VENTURA COUNTY EMPLOYEES’ RETIREMENT ASSOCIATION BOARD OF RETIREMENT BUSINESS MEETING December 15, 2014 AGENDA PLACE: Ventura County Employees' Retirement Association Second Floor Boardroom 1190 South Victoria Avenue Ventura, CA 93003 TIME: 9:00 a.m. ITEM: I. CALL TO ORDER Master Page No. II. APPROVAL OF AGENDA 1 – 3 III. APPROVAL OF MINUTES A. Business Meeting of November 17, 2014 4 – 16 B. Disability Meeting of December 1, 2014 17 – 23 IV. CONSENT AGENDA A. Approve Regular and Deferred Retirements and Survivors Continuances for the Month of November 2014. 24 B. Receive and File Report of Checks Disbursed in November 2014. 25 – 34 C. Receive and File Budget Summary for FY 2014-15 Month Ending October 31, 2014. 35 D. Receive and File Budget Summary for FY 2014-15 Month Ending November 30, 2014. 36 E. Receive and File Statements of Fiduciary Net Position, Statements of Changes in Fiduciary Net Position, Investments & Cash Equivalents, and Schedules of Investment Management Fees for the Periods Ending September 30, 2014 and October 31, 2014. 37 – 48 MASTER PAGE NO. 1

Welcome message from author
This document is posted to help you gain knowledge. Please leave a comment to let me know what you think about it! Share it to your friends and learn new things together.
Transcript

VENTURA COUNTY EMPLOYEES’ RETIREMENT ASSOCIATION
BOARD OF RETIREMENT
BUSINESS MEETING
December 15, 2014
AGENDA PLACE: Ventura County Employees' Retirement Association
Second Floor Boardroom 1190 South Victoria Avenue Ventura, CA 93003
TIME: 9:00 a.m.
ITEM:
I. CALL TO ORDER Master Page No.
II. APPROVAL OF AGENDA 1 – 3
III. APPROVAL OF MINUTES
A. Business Meeting of November 17, 2014 4 – 16
B. Disability Meeting of December 1, 2014 17 – 23
IV. CONSENT AGENDA
A. Approve Regular and Deferred Retirements and Survivors Continuances for the Month of November 2014.
24
B. Receive and File Report of Checks Disbursed in November 2014.
25 – 34
C. Receive and File Budget Summary for FY 2014-15 Month Ending October 31, 2014.
35
D. Receive and File Budget Summary for FY 2014-15 Month Ending November 30, 2014.
36
E. Receive and File Statements of Fiduciary Net Position, Statements of Changes in Fiduciary Net Position, Investments & Cash Equivalents, and Schedules of Investment Management Fees for the Periods Ending September 30, 2014 and October 31, 2014.
37 – 48
MASTER PAGE NO. 1

BOARD OF RETIREMENT DECEMBER 15, 2014 AGENDA BUSINESS MEETING PAGE 2 V. STANDING ITEM
A. Receive an Oral Update on Pensionable Compensation
and PEPRA.
VI. INVESTMENT MANAGER PRESENTATIONS
A. Receive Annual Investment Presentation, BlackRock, Anthony Freitas, Managing Director, Laura Champion, Vice President, and Cara Barr, Director. (30 Minutes)
49 – 129
B. Receive Annual Investment Presentation, RREEF, Jay Miller, Director, Portfolio Manager, and Nolan Olsen, Director, Global Client Group. (30 Minutes)
130 – 193
VII. INVESTMENT INFORMATION
A. NEPC – Allan Martin, Partner
1. Receive and File Preliminary Performance Report Month Ending November 30, 2014 RECOMMENDED ACTION: Receive and File.
194 – 200
2. Memorandum from NEPC on PIMCO, dated December 15, 2014 RECOMMENDED ACTION: Receive and File.
201
3. Global Asset Allocation Review and Asset Allocation Update RECOMMENDED ACTION: Receive and File.
202 – 224
4. Selection of Legal Firm to Review Pantheon Global Secondary Fund V Documents
225
VIII. ACTUARIAL INFORMATION
A. GASB 67 Presentation: John Monroe, Segal Consulting Presenting via Teleconference Time: 10:30 a.m.
1. Segal Consulting’s GASB 67 Report RECOMMENDED ACTION: Approve.
226 – 245
B. Receipt and Distribution of June 30, 2014 Actuarial Information
246 – 335
MASTER PAGE NO. 2

BOARD OF RETIREMENT DECEMBER 15, 2014 AGENDA BUSINESS MEETING PAGE 3 IX. OLD BUSINESS
A. Oral Update from Chair on Cost Estimate to File Amicus Brief in the SDCERA v. County of San Diego Case
B. Oral Update from Chair on General Counsel Position
X. NEW BUSINESS
A. Receive and File VCERIS Project Monthly Report –November 2014
336
B. Recommendation to Approve Trustee McCormick’s Attendance at the 2015 Pension Bridge Conference, April 7 – 8, 2015, San Francisco, CA
337
C. Recommendation to Approve Board Member Travel to NEPC Public Fund Workshop, January 12 – 13, 2015, Tempe, AZ
338 – 340
D. Consideration of Proposed CERL Legislation Drafted by Trustee Goulet
341 – 344
E. Recommendation to Approve Application for Reinstatement to Active Membership Pursuant to GC 31680.4 & 31680.5 – Cynthia Cantle
1. Letter from Staff 345
2. Letter from Cynthia Cantle 346
3. Offer of Employment 347
4. Medical Clearance 348
XI. INFORMATIONAL
A. Invitation to Winter Forum on Real Estate Opportunity & Private Fund Investing, January 21 – 23, 2015, at Laguna Beach, CA
349 – 353
B. 2015 Americas Real Assets Client Conference, Deutsche Asset & Wealth Management, March 17-19, 2015, Dana Point, CA
354 – 355
XII. PUBLIC COMMENT
XIII. STAFF COMMENT
XIV. BOARD MEMBER COMMENT
XV. ADJOURNMENT
MASTER PAGE NO. 3

VENTURA COUNTY EMPLOYEES’ RETIREMENT ASSOCIATION
BOARD OF RETIREMENT
BUSINESS MEETING
November 17, 2014
MINUTES DIRECTORS PRESENT:
Tracy Towner, Chair, Safety Employee Member William W. Wilson, Vice Chair, Public Member Steven Hintz, Treasurer-Tax Collector Mike Sedell, Public Member Peter C. Foy, Public Member Deanna McCormick, General Employee Member Arthur E. Goulet, Retiree Member Chris Johnston, Alternate Employee Member Will Hoag, Alternate Retiree Member
DIRECTORS ABSENT:
Joseph Henderson, Public Member Vacant, General Employee Member
STAFF PRESENT:
Tim Thonis, Interim Retirement Administrator Henry Solis, Chief Financial Officer Lori Nemiroff, Assistant County Counsel Stephanie Caiazza, Program Assistant Chantell Garcia, Retirement Benefits Specialist
PLACE:
Ventura County Employees' Retirement Association Second Floor Boardroom 1190 South Victoria Avenue Ventura, CA 93003
TIME:
9:00 a.m.
ITEM:
I. CALL TO ORDER Chair Tracy Towner called the Business Meeting of November 17, 2014, to order at 9:01 a.m.
MASTER PAGE NO. 4

BOARD OF RETIREMENT NOVEMBER 17, 2014 MINUTES BUSINESS MEETING PAGE 2 II. APPROVAL OF AGENDA
MOTION: Approve the Agenda. Moved by Hintz, seconded by McCormick. Vote: Motion carried. Yes: Goulet, Hintz, McCormick, Foy, Sedell, Johnston, Wilson, Towner No: - Absent: Henderson
III. APPROVAL OF MINUTES
A. Special Meeting of October 29, 2014. MOTION: Approve the Minutes. Moved by Hintz, seconded by Johnston. Vote: Motion carried. Yes: Goulet, Hintz, McCormick, Foy, Sedell, Johnston, Wilson, Towner No: - Absent: Henderson
B. Disability Meeting of November 3, 2014. MOTION: Approve the Minutes. Moved by McCormick, seconded by Goulet. Vote: Motion carried. Yes: Goulet, Hintz, McCormick, Foy, Sedell, Johnston, Wilson, Towner No: - Absent: Henderson
IV. CONSENT AGENDA
A. Approve Regular and Deferred Retirements and Survivors Continuances for the Month of October 2014.
B. Receive and File Report of Checks Disbursed in October 2014.
C. Receive and File Statement of Reserves for FY 2013-14 Month Ending June 30, 2014.
MASTER PAGE NO. 5

BOARD OF RETIREMENT NOVEMBER 17, 2014 MINUTES BUSINESS MEETING PAGE 3 D. Receive and File Budget Summary for FY 2014-15 Month Ending August 31,
2014.
E. Receive and File Budget Summary for FY 2014-15 Month Ending September 30, 2014.
F. Receive and File Statement of Fiduciary Net Position, Statement of Changes in Fiduciary Net Position, and Investments & Cash Equivalents for Month Ending August 31, 2014. MOTION: Approve the Consent Agenda. Moved by Wilson, seconded by Johnston. Vote: Motion carried. Yes: Goulet, Hintz, McCormick, Foy, Sedell, Johnston, Wilson, Towner No: - Absent: Henderson
END OF CONSENT AGENDA V. STANDING ITEM
A. Receive an Oral Update on Pensionable Compensation and PEPRA.
Ms. Nemiroff stated that there was nothing new to report on Pensionable Compensation and PEPRA at this time.
VI. INVESTMENT INFORMATION
A. NEPC – Don Stracke, Senior Consultant.
1. Consideration of an Additional Private Equity Commitment to the Pantheon Global Secondary Fund V. NEPC recommended a $50 million commitment to the Pantheon Global Secondary Fund V. MOTION: Table this item until after Item VI.A.2. Moved by Sedell, seconded by Wilson. Vote: Motion carried. Yes: Goulet, Hintz, McCormick, Foy, Sedell, Johnston, Wilson, Towner No: - Absent: Henderson
MASTER PAGE NO. 6

BOARD OF RETIREMENT NOVEMBER 17, 2014 MINUTES BUSINESS MEETING PAGE 4
Following the presentation by Pantheon and discussion between the Board and Mr. Stracke, the following motion was made: MOTION: Commit $50 million to the Pantheon Global Secondary Fund V. Moved by Wilson, seconded by Johnston. Vote: Motion carried. Yes: Goulet, Hintz, McCormick, Foy, Sedell, Johnston, Wilson, Towner No: - Absent: Henderson
2. Pantheon Presentation of Global Secondary Fund V., Matt Garfunkle, Partner, Matthew Jones, Partner, and Sprague Von Stroh, Vice President. MOTION: Receive and file. Moved by Goulet, seconded by Sedell. Vote: Motion carried. Yes: Goulet, Hintz, McCormick, Foy, Sedell, Johnston, Wilson, Towner No: - Absent: Henderson
3. Memorandum from NEPC on PIMCO, dated November 17, 2014. MOTION: Receive and file. Moved by Hintz, seconded by Wilson. Vote: Motion carried. Yes: Goulet, Hintz, McCormick, Foy, Sedell, Johnston, Wilson, Towner No: - Absent: Henderson
4. PIMCO Organizational Update and Strategy Review, David J. Blair, Senior Vice President, Thomas J. Otterbein, Account Manager, and Sasha Talcott, Vice President. Mr. Foy left the meeting at 9:54 a.m. Mr. Sedell left the meeting at 10:07 a.m.
MASTER PAGE NO. 7

BOARD OF RETIREMENT NOVEMBER 17, 2014 MINUTES BUSINESS MEETING PAGE 5
MOTION: Receive and file. Moved by McCormick, seconded by Hintz. Vote: Motion carried. Yes: Goulet, Hintz, McCormick, Johnston, Wilson, Towner No: - Absent: Henderson, Sedell, Foy
5. Asset Allocation Update/Workplan Discussion. Mr. Sedell reentered the meeting at 10:15 a.m. MOTION: Request that NEPC return with additional information regarding Global Tactical Asset Allocation and credit strategies. Moved by Goulet, seconded by Wilson. Vote: Motion carried. Yes: Goulet, Hintz, McCormick, Sedell, Johnston, Wilson, Towner No: - Absent: Henderson, Foy
6. Receive and File Investment Summary – Quarter Ending September 30, 2014. MOTION: Receive and file. Moved by Wilson, seconded by McCormick. Vote: Motion carried. Yes: Goulet, Hintz, McCormick, Sedell, Johnston, Wilson, Towner No: - Absent: Henderson, Foy
7. Receive and File Preliminary Performance Report Month Ending October 31, 2014. MOTION: Receive and file. Moved by Wilson, seconded by McCormick. Vote: Motion carried. Yes: Goulet, Hintz, McCormick, Sedell, Johnston, Wilson, Towner No: - Absent: Henderson, Foy
MASTER PAGE NO. 8

BOARD OF RETIREMENT NOVEMBER 17, 2014 MINUTES BUSINESS MEETING PAGE 6 8. Proposed 2015 Due Diligence Calendar.
Mr. Foy reentered the meeting at 10:45 a.m. MOTION: Approve. Moved by Wilson, seconded by Johnston. Vote: Motion carried. Yes: Goulet, Hintz, McCormick, Foy, Sedell, Johnston, Wilson, Towner No: - Absent: Henderson
VII. Ventura County Employees’ Retirement Information System (VCERIS) Pension Administration Project
A. Memorandum of Understanding with Auditor/Controller. Ms. Nemiroff noted that the effective date of the document was changed to November 17, 2014, to allow more flexibility for modifications before it is ratified. The signature line of the document was revised to require a signature from the Board of Supervisors, at the County’s request. Ms. Nemiroff recommended that, if the Memorandum of Understanding is approved, the Chair should be granted authority to make any non-material changes to the document without returning to the Board for authorization. Jeff Burgh, Auditor/Controller, was present to discuss this item. Mr. Burgh provided a draft “Scope of Work” for the Board’s review, and the Board and Mr. Burgh discussed whether changes needed to be made to the Memorandum of Understanding before it could be approved. The following motion was made: MOTION: Postpone voting on this matter until a future meeting, with the understanding that work to develop accurate compensation earnable information will continue. Moved by Hintz, seconded by Foy. Vote: Motion carried. Yes: Goulet, Hintz, Foy, Sedell, Wilson, Towner No: McCormick, Johnston Absent: Henderson
B. VCERIS Project Quarterly Status Report. Brian Colker was present on behalf of Linea Solutions, Inc. to provide an update on the VCERIS project.
MASTER PAGE NO. 9

BOARD OF RETIREMENT NOVEMBER 17, 2014 MINUTES BUSINESS MEETING PAGE 7
Mr. Colker informed the Board that roughly 2/3 of the system has been designed, developed, and tested, leaving an estimated 5-6 months of development work for the remaining processes. Mr. Colker reported that the mapping and programming activities for data conversion are complete, and data cleanup has not uncovered any major issues. Once the dates are solidified in the Memorandum of Understanding, Linea and Vitech will update their project plan and produce change orders to be considered by the Board at a future meeting. Mr. Colker noted that the change order numbers listed on the status report reflect the numbering of the Vitech change orders, rather than that of VCERA. MOTION: Receive and file. Moved by Hintz, seconded by McCormick. Vote: Motion carried. Yes: Goulet, Hintz, McCormick, Foy, Sedell, Johnston, Wilson, Towner No: - Absent: Henderson
C. Monthly Report – October 2014. MOTION: Receive and file. Moved by Sedell, seconded by Hintz. Vote: Motion carried. Yes: Goulet, Hintz, McCormick, Foy, Sedell, Johnston, Wilson, Towner No: - Absent: Henderson
VIII. OLD BUSINESS
A. PEPRA Compensation Resolution – Ashley Dunning.
1. Letter from Manatt, Phelps, & Phillips, dated November 10, 2014.
2. Draft Resolution.
Ms. Dunning provided a summary of her analysis regarding the definition and determination of pensionable compensation under PEPRA, and concluded that the Board of Retirement has the authority to determine the definition of pensionable compensation, within the law. Ms. Dunning provided a draft resolution for the Board’s review and approval, including a list of requirements and alternative interpretations of normal monthly rate of pay or base pay.
MASTER PAGE NO. 10

BOARD OF RETIREMENT NOVEMBER 17, 2014 MINUTES BUSINESS MEETING PAGE 8
Received public comment from Joe Karahman, SEIU Local #721; Ramon Rubalcava, SEIU Local #721, and Paul Derse, County Executive Office, County of Ventura. The Board considered the following interpretations of Government Code section 7522.34 subdivision (A) definitions as permitting pay items to be included in Pensionable Compensation if they are:
(i) Within the normal monthly rate of pay only. (ii) Within the base pay only. (iii) Within either the normal monthly rate of pay or the base pay of the
member.
After discussion by the Board, the following motions were made: MOTION: Adopt interpretation (ii) of Government Code section 7522.34 subdivision (a) definition as permitting pay items to be included in Pensionable Compensation if they are within the base pay only. Moved by Wilson, seconded by Foy. Vote: Motion failed. Yes: Foy, Sedell, Wilson No: Johnston, Goulet, Hintz, McCormick, Towner Absent: Henderson MOTION: Adopt interpretation (i) of Government Code section 7522.34 subdivision (a) definition as permitting pay items to be included in Pensionable Compensation if they are within the normal monthly rate of pay only. Moved by Goulet, seconded by McCormick. Vote: Motion failed. Yes: Goulet No: Hintz, McCormick, Foy, Sedell, Johnston, Wilson, Towner Absent: Henderson MOTION: Adopt interpretation (iii) of Government Code section 7522.34 subdivision (a) definition as permitting pay items to be included in Pensionable Compensation if they are within either the normal monthly rate of pay or the base pay of the member.
MASTER PAGE NO. 11

BOARD OF RETIREMENT NOVEMBER 17, 2014 MINUTES BUSINESS MEETING PAGE 9
Moved by Johnston, seconded by McCormick. Vote: Motion carried. Yes: Goulet, Hintz, McCormick, Sedell, Johnston, Towner No: Foy, Wilson Absent: Henderson MOTION: Adopt the language of the draft Resolution on page 3 in numbered paragraph 2.(c); remove the words “or executive staff” from the paragraph. Moved by Wilson, seconded by Hintz. Vote: Motion carried. Yes: Goulet, Hintz, McCormick, Foy, Sedell, Johnston, Wilson, Towner No: - Absent: Henderson Ms. Dunning agreed to make non-material or grammatical changes to the paragraph as needed. Mr. Hintz left the meeting at 12:40 p.m. MOTION: Adopt the language on p.5 of the draft Resolution in paragraph 4(h)(i), modified to define a labor policy or agreement as any of the following: Memorandum of Agreement; a Management, Confidential Clerical and Other Unrepresented Employees Resolution; or other similar document as specifically approved by the VCERA Board of Retirement. Moved by McCormick, seconded by Goulet. Vote: Motion carried. Yes: Goulet, McCormick, Foy, Sedell, Johnston, Wilson, Towner No: - Absent: Henderson, Hintz MOTION: Adopt the language on p.5 of the draft Resolution in paragraph 4(h)(ii), modified to remove the word “not” from the following sentence: “Identifying a percentage increase in salary, in lieu of a dollar amount, in a labor policy or agreement does [not] comply with this interpretation of a “pay schedule”. Moved by McCormick, seconded by Goulet. Vote: Motion carried.
MASTER PAGE NO. 12

BOARD OF RETIREMENT NOVEMBER 17, 2014 MINUTES BUSINESS MEETING PAGE 10
Yes: Goulet, McCormick, Foy, Sedell, Johnston, Wilson, Towner No: - Absent: Henderson, Hintz Ms. Dunning recommended that the Board adopt the language on page 5 of the resolution in paragraph 5, and modify the end of the following sentence: “VCERA Staff will analyze pay codes to determine whether they constitute Pensionable Compensation or not, under this Resolution” to include the phrase “and will bring such determinations to the VCERA Board for action.” Mr. Sedell requested clarification regarding the proposed pay code review process by VCERA staff and the Board’s authority to make the final determination of which pay codes meet the criteria. Ms. Dunning explained that, if this language is adopted, the process will be for staff to review the employer pay codes, identify which pay codes meet the criteria outlined in the resolution, and seek Board approval of such determinations. Ms. Dunning confirmed that the VCERA Board will have discretion to exclude any items that it determines do not meet the criteria, regardless of VCERA staff’s determination and recommendation to the Board. MOTION: Adopt the language on p.5 of the draft Resolution in paragraph 5, and modify the end of the following sentence: “VCERA Staff will analyze pay codes to determine whether they constitute Pensionable Compensation or not, under this Resolution” to include the phrase “and will bring such determinations to the VCERA Board for action”. Moved by McCormick, seconded by Johnston. Vote: Motion carried. Yes: Goulet, McCormick, Foy, Sedell, Johnston, Wilson, Towner No: - Absent: Henderson, Hintz Chair Towner, with the consensus of the Board, further directed Ms. Dunning to replace “VCERA staff” with “VCERA’s Retirement Administrator” throughout the draft Resolution.
B. Consideration of Available Options Pursuant to Step #7 of VCERA’s Interest Crediting Policy.
1. Letter from Staff.
2. Statement of Reserves for FY 2013-14 Month Ending June 30, 2014.
MASTER PAGE NO. 13

BOARD OF RETIREMENT NOVEMBER 17, 2014 MINUTES BUSINESS MEETING PAGE 11 3. Interest Crediting Policy.
MOTION: Leave $2.7 million of remaining available earnings in the
Undistributed Earnings Reserve as a contingency against future deficiencies in interest earnings. Moved by Wilson, seconded by Sedell. Vote: Motion carried. Yes: McCormick, Foy, Sedell, Johnston, Wilson, Towner No: Goulet Absent: Henderson, Hintz
IX. NEW BUSINESS
A. Decision on Whether to File Amicus Brief in SDCERA v. County of San Diego.
1. Copy of Complaint for Declaratory Relief.
After discussion by the Board, the following motion was made: MOTION: Postpone this item until the December 1, 2014 disability meeting. Moved by Goulet, seconded by Foy. Vote: Motion carried. Yes: Goulet, McCormick, Foy, Sedell, Johnston, Wilson, Towner No: - Absent: Henderson, Hintz Mr. Johnston left the meeting at 1:03 p.m.
B. Proposed 2015 Board Calendar. MOTION: Approve. Moved by Goulet, seconded by Foy. Vote: Motion carried. Yes: Goulet, McCormick, Foy, Sedell, Wilson, Towner No: - Absent: Henderson, Hintz, Johnston
C. Trustee Reports, Deanna McCormick, General Employee Member.
MASTER PAGE NO. 14

BOARD OF RETIREMENT NOVEMBER 17, 2014 MINUTES BUSINESS MEETING PAGE 12 1. PIMCO Due Diligence Report.
2. PIMCO Conference Report.
MOTION: Receive and file.
Moved by Goulet, seconded by Sedell. Vote: Motion carried. Yes: Goulet, McCormick, Foy, Sedell, Wilson, Towner No: - Absent: Henderson, Hintz, Johnston Mr. Johnston returned to the meeting at 1:04 p.m.
X. INFORMATIONAL
A. Invitation to GMO Asset Allocation Discussion, November 20, 2014, Los Angeles.
B. Loomis Sayles Correspondence – Portfolio Manager Update.
C. Save the Date: Pension Bridge Conference; April 7 – 8, 2015.
XI. PUBLIC COMMENT None.
XII. STAFF COMMENT None.
XIII. BOARD MEMBER COMMENT None.
MASTER PAGE NO. 15

BOARD OF RETIREMENT NOVEMBER 17, 2014 MINUTES BUSINESS MEETING PAGE 13 XIV. ADJOURNMENT
The meeting was adjourned at 1:05 p.m. Respectfully submitted,
___________________________________________ TIM THONIS, Interim Retirement Administrator Approved, ___________________________________ TRACY TOWNER, Chairman
MASTER PAGE NO. 16

VENTURA COUNTY EMPLOYEES’ RETIREMENT ASSOCIATION
BOARD OF RETIREMENT
DISABILITY MEETING
December 1, 2014
MINUTES DIRECTORS PRESENT:
Tracy Towner, Chair, Safety Employee Member William W. Wilson, Vice Chair, Public Member Peter C. Foy, Public Member Mike Sedell, Public Member Joseph Henderson, Public Member Deanna McCormick, General Employee Member Arthur E. Goulet, Retiree Member Will Hoag, Alternate Retiree Member Chris Johnston, Alternate Safety Employee Member
DIRECTORS ABSENT:
Steven Hintz, Treasurer-Tax Collector Vacant, General Employee Member
STAFF PRESENT:
Tim Thonis, Interim Retirement Administrator Henry Solis, Chief Financial Officer Lori Nemiroff, Assistant County Counsel Stephanie Caiazza, Program Assistant Donna Edwards, Retirement Benefits Specialist
PLACE: Ventura County Employees' Retirement Association Second Floor Boardroom 1190 South Victoria Avenue Ventura, CA 93003
TIME: 9:00 a.m.
ITEM:
I. CALL TO ORDER Chair Towner called the Disability Meeting of December 1, 2014, to order at 9:00 a.m.
MASTER PAGE NO. 17

BOARD OF RETIREMENT DECEMBER 1, 2014 MINUTES DISABILITY MEETING PAGE 2 II. APPROVAL OF AGENDA
MOTION: Approve the Agenda. Moved by Wilson, seconded by McCormick. Vote: Motion carried Yes: Goulet, Henderson, Sedell, McCormick, Johnston, Wilson, Towner No: - Absent: Hintz, Foy
III. APPROVAL OF MINUTES
A. Business Meeting of November 17, 2014. Mr. Sedell requested for more detail be added to the minutes from the business meeting of November 17, 2014, under item VIII.A. PEPRA Compensation Resolution, and for the revised minutes to be considered by the Board at the next meeting. MOTION: Continue this item at the business meeting of December 15, 2014. Moved by Wilson, seconded by Sedell. Vote: Motion carried Yes: Goulet, Henderson, Sedell, McCormick, Johnston, Wilson, Towner No: - Absent: Hintz, Foy
IV. RECEIVE AND FILE PENDING DISABILITY APPLICATION STATUS REPORT
MOTION: Receive and file the report. Moved by Wilson, seconded by Johnston. Vote: Motion carried Yes: Goulet, Henderson, Sedell, McCormick, Johnston, Wilson, Towner No: - Absent: Hintz, Foy
V. APPLICATIONS FOR DISABILITY RETIREMENT
A. Application for Service Connected Disability Retirement, Kostiuchenko, Yevhen (Eugene); Case No. 14-021.
MASTER PAGE NO. 18

BOARD OF RETIREMENT DECEMBER 1, 2014 MINUTES DISABILITY MEETING PAGE 3 1. Application for Service Connected Disability Retirement and
Supporting Documentation.
2. Hearing Notice Served on November 18, 2014.
Paul Hilbun was present on behalf of the County of Ventura Risk Management. Assistant Sheriff Steve DeCesari of the Ventura County Sheriff’s Office appeared on behalf of the applicant. Both parties declined to make a statement. The following motion was made: MOTION: Grant the applicant, Yevhen (Eugene) Kostiuchenko, a service connected disability retirement. Moved by Sedell, seconded by Henderson. Vote: Motion carried Yes: Goulet, Henderson, Sedell, McCormick, Johnston, Wilson, Towner No: - Absent: Hintz, Foy The parties agreed to waive preparations of Findings of Fact and Conclusions of Law. Mr. Goulet expressed his condolences for the loss of Deputy Kostiuchenko.
B. Application for Service Connected Disability Retirement, Hookstra, Maureen; Case No. 12-004.
1. Application for Service Connected Disability Retirement and Supporting Documentation.
2. Hearing Notice Served on October 23, 2014.
Paul Hilbun and Derek Straatsma, Attorney at Law, were present on behalf of County of Ventura Risk Management. The applicant, Maureen Hookstra, was also present. Both parties declined to make a statement. Mr. Goulet questioned the absence of written documentation in the record regarding reasonable accommodation and specific job duties. Mr. Foy entered the meeting at 9:08 a.m.
MASTER PAGE NO. 19

BOARD OF RETIREMENT DECEMBER 1, 2014 MINUTES DISABILITY MEETING PAGE 4
After discussion by the Board and Risk Management, the following motion was made: MOTION: Grant the applicant, Maureen Hookstra, a service connected disability retirement. Moved by Sedell, seconded by Johnston. Vote: Motion carried Yes: Henderson, Sedell, McCormick, Johnston, Wilson, Towner No: Goulet Absent: Hintz Abstain: Foy Mr. Goulet stated that his vote against the motion was not related to the applicant. The parties agreed to waive preparations of Findings of Fact and Conclusions of Law.
C. Application for Non-Service Connected Disability Retirement, Moten, Urissa; Case No. 13-026.
1. Summary of Evidence, Suggested Findings of Fact and Conclusions of Law, and Recommendation, Submitted by Hearing Officer Deborah Z. Wissley, Dated October 15, 2014.
2. Hearing Notice Served on October 22, 2014.
Paul Hilbun and John I. Gilman, Attorney at Law, were present on behalf of the County of Ventura Risk Management. The applicant, Urissa Moten, was also present. Mr. Gilman stated that Risk Management had no objection to the adoption of the hearing officer’s recommendation. The applicant declined to make a statement. The following motion was made: MOTION: Adopt the Hearing Officer’s Recommendation and grant the applicant, Urissa Moten, a non-service connected disability retirement. Moved by McCormick, seconded by Johnston. Vote: Motion carried
MASTER PAGE NO. 20

BOARD OF RETIREMENT DECEMBER 1, 2014 MINUTES DISABILITY MEETING PAGE 5
Yes: Goulet, Henderson, Foy, Sedell, McCormick, Johnston, Wilson, Towner No: - Absent: Hintz
VI. OLD BUSINESS
A. Decision on Whether to File Amicus Brief in SDCERA v. County of San Diego.
1. Copy of Complaint for Declaratory Relief.
After discussion, the Board agreed that its intention is to hire outside counsel to file an amicus brief in SDCERA v. County of San Diego, provided the cost is reasonable. The following motion was made: MOTION: Authorize Chair to seek an estimate of the cost of hiring outside counsel to file an amicus brief in SDCERA v. County of San Diego, and return to the Board with the estimate for approval. Moved by Goulet, seconded by Wilson. Vote: Motion carried Yes: Goulet, Henderson, Foy, Sedell, McCormick, Johnston, Wilson, Towner No: - Absent: Hintz
B. Approval of Timeline for VCERIS Project. Chair Towner informed the Board that the Timeline for VCERIS Project was developed for the Board’s approval in lieu of the Memorandum of Understanding that was proposed at the business meeting of November 17, 2014. After discussion by the Board, the following motion was made: MOTION: Approve. Moved by Sedell, seconded by Henderson. Vote: Motion carried Yes: Goulet, Henderson, Foy, Sedell, McCormick, Johnston, Wilson, Towner No: - Absent: Hintz
MASTER PAGE NO. 21

BOARD OF RETIREMENT DECEMBER 1, 2014 MINUTES DISABILITY MEETING PAGE 6
Mr. Goulet commended Chair Towner for his time and effort on this item.
VII. NEW BUSINESS
A. Appointment of 2015 Board Chair and Vice Chair. MOTION: Appoint Mr. Towner as Chair. Moved by Wilson, seconded by Henderson. Vote: Motion carried Yes: Goulet, Henderson, Foy, Sedell, McCormick, Johnston, Wilson, Towner No: - Absent: Hintz MOTION: Appoint Mr. Wilson as Vice Chair. Moved by Henderson, seconded by Sedell. Vote: Motion carried Yes: Goulet, Henderson, Foy, Sedell, McCormick, Johnston, Wilson, Towner No: - Absent: Hintz Chair Towner stated that VCERA’s new retirement administrator, Ms. Linda Webb, is scheduled to attend the Board of Retirement meetings of December 15, 2014 and January 5, 2015.
VIII. INFORMATIONAL
A. PIMCO Institute, January 14 – 15, 2015, Newport Beach, CA.
B. Opal Financial Group- Public Funds Summit 2015, January 12 – 14, 2015, Scottsdale, AZ.
C. NEPC 2015 Public Fund Workshop, January 12 – 13, 2015, Phoenix, AZ.
IX. PUBLIC COMMENT None.
X. STAFF COMMENT None.
MASTER PAGE NO. 22

BOARD OF RETIREMENT DECEMBER 1, 2014 MINUTES DISABILITY MEETING PAGE 7 XI. BOARD MEMBER COMMENT
Ms. McCormick commented on delayed disability cases on the status report, and the Board discussed several aspects of the disability retirement application process that can lead to delays. Mr. Johnston expressed interest in acquiring more efficient technology for the distribution and access of board packet materials. Several Board members reported experiencing similar impediments with the software currently in use.
XII.
ADJOURNMENT The meeting was adjourned at 10:00 a.m. Respectfully submitted,
___________________________________________ TIM THONIS, Interim Retirement Administrator Approved, ___________________________________ TRACY TOWNER, Chairman
MASTER PAGE NO. 23

DATE OF TOTAL OTHER EFFECTIVEFIRST NAME LAST NAME G/S MEMBERSHIP SERVICE SERVICE DEPARTMENT DATE
Florida A. Alvarado G 5/16/1999 10.00 Health Care Agency 10/17/14Emie O. Arruejo G 11/6/1994 19.70 B=0.09150 Child Support Services 11/01/14Cheri D. Barrett G 04/14/1975 38.70 Child Support Services 10/10/14Sandra J. Bickford G 10/27/1991 22.90 Auditor-Controller 10/11/14Lucy C. Chavez G 02/14/1993 20.20 Human Services Agency 11/01/14Sivarajan Chikkiah G 11/20/1994 20.00 B=0.11073 Public Works 10/24/14William C. Elder S 01/28/2001 11.80 Fire Protection 03/17/13Wilmer C. Gaetos G 12/11/2000 13.80 Information Services Department 10/27/14Paul J. Higgason S 07/17/1983 31.30 Sheriff 10/25/14Victor M. Kelley III G 08/04/1991 23.00 Health Care Agency 10/11/14Deborah A. Kerr G 06/27/1999 19.60 B=0.09590 Health Care Agency 10/31/14
D=4.25500Donald W. Kingdon G 11/25/1990 6.90 C=17.27444 Health Care Agency 09/28/14
(Deferred)
Angelina Montoya G 10/28/1979 35.10 B=0.11230 Health Care Agency 10/18/14Jeffrey S. Reagan S 12/23/1984 1.60 A=1.6 Sheriff 09/24/14
(deferred)
Dale E. Redfield G 03/14/1982 32.50 Library 10/19/14Yolanda Saunders S 12/23/2011 2.90 District Attorney 04/11/14
(Non-member Spouse, deferred)
David W. Whaley G 02/26/1979 35.60 Assessor 10/25/14Michael S. Wickham S 03/08/1987 28.50 B=0.87650 Fire Protection 10/06/14
Lori Barth G 4/10/2005 8.87 Health Care Agency 10/24/2014
Miroslav Borak G 12/9/2002 11.93 Child Support Services 11/8/2014
Denise Carman G 6/18/2006 6.63 Health Care Agency 10/15/2014
Erin Conklin G 10/6/2003 10.60 Health Care Agency 11/7/2014
Wilma Donovan G 12/09/2002 11.93 Child Support Services 11/08/2014Suzanne Fernandez G 04/08/2007 6.33 Health Care Agency 10/25/2014Angela Field G 02/06/2000 14.15 Sheriff's Department 10/19/2014Stella Herrera G 07/05/1992 22.02 Child Support Services 11/08/2014Andy Hovey G 01/27/1992 22.78 VRSD 10/28/2014Daniel Lopez G 02/08/2009 5.13 Superior Court 11/13/2014Cheryl Lopez G 10/08/2001 12.94 Superior Court 10/24/2014Ana Melgoza G 07/02/2006 7.88 Board of Supervisors 10/31/2014Theresa E. Sabedra G 04/24/2005 9.52 Assessor 10/31/2014Arlene C. Samaniego G 03/20/2005 10.84 Child Support Services 10/12/2014Maria D. Tello G 07/30/2006 7.84 Health Care Agency 10/30/2014
Gerald M. SchneiderGene R. SignorLinda G. Whalen
* = Member Establishing ReciprocityA = Previous MembershipB = Other County Service (eg Extra Help)C = Reciprocal ServiceD = Public Service
SURVIVORS' CONTINUANCES:
VENTURA COUNTY EMPLOYEES' RETIREMENT ASSOCIATION
REPORT OF REGULAR AND DEFERRED RETIREMENTS AND SURVIVORS CONTINUANCES
NOVEMBER 2014
REGULAR RETIREMENTS:
DEFERRED RETIREMENTS:
MASTER PAGE NO. 24

Closed
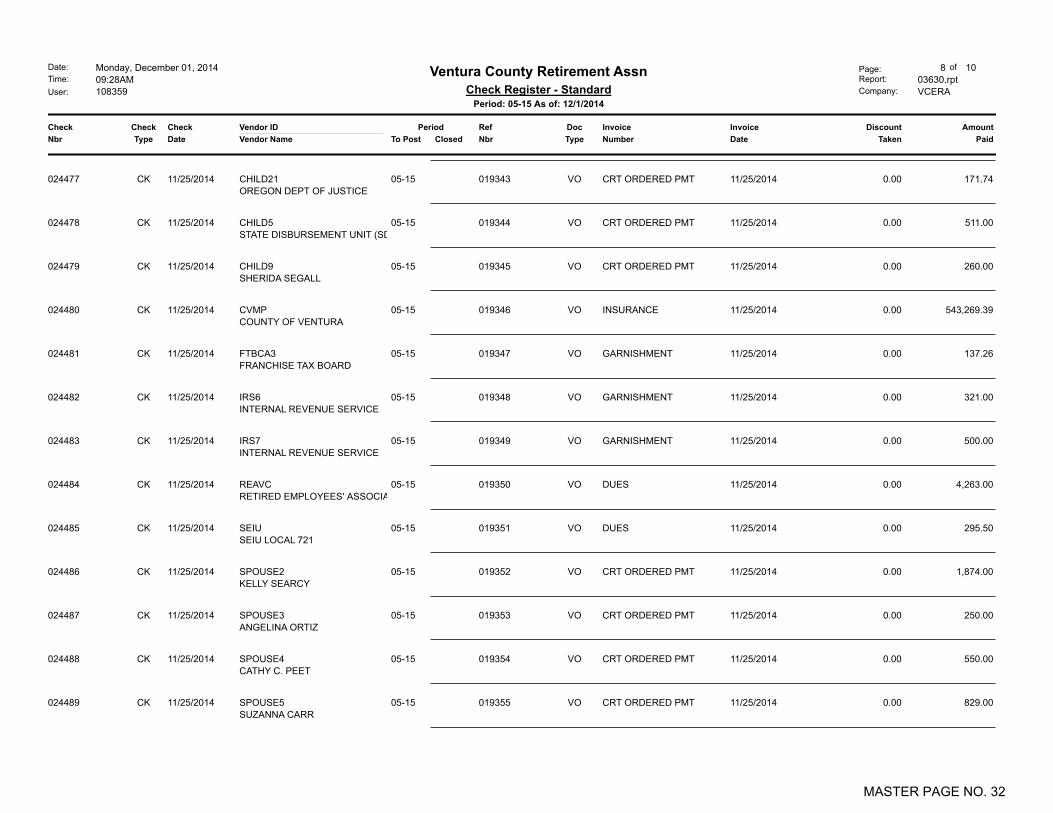
Invoice Discount AmountDocRefCheck Check InvoiceCheck
Nbr Type Date
Vendor ID
Vendor Name Nbr Type Date Taken PaidNumberTo Post
Date:
Time:
User:
Monday, December 01, 2014
09:28AM
108359
Page:Report:
Company:
1 of 10
03630.rpt
VCERA
Ventura County Retirement AssnCheck Register - Standard
Period: 05-15 As of: 12/1/2014
Period
Company: VCERA
Acct / Sub: 1002 00
BARNEY -315.00 0.00ADMIN EXP 9/24/2014VC
ABU COURT REPORTING INC
11/6/2014 VO05-15024239 01910805-15
Check Total -315.00
- Missing024385024240
102691 15,236.64 0.00REFUND T2 COL 11/5/2014CK
CELIA P. BAGAY
11/5/2014 VO024386 01925505-15
105359 41,748.25 0.00REFUND- CONTRIB 11/5/2014CK
CYNTHIA M. ESTRADA
11/5/2014 VO024387 01925605-15
105375 20,766.93 0.00REFUND- CONTRIB 11/5/2014CK
SANDRA K. LEE
11/5/2014 VO024388 01925705-15
107432 20,488.81 0.00REFUND T2 COL 11/5/2014CK
PAMELA A. EICHELE
11/5/2014 VO024389 01925805-15
116273 34,688.93 0.00REFUND- CONTRIB 11/5/2014CK
GARY D. WEAVER
11/5/2014 VO024390 01925905-15
116582 13,758.11 0.00REFUND- CONTRIB 11/5/2014CK
KATIE L. PFEIFFER POLEN
11/5/2014 VO024391 01926005-15
116847 26,319.98 0.00REFUND- CONTRIB 11/5/2014CK
AMBER C. BELL
11/5/2014 VO024392 01926105-15
122537 2,061.40 0.00REFUND- CONTRIB 11/5/2014CK
BRUCE M. TANNER
11/5/2014 VO024393 01926205-15
122617 2,323.99 0.00REFUND- CONTRIB 11/5/2014CK
AMY E. DANIELS
11/5/2014 VO024394 01926305-15
122939 4,093.96 0.00REFUND- CONTRIB 11/5/2014CK
REYNEIDA C. FELIX
11/5/2014 VO024395 01926405-15
123320 931.42 0.00REFUND- CONTRIB 11/5/2014CK
ROSA G. RAMIREZ
11/5/2014 VO024396 01926505-15
MASTER PAGE NO. 25

Closed
Invoice Discount AmountDocRefCheck Check InvoiceCheck
Nbr Type Date
Vendor ID
Vendor Name Nbr Type Date Taken PaidNumberTo Post
Date:
Time:
User:
Monday, December 01, 2014
09:28AM
108359
Page:Report:
Company:
2 of 10
03630.rpt
VCERA
Ventura County Retirement AssnCheck Register - Standard
Period: 05-15 As of: 12/1/2014
Period
123588 6,376.16 0.00REFUND- CONTRIB 11/5/2014CK
TAMYKO S. GRAY
11/5/2014 VO024397 01926605-15
123860 1,215.01 0.00REFUND- CONTRIB 11/5/2014CK
BRANDON S. TITUS
11/5/2014 VO024398 01926705-15
122796R 7,190.74 0.00ROLLOVER 11/5/2014CK
STATE FARM MUTUAL FUNDS
11/5/2014 VO024399 01926805-15
124086R 1,043.63 0.00ROLLOVER 11/5/2014CK
EDWARD JONES
11/5/2014 VO024400 01926905-15
121064B1R 57,456.92 0.00ROLLOVER 11/5/2014CK
CAPITAL BANK AND TRUST COMPANY
11/5/2014 VO024401 01927005-15
F1510B1 102.02 0.00DEATH BENEFIT 11/5/2014CK
SHANNON M. CONDIE
11/5/2014 VO024402 01927105-15
F1605B1 3,830.95 0.00DEATH BENEFIT 11/5/2014CK
ELEANOR RANGEL
11/5/2014 VO024403 01927205-15
F1794S 2,516.76 0.00DEATH BENEFIT 11/5/2014CK
JUDY SIMON
11/5/2014 VO024404 01927305-15
F3721S 3,255.85 0.00DEATH BENEFIT 11/5/2014CK
BILLY J. BUTLER
11/5/2014 VO024405 01927405-15
F8858S 3,610.14 0.00DEATH BENEFIT 11/5/2014CK
LEE A. HESS
11/5/2014 VO024406 01927505-15
F8619 1,901.38 0.00PENSION PAYMENT 11/5/2014CK
KAREN D. TURSE
11/5/2014 VO024407 01927605-15
XXXXX8816 5,479.91 0.00REFUND- CONTRIB 11/5/2014CK
TERESA PENA
11/5/2014 VO024408 01927705-15
990007 2,224.96 0.00TRAVEL REIMB 11/5/2014CK
DEANNA MCCORMICK
11/5/2014 VO024409 01927805-15
ADP 2,611.37 0.00ADMIN EXP 11/5/2014CK
ADP LLC
11/5/2014 VO024410 01927905-15
MASTER PAGE NO. 26

Closed
Invoice Discount AmountDocRefCheck Check InvoiceCheck
Nbr Type Date
Vendor ID
Vendor Name Nbr Type Date Taken PaidNumberTo Post
Date:
Time:
User:
Monday, December 01, 2014
09:28AM
108359
Page:Report:
Company:
3 of 10
03630.rpt
VCERA
Ventura County Retirement AssnCheck Register - Standard
Period: 05-15 As of: 12/1/2014
Period
BARNEY 600.00 0.00ADMIN EXP 11/5/2014CK
ABU COURT REPORTING INC
11/5/2014 VO024411 01928005-15
CALAPRS 3,100.00 0.00ADMIN EXP 11/5/2014CK
CALAPRS
11/5/2014 VO024412 01928105-15
SACRS 1,090.00 0.00ADMIN EXP 11/5/2014CK
SACRS
11/5/2014 VO024413 01928205-15
TRI 512.11 0.00ADMIN EXP 11/5/2014CK
TRI COUNTY OFFICE FURNITURE
11/5/2014 VO024414 01928305-15
VOLT 1,583.04 0.00ADMIN EXP 11/5/2014CK
VOLT
11/5/2014 VO024415 01928405-15
VSG 19,500.00 0.00PAS 11/5/2014CK
VSG HOSTING, INC
11/5/2014 VO024416 01928505-15
WALTER 208,146.70 0.00INVESTMENT FEES 11/5/2014CK
BNY MELLON INV MGMNT CAYMAN LTD
11/5/2014 VO024417 01928605-15
F8918 3,034.11 0.00PENSION PAYMENT 11/6/2014CK
BARBARA J. FLYNN
11/6/2014 VO024418 01928705-15
BARNEY 315.00 0.00ADMIN EXP 9/24/2014CK
ABU COURT REPORTING INC
11/6/2014 VO024419 01910805-15
107131 25,147.87 0.00REFUND CONTRIB 11/13/2014CK
ANA E. AVILA
11/13/2014 VO024420 01928805-15
119074 27,997.05 0.00REFUND CONTRIB 11/13/2014CK
MARIO A. MARTINEZ
11/13/2014 VO024421 01928905-15
122960 4,104.09 0.00REFUND CONTRIB 11/13/2014CK
NAOMI RODRIGUEZ
11/13/2014 VO024422 01929005-15
123067R 1,033.50 0.00ROLLOVER 11/13/2014CK
FMTC
11/13/2014 VO024423 01929105-15
MASTER PAGE NO. 27

Closed
Invoice Discount AmountDocRefCheck Check InvoiceCheck
Nbr Type Date
Vendor ID
Vendor Name Nbr Type Date Taken PaidNumberTo Post
Date:
Time:
User:
Monday, December 01, 2014
09:28AM
108359
Page:Report:
Company:
4 of 10
03630.rpt
VCERA
Ventura County Retirement AssnCheck Register - Standard
Period: 05-15 As of: 12/1/2014
Period
123095R 13,758.49 0.00ROLLOVER 11/13/2014CK
FIDELITY INVESTMENTS
11/13/2014 VO024424 01929205-15
F0522B1 1,061.89 0.00DEATH BENEFIT 11/13/2014CK
THE ESTATE OF B. RUBY CUMMINS
11/13/2014 VO024425 01929305-15
F0566B1 2,280.83 0.00DEATH BENEFIT 11/13/2014CK
PAUL P. DEFLORES JR.
11/13/2014 VO024426 01929405-15
F1274B1 4,210.06 0.00DEATH BENEFIT 11/13/2014CK
THE ESTATE OF MARGOT A. MARTIN
11/13/2014 VO024427 01929505-15
F2087S 1,877.36 0.00DEATH BENEFIT 11/13/2014CK
LINDA G. WHALEN
11/13/2014 VO024428 01929605-15
F5803B1 146.53 0.00DEATH BENEFIT 11/13/2014CK
THE ANDREW FAMILY TRUST OF 7/2/04
11/13/2014 VO024429 01929705-15
F3963 2,925.07 0.00PENSION PAYMENT 11/13/2014CK
AMANDO A. GUTIERREZ
11/13/2014 VO024430 01929805-15
101602 180.00 0.00REIMBURSEMENT 11/13/2014CK
HENRY SOLIS
11/13/2014 VO024431 01929905-15
107678 2,000.00 0.00REIMBURSEMENT 11/13/2014CK
DOUGLAS ARNETT
11/13/2014 VO024432 01930005-15
BARNEY 630.00 0.00ADMIN EXP 11/13/2014CK
ABU COURT REPORTING INC
11/13/2014 VO024433 01930105-15
CLIFTON 32,045.00 0.00INVESTMENT FEES 11/13/2014CK
PARAMETRIC CLIFTON
11/13/2014 VO024434 01930205-15
CORPORATE 112.91 0.00ADMIN EXP 11/13/2014CK
STAPLES ADVANTAGE
11/13/2014 VO024435 01930305-15
CUSTOM 1,056.40 0.00ADMIN EXP 11/13/2014CK
CUSTOM PRINTING
11/13/2014 VO024436 01930405-15
GFOA 420.00 0.00ADMIN EXP 11/13/2014CK
GOVERNMENT FINANCE
11/13/2014 VO024437 01930505-15
MASTER PAGE NO. 28

Closed
Invoice Discount AmountDocRefCheck Check InvoiceCheck
Nbr Type Date
Vendor ID
Vendor Name Nbr Type Date Taken PaidNumberTo Post
Date:
Time:
User:
Monday, December 01, 2014
09:28AM
108359
Page:Report:
Company:
5 of 10
03630.rpt
VCERA
Ventura County Retirement AssnCheck Register - Standard
Period: 05-15 As of: 12/1/2014
Period
HARRIS 124.50 0.00ADMIN EXP 11/13/2014CK
HARRIS WATER CONDITIONING INC
11/13/2014 VO024438 01930605-15
IFEBP 1,055.00 0.00ADMIN EXP 11/13/2014CK
INT'L FOUNDATION OF EMPLOYEE
11/13/2014 VO024439 01930705-15
INTERGRATE 250.00 0.00IT 11/13/2014CK
INTEGRATED FIRE & SAFETY
11/13/2014 VO024440 01930805-15
MANATT 6,274.08 0.00LEGAL FEES 11/13/2014CK
MANATT, PHELPS, PHILLIPS
11/13/2014 VO024441 01930905-15
MEGAPATH 638.46 0.00IT/PAS 11/13/2014CK
MEGAPATH
11/13/2014 VO024442 01931005-15
PEREA 875.00 0.00ADMIN EXP 11/13/2014CK
KENNETH A. PEREA
11/13/2014 VO024443 01931105-15
REAMS 121,485.00 0.00INVESTMENT FEES 11/13/2014CK
REAMS ASSET MANAGEMENT
11/13/2014 VO024444 01931205-15
VOLT 725.76 0.00ADMIN EXP 11/13/2014CK
VOLT
11/13/2014 VO024445 01931305-15
WESTERN 185,657.96 0.00INVESTMENT FEES 11/13/2014CK
WESTERN ASSET MANAGEMENT CO
11/13/2014 VO024446 01931405-15
108033 36,592.29 0.00REFUND CONTRIB 11/19/2014CK
LORI L. BARTH
11/19/2014 VO024447 01931505-15
121015 16,722.14 0.00REFUND CONTRIB 11/19/2014CK
JEFFREY ALAN AVANTS
11/19/2014 VO024448 01931605-15
121141 15,714.81 0.00REFUND CONTRIB 11/19/2014CK
TAMARA R. LAPO-CRAFT
11/19/2014 VO024449 01931705-15
122536 4,521.15 0.00REFUND CONTRIB 11/19/2014CK
CASSANDRA A. SAGO
11/19/2014 VO024450 01931805-15
MASTER PAGE NO. 29

Closed
Invoice Discount AmountDocRefCheck Check InvoiceCheck
Nbr Type Date
Vendor ID
Vendor Name Nbr Type Date Taken PaidNumberTo Post
Date:
Time:
User:
Monday, December 01, 2014
09:28AM
108359
Page:Report:
Company:
6 of 10
03630.rpt
VCERA
Ventura County Retirement AssnCheck Register - Standard
Period: 05-15 As of: 12/1/2014
Period
F2598B1 3,113.00 0.00DEATH BENEFIT 11/19/2014CK
BEVERLY S. FAIR
11/19/2014 VO024451 01931905-15
F2598B2 2,794.83 0.00DEATH BENEFIT 11/19/2014CK
KATHLEEN L. ACKERMAN
11/19/2014 VO024452 01932005-15
F2598B3R 3,776.80 0.00ROLLOVER 11/19/2014CK
CHARLES SCHWAB & CO., INC.
11/19/2014 VO024453 01932105-15
F2682S 3,243.37 0.00DEATH BENEFIT 11/19/2014CK
GERALD M. SCHNEIDER
11/19/2014 VO024454 01932205-15
F4582B1 1,460.95 0.00DEATH BENEFIT 11/19/2014CK
CAROLYN L. BERG
11/19/2014 VO024455 01932305-15
F4582B2R 1,772.47 0.00ROLLOVER 11/19/2014CK
HEARTLAND BANK
11/19/2014 VO024456 01932405-15
F4582B3 1,417.98 0.00DEATH BENEFIT 11/19/2014CK
MICHAEL SHANE BAKER
11/19/2014 VO024457 01932505-15
F6668B1 186.21 0.00DEATH BENEFIT 11/19/2014CK
CAROLYN L. BERG
11/19/2014 VO024458 01932605-15
F6668B2R 180.72 0.00ROLLOVER 11/19/2014CK
HEARTLAND BANK
11/19/2014 VO024459 01932705-15
F6668B3 180.72 0.00DEATH BENEFIT 11/19/2014CK
MICHAEL SHANE BAKER
11/19/2014 VO024460 01932805-15
ADP 8,870.13 0.00ADMIN EXP 11/19/2014CK
ADP LLC
11/19/2014 VO05-15024461 01932905-15
ADP -8,870.13 0.00ADMIN EXP 11/19/2014VC
ADP LLC
11/19/2014 VO05-15024461 01932905-15
Check Total 0.00
AT&T 289.05 0.00IT 11/19/2014CK
AT & T MOBILITY
11/19/2014 VO05-15024462 01933005-15
AT&T -289.05 0.00IT 11/19/2014VC
AT & T MOBILITY
11/19/2014 VO05-15024462 01933005-15
Check Total 0.00
MASTER PAGE NO. 30

Closed
Invoice Discount AmountDocRefCheck Check InvoiceCheck
Nbr Type Date
Vendor ID
Vendor Name Nbr Type Date Taken PaidNumberTo Post
Date:
Time:
User:
Monday, December 01, 2014
09:28AM
108359
Page:Report:
Company:
7 of 10
03630.rpt
VCERA
Ventura County Retirement AssnCheck Register - Standard
Period: 05-15 As of: 12/1/2014
Period
BROWN 2,132.50 0.00ADMIN EXP 11/19/2014CK
BROWN ARMSTRONG
11/19/2014 VO024463 01933105-15
CINTAS 130.40 0.00ADMIN EXP 11/19/2014CK
CINTAS CORP
11/19/2014 VO024464 01933205-15
CMP 20,455.00 0.00IT/PAS 11/19/2014CK
CMP & ASSOCIATES, INC
11/19/2014 VO024465 01933305-15
CUSTOM 259.20 0.00ADMIN EXP 11/19/2014CK
CUSTOM PRINTING
11/19/2014 VO024466 01933405-15
GFOA 180.00 0.00ADMIN EXP 11/19/2014CK
GOVERNMENT FINANCE
11/19/2014 VO024467 01933505-15
SMARTBEAR 5,542.65 0.00PAS 11/19/2014CK
SMARTBEAR SOFTWARE, INC
11/19/2014 VO024468 01933605-15
STATE 16,300.21 0.00INVESTMENT FEES 11/19/2014CK
STATE STREET BANK AND TRUST
11/19/2014 VO024469 01933705-15
TWC 481.97 0.00IT 11/19/2014CK
TIME WARNER CABLE
11/19/2014 VO024470 01933805-15
VITECH 2,500.00 0.00PAS 11/19/2014CK
VITECH SYSTEMS GROUP INC
11/19/2014 VO024471 01933905-15
VOLT 2,462.40 0.00ADMIN 11/19/2014CK
VOLT
11/19/2014 VO024472 01934005-15
ADP 8,870.13 0.00ADMIN EXP 11/19/2014CK
ADP LLC
11/19/2014 VO024473 01932905-15
AT&T 289.05 0.00IT 11/19/2014CK
AT & T MOBILITY
11/19/2014 VO024474 01933005-15
CA SDU 1,052.47 0.00CRT ORDERED PMT 11/25/2014CK
CALIFORNIA STATE
11/25/2014 VO024475 01934105-15
CALPERS 18,699.79 0.00INSURANCE 11/25/2014CK
CALPERS LONG-TERM
11/25/2014 VO024476 01934205-15
MASTER PAGE NO. 31
Closed
Invoice Discount AmountDocRefCheck Check InvoiceCheck
Nbr Type Date
Vendor ID
Vendor Name Nbr Type Date Taken PaidNumberTo Post
Date:
Time:
User:
Monday, December 01, 2014
09:28AM
108359
Page:Report:
Company:
8 of 10
03630.rpt
VCERA
Ventura County Retirement AssnCheck Register - Standard
Period: 05-15 As of: 12/1/2014
Period
CHILD21 171.74 0.00CRT ORDERED PMT 11/25/2014CK
OREGON DEPT OF JUSTICE
11/25/2014 VO024477 01934305-15
CHILD5 511.00 0.00CRT ORDERED PMT 11/25/2014CK
STATE DISBURSEMENT UNIT (SDU)
11/25/2014 VO024478 01934405-15
CHILD9 260.00 0.00CRT ORDERED PMT 11/25/2014CK
SHERIDA SEGALL
11/25/2014 VO024479 01934505-15
CVMP 543,269.39 0.00INSURANCE 11/25/2014CK
COUNTY OF VENTURA
11/25/2014 VO024480 01934605-15
FTBCA3 137.26 0.00GARNISHMENT 11/25/2014CK
FRANCHISE TAX BOARD
11/25/2014 VO024481 01934705-15
IRS6 321.00 0.00GARNISHMENT 11/25/2014CK
INTERNAL REVENUE SERVICE
11/25/2014 VO024482 01934805-15
IRS7 500.00 0.00GARNISHMENT 11/25/2014CK
INTERNAL REVENUE SERVICE
11/25/2014 VO024483 01934905-15
REAVC 4,263.00 0.00DUES 11/25/2014CK
RETIRED EMPLOYEES' ASSOCIATION
11/25/2014 VO024484 01935005-15
SEIU 295.50 0.00DUES 11/25/2014CK
SEIU LOCAL 721
11/25/2014 VO024485 01935105-15
SPOUSE2 1,874.00 0.00CRT ORDERED PMT 11/25/2014CK
KELLY SEARCY
11/25/2014 VO024486 01935205-15
SPOUSE3 250.00 0.00CRT ORDERED PMT 11/25/2014CK
ANGELINA ORTIZ
11/25/2014 VO024487 01935305-15
SPOUSE4 550.00 0.00CRT ORDERED PMT 11/25/2014CK
CATHY C. PEET
11/25/2014 VO024488 01935405-15
SPOUSE5 829.00 0.00CRT ORDERED PMT 11/25/2014CK
SUZANNA CARR
11/25/2014 VO024489 01935505-15
MASTER PAGE NO. 32

Closed
Invoice Discount AmountDocRefCheck Check InvoiceCheck
Nbr Type Date
Vendor ID
Vendor Name Nbr Type Date Taken PaidNumberTo Post
Date:
Time:
User:
Monday, December 01, 2014
09:28AM
108359
Page:Report:
Company:
9 of 10
03630.rpt
VCERA
Ventura County Retirement AssnCheck Register - Standard
Period: 05-15 As of: 12/1/2014
Period
SPOUSE6 675.00 0.00CRT ORDERED PMT 11/25/2014CK
BARBARA JO GREENE
11/25/2014 VO024490 01935605-15
SPOUSE7 104.00 0.00CRT ORDERED PMT 11/25/2014CK
MARIA G. SANCHEZ
11/25/2014 VO024491 01935705-15
VCDSA 245,369.04 0.00INSURANCE 11/25/2014CK
VENTURA COUNTY DEPUTY
11/25/2014 VO024492 01935805-15
VCPFF 70,076.71 0.00INSURANCE 11/25/2014CK
VENTURA COUNTY PROFESSIONAL
11/25/2014 VO024493 01935905-15
VRSD 6,423.84 0.00INSURANCE 11/25/2014CK
VENTURA REGIONAL
11/25/2014 VO024494 01936005-15
VSP 8,299.50 0.00INSURANCE 11/25/2014CK
VISION SERVICE PLAN - (CA)
11/25/2014 VO024495 01936105-15
100748 990.81 0.00TRAVEL REIMB 11/25/2014CK
CHRIS JOHNSTON
11/25/2014 VO024496 01936205-15
100917 1,113.56 0.00TRAVEL REIMB 11/25/2014CK
STEVEN HINTZ
11/25/2014 VO024497 01936305-15
990002 1,100.21 0.00TRAVEL REIMB 11/25/2014CK
ARTHUR E. GOULET
11/25/2014 VO024498 01936405-15
990007 313.72 0.00TRAVEL REIMB 11/25/2014CK
DEANNA MCCORMICK
11/25/2014 VO024499 01936505-15
ACCESS 682.29 0.00ADMIN EXP 11/25/2014CK
ACCESS INFORMATION MANAGEMENT
11/25/2014 VO024500 01936605-15
ASSIMA 2,328.93 0.00PAS 11/25/2014CK
ASSIMA, INC.
11/25/2014 VO024501 01936705-15
CORPORATE 51.35 0.00ADMIN EXP 11/25/2014CK
STAPLES ADVANTAGE
11/25/2014 VO024502 01936805-15
MBS 2,738.75 0.00PAS 11/25/2014CK
MANAGED BUSINESS SOLUTIONS, LLC.
11/25/2014 VO024503 01936905-15
MASTER PAGE NO. 33

Closed
Invoice Discount AmountDocRefCheck Check InvoiceCheck
Nbr Type Date
Vendor ID
Vendor Name Nbr Type Date Taken PaidNumberTo Post
Date:
Time:
User:
Monday, December 01, 2014
09:28AM
108359
Page:Report:
Company:
10 of 10
03630.rpt
VCERA
Ventura County Retirement AssnCheck Register - Standard
Period: 05-15 As of: 12/1/2014
Period
MF 15,200.57 0.00ADMIN EXP 11/25/2014CK
M.F. DAILY CORPORATION
11/25/2014 VO024504 01937005-15
NAPPA 450.00 0.00ADMIN EXP 11/25/2014CK
NAPPA
11/25/2014 VO024505 01937105-15
PIMCO 107,268.08 0.00INVESTMENT FEES 11/25/2014CK
PACIFIC INVESTMENT MGMT CO.
11/25/2014 VO024506 01937205-15
PRUDENTIAL 198,752.72 0.00INVESTMENT FEES 11/25/2014CK
PRUDENTIAL INSURANCE
11/25/2014 VO024507 01937305-15
SAFEGUARD 200.72 0.00ADMIN EXP 11/25/2014CK
SAFEGUARD BUSINESS SYSTEMS
11/25/2014 VO024508 01937405-15
VOLT 933.12 0.00ADMIN EXP/PAS 11/25/2014CK
VOLT
11/25/2014 VO024509 01937505-15
Check Count: 127Acct Sub Total: 2,344,211.01
Amount PaidCountCheck Type
2,353,685.19124Regular
0.000Hand
-9,474.183Void
0.000Stub
Zero 0.000
Mask 0 0.00
Total: 127 2,344,211.01
Electronic Payment 0 0.00
Company Total 2,344,211.01Company Disc Total 0.00
MASTER PAGE NO. 34
VENTURA COUNTY EMPLOYEES' RETIREMENT ASSOCIATION BUDGET SUMMARY FISCAL YEAR 2014-2015October 2014 - 33.33% of Fiscal Year Expended
Adopted AdjustedEXPENDITURE DESCRIPTIONS 2014/2015 2014/2015 Year to Date Available Percent
Budget Budget Oct-14 Expended Balance ExpendedSalaries & Benefits: Salaries 1,842,500.00$ 1,842,500.00$ 182,434.32$ 471,030.38$ 1,371,469.62$ 25.56% Extra-Help 62,600.00 62,600.00 6,026.40 24,889.11 37,710.89 39.76% Overtime 1,000.00 1,000.00 129.28 329.95 670.05 33.00% Supplemental Payments 59,600.00 59,600.00 5,359.96 14,061.76 45,538.24 23.59% Vacation Redemption 102,500.00 102,500.00 0.00 6,405.19 96,094.81 6.25% Retirement Contributions 366,000.00 366,000.00 34,941.74 91,003.56 274,996.44 24.86% OASDI Contributions 115,600.00 115,600.00 10,465.69 28,697.54 86,902.46 24.82% FICA-Medicare 29,100.00 29,100.00 2,666.90 6,930.82 22,169.18 23.82% Retiree Health Benefit 13,300.00 13,300.00 2,092.80 7,673.60 5,626.40 57.70% Group Health Insurance 182,100.00 182,100.00 17,670.00 46,124.40 135,975.60 25.33% Life Insurance/Mgmt 1,100.00 1,100.00 112.45 302.42 797.58 27.49% Unemployment Insurance 2,300.00 2,300.00 220.71 567.62 1,732.38 24.68% Management Disability Insurance 4,500.00 4,500.00 442.95 1,141.36 3,358.64 25.36% Worker' Compensation Insurance 13,400.00 13,400.00 1,361.03 3,514.51 9,885.49 26.23% 401K Plan Contribution 33,100.00 33,100.00 2,940.22 7,359.39 25,740.61 22.23% Transfers In 150,700.00 150,700.00 6,010.80 21,723.54 128,976.46 14.42% Transfers Out (150,700.00) (150,700.00) (6,010.80) (21,723.54) (128,976.46) 14.42%
Total Salaries & Benefits 2,828,700.00$ 2,828,700.00$ 266,864.45$ 710,031.61$ 2,118,668.39$ 25.10%
Services & Supplies: Telecommunication Services - ISF 37,800.00$ 37,800.00$ 3,030.11$ 11,128.75$ 26,671.25$ 29.44% General Insurance - ISF 12,200.00 12,200.00 0.00 0.00 12,200.00 0.00% Office Equipment Maintenance 1,000.00 1,000.00 0.00 0.00 1,000.00 0.00% Membership and Dues 9,500.00 9,500.00 0.00 4,319.00 5,181.00 45.46% Education Allowance 10,000.00 10,000.00 0.00 2,000.00 8,000.00 20.00% Cost Allocation Charges (35,400.00) (35,400.00) 0.00 0.00 (35,400.00) 0.00% Printing Services - Not ISF 3,000.00 3,000.00 431.08 754.67 2,245.33 25.16% Books & Publications 2,500.00 2,500.00 157.42 306.42 2,193.58 12.26% Office Supplies 20,000.00 20,000.00 1,041.59 2,772.74 17,227.26 13.86% Postage & Express 59,700.00 59,700.00 3,495.03 16,366.20 43,333.80 27.41% Printing Charges - ISF 10,000.00 10,000.00 0.00 1,191.20 8,808.80 11.91% Copy Machine Services - ISF 6,500.00 6,500.00 291.15 291.15 6,208.85 4.48% Board Member Fees 12,000.00 12,000.00 800.00 3,200.00 8,800.00 26.67% Professional Services 1,074,000.00 1,074,000.00 87,320.28 283,922.11 790,077.89 26.44% Storage Charges 5,500.00 5,500.00 0.00 1,033.19 4,466.81 18.79% Equipment 0.00 0.00 0.00 0.00 0.00 #DIV/0! Office Lease Payments 186,000.00 186,000.00 15,200.57 60,802.28 125,197.72 32.69% Private Vehicle Mileage 9,000.00 9,000.00 107.52 607.64 8,392.36 6.75% Conference, Seminar and Travel 63,000.00 63,000.00 1,519.18 3,757.80 59,242.20 5.96% Furniture 5,000.00 5,000.00 0.00 0.00 5,000.00 0.00% Facilities Charges 3,900.00 3,900.00 1,782.00 2,604.47 1,295.53 66.78% Transfers In 16,000.00 16,000.00 638.32 2,306.94 13,693.06 14.42% Transfers Out (16,000.00) (16,000.00) (638.32) (2,306.94) (13,693.06) 14.42%
Total Services & Supplies 1,495,200.00$ 1,495,200.00$ 115,175.93$ 395,057.62$ 1,100,142.38$ 26.42%
Total Sal, Ben, Serv & Supp 4,323,900.00$ 4,323,900.00$ 382,040.38$ 1,105,089.23$ 3,218,810.77$ 25.56%
Technology: Computer Hardware 32,600.00$ 32,600.00$ 100.41$ 401.72 32,198.28$ 1.23% Computer Software 193,000.00 193,000.00 4.99 29,441.15 163,558.85 15.25% Systems & Application Support 670,200.00 670,200.00 70,606.93 107,424.28 562,775.72 16.03% Pension Administration System 1,621,400.00 1,621,400.00 474,189.49 580,424.34 1,040,975.66 35.80%
Total Technology 2,517,200.00$ 2,517,200.00$ 544,901.82$ 717,691.49$ 1,799,508.51$ 28.51%
Contingency 615,200.00$ 615,200.00$ -$ -$ 615,200.00$ 0.00%
Total Current Year 7,456,300.00$ 7,456,300.00$ 926,942.20$ 1,822,780.72$ 5,633,519.28$ 24.45%
MASTER PAGE NO. 35

VENTURA COUNTY EMPLOYEES' RETIREMENT ASSOCIATION BUDGET SUMMARY FISCAL YEAR 2014-2015
November 2014 - 41.66% of Fiscal Year Expended
Adopted AdjustedEXPENDITURE DESCRIPTIONS 2014/2015 2014/2015 Year to Date Available Percent
Budget Budget Nov-14 Expended Balance ExpendedSalaries & Benefits: Salaries 1,842,500.00$ 1,842,500.00$ 122,271.46$ 593,301.84$ 1,249,198.16$ 32.20% Extra-Help 62,600.00 62,600.00 5,704.32 30,593.43 32,006.57 48.87% Overtime 1,000.00 1,000.00 0.00 329.95 670.05 33.00% Supplemental Payments 59,600.00 59,600.00 3,591.08 17,652.84 41,947.16 29.62% Vacation Redemption 102,500.00 102,500.00 1,610.77 8,015.96 94,484.04 7.82% Retirement Contributions 366,000.00 366,000.00 24,860.81 115,864.37 250,135.63 31.66% OASDI Contributions 115,600.00 115,600.00 6,955.29 35,652.83 79,947.17 30.84% FICA-Medicare 29,100.00 29,100.00 1,808.76 8,739.58 20,360.42 30.03% Retiree Health Benefit 13,300.00 13,300.00 2,092.80 9,766.40 3,533.60 73.43% Group Health Insurance 182,100.00 182,100.00 11,970.00 58,094.40 124,005.60 31.90% Life Insurance/Mgmt 1,100.00 1,100.00 72.66 375.08 724.92 34.10% Unemployment Insurance 2,300.00 2,300.00 147.74 715.36 1,584.64 31.10% Management Disability Insurance 4,500.00 4,500.00 896.37 2,037.73 2,462.27 45.28% Worker' Compensation Insurance 13,400.00 13,400.00 950.89 4,465.40 8,934.60 33.32% 401K Plan Contribution 33,100.00 33,100.00 2,006.91 9,366.30 23,733.70 28.30% Transfers In 150,700.00 150,700.00 10,843.76 32,567.30 118,132.70 21.61% Transfers Out (150,700.00) (150,700.00) (10,843.76) (32,567.30) (118,132.70) 21.61%
Total Salaries & Benefits 2,828,700.00$ 2,828,700.00$ 184,939.86$ 894,971.47$ 1,933,728.53$ 31.64%
Services & Supplies: Telecommunication Services - ISF 37,800.00$ 37,800.00$ 2,805.26$ 13,934.01$ 23,865.99$ 36.86% General Insurance - ISF 12,200.00 12,200.00 0.00 0.00 12,200.00 0.00% Office Equipment Maintenance 1,000.00 1,000.00 269.90 269.90 730.10 26.99% Membership and Dues 9,500.00 9,500.00 1,925.00 6,244.00 3,256.00 65.73% Education Allowance 10,000.00 10,000.00 2,000.00 4,000.00 6,000.00 40.00% Cost Allocation Charges (35,400.00) (35,400.00) 0.00 0.00 (35,400.00) 0.00% Printing Services - Not ISF 3,000.00 3,000.00 1,315.60 2,070.27 929.73 69.01% Books & Publications 2,500.00 2,500.00 0.00 306.42 2,193.58 12.26% Office Supplies 20,000.00 20,000.00 164.26 2,937.00 17,063.00 14.69% Postage & Express 59,700.00 59,700.00 9,033.21 25,399.41 34,300.59 42.55% Printing Charges - ISF 10,000.00 10,000.00 9,157.68 10,348.88 (348.88) 103.49% Copy Machine Services - ISF 6,500.00 6,500.00 0.00 291.15 6,208.85 4.48% Board Member Fees 12,000.00 12,000.00 1,400.00 4,600.00 7,400.00 38.33% Professional Services 1,074,000.00 1,074,000.00 22,558.41 306,480.52 767,519.48 28.54% Storage Charges 5,500.00 5,500.00 682.29 1,715.48 3,784.52 31.19% Equipment 0.00 0.00 0.00 0.00 0.00 #DIV/0! Office Lease Payments 186,000.00 186,000.00 15,200.57 76,002.85 109,997.15 40.86% Private Vehicle Mileage 9,000.00 9,000.00 1,348.70 1,956.34 7,043.66 21.74% Conference, Seminar and Travel 63,000.00 63,000.00 8,944.56 12,702.36 50,297.64 20.16% Furniture 5,000.00 5,000.00 512.11 512.11 4,487.89 10.24% Facilities Charges 3,900.00 3,900.00 400.00 3,004.47 895.53 77.04% Transfers In 16,000.00 16,000.00 1,151.56 3,458.50 12,541.50 21.62% Transfers Out (16,000.00) (16,000.00) (1,151.56) (3,458.50) (12,541.50) 21.62%
Total Services & Supplies 1,495,200.00$ 1,495,200.00$ 77,717.55$ 472,775.17$ 1,022,424.83$ 31.62%
Total Sal, Ben, Serv & Supp 4,323,900.00$ 4,323,900.00$ 262,657.41$ 1,367,746.64$ 2,956,153.36$ 31.63%
Technology: Computer Hardware 32,600.00$ 32,600.00$ -$ 401.72 32,198.28$ 1.23% Computer Software 193,000.00 193,000.00 7,871.58 37,312.73 155,687.27 19.33% Systems & Application Support 670,200.00 670,200.00 46,010.94 153,435.22 516,764.78 22.89% Pension Administration System 1,621,400.00 1,621,400.00 14,994.78 595,419.12 1,025,980.88 36.72%
Total Technology 2,517,200.00$ 2,517,200.00$ 68,877.30$ 786,568.79$ 1,730,631.21$ 31.25%
Contingency 615,200.00$ 615,200.00$ -$ -$ 615,200.00$ 0.00%
Total Current Year 7,456,300.00$ 7,456,300.00$ 331,534.71$ 2,154,315.43$ 5,301,984.57$ 28.89%
MASTER PAGE NO. 36

ACCRUED INTEREST AND DIVIDENDS 3,635,608SECURITY SALES 35,700,149MISCELLANEOUS 6,861
DOMESTIC EQUITY SECURITIES 118,637,582DOMESTIC EQUITY INDEX FUNDS 1,193,824,201INTERNATIONAL EQUITY SECURITIES 358,868,671INTERNATIONAL EQUITY INDEX FUNDS 259,029,569GLOBAL EQUITY 434,020,217PRIVATE EQUITY 97,724,029DOMESTIC FIXED INCOME - CORE PLUS 616,983,970DOMESTIC FIXED INCOME - U.S. INDEX 136,750,241GLOBAL FIXED INCOME 257,330,147REAL ESTATE 314,010,427ALTERNATIVES 435,185,821CASH OVERLAY - CLIFTON 75
SECURITY PURCHASES PAYABLE 39,278,995ACCOUNTS PAYABLE 2,028,477PREPAID CONTRIBUTIONS 120,149,705
MASTER PAGE NO. 37

ACCRUED INTEREST AND DIVIDENDS 4,578,958SECURITY SALES 32,095,552MISCELLANEOUS 6,710
DOMESTIC EQUITY SECURITIES 114,293,084DOMESTIC EQUITY INDEX FUNDS 1,227,654,353INTERNATIONAL EQUITY SECURITIES 354,238,047INTERNATIONAL EQUITY INDEX FUNDS 256,096,260GLOBAL EQUITY 434,904,507PRIVATE EQUITY 104,526,496DOMESTIC FIXED INCOME - CORE PLUS 615,550,357DOMESTIC FIXED INCOME - U.S. INDEX 138,021,503GLOBAL FIXED INCOME 256,256,784REAL ESTATE 313,736,471ALTERNATIVES 418,969,614CASH OVERLAY - CLIFTON 88
SECURITY PURCHASES PAYABLE 32,831,085ACCOUNTS PAYABLE 1,279,558PREPAID CONTRIBUTIONS 100,404,590
MASTER PAGE NO. 38

EMPLOYER $34,715,664EMPLOYEE 12,235,786
NET APPRECIATION IN FAIR VALUE OF INVESTMENTS (55,551,136)INTEREST INCOME 3,721,076DIVIDEND INCOME 15,231,517REAL ESTATE OPERATING INCOME, NET 3,859,111SECURITY LENDING INCOME 29,368
MANAGEMENT & CUSTODIAL FEES 3,392,385SECURITIES LENDING BORROWER REBATES (3,288)SECURITIES LENDING MANAGEMENT FEES 12,761
BENEFIT PAYMENTS 55,889,004MEMBER REFUNDS 834,842ADMINISTRATIVE EXPENSES 896,261
MASTER PAGE NO. 39

EMPLOYER $54,217,256EMPLOYEE 19,151,674
NET APPRECIATION IN FAIR VALUE OF INVESTMENTS (39,717,059)INTEREST INCOME 4,979,904DIVIDEND INCOME 16,066,867REAL ESTATE OPERATING INCOME, NET 3,859,111SECURITY LENDING INCOME 42,518
MANAGEMENT & CUSTODIAL FEES 3,717,274SECURITIES LENDING BORROWER REBATES (3,878)SECURITIES LENDING MANAGEMENT FEES 16,644
BENEFIT PAYMENTS 74,714,982MEMBER REFUNDS 1,302,385ADMINISTRATIVE EXPENSES 1,822,713
MASTER PAGE NO. 40
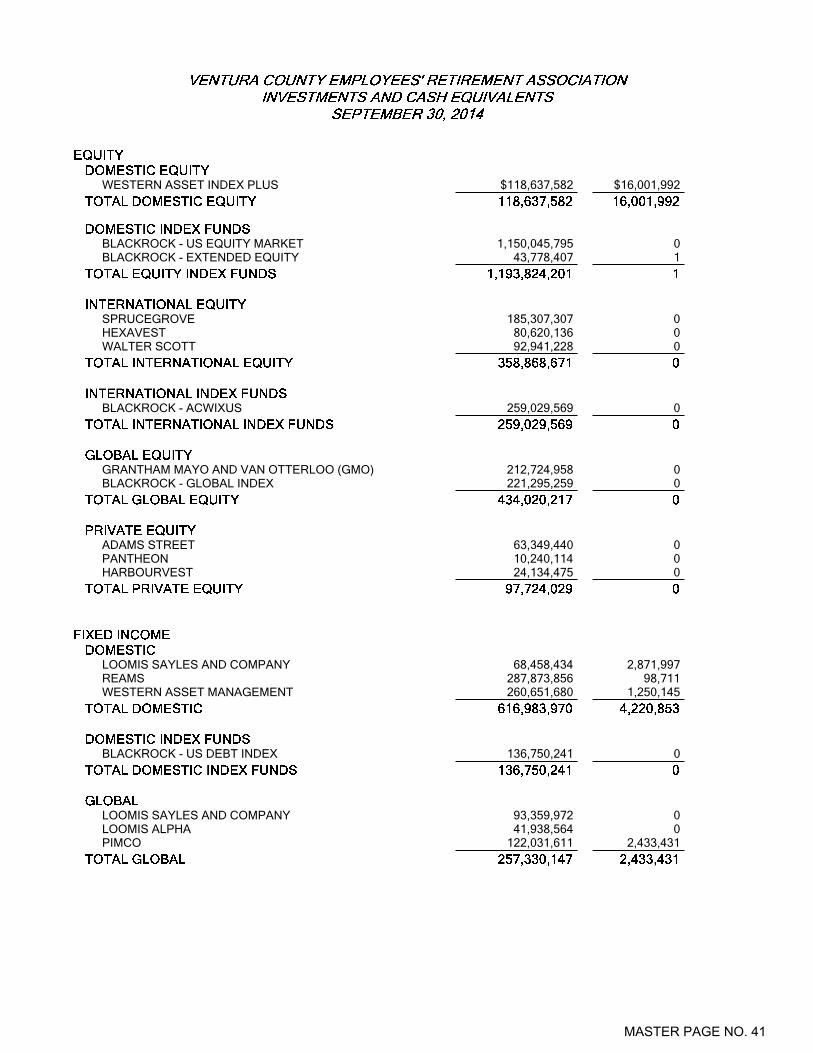
WESTERN ASSET INDEX PLUS $118,637,582 $16,001,992
BLACKROCK - US EQUITY MARKET 1,150,045,795 0BLACKROCK - EXTENDED EQUITY 43,778,407 1
SPRUCEGROVE 185,307,307 0HEXAVEST 80,620,136 0WALTER SCOTT 92,941,228 0
BLACKROCK - ACWIXUS 259,029,569 0
GRANTHAM MAYO AND VAN OTTERLOO (GMO) 212,724,958 0BLACKROCK - GLOBAL INDEX 221,295,259 0
ADAMS STREET 63,349,440 0PANTHEON 10,240,114 0HARBOURVEST 24,134,475 0
LOOMIS SAYLES AND COMPANY 68,458,434 2,871,997REAMS 287,873,856 98,711WESTERN ASSET MANAGEMENT 260,651,680 1,250,145
BLACKROCK - US DEBT INDEX 136,750,241 0
LOOMIS SAYLES AND COMPANY 93,359,972 0LOOMIS ALPHA 41,938,564 0PIMCO 122,031,611 2,433,431
MASTER PAGE NO. 41

PRUDENTIAL REAL ESTATE 103,915,047 0RREEF 7,474,566 0UBS REALTY 202,620,814 0
BRIDGEWATER 284,315,450 0TORTOISE (MLP's) 150,870,371 4,563,752
MASTER PAGE NO. 42

WESTERN ASSET INDEX PLUS $114,293,084 $19,371,128
BLACKROCK - US EQUITY MARKET 1,182,098,332 0BLACKROCK - EXTENDED EQUITY 45,556,021 1
SPRUCEGROVE 182,213,570 0HEXAVEST 79,446,792 0WALTER SCOTT 92,577,685 0
BLACKROCK - ACWIXUS 256,096,260 0
GRANTHAM MAYO AND VAN OTTERLOO (GMO) 212,008,712 0BLACKROCK - GLOBAL INDEX 222,895,794 0
ADAMS STREET 67,249,407 0PANTHEON 10,105,114 0HARBOURVEST 27,171,975 0
LOOMIS SAYLES AND COMPANY 68,008,534 3,351,873REAMS 286,571,170 98,948WESTERN ASSET MANAGEMENT 260,970,653 2,620,627
BLACKROCK - US DEBT INDEX 138,021,503 0
LOOMIS SAYLES AND COMPANY 93,359,972 0LOOMIS ALPHA 41,825,221 0PIMCO 121,071,592 5,365,874
MASTER PAGE NO. 43

PRUDENTIAL REAL ESTATE 103,915,047 0RREEF 7,200,610 0UBS REALTY 202,620,814 0
BRIDGEWATER 274,016,903 0TORTOISE (MLP's) 144,952,711 4,618,798
MASTER PAGE NO. 44

BLACKROCK - US EQUITY $60,383BLACKROCK - EXTENDED EQUITY 4,462WESTERN ASSET INDEX PLUS 62,105
BLACKROCK - ACWIXUS 66,873SPRUCEGROVE 118,188HEXAVEST 94,213WALTER SCOTT 208,147
GRANTHAM MAYO VAN OTTERLOO (GMO) 306,216BLACKROCK - GLOBAL INDEX 22,453
ADAMS STREET 486,628HARBOURVEST 80,149PANTHEON 37,500
BLACKROCK - US DEBT INDEX 23,682LOOMIS, SAYLES AND COMPANY 71,245REAMS ASSET MANAGEMENT 233,540WESTERN ASSET MANAGEMENT 123,553
LOOMIS, SAYLES AND COMPANY 72,083LOOMIS ALPHA 41,786PIMCO 107,351
PRUDENTIAL REAL ESTATE ADVISORS 198,753RREEF 22,388UBS REALTY 482,787
BRIDGEWATER 183,840TORTOISE 243,760
MASTER PAGE NO. 45

BORROWERS REBATE (3,288)MANAGEMENT FEES 12,761
INVESTMENT CONSULTANTINVESTMENT CUSTODIAN 8,257
MASTER PAGE NO. 46

BLACKROCK - US EQUITY $60,383BLACKROCK - EXTENDED EQUITY 4,462WESTERN ASSET INDEX PLUS 62,105
BLACKROCK - ACWIXUS 66,873SPRUCEGROVE 178,131HEXAVEST 94,213WALTER SCOTT 208,147
GRANTHAM MAYO VAN OTTERLOO (GMO) 403,294BLACKROCK - GLOBAL INDEX 22,453
ADAMS STREET 486,628HARBOURVEST 80,149PANTHEON 37,500
BLACKROCK - US DEBT INDEX 23,682LOOMIS, SAYLES AND COMPANY 71,245REAMS ASSET MANAGEMENT 233,540WESTERN ASSET MANAGEMENT 123,553
LOOMIS, SAYLES AND COMPANY 72,083LOOMIS ALPHA 42,217PIMCO 107,351
PRUDENTIAL REAL ESTATE ADVISORS 198,753RREEF 22,388UBS REALTY 482,787
BRIDGEWATER 274,317TORTOISE 243,760
MASTER PAGE NO. 47

BORROWERS REBATE (3,878)MANAGEMENT FEES 16,644
INVESTMENT CONSULTANT 68,750INVESTMENT CUSTODIAN 16,467
MASTER PAGE NO. 48

Ventura County Employees’ Retirement Association
15 December 2014
MASTER PAGE NO. 49

2 For use with institutional and professional investors only — proprietary and confidential
Table of Contents
I. BlackRock Update
II. Holdings and Performance Summary
III. Beta Strategies Update i. Portfolio Review
IV. Fixed Income Indexing Update i. Portfolio Review
Appendix i. Securities Lending Program Update
ii. Market Outlook
iii. Supplemental Performance
iv. Presenter Biographies
MASTER PAGE NO. 50

I. BlackRock Update
For use with institutional and professional investors only — proprietary and confidential MASTER PAGE NO. 51
4 For use with institutional and professional investors only - proprietary and confidential
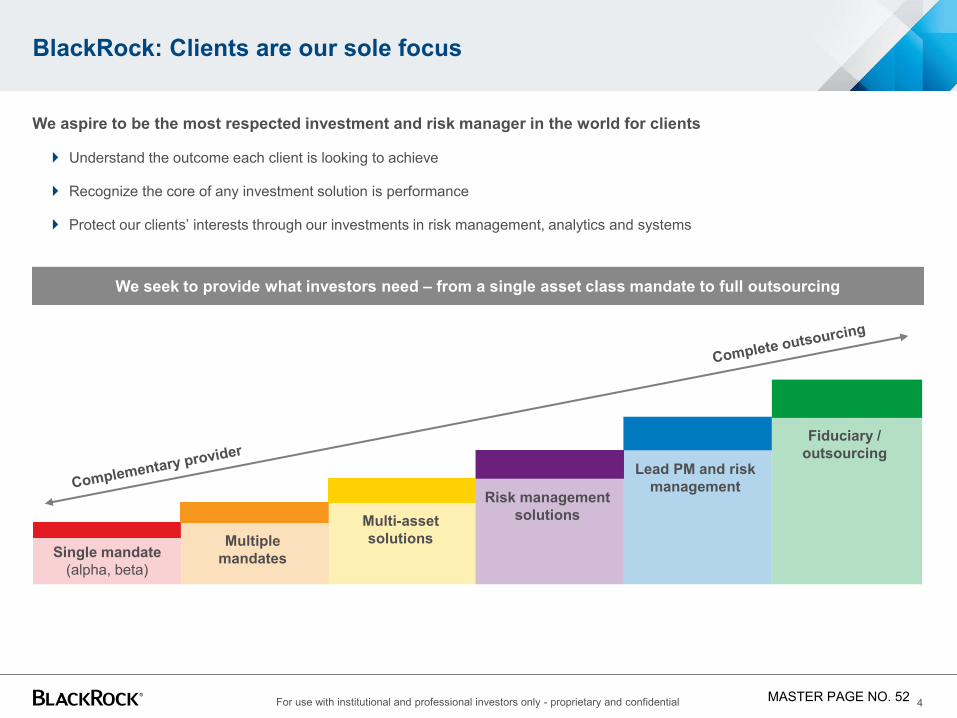
BlackRock: Clients are our sole focus
We aspire to be the most respected investment and risk manager in the world for clients
Understand the outcome each client is looking to achieve
Recognize the core of any investment solution is performance
Protect our clients’ interests through our investments in risk management, analytics and systems
We seek to provide what investors need – from a single asset class mandate to full outsourcing
Single mandate (alpha, beta)
Multiple mandates
Multi-asset solutions
Risk management solutions
Lead PM and risk management
Fiduciary / outsourcing
MASTER PAGE NO. 52

5 For use with institutional and professional investors only - proprietary and confidential
1970s • Pioneered index and quantitative investing
1980s • Created the First Term Trust (closed-end fund)
• Initiated fixed income and international indexing
1990s • Created the industry’s first target date fund
• Introduced exchange-traded funds under World Equity Benchmark Shares (WEBS) brand (now iShares® ETFs)
2000s
• Launched BlackRock Solutions® for risk management and advisory services
• Enhanced capabilities by strengthening equities, and adding alternatives, real estate, passive, and scientific investments
• Launched Financial Markets Advisory business
2010s
• Engaged by US and European governments for critical risk assessments and banking sector stabilization strategies
• Launched BlackRock Investment Institute
• Introduced Global Capital Markets desk
• Launched first target maturity fixed income ETF
• Created an index to track sovereign credit risk (BlackRock Sovereign Risk Index)
Firm culture and structure reinforce our client-centric approach
Independent asset manager focused only on clients Established in 1988 and public since 1999 (NYSE: BLK)
Independent Board of Directors
No proprietary trading
Group dedicated to corporate governance
Deep understanding of regulatory requirements Manage portfolios for clients subject to varied and complex
regulatory regimes
Operate on behalf of investors under more than 50 regulatory authorities worldwide
Significant experience managing portfolios for official institutions and governments
BlackRock Solutions® foundation for managing risk Deliberate, diversified and scaled risk enables us to invest
with conviction in pursuit of alpha
Internally developed risk tools and analysis offered directly to clients as a service
Reinforces transparency and our responsibility to clients
Timeline includes history from predecessor entities
History of innovation and evolution to better serve investors
MASTER PAGE NO. 53

6 For use with institutional and professional investors only - proprietary and confidential
Depth of investment resources maximizes performance potential
Organization drives idea and analysis sharing 133 investment teams located in 17 countries connect
through a common culture and operating platform*
The BlackRock Investment Institute (BII), our internal investor forum, facilitates sharing and debates insights
Daily global meeting for BlackRock’s 1,900+ investment
professionals to discuss markets, portfolio positioning and ongoing trends
Chief Investment Officers ensure rigorous, deliberate and repeatable investment processes
Investors potential benefit from scale of infrastructure Global trading function seeks to enable increased access to
liquidity and produces trading efficiencies, improving execution
Capital Markets Group leverages scale and breadth of platform to help maximize allocations and to seek alpha opportunities in primary markets
Dedicated Risk & Quantitative Analysis (RQA) professionals partner with portfolio teams to monitor and analyze risk
Proprietary Aladdin® platform integrates portfolio management, risk analytics, trading and operations
Built to generate alpha
Collective expertise
Global infrastructure
Trading Dedicated Capital Markets
Aladdin® Risk &
Quantitative Analysis
Investment Research
Daily Global Meeting
BlackRock Investment
Institute
Chief Investment Officers
*Data as of 30 June 2014
MASTER PAGE NO. 54

7 For use with institutional and professional investors only - proprietary and confidential
Positioned to address client needs
Breadth of capabilities enables outcome-based solutions tailored to individual client objectives
• Capabilities across investment styles: index, active fundamental, scientific and absolute return
• Global, regional and sector-specific investing
• Specialized capabilities across real estate, private equity, direct hedge funds, fund of hedge funds, infrastructure and renewable power
• Solutions-oriented approach extends to alternatives portfolio construction
• Manage strategies across benchmark types and styles: index, fundamental, model-based and absolute return
• Specialized experts covering all market sectors
• Recognized as a ‘go to’ leader in credit and liquidity
• Flexible product range across multiple currencies
• Outcome focused: target-date, balanced risk factor, and liability-driven investing
• Asset-class agnostic perspective facilitates unbiased market views, advice, and portfolio solutions
$4.52 trillion in assets under management Scalable services and infrastructure
• Centralized platform analyzes risk across asset classes
• Leverage for risk management, investment decision support and performance analytics
• Partner with clients to help save costs and reduce risks when changing investment exposures
• Executed over 3,000 individual transitions with assets totaling $2.3 trillion over the past five years
• Advise public and private financial institutions on complex capital markets and balance sheet exposures
• Managed or advised on over $8 trillion in asset and derivative portfolios
• More than 50,000 trades per day across equity, fixed income, cash, currency and futures
• 24-hour global coverage across seven trading desks
• Focus on research, technology and coordination with portfolio management functions that seek to deliver above market returns
• Covers securities in over 30 markets globally
Equity $2.4 trillion
Fixed Income $1.3 trillion
Alternatives* $113 billion
Multi-asset $373 billion
Cash $281 billion
Risk Management
Advisory
Transition Management
Securities Lending
Trading
AUM As of 30 September 2014 * The alternatives AUM may include committed capital, in addition to invested capital, which remains subject to drawdown
MASTER PAGE NO. 55

II. Holdings and Performance Summary
For use with institutional and professional investors only — proprietary and confidential MASTER PAGE NO. 56

9 For use with institutional and professional investors only — proprietary and confidential
Ventura County Employees’ Retirement Association Holdings & Performance Summary
November 2014 % FY 2015% YTD 2014 % 1-Year % Since Inception % AUM
Ventura County Employees’ Retirement System
US Equity Market Fund (inception 6/02/2008) 2.42 5.23 12.56 15.51 9.02 $1,210,681,373
Dow Jones U.S. Total Stock Market Index 2.42 5.17 12.49 15.44 8.94
Tracking Difference 0.00 0.06 0.07 0.07 0.08
Extended Equity Market Fund (inception 9/30/2002) 1.29 0.41 6.61 9.74 12.84 $46,144,931
Dow Jones U.S. Completion Total Stock Market Index 1.33 0.37 6.59 9.80 12.77
Tracking Difference -0.04 0.04 0.02 -0.06 0.07
ACWI Equity Index Fund (inception 6/27/2012) 1.71 0.17 6.63 8.43 17.78 $226,711,462
MSCI ACWI Net Dividend Return Index 1.67 0.03 6.21 8.04 17.34
Tracking Difference 0.04 0.14 0.42 0.39 0.44
ACWI ex-US IMI Index Fund (inception 5/30/2008) 0.59 -5.97 -0.37 0.66 0.71 $257,598,969
MSCI ACWI ex-U.S. IMI Index 0.58 -6.03 -0.60 0.38 0.50
Tracking Difference 0.01 0.06 0.23 0.28 0.21
As of 30 November 2014
*Returns since inception for periods greater than one year are annualized
MASTER PAGE NO. 57
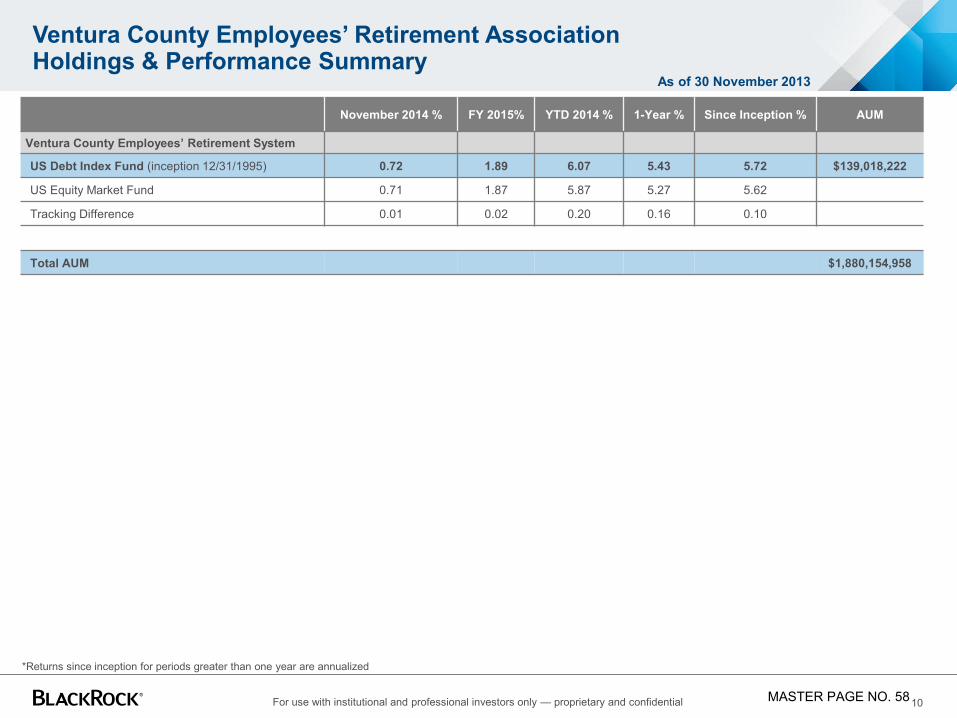
10 For use with institutional and professional investors only — proprietary and confidential
Ventura County Employees’ Retirement Association Holdings & Performance Summary
November 2014 % FY 2015% YTD 2014 % 1-Year % Since Inception % AUM
Ventura County Employees’ Retirement System
US Debt Index Fund (inception 12/31/1995) 0.72 1.89 6.07 5.43 5.72 $139,018,222
US Equity Market Fund 0.71 1.87 5.87 5.27 5.62
Tracking Difference 0.01 0.02 0.20 0.16 0.10
Total AUM $1,880,154,958
As of 30 November 2013
*Returns since inception for periods greater than one year are annualized
MASTER PAGE NO. 58

III. Beta Strategies Update
For use with institutional and professional investors only — proprietary and confidential MASTER PAGE NO. 59

12 For use with institutional and professional investors only — proprietary and confidential
BlackRock’s Beta Strategies Platform
Global leader in Index Equity assets1
We seek to deliver consistent performance with precise and reliable outcomes for our clients
Thousands of skillful and thoughtful decisions made each year for swift response to market trends and client demands
Extensive and flexible platform for beta strategies Over 2,000 funds managed against 650+ benchmarks
Daily liquidity with T-1 notification (for US equities) and T-2 notification (for non US equities)2
Modular fund structure and asset allocation platform facilitates custom and outcome oriented solutions
Source: BlackRock, Inc. and its affiliates (together “BlackRock”) as of 30 September 2014 1 In terms of AUM. Source: Pensions & Investments 2 Frontier markets commingled fund currently open bi-monthly
Total Beta Strategies risk managed assets of $2.9 trillion USD
In billions USD
851 1,019 1,316 6 1,366 439
560 735 775
2011 2012 2013 Sep-14
Institutional AUM iShares® AUM IAA Risk Managed
$1.7T $2.1T
$2.8T $2.8T
US Equities 51%
Developed Non-US
38%
Emerging Markets
10% Commoditie
s 1%
Distribution of assets by region of mandate
MASTER PAGE NO. 60

13 For use with institutional and professional investors only — proprietary and confidential
BlackRock is a leading global provider of equity index solutions
We have a history of consistent performance and low tracking error
Constant evolution
Relentless in our quest to improve beta strategies
Rapid and flexible response to trends, new markets and client demands
Our scale and technology innovations enhance our ability to deliver consistent performance
Seek performance with precision
We believe skill and ingenuity can lead to precise, reliable outcomes
Thousands of decisions each year provide opportunities to preserve value for clients
Backed by experienced teams specializing in tax, trading, risk oversight and securities lending
Clients first
We put clients at the center of our thinking and minimize potential conflicts of interest
Scale and diversity of our platform helps lower costs for clients
Strive for consistent performance as planned
Consistent returns with low costs
Flexible range of solutions to help meet diverse client needs
Minimal risk at less cost
Seek to provide: BlackRock’s Key Differentiators:
MASTER PAGE NO. 61

14 For use with institutional and professional investors only — proprietary and confidential
Over 40 years of experience driving beta forward
We constantly reinvest in and reinvent our business so our clients have access to high quality Beta solutions Drive the industry forward through our ability to create specialized, innovative investments afforded by our scale and depth of expertise
Forge new ground for clients — first manager to offer opportunities in equity index developed, emerging, and frontier markets
Evolve capabilities to continuously deliver on emerging trends — strategic beta, global benchmarking, overlay strategies
Serve as an index advocate on behalf of clients and as a key partner to index providers seeking our practitioner knowledge
Fund of fund structures
EAFE Equity
Index
Securities Lending
Equity and currency hedging
First 401(k) Target Date
Fund (LifePath)
Russell Index Funds
Investment Analysis:
index portfolio management
tool
Income strategy ETFs EAFE
Small Cap
EM Directed FX
Daily openings for all funds
Emerging Markets
Small Cap
Factor ETFs Aladdin
Migration T-2 for
International
Currency Hedged iShares ETFs
Index pioneer and innovator
Defined contribution capabilities
Emerging Market
Equity Index
World Equity Benchmark
Shares (WEBS)
Triple A: asset allocation
PM tool
iShares Exchange-
Traded Funds
Eliminated dividend flipping
Risk model
enhancements
EAFE Index Plus
Frontier Markets
Fundamentally
weighted strategies
Minimum Volatility ETFs Journey Mgmt
40 years of Beta Strategies — Continual evolution of products, technology and capabilities
1971 2014
BlackRock Index Equity RMA1
1 Risk Managed Assets (RMA) represents total asset values of the portfolio risks managed by Index Asset Allocation group
MASTER PAGE NO. 62

15 For use with institutional and professional investors only — proprietary and confidential
Source: Boston Consulting Group, Strategic Insight, eVestment Alliance, BLK Corporate Strategy estimates. AUM
figures represent industry AUM in $ trillions (excl MMFs & Instl Alts)
$6.38
$0.71
$1.59
Custom synthetic overlays
Implementing synthetic passive exposure over an alpha strategy
Creating capital efficient, liquid, rebalancing strategies
Expressing tactical asset allocation views through synthetic beta
Comprehensive core
Migrating to broader mandates — segregated index mandates are re-aggregated into one
Going global — ACWI / ACWI IMI1 is the fastest growing index strategy
Moving EM into mainstream — no longer niche; gain EM exposure via global indices
Complementary styles
Introducing strategic beta as complement to traditional market cap indices
• Minimum volatility • Fundamentally-weighted • Factor-based • Economic exposure
Beta strategies continue to be a growing portion of client portfolios
Investors today are enhancing their passive allocations in three ways:
Declining home equity bias and increasing global focus2 Growth in strategic beta over past 4 years
2005 2012
Source: BlackRock strategic beta (non-market cap weighted strategies) assets under management
Dom Index EM Index Global Index CAGR
+11%
+14%
$3.16
$0.05
$0.64
+48%
1 All Country World Index Investable Market Index 2 Represents $ in trillions from perspective of home country investor
$1
$8
$15
$29
0
5
10
15
20
25
30
35
2010 2011 2012 2013
$ bi
llion
s
MASTER PAGE NO. 63

16 For use with institutional and professional investors only — proprietary and confidential
Beta Strategies: Americas Index Equity
* Located outside of the US As of 8 Sept, 2014
Amy Schioldager Global Head of Beta Strategies
Corin Frost, CFA Global Head of Index
Product Strategy
Alan Mason Head of Americas Beta
Strategies
Americas Index Equity
Beta Strategies Leadership
Strategy
Christopher Bliss, CFA Head of Institutional
Portfolio Management
Amy Whitelaw Head of DC
Portfolio Management
Creighton Jue, CFA Head of Alternative
Beta
Matthew Lee, Ph.D. Head of Research
Stephanie Allen Head of Index Research
Scott Dohemann, CFA Head of US Index Strategy
Institutional Defined Contribution Alternative Research Index Research US Strategy
Rachel Aguirre Senior Portfolio
Manager
Matt Waldron, CFA Senior Portfolio
Manager
Maya Tussing Senior Portfolio
Manager
Peter Sietsema, CFA
Senior Portfolio Manager
North America International Developed
International Emerging
Index Allocation
Cara Barr
Kristen Dickey
Timothy Murray, CFA
Jerry Sun
Andrew Graver*
Jack Mortensen*
Timothy Parsons*
Flora Herries*
Ben Garland, CFA*
Colin Zhang*
Portfolio Management
North America International Developed
International Emerging
Index Allocation Defined Contribution Alternative Research Officer Index
Analyst
U.S.
Research
EMEA
+6 Portfolio Managers
+6 Portfolio Managers
+4 Portfolio Managers
+3 Portfolio Managers
+6 Portfolio Managers
+6 Portfolio Managers
+3 Officers +7 Analysts
APAC
MASTER PAGE NO. 64

17 For use with institutional and professional investors only — proprietary and confidential
Core investment philosophy of total performance management
We believe that superior investment outcomes are best achieved through a disciplined, objective process to manage return, risk and cost
Total Performance Management
Return
Cost Risk
Return Performance as planned with
value-added portfolio management
Flexible strategies and solutions
Risk Proprietary portfolio & risk
management system helps manage investment and operational risk
Cost Trading cost integrated into
portfolio construction using proprietary transaction cost models
Transaction costs minimized through internal crossing network
Focus on best execution for all external trading, including FX
MASTER PAGE NO. 65

18 For use with institutional and professional investors only — proprietary and confidential
Our index investment management process is anything but passive
Deep expertise and investment skill underpin consistent historical performance BlackRock’s beta portfolios are managed using a team approach to strategy, portfolio management, research, and trading
The ability to capture gains on hundreds of investment decisions adds up over time Portfolio managers’ decision-making process involves deciding on corporate actions such as dividends, stock splits, spinoffs, rights
offerings, and mergers & acquisitions
Benchmark Knowledge
Analysis of forthcoming index changes
Audit daily updates from index providers
Develop trade strategies to thoughtfully incorporate index events
Portfolio Construction
Teams of portfolio managers dedicated by region
Supported by leading technology and risk models
Rapid dividend reinvestment and cash equitization
Efficient Trading
Industry’s largest internal market
place for crossing
Best execution sought on all trades
Economies of scale
Dedicated trading research team
Performance & Oversight
Daily review by portfolio managers
Monthly Investment Review Committee
Independent Risk & Quantitative Analysis Group
Detail-intensive investment decisions in pursuit of performance with precision and reliability
Risk Management
Leverage RQA and BlackRock’s proprietary Aladdin® system to help identify, monitor and minimize risk
MASTER PAGE NO. 66

19 For use with institutional and professional investors only — proprietary and confidential
Factors PMs use to preserve value
Capital Markets Perspective
Fund-Specific Factors
Market sentiment
Macro economic events
Expected activity of
other investors
Local market convention
Corporate actions
Benchmark methodology
Risk model and optimization
Liquidity Profile
Exte
rnal
B
ench
mar
k
PMs evaluate aggregate views, activities, and sentiments of other investors, including: Net flows of BLK and other indexers Expected activity of profit-motivated investors Local market conventions and behaviors Macro economic events (Fed announcement, jobs report) Company earnings releases Market sentiment that could affect rebalancing
PMs have detailed understanding of benchmark changes in context of each Fund:
Ensure funds are fully invested in light of client flows or dividend
payments Construct each trade to explicitly trade off risk and cost Carefully evaluate corporate actions to help minimize risk and
preserve value Develop creative trading strategies for less liquid positions Partner with index providers regarding benchmark changes
Our portfolio managers use skill and ingenuity in pursuit of creating precis and reliable outcomes, and have delivered benchmark returns as planned each year
Beta PMs are experts in the capital markets they transact — actively driving hundreds of decisions each year
Beta Portfolio Managers
MASTER PAGE NO. 67

20 For use with institutional and professional investors only — proprietary and confidential
Beta Strategies is Anything but Passive — Google Corporate Action
Ensuring the interests of our
clients and advocating on their behalf are high priorities
Risks considered Delete Class A Shares (Original)
Retain both Class A and C Shares (Final Decision)
Liquidity Capital structure
Capital gains Tracking error Market impact
BlackRock-driven outcome: S&P and Russell revised published methodology to maintain both Class A and C for Google,
avoiding $45 billion in unnecessary trading and additional price volatility
Background
Google announced a distribution of new class of non-voting C shares to existing shareholders of outstanding shares of Class A and Class B common stock
S&P and Russell originally planned to delete the Google Class A shares from their respective indexes, and double the weight of the Class C shares
Impact Google represents ~2% in S&P 500 and Russell 1000. Beta Strategies engaged with
indexers and Google on potential risk of original treatment including tracking error, tax implications, and price volatility
MASTER PAGE NO. 68

21 For use with institutional and professional investors only — proprietary and confidential
-20%
0%
20%
40%
60%
80%
100%
May-13 Jun-13 Jul-13 Aug-13 Sep-13 Oct-13 Nov-13 Dec-13 Jan-14 Feb-14 Mar-14 Apr-14 May-14
MSCI UAE MSCI Qatar MSCI Emerging Markets
Deliberate balancing of risk, return, and costs: UAE and Qatar Reclassification from Frontier to Emerging Markets
Value Preservation
Globally, executed ~$1.5 billion in Qatar / UAE trades over several weeks
Cautious approach to liquidity and risk management
Generated $55 million in value for BlackRock clients
Reclassification Announcement June 11, 2013
SAIR Announcement 10 Qatar, 9 UAE adds. Market turnover: $1.6M
Pre-positioning Investors buy into markets; EM flat
Effective date May 29, 2014. Prices peak
BLK trading
strategies create value
Market context
Significant pre-positioning
Low liquidity, large trade size
Operational complexity & immature local market structure
Benchmark context
UAE and Qatar promoted to EM status by MSCI effective May 30th, 2014
UAE and Qatar to comprise appx 50 bps each in MSCI EM Index
Net expected buy of ~$1bn in each market was 10 – 15x ADV
MASTER PAGE NO. 69

22 For use with institutional and professional investors only — proprietary and confidential
Sources: BlackRock, Russell, Bloomberg, Barclays Capital. Performance calculated on a trade-weight basis.
Russell Reconstitution 2014
A unique year for Russell reconstitution
Late on effective date, performance of both Russell 1000 and 2000 moved in the opposite direction of indexer flows.
Business Development Companies (BDCs) were removed
• This resulted in 2 deletions from R1000 at 5 bps turnover, and 33 deletions from R2000 at 1.19% of the index.
2014 BlackRock Fund Performance
Maintained tight risk controls and captured $10.5 million in value through specific trading strategies.
Total gross value of our trade was $49.8 billion.
• Crossed over $12 billion per side (49%) thereby reducing trading costs for BlackRock clients.
Processed over 160,000 orders in Aladdin vs. an average of 30,000 per day
Russell 1000 Buys vs Sells
Russell 2000 Buys vs Sells
One-Way Rebalance Turnover
2014 2013 2012 2011 2010
Russell 1000 2.17% 2.32% 1.82% 2.69% 3.92%
Russell 2000 10.11% 9.01% 10.05% 10.48% 9.50%
All R2 Buys All R2 Sells
All R1 Buys All R1 Sells
June 27 Rebalance Trade Intra-day Performance
MASTER PAGE NO. 70

23 For use with institutional and professional investors only — proprietary and confidential
BlackRock’s scale and internal crossing network deliver significantly lower transaction costs
The scale of BlackRock’s CTFs and global trading footprint results in reduced T costs: On average, we cross approximately 40 – 50% of client flows
Market trades reflect the industry’s most competitive commission rates
1 Estimated transaction costs includes commissions and taxes based on BlackRock’s current standard negotiated rates. Source: BlackRock. BlackRock Flagship Index Funds shown.
BlackRock transaction costs vs. ex-ante estimates1 Average client cost in 2013, as of Dec 31, 2013
1 1
8
1
5 3
6
10
2 2
17
4
15
7
13
21
0
5
10
15
20
25
Buy Sell Buy Sell Buy Sell Buy Sell
S&P 500 MSCI EAFE MSCI ACWI ex-US IMI MSCI EM
Tran
sact
ion
cost
s (b
p)
Actual Client T-Cost T-Cost Estimate Pre Crossing
MASTER PAGE NO. 71

24 For use with institutional and professional investors only — proprietary and confidential
0 0 0 0 0 0 0 0
105
9 2 0 2 1 0 1 0
0
10
20
30
40
50
60
70
80
90
100
110
120
-8 to -7 -7 to -6 -6 to -5 -5 to -4 -4 to -3 -3 to -2 -2 to -1 -1 to 0 0 to 1 1 to 2 2 to 3 3 to 4 4 to 5 5 to 6 6 to 7 7 to 8 8 to 9
# of
tim
es b
ench
mar
k m
atch
ed o
r bea
t
Performance in relation to benchmark (BPS)
Precision performance, as planned
Over the past 10 years, Beta’s S&P 500® Index Equity strategy matched or beat the benchmark 100% of the time
As of 30 September 2014 Source: BlackRock, Inc. and S&P Past performance is no guarantee of future results
S&P 500 Index Fund A Performance — Excess Returns Matched or beat: 100%
MASTER PAGE NO. 72
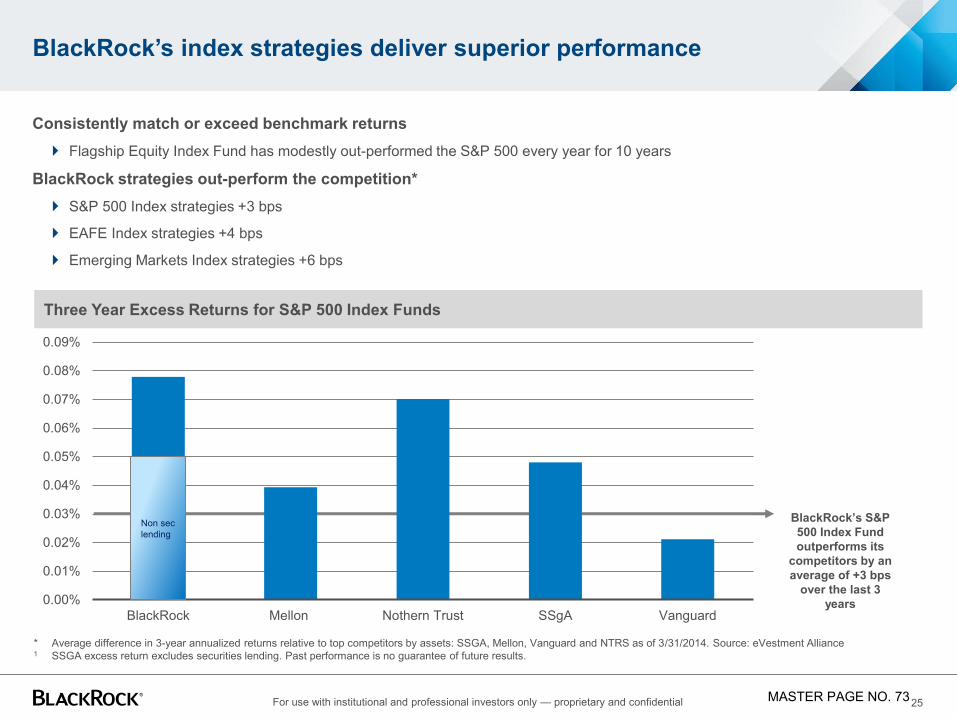
25 For use with institutional and professional investors only — proprietary and confidential
0.00%
0.01%
0.02%
0.03%
0.04%
0.05%
0.06%
0.07%
0.08%
0.09%
BlackRock Mellon Nothern Trust SSgA Vanguard
BlackRock’s index strategies deliver superior performance
Consistently match or exceed benchmark returns Flagship Equity Index Fund has modestly out-performed the S&P 500 every year for 10 years
BlackRock strategies out-perform the competition* S&P 500 Index strategies +3 bps
EAFE Index strategies +4 bps
Emerging Markets Index strategies +6 bps
BlackRock’s S&P 500 Index Fund outperforms its
competitors by an average of +3 bps
over the last 3 years
Three Year Excess Returns for S&P 500 Index Funds
* Average difference in 3-year annualized returns relative to top competitors by assets: SSGA, Mellon, Vanguard and NTRS as of 3/31/2014. Source: eVestment Alliance 1 SSGA excess return excludes securities lending. Past performance is no guarantee of future results.
Non sec lending
MASTER PAGE NO. 73

26 For use with institutional and professional investors only — proprietary and confidential
Key takeaway Our approach to Beta: anything but passive
Investors today demand more reliable, precise returns and innovative ways to use beta
BlackRock Beta Strategies’ approach is focused on:
Seek to provide consistent performance
as planned
Performance
Rooted in deep understanding of
benchmarks and capital markets
Process
Scale and technology innovations enhance
ability to deliver consistent performance
and minimize costs
Platform
Flexible spectrum of solutions featuring
more than 1,000 funds covering 350+ benchmarks
Products
Team combines skill and ingenuity in
seeking to enhance outcomes
People
MASTER PAGE NO. 74

i. Portfolio Review
For use with institutional and professional investors only — proprietary and confidential MASTER PAGE NO. 75

28 For use with institutional and professional investors only — proprietary and confidential
* Returns since inception for periods greater than one year are annualized Client inception 2 June 2008 Fiscal year end June 30
Returns since client inception
US Equity Market Fund Ventura County Employees’ Retirement Association
2.42
5.23
12.56
15.51
9.02
2.42
5.17
12.49
15.44
8.94
0
2
4
6
8
10
12
14
16
18
Nov-14 Fiscal year 2015 YTD 2014 1 Year Since inception*
Perc
ent
Fund DJ US Total Stock Market Index
Account value $1,210,681,373
As of 30 November 2014
MASTER PAGE NO. 76
29 For use with institutional and professional investors only — proprietary and confidential
Portions of the above characteristics are based on benchmark data as the portfolio fully replicates benchmark and is for analytical purposes only. Index data may differ to those published by the Index due to different classification criteria. Breakdowns may not sum to total due to rounding, exclusion of cash, STIF, and statistically immaterial factors Sources: BlackRock, FactSet
Sector diversification
Equity Index Fund Characteristics
Eq-
Idx-
A-C
h
11.70
9.55
9.70
16.33
13.89
10.28
19.66
3.45
2.43
3.00
11.70
9.55
9.70
16.34
13.89
10.28
19.66
3.45
2.43
3.00
0 8 16 24
Consumer discretionary
Consumer staples
Energy
Financials
Health care
Industrials
Information technology
Materials
Telecommunication services
Utilities
Fund Index
Top 10 holdings
Fund % Index %
Apple Inc. 3.44 3.44
Exxon Mobil Corporation 2.29 2.29
Microsoft Corporation 2.18 2.18
Johnson & Johnson 1.72 1.72
General Electric Company 1.47 1.47
Berkshire Hathaway Inc. Class B 1.44 1.44
Wells Fargo & Company 1.41 1.41
Procter & Gamble Company 1.29 1.29
Chevron Corporation 1.29 1.29
JPMorgan Chase & Co. 1.29 1.29
Characteristics
Strategy S&P 500® Index
Total fund assets $63.47B
Number of holdings 502
As of 30 September 2014
MASTER PAGE NO. 77

30 For use with institutional and professional investors only — proprietary and confidential
* Returns since inception for periods greater than one year are annualized Client inception 30 September 2002 Fiscal year end June 30
Returns since client inception
Extended Equity Market Fund Ventura County Employees’ Retirement Association
1.29 0.41
6.61
9.74
12.84
1.33 0.37
6.59
9.80
12.77
0
2
4
6
8
10
12
14
Nov-14 Fiscal year 2015 YTD 2014 1 Year Since inception*
Perc
ent
Fund DJ US Completion Total Stock Market Index
Account value $46,144,931
As of 30 November 2014 E
xEqA
R-M
VP
-121
015*
MASTER PAGE NO. 78

31 For use with institutional and professional investors only — proprietary and confidential
This information is unaudited and intended for analytical purposes only Sources: BlackRock, FactSet Sector diversification
Extended Market Fund Characteristics
Ext
-Mkt
-A-C
h
15.89
2.91
6.46
22.28
11.83
14.65
16.17
5.26
1.31
3.12
15.81
2.93
6.47
22.33
11.82
14.74
16.10
5.27
1.32
3.13
0 9 18 27
Consumer discretionary
Consumer staples
Energy
Financials
Health care
Industrials
Information technology
Materials
Telecommunication services
Utilities
Fund Index
Top 10 holdings
Fund % Index %
Twitter, Inc. 0.61 0.61
American Airlines Group, Inc. 0.61 0.61
Tesla Motors, Inc. 0.55 0.55
Las Vegas Sands Corp. 0.54 0.55
Illumina, Inc. 0.54 0.54
LinkedIn Corporation Class A 0.51 0.51
Liberty Global Plc Class C 0.51 0.51
HCA Holdings, Inc. 0.51 0.51
Cheniere Energy, Inc. 0.43 0.42
United Continental Holdings, Inc. 0.41 0.41
Characteristics
Strategy Dow Jones US Completion Total Stock Market Index
Total fund assets $9.36B
Number of holdings 2,292
As of 30 September 2014
MASTER PAGE NO. 79

32 For use with institutional and professional investors only — proprietary and confidential
Returns since inception for periods greater than one year are annualized Client inception 27 June 2012 Fiscal year end June 30
Returns since client inception
ACWI Index Fund Ventura County Employees’ Retirement Association
1.71 0.17
6.63 8.43
17.78
1.67 0.03
6.21 8.04
17.34
02468
101214161820
Nov-14 Fiscal year 2015 YTD 2014 1 Year Since inception*
Perc
ent
Fund MSCI ACWI Index
Account value $226,711,462
FI-M
VP
-121
015*
As of 30 November 2014
MASTER PAGE NO. 80

33 Intended for use in a one-on-one presentation with institutional trust clients or prospective eligible
institutional trust clients of BlackRock Institutional Trust Company. N.A. (“BTC”)
This information is unaudited and intended for analytical purposes only Sources: BlackRock, FactSet
ACWI Index Fund Characteristics
Characteristics
Strategy MSCI ACWI IndexSM
Total fund value $1.05B
Number of issues 2,480
Country allocation (%)
Top 10 holdings
Country Weight (%)
Apple Inc. United States 1.65
Exxon Mobil Corporation United States 1.10
Microsoft Corporation United States 0.99
Johnson & Johnson United States 0.82
Wells Fargo & Company United States 0.71
General Electric Company United States 0.70
Nestle S.A. Switzerland 0.64
JPMorgan Chase & Co. United States 0.62
Chevron Corporation United States 0.62
Procter & Gamble Company United States 0.62
Canada 3.76 France 3.49 Switzerland 3.19 Germany 3.08 Australia 2.63 China 2.09 Korea 1.64 Taiwan 1.30 Spain 1.28 Brazil 1.12 Sweden 1.08 Hong Kong 1.03 Netherlands 0.97 Italy 0.90 South Africa 0.80
India 0.77 Mexico 0.60 Denmark 0.55 Singapore 0.53 Russia 0.50 Belgium 0.44 Malaysia 0.43 Finland 0.32 Norway 0.30 Indonesia 0.29 Thailand 0.26 Ireland 0.21 Israel 0.20 Poland 0.18 Turkey 0.17
Chile 0.16 Philippines 0.13 Colombia 0.11 Austria 0.07 Greece 0.07 Portugal 0.07 United Arab Emirates 0.07 Qatar 0.06 Peru 0.05 New Zealand 0.04 Czech Republic 0.03 Egypt 0.03 Hungary 0.02 Luxembourg 0.00
As of 30 September 2014 A
CW
I-Ind
ex-A
-Ch
United States 50.15
United Kingdom
7.44
Japan 7.39
MASTER PAGE NO. 81
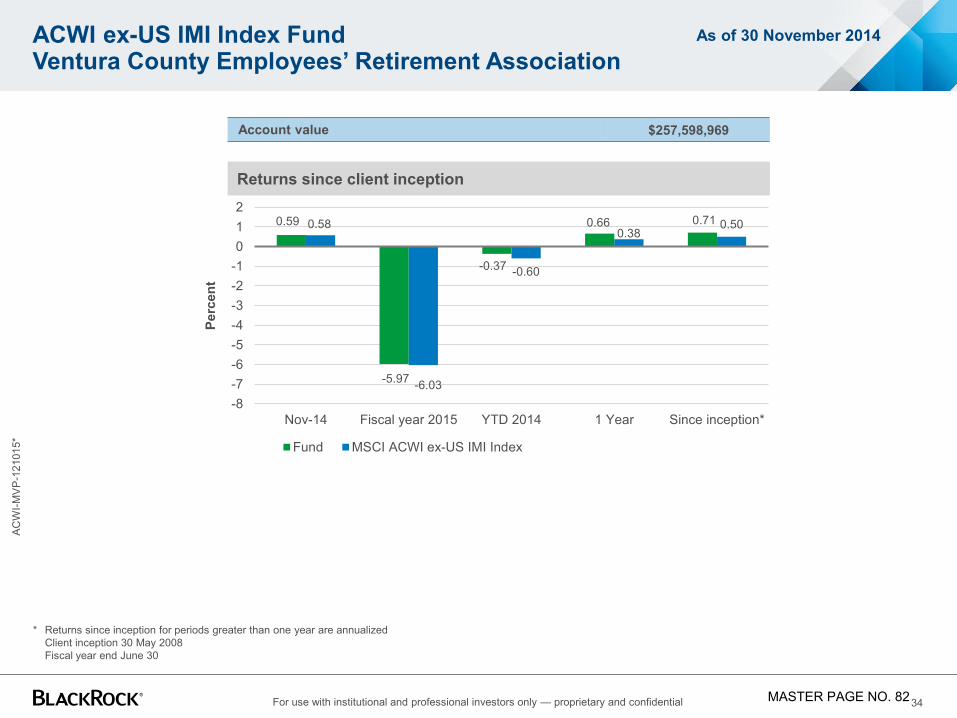
34 For use with institutional and professional investors only — proprietary and confidential
* Returns since inception for periods greater than one year are annualized Client inception 30 May 2008 Fiscal year end June 30
Returns since client inception
ACWI ex-US IMI Index Fund Ventura County Employees’ Retirement Association
0.59
-5.97
-0.37
0.66 0.71 0.58
-6.03
-0.60
0.38 0.50
-8-7-6-5-4-3-2-1012
Nov-14 Fiscal year 2015 YTD 2014 1 Year Since inception*
Perc
ent
Fund MSCI ACWI ex-US IMI Index
Account value $257,598,969
AC
WI-M
VP
-121
015*
As of 30 November 2014
MASTER PAGE NO. 82

35 Intended for use in a one-on-one presentation with institutional trust clients or prospective eligible
institutional trust clients of BlackRock Institutional Trust Company. N.A. (“BTC”)
This information is unaudited and intended for analytical purposes only Sources: BlackRock, FactSet
BlackRock MSCI ACWI ex-US IMI IndexSM Fund A Characteristics
Characteristics
Strategy MSCI ACWI ex-US IMISM
Total fund value $6.94B
Number of issues in fund 6,132
Number of issues in index 6,039
Top 10 holdings
Country Weight (%)
Nestle S.A. Switzerland 1.12
Novartis AG Switzerland 1.02
Roche Holding Ltd Genusssch. Switzerland 0.98
HSBC Holdings plc United Kingdom 0.92
Toyota Motor Corp. Japan 0.78
Royal Dutch Shell Plc Class A United Kingdom 0.71
Total SA France 0.67
BP p.l.c. United Kingdom 0.64
Sanofi France 0.64
Samsung Electronics Co., Ltd. Korea 0.60
China 4.22 Korea 3.36 Taiwan 2.84 Spain 2.49 Sweden 2.24 Brazil 2.10 Hong Kong 2.04 Italy 1.88 Netherlands 1.83 South Africa 1.61 India 1.54 Singapore 1.16 Denmark 1.12 Mexico 1.12
Belgium 0.90 Russia 0.90 Malaysia 0.89 Norway 0.73 Finland 0.67 Indonesia 0.61 Thailand 0.59 Israel 0.44 Poland 0.35 Turkey 0.34 Chile 0.31 Ireland 0.27 Philippines 0.27 Austria 0.20
AC
WI-e
x-U
S-IM
I-A-C
h
Colombia 0.20 New Zealand 0.17 Portugal 0.16 Greece 0.14 United Arab Emirates 0.14 Qatar 0.13 Peru 0.09 Egypt 0.08 Czech Republic 0.05 Hungary 0.04 Luxembourg 0.00
As of 30 September 2014
Country allocation (%)
Japan 15.48
United Kingdom
14.98
Canada 7.76 France
6.47
Switzerland 5.98
Germany 5.93
Australia 5.20
MASTER PAGE NO. 83

IV. Fixed Income Indexing Update
For use with institutional and professional investors only — proprietary and confidential MASTER PAGE NO. 84

37 For use with institutional and professional investors only — proprietary and confidential
Global fixed income platform provides greater access to investment opportunities
Benefits of BlackRock's breadth and depth Talent: 400+ fixed income professionals generate ideas and identify insights to create alpha opportunities
Trading: Global execution platform provides deep market access
Technology: Best-in-class analytics and risk management enables us to better understand and take risk in pursuit of alpha
Culture: Fiduciary commitment to advising and serving clients drives our investment culture
Experienced leadership team oversees portfolio teams with decision-making autonomy
AUM in USD as of 30 September 2014; excludes fixed income alternative assets
Active $683 billion
Global Fixed Income Platform $1.33 trillion
Rick Rieder Co-head of Americas FI
CIO of Fundamental FI
Kevin Holt Co-head of Americas FI
Tim Webb Head of International FI
CIO of Model-based FI
Fundamental $637 billion
Model-Based $46 billion
Index $451 billion
ETF $199 billion
Passive $650 billion
MASTER PAGE NO. 85

38 For use with institutional and professional investors only — proprietary and confidential
BlackRock Model-Based North America Portfolio Solutions Team
The North America portfolio solutions team consists of 25 investment professionals Scott Radell, CFA, Managing Director, is a Head of US Fixed Income Portfolio Solutions within BlackRock's Model-Based Fixed Income Portfolio Management Group. Mr. Radell's service with the firm dates back to 2003, including his years with Barclays Global Investors (BGI), which merged with BlackRock in 2009. At BGI, Mr. Radell was the Head of Portfolio Solutions, a group responsible for management and oversight of all US based active fixed income funds. Before founding the Portfolio Solutions Group, he was a portfolio manager responsible for BGI's active investment grade long-only and long/short cross-over portfolios. Prior to joining BGI, Scott served for over seven years as an analyst for corporate bond and Commercial Mortgage Backed Securities for Morgan Stanley Investment Management. Mr. Radell began his career as a fixed income client service and mortgage analysts at BARRA.
Mr. Radell earned a BA degree in quantitative economics and decision sciences from the University of California at San Diego in 1992.
Credit Multi-Sector/Other Rates/Mortgage/EM
Scott Radell
Sr. Portfolio Manager Multi-Sector
Joel Silva
Sr. Portfolio Manager Municipals / Canada
Karen Uyehara
Portfolio Manager Multi-Sector
Rena Patel
Portfolio Manager Municipals
Jasmita Mohan
Portfolio Manager Multi-Sector
Tao Chen
Portfolio Manager Municipal Bonds
Jermaine Pierre
Portfolio Manager Canada
Clay Armistead
Portfolio Manager Securitized Credit
Shashank Khanna
Jr Portfolio Manager Canada
David Dulski
Portfolio Manager Corporate Credit
Allen Kwong
Portfolio Manager Corporate Credit
Nicolas Giometti
Jr Portfolio Manager Corporate Credit
Eric Souders
Portfolio Manager Corporate Credit
Jonathan Graves
Sr. Portfolio Manager Corporate Credit
Elya Schwartzman
Portfolio Manager Corporate Credit
Jay Mauro
Sr. Portfolio Manager US Government Bonds
Parry Wang
Portfolio Manager Agency Mortgages
Wes George
Portfolio Manager US Government Bonds
Mark Buell
Portfolio Manager US Government Bonds
Daniel Ruiz
Portfolio Manager Emerging Markets
Gabe Shipley
Portfolio Manager Emerging Markets
Leo Landes
Portfolio Manager Corporate Credit
As of 30 September 2014
Garrett Herfkens
Portfolio Manager Corporate Credit
Jesse Kang
Jr Portfolio Manager Corporate Credit
Lip Tong
Portfolio Manager Canada
MASTER PAGE NO. 86

39 For use with institutional and professional investors only — proprietary and confidential
Fixed Income indexing: different market, different strategy
Quantitative process balances tracking error & transaction costs Unlike equities, Fixed Income is not traded on exchanges
Prohibitive costs, uncertain liquidity, and issue scarcity often makes perfect replication infeasible
Index process optimizes marginal contribution to tracking error with T-Costs
For illustrative purpose only. Source: BlackRock
Tracking Error
Number of issues
Transaction Costs Optimal Portfolio
Bas
is P
oint
s
MASTER PAGE NO. 87

40 For use with institutional and professional investors only — proprietary and confidential
Modular Fund Design
BlackRock's modular fund design leverages our scale and facilitates crossing opportunities for clients
Source: BlackRock; data as of 30 September 2014 *12 month ex-ante risk
Long Credit Issues Fund: 1,849 Issues B’mark: 1,900
Mortgage-Backed Securities Issues Fund: 420 Issues B’mark: 420
Asset-Backed Securities Issues Fund: 160 Issues B’mark: 348
CMBS Issues Fund: 316 Issues B'Mark: 1,328
Intermediate Government Issues Fund: 289 Issues B’mark: 821
Long Government Issues Fund: 74 Issues B’mark: 90
Intermediate Credit Issues Fund: 3,897 Issues B’mark: 4,045
CMBS 2% ABS
<1%
MBS 29%
Long Credit 9%
Intermediate Credit 21%
Long Govt 5%
Intermediate Govt 34%
Barclays US Aggregate Issues Fund: 7,219
Issues Benchmark: 8,958
MASTER PAGE NO. 88

41 For use with institutional and professional investors only — proprietary and confidential
US
$ Tr
illio
ns
Small Lot
Secondary
Primary Primary Issuance • BLK Global Capital Markets/Syndicate manages deal structure as well as
optimizes allocations • BLK drives many “issued to manage” deals which result in reduced fees and
increased allocations
Secondary Trading • Pricing power of US$4 trillion annual flow • Managed trade distribution and optimized execution leverages price discovery,
reduces bid/offer spread Small Lot Trading
• Dedicated unit aggregates firm-wide small lot orders • Execution benefits from round-lot price improvement 0.0
7.9
BlackRock is the Largest Counterparty to Wall Street
Size and scale are a clear competitive advantage in the Fixed Income marketplace BlackRock traded $7.9 trillion of fixed income last year
Globally coordinated trading business leveraging scale across all investment activity for strong pricing power
The uniqueness of our breadth and depth benefits our trading experience at all levels of execution
Source: BlackRock; Data as of 31 December 2013
MASTER PAGE NO. 89

42 For use with institutional and professional investors only — proprietary and confidential
BlackRock’s Index Strategies Have Delivered Superior Performance
There are four key reasons to pick BlackRock over any other index provider Low historical tracking error
An experienced, stable team
Low transaction costs from size and scale
Transparent pricing and no cross subsidization as BlackRock has no custody business
1 Source: Pension & Investments. All dollar values are in $ millions.; data as of 30 June 2013 2 Source: eVestment; data as of 31 December 2013. Past performance is no guarantee of future results. Indexes are unmanaged and one cannot invest directly in an index.
Excess returns vs. Barclays US Aggregate Index2 Global Fixed Income Index Market AUM1
574
295 302
81 42
BlackRock Vanguard State Street Northern Trust BNY/Mellon-0.20
-0.15
-0.10
-0.05
0.00
0.05
0.10
0.15
3Q13 1-Yr 2-Yr 3-Yr 4-Yr 5-Yr 7-Yr 10-Yr
BlackRock
BNY Mellon/Mellon Capital Management
NTRS
State Street Global Advisors
MASTER PAGE NO. 90

i. Portfolio Review
For use with institutional and professional investors only — proprietary and confidential MASTER PAGE NO. 91

44 For use with institutional and professional investors only — proprietary and confidential
Returns since inception for periods greater than one year are annualized Client inception 31 December 1995 Fiscal year end June 30
Returns since client inception
US Debt Index Fund Ventura County Employees’ Retirement Association
0.72
1.89
6.07 5.43 5.72
0.71
1.87
5.87 5.27
5.62
0
1
2
3
4
5
6
7
Nov-14 Fiscal year 2015 YTD 2014 1 Year Since inception*
Perc
ent
Fund Barclays US Aggregate Bond Index
Account value $139,018,222
AC
WI-E
qAR
-MV
P-12
1015
*
As of 30 November 2014
MASTER PAGE NO. 92
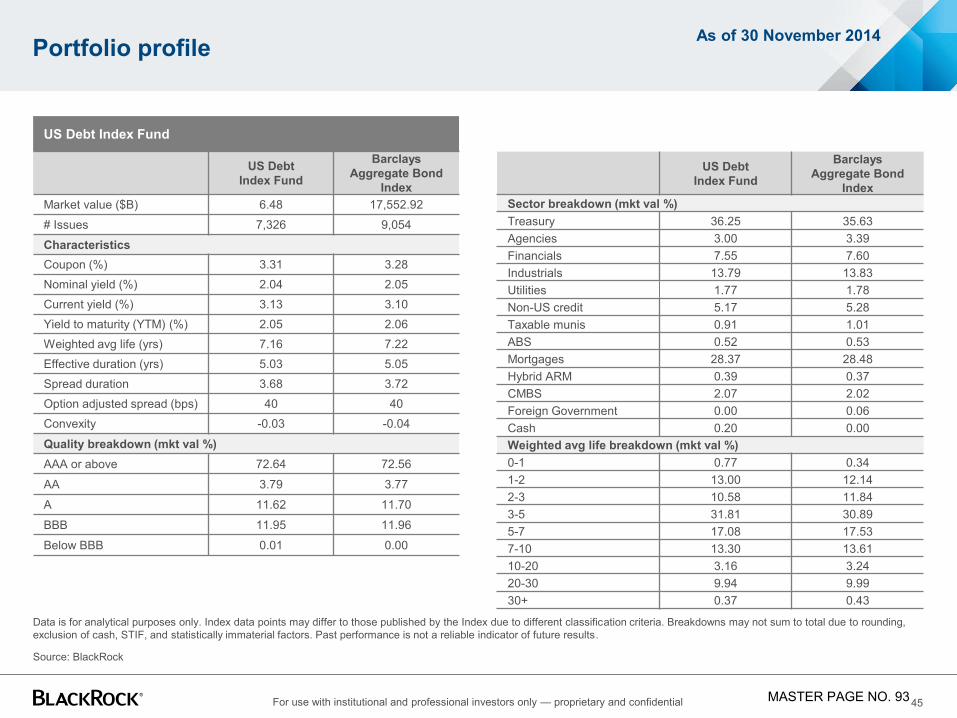
45 For use with institutional and professional investors only — proprietary and confidential
Portfolio profile
Data is for analytical purposes only. Index data points may differ to those published by the Index due to different classification criteria. Breakdowns may not sum to total due to rounding, exclusion of cash, STIF, and statistically immaterial factors. Past performance is not a reliable indicator of future results.
Source: BlackRock
US Debt Index Fund
US Debt Index Fund
Barclays Aggregate Bond
Index Market value ($B) 6.48 17,552.92
# Issues 7,326 9,054
Characteristics Coupon (%) 3.31 3.28 Nominal yield (%) 2.04 2.05 Current yield (%) 3.13 3.10 Yield to maturity (YTM) (%) 2.05 2.06 Weighted avg life (yrs) 7.16 7.22 Effective duration (yrs) 5.03 5.05 Spread duration 3.68 3.72
Option adjusted spread (bps) 40 40 Convexity -0.03 -0.04
Quality breakdown (mkt val %) AAA or above 72.64 72.56
AA 3.79 3.77
A 11.62 11.70
BBB 11.95 11.96
Below BBB 0.01 0.00
US Debt Index Fund
Barclays Aggregate Bond
Index Sector breakdown (mkt val %) Treasury 36.25 35.63 Agencies 3.00 3.39 Financials 7.55 7.60 Industrials 13.79 13.83 Utilities 1.77 1.78 Non-US credit 5.17 5.28 Taxable munis 0.91 1.01 ABS 0.52 0.53 Mortgages 28.37 28.48 Hybrid ARM 0.39 0.37 CMBS 2.07 2.02 Foreign Government 0.00 0.06 Cash 0.20 0.00 Weighted avg life breakdown (mkt val %) 0-1 0.77 0.34 1-2 13.00 12.14 2-3 10.58 11.84 3-5 31.81 30.89 5-7 17.08 17.53 7-10 13.30 13.61 10-20 3.16 3.24 20-30 9.94 9.99 30+ 0.37 0.43
As of 30 November 2014
MASTER PAGE NO. 93

Appendix
For use with institutional and professional investors only — proprietary and confidential MASTER PAGE NO. 94

i. Securities Lending Program Update
For use with institutional and professional investors only — proprietary and confidential MASTER PAGE NO. 95

48 For use with institutional and professional investors only — proprietary and confidential
-
1
2
3
4
5
6
7
Jan-
08A
pr-0
8Ju
l-08
Sep
-08
Dec
-08
Mar
-09
Jun-
09S
ep-0
9D
ec-0
9M
ar-1
0Ju
n-10
Sep
-10
Dec
-10
Mar
-11
Jun-
11S
ep-1
1D
ec-1
1M
ar-1
2Ju
n-12
Sep
-12
Dec
-12
Mar
-13
Jun-
13S
ep-1
3D
ec-1
3M
ar-1
4Ju
n-14
Lend
able
$ (T
rillio
ns)
-
2
4
6
8
10
12
Jan-
08A
pr-0
8Ju
l-08
Sep
-08
Dec
-08
Mar
-09
Jun-
09S
ep-0
9D
ec-0
9M
ar-1
0Ju
n-10
Sep
-10
Dec
-10
Mar
-11
Jun-
11S
ep-1
1D
ec-1
1M
ar-1
2Ju
n-12
Sep
-12
Dec
-12
Mar
-13
Jun-
13S
ep-1
3D
ec-1
3M
ar-1
4Ju
n-14
Lend
able
sha
res
(Tril
lions
)
Equity supply trends: Equity lenders exited the market in Q4 2008, but
lendable assets returned to pre-crisis levels a couple years later
Lendable shares continued to increase into 2014
Fixed Income supply trends:
Fixed Income lenders exited the market dramatically at the height of the credit crisis as investors removed assets from lending programs
Fixed Income lending spreads have remained relatively low and lenders have been slowly returning
Global Market Update: Trends in Equity and Fixed Income Supply
Source: Markit (formerly Data Explorers), 1 January 2008 — 22 September 2014. Global markets as defined by Markit Please refer to slide titled “Important Notes” for additional risk information
Global Fixed Income Market lendable ($)
Global Equity Market lendable (shares)
Amount on loan
Amount on loan
MASTER PAGE NO. 96

49 For use with institutional and professional investors only — proprietary and confidential
Market update: Regulatory update
Dodd Frank Act (DFA) DFA Section 165: New lending limits on a percentage of capital. Quantitative Impact Study likely to delay implementation
DFA Section 984(b): SEC Transparency Rules. Although DFA mandated that SEC issue regulations by July 2012, SEC should propose rules following the final adoption by FSB of the Shadow Banking recommendations described below.
Financial Stability Board FSB Shadow Banking report on Securities Lending was released August 29 2013. Specific recommendations include
increased transparency through reporting to regulators, disclosure to fund investors, minimum standards for cash collateral management, and enhancements to daily collateral “mark-to-market” process
FSB requested further comment on mandatory minimum haircuts on collateral. BlackRock participated with trade associations in the US and Europe to provide industry comments in November 2013. Final recommendations on minimum haircuts expected in Q4 2014
FSB recommendations do not have the force of law, but most governments are expected to take action to carry out the recommendations over the next few years
European FTT A European Financial Transaction Tax (EU FTT) is being considered that would cover Sec Lending and repo trades at up
to 10 bps per movement
BlackRock is working directly and with industry groups to oppose the FTT or at least exclude Sec Lending and repo trades, consistent with current stamp duty rules
Source: BlackRock summary as of 1 September 2014
MASTER PAGE NO. 97

50 For use with institutional and professional investors only — proprietary and confidential
Securities Lending Performance – 2014 YTD
VCERA has earned $5.53 million from lending since 2007:
2007 2008 2009 2010 2011 2012 2013 2014 YTD
VCERA Income ($) 410,414 854,331 740,459 511,100 689,242 838,020 767,154 718,028
Fund Yield (ann bps) 3.2 6.9 6.8 3.9 4.9 5.3 4.2 4.3
Source: BlackRock. 2014 YTD includes 1/1/2014 – 11/30/2014
Account Name Average Net Assets
Average Assets On-Loan
Average Percent On-
Loan
VCERA Income
Net Spread (ann bps)
Fund Yield (ann bps)
Ventura County Employees' Ret Assoc 1,808,324,424 196,561,074 10.9% 718,028 39.9 4.3
US Debt Index Fund 135,666,539 45,991,148 33.9% 73,444 17.5 5.9
Extended Equity Market Fund 45,021,961 10,073,473 22.4% 57,495 62.4 14.0
MSCI ACWI ex-US IMI Index Fund 270,254,418 13,930,963 5.2% 119,607 93.8 4.8
BLK MSCI ACWI Equity Index Fd 218,914,552 12,265,103 5.6% 56,876 50.7 2.8
U.S. Equity Market Fund 1,138,466,954 114,300,387 10.0% 410,606 39.3 3.9
MASTER PAGE NO. 98

51 For use with institutional and professional investors only — proprietary and confidential
VCERA Securities Lending Performance
VCERA Top 10 Securities Lending Assets in 2014 YTD :
Source: BlackRock. 2014 YTD includes 1/1/2014 – 11/30/2014
Asset Name Country Income to
VCERA % of VCERA
Income Spread (BPS)
3D SYSTEMS CORP US $18,123 2.53% 571
VISA INC CLASS A US $7,790 1.09% 22
VIRNETX HOLDING CORP US $7,302 1.02% 1,653
MYRIAD GENETICS INC. US $7,073 0.99% 449
SEARS HOLDINGS CORP US $6,631 0.93% 583
AT&T INC US $6,606 0.92% 22
GOPRO INC CLASS A US $6,520 0.91% 3,739
OPKO HEALTH INC. US $6,514 0.91% 525
MANNKIND CORP. US $6,507 0.91% 751
RESMED INC. US $5,986 0.84% 136 Top 10 Assets Overall $79,052 11.03% 102
MASTER PAGE NO. 99

52 For use with institutional and professional investors only — proprietary and confidential
Cash Collateral Portfolios: VCERA’s Exposure
Fund Name Cash Collateral
Reinvestment Fund B Cash Equivalent
Fund II Term Fund 11 VCERA Funds
Sub-Total
MSCI ACWI ex-US IMI Index Fund 2,021,975 11,205,243 13,227,218
BLK MSCI ACWI Equity Index Fd 984,340 9,875,392 880,026 11,739,757
Extended Equity Market Fund 10,390,608 188,636 10,579,244
U.S. Equity Market Fund 133,798,055 15,070,941 148,868,996
US Debt Index Fund 45,131,666 1,185,880 46,317,546
Cash Collateral Fund Sub-Total 3,006,314 210,400,965 17,325,482 230,732,761
11/30/2014 cash fund unaudited NAVs 1.0001 1.0002 1.0000
Source: BlackRock. Data presented as of 11/30/2014
MASTER PAGE NO. 100

53 For use with institutional and professional investors only — proprietary and confidential
Investment allocation
Moody’s credit ratings of portfolio holdings2
Cash Equivalent Fund II As of 30 November 2014
Portfolio maturity profile
Fund overview Cash Equivalent Fund II (the “Fund”) invests the cash collateral received in
connection with loans of securities from certain BlackRock collective investment funds. The objective of this fund is to seek as high a level of current income as is consistent with liquidity and stability of principal and to operate with a stable net asset value of $1.00 per unit.
1. Overnight liquidity represents the percentage of fund invested in securities and other assets that mature the following day 2. Portfolio holdings and P-1 issuers that do not have a short-term Moody’s rating are included in the “P-1” rating. Some ratings may be implied if the instrument is not explicitly rated.
BlackRock’s credit team assesses unrated instruments to determine if they are of equivalent credit quality. 3. Includes overnight liquidity 4. Weighted Average Maturity (WAM) is a portfolio’s dollar weighted average maturity or exposure to interest rate risk (similar to duration) typically measured in days. For example, in
calculating WAM, floating rate assets are measured to their next reset date and fixed rate assets are measured to their final maturity. 5. Allocations may be greater than 0% but round down to zero. All data as of 30 November 2014; Source: BlackRock
Fund size $39,114,647,515
Overnight liquidity1 15% of total assets
Securities with maturities < 2 months3 56% of total assets
Weighted Average Maturity4 37 days
0%10%20%30%40%50%60%70%
o/n 1 mo 1-6mo 6-12mo 12mo+
% o
f tot
al a
sset
s
Maturity profileAs of 11/30/2014 As of 12/31/2012 As of 12/31/2010 As of 12/31/2008
Box Spreads 2%
Certificates of Deposit 19%
Commercial Paper 9%
Medium Term Notes 11%
Repurchase Agreements 52%
Time Deposits 6%
94.4%
5.6% 0.0%
P-1
P-2
NP5
MASTER PAGE NO. 101

54 For use with institutional and professional investors only — proprietary and confidential
Investment allocation
Moody’s credit ratings of portfolio holdings2
Cash Collateral Reinvestment Fund B As of 30 November 2014
Portfolio maturity profile
Fund overview Cash Collateral Reinvestment Fund B (the “Fund”) invests the cash collateral
received in connection with loans of securities from common trust funds. The objective of this fund is to seek as high a level of current income as is consistent with liquidity and stability of principal and to operate with a stable net asset value of $1.00 per unit.
1. Overnight liquidity represents the percentage of fund invested in securities and other assets that mature the following day 2. Portfolio holdings and P-1 issuers that do not have a short-term Moody’s rating are included in the “P-1” rating. Some ratings may be implied if the instrument is not explicitly rated.
BlackRock’s credit team assesses unrated instruments to determine if they are of equivalent credit quality. 3. Includes overnight liquidity 4. Weighted Average Maturity (WAM) is a portfolio’s dollar weighted average maturity or exposure to interest rate risk (similar to duration) typically measured in days. For example, in
calculating WAM, floating rate assets are measured to their next reset date and fixed rate assets are measured to their final maturity 5. Allocations may be greater than 0% but round down to zero. All data as of 30 November 2014; Source: BlackRock
Fund size $3,226,339,185
Overnight liquidity1 20% of total assets
Securities with maturities < 2 months3 58% of total assets
Weighted Average Maturity4 38 days
0%
10%
20%
30%
40%
50%
60%
o/n 1 mo 1-6mo 6-12mo 12mo+
% o
f tot
al a
sset
s
Maturity profile
As of 11/30/2014 As of 12/31/2012 As of 12/31/2010 As of 12/31/2008
Certificates of Deposit 22%
Commercial Paper 9%
Medium Term Notes 10%
Repurchase Agreements 53%
Time Deposits 5%
93.4%
6.6% 0.0%
P-1P-2NP5
MASTER PAGE NO. 102

ii. Market Outlook
For use with institutional and professional investors only — proprietary and confidential MASTER PAGE NO. 103
56 For use with institutional and professional investors only — proprietary and confidential
Global Market Overview
MASTER PAGE NO. 104

57 For use with institutional and professional investors only — proprietary and confidential
Performance of Select Global Markets
MASTER PAGE NO. 105

58 For use with institutional and professional investors only — proprietary and confidential
U.S. Bond vs. Equity Returns
MASTER PAGE NO. 106

59 For use with institutional and professional investors only — proprietary and confidential
Valuation of Assets vs. Historic Norm
MASTER PAGE NO. 107

60 For use with institutional and professional investors only — proprietary and confidential
Real GDP Growth on Previous Year
MASTER PAGE NO. 108

61 For use with institutional and professional investors only — proprietary and confidential
U.S. 2-Year Market Overview
MASTER PAGE NO. 109

62 For use with institutional and professional investors only — proprietary and confidential
Emerging Markets FX Performance
MASTER PAGE NO. 110

63 For use with institutional and professional investors only — proprietary and confidential
Emerging Equities and the Dollar
MASTER PAGE NO. 111

iii. Supplemental Performance
For use with institutional and professional investors only — proprietary and confidential MASTER PAGE NO. 112

For u
se w
ith in
stitu
tiona
l and
pro
fess
iona
l inv
esto
rs o
nly
— p
ropr
ieta
ry a
nd c
onfid
entia
l
US Equity Market Fund Ventura County Employees’ Retirement Association
For use with institutional and professional investors only – proprietary and confidential
MASTER PAGE NO. 113

For u
se w
ith in
stitu
tiona
l and
pro
fess
iona
l inv
esto
rs o
nly
— p
ropr
ieta
ry a
nd c
onfid
entia
l
US Equity Market Fund 50
2925
For use with institutional and professional investors only – proprietary and confidential
MASTER PAGE NO. 114

For u
se w
ith in
stitu
tiona
l and
pro
fess
iona
l inv
esto
rs o
nly
— p
ropr
ieta
ry a
nd c
onfid
entia
l
Extended Equity Market Fund Ventura County Employees’ Retirement Association
5000
69-5
9244
3
For use with institutional and professional investors only – proprietary and confidential
MASTER PAGE NO. 115

For u
se w
ith in
stitu
tiona
l and
pro
fess
iona
l inv
esto
rs o
nly
— p
ropr
ieta
ry a
nd c
onfid
entia
l
Extended Equity Market Fund 50
0069
For use with institutional and professional investors only – proprietary and confidential
MASTER PAGE NO. 116

For u
se w
ith in
stitu
tiona
l and
pro
fess
iona
l inv
esto
rs o
nly
— p
ropr
ieta
ry a
nd c
onfid
entia
l
ACWI Equity Index Fund Ventura County Employees’ Retirement Association
6748
17-6
3242
6
For use with institutional and professional investors only – proprietary and confidential
MASTER PAGE NO. 117

For u
se w
ith in
stitu
tiona
l and
pro
fess
iona
l inv
esto
rs o
nly
— p
ropr
ieta
ry a
nd c
onfid
entia
l
MSCI ACWI Equity Index Fund 67
4817
For use with institutional and professional investors only – proprietary and confidential
MASTER PAGE NO. 118

For u
se w
ith in
stitu
tiona
l and
pro
fess
iona
l inv
esto
rs o
nly
— p
ropr
ieta
ry a
nd c
onfid
entia
l
ACWI ex-US IMI Index Fund Ventura County Employees’ Retirement Association
6462
97-6
3242
6
For use with institutional and professional investors only – proprietary and confidential
MASTER PAGE NO. 119

For u
se w
ith in
stitu
tiona
l and
pro
fess
iona
l inv
esto
rs o
nly
— p
ropr
ieta
ry a
nd c
onfid
entia
l
ACWI ex-US IMI Index Fund 64
6297
For use with institutional and professional investors only – proprietary and confidential
MASTER PAGE NO. 120

For u
se w
ith in
stitu
tiona
l and
pro
fess
iona
l inv
esto
rs o
nly
— p
ropr
ieta
ry a
nd c
onfid
entia
l
US Debt Index Fund Ventura County Employees’ Retirement Association
5068
64-5
3774
5
For use with institutional and professional investors only – proprietary and confidential
MASTER PAGE NO. 121

For u
se w
ith in
stitu
tiona
l and
pro
fess
iona
l inv
esto
rs o
nly
— p
ropr
ieta
ry a
nd c
onfid
entia
l
US Debt Index Fund 50
6864
For use with institutional and professional investors only – proprietary and confidential
MASTER PAGE NO. 122

iv. Presenter Biographies
For use with institutional and professional investors only — proprietary and confidential MASTER PAGE NO. 123

76 For use with institutional and professional investors only — proprietary and confidential
Presenter Biographies
Anthony R. Freitas, CFA, Managing Director, is a member of the US and Canada Institutional team within BlackRock's Institutional Client Business. He is responsible for developing and maintaining relationships with institutional investors, including public and private pension plans, foundations and endowments. Prior to joining BlackRock in 2004, Mr. Freitas was with Deutsche Asset Management, most recently as Managing Director and Regional Manager for client service. From 1993 to 2000, he was with Boston Partners Asset Management L.P. Initially a vice president responsible for West Coast client service, he became a Principal in 1995. Mr. Freitas began his career at Callan Associates in 1986 as a pension fund consultant. Mr. Freitas earned an BA degree in political science from the University of California at Berkeley in 1982 and an MBA in finance from San Francisco State University in 1985.
Laura Champion, Vice President, is a member of the US and Canada Institutional team within BlackRock's Institutional Client Business. She is responsible for developing and maintaining relationships with institutional investors, including public and private pension plans, foundations and endowments. Ms. Champion’s service with the firm dates back to 2011. Before assuming her current responsibilities, Ms. Champion previously worked as a Business Development Associate in iShares within the Private Client Group where she was responsible for developing and maintaining relationships with financial advisors across the retail business. Prior to joining BlackRock in 2011 Laura worked for Bank of America Merrill Lynch in Institutional Equity Research Sales in San Francisco where she focused on developing and maintaining relationships with institutional investors, corporate management teams and research analysts with an emphasis on regional roadshow coordination and marketing. Ms. Champion received a B.A. in International Relations and French Literature from the University of California Santa Barbara.
Cara Barr, Director, is an Index Equity Strategist within BlackRock’s Beta Strategies Group. Ms. Barr’s service at the firm started in 2012 within the Change Management team for Business Operations. Before joining BlackRock, Cara spent seven years at Royal Bank of Canada in the International Wealth Management group spanning the New York, London, Geneva and the Caribbean offices. She was a portfolio manager in Grand Cayman managing assets for RBC’s international clients, then a senior manager providing strategic solutions for the portfolio analytics and investment platform. Prior to RBC, Cara was an Research Equity analyst at Merrill Lynch. Ms. Barr earned a BA (Hons.) degree in psychology from Queen’s University and an MBA degree from the University of Toronto.
MASTER PAGE NO. 124

v. Disclosures
For use with institutional and professional investors only — proprietary and confidential MASTER PAGE NO. 125

78 For use with institutional and professional investors only — proprietary and confidential
For more information
For additional information, including portfolio holdings, please contact your client relationship officer directly or visit us online at www.blackrock.com. A general description of the investment philosophy, risk management and guidelines criteria, as well as specific investment guidelines for short-term investment funds can be found in the Short Term Investment Funds Overview and Guidelines (the “STIF Guidelines”). A copy of the STIF Guidelines, which may be updated from time to time, may be accessed via the following website link: www.blackrockdocuments.com.
Fund manager
BlackRock Institutional Trust Company, N.A. (“BTC”), a national banking association acting as a limited purpose trust company, is the fund's manager and trustee. BTC is a wholly-owned subsidiary of BlackRock, Inc. For more information about BlackRock, please go to www.blackrock.com.
Fund
The Fund is a bank collective investment fund and is maintained and managed by BTC. Collective investment funds known as “group trusts” are available only to certain qualified employee
benefit plans and governmental plans and not offered or available to the general public. Accordingly, prospectuses are not required and prices are not available in local publications. The fund is a short term investment fund (STIF) which, in accordance with regulations and the collective fund plan documents, values assets at amortized cost for unitholder transactions. To obtain estimated shadow market value information, please visit www.blackrock.com.
Disclaimers
The Fund is NOT FDIC insured, is NOT an obligation or deposit of, or guarantee by, BTC or its affiliates and involves investment risk, including possible loss of principal.
This information is being provided to you for informational purposes only and does not constitute legal, tax or accounting advice. The information contained herein is believed to be reliable but BTC does not warrant its accuracy or completeness. Information as to ratings is provided from data provided by the relevant nationally recognized statistical ratings organizations and BTC does not warrant the completeness or accuracy of such information. The statements herein are qualified by disclosure documents including without limitation the audited financial statements for the Fund, the STIF Guidelines and “Information About BlackRock Institutional Trust Company, N.A. — 16 Things You Should Know.” This publication is not intended as an
offer or solicitation for the purchase or sale of any of the financial investments referred to herein. You should not rely upon this publication in evaluating the merits of investing in the fund. No part of this publication may be reproduced in any manner without BTC’s prior consent.
Information is being furnished to you on a confidential basis as fiduciary of your system to support your internal risk management and/or compliance needs. You agree to treat as confidential such information. Subject as provided below, this information is to be used internally and strictly in connection with these activities. Without BTC’s prior written consent, the
information is not to be shared (i) internally, except with key personnel on a “need-to-know” basis in order to support your risk management or compliance activities, or (ii) externally, except to the extent external agents use such information for internal risk management and/or compliance needs or such information is required to be disclosed pursuant to applicable laws and/or regulations or pursuant to subpoena or other court order.
To extent that information is either shared internally on a “needs to know basis” or externally with external agents, then such recipients of such information will be notified by you of the confidential nature of the information, and shall be bound by the same duties and obligations with respect to the information as you are as the recipient. The aforementioned permitted use of the information clearly prohibits any use of such information for investment or trading decisions. If a request is made to make such information public under applicable laws, then you shall use reasonable efforts to give prior notice of any such request so as to permit BTC to seek to obtain a protective order prohibiting or restricting the public disclosure of such information.
© 2014 BlackRock, Inc. All Rights reserved. BLACKROCK, BLACKROCK SOLUTIONS, ALADDIN, iSHARES, LIFEPATH, SO WHAT DO I DO WITH MY MONEY, INVESTING FOR A NEW WORLD, and BUILT FOR THESE TIMES are registered and unregistered trademarks of BlackRock, Inc. or its subsidiaries in the United States and elsewhere. All other trademarks are those of their respective owners.
Cash Collateral Funds As of 30 November 2014
MASTER PAGE NO. 126

79 For use with institutional and professional investors only — proprietary and confidential
THE INFORMATION CONTAINED HEREIN MAY BE PROPRIETARY IN NATURE AND HAS BEEN PROVIDED TO YOU ON A CONFIDENTIAL BASIS, AND MAY NOT BE REPRODUCED, COPIED OR DISTRIBUTED WITHOUT THE PRIOR CONSENT OF BLACKROCK, INC. (“BLACKROCK”).
These materials are not an advertisement and are not intended for public use or dissemination. Any investments named within this material may not necessarily be held in any accounts managed by BlackRock. Reliance upon information in this material is at the sole discretion of the reader. Past performance is no guarantee of future results.
This material is for distribution only to those types of recipients as provided below and should not be relied upon by any other persons. This material is provided for informational purposes only and does not constitute a solicitation in any jurisdiction in which such solicitation is unlawful or to any person to whom it is unlawful. Moreover, it neither constitutes an offer to enter into an investment agreement with the recipient of this document nor an invitation to respond to it by making an offer to enter into an investment agreement.
Securities Lending Returns
BlackRock retains a portion of securities lending returns in exchange for managing the program. This fee reflects risk management, as well as the technology and personnel costs of maintaining the lending platform. In addition, BlackRock receives a fee for the management of cash collateral. Actual lending yields and fees for strategies represented may vary. Please note, other administrative costs, including but not limited to, accounting, custody and audit fees, may vary. Investors may receive 50% of securities lending returns and BlackRock retains 50%, except in cases where a client may negotiate a different compensation arrangement. BlackRock may negotiate different securities lending compensation arrangements with our clients depending on a variety of factors, including, but not limited to, the nature and size of the investment and the overall relationship with, and services delivered to, a particular client. Asset spread income is defined as the interest income earned in cash reinvestment funds on collateral balances less the Federal Funds Open Rate. Liability spread income is defined as the difference between the Federal Funds Open Rate and the rebate rate negotiated with the borrower.
Forward Looking Information
This material may contain “forward-looking” information that is not purely historical in nature. Such information may include, among other things, projections, forecasts, estimates of yields or returns, and proposed or expected portfolio composition. Moreover, where certain historical performance information of other investment vehicles or composite accounts managed by BlackRock, Inc. and/or its subsidiaries (together, “BlackRock”) has been included in this material and such performance information is presented by way of example only. No representation is made that the performance presented will be achieved, or that every assumption made in achieving, calculating or presenting either the forward-looking information or the historical performance information herein has been considered or stated in preparing this material. Any changes to assumptions that may have been made in preparing this material could have a material impact on the investment returns that are presented herein by way of example.
Forecast
This material is not intended to be relied upon as a forecast, research or investment advice, and is not a recommendation, offer or solicitation to buy or sell any securities or to adopt any investment strategy. The opinions expressed may change as subsequent conditions vary. The information and opinions contained in this material are derived from proprietary and nonproprietary sources deemed by BlackRock to be reliable, are not necessarily all inclusive and are not guaranteed as to accuracy. There is no guarantee that any forecasts made will come to pass.
No Recommendation
These materials are neither an offer to sell nor a solicitation of any offer to buy shares in any fund. You may not rely upon these materials in evaluating the merits of investing in any fund that employs any of the strategies referred to herein. Any reference herein to any security and/or a particular issuer shall not constitute a recommendation to buy or sell, offer to buy, offer to sell, or a solicitation of an offer to buy or sell any such securities issued by such issuer.
Money Market Fund
Although a money market fund seeks to preserve the value of one’s investment at $1.00 per share, it is possible to lose money by investing in a money market fund. Investment in a money market fund is not similar to making a bank deposit. This investment is not insured or guaranteed by the Federal Deposit Insurance Corporation or by any bank or governmental agency.
Important Notes
MASTER PAGE NO. 127

80 For use with institutional and professional investors only — proprietary and confidential
Risk
Securities lending involves exposure to certain risks, including cash collateral investment risk (i.e., risk that cash collateral investments, whether in Cash Collateral Funds or otherwise, may not achieve their investment objective, including suffering realized or unrealized loss due to investment performance), “gap” risk (i.e., risk that the return on cash collateral investments is insufficient to pay the rebate fees the Lending Fund or Lending Account has committed to pay to borrowers), liquidity risk (i.e., risk that the cash collateral is invested, directly or through the Cash Collateral Funds, in securities and other instruments that are less liquid than the Lending Fund or Lending Account, which could limit the liquidity available to the Lending Fund or Lending Account for ordinary course transactions), operational risk (i.e., risk of losses resulting from problems in the settlement and accounting process), foreign exchange risk (i.e., risk of a shortfall at default when a cash collateral investment is denominated in a currency other than the currency of the assets being loaned due to movements in foreign exchange rates), and credit, legal, counterparty and market risks. At any particular point in time, investments in the Cash Collateral Funds could comprise a material portion of a Lending Fund’s assets.
Investing involves risk, including possible loss of principal. Asset allocation and diversification strategies do not assure a profit and may not protect against loss or effects of market or other economic conditions on asset classes. Diversification among investment options and asset classes may help to reduce overall volatility.
BlackRock makes no representations or warranties as to the accuracy or completeness of the information contained herein, and further nothing contained herein shall be relied upon as a promise by, or representation by, BlackRock whether as to past or future performance results. Past performance is not indicative or predictive of future performance.
These materials are being provided for informational purposes only and are not intended to constitute tax, legal or accounting advice. You should consult your own advisers on such matters. Additional information is available on request. Information contained herein is believed to be reliable but BlackRock does not warrant its accuracy or completeness. Information contained herein represents BlackRock’s own opinions. There can be no assurance that the investment objectives of any strategy referred to herein will be achieved. An investment in any strategy referred to herein involves a high degree of risk, including the risk that the entire amount invested may be lost.
Any strategy referred to herein does not give rise to a deposit or other obligation of BlackRock, Inc. or its subsidiaries and affiliates, and is not guaranteed by BlackRock, Inc. or its subsidiaries and affiliates, and is not insured by the United States Federal Deposit Insurance Corporation or any other governmental agency, and may involve investment risks, including possible loss of principal invested.
For ease of reference, “BlackRock” may be used to refer to BlackRock, Inc. and its affiliates, including BlackRock Institutional Trust Company, N.A. BlackRock Institutional Trust Company, N.A. (“BTC”), a national banking association operating as a limited purpose trust company, manages the collective investment products and services discussed in this publication and provides fiduciary and custody services to various institutional investors. A collective investment fund is privately offered: prospectuses are not required. Strategies maintained by BTC are not insured by the Federal Deposit Insurance Corporation or any other agency of the US government, are not an obligation or deposit of, or guaranteed by, BTC or its affiliates.
Strategies include bank collective investment funds maintained and managed by BlackRock Institutional Trust Company, N.A. which are available only to certain qualified employee benefit plans and governmental plans and not offered or available to the general public. Accordingly, prospectuses are not required and prices are not available in local publications. To obtain pricing information, please contact your local service representative. Strategies maintained by BlackRock are not insured by the Federal Deposit Insurance Corporation and are not guaranteed by BlackRock or its affiliates. There are structural and regulatory differences between collective funds and mutual funds that may affect their respective fees and performance.
THIS MATERIAL IS HIGHLY CONFIDENTIAL AND IS NOT TO BE REPRODUCED OR DISTRIBUTED TO PERSONS OTHER THAN THE RECIPIENT.
BLACKROCK is a registered trademark of BlackRock, Inc. All other trademarks are the property of their respective owners.
© 2014 BlackRock, Inc. All rights reserved.
Important Notes (cont’d)
MASTER PAGE NO. 128

81 For use with institutional and professional investors only — proprietary and confidential
For recipients in the US: In the US this material is for institutional investors only.
For recipients in the EU: In the EU issued by BlackRock Investment Management (UK) Limited (authorised and regulated by the Financial Conduct Authority). Registered office: 12 Throgmorton Avenue, London, EC2N 2DL. Registered in England No. 2020394. Tel: 020 7743 3000. For your protection, telephone calls are usually recorded. BlackRock is a trading name of BlackRock Investment Management (UK) Limited.
For recipients in Korea: For distribution in Korea for Professional Investors only ("Professional Investors") as defined in the local regulation.
For recipients in Singapore: In Singapore, the information provided is issued by BlackRock (Singapore) Limited (company registration number: 200010143N) for institutional investors only. This information may not be circulated or distributed to any person in Singapore other than (i) to an institutional investor pursuant to Section 304 of the Securities and Futures Act ("SFA") or (ii) otherwise pursuant to and in accordance with the conditions of any other applicable provision of the SFA.
For recipients in Hong Kong: In Hong Kong, the information provided is issued by BlackRock Asset Management North Asia Limited and is only for distribution to "professional investors" (as defined in the Securities and Futures Ordinances (Cap. 571 of the laws of Hong Kong)) and should not be relied upon by any other persons.
For recipients in China: These materials may not be distributed to individuals resident in the PRC or entities registered in the PRC unless such parties have received all the required PRC government approvals to participate in any investment or receive any investment advisory or investment management services
For recipients in Latin America: In Latin America, for Institutional and Professional Investors only (not for public distribution). This material is solely for educational purposes and does not constitute investment advice, or an offer or a solicitation to sell or a solicitation of an offer to buy any shares of any funds (nor shall any such shares be offered or sold to any person) in any jurisdiction within Latin America in which such an offer, solicitation, purchase or sale would be unlawful under the securities laws of that jurisdiction. If any funds are mentioned or inferred to in this material, it is possible that some or all of the funds have not been registered with the securities regulator of Brazil, Chile, Colombia, Mexico, Panama, Peru, Uruguay or any other securities regulator in any Latin American country, and thus, might not be publicly offered within any such country. The securities regulators of such countries have not confirmed the accuracy of any information contained herein. No information discussed herein can be provided to the general public in Latin America.
This document contains general information only and is not intended to be relied upon as a forecast, research, investment advice, or a recommendation, offer or solicitation to buy or sell any securities or to adopt any investment strategy. The information does not take into account your financial circumstances. An assessment should be made as to whether the information is appropriate for you having regard to your objectives, financial situation and needs.
The opinions expressed are as of 11/30/2014 and may change as subsequent conditions vary. The information and opinions contained in this material are derived from proprietary and non-proprietary sources deemed by BlackRock, Inc. and/or its subsidiaries (together, “BlackRock”) to be reliable, are not necessarily all inclusive and are not guaranteed as to accuracy. There is no guarantee that any forecasts made will come to pass. Any investments named within this material may not necessarily be held in any accounts managed by BlackRock. Reliance upon information in this material is at the sole discretion of the reader. Past performance is no guarantee of future results.
BlackRock® is a registered trademark of BlackRock, Inc. All other trademarks are the property of their respective owners.
© 2014 BlackRock, Inc. All rights reserved. BLACKROCK, BLACKROCK SOLUTIONS, and iSHARES are registered trademarks of BlackRock, Inc. or its subsidiaries. All other trademarks are the property of their respective owners.
UIM-0056
Important Notes (cont’d)
MASTER PAGE NO. 129
Deutsche Asset & Wealth Management
RREEF America REIT III Review Third Quarter 2014 Ventura County Employees’ Retirement Association December 15, 2014
Confidential – Not for Public Distribution MASTER PAGE NO. 130

Deutsche Asset & Wealth Management
RREEF America REIT III Review Review Ventura County Employees’ Retirement Association – December 15, 2014
The preceding is presented for informational purposes by RREEF America L.L.C. on behalf of RREEF America REIT III, Inc. (“RREEF America REIT III”, or the “Fund”). This information may not be distributed, circulated, quoted, or otherwise disseminated without the prior consent of RREEF America L.L.C. The information should be read and reviewed in conjunction with the important disclosure information entitled “Important Information” and “Performance Notes” later in these materials. The disclosure information under “Important Information” is applicable to all performance data throughout this presentation. This presentation contains forward-looking statements which should be considered in connection with the statements contained in “Important Information”. These forward-looking statements include, but are not limited to, management’s plans, projections, objectives, expectations, and intentions, and other similar statements. These statements are based on the current beliefs or expectations of management which are inherently subject to significant uncertainties and changes in circumstances, many of which are beyond management’s control. The ability of the Fund to successfully achieve the objectives set forth in the business plans and the initiatives described herein will be dependent, in many cases, upon the availability of financing and a market for real estate assets, each of which is uncertain in the current environment. The information contained herein is for the confidential use of only those persons to whom it is transmitted by RREEF America L.L.C., or its affiliates and may not be reproduced, provided to others, or quoted, referred to or used for any purpose without the prior written permission of RREEF America L.L.C. Each recipient, as a condition to the provision of this information and by virtue of receipt thereof, agrees not to make a photocopy or other copy or to divulge the contents hereof to any other person (other than a legal, business, investment or tax advisor in connection with obtaining the advice of such person with respect to the investment). Failure to comply with the foregoing may result in irreparable damage to the lenders, shareholders and RREEF America L.L.C., among others.
Confidential – not for public distribution
2 MASTER PAGE NO. 131

Deutsche Asset & Wealth Management
RREEF America REIT III Review Review Ventura County Employees’ Retirement Association – December 15, 2014
Table of contents
Section
Appendix
01 Firm Update
02 Economic and Market Update
03 RREEF America REIT III: Fund Update and Performance Highlights
04 RREEF America REIT III: Major Asset Update
A1 Statement of Account
A2 Fund Details
A3 Biographies
A4 Summary of Strategic Plan Assumptions and GIPS Composite Reports
3 MASTER PAGE NO. 132

01 Firm Update
MASTER PAGE NO. 133

Deutsche Asset & Wealth Management
RREEF America REIT III Review Review Ventura County Employees’ Retirement Association – December 15, 2014
Alternatives investment business Part of Deutsche Bank’s Asset & Wealth Management (“Deutsche AWM”) division
— Strong, demonstrated commitment from DB Group to the alternatives investment business — Alternatives identified as a key component of growth strategy for AWM
Not all Deutsche AWM products and services are offered in all jurisdictions and availability is subject to local regulatory restrictions and requirements. As of November 2014.
Sustainable Investments
LiquidReal Assets
Real Estate Infrastructure
Deutsche Bank
Regional Management
Private & Business Clients
Corporate Banking & Securities
Asset & Wealth Management
Michele Faissola
Global Transaction Banking
Non-Core Operations
Active Passive Alternatives Deposits/Loans
Alternatives and Real AssetsPierre Cherki
Alternatives and Fund SolutionsStephane Farouze
Retirement Products
Fund Derivatives & Financing
Private Equity & Private Markets
HedgeFunds
5 MASTER PAGE NO. 134

Deutsche Asset & Wealth Management
RREEF America REIT III Review Review Ventura County Employees’ Retirement Association – December 15, 2014
Global Real Estate Business Long tenured manager of real estate assets across the private and public investment spectrum and around the globe
Global footprint and AUM (billions)
— A 40-year investment heritage
— Committed to local market expertise with approximately 450 employees in 22 cities worldwide
— A full service real estate manager with $46.8 /€37.1 billion in assets under management
— 460 institutional clients
— Investors represent more than 20 countries across the Americas, Asia Pacific and EMEA
Real estate business at a glance
Numbers may not sum due to rounding. There is no guarantee the investment objective can be achieved. Source: Deutsche Asset & Wealth Management. As of September 30, 2014.
6
Our mission is to provide real estate investment management services consistent with our clients'
objectives for diversification, preservation of capital and superior long-term risk-adjusted performance.
38%
37%
4%
20% RE Direct: Americas $17.9 bn
RE Direct: Europe $17.5 bn
RE Direct: Asia Pacific $2.0 bn
RE Securities $9.4 bn
Total: $46.8 bn
MASTER PAGE NO. 135

Deutsche Asset & Wealth Management
RREEF America REIT III Review Review Ventura County Employees’ Retirement Association – December 15, 2014
7
‒ $17.9 billion in U.S. private real estate AUM1
‒ Nearly 300 institutional clients, including public, corporate, union and foundations/endowments
‒ Long tenured senior professionals averaging 14 years with the firm and 28 years of industry experience
‒ Approximately 200 total professionals and staff in 9 offices
‒ Dedicated teams closed more than $32 billion in purchase and sales transactions since 2006
‒ Regional asset management organization with nearly 30 asset managers
— Chicago — New York — San Francisco — Atlanta — Boston
— Costa Mesa — Dallas — Washington, D.C. — Seattle
United States
Americas Office Locations
Key Distinctions
‒ Four decades of experience in U.S. markets
‒ Seasoned local teams and hands-on approach
‒ Industry thought leadership through Research & Strategy team
‒ Long-term outperformance for core real estate
Property Diversification by Sector & Region
By Property Sector By Region
Industrial 24%
Office 33%
Residential 16%
Retail 21%
Other 4%
East 33%
Midwest 7%
South 18%
West 42%
Ex-US 0%
1 Includes core, value add and opportunistic direct real estate investments in the Americas. Excludes real estate securities. Source: Deutsche Asset & Wealth Management. Diversification based on gross asset value by primary use. Numbers may not sum due to rounding As of September 30, 2014.
$17.9 billion $17.9 billion
Private Real Estate – Americas Overview
MASTER PAGE NO. 136

Private Real Estate leadership team – AmericasSenior leaders average 14 years with the firm and 28 years with the industrySenior leaders average 14 years with the firm and 28 years with the industry
Head of Real Estate, AmericasHead of Real Estate, AmericasTodd Henderson
Marc Tim Al Laura Jim Kevin Aimee
11 23
FelicianoCIO and Portfolio
Management
EllsworthTransactions
DiazAsset
Management
GaylordGlobal Client
Group
CarboneRetail
Products
HowleyRREEF America
REIT II
SamfordCOO
9 21 16 31 20 30 12 30 19 34 12 34 16 21
Investment Functions
Asset Management
CentralFunctions
Fund Finance
Global Client Group
PortfolioManagement
Research & Strategy
Transactions
61 employees 26 employees 35 employees 27 employees 42 employees 11 employees 16 employees
Years with industry #Years with firm #
Deutsche Asset& Wealth Management
RREEF America REIT III Review Review Ventura County Employees’ Retirement Association – December 15, 2014
8
As of September 30, 2014.
MASTER PAGE NO. 137

Deutsche Asset & Wealth Management
RREEF America REIT III Review Review Ventura County Employees’ Retirement Association – December 15, 2014
9
Americas Real Estate – 2014 YTD Highlights Strong results for performance, capital raising and transaction activity
Performance Results
RREEF America REIT III: 1-year net return of 26.9%; 3-year net return of 21.0%
RREEF America REIT II: Total gross and net return performance exceeds NFI-ODCE for trailing 3 and 5 years; continues to deliver top-tier income performance
U.S. Core Private Real Estate Aggregate: Outperforming NFI-ODCE on gross basis for trailing 1, 3, 5, 10, 20 and 30 years
Capital Formation
Nearly $17 billion raised (gross) across Alternatives and Real Assets year to date
Approximately $4 billion raised globally across our private real estate products
Real estate debt platform launched in Europe with two separate accounts totaling 1 billion Euros
Approximately $13 billion in gross inflows in Liquid Real Assets (real estate and infrastructure securities)
Americas direct real estate highlights:
‒ RREEF America REIT II: very strong momentum with more than $890 million raised year to date with strong regional and channel diversification, including Europe, Asia Pac and the Middle East
‒ Separate accounts: $400 million in additional allocations from six existing clients
‒ New product launches continue to be a focus, including our new U.S. energy retrofit strategy which had a first close in September
Transaction Activity
Americas Transaction Activity
Acquisitions: $2.15 billion in new acquisitions closed with more than $580 million in additional transactions currently under contract or offer pending
Dispositions: $1.46 billion in closed transactions, comprised of 32 property sales
Financings: $1.7 billion in 23 closed debt financing transactions
1
2
3
Results as of September 30, 2014. NFI-ODCE = NCREIF Fund Index Open End Diversified Core Equity. Past performance is not indicative of future results. See “Important Information” for more details. Source: Deutsche AWM.
MASTER PAGE NO. 138

Deutsche Asset & Wealth Management
RREEF America REIT III Review Review Ventura County Employees’ Retirement Association – December 15, 2014
10
RREEF America REIT III Management Team
Source: Deutsche Asset & Wealth Management. As of September 2014.
RREEF America REIT III Board of Directors Five Independent Directors
Todd Henderson
Americas Real Estate Investment Committee
Portfolio Management Team
Jay Miller Lead Portfolio Manager
and Western Region
Norton O’Meara Portfolio Manager
Midwest/Eastern Region
Mike Nigro
Head of Real Estate Value Add, Americas
Joe Cappelletti Chief Financial Officer
Portfolio Management Support 2 investment professionals
Fund Operations 3 investment professionals
Fund Finance 3 investment professionals
18 8
29 20 18 10
29 29
23 11
Megan Martin Controller
8 4
Years with firm # Years with industry #
MASTER PAGE NO. 139

02 Economic and Market Update
Certain information in this research report constitutes forward-looking statements. Due to various risks, uncertainties and assumptions made in our analysis, actual events or results or the actual performance of the markets covered by this research report may differ materially from those described. The information herein reflect our current view only, are subject to change and are not intended to be promissory or relied upon by the reader. There can be no certainty that events will turn out as we have opined herein.
MASTER PAGE NO. 140

Deutsche Asset & Wealth Management
RREEF America REIT III Review Ventura County Employees’ Retirement Association – December 15, 2014
12
U.S. Economy Key Strategic Themes
— Expect stable to above average Gross Domestic Product (“GDP”) growth driven by investment, housing and consumption
— Job growth indicators are very positive despite some excess capacity. We expect this to result in stable tenant demand.
— “Tail risks” remain in Ukraine, Middle East, Hong Kong leading to stable U.S. bond yields
— Inflation expectations remain anchored at 2% or less due in part to dollar strength
Source: Deutsche AWM ARA Research. This information is a forecast and due to a variety of uncertainties, and assumptions made in our analysis, actual events or results or the actual performance of the markets covered may differ from those presented. As of October 2014.
MASTER PAGE NO. 141

Deutsche Asset & Wealth Management
RREEF America REIT III Review Ventura County Employees’ Retirement Association – December 15, 2014
13
Real estate performance in different macro environments Returns rise with strong GDP growth, fall with rising “real” interest rates
Real estate returns and macro drivers1
(1978 to 2013)
1 Return scenarios provided by Deutsche AWM's ARA Research team based on data input sourced from NCREIF, U.S. Bureau of Economic Analysis (”BEA”) and U.S. Bureau of Labor Statistics
(“BLS”) 2 U.S. Bureau of Labor Statistics, U.S. Bureau of Economic Analysis, Federal Reserve. LTA = Long Term Average. This information is for illustrative purposes and is not representative of any individual Deutsche AWM investment or investment strategy. Assumptions made in our analysis, actual events or results may not affect the actual performance of the markets covered and may differ from those presented. As of October 2014.
GDP Growth (2.8% average)
Real Interest Rates (3.0%
Average)
Above Average GDP
Below Average GDP
Below Average
Real Rates 13.7%
(20%) 11.6%
(28%)
Above Average Real
Rates 8.0% (36%)
0.5% (16%)
-5.0%
0.0%
5.0%
10.0% Real Rates GDP Growth
Historical real rates and GDP (8 qtr MA)2
LTA 8.9%
— Real estate performs best when GDP growth is above average and inflation adjusted interest rates (“real” interest rates) are below-average
— Real estate is a weak performer when GDP is below average and real interest rates are above average
— We expect GDP in the range of 2.8% - 3.0% in 2015 with real interest rates remaining below average
— On this basis, it’s reasonable to expect real estate to produce results in line with its long term average.
MASTER PAGE NO. 142

Deutsche Asset & Wealth Management
RREEF America REIT III Review Ventura County Employees’ Retirement Association – December 15, 2014
14
Recent trends: Real estate fundamentals are strong
* 2Q14 Demand is Deutsche AWM forecast for Apartments and Retail Sources: Data provided by CBRE-EA and Deutsche AWM ARA Research. As of October 2014.
1.3%
0.8% 0.6%
0.4%
1.5%
1.8%
1.4%
0.8%
0.0%
0.5%
1.0%
1.5%
2.0%
2.5%
Apartments Industrial Office Retail
Supply % of Stock Demand % of Stock
158,000 156,655
37,448 12,954
139,562
240,462
35,815 28,137
129,880 136,846
40,231 18,286
0
50,000
100,000
150,000
200,000
250,000
300,000
Apartment (Units) Industrial (1,000's Sq.Ft.) Office (Sq.Ft.) Retail (Sq.Ft.)
3Q14* 2013 20-year annual average
(125.00)
(100.00)
(75.00)
(50.00)
(25.00)
-
25.00
Apartments Industrial Office Retail
YOY Vacancy Change as of 3Q14* (bps)
-1.0%
0.0%
1.0%
2.0%
3.0%
4.0%
5.0%
Apartments Industrial Office Retail
2014 Rent increase annualized
MASTER PAGE NO. 143

Deutsche Asset & Wealth Management
RREEF America REIT III Review Ventura County Employees’ Retirement Association – December 15, 2014
15
Property fundamentals still well below prior peaks
Source: Deutsche AWM ARA Research, data as of June 2014. This information is a forecast and due to a variety of uncertainties, and assumptions made in our analysis, actual events or results may not affect the actual performance of the markets covered may differ from those presented. As of October 2014.
80
85
90
95
100
105
110
115
120
125
130
135
140
2007
2008
2009
2010
2011
2012
2013
2014
2015
2016
2017
2018
2019
Index 2012 = 100
Apartments Industrial Office-CBD Retail
Forecast
96
97
98
99
100
101
102
103
104
105
2007
2008
2009
2010
2011
2012
2013
2014
2015
2016
2017
2018
2019
Index 2012 = 100
Apartments Industrial Office-CBD Retail
Rent Occupancy Forecast
US Rent and Occupancy Levels by Property Sector – Indexed to 2012
MASTER PAGE NO. 144

03 RREEF America REIT III: Fund Update and Performance Highlights
MASTER PAGE NO. 145

Deutsche Asset & Wealth Management
RREEF America REIT III Review Ventura County Employees’ Retirement Association – December 15, 2014
17
Fund Profile
Open-end value-added fund; inception March 2003
$657M NAV, $1.0B gross real estate market value1
$472M total debt2
47% loan to value3
Cash balance of $117M
Sector diversification5 Market diversification5
51 investments,12 metro areas
6.5 million square feet
84 percent quarter-end occupancy4
117 institutional investors
South 38%
East 35%
Midwest 2%
West 25%
1 Includes the Fund’s investments in unconsolidated joint ventures.
2 Reflects debt marked to market. Excludes debt held in unconsolidated joint ventures. 3 Loan to value is marked to market debt as a percentage of total gross real estate value. Excludes debt held in unconsolidated joint ventures. 4 Occupancy is based on leased square feet. 5 Diversification based on total gross real estate value and primary use of assets. The above charts include the Fund’s investment in unconsolidated joint ventures. As of September 30, 2014. Unaudited.
Retail Office Industrial Land/Other
Office 57%
Retail 17%
Industrial 15%
Development/ Land/Other
11%
MASTER PAGE NO. 146

Deutsche Asset & Wealth Management
RREEF America REIT III Review Ventura County Employees’ Retirement Association – December 15, 2014
18
Net of fee returns — 3Q 2014 total return of 5.3% — Trailing 12-month total return of 26.9% — 3-year total return of 21.0%
Current loan to value of 47%1
Total gross sales proceeds totaling approximately $754M, retired debt of $314M, and generated $289M in net sales proceeds to the Fund through September 30, 2014
The Fund produced approximately $30 million in realized and unrealized appreciation during the quarter, predominately due to the sale of Milpitas Business Park and unrealized appreciation at the Domain.
Eighteen properties were externally appraised during the quarter for a total gross real estate market value of $303 million, resulting in a 10.1 percent increase from their prior gross real estate market values
RREEF America REIT III Performance Highlights
1 Loan to value is debt marked-to-market as a percentage of total gross real estate value. Excludes debt held in unconsolidated joint ventures. Financial summary and performance results are preliminary and unaudited. After fee returns are net of asset management. Individual client returns may vary from the overall fund results. Past performance is not indicative of future results. No assurance can be given as to the actual results. Certain of this information is a forecast and thus subject to a number of assumptions, risks and uncertainties, many of which are beyond the control of Deutsche Asset & Wealth Management or the Fund, including, but not limited to, the acts and conduct of third parties and general economic, financial, and political events and conditions. Actual events, conditions or results may differ from those assumed or presented. See “Performance Notes" and "Important Information” for additional information. As of September 30, 2014.
The Fund ended 3Q 2014 with a share price of $40.79, or $77.41 adjusted to exclude distributions
17% increase over the $66.03 adjusted share price 12 months ago
Capital distribution of $25 million was paid pro rata to all shareholders on October 31, 2014.
The Fund exceeded its $265 million shareholder distribution projection for 2014 with $315 million delivered to shareholders in 2014.
Performance Highlights Distributions
RREEF America REIT III continues to execute its Strategic Plan generating the best risk adjusted returns possible while balancing the goal to deliver capital to Shareholders
MASTER PAGE NO. 147

Deutsche Asset & Wealth Management
RREEF America REIT III Review Ventura County Employees’ Retirement Association – December 15, 2014
19
$25M of $117M cash balance was distributed on October 31, 2014
Maintaining cash balance required to fund Strategic Plan
Fund’s overall loan to value ratio <50%
Subsequent distributions dependent on asset sales and Board of Director’s approval
Balance Sheet Snapshot
September 30, 2014
Total Real Estate Investments $1.007B
Cash 117M
Other Assets 63M
Total Assets $1.187B
Loans Payable1 ($472M)
Accrued Distribution2 (25M)
Other Liabilities (19M)
Total Liabilities ($516M)
Non-controlling Interest in Joint Venture investments ($14M)
Net Asset Value3 $657M
Net Asset Value Per Share4 $40.79
Loan-to-Value5 47%
1 Based on September 30, 2014 loan balances, reflects debt marked to market. Excludes debt held in unconsolidated joint ventures. 2 Distribution accrued as of September 30, 2014 and paid on October 31, 2014. 3 Based upon most recent appraised values adjusted for subsequent capital expenditures which may contain substantial unrealized appreciation and depreciation. See “Performance Notes” for additional information.
4 NAV divided by number of outstanding shares. The share price does not necessarily represent the price at which a share could be sold. See “Performance Notes.” 5 Loan to value is marked to market debt as a percent of total gross real estate value and excludes debt held in unconsolidated joint ventures.
MASTER PAGE NO. 148

Deutsche Asset & Wealth Management
RREEF America REIT III Review Ventura County Employees’ Retirement Association – December 15, 2014
20
2Q 2014 Projected Sale and Distribution Assumptions Based on Gross Sales Price less Debt1
Projected # Sales 26 32 12 9 Total
Projected Distributions3 $315 million $325 million $150 million $148 million $938 million
1Represents gross sales prices less debt pay off. Unconsolidated joint ventures are shown at 100% of the joint ventures’ gross real estate value less debt pay off. 2Includes actual property sales that closed through second quarter 2014. 3Represents the Fund’s share of distributions to be paid. Based upon projected sales and expenses as well as an assumption that all other items in the business plan are achieved during the period. No assurance can be given that any of the events assumed will occur, or that unanticipated events will not occur. Other assets not scheduled to be sold may be sold. Proceeds of sale will be reduced by fees and expenses which is substantial. This information is a forecast and due to a variety of uncertainties, and assumptions made in our analysis, actual events or results or the actual performance of the markets covered may differ from those presented. Disposition values are projected gross sale proceeds.
$121
$14 $10
$193
$269
$36 $73
$22 $70
$114
$89
$3
$62
$0
$100
$200
$300
$400
$500
$600
2014 2015 2016 2017
Milli
ons
Other
Residential
Retail
Office
Industrial
$539
$356
2
$46
$135
MASTER PAGE NO. 149

Deutsche Asset & Wealth Management
RREEF America REIT III Review Ventura County Employees’ Retirement Association – December 15, 2014
21
3Q 2014 Projected Sale and Distribution Assumptions Based on Gross Sales Price less Debt1
Projected # Sales 21 56 0 0 Total
Projected Distributions3 $315 million $340 million $265 million4 $16 million $936 million
1Represents gross sales prices less debt pay off. Unconsolidated joint ventures are shown at 100% of the joint ventures’ gross real estate value less debt pay off. 2Includes actual property sales that closed through third quarter 2014. 3Represents the Fund’s share of distributions to be paid. Based upon projected sales and expenses as well as an assumption that all other items in the business plan are achieved during the period. 4Projected to be distributed in first quarter 2016. No assurance can be given that any of the events assumed will occur, or that unanticipated events will not occur. Other assets not scheduled to be sold may be sold. Proceeds of sale will be reduced by fees and expenses which is substantial. This information is a forecast and due to a variety of uncertainties, and assumptions made in our analysis, actual events or results or the actual performance of the markets covered may differ from those presented. Disposition values are projected gross sale proceeds.
$95 $61
$196 $309
$22
$74
$114
$12 $92
$60
$0
$100
$200
$300
$400
$500
$600
2014 2015 2016 2017
Milli
ons
Other
Residential
Retail
Office
Industrial
$519 $516
2
MASTER PAGE NO. 150

Deutsche Asset & Wealth Management
RREEF America REIT III Review Ventura County Employees’ Retirement Association – December 15, 2014
22
2014 Dispositions
During the third quarter, the Fund sold five assets for total gross sales proceeds of $149 million and $40 million in net proceeds to the Fund. This brought total gross sales proceeds through September 2014 to $754 million and $289 million in net sales proceeds to the Fund.
Third quarter sales included four investments from the Silicon Valley Portfolio and 805 Middlesex in Billerica, MA.
Projected to sell eight assets in the fourth quarter of 2014 which are expected to generate projected total gross sales proceeds of $155 million and $45 million in net sales proceeds to the Fund. This produces a projected $909 million in total gross sales proceeds and $334 million in net sales proceeds to the Fund for calendar year 2014.
Note: Disposition activity occurred at an accelerated rate as compared to approved Strategic Plan. Realized proceeds did not dramatically exceed projected plan amounts. Certain of this information is a forecast and thus subject to a number of assumptions, risks and uncertainties, many of which are beyond the control of Deutsche Asset & Wealth Management or the Fund, including, but not limited to, the acts and conduct of third parties and general economic, financial, and political events and conditions. Actual events, conditions or results may differ from those assumed or presented. See “Important Information” for additional information.
2014 Strategic Plan
3Q 2014 YTD Executed
Projected for the remainder of
2014
Total Projected ending 2014
Number of Dispositions 22 13 8 21
Gross Sales Proceeds $532 million $754 million $155 million $909 million
Gross Debt Retirement – From Sales $263 million $314 million $76 million $390 million
RREEF America REIT III – Net Sales Proceeds $198 million $289 million $45 million $334 million
MASTER PAGE NO. 151

Deutsche Asset & Wealth Management
RREEF America REIT III Review Ventura County Employees’ Retirement Association – December 15, 2014
23
Leasing Activity
During the quarter, 18 new and renewal leases were executed within the operating portfolio totaling 231,000 square feet or approximately 4 percent of the total commercial net rentable area. The Fund ended third quarter at 84% occupancy.
During the trailing twelve months, the Fund executed 89 new and renewal leases within the operating portfolio totaling over 975,000 square feet representing approximately 15 percent of the current total commercial net rentable area.
For office and industrial expirations, a renewal rate of 60-65 percent is projected, in line with the Fund's historical performance1.
For 2014, 9 percent of the office and industrial lease expirations are in Silicon Valley where properties are seeing strong tenant demand and increasing market rents.
Future Lease Maturities2
Retail Office Industrial
4% 4%
19%
6%
0%
5%
10%
15%
20%
25%
30%
2014 2015 2016 2017
5% 9%
18%
10%
0%
5%
10%
15%
20%
25%
30%
2014 2015 2016 2017
3% 5%
29%
21%
0%
5%
10%
15%
20%
25%
30%
2014 2015 2016 2017
1Certain of this information is a forecast and thus subject to a number of assumptions, risks and uncertainties, many of which are beyond the control of Deutsche Asset & Wealth Management or the Fund, including, but not limited to, the acts and conduct of third parties and general economic, financial, and political events and conditions. Actual events, conditions or results may differ from those assumed or presented. See “Performance Notes" and "Important Information” for additional information.
2Lease rollover is a percentage of total rentable square feet. 2014 lease maturities include month-to-month roll over. As of September 30, 2014. Unaudited.
MASTER PAGE NO. 152

Deutsche Asset & Wealth Management
RREEF America REIT III Review Ventura County Employees’ Retirement Association – December 15, 2014
24
NOI and Occupancy Analysis
Trailing 12 months as of Quarter End Occupancy 1,2,3
Trailing 12-MonthSame Store NOI1,2 3Q 2013 (000’s) 3Q 2014 (000’s) % Change 3Q 2013 3Q 2014 % Variance
Industrial $9,477 $11,108 17% 83% 85% 2%
Office 44,565 42,433 -5% 82% 84% 2%
Retail 9,146 8,992 -2% 92% 89% -3%
Total Same Store Property NOI $63,188 $62,533 -1% 84% 85% 1%
Same Store NOI - Actual to Budget4,5 3Q 2014 Actual (000’s) 3Q 2014 Budget (000’s) % Change
Industrial $2,938 $2,543 16%
Office 10,569 11,032 -4%
Retail 2,365 2,125 11%
Total Same Store Property NOI $15,872 $15,700 1%
1 Excludes assets that were not held from October 1, 2012 through September 30, 2014. 2 Excludes assets that had a partial disposition anytime during the time frame of October 1, 2012 through September 30, 2014. 3 Occupancy values are NRA weighted and represent the last quarter of the trailing twelve month period. 4 Excludes assets that were not held from July 1, 2014 through September 30, 2014. 5 Excludes assets that had a partial disposition anytime during the time frame of July 1, 2014 through September 30, 2014. Note: NOI represents income from property operations reduced by expenses from property operations. Silicon Valley Portfolio is represented at 100% ownership. Please see “Performance Notes” and “Important Information” for additional information.
MASTER PAGE NO. 153

04 RREEF America REIT III: Major Asset Update
The following pages set forth certain information on assets believed to be important to Fund performance. These assets are not necessarily representative of the Fund as a whole and other assets, not illustrated above, may be important to Fund performance. Information on those assets not presented is available upon request. Certain of the information provided, including expected sales and IRRs, is based on numerous forward-looking assumptions and no assurance can be given that the events assumed will occur. The deduction of fees and expenses will reduce returns. See “Summary of Base Case Strategic Plan Cash Flow Assumptions”, “Performance Notes” and “Important Information” for further information.
MASTER PAGE NO. 154

Deutsche Asset & Wealth Management
RREEF America REIT III Review Review Ventura County Employees’ Retirement Association – December 15, 2014
Gross Market Value as of September 30, 2014. Gross market value and equity value shown at 100% except unconsolidated joint ventures which are shown at ownership percentage. Determination of those assets that will drive value is based on numerous forward-looking assumptions and no assurance can be given that the events assumed will occur. No representation is made as to the amount that will actually be received with respect to these assets or an investment in the Fund.
San Jose
Oakland
Phoenix Los Angeles
Minneapolis
Austin
Forth Worth
Portland
Circles indicate size of exposure (gross market value)
< $50M $50M – $100M
$250M – $750M
$100M – $250M
Silicon Valley Portfolio 24% Fund Equity Value
3100 Lomita 7% Fund Equity Value
The Domain 25% Fund Equity Value
Tower Place/Tower Walk 21% Fund Equity Value
Newark
Boston Hartford
Atlanta
BCIA Portfolio 7% Fund Equity Value
Geographic Concentration Five major assets comprise 84% of Fund’s current equity value and the majority of total projected value
26 MASTER PAGE NO. 155

Deutsche Asset & Wealth Management
RREEF America REIT III Review Review Ventura County Employees’ Retirement Association – December 15, 2014
Domain Update Austin, TX
Highlights:
— Closed sales in 2014 totaling $171.9 million, including the Whole Food building for $34.1 million, Domain Parkside I for $88 million, and the Mixed-Use District land for $49.8 million.
— Northwood / Endeavor is under agreement to either purchase or participate in a land contribution venture for the Domain 1 office building at $5.9 million. — Under contract to sell SRG 3.71 acres of land (P Block) for a 225 room senior living facility. The purchase price is $8,750,000. — Construction continues on Domain Parkside II, a 212 apartment unit development with 15,000 square feet of ground floor retail. The joint venture partner is responsible for
providing all additional equity and all completion and recourse obligations for the project. Construction is scheduled to be complete in October 2014. — IMT Capital is under contract to purchase Domain Parkside II for $38.5 million with $5 million of hard earnest money deposited. — Construction continues on Domain 2, an office building development with 114,535 square feet of office space on top of 25,000 square feet of retail, and Domain 7, a
221,973 square foot spec office building. For both Domain 2 & 7, The joint venture partner is responsible for providing all additional equity and all completion and recourse obligations for the project.
Domain 2 - Certificate of occupancy was obtained in September and tenant buildout work is underway. Domain 2 is 100% leased to HomeAway for 11.5 years. HomeAway’s lease commenced in September. Initial occupancy is expected to take place in October.
Domain 7 - Certificate of occupancy for Domain 7 is expected to be obtained in November. Domain 7 is 38% pre-leased and 68% committed. — Construction continues on a third participating land contribution with Columbus Realty, a 316 apartment unit development on 4.5 acres (K Block). The joint venture partner
is responsible for providing all additional equity and all completion and recourse obligations for the project. Construction is scheduled to be complete in August 2015 — HFF provided a BOV range for the existing Domain buildings and the remaining undeveloped land resulting in proceeds of between $122.77 million and $141.47 million.
Property Type: Mixed-Use
Square Footage / Units: 340,615 square feet
Acquisition Date: September 2005
Occupancy: 100%
Carry Value: $173.8 million
Since Inception Income: $32.6 million
Realized Gain: $16.5 million
Total All In Value: $222.9 million
Cost $158.7 million
Debt / Loan-to-Value: $38.5 million / 22%
Equity Value: $135.3 million
Ownership Percentage: 94.7% (59.9% for Domain Parkside II, 64.5% for Domain Parkside III and 47.4% for Domain 2 &7)
27 MASTER PAGE NO. 156

Deutsche Asset & Wealth Management
RREEF America REIT III Review Review Ventura County Employees’ Retirement Association – December 15, 2014
28
Domain Update Austin, TX
RREEF Domain, LP Current Holdings
Product Type Built / Under
Construction Land FAR Residential 528 Units 1,337 Units
Office 667,656 SF 1,399,578 SF
Retail 8,600 SF 0 SF
Site Plan as of 3Q 2014
MASTER PAGE NO. 157

Deutsche Asset & Wealth Management
RREEF America REIT III Review Review Ventura County Employees’ Retirement Association – December 15, 2014
Property Type: Office & Industrial
Square Footage: 735,638
Acquisition Date: September 2006
Occupancy: 84.7%
Carry Value: $169.1 million
Equity Value: $127.1 million
Debt / Loan-to-Value: $42.0 million / 24.9%
Ownership Percentage: 51.0%
Silicon Valley Update Silicon Valley, CA
Highlights:
Note: 100% values are represented for Silicon Valley Portfolio. As of September 30, 2014.
— The portfolio team continued to execute the Strategic Plan with the dispositions of Tasman Technology Park, several buildings within the San Jose Portfolio and a building in Sunnyvale for a total sales of $144 million.
— Dispositions executed and sales under contract will completely retire portfolio debt in 4Q 2014 (saving $2.7 million in interest expense in 2014). The portfolio loan was placed in June 2013.
— The portfolio team selected buyers for the Mountain View/Macara portfolio with closing projected prior to year end. Additionally, we plan to market Zanker Brokaw ($21 million) and Guadalupe ($24 million) for sale beginning in 4Q 2014.
— The portfolio ended third quarter 2014 at 84.7 percent occupancy, down from 89.8 percent at the end of 2Q 2014. Quarter over quarter variance is attributable to over 100K SF of planned vacancy held for sale to value-add buyers or developers.
— Executed 269,000 square feet of new and renewal leases through September 2014.
29 MASTER PAGE NO. 158

Deutsche Asset & Wealth Management
RREEF America REIT III Review Review Ventura County Employees’ Retirement Association – December 15, 2014
Guadalupe $24M (14%)
Mountain View $30M (18%)
Quantum $35M (21%)
Macara $46M (27%)
Three miscellaneous smaller assets $13M (8%) TOTAL PORTFOLIO = $169M
Silicon Valley Update Silicon Valley, CA
Zanker Brokaw $21M (12%)
30 MASTER PAGE NO. 159

Deutsche Asset & Wealth Management
RREEF America REIT III Review Review Ventura County Employees’ Retirement Association – December 15, 2014
Building Size: 608,968
Total Sales Price: $116 million
Price Per Square Foot: $190
Total Leasing: 395,000 square feet
Silicon Valley Update – Tasman Technology Park Sale Silicon Valley, CA
— 2012 Situation: 51% occupancy and $55.2 million carry value.
— 2012 Strategic Plan: 4Q 2014 close at $77.6 million sales price.
— Sale generated proceeds of $64.4 million to the venture (The Fund’s share is $32.8 million).
— Leased 395,000 square feet to stabilize property at 98 percent occupancy from a low of 33 percent in January 2009. Leasing included 364K sf to credit tenants FireEye and Micron Technology.
— Successfully marketed the Milpitas location and the property’s future direct link to the Bay Area wide mass-transit via BART to provide access to regional workforce via public transportation.
— At $116.0 million or $190 psf, the sale of Tasman Technology represents the largest transaction, by price, price per square foot and size, in the Milpitas market during 2014, and a $38.4 million improvement over 2012 projections.
$38 million Increase from 2012 Projection
31 MASTER PAGE NO. 160

Deutsche Asset & Wealth Management
RREEF America REIT III Review Review Ventura County Employees’ Retirement Association – December 15, 2014
32
Tower Place/Tower Walk Update Atlanta, GA
Highlights:
Tower Place Tower Walk
Property Type: Office Retail
Square Footage: 613,821 square feet 163,461 square feet
Acquisition Date: May 2005 May 2005
Occupancy: 92.2% 44.0%
Carry Value: $135.9 million $21.8 million
Equity Value: $96.2 million $15.1 million
Debt / Loan-to-Value: $39.7 million / 29.2% $6.7 million / 30.7%
Ownership Percentage: 98.2% 98.2%
— Signed 1 new and 5 renewal leases at Tower Place totaling 28,286 square feet including a 6 year renewal of PB Americas, an 18,554 square foot tenant expiring at year-end 2014.
— PB is 1 of 3 larger tenants with near-term lease maturities that have been targeted to renew prior to marketing Tower Place for sale. The other 2 are NextGen in 5.7% of the NRA through December 2015 and WPP in 7.5% of the NRA through September 2016. NextGen is very likely to renew . WPP has other offices in Atlanta and is considering various alternatives. including a renewal.
— At Tower Walk, we executed a letter of intent with Roam, an operator of shared office space, for a 7-year lease, which will support Buyer underwriting in 2015 by providing stable cash flow, no downtime, and maintains a redevelopment option. Roam plans to invest over $1 million in the space.
MASTER PAGE NO. 161

Deutsche Asset & Wealth Management
RREEF America REIT III Review Review Ventura County Employees’ Retirement Association – December 15, 2014
33
Tower Place/Tower Walk Update Atlanta, GA Strategic Plan
— The subdivision of Tower Walk / Tower Place is on schedule to be completed by year-end 2014. — Preliminary architectural drawings and pricing have been completed for a 327 unit, 20-story apartment
building on 2.5 acres. — 1 to 3 buyers are expected in mid-2015 when the project is anticipated to be sold based on preliminary
broker valuations.
Tower Place - $154 million Tower Walk along Piedmont - $13.8 million 2.5 acres - $8 million
MASTER PAGE NO. 162

Deutsche Asset & Wealth Management
RREEF America REIT III Review Review Ventura County Employees’ Retirement Association – December 15, 2014
34
Tower Place/Tower Walk Update Atlanta, GA
MASTER PAGE NO. 163

Looking Ahead
MASTER PAGE NO. 164

Deutsche Asset & Wealth Management
RREEF America REIT III Review Review Ventura County Employees’ Retirement Association – December 15, 2014
2014 Year to Date Progress vs. 2014 Strategic Plan Projections
2014 Year to Date Progress
2014 Strategic Plan Projections
Fund Total Return1 24.7% 7% - 11%
Number of Dispositions 13 22
Disposition gross sales proceeds $754 million $532 million
Distributions2 $315 million $265 million
Share Price Net of Distributions $40.79 $35.78
Share Price Gross of Distributions3
$77.41 $70.85
1Before fees. 2Represents the Fund’s share of distributions to be paid. Includes a $25 million distribution paid on October 31, 2014. Based upon projected sales and expenses as well as an assumption that all other items in the business plan are achieved during the period. No assurance can be given that any of the events assumed will occur, or that unanticipated events will not occur. Other assets not scheduled to be sold may be sold. Proceeds of sale will be reduced by fees and expenses, as well as debt which is substantial. This information is a forecast and due to a variety of uncertainties, and assumptions made in our analysis, actual events or results or the actual performance of the markets covered may differ from those presented. Disposition values are projected total gross sales proceeds. 3Share price reflects NAV before the capital distributions that began in 4Q12. As of September 30, 2014.
36 MASTER PAGE NO. 165

Deutsche Asset & Wealth Management
RREEF America REIT III Review Review Ventura County Employees’ Retirement Association – December 15, 2014
— RREEF America REIT III team remains focused on executing the Fund's Strategic Plan and creating value
— Quarterly Highlights
Third quarter 2014 return of 5.3% net of fees
Capital distribution of $25M paid pro rata to all investors on October 31, 2014
Through third quarter 2014, the Fund delivered a 12-month return of 26.9% net of fees and a 3-year return of 21.0% net of fees
— 2014 Strategic Plan Progress
Delivered before fees performance returns in excess of the 7.0 to 11.0 percent targets stated in the 2014 Strategic Plan
Continued to drive capital improvement and leasing programs to stabilize occupancy and maximize net operating income.
Looking Ahead
Past performance is not indicative of future results. See also “Performance Notes” and “Important Information.” As of September 30, 2014.
37 MASTER PAGE NO. 166

Statement of Account
Appendix
A1
MASTER PAGE NO. 167

Deutsche Asset & Wealth Management
RREEF America REIT III Review Review Ventura County Employees’ Retirement Association – December 15, 2014
Account summary
Inception date 10/01/2007
Total investment $25,000,000
Change in value1 (17,799,390)
Ending net asset value $7,200,610
Performance Summary
Dividend Yield Since Inception: 0.1%
Statement of Account Ventura County Employees’ Retirement Association
1 Investment income plus realized and unrealized gain, net of management fees, paid dividends, and dividends declared at, but reinvested after quarter end. Total Returns are time-weighted as of September 30, 2014. Past performance is not indicative of future results.
Distributions summary
Dividend distributions since inception:
— Income $160,764
— Capital and appreciation 6,471,696
Total distributions $6,632,460
Total reinvested 167,104
Total paid $6,465,356
Note: All future distributions will be paid on a pro rata basis to all shareholders in the Fund.
Shares outstanding summary
Beginning share balance: 175,328
Shares issued for additional contributions: 1,208
Ending share balance: 176,536
5.6%
28.5%
22.2% 21.4%
-6.2%
5.3%
26.9%
21.0% 20.0%
-7.0%
3.0%
11.4% 11.3% 11.3%
1.7%
-10%
-5%
0%
5%
10%
15%
20%
25%
30%
35%
Third Quarter 1 Year 3 Year 5 Year Since Inception
Account – (Gross) Account – (Net) NFI-ODCE – (Net)
RREEF America REIT III – As of September 30, 2014
39 MASTER PAGE NO. 168

Fund Details
Appendix
A2
MASTER PAGE NO. 169

Deutsche Asset & Wealth Management
RREEF America REIT III Review Review Ventura County Employees’ Retirement Association – December 15, 2014
Fund Structure & Governance
Private REIT vehicle
Overseen by board of directors – five independent and one Deutsche Asset & Wealth Management-related
All directors are elected annually by the Fund's shareholders
Board powers include — Approve Strategic Plan — Approve Valuations, Distributions and Redemptions — Approve Quarterly NAV — Approve Dispositions/Financings/Joint Ventures — Hire and Oversee Auditors — Hire/Fire Investment Manager
RREEF America REIT III Structure
RREEF America REIT III
Shareholders
RREEF America REIT III, Inc.
RREEF America REIT III
Board of Directors
RREEF America LLC
Investment Manager
41 MASTER PAGE NO. 170

Deutsche Asset & Wealth Management
RREEF America REIT III Review Review Ventura County Employees’ Retirement Association – December 15, 2014
List of investments Office
*100% of market value and gross sales price are represented for all joint venture. As of September 30, 2014.
Name Metro Area Acquisition Date Size
(sf/units)
Gross Real Estate Market Value
(000's) Occupancy (%) North Loop 101 - Phase II Phoenix, AZ 04/08/04 88,514 $ 12,048 95% Tower Place* Atlanta, GA 05/04/05 613,821 135,886 92% Domain Existing 2 & 5* Austin, TX 09/29/05 331,998 65,900 100% One Concord Annex Concord, CA 10/04/05 2,572 170 66% 15 Trafalgar Square Nashua, NH 11/08/05 36,706 2,000 54% 175 Paramount Raynham, MA 11/08/05 27,278 1,700 54% 321 Billerica Chelmsford, MA 11/08/05 72,050 6,400 75% 410 Amherst Nashua, NH 11/08/05 68,255 4,800 49% Farmington Office Park Farmington, CT 11/08/05 69,525 4,700 65% Federal Billerica, MA 11/08/05 217,834 19,600 72% One Portland Square Portland, ME 11/08/05 104,938 23,585 100% Southborough Park South Portland, ME 11/08/05 106,553 13,009 82% Two Portland Square Portland, ME 11/08/05 154,118 30,277 96% Two Robbins Westford, MA 11/08/05 59,814 4,600 48% Andover Tech Andover, MA 11/08/05 333,711 35,995 99% 15 Crosby Bedford, MA 11/08/05 70,712 12,500 100% Somerset Square Glastonbury, CT 11/08/05 40,759 5,700 100% 35 Parkwood Hopkinton, MA 11/08/05 159,796 5,600 0% 25 Porter Littleton, MA 11/08/05 67,167 2,830 32% Braemar Office Park Edina, MN 05/04/06 216,944 23,620 91% Northpointe Business Park* San Jose, CA 09/01/06 45,848 4,310 0% Macara* Sunnyvale, CA 09/01/06 96,066 46,200 100% Guadalupe* Santa Clara, CA 09/01/06 128,000 23,900 79% Quantum* Milpitas, CA 09/01/06 187,134 35,500 100% 3100 Lomita Torrance, CA 10/12/06 573,167 80,009 84% Office - Total 25 Assets 3,873,280 sf $ 600,839 83%
42 MASTER PAGE NO. 171

Deutsche Asset & Wealth Management
RREEF America REIT III Review Review Ventura County Employees’ Retirement Association – December 15, 2014
List of investments Industrial
*100% of market value and gross sales price are represented for all joint venture. As of September 30, 2014.
Name Metro Area Acquisition Date Size
(sf/units)
Gross Real Estate Market Value
(000's) Occupancy (%)
North Loop 101 Business Center Phoenix, AZ 04/08/04 169,497 $ 27,972 96%
BC Marlborough Marlborough, MA 11/08/05 134,404 12,119 91%
326 Ballardvalle Wilmington, MA 11/08/05 293,980 20,400 100%
12 Parkwood Hopkinton, MA 11/08/05 38,979 2,700 100%
22 Cotton Nashua, NH 11/08/05 153,697 9,500 72%
200 Bulfinch Andover, MA 11/08/05 82,541 6,119 42%
472 Amherst Nashua, NH 11/08/05 98,424 4,000 85%
Griffin Brook Methuen, MA 11/08/05 145,575 7,300 67%
375 Paramount Raynham, MA 11/08/05 49,770 7,100 100%
5 Wentworth Hudson, NH 11/08/05 139,657 6,830 100%
Andover Street Tewksbury, MA 11/08/05 33,000 1,750 0%
San Jose / Santa Clara* Santa Clara, CA 09/01/06 19,000 2,800 100%
Zanker/Brokaw* San Jose, CA 09/01/06 120,402 20,650 94%
Mountainview* Mountain View, CA 09/01/06 97,076 29,880 100%
Sunnyvale* Sunnyvale, CA 09/01/06 42,112 5,887 22%
Industrial - Total 15 Assets 1,618,114 sf $ 165,007 85%
43 MASTER PAGE NO. 172

Deutsche Asset & Wealth Management
RREEF America REIT III Review Review Ventura County Employees’ Retirement Association – December 15, 2014
List of investments Retail
*100% of market value and gross sales price are represented for all joint venture. As of September 30, 2014.
Name Metro Area Acquisition Date Size
(sf/units)
Gross Real Estate Market Value
(000's) Occupancy (%)
Collin Creek Shopping Center Plano, TX 11/17/03 481,232 $ 49,939 98%
Tower Walk* Atlanta, GA 05/04/05 163,461 21,843 44%
Essex Green West Orange, NJ 07/06/06 351,370 92,782 97%
Domain Aloft* Austin, TX 10/14/09 8,617 3,170 100%
Retail - Total 4 Assets 1,004,680 sf $ 167,734 89%
44 MASTER PAGE NO. 173

Deutsche Asset & Wealth Management
RREEF America REIT III Review Review Ventura County Employees’ Retirement Association – December 15, 2014
List of investments Development/Land/Other
*100% of market value and gross sales price are represented for all joint venture. As of September 30, 2014.
Name Metro Area Acquisition Date Size
(sf/units)
Gross Real Estate Market Value
(000's)
Three Concord Center Concord, CA 07/01/03 N/A $ 2,370
The Domain - Land* Austin, TX 09/29/05 N/A 61,764
Portland Square Parking Portland, ME 11/08/05 N/A 8,258
Domain Parkside* Austin, TX 08/26/11 N/A 118
Domain Parkside II* Austin, TX 06/21/13 N/A 38,500
Domain 2 & 7* Austin, TX 07/03/13 N/A 79,335
Domain Parkside III* Austin, TX 05/02/14 N/A 16,184
Development/Land/Other - Total 7 Assets N/A $ 206,529
45 MASTER PAGE NO. 174

Deutsche Asset & Wealth Management
RREEF America REIT III Review Review Ventura County Employees’ Retirement Association – December 15, 2014
Downtown Sunnyvale
In September 2009, Wells Fargo and Wachovia (the "Banks") foreclosed on the Downtown Sunnyvale mixed-use project (the “Property”) owned by a joint venture (the “Venture”) between the Fund and developer Peter Pau (“Pau”) and obtained a court-appointed Receiver to take control of Property operations all as part of a foreclosure settlement (the “Settlement”) between the Banks and the Venture. The Settlement requires the Fund to cooperate with the Banks from any claims by Pau. At foreclosure, the project was partially completed with construction roughly 60% complete. The Banks now own the Property pursuant to an August 2011 Trustee Sale. The Receiver was dismissed in May 2012.
In June 2011, Peter Pau, purporting to act on behalf of himself as well as the ownership joint venture, began a series of lawsuits against the Banks and the Fund, (i) to invalidate the Banks’ acquiring title through the Trustee’s Sale and (ii) unspecified damages related to the Banks’ foreclosure and the foreclosure settlement negotiated by the Banks and the Fund.
This matter remains stayed as all issues are on appeal. In May 2013, the City Attorney for the City of Sunnyvale asked for an informal update from all parties as to the status of the litigation and the potential for resolution. All parties responded with their latest arguments to the Court, with no new positions. The City has since proposed that the parties engage in settlement discussions. While all parties have agreed to cooperate, Pau has refused to make any settlement demand making settlement unlikely.
A mediation took place in September involving all the parties. The plaintiff, Pau, offered to settle in return for the defendant Banks selling the Downtown Sunnyvale Project to any of a list of buyers, or pay him $55M. The Banks offered $5M to settle right away, which Pau refused. No demand was made of the Fund. Otherwise, the litigation continues to be stayed pending adjudication of various appeals by the parties.
In 2013, plaintiff, Peter Pau's first action challenging the Trustee sale to the Banks was dismissed by the trial court, and the California Court of Appeals upheld the dismissal and the Banks were awarded their attorneys’ fees and costs. Mr. Pau's second action remains pending but inactive while Mr. Pau appeals rulings against him in that action. The appeals have been fully briefed and oral arguments on the final appeal are expected before year end.
Contingent Liabilities
As of September 30, 2014.
46 MASTER PAGE NO. 175

Biographies
Appendix
A3
MASTER PAGE NO. 176

Deutsche Asset & Wealth Management
RREEF America REIT III Review Review Ventura County Employees’ Retirement Association – December 15, 2014
Presenters
James W. Miller, Jr., Director +1 (415) 262-7730, [email protected] — Lead Portfolio Manager, RREEF America REIT III: San Francisco
— Joined the Company in 2006 with 10 years of industry experience. Prior to joining, James served as an Executive Vice President in the Corporate Solutions Group at Jones Lang LaSalle. Previously, he worked as an Attorney at Orrick, Herrington & Sutcliffe LLP
— BA in English from University of Virginia; JD from Washington & Lee University
Nolan Olsen, CAIA, Director +1 (415) 262-2055, [email protected] — Institutional Investment Specialist, Global Client Group: San Francisco
— Joined the Company in 2013 with 16 years of industry experience. Prior to joining, Nolan served as Director of Marketing at Van Eck Global. Previously, he
held senior roles in Marketing at Morgan Stanley Investment Management and was the Founder and Managing Partner at Langschiff Partners, LLC. Earlier, he worked in Institutional Equity Sales at CIBC World Markets, in US Equities at Schonfeld Securities, LLC, and was an Account Executive at NewsEdge Corporation. Nolan began his career as a Sales Trader for FX Spot and Options Markets at American Express Bank
— BA in Economics and Government from St. Lawrence University; Chartered Alternative Investment Analyst; Series 3, 7, 24, 55 and 63 Licenses
48 MASTER PAGE NO. 177

Deutsche Asset & Wealth Management
RREEF America REIT III Review Review Ventura County Employees’ Retirement Association – December 15, 2014
RREEF America REIT III Management team
James W. Miller, Jr., Director
— Lead Portfolio Manager, RREEF America REIT III: San Francisco
— Joined the Company in 2006 with 10 years of industry experience. Prior to joining, James served as an Executive Vice President in the Corporate Solutions Group at Jones Lang LaSalle. Previously, he worked as an Attorney at Orrick, Herrington & Sutcliffe LLP
— BA in English from University of Virginia; JD from Washington & Lee University
Norton F. O'Meara, Director
— Portfolio Manager, RREEF America REIT III: Chicago
— Joined the Company in 1994 with 9 years of industry experience. Prior to joining, Norton served as a Portfolio Manager at VMS Realty. Previously, he was a Development Manager at Fordham Company
— BS in Marketing from Boston College; MBA from Loyola University Chicago
Joseph Cappelletti, CPA, Director
— Chief Financial Officer of RREEF America REIT II & III: Chicago
— Joined the Company in 1985. Prior to his current role, Joseph served as Director of Client Reporting and as Treasurer and Controller of Cabot Industrial Trust (an industrial REIT acquired by Deutsche Bank). Previously, he worked as Asset Management Controller and as a Portfolio Accountant
— BS in Accounting and MBA in Finance from DePaul University; Certified Public Accountant
Michael J. Nigro, PE, Managing Director
— Head of Real Estate Value Add and Development for the Americas: Chicago
— Joined the Company in 2004 with 8 years of industry experience. Prior to joining, Michael served as a Senior Manager at Mesirow Financial Real Estate, where he was responsible for large public-private partnership projects. He began his career as a Project Manager
— BS in Civil Engineering from University of Illinois at Urbana-Champaign; MBA in Finance (with Distinction) from DePaul University; Professional Engineer License
Megan Martin, CPA, Vice President
— Portfolio Accounting Controller, RREEF America REIT III: Chicago
— Joined the Company in 2010 with 4 years of industry experience. Prior to her current role, Megan served as an Assistant Controller. Before joining, she was a Finance Controller at Vestian Group, Inc and a Senior Associate at KPMG, LLP
— BA and MA in Accounting from University of Illinois at Urbana-Champaign; Certified Public Accountant; Real Estate Salesperson License; Women on Wall Street, Deutsche Bank Chapter, Steering Committee Member (2011-2013)
Jas Hodzic, Assistant Vice President
— Portfolio Analyst, RREEF America REIT III and RREEF Property Trust: San Francisco
— Joined the Company in 2008 with 3 years of industry experience. Prior to joining, Jas served as a Real Estate Underwriter at HSBC
— BA in Entrepreneurial Studies and MBA in Finance from The University of New Mexico
49 MASTER PAGE NO. 178

Deutsche Asset & Wealth Management
RREEF America REIT III Review Review Ventura County Employees’ Retirement Association – December 15, 2014
RREEF America REIT III Management team (continued)
Tim Leske, Assistant Vice President
— Portfolio Analyst, RREEF America REIT II & III: Chicago
— Joined the Company in 2006. Prior to his current role, Tim served in Residential Accounting
— BS in Accounting from Aurora University; MBA from Northern Illinois University
Maria Trinh, Assistant Vice President — Portfolio Analyst, RREEF America REIT III: San Francisco
— Joined the Company in 2004 with 2 years of industry experience. Prior to joining, Maria served as a Research Intern and Portfolio Analyst at AMB Property Corporation
— BA in Urban and Regional Economics from the University of California, Los Angeles; Graduate level coursework in Economic Development and Real Estate at Cornell University; Chinese Language and Culture Program at Nanjing Normal University in China
Michelle Frank, Associate
— Portfolio Analyst, RREEF America REIT II & III: Chicago
— Joined the Company in 1999. Prior to her current role, Michelle served as a Senior Fund Accountant for RREEF Global Fund Finance and as a Senior Analyst for RREEF Client Reporting. Previously, Michelle was a Senior Accountant for RREEF Property Management
— BBA in Finance and MS in Accountancy from Loyola University Chicago
Jordan Grebow, Analyst
— Portfolio Analyst, RREEF America REIT II & III: Chicago
— Joined the Company in 2014. Prior to his current role, Jordan served as an Associate at Newmark Grubb Knight Frank
— BA in Economics from Indiana University
50 MASTER PAGE NO. 179

Deutsche Asset & Wealth Management
RREEF America REIT III Review Review Ventura County Employees’ Retirement Association – December 15, 2014
RREEF America REIT III Board of Directors Daryl J. Carter – Mr. Carter is the Founder, Chairman and CEO of Avanath Capital Management, LLC, a Southern California based investment firm focused on conventional and affordable multifamily investments. Mr. Carter directs the strategy, investments, and overall operations of the firm. Over the past two years, Avanath has acquired in excess of $300 million in affordable apartment communities nationwide. Mr. Carter is also a Managing Partner of McKinley-Avanath, a property management company focused on the affordable apartment sector, an entity owned jointly by Avanath and McKinley, Inc. Mr. Carter has 32 years of experience in the commercial real estate industry. Previously, he was an Executive Managing Director of Centerline Capital Group (“Centerline”) and head of the Commercial Real Estate Group. Mr. Carter became part of the Centerline team when his company, Capri Capi-tal Finance (“CCF”), was acquired by Centerline in 2005. Mr. Carter co-founded and served as Co-Chairman of both CCF and Capri Capital Advisors (“CCA”). He was instrumental in building Capri to a diversified real estate investment firm with $8 billion in real estate equity and debt investments under management. Prior to Capri, Mr. Carter was Regional Vice President at Westinghouse Credit Corporation in Irvine and a Second Vice President at Continental Bank in Chicago. Mr. Carter holds dual Masters Degrees in Archi-tecture and Management, both received from the Massachusetts Institute of Technology. He received a Bachelor of Science degree in Architecture from the University of Michigan. Mr. Carter is a Trustee of the Urban Land Institute, Executive Committee Member and Vice Chairman of the National Multi Housing Council and a Past Chairman of the Commercial Board of Governors of the Mortgage Bankers Association. Mr. Carter serves on the Visiting Committee of the M.I.T. Sloan School of Management. Mr. Carter also serves as an independent director of three companies, Whitestone REIT (AMEX:WSR), a retail/office REIT, The Olson Company, a Southern California homebuilding company, and RREEF America III, a private REIT.
Alice M. Connell – Ms. Connell is the Co-Founder and Managing Principal of Bay Hollow Associates, LLC, a commercial real estate advisory firm that provides strategic advice with respect to a range of commercial real estate issues: portfolio analysis, asset repositioning, strategic alternatives, debt restructuring, risk mitigation, value retention/recovery, recapitalization and strategic partnering. These services are built upon Ms. Connell's extensive experience as an Institutional Investor in both the private debt capital market as well as in the real estate equity capital markets, and commercial property markets both domestic and international. Over the course of a 30+ year career at TIAA-CREF ("T-C"), Ms. Connell held a series of senior positions in both the commercial mortgage lending and real estate equity investing areas. She is most experienced in both the acquisition as well as in the portfolio strategy and management sides of an Institutional Investor Real Estate Portfolio. She has served as a Trustee of the Urban Land Institute and is a current member of its Audit Committee as well as an Executive Committee member of its Women's Leadership Initiative, a Member of the Real Estate Advisory Committee of the New York State Common Retirement Fund, a member of the Investment Committee of Quilvest REP, and a Member of the Advisory Boards of both Parmenter Realty Partners and
Park Madison Partners. In addition, Ms. Connell joined the Board of Apollo Commercial Real Estate Finance ("ARI") in September 2009 and, since November of 2009, has been a director of RREEF America REIT III. In 2013, Ms. Connell joined the Board of the Empire State Realty Trust ("ESRT") as well as joining CBRE Global Investors' Americas Investment Committee where she serves as an Independent Member. She was the Founder and Chair of ULI New York's District Council, a Director of both the Pension Real Estate Association ("PREA") and WX (Women Executives in Real Estate). She was also a Member of the Executive Committee of the Zell-Lurie Real Estate Center of the Wharton School at the University of Pennsylvania. Ms. Connell holds a M.A. degree from New York University and a B.A. degree, magna cum laude, from St. Bonaventure University. Patricia R. Healy (“Trish”) – Ms. Healy is a co-founder of Hyde Street Holdings, LLC. (“HSH”), a boutique investment firm founded in 1996. As both institutional asset advisor and principal, HSH specializes in the acquisition of opportunistic real estate and/or real estate debt; entities/products and the provision of strategic, operational and financial services in under-optimized companies/situations. Prior to HSH, Ms. Healy was Co-Founder of the Hanford/Healy Companies (1988). Through its five national offices HH provided real estate investment and advisory services, asset management and acted as a principal in the acquisition of loan portfolios and below investment grade portions of securities. It was a rated special servicer. General Motor’s subsidiary, GMAC Commercial Mortgage purchased the Hanford/Healy Companies in September of 1996. Prior to HH Ms. Healy held various senior management positions with real estate and financial firms. She has served on various profit and non-profit boards (including service as the audit chair for the North Carolina Symphony). Currently she serves as Chair of the Green Chair Project. Membership in professional associations include: Lambda Alpha; the American Society of Real Estate Councilors (CRE) and the Urban Land Institute (ULI), in which she has served as a Trustee and Council Chair and is a Governor. For Fiscal Years 2009-2011, Ms. Healy served on ULI’s (World Wide) Executive Committee and is now serving on ULI’s Nominating and Governance Committee. Ms. Healy has an undergraduate (BA) from Tulane University and graduate degrees from Southern Methodist University (MBA) and The American Graduate School of International Management (MIM). W. Todd Henderson – Todd Henderson is a Managing Director and Head of Real Estate, Americas for Deutsche Asset & Wealth Management’s Alternatives and Real Assets platform, based in New York. Todd joined the Company in 2003 with 12 years of experience in the real estate industry. In his current role, he is responsible for all facets of the direct real estate investment management business in the Americas and also serves on the Alternatives and Real Assets Executive Committee. Currently, he serves as a member of the Board of Directors for RREEF America REIT II, RREEF America REIT III and RREEF Property Trust. Prior to his current role, Todd was the Chief Investment Officer for the Americas real estate investment business and, in this role, was responsible for directing the investment strategy in the Americas.
51 MASTER PAGE NO. 180

Deutsche Asset & Wealth Management
RREEF America REIT III Review Review Ventura County Employees’ Retirement Association – December 15, 2014
RREEF America REIT III Board of Directors (continued) In his capacity as CIO, he served as Chairman of the Americas Real Estate Investment Committee, and served on the Americas Real Estate Management Committee. From June 2007-March 2009, Todd was responsible for the Company’s Value-Added and Development group where he directed a 16-person team managing a $4.5 billion portfolio for multiple clients. While in this role, he formulated the strategy for restructuring the portfolio and the group in response to the global financial crisis. In particular, he led the RREEF America REIT III team in the restructuring of the fund. Prior to joining, Todd was a Director of Acquisitions for The J.E. Robert Company in Washington, D.C., where he was involved in the sourcing, executing and financing of over $6 billion of real estate transactions. Previously, he worked on restructuring and disposing of nonperforming real estate loans at First Gibraltar Bank on behalf of the bank and the Resolution Trust Company (RTC). He holds a BA from the University of North Texas and an MBA from The Wharton School, University of Pennsylvania. Steven R. LeBlanc – Mr. LeBlanc is the Founding Partner of CapRidge Partners, a fully integrated office investment and ownership company in Austin, Texas. Mr. LeBlanc was with the Teacher Retirement System of Texas from 1998 to 2012 where he oversaw the plan’s real assets, private equity and principle investments. His scope of responsibility covered 27% of the entire portfolio with a team of 23 and over $40 billion investment exposure under his management. He also served on the Investment Committee for the $120 billion fund. In the time that Mr. LeBlanc had been with Texas Teachers, he has deployed nearly $30 billion of assets. In 2011, Mr. LeBlanc was invited to testify in front of the Congressional Subcommittee on Capital Markets and Government Sponsored Enterprises on the “Reopening American Capital Markets to Emerging Growth Companies Act of 2011”. He has been on Bloomberg Television’s Street Smarts and Money Moves as well as a guest host on CNBC’s Squawk Box. From 2005 to 2008, he served as Professor - Real Estate at the University of Texas McCombs School of Business in Austin. Mr. LeBlanc led the creation of the $ 6 Billion Private Markets’ Strategic Partnership Network. He established the Real Estate Certificate Program for Undergraduate Students at The University of Texas at Austin. Prior to that Mr. LeBlanc was the CEO, President and Board Member of Summit Properties Inc., a $2 Billion real estate investment trust (REIT), which engages in the development, construction, acquisition, and operation of luxury apartment communities in the southeast and mid-Atlantic United States. Prior to joining Summit Properties Inc., Mr. LeBlanc served as President and CEO of Urban Growth Property Trust from 1997 to 1998, where he developed the start up strategic business plan, orchestrated the transition to REIT status and initiated over $300 million in acquisitions and developments focused on owning and developing income-producing land in major urban markets. Mr. LeBlanc also had senior real estate roles at Archstone Communities Trust and was a Senior Partner at Lincoln Property Company. He formerly served as Chairman of the Urban Land Institute District Council in Austin, and on the Board of Trustees of the Real Estate Roundtable, the Investment Advisory Board of the Employee Retirement System of Texas and the Penland School of Crafts and Charlotte Latin School. Mr. LeBlanc received a Bachelor of Business Administration, Real Estate and Finance from the University of Texas at Austin. He also attended the University of Bridgeport School of Law.
Steven G. Rogers – Mr. Rogers is the Founding and Managing Member of Rogers and Associates, LLC (“RA”). Formed in 2011, the firm focuses on providing specialized solutions for principals and institutional owners in the real estate industry and board level advisory work. Prior to RA, Mr. Rogers led Parkway Properties as President and Chief Executive Officer from its early development through its move to the New York Stock Exchange (“NYSE”) to where it is today as a member of the S&P 600 Small Cap Index. Mr. Rogers joined Parkway as an Asset Manager in 1983. He was promoted to Vice President in 1988; Senior Vice President in 1991; President in 1993 and CEO in 1997. Additionally, Mr. Rogers was a member of Parkway’s Board of Directors from 1996 to 2011. In 1976 Mr. Rogers graduated magna cum laude from the University of Mississippi and went on to complete five years in the U.S. Army. Upon completing his military service, Mr. Rogers attended Harvard Graduate School of Business Administration earning his MBA with first year honors in 1983. His numerous community, political, and business activities include serving as a Director of First Commercial Bank, a de novo bank he helped found in 2000, an Independent Director of Net Lease Alliance, a real estate development services firm in Nashville, TN., and a Trustee for the Walker Family Trust, a private land and investment company. He currently serves as a member of the Urban Land Institute and on the Board of the Boy Scouts of America, Andrew Jackson Council. Mr. Rogers past positions include President for the AJC of Boy Scouts of America, State Chairman for Young Presidents Organization (YPO), Vice Chairman and Trustee for the MS Museum of Art, State Chairman of the National Endowment for the Arts Fund Raiser, two terms on the Board of Trustees of NAREIT including Chairman of the Audit Committee, and the National Advisory Board for the B.B. King Museum.
52 MASTER PAGE NO. 181

Deutsche Asset & Wealth Management
RREEF America REIT III Review Review Ventura County Employees’ Retirement Association – December 15, 2014
Americas Real Estate Investment Committee
Marc Feliciano, Managing Director
— Chief Investment Officer of Real Estate, Americas, Head of Portfolio Management, Americas and Member of the Americas Real Estate Management and Investment Committees: Chicago
— Joined the Company in 2005 with 12 years of industry experience. Prior to his current role, Marc served as the Global Head of Risk and Performance Analysis. Before joining, he was a Portfolio Manager at Renascent Capital Management LLC and Co-founder of the Real Estate Derivatives Group at Prebon Yamane Inc. Previously, Marc served as a Senior Analyst and Portfolio Manager at R.D. Capital, LLC and in private and public real estate at Morgan Stanley, Heitman/PRA Securities Advisors and at INVESCO Realty Advisors
— BBA in Accounting and MPA in Taxation from The University of Texas at Austin
James N. Carbone, Managing Director
— Head of Real Estate Retail Products for the Americas, Chief Executive Officer for RREEF Property Trust and Member of the Americas Real Estate Management and Investment Committees: San Francisco
— Joined the Company in 1995 with 15 years of industry experience. Prior to his current role, James served as the Head of Global Business Development for RREEF Alternative Investments. Prior to joining, James began his career in the management, brokerage, development, and disposition/acquisition of commercial real estate
— BA in Economics from University of California, Davis
Pierre Cherki, Managing Director
— Head of Alternatives and Real Assets, Member of the Deutsche Asset & Wealth Management ("Deutsche AWM") Executive Committee, Deutsche AWM Alternatives and Real Assets Executive Committee, and Americas Real Estate Investment Committee: New York
— Joined the Company in 1997. Prior to his current role, Pierre served as the Global Head of the real estate investment business (formerly RREEF Real Estate). Previously, he was responsible for the development of the real estate investment business in Central and Eastern Europe
— BA in Management and Economics from Tel Aviv University; MBA from Kellogg School of Management, Northwestern University
Al Diaz, Managing Director
— Head of Real Estate Asset Management for the Americas and Member of the Americas Real Estate Management and Investment Committees: Chicago
— Joined the Company in 1994 with 10 years of industry experience. Prior to joining, Al held various roles at The Balcor Company including Head of Retail Property Management. Previously, he worked as a Real Estate Broker in Florida
— BA in International Relations from Indiana University; Florida Real Estate Broker License
53 MASTER PAGE NO. 182

Deutsche Asset & Wealth Management
RREEF America REIT III Review Review Ventura County Employees’ Retirement Association – December 15, 2014
Americas Real Estate Investment Committee (continued)
Timothy Ellsworth, Managing Director
— Head of Real Estate Transactions for the Americas and Member of the Americas Real Estate Management and Investment Committees: Chicago
— Joined the Company in 1998 with 15 years of industry experience. Prior to his current role, Timothy served as the Head of Real Estate Portfolio Management in the Americas. Before joining, he was Regional Vice President of Acquisitions at Cornerstone Real Estate Advisors. Previously, he worked in Debt and Equity Finance, Asset Management and Investment Sales at General Electric Capital
— BS in Finance from Indiana University
W. Todd Henderson, Managing Director
— Head of Real Estate for the Americas and Member of the Deutsche Asset & Wealth Management Alternatives and Real Assets Executive Committee and Americas Real Estate Management and Investment Committees: New York
— Joined the Company in 2003 with 12 years of industry experience. Prior to his current role, Todd served as the Chief Investment Officer of RREEF Real Estate in the Americas. Before joining, he was Director of Acquisitions for The J.E. Robert Company. Previously, he worked in restructuring and disposing of nonperforming real estate loans at First Gibraltar Bank
— BA from the University of North Texas; MBA from The Wharton School, University of Pennsylvania. Currently serves as a member of the Board of Directors for RREEF America REIT II, RREEF America REIT III, and RREEF Property Trust.
Michael J. Nigro, PE, Managing Director — Head of Real Estate Value Add and Development for the Americas: Chicago
— Joined the Company in 2004 with 8 years of industry experience. Prior to joining, Michael served as a Senior Manager at Mesirow Financial Real Estate, where he was responsible for large public-private partnership projects. He began his career as a Project Manager
— BS in Civil Engineering from University of Illinois at Urbana-Champaign; MBA in Finance (with Distinction) from DePaul University; Professional Engineer License
Mark G. Roberts, CFA, Managing Director
— Head of Research and Strategy and Member of the Deutsche Asset & Wealth Management Alternatives and Real Assets Executive Committee and Americas Real Estate Investment Committee: New York
— Joined the Company in 2011 with 26 years of industry experience. Prior to joining, Mark served as Global Director of Research at Invesco Real Estate and Director of Construction and Development at Club Corp International
— BA in Architecture from the University of Illinois, Urbana; MS in Real Estate from MIT; CFA Charterholder; Current Past-Chairman of the NCREIF Board; Wrote chapter in Handbook of Alternative Investments; Articles for PREA Quarterly, NCREIF Quarterly, Institute of Fiduciary Education
54 MASTER PAGE NO. 183

Deutsche Asset & Wealth Management
RREEF America REIT III Review Review Ventura County Employees’ Retirement Association – December 15, 2014
Americas Real Estate Investment Committee (continued)
James W. Miller, Jr., Director
— Lead Portfolio Manager, RREEF America REIT III: San Francisco
— Joined the Company in 2006 with 10 years of industry experience. Prior to joining, James served as an Executive Vice President in the Corporate Solutions Group at Jones Lang LaSalle. Previously, he worked as an Attorney at Orrick, Herrington & Sutcliffe LLP
— BA in English from University of Virginia; JD from Washington & Lee University
55 MASTER PAGE NO. 184

A4 Summary of Strategic Plan Assumptions and GIPS Composite Reports
Appendix
MASTER PAGE NO. 185

Deutsche Asset & Wealth Management
RREEF America REIT III Review Review Ventura County Employees’ Retirement Association – December 15, 2014
The inputs to the Strategic Plan are based upon a number of factors, including the terms of debt financing, leases in place, property budgets and other property specific matters, as well as assumptions as to macro and micro economic activity. This information is included in detailed sell analyses with respect to each asset. These analyses, which are periodically updated, have been developed by Deutsche Asset & Wealth Management (with input from joint venture partners where applicable), and represent Deutsche Asset & Wealth Management’s estimate of the sources and uses of cash with respect to a particular asset, based upon, among other things, assumptions as to developmental and operational costs, the terms and availability of financing, and the anticipated timing and manner of realization upon such asset. These analyses are subject to a review process, which results in the revision of anticipated cash flows or the strategy for an asset, based upon actual or anticipated changes in market conditions, the condition and market for the asset, debt maturities and similar matters
The cash flows model used to generate certain of the information presented herein, particularly future asset sales, debt financing, and other Fund capital activity. This information constitutes projections, which may or may not be realized. Actual results may differ, perhaps materially, from the information contained herein. See “Performance Notes” for additional information. The Fund model is the result of a detailed "bottom-up" analysis constructed as follows: — The projected cash flows start from the beginning of period cash position of the Fund — Following that the projected cash flows with respect to each investment set forth in the business plans are input into the model, which aggregates the
data for each period indicated — The projected timing of dispositions are specific to each asset, with the overall goal of maximizing risk adjusted returns. Proceeds ultimately realized are
based upon the capitalization of projected asset income at the time of sale — Where applicable, general property level loan refinancing assumptions are utilized based upon loan to value thresholds or projected in-place income — The model then calculates the projected total potential distributable cash based upon the terms of Fund level financing, as well as Fund level income and
expenses. In more detail: o Fund management fees are accounted for and are assumed to be payed on a monthly basis per terms of the board approved management
agreement amendment o Fund overhead assumptions (audit, tax, insurance, etc.) are consistent with historical expenses
The sum of all the above items results in RREEF America REIT III‘s net (distributable) cash position at the end of each given period Value per share is calculated based on projected total capital distributions divided by the total outstanding shares of 16,109,897 Please see the following page for a list of key cash flow model assumptions
Summary of Strategic Plan Assumptions
This information is a forecast and due to a variety of uncertainties, and assumptions made in our analysis, actual events or results or the actual performance of the markets covered may differ from those presented.
57 MASTER PAGE NO. 186

Deutsche Asset & Wealth Management
RREEF America REIT III Review Review Ventura County Employees’ Retirement Association – December 15, 2014
Summary of Strategic Plan Assumptions (continued)
Based on 2014 Deutsche Asset & Wealth Management Management’s internal development budgets (by asset) Prepared by development manager for each asset Includes recently approved Domain development and operating plan
Development property cash flows
Based on 2014 Deutsche Asset & Wealth Management Management’s internal budgets (by property) Prepared by individual portfolio manager for each property
Operating property cash flows
Sale recommendations based upon economic, property level, and capital market analysis (includes input from Deutsche Asset & Wealth Management’s Research/CIO Group and Investment Committee)
Asset sale assumptions
Exit Cap rate applied to 12-month forward NOI and based on Deutsche Asset & Wealth Management’s management assumptions:
— Industrial: 7.00% - 10.00% — Office: 6.50% - 10.50% — Retail: 7.00% - 9.00%
Closing costs range between 1.50% - 3.00% of gross residual proceeds before debt paydown
Residual sale proceeds
Loans projected to mature before the collateralized asset is sold are projected to be refinanced at market rates
Loan refinancing assumptions
125 basis point asset management fee (annual) based upon Fund net asset value with 10 basis points deferred and 10 basis points subject to 9% internal rate of return
Fund overhead consistent with historical expenses Fund level expenses
Ending cash balance of $117 million as of September 30, 2014 Distributions commenced in January 2013 and are driven by existing cash and potential dispositions Share price and IRR estimates calculated from projected quarterly cash available for distribution and total outstanding shares
Cash available for distribution
This information is a forecast and due to a variety of uncertainties, and assumptions made in our analysis, actual events or results or the actual performance of the markets covered may differ from those presented.
58 MASTER PAGE NO. 187

GIPS® Composite Report Americas Real Estate – RREEF America REIT III Composite
First Quarter 2014
MASTER PAGE NO. 188

Deutsche Asset & Wealth Management
Year end
Income Return Gross
of Fees Capital Return
Total Return Gross
of Fees
Income Return
Net of Fees1
Total Return
Net of Fees1
Total Return
NFI-ODCE Gross
of Fees2
Total Return
NFI-ODCE Net of Fees2
Total Composite Net Assets
End of Period
(USD million)
Percent Leveraged
End of Period
(as a % of composite
assets)
Percent of External
Valuations End of Period
(as a % of composite
assets)
Number of Portfolios
End of Period
Total Firm
Assets End
of Period (USD
billion)
Total Firm
Net Assets End
of Period (USD billion)
20033 1.22 7.16 8.43 0.50 7.67 7.30 6.56 $152.8 53.4 0.0 1 $15.1 $10.4
2004 3.94 13.57 17.87 2.07 15.85 13.06 12.01 $366.8 39.2 22.0 1 $17.7 $11.9
2005 3.47 18.33 22.27 0.57 18.98 21.40 20.16 $1,009.4 47.9 12.0 1 $25.1 $16.9
2006 3.30 13.31 16.93 1.14 14.60 16.32 15.27 $1,514.1 49.9 27.1 1 $30.6 $20.5
2007 1.65 16.72 18.58 -0.45 16.28 15.97 14.84 $2,047.1 46.5 16.1 1 $30.0 $20.6
2008 1.68 -46.22 -45.23 1.80 -45.25 -10.01 -10.70 $1,248.9 63.7 100.0 1 $25.2 $15.4
2009 6.79 -66.94 -64.03 5.45 -64.62 -29.76 -30.40 $472.5 83.0 28.9 1 $19.5 $10.6
2010 2.49 6.00 9.04 0.88 7.35 16.36 15.26 $507.2 76.5 12.0 1 $19.4 $10.4
2011 -.10 55.43 55.32 -1.22 53.77 15.99 14.96 $780.0 69.9 19.1 1 $18.2 $11.6
2012 -3.04 27.31 23.70 -3.75 22.85 10.94 9.79 $933.2 51.1 39.5 1 $16.6 $11.1
2013 5.73 10.73 16.93 4.55 15.65 13.94 12.89 $785.7 46.6 20.2 1 $16.3 $11.6
1Q2014 1.82 2.25 4.07 1.54 3.79 2.52 2.29 $750.5 46.2 22.0 1 $16.7 $12.1
Americas Real Estate – RREEF America REIT III Composite First Quarter 2014
1 Net of fees returns are net of investment management and performance-based fees. Actual investment management fees are used. 2 NCREIF benchmark not examined as part of verification. 3 For the period April 1, 2003 through December 31, 2003. Data shown April 1, 2003 through March 31, 2014.
Schedule of rates of return and statistics
MASTER PAGE NO. 189

Deutsche Asset & Wealth Management
Organization and Presentation Standards
Deutsche Asset & Wealth Management - Americas Real Estate (the "Firm") is part of the Alternatives and Real Assets platform of Deutsche Asset & Wealth Management, a division of Deutsche Bank AG. The Firm specializes in creating and managing real estate investment portfolios across the risk spectrum, including private real estate equity, private real estate debt, as well as other blended or specialized strategies for institutional, high net worth and retail investors in the U.S. and abroad.
Portfolios Eligible For The Composites And Types Of Portfolios
All discretionary, fee-paying portfolios are included in at least one composite. Portfolios are considered discretionary if the Firm has sole or primary responsibility for major investment decisions, including acquisitions, dispositions and financing. The existence of client-imposed investment restrictions may not preclude classification of a portfolio as discretionary where such restrictions do not inhibit the Firm from implementing its intended strategy. There is no minimum portfolio asset size requirement for inclusion in a composite and no assets are included in any composite that is not a part of the Firm.
A portfolio is included in a composite in the first full quarter after the first investment is purchased. From 01/01/2002 to 09/30/2010, a portfolio with an investment purchased on the first day of the quarter is included in a composite for that quarter. Effective 10/01/2010, a portfolio with an investment purchased on the first day of the quarter is excluded from a composite for that quarter. A portfolio with its last investment sold on the last day of a quarter is excluded from a composite for that quarter. Effective 01/01/2012, a portfolio with an investment purchased on the first day of the quarter is included in the composite for that quarter. a portfolio with its last investment sold on the last day of a quarter is included in the composite for that quarter.
Americas Real Estate – RREEF America REIT III Composite
The Americas Real Estate – RREEF America REIT III Composite is a value-added, open-end commingled composite structured as a private real estate investment trust (REIT) that seeks to provide institutional investors with highly competitive value-added investment returns. The composite’s investment strategy includes the acquisition, physical improvement, market repositioning, active management and sale of well-located apartment, industrial, retail and office properties in major metropolitan markets across the continental United States. The strategy also includes up to 20% opportunistic investments primarily in the form of new development projects. The composite was created in March 2009. From 01/01/2002 to 09/30/2010, the RREEF Real Estate – RREEF America REIT III Composite was known as the “RREEF America REIT III Composite.” This name change is effective 10/01/2010. From 10/01/2010 to 12/31/2012, the Americas Real Estate – RREEF America REIT III Composite was known as the “RREEF Real Estate – RREEF America REIT III Composite.” This name change is effective 01/01/2013.
Performance Results
Composite returns are calculated on an asset-weighted basis using beginning of period values adjusted for time-weighted external cash flows. Cash flows are time-weighted so portfolio returns reflect the time assets are actually held in the portfolio. Contributions and distributions are weighted based on the date of cash flow. Returns include cash and cash equivalents, related interest income and when applicable, the reinvestment of income. Income returns are based on accrual recognition of earned income. Capital expenditures are capitalized and included in the cost of the property and are reconciled through the valuation process and reflected in the capital return component. Returns are calculated on a quarterly basis. Annual returns are time-weighted returns calculated by geometrically linking quarterly returns. Income and capital returns may not equal total returns due to compounding effects of linking quarterly returns. Gross returns are presented before asset management and performance fees. Net returns are presented after asset management and performance fees. Gross and Net returns are calculated net of operating and fund expenses incurred on behalf of the underlying portfolios. Returns are calculated net of certain administrative expenses incurred on behalf of the underlying portfolios. Returns are presented and denominated in U.S. Dollars. Returns are presented net of leverage. Policies for valuing portfolios, calculating performance, and preparing compliant presentations are available upon request. A complete list and description of the Firm’s composites is also available upon request.
Americas Real Estate – RREEF America REIT III Composite First Quarter 2014
MASTER PAGE NO. 190

Deutsche Asset & Wealth Management
Performance Results (continued)
Portfolios may be leveraged utilizing fixed and floating rate debt. Effective 01/01/2009, the impact of marking debt to market, where called for by the client agreement, is included in the performance of the composite. Material use of leverage is defined as the use of debt of any amount on any asset. Material use of derivatives is defined as the use of interest rate swaps and caps, the amount of which totals more than 5% of portfolio assets. Total Firm assets represent the aggregate fair market value of properties under management. Total Firm net assets represent the net asset value of all portfolios under management.
Assets are valued quarterly by the Firm. For both internal and external property valuations, the Firm relies on the application of market discount rates to project future cash flows and capitalized terminal values over the expected holding period. Prior to January 1, 2006, real estate assets were externally appraised by either a tax appraiser or an independent Member of the Appraisal Institute (MAI) at least once every 36 months, unless otherwise not required by a portfolio’s Investment Management Agreement and certain properties under development. Effective January 1, 2006, all properties were externally appraised by either a tax appraiser or an independent Member of the Appraisal Institute (MAI) at least once every 36 months. Effective January 1, 2011, assets are externally appraised by either a tax appraiser or an independent Member of the Appraisal Institute (MAI) at least once every 12 months unless client agreements stipulate otherwise, in which case real estate investments are externally appraised at least once every 36 months or per the client agreement if the client agreement requires external valuations more frequently than every 36 months.
Composite dispersion measures represent the consistency of composite performance with respect to the individual portfolio returns within the composite. Composite dispersion is measured by the high and low returns for the periods presented.
Past performance is not indicative of future results. Other methods may produce different results and the results for individual portfolios and for different periods may vary depending on market conditions and the composition of the portfolio. Care should be used when comparing these results to those published by other investment advisers, other investment vehicles and unmanaged indices due to possible differences in calculation methods.
Fees
The REIT earns an annual asset management fee equal to .6% of the aggregate gross fair value of all of the REIT’s real estate investments. As of April 1, 2009, the Board of the REIT approved a reduction in the asset advisory fee to .3% of the aggregate fair value of all of the REIT’s real estate investments. As of January 1, 2013, the Board of the REIT approved a reduction in the fee up to 125 basis points of the REIT’s month-ending net asset value, with 105 basis points paid monthly.
The REIT also earns a performance fee, which is determined at the end of a three year compensation period. The fee, which is payable in common stock of the REIT and subject to a 50% holdback, is based on 15% of the excess by which the estimated ending equity of the investments exceeds the hurdle value that would result in an 8% real internal rate of return. Pursuant to the amended Investment Management Agreement, effective April 1, 2009, the performance fee is suspended until cumulative investor distributions equal cumulative contributions. As of January 1, 2013, the Board of the REIT approved a revised performance fee equal to10 basis points deferred until the sale of the final asset and the additional 10 basis points paid upon investors receiving a 9% investment rate of return.
NCREIF Fund Index – ODCE Benchmark
The National Council of Real Estate Investment Fiduciaries (NCREIF) Fund Index – Open-End Diversified Core Equity (NFI-ODCE) is a fund-level capitalization-weighted, time-weighted return index and includes property investments at ownership share, cash balances and leverage.
Compliance Statement
Deutsche Asset & Wealth Management - Americas Real Estate (the "Firm") claims compliance with the Global Investment Performance Standards (GIPS®) and has prepared and presented this report in compliance with the GIPS standards. The Firm has been independently verified for the periods January 1, 2002 through September 30, 2013. The verification report is available upon request.
Verification assesses whether (1) the firm has complied with all the composite construction requirements of the GIPS standards on a firm-wide basis and (2) the firm’s policies and procedures are
designed to calculate and present performance in compliance with the GIPS standards. The Americas Real Estate - RREEF America REIT III Composite has been examined for the periods January 1, 2002 through September 30, 2013.
Americas Real Estate – RREEF America REIT III Composite First Quarter 2014
MASTER PAGE NO. 191

Deutsche Asset & Wealth Management
RREEF America REIT III Review Review Ventura County Employees’ Retirement Association – December 15, 2014
Performance Notes
The NCREIF Fund Index - Open End Diversified Core Equity Index (NFI-ODCE), is the first of the NCREIF Fund Database products and is an index of investment returns reporting on both a historical and current basis the results of 33 open-end commingled funds pursuing a core investment strategy, some of which have performance histories dating back to the 1970s. The NFI-ODCE is a fund-level capitalization weighted, time-weighted return index and includes property investments at ownership share, cash balances and leverage (i.e., returns reflect the fund’s actual asset ownership positions and financing strategy). The current quarter results are preliminary based on estimated data provided by the fund managers and are therefore subject to change.
The Fund NAV (and accordingly, the Fund share price) is calculated based primarily on values from independent appraisals of real estate assets and Management's estimate of fair market value of the Fund’s debt obligations. These values include substantial unrealized appreciation and do not purport to present the net realizable, liquidation or fair value of the Fund as a whole. Please note that 18 of the Fund's 51 assets were externally appraised during third quarter 2014, with the remaining assets held at their prior total gross real estate market value plus capitalized costs. This may distort the results. Differences in valuation cycles and frequency may make the performance results not comparable. Please refer to “Important Information” for further information.
The Fund has substantially completed its restructuring plan. However, there can be no assurance that the Fund will be able to remain in compliance with the terms of its financial obligations, or to obtain additional capital in order to satisfy its liquidity needs.
The financial data herein is based, in part, on management’s business plans and budgets as of the date indicated and takes into account such factors and assumptions as management deems relevant including property operations and portfolio level expenses. However, events assumed to occur may not occur, and other events may occur which were not assumed to occur or otherwise taken into account in preparing the data contained herein. Such events could materially affect the analysis. In addition, changes in a number of factors, including (without limitation) global and local economic conditions, the growing global economic crisis, the availability of credit (or lack thereof), the level of interest rates and other credit terms, demand for certain types of investments and a number of other factors may cause the actual results to vary, perhaps significantly, from the financial data contained herein. You and your advisers should consider the impact of current economic conditions, which are unprecedented, in evaluating the information contained herein.
Moreover, the information set forth above speaks only as of the date indicated; it was not revised to take account of events which have occurred subsequent to the date indicated. Accordingly, it may not be representative of values or the amount that may ultimately be received with respect of an investment. No assurance can be given as to the actual events that may occur or the appropriate assumptions to be applied. Net performance results are after asset management and incentive fees. No representation or warranty is made as to the actual amounts that will be distributed with respect to your investment. Information herein includes or is based upon certain “forward-looking statements.” These forward-looking statements include, but are not limited to, the plans, projections, objectives, expectations and intentions of the Fund and its advisers and other statements contained herein that are not historical facts. These statements are based on current beliefs or expectations and are inherently subject to significant uncertainties and changes in circumstances, many of which are beyond the Fund’s control. Actual results may differ materially from these expectations due to changes in, among other things, global, political, economic, business, competitive, market and regulatory factors.
Past performance is not indicative of future results. Net performance results are after asset management and incentive fees. This information includes or is based upon certain “forward-looking statements.” These forward-looking statements include, but are not limited to, the plans, projections, objectives, expectations and intentions of the Fund and its advisers and other statements contained herein that are not historical facts. These statements are based on current beliefs or expectations and are inherently subject to significant uncertainties and changes in circumstances, many of which are beyond the Fund’s control. Actual results may differ materially from these expectations due to changes in, among other things, global, political, economic, business, competitive, market and regulatory factors. The final NAV and performance results, as revised, will be published following the Fund's quarterly Board of Directors meeting in the Fund's quarterly report and shall supersede in their entirety any estimates contained herein.
MASTER PAGE NO. 192

Deutsche Asset & Wealth Management
RREEF America REIT III Review Review Ventura County Employees’ Retirement Association – December 15, 2014
Important Information
© 2014 Deutsche Bank AG. All rights reserved. (10/14) I-031584-1.0
Deutsche Asset & Wealth Management represents the asset management and wealth management activities conducted by Deutsche Bank AG or any of its subsidiaries. Clients will be provided Deutsche Asset & Wealth Management products or services by one or more legal entities that will be identified to clients pursuant to the contracts, agreements, offering materials or other documentation relevant to such products or services. In the United States Deutsche Asset & Wealth Management relates to the asset management activities of RREEF America L.L.C., and Deutsche Investment Management Americas Inc, in addition to other regional entities in the Deutsche Bank Group. An investment in real estate involves a high degree of risk, including possible loss of principal amount invested, and is suitable only for sophisticated investors who can bear such losses. The value of shares/ units and their derived income may fall or rise. Any forecasts provided herein are based upon Deutsche Asset & Wealth Management’s opinion of the market at this date and are subject to change dependent on the market. Past performance or any prediction, projection or forecast on the economy or markets is not indicative of future performance. This material was prepared without regard to the specific objectives, financial situation or needs of any particular person who may receive it. It is intended for informational purposes only. It does not constitute investment advice, a recommendation, an offer, solicitation, the basis for any contract to purchase or sell any security or other instrument, or for Deutsche Bank AG or its affiliates to enter into or arrange any type of transaction as a consequence of any information contained herein. Neither Deutsche Bank AG nor any of its affiliates gives any warranty as to the accuracy, reliability or completeness of information which is contained in this document. Except insofar as liability under any statute cannot be excluded, no member of the Deutsche Bank Group, the Issuer or any officer, employee or associate of them accepts any liability (whether arising in contract, in tort or negligence or otherwise) for any error or omission in this document or for any resulting loss or damage whether direct, indirect, consequential or otherwise suffered by the recipient of this document or any other person. The supplemental information referenced for the U.S. Core real estate leveraged property performance aggregate includes all discretionary and nondiscretionary core real estate portfolios. The performance is calculated according to the National Council Real Estate Fiduciaries property formula and is based on fair value of real estate. The GIPS composite, Americas Real Estate - U.S. Core Composite includes only discretionary core direct real estate portfolios. See the GIPS Core Composite disclosures for details on the return methodology. Certain Deutsche Asset & Wealth Management products and services may not be available in every region or country for legal or other reasons, and information about these products or services is not directed to those investors residing or located in any such region or country. From time to time Deutsche Asset & Wealth Management receives information requests from investors or their consultants. This information is available upon request. Please contact us for assistance in this regard. We also have a password-protected client web portal called Client Connect with additional information on the Fund. For access, please contact us or go to www.rreef.com.
MASTER PAGE NO. 193

Ventura County Employees'Retirement AssociationPerformance ReportMonth Ending November 30, 2014
Don Stracke, CFA, CAIA, Senior Consultant Allan Martin, PartnerAnthony Ferrara, CAIA, Senior Analyst
MASTER PAGE NO. 194

Policy Index: Uses an estimated CPI+4% index due to CPI monthly lag
Policy Index: Currently, 30% Total U.S. Equity Benchmark, 19% Barclays Aggregate, 14% MSCI ACWI ex U.S., 10% MSCI ACWI, 5% Barclays Global Aggregate, 5% DJ U.S. Total Stock Market Index + 3%, 10% CPI+4% Index, and 7% NCREIFODCE Real Estate Index
Total U.S. Equity Benchmark: The Benchmark is a dynamic hybrid using the respective managers' market value weights within the U.S. Equity component toward their benchmark. Prior to May 2013, the Dow Jones U.S. Total Stock Market Index.Prior to May 2007, the Russell 3000 Index
CPI+4% is estimated for latest month.
November 30, 2014
Ventura County Employees’ Retirement AssociationTotal Fund Performance Detail Net of Fees
Performance Summary
Market Value($)
% ofPortfolio
1 Mo(%)
3 Mo(%)
YTD(%)
FiscalYTD(%)
1 Yr(%)
3 Yrs(%)
5 Yrs(%)
10 Yrs(%)
Return(%) Since
_
Total Fund 4,377,853,324 100.0 1.1 0.0 7.2 0.6 8.8 13.3 11.1 6.8 8.3 Apr-94Policy Index 1.2 0.6 7.4 1.6 9.0 12.7 10.4 6.9 8.3 Apr-94
Over/Under -0.1 -0.6 -0.2 -1.0 -0.2 0.6 0.7 -0.1 0.0 Total Fund ex Clifton 4,324,732,688 98.8 1.1 -0.1 7.3 0.7 8.9 13.1 10.9 6.8 8.3 Apr-94Total Fund ex Private Equity 4,272,682,731 97.6 1.1 -0.2 7.0 0.5 8.5 -- -- -- 12.4 Jan-12
Policy Index 1.2 0.6 7.4 1.6 9.0 12.7 10.4 6.9 12.9 Jan-12Over/Under -0.1 -0.8 -0.4 -1.1 -0.5 -0.5
Total US Equity 1,396,545,350 31.9 2.4 3.0 12.6 5.2 15.5 21.2 16.8 7.9 9.2 Dec-93Total U.S. Equity Benchmark 2.4 3.0 12.4 5.1 15.4 20.8 16.4 8.4 9.6 Dec-93
Over/Under 0.0 0.0 0.2 0.1 0.1 0.4 0.4 -0.5 -0.4 BlackRock Extended Equity Index 46,144,931 1.1 1.3 0.0 6.5 0.4 9.7 20.3 18.3 9.7 12.6 Oct-02
Dow Jones U.S. Completion Total Stock Market 1.3 0.1 6.6 0.4 9.8 20.1 18.0 9.6 12.6 Oct-02Over/Under 0.0 -0.1 -0.1 0.0 -0.1 0.2 0.3 0.1 0.0
Western U.S. Index Plus 139,719,013 3.2 2.9 3.8 14.8 6.5 17.5 23.0 19.0 -- 3.7 May-07S&P 500 2.7 3.7 14.0 6.4 16.9 20.9 16.0 8.1 6.4 May-07
Over/Under 0.2 0.1 0.8 0.1 0.6 2.1 3.0 -2.7 BlackRock Equity Market Fund 1,210,681,406 27.7 2.4 3.0 12.5 5.2 15.5 20.8 16.4 -- 7.8 Dec-07
Dow Jones U.S. Total Stock Market 2.4 3.0 12.5 5.2 15.4 20.8 16.4 8.5 7.7 Dec-07Over/Under 0.0 0.0 0.0 0.0 0.1 0.0 0.0 0.1
2 MASTER PAGE NO. 195

November 30, 2014
Total Non-U.S. Equity Benchmark: MSCI ACWI ex US Free, prior to May 2002, the MSCI EAFE
Ventura County Employees’ Retirement AssociationTotal Fund Performance Detail Net of Fees
Market Value($)
% ofPortfolio
1 Mo(%)
3 Mo(%)
YTD(%)
FiscalYTD(%)
1 Yr(%)
3 Yrs(%)
5 Yrs(%)
10 Yrs(%)
Return(%) Since
_
Total Non-US Equity 616,692,376 14.1 1.0 -4.5 -0.6 -5.4 0.4 10.4 6.4 6.0 6.7 Mar-94Total Non-US Equity Benchmark 0.7 -5.1 -0.3 -5.5 0.6 9.9 5.6 6.0 5.5 Mar-94
Over/Under 0.3 0.6 -0.3 0.1 -0.2 0.5 0.8 0.0 1.2 BlackRock ACWI ex-U.S. Index 257,598,978 5.9 0.6 -5.5 -0.5 -6.0 0.5 10.2 6.0 -- 1.8 Mar-07
MSCI ACWI ex USA Gross 0.7 -5.0 0.1 -5.4 1.0 10.4 6.1 6.4 1.9 Mar-07Over/Under -0.1 -0.5 -0.6 -0.6 -0.5 -0.2 -0.1 -0.1
Sprucegrove 185,512,984 4.2 1.8 -4.3 -0.4 -6.0 0.8 10.9 8.1 6.5 8.3 Mar-02MSCI EAFE Gross 1.4 -3.9 -1.1 -5.9 0.4 12.5 6.9 5.7 7.0 Mar-02
Over/Under 0.4 -0.4 0.7 -0.1 0.4 -1.6 1.2 0.8 1.3 MSCI ACWI ex USA Gross 0.7 -5.0 0.1 -5.4 1.0 10.4 6.1 6.4 7.8 Mar-02
Hexavest 80,507,997 1.8 1.3 -2.3 -0.4 -4.0 0.8 10.4 -- -- 5.4 Dec-10MSCI EAFE Gross 1.4 -3.9 -1.1 -5.9 0.4 12.5 6.9 5.7 6.3 Dec-10
Over/Under -0.1 1.6 0.7 1.9 0.4 -2.1 -0.9 Walter Scott 93,072,416 2.1 0.5 -3.6 -1.4 -3.8 -1.2 9.4 -- -- 4.8 Dec-10
MSCI ACWI ex USA Gross 0.7 -5.0 0.1 -5.4 1.0 10.4 6.1 6.4 4.3 Dec-10Over/Under -0.2 1.4 -1.5 1.6 -2.2 -1.0 0.5
Total Global Equity 441,585,156 10.1 1.5 -1.9 4.5 -2.0 6.1 13.4 9.8 -- 5.9 May-05MSCI ACWI Gross 1.7 -0.8 6.7 0.2 8.6 15.4 10.6 7.3 7.5 May-05
Over/Under -0.2 -1.1 -2.2 -2.2 -2.5 -2.0 -0.8 -1.6 GMO Global Equity 214,873,695 4.9 1.4 -2.9 2.5 -4.2 3.7 12.3 9.4 -- 7.1 Apr-05
MSCI ACWI Gross 1.7 -0.8 6.7 0.2 8.6 15.4 10.6 7.3 7.5 Apr-05Over/Under -0.3 -2.1 -4.2 -4.4 -4.9 -3.1 -1.2 -0.4
BlackRock MSCI ACWI Equity Index 226,711,461 5.2 1.7 -0.9 6.6 0.1 8.4 -- -- -- -- May-12MSCI ACWI Gross 1.7 -0.8 6.7 0.2 8.6 15.4 10.6 7.3 18.4 May-12
Over/Under 0.0 -0.1 -0.1 -0.1 -0.2
3 MASTER PAGE NO. 196

November 30, 2014
Reams Custom Index: Merrill Lynch 3 Month Libor Constant Maturity Index, prior to February 2013 the Barclays AggregateLoomis Custom Index: 65% Barclays Aggregate, 30% Citigroup High Yield Market Index and 5% JPM Non-US Hedged Bond Index
Ventura County Employees’ Retirement AssociationTotal Fund Performance Detail Net of Fees
Market Value($)
% ofPortfolio
1 Mo(%)
3 Mo(%)
YTD(%)
FiscalYTD(%)
1 Yr(%)
3 Yrs(%)
5 Yrs(%)
10 Yrs(%)
Return(%) Since
_
Total US Fixed Income 762,087,614 17.4 0.0 0.1 3.4 0.3 3.2 4.8 6.0 6.0 6.4 Feb-94Barclays Aggregate 0.7 1.0 5.9 1.9 5.3 3.0 4.1 4.8 5.8 Feb-94
Over/Under -0.7 -0.9 -2.5 -1.6 -2.1 1.8 1.9 1.2 0.6 Western 266,187,093 6.1 0.5 0.5 7.3 1.6 7.0 5.7 6.7 5.6 6.6 Dec-96
Barclays Aggregate 0.7 1.0 5.9 1.9 5.3 3.0 4.1 4.8 5.7 Dec-96Over/Under -0.2 -0.5 1.4 -0.3 1.7 2.7 2.6 0.8 0.9
BlackRock U.S. Debt Fund 139,018,227 3.2 0.7 1.0 6.0 1.9 5.4 3.1 4.2 4.9 5.7 Nov-95Barclays Aggregate 0.7 1.0 5.9 1.9 5.3 3.0 4.1 4.8 5.7 Nov-95
Over/Under 0.0 0.0 0.1 0.0 0.1 0.1 0.1 0.1 0.0 Reams 284,526,572 6.5 -0.8 -0.4 -2.8 -1.6 -2.7 3.8 5.3 6.3 6.0 Sep-01
Reams Custom Index 0.0 0.1 0.2 0.1 0.2 1.7 3.3 4.4 4.7 Sep-01Over/Under -0.8 -0.5 -3.0 -1.7 -2.9 2.1 2.0 1.9 1.3
Barclays Aggregate 0.7 1.0 5.9 1.9 5.3 3.0 4.1 4.8 5.0 Sep-01Loomis Sayles Multi Strategy 72,355,722 1.7 0.0 -0.6 7.7 0.2 8.1 9.0 8.7 -- 7.4 Jul-05
Loomis Custom Index 0.2 0.1 5.1 0.8 4.9 5.0 5.8 -- 5.8 Jul-05Over/Under -0.2 -0.7 2.6 -0.6 3.2 4.0 2.9 1.6
Barclays Aggregate 0.7 1.0 5.9 1.9 5.3 3.0 4.1 4.8 4.9 Jul-05Total Global Fixed Income 261,335,056 6.0 0.0 -2.2 2.1 -2.4 2.0 -- -- -- 1.3 Jun-12
Barclays Global Aggregate -0.4 -3.1 1.3 -3.5 0.7 1.2 2.0 3.8 0.6 Jun-12Over/Under 0.4 0.9 0.8 1.1 1.3 0.7
Loomis Sayles Global Fixed Income 92,837,434 2.1 -0.6 -3.3 1.1 -3.6 0.8 -- -- -- 1.1 Jun-12Barclays Global Aggregate -0.4 -3.1 1.3 -3.5 0.7 1.2 2.0 3.8 0.6 Jun-12
Over/Under -0.2 -0.2 -0.2 -0.1 0.1 0.5 PIMCO Global Fixed Income 126,407,924 2.9 0.3 -2.2 2.6 -2.4 2.3 -- -- -- -0.5 Sep-12
Barclays Global Aggregate -0.4 -3.1 1.3 -3.5 0.7 1.2 2.0 3.8 -0.8 Sep-12Over/Under 0.7 0.9 1.3 1.1 1.6 0.3
Loomis Strategic Alpha 42,089,698 1.0 0.6 0.2 2.7 0.6 3.3 -- -- -- 3.1 Jul-13Barclays Global Aggregate -0.4 -3.1 1.3 -3.5 0.7 1.2 2.0 3.8 1.8 Jul-13
Over/Under 1.0 3.3 1.4 4.1 2.6 1.3
4 MASTER PAGE NO. 197

November 30, 2014
Total Real Estate Benchmark: NCREIF ODCE; prior to January 2006, the NCREIF Property IndexReal Estate managers and NCREIF ODCE are valued on a quarterly basis. Performance is not applicable in mid-quarter months, therefore 0% return is shown.Total Liquid Alternatives index, the CPI+4% is estimated by carrying the last available month forwardCPI+5% and CPI+4% are estimated by carrying the last available month forwardReal Estate Valuation is as of 9/30/2014.Tortoise performance is preliminary
Ventura County Employees’ Retirement AssociationTotal Fund Performance Detail Net of Fees
Market Value($)
% ofPortfolio
1 Mo(%)
3 Mo(%)
YTD(%)
FiscalYTD(%)
1 Yr(%)
3 Yrs(%)
5 Yrs(%)
10 Yrs(%)
Return(%) Since
_
Total Real Estate 313,736,471 7.2 0.0 3.0 8.3 3.0 11.0 10.2 10.8 5.4 7.6 Mar-94Total Real Estate Benchmark 0.0 3.2 8.9 3.2 12.4 12.3 12.4 7.1 8.7 Mar-94
Over/Under 0.0 -0.2 -0.6 -0.2 -1.4 -2.1 -1.6 -1.7 -1.1 Prudential Real Estate 103,915,047 2.4 0.0 3.0 8.6 3.0 12.3 11.5 12.5 6.8 4.9 Jun-04
NCREIF-ODCE 0.0 3.2 8.9 3.2 12.4 12.3 12.4 7.1 7.2 Jun-04Over/Under 0.0 -0.2 -0.3 -0.2 -0.1 -0.8 0.1 -0.3 -2.3
UBS Real Estate 202,620,814 4.6 0.0 2.9 7.6 2.9 9.8 9.4 10.0 6.7 7.1 Mar-03NCREIF-ODCE 0.0 3.2 8.9 3.2 12.4 12.3 12.4 7.1 7.5 Mar-03
Over/Under 0.0 -0.3 -1.3 -0.3 -2.6 -2.9 -2.4 -0.4 -0.4 RREEF 7,200,610 0.2 0.0 5.3 23.5 5.3 27.0 21.1 20.0 -- -6.9 Sep-07
NCREIF-ODCE 0.0 3.2 8.9 3.2 12.4 12.3 12.4 7.1 2.6 Sep-07Over/Under 0.0 2.1 14.6 2.1 14.6 8.8 7.6 -9.5
Total Liquid Alternatives 427,580,072 9.8 0.4 -3.6 12.9 -1.8 13.8 -- -- -- 15.3 Apr-13CPI + 4% (Unadjusted) 0.1 0.6 5.3 1.0 5.7 5.6 5.9 6.3 5.2 Apr-13
Over/Under 0.3 -4.2 7.6 -2.8 8.1 10.1 Bridgewater All Weather Fund 279,943,611 6.4 1.1 -1.5 9.8 0.3 9.3 -- -- -- 10.7 Aug-13
CPI + 5% (Unadjusted) 0.2 0.8 6.3 1.4 6.7 -- -- -- 6.1 Aug-13Over/Under 0.9 -2.3 3.5 -1.1 2.6 4.6
Tortoise Energy Infrastructure 147,636,461 3.4 -1.0 -7.4 19.2 -5.6 23.6 -- -- -- 20.3 Apr-13Wells Fargo MLP Index -1.4 -9.1 11.7 -5.1 13.7 16.6 -- -- 11.5 Apr-13
Over/Under 0.4 1.7 7.5 -0.5 9.9 8.8
5 MASTER PAGE NO. 198

November 30, 2014
Ventura County Employees’ Retirement AssociationTotal Fund Performance Detail Net of Fees
Performance for Clifton Overlay is not meaningful on an individual account basis
Please Note:Private Equity performance is shown on a time-weighted return basis. Values are cash adjusted with current month cash flows.
Market Value($)
% ofPortfolio
1 Mo(%)
3 Mo(%)
YTD(%)
FiscalYTD(%)
1 Yr(%)
3 Yrs(%)
5 Yrs(%)
10 Yrs(%)
Return(%) Since
_
Overlay 53,120,636 1.2 Clifton 53,120,636 1.2
Total Private Equity 105,170,592 2.4 1.1 7.0 18.4 7.0 23.2 -- -- -- -- Jul-10DJ U.S. Total Stock Market Index + 3% 2.7 3.8 15.5 6.5 18.9 -- -- -- -- Jul-10
Over/Under -1.6 3.2 2.9 0.5 4.3 Adams Street Partners 68,396,089 1.6 1.7 6.0 18.3 6.0 23.3 -- -- -- -- Jul-10
DJ U.S. Total Stock Market Index + 3% 2.7 3.8 15.5 6.5 18.9 -- -- -- -- Jul-10Over/Under -1.0 2.2 2.8 -0.5 4.4
Panteon Ventures 9,775,115 0.2 -0.1 5.7 19.4 5.7 22.4 -- -- -- -- Aug-10DJ U.S. Total Stock Market Index + 3% 2.7 3.8 15.5 6.5 18.9 -- -- -- -- Aug-10
Over/Under -2.8 1.9 3.9 -0.8 3.5 Harbourvest 26,999,388 0.6 -0.1 10.7 18.5 10.4 24.0 -- -- -- -- May-13
DJ U.S. Total Stock Market Index + 3% 2.7 3.8 15.5 6.5 18.9 -- -- -- 22.5 May-13Over/Under -2.8 6.9 3.0 3.9 5.1
XXXXX
6 MASTER PAGE NO. 199

November 30, 2014
Ventura County Employees’ Retirement AssociationTotal Fund
Cash Flow Summary
Month Ending November 30, 2014Beginning
Market Value Withdrawals Contributions Net Cash Flow Fees Net InvestmentChange
EndingMarket Value
_
Adams Street Partners $67,249,412 $0 $0 $0 $0 $1,146,677 $68,396,089BlackRock ACWI ex-U.S. Index $256,096,259 $0 $0 $0 -$23,133 $1,502,718 $257,598,978BlackRock Equity Market Fund $1,182,098,332 $0 $0 $0 -$22,261 $28,583,074 $1,210,681,406BlackRock Extended Equity Index $45,556,022 $0 $0 $0 -$3,076 $588,910 $46,144,931BlackRock MSCI ACWI Equity Index $222,895,794 $0 $0 $0 -$9,224 $3,815,667 $226,711,461BlackRock U.S. Debt Fund $138,021,503 $0 $0 $0 -$7,967 $996,724 $139,018,227Bridgewater All Weather Fund $276,791,147 $0 $0 $0 -$91,655 $3,152,464 $279,943,611Clifton $68,212,231 -$17,218,296 $2,239,782 -$14,978,514 -$5,468 -$113,081 $53,120,636GMO Global Equity $212,008,712 $0 $0 $0 -$98,484 $2,864,983 $214,873,695Harbourvest $27,033,829 $0 $0 $0 $0 -$34,442 $26,999,388Hexavest $79,446,792 $0 $0 $0 -$31,003 $1,061,205 $80,507,997Loomis Sayles Global Fixed Income $93,359,972 $0 $0 $0 -$23,209 -$522,537 $92,837,434Loomis Sayles Multi Strategy $72,347,364 $0 $0 $0 -$23,922 $8,358 $72,355,722Loomis Strategic Alpha $41,825,221 $0 $0 $0 -$14,030 $264,477 $42,089,698Panteon Ventures $10,105,112 -$321,506 $0 -$321,506 $0 -$8,491 $9,775,115PIMCO Global Fixed Income $126,049,853 $0 $0 $0 -$35,769 $358,071 $126,407,924Prudential Real Estate $103,915,047 $0 $0 $0 $0 $0 $103,915,047Reams $286,670,118 $0 $0 $0 -$41,816 -$2,143,546 $284,526,572RREEF $7,200,610 $0 $0 $0 $0 $0 $7,200,610Sprucegrove $182,213,570 $0 $0 $0 -$58,232 $3,299,415 $185,512,984Tortoise Energy Infrastructure $149,052,712 $0 $0 $0 -$87,311 -$1,416,251 $147,636,461UBS Real Estate $202,620,814 $0 $0 $0 $0 $0 $202,620,814Walter Scott $92,577,685 $0 $0 $0 -$68,411 $494,731 $93,072,416Western $264,736,436 $0 $0 $0 -$45,773 $1,450,657 $266,187,093Western U.S. Index Plus $135,805,095 $0 $0 $0 -$29,965 $3,913,918 $139,719,013Total $4,343,889,644 -$17,539,802 $2,239,782 -$15,300,020 -$720,710 $49,263,700 $4,377,853,324
7 MASTER PAGE NO. 200

To: Ventura County Employees’ Retirement Association (“VCERA”) Board
From: Don Stracke, CFA, CAIA, Allan Martin, Anthony Ferrara, CAIA
Date: December 15, 2014
Subject: Watch List Update PIMCO Update: In March, 2014, VCERA put PIMCO on watch for the global fixed income they manage for the board due to organizational changes. As of the end of November, VCERA had approximately $126 million invested in their Global Fixed Income Strategy, which represented approximately 2.9% of the Total Fund. PIMCO released Total Return fund flow information recently for the month of November. Outflows continued in November in Total Return, totaling $9.5 billion, or approximately 5.5% of fund assets. Redemptions occurred at a slower pace compared to both September and October, which had redemptions of $23.5 billion (10% of Fund assets) and $27.5 billion (14% of Fund assets), respectively. In total, the Total Return Fund experienced net outflows of approximately $60 billion for months of September, October, and November combined; that equates to just over 25% loss in Fund assets. Flows in other asset classes in general vary significantly, but are much smaller than in Total Return. There have been no significant personnel departures, and the performance for the VCERA fund will be reviewed within the monthly flash report. We suggest you maintain PIMCO on the watch list. Sprucegrove Update: The VCERA board voted to place Sprucegrove on the watch list in September after Sprucegrove announced that Co-President/Co-Portfolio Manager of the International Equities and International Value Equities strategies, Peter Ellement, resigned from the firm. As of the end of November, Sprucegrove manages approximately $186 million for VCERA in a strategy benchmarked against the EAFE. Over the course of 2014, Sprucegrove has experienced approximately $1 billion in outflows and the product is currently closed. As a comparison they experienced approximately $2 billion in outflows in 2013. They believe that none of the outflows this year were due to Peter Ellement’s departure. They cite one client who moved to an out-sourced CIO model, another one that was acquired, and a third moving to a higher alternative allocation as examples. There have been no additional personnel departures since Peter Ellement departed. We suggest that the VCERA board maintain the watch list status for Sprucegrove.
255 State Street | Boston, MA 02109 | TEL: 617.374.1300 | www.nepc.com
BOSTON | ATLANTA | CHARLOTTE | CHICAGO | DETROIT | LAS VEGAS | SAN FRANCISCO
MASTER PAGE NO. 201

Ventura County Employees’ Retirement Association Global Asset Allocation Review And AA update December 15th, 2014
Allan Martin, Partner Don Stracke, CFA, CAIA, Senior Consultant
MASTER PAGE NO. 202

Global Asset Allocation
MASTER PAGE NO. 203
• GTAA strategies provide broadly diversified asset class exposure within one portfolio
– Portfolio includes multiple asset classes (e.g. stocks and bonds, real assets, commodities)
– Can be viewed as instant diversification
• Products can be designed around different benchmarks – Traditional 60% global stocks/40% global bonds – Achieving an absolute/real return target (e.g., CPI + 5%) – There is significant differences between different approaches
• Multi-Asset strategies are a core allocation providing risk balance for
the portfolio – Serves as a core liquid asset allocation approach – Provides meaningful allocations to risk exposures under-represented in traditional
allocations – Mitigates exposure to one dominant risk factor and limits potential drawdown risk
• Thesis benefits from, but is not dependent on, manager skill in
identifying over- and under-valued asset classes.
What is Global Asset Allocation?
3 MASTER PAGE NO. 204

• Global Asset Allocation (GAA) strategies are broadly diversified – Multiple, small asset class decisions rather than one big decision – Ability to underweight risky asset classes when risk-premia are unattractive
• Manager skill can add value through asset class rotation and security
selection – Better, more timely exploitation of market opportunities – Provides efficient way to diversify the portfolio without having to hire a large number
of niche managers – Diversifying alpha source
• Strategies combine top-down asset class selection, portfolio
construction & risk management techniques
• Tactical asset class weighting can add value above static, strategic allocation by taking advantage of mis-pricings and exploiting relationships between global markets
Why Global Asset Allocation?
4 MASTER PAGE NO. 205

• NEPC’s forecasts—and those of many other industry leaders—are for a subdued outlook in traditional asset classes relative to the past
• NEPC expects volatility to continue
• Global asset allocation managers can be nimble as we move through an uncertain market
– Attempting to protect capital but taking on risk where appropriate and positioning for potential market opportunities
• Taking full advantage of diversification benefits (risk diversification) can produce a more efficient portfolio, especially in highly volatile markets
The Case Going Forward
5 MASTER PAGE NO. 206

Equity Markets: Poised to Continue or Overly Optimistic
3/31/2014 15.97
Source: Bloomberg as of 3/31 Source: Bloomberg as of 3/31
Source: Bloomberg as of 3/31, Long-term averages since 1954 Source: Bloomberg as of 3/31
6 MASTER PAGE NO. 207

GAA Strategies can be Both Defensive and Opportunistic as Risk Premium Decline
7
0%
10%
20%
30%
40%
50%
60%
70%
80%
90%
100%Sample GAA Strategy
US Equity
International Equity
Emerging MarketEquityInvestment GradeCreditHigh Yield
Emerging MarketDebtAlternatives
Commodities
Global InflationLinked BondsGlobal Interest Rates
Cash
MASTER PAGE NO. 208

• NEPC continues to believe Multi-Asset Strategies are an important input to meet return expectations while diversifying equity risk
– NEPC has long supported a focus on risk based implementation to create a balanced mix of risk and factor exposures
– Diversification still matters, most especially after a period of rising equity markets
• Compressed return expectations across asset classes flow through to Multi-Asset strategies
– A tactical multi-asset approach is not a panacea, but an implementation tool to efficiently take market risk
– Discipline of tactical based strategies allows for participation in rising markets, while maintaining a defensive position when markets correct
– The decoupling of portfolio returns from equity risk and economic growth will differentiate returns from equity focused peers
• Over the last 10 years NEPC has been at the forefront of the industry
when discussing the benefits of a multi-asset investment program – Think outside the “benchmark box” when constructing a portfolio – Implementation begins with a balanced mix of risk premiums paired with tactical asset
allocation strategies – Dedicated internal resources focused exclusively on identifying and evaluating multi-
asset strategies
NEPC has a Long History of Recommending Multi-Asset Strategies
8 MASTER PAGE NO. 209

• Among NEPC clients, Multi-Asset Strategies represent over $34 billion in assets
– Nearly 250 clients have an allocation to a multi-asset mandate representing over 75% of our total clients
– Of those clients, on average they have an allocation to 3 multi-asset strategies – Allocations to multi-asset strategies are with over 25 various global investment firms
• Client-focused solutions with global coverage across the investment
manager universe – Primarily focused on Europe and the U.S. but coverage includes both Asia and
emerging market domiciled investment firms – NEPC size provides unique access to investment manager community and ability to
develop customized solutions across geography and strategy
• Significant exposure and consistent dialogue with a diverse group of global multi-asset managers
– GMO – Bridgewater – Wellington – Schroders – Newton
Multi-Asset Strategy Experience
9 MASTER PAGE NO. 210

• NEPC offers multiple asset allocation and risk budgeting tools to model implementation options for a multi-asset strategy allocation
– Risk tools designed to deliver a multi-asset solution tailored to client risk and return objectives
– Includes analysis of long-term and short-term correlations to understand alpha relationship with common market risk factors
• “Risk aware” risk budgeting approach utilized for custom strategy
implementation to more closely align active manager exposure to client risk targets
• “Factor Risk” analysis can reveal non-intuitive portfolio concentrations
– Solely focusing on risk exposure analysis can lead to a false sense of diversification across asset classes
– Identifying the factor exposures of a multi-asset strategy can improve perspective on how individual strategies fit in a larger multi-asset program
• Multi-Asset allocations can be designed to meet custom broad market
risk and return investment objectives – Ability to construct a multi-asset program with multiple beta and alpha implementation
options – Examples include a “total return approach”, “equity replacement”, or “fixed income
replacement”
Implementation of a Multi-Asset Strategy Portfolio
10 MASTER PAGE NO. 211

• Diversified allocation of multiple multi-asset strategies with a volatility target similar to a “traditional” portfolio allocation
– Consists of Risk Parity strategies paired with unconstrained GAA strategies to provide a broad multi-asset solution
– Provides exposure to multiple risk premia while mitigating equity drawdowns
“Total Return” Multi-Asset Solution
11 MASTER PAGE NO. 212

• Factor exposure analysis reveals a greater growth bias in the portfolio but remains more diversified than a 60/40 portfolio
– Illustrates a portfolio with a similar total volatility as a traditional portfolio can provide a more balanced exposure to growth, inflation, and rates
– Growth exposure in the multi-asset portfolio also proves to be more risk balanced
“Total Return” Multi-Asset Solution
12 MASTER PAGE NO. 213

• Diversified allocation of return oriented multi-asset strategies with a volatility target currently below global equities
– Consists of a tactical Risk Parity strategy paired with equity focused GAA strategies – Return expectations are subdued across risky asset classes, increasing the importance
of tactical asset allocation strategies to identify sources of value
“Equity Replacement” Multi-Asset Solution
13 MASTER PAGE NO. 214

• NEPC maintains a preferred provider list of multi-asset strategies thoroughly vetted by NEPC Research
– Continuous assessment of portfolio construction and risk management techniques – A robust risk management process incorporating both quantitative and qualitative
factors is essential
• NEPC has significant experience working with Investment Boards and Clients to detail the benefits of multi-asset strategies
– NEPC has conducted many education sessions and seminars to provide a greater comfort and understanding of multi-asset portfolios
• NEPC has worked extensively with clients to construct broad multi-
asset solutions and facilitate investment manager provider searches – Look to offer a flexible approach customized for each investors risk/return profile – Client-focused solutions with broad coverage across the investment manager universe
• Overriding goal is to provide broadly diversified asset class exposure
to assets that perform well in diverse economic environments
Evaluation of Multi-Asset Strategies
14 MASTER PAGE NO. 215

• Global Asset Allocation strategies continue to grow in asset size in
both the U.S. and Europe – GAA strategies are utilizing tail-hedging instruments and relative volatility exposures
much more extensively – Some strategies are incorporating “alternative risk premia” and “smart beta”
exposures – Industry wide, multi-asset strategies are increasingly being added to strategic asset
allocations – GAA strategies are making larger resource commitment to build out broad multi-asset
capabilities
Current Multi-Asset Strategy Trends
15 MASTER PAGE NO. 216

• Complement one another as well as the performance of traditional managers
– Reasonable correlations between strategies – Unique approach to allocating assets and identifying return opportunities – Generally provide greater downside protection
• Represent a broad set of strategies
– Tactical/opportunistic asset class rotation (alpha) – Long-term strategic beta exposures – Real return focus
• Improve the risk-return profile of the total fund when GTAA is added
to the portfolio – Better diversification of risk allocations (less dependence on equity risk) – Improved risk/return expectations – Diversification benefits
• Adding new asset classes • Complement to existing managers; low correlations
• Have reasonable fees – Paying appropriately for beta exposure (cheap) and manager alpha (expensive)
• NEPC therefore generally recommends implementation with 2-3
managers
A Good Team of GTAA Managers Will…
16 MASTER PAGE NO. 217
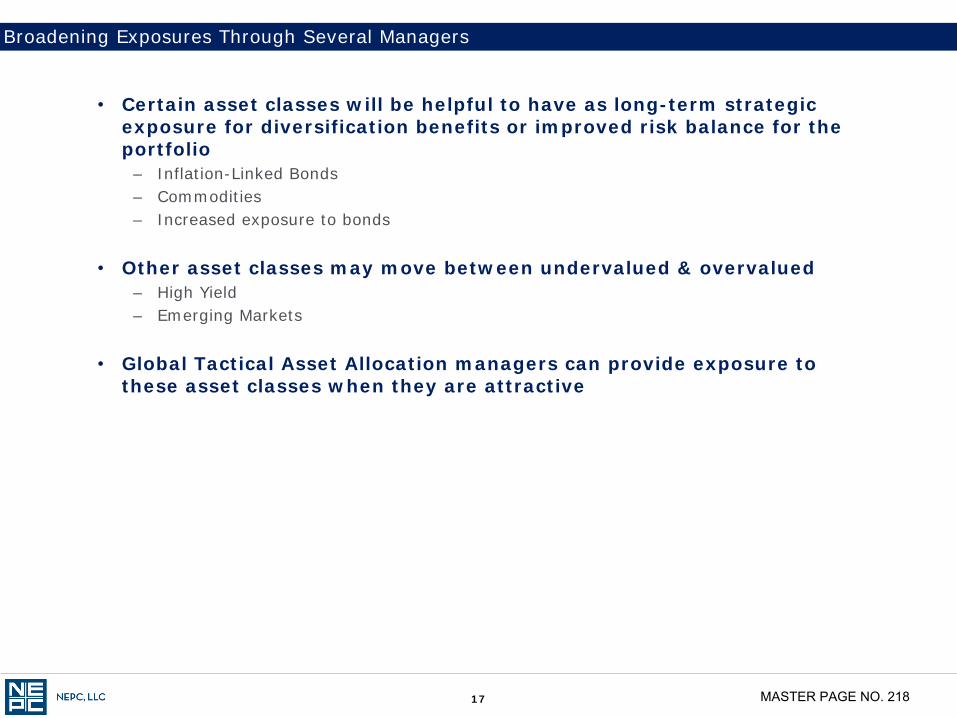
• Certain asset classes will be helpful to have as long-term strategic exposure for diversification benefits or improved risk balance for the portfolio
– Inflation-Linked Bonds – Commodities – Increased exposure to bonds
• Other asset classes may move between undervalued & overvalued
– High Yield – Emerging Markets
• Global Tactical Asset Allocation managers can provide exposure to
these asset classes when they are attractive
Broadening Exposures Through Several Managers
17 MASTER PAGE NO. 218

• Many global managers have benchmarks of approximately 60% equity
– Volatility will be largely driven by equity returns • Majority of risk budget allocated to equities
– Exposures will be more diversified and tactical • Some will be more global (also most liquid – only trading in developed markets) • Others be more focused (emerging markets, niche strategies, etc.) • Others will have a strategic tilt (more value oriented)
• Conservative/Real Return focused strategies are often the least volatile
– More fixed income focused – Provide a hedge against inflation (and nice portfolio diversification) – Will provide exposure to markets potentially not accessed in other parts of the
portfolio • TIPS • Commodities
• Choosing a preferred manager in each of these strategies produces a well diversified and broad GTAA program
Building an Appropriate GTAA Manager Team
18 MASTER PAGE NO. 219

Risk can be reduced with a mix of GAA Managers (Five years ending 9/30/14)
19
0%
2%
4%
6%
8%
10%
12%
0% 2% 4% 6% 8% 10% 12%
FPL Blend
Simulated 3 Team Blend
60/40
MASTER PAGE NO. 220

The Difference Between Global Macro & GTAA Products
20
Global Tactical Asset Allocation Global Macro
Fees Traditional, i.e. no incentive fee Alternative, i.e. includes an incentive fee
Portfolio Construction Portfolio is constructed of many dozens of independent positions
Portfolio is constructed of many dozen positions that fit into 4 – 7 main themes
Risk Management Focused on concentration limits and total notional leverage
Risk Management is focused on not loosing money, (Concentration Limits, VaR Analysis, Stress Tests, Scenario Analysis, and Stop Losses),
and is independent of total notional leverage
Trade Sizing Trades are sized by conviction as a % of total NAV
Trades are sized by what they bring to the portfolio and by the specific downside risk of the individual trade as a % of a risk limit
Use of Non-Fundamental Indicators Like Top-down Momentum Signals
Do not focus on fund flows, market sentiment, or technical indicators
May consider fund flows, market sentiment, an/or technical indicators
Strategy Research & Opportunity Identification
Supply & Demand Top Down Fundamental Focus where the market is going to move
Combination of both technical and fundamental uses to attempt to identify where risk is mispriced in the market
Trade Structure Straightforward Complex - Trades within the portfolio are structured to create asymmetric payouts
Added Value Created through selecting which market beta with which to be exposed in place of cash
Created through capturing trending markets, risk management, and by the asymmetric trade structures both long and short
Upside / Downside Ratio Low High
Long Term Beta High Low
Dynamic Investment Horizon No Yes
Relative Value Spread Trades No Yes
Wide Range of Return Drivers No Yes
MASTER PAGE NO. 221

• GAA strategies can have an important role in client’s portfolios
• NEPC has long recommended GAA managers – 235 clients have exposure – Have had formal recommended list with nine managers for the last five years
• Less constraints on GAA managers can lead to improved performance
through manager skill – Rotating in and out of strategies as they become attractive/overpriced – Allocating to asset classes with best expected risk-adjusted returns – Freedom to quickly implement opportunistic trades
• Allocation to a team of GAA managers has less exposure to prolonged
equity market drawdowns (reduce dependence on equity for returns) – NEPC generally recommends implementing with 2-3 managers.
• Allocation to GAA program provides total portfolio with broader
diversification – Higher exposure to less risky and under-utilized asset classes – Less liquid markets or niche strategies – Under-exposed risks (inflation protection)
Global Asset Allocation: Final Thoughts
21 MASTER PAGE NO. 222

Asset Allocation Comparison
*Became NEPC Client in 1Q 2013
City of
Fresno* SBCERA ASRS OCERS AZPSPRS NMERB VCERA OK Tobacco
U.S. Equity 27 13 35 15 16 22 30 25 Non-U.S. Equity 25 15 23 15 14 15 14 15 Global Equity - - - 5 - - 10 - Total Equity 52 28 58 35 30 37 54 40 Domestic Fixed Income 19 2 19 10 5 7 19 28 Credit/Private Debt 6 24 3 10 13 20 - 8 High Yield 6 - - - - - - 7 Global Bonds - 1 - 2 - - 5 - Emerging Market Debt - 6 4 3 3 2 - - TIPS - - - - - - - - Total Fixed Income 31 33 26 25 21 29 24 43 Real Estate 6 9 6 10 10 2 7 8 REITs 4 - - - - 3 - - Private Equity - 16 7 6 10 8 5 - Absolute Return/Low Vol Equity - 7 - 7 4 3 - - Total Alternatives 10 32 13 23 27 16 12 8
GTAA/Risk Parity 7 - - 7 14 10 6 9 Real Assets/Commodities - 5 4 10 8 7 4 - Cash - 2 - - 2 1 - - Total Other 7 7 4 17 24 18 10 9 Total 100 100 100 100 100 100 100 100 As of Sept. 30, 2014:
Total Assets ($ Millions) 2,464 8,056 34,058 11,789 8,024 11,180 4,328 943
22 MASTER PAGE NO. 223

Current and Proposed Asset Allocation Mixes
23
Current Target
Mix A Mix B
Large Cap Equities 27% 25% 23%Small/Mid Cap Equities 3% 3% 3%Int'l Equities (Unhedged) 12% 12% 10%Emerging Int'l Equities 2% 4% 2%Global Equity 10% 8% 8%Total Equity 54% 52% 46%Core Bonds 12% 9% 9%Global Bonds (Unhedged) 5% 2% 2%Absolute Return Fixed Income 7% 7% 9%US Credit 0% 2% 2%Total Fixed Income 24% 20% 22%Private Equity 5% 6% 6%Real Estate (Core) 7% 8% 8%Total Alternatives 12% 14% 14%Global Asset Allocation 0% 0% 6%Risk Parity 6% 8% 6%MLPs 4% 6% 6%Total Other 10% 14% 18%
Expected Return 5-7 Years 6.3% 6.7% 6.5%Expected Return 30 Year 7.6% 7.9% 7.7%Standard Dev of Asset Return 12.4% 12.9% 12.3%Probability of 5-7 Yr over 7.75% 39.8% 42.9% 41.0%Sortino Ratio MAR @ 0% 0.62 0.63 0.64Sharpe Ratio 0.39 0.40 0.41
MASTER PAGE NO. 224

December 15, 2014 Board of Retirement Ventura County Employees’ Retirement Association 1190 South Victoria Avenue, Suite 200 Ventura, CA 93003 SUBJECT: PANTHEON GLOBAL SECONDARY FUND V Dear Board Members: On November 17, 2014, VCERA approved a commitment of $50 million to Pantheon’s Global Secondary Fund V (Fund). VCERA recently received the Fund’s investment documents and is seeking your Board’s direction, or preference, for accomplishing the necessary legal review. In the past, VCERA has utilized several capable firms to accomplish the work including Foley & Lardner, Reed Smith and Manatt, Phelps and Phillips. If the Board has a preference for a firm to utilize, then a motion to select a firm may be made. Alternatively, the Board may direct staff to make the selection in order to move forward with VCERA’s commitment. VCERA staff will be pleased to respond to any questions you may have on this matter at the December 15, 2014 business meeting. Sincerely,
Tim Thonis Interim Retirement Administrator
MASTER PAGE NO. 225

Ventura County Employees’ Retirement Association Governmental Accounting Standards (GAS) 67 Actuarial Valuation as of June 30, 2014
This report has been prepared at the request of the Board of Retirement to assist in administering the Fund. This valuation report may not otherwise be copied or reproduced in any form without the consent of the Board of Retirement and may only be provided to other parties in its entirety. The measurements shown in this actuarial valuation may not be applicable for other purposes.
Copyright © 2014 by The Segal Group, Inc. All rights reserved.
MASTER PAGE NO. 226

100 Montgomery Street Suite 500 San Francisco, CA 94104-4308 T 415.263.8200 www.segalco.com December 8, 2014 Board of Retirement Ventura County Employees’ Retirement Association 1190 S. Victoria Avenue, Suite 200 Ventura, CA 93003-6572 Dear Board Members: We are pleased to submit this Governmental Accounting Standards (GAS) 67 Actuarial Valuation as of June 30, 2014. It contains various information that will need to be disclosed in order to comply with GAS 67. This report was prepared in accordance with generally accepted actuarial principles and practices at the request of the Board to assist in administering the Plan. The census and financial information on which our calculations were based was provided by the Retirement Association. That assistance is gratefully acknowledged. The measurements shown in this actuarial valuation may not be applicable for other purposes. Future actuarial measurements may differ significantly from the current measurements presented in this report due to such factors as the following: plan experience differing from that anticipated by the economic or demographic assumptions; changes in economic or demographic assumptions; increases or decreases expected as part of the natural operation of the methodology used for these measurements (such as the end of an amortization period); and changes in plan provisions or applicable law. The actuarial calculations were completed under the supervision of John Monroe, ASA, MAAA, Enrolled Actuary. We are members of the American Academy of Actuaries and we meet the Qualification Standards of the American Academy of Actuaries to render the actuarial opinion herein. To the best of our knowledge, the information supplied in the actuarial valuation is complete and accurate. Further, in our opinion, the assumptions as approved by the Board are reasonably related to the experience of and expectations for the Plan. We look forward to reviewing this report with you and to answering any questions. Sincerely,
Segal Consulting, a Member of The Segal Group, Inc. By:
Paul Angelo, FSA, EA, MAAA, FCA John Monroe, ASA, EA, MAAA Senior Vice President and Actuary Vice President and Actuary
/bqb 5200550.V22/5325.001
MASTER PAGE NO. 227
SECTION 1 SECTION 2 SECTION 3
VALUATION SUMMARY GASB 67 INFORMATION AICPA SCHEDULES
Purpose .......................................... i
Significant Issues in Valuation Year.......................................... i
Summary of Key Valuation Results Results ..................................... ii
EXHIBIT 1 General Information – “Financial
Statements”, Note Disclosures and Required Supplementary Information for a Cost-Sharing Pension Plan ............................ 1
EXHIBIT 2 Net Pension Liability .................... 4
EXHIBIT 3 Schedules of Changes in
Net Pension Liability – Last Two Fiscal Years ............. 6
EXHIBIT 4 Schedule of VCERA’s
Contributions – Last Ten Fiscal Years ............................. 8
EXHIBIT 5 Projection of Pension Plan’s
Fiduciary Net Position for Use in Calculation of Discount Rate as of June 30, 2014 ....... 10
EXHIBIT A Schedule of Employer
Allocations as of June 30, 2014 ........................ 12
EXHIBIT B Schedule of Pension Amounts
by Employer as of June 30, 2014 ........................ 13
MASTER PAGE NO. 228

SECTION 1: Valuation Summary for the Ventura County Employees’ Retirement Association
i
Purpose This report has been prepared by Segal Consulting to present certain disclosure information required by Governmental Accounting Standards (GAS) 67 as of June 30, 2014. This valuation is based on:
The benefit provisions of the Retirement Association, as administered by the Board;
The characteristics of covered active members, terminated vested members, and retired members and beneficiaries as of June 30, 2013, provided by the Retirement Office;
The assets of the Plan as of June 30, 2014, provided by the Retirement Office;
Economic assumptions regarding future salary increases and investment earnings; and
Other actuarial assumptions, regarding employee terminations, retirement, death, etc.
Significant Issues in Valuation Year The following key findings were the result of this actuarial valuation: The Governmental Accounting Standards Board (GASB) approved two new Statements affecting the reporting of
pension liabilities for accounting purposes. Statement 67 replaces Statement 25 and is for plan reporting. Statement 68 replaces Statement 27 and is for employer reporting. Statement 67 is effective with the fiscal year ending June 30, 2014 for Plan reporting and Statement 68 is effective with the fiscal year ending June 30, 2015 for employer reporting. The information contained in this valuation is intended to be used (along with other information) in order to comply with Statement 67.
It is important to note that the new GASB rules only redefine pension liability and expense for financial reporting purposes, and do not apply to contribution amounts for pension funding purposes. Employers and plans can still develop and adopt funding policies under current practices.
When measuring pension liability GASB uses the same actuarial cost method (Entry Age method) and the same type of discount rate (expected return on assets) as VCERA uses for funding. This means that the Total Pension Liability (TPL) measure for financial reporting shown in this report is determined on generally the same basis as VCERA’s Actuarial Accrued Liability (AAL) measure for funding. We note that the same is generally true for the Normal Cost component of the annual plan cost for funding and financial reporting.
MASTER PAGE NO. 229

SECTION 1: Valuation Summary for the Ventura County Employees’ Retirement Association
ii
The TPL and the Plan’s Fiduciary Net Position include liabilities and assets held for the Supplemental Medical ($27.50) Reserve. The TPL only includes a liability up to the amount in the Supplemental Medical ($27.50) Reserve. This is because we understand that the Supplemental Medical ($27.50) benefit is a nonvested benefit and once the reserve is depleted no further benefits would need to be paid.
The Net Pension Liability (NPL) is equal to the difference between the TPL and the Plan’s Fiduciary Net Position. The Plan’s Fiduciary Net Position is equal to the market value of assets and therefore, the NPL measure is very similar to an Unfunded Actuarial Accrued Liability (UAAL) on a market value basis. The NPL decreased from $995 million as of June 30, 2013 to $553 million as of June 30, 2014 due to the approximately 18% return on the market value of assets during 2013/2014 that exceeded the assumed return of 7.75%. Changes in these values during the last two fiscal years ending June 30, 2013 and June 30, 2014 can be found in Exhibit 3 of Section 2.
The net pension liability was measured as of June 30, 2014 and 2013. Plan fiduciary net position (plan assets) was valued as of the measurement date while the total pension liability was determined based upon rolling forward the total pension liability from actuarial valuations as of June 30, 2013 and 2012, respectively.
The discount rates used to determine the TPL and NPL as of June 30, 2014 and 2013 were 7.75% and 7.75%, respectively, following the same assumptions used by the Association in the funding valuations as of June 30, 2013 and June 30, 2012. The detailed derivation of the discount rate of 7.75% used in the calculation of the TPL and NPL as of June 30, 2014 can be found in Exhibit 5 of Section 2.
Various other information that is required to be disclosed can be found throughout Exhibits 1 through 4 in Section 2.
Section 3 contains two schedules that the American Institue of Certified Public Accountants (AICPA) recommends be prepared by cost sharing pension plans. These two schedules contain summary information related to GASB 68 and are based on many of the results shown earlier in this report. The first schedule shows the method used for allocating the NPL along with the NPL amounts allocated amongst all of the employers in VCERA. The second schedule is a summary that shows the allocated NPL, deferred outflows and inflows of resources and pension expense by employer. Further information regarding GASB 68 including additional information that employers will need to disclose will be provided in a separate report that is anticipated to be completed during the first quarter of 2015.
MASTER PAGE NO. 230

SECTION 1: Valuation Summary for the Ventura County Employees’ Retirement Association
iii
Summary of Key Valuation Results
2014 2013 Disclosure elements for fiscal year ending June 30:
Service cost $122,896,442 $118,839,073 Total pension liability 4,828,039,882 4,622,116,813 Plan fiduciary net position 4,274,885,864 3,627,505,467 Net pension liability 553,154,018 994,611,346
Schedule of contributions for fiscal year ending June 30: Actuarially determined contributions $161,247,000 $142,370,000 Actual contributions $161,247,000 $142,370,000 Contribution deficiency (excess) 0 0
Demographic data for plan year ending June 30: Number of retired members and beneficiaries 6,121 5,888 Number of vested terminated members(1) 2,339 2,249 Number of active members 8,210 8,068
Key assumptions: Investment rate of return 7.75% 7.75% Inflation rate 3.25% 3.25% Projected salary increases(2) 4.50% - 12.50%, varying by
service, including inflation 4.50% - 12.50%, varying by
service, including inflation (1)
Includes terminated members with member contributions on deposit. (2) Includes inflation at 3.25% plus real across-the-board salary increase of 0.75% plus merit and promotional increases.
MASTER PAGE NO. 231

SECTION 2: GASB 67 Information for Ventura County Employees’ Retirement Association
1
EXHIBIT 1 General Information – “Financial Statements”, Note Disclosures and Required Supplementary Information for a Cost-Sharing Pension Plan
Plan Description
Plan administration. The Ventura County Employees’ Retirement Association (VCERA) was established by the County of Ventura in 1947. VCERA is administered by the Board of Retirement and governed by the County Employees’ Retirement Law of 1937 (California Government Code Section 31450 et. seq.) and the California Public Employees’ Pension Reform Act of 2013 or “PEPRA” (California Government Code Section 7522 et. seq.). VCERA is a cost-sharing multiple employer public employee retirement system whose main function is to provide service retirement, disability, death and survivor benefits to the safety and general members employed by the County of Ventura. VCERA also provides retirement benefits to the employee members of the Ventura County Courts, Air Pollution Control District, and the Ventura Regional Sanitation District.
The management of VCERA is vested with the VCERA Board of Retirement. The Board consists of nine members and two alternates. The County Treasurer is a member of the Board of Retirement by law. Four members are appointed by the Board of Supervisors, one of whom may be a County Supervisor. Two members are elected by the general membership; one member and one alternate are elected by the safety membership, one member and one alternate are elected by the retired members of the Association. All members of the Board of Retirement serve terms of three years except for the County Treasurer whose term runs concurrent with his term as County Treasurer.
Plan membership. At June 30, 2014, pension plan membership consisted of the following:
Retired members or beneficiaries currently receiving benefits 6,121 Vested terminated members entitled to but not yet receiving benefits(1) 2,339 Active members 8,210 Total 16,670
(1) Includes terminated members with member contributions on deposit.
Benefits provided. VCERA provides service retirement, disability, death and survivor benefits to eligible employees. All permanent employees of the County of Ventura or contracting district who work a regular schedule of 64 or more hours per bi-weekly pay period become members of VCERA upon appointment. There are separate retirement plans for safety and general member employees. Safety membership is extended to those involved in active law enforcement, fire suppression, and
MASTER PAGE NO. 232

SECTION 2: GASB 67 Information for Ventura County Employees’ Retirement Association
2
probation. Any new Safety Member who becomes a member on or after January 1, 2013 is designated PEPRA Safety. All other employees are classified as general members. There are four tiers applicable to general members. Those hired prior to June 30, 1979, and certain management personnel who entered service prior to October 16, 2001, are included in Tier 1. Those hired after that date are included in Tier 2. New Members employed after January 1, 2013 are designated as PEPRA Tier 1 or 2.
General members prior to January 1, 2013, are eligible to retire once they attain the age of 70 regardless of service or at age 50 and have acquired 10 or more years of retirement service credit. A member with 30 years of service is eligible to retire regardless of age. General members who are first hired on or after January 1, 2013, are eligible to retire once they have attained the age of 70 regardless of service or at age 52, and have acquired five or more years of retirement service credit.
Safety members prior to January 1, 2013, are eligible to retire once they attain the age of 70 regardless of service or at age 50 and have acquired 10 or more years of retirement service credit. A member with 20 years of service is eligible to retire regardless of age. Safety members who are first hired on or after January 1, 2013, are eligible to retire once they have attained the age of 70 regardless of service or at age 50, and have acquired five or more years of retirement service credit.
The retirement benefit the member will receive is based upon age at retirement, final average compensation, years of retirement service credit and retirement plan and tier.
General member benefits for Tier 1 and Tier 2 are calculated pursuant to the provisions of sections 31676.11 and 31676.1, respectively. The monthly allowance is equal to 1/90th of the first $350 of final compensation, plus 1/60th of the excess final compensation times years of accrued retirement service credit times age factor from either section 31676.11 (Tier 1) or 31676.1 (Tier 2). General member benefits for those who are first hired on or after January 1, 2013, are calculated pursuant to the provision California Government Code Section 7522.25(d). The monthly allowance is equal to the final compensation multiplied by years of accrued retirement credit multiplied by the age factor from section 7522.20(a).
Safety member benefits are calculated pursuant to the provisions of California Government Code Section 31664. The monthly allowance is equal to 1/50th of final compensation times years of accrued retirement service credit times age factor from Section 31664. For those Safety member benefits first hired on or after January 1, 2013, are calculated pursuant to the provision California Government Code Section 7522.25(d). The monthly allowance is equal to the final compensation multiplied by years of accrued retirement credit multiplied by the age factor from section 7522.25(d).
For members with membership dates before January 1, 2013, the maximum monthly retirement allowance is 100% of final compensation. There is no final compensation limit on the maximum retirement benefit for members with membership dates on or after January 1, 2013.
MASTER PAGE NO. 233

SECTION 2: GASB 67 Information for Ventura County Employees’ Retirement Association
3
The maximum amount of compensation earnable that can be taken into account for 2014 for members with membership dates on or after July 1, 1996 but before January 1, 2013 is $260,000. For members with membership dates on or after January 1, 2013 the maximum amount of pensionable compensation that can be taken into account for 2014 is equal to $115,064 for those enrolled in Social Security ($138,077 for those not enrolled in Social Security). These limits are adjusted on an annual basis. Members are exempt from paying member conributions and employers are exempt from paying employer contributions on compensation in excess of the annual cap.
Final average compensation consists of the highest 12 consecutive months for a Safety or Tier 1 General member and the highest 36 consecutive months for a Tier 2, PEPRA Tier 1 and 2, General and PEPRA Safety member.
The member may elect an unmodified retirement allowance, or choose an optional retirement allowance. The unmodified retirement allowance provides the highest monthly benefit and a 60% continuance to an eligible surviving spouse. An eligible surviving spouse is one married to the member at least two years prior to the date of death and has attained age 55 on or prior to the date of death. There are four optional retirement allowances the member may choose. Each of the optional retirement allowances requires a reduction in the unmodified retirement allowance in order to allow the member the ability to provide certain benefits to a surviving spouse or named beneficiary having an insurable interest in the life of the member.
VCERA provides an annual cost-of-living benefit to Safety and Tier 1 General member retirees. The cost-of-living adjustment, based upon the Consumer Price Index for the Los Angeles, Riverside, Orange County area, is capped at 3.0%. Certain Tier 2 general member retirees receive a fixed 2% cost-of-living adjustment pursuant to collective bargaining agreements.
The County of Ventura and contracting districts contribute to the retirement plan based upon actuarially determined contribution rates adopted by the Board of Retirement. Employer contribution rates are adopted annually based upon recommendations received from VCERA’s actuary after the completion of the annual actuarial valuation. The average employer contribution rate as of June 30, 2014 for 2013-2014 (based on the June 30, 2012 valuation) was 26.63% of compensation.
Members are required to make contributions to VCERA regardless of the retirement plan or tier in which they are included. The average member contribution rate as of June 30, 2014 for 2013-2014 (based on the June 30, 2012 valuation) was 8.53% of compensation.
MASTER PAGE NO. 234

SECTION 2: GASB 67 Information for Ventura County Employees’ Retirement Association
4
EXHIBIT 2 Net Pension Liability
The components of the net pension liability are as follows: June 30, 2014 June 30, 2013
Total pension liability $4,828,039,882 $4,622,116,813 Plan fiduciary net position 4,274,885,864 3,627,505,467 Net pension liability $553,154,018 $994,611,346 Plan fiduciary net position as a percentage of the total pension liability 88.54% 78.48%
The net pension liability was measured as of June 30, 2014 and 2013. Plan fiduciary net position (plan assets) was valued as of the measurement date while the total pension liability was determined based upon rolling forward the total pension liability from actuarial valuations as of June 30, 2013 and 2012, respectively.
Plan provisions. The plan provisions used in the measurement of the net pension liability are the same as those used in the VCERA actuarial valuation as of June 30, 2013. The TPL and the Plan’s Fiduciary Net Position include liabilities and assets held for the Supplemental Medical ($27.50) Reserve.
Actuarial assumptions and methods. The total pension liabilities as of June 30, 2014 and June 30, 2013 were determined by actuarial valuations as of June 30, 2013 and June 30, 2012, respectively. The actuarial assumptions used were based on the results of an experience study for the period July 1, 2008 through June 30, 2011. They are the same as the assumptions used in the June 30, 2013 funding actuarial valuation for VCERA and will be used in the June 30, 2014 funding actuarial valuation. The assumptions used in the funding valuations are outlined on page 9 of this report. The only exception is that for GAS 67 purposes, the investment return assumption used is net of investment expenses only and is not net of administrative expenses. In particular, the following actuarial assumptions were applied to all periods included in the measurement:
Inflation 3.25% Salary increases 4.50% to 12.50%, varying by service, including inflation Investment rate of return 7.75%, net of pension plan investment expense, including inflation Other assumptions Same as those that will be used in June 30, 2014 funding valuation
MASTER PAGE NO. 235

SECTION 2: GASB 67 Information for Ventura County Employees’ Retirement Association
5
The Entry Age Actuarial Cost Method used in VCERA’s annual actuarial valuation has also been applied in measuring the Service Cost and TPL with one exception. For purposes of measuring the Service Cost and TPL, we have reflected the same plan provisions used in determining the member’s Actuarial Present Value of Projected Benefits. This is different from the version of this method applied in VCERA’s annual funding valuation, where the Normal Cost and Actuarial Accrued Liability are determined as if the current benefit accrual rate had always been in effect.
The long-term expected rate of return on pension plan investments was determined in 2012 using a building-block method in which expected future real rates of return (expected returns, net of pension plan investment expense and inflation) are developed for each major asset class. This information is combined to produce the long-term expected rate of return by weighting the expected future real rates of return by the target asset allocation percentage and by adding expected inflation. The target allocation and projected arithmetic real rates of return for each major asset class, after deducting inflation, but before investment expenses, used in the derivation of the long-term expected investment rate of return assumption are summarized in the following table:
Asset Class Target
Allocation
Long-Term Expected Real Rate of Return
Domestic equity 39.00% 6.22% International equity 21.00% 6.78% Core Bonds 16.25% 1.06% Global Bonds 5.00% 1.45% Real Estate 10.00% 5.05% Credit Strategies 3.75% 4.18% Private Equity 5.00% 11.08% Total 100.00%
Discount rate: The discount rate used to measure the total pension liability was 7.75% as of both June 30, 2014 and June 30, 2013. The projection of cash flows used to determine the discount rate assumed plan member contributions will be made at the current contribution rate and that employer contributions will be made at rates equal to the actuarially determined contribution rates. For this purpose, only employee and employer contributions that are intended to fund benefits for current plan members and their beneficiaries are included. Projected employer contributions that are intended to fund the service costs for future plan members and their beneficiaries, as well as projected contributions from future plan members, are not included. Based on those
MASTER PAGE NO. 236
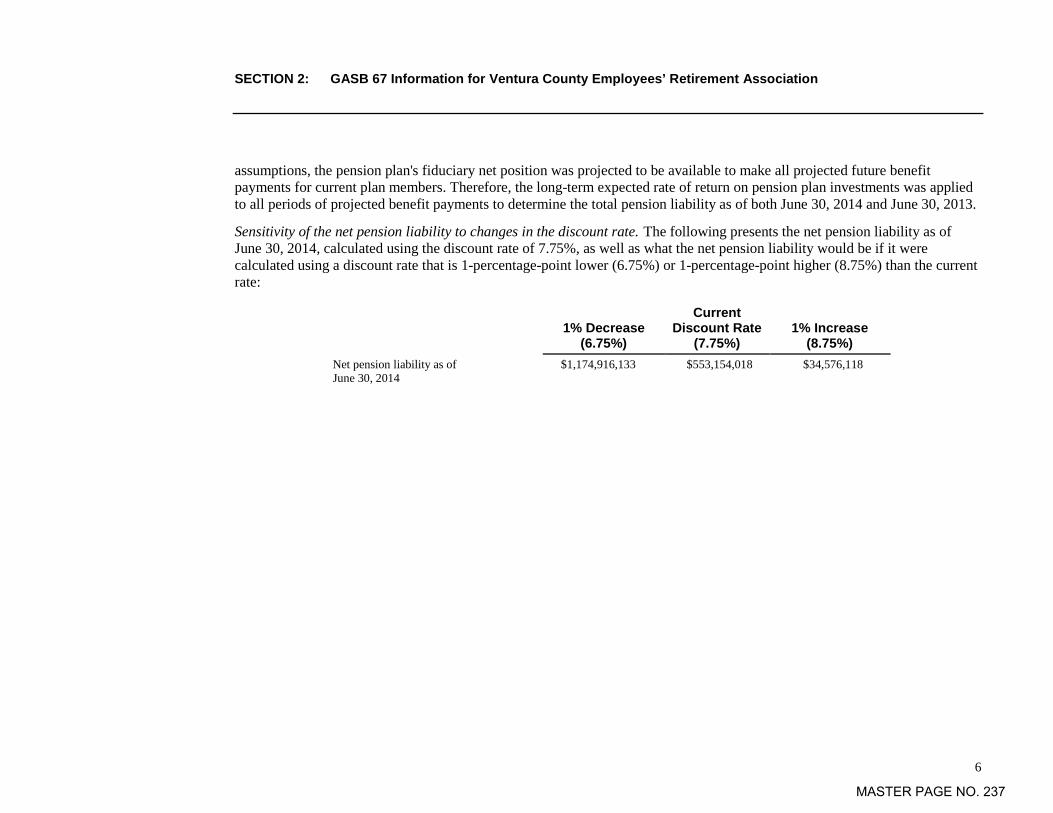
SECTION 2: GASB 67 Information for Ventura County Employees’ Retirement Association
6
assumptions, the pension plan's fiduciary net position was projected to be available to make all projected future benefit payments for current plan members. Therefore, the long-term expected rate of return on pension plan investments was applied to all periods of projected benefit payments to determine the total pension liability as of both June 30, 2014 and June 30, 2013.
Sensitivity of the net pension liability to changes in the discount rate. The following presents the net pension liability as of June 30, 2014, calculated using the discount rate of 7.75%, as well as what the net pension liability would be if it were calculated using a discount rate that is 1-percentage-point lower (6.75%) or 1-percentage-point higher (8.75%) than the current rate:
1% Decrease
(6.75%)
Current Discount Rate
(7.75%) 1% Increase
(8.75%) Net pension liability as of June 30, 2014
$1,174,916,133 $553,154,018 $34,576,118
MASTER PAGE NO. 237
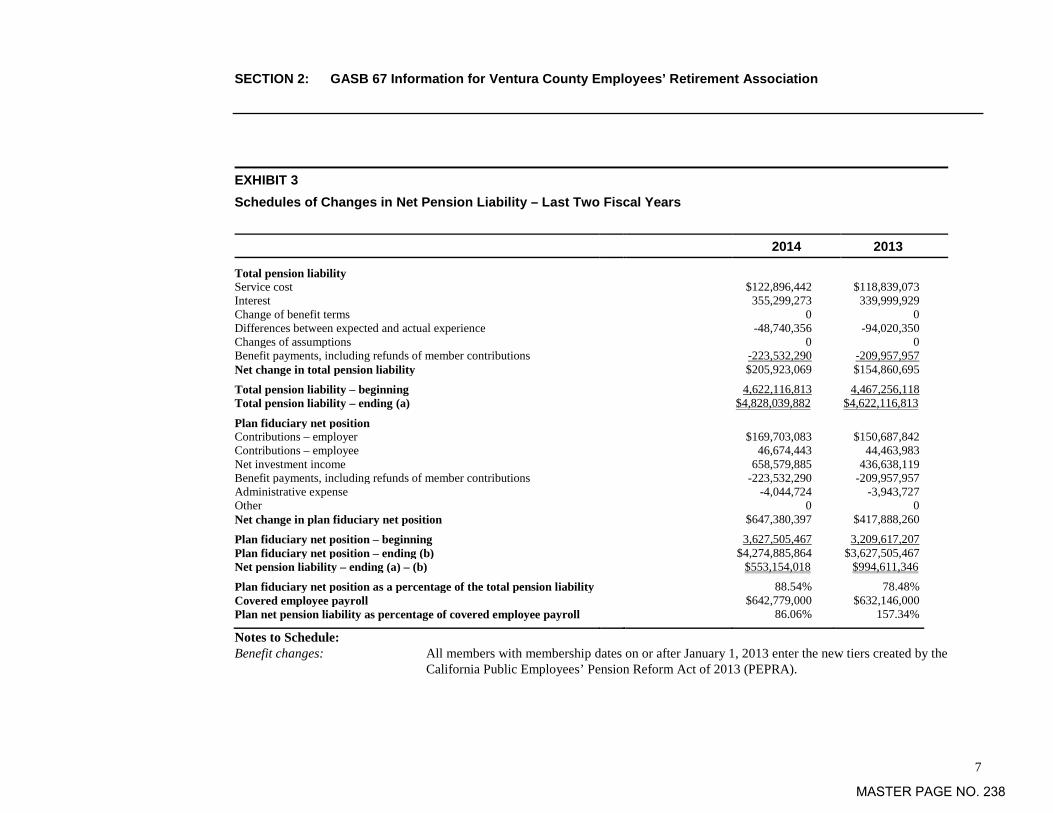
SECTION 2: GASB 67 Information for Ventura County Employees’ Retirement Association
7
EXHIBIT 3 Schedules of Changes in Net Pension Liability – Last Two Fiscal Years
2014 2013
Total pension liability
Service cost $122,896,442 $118,839,073 Interest 355,299,273 339,999,929 Change of benefit terms 0 0 Differences between expected and actual experience -48,740,356 -94,020,350 Changes of assumptions 0 0 Benefit payments, including refunds of member contributions -223,532,290 -209,957,957 Net change in total pension liability $205,923,069 $154,860,695
Total pension liability – beginning 4,622,116,813 4,467,256,118 Total pension liability – ending (a) $4,828,039,882 $4,622,116,813
Plan fiduciary net position Contributions – employer $169,703,083 $150,687,842 Contributions – employee 46,674,443 44,463,983 Net investment income 658,579,885 436,638,119 Benefit payments, including refunds of member contributions -223,532,290 -209,957,957 Administrative expense -4,044,724 -3,943,727 Other 0 0 Net change in plan fiduciary net position $647,380,397 $417,888,260
Plan fiduciary net position – beginning 3,627,505,467 3,209,617,207 Plan fiduciary net position – ending (b) $4,274,885,864 $3,627,505,467 Net pension liability – ending (a) – (b) $553,154,018 $994,611,346
Plan fiduciary net position as a percentage of the total pension liability 88.54% 78.48% Covered employee payroll $642,779,000 $632,146,000 Plan net pension liability as percentage of covered employee payroll 86.06% 157.34%
Notes to Schedule: Benefit changes: All members with membership dates on or after January 1, 2013 enter the new tiers created by the
California Public Employees’ Pension Reform Act of 2013 (PEPRA).
MASTER PAGE NO. 238

SECTION 2: GASB 67 Information for Ventura County Employees’ Retirement Association
8
EXHIBIT 4 Schedule of VCERA’s Contributions – Last Ten Fiscal Years
Year Ended June 30
Actuarially Determined
Contributions(1)
Contributions in Relation to the
Actuarially Determined
Contributions(1) Contribution
Deficiency (Excess) Covered-Employee
Payroll
Contributions as a Percentage of
Covered Employee Payroll
2005 $51,792,000 $51,792,000 $0 $475,935,000 10.88% 2006 74,373,000 74,373,000 0 478,053,000 15.56% 2007 86,455,000 86,455,000 0 519,145,000 16.65% 2008 104,429,000 104,429,000 0 551,968,000 18.92% 2009 105,278,000 105,278,000 0 599,173,000 17.57% 2010 97,324,000 97,324,000 0 634,777,000 15.33% 2011 111,585,000 111,585,000 0 654,829,000 17.04% 2012 132,386,000 132,386,000 0 637,037,000 20.78% 2013 142,370,000 142,370,000 0 632,146,000 22.52% 2014 161,247,000 161,247,000 0 642,779,000 25.09%
(1) Actuarially determined contributions exclude employer paid member contributions.
See accompanying notes to this schedule on next page.
MASTER PAGE NO. 239

SECTION 2: GASB 67 Information for Ventura County Employees’ Retirement Association
9
Notes to Exhibit 4
Methods and assumptions used to establish “actuarially determined contribution” rates:
Valuation date Actuarially determined contribution rates are calculated as of June 30, two years prior to the end of the fiscal year in which contributions are reported
Actuarial cost method Entry Age Actuarial Cost Method Amortization method Level percent of payroll (4.00% payroll growth assumed) Remaining amortization period 15 years for UAAL as of June 30, 2004. Any changes in UAAL after June 30, 2004 are
separately amortized over a 15-year closed period effective with that valuation. Effective June 30, 2012, any changes in UAAL due to actuarial gains or losses or due to plan amendments (with the exception of a change due to retirement incentives) will be amortized over a 15-year closed period effective with that valuation (up to a 5-year closed period for retirement incentives). Any change in UAAL due to changes in actuarial assumptions or methods will be amortized over a 20-year closed period effective with that valuation.
Asset valuation method Market value of assets less unrecognized returns in each of the last ten semi-annual accounting periods. Unrecognized returns are equal to the difference between the actual market return and the expected return on market value and are recognized over a five-year period. The Actuarial Value of Assets is reduced by the value of the supplemental medical benefit reserve and statutory contingency reserve. Deferred gains and losses as of June 30, 2011 have been combined and will be recognized in equal amounts over a period of four and a half years from that date.
Actuarial assumptions: Investment rate of return 7.75%, net of pension plan administration and investment expenses, including inflation Inflation rate 3.25% Real across-the-board salary increase 0.75% Projected salary increases* 4.50% - 12.50%, varying by service, including inflation Cost of living adjustments For General Tier 1 and Safety, 3% (actual increases are contingent upon CPI increases with a
3.00% maximum). For General Tier 2, SEIU members receive a fixed 2% cost-of-living adjustment not subject to CPI increases that applies to future service after March 2003.
Other Assumptions: Same as those used in the June 30, 2013 funding actuarial valuation and will be used in the June 30, 2014 funding actuarial valuation.
* Includes inflation at 3.25% plus real across-the-board salary increase of 0.75% plus merit and promotional increases.
MASTER PAGE NO. 240

SECTION 2: GASB 67 Information for Ventura County Employees’ Retirement Association
10
EXHIBIT 5 Projection of Pension Plan’s Fiduciary Net Position for Use in Calculation of Discount Rate as of June 30, 2014
($ in millions)
Projected Beginning Projected Projected Projected Projected Projected EndingYear Plan Fiduciary Total Benefit Administrative Investment Plan Fiduciary
Beginning Net Position Contributions Payments Expenses Earnings Net PositionJuly 1, (a) (b) (c) (d) (e) (f) = (a) + (b) - (c) - (d) + (e)2013 $3,628 $216 $224 $4 $659 $4,2752014 4,275 228 247 5 331 4,5832015 4,583 224 263 5 354 4,8932016 4,893 219 280 5 378 5,2042017 5,204 209 298 6 401 5,5102018 5,510 203 316 6 423 5,8142019 5,814 150 334 6 444 6,0682020 6,068 141 352 7 463 6,3132021 6,313 120 372 7 480 6,5342022 6,534 133 392 7 497 6,765
2038 8,123 27 665 9 607 8,0822039 8,082 23 674 9 603 8,0252040 8,025 20 683 9 598 7,9522041 7,952 17 690 9 592 7,8622042 7,862 14 695 9 585 7,758
2087 12,545 0 16 14 971 13,4862088 13,486 0 13 15 1,044 14,5032089 14,503 0 10 16 1,123 15,6002090 15,600 0 7 17 1,208 16,7832091 16,783 0 6 19 1,300 18,059
2124 190,012 0 0 * 212 14,718 204,5182125 204,518 0 0 228 15,841 220,132
2125 Discounted Value: 48 **
***
Less than $1 M, when rounded.$204,518 million when discounted with interest at the rate of 7.75% per annum has a value of $48 M as of June 30, 2014.
MASTER PAGE NO. 241

SECTION 2: GASB 67 Information for Ventura County Employees’ Retirement Association
11
EXHIBIT 5 Projection of Pension Plan’s Fiduciary Net Position for Use in Calculation of Discount Rate as of June 30, 2014
($ in millions) - continued
Notes:(1)(2)(3)(4)
(5)
(6)
(7)
(8)
(9) As illustrated in this Exhibit, the Plan's fiduciary net position was projected to be available to make all projected future benefit payments for current Plan members. In other words, there is no projected "cross-over date" when projected benefits are not covered by projected assets. Therefore, the long-term expected rate of return on Plan investments of 7.75% per annum was applied to all periods of projected benefit payments to determine the total pension liability as of June 30, 2014 shown earlier in this report, pursuant to paragraph 44 of GASB Statement No. 67.
Years 2023-2037, 2043-2086, and 2092-2123 have been omitted from this table.Column (a): Except for the "discounted value" shown for 2125, none of the projected beginning plan fiduciary net position amounts shown have been adjusted for the time value of money.
Column (b): Projected total contributions include employee and employer normal cost rates applied to closed group projected payroll (based on covered active members as of June 30, 2013), plus employer contributions to the unfunded actuarial accrued liability. Contributions are assumed to occur halfway through the year, on average.
Column (c): Projected benefit payments have been determined in accordance with paragraph 39 of GASB Statement No. 67, and are based on the closed group of active, inactive vested, retired members, and beneficiaries as of June 30, 2013. The projected benefit payments reflect the cost of living increase assumptions used in June 30, 2013 valuation report and include projected benefits associated with the Supplemental Medical ($27.50) Reserve.
Column (d): Projected administrative expenses are calculated as approximately 0.11% of the projected beginning plan fiduciary net position amount. The 0.11% portion was based on the actual fiscal year 2013/2014 administrative expenses (unaudited) as a percentage of the actual beginning plan fiduciary net position as of July 1, 2013. Administrative expenses are assumed to occur halfway through the year, on average.
Column (e): Projected investment earnings are based on the assumed investment rate of return of 7.75% per annum and reflect the actual timing of benefit payments, which are made at the end of each month.
Amounts shown in the year beginning July 1, 2013 row are actual amounts, based on the unaudited financial statements provided by VCERA.Amounts may not total exactly due to rounding.
MASTER PAGE NO. 242

SECTION 3: AICPA Schedules for Ventura County Employees’ Retirement Association
12
EXHIBIT A Schedule of Employer Allocations as of June 30, 2014
Employer ID Employer General Tier 1 and 2 General Tier 1 and 2 % Safety Tier Safety Tier % Total Compensation Total %01 County of Ventura $435,463,038 91.340% $166,030,608 100.000% $601,493,646 93.577%10 Ventura County Courts $32,106,371 6.735% $0 0.000% $32,106,371 4.995%11 Ventura County Air Pollution Control Department $4,421,483 0.927% $0 0.000% $4,421,483 0.688%22 Ventura Regional Sanitation District $4,757,644 0.998% $0 0.000% $4,757,644 0.740%
Total $476,748,535 100.000% $166,030,608 100.000% $642,779,144 100.000%
Employer Allocation Employer ID Employer General Tier 1 and 2 General Tier 1 and 2 % Safety Tier Safety Tier % Total NPL Percentage
01 County of Ventura $230,356,648 91.340% $300,957,654 100.000% $531,314,302 96.052%10 Ventura County Courts 16,984,027 6.735% 0 0.000% 16,984,027 3.070%11 Ventura County Air Pollution Control Department 2,338,931 0.927% 0 0.000% 2,338,931 0.423%22 Ventura Regional Sanitation District 2,516,758 0.998% 0 0.000% 2,516,758 0.455%
Total $252,196,364 100.000% $300,957,654 100.000% $553,154,018 100.000%
Actual Compensation by Employer and TierJuly 1, 2013 to June 30, 2014
Allocation of June 30, 2014 Estimated Net Pension Liability (NPL)
Notes:Actual July 1, 2013 through June 30, 2014 compensation information was provided by VCERA.
The Net Pension Liability (NPL) for each tier is the Total Pension Liability (TPL) minus the Plan Net Position. The Total Pension Liabilty for each tier is obtained from internalvaluation results based on the actual particpants in each tier. The Plan Net Position for each tier was estimated by adjusting each tier's internally tracked valuation value of assets (which is used to determine employer contribution rates by tier) by the ratio of the total VCERA plan net position to total VCERA valuation value of assets.Based on this methodology, any non-valuation reserves (such as the $27.50 Supplemental Medical Benefit) are allocated amongst the tiers based on each tier's valuation value of assets.
The Safety Tier only has one employer (County of Ventura), so all of the NPL for that tier is allocated to the County.
For the two other tiers that have multiple employers, the NPL is allocated based on the actual compensation for each employer in the tier during the period ending on the measurement date within the tier. - Calculate ratio of employer's compensation to the total compensation for the tier. - This ratio is multiplied by the NPL for the tier to determine the employer's proportionate share of the NPL for the tier. - If the employer is in several tiers, the employer's total allocated NPL is the sum of its allocated NPL from each tier. - Proportionate share of total plan NPL is then the ratio of the employer's total allocated NPL to the total NPL of all employers. - In this allocation, General Tier 1 and 2 were treated as one tier (combined) consistent with the determination of the Basic UAAL rate in the actuarial valuation.
MASTER PAGE NO. 243

SECTION 3: AICPA Schedules for Ventura County Employees’ Retirement Association
13
EXHIBIT B Schedule of Pension Amounts by Employer as of June 30, 2014
Deferred Outflows of Resources County of Ventura
Ventura County Courts
Ventura County Air Pollution Control
Department Ventura Regional Sanitation District
Total for All Employers
Differences Between Expected and Actual Experience $0 $0 $0 $0 $0
Net Difference Between Projected and Actual Investment Earnings on Pension Plan Investments 0 0 0 0 0
Changes of Assumptions 0 0 0 0 0 Changes in Proportion and Differences Between
Employer Contributions and Proportionate Share of Contributions 0 431,427 103,022 62,374 596,823
Total Deferred Outflows of Resources $0 $431,427 $103,022 $62,374 $596,823 Deferred Inflows of Resources Differences Between Expected and Actual
Experience $37,932,493 $1,212,553 $166,985 $179,681 $39,491,712 Net Difference Between Projected and Actual
Investment Earnings on Pension Plan Investments 290,370,069 9,281,988 1,278,256 1,375,440 302,305,753 Changes of Assumptions 0 0 0 0 0 Changes in Proportion and Differences Between
Employer Contributions and Proportionate Share of Contributions
596,823 0 0 0
596,823
Total Deferred Inflows of Resources $328,899,385 $10,494,541 $1,445,241 $1,555,121 $342,394,288
Net Pension Liability as of June 30, 2013 $955,341,941 $30,538,522 $4,205,569 $4,525,315 $994,611,346 Net Pension Liability as of June 30, 2014 $531,314,302 $16,984,027 $2,338,931 $2,516,758 $553,154,018
MASTER PAGE NO. 244

SECTION 3: AICPA Schedules for Ventura County Employees’ Retirement Association
14
EXHIBIT B Schedule of Pension Amounts by Employer as of June 30, 2014 (continued)
Pension Expense County of Ventura
Ventura County Courts
Ventura County Air Pollution Control
Department Ventura Regional Sanitation District
Total for All Employers
Proportionate Share of Plan Pension Expense $67,277,762 $2,150,605 $296,168 $318,685 $70,043,220 Net Amortization of Deferred Amounts from
Changes in Proportion and Differences Between Employer Contributions and Proportionate Share of Contributions -139,771 101,037 24,127 14,607 0
Total Employer Pension Expense $67,137,991 $2,251,642 $320,295 $333,292 $70,043,220
Notes:Amounts shown in this exhibit excluding the differences between employer contributions and proportionate share of contributions wereallocated by employer based on the Employer Allocation Percentage calculated in Exhibit A.
In determining the pension expense: - Any differences between projected and actual investment earnings on pension plan investments are recognized over a period of five years beginning with the year in which they occur. - Differences between expected and actual experience and between employer contributions and proportionate share of contributions are recognized over the average of the expected remaining service lives of all employees that are provided with pensions through VCERA determined as of June 30, 2013 (the beginning of the measurement periodn ending June 30, 2014) and is 5.27 years.
The average of the expected remaining service lives of all employees was determined by: - Calculating each active employees' expected remaining service life as the present value of $1 per year of future service at zero percent interest. - Setting the remaining service life to zero for each nonactive or retired members. - Dividing the sum of the above amounts by the total number of active employee, nonactive and retired members.
Only for this initial transition year, the beginning of the year Net Pension Liability as of June 30, 2013 was allocated by using the same Employer Allocation Percentage shown in Exhibit A as of June 30, 2014.
We did not attempt to determine the beginning balances for deferred inflows of resources and deferred outflows of resources as of the beginning of the period for the 2013/14 fiscal year. Per paragraph 137 of GAS 68, these balances are assumed to be zero.
MASTER PAGE NO. 245

December 15, 2014 Board of Retirement Ventura County Employees’ Retirement Association 1190 South Victoria Avenue, Suite 200 Ventura, CA 93003 SUBJECT: DISTRIBUTION OF JUNE 30, 2014 ACTUARIAL VALUATION AND REVIEW Dear Board Members: Recommendation: Accept receipt of the June 30, 2014 Actuarial Valuation and Review (Valuation) and direct staff to provide copies of the Valuation to all employee organizations recognized by the County of Ventura. Discussion: Attached is the June 30, 2014 Valuation that summarizes the actuarial data used, establishes the funding requirements for fiscal year 2015-2016 and analyzes the preceding year’s actuarial experience. As the Board is aware, a settlement agreement in the VCDSA, SEIU, VCPPOA, et al. v. Board of Retirement lawsuit provides that VCERA shall notify all employee organizations recognized by the County of Ventura of its receipt of the Valuation and shall provide a copy of the Valuation to each such organization at least 25 days prior to the Board taking any action. Segal Consulting will be present at the January 26, 2015, business meeting to discuss and answer questions related to the June 30, 2014 Valuation. Please attempt to submit any questions that arise during your review of the Valuation to VCERA staff in advance of the January 26th meeting so that Segal Consulting may be prepared to answer your questions at the meeting. VCERA staff will be pleased to respond to any questions you may have on this matter at the December 15, 2014 business meeting. Sincerely,
Tim Thonis Interim Retirement Administrator
MASTER PAGE NO. 246

Ventura County Employees’ Retirement Association Actuarial Valuation and Review as of June 30, 2014
This report has been prepared at the request of the Board of Retirement to assist in administering the Fund. This valuation report may not otherwise be copied or reproduced in any form without the consent of the Board of Retirement and may only be provided to other parties in its entirety. The measurements shown in this actuarial valuation may not be applicable for other purposes.
Copyright © 2014 by The Segal Group, Inc. All rights reserved.
MASTER PAGE NO. 247

100 MONTGOMERY STREET, SUITE 500 SAN FRANCISCO, CA 94104
T 415.263.8200 F 415.376.1167 www.segalco.com
December 8, 2014
Board of Retirement Ventura County Employees' Retirement Association 1190 S. Victoria Avenue, Suite 200 Ventura, CA 93003-6572
Dear Board Members: We are pleased to submit this Actuarial Valuation and Review as of June 30, 2014. It summarizes the actuarial data used in the valuation, establishes the funding requirements for fiscal 2015-2016 and analyzes the preceding year’s experience. This report was prepared in accordance with generally accepted actuarial principles and practices at the request of the Board to assist in administering the Plan. The census and financial information on which our calculations were based was provided by the Retirement Association. That assistance is gratefully acknowledged. The measurements shown in this actuarial valuation may not be applicable for other purposes. Future actuarial measurements may differ significantly from the current measurements presented in this report due to such factors as the following: plan experience differing from that anticipated by the economic or demographic assumptions; changes in economic or demographic assumptions; increases or decreases expected as part of the natural operation of the methodology used for these measurements (such as the end of an amortization period); and changes in plan provisions or applicable law. The actuarial calculations were completed under the supervision of John Monroe, ASA, MAAA, Enrolled Actuary. We are members of the American Academy of Actuaries and we meet the Qualification Standards of the American Academy of Actuaries to render the actuarial opinion herein. To the best of our knowledge, the information supplied in the actuarial valuation is complete and accurate. Further, in our opinion, the assumptions as approved by the Board are reasonably related to the experience of and the expectations for the Plan. We look forward to reviewing this report at your next meeting and to answering any questions.
Sincerely, Segal Consulting, a Member of The Segal Group, Inc. By: ___________________________________ ____________________________
Paul Angelo, FSA, EA, MAAA, FCA John Monroe, ASA, EA, MAAA Senior Vice President and Actuary Vice President and Actuary
AW/hy
MASTER PAGE NO. 248

VALUATION SUMMARY VALUATION RESULTS SUPPLEMENTAL INFORMATION REPORTING INFORMATION
Purpose and Scope ......................... i Significant Issues in this
Valuation ................................. ii Summary of Key Valuation
Results ..................................... v Summary of Key Valuation
Demographic and Financial Data ....................................... vii
A. Member Data .......................... 1 B. Financial Information.............. 4 C. Actuarial Experience ............... 8 D. Employer And Member
Contributions ........................ 13 E. Information Required by
GASB 27 ............................... 22 F. Volatility Ratios .................... 23
EXHIBIT A Table of Plan Coverage ........................ 24
EXHIBIT B Members in Active Service and Projected Average Compensation as of June 30, 2014 ....................................... 30
EXHIBIT C Reconciliation of Member Data – June 30, 2013 to June 30, 2014 ............ 35
EXHIBIT D Summary Statement of Income and Expenses on an Actuarial Value Basis . 36
EXHIBIT E Summary Statement of Net Assets ....... 37
EXHIBIT F Actuarial Balance Sheet ....................... 38
EXHIBIT G Summary of Allocated Reserves .......... 39
EXHIBIT H Development of Unfunded/(Overfunded) Actuarial Accrued Liability for Year Ended June 30, 2014 ............................ 40
EXHIBIT I Table of Amortization Bases ................ 41
EXHIBIT J Section 415 Limitations ....................... 43
EXHIBIT K Definitions of Pension Terms ............... 44
EXHIBIT I Summary of Actuarial Valuation Results .......................................... 46
EXHIBIT II Supplementary Information Required by GASB 27 – Schedule of Employer Contributions ................ 48
EXHIBIT III Supplementary Information Required by GASB 27 – Schedule of Funding Progress .......................... 49
EXHIBIT IV Supplementary Information Required by GASB 27 .................. 50
EXHIBIT V Actuarial Assumptions and Methods ........................................ 51
EXHIBIT VI Summary of Plan Provisions......... 60
Appendix A Member Contribution Rates for Non-PEPRA Members.................. 67
Appendix B Member Contribution Rates for PEPRA Members .................... 72
Appendix C Employer Contribution Rates Based on 50/50 Sharing of Normal Cost for Non-PEPRA Tiers ....................... 73
Appendix D Member Contribution Rates Based on 50/50 Sharing of Normal Cost for Non-PEPRA Tiers ....................... 75
Appendix E Employer Contribution Rates For Reference Purposes Only - Current and Prior Valuation Under Non-Combined Methodology ............... 76
SECTION 1 SECTION 2 SECTION 3 SECTION 4
MASTER PAGE NO. 249

SECTION 1: Valuation Summary for the Ventura County Employees' Retirement Association
i
PURPOSE AND SCOPE This report has been prepared by Segal Consulting to present a valuation of the Ventura County Employees' Retirement Association as of June 30, 2014. The valuation was performed to determine whether the assets and contributions are sufficient to provide the prescribed benefits. The contribution requirements presented in this report are based on:
The benefit provisions of the Retirement Association, as administered by the Board of Retirement;
The characteristics of covered active members, terminated vested members, and retired members and beneficiaries as of June 30, 2014, provided by the Retirement Office;
The assets of the Plan as of June 30, 2014, provided by the Retirement Office;
Economic assumptions regarding future salary increases and investment earnings; and
Other actuarial assumptions, regarding employee terminations, retirement, death, etc.
One of the general goals of an actuarial valuation is to establish contributions which fully fund the system’s liabilities, and which, as a percentage of payroll, remain as level as possible for each generation of active members. Annual actuarial valuations measure the progress toward this goal, as well as test the adequacy of the contribution rates. In preparing this valuation, we have employed generally accepted actuarial methods and assumptions to evaluate the Association’s assets, liabilities and future contribution requirements. Our calculations are based upon member data and financial information provided to us by the Association’s staff. This information has not been audited by us, but it has been reviewed and found to be consistent, both internally and with the prior year’s information. Please note that the Actuarial Standards Board has adopted Actuarial Standard of Practice (ASOP) No. 4 that provides guidelines for actuaries to follow when measuring pension obligations. For a plan such as that offered by the Retirement Association that may use undistributed excess earnings to provide supplemental benefits, the valuation report must indicate that the impact of any such future use of undistributed excess earnings on the future financial condition of the plan has not been explicitly measured or otherwise reflected in the valuation.
MASTER PAGE NO. 250

SECTION 1: Valuation Summary for the Ventura County Employees' Retirement Association
ii
The contribution requirements are determined as a percentage of payroll. The Association’s employer rates provide for both normal cost and a contribution to amortize any unfunded or overfunded actuarial accrued liabilities. In 2004, the Board elected to amortize the Association’s Unfunded Actuarial Accrued Liability (UAAL) as of June 30, 2004 over a declining 15-year period. Any change in the UAAL after June 30, 2004 is amortized over separate 15-year declining amortization periods. Effective with the June 30, 2012 valuation, any change in the UAAL that arises due to assumption changes is amortized over separate 20-year declining amortization periods. Also, any change in the UAAL that arises due to retirement incentives is annualized over separate declining amortization period of up to 5 years. The rates calculated in this report may be adopted by the Board for the fiscal year that extends from July 1, 2015 through June 30, 2016. SIGNIFICANT ISSUES IN THIS VALUATION The following key findings were the result of this actuarial valuation: The market value of assets earned a return of 18.1% for the July 1, 2013 to June 30, 2014 plan year. The valuation value of
assets earned a return of 8.1% for the same period due to the deferral of most of the current year investment gains and the recognition of prior investment gains and losses. This resulted in an actuarial gain when measured against the assumed rate of return of 7.75%. This actuarial investment gain decreased the average employer contribution rate by 0.19% of compensation.
The ratio of the valuation value of assets to actuarial accrued liabilities increased from 79.2% to 82.7%. The Association’s Unfunded Actuarial Accrued Liability (UAAL) decreased from $953 million as of June 30, 2013 to $820 million as of June 30, 2014. This decrease is primarily due to expected changes in the UAAL, lower than expected individual salary increases and lower than expected benefit increases for retirees and beneficiaries offset to some extent by actual contributions less than expected. A complete reconciliation of the Association’s UAAL is provided in Section 3, Exhibit H.
The average employer rate decreased from 29.03% of payroll to 28.11% of payroll. This decrease is primarily due to lower than expected individual salary increases, lower than expected benefit increases for retirees and beneficiaries, the investment gain (on the valuation value of assets) and other experience gains offset to some extent by actual contributions less than expected and lower than expected total payroll growth. A complete reconciliation of the Association’s employer rate is provided in Section 2, Subsection D (see Chart 15).
Ref: Pg. 41
Ref: Pg. 10
Ref: Pg. 40
Ref: Pg. 49
Ref: Pg. 20
MASTER PAGE NO. 251

SECTION 1: Valuation Summary for the Ventura County Employees' Retirement Association
iii
The Association approved a three-year phase-in for the change in employer contribution rate due to the changes in economic actuarial assumptions and the actuarial cost method from the June 30, 2012 valuation. For the June 30, 2014 valuation, the phase-in has been completed. Note that the June 30, 2013 results shown in this valuation report do not include the effect of the phase-in.
The average member rate increased from 8.58% of payroll to 8.61% of payroll. A complete reconciliation of the member rate is provided in Section 2, Subsection D (see Chart 16).
As indicated in Section 2, Subsection B of this report, the net unrecognized investment gain as of June 30, 2014 is $310 million (as compared to an unrecognized loss of $6 million in the June 30, 2013 valuation). This investment gain will be recognized in the determination of the actuarial value of assets for funding purposes over the next few years. This means that if the plan earns the assumed rate of investment return of 7.75% per year (net of expenses) on a market value basis then the deferred gains will be recognized over the next few years as shown in the footnote to Chart 7.
The net deferred gains of $310 million represent about 7.3% of the market value of assets. Unless offset by future investment losses or other unfavorable experience, the recognition of the $310 million market gains is expected to have an impact on the Association’s future funded ratio and average employer contribution rate. This potential impact may be illustrated as follows:
• If the net deferred gains were recognized immediately in the valuation value of assets, the funded ratio would increase from 82.7% to 89.2%.
• If the net deferred gains were recognized immediately in the valuation value of assets, the average employer rate would decrease from 28.11% to about 23.90% of payroll.
As requested by VCERA staff, Appendix C and Appendix D show the employer and member contribution rates based on a 50/50 sharing of Normal Cost for non-PEPRA Tiers. For purposes of these calculations, we have been directed by VCERA to assume that the cessation of member contributions after 30 years of service for non-PEPRA members continues per the County Employees Retirement Law (CERL) and that the cost associated with this provision is to be paid for by employers.
The actuarial valuation report as of June 30, 2014 is based on financial information as of that date. Changes in the value of assets subsequent to that date are not reflected. Declines in asset values will increase the actuarial cost of the Plan, while increases will decrease the actuarial cost of the Plan.
Ref: Pg. 21
Ref: Pg. 5
Ref: Pg. 73
MASTER PAGE NO. 252

SECTION 1: Valuation Summary for the Ventura County Employees' Retirement Association
iv
The Governmental Accounting Standards Board (GASB) approved two new Statements affecting the reporting of pension liabilities for accounting purposes. Statement 67 replaces Statement 25 and is for plan reporting. Statement 68 replaces Statement 27 and is for employer reporting. It is important to note that the new GASB rules only redefine pension expense for financial reporting purposes, and do not apply to contribution amounts for actual pension funding purposes. Employers and plans can still develop and adopt funding policies under current practices. Because Statement 68 is not effective until the fiscal year ending June 30, 2015 for VCERA employer reporting, we have continued to include financial reporting information in this report in accordance with Statement 27. Financial reporting information for Statement 67 is provided in a separate report that follows this report.
Impact of Future Experience on Contribution Rates
Future contribution requirements may differ from those determined in the valuation because of: Differences between actual experience and anticipated experience; Changes in actuarial assumptions or methods; Changes in statutory provisions; and Differences between the contribution rates determined by the valuation and those adopted by the Board.
Ref: Pg. 22 Ref: Pg. 48-50
MASTER PAGE NO. 253

SECTION 1: Valuation Summary for the Ventura County Employees' Retirement Association
v
Summary of Key Valuation Results (all dollar amounts in thousands) June 30, 2014 June 30, 2013(2)
Employer Contribution Rates: (1) Estimated Estimated Total Rate Annual Amount(3) Total Rate Annual Amount(3) General Tier 1 61.89% $6,190 50.20% $5,696 General PEPRA Tier 1(4) N/A N/A 46.11% 506 General Tier 2 18.07% 37,913 18.68% 39,639 General PEPRA Tier 2 16.63% 1,978 17.03% 539 General Tier 2C(5) 19.16% 43,813 19.65% 47,316 General PEPRA Tier 2C(5) 17.67% 4,233 17.91% 1,405 General Combined 19.43% 94,127 19.96% 95,101 Safety 53.87% 86,233 55.68% 90,249 Safety PEPRA 50.30% 1,913 53.56% 92 Safety Combined 53.79% 88,146 55.68% 90,341 All Categories combined 28.11% $182,273 29.03% $185,442
Average Member Contribution Rates: (1)(6) Estimated Estimated Total Rate Annual Amount(3) Total Rate Annual Amount(3) General Tier 1 9.16% $916 9.16% $1,039 General PEPRA Tier 1(4) N/A N/A 6.50% 71 General Tier 2 5.78% 12,129 5.78% 12,267 General PEPRA Tier 2 6.92% 823 6.83% 216 General Tier 2C(5) 8.41% 19,231 8.41% 20,253 General PEPRA Tier 2C(5) 9.55% 2,288 9.46% 742 Safety 12.40% 19,849 12.44% 20,163 Safety PEPRA 14.69% 559 16.14% 28 All Categories combined 8.61% $55,795 8.58% $54,779
(1) Before reflection of any member rate that may be “picked-up” by the employer. Contributions are assumed to be paid throughout the year. (2) Before reflecting three-year phase-in of the effect of the changes in economic actuarial assumptions and the actuarial cost method from the June
30, 2012 valuation. (3) Based on projected compensation for each year shown. (4) There are no active members in General PEPRA Tier 1 as of June 30, 2014. (5) Throughout this report, this category represents those Tier 2 members who contribute a negotiated 2.63% of compensation for a fixed 2% COLA
pursuant to Government Code 31627 that applies to service after March 2003. (6) The non-refundability factors as of June 30, 2014 are 0.97 for General Tier 1 and Tier 2 (non-PEPRA) and 0.99 for Safety (non-PEPRA)
compared to 0.94 for General Tier 1 and Tier 2 (non-PEPRA) and 0.98 for Safety (non-PEPRA) from June 30, 2013.
MASTER PAGE NO. 254

SECTION 1: Valuation Summary for the Ventura County Employees' Retirement Association
vi
Summary of Key Valuation Results (continued) (all dollar amounts in thousands) June 30, 2014 June 30, 2013
Funded Status: Actuarial accrued liability(AAL)(1) $4,731,016 $4,575,063 Valuation value of assets (VVA)(1) 3,910,801 3,621,709 Market value of assets (MVA) 4,274,886 3,627,505 Funded percentage on VVA basis (VVA/AAL) 82.66% 79.16% Funded percentage on MVA basis (MVA/AAL) 90.36% 79.29% Unfunded actuarial accrued liability (UAAL) on VVA basis $820,215 $953,354 Unfunded actuarial accrued liability (UAAL) on MVA basis 456,130 947,558
Key Assumptions: Interest rate 7.75% 7.75% Inflation rate 3.25% 3.25% Across the board salary increase 0.75% 0.75%
(1) Excludes liabilities and assets held for supplemental medical benefit reserve and statutory contingency reserve.
MASTER PAGE NO. 255

SECTION 1: Valuation Summary for the Ventura County Employees' Retirement Association
vii
Summary of Key Valuation Demographic and Financial Data June 30, 2014 June 30, 2013 Percentage Change
Active Members: Number of members 8,210 8,068 1.8% Average age 45.3 45.4 N/A Average service 11.2 11.2 N/A Projected total compensation $648,257,042 $638,763,186 1.5% Average projected compensation $78,959 $79,172 -0.3%
Retired Member and Beneficiaries: Number of members: Service retired 4,452 4,259 4.5% Disability retired 837 828 1.1% Beneficiaries 832 801 3.9% Total 6,121 5,888 4.0% Average age 69.4 69.1 N/A Average monthly benefit(1) $2,897 $2,862 1.2%
Vested Terminated Members: Number of terminated vested members(2) 2,339 2,249 4.0% Average age 46.2 46.1 N/A
Total Members: 16,670 16,205 2.9%
Summary of Financial Data (dollar amounts in thousands): Market value of assets $4,274,886 $3,627,505 17.8% Return on market value of assets 18.06% 13.51% N/A Actuarial value of assets $3,964,814 $3,633,626 9.1% Return on actuarial value of assets 9.32% 6.97% N/A Valuation value of assets $3,910,801 $3,621,709 8.0% Return on valuation value of assets 8.13% 7.00% N/A
(1) Excludes monthly benefits for vested fixed supplemental and supplemental medical benefit amounts. (2) Includes terminated members with member contributions on deposit.
MASTER PAGE NO. 256

SECTION 2: Valuation Results for the Ventura County Employees' Retirement Association
1
The Actuarial Valuation and Review considers the number and demographic characteristics of covered members, including active members, vested terminated members, retired members and beneficiaries.
This section presents a summary of significant statistical data on these member groups.
More detailed information for this valuation year and the preceding valuation can be found in Section 3, Exhibits A, B, and C.
A. MEMBER DATA
A historical perspective of how the member population has changed over the past ten valuations can be seen in this chart.
CHART 1
Member Population: 2005 – 2014
4
Year Ended June 30
Active Members
Vested Terminated Members(1)
Retired Members and Beneficiaries
Total Non-Actives
Ratio of Non-Actives to Actives
2005 7,245 1,713 4,314 6,027 0.83
2006 7,403 1,756 4,570 6,326 0.85
2007 7,653 1,864 4,770 6,634 0.87
2008 7,928 2,007 4,914 6,921 0.87
2009 8,045 2,055 5,041 7,096 0.88
2010 8,003 2,040 5,267 7,307 0.91
2011 8,040 2,097 5,481 7,578 0.94
2012 8,019 2,161 5,658 7,819 0.98
2013 8,068 2,249 5,888 8,137 1.01
2014 8,210 2,339 6,121 8,460 1.03
(1) Includes terminated members with member contributions on deposit.
MASTER PAGE NO. 257

SECTION 2: Valuation Results for the Ventura County Employees' Retirement Association
2
0
200
400
600
800
1,000
1,200
1,400
0
500
1,000
1,500
2,000
2,500
Active Members Plan costs are affected by the age, years of service and compensation of active members. In this year’s valuation, there were 8,210 active members with an average age of 45.3, average service of 11.2 years and average compensation of $78,959. The 8,068 active members in the prior valuation had an average age of 45.4, average service of 11.2 years and average compensation of $79,172.
Among the active members, there were none with unknown age.
Inactive Members In this year’s valuation, there were 2,339 members with a vested right to a deferred or immediate vested benefit or entitled to a return of their member contributions versus 2,249 in the prior valuation.
These graphs show a distribution of active members by age and by years of service.
CHART 2
Distribution of Active Members by Age as of June 30, 2014
CHART 3
Distribution of Active Members by Years of Service as of June 30, 2014
MASTER PAGE NO. 258

SECTION 2: Valuation Results for the Ventura County Employees' Retirement Association
3
0
200
400
600
800
1,000
1,200
1,400
1,600
Disability
Service0
200
400
600
800
1,000
1,200
1,400
Retired Members and Beneficiaries As of June 30, 2014, 5,289 retired members and 832 beneficiaries were receiving total monthly benefits of $17,733,078. For comparison, in the previous valuation, there were 5,087 retired members and 801 beneficiaries receiving monthly benefits of $16,851,966. These monthly benefits exclude benefits for vested fixed supplemental and supplemental medical benefit amounts.
CHART 5
Distribution of Retired Members by Type and by Age as of June 30, 2014
CHART 4
Distribution of Retired Members by Type and by Monthly Amount as of June 30, 2014
These graphs show a distribution of the current retired members based on their monthly amount and age, by type of pension.
MASTER PAGE NO. 259

SECTION 2: Valuation Results for the Ventura County Employees' Retirement Association
4
0
100
200
300
400
500
600
2005 2006 2007 2008 2009 2010 2011 2012 2013 2014
$ M
illion
s
Adjustment toward market value
Benefits paid
Net interest and dividends
Contributions
Retirement plan funding anticipates that, over the long term, both contributions and net investment earnings (less investment fees and administrative expenses) will be needed to cover benefit payments.
Retirement plan assets change as a result of the net impact of these income and expense components. The adjustment toward market value shown in the chart is the “non-cash” earnings on investments implicitly included in the actuarial value of assets. Additional financial information, including a summary of these transactions for the valuation year, is presented in Section 3, Exhibits D and E.
It is desirable to have level and predictable plan costs from one year to the next. For this reason, the Board of Retirement has approved an asset valuation method that gradually adjusts to market value. Under this valuation method, the full value of market fluctuations is not recognized in a single year and, as a result, the asset value and the plan costs are more stable.
The amount of the adjustment to recognize market value is treated as income, which may be positive or negative. Realized and unrealized gains and losses are treated equally and, therefore, the sale of assets has no immediate effect on the actuarial value.
B. FINANCIAL INFORMATION
The chart depicts the components of changes in the actuarial value of assets over the last ten years. Note: The first bar represents increases in assets during each year while the second bar details the decreases.
CHART 6
Comparison of Increases and Decreases in the Actuarial Value of Assets for Years Ended June 30, 2005 – 2014
MASTER PAGE NO. 260

SECTION 2: Valuation Results for the Ventura County Employees' Retirement Association
5
The chart shows the determination of the actuarial and valuation value of assets as of the valuation date.
CHART 7
Determination of Actuarial and Valuation Value of Assets for Year Ended June 30, 2014
1. Market Value of Assets $4,274,885,864
2. Calculation of unrecognized return Original Amount Deferral Percentage Unrecognized Return*
(a) Period ended June 30, 2014 $93,124,979 90.00% $83,812,481
(b) Period ended December 31, 2013 264,705,452 80.00% 211,764,361
(c) Period ended June 30, 2013 66,644,214 70.00% 46,650,950
(d) Period ended December 31, 2012 101,488,670 60.00% 60,893,202
(e) Period ended June 30, 2012 83,335,657 50.00% 41,667,829
(f) Period ended December 31, 2011 (283,550,123) 40.00% (113,420,049)
(g) Combined deferred loss as of June 30, 2011** (63,892,227) 33.33% (21,297,409)
(h) Total unrecognized return*** 310,071,365
3. Actuarial Value of Assets: (1) – (2h) $3,964,814,499
4. Actuarial Value as percentage of Market Value 92.7%
5. Non-valuation reserves:
(a) Supplemental medical benefit $10,401,838
(b) Statutory contingency 43,611,864
(c) Subtotal $54,013,702
6. Valuation Value of Assets: (3) – (5c) $3,910,800,797
* Recognition at 10% per six month period over 5 years. ** Net deferred loss as of June 30, 2011 was combined and will be recognized over 4.5 years in level semi-annual amounts. *** Deferred return as of June 30, 2014 recognized in each of the next five years:
(a) Amount Recognized during 2014/2015 $50,951,497 (b) Amount Recognized during 2015/2016 58,050,633 (c) Amount Recognized during 2016/2017 113,526,229 (d) Amount Recognized during 2017/2018 78,230,508 (e) Amount Recognized during 2018/2019 9,312,498 $310,071,365
MASTER PAGE NO. 261

SECTION 2: Valuation Results for the Ventura County Employees' Retirement Association
6
CHART 8
Allocation of Valuation Value of Assets as of June 30, 2014
The calculation of the valuation value of assets from June 30, 2013 to June 30, 2014 by category is provided below:
Allocated Assets for Funding
General
Tier I Tier II Safety Total
1. Allocated Assets as of Beginning of Plan Year $597,855,452 $1,446,404,485 $1,577,448,599 $3,621,708,536
2. Member Contributions 353,158 25,735,219 8,042,950 34,131,327
3. Member Buybacks 234,072 815,820 390,510 1,440,402
4. Employer Pick-up Contributions Credited to Member Account 187,307 6,036,434 4,878,973 11,102,714
5. Employer Contributions 4,100,040 75,826,051 89,776,992 169,703,083
6. Refunds of Member Contributions and Death Benefits Paid 376,761 4,717,384 333,866 5,428,011
7. Retiree Benefit Payments Excluding Supplemental Medical Payments 73,968,041 55,029,918 87,166,509 216,164,468
8. Subtotal (Items 1 + 2 + 3 + 4 + 5 – 6 – 7) $528,385,227 $1,495,070,707 $1,593,037,649 $3,616,493,583
9. Weighted Average Fund Balance: Item 1 + ½ of (Items 2, 3, 4, 5) – ½ of (Items 6, 7) 563,120,340 1,470,737,596 1,585,243,124 3,619,101,060
10. Earnings Allocated in Proportion to Item 9 45,793,244 119,601,160 128,912,810 294,307,214
11. Valuation Value of Assets (Items 8 + 10) $574,178,471 $1,614,671,867 $1,721,950,459 $3,910,800,797
Note: Results may not add due to rounding.
MASTER PAGE NO. 262

SECTION 2: Valuation Results for the Ventura County Employees' Retirement Association
7
0.0
0.5
1.0
1.5
2.0
2.5
3.0
3.5
4.0
4.5
2005 2006 2007 2008 2009 2010 2011 2012 2013 2014
$ Bi
llions
Market Value
Actuarial Value
Valuation Value
The market value, actuarial value, and valuation value of assets are representations of VCERA’s financial status. As investment gains and losses are gradually taken into account, the actuarial value of assets tracks the market value of assets, but with less volatility. The valuation value of assets is the actuarial value, excluding any non-valuation reserves. The valuation value of assets is significant because VCERA’s liabilities are compared to these assets to determine what portion, if any, remains unfunded. Amortization of the unfunded actuarial accrued liability is an important element in determining the contribution requirement.
This chart shows the change in market value, actuarial value and valuation value over the past ten years.
CHART 9
Market Value, Actuarial Value and Valuation Value of Assets as of June 30, 2005 – 2014
MASTER PAGE NO. 263
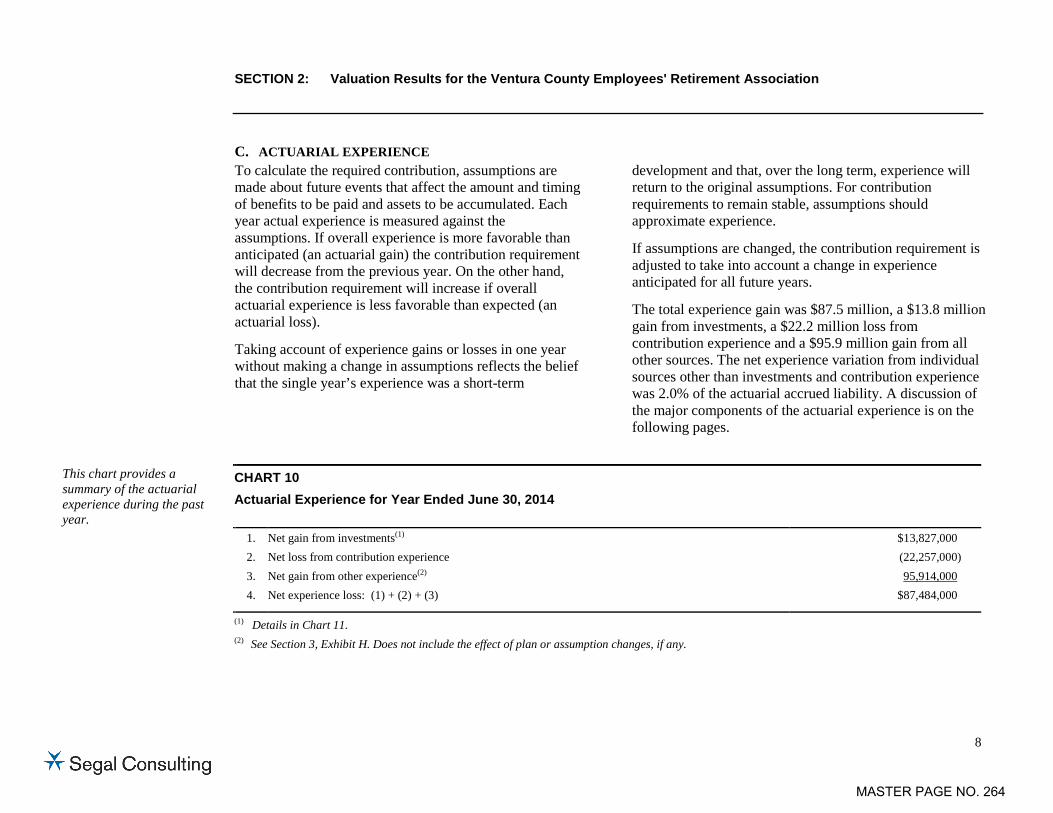
SECTION 2: Valuation Results for the Ventura County Employees' Retirement Association
8
To calculate the required contribution, assumptions are made about future events that affect the amount and timing of benefits to be paid and assets to be accumulated. Each year actual experience is measured against the assumptions. If overall experience is more favorable than anticipated (an actuarial gain) the contribution requirement will decrease from the previous year. On the other hand, the contribution requirement will increase if overall actuarial experience is less favorable than expected (an actuarial loss).
Taking account of experience gains or losses in one year without making a change in assumptions reflects the belief that the single year’s experience was a short-term
development and that, over the long term, experience will return to the original assumptions. For contribution requirements to remain stable, assumptions should approximate experience.
If assumptions are changed, the contribution requirement is adjusted to take into account a change in experience anticipated for all future years.
The total experience gain was $87.5 million, a $13.8 million gain from investments, a $22.2 million loss from contribution experience and a $95.9 million gain from all other sources. The net experience variation from individual sources other than investments and contribution experience was 2.0% of the actuarial accrued liability. A discussion of the major components of the actuarial experience is on the following pages.
C. ACTUARIAL EXPERIENCE
CHART 10 Actuarial Experience for Year Ended June 30, 2014
1. Net gain from investments(1) $13,827,000
2. Net loss from contribution experience (22,257,000)
3. Net gain from other experience(2) 95,914,000
4. Net experience loss: (1) + (2) + (3) $87,484,000
(1) Details in Chart 11.
(2) See Section 3, Exhibit H. Does not include the effect of plan or assumption changes, if any.
This chart provides a summary of the actuarial experience during the past year.
MASTER PAGE NO. 264

SECTION 2: Valuation Results for the Ventura County Employees' Retirement Association
9
Investment Rate of Return A major component of projected asset growth is the assumed rate of return. The assumed return should represent the expected long-term rate of return, based on VCERA’s investment policy. For valuation purposes, the assumed rate of return on the valuation value of assets is 7.75% (based on the June 30, 2013 valuation). The actual rate of return on the valuation value of assets for the 2013/2014 plan year was 8.13%.
Since the actual return for the year was greater than the assumed return, the VCERA experienced an actuarial gain during the year ended June 30, 2014 with regard to its investments.
This chart shows the gain/(loss) due to investment experience.
CHART 11 Investment Experience for Year Ended June 30, 2014 – Market Value, Actuarial Value and Valuation Value of Assets
Market Value Actuarial Value Valuation Value
1. Actual return $654,535,161 $338,343,729 $294,307,214
2. Average value of assets 3,623,928,085 3,630,048,152 3,619,101,060
3. Actual rate of return: (1) ÷ (2) 18.06% 9.32% 8.13%
4. Assumed rate of return 7.75% 7.75% 7.75%
5. Expected return: (2) x (4) $280,854,427 $281,328,732 $280,480,332
6. Actuarial gain/(loss): (1) – (5) $373,680,734 $57,014,997 $13,826,882
MASTER PAGE NO. 265

SECTION 2: Valuation Results for the Ventura County Employees' Retirement Association
10
Because actuarial planning is long term, it is useful to see how the assumed investment rate of return has followed actual experience over time. The chart below shows the rate of return on an actuarial, valuation, and market basis for the last ten years.
CHART 12 Investment Return – Market Value, Actuarial Value and Valuation Value: 2005 – 2014
Market Value
Investment Return Actuarial Value
Investment Return Valuation Value
Investment Return
Year Ended June 30 Amount Percent Amount Percent Amount Percent
2005 $203,080,574 9.19% $168,122,229 8.05% $168,122,229 8.16%
2006 238,212,815 9.95 221,191,725 9.88 221,191,725 10.00
2007 458,962,761 17.48 344,644,568 14.06 308,000,514 12.68
2008 (211,806,573) (6.86) 307,776,354 11.01 310,176,628 11.32
2009 (628,718,568) (21.86) 5,186,654 0.17 31,242,785 1.02
2010 343,005,717 15.33 43,756,165 1.41 43,756,185 1.42
2011 622,940,028 24.34 121,406,541 3.89 121,406,541 3.91
2012 47,147,363 1.49 184,787,098 5.72 184,909,716 5.75
2013 432,694,392 13.51 237,282,497 6.97 237,282,497 7.00
2014 654,535,161 18.06 338,343,729 9.32 294,307,214 8.13
Total $2,160,053,670 $1,972,497,560 $1,920,396,034
Five-Year Average Return 14.20% 5.61% 5.37%
Ten-Year Average Return 7.72% 6.78% 6.64%
Note: Each year’s yield is weighted by the average asset value in that year.
MASTER PAGE NO. 266

SECTION 2: Valuation Results for the Ventura County Employees' Retirement Association
11
-30%
-20%
-10%
0%
10%
20%
30%
2005 2006 2007 2008 2009 2010 2011 2012 2013 2014
Market Value
Actuarial Value
Valuation Value
Subsection B described the actuarial asset valuation method that gradually takes into account fluctuations in the market value rate of return. The effect of this is to stabilize the actuarial rate of return, which contributes to leveling pension plan costs.
This chart illustrates how this leveling effect has actually worked over the years 2005 - 2014.
CHART 13
Market, Actuarial and Valuation Rates of Return for Years Ended June 30, 2005 - 2014
MASTER PAGE NO. 267
SECTION 2: Valuation Results for the Ventura County Employees' Retirement Association
12
Other Experience There are other differences between the expected and the actual experience that appear when the new valuation is compared with the projections from the previous valuation. These include:
the extent of turnover among the participants,
retirement experience (earlier or later than expected),
mortality (more or fewer deaths than expected),
the number of disability retirements, and
salary increases different than assumed.
The net gain from this other experience for the year ended June 30, 2014 amounted to $95.9 million which is 2.0% of the actuarial accrued liability. This gain was mainly due to individual salary increases less than assumed and lower than expected benefit increases for retirees and beneficiaries. See Exhibit H for a detailed development of the Unfunded Actuarial Accrued Liability.
MASTER PAGE NO. 268

SECTION 2: Valuation Results for the Ventura County Employees' Retirement Association
13
Employer contributions consist of two components:
Normal Cost The annual contribution rate that, if paid annually from a member’s first year of membership through the year of retirement, would accumulate to the amount necessary to fully fund the member's retirement-related benefits. Accumulation includes annual crediting of interest at the assumed investment earning rate. The contribution rate is expressed as a level percentage of the member’s compensation.
Contribution to the Unfunded Actuarial Accrued Liability (UAAL) The annual contribution rate that, if paid annually over the UAAL amortization
period, would accumulate to the amount necessary to fully fund the UAAL. Accumulation includes annual crediting of interest at the assumed investment earning rate. The contribution (or rate credit in the case of a negative unfunded actuarial accrued liability) is calculated to remain as a level percentage of future active member payroll (including payroll for new members as they enter the Association) assuming a constant number of active members. In order to remain as a level percentage of payroll, amortization payments (credits) are scheduled to increase at the combined annual inflation and “across the board” increases rate of 4.00%. The June 30, 2004 UAAL is being amortized over a 15-year declining period effective June 30, 2004. The change in UAAL that arises due to actuarial gains or losses or due to plan amendments (with the exception of retirement incentives) at each valuation is amortized over its own declining 15-year period. Effective with the June 30, 2012 valuation, any change in UAAL that arises due to changes in actuarial assumptions or methods is amortized over its own declining 20-year period and any change in UAAL due to retirement incentives is amortized over its own declining period of up to 5 years.
VCERA’s UAAL is determined separately for each tier depending on the assets and
liabilities for that tier.
Effective with the June 30, 2012 valuation, the Basic UAAL rate has been calculated on a combined basis for both General Tier 1 and General Tier 2. The recommended employer contribution rates determined under this combined methodology are
D. EMPLOYER AND MEMBER CONTRIBUTIONS
MASTER PAGE NO. 269

SECTION 2: Valuation Results for the Ventura County Employees' Retirement Association
14
provided on Chart 14. For reference purposes only, Appendix E shows the employer contribution rates under the previous non-combined methodology. Appendix C and Appendix D show the employer and member contribution rates based on a 50/50 sharing of Normal Cost for non-PEPRA Tiers. For purposes of these calculations, we have been directed by VCERA to assume that the cessation of member contributions after 30 years of service for non-PEPRA members continues per the County Employees Retirement Law (CERL) and that the cost associated with this provision is to be paid for by members with less than 30 years. All June 30, 2013 employer contribution rates shown in this report are before reflecting the three-year phase-in of the effect of the changes in economic actuarial assumptions and the actuarial cost method from the June 30, 2012 valuation. For the June 30, 2014 valuation, the phase-in has been completed.
Member ContributionsNon-PEPRA Members Articles 6 and 6.8 of the 1937 Act define the methodology to be used in the
calculation of member basic contribution rates for General members and Safety members, respectively. The basic contribution rate is determined so that the accumulation of a member’s basic contributions made in a given year until a certain age will be sufficient to fund an annuity at that age that is equal to 1/120 of Final Average Compensation for General members and 1/100 of Final Average Compensation for Safety members. That age is 55 for General Tier 1 members, 60 for General Tier 2 members and 50 for Safety members. It is assumed that contributions are made annually at the same rate, starting at entry age. In addition to their basic contributions, General Tier 1 and Safety members pay one-half of the total normal cost necessary to fund their cost-of-living benefits. General Tier 2 members eligible for the fixed 2% cost-of-living benefit contribute a negotiated 2.63% of compensation per year. Member contributions accumulate with interest at the lesser of the assumed investment earning rate or the rate on ten year U.S. Treasury notes. Any difference between the assumed investment earning rate and the actual interest crediting rate will be credited to the County Advance reserve. The Non-PEPRA member contribution rates are provided in Appendix A. Please note that the member rates provided in the report are the full rate before reflecting any employer pickup. Also, in calculating the
MASTER PAGE NO. 270

SECTION 2: Valuation Results for the Ventura County Employees' Retirement Association
15
basic member rate, we follow the Board’s past practice and have not included any in-service pay redemptions that may potentially increase a member’s final average compensation and hence retirement benefit.
PEPRA Members Pursuant to Section 7522.30(a) of the Government Code, members under PEPRA tiers
are required to contribute at least 50% of the Normal Cost. In addition, there are certain additional requirements that would have to be met such as requiring the new employees to pay the contribution rate of “similarly situated employees”, if it is greater. (reference: Section 7522.30(c)). We further understand that different rules may have to be applied for collectively bargained employees, non-represented, managerial or other supervisory employees. (reference: Section 7522.30(e)). In preparing the Normal Cost rates in this report, we have assumed that exactly 50% of the Normal Cost would be paid by the new members and we have taken into account in this valuation only the requirements of Section 7522.30(c), but not the requirements of Section 7522.30(e). The only exception to this is that we have also shown the PEPRA Tier 2 with COLA contribution rates including the member COLA contribution rate of 2.63% of compensation based on current bargaining agreements.
Also of note is that based on our discussions with VCERA, we have used the discretion made available by Section 31620.5(a) of AB 1380 to no longer round the PEPRA member’s contribution rates to the nearest one quarter of one percent as was previously required by CalPEPRA. This is consistent with established practice for the Non-PEPRA plans and should allow for exactly one-half of the normal cost for the PEPRA plans to be paid by the employees and one-half by the employers. In addition, Section 31620.5(b) of AB 1380 also provides that the “one percent rule” under Section 7522.30(d) does not apply. This section formerly limited the circumstances under which the PEPRA member rate would change.
The PEPRA member contribution rates are provided in Appendix B.
Tier 2 COLA Procedures This benefit has been valued consistent with the methodologies described in our
October 9, 2006 report entitled “Funding Policies and Procedures for General Tier II COLA Benefit”.
\
MASTER PAGE NO. 271

SECTION 2: Valuation Results for the Ventura County Employees' Retirement Association
16
CHART 14a Recommended Employer Contribution Rates (Dollar Amounts in Thousands) – Current Valuation Under Combined Methodology
June 30, 2014 Actuarial Valuation BASIC COLA TOTAL
General Tier 1 Members Rate Estimated Annual
Amount(1) Rate Estimated Annual
Amount(1) Rate Estimated Annual
Amount(1) Normal Cost 8.11% $811 2.43% $243 10.54% $1,054 UAAL(2) 9.71% 971 41.64% 4,165 51.35% 5,136 Total Contribution 17.82% $1,782 44.07% $4,408 61.89% $6,190 General Tier 2 Members w/o COLA Normal Cost 8.36% $17,543 0.00% $0 8.36% $17,543 UAAL(2) 9.71% 20,370 0.00% 0 9.71% 20,370 Total Contribution 18.07% $37,913 0.00% $0 18.07% $37,913 General PEPRA Tier 2 Members w/o COLA Normal Cost 6.92% $823 0.00% $0 6.92% $823 UAAL(2) 9.71% 1,155 0.00% 0 9.71% 1,155 Total Contribution 16.63% $1,978 0.00% $0 16.63% $1,978 General Tier 2 Members w/COLA Normal Cost (3) 8.36% $19,117 -0.05% -$115 8.31% $19,002 UAAL(2)(4) 9.71% 22,204 1.14% 2,607 10.85% 24,811 Total Contribution 18.07% $41,321 1.09% $2,492 19.16% $43,813 General PEPRA Tier 2 Members w/COLA Normal Cost (3) 6.92% $1,658 -0.10% -$24 6.82% $1,634 UAAL(2)(4) 9.71% 2,326 1.14% 273 10.85% 2,599 Total Contribution 16.63% $3,984 1.04% $249 17.67% $4,233 All General Members(5) Normal Cost 8.25% $39,952 0.02% $104 8.27% $40,056 UAAL 9.71% 47,026 1.45% 7,045 11.16% 54,071 Total Contribution 17.96% $86,978 1.47% $7,149 19.43% $94,127
MASTER PAGE NO. 272

SECTION 2: Valuation Results for the Ventura County Employees' Retirement Association
17
CHART 14a (continued) Recommended Employer Contribution Rates (Dollar Amounts in Thousands) – Current Valuation Under Combined Methodology
June 30, 2014 Actuarial Valuation BASIC COLA TOTAL
Safety Members Rate Estimated Annual
Amount(1) Rate Estimated Annual
Amount(1) Rate Estimated Annual
Amount(1) Normal Cost 13.97% $22,362 4.29% $6,868 18.26% $29,230 UAAL 44.50% 71,233 -8.89% -14,230 35.61% 57,003 Total Contribution 58.47% $93,595 -4.60% -$7,362 53.87% $86,233 Safety PEPRA Members Normal Cost 10.60% $403 4.09% $156 14.69% $559 UAAL 44.50% 1,692 -8.89% -338 35.61% 1,354 Total Contribution 55.10% $2,095 -4.80% -$182 50.30% $1,913 All Safety Members(5) Normal Cost 13.89% $22,765 4.29% $7,024 18.18% $29,789 UAAL 44.50% 72,925 -8.89% -14,568 35.61% 58,357 Total Contribution 58.39% $95,690 -4.60% -$7,544 53.79% $88,146 All Categories Combined(5) Normal Cost 9.67% $62,717 1.10% $7,128 10.77% $69,845 UAAL 18.50% 119,951 -1.16% -7,523 17.34% 112,428 Total Contribution 28.17% $182,668 -0.06% -$395 28.11% $182,273 (1) Amounts are in thousands, assumed to be paid throughout the year, and are based on June 30, 2014 annual payroll (also in thousands) shown below: General Tier 1 $10,004 General Tier 2 209,847 General PEPRA Tier 2 11,899 General Tier 2C 228,670 General PEPRA Tier 2C 23,959 Safety 160,075 Safety PEPRA 3,803 Total $648,257 (2) Basic UAAL rates have been calculated on a combined basis for all General Tiers. (3) Reflects General Tier 2 member COLA contribution rate of 2.63% based on current bargaining agreements. (4) Includes 0.56% in COLA UAAL costs attributed to the first two years of service accrued for the fixed 2% COLA pursuant to Government Code 31627. (5) These aggregated rates are provided for informational purposes only as we understand that the intent is to implement the tier specific rates, if possible.
MASTER PAGE NO. 273

SECTION 2: Valuation Results for the Ventura County Employees' Retirement Association
18
CHART 14b Recommended Employer Contribution Rates (Dollar Amounts in Thousands) – Prior Valuation Under Combined Methodology
June 30, 2013 Actuarial Valuation(1) BASIC COLA TOTAL
General Tier 1 Members Rate Estimated Annual
Amount(2) Rate Estimated Annual
Amount(2) Rate Estimated Annual
Amount(2) Normal Cost 8.15% $925 2.44% $277 10.59% $1,202 UAAL(3) 10.20% 1,157 29.41% 3,337 39.61% 4,494 Total Contribution 18.35% $2,082 31.85% $3,614 50.20% $5,696 General PEPRA Tier 1 Members Normal Cost 4.70% $52 1.80% $19 6.50% $71 UAAL(3) 10.20% 112 29.41% 323 39.61% 435 Total Contribution 14.90% $164 31.21% $342 46.11% $506 General Tier 2 Members w/o COLA Normal Cost 8.48% $17,997 0.00% $0 8.48% $17,997 UAAL(3) 10.20% 21,642 0.00% 0 10.20% 21,642 Total Contribution 18.68% $39,639 0.00% $0 18.68% $39,639 General PEPRA Tier 2 Members w/o COLA Normal Cost 6.83% $216 0.00% $0 6.83% $216 UAAL(3) 10.20% 323 0.00% 0 10.20% 323 Total Contribution 17.03% $539 0.00% $0 17.03% $539 General Tier 2 Members w/COLA Normal Cost (4) 8.48% $20,422 -0.04% -$97 8.44% $20,325 UAAL(3)(5) 10.20% 24,559 1.01% 2,432 11.21% 26,991 Total Contribution 18.68% $44,981 0.97% $2,335 19.65% $47,316 General PEPRA Tier 2 Members w/COLA Normal Cost (4) 6.83% $536 -0.13% -$10 6.70% $526 UAAL(3)(5) 10.20% 800 1.01% 79 11.21% 879 Total Contribution 17.03% $1,336 0.88% $69 17.91% $1,405 All General Members(6) Normal Cost 8.43% $40,148 0.04% $189 8.47% $40,337 UAAL 10.20% 48,593 1.29% 6,171 11.49% 54,764 Total Contribution 18.63% $88,741 1.33% $6,360 19.96% $95,101
MASTER PAGE NO. 274

SECTION 2: Valuation Results for the Ventura County Employees' Retirement Association
19
CHART 14b (continued) Recommended Employer Contribution Rates (Dollar Amounts in Thousands) – Prior Valuation Under Combined Methodology
June 30, 2013 Actuarial Valuation(1) BASIC COLA TOTAL
Safety Members Rate Estimated Annual
Amount(2) Rate Estimated Annual
Amount(2) Rate Estimated Annual
Amount(2) Normal Cost 13.96% $22,627 4.30% $6,970 18.26% $29,597 UAAL 42.87% 69,486 -5.45% -8,834 37.42% 60,652 Total Contribution 56.83% $92,113 -1.15% -$1,864 55.68% $90,249 Safety PEPRA Members Normal Cost 11.27% $19 4.87% $9 16.14% $28 UAAL 42.87% 73 -5.45% -9 37.42% 64 Total Contribution 54.14% $92 -0.58% $0 53.56% $92 All Safety Members(6) Normal Cost 13.96% $22,646 4.30% $6,979 18.26% $29,625 UAAL 42.87% 69,559 -5.45% -8,843 37.42% 60,716 Total Contribution 56.83% $92,205 -1.15% -$1,864 55.68% $90,341 All Categories Combined(6) Normal Cost 9.83% $62,794 1.12% $7,168 10.95% $69,962 UAAL 18.50% 118,152 -0.42% -2,672 18.08% 115,480 Total Contribution 28.33% $180,946 0.70% $4,496 29.03% $185,442 (1) Before reflecting three-year phase-in of the effect of the changes in economic actuarial assumptions and actuarial cost method from the June 30, 2012
valuation. (2) Amounts are in thousands, assumed to be paid throughout the year, and are based on June 30, 2013 annual payroll (also in thousands) shown below: General Tier 1 $11,348 General PEPRA Tier 1 1,099 General Tier 2 212,229 General PEPRA Tier 2 3,163 General Tier 2C 240,822 General PEPRA Tier 2C 7,847 Safety 162,085 Safety PEPRA 171 Total $638,764 (3) Basic UAAL rates have been calculated on a combined basis for all General Tiers. (4) Reflects General Tier 2 member COLA contribution rate of 2.63% based on current bargaining agreements. (5) Includes 0.53% in COLA UAAL costs attributed to the first two years of service accrued for the fixed 2% COLA pursuant to Government Code 31627. (6) These aggregated rates are provided for informational purposes only as we understand that the intent is to implement the tier specific rates, if possible.
MASTER PAGE NO. 275

SECTION 2: Valuation Results for the Ventura County Employees' Retirement Association
20
The employer contribution rates as of June 30, 2014 are based on all of the data described in the previous sections, the actuarial assumptions described in Section 4, and the Plan provisions adopted at the time of preparation of the Actuarial Valuation. They include all changes affecting future costs, adopted benefit changes, actuarial gains and losses and changes in the actuarial assumptions.
Reconciliation of Recommended Employer Contribution Rate The chart below details the changes in the recommended average employer contribution rate from the prior valuation to the current year’s valuation.
CHART 15 Reconciliation of Recommended Average Employer Contribution Rate from June 30, 2013 to June 30, 2014 (Dollar Amounts in Thousands)
Contribution Rate
Estimated Annual Dollar Cost(1)
Recommended Average Employer Contribution Rate as of June 30, 2013(4) 29.03% $185,442
Effect of investment gain(2) (0.19)% (1,232)
Effect of difference in actual versus expected contributions due to phase-in and delay in implementation of contribution rates calculated in June 30, 2013 valuation
0.30% 1,945
Effect of difference in actual versus expected individual salary increases (0.77)% (4,992)
Effect of difference in actual versus expected total payroll growth 0.45% 2,917
Effect of lower than expected COLA benefit increase for retirees and beneficiaries (0.51)% (3,306)
Effect of net other changes(3) (0.20)% 1,499
Total change (0.92)% $(3,169)
Recommended Average Employer Contribution Rate as of June 30, 2014 28.11% $182,273 (1) Based on projected payroll for each year. (2) The Association’s valuation value of assets earned 8.13% which was greater than the 7.75% assumed rate of return. (3) Other differences in actual versus expected experience including mortality, disability, withdrawal, retirement and in-service redemption experience.
Estimated annual dollar cost also reflects change in payroll from prior valuation. (4) Before reflecting three-year phase-in of the effect of the changes in economic actuarial assumptions and actuarial cost method from the June 30, 2012
valuation.
The chart reconciles the employer contribution from the prior valuation to the amount determined in this valuation.
MASTER PAGE NO. 276

SECTION 2: Valuation Results for the Ventura County Employees' Retirement Association
21
The member contribution rates as of June 30, 2014 are based on all of the data described in the previous sections, the actuarial assumptions described in Section 4, and the Plan provisions adopted at the time of preparation of the Actuarial Valuation.
Reconciliation of Recommended Member Contribution Rate The chart below details the changes in the recommended average member contribution rate from the prior valuation to the current year’s valuation.
CHART 16 Reconciliation of Recommended Average Member Contribution Rate from June 30, 2013 to June 30, 2014 (Dollar Amounts in Thousands)
Contribution Rate Estimated Annual Dollar Cost(1)
Recommended Average Member Contribution Rate in June 30, 2013 Valuation 8.58% $54,779
Effect of changes in demographic profile of employee group(2) 0.03% 1,016
Recommended Average Member Contribution Rate in June 30, 2014 Valuation 8.61% $55,795
(1) Based on projected payroll for each year. (2) Estimated annual dollar cost also reflects change in payroll from prior valuation.
The chart reconciles the member contribution from the prior valuation to the amount determined in this valuation.
MASTER PAGE NO. 277

SECTION 2: Valuation Results for the Ventura County Employees' Retirement Association
22
020406080
100120140160180
2009 2010 2011 2012 2013 2014
$ M
illio
ns
Required Actual
0%
20%
40%
60%
80%
100%
120%
2009 2010 2011 2012 2013 2014
Governmental Accounting Standards Board (GASB) reporting information provides standardized information for comparative purposes of governmental pension plans. This information allows a reader of the financial statements to compare the funding status of one governmental plan to another on relatively equal terms.
Critical information to the GASB is the historical comparison of the GASB required contributions to the actual contributions. This comparison demonstrates whether a plan is being funded within the range of GASB reporting requirements. Chart 17 below presents a graphical representation of this information for the Plan.
The other critical piece of information regarding the Plan’s financial status is the funded ratio. This ratio compares the valuation value of assets to the actuarial accrued liabilities of the plan as calculated under GASB standards. High ratios indicate a well-funded plan with assets sufficient to cover the Plan’s actuarial liabilities. Lower ratios may indicate recent changes to benefit structures, funding of the plan below actuarial requirements, poor asset performance, or a variety of other changes.
The details regarding the calculations of these values and other GASB numbers may be found in Section 4, Exhibits II, III, and IV.
E. INFORMATION REQUIRED BY GASB 27
CHART 17
Required Versus Actual Contributions These graphs show key GASB factors.
CHART 18
Funded Ratio
MASTER PAGE NO. 278

SECTION 2: Valuation Results for the Ventura County Employees' Retirement Association
23
Retirement plans are subject to volatility in the level of required contributions. This volatility tends to increase as retirement plans become more mature.
The Asset Volatility Ratio (AVR), which is equal to the market value of assets divided by total payroll, provides an indication of the potential contribution volatility for any given level of investment volatility. A higher AVR indicates that the plan is subject to a greater level of contribution volatility. This is a current measure since it is based on the current level of assets.
For VCERA, the current AVR is about 6.6. This means that a 1% asset gain/(loss) (relative to the assumed investment return) translates to about 6.6% of one-year’s payroll. Since VCERA amortizes actuarial gains and losses over a period of 15 years, there would be a 0.6% of payroll decrease/(increase) in the required contribution for each 1% asset gain/(loss).
The Liability Volatility Ratio (LVR), which is equal to the Actuarial Accrued Liability divided by payroll, provides an indication of the longer-term potential for contribution volatility for any given level of investment volatility. This is because, over an extended period of time, the plan’s assets should track the plan’s liabilities. For example, if a plan is 50% funded on a market value basis, the liability volatility ratio would be double the asset volatility ratio and the plan sponsor should expect contribution volatility to increase over time as the plan becomes better funded.
The LVR also indicates how volatile contributions will be in response to changes in the Actuarial Accrued Liability due to actual experience or to changes in actuarial assumptions.
For VCERA, the current LVR is about 7.3. This is about 11% higher than the AVR. Therefore, we would expect that contribution volatility will increase over the long term.
F. VOLATILITY RATIOS
CHART 19 Volatility Ratios for Years Ended June 30, 2009 – 2014
Year Ended June 30 Asset Volatility Ratio Liability Volatility Ratio
2009 3.5 5.8
2010 3.9 5.9
2011 5.0 6.3
2012 5.1 6.9
2013 5.7 7.2
2014 6.6 7.3
This chart shows how the asset and liability volatility ratios have varied over time.
MASTER PAGE NO. 279

SECTION 3: Supplemental Information for the Ventura County Employees' Retirement Association
24
EXHIBIT A Table of Plan Coverage i. General Tier 1 Year Ended June 30
Category 2014 2013 Change From
Prior Year Active members in valuation:
Number 92 109 -15.6% Average age 60.4 58.7 N/A Average service 31.6 29.4 N/A Projected total compensation(1) $10,004,102 $11,347,554 -11.8% Projected average compensation $108,740 $104,106 4.5% Account balances $17,403,435 $18,445,454 -5.6% Total active vested members 92 105 -12.4%
Vested terminated members(2) 58 62 -6.5% Retired members:
Number in pay status 1,508 1,539 -2.0% Average age 74.8 74.2 N/A Average monthly benefit(3) $3,481 $3,403 2.3%
Disabled members: Number in pay status 115 123 -6.5% Average age 72.7 72.6 N/A Average monthly benefit(3) $2,293 $2,244 2.2%
Beneficiaries: Number in pay status 359 367 -2.2% Average age 79.0 79.1 N/A Average monthly benefit(3) $1,551 $1,451 6.9%
(1) Calculated by increasing annualized bi-weekly compensation rates as of valuation date by one-half year of inflation and “across the board” salary increases.
(2) Includes terminated members with member contributions on deposit. (3) Excludes vested fixed supplemental and supplemental medical benefit amounts.
MASTER PAGE NO. 280

SECTION 3: Supplemental Information for the Ventura County Employees' Retirement Association
25
EXHIBIT A (continued) Table of Plan Coverage ii. General Tier 2 Year Ended June 30
Category 2014 2013 Change From
Prior Year Active members in valuation:
Number 5,825 6,201 -6.1% Average age 47.3 46.6 N/A Average service 11.5 10.7 N/A Projected total compensation(1) $438,516,507 $453,050,594 -3.2% Projected average compensation $75,282 $73,061 3.0% Account balances $360,544,571 $344,670,730 4.6% Total active vested members 4,607 4,564 0.9%
Vested terminated members(2) 1,925 1,902 1.2% Retired members:
Number in pay status 2,267 2,062 9.9% Average age 67.6 67.3 N/A Average monthly benefit(3) $1,585 $1,510 5.0%
Disabled members: Number in pay status 337 327 3.1% Average age 62.9 62.1 N/A Average monthly benefit(3) $1,436 $1,416 1.4%
Beneficiaries: Number in pay status 256 228 12.3% Average age 67.2 66.5 N/A Average monthly benefit(3) $788 $799 -1.4%
(1) Calculated by increasing annualized bi-weekly compensation rates as of valuation date by one-half year of inflation and “across the board” salary increases.
(2) Includes terminated members with member contributions on deposit. (3) Excludes vested fixed supplemental and supplemental medical benefit amounts.
MASTER PAGE NO. 281

SECTION 3: Supplemental Information for the Ventura County Employees' Retirement Association
26
EXHIBIT A (continued) Table of Plan Coverage iii. PEPRA General Tier 1 Year Ended June 30
Category 2014 2013 Change From
Prior Year Active members in valuation:
Number 0 18 -100.0% Average age N/A 26.3 N/A Average service N/A 0.2 N/A Projected total compensation(1) N/A $1,099,121 N/A Projected average compensation N/A $61,062 N/A Account balances N/A $4,521 N/A Total active vested members 0 0 N/A
Vested terminated members(2) 5 2 150.0% Retired members:
Number in pay status 0 0 N/A Average age N/A N/A N/A Average monthly benefit(3) N/A N/A N/A
Disabled members: Number in pay status 0 0 N/A Average age N/A N/A N/A Average monthly benefit(3) N/A N/A N/A
Beneficiaries: Number in pay status 0 0 N/A Average age N/A N/A N/A Average monthly benefit(3) N/A N/A N/A
(1) Calculated by increasing annualized bi-weekly compensation rates as of valuation date by one-half year of inflation and “across the board” salary increases.
(2) Includes terminated members with member contributions on deposit. (3) Excludes vested fixed supplemental and supplemental medical benefit amounts.
MASTER PAGE NO. 282

SECTION 3: Supplemental Information for the Ventura County Employees' Retirement Association
27
EXHIBIT A (continued) Table of Plan Coverage iv. PEPRA General Tier 2 Year Ended June 30
Category 2014 2013 Change From
Prior Year Active members in valuation:
Number 755 235 221.3% Average age 35.8 35.2 N/A Average service 0.7 0.2 N/A Projected total compensation(1) $35,858,216 $11,009,761 225.7% Projected average compensation $47,494 $46,850 1.4% Account balances $2,164,512 $207,028 945.5% Total active vested members 0 0 N/A
Vested terminated members(2) 64 12 433.3% Retired members:
Number in pay status 0 0 N/A Average age N/A N/A N/A Average monthly benefit(3) N/A N/A N/A
Disabled members: Number in pay status 0 0 N/A Average age N/A N/A N/A Average monthly benefit(3) N/A N/A N/A
Beneficiaries: Number in pay status 0 0 N/A Average age N/A N/A N/A Average monthly benefit(3) N/A N/A N/A
(1) Calculated by increasing annualized bi-weekly compensation rates as of valuation date by one-half year of inflation and “across the board” salary increases.
(2) Includes terminated members with member contributions on deposit. (3) Excludes vested fixed supplemental and supplemental medical benefit amounts.
MASTER PAGE NO. 283

SECTION 3: Supplemental Information for the Ventura County Employees' Retirement Association
28
EXHIBIT A (continued) Table of Plan Coverage v. Safety Year Ended June 30
Category 2014 2013 Change From
Prior Year Active members in valuation:
Number 1,471 1,502 -2.1% Average age 41.9 41.2 N/A Average service 14.6 13.9 N/A Projected total compensation(1) $160,074,949 $162,085,238 -1.2% Projected average compensation $108,820 $107,913 0.8% Account balances $161,930,571 $153,365,442 5.6% Total active vested members 1,274 1,260 1.1%
Vested terminated members(2) 284 271 4.8% Retired members:
Number in pay status 677 658 2.9% Average age 65.7 65.2 N/A Average monthly benefit(3) $7,141 $6,981 2.3%
Disabled members: Number in pay status 385 378 1.9% Average age 63.4 63.1 N/A Average monthly benefit(3) $5,044 $4,967 1.6%
Beneficiaries: Number in pay status 217 206 5.3% Average age 67.3 67.3 N/A Average monthly benefit(3) $2,805 $2,801 0.1%
(1) Calculated by increasing annualized bi-weekly compensation rates as of valuation date by one-half year of inflation and “across the board” salary increases.
(2) Includes terminated members with member contributions on deposit. (3) Excludes vested fixed supplemental and supplemental medical benefit amounts.
MASTER PAGE NO. 284

SECTION 3: Supplemental Information for the Ventura County Employees' Retirement Association
29
EXHIBIT A (continued) Table of Plan Coverage vi. PEPRA Safety Year Ended June 30
Category 2014 2013 Change From
Prior Year Active members in valuation:
Number 67 3 2133.3% Average age 28.9 31.8 N/A Average service 0.7 0.2 N/A Projected total compensation(1) $3,803,268 $170,918 2125.2% Projected average compensation $56,765 $56,973 -0.4% Account balances $335,236 $4,103 8070.5% Total active vested members 0 0 N/A
Vested terminated members(2) 3 0 N/A Retired members:
Number in pay status 0 0 N/A Average age N/A N/A N/A Average monthly benefit(3) N/A N/A N/A
Disabled members: Number in pay status 0 0 N/A Average age N/A N/A N/A Average monthly benefit(3) N/A N/A N/A
Beneficiaries: Number in pay status 0 0 N/A Average age N/A N/A N/A Average monthly benefit(3) N/A N/A N/A
(1) Calculated by increasing annualized bi-weekly compensation rates as of valuation date by one-half year of inflation and “across the board” salary increases.
(2) Includes terminated members with member contributions on deposit. (3) Excludes vested fixed supplemental and supplemental medical benefit amounts.
MASTER PAGE NO. 285

SECTION 3: Supplemental Information for the Ventura County Employees' Retirement Association
30
EXHIBIT B Members in Active Service and Projected Average Compensation as of June 30, 2014 By Age and Years of Service i. General Tier 1
Years of Service
Age Total 0-4 5-9 10-14 15-19 20-24 25-29 30-34 35-39 40 & over Under 25 - - - - - - - - - - - - - - - - - - - -
- - - - - - - - - - - - - - - - - - - - 25 - 29 - - - - - - - - - - - - - - - - - - - -
- - - - - - - - - - - - - - - - - - - - 30 - 34 - - - - - - - - - - - - - - - - - - - -
- - - - - - - - - - - - - - - - - - - - 35 - 39 - - - - - - - - - - - - - - - - - - - -
- - - - - - - - - - - - - - - - - - - - 40 - 44 - - - - - - - - - - - - - - - - - - - -
- - - - - - - - - - - - - - - - - - - - 45 - 49 2 - - - - 1 1 - - - - - - - - - -
$194,294 - - - - $175,942 $212,646 - - - - - - - - - - 50 - 54 9 - - - - 1 - - 2 2 1 3 - -
147,943 - - - - 201,280 - - $211,322 $191,155 $62,462 $87,597 - - 55 - 59 30 - - 1 3 1 1 1 4 19 - -
116,189 - - $171,784 178,404 201,373 226,147 233,843 127,541 84,587 - - 60 - 64 40 - - - - 2 3 5 5 3 17 5
93,193 - - - - 164,931 112,607 150,369 91,708 78,031 73,938 $71,727 65 - 69 7 - - - - - - 1 1 1 1 3 - -
110,587 - - - - - - 86,399 130,728 48,878 176,570 110,510 - - 70 & over 4 - - - - - - - - - - - - - - 2 2
74,129 - - - - - - - - - - - - - - 100,439 47,818 Total 92 - - 1 7 6 9 9 9 44 7
$108,740 - - $171,784 $177,471 $139,706 $170,152 $124,841 $109,254 $83,166 $64,896
MASTER PAGE NO. 286

SECTION 3: Supplemental Information for the Ventura County Employees' Retirement Association
31
EXHIBIT B (continued) Members in Active Service and Projected Average Compensation as of June 30, 2014 By Age and Years of Service ii. General Tier 2
Years of Service
Age Total 0-4 5-9 10-14 15-19 20-24 25-29 30-34 35-39 40 & over Under 25 26 26 - - - - - - - - - - - - - - - -
$48,523 $48,523 - - - - - - - - - - - - - - - - 25 - 29 318 221 97 - - - - - - - - - - - - - -
59,347 60,490 $56,745 - - - - - - - - - - - - - - 30 - 34 636 262 313 61 - - - - - - - - - - - -
69,186 69,474 69,322 $67,255 - - - - - - - - - - - - 35 - 39 670 172 264 196 38 - - - - - - - - - -
71,827 67,634 73,173 73,496 $72,841 - - - - - - - - - - 40 - 44 758 143 260 209 117 28 1 - - - - - -
76,252 71,486 76,539 78,217 79,158 $70,941 $81,383 - - - - - - 45 - 49 842 116 230 223 131 113 27 2 - - - -
77,983 69,253 76,719 79,078 86,050 79,925 70,183 $74,767 - - - - 50 - 54 965 116 229 225 127 150 81 37 - - - -
78,668 72,797 74,751 77,984 82,102 81,413 87,417 83,410 - - - - 55 - 59 878 95 193 171 130 135 98 55 1 - -
80,042 73,247 75,204 77,296 81,858 82,494 88,521 91,384 $107,570 - - 60 - 64 536 54 122 120 77 86 46 30 1 - -
77,523 69,920 76,144 75,748 81,847 76,644 85,992 82,791 64,312 - - 65 - 69 151 13 44 30 24 23 12 4 1 - -
78,172 75,468 70,874 84,033 75,915 78,205 99,121 66,240 108,399 - - 70 & over 45 4 14 12 4 3 5 3 - - - -
72,146 83,501 68,955 75,760 60,107 76,818 68,100 75,567 - - - - Total 5,825 1,222 1,766 1,247 648 538 270 131 3 - -
$75,282 $68,097 $73,087 $76,803 $81,381 $79,902 $85,992 $85,780 $93,427 - -
MASTER PAGE NO. 287

SECTION 3: Supplemental Information for the Ventura County Employees' Retirement Association
32
EXHIBIT B Members in Active Service and Projected Average Compensation as of June 30, 2014 By Age and Years of Service iii. PEPRA General Tier 2
Years of Service
Age Total 0-4 5-9 10-14 15-19 20-24 25-29 30-34 35-39 40 & over Under 25 95 95 - - - - - - - - - - - - - - - -
$36,725 $36,725 - - - - - - - - - - - - - - - - 25 - 29 196 196 - - - - - - - - - - - - - - - -
43,758 43,758 - - - - - - - - - - - - - - - - 30 - 34 145 145 - - - - - - - - - - - - - - - -
48,691 48,691 - - - - - - - - - - - - - - - - 35 - 39 92 92 - - - - - - - - - - - - - - - -
48,447 48,447 - - - - - - - - - - - - - - - - 40 - 44 69 69 - - - - - - - - - - - - - - - -
48,647 48,647 - - - - - - - - - - - - - - - - 45 - 49 54 54 - - - - - - - - - - - - - - - -
52,891 52,891 - - - - - - - - - - - - - - - - 50 - 54 44 44 - - - - - - - - - - - - - - - -
57,742 57,742 - - - - - - - - - - - - - - - - 55 - 59 40 40 - - - - - - - - - - - - - - - -
56,438 56,438 - - - - - - - - - - - - - - - - 60 - 64 13 13 - - - - - - - - - - - - - - - -
58,811 58,811 - - - - - - - - - - - - - - - - 65 - 69 7 7 - - - - - - - - - - - - - - - -
71,400 71,400 - - - - - - - - - - - - - - - - 70 & over - - - - - - - - - - - - - - - - - - - -
- - - - - - - - - - - - - - - - - - - - Total 755 755 - - - - - - - - - - - - - - - -
$47,494 $47,494 - - - - - - - - - - - - - - - -
MASTER PAGE NO. 288

SECTION 3: Supplemental Information for the Ventura County Employees' Retirement Association
33
EXHIBIT B (continued) Members in Active Service and Projected Average Compensation as of June 30, 2014 By Age and Years of Service iv. Safety
Years of Service
Age Total 0-4 5-9 10-14 15-19 20-24 25-29 30-34 35-39 40 & Over Under 25 20 20 - - - - - - - - - - - - - - - -
$77,870 $77,870 - - - - - - - - - - - - - - - - 25 - 29 144 95 49 - - - - - - - - - - - - - -
83,117 79,062 $90,978 - - - - - - - - - - - - - - 30 - 34 227 43 149 35 - - - - - - - - - - - -
96,529 86,537 99,307 $96,979 - - - - - - - - - - - - 35 - 39 243 16 77 104 46 - - - - - - - - - -
105,401 96,954 102,777 101,913 $120,618 - - - - - - - - - - 40 - 44 278 13 30 68 125 42 - - - - - - - -
111,784 100,376 104,752 102,104 114,679 $127,394 - - - - - - - - 45 - 49 241 4 15 50 77 57 37 1 - - - -
115,888 105,439 103,750 100,871 117,804 123,231 $127,142 $108,281 - - - - 50 - 54 198 2 4 10 25 41 73 43 - - - -
126,259 125,780 91,793 98,571 113,949 123,270 130,564 138,623 - - - - 55 - 59 92 4 4 3 9 16 27 22 7 - -
126,520 131,899 138,981 94,009 99,754 114,073 129,364 130,999 $168,085 - - 60 - 64 28 - - 4 4 3 5 8 1 3 - -
120,712 - - 140,934 105,387 121,951 106,486 117,380 132,892 141,478 - - 65 - 69 - - - - - - - - - - - - - - - - - - - -
- - - - - - - - - - - - - - - - - - - - 70 & over
- - - - - - - - - - - - - - - - - - - -
- - - - - - - - - - - - - - - - - - - - Total 1,471 197 332 274 285 161 145 67 10 - -
$108,820 $85,515 $100,464 $100,982 $116,023 $122,897 $128,740 $135,581 $160,103 - -
MASTER PAGE NO. 289

SECTION 3: Supplemental Information for the Ventura County Employees' Retirement Association
34
EXHIBIT B Members in Active Service and Projected Average Compensation as of June 30, 2014 By Age and Years of Service v. PEPRA Safety
Years of Service
Age Total 0-4 5-9 10-14 15-19 20-24 25-29 30-34 35-39 40 & over Under 25 19 19 - - - - - - - - - - - - - - - -
$54,627 $54,627 - - - - - - - - - - - - - - - - 25 - 29 31 31 - - - - - - - - - - - - - - - -
55,438 55,438 - - - - - - - - - - - - - - - - 30 - 34 10 10 - - - - - - - - - - - - - - - -
51,404 51,404 - - - - - - - - - - - - - - - - 35 - 39 2 2 - - - - - - - - - - - - - - - -
39,250 39,250 - - - - - - - - - - - - - - - - 40 - 44 2 2 - - - - - - - - - - - - - - - -
62,098 62,098 - - - - - - - - - - - - - - - - 45 - 49 1 1 - - - - - - - - - - - - - - - -
85,670 85,670 - - - - - - - - - - - - - - - - 50 - 54 1 1 - - - - - - - - - - - - - - - -
138,077 138,077 - - - - - - - - - - - - - - - - 55 - 59 1 1 - - - - - - - - - - - - - - - -
106,313 106,313 - - - - - - - - - - - - - - - - 60 - 64 - - - - - - - - - - - - - - - - - - - -
- - - - - - - - - - - - - - - - - - - - 65 - 69 - - - - - - - - - - - - - - - - - - - -
- - - - - - - - - - - - - - - - - - - - 70 & over - - - - - - - - - - - - - - - - - - - -
- - - - - - - - - - - - - - - - - - - - Total 67 67 - - - - - - - - - - - - - - - -
$56,765 $56,765 - - - - - - - - - - - - - - - -
MASTER PAGE NO. 290

SECTION 3: Supplemental Information for the Ventura County Employees' Retirement Association
35
EXHIBIT C Reconciliation of Member Data – June 30, 2013 to June 30, 2014
Active
Members
Vested Terminated Members(1) Pensioners Disableds Beneficiaries Total
Number as of June 30, 2013 8,068 2,249 4,259 828 801 16,205 New members 667 75 0 0 72 814 Terminations – with vested rights -215 215 0 0 0 0 Contributions refunds -110 -77 0 0 0 -187 Retirements -201 -91 292 0 0 0 New disabilities -13 -2 -12 27 0 0 Return to work 23 -22 -1 0 0 0 Died with or without beneficiary -9 -8 -88 -19 -40 -164 Data adjustments 0 0 2 1 -1 2
Number as of June 30, 2014 8,210 2,339 4,452 837 832 16,670
(1) Includes terminated members with member contributions on deposit.
MASTER PAGE NO. 291

SECTION 3: Supplemental Information for the Ventura County Employees' Retirement Association
36
EXHIBIT D Summary Statement of Income and Expenses on an Actuarial Value Basis
Year Ended June 30, 2014 Year Ended June 30, 2013 Contribution income:
Employer contributions $169,703,083 $150,687,842 Member contributions 46,674,443 44,463,983
Contribution income $216,377,526 $195,151,825 Investment income:
Interest, dividends and other income $49,344,497 $50,691,908 Adjustment toward market value (1) 305,935,366 200,561,615 Less investment and administrative fees (16,936,134) (13,971,026)
Net investment income $338,343,729 $237,282,497 Total income available for benefits $554,721,255 $432,434,322
Less benefit payments ($223,532,290) ($209,957,957)
Change in reserve for future benefits $331,188,965 $222,476,365
(1) Equals the “non-cash” earnings on investments included in the Actuarial Value of Assets.
MASTER PAGE NO. 292

SECTION 3: Supplemental Information for the Ventura County Employees' Retirement Association
37
EXHIBIT E Summary Statement of Net Assets
Year Ended June 30, 2014 Year Ended June 30, 2013 Cash equivalents $63,604,211 $63,940,819 Pension software development cost 6,459,436 3,443,718 Accounts receivable:
Member and employer contributions $5,691,835 $4,487,879 Accrued interest and dividends 3,358,253 3,537,646 Securities sold $23,833,386 24,075,489 Other 16,979 14,078
Total accounts receivable $32,900,453 $32,115,092 Investments:
Equities $2,490,857,698 $2,299,255,552 Fixed income 970,048,742 884,109,813 Real estate 306,840,325 283,379,695 Investments received on securities lending 62,402,546 50,542,569 Others 428,072,939 109,469,955
Total investments at market value $4,258,222,250 $3,626,757,584 Total assets $4,361,186,350 $3,726,257,213
Liabilities: Securities lending ($62,402,546) ($50,542,569) Security purchases (21,181,466) (45,685,949) Accounts payable (2,689,643) (2,497,655) Prepaid contributions (26,831) (25,573)
Total liabilities ($86,300,486) ($98,751,746)
Net assets at market value $4,274,885,864 $3,627,505,467 Net assets at actuarial value $3,964,814,499 $3,633,625,534 Net assets at valuation value $3,910,800,797 $3,621,708,536
MASTER PAGE NO. 293

SECTION 3: Supplemental Information for the Ventura County Employees' Retirement Association
38
EXHIBIT F Actuarial Balance Sheet
An overview of the Plan’s funding is given by an Actuarial Balance Sheet. In this approach, we first determine the amount and timing of all future payments that will be made by the Plan for current participants. We then discount these payments at the valuation interest rate to the date of the valuation, thereby determining their present value. We refer to this present value as the “liability” of the Plan.
Second, we determine how this liability will be met. These actuarial “assets” include the net amount of assets already accumulated by the Plan, the present value of future member contributions, the present value of future employer normal cost contributions, and the present value of future employer amortization payments for the unfunded actuarial accrued liability.
Actuarial Balance Sheet ($ in 000s) Assets June 30, 2014 June 30, 2013 1. Total valuation value of assets $3,910,801 $3,621,709
2. Present value of future contributions by members 449,384 444,668
3. Present value of future employer contributions for:
a. Entry age normal cost $514,554 524,833
b. Unfunded actuarial accrued liability 820,215 953,354
4. Total current and future assets $5,694,954 $5,544,564
Liabilities 5. Present value of benefits for retirees and beneficiaries $2,646,710 $2,549,515
6. Present value of benefits for vested terminated members 127,447 131,431
7. Present value of benefits for active members 2,920,797 2,863,618
8. Total liabilities $5,694,954 $5,544,564
MASTER PAGE NO. 294

SECTION 3: Supplemental Information for the Ventura County Employees' Retirement Association
39
EXHIBIT G Summary of Allocated Reserves
Reserves
June 30, 2014 June 30, 2013 Member contributions reserve (1) $611,920,699 $584,474,197 Employer advance reserve (1) 1,886,562,740 1,664,856,154 Offset: Interest crediting shortfall tracking account (1) (889,356,718) (824,240,436) Retiree reserve (1) 2,150,677,421 2,051,529,206 Supplemental death benefit reserve (1) 13,897,630 13,408,521 Vested fixed supplemental ($108.44) reserve (1) 134,434,076 131,680,894 Undistributed earnings (1) 2,664,949 0
Valuation reserves $3,910,800,797 $3,621,708,536
Supplemental medical ($27.50) reserve (2) 10,401,838 11,916,998 Contingency reserve (2) 43,611,864 0 Total reserves (actuarial value) $3,964,814,499 $3,633,625,534 Market stabilization reserve (2) 310,071,365 (6,120,067)
Net market value $4,274,885,864 $3,627,505,467
(1) Included in valuation value of assets. (2) Not included in valuation value of assets.
MASTER PAGE NO. 295

SECTION 3: Supplemental Information for the Ventura County Employees' Retirement Association
40
EXHIBIT H Development of Unfunded/(Overfunded) Actuarial Accrued Liability for Year Ended June 30, 2014
1. Unfunded actuarial accrued liability at beginning of year $953,354,000 2. Total Normal Cost payable at middle of year 125,613,000 3. Expected employer and member contributions (237,819,000) 4. Interest (whole year on (1) plus half year on (2) + (3)) 66,551,000 5. Expected unfunded actuarial accrued liability at end of year $907,699,000 6. Actuarial (gain)/loss due to all changes: (a) Investment return $(13,827,000) (b) Actual contributions less than expected 22,257,000 (c) Lower than expected individual salary increases (56,617,000) (d) Lower than expected COLA benefit increase for retirees and beneficiaries (37,292,000) (e) Other experience (2,005,000) Total changes $(87,484,000)
7. Unfunded actuarial accrued liability at end of year $820,215,000
Note: Net gain from other experience of $95.9 million (as shown on page 8) is equal to: 6(c) + 6(d) + 6(e).
MASTER PAGE NO. 296

SECTION 3: Supplemental Information for the Ventura County Employees' Retirement Association
41
EXHIBIT I Table of Amortization Bases
Date Established Source Initial
Amount Outstanding
Balance Years
Remaining Payment
General Tier 1 June 30, 2004 Restart of Amortization $63,394,000 $37,659,000 5 $8,407,000 June 30, 2005 Actuarial (Gain)/Loss 22,085,000 14,854,000 6 2,811,000 June 30, 2006 Actuarial (Gain)/Loss 7,048,000 5,219,000 7 861,000 June 30, 2006 Assumption Change 41,538,000 30,713,000 7 5,068,000 June 30, 2007 Actuarial (Gain)/Loss (19,901,000) (15,864,000) 8 (2,330,000) June 30, 2008 Actuarial (Gain)/Loss (18,128,000) (15,340,000) 9 (2,036,000) June 30, 2009 Actuarial (Gain)/Loss 55,190,000 48,942,000 10 5,946,000 June 30, 2009 Assumption Change 18,574,000 16,462,000 10 2,000,000 June 30, 2010 Actuarial (Gain)/Loss 50,018,000 46,022,000 11 5,168,000 June 30, 2011 Actuarial (Gain)/Loss 36,225,000 34,317,000 12 3,591,000 June 30, 2012 Actuarial (Gain)/Loss 29,865,000 28,924,000 13 2,840,000 June 30, 2012 Demographic Assumption Change 38,104,000 38,277,000 18 2,942,000 June 30, 2012 Economic Assumption Change 19,517,000 19,606,000 18 1,507,000 June 30, 2013 Actuarial (Gain)/Loss 31,670,000 31,240,000 14 2,895,000 June 30, 2014 Actuarial (Gain)/Loss 16,119,000 16,119,000 15 1,417,000 $337,150,000 $41,087,000 General Tier 2 June 30, 2004 Restart of Amortization $49,731,000 $29,549,000 5 $6,597,000 June 30, 2005 Actuarial (Gain)/Loss 7,622,000 5,133,000 6 971,000 June 30, 2006 Actuarial (Gain)/Loss (9,108,000) (6,738,000) 7 (1,112,000) June 30, 2006 Assumption Change 19,085,000 14,112,000 7 2,329,000 June 30, 2006 Plan Provision Change 14,731,000 10,885,000 7 1,796,000 June 30, 2007 Actuarial (Gain)/Loss (39,508,000) (31,502,000) 8 (4,626,000) June 30, 2008 Actuarial (Gain)/Loss (34,794,000) (29,435,000) 9 (3,907,000) June 30, 2009 Actuarial (Gain)/Loss 71,253,000 63,179,000 10 7,675,000 June 30, 2009 Assumption Change 22,696,000 20,118,000 10 2,444,000 June 30, 2010 Actuarial (Gain)/Loss 47,615,000 43,817,000 11 4,920,000 June 30, 2011 Actuarial (Gain)/Loss (6,949,000) (6,599,000) 12 (691,000) June 30, 2012 Actuarial (Gain)/Loss (18,106,000) (17,539,000) 13 (1,722,000) June 30, 2012 Demographic Assumption Change 29,420,000 29,550,000 18 2,271,000 June 30, 2012 Economic Assumption Change 32,874,000 33,028,000 18 2,539,000 June 30, 2013 Actuarial (Gain)/Loss (23,823,000) (23,509,000) 14 (2,179,000) June 30, 2014 Actuarial (Gain)/Loss (49,125,000) (49,125,000) 15 (4,319,000) $84,924,000 $12,986,000
MASTER PAGE NO. 297

SECTION 3: Supplemental Information for the Ventura County Employees' Retirement Association
42
EXHIBIT I (continued)
Table of Amortization Bases
Date Established Source Initial
Amount Outstanding
Balance Years
Remaining Payment
Safety June 30, 2004 Restart of Amortization $210,319,000 $124,936,000 5 $27,892,000 June 30, 2005 Actuarial (Gain)/Loss 19,142,000 12,875,000 6 2,437,000 June 30, 2006 Actuarial (Gain)/Loss 3,418,000 2,521,000 7 416,000 June 30, 2006 Assumption Change 42,167,000 31,180,000 7 5,145,000 June 30, 2007 Actuarial (Gain)/Loss (37,489,000) (29,880,000) 8 (4,388,000) June 30, 2008 Actuarial (Gain)/Loss (22,443,000) (18,975,000) 9 (2,519,000) June 30, 2009 Actuarial (Gain)/Loss 78,157,000 69,300,000 10 8,419,000 June 30, 2009 Assumption Change 49,982,000 44,319,000 10 5,384,000 June 30, 2010 Actuarial (Gain)/Loss 108,448,000 99,804,000 11 11,207,000 June 30, 2011 Actuarial (Gain)/Loss 8,879,000 8,418,000 12 881,000 June 30, 2012 Actuarial (Gain)/Loss (7,501,000) (7,255,000) 13 (712,000) June 30, 2012 Demographic Assumption Change 55,513,000 55,772,000 18 4,287,000 June 30, 2012 Economic Assumption Change 51,887,000 52,119,000 18 4,006,000 June 30, 2013 Actuarial (Gain)/Loss 7,588,000 7,485,000 14 694,000 June 30, 2014 Actuarial (Gain)/Loss (54,478,000) (54,478,000) 15 (4,789,000) $398,141,000 $58,360,000 Total VCERA June 30, 2004 Restart of Amortization $323,444,000 $192,144,000 5 $42,896,000 June 30, 2005 Actuarial (Gain)/Loss 48,849,000 32,862,000 6 6,219,000 June 30, 2006 Actuarial (Gain)/Loss 1,358,000 1,002,000 7 165,000 June 30, 2006 Assumption Change 102,790,000 76,005,000 7 12,542,000 June 30, 2006 Plan Provision Change 14,731,000 10,885,000 7 1,796,000 June 30, 2007 Actuarial (Gain)/Loss (96,898,000) (77,246,000) 8 (11,344,000) June 30, 2008 Actuarial (Gain)/Loss (75,365,000) (63,750,000) 9 (8,462,000) June 30, 2009 Actuarial (Gain)/Loss 204,600,000 181,421,000 10 22,040,000 June 30, 2009 Assumption Change 91,252,000 80,899,000 10 9,828,000 June 30, 2010 Actuarial (Gain)/Loss 206,081,000 189,643,000 11 21,295,000 June 30, 2011 Actuarial (Gain)/Loss 38,155,000 36,136,000 12 3,781,000 June 30, 2012 Actuarial (Gain)/Loss 4,258,000 4,130,000 13 406,000 June 30, 2012 Demographic Assumption Change 123,037,000 123,599,000 18 9,500,000 June 30, 2012 Economic Assumption Change 104,278,000 104,753,000 18 8,052,000 June 30, 2013 Actuarial (Gain)/Loss 15,435,000 15,216,000 14 1,410,000 June 30, 2014 Actuarial (Gain)/Loss (87,484,000) (87,484,000) 15 (7,691,000) $820,215,000 $112,433,000
MASTER PAGE NO. 298

SECTION 3: Supplemental Information for the Ventura County Employees' Retirement Association
43
Section 415 of the Internal Revenue Code (IRC) specifies the maximum benefits that may be paid to an individual from a defined benefit plan and the maximum amounts that may be allocated each year to an individual’s account in a defined contribution plan.
A qualified pension plan may not pay benefits in excess of the Section 415 limits. The ultimate penalty for non-compliance is disqualification: active participants could be taxed on their vested benefits and the IRS may seek to tax the income earned on the plan’s assets.
In particular, Section 415(b) of the IRC limits the maximum annual benefit payable at the Normal Retirement Age to a dollar limit of $160,000 indexed for inflation. That limit is $210,000 for 2014 and 2015. Normal Retirement Age for these purposes is age 62. These are the limits in simplified terms. They must be adjusted based on each participant’s circumstances, for such things as age at retirement, form of benefits chosen and after tax contributions. Limits are also affected by the “grandfather” election under Section 415(b)(10).
For Non-PEPRA members, benefits in excess of the limits may be paid through a qualified governmental excess plan that meets the requirements of Section 415(m).
Legal Counsel’s review and interpretation of the law and regulations should be sought on any questions in this regard.
Contribution rates determined in this valuation have not been reduced for the Section 415 limitations. Actual limitations will result in gains as they occur.
EXHIBIT J Section 415 Limitations
MASTER PAGE NO. 299

SECTION 3: Supplemental Information for the Ventura County Employees' Retirement Association
44
The following list defines certain technical terms for the convenience of the reader:
Assumptions or Actuarial Assumptions: The estimates on which the cost of the Plan is calculated including:
(a) Investment return — the rate of investment yield that the Plan will earn over the long-term future;
(b) Mortality rates — the death rates of employees and pensioners; life expectancy is based on these rates;
(c) Retirement rates — the rate or probability of retirement at a given age;
(d) Turnover rates — the rates at which employees of various ages are expected to leave employment for reasons other than death, disability, or retirement.
Normal Cost: The amount of contributions required to fund the cost allocated to the current year of service.
Actuarial Accrued Liability for Actives: The equivalent of the accumulated normal costs allocated to the years before the
valuation date.
Actuarial Accrued Liability for Pensioners: The single sum value of lifetime benefits to benefits to existing pensioners. This sum
takes account of life expectancies approritate to the ages of the pensioners and the interest that the sum is expected to earn beofre it is entirely paid out in benefits.
EXHIBIT K Definitions of Pension Terms
MASTER PAGE NO. 300

SECTION 3: Supplemental Information for the Ventura County Employees' Retirement Association
45
Unfunded/(Overfunded) Actuarial Accrued Liability: The extent to which the actuarial accrued liability of the Plan exceeds (or is exceeded
by) the assets of the Plan.
Amortization of the Unfunded/ (Overfunded) Actuarial Accrued Liability: Payments made over a period of years equal in value to the Plan’s unfunded or
overfunded actuarial accrued liability.
Investment Return: The rate of earnings of the Plan from its investments, including interest, dividends and capital gain and loss adjustments, computed as a percentage of the average value of the fund. For actuarial purposes, the investment return often reflects a smoothing of the market gains and losses to avoid significant swings in the value of assets from one year to the next.
Payroll or Compensation: Compensation Earnable and Pensionable Compensation expected to be paid to active members during the twelve months following the valuation date. Only Compensation Earnable and Pensionable Compensation that would possibly go into the determination of retirement benefits are included.
MASTER PAGE NO. 301

SECTION 4: Reporting Information for the Ventura County Employees' Retirement Association
46
EXHIBIT I Summary of Actuarial Valuation Results
The valuation was made with respect to the following data supplied to us: 1. Retired members as of the valuation date (including 832 beneficiaries in pay status) 6,121 2. Members inactive during year ended June 30, 2014 with vested rights(1) 2,339 3. Members active during the year ended June 30, 2014 8,210
The actuarial factors as of the valuation date are as follows (amounts in 000s):
1. Normal cost $125,640 2. Present value of future benefits 5,694,954 3. Present value of future normal costs 963,938 4. Actuarial accrued liability(2) 4,731,016 Retired members and beneficiaries $2,646,710 Inactive members with vested rights(1) 127,447 Active members 1,956,859 5. Valuation value of assets(2) ($4,274,886 at market value as reported by Retirement Association) 3,910,801 6. Unfunded actuarial accrued liability $820,215 (1) Includes terminated members with member contributions on deposit. (2) Excludes liabilities and assets held for supplemental medical benefit reserve and statutory contingency reserve.
MASTER PAGE NO. 302

SECTION 4: Reporting Information for the Ventura County Employees' Retirement Association
47
EXHIBIT I (continued) Summary of Actuarial Valuation Results
The determination of the recommended average employer contribution is as follows (amounts in 000s): Dollar Amount % of Payroll 1. Total normal cost $125,640 19.38% 2. Expected employee contributions -55,795 -8.61% 3. Employer normal cost: (1) + (2) $69,845 10.77% 4. Amortization of unfunded actuarial accrued liability 112,428 17.34% 5. Total recommended average employer contribution: (3) + (4) $182,273 28.11% 6. Projected compensation $648,257
MASTER PAGE NO. 303

SECTION 4: Reporting Information for the Ventura County Employees' Retirement Association
48
EXHIBIT II Supplementary Information Required by GASB 27 – Schedule of Employer Contributions
Plan Year Ended June 30
Annual Required Contributions
Actual Contributions
Percentage Contributed
2009 $105,278,000 $105,278,000 100.0% 2010 97,324,000 97,324,000 100.0% 2011 111,585,000 111,585,000 100.0% 2012 132,386,000 132,386,000 100.0% 2013 142,370,000 142,370,000 100.0% 2014 161,247,000 161,247,000 100.0%
MASTER PAGE NO. 304

SECTION 4: Reporting Information for the Ventura County Employees' Retirement Association
49
EXHIBIT III Supplementary Information Required by GASB 27 – Schedule of Funding Progress
Actuarial Valuation
Date
Valuation Value
of Assets(1) (a)
Actuarial Accrued Liability
(AAL)(2) (b)
Unfunded/ (Overfunded)
AAL (UAAL) (b) - (a)
Funded Ratio
(a) / (b)
Covered Payroll
(c)
UAAL as a Percentage of
Covered Payroll
[(b) - (a) / (c)] 06/30/2009 $3,090,148,000 $3,663,701,000 $573,553,000 84.34% $634,777,000 90.36% 06/30/2010 3,115,984,000 3,877,443,000 761,459,000 80.36% 654,829,000 116.28% 06/30/2011 3,220,388,000 3,995,352,000 774,964,000 80.60% 637,037,000 121.65% 06/30/2012 3,397,360,000 4,373,227,000 975,867,000 77.69% 633,848,000 153.96% 06/30/2013 3,621,709,000 4,575,063,000 953,354,000 79.16% 638,764,000 149.25% 06/30/2014 3,910,801,000 4,731,016,000 820,215,000 82.66% 648,257,000 126.53%
(1) Excludes assets for supplemental medical benefit reserve and statutory contingency reserve. (2) Excludes liabilities held for supplemental medical benefit reserve and statutory contingency reserve.
MASTER PAGE NO. 305

SECTION 4: Reporting Information for the Ventura County Employees' Retirement Association
50
EXHIBIT IV Supplementary Information Required by GASB 27
Valuation date June 30, 2014 Actuarial cost method Entry Age Actuarial Cost Method Amortization method Level percent of payroll (4.00% payroll growth assumed) Remaining amortization period 15 years for UAAL as of June 30, 2004. Any changes in UAAL after June 30, 2004 are
separately amortized over a 15-year closed period effective with that valuation. Effective June 30, 2012, any changes in UAAL due to actuarial gains or losses or due to plan amendments (with the exception of a change due to retirement incentives) will be amortized over a 15-year closed period effective with that valuation (up to a 5-year closed period for retirement incentives). Any change in UAAL due to changes in actuarial assumptions or methods will be amortized over a 20-year closed period effective with that valuation.
Asset valuation method Market value of assets less unrecognized returns in each of the last ten semi-annual accounting periods. Unrecognized returns are equal to the difference between the actual market return and the expected return on market value and are recognized over a five-year period. The Actuarial Value of Assets is reduced by the value of the supplemental medical benefit reserve and statutory contingency reserve. Deferred gains and losses as of June 30, 2011 have been combined and will be recognized in equal amounts over a period of four and a half years from that date.
Actuarial assumptions: Investment rate of return 7.75%(1) Projected salary increases 4.50% - 12.50%(2) varying by service Cost of living adjustments For General Tier 1 and Safety, 3% (actual increases are contingent upon CPI increases with a
3.00% maximum). For General Tier 2, SEIU members receive a fixed 2% cost-of-living adjustment not subject to CPI increases that applies to future service after March 2003.
Plan membership: Retired members and beneficiaries receiving benefits 6,121 Terminated members entitled to, but not yet receiving benefits(3) 2,339 Active members 8,210 Total 16,670
(1) Includes inflation at 3.25%. (2) Includes inflation at 3.25%, “across the board” increases of 0.75%, plus merit and longevity increases. See Exhibit V for these increases. (3) Includes terminated members with member contributions on deposit.
MASTER PAGE NO. 306

SECTION 4: Reporting Information for the Ventura County Employees' Retirement Association
51
EXHIBIT V Actuarial Assumptions and Methods
Actuarial Assumptions
Post – Retirement Mortality Rates:
Healthy: For all Members: RP-2000 Combined Healthy Mortality Table projected with Scale AA to 2025 set back one year.
Disabled: For General Members: RP-2000 Combined Healthy Mortality Table projected with Scale AA to 2025 set forward five years for males and seven years for females.
For Safety Members: RP-2000 Combined Healthy Mortality Table projected with Scale AA to 2025 set back one year.
The RP-2000 mortality tables projected with Scale AA to 2010 and adjusted by the applicable set backs and set forwards shown above reasonably reflect the projected mortality experience as of the measurement date. The additional projection to 2025 is a provision for future mortality improvements.
Beneficiaries: Beneficiaries are assumed to have the same mortality as a General Member of the opposite sex who has taken a service (non-disability) retirement.
Member Contribution Rates: For General Members: RP-2000 Combined Healthy Mortality Table projected with Scale AA to 2025 set back one year weighted 35% male and 65% female.
For Safety Members: RP-2000 Combined Healthy Mortality Table projected with Scale AA to 2025 set back one year weighted 80% male and 20% female.
MASTER PAGE NO. 307

SECTION 4: Reporting Information for the Ventura County Employees' Retirement Association
52
Termination Rates Before Retirement: Rate (%) Mortality
General Safety Age Male Female Male Female 25 0.03 0.01 0.03 0.01 30 0.04 0.02 0.04 0.02 35 0.06 0.03 0.06 0.03 40 0.09 0.04 0.09 0.04 45 0.10 0.07 0.10 0.07 50 0.13 0.10 0.13 0.10 55 0.19 0.19 0.19 0.19 60 0.40 0.39 0.40 0.39 65 0.79 0.76 0.79 0.76
All pre-retirement deaths are assumed to be non-duty related.
MASTER PAGE NO. 308

SECTION 4: Reporting Information for the Ventura County Employees' Retirement Association
53
Termination Rates Before Retirement (continued):
Rate (%) Disability
Age General(1) Safety(2)
25 0.02 0.14 30 0.04 0.26 35 0.08 0.48 40 0.13 0.90 45 0.21 1.16 50 0.40 1.98 55 0.56 3.40 60 0.69 4.60 65 0.90 0.00 70 1.00 0.00
(1) 40% of General disabilities are assumed to be duty disabilities and the other 60% are assumed to be ordinary disabilities.
(2) 90% of Safety disabilities are assumed to be duty disabilities and the other 10% are assumed to be ordinary disabilities.
MASTER PAGE NO. 309

SECTION 4: Reporting Information for the Ventura County Employees' Retirement Association
54
Termination Rates Before Retirement (continued):
Rate (%) Withdrawal (Less than Five Years of Service)* Years of Service General Safety
0 15.00 12.00 1 10.00 6.00 2 8.00 5.50 3 7.00 5.00 4 6.00 4.00
Withdrawal (Five or More Years of Service)* Age General Safety
20 6.00 4.00 25 6.00 4.00 30 5.70 3.40 35 4.90 2.40 40 3.90 1.40 45 2.90 0.70 50 2.20 0.20 55 1.70 0.00 60 1.20 0.00 65 1.00 0.00 70 0.00 0.00
* The greater of a refund of member contributions and a deferred annuity is valued when a member withdraws.
No withdrawal is assumed after a member is first assumed to retire.
MASTER PAGE NO. 310

SECTION 4: Reporting Information for the Ventura County Employees' Retirement Association
55
Retirement Rates:
Age
General Tier 1 and 2 PEPRA
General Tier 1 and 2
Safety
PEPRA Safety 40 0.00 0.00 1.00 0.00 41 0.00 0.00 1.00 0.00 42 0.00 0.00 1.00 0.00 43 0.00 0.00 1.00 0.00 44 0.00 0.00 1.00 0.00 45 0.00 0.00 1.00 0.00 46 0.00 0.00 1.00 0.00 47 0.00 0.00 1.00 0.00 48 0.00 0.00 1.00 0.00 49 0.00 0.00 1.00 0.00 50 3.00 0.00 2.00 4.00 51 3.00 0.00 2.00 2.00 52 4.00 2.00 4.00 5.00 53 4.00 2.00 6.00 8.00 54 6.00 3.00 18.00 18.00 55 6.00 5.00 25.00 20.00 56 7.00 5.00 20.00 20.00 57 8.00 6.00 20.00 18.00 58 10.00 7.00 18.00 18.00 59 10.00 8.00 25.00 30.00 60 14.00 10.00 25.00 30.00 61 18.00 12.50 30.00 30.00 62 22.00 20.00 40.00 50.00 63 20.00 20.00 50.00 50.00 64 25.00 20.00 50.00 50.00 65 35.00 25.00 100.00 100.00 66 35.00 30.00 100.00 100.00 67 35.00 30.00 100.00 100.00 68 25.00 30.00 100.00 100.00 69 20.00 30.00 100.00 100.00 70 20.00 50.00 100.00 100.00 71 20.00 50.00 100.00 100.00 72 20.00 50.00 100.00 100.00 73 20.00 50.00 100.00 100.00 74 40.00 50.00 100.00 100.00 75 100.00 100.00 100.00 100.00
MASTER PAGE NO. 311

SECTION 4: Reporting Information for the Ventura County Employees' Retirement Association
56
Retirement Age and Benefit for Deferred Vested Members: For deferred vested members, we make the following retirement assumption:
General Age: 58 Safety Age: 54
We assume that 50% and 65% of future General and Safety deferred vested members, respectively, will continue to work for a reciprocal employer. For reciprocals, we assume 4.50% compensation increases per annum.
Future Benefit Accruals: 1.0 year of service per year.
Unknown Data for Members: Same as those exhibited by members with similar known characteristics. If not specified, members are assumed to be male.
Definition of Active Members: All active members of VCERA as of the valuation date.
Percent Married: 70% of male members and 50% of female members are assumed to be married at pre-retirement death or retirement. There is no explicit assumption for children’s benefits.
Age of Spouse: Female (or male) spouses are 3 years younger (or older) than their spouses.
Net Investment Return: 7.75%, net of investment and administration expenses.
Member Contribution Crediting Rate: 3.25% (Actual increase is based on projected long term ten-year Treasury rate).
Consumer Price Index: Increase of 3.25% per year; retiree COLA increases due to CPI are subject to a 3.0% maximum change per year for General Tier 1 and Safety. For General Tier 2, SEIU members receive a fixed 2% cost-of-living adjustment, not subject to changes in the CPI, that applies to future service after March 2003.
MASTER PAGE NO. 312

SECTION 4: Reporting Information for the Ventura County Employees' Retirement Association
57
In-Service Redemptions:
Non-PEPRA Formulas The following assumptions for in-service redemptions pay as a percentage of final average compensation are used:
General Tier 1 8.00% General Tier 2 3.50% Safety 7.50%
For determining the cost of the basic benefit (i.e., non-COLA component), the cost of this pay element is currently recognized in the valuation as an employer only cost and does not affect member contribution rates.
PEPRA Formulas None
Salary Increases: Annual Rate of Compensation Increase
Inflation: 3.25% per year; plus “across the board” salary increases of 0.75% per year; plus the following promotional and merit increases: Years of Service General Safety
Less than 1 5.00% 8.50% 1 3.75 6.25 2 3.00 4.75 3 2.50 4.00 4 2.00 3.00 5 1.50 2.50 6 1.00 2.00 7 1.00 1.50 8 0.75 1.25 9 0.50 1.00
10 0.50 0.75 11 0.50 0.75 12 0.50 0.75 13 0.50 0.75 14 0.50 0.75 15 0.50 0.75 16 0.50 0.50 17 0.50 0.50 18 0.50 0.50 19 0.50 0.50
20 and Over 0.50 0.50
MASTER PAGE NO. 313

SECTION 4: Reporting Information for the Ventura County Employees' Retirement Association
58
Increase in the Internal Revenue Code Section 401(a)(17) Compensation Limit: Increase of 3.25% per year from the valuation date.
Increase in Section 7522.10 Compensation Limit: Increase of 3.25% per year from the valuation date.
Actuarial Methods
Actuarial Cost Method: Entry Age Actuarial Cost Method. Entry Age is the age at the member’s hire date. Normal Cost and Actuarial Accrued Liability are calculated on an individual basis and are based on costs allocated as a level percentage of compensation, as if the current benefit formulas have always been in effect (i.e., “replacement life”).
Actuarial Value of Assets: Market value of assets less unrecognized returns in each of the last ten semi-annual accounting periods. Unrecognized returns are equal to the difference between the actual market return and the expected return on market value and are recognized over a five-year period. Deferred gains and losses as of June 30, 2011 have been combined and will be recognized in equal amounts over a period of four and a half years from that date.
Valuation Value of Assets: Actuarial Value of Assets reduced by the value of the supplemental medical benefit reserve and statutory contingency reserve.
Amortization Policy: The UAAL, (i.e., the difference between the Actuarial Accrued Liability and the Valuation Value of Assets), as of June 30, 2011 shall continue to be amortized over separate 15-year period amortization layers based on the valuations during which each separate layer was previously established.
Any new UAAL as a result of actuarial gains or losses identified in the annual valuation as of June 30 will be amortized over a period of 15 years.
Any new UAAL as a result of change in actuarial assumptions or methods will be amortized over a period of 20 years.
Unless an alternative amortization period is recommended by the Actuary and accepted by the Board based on the results of an actuarial analysis:
MASTER PAGE NO. 314

SECTION 4: Reporting Information for the Ventura County Employees' Retirement Association
59
i) with the exception noted in ii., below, the increase in UAAL as a result of any plan amendments will be amortized over a period of 15 years;
ii) the increase in UAAL resulting from a temporary retirement incentive, including the impact of benefits resulting from additional service permitted in Section 31641.04 of the 1937 CERL (Golden Handshake), will be funded over a period of up to 5 years.
The UAAL will be amortized over “closed” amortization periods so that the amortization period for each layer decreases by one year with each actuarial valuation.
The UAAL will be amortized as a level percentage of payroll so that the amortization amount in each year during the amortization period shall be expected to be a level percentage of covered payroll, taking into consideration the current assumption for general payroll increase.
If an overfunding exists (i.e., the total of all UAAL becomes negative so that there is a surplus), such surplus and any subsequent surpluses will be amortized over an “open” amortization period of 30 years. Any prior UAAL amortization layers will be considered fully amortized, and any subsequent UAAL, will be amortized over 15 years as the first of a new series of amortization layers.
These amortization policy components will apply separately to each of VCERA’s UAAL cost groups.
Changes in Actuarial Assumptions and Methods: There have been no changes in actuarial assumptions or methods since the previous
valuation.
MASTER PAGE NO. 315

SECTION 4: Reporting Information for the Ventura County Employees' Retirement Association
60
EXHIBIT VI Summary of Plan Provisions
This exhibit summarizes the major provisions of the VCERA included in the valuation. It is not intended to be, nor should it be interpreted as, a complete statement of all plan provisions.
Membership Eligibility: All regular employees of the County of Ventura or contracting district, scheduled to work 64 or more hours biweekly, are eligible to become a member of the Retirement Association subject to classification below:
General Tier 1 All General members with membership dates before June 30, 1979, plus Deputy Sheriff trainees and certain executive management with membership dates before January 1, 2013.
General Tier 2 All General members with membership dates on or after June 30, 1979 and before January 1, 2013, except as noted above for General Tier 1.
Safety All Safety members with membership dates before January 1, 2013. PEPRA General Tier 1 Deputy Sheriff trainees with membership dates on or after January 1, 2013 and before
April 17, 2014. PEPRA General Tier 2 All General members with membership dates on or after January 1, 2013, except as
noted above for PEPRA General Tier 1. PEPRA Safety All Safety members with membership dates on or after January 1, 2013.
Final Compensation for Benefit Determination:
General Tier 1 and Safety Highest consecutive twelve months of compensation earnable (§31462.1)(FAC1). General Tier 2 Highest consecutive thirty-six months of compensation earnable (§31462)(FAC3). PEPRA General Tier 1, PEPRA General Tier 2 and PEPRA Safety Highest consecutive thirty-six months of pensionable compensation (§7522.32) (FAS3).
MASTER PAGE NO. 316

SECTION 4: Reporting Information for the Ventura County Employees' Retirement Association
61
Compensation Limit: General Tier 1, General Tier 2 and Safety For members with membership dates on or after July 1, 1996, Compensation Earnable
is limited to Internal Revenue Code Section 401(a)(17). The limit for the Plan Year beginning July 1, 2014 is $260,000. The limit is indexed for inflation on an annual basis.
PEPRA General Tier 1, PEPRA General Tier 2 and PEPRA Safety Pensionable Compensation is limited to $115,064 for 2014 ($138,077, if not enrolled
in Social Security). The limit is indexed for inflation on an annual basis.
Service: Years of service. (Yrs)
Service Retirement Eligibility: General Age 50 with 10 years of service, or age 70 regardless of service, or after 30 years,
regardless of age (§31672). Safety Age 50 with 10 years of service, or age 70 regardless of service, or after 20 years,
regardless of age (§31663.25). PEPRA General Age 52 with 5 years of service (§7522.20(a)) or age 70 regardless of service
(§31672.3). PEPRA Safety Age 50 with 5 years of service (§7522.25(d)) or age 70 regardless of service
(§31672.3).
Benefit Formula:
Retirement Age
Benefit Formula General Tier 1 (§31676.11) 50 (1.24%xFAC1 – 1/3x1.24%x$350x12)xYrs 55 (1.67%xFAC1 – 1/3x1.67%x$350x12)xYrs 60 (2.18%xFAC1 – 1/3x2.18%x$350x12)xYrs 62 (2.35%xFAC1 – 1/3x2.35%x$350x12)xYrs 65 or later (2.61%xFAC1 – 1/3x2.61%x$350x12)xYrs
MASTER PAGE NO. 317

SECTION 4: Reporting Information for the Ventura County Employees' Retirement Association
62
Retirement Age Benefit Formula General Tier 2 (§31676.1) 50 (1.18%xFAC3 – 1/3x1.18%x$350x12)xYrs 55 (1.49%xFAC3 – 1/3x1.49%x$350x12)xYrs 60 (1.92%xFAC3 – 1/3x1.92%x$350x12)xYrs 62 (2.09%xFAC3 – 1/3x2.09%x$350x12)xYrs 65 or later (2.43%xFAC3 – 1/3x2.43%x$350x12)xYrs
Retirement Age Benefit Formula PEPRA General Tier 1 and PEPRA General Tier 2 (§7522.20(a)) 52 (1.00%xFAS3 x Yrs) 55 (1.30%xFAS3 x Yrs) 60 (1.80%xFAS3 x Yrs) 62 (2.00%xFAS3 x Yrs) 65 (2.30%xFAS3 x Yrs) 67 or later (2.50%xFAS3 x Yrs)
Retirement Age Benefit Formula Safety (Non-Integrated) (§31664) 50 (2.00%xFAC1xYrs) 55 (2.62%xFAC1xYrs) 60 or later (2.62%xFAC1xYrs)
Retirement Age Benefit Formula PEPRA Safety (§7522.25(d)) 50 (2.00%xFAS3xYrs) 55 (2.50%xFAS3xYrs) 57 or later (2.70%xFAS3xYrs)
MASTER PAGE NO. 318

SECTION 4: Reporting Information for the Ventura County Employees' Retirement Association
63
Maximum Benefit: General Tier 1, General Tier 2 and Safety 100% of Highest Average Compensation (§31676.1, §31676.11, §31664) PEPRA General Tier 1, PEPRA General Tier 2 and PEPRA Safety None
Ordinary Disability: General Tier 1, General Tier 2, PEPRA General Tier 1 and PEPRA General Tier 2 Eligibility Five years of service (§31720). Benefit Formula 1.5% per year of service. If the benefit does not exceed one-third of Final
Compensation, the service is projected to 65, but total benefit cannot be more than one-third of Final Compensation (§31727).
Safety and PEPRA Safety Eligibility Five years of service (§31720). Benefit Formula 1.8% per year of service. If the benefit does not exceed one-third of Final
Compensation, the service is projected to 55, but total benefit cannot be more than one-third of Final Compensation (§31727.2).
Line-of-Duty Disability: All Members Eligibility No age or service requirements (§31720). Benefit Formula 50% of the Final Compensation or 100% of Service Retirement benefit, if larger
(§31727.4).
Pre-Retirement Death: All Members Less than Five Years of Service Refund of employee contributions with interest, plus one month’s compensation for
each year of service to a maximum of six month’s compensation (§31781). 50% of Final Compensation or 100% of Service Retirement benefit, if larger, payable
to spouse if Line-of-Duty death (§31787).
MASTER PAGE NO. 319

SECTION 4: Reporting Information for the Ventura County Employees' Retirement Association
64
An additional lump sum benefit of one-year of compensation is paid if Line-of-Duty death for Safety member (§31787.6). OR
Five or More Years of Service 60% of the greater of Service Retirement or Ordinary Disability Retirement benefit payable to surviving eligible spouse (§31765.1, §31781.1), in lieu of above.
An additional lump sum benefit of one-year of compensation is paid if Line-of-Duty death for Safety member (§31787.6).
Death After Retirement: All Members Service Retirement or Ordinary Disability Retirement 60% of member’s unmodified allowance continued to eligible spouse (§31760.1). In addition, there is a $5,000 lump sum benefit payable to member’s beneficiary
(§31789.3). An eligible spouse is a surviving spouse who was married to the member at least two years prior to the date of death and has attained age 55 on or prior to the date of death (§31760.2, §31785.1).
Line-of-Duty Disability 100% of member’s allowance continued to eligible spouse (§31786). In addition, there is a $5,000 lump sum benefit payable to member’s beneficiary (§31789.3). An eligible spouse is a surviving spouse who was married to the member at least two years prior to the date of death and has attained age 55 on or prior to the date of death (§31786.1).
Withdrawal Benefits: Less than Five Years of Service Refund of accumulated employee contributions with interest (§31628) or entitled to
earned benefits commencing at anytime after eligible to retire (§31629.5). Five or More Years of Service If contributions left on deposit, entitled to earned benefits commencing at any time
after eligible to retire (§31700).
Post-retirement
Cost-of-Living Benefits: General Tier 1, Safety, Future changes based on Consumer Price Index to a maximum of 3% per year, excess PEPRA General Tier 1 “banked” (§31870.1). and PEPRA Safety
MASTER PAGE NO. 320

SECTION 4: Reporting Information for the Ventura County Employees' Retirement Association
65
General Tier 2 SEIU members receive a fixed 2% cost-of-living adjustment, not subject to changes in and PEPRA General Tier 2 the CPI, that applies to future service after March, 2003. This benefit has been valued
consistent with the methodologies described in our October 9, 2006 report entitled “Funding Policies and Procedures for General Tier II COLA Benefit”.
\
Supplemental Benefit: A supplemental benefit in the amount of $108.44 per month is paid to retirees and their survivors.
Member Contributions: Please refer to Appendix A for the specific rates.
General Tier 1 Basic Provide for an average annuity at age 55 equal to 1/120 of FAC1 (§31621.1). Cost-of-Living Provide for one-half of future cost-of-living costs.
General Tier 2 Basic Provide for an average annuity at age 60 equal to 1/120 of FAC3 (§31621). Cost-of-Living Provide for a fixed 2% cost-of-living increase for SEIU members that applies to
service after March 2003 (§31627). The contribution rate is currently a negotiated 2.63% of compensation.
Safety Basic Provide for an average annuity at age 50 equal to 1/100 of FAC1 (§31639.25). Cost-of-Living Provide for one-half of future cost-of-living costs.
PEPRA General Tier 1 Provide for 50% of total Normal Cost. PEPRA General Tier 2 Provide for 50% of total Normal Cost. In addition, for General Tier 2 with COLA
members, the current member COLA contribution rate of 2.63% of compensation has been reflected.
PEPRA Safety Provide for 50% of total Normal Cost.
Other Information: For Non-PEPRA members hired after November 1974, they will pay a contribution corresponding to a General and Safety member hired at entry age 36 and 27, respectively. Non-PEPRA Safety members with 30 or more years of service are exempt from paying member contributions. The same applies for Non-PEPRA General members hired on or before March 7, 1973.
MASTER PAGE NO. 321

SECTION 4: Reporting Information for the Ventura County Employees' Retirement Association
66
Plan Changes: There have been no changes in plan provisions since the previous actuarial valuation that had a material impact on plan liabilities.
Plan Provisions Not Valued: The Board of Retirement has approved a Supplemental Medical Benefit. This benefit is funded from Undistributed Excess Earnings, paid from a reserve that is not included in the Valuation Value of Assets and is subject at all times to the availability of funds.
The Supplemental Medical Benefit is $27.50 per month and is payable to virtually all retirees and beneficiaries.
NOTE: The summary of major plan provisions is designed to outline principle plan benefits as interpreted for purposes of the actuarial valuation. If the Association should find the plan summary not in accordance with the actual provisions, the Association should alert the actuary so they can both be sure the proper provisions are valued.
MASTER PAGE NO. 322

SECTION 4: Reporting Information for the Ventura County Employees' Retirement Association
67
Appendix A Member Contribution Rates for Non-PEPRA Members
General Tier 1 Members’ Contribution Rates from the June 30, 2014 Actuarial Valuation
(Expressed as a Percentage of Monthly Payroll)
Calculated Under Recommended Assumptions
Basic COLA Total Entry Age First $350 Over $350 First $350 Over $350 First $350 Over $350
15 3.32% 4.98% 1.18% 1.77% 4.50% 6.75% 16 3.32% 4.98% 1.18% 1.77% 4.50% 6.75% 17 3.38% 5.07% 1.20% 1.80% 4.58% 6.87% 18 3.44% 5.17% 1.23% 1.83% 4.67% 7.00% 19 3.51% 5.26% 1.24% 1.87% 4.75% 7.13% 20 3.57% 5.36% 1.27% 1.90% 4.84% 7.26% 21 3.64% 5.46% 1.29% 1.94% 4.93% 7.40% 22 3.71% 5.56% 1.31% 1.97% 5.02% 7.53% 23 3.77% 5.66% 1.34% 2.01% 5.11% 7.67% 24 3.84% 5.77% 1.37% 2.04% 5.21% 7.81% 25 3.91% 5.87% 1.39% 2.08% 5.30% 7.95% 26 3.99% 5.98% 1.41% 2.12% 5.40% 8.10% 27 4.06% 6.09% 1.44% 2.16% 5.50% 8.25% 28 4.13% 6.20% 1.47% 2.20% 5.60% 8.40% 29 4.21% 6.31% 1.49% 2.24% 5.70% 8.55% 30 4.28% 6.42% 1.52% 2.28% 5.80% 8.70% 31 4.36% 6.54% 1.55% 2.32% 5.91% 8.86% 32 4.44% 6.66% 1.57% 2.36% 6.01% 9.02% 33 4.52% 6.78% 1.60% 2.40% 6.12% 9.18% 34 4.60% 6.90% 1.63% 2.45% 6.23% 9.35% 35 4.68% 7.02% 1.67% 2.50% 6.35% 9.52% 36 4.77% 7.15% 1.69% 2.54% 6.46% 9.69% 37 4.85% 7.28% 1.73% 2.59% 6.58% 9.87% 38 4.94% 7.41% 1.75% 2.63% 6.69% 10.04% 39 5.03% 7.55% 1.79% 2.68% 6.82% 10.23%
MASTER PAGE NO. 323

SECTION 4: Reporting Information for the Ventura County Employees' Retirement Association
68
General Tier 1 Members’ Contribution Rates from the June 30, 2014 Actuarial Valuation (Expressed as a Percentage of Monthly Payroll)
Calculated Under Recommended Assumptions
Basic COLA Total Entry Age First $350 Over $350 First $350 Over $350 First $350 Over $350
40 5.13% 7.69% 1.82% 2.73% 6.95% 10.42% 41 5.22% 7.83% 1.85% 2.78% 7.07% 10.61% 42 5.32% 7.98% 1.89% 2.83% 7.21% 10.81% 43 5.42% 8.13% 1.93% 2.89% 7.35% 11.02% 44 5.53% 8.29% 1.96% 2.95% 7.49% 11.24% 45 5.64% 8.46% 2.01% 3.01% 7.65% 11.47% 46 5.75% 8.62% 2.04% 3.06% 7.79% 11.68% 47 5.85% 8.77% 2.07% 3.11% 7.92% 11.88% 48 5.95% 8.93% 2.12% 3.17% 8.07% 12.10% 49 6.04% 9.06% 2.15% 3.22% 8.19% 12.28% 50 6.11% 9.17% 2.18% 3.26% 8.29% 12.43% 51 6.17% 9.25% 2.19% 3.29% 8.36% 12.54% 52 6.21% 9.31% 2.20% 3.31% 8.41% 12.62% 53 6.22% 9.33% 2.21% 3.31% 8.43% 12.64%
54 & Over 6.18% 9.28% 2.20% 3.29% 8.38% 12.57%
Interest: 7.75% COLA: 3.00% COLA Loading: 35.49% Mortality: RP-2000 Combined Healthy Mortality Table projected with Scale AA to 2025 set back one year, weighted
35% male and 65% female. Salary Increase: See Exhibit V. Note: All members hired after November 1974, will pay a contribution corresponding to entry age 36.
These rates are determined before any pickups by the employer.
MASTER PAGE NO. 324

SECTION 4: Reporting Information for the Ventura County Employees' Retirement Association
69
General Tier 2 Members’ Contribution Rates from the June 30, 2014 Actuarial Valuation (Expressed as a Percentage of Monthly Payroll)
Calculated Under Recommended Assumptions
Basic Only Basic Only Entry Age First $350 Over $350 Entry Age First $350 Over $350
16 2.73% 4.09% 38 4.07% 6.11% 17 2.78% 4.17% 39 4.15% 6.22% 18 2.83% 4.24% 40 4.22% 6.33% 19 2.88% 4.32% 41 4.30% 6.45% 20 2.94% 4.41% 42 4.37% 6.56% 21 2.99% 4.49% 43 4.45% 6.68% 22 3.05% 4.57% 44 4.53% 6.80% 23 3.11% 4.66% 45 4.62% 6.93% 24 3.16% 4.74% 46 4.71% 7.06% 25 3.22% 4.83% 47 4.79% 7.19% 26 3.28% 4.92% 48 4.89% 7.33% 27 3.34% 5.01% 49 4.98% 7.47% 28 3.40% 5.10% 50 5.07% 7.60% 29 3.47% 5.20% 51 5.15% 7.73% 30 3.53% 5.29% 52 5.24% 7.86% 31 3.59% 5.39% 53 5.31% 7.96% 32 3.66% 5.49% 54 5.37% 8.05% 33 3.73% 5.59% 55 5.40% 8.10% 34 3.79% 5.69% 56 5.42% 8.13% 35 3.86% 5.79% 57 5.41% 8.12% 36 3.93% 5.89% 58 5.61% 8.42% 37 4.00% 6.00% 59 & over 5.82% 8.73%
Interest: 7.75% COLA: SEIU members contribute a negotiated 2.63% for a fixed 2% COLA pursuant to Government Code 31627. Mortality: RP-2000 Combined Healthy Mortality Table projected with Scale AA to 2025 set back one year, weighted
35% male and 65% female. Salary Increase: See Exhibit V.
Note: All members hired after November 1974, will pay a contribution corresponding to entry age 36. These rates are determined before any pickups by the employer.
MASTER PAGE NO. 325

SECTION 4: Reporting Information for the Ventura County Employees' Retirement Association
70
Safety Members’ Contribution Rates from the June 30, 2014 Actuarial Valuation (Expressed as a Percentage of Monthly Payroll)
Calculated Under Recommended Assumptions
Entry Age Basic COLA Total 15 7.69% 4.28% 11.97% 16 7.69% 4.28% 11.97% 17 7.69% 4.28% 11.97% 18 7.69% 4.28% 11.97% 19 7.69% 4.28% 11.97% 20 7.69% 4.28% 11.97% 21 7.69% 4.28% 11.97% 22 7.83% 4.37% 12.20% 23 7.98% 4.45% 12.43% 24 8.13% 4.54% 12.67% 25 8.29% 4.62% 12.91% 26 8.44% 4.71% 13.15% 27 8.61% 4.79% 13.40% 28 8.77% 4.89% 13.66% 29 8.94% 4.98% 13.92% 30 9.11% 5.08% 14.19% 31 9.29% 5.18% 14.47% 32 9.48% 5.28% 14.76% 33 9.67% 5.39% 15.06% 34 9.84% 5.49% 15.33% 35 10.02% 5.59% 15.61% 36 10.21% 5.69% 15.90% 37 10.41% 5.80% 16.21% 38 10.62% 5.91% 16.53% 39 10.84% 6.04% 16.88% 40 11.05% 6.16% 17.21% 41 11.26% 6.27% 17.53% 42 11.45% 6.39% 17.84%
MASTER PAGE NO. 326

SECTION 4: Reporting Information for the Ventura County Employees' Retirement Association
71
Safety Members’ Contribution Rates from the June 30, 2014 Actuarial Valuation (Expressed as a Percentage of Monthly Payroll)
Calculated Under Recommended Assumptions
Entry Age Basic COLA Total 43 11.62% 6.48% 18.10% 44 11.76% 6.56% 18.32% 45 11.88% 6.62% 18.50% 46 11.93% 6.65% 18.58% 47 11.94% 6.65% 18.59% 48 11.84% 6.60% 18.44%
49 & Over 11.59% 6.46% 18.05%
Interest: 7.75% COLA: 3.00% COLA Loading: 55.72% Mortality: RP-2000 Combined Healthy Mortality Table projected with Scale AA to 2025 set back one year,
weighted 80% male and 20% female.
Salary Increase: See Exhibit V.
Note: All members hired after November 1974, will pay a contribution corresponding to entry age 27. These rates are determined before any pickups by the employers.
MASTER PAGE NO. 327

SECTION 4: Reporting Information for the Ventura County Employees' Retirement Association
72
Appendix B Member Contribution Rates for PEPRA Members
Basic COLA Total General Tier 2 without COLA 6.92% 0.00% 6.92% General Tier 2 with COLA 6.92% 2.63%(1) 9.55%
Safety 10.60% 4.09% 14.69%
The PEPRA member contribution rate is 50% of the Normal Cost. (1) General Tier 2 members with COLA are required to pay COLA contributions of 2.63% of compensation based on current bargaining
agreements.
Note: It is our understanding that in the determination of pension benefits under the PEPRA tier formulas, the compensation that can be taken into account for 2014 is $115,064. (For an employer that is not enrolled in Social Security, the maximum amount is $138,077) (reference Section 7522.10). These amounts should be adjusted for changes to the Consumer Price Index for All Urban Consumers after 2014 (reference Section 7522.10(d)).
MASTER PAGE NO. 328

SECTION 4: Reporting Information for the Ventura County Employees' Retirement Association
73
Appendix C Employer Contribution Rates (Dollar Amounts in Thousands) Based on 50/50 Sharing of Normal Cost for Non-PEPRA Tiers – Current Valuation Under Combined Methodology
June 30, 2014 Actuarial Valuation BASIC COLA TOTAL
General Tier 1 Members Rate Estimated Annual
Amount(1) Rate Estimated Annual
Amount(1) Rate Estimated Annual
Amount(1) Normal Cost(2) 7.72% $772 2.50% $250 10.22% $1,022 UAAL(3) 9.71% 971 41.64% 4,165 51.35% 5,136 Total Contribution 17.43% $1,743 44.14% $4,415 61.57% $6,158 General Tier 2 Members w/o COLA Normal Cost 7.09% $14,878 0.00% $0 7.09% $14,878 UAAL(3) 9.71% 20,370 0.00% 0 9.71% 20,370 Total Contribution 16.80% $35,248 0.00% $0 16.80% $35,248 General PEPRA Tier 2 Members w/o COLA Normal Cost 6.92% $823 0.00% $0 6.92% $823 UAAL(3) 9.71% 1,155 0.00% 0 9.71% 1,155 Total Contribution 16.63% $1,978 0.00% $0 16.63% $1,978 General Tier 2 Members w/COLA Normal Cost (4) 7.09% $16,213 -0.05% -$115 7.04% $16,098 UAAL(3)(5) 9.71% 22,204 1.14% 2,607 10.85% 24,811 Total Contribution 16.80% $38,417 1.09% $2,492 17.89% $40,909 General PEPRA Tier 2 Members w/COLA Normal Cost (4) 6.92% $1,658 -0.10% -$24 6.82% $1,634 UAAL(3)(5) 9.71% 2,326 1.14% 273 10.85% 2,599 Total Contribution 16.63% $3,984 1.04% $249 17.67% $4,233 All General Members(6) Normal Cost 7.09% $34,344 0.02% $111 7.11% $34,455 UAAL 9.71% 47,026 1.45% 7,045 11.16% 54,071 Total Contribution 16.80% $81,370 1.47% $7,156 18.27% $88,526
MASTER PAGE NO. 329

SECTION 4: Reporting Information for the Ventura County Employees' Retirement Association
74
Appendix C (continued) Employer Contribution Rates (Dollar Amounts in Thousands) Based on 50/50 Sharing of Normal Cost for Non-PEPRA Tiers – Current Valuation Under Combined Methodology
June 30, 2014 Actuarial Valuation BASIC COLA TOTAL
Safety Members Rate Estimated Annual
Amount(1) Rate Estimated Annual
Amount(1) Rate Estimated Annual
Amount(1) Normal Cost(7) 11.80% $18,889 4.68% $7,491 16.48% $26,380 UAAL 44.50% 71,233 -8.89% -14,230 35.61% 57,003 Total Contribution 56.30% $90,122 -4.21% -$6,739 52.09% $83,383 Safety PEPRA Members Normal Cost 10.60% $403 4.09% $156 14.69% $559 UAAL 44.50% 1,692 -8.89% -338 35.61% 1,354 Total Contribution 55.10% $2,095 -4.80% -$182 50.30% $1,913 All Safety Members(6) Normal Cost 11.77% $19,292 4.67% $7,647 16.44% $26,939 UAAL 44.50% 72,925 -8.89% -14,568 35.61% 58,357 Total Contribution 56.27% $92,217 -4.22% -$6,921 52.05% $85,296 All Categories Combined(6) Normal Cost 8.27% $53,636 1.20% $7,758 9.47% $61,394 UAAL 18.50% 119,951 -1.16% -7,523 17.34% 112,428 Total Contribution 26.77% $173,587 0.04% $235 26.81% $173,822 (1) Amounts are in thousands, assumed to be paid throughout the year, and are based on June 30, 2014 annual payroll (also in thousands) shown below: General Tier 1 $10,004 General Tier 2 209,847 General PEPRA Tier 2 11,899 General Tier 2C 228,670 General PEPRA Tier 2C 23,959 Safety 160,075 Safety PEPRA 3,803 Total $648,257 (2) The total employer rate has been adjusted by 0.37% to account for the cost associated with the cessation of member contributions after 30 years of
service. (3) Basic UAAL rates have been calculated on a combined basis for all General Tiers. (4) Reflects General Tier 2 member COLA contribution rate of 2.63% based on current bargaining agreements. (5) Includes 0.56% in COLA UAAL costs attributed to the first two years of service accrued for the fixed 2% COLA pursuant to Government Code 31627. (6) These aggregated rates are provided for informational purposes only as we understand that the intent is to implement the tier specific rates, if possible. (7) The total employer rate has been adjusted by 1.13% to account for the cost associated with the cessation of member contributions after 30 years of
service.
MASTER PAGE NO. 330

SECTION 4: Reporting Information for the Ventura County Employees' Retirement Association
75
Appendix D Member Contribution Rates Based on 50/50 Sharing of Normal Cost for Non-PEPRA Tiers
Basic COLA Total
First $350 Over $350 First $350 Over $350 First $350 Over $350 General Tier 1 5.03% 7.44% 1.62% 2.41% 6.65% 9.85% General Tier 2 without COLA 4.81% 7.09% 0.00% 0.00% 4.81% 7.09% General Tier 2 COLA 4.81% 7.09% 2.63%(1) 2.63%(1) 7.44% 9.72% Safety 10.99% 10.99% 4.36% 4.36% 15.35% 15.35% (1) General Tier 2 members with COLA are required to pay COLA contributions of 2.63% of compensation based on current bargaining agreements.
MASTER PAGE NO. 331

SECTION 4: Reporting Information for the Ventura County Employees' Retirement Association
76
Appendix E Employer Contribution Rates (Dollar Amounts in Thousands) For Reference Purposes Only – Current Valuation Under Non-Combined Methodology
June 30, 2014 Actuarial Valuation BASIC COLA TOTAL
General Tier 1 Members Rate Estimated Annual
Amount(1) Rate Estimated Annual
Amount(1) Rate Estimated Annual
Amount(1) Normal Cost 8.11% $811 2.43% $243 10.54% $1,054 UAAL(2) 369.07% 36,922 41.64% 4,165 410.71% 41,087 Total Contribution 377.18% $37,733 44.07% $4,408 421.25% $42,141 General Tier 2 Members w/o COLA Normal Cost 8.36% $17,543 0.00% $0 8.36% $17,543 UAAL(2) 2.13% 4,470 0.00% 0 2.13% 4,470 Total Contribution 10.49% $22,013 0.00% $0 10.49% $22,013 General PEPRA Tier 2 Members w/o COLA Normal Cost 6.92% $823 0.00% $0 6.92% $823 UAAL(2) 2.13% 253 0.00% 0 2.13% 253 Total Contribution 9.05% $1,076 0.00% $0 9.05% $1,076 General Tier 2 Members w/COLA Normal Cost (3) 8.36% $19,117 -0.05% -$115 8.31% $19,002 UAAL(2)(4) 2.13% 4,871 1.14% 2,607 3.27% 7,478 Total Contribution 10.49% $23,988 1.09% $2,492 11.58% $26,480 General PEPRA Tier 2 Members w/COLA Normal Cost (3) 6.92% $1,658 -0.10% -$24 6.82% $1,634 UAAL(2)(4) 2.13% 510 1.14% 273 3.27% 783 Total Contribution 9.05% $2,168 1.04% $249 10.09% $2,417 All General Members Normal Cost 8.25% $39,952 0.02% $104 8.27% $40,056 UAAL 9.71% 47,026 1.45% 7,045 11.16% 54,071 Total Contribution 17.96% $86,978 1.47% $7,149 19.43% $94,127
MASTER PAGE NO. 332

SECTION 4: Reporting Information for the Ventura County Employees' Retirement Association
77
Appendix E (continued) Employer Contribution Rates (Dollar Amounts in Thousands) For Reference Purposes Only – Current Valuation Under Non-Combined Methodology
June 30, 2014 Actuarial Valuation BASIC COLA TOTAL
Safety Members Rate Estimated Annual
Amount(1) Rate Estimated Annual
Amount(1) Rate Estimated Annual
Amount(1) Normal Cost 13.97% $22,362 4.29% $6,868 18.26% $29,230 UAAL 44.50% 71,233 -8.89% -14,230 35.61% 57,003 Total Contribution 58.47% $93,595 -4.60% -$7,362 53.87% $86,233 Safety PEPRA Members Normal Cost 10.60% $403 4.09% $156 14.69% $559 UAAL 44.50% 1,692 -8.89% -338 35.61% 1,354 Total Contribution 55.10% $2,095 -4.80% -$182 50.30% $1,913 All Safety Members Normal Cost 13.89% $22,765 4.29% $7,024 18.18% $29,789 UAAL 44.50% 72,925 -8.89% -14,568 35.61% 58,357 Total Contribution 58.39% $95,690 -4.60% -$7,544 53.79% $88,146 All Categories Combined Normal Cost 9.67% $62,717 1.10% $7,128 10.77% $69,845 UAAL 18.50% 119,951 -1.16% -7,523 17.34% 112,428 Total Contribution 28.17% $182,668 -0.06% -$395 28.11% $182,273 (1) Amounts are in thousands, assumed to be paid throughout the year, and are based on June 30, 2014 annual payroll (also in thousands) shown below: General Tier 1 $10,004 General Tier 2 209,847 General PEPRA Tier 2 11,899 General Tier 2C 228,670 General PEPRA Tier 2C 23,959 Safety 160,075 Safety PEPRA 3,803 Total $648,257 (2) Basic UAAL rates have not been calculated on a combined basis for all General Tiers. (3) Reflects General Tier 2 member COLA contribution rate of 2.63% based on current bargaining agreements. (4) Includes 0.56% in COLA UAAL costs attributed to the first two years of service accrued for the fixed 2% COLA pursuant to Government Code 31627.
MASTER PAGE NO. 333

SECTION 4: Reporting Information for the Ventura County Employees' Retirement Association
78
Appendix E (continued) Employer Contribution Rates (Dollar Amounts in Thousands) For Reference Purposes Only – Prior Valuation Under Non-Combined Methodology
June 30, 2013 Actuarial Valuation(1) BASIC COLA TOTAL
General Tier 1 Members Rate Estimated Annual
Amount(2) Rate Estimated Annual
Amount(2) Rate Estimated Annual
Amount(2) Normal Cost 8.15% $925 2.44% $277 10.59% $1,202 UAAL(3) 277.05% 31,440 29.41% 3,337 306.46% 34,777 Total Contribution 285.20% $32,365 31.85% $3,614 317.05% $35,979 General PEPRA Tier 1 Members Normal Cost 4.70% $52 1.80% $19 6.50% $71 UAAL(3) 277.05% 3,045 29.41% 323 306.46% 3,368 Total Contribution 281.75% $3,097 31.21% $342 312.96% $3,439 General Tier 2 Members w/o COLA Normal Cost 8.48% $17,997 0.00% $0 8.48% $17,997 UAAL(3) 3.04% 6,452 0.00% 0 3.04% 6,452 Total Contribution 11.52% $24,449 0.00% $0 11.52% $24,449 General PEPRA Tier 2 Members w/o COLA Normal Cost 6.83% $216 0.00% $0 6.83% $216 UAAL(3) 3.04% 96 0.00% 0 3.04% 96 Total Contribution 9.87% $312 0.00% $0 9.87% $312 General Tier 2 Members w/COLA Normal Cost (4) 8.48% $20,422 -0.04% -$97 8.44% $20,325 UAAL(3)(5) 3.04% 7,321 1.01% 2,432 4.05% 9,753 Total Contribution 11.52% $27,743 0.97% $2,335 12.49% $30,078 General PEPRA Tier 2 Members w/COLA Normal Cost (4) 6.83% $536 -0.13% -$10 6.70% $526 UAAL(3)(5) 3.04% 239 1.01% 79 4.05% 318 Total Contribution 9.87% $775 0.88% $69 10.75% $844 All General Members Normal Cost 8.43% $40,148 0.04% $189 8.47% $40,337 UAAL 10.20% 48,593 1.29% 6,171 11.49% 54,764 Total Contribution 18.63% $88,741 1.33% $6,360 19.96% $95,101
MASTER PAGE NO. 334

SECTION 4: Reporting Information for the Ventura County Employees' Retirement Association
79
Appendix E (continued) Employer Contribution Rates (Dollar Amounts in Thousands) For Reference Purposes Only – Prior Valuation Under Non-Combined Methodology
June 30, 2013 Actuarial Valuation(1) BASIC COLA TOTAL
Safety Members Rate Estimated Annual
Amount(2) Rate Estimated Annual
Amount(2) Rate Estimated Annual
Amount(2) Normal Cost 13.96% $22,627 4.30% $6,970 18.26% $29,597 UAAL 42.87% 69,486 -5.45% -8,834 37.42% 60,652 Total Contribution 56.83% $92,113 -1.15% -$1,864 55.68% $90,249 Safety PEPRA Members Normal Cost 11.27% $19 4.87% $9 16.14% $28 UAAL 42.87% 73 -5.45% -9 37.42% 64 Total Contribution 54.14% $92 -0.58% $0 53.56% $92 All Safety Members Normal Cost 13.96% $22,646 4.30% $6,979 18.26% $29,625 UAAL 42.87% 69,559 -5.45% -8,843 37.42% 60,716 Total Contribution 56.83% $92,205 -1.15% -$1,864 55.68% $90,341 All Categories Combined Normal Cost 9.83% $62,794 1.12% $7,168 10.95% $69,962 UAAL 18.50% 118,152 -0.42% -2,672 18.08% 115,480 Total Contribution 28.33% $180,946 0.70% $4,496 29.03% $185,442 (1) Before reflecting three-year phase-in of the effect of the changes in economic actuarial assumptions and actuarial cost method from the June 30, 2012
valuation. (2) Amounts are in thousands, assumed to be paid throughout the year, and are based on June 30, 2013 annual payroll (also in thousands) shown below: General Tier 1 $11,348 General PEPRA Tier 1 1,099 General Tier 2 212,229 General PEPRA Tier 2 3,163 General Tier 2C 240,822 General PEPRA Tier 2C 7,847 Safety 162,085 Safety PEPRA 171 Total $638,764 (3) Basic UAAL rates have not been calculated on a combined basis for all General Tiers. (4) Reflects General Tier 2 member COLA contribution rate of 2.63% based on current bargaining agreements. (5) Includes 0.53% in COLA UAAL costs attributed to the first two years of service accrued for the fixed 2% COLA pursuant to Government Code 31627. 5328634v1/05325.002
MASTER PAGE NO. 335

Ventura County Employees’ Retirement Information System
Project Status Report Month Ending: November 2014
Reporting to: Board of Retirement Report Date: 12/02/14 Written by: Brian Colker
1
PROJECT STATUS SUMMARY Actual Percentage Complete: 70.55%* Planned Percentage Complete: 75.46%*
**Note: The updated Sprint Schedule went into effect with the approval of the PEPRA change order. The
completion percentages have been adjusted to take into account the updates and changes per the new sprint schedule. Scope Schedule Cost Risks Quality
Schedule
The project schedule is 4.91% behind schedule. The two primary factors causing the schedule impacts are:
VCERA staffing issues – Over the course of the project staffing issues negatively impacted the project schedule. Currently the project is adequately staffed, but the project schedule was impacted. Linea and VCERA management will continue to closely monitor on-going resource levels to determine any further delays to the project.
Third party vendor issues – Vitech and County IT continue to conduct system testing and are still targeting the end of the year to have all testing completed.
Risks
There are two project risks that are being closely monitored. Plan sponsor payroll transmittal –VCERA and the Auditor-Controller’s office are continuing to
negotiate the schedule for completion of the transmittal file and testing phases. It has been agreed that the work will be completed without an official Memorandum of Understanding. The project team will determine the impacts to the project schedule and prepare a revised project plan for the Board as soon as the schedule has been finalized.
VCERA staffing issues –There has been no change to this risk. The project team is continuing to attempt to reduce the current schedule impacts and to prevent additional impacts.
KEY ACCOMPLISHMENTS LAST MONTH
Continued design, development, and testing activities for Segment H functionality: o Disability o Active Death Processing o Retired Death Processing o DRO Processing – Alt Payee o 1099R Processing
Wrote 344 test cases and executed 227 tests. Completed Data Conversion Cycle 10
MASTER PAGE NO. 336

December 15, 2014 Board of Retirement Ventura County Employees’ Retirement Association 1190 South Victoria Avenue, Suite 200 Ventura, CA 93003 SUBJECT: RECOMMENDATION FOR MS. McCORMICK’S ATTENDANCE AT THE 2015 PENSION BRIDGE CONFERENCE, APRIL 7- 8, 2015, SAN FRANCISCO. Dear Board Members: Staff recommends approval for Ms. McCormick to attend the 2015 Pension Bridge Conference in San Francisco, April 7-8, 2015. The cost to attend is estimated to be $1,350 including event registration, hotel, air fare and other travel related expenses. VCERA staff will be pleased to respond to any questions you may have on this matter at the December 15, 2014 business meeting. Sincerely,
Tim Thonis Interim Retirement Administrator
MASTER PAGE NO. 337

December 15, 2014 Board of Retirement Ventura County Employees’ Retirement Association 1190 South Victoria Avenue, Suite 200 Ventura, CA 93003 SUBJECT: RECOMMENDATION FOR MR. GOULET, MR. SEDELL AND MR. WILSON TO ATTEND THE 6TH ANNUAL NEPC PUBLIC FUND WORKSHOP; JANUARY 12 – 13, 2015, TEMPE, ARIZONA Dear Board Members: Staff recommends approval for Mr. Goulet, Mr. Sedell and Mr. Wilson to attend NEPC’s 2015 Public Fund Workshop in Tempe Arizona, January 12-13, 2015. The aggregate cost to attend is estimated to be $2,750 including hotel, meals, air fare and other travel related expenses. VCERA staff will be pleased to respond to any questions you may have on this matter at the December 15, 2014 business meeting. Sincerely,
Tim Thonis Interim Retirement Administrator
MASTER PAGE NO. 338

255 State Street | Boston, MA 02109 | TEL: 617.374.1300 | www.nepc.com
BOSTON | ATLANTA | CHARLOTTE | CHICAGO | DETROIT | LAS VEGAS | SAN FRANCISCO
2015 Public Funds Workshop Monday and Tuesday, January 12 and 13
Tempe Mission Palms 60 East Fifth Street Tempe, AZ 85281
Workshop Agenda — January 12-13 Monday, January 12 6:30am-7:45a: Breakfast (at your leisure) in the cloister 7:45am: Adjourn to meeting room 8:00a-9:30a: Opening Remarks/Fund Introductions Rhett Humphreys of NEPC to provide opening remarks, followed by
participants introducing their Fund and current key strategic initiatives 9:30a–10:30a: NEPC 2015 Capital Markets Update and Asset Allocation Thoughts
Tim McCusker, NEPC 10:30a–10:45a: Break 10:45a–11:45a: Public Plan Trends, Threats and Challenges Hank Kim, NCPERS 11:45a–12:45p: Investing in a Low Return World How to take smart risks, layout while returns are lower, focus in
investment Chris Levell, NEPC
12:45p–1:45p: LUNCH 1:45p–2:45p: European Credit Opportunities
Alternative Opportunities in Europe Sean Ruhmann and Neil Sheth of NEPC to lead a client panel (client(s) TBD)
2:45p–3:45p: Credit Spreads in Different Monetary Regimes (tentative topic) Clients are worried about credit and conditions. Spreads will stay low in a changing interest rate regime
3:45p–4:00p: Break
MASTER PAGE NO. 339

4:00p-5:00pm: Fee Policy, Analysis and Rationalizing Fees for Alternative
Investments Cost effective fee management. Sean Gill, NEPC (client participants to include Girard Miller, OCERS; Bob Jacksha, NMERB)
5:00pm: Closing Remarks 5:45p: Cocktails 6:15p: Dinner – (Daniel Ivascyn, Group CIO from PIMCO—Mike Manning, NEPC to
run a Q & A session) Tuesday, January 13 6:30am-7:45am: Breakfast (at your leisure) in the cloister 7:45am: Adjourn to meeting room 8:00a-8:45a: Asia Private Equity: Transformational Capital for the Transitional
Decade Melissa Ma, Co-Founder and Managing Partner of Asia Alternatives
8:45a-9:30a: Client Panel on Investing in Asia
Chris Hill/Sean Gill, NEPC (client participants TBD)
9:30a-9:45a: Break 9:45a-10:30a: Risk Management in a Dynamic World Panel (Bridgewater to moderate?) on Tail Risk hedging, Smart Beta,
Defensive Equity, Currency Risk (Don Pierce, SBCERA-Intelligent Rebalancing)
10:15a–11:30a: SPONSOR PANEL – Investments/Operations/Political Environment/Challenges
Kevin Leonard, NEPC will moderate a panel (client participants TBD) 11:30a: Concluding Remarks Kevin Leonard, NEPC 12:00pm: Box lunch (seating available in the courtyard)
MASTER PAGE NO. 340

VENTURA COUNTY EMPLOYEES’ RETIREMENT ASSOCIATION
1190 South Victoria Avenue, Suite 200 Ventura, CA 93003-6572
(805) 339-4250 Fax: (805) 339-4269 http://www.ventura.org/vcera
December 15, 2014 Board of Retirement Ventura County Retired Employees’ Association 1190 S. Victoria Ave., Suite 200 Ventura, CA 93003-6572 Subject: Potential Legislation Dear Board Members: In furtherance of the Board’s discussion about the possibility of seeking legislation to give the Board authority over the job descriptions and compensation of VCERA’s upper level employees, I have attached a draft of a bill that would accomplish that goal. Actually, the bill is quite simple, since all of the groundwork was done by OCERS and SBCERA when they ran their bills previously. CCCERA’s recent successful legislation (SB 673) is somewhat different in that all staff working for that system will be CCCERA employees, not just upper level management. SB 673 goes into effect on January 1, 2015. As you’ll note, section 1 of the bill adds VCERA to the definition of “district” in CERL. This does not make VCERA a “special district” within the ordinary meaning of that term. The purpose of the addition to the definition is solely to enable those who are employees of VCERA, rather than county employees, to participate in the retirement system. If the Board chooses to seek an author to carry a bill such as the attached, I suggest it be vetted by Harvey Leiderman to insure that I haven’t missed anything. Mr. Leiderman played a key role in drafting the OCERS bill in 2002, and the CCCERA bill in 2014, so he would be aware of any other provisions of CERL that might need to amended as well. I would be happy to answer any questions regarding this subject. Sincerely,
Arthur E. Goulet Retiree Member Attachment
MASTER PAGE NO. 341

SECTION 1. Section 31468 of the
Government Code is amended to read:
31468. (a) "District" means a district, formed under the laws of
the state, located wholly or partially within the county other than a
school district.
(b) "District" also includes any institution operated by two or
more counties, in one of which there has been adopted an ordinance
placing this chapter in operation.
(c) "District" also includes any organization or association
authorized by Chapter 26 of the Statutes of 1935, as amended by
Chapter 30 of the Statutes of 1941, or by Section 50024, which
organization or association is maintained and supported entirely from
funds derived from counties, and the board of any retirement system
is authorized to receive the officers and employees of that
organization or association into the retirement system managed by the
board.
(d) "District" also includes, but is not limited to, any sanitary
district formed under Part 1 (commencing with Section 6400) of
Division 6 of the Health and Safety Code.
(e) "District" also includes any city, public authority, public
agency, and any other political subdivision or public corporation
formed or created under the constitution or laws of this state and
located or having jurisdiction wholly or partially within the county.
(f) "District" also includes any nonprofit corporation or
association conducting an agricultural fair for the county pursuant
to a contract between the corporation or association and the board of
supervisors under the authority of Section 25905.
(g) "District" also includes the Regents of the University of
California, but with respect only to employees who were employees of
a county in a county hospital, who became university employees
pursuant to an agreement for transfer to the regents of a county
hospital or of the obligation to provide professional medical
services at a county hospital, and who under that agreement had the
right and did elect to continue membership in the county's retirement
system established under this chapter.
(h) "District" also includes the South Coast Air Quality
Management District, a new public agency created on February 1, 1977,
pursuant to Chapter 5.5 (commencing with Section 40400) of Part 3 of
Division 26 of the Health and Safety Code.
(1) Employees of the South Coast Air Quality Management District
shall be deemed to be employees of a new public agency occupying new
positions on February 1, 1977. On that date, those new positions are
deemed not to have been covered by any retirement system.
(2) No retirement system coverage may be effected for an employee
of the South Coast Air Quality Management District who commenced
employment with the district during the period commencing on February
1, 1977, and ending on December 31, 1978, unless and until the
employee shall have elected whether to become a member of the
retirement association established in accordance with this chapter
for employees of Los Angeles County or the retirement association
established in accordance with this chapter for employees of San
Bernardino County. The election shall occur before January 1, 1980.
Any employee who fails to make the election provided for herein shall
be deemed to have elected to become a member of the retirement
association established in accordance with this chapter for the
County of Los Angeles.
(3) The South Coast Air Quality Management District shall make
application to the retirement associations established in accordance
with this chapter for employees of Los Angeles County and San
MASTER PAGE NO. 342

Bernardino County for coverage of employees of the South Coast Air
Quality Management District.
(4) An employee of the South Coast Air Quality Management District
who commenced employment with the district during the period
commencing on February 1, 1977, and ending on December 31, 1978, and
who has not terminated employment before January 1, 1980, shall be
covered by the retirement association elected by the employee
pursuant to paragraph (2). That coverage shall be effected no later
than the first day of the first month following the date of the
election provided for in paragraph (2).
(5) Each electing employee shall receive credit for all service
with the South Coast Air Quality Management District. However, the
elected retirement association may require, as a prerequisite to
granting that credit, the payment of an appropriate sum of money or
the transfer of funds from another retirement association in an
amount determined by an enrolled actuary and approved by the elected
retirement association's board. The amount to be paid shall include
all administrative and actuarial costs of making that determination.
The amount to be paid shall be shared by the South Coast Air Quality
Management District and the employee. The share to be paid by the
employee shall be determined by good faith bargaining between the
district and the recognized employee organization, but in no event
shall the employee be required to contribute more than 25 percent of
the total amount required to be paid. The elected retirement
association's board may not grant that credit for that prior service
unless the request for that credit is made to, and the required
payment deposited with, the elected retirement association's board no
earlier than January 1, 1980, and no later than June 30, 1980. The
foregoing shall have no effect on any employee's rights to reciprocal
benefits under Article 15 (commencing with Section 31830).
(6) An employee of the South Coast Air Quality Management District
who commenced employment with the district after December 31, 1978,
shall be covered by the retirement association established in
accordance with this chapter for employees of San Bernardino County.
That coverage shall be effected as of the first day of the first
month following the employee's commencement date.
(7) Notwithstanding paragraphs (2) and (4) above, employees of the
South Coast Air Quality Management District who were employed
between February 1, 1977, and December 31, 1978, and who terminate
their employment between February 1, 1977, and January 1, 1980, shall
be deemed to be members of the retirement association established in
accordance with this chapter for the employees of Los Angeles County
commencing on the date of their employment with the South Coast Air
Quality Management District.
(i) "District" also includes any nonprofit corporation that
operates one or more museums within a county of the 15th class, as
described by Sections 28020 and 28036 of the Government Code, as
amended by Chapter 1204 of the Statutes of 1971, pursuant to a
contract between the corporation and the board of supervisors of the
county, and that has entered into an agreement with the board and the
county setting forth the terms and conditions of the corporation's
inclusion in the county's retirement system.
(j) "District" also includes any economic development association
funded in whole or in part by a county of the 15th class, as
described by Sections 28020 and 28036 of the Government Code, as
amended by Chapter 1204 of the Statutes of 1971, and that has entered
into an agreement with the board of supervisors and the county
setting forth the terms and conditions of the association's inclusion
in the county's retirement system.
(k) "District" also includes any special commission established in
MASTER PAGE NO. 343

the Counties of Tulare and San Joaquin as described by Section
14087.31 of the Welfare and Institutions Code, pursuant to a contract
between the special commission and the county setting forth the
terms and conditions of the special commission's inclusion in the
county's retirement system with the approval of the board of
supervisors and the board of retirement.
( l ) (1) "District" also includes the retirement
system established under this chapter in Orange County.
(2) "District" also includes the retirement system established
under this chapter in San Bernardino County at such time as the board
of retirement, by resolution, makes this section applicable in that
county.
(3) "District" also includes the retirement system established
under this chapter in Contra Costa County.
(4) "District" also includes the retirement system established
under this chapter in Ventura County
Section 2. Section 31522.5 of the Government Code is amended to read:
31522.5. (a) In a county in which the board of retirement has
appointed personnel pursuant to Section 31522.1, the board of
retirement may appoint an administrator, an assistant administrator,
a chief investment officer, senior management employees next in line
of authority to the chief investment officer, subordinate
administrators, senior management employees next in line of authority
to subordinate administrators, and legal counsel.
(b) Notwithstanding any other provision of law, the personnel
appointed pursuant to this section may not be county employees but
shall be employees of the retirement system, subject to terms and
conditions of employment established by the board of retirement.
Except as specifically provided in this subdivision, all other
personnel shall be county employees for purposes of the county's
employee relations resolution, or equivalent local rules, and the
terms and conditions of employment established by the board of
supervisors for county employees, including those set forth in a
memorandum of understanding.
(c) The compensation of personnel appointed pursuant to this
section shall be an expense of administration of the retirement
system, pursuant to Section 31580.2.
(d) The board of retirement and board of supervisors may enter
into any agreements as may be necessary and appropriate to carry out
the provisions of this section.
(e) Section 31522.2 is not applicable to any retirement system
that elects to appoint personnel pursuant to this section.
(f) This section shall apply only in Orange County.
(g) This section shall apply to the retirement system established
under this chapter in San Bernardino County at such time as the board
of retirement, by resolution, makes this section applicable in that
county.
(h) This section shall apply to the retirement system established
under this chapter in Ventura County at such time as the board
of retirement, by resolution, makes this section applicable in that
county.
MASTER PAGE NO. 344

December 15, 2014 Board of Retirement Ventura County Employees’ Retirement Association 1190 South Victoria Avenue, #200 Ventura, CA 93003 SUBJECT: REINSTATEMENT TO ACTIVE MEMBERSHIP; CYNTHIA CANTLE Dear Board Members, Staff recommends that VCERA retired member Ms. Cynthia Cantle be reinstated to active membership pursuant to Government Code Sections 31680.4 & 31680.5. Ms. Cantle has filed her application for reinstatement pursuant to section 31680.4, a medical determination that she is not incapacitated for the duties assigned, and a letter indicating her offer of full-time employment. VCERA staff members will be pleased to answer any questions you may have on this item at the business meeting of December 15, 2014. Sincerely,
Tim Thonis Interim Retirement Administrator
MASTER PAGE NO. 345

MASTER PAGE NO. 346•
December 15, 2014
Board of Retirement Ventura County Employees' Retirement Association 1190 S Victoria Avenue, Suite 200 Ventura, CA 93003
Dear Members of the Board of Retirement:
I hereby respectfully request reinstatement as an active employee of the County of Ventura, filling a position as Board of Supervisor's Chief of Staff, effective January 5, 2015.
As instructed by your staff, I have attached a copy of the offer of employment, the draft job description and a letter from my physician stating that I am capable of fulfilling the duties required.
I appreciate your favorable consideration of this request, and I look forward to once again becoming an active and contributing employee serving the citizens of Ventura County.
If you have any questions, please do not hesitate to contact me.
Sincerely,
Cynthia Cantle 465 Gridley Road Ojai, CA 805-640-9598

MASTER PAGE NO. 347
BOARD OF SUPERVISORS C 0 U NT Y OF V E NT U R A GOVERNMENT CENTER, HALL OF ADMINISTRATION BOO SOUTH VICTORIA AVENUE, VENTURA, CALIFORNIA 93009
November 30, 2014
Cynthia Cantle 465 Gridley Road Ojai, CA 93023
Dear Cynthia,
From the Desk of STEVE BENNETT SUPERVISOR, FIRST DISTRICT
(805) 654-2703 FAX: (805) 654-2226
E-mail:[email protected]
MEMBERS OF THE BOARD STEVE BENNETT, Chair
LINDA PARKS KATHY I. LONG PETER C. FOY
JOHN C. ZARAGOZA
I am pleased to extend to you an offer of employment as my Board of SupeNisor's Chief of Staff.
Cordially,
Steve Bennett SupeNisor, First District
@ Recycled Paper

MASTER PAGE NO. 348
I have read the job description for Board of Supervisors Chief of Staff and confirm that Cynthia S. Cantle is physically capable of performing the job as described.
Dr. Mary . D , D Date

Hi Tim, Hope this finds you well. This is just a quick note to see if we can welcome you at IMN’s renowned Winter Forum on RealEstate Opportunity & Private Fund Investing, between Jan. 21st – 23rd, 2015 at the Montage, Laguna Beach, CA. The largest event of its kind on the West Coast, with 1000+ senior executives in attendance, it is largely considered to be thebest CRE deal-making event in the country. The forum offers real estate investors strategic insights into the current regulatoryand market environment. You may qualify for a complimentary pass, however all passes are subject to IMN’s approval based on availability. Ifinterested, please let me know so that I may expedite the approval process. I would be happy to get on a quick call to address any concerns you have. Thank you for your consideration, I look forwardto hearing from you soon. Below is partial listing of companies represented at the 2014 event. Warm regards, Sahadev Shivarthy | Director – Investor RelationsInformation Management Network (IMN)a Euromoney Institutional Investor PLC company225 Park Avenue South, 7th Floor | New York, NY 10003t: (212) 224-3521 | c: (845) 667-2025
Ask me about DirectConnect: IMN's exclusive online networking platform
(Please note: due to the overwhelming interest for this event, receipt of this email does not guarantee complimentary access tothe program. Thank you in advance for your patience and understanding.)
A Partial Listing of Companies Represented at January 2014 event:
4Terra Investments First West Capital Corp. Palisades Equity PartnersABP Capital, LLC Focus Management Group Parametric Portfolio Associates/Eaton VanceAckman-Ziff Real Estate Group Foremost Communities Paramount Lodging AdvisorsAdler Realty Investments, Inc. Forge Capital Partners, LLC Parmenter Realty PartnersAEI Consultants Fortress Investment Group Parse Capital, LLCAEW Capital Management, L.P. Fox and Hounds Properties Partner EnergyAffordable Housing Investment Partners of Marcus& Millichap
Fox River Partners Partner Engineering and Science
Aileron Capital Management Fox Rothschild LLP Partners Capital SolutionsAjlan & Bros Group Frandzel Robins Bloom & Csato Pathfinder Partners, LLCAkin Gump Strauss Hauer & Feld Freestone Real Estate Opportunities, L.P. Peachtree Hotel GroupAllen Matkins GE Capital Real Estate Pennant ManagementAllstate Investments, LLC GEM Realty Capital, Inc. Perth AdvisorsAmCap, Inc. Gemini Capital Phillips Edison & CompanyAmerican Asset Corp George Smith Partners PIMCOAmerican Development Group, Gerrity Group, LLC Pintar Investment Company
MASTER PAGE NO. 349

American Homes 4 Rent Gibson, Dunn & Crutcher LLP Pircher, Nichols & MeeksAmerican Real Estate Partners GlobeSt.com PNL CompaniesAmerican Realty Advisors Godfrey & Kahn, S.C. Pontus CapitalAMG Realty Group LLC Goldman Sachs Portfolio Advisors, LLCAmstar Group, LLC Goodwin Procter LLP Prana InvestmentsAndell, Inc. Green Oak Real Estate Precise Associates Inc.Arc Capital Partners, LLC Greenberg Traurig, LLP Precision BoomerangArcturus Group GreenOak Real Estate Preferred CapitalAres Management LLC Greystar Real Estate Partners, Premier AmericaArgent Management Greystone Servicing Corporation, Inc. Prescott Realty Group, Inc.Argosy Real Estate Griffin Capital Primestor Development, IncArixa Capital Advisors, LLC GTIS Partners Principal Real Estate InvestorsArnall Golden Gregory LLP H/2 Partners Procopio Cory Hargreaves & Savitch LLPArtemis Real Estate Partners Hackman Capital Partners, LLC Proskauer Rose LLPArtis Advisors LLC HAI Advisors LLC Province GroupAstrum Investment Management Hana Asset Trust PRP, LLCAtalaya Capital Management LP HARBOR REAL ESTATE INVESTMENTS LLC Prudential Real Estate InvestorsAtlantic American Partners Harbor Real Estate Partners PwCAustin (TX) Police Retirement System Harrison Street Quantinal Capital AdvisorsAVP Advisors, LLC Harvard University R.W. Baird & Co.Axcel Development Group Hawkins Way Capital R.W. Selby & Co., Inc.Axis Development Group Haynes and Boone, LLP RabobankB.H. Management, Inc. HG Capital, LLC Randall MartinB.H. Properties High Rock Land Company, LLC Randolph Street Realty CapitalBaldwin & Sons, LLC Highbridge Principal Strategies Raymond JamesBallard Spahr Hilco Real Estate RCLCOBank of America Merrill Lynch Hill International, Inc. Realty Mogul, Co.Bank of the West Holthouse Carlin & Van Trigt Realty Pilot, LLCBeacon Pointe Advisors HomeStar Companies Red Cedar ResidentialBeijing Eiseley Capital Management Hoving Capital RedBrook Capital Partners, LLCBenedict Canyon Equities Hylant Group Redwood Real Estate PartnersBerkadia ICO Group of Companies REEisBFIM IHP Capital Partners Regent PropertiesBig Ocean LLC Imperial Capital REIT Investment GroupBioRealty, Inc. Independence Capital Partners Related CompaniesBixby Land Company Inland Institutional Capital Partners Rendina CompaniesBKD, LLP In-Rel Properties, Inc. Rentv.com, Inc.BlackRock InSight Capital Partners LLC Reven Housing REIT, Inc.Blackstone Integratec Services Revere Property GroupBlackwood Integrated Capital Reznick Capital Markets Securities, LLCBlue Mountain Homes Interwest Capital Corporation Rialto Capital AdvisorsBofI Federal Bank Invesco Real Estate Rising Realty PartnersBolour Associates Investors Capital Group LLC RMA, Inc.Borstein Enterprises Iris Environmental Robinson Development GroupBoys & Girls Clubs of Capistrano Valley Irvine Company ROC SeniorsBridge Investment Group Partners Isles Ranch Partners, LLC Rockwood Capital, LLCBridgeport Investments iStar Financial Rosemont RealtyBridgeway Partners J.P. Morgan Rosen Consulting GroupBrooks Capital Management Jacksonville Police & Fire Pension Fund Rothstein KassBuie Stoddard Group LLC James Investment Partners RSI Asset Management, LLCCain White Group JCR Capital RTI Capital, LLCCalkain Companies JCR Companies Russell InvestmentsCannae Partners JCRA Financial LLC RW BairdCantor Fitzgerald Jenny Scharfeld Consulting RW Kline CompaniesCanyon Capital Realty Advisors JH Real Estate Partners Inc. Sabal Financial Group, L.P.Capital Cove Asset Management JH Stark Companies Sack PropertiesCapital Cove Financial JMB Financial Advisors LLC Sage Realty
MASTER PAGE NO. 350

Capital Hall Partners John Burns Real Estate Consulting San Bernardino County Employees RetirementAssociation
Capital One Bank Johnson Capital Santa Ynez Band of Chumash IndiansCapital Source Bank Jones Lang LaSalle Sares Regis GroupCapitalSource JPMorgan Investment Management Inc. Schulte Roth & Zabel LLPCapmark Investments LP JW Development Segal RogerscaseyCapri Capital Partners, LLC Kajaine Capital Sequoian InvestmentsCapstone Advisors, Inc. Kaplan Voekler Cunningham & Frank, PLC Seward & Kissel LLPCarVal Investors Karlin Real Estate Shashi Group, LLCCassidy Turley Katten Muchin Rosenman Sheldon DevelopmentCastlelake KBS Capital Advisors Sheppard Mullin Richter & Hampton LLPCBRE KBS Realty Advisors Shopoff Realty InvestmentsCBRE Global Investors Keller Williams Realty Sierra Pacific Realty/ Fusion networkCenter Street Lending Corporation Kelley Drye & Warren SilverPortalCapital.comCenterra Capital Kelly Capital Silverstein Properties, Inc.CenterSquare Investment Management Kennedy Wilson Singerman Real EstateCerberus California, LLC Key Property Services, LLC SitusCervenka & Lukes Capital Partners Keystone Sonnenblick Development, LLCChicago Policemen's Annuity & Benefit Fund Kilbourne Group Southwest Value PartnersChicago Title Company Kimball, Tirey & St. John LLP Spurs Capital LLCChina Association of Small and Medium Enterprises,of CAST
Knipp Contracting Squar Milner Peterson Miranda & WilliamsonLLP
Church Pension Group Kor Group SR CommercialCIM Group Koss Resource SSG Realty PartnersCIP Real Estate KPMG LLP Standard GlobalCity National Bank Lancaster Group Inc Starwood Property TrustClarion Partners Land Advisors Capital Strada Investment Group II, LLCClay Cove Capital Land Advisors Organization Strategic Holdings, LLCClear Capital LLC Land Banking & Development Strategic Realty Capital, LLCCohen Financial LandCap Investment Partners Stroock & Stroock & Lavan, LLPCohnReznick LLP Landmark Partners Sumitomo Mitsui Banking CorporationColdwell Banker Commercial Saunders RalstonDantzler Realty
Langan Treadwell Rollo SunCal
Cole Real Estate Investments LaSalle Investment Management Sydell Group, Ltd.Colony AMC Latham & Watkins LLP TAB BankColony American Homes Laurus Corporation Tabibian & AssociatesColony Capital, LLC Law & Associates/Land Veritas Target Rock PartnersCommunity Builders Group LBA Realty LLC TDP, Bay Area Partners, LLCConnorex-Lucinda, LLC LBG Realty Advisors, LLC Teacher Retirement System of TexasConsultant LCN Capital Partners TEDxOnBoardContrarian Capital Management, Lever Capital Partners Ten Capital ManagementConvergent Capital Partners Lewis Operating Corp. Terra Capital PartnersConvermat Capital Liberty Group Texas Permanent School FundCooley LLP Lincoln Property Company The Bascom Group, LLCCore Trust Capital Partners Lincoln Street Capital LLC The Blackstone GroupCornerstone Real Estate Advisers LLJ Ventures The Carlyle GroupCornerstone Wealth Management Lone Oak Fund, LLC The CenterCap Group, LLCCortland Capital Market Services Long Market Property Partners The Concord Group, LLCCortland Fund Services Los Angeles City Employees' Retirement
System (LACERS)The Exchange Block LLC
Cost Segregation Servcies, Inc. Lowe Enterprises, Inc. The Laramar Group, LLCCowboy and Company, LLC LRES Corp The Magellan Group, Inc.Cox Castle & Nicholson LLP LStar Management The Muller CompanyCRE Radio Lubert-Adler Partners, LP The Pollin Group, LLCCrescent Bay Holdings, LLC Macquarie Capital (USA) Inc. The Robert Mayer CorporationCrossHarbor Capital Partners, Madison Title Agency LLC The Royal Bank of ScotlandCrown Advisors, Inc. Mamey Investment Corporation The Shopoff Group LP
MASTER PAGE NO. 351

Crown Realty & Development Manatt, Phelps & Phillips, LLP The Swig CompanyCruzan Monroe Mark IV Capital The TerraCotta GroupCunningham Development Company, Inc. Marketing Consultant The Wolff CompanyCushman & Wakefield Maxwelle The Yucaipa CompaniesCYPRESS Office Properties, LLC Mayer Brown LLP THG, LLCD2 Realty Services, Inc. McCarthy Cook & Co. Thorofare CapitalDalfen America Corp. McGladrey LLP TIAA CREFDansk Investment Group, Inc. Menlo Equities Torrey Capital GroupDavid Clinton Pension Advisors Mercer TranswesternDebtwire Mesa West Capital, LLC Trefethen AdvisorsDesjardins, Fédération des Caisses du Québec Metrostudy, A Hanley Wood Company TrigildDeutsche Bank Meyers Research LLC, a Kennedy Wilson
CompanyTriMont Real Estate Advisors
Develop Michigan MIG Real Estate, LLC Tristan Capital PartnersDigital Realty Trust Milbank, Tweed, Hadley & McCloy TruAmerica MultiFamilyDivcoWest Real Estate Services Mintz, Levin, Cohn, Ferris, Glovsky and Popeo,
P.C.True Investments
DLA Piper Miracle Mile Advisors, LLC Turner DevelopmentDLC Residential Mission Capital Advisors Turner Real Estate InvestmentsDLJ Real Estate Capital Partners Mission Pacific Land Company TwinRock PartnersDonahue Schriber Realty Group Morgan Browning Capital U.S. Best Repair Service, Inc.Doral Bank Morgan Stanley U.S. Securities and Exchange CommissionDouglas Wilson Companies Morgan Stanley Real Estate UCLA Investment CompanyDRA Advisors, LLC Morgan Stanley Wealth Management Union bankDrawbridge Realty Trust Morris, Manning & Martin, LLP United Security InvestorsDeutsche Bank Morrison & Foerster LLP Universe HoldingsEagle Group Finance, L.P. Moss Adams Capital LLC Urbana Varro, LLCEastdil Secured Moss Adams LLP US-China Real Estate Investment CenterEB5Investors.com Moss Group Varde PartnersEdgewood Realty Partners, LLC MUFG Union Bank VAREPEisner Kahan Muir Alternative Investment Management W.M. Grace CompaniesEisnerAmper, LLP Mutual of Omaha Bank Walnut Street Opportunity FundEncore Capital Management MWest Holdings Walton Asset ManagementEncore Housing Opportunity Fund National REIA Walton Street Capital, LLCEquity Resource Investments Nelson Brothers Professional Real Estate Washington HoldingsEquity Stake NES Financial Waypoint HomesErnst & Young LLP Net Lease Capital Advisors Wells Fargo Bank N.A.Essex Property Trust Newmark Grubb Knight Frank Wells Fargo Commercial Real EstateETCO Homes Noble Investment Group, LLC West Coast Real Estate VenturesEthika Investments Nomura Holding America Inc. Westbrook PartnersEVOLVE North Star Realty Finance Westbrook PropertiesEVOQ Properties Northern Trust WESTCAP CORPEY Global Services Limited NorthStar Realty Finance Corp. Western National PropertiesFairfield Residential Northwood Investors Westpac Campus Communities,Farallon Capital Management, Oak Pass Capital Management Westport Capital Partners LLCFarco Homes OAK SKY Capital White Oak Real EstateFelix / Weiner Consulting Group Oaktree Real Estate Finance, LLC Wilshire Finance PartnersFenway Properties OneWest Bank N.A. Wilson MeanyFident Capital OPG Funds Management Group Wood PartnersFinancial Compound Opus Bank Woodbine Investment CorporationFirst American Title Insurance Company ORG Property Management Woodbridge Capital PartnersFirst Key Lending, LLC Paladin Realty Partners, LLC Woodside GroupFirst Republic Bank Palisades Capital Realty Advisors Worcester Investments Yardi Systems, Inc. Zephyr Partners
MASTER PAGE NO. 352

DISCLAIMER: IMN, a division of Euromoney Institutional Investor PLC, 225 Park Avenue South, New York, NY 10003. This emailand any files transmitted with it are confidential and intended solely for the use of the individual or entity to whom they areaddressed. If you have received this email in error please notify the system manager. This footnote also confirms that this emailmessage has been swept for the presence of computer viruses. www.imn.org. If you would prefer not to receive emails fromIMN, please click respond to this email with unsubscribe in the subject line. Your request will be completed within 5 businessdays.
DISCLAIMER: If you would prefer not to receive emails from IMN, please click respond to this email with unsubscribe in the subject line. Your request will becompleted within 5 business days. IMN, a division of Euromoney Institutional Investor PLC, 225 Park Avenue South, New York, NY 10003. This email andany files transmitted with it are confidential and intended solely for the use of the individual or entity to whom they are addressed. If you have received thisemail in error please notify the system manager. This footnote also confirms that this email message has been swept for the presence of computer viruses.www.imn.org.
MASTER PAGE NO. 353

2015 Americas Real Assets Client Conference
Save the Date
Laguna Cliffs Marriott Resort & Spa Dana Point, California March 17-19, 2015
MASTER PAGE NO. 354

SAVE THE DATE Please plan on joining Deutsche Asset & Wealth Management’s real assets team for our 17th annual client educational conference in beautiful Dana Point, California on March 17-19. Commencing with a welcome reception and dinner on Tuesday, March 17, the event will feature a series of educational presentations and discussions, including:
‒ Outlook on global and U.S. economies ‒ Investment perspectives on domestic and overseas property markets ‒ Portfolio construction views and transaction market trends ‒ Update on the liquid real assets markets ‒ Assessing the infrastructure space ‒ Investor meetings for RREEF America REIT II and RREEF America REIT III ‒ Breakout discussion for separate account clients
Most importantly, we look forward to the opportunity of spending time with you and hearing your thoughts on the role real assets is playing in your portfolios, and the challenges and opportunities you see in the year ahead. We look forward to seeing you in southern California! Laura Gaylord Managing Director, Global Client Group
Formal Invitation and Agenda to Follow
Deutsche Asset & Wealth Management represents the asset management and wealth management activities conducted by Deutsche Bank AG or any of its subsidiaries. Clients will be provided Deutsche Asset & Wealth Management products or services by one or more legal entities that will be identified to clients pursuant to the contracts, agreements, offering materials or other documentation relevant to such products or services. © 2014 Deutsche Bank AG. All rights reserved. I-036178-1
MASTER PAGE NO. 355
Related Documents


