BUSINESS JOURNAL SKYLINE A Research Publication of Skyline University College, Sharjah, United Arab Emirates. Volume IX-Issue 1-2013-2014 CONTENTS 1. EDITORIAL Amitabh Upadhya .......................................................................................................................................... 2. THE MACROECONOMIC DETERMINANTS OF BANK CREDIT IN MALAYSIA: AN ANALYSIS VIA THE ERROR CORRECTION MODEL (ECM) Hassanudin Mohd Thas Thaker, Tan Siew Ee, Chuan Fui Sin, Wong Hui Man..................................... 3. TESTING WEAK FORM STOCK MARKET EFFICIENCY ON MUSCAT SECURITIES MARKET: OMAN Arvind Kumar, Dharmendra Singh.............................................................................................................. 4. THE COMPATIBILITY OF BUSINESS CURRICULUM AT PALESTINIAN UNIVERSITIES WITH THE ACTUAL DEMANDS OF THE LOCAL MARKET AS PERCEIVED BY BUSINESS GRADUATES Usamah Shahwan............................................................................................................................................ 5. ROLE OF BLOGS AS EXPAT CONSUMERS SOURCE OF INFORMATION: AN EXPLORATORY STUDY Shivakumar Krishnamurti, Ruchi Agarwal................................................................................................. 6. JOB SATISFACTION: A STUDY OF PUBLIC AND PRIVATE SECTOR EMPLOYEES Vishal Kumar,Savita ...................................................................................................................................... 7. AN EXPLORATORY STUDY OF WORK-LIFE BALANCE AND WORK-FAMILY CONFLICTS IN THE UNITED ARAB EMIRATES Nick Forster, Aisha Al Ali Ebrahim, Nadia Alma Ibrhim.......................................................................... 8. CHANGES IN EMPLOYER-EMPLOYEE RELATIONSHIP: IMPACT OF PERCEIVED ORGANIZATIONAL SUPPORT ON SOCIAL EXCHANGE OF THE OUTSOURCING INDUSTRY IN SRI LANKA V.Sivalogathasan, Ashmel Hashim............................................................................................................... 9. WORK-LIFE BALANCE AND BURNOUT AS PREDICTORS OF JOB SATISFACTION IN PRIVATE BANKING SECTOR V.Rama Devi, A.Nagini.................................................................................................................................. 10. REGULATION, INTERPERSONAL RELATIONSHIP AND DEMISE OF A PROMISING COMPANY: THE CASE OF GREAT AFRICAN INSURANCE COMPANY Anastas Kabral Nyamikeh ............................................................................................................................ 11. FORTHCOMING CONFERENCES ........................................................................................................... 12. CALL FOR PAPERS .................................................................................................................................... ii 1 9 14 22 29 34 43 50 54 59 62 ISSN 1998 - 3425 Annual Journal of Skyline University College, Sharjah, U.A.E. Skyline Business Journal, Volume IX-Issue 1-2013-2014

Welcome message from author
This document is posted to help you gain knowledge. Please leave a comment to let me know what you think about it! Share it to your friends and learn new things together.
Transcript

Skyline Business Journal, Volume IX-Issue 1-2013-2014
BUSINESS JOURNALSKYLINEA Research Publication of Skyline University College, Sharjah, United Arab Emirates.
Volume IX-Issue 1-2013-2014
CONTENTS
1. EDITORIAL Amitabh Upadhya ..........................................................................................................................................
2. THE MACROECONOMIC DETERMINANTS OF BANK CREDIT IN MALAYSIA: AN ANALYSIS VIA THE ERROR CORRECTION MODEL (ECM) Hassanudin Mohd Thas Thaker, Tan Siew Ee, Chuan Fui Sin, Wong Hui Man.....................................
3. TESTING WEAK FORM STOCK MARKET EFFICIENCY ON MUSCAT SECURITIES MARKET: OMAN Arvind Kumar, Dharmendra Singh..............................................................................................................
4. THE COMPATIBILITY OF BUSINESS CURRICULUM AT PALESTINIAN UNIVERSITIES WITH THE ACTUAL DEMANDS OF THE LOCAL MARKET AS PERCEIVED BY BUSINESS GRADUATES Usamah Shahwan............................................................................................................................................
5. ROLE OF BLOGS AS EXPAT CONSUMERS SOURCE OF INFORMATION: AN EXPLORATORY STUDY Shivakumar Krishnamurti, Ruchi Agarwal.................................................................................................
6. JOB SATISFACTION: A STUDY OF PUBLIC AND PRIVATE SECTOR EMPLOYEES Vishal Kumar,Savita ......................................................................................................................................
7. AN EXPLORATORY STUDY OF WORK-LIFE BALANCE AND WORK-FAMILY CONFLICTS IN THE UNITED ARAB EMIRATES Nick Forster, Aisha Al Ali Ebrahim, Nadia Alma Ibrhim..........................................................................
8. CHANGES IN EMPLOYER-EMPLOYEE RELATIONSHIP: IMPACT OF PERCEIVED ORGANIZATIONAL SUPPORT ON SOCIAL EXCHANGE OF THE OUTSOURCING INDUSTRY IN SRI LANKA V.Sivalogathasan, Ashmel Hashim...............................................................................................................
9. WORK-LIFE BALANCE AND BURNOUT AS PREDICTORS OF JOB SATISFACTION IN PRIVATE BANKING SECTOR V.Rama Devi, A.Nagini..................................................................................................................................
10. REGULATION, INTERPERSONAL RELATIONSHIP AND DEMISE OF A PROMISING COMPANY: THE CASE OF GREAT AFRICAN INSURANCE COMPANY Anastas Kabral Nyamikeh ............................................................................................................................
11. FORTHCOMING CONFERENCES ...........................................................................................................
12. CALL FOR PAPERS ....................................................................................................................................
ii
1
9
14
22
29
34
43
50
54
59
62
ISSN 1998 - 3425
Annual Journal of Skyline University College, Sharjah, U.A.E.Skyline Business Journal, Volume IX-Issue 1-2013-2014

ii
Skyline Business Journal, Volume IX-Issue 1-2013-2014
EDITORIAL
Skyline Business Journal enters the tenth year of its launch with this issue. The next issue will complete a decade of scholarly journey, these past years the journal has gone through a steady process of evolution in circulation, print quality and merit of articles. We are still on the job to take the journal to yet greater heights. I am proud of the team that works for the Journal which also includes the scholars of the editorial board. Each one of the team member is dedicated and focused to achieve the goals we set for ourselves every year. It will not be out of place if I inform readers that this year we will come up with a special issue of the Journal that will include selected papers that are to be presented at the ‘International Conference on Tourism Milestones’ slated to be held during 31st March and 2nd April 2014 in Sharjah organized by Skyline University College.
The present issue has nine research papers. Four out of these nine papers revolve around the theme of Human Resource Management. Interestingly, two of these are on work-life balance. One of which explores the balancing act by Emirati women on the demands of their job and family while the other investigates the relationship between work-life balance and employee satisfaction amongst bankers. Further, a paper assesses employer employee relationship in BPO organizations of Sri Lanka. The paper concludes that employer-employee relationship is paramount since the human capital is a critical success factor to business solutions. The fourth paper in this group is a study of job satisfaction between employees of public and private sectors in India.
There also is a very interesting paper from Palestine evaluating the compatibility of Business Management curriculums taught at Palestinian Universities with the requirements of the market. The paper finds out that there is a perceived mismatch between the two and that is a cause for concern and a relook is needed, the author suggests means to re-design the curriculum to fulfill the imminent need. In yet another paper, the researcher explores the role of blogs as a source of information to expatriates in the UAE. This study reveals that the expats not only blog their experiences but also the blogs are a rich source of vital information to them on a variety of products, services and even medical issues. This issue of the Journal also includes an interesting case study from Ghana about the demise of The Great African Insurance Company, due to inefficient management, internal conflicts and authoritarian leadership style. There are the other two papers, one highlighting macroeconomic determinants of bank credit in Malaysia and the other on stock market efficiency of Muscat (Oman) securities.
It is very satisfying to see that researchers from the region are taking keen interest in the Journal and contributing meaningfully. The geographical coverage of the articles this time is pretty wide, all the way from Malaysia in the east to Ghana in the west representing several business and management issues in the developing world. I am sure the steady flow of contributions will continue and only worthy research is published in the forthcoming issues.
Dr. Amitabh UpadhyaEditor-in-Chief
SKYLINE BUSINESS JOURNAL
PatronMr. Kamal Puri
Editor-in-ChiefDr. Amitabh Upadhya
Associate EditorDr. Shanmugan Joghee
Technical CommitteeDr. Deepak Kalra
Mr. Firoj Kumar RautaMr. Anish Chacko
www.skylineuniversity.ac.ae
Editorial Board
Dr.Richard Anthony John SharpleyUniversity of Central Lancashire
UK
Dr.Bob De WitStrategy AcademyThe Netherlands
Dr. Elsadig Musa Ahmed Multimedia University
Malaysia
Dr.Devashish Das GuptaIIM-Lucknow, India
Dr. Parag SanghaniSkyline University College
Dr. John SeniorSkyline University College
Dr. Manuel FernandezSkyline University College
Dr. Mohammed Nadeem National University, USA
Dr.Nicholas MeihuizenNorth West University
South Africa
Dr.Kakul Agha Knowledge Oasis Muscat
Sultanate of Oman
Dr.J.Paul Sundar Kirubakaran College of Applied Sciences Nizwa, Sultanate of Oman
Dr.Shivakumar KrishnamurtiSkyline University College
Dr. Riktesh SrivastavaSkyline University College
Dr.Beena SalimSkyline University College
Dr.Manoj KumarSkyline University College
Dr.Idorenyin AkpanAmerican University of Nigeria
Dr. Kristine Brands Regis University
Colorado Springs, USA
Dr.Mansour Ibrahim SaaydahWorld Islamic Sciences &
Education University, Jordan
Dr. Makarand UpadhyayaJazan University
Jazan , Saudi Arabia
Dr. Rashad M. Y. AlsaedSkyline University College
Dr.Welcome SibandaSkyline University College
Dr.Mahesh AgnihotriSkyline University College
Dr. Nadir Ali KolachiSkyline University College
Dr. Ming Ming Su Renmin University of China
Dr.Sudhakar KotaSkyline University College
Dr. Anil Roy DubeySkyline University College
Consulting Editorial Board
Skyline Business Journal, Volume IX-Issue 1-2013-2014

ii
Skyline Business Journal, Volume IX-Issue 1-2013-2014
EDITORIAL
Skyline Business Journal enters the tenth year of its launch with this issue. The next issue will complete a decade of scholarly journey, these past years the journal has gone through a steady process of evolution in circulation, print quality and merit of articles. We are still on the job to take the journal to yet greater heights. I am proud of the team that works for the Journal which also includes the scholars of the editorial board. Each one of the team member is dedicated and focused to achieve the goals we set for ourselves every year. It will not be out of place if I inform readers that this year we will come up with a special issue of the Journal that will include selected papers that are to be presented at the ‘International Conference on Tourism Milestones’ slated to be held during 31st March and 2nd April 2014 in Sharjah organized by Skyline University College.
The present issue has nine research papers. Four out of these nine papers revolve around the theme of Human Resource Management. Interestingly, two of these are on work-life balance. One of which explores the balancing act by Emirati women on the demands of their job and family while the other investigates the relationship between work-life balance and employee satisfaction amongst bankers. Further, a paper assesses employer employee relationship in BPO organizations of Sri Lanka. The paper concludes that employer-employee relationship is paramount since the human capital is a critical success factor to business solutions. The fourth paper in this group is a study of job satisfaction between employees of public and private sectors in India.
There also is a very interesting paper from Palestine evaluating the compatibility of Business Management curriculums taught at Palestinian Universities with the requirements of the market. The paper finds out that there is a perceived mismatch between the two and that is a cause for concern and a relook is needed, the author suggests means to re-design the curriculum to fulfill the imminent need. In yet another paper, the researcher explores the role of blogs as a source of information to expatriates in the UAE. This study reveals that the expats not only blog their experiences but also the blogs are a rich source of vital information to them on a variety of products, services and even medical issues. This issue of the Journal also includes an interesting case study from Ghana about the demise of The Great African Insurance Company, due to inefficient management, internal conflicts and authoritarian leadership style. There are the other two papers, one highlighting macroeconomic determinants of bank credit in Malaysia and the other on stock market efficiency of Muscat (Oman) securities.
It is very satisfying to see that researchers from the region are taking keen interest in the Journal and contributing meaningfully. The geographical coverage of the articles this time is pretty wide, all the way from Malaysia in the east to Ghana in the west representing several business and management issues in the developing world. I am sure the steady flow of contributions will continue and only worthy research is published in the forthcoming issues.
Dr. Amitabh UpadhyaEditor-in-Chief
ii

Skyline Business Journal, Volume IX-Issue 1-2013-2014
THE MACROECONOMIC DETERMINANTS OF BANK CREDIT IN MALAYSIA AN ANALYSIS VIA THE ERROR CORRECTION MODEL (ECM)
Hassanudin Mohd Thas Thaker, Tan Siew Ee, Chuan Fui Sin, Wong Hui Man
Abstract:
The financial landscape in the Malaysian banking sector has undergone major structural changes in this era of globalization with various liberalization measures introduced during the last decade. These include government reforms to improve the bank infrastructure, existing ownership structures, lending practices and capital requirements; deregulation to allow for increased competition and greater focus on consolidation and mergers and acquisitions (Abdul Rahman et al, 2006). As part of the reform to develop large and high-performing banks to support growth at home and abroad, the government encouraged the banking sector to move towards a more private market- driven industry sector; to implement Basel Accord II and to adopt similar risk management standards as well as to improve bank services such as lending and borrowing activities and performance in the home country (Aziz, 2006). In this context, our study aims to discuss the impact of macroeconomic variables on bank credit in Malaysia between 1991 and 2011.Using quarterly data for January 1991 to December 2011, unit root test, cointegration test and the vector error correction model were applied to uncover the dynamic long run relationship between macroeconomic variables and bank credit. Overall, it can be clearly seen that all these three macroeconomic variables have contributed positively towards bank credit in the Malaysia. It is also statistically proven that they also have positive long run relationship with the bank credit.
Keywords: Bank Credit, Unit Root Test, Cointegration Test, Vector Error Correction Model, Malaysia.
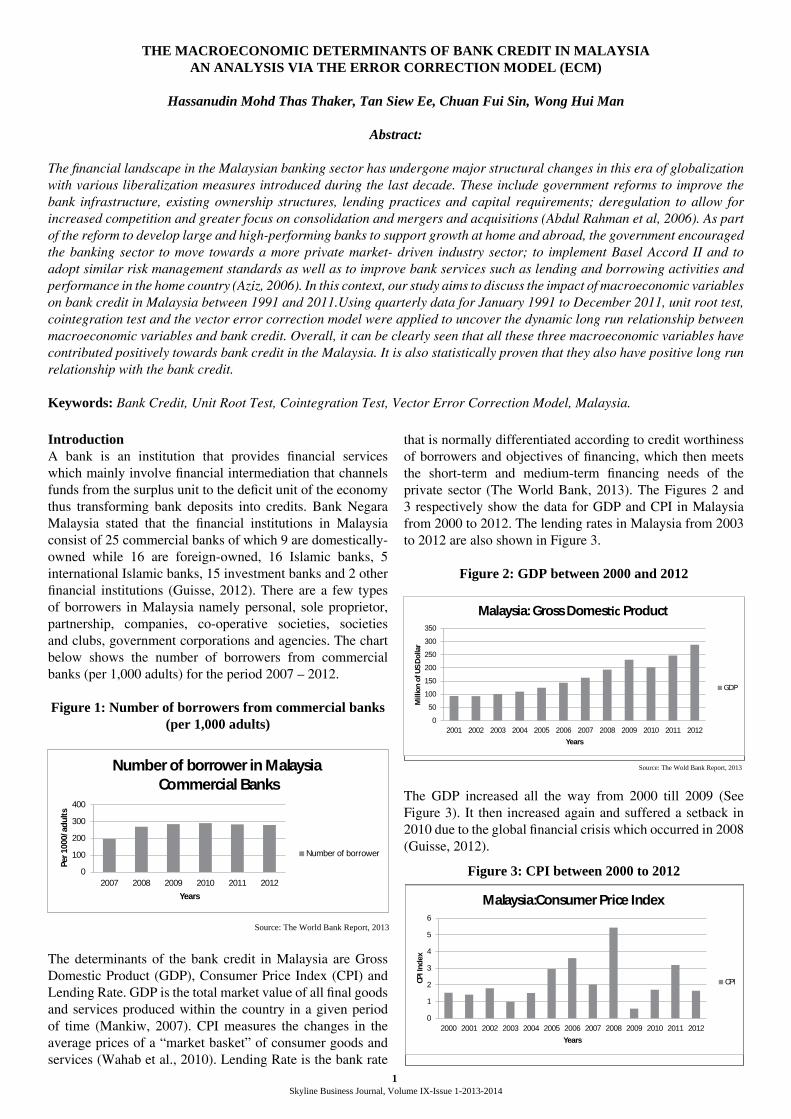
IntroductionA bank is an institution that provides financial services which mainly involve financial intermediation that channels funds from the surplus unit to the deficit unit of the economy thus transforming bank deposits into credits. Bank Negara Malaysia stated that the financial institutions in Malaysia consist of 25 commercial banks of which 9 are domestically-owned while 16 are foreign-owned, 16 Islamic banks, 5 international Islamic banks, 15 investment banks and 2 other financial institutions (Guisse, 2012). There are a few types of borrowers in Malaysia namely personal, sole proprietor, partnership, companies, co-operative societies, societies and clubs, government corporations and agencies. The chart below shows the number of borrowers from commercial banks (per 1,000 adults) for the period 2007 – 2012.
Figure 1: Number of borrowers from commercial banks (per 1,000 adults)
The determinants of the bank credit in Malaysia are Gross Domestic Product (GDP), Consumer Price Index (CPI) and Lending Rate. GDP is the total market value of all final goods and services produced within the country in a given period of time (Mankiw, 2007). CPI measures the changes in the average prices of a “market basket” of consumer goods and services (Wahab et al., 2010). Lending Rate is the bank rate
that is normally differentiated according to credit worthiness of borrowers and objectives of financing, which then meets the short-term and medium-term financing needs of the private sector (The World Bank, 2013). The Figures 2 and 3 respectively show the data for GDP and CPI in Malaysia from 2000 to 2012. The lending rates in Malaysia from 2003 to 2012 are also shown in Figure 3.
Figure 2: GDP between 2000 and 2012
4
Figure 1: Number of borrowers from commercial banks (per 1,000 adults)
Source: The World Bank Report, 2013
The determinants of the bank credit in Malaysia are Gross Domestic Product (GDP), Consumer Price Index (CPI) and Lending Rate. GDP is the total market value of all final goods and services produced within the country in a given period of time (Mankiw, 2007). CPI measures the changes in the average prices of a “market basket” of consumer goods and services (Wahab et al., 2010). Lending Rate is the bank rate that is normally differentiated according to creditworthiness of borrowers and objectives of financing, which then meets the short-term and medium-term financing needs of the private sector (The World Bank, 2013). The Figures 2 and 3 respectively show the data for GDP and CPI in Malaysia from 2000 to 2012. The lending rates in Malaysia from 2003 to 2012 are also shown in Figure 3.
Figure 2: GDP between 2000 and 2012
Source: The Wold Bank Report, 2013
0
100
200
300
400
2007 2008 2009 2010 2011 2012
Per 1
000/
adul
ts
Years
Number of borrower in Malaysia Commercial Banks
Number of borrower
0
50
100
150
200
250
300
350
2001 2002 2003 2004 2005 2006 2007 2008 2009 2010 2011 2012
Mill
ion
of U
S D
olla
r
Years
Malaysia: Gross Domestic Product
GDP
The GDP increased all the way from 2000 till 2009 (See Figure 3). It then increased again and suffered a setback in 2010 due to the global financial crisis which occurred in 2008 (Guisse, 2012).
Figure 3: CPI between 2000 to 2012
5
The GDP increased all the way from 2000 till 2009 (See Figure 3). It then increased again and suffered a setback in 2010 due to the global financial crisis which occurred in 2008 (Guisse, 2012).
Figure 3: CPI between 2000 to 2012
Source: The World Bank Report, 2013 The CPI increased all the way from the year 2000 to 2012. Rising food and energy prices which boosted inflation in emerging markets around the world could be one of the reasons for this. Many commodity prices, including crude oil, have posted significant increases throughout these years.
Figure 4: The graph of Lending Rate between 2003 to 2012
Source: The World Bank, 2013
There was a decrease in the lending rate between 2003 and 2005 due to the role of the Bank Negara in reducing the lending rate to stimulate the economy. The lending rate suffered a drastic decrease between 2008 and 2009 which are the post-crisis years of the 2008 global financial crisis.
0
1
2
3
4
5
6
2000 2001 2002 2003 2004 2005 2006 2007 2008 2009 2010 2011 2012
CPI I
ndex
Years
Malaysia:Consumer Price Index
CPI
1

Skyline Business Journal, Volume IX-Issue 1-2013-2014
The CPI increased all the way from the year 2000 to 2012. Rising food and energy prices which boosted inflation in emerging markets around the world could be one of the reasons for this. Many commodity prices, including crude oil, have posted significant increases throughout these years.
Figure 4: The graph of Lending Rate between 2003 to 2012
5
The GDP increased all the way from 2000 till 2009 (See Figure 3). It then increased again and suffered a setback in 2010 due to the global financial crisis which occurred in 2008 (Guisse, 2012).
Figure 3: CPI between 2000 to 2012
Source: The World Bank Report, 2013 The CPI increased all the way from the year 2000 to 2012. Rising food and energy prices which boosted inflation in emerging markets around the world could be one of the reasons for this. Many commodity prices, including crude oil, have posted significant increases throughout these years.
Figure 4: The graph of Lending Rate between 2003 to 2012
Source: The World Bank, 2013
There was a decrease in the lending rate between 2003 and 2005 due to the role of the Bank Negara in reducing the lending rate to stimulate the economy. The lending rate suffered a drastic decrease between 2008 and 2009 which are the post-crisis years of the 2008 global financial crisis.
0
1
2
3
4
5
6
2000 2001 2002 2003 2004 2005 2006 2007 2008 2009 2010 2011 2012
CPI I
ndex
Years
Malaysia:Consumer Price Index
CPI
There was a decrease in the lending rate between 2003 and 2005 due to the role of the Bank Negara in reducing the lending rate to stimulate the economy. The lending rate suffered a drastic decrease between 2008 and 2009 which are the post-crisis years of the 2008 global financial crisis.
There are many reasons why people involve themselves in bank credit activities. The bank offers various kinds of loans to satisfy different needs of borrowers. As a consumer, due to the budget constraints, they may choose to spend using credit cards to increase their utilities now and forego the consumption in the future. Again, due to limited buying power, consumers cannot afford to buy those luxurious goods such as cars, houses and lands. Hence, after getting the loans from bank, they can repay through instalment including principal plus interest. This consumption contributes largely to the total gross domestic output. Beside this, business people will apply for loans from banks for investing in financial securities, mutual fund and derivatives. This accounts for the investment components in gross domestic product.
Furthermore, the Malaysian banking sector has undergone significant structural change in this phase of globalization with various liberalization measures being introduced over the last decade. These include government reforms to improve the bank infrastructure, the existing ownership structures, lending practices and capital requirements; deregulation to allow for increased competition, and heavy focus on consolidation and mergers and acquisitions ( Abdul Rahman et al, 2006). As part of the reform to develop large, high-performing banks to support growth at home and abroad, the government encouraged banks to move towards a more private market- driven industry sector; to implement Basel Accord II or to adopt similar risk management standards; and to improve bank structure and performance in the home country (Aziz, 2006). Therefore, we believe that these factors may have an implication on the bank credit activity in Malaysia. This paper therefore aims to discuss the impact and relationship of macroeconomic variables towards bank credit in Malaysia for the decades covering 1991 - 2011.
2.0. Literature ReviewThere are quite a number of researches conducted in the area of banks credit both for developed and emerging economies.
In this study, the literature review can be divided into three categories that will discuss Lending Rate (LR), Consumer Price Index (CPI) and Gross Domestic Product (GDP) which we consider to be the main determinants of bank credit.
It is postulated that there is a positive relationship between lending rate and bank credit. The lending rate is highly related to monetary policy implemented by the Central Bank. If the economy is in recession, the central bank will buy in the government bonds to stimulate expenditures and it will increase the supply of money in the market (McConnell et al., 2012). Hence, the lending rate will fall due to excess supply of money. Consequently, this will benefit two parties in the market, namely consumers and producers. For consumers, they are encouraged to forego future consumption and consume more now in the goods and services market. For producers, the low interest rates act as an incentive to borrow money to invest by purchasing more raw materials, equipments and buildings. If this situation is uncontrolled, the money supply continues to expand and prices will continuously rise when the growth of output reaches the capacity limits (Schwartz, 2008). Comparatively, Topi and Vilmunen (2001) have attempted to investigate the effects of monetary policy on bank lending for Finland. They find that bank lending responds positively to changes in real income and inflation, but negatively to monetary policy shocks.
There is also a positive relationship between deposit interest rate and bank activity. Bank loans are raised significantly and immediately when there is an increase in the interest rate (Ibrahim, 2006). Interest rate has long been recognized by classical, neo-classical and contemporary economists as one of the factors that determine the level of savings in the economy. The higher the rate of interest, the more willing people will be to forego present consumption; more money will be saved (Haron & Ahmad, et.al. 2006). Masson et al. (1998) found that demographic factor such as real interest rate is positively related to savings in industrial and developing countries (Haron & Wan Azmi, 2006). Using the Adaptive Expectation Model, it is confirmed that there is a negative relationship between the interest rate of conventional banks and the amount deposited in interest-free deposit facilities due to the existence of the utility maximization theory (Haron & Ahmad, et.al. 2006).
The positive relationship between CPI and bank credit also appears to be a positive one. Using the two-tailed Spearman test, quarterly repayment data from Bank Negara Malaysia (BNM) for eight major types of loans were tested for correlation against the CPI. The result shows that there is a significant positive correlation between CPI and repayment of loans for purchase of transport vehicles, purchase of property, personal consumption, credit cards, working capital, total loan repayments (Kechik, 2008). CPI is used as an indicator for inflation. Risk-adverse consumers may increase their precautionary savings because inflation increases the uncertainty regarding future income growth (Haron & Wan Azmi, 2006). On the other hand, a study by Pazarbasioglu (1997) indicates that inflation had a strong negative effect on credit demand in Finland during the period 1981-1986 and 1987-1995. Pazarbasioglu estimated credit demand
2

Skyline Business Journal, Volume IX-Issue 1-2013-2014
for Finland to determine whether there was a credit crunch after the banking crisis. To analyse the effect of inflation on bank credit Pazarbasioglu used the maximum log likelihood approach. The explanatory variables were the bank lending rate, expected fixed investment, expected rate of inflation and industrial production. A similar result was found in Moore and Threshgold (1985) whereby they investigated the short-run dynamics of loans to the industrial and commercial companies in the United Kingdom. The explanatory variables in the model were components of the working capital of the firms and the data used covered the period 1978-1981. A single short-run disequilibrium equation was used to analysis the short-run dynamics of loans. This Moore and Threshgold study also provides evidence of a negative relationship between bank credit and inflation.
In general, many studies have been conducted in the past on the relationship between bank credit and economic growth. One, conducted by Ibrahim (2009) showed that there was a positive relationship between GDP and bank activity because an increase in GDP will raise both supply and demand for loans. As GDP increases, banks will have more funds to make loans due to the increase in the amount of deposits. Moreover, Agrawal (2001) found that both high rate of growth of income per capita and the rapidly declining age dependency ratio have contributed to the high rate of savings in the seven Asian countries (South Korea, Taiwan, Singapore, Malaysia, Thailand, Indonesia and India).(Haron & Wan Azmi, 2006). Deidda and Fattouh (2002) concluded that there is a positive correlation between bank-based financial development and growth of the economy in countries with higher income. When the income of the country grows, market-based financial structures will increase (Lakstutiene, 2008). However, the high credit growth acts as a signal for the occurrence of financial crises. In the empirical analysis, there is a significant relationship between the rapid credit growth and increasing defaults. Dell’Ariccia and Marques (2006) as cited in Kelly, McQuinn, Stuart (2013) have a prediction that the defaults cases will be increasing after the credit has been expanded rapidly. The rapid credit growth is more likely to occur in the upswing of a business cycle due to over-exuberant lending. Hence, the defaults rate is increasing in the upswing of the cycle. So, when the GDP is increasing rapidly and economy is at the peak of the business cycle, the bank credit system makes more mistakes and will finally contribute to the collapse of economy. (as cited in Kelly, Mc Quinn, Stuart, 2013). Inevitably, the growth of GDP is positively correlated to the rapid growth of bank credit activities.Therefore, hypotheses put forth in this study are;
H1: Bank credit in Malaysia is determined by Lending Rate/Interest Rate;
H2: Bank credit in Malaysia is determined by Consumer Price index;
H3: Bank credit in Malaysia is determined by Gross Domestic Product;
3.0. Methodology
3.1. ModelTo identify the relationship between bank credit and
macroeconomic determinants, we employ the following model;
8
the business cycle, the bank credit system makes more mistakes and will finally contribute to the collapse of economy. (as cited in Kelly, Mc Quinn, Stuart, 2013). Inevitably, the growth of GDP is positively correlated to the rapid growth of bank credit activities.
Therefore, hypotheses put forth in this study are; H1: Bank credit in Malaysia is determined by Lending Rate/Interest Rate; H2: Bank credit in Malaysia is determined by Consumer Price index; H3: Bank credit in Malaysia is determined by Gross Domestic Product;
3.0. Methodology
3.1. Model
To identify the relationship between bank credit and macroeconomic determinants, we employ the following model;
LnBC = f (LnLR, LnCPI, LnGDP)
where:
LnBC = Natural Log of Bank Credit/Loans LnLR = Natural Log of Lending Rate/Interest Rate LnCPI = Natural Log of Consumer Price Index (Base Year: 1990: 100) LnGDP = Natural Log of Gross Domestic Product
3.2. Unit Root (UR) and Cointegration Tests (CT)
The first step in this study is to determine stationarity of the variables of the models. Broadly speaking, classical regression techniques may be invalid if applied to variables that do not fulfil the stationarity property (Thomas, 1997). This study uses the most commonly used test, which is the Augmented Dickey Fuller (ADF) test. It is “augmenting” a random walk with drifts around a stochastic trend by adding the lagged values of the dependent variable ΔYt (Gujarati, 2009). The test of Unit Root is based on the following equation;
(UR) ----------------------
m
ittittt YYY
11121 (Equation 1)
where: 1 and 2 are parameters, t is the time or trend variable, indicates drift, t is a pure white noise error term and ),322211 (),( tttttt YYYYYY etc. In case if the null hypothesis exists, i.e. 0 ; then there is a unit root. Hence, the time series is non – stationary. If the alternate hypothesis exists, i.e. is less than zero, then the time series is stationary.
The next step would be a test on cointegration. Gujarati (2009) illustrates that, although variables are individually not stationary, I (1), and they are stochastic trends, and the linear combination between those variables may be stationary. Therefore, all those variables are co-integrated. Variables will be cointegrated in the case where they have long term or equilibrium, relationship between them (Gujarati, 2009). In order to test the long run
3.2. Unit Root (UR) and Cointegration Tests (CT)The first step in this study is to determine stationarity of the variables of the models. Broadly speaking, classical regression techniques may be invalid if applied to variables that do not fulfil the stationarity property (Thomas, 1997). This study uses the most commonly used test, which is the Augmented Dickey Fuller (ADF) test. It is “augmenting” a random walk with drifts around a stochastic trend by adding the lagged values of the dependent variable ΔYt (Gujarati, 2009). The test of Unit Root is based on the following equation;
8
the business cycle, the bank credit system makes more mistakes and will finally contribute to the collapse of economy. (as cited in Kelly, Mc Quinn, Stuart, 2013). Inevitably, the growth of GDP is positively correlated to the rapid growth of bank credit activities.
Therefore, hypotheses put forth in this study are; H1: Bank credit in Malaysia is determined by Lending Rate/Interest Rate; H2: Bank credit in Malaysia is determined by Consumer Price index; H3: Bank credit in Malaysia is determined by Gross Domestic Product;
3.0. Methodology
3.1. Model
To identify the relationship between bank credit and macroeconomic determinants, we employ the following model;
LnBC = f (LnLR, LnCPI, LnGDP)
where:
LnBC = Natural Log of Bank Credit/Loans LnLR = Natural Log of Lending Rate/Interest Rate LnCPI = Natural Log of Consumer Price Index (Base Year: 1990: 100) LnGDP = Natural Log of Gross Domestic Product
3.2. Unit Root (UR) and Cointegration Tests (CT)
The first step in this study is to determine stationarity of the variables of the models. Broadly speaking, classical regression techniques may be invalid if applied to variables that do not fulfil the stationarity property (Thomas, 1997). This study uses the most commonly used test, which is the Augmented Dickey Fuller (ADF) test. It is “augmenting” a random walk with drifts around a stochastic trend by adding the lagged values of the dependent variable ΔYt (Gujarati, 2009). The test of Unit Root is based on the following equation;
(UR) ----------------------
m
ittittt YYY
11121 (Equation 1)
where: 1 and 2 are parameters, t is the time or trend variable, indicates drift, t is a pure white noise error term and ),322211 (),( tttttt YYYYYY etc. In case if the null hypothesis exists, i.e. 0 ; then there is a unit root. Hence, the time series is non – stationary. If the alternate hypothesis exists, i.e. is less than zero, then the time series is stationary.
The next step would be a test on cointegration. Gujarati (2009) illustrates that, although variables are individually not stationary, I (1), and they are stochastic trends, and the linear combination between those variables may be stationary. Therefore, all those variables are co-integrated. Variables will be cointegrated in the case where they have long term or equilibrium, relationship between them (Gujarati, 2009). In order to test the long run
where: and are parameters, t is the time or trend variable, indicates drift, is a pure white noise error term and etc. In case if the null hypothesis exists, i.e. ; then there is a unit root. Hence, the time series is non – stationary. If the alternate hypothesis exists, i.e. is less than zero, then the time series is stationary.
The next step would be a test on cointegration. Gujarati (2009) illustrates that, although variables are individually not stationary, I (1), and they are stochastic trends, and the linear combination between those variables may be stationary. Therefore, all those variables are co-integrated. Variables will be cointegrated in the case where they have long term or equilibrium, relationship between them (Gujarati, 2009). In order to test the long run relationship, the Johansen and Julieus Cointegration (CT) test will be employed. The test will be run based on the following equation;
Cointegration exists if the trace statistics is greater than critical values. After the identification of the number of Cointegration equations, then we can proceed to the Vector Error Correction Model analysis.
3.3. Vector Error Correction Model (VECM)Vector Error Correction Model is a restricted VAR (Vector Autoregressive) model used for non - stationary variables to be cointegrated. VECM specification restricts the long run behaviour of endogenous variables to converge to their cointegration relationship (Abduh et all, 2011).
VECM shows the adjustment of instability relationship from short term to long term equilibrium. This method is used to incorporate a loss of long term information as long as the data are cointegrated. In the short run, there may be disequilibrium. The statistical significance of the Error
1β 2β
),322211 (),( −−−−−− −=∆−=∆ tttttt YYYYYYtεδ
0=δ
δ
9
relationship, the Johansen and Julieus Cointegration (CT) test will be employed. The test will be run based on the following equation;
(CT) ----------------
p
ittitt YrYY
1110 Equation (2)
Cointegration exists if the trace statistics is greater than critical values. After the identification of the number of Cointegration equations, then we can proceed to the Vector Error Correction Model analysis.
3.3. Vector Error Correction Model (VECM)
Vector Error Correction Model is a restricted VAR (Vector Autoregressive) model used for non - stationary variables to be cointegrated. VECM specification restricts the long run behaviour of endogenous variables to converge to their cointegration relationship (Abduh et all, 2011).
VECM shows the adjustment of instability relationship from short term to long term equilibrium. This method is used to incorporate a loss of long term information as long as the data are cointegrated. In the short run, there may be disequilibrium. The statistical significance of the Error Correction Term (ECT) (-1) coefficient decides how quickly the equilibrium is restored (Abduh et all, 2011). To be more specific, the VECM Approach according to Masih and Masih (1997) as cited by in Gujarati (2009) allows us to differentiate between short term and long term dynamics within long run equilibrium. Broadly speaking, this method is based on the following equation;
VECM -----------------
1
11,01
k
itttitit YYrY (Equation 3)
where:
tY = 1 tt YY K-1 = Order of VECM from VAR
i = Regression coefficient matrix (b1... bi),
0 = Intercept vector
1 = Regression coefficient vector = Time trend = Loading matrix = Cointergration vector = Variables used in the analysis
3

Skyline Business Journal, Volume IX-Issue 1-2013-2014
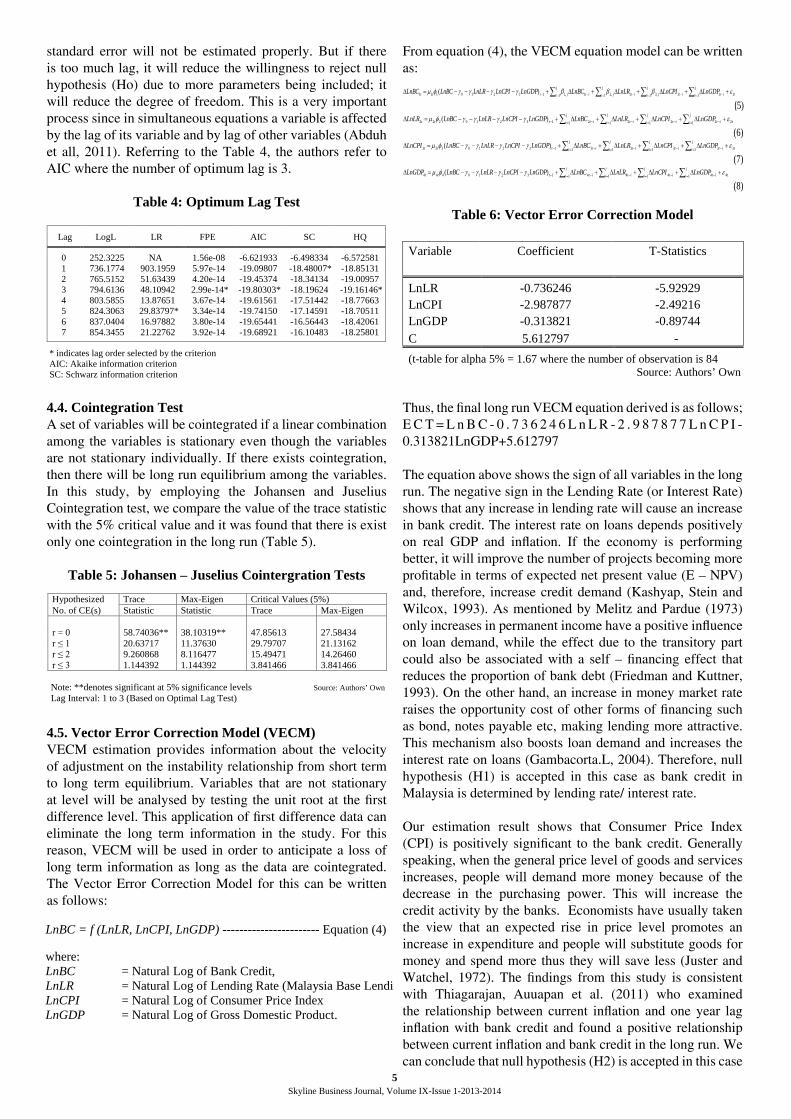
standard error will not be estimated properly. But if there is too much lag, it will reduce the willingness to reject null hypothesis (Ho) due to more parameters being included; it will reduce the degree of freedom. This is a very important process since in simultaneous equations a variable is affected by the lag of its variable and by lag of other variables (Abduh et all, 2011). Referring to the Table 4, the authors refer to AIC where the number of optimum lag is 3.
Table 4: Optimum Lag Test
13
Table 4: Optimum Lag Test
Lag LogL LR FPE AIC SC HQ 0 252.3225 NA 1.56e-08 -6.621933 -6.498334 -6.572581
1 736.1774 903.1959 5.97e-14 -19.09807 -18.48007* -18.85131 2 765.5152 51.63439 4.20e-14 -19.45374 -18.34134 -19.00957 3 794.6136 48.10942 2.99e-14* -19.80303* -18.19624 -19.16146* 4 803.5855 13.87651 3.67e-14 -19.61561 -17.51442 -18.77663 5 824.3063 29.83797* 3.34e-14 -19.74150 -17.14591 -18.70511 6 837.0404 16.97882 3.80e-14 -19.65441 -16.56443 -18.42061 7 854.3455 21.22762 3.92e-14 -19.68921 -16.10483 -18.25801 * indicates lag order selected by the criterion
AIC: Akaike information criterion SC: Schwarz information criterion
4.4. Cointegration Test
A set of variables will be cointegrated if a linear combination among the variables is stationary even though the variables are not stationary individually. If there exists cointegration, then there will be long run equilibrium among the variables. In this study, by employing the Johansen and Juselius Cointegration test, we compare the value of the trace statistic with the 5% critical value and it was found that there is exist only one cointegration in the long run (Table 5).
Table 5: Johansen – Juselius Cointergration Tests
Hypothesized Trace Max-Eigen Critical Values (5%) No. of CE(s) Statistic Statistic Trace Max-Eigen r = 0 58.74036** 38.10319** 47.85613 27.58434 r ≤ 1 20.63717 11.37630 29.79707 21.13162 r ≤ 2 9.260868 8.116477 15.49471 14.26460 r ≤ 3 1.144392 1.144392 3.841466 3.841466
Note: **denotes significant at 5% significance levels Source: Authors‟ Own Lag Interval: 1 to 3 (Based on Optimal Lag Test)
4.4. Cointegration TestA set of variables will be cointegrated if a linear combination among the variables is stationary even though the variables are not stationary individually. If there exists cointegration, then there will be long run equilibrium among the variables. In this study, by employing the Johansen and Juselius Cointegration test, we compare the value of the trace statistic with the 5% critical value and it was found that there is exist only one cointegration in the long run (Table 5).
Table 5: Johansen – Juselius Cointergration Tests
4.5. Vector Error Correction Model (VECM)VECM estimation provides information about the velocity of adjustment on the instability relationship from short term to long term equilibrium. Variables that are not stationary at level will be analysed by testing the unit root at the first difference level. This application of first difference data can eliminate the long term information in the study. For this reason, VECM will be used in order to anticipate a loss of long term information as long as the data are cointegrated. The Vector Error Correction Model for this can be written as follows:
14
4.5. Vector Error Correction Model (VECM)
VECM estimation provides information about the velocity of adjustment on the instability relationship from short term to long term equilibrium. Variables that are not stationary at level will be analysed by testing the unit root at the first difference level. This application of first difference data can eliminate the long term information in the study. For this reason, VECM will be used in order to anticipate a loss of long term information as long as the data are cointegrated. The Vector Error Correction Model for this can be written as follows:
LnBC = f (LnLR, LnCPI, LnGDP) ----------------------- Equation (4)
where: LnBC = Natural Log of Bank Credit, LnLR = Natural Log of Lending Rate (Malaysia Base Lending Rate) LnCPI = Natural Log of Consumer Price Index LnGDP = Natural Log of Gross Domestic Product.
From equation (4), the VECM equation model can be written as:
j
t
j
i
j
i titj
i itjitjitjttt LnGDPLnCPILnLRLnBCLnGDPLnCPILnLRLnBCLnBC1 1 1 111 1,31,21,113210111 )(
(5)
j
t
j
i
j
i titj
i itititttt LnGDPLnCPILnLRLnBCLnGDPLnCPILnLRLnBCLnLR1 1 1 221 22213210222 )(
(6)
j
t
j
i
j
i titj
i itititttt LnGDPLnCPILnLRLnBCLnGDPLnCPILnLRLnBCLnCPI1 1 1 331 33313210333 )(
(7)
j
t
j
i
j
i titj
i itititttt LnGDPLnCPILnLRLnBCLnGDPLnCPILnLRLnBCLnGDP1 1 1 441 44413210444 )(
(8)
Table 6: Vector Error Correction Model
Variable Coefficient T-Statistics LnLR -0.736246 -5.92929 LnCPI -2.987877 -2.49216 LnGDP -0.313821 -0.89744 C 5.612797 - (t-table for alpha 5% = 1.67 where the number of observation is 84
Source: Authors‟ Own
Thus, the final long run VECM equation derived is as follows;
From equation (4), the VECM equation model can be written as:
Table 6: Vector Error Correction Model
Thus, the final long run VECM equation derived is as follows;E C T = L n B C - 0 . 7 3 6 2 4 6 L n L R - 2 . 9 8 7 8 7 7 L n C P I -0.313821LnGDP+5.612797
The equation above shows the sign of all variables in the long run. The negative sign in the Lending Rate (or Interest Rate) shows that any increase in lending rate will cause an increase in bank credit. The interest rate on loans depends positively on real GDP and inflation. If the economy is performing better, it will improve the number of projects becoming more profitable in terms of expected net present value (E – NPV) and, therefore, increase credit demand (Kashyap, Stein and Wilcox, 1993). As mentioned by Melitz and Pardue (1973) only increases in permanent income have a positive influence on loan demand, while the effect due to the transitory part could also be associated with a self – financing effect that reduces the proportion of bank debt (Friedman and Kuttner, 1993). On the other hand, an increase in money market rate raises the opportunity cost of other forms of financing such as bond, notes payable etc, making lending more attractive. This mechanism also boosts loan demand and increases the interest rate on loans (Gambacorta.L, 2004). Therefore, null hypothesis (H1) is accepted in this case as bank credit in Malaysia is determined by lending rate/ interest rate.
Our estimation result shows that Consumer Price Index (CPI) is positively significant to the bank credit. Generally speaking, when the general price level of goods and services increases, people will demand more money because of the decrease in the purchasing power. This will increase the credit activity by the banks. Economists have usually taken the view that an expected rise in price level promotes an increase in expenditure and people will substitute goods for money and spend more thus they will save less (Juster and Watchel, 1972). The findings from this study is consistent with Thiagarajan, Auuapan et al. (2011) who examined the relationship between current inflation and one year lag inflation with bank credit and found a positive relationship between current inflation and bank credit in the long run. We can conclude that null hypothesis (H2) is accepted in this case
Skyline Business Journal, Volume IX-Issue 1-2013-2014
Correction Term (ECT) (-1) coefficient decides how quickly the equilibrium is restored (Abduh et all, 2011). To be more specific, the VECM Approach according to Masih and Masih (1997) as cited by in Gujarati (2009) allows us to differentiate between short term and long term dynamics within long run equilibrium. Broadly speaking, this method is based on the following equation;
9
relationship, the Johansen and Julieus Cointegration (CT) test will be employed. The test will be run based on the following equation;
(CT) ----------------
p
ittitt YrYY
1110 Equation (2)
Cointegration exists if the trace statistics is greater than critical values. After the identification of the number of Cointegration equations, then we can proceed to the Vector Error Correction Model analysis.
3.3. Vector Error Correction Model (VECM)
Vector Error Correction Model is a restricted VAR (Vector Autoregressive) model used for non - stationary variables to be cointegrated. VECM specification restricts the long run behaviour of endogenous variables to converge to their cointegration relationship (Abduh et all, 2011).
VECM shows the adjustment of instability relationship from short term to long term equilibrium. This method is used to incorporate a loss of long term information as long as the data are cointegrated. In the short run, there may be disequilibrium. The statistical significance of the Error Correction Term (ECT) (-1) coefficient decides how quickly the equilibrium is restored (Abduh et all, 2011). To be more specific, the VECM Approach according to Masih and Masih (1997) as cited by in Gujarati (2009) allows us to differentiate between short term and long term dynamics within long run equilibrium. Broadly speaking, this method is based on the following equation;
VECM -----------------
1
11,01
k
itttitit YYrY (Equation 3)
where:
tY = 1 tt YY K-1 = Order of VECM from VAR
i = Regression coefficient matrix (b1... bi),
0 = Intercept vector
1 = Regression coefficient vector = Time trend = Loading matrix = Cointergration vector = Variables used in the analysis
3.4. Impulse Response Function (IRF)Impulse Response Function (IRF) is a method which is used to determine the response of an endogenous variable on a certain shock, because this shock may be transmitted to the other dependent variables through a dynamic structure or lag structure in the VAR model. IRF essentially maps out the dynamic response path of a variable due to a one – period standard deviation shock to another variable. The summary of the flowchart methodology framework to be applied in this study is as follows;
Figure 1: The Process of Vector Autoregressive (VAR)
3.5. Data CollectionThe data collected comprises of quarterly data for the period 1/1991 to 2/2011, and this paper employs the Johansson and Juselius Cointergration Test and Vector Error Correction Model (VECM). For Lending rate and Bank Credit, the data was gathered from Bank Negara Statistics (published by Bank Negara Malaysia). For Consumer Price Index (CPI) and Gross Domestic Product (GDP), the data was gathered and complied from the Statistical Bulletin and other publications of the Department of Statistics, Malaysia.
4.0. Empirical Evidences and Analyses.In this part, analysis will be divided into 7 parts, namely; (i) Descriptive Statistics, (ii) Unit Root Tests and Stationarity,
(iii) Lag Optimum Test, (iv) Cointegration Test, (v) Vector Error Correction Model, (vi) Error Correction Model and (vii) Impulse Response Function.
4.1. Descriptive Statistics
Table 1: Descriptive Statistics
11
4.0. Empirical Evidences and Analyses.
In this part, analysis will be divided into 7 parts, namely; (i) Descriptive Statistics, (ii) Unit Root Tests and Stationarity, (iii) Lag Optimum Test, (iv) Cointegration Test, (v) Vector Error Correction Model, (vi) Error Correction Model and (vii) Impulse Response Function. 4.1. Descriptive Statistics
Table 1: Descriptive Statistics
Details LNCREDIT LNLENDR LNCPI LNGDP Mean 12.90941 2.018187 4.510374 11.39201 Median 13.05389 1.987851 4.531524 11.39263 Maximum 13.75254 2.603430 4.764735 12.25198 Minimum 11.36718 1.585145 4.197202 10.35930 Std. Dev. 0.583893 0.260708 0.157098 0.536954 Skewness -0.931968 0.140201 -0.246942 -0.150151 Kurtosis 3.116586 1.955582 2.067043 1.973647
Jarque-Bera 11.91681 3.995568 3.807290 3.907237 Probability 0.002584 0.135636 0.149024 0.141760
Sum 1058.572 165.4913 369.8507 934.1447 Sum Sq. Dev.
27.61544 5.505478 1.999066 23.35390
Table 1 explain descriptive statistics whereby all series for said variables are transformed into log form. Basically all the variables have stable scores in mean, median and kurtosis. In addition, all series transformation into log directly gives elasticities and solves the problem of Heteroscedasticity. Moreover, by looking at Jarque Bera value, it‟s clearly indicates that there is no autocorrelation problem and the model is fit in this study.
Table 1 explain descriptive statistics whereby all series for said variables are transformed into log form. Basically all the variables have stable scores in mean, median and kurtosis. In addition, all series transformation into log directly gives elasticities and solves the problem of Heteroscedasticity. Moreover, by looking at Jarque Bera value, it’s clearly indicates that there is no autocorrelation problem and the model is fit in this study.
4.2. Unit Root and Stationary testTest of stationary are employed to indicate unit root in the variable (Gujarati, 2009). The investigation using Augmented Dickey Fuller (ADF) summarized in Table 2 shows that there are no variables having unit root; However when the first difference condition of all variables are conducted using the same ADF test by comparing the level and the McKinnon value using 1%, 5% and 10% alpha, those variables fulfil the requirement of stationarity since the absolute number in level (ADF) are greater than McKinnon Value (Table 3)
Table 2: Unit Root Test (At Level)
Table 3: Unit Root Test (First Difference)
12
4.2. Unit Root and Stationary test
Test of stationary are employed to indicate unit root in the variable (Gujarati, 2009). The investigation using Augmented Dickey Fuller (ADF) summarized in Table 2 shows that there are no variables having unit root; However when the first difference condition of all variables are conducted using the same ADF test by comparing the level and the McKinnon value using 1%, 5% and 10% alpha, those variables fulfil the requirement of stationarity since the absolute number in level (ADF) are greater than McKinnon Value (Table 3)
Table 2: Unit Root Test (At Level)
Variable ADF Test
Statistic
McKinnon Value
Description
1% 5% 10% LnBC -1.089280 -4.081666 -3.469235 -3.161518 Not Stationary LnLR -2.987647 -4.076860 -3.466966 -3.466966 Not Stationary LnCPI -2.415819 -4.075340 -3.466248 -3.466248 Not Stationary LnGDP -2.606459 -4.083355 -3.470032 -3.470032 Not Stationary Source: Authors‟ own
Table 3: Unit Root Test (First Difference)
Variable ADF Test
Statistic
McKinnon Value
Description
1% 5% 10% LnBC -8.503649 -4.076860 -3.466966 -3.160198 Stationary LnLR -4.895871 -4.076860 -3.466966 -3.160198 Stationary LnCPI -7.455612 -4.076860 -3.466966 -3.160198 Stationary LnGDP -5.745809 -4.083355 -3.470032 -3.161982 Stationary Source: Authors‟ own
4.3. Lag Optimum Test
This test will explain if the lag used is too small in the unit root rest, then the residual from the regression process will not perform the white noise process and as a result the model will be unable to predict the actual error precisely. Therefore, standard error will not be estimated properly. But if there is too much lag, it will reduce the willingness to reject null hypothesis (Ho) due to more parameters being included; it will reduce the degree of freedom. This is a very important process since in simultaneous equations a variable is affected by the lag of its variable and by lag of other variables (Abduh et all, 2011). Referring to the Table 4, the authors refer to AIC where the number of optimum lag is 3.
4.3. Lag Optimum TestThis test will explain if the lag used is too small in the unit root rest, then the residual from the regression process will not perform the white noise process and as a result the model will be unable to predict the actual error precisely. Therefore,
4
Skyline Business Journal, Volume IX-Issue 1-2013-2014
standard error will not be estimated properly. But if there is too much lag, it will reduce the willingness to reject null hypothesis (Ho) due to more parameters being included; it will reduce the degree of freedom. This is a very important process since in simultaneous equations a variable is affected by the lag of its variable and by lag of other variables (Abduh et all, 2011). Referring to the Table 4, the authors refer to AIC where the number of optimum lag is 3.
Table 4: Optimum Lag Test
13
Table 4: Optimum Lag Test
Lag LogL LR FPE AIC SC HQ 0 252.3225 NA 1.56e-08 -6.621933 -6.498334 -6.572581 1 736.1774 903.1959 5.97e-14 -19.09807 -18.48007* -18.85131 2 765.5152 51.63439 4.20e-14 -19.45374 -18.34134 -19.00957 3 794.6136 48.10942 2.99e-14* -19.80303* -18.19624 -19.16146* 4 803.5855 13.87651 3.67e-14 -19.61561 -17.51442 -18.77663 5 824.3063 29.83797* 3.34e-14 -19.74150 -17.14591 -18.70511 6 837.0404 16.97882 3.80e-14 -19.65441 -16.56443 -18.42061 7 854.3455 21.22762 3.92e-14 -19.68921 -16.10483 -18.25801 * indicates lag order selected by the criterion
AIC: Akaike information criterion SC: Schwarz information criterion
4.4. Cointegration Test
A set of variables will be cointegrated if a linear combination among the variables is stationary even though the variables are not stationary individually. If there exists cointegration, then there will be long run equilibrium among the variables. In this study, by employing the Johansen and Juselius Cointegration test, we compare the value of the trace statistic with the 5% critical value and it was found that there is exist only one cointegration in the long run (Table 5).
Table 5: Johansen – Juselius Cointergration Tests
Hypothesized Trace Max-Eigen Critical Values (5%) No. of CE(s) Statistic Statistic Trace Max-Eigen r = 0 58.74036** 38.10319** 47.85613 27.58434 r ≤ 1 20.63717 11.37630 29.79707 21.13162 r ≤ 2 9.260868 8.116477 15.49471 14.26460 r ≤ 3 1.144392 1.144392 3.841466 3.841466
Note: **denotes significant at 5% significance levels Source: Authors‟ Own Lag Interval: 1 to 3 (Based on Optimal Lag Test)
13
Table 4: Optimum Lag Test
Lag LogL LR FPE AIC SC HQ 0 252.3225 NA 1.56e-08 -6.621933 -6.498334 -6.572581
1 736.1774 903.1959 5.97e-14 -19.09807 -18.48007* -18.85131 2 765.5152 51.63439 4.20e-14 -19.45374 -18.34134 -19.00957 3 794.6136 48.10942 2.99e-14* -19.80303* -18.19624 -19.16146* 4 803.5855 13.87651 3.67e-14 -19.61561 -17.51442 -18.77663 5 824.3063 29.83797* 3.34e-14 -19.74150 -17.14591 -18.70511 6 837.0404 16.97882 3.80e-14 -19.65441 -16.56443 -18.42061 7 854.3455 21.22762 3.92e-14 -19.68921 -16.10483 -18.25801 * indicates lag order selected by the criterion
AIC: Akaike information criterion SC: Schwarz information criterion
4.4. Cointegration Test
A set of variables will be cointegrated if a linear combination among the variables is stationary even though the variables are not stationary individually. If there exists cointegration, then there will be long run equilibrium among the variables. In this study, by employing the Johansen and Juselius Cointegration test, we compare the value of the trace statistic with the 5% critical value and it was found that there is exist only one cointegration in the long run (Table 5).
Table 5: Johansen – Juselius Cointergration Tests
Hypothesized Trace Max-Eigen Critical Values (5%) No. of CE(s) Statistic Statistic Trace Max-Eigen r = 0 58.74036** 38.10319** 47.85613 27.58434 r ≤ 1 20.63717 11.37630 29.79707 21.13162 r ≤ 2 9.260868 8.116477 15.49471 14.26460 r ≤ 3 1.144392 1.144392 3.841466 3.841466
Note: **denotes significant at 5% significance levels Source: Authors‟ Own Lag Interval: 1 to 3 (Based on Optimal Lag Test)
4.4. Cointegration TestA set of variables will be cointegrated if a linear combination among the variables is stationary even though the variables are not stationary individually. If there exists cointegration, then there will be long run equilibrium among the variables. In this study, by employing the Johansen and Juselius Cointegration test, we compare the value of the trace statistic with the 5% critical value and it was found that there is exist only one cointegration in the long run (Table 5).
Table 5: Johansen – Juselius Cointergration Tests
4.5. Vector Error Correction Model (VECM)VECM estimation provides information about the velocity of adjustment on the instability relationship from short term to long term equilibrium. Variables that are not stationary at level will be analysed by testing the unit root at the first difference level. This application of first difference data can eliminate the long term information in the study. For this reason, VECM will be used in order to anticipate a loss of long term information as long as the data are cointegrated. The Vector Error Correction Model for this can be written as follows:
14
4.5. Vector Error Correction Model (VECM)
VECM estimation provides information about the velocity of adjustment on the instability relationship from short term to long term equilibrium. Variables that are not stationary at level will be analysed by testing the unit root at the first difference level. This application of first difference data can eliminate the long term information in the study. For this reason, VECM will be used in order to anticipate a loss of long term information as long as the data are cointegrated. The Vector Error Correction Model for this can be written as follows:
LnBC = f (LnLR, LnCPI, LnGDP) ----------------------- Equation (4)
where: LnBC = Natural Log of Bank Credit, LnLR = Natural Log of Lending Rate (Malaysia Base Lending Rate) LnCPI = Natural Log of Consumer Price Index LnGDP = Natural Log of Gross Domestic Product.
From equation (4), the VECM equation model can be written as:
j
t
j
i
j
i titj
i itjitjitjttt LnGDPLnCPILnLRLnBCLnGDPLnCPILnLRLnBCLnBC1 1 1 111 1,31,21,113210111 )(
(5)
j
t
j
i
j
i titj
i itititttt LnGDPLnCPILnLRLnBCLnGDPLnCPILnLRLnBCLnLR1 1 1 221 22213210222 )(
(6)
j
t
j
i
j
i titj
i itititttt LnGDPLnCPILnLRLnBCLnGDPLnCPILnLRLnBCLnCPI1 1 1 331 33313210333 )(
(7)
j
t
j
i
j
i titj
i itititttt LnGDPLnCPILnLRLnBCLnGDPLnCPILnLRLnBCLnGDP1 1 1 441 44413210444 )(
(8)
Table 6: Vector Error Correction Model
Variable Coefficient T-Statistics LnLR -0.736246 -5.92929 LnCPI -2.987877 -2.49216 LnGDP -0.313821 -0.89744 C 5.612797 - (t-table for alpha 5% = 1.67 where the number of observation is 84
Source: Authors‟ Own
Thus, the final long run VECM equation derived is as follows;
14
4.5. Vector Error Correction Model (VECM)
VECM estimation provides information about the velocity of adjustment on the instability relationship from short term to long term equilibrium. Variables that are not stationary at level will be analysed by testing the unit root at the first difference level. This application of first difference data can eliminate the long term information in the study. For this reason, VECM will be used in order to anticipate a loss of long term information as long as the data are cointegrated. The Vector Error Correction Model for this can be written as follows:
LnBC = f (LnLR, LnCPI, LnGDP) ----------------------- Equation (4)
where: LnBC = Natural Log of Bank Credit, LnLR = Natural Log of Lending Rate (Malaysia Base Lending Rate) LnCPI = Natural Log of Consumer Price Index LnGDP = Natural Log of Gross Domestic Product.
From equation (4), the VECM equation model can be written as:
j
t
j
i
j
i titj
i itjitjitjttt LnGDPLnCPILnLRLnBCLnGDPLnCPILnLRLnBCLnBC1 1 1 111 1,31,21,113210111 )(
(5)
j
t
j
i
j
i titj
i itititttt LnGDPLnCPILnLRLnBCLnGDPLnCPILnLRLnBCLnLR1 1 1 221 22213210222 )(
(6)
j
t
j
i
j
i titj
i itititttt LnGDPLnCPILnLRLnBCLnGDPLnCPILnLRLnBCLnCPI1 1 1 331 33313210333 )(
(7)
j
t
j
i
j
i titj
i itititttt LnGDPLnCPILnLRLnBCLnGDPLnCPILnLRLnBCLnGDP1 1 1 441 44413210444 )(
(8)
Table 6: Vector Error Correction Model
Variable Coefficient T-Statistics LnLR -0.736246 -5.92929 LnCPI -2.987877 -2.49216 LnGDP -0.313821 -0.89744 C 5.612797 - (t-table for alpha 5% = 1.67 where the number of observation is 84
Source: Authors‟ Own
Thus, the final long run VECM equation derived is as follows;
14
4.5. Vector Error Correction Model (VECM)
VECM estimation provides information about the velocity of adjustment on the instability relationship from short term to long term equilibrium. Variables that are not stationary at level will be analysed by testing the unit root at the first difference level. This application of first difference data can eliminate the long term information in the study. For this reason, VECM will be used in order to anticipate a loss of long term information as long as the data are cointegrated. The Vector Error Correction Model for this can be written as follows:
LnBC = f (LnLR, LnCPI, LnGDP) ----------------------- Equation (4)
where: LnBC = Natural Log of Bank Credit, LnLR = Natural Log of Lending Rate (Malaysia Base Lending Rate) LnCPI = Natural Log of Consumer Price Index LnGDP = Natural Log of Gross Domestic Product.
From equation (4), the VECM equation model can be written as:
j
t
j
i
j
i titj
i itjitjitjttt LnGDPLnCPILnLRLnBCLnGDPLnCPILnLRLnBCLnBC1 1 1 111 1,31,21,113210111 )(
(5)
j
t
j
i
j
i titj
i itititttt LnGDPLnCPILnLRLnBCLnGDPLnCPILnLRLnBCLnLR1 1 1 221 22213210222 )(
(6)
j
t
j
i
j
i titj
i itititttt LnGDPLnCPILnLRLnBCLnGDPLnCPILnLRLnBCLnCPI1 1 1 331 33313210333 )(
(7)
j
t
j
i
j
i titj
i itititttt LnGDPLnCPILnLRLnBCLnGDPLnCPILnLRLnBCLnGDP1 1 1 441 44413210444 )(
(8)
Table 6: Vector Error Correction Model
Variable Coefficient T-Statistics LnLR -0.736246 -5.92929 LnCPI -2.987877 -2.49216 LnGDP -0.313821 -0.89744 C 5.612797 - (t-table for alpha 5% = 1.67 where the number of observation is 84
Source: Authors‟ Own
Thus, the final long run VECM equation derived is as follows;
From equation (4), the VECM equation model can be written as:
Table 6: Vector Error Correction Model
Thus, the final long run VECM equation derived is as follows;E C T = L n B C - 0 . 7 3 6 2 4 6 L n L R - 2 . 9 8 7 8 7 7 L n C P I -0.313821LnGDP+5.612797
The equation above shows the sign of all variables in the long run. The negative sign in the Lending Rate (or Interest Rate) shows that any increase in lending rate will cause an increase in bank credit. The interest rate on loans depends positively on real GDP and inflation. If the economy is performing better, it will improve the number of projects becoming more profitable in terms of expected net present value (E – NPV) and, therefore, increase credit demand (Kashyap, Stein and Wilcox, 1993). As mentioned by Melitz and Pardue (1973) only increases in permanent income have a positive influence on loan demand, while the effect due to the transitory part could also be associated with a self – financing effect that reduces the proportion of bank debt (Friedman and Kuttner, 1993). On the other hand, an increase in money market rate raises the opportunity cost of other forms of financing such as bond, notes payable etc, making lending more attractive. This mechanism also boosts loan demand and increases the interest rate on loans (Gambacorta.L, 2004). Therefore, null hypothesis (H1) is accepted in this case as bank credit in Malaysia is determined by lending rate/ interest rate.
Our estimation result shows that Consumer Price Index (CPI) is positively significant to the bank credit. Generally speaking, when the general price level of goods and services increases, people will demand more money because of the decrease in the purchasing power. This will increase the credit activity by the banks. Economists have usually taken the view that an expected rise in price level promotes an increase in expenditure and people will substitute goods for money and spend more thus they will save less (Juster and Watchel, 1972). The findings from this study is consistent with Thiagarajan, Auuapan et al. (2011) who examined the relationship between current inflation and one year lag inflation with bank credit and found a positive relationship between current inflation and bank credit in the long run. We can conclude that null hypothesis (H2) is accepted in this case
Skyline Business Journal, Volume IX-Issue 1-2013-2014
Correction Term (ECT) (-1) coefficient decides how quickly the equilibrium is restored (Abduh et all, 2011). To be more specific, the VECM Approach according to Masih and Masih (1997) as cited by in Gujarati (2009) allows us to differentiate between short term and long term dynamics within long run equilibrium. Broadly speaking, this method is based on the following equation;
9
relationship, the Johansen and Julieus Cointegration (CT) test will be employed. The test will be run based on the following equation;
(CT) ----------------
p
ittitt YrYY
1110 Equation (2)
Cointegration exists if the trace statistics is greater than critical values. After the identification of the number of Cointegration equations, then we can proceed to the Vector Error Correction Model analysis.
3.3. Vector Error Correction Model (VECM)
Vector Error Correction Model is a restricted VAR (Vector Autoregressive) model used for non - stationary variables to be cointegrated. VECM specification restricts the long run behaviour of endogenous variables to converge to their cointegration relationship (Abduh et all, 2011).
VECM shows the adjustment of instability relationship from short term to long term equilibrium. This method is used to incorporate a loss of long term information as long as the data are cointegrated. In the short run, there may be disequilibrium. The statistical significance of the Error Correction Term (ECT) (-1) coefficient decides how quickly the equilibrium is restored (Abduh et all, 2011). To be more specific, the VECM Approach according to Masih and Masih (1997) as cited by in Gujarati (2009) allows us to differentiate between short term and long term dynamics within long run equilibrium. Broadly speaking, this method is based on the following equation;
VECM -----------------
1
11,01
k
itttitit YYrY (Equation 3)
where:
tY = 1 tt YY K-1 = Order of VECM from VAR
i = Regression coefficient matrix (b1... bi),
0 = Intercept vector
1 = Regression coefficient vector = Time trend = Loading matrix = Cointergration vector = Variables used in the analysis
9
relationship, the Johansen and Julieus Cointegration (CT) test will be employed. The test will be run based on the following equation;
(CT) ----------------
p
ittitt YrYY
1110 Equation (2)
Cointegration exists if the trace statistics is greater than critical values. After the identification of the number of Cointegration equations, then we can proceed to the Vector Error Correction Model analysis.
3.3. Vector Error Correction Model (VECM)
Vector Error Correction Model is a restricted VAR (Vector Autoregressive) model used for non - stationary variables to be cointegrated. VECM specification restricts the long run behaviour of endogenous variables to converge to their cointegration relationship (Abduh et all, 2011).
VECM shows the adjustment of instability relationship from short term to long term equilibrium. This method is used to incorporate a loss of long term information as long as the data are cointegrated. In the short run, there may be disequilibrium. The statistical significance of the Error Correction Term (ECT) (-1) coefficient decides how quickly the equilibrium is restored (Abduh et all, 2011). To be more specific, the VECM Approach according to Masih and Masih (1997) as cited by in Gujarati (2009) allows us to differentiate between short term and long term dynamics within long run equilibrium. Broadly speaking, this method is based on the following equation;
VECM -----------------
1
11,01
k
itttitit YYrY (Equation 3)
where:
tY = 1 tt YY K-1 = Order of VECM from VAR
i = Regression coefficient matrix (b1... bi),
0 = Intercept vector
1 = Regression coefficient vector = Time trend = Loading matrix = Cointergration vector = Variables used in the analysis
3.4. Impulse Response Function (IRF)Impulse Response Function (IRF) is a method which is used to determine the response of an endogenous variable on a certain shock, because this shock may be transmitted to the other dependent variables through a dynamic structure or lag structure in the VAR model. IRF essentially maps out the dynamic response path of a variable due to a one – period standard deviation shock to another variable. The summary of the flowchart methodology framework to be applied in this study is as follows;
Figure 1: The Process of Vector Autoregressive (VAR)
3.5. Data CollectionThe data collected comprises of quarterly data for the period 1/1991 to 2/2011, and this paper employs the Johansson and Juselius Cointergration Test and Vector Error Correction Model (VECM). For Lending rate and Bank Credit, the data was gathered from Bank Negara Statistics (published by Bank Negara Malaysia). For Consumer Price Index (CPI) and Gross Domestic Product (GDP), the data was gathered and complied from the Statistical Bulletin and other publications of the Department of Statistics, Malaysia.
4.0. Empirical Evidences and Analyses.In this part, analysis will be divided into 7 parts, namely; (i) Descriptive Statistics, (ii) Unit Root Tests and Stationarity,
(iii) Lag Optimum Test, (iv) Cointegration Test, (v) Vector Error Correction Model, (vi) Error Correction Model and (vii) Impulse Response Function.
4.1. Descriptive Statistics
Table 1: Descriptive Statistics
11
4.0. Empirical Evidences and Analyses.
In this part, analysis will be divided into 7 parts, namely; (i) Descriptive Statistics, (ii) Unit Root Tests and Stationarity, (iii) Lag Optimum Test, (iv) Cointegration Test, (v) Vector Error Correction Model, (vi) Error Correction Model and (vii) Impulse Response Function. 4.1. Descriptive Statistics
Table 1: Descriptive Statistics
Details LNCREDIT LNLENDR LNCPI LNGDP Mean 12.90941 2.018187 4.510374 11.39201 Median 13.05389 1.987851 4.531524 11.39263 Maximum 13.75254 2.603430 4.764735 12.25198 Minimum 11.36718 1.585145 4.197202 10.35930 Std. Dev. 0.583893 0.260708 0.157098 0.536954 Skewness -0.931968 0.140201 -0.246942 -0.150151 Kurtosis 3.116586 1.955582 2.067043 1.973647
Jarque-Bera 11.91681 3.995568 3.807290 3.907237 Probability 0.002584 0.135636 0.149024 0.141760
Sum 1058.572 165.4913 369.8507 934.1447 Sum Sq. Dev.
27.61544 5.505478 1.999066 23.35390
Table 1 explain descriptive statistics whereby all series for said variables are transformed into log form. Basically all the variables have stable scores in mean, median and kurtosis. In addition, all series transformation into log directly gives elasticities and solves the problem of Heteroscedasticity. Moreover, by looking at Jarque Bera value, it‟s clearly indicates that there is no autocorrelation problem and the model is fit in this study.
Table 1 explain descriptive statistics whereby all series for said variables are transformed into log form. Basically all the variables have stable scores in mean, median and kurtosis. In addition, all series transformation into log directly gives elasticities and solves the problem of Heteroscedasticity. Moreover, by looking at Jarque Bera value, it’s clearly indicates that there is no autocorrelation problem and the model is fit in this study.
4.2. Unit Root and Stationary testTest of stationary are employed to indicate unit root in the variable (Gujarati, 2009). The investigation using Augmented Dickey Fuller (ADF) summarized in Table 2 shows that there are no variables having unit root; However when the first difference condition of all variables are conducted using the same ADF test by comparing the level and the McKinnon value using 1%, 5% and 10% alpha, those variables fulfil the requirement of stationarity since the absolute number in level (ADF) are greater than McKinnon Value (Table 3)
Table 2: Unit Root Test (At Level)
Table 3: Unit Root Test (First Difference)
12
4.2. Unit Root and Stationary test
Test of stationary are employed to indicate unit root in the variable (Gujarati, 2009). The investigation using Augmented Dickey Fuller (ADF) summarized in Table 2 shows that there are no variables having unit root; However when the first difference condition of all variables are conducted using the same ADF test by comparing the level and the McKinnon value using 1%, 5% and 10% alpha, those variables fulfil the requirement of stationarity since the absolute number in level (ADF) are greater than McKinnon Value (Table 3)
Table 2: Unit Root Test (At Level)
Variable ADF Test
Statistic
McKinnon Value
Description
1% 5% 10% LnBC -1.089280 -4.081666 -3.469235 -3.161518 Not Stationary LnLR -2.987647 -4.076860 -3.466966 -3.466966 Not Stationary LnCPI -2.415819 -4.075340 -3.466248 -3.466248 Not Stationary LnGDP -2.606459 -4.083355 -3.470032 -3.470032 Not Stationary Source: Authors‟ own
Table 3: Unit Root Test (First Difference)
Variable ADF Test
Statistic
McKinnon Value
Description
1% 5% 10% LnBC -8.503649 -4.076860 -3.466966 -3.160198 Stationary LnLR -4.895871 -4.076860 -3.466966 -3.160198 Stationary LnCPI -7.455612 -4.076860 -3.466966 -3.160198 Stationary LnGDP -5.745809 -4.083355 -3.470032 -3.161982 Stationary Source: Authors‟ own
4.3. Lag Optimum Test
This test will explain if the lag used is too small in the unit root rest, then the residual from the regression process will not perform the white noise process and as a result the model will be unable to predict the actual error precisely. Therefore, standard error will not be estimated properly. But if there is too much lag, it will reduce the willingness to reject null hypothesis (Ho) due to more parameters being included; it will reduce the degree of freedom. This is a very important process since in simultaneous equations a variable is affected by the lag of its variable and by lag of other variables (Abduh et all, 2011). Referring to the Table 4, the authors refer to AIC where the number of optimum lag is 3.
12
4.2. Unit Root and Stationary test
Test of stationary are employed to indicate unit root in the variable (Gujarati, 2009). The investigation using Augmented Dickey Fuller (ADF) summarized in Table 2 shows that there are no variables having unit root; However when the first difference condition of all variables are conducted using the same ADF test by comparing the level and the McKinnon value using 1%, 5% and 10% alpha, those variables fulfil the requirement of stationarity since the absolute number in level (ADF) are greater than McKinnon Value (Table 3)
Table 2: Unit Root Test (At Level)
Variable ADF Test
Statistic
McKinnon Value
Description
1% 5% 10% LnBC -1.089280 -4.081666 -3.469235 -3.161518 Not Stationary LnLR -2.987647 -4.076860 -3.466966 -3.466966 Not Stationary LnCPI -2.415819 -4.075340 -3.466248 -3.466248 Not Stationary LnGDP -2.606459 -4.083355 -3.470032 -3.470032 Not Stationary Source: Authors‟ own
Table 3: Unit Root Test (First Difference)
Variable ADF Test
Statistic
McKinnon Value
Description
1% 5% 10% LnBC -8.503649 -4.076860 -3.466966 -3.160198 Stationary LnLR -4.895871 -4.076860 -3.466966 -3.160198 Stationary LnCPI -7.455612 -4.076860 -3.466966 -3.160198 Stationary LnGDP -5.745809 -4.083355 -3.470032 -3.161982 Stationary Source: Authors‟ own
4.3. Lag Optimum Test
This test will explain if the lag used is too small in the unit root rest, then the residual from the regression process will not perform the white noise process and as a result the model will be unable to predict the actual error precisely. Therefore, standard error will not be estimated properly. But if there is too much lag, it will reduce the willingness to reject null hypothesis (Ho) due to more parameters being included; it will reduce the degree of freedom. This is a very important process since in simultaneous equations a variable is affected by the lag of its variable and by lag of other variables (Abduh et all, 2011). Referring to the Table 4, the authors refer to AIC where the number of optimum lag is 3.
4.3. Lag Optimum TestThis test will explain if the lag used is too small in the unit root rest, then the residual from the regression process will not perform the white noise process and as a result the model will be unable to predict the actual error precisely. Therefore,
5
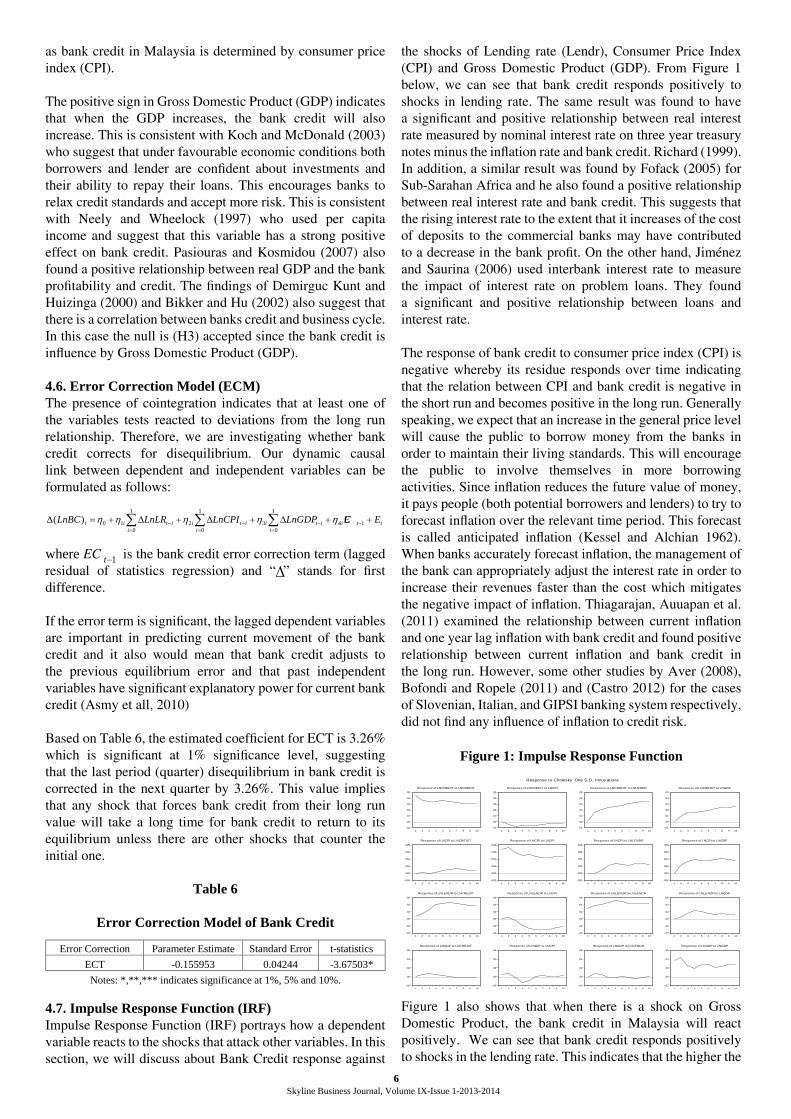
Skyline Business Journal, Volume IX-Issue 1-2013-2014
as bank credit in Malaysia is determined by consumer price index (CPI).
The positive sign in Gross Domestic Product (GDP) indicates that when the GDP increases, the bank credit will also increase. This is consistent with Koch and McDonald (2003) who suggest that under favourable economic conditions both borrowers and lender are confident about investments and their ability to repay their loans. This encourages banks to relax credit standards and accept more risk. This is consistent with Neely and Wheelock (1997) who used per capita income and suggest that this variable has a strong positive effect on bank credit. Pasiouras and Kosmidou (2007) also found a positive relationship between real GDP and the bank profitability and credit. The findings of Demirguc Kunt and Huizinga (2000) and Bikker and Hu (2002) also suggest that there is a correlation between banks credit and business cycle. In this case the null is (H3) accepted since the bank credit is influence by Gross Domestic Product (GDP).
4.6. Error Correction Model (ECM)The presence of cointegration indicates that at least one of the variables tests reacted to deviations from the long run relationship. Therefore, we are investigating whether bank credit corrects for disequilibrium. Our dynamic causal link between dependent and independent variables can be formulated as follows:
where EC is the bank credit error correction term (lagged residual of statistics regression) and “ ” stands for first difference.
If the error term is significant, the lagged dependent variables are important in predicting current movement of the bank credit and it also would mean that bank credit adjusts to the previous equilibrium error and that past independent variables have significant explanatory power for current bank credit (Asmy et all, 2010)
Based on Table 6, the estimated coefficient for ECT is 3.26% which is significant at 1% significance level, suggesting that the last period (quarter) disequilibrium in bank credit is corrected in the next quarter by 3.26%. This value implies that any shock that forces bank credit from their long run value will take a long time for bank credit to return to its equilibrium unless there are other shocks that counter the initial one.
Table 6
Error Correction Model of Bank Credit
∑ ∑ ∑= = =
−−−− ++∆+∆+∆+=∆1
0
1
0
1
0143210)(
i i ittiitiitiitit EECLnGDPLnCPILnLRLnBC ηηηηη
1−tEC∆
16
4.6. Error Correction Model (ECM)
The presence of cointegration indicates that at least one of the variables tests reacted to deviations from the long run relationship. Therefore, we are investigating whether bank credit corrects for disequilibrium. Our dynamic causal link between dependent and independent variables can be formulated as follows:
1
0
1
0
1
0143210)(
i i ittiitiitiitit EECLnGDPLnCPILnLRLnBC
where 1tEC is the bank credit error correction term (lagged residual of statistics regression) and “ ” stands for first difference.
If the error term is significant, the lagged dependent variables are important in predicting current movement of the bank credit and it also would mean that bank credit adjusts to the previous equilibrium error and that past independent variables have significant explanatory power for current bank credit (Asmy et all, 2010)
Based on Table 6, the estimated coefficient for ECT is 3.26% which is significant at 1% significance level, suggesting that the last period (quarter) disequilibrium in bank credit is corrected in the next quarter by 3.26%. This value implies that any shock that forces bank credit from their long run value will take a long time for bank credit to return to its equilibrium unless there are other shocks that counter the initial one.
Table 6
Error Correction Model of Bank Credit
Error Correction Parameter Estimate Standard Error t-statistics ECT -0.155953 0.04244 -3.67503*
Notes: *,**,*** indicates significance at 1%, 5% and 10%.
4.7. Impulse Response Function (IRF)
Impulse Response Function (IRF) portrays how a dependent variable reacts to the shocks that attack other variables. In this section, we will discuss about Bank Credit response against the shocks of Lending rate (Lendr), Consumer Price Index (CPI) and Gross Domestic Product (GDP). From Figure 1 below, we can see that bank credit responds positively to shocks in lending rate. The same result was found to have a significant and positive relationship between real interest rate measured by nominal interest rate on three year treasury notes minus the inflation rate and bank credit. Richard (1999). In addition, a similar result was found by Fofack (2005) for Sub-Sarahan Africa and he also found a positive relationship between real interest rate and bank credit. This suggests that the rising interest rate to the extent that it increases of the cost of deposits to the commercial banks may have contributed to a decrease in the bank profit. On the other hand, Jiménez and Saurina (2006) used interbank interest rate to measure the impact of interest rate on problem loans. They found a significant and positive relationship between loans and interest rate.
4.7. Impulse Response Function (IRF)Impulse Response Function (IRF) portrays how a dependent variable reacts to the shocks that attack other variables. In this section, we will discuss about Bank Credit response against
the shocks of Lending rate (Lendr), Consumer Price Index (CPI) and Gross Domestic Product (GDP). From Figure 1 below, we can see that bank credit responds positively to shocks in lending rate. The same result was found to have a significant and positive relationship between real interest rate measured by nominal interest rate on three year treasury notes minus the inflation rate and bank credit. Richard (1999). In addition, a similar result was found by Fofack (2005) for Sub-Sarahan Africa and he also found a positive relationship between real interest rate and bank credit. This suggests that the rising interest rate to the extent that it increases of the cost of deposits to the commercial banks may have contributed to a decrease in the bank profit. On the other hand, Jiménez and Saurina (2006) used interbank interest rate to measure the impact of interest rate on problem loans. They found a significant and positive relationship between loans and interest rate.
The response of bank credit to consumer price index (CPI) is negative whereby its residue responds over time indicating that the relation between CPI and bank credit is negative in the short run and becomes positive in the long run. Generally speaking, we expect that an increase in the general price level will cause the public to borrow money from the banks in order to maintain their living standards. This will encourage the public to involve themselves in more borrowing activities. Since inflation reduces the future value of money, it pays people (both potential borrowers and lenders) to try to forecast inflation over the relevant time period. This forecast is called anticipated inflation (Kessel and Alchian 1962). When banks accurately forecast inflation, the management of the bank can appropriately adjust the interest rate in order to increase their revenues faster than the cost which mitigates the negative impact of inflation. Thiagarajan, Auuapan et al. (2011) examined the relationship between current inflation and one year lag inflation with bank credit and found positive relationship between current inflation and bank credit in the long run. However, some other studies by Aver (2008), Bofondi and Ropele (2011) and (Castro 2012) for the cases of Slovenian, Italian, and GIPSI banking system respectively, did not find any influence of inflation to credit risk.
Figure 1 also shows that when there is a shock on Gross Domestic Product, the bank credit in Malaysia will react positively. We can see that bank credit responds positively to shocks in the lending rate. This indicates that the higher the
18
Figure 1: Impulse Response Function
5.0. Conclusion
The main objective of this paper is to evaluate the macroeconomic determinants of bank credit in Malaysia. Three independent variables have been employed in this study which are Lending Rate, Consumer Price Index and Gross Domestic Product. The analysis was conducted using Vector Error Correction Model (VECM) to analyse the long - run relationship between bank credit and macroeconomic variables. Overall, it can be clearly seen that all these three macroeconomic variables contribute positively towards bank credit activity in Malaysia between 1991 and 2011. It was statistically proven that they have positive long - run relationship with the bank credit. Future research is nevertheless still required in this broad area of bank credit activity in Malaysia by employing more variables to analyze further on this area as it is a vital issue for bankers when it comes to bank lending or borrowing activities. Perhaps, researchers may consider using more sophisticated statistical tools to generate more comprehensive results and analysis.
-.01
.00
.01
.02
.03
.04
.05
1 2 3 4 5 6 7 8 9 10
Response of LNCREDIT to LNCREDIT
-.01
.00
.01
.02
.03
.04
.05
1 2 3 4 5 6 7 8 9 10
Response of LNCREDIT to LNCPI
-.01
.00
.01
.02
.03
.04
.05
1 2 3 4 5 6 7 8 9 10
Response of LNCREDIT to LNLENDR
-.01
.00
.01
.02
.03
.04
.05
1 2 3 4 5 6 7 8 9 10
Response of LNCREDIT to LNGDP
-.002
.000
.002
.004
.006
.008
1 2 3 4 5 6 7 8 9 10
Response of LNCPI to LNCREDIT
-.002
.000
.002
.004
.006
.008
1 2 3 4 5 6 7 8 9 10
Response of LNCPI to LNCPI
-.002
.000
.002
.004
.006
.008
1 2 3 4 5 6 7 8 9 10
Response of LNCPI to LNLENDR
-.002
.000
.002
.004
.006
.008
1 2 3 4 5 6 7 8 9 10
Response of LNCPI to LNGDP
-.04
-.02
.00
.02
.04
.06
1 2 3 4 5 6 7 8 9 10
Response of LNLENDR to LNCREDIT
-.04
-.02
.00
.02
.04
.06
1 2 3 4 5 6 7 8 9 10
Response of LNLENDR to LNCPI
-.04
-.02
.00
.02
.04
.06
1 2 3 4 5 6 7 8 9 10
Response of LNLENDR to LNLENDR
-.04
-.02
.00
.02
.04
.06
1 2 3 4 5 6 7 8 9 10
Response of LNLENDR to LNGDP
-.02
.00
.02
.04
.06
1 2 3 4 5 6 7 8 9 10
Response of LNGDP to LNCREDIT
-.02
.00
.02
.04
.06
1 2 3 4 5 6 7 8 9 10
Response of LNGDP to LNCPI
-.02
.00
.02
.04
.06
1 2 3 4 5 6 7 8 9 10
Response of LNGDP to LNLENDR
-.02
.00
.02
.04
.06
1 2 3 4 5 6 7 8 9 10
Response of LNGDP to LNGDP
Response to Cholesky One S.D. Innov ations
Figure 1: Impulse Response Function
Skyline Business Journal, Volume IX-Issue 1-2013-2014
GDP level, the higher the standard of living and the higher the income level and the ability to repay the loan is higher. This is consistent with the study by Koch and McDonald (2003) which suggest that under good economic conditions both borrowers and lenders are confident about investments and their ability to repay their loans. This encourages banks to relax credit standards and accept more risk.
5.0. ConclusionThe main objective of this paper is to evaluate the macroeconomic determinants of bank credit in Malaysia. Three independent variables have been employed in this study which are Lending Rate, Consumer Price Index and Gross Domestic Product. The analysis was conducted using Vector Error Correction Model (VECM) to analyse the long - run relationship between bank credit and macroeconomic variables. Overall, it can be clearly seen that all these three macroeconomic variables contribute positively towards bank credit activity in Malaysia between 1991 and 2011. It was statistically proven that they have positive long - run relationship with the bank credit. Future research is nevertheless still required in this broad area of bank credit activity in Malaysia by employing more variables to analyze further on this area as it is a vital issue for bankers when it comes to bank lending or borrowing activities. Perhaps, researchers may consider using more sophisticated statistical tools to generate more comprehensive results and analysis.
References
Abdul Wahab, N.H.,Mhd Khalili, J., Subramaniam, G., Yusoff, S., Mohd, N., Taib, J., Mohd Saad., B., Ali, H., Setapa, F., Mohamad Arshad, A.A., &Tucker, I.B.,(2010). Economic Theory in the Malaysian Context. 1st Edition. Malaysia: Cengage Learning Asia Pre. Ltd.
Abduh, Azmi Omar, Jarita Duasa (2011). “The Impact of Crisis and Macroeconomic variables towards Islamic Banking Deposits. American Journal of Applied Sciences, Vol. 8(12), pp.1413 – 1418.
Agrawal, Paradep (2001), ‘The Relation between Savings and Growth: Cointegration and Causality Evidence from Asia.’ Applied Economics , Vol 33,pp. 499-513.
Ascarya. (2009b) .The Determinants of Inflation under Dual Monetary System in Indonesia. Working Paper, Bank Indonesia.
Asmy. M.Thas Thaker, Wican Rohilina, Aris Hassama & Md. Fouad Amin (2010). “Effect of Macroeconomic variables on Stock Prices in Malaysia: An Approach of Error Correction Model”. The Global Journal of Finance and Economics, Vol. 7(2), pp. 149-164.
Aver, B.(2008). “An Empirical Analysis of Credit Risk Factors of the Slovenian Banking System”. Managing Global Transitions, Vol. 6(3), pp. 317-334.
Aziz, Z.A. (2006). “Extending the boundaries in the new financial landscape”. Governor of Bank Negara’s Speech at
the 10th Malaysia Banking, Finance & Insurance Summit: Liberalisation and Consolidation of Malaysia Banking and Finance sector: Enhancing Competitiveness & Resilience of our Economy, Kota Kinabalu, June 9.
Bikker, J&Hu, H (2002), “Cyclical patterns in profits, provisioning and lending of banks and pro cyclicality of the new Basel capital requirement “, BNL Quarterly Review, Vol. 221, pp. 143-175.
Bofondi, M.and T. Ropele (2011). “Macroeconomic determinants of bad loans: evidence from Italian Banks”. Bank of Italy Occasional Paper (89).
Castro, V. (2012). “Macroeconomic determinants of the credit risk in the banking system: the case of the GIPSI.Damodar, N.Gujarati. “Basic Econometrics”. (2009). McGraw Hill Publication. International Student Edition.
Demirguc-Kunt, A&Detragiache , E (2000). “Monitoring banking sector fragility: a multivariate logit approach, World Bank Economic Review, Oxford University Press, Vol.14 (2), pp. 287 – 307.
Dell’Ariccia, G. and R. Marquez (2006), “Lending booms and lending standards”,The Journal of Finance, Vol. LXI, No. 5, pp. 2511-2546.
European Central Bank (2013). “Exploring the Steady – state Relationship between Credit and GDP for A Small Open Economy: The Ireland Case. Germany: European Central Bank. pp.6.
Freidman B. and Kuttner K. (1993), “Economic Activity and the Short –Term Credit Markets: an Analysis of Prices and Quantities”. Brooking Papers on Economic Activity, Vol.2,pp.193-283.
Fofack, Hippolyte (2005). “Non – performing loans in sub – Saharan Africa: Causal Analysis and Macroeconomic Implications”. World Bank Policy Research Working Paper No. 3769, November.
F.Thomas Juster & Paul Wachtel, (1972). “Inflation and the Consumer”. Brookings Papers on Economic Activity, Economic Studies Program. The Brooking Institution, Vol. 3(1), pp. 71 -122.
Gambacorta.L. (2004), “How do bank set interest rates” National Bureau of Economic Research, Cambridge, Working paper series 10295.
Haron,S., Ahmad,N., (2006). “The Effects of Conventional Interest Rates and Rate of Profit on Funds Deposited with Islamic Banking System in Malaysia. International Journal of Islamic Financial Services. 1(4), pp.7.
Haron,S., Wan Azmi, W.N. (2006). “Deposit Determinants of Commercial Banks In Malaysia. . International Journal of Islamic Financial Services. 1(5), pp.15.
6

Skyline Business Journal, Volume IX-Issue 1-2013-2014
GDP level, the higher the standard of living and the higher the income level and the ability to repay the loan is higher. This is consistent with the study by Koch and McDonald (2003) which suggest that under good economic conditions both borrowers and lenders are confident about investments and their ability to repay their loans. This encourages banks to relax credit standards and accept more risk.
5.0. ConclusionThe main objective of this paper is to evaluate the macroeconomic determinants of bank credit in Malaysia. Three independent variables have been employed in this study which are Lending Rate, Consumer Price Index and Gross Domestic Product. The analysis was conducted using Vector Error Correction Model (VECM) to analyse the long - run relationship between bank credit and macroeconomic variables. Overall, it can be clearly seen that all these three macroeconomic variables contribute positively towards bank credit activity in Malaysia between 1991 and 2011. It was statistically proven that they have positive long - run relationship with the bank credit. Future research is nevertheless still required in this broad area of bank credit activity in Malaysia by employing more variables to analyze further on this area as it is a vital issue for bankers when it comes to bank lending or borrowing activities. Perhaps, researchers may consider using more sophisticated statistical tools to generate more comprehensive results and analysis.
References
Abdul Wahab, N.H.,Mhd Khalili, J., Subramaniam, G., Yusoff, S., Mohd, N., Taib, J., Mohd Saad., B., Ali, H., Setapa, F., Mohamad Arshad, A.A., &Tucker, I.B.,(2010). Economic Theory in the Malaysian Context. 1st Edition. Malaysia: Cengage Learning Asia Pre. Ltd.
Abduh, Azmi Omar, Jarita Duasa (2011). “The Impact of Crisis and Macroeconomic variables towards Islamic Banking Deposits. American Journal of Applied Sciences, Vol. 8(12), pp.1413 – 1418.
Agrawal, Paradep (2001), ‘The Relation between Savings and Growth: Cointegration and Causality Evidence from Asia.’ Applied Economics , Vol 33,pp. 499-513.
Ascarya. (2009b) .The Determinants of Inflation under Dual Monetary System in Indonesia. Working Paper, Bank Indonesia.
Asmy. M.Thas Thaker, Wican Rohilina, Aris Hassama & Md. Fouad Amin (2010). “Effect of Macroeconomic variables on Stock Prices in Malaysia: An Approach of Error Correction Model”. The Global Journal of Finance and Economics, Vol. 7(2), pp. 149-164.
Aver, B.(2008). “An Empirical Analysis of Credit Risk Factors of the Slovenian Banking System”. Managing Global Transitions, Vol. 6(3), pp. 317-334.
Aziz, Z.A. (2006). “Extending the boundaries in the new financial landscape”. Governor of Bank Negara’s Speech at
the 10th Malaysia Banking, Finance & Insurance Summit: Liberalisation and Consolidation of Malaysia Banking and Finance sector: Enhancing Competitiveness & Resilience of our Economy, Kota Kinabalu, June 9.
Bikker, J&Hu, H (2002), “Cyclical patterns in profits, provisioning and lending of banks and pro cyclicality of the new Basel capital requirement “, BNL Quarterly Review, Vol. 221, pp. 143-175.
Bofondi, M.and T. Ropele (2011). “Macroeconomic determinants of bad loans: evidence from Italian Banks”. Bank of Italy Occasional Paper (89).
Castro, V. (2012). “Macroeconomic determinants of the credit risk in the banking system: the case of the GIPSI.Damodar, N.Gujarati. “Basic Econometrics”. (2009). McGraw Hill Publication. International Student Edition.
Demirguc-Kunt, A&Detragiache , E (2000). “Monitoring banking sector fragility: a multivariate logit approach, World Bank Economic Review, Oxford University Press, Vol.14 (2), pp. 287 – 307.
Dell’Ariccia, G. and R. Marquez (2006), “Lending booms and lending standards”,The Journal of Finance, Vol. LXI, No. 5, pp. 2511-2546.
European Central Bank (2013). “Exploring the Steady – state Relationship between Credit and GDP for A Small Open Economy: The Ireland Case. Germany: European Central Bank. pp.6.
Freidman B. and Kuttner K. (1993), “Economic Activity and the Short –Term Credit Markets: an Analysis of Prices and Quantities”. Brooking Papers on Economic Activity, Vol.2,pp.193-283.
Fofack, Hippolyte (2005). “Non – performing loans in sub – Saharan Africa: Causal Analysis and Macroeconomic Implications”. World Bank Policy Research Working Paper No. 3769, November.
F.Thomas Juster & Paul Wachtel, (1972). “Inflation and the Consumer”. Brookings Papers on Economic Activity, Economic Studies Program. The Brooking Institution, Vol. 3(1), pp. 71 -122.
Gambacorta.L. (2004), “How do bank set interest rates” National Bureau of Economic Research, Cambridge, Working paper series 10295.
Haron,S., Ahmad,N., (2006). “The Effects of Conventional Interest Rates and Rate of Profit on Funds Deposited with Islamic Banking System in Malaysia. International Journal of Islamic Financial Services. 1(4), pp.7.
Haron,S., Wan Azmi, W.N. (2006). “Deposit Determinants of Commercial Banks In Malaysia. . International Journal of Islamic Financial Services. 1(5), pp.15.
7

Skyline Business Journal, Volume IX-Issue 1-2013-2014
Ibrahim,M.H., (2006). “Stock Prices and Bank Loan Dynamics in a Developing Country: The Case of Malaysia. Journal of Applied Economics. 10(1), pp.81.
Jimenez, Gabriel and Jesus Saurina (2005). “Credit cycles, credit risk, and prudential regulation”. Banco de Espana, January.
Kashyap A. And Stein J.C. (1995). “The Impact of Monetary Policy on Bank Balance Sheets”, Carnegie Rochester Conference Series on Public Policy, Vol.42, pp.151-195.
Kechik, A.L. (2008). A Study of Loan Repayment Patterns in Relation to Selected Economic Indicators. Master Graduation Thesis, Universiti Utara Malaysia, (UUM)
Kelly, R., McQuinn, K., Stuart, R., (2013). Exploring the Steady-State Relationship Between Credit and GDP For A Small Open Economy The Case Of Ireland. Research Working Paper. January. Koch, T.W. and McDonald (2003). Bank Management. 3rd edition, pp. 157 -169. Sydney, Thompson.
Lakstutiene, A., (2008). Correlations of the Indicators of the Financial system and Gross Domestic Product in European Union Countries . ISSN 1392-2785 Engineering Economics. 3 (58), pp.12.
Mankiw, N.G. (2007). Principles of Macroeconomics. 4th ed. USA: Thompson Higher Education.
Masson, Paul R., Tamin Bayoumi, and Hossein Samiei (1998), ‘International Evidence on the Determinants of Private Saving.’The World Bank Economic Review.’ Vol. 12, No. 3, pp. 483-501.
Melitz J. and Pardue M. (1973). “The Demand and Supply of Commercial Bank Loans”. Journal of Money, Credit and Banking, Vol.5, No. 2, pp. 669-92.
McConell, C.R., Brue, S.L., Flynn,S.M. (2012). Macroeconomics. 19th ed. London” McGraw –Hill Higher Education.
Mohd. Azmi Omar, Abdul Rahim Abdul Rahman, Rosylin Mohd. Yusuf, M.Shabri Abd. Majid and Mohd. Eskandar Shah. (2006). “ Efficiency of Commercial Banks in Malaysia”. Asian Academy of Management Journal of Accounting and Finance, Vol.2, pp. 19-42.
Moore, B.J and Threadgold, R.A., (1985). Corporate bank borrowing in the U.K, 1965-81. Economia. 52:65-78.
Neely,M& Wheelock, D (1997). Why does bank performance vary across states? Federal Reserve Bank of St. Louis Review, pp.27-40.
Pasiouras, F & Kosmidou, K 2007, ‘Factors influencing the profitability of domestic and foreign commercial banks in the European Union’, Research in International Business and Finance, vol. 21, no. 2, pp. 222- 237.
Hassanudin Mohd Thas ThakerFaculty of Business, Economics and Accounting.
Department of Business Studies.HELP University
Malaysia
Tan Siew Ee Faculty of Business, Economics and Accounting.
Department of Business Studies. HELP University
Malaysia
Chuan Fui SinFaculty of Business, Economics and Accounting.
Department of Management and Economics. HELP University
Malaysia
Wong Hui ManFaculty of Business, Economics and Accounting.
Department of Management and Economics. HELP University
Malaysia
Pazarbasioglu,C., (1997). A credit crunch? Finland in the aftermath of the Banking crisis. IFM Staff Papers. 44, 3:315-328.
Richard, J. C. (1999). “New evidence on determinants of bank failures in the US.” Applied Economics Letters 6(1): 45-47.
Schwartz, Anna J. (2008): Money Supply: The Concise Encyclopaedia of Economics available on the World Wide Web at http://www.econlib.org.
Topi, J. and Vilmunen, J. (2001), Transmission of monetary policy shocks in Finland: Evidence from bank level data on loans, Working Papers 100, European Central Bank.
8

Skyline Business Journal, Volume IX-Issue 1-2013-2014
TESTING WEAK FORM STOCK MARKET EFFICIENCY ON MUSCAT SECURITIES MARKET: OMAN
Arvind Kumar, Dharmendra Singh
Abstract:
This paper examines the random walk behavior of daily and weekly returns of the MSM 30 index, the leading index of Muscat Securities Market during 1st July 2010 to 30th June, 2013. MSM-30 Index is tested for weak form efficiency using unit root tests like Augmented Dickey-Fuller test, Phillips-Peron (PP) test, Kwiatkowski, Phillips, Schmidt and Shin (KPSS), and Variance ratio test using homoscedastic and heteroscedastic test estimates. Results of all the unit root tests are consistent and support the presence of unit root. Variance ratio test supports that Muscat stock market index do not follow random walk and autocorrelation is a cause of non-random nature not heteroscedasticity. Since variance ratio test is more powerful than unit root tests performed in the study, author goes by the results of variance ratio test.
Keywords: Random walk, Unit root, Variance ratios, market efficiency
IntroductionThe term market efficiency in capital market theory is used to explain the degree to which stock prices reflect all available, relevant information. The Efficient Market Hypothesis (EMH) proposed by Fama (1970) defines an efficient market as one in which new information is quickly and correctly reflected in its current stock price. In his paper, Fama (1970) formalized the theory and presented empirical evidences, he also subdivided the EMH into the weak-form, semi-strong-form and strong-form. This paper focuses on the weak-form version, which asserts that security prices fully reflect all historical information.
The logic behind the random walk concept is that price changes occur only in response to genuinely new information. Since genuine news is by definition unpredictable, the resulting price changes must be unpredictable and random. The weak-form of EMH asserts that stock prices already reflect all information that can be derived by exploring market trading data such as the history of past prices, trading volume and any other market oriented information. The semi-strong-form hypothesis states that all publicly available information regarding the prospects of a firm already must be reflected in the stock price. Information related to company fundamentals, management expertise, accounting practices and decisions like dividends and stock splits are reflected in the stock price. Finally the strong-form EMH contends that stock prices reflects all information from historical, public, and private sources, so that no investor can realize abnormal rate of return. Stock market efficiency is an important concept, both in terms of an understanding of the working of stock markets and in their performance and contribution of the development of a country’s economy. If the stock market is efficient, the prices will represent the intrinsic values of the stocks or in other words, stocks will reflect their true value leading to optimum allocation of resources that benefits both individual investors and country as a whole. The efficient market hypothesis implies that technical analysis is without merit. The past history of prices and trading volume is publicly available at minimal cost. Therefore, any publicly available information would be reflected in stock prices. The key to successful technical analysis is a sluggish response of stock prices or in other words inefficiency of the market. This is because if the stock price responds slowly enough to the publicly available information, the intelligent investor will be
able to identify a trend that can be exploited to get abnormal returns. Therefore, if EMH holds investors should doubt the strategy of beating the market and should adopt the strategy of buy and hold.
The objective of this paper is to investigate weak-form efficient market hypothesis in the Muscat securities market (MSM). The presence of random walk is evaluated using stock market index, MSM-30. The stock index is tested for random walk using two procedures i.e. Unit root test and Variance ratio test. The three different unit root tests Augmented Dickey-Fuller (ADF) test, the Phillips-Peron (PP) test, and the Kwiatkowski, Phillips, Schmidt and Shin (KPSS) test are applied to test the presence of unit root. Later on , as a confirmatory test more powerful Variance ratio test as suggested by Lo & MacKinlay in 1988 is used to test randomness in the MSM-30 index.
Literature ReviewThere is wide literature available on random walk hypothesis and stock market efficiency. The random walk model was first developed by Bachelier (1900) in which he confirmed that price changes are nearly uncorrelated resulting to a random-walk like behavior or random nature of price changes. Samuelson (1965) and Fama (1965, 1970) triggered keen interest in this area. Samuelson (1965), Fama (1965) and Jennergeen and Korsvold (1974) examined the behavior of stock returns by applying serial correlation tests and they found markets as efficient.
Poshakwale (1996) examined on weak form efficiency in Bombay Stock Exchange by using serial correlation and runs test on the selected data. He concluded that market is not weak form efficient. Alam et al. (1999) tested the random walk hypothesis for Bangladesh, Sri Lanka, Hong Kong and Taiwan. They discovered that except Sri Lankan all other stock indices follow a random walk. Mobarek & Keasey (2000) in their study on Dhaka Stock exchange applied Runs test, Smirnov normality test, Auto-correlation, Auto-regression, and ARIMA on daily price indices, empirical results revealed that Dhaka stock exchange is not weak form efficient.
Worthington & Higgs (2006) studied daily stock returns of emerging markets like China, India, Korea, Malaysia,
9

Skyline Business Journal, Volume IX-Issue 1-2013-2014
Pakistan, Sri Lanka, Indonesia, Philippines, Thailand and Taiwan and five developed stock markets of Australia, Japan, Hong Kong, Singapore and New Zealand. They used various tests like Augmented Dickey fuller test, Phillips-Perron test, Runs test, multiple variance ratio tests and auto correlation function test. Among these Runs test, multiple variance ratio tests and Auto-correlation test confirmed that all the emerging markets and three developed markets of Japan, New Zealand and Hong Kong are not weak-form efficient.
Pan et al. (1991) analyzed the weak form of efficiency in five Asian stock markets of Hong Kong, Singapore, Japan, Taiwan and South Korea using Variance ratio test on daily and weekly returns. Authors concluded that only Japan is weak form efficient on both daily and weekly returns whereas Singapore and Korea are not weak form efficient for both the weekly and daily returns. Hong Kong daily returns and Taiwan weekly returns were also not weak form efficient. Chakraborty (2006) in his study analyzed the weak-form efficiency of the Pakistani stock market by considering daily closing prices and used serial correlation and variance ratio test in his study; he revealed that the stock market is inefficient.
Since majority of Arab stock market are emerging markets, therefore abundant literature is available on Arab stock markets. Dahel and Laabas (1999) observed the behavior of the daily stock prices in the Gulf countries Bahrain, Kuwait, Saudi Arabia and Oman. They observed that except Kuwait Stock Market other markets are not weak form efficient market. Abraham et al (2002) applied Lo and MacKinlay variance ratio test on emerging markets and observed dependencies in returns at index values for Saudi Arabia, Kuwait and Bahrain.
Smith (2007) studied the weak form of efficiency in the Middle East stock markets and found that Israeli, Lebanese and Jordanian markets were weak-form efficient while the Kuwait and Oman markets were not. Al Khzali et al (2007) who studied the behavior of Saudi Arabia, Bahrain and Kuwait concluded that Saudi Arabia and Bahrain stock market strongly support random walk while Kuwait fails within the critical bounds.
Marashdeh and Shrestha (2008) examined the randomness of stock price index in UAE by using unit root test of Augmented Dickey Fuller and Philip-Perron. The results show that the data has a unit root and follows a random walk. Benjelloun and Squalli (2008) studied the markets of UAE, Jordan, Saudi Arabia and Qatar and revealed that results are not consistent across different sectors and markets. Randomness was rejected in general indexes of Jordan, Abu Dhabi and Dubai. However, in case of sectoral indexes, they failed to reject the randomness in few sectors. Al-Jafari (2012) tested day-of-the-week effect on Muscat securities market using MSM 30 index and observed that day-of-the-week effect is not present and MSM is an efficient stock market.
There is extensive literature on random walk and market efficiency still there is lack of consensus among the researchers regarding efficiency of GCC markets. Compared
to the countries like Saudi Arabia, Jordan and Kuwait lesser literature is available on Oman stock market and there is lack of clarity regarding the weak form efficiency of MSM. Therefore, this study attempts to fill the gap in literature and to provide recent empirical evidence on stock market efficiency of Muscat Securities Market.
Overview of Muscat Securities MarketThe Muscat Securities Market (MSM) is the only stock exchange in Oman. It was established on 21 June 1988, to regulate and control the securities market of Oman. Ten years later some reforms were realized and Capital Market Authority (CMA) was established as a separate regulatory body responsible for organizing and supervising the issue and trading of securities in the Sultanate. After commencement of CMA the regulatory and exchange functions of the stock exchange were separated with executing body as MSM and regulating body as CMA.
MSM has two classifications, one is regular market and other one is parallel market. Regular market has strict norms and only financially sound company can be listed on regular market. Whereas, listing norms for parallel markets are relatively relaxed and this makes weak and new companies to list on parallel market.
Performance Snapshot Table I reflects the key stock market indicators of MSM from year 2008 to 2012.The MSM 30 index closed at the end of year 2012 at 5,760.84 recording increase of 65.7 points representing 1.15% compared with the last year. The Market capitalization increased by 12.79% compare with last year, reaching around Omani rial(OMR) 11.67 billion in year 2012.Trading value of 2012 reached OMR 1.07 billion with daily average OMR 4.28 million, recording increase of 7.49% compare with last year. The market capitalization to GDP ratio, which is indicative of the market size, marginally increased to 38.8 % in 2012 from 38.4% in the previous year.
Table I: Key Stock Market Indicators
Performance Snapshot
Table I reflects the key stock market indicators of MSM from year 2008 to 2012.The MSM 30
index closed at the end of year 2012 at 5,760.84 recording increase of 65.7 points representing
1.15% compared with the last year. The Market capitalization increased by 12.79% compare
with last year, reaching around Omani rial(OMR) 11.67 billion in year 2012.Trading value of
2012 reached OMR 1.07 billion with daily average OMR 4.28 million, recording increase of
7.49% compare with last year. The market capitalization to GDP ratio, which is indicative of the
market size, marginally increased to 38.8 % in 2012 from 38.4% in the previous year.
Table I: Key Stock Market Indicators Indicator 2008* 2009* 2010 2011 2012
MSM 30 Share Price Index
Number of shares traded(Mil)
Number of bonds traded(Mil)
Total turnover (RO Mil)
a) turnover in shares (RO Mil)
b) turnover in bonds (RO Mil)
Number of trading days
Average trading per day in
shares and bonds(RO Mil)
Market Capitalization ( RO Mil)
*Figures for 2008 & 2009 do
not include OTC trading
5441.12
4198.4
6.3
3388
3346
42
248
13.66
7912
6368.80
6067.4
23.9
2285
2246
39
246
9.29
9093
6754.92
3013.2
11.3
1317
1274
43
247
5.33
10902
5695.12
2366.2
14.1
991
981
10
246
4.03
10342
5760.84
4319.2
23.0
1065
1025
40
249
4.28
11665
Source: Annual Report 2012, Central Bank of Oman
Data and MethodologyThis paper uses the MSM-30 index to analyze the weak form of efficiency in the Muscat securities market. The study spans more than three years, starting from 1st July 2010 and
10

Skyline Business Journal, Volume IX-Issue 1-2013-2014
extending till 30th June, 2013 for daily & weekly returns. The return is calculated as the logarithmic difference between two consecutive prices in a series, yielding continuously compounded returns.
The MSM Index (MSM-30) was established in 1992 with a base year of June 1990 and base value of 1000. It serves as a benchmark to investors in tracking the performance of the Omani stock market. It is a value-weighted index of 30 high capitalized most liquid and profitable companies that are listed on MSM. Index includes 30 companies selected on the basis of market capitalization (weight 40%), liquidity (weight 45%) and earnings per share (weight 15%). The components of MSM-30 index are revised every year on the basis of performance and index components are changed every year in the month of July.
The Muscat Securities Market Index, MSM 30, is a capitalization-weighted index of the 30 most highly capitalized, liquid and profitable companies listed on the Muscat Securities Market. The main objective of the MSM 30 is to represent all the stocks listed in the exchange and to work as a benchmark index for the investors. To achieve these objectives, the MSM 30 has the following features:1. Only freely floating shares for trading are included in the construction of the index. Therefore, other shares like shares held by the government, promoters, strategic holdings and locked-in shares which are not tradable for at least 3 months are excluded.
2. To ensure wider representation of smaller companies a 10% capping (CAP) is set in the index.
3. The free float stocks and capping is revised on a quarterly basis, by end of March, June, September and December. But the index sample amendment takes place in the beginning of July each year.
The MSM-30 includes three main sectors namely banking and investment, industry, and services and insurance. In MSM -30 for year 2011-2012 out of the total 30 index constituents, Banking and investment sector continues to dominate with a total of 13 companies, A total of 11 companies from the Industry sector and about 6 companies in the Services sector. The break-up of market capitalization for MSM-30 for year 2011-2012 is 53% for Banking and Investment sector, 32.5% for Services & Insurance sector and 14.5% for Industry sector.
Unit Root TestA unit root test tests whether a time series variable is non–stationary using an autoregressive model. Three different unit root tests are used to test the presence of a unit root in a series: namely, the Augmented Dickey-Fuller (ADF) test, the Phillips-Peron (PP) test, and the Kwiatkowski, Phillips, Schmidt and Shin (KPSS) test. Dickey-Fuller test involves fitting the regression model as: , where Pt denotes the price at time t Test examines the null hypothesis that series contains the unit root versus series is stationary.
The null hypothesis of a unit root is rejected in each case if the test statistic is more negative than the critical value. A series with unit root is said to be non-stationary and follow random walk. But in this serial correlation creates problem, to counter this Augmented Dickey Fuller test (ADF) equation includes lags of the first differences of Pt.The ADF unit root test is conducted using the following regression equation:
In equation (1), ΔPit is the first difference term i.e. (Pit - Pit-1), it is the white noise or error term, is the constant, is the coefficient for the trend and i are coefficients to be estimated.
One advantage of the PP tests over the ADF tests is that the PP tests are robust to serial correlations and general forms of heteroskedasticity in the error term ut. Another advantage is that the user does not have to specify a lag length for the test regression. KPSS test also uses autocorrelation correction approach like PP test but in KPSS parametric approach is adopted to overcome the problem of autocorrelation. In KPSS the null hypothesis is different from the earlier two tests as it assumes stationarity of the variable and the alternative is the presence of unit root or non-stationarity of the variable or presence of random walk. To increase the robustness of the result all the three tests are used to detect unit root in the series.
Variance Ratio TestIn this study variance ratio test developed by Lo & Mackinlay (1988) is used on the MSM-30 index to study random walk hypothesis. Variance ratio is applied after the unit root test, as the variance ratio test is more powerful and robust than unit root tests. Variance ratio test is based on the concept of random walk that if a time series of variable Pt follows a random walk then the variance of increments of Pt is linear in its data interval. This means that the variance of (Pt – Pt-1) = (Pt – Pt-n)/n, or the variance of its n-differences is n times the variance of its first difference for a random walk series.
The null and alternative hypothesis of the test are stated as
H0: The variance ratio at lag n, VR (n) = 1H1: The variance ratio at lag n, VR (n) ≠ 1
Where VR(n) = Var[rt(n)] /[n. Var(rt)] is the variance ratio at lag n
Due to the above relationship, Lo & Mackinlay (1988) says that the variance of weekly price changes must be five times the variance of a daily price change. As in general there are five working days in a week for the stock markets.
FindingsAll the unit root tests were applied once on daily return and then on weekly return of MSM-30 index. Results of Augmented Dickey-Fuller (ADF), Phillips-Perron (PP) tests and Kwiatkowski, Phillips, Schmidt, and Shin (KPSS) test for the daily observations are presented in Table II,
3. The free float stocks and capping is revised on a quarterly basis, by end of March, June,
September and December. But the index sample amendment takes place in the beginning of July
each year.
The MSM-30 includes three main sectors namely banking and investment, industry, and services
and insurance. In MSM -30 for year 2011-2012 out of the total 30 index constituents, Banking
and investment sector continues to dominate with a total of 13 companies, A total of 11
companies from the Industry sector and about 6 companies in the Services sector. The break-up
of market capitalization for MSM-30 for year 2011-2012 is 53% for Banking and Investment
sector, 32.5% for Services & Insurance sector and 14.5% for Industry sector.
Unit Root Test
A unit root test tests whether a time series variable is non–stationary using an
autoregressive model. Three different unit root tests are used to test the presence of a unit root in
a series: namely, the Augmented Dickey-Fuller (ADF) test, the Phillips-Peron (PP) test, and the
Kwiatkowski, Phillips, Schmidt and Shin (KPSS) test. Dickey-Fuller test involves fitting the
regression model as:
P t = φ Pt-1 + ut , where Pt denotes the price at time t
Test examines the null hypothesis that series contains the unit root versus series is stationary.
H0: φ =1
H1 : φ < 1
The null hypothesis of a unit root is rejected in each case if the test statistic is more negative than
the critical value. A series with unit root is said to be non-stationary and follow random walk.
But in this serial correlation creates problem, to counter this Augmented Dickey Fuller test
(ADF) equation includes lags of the first differences of Pt.
The ADF unit root test is conducted using the following regression equation:
∆ Pit = ββtφPit-1∑φi∆Pit-i + it
In equation (1), ΔPit is the first difference term i.e. (Pit - Pit-1), it is the white noise or error
term, β is the constant, βis the coefficient for the trend and φi are coefficients to be estimated.
One advantage of the PP tests over the ADF tests is that the PP tests are robust to serial
correlations and general forms of heteroskedasticity in the error term ut. Another advantage is
that the user does not have to specify a lag length for the test regression. KPSS test also uses
autocorrelation correction approach like PP test but in KPSS parametric approach is adopted to
overcome the problem of autocorrelation. In KPSS the null hypothesis is different from the
earlier two tests as it assumes stationarity of the variable and the alternative is the presence of
unit root or non-stationarity of the variable or presence of random walk. To increase the
robustness of the result all the three tests are used to detect unit root in the series.
Variance Ratio Test
In this study variance ratio test developed by Lo & Mackinlay (1988) is used on the
MSM-30 index to study random walk hypothesis. Variance ratio is applied after the unit root
test, as the variance ratio test is more powerful and robust than unit root tests. Variance ratio test
is based on the concept of random walk that if a time series of variable Pt follows a random walk
then the variance of increments of Pt is linear in its data interval. This means that the variance of
11
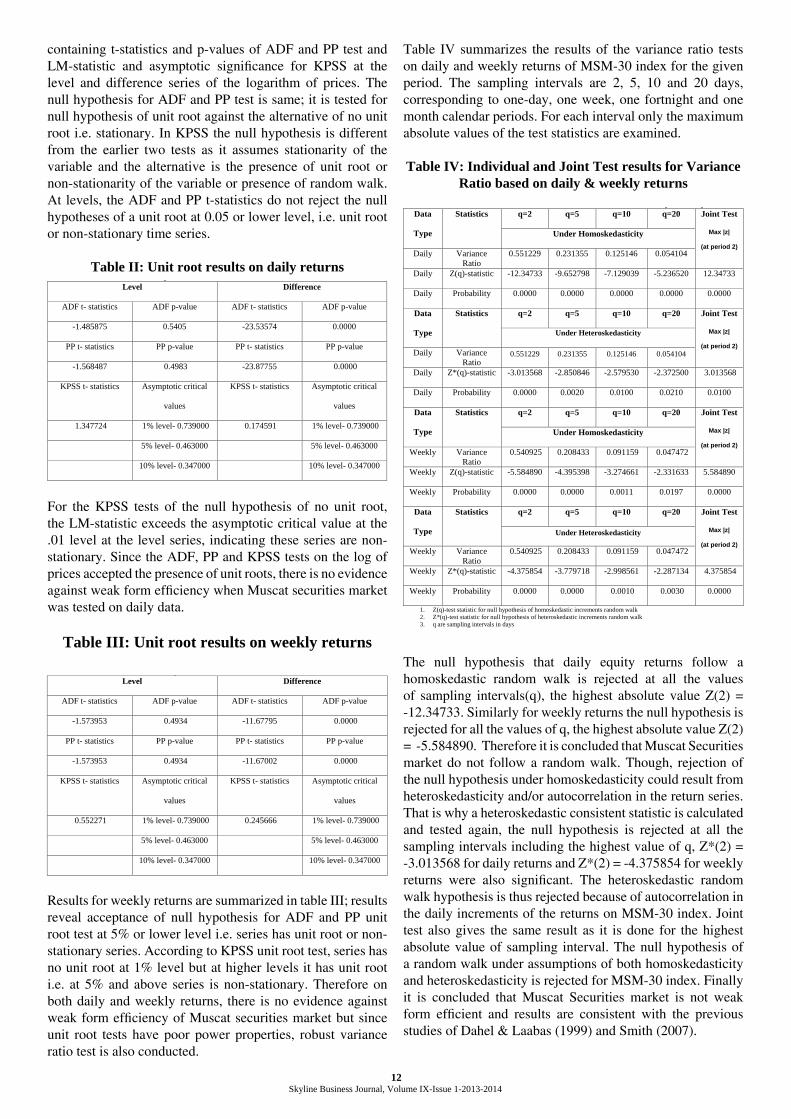
Skyline Business Journal, Volume IX-Issue 1-2013-2014
containing t-statistics and p-values of ADF and PP test and LM-statistic and asymptotic significance for KPSS at the level and difference series of the logarithm of prices. The null hypothesis for ADF and PP test is same; it is tested for null hypothesis of unit root against the alternative of no unit root i.e. stationary. In KPSS the null hypothesis is different from the earlier two tests as it assumes stationarity of the variable and the alternative is the presence of unit root or non-stationarity of the variable or presence of random walk. At levels, the ADF and PP t-statistics do not reject the null hypotheses of a unit root at 0.05 or lower level, i.e. unit root or non-stationary time series.
Table II: Unit root results on daily returns
Table II: Unit root results on daily returns Level Difference
ADF t- statistics ADF p-value ADF t- statistics ADF p-value
-1.485875 0.5405 -23.53574 0.0000
PP t- statistics PP p-value PP t- statistics PP p-value
-1.568487 0.4983 -23.87755 0.0000
KPSS t- statistics Asymptotic critical
values
KPSS t- statistics Asymptotic critical
values
1.347724 1% level- 0.739000 0.174591 1% level- 0.739000
5% level- 0.463000 5% level- 0.463000
10% level- 0.347000 10% level- 0.347000
For the KPSS tests of the null hypothesis of no unit root, the LM-statistic exceeds the asymptotic
critical value at the .01 level at the level series, indicating these series are non-stationary. Since
the ADF, PP and KPSS tests on the log of prices accepted the presence of unit roots, there is no
evidence against weak form efficiency when Muscat securities market was tested on daily data.
For the KPSS tests of the null hypothesis of no unit root, the LM-statistic exceeds the asymptotic critical value at the .01 level at the level series, indicating these series are non-stationary. Since the ADF, PP and KPSS tests on the log of prices accepted the presence of unit roots, there is no evidence against weak form efficiency when Muscat securities market was tested on daily data.
Table III: Unit root results on weekly returns
Table III: Unit root results on weekly returns Level Difference
ADF t- statistics ADF p-value ADF t- statistics ADF p-value
-1.573953 0.4934 -11.67795 0.0000
PP t- statistics PP p-value PP t- statistics PP p-value
-1.573953 0.4934 -11.67002 0.0000
KPSS t- statistics Asymptotic critical
values
KPSS t- statistics Asymptotic critical
values
0.552271 1% level- 0.739000 0.245666 1% level- 0.739000
5% level- 0.463000 5% level- 0.463000
10% level- 0.347000 10% level- 0.347000
Results for weekly returns are summarized in table III; results reveal acceptance of null
hypothesis for ADF and PP unit root test at 5% or lower level i.e. series has unit root or non-
stationary series. According to KPSS unit root test, series has no unit root at 1% level but at
higher levels it has unit root i.e. at 5% and above series is non-stationary. Therefore on both daily
and weekly returns, there is no evidence against weak form efficiency of Muscat securities
market but since unit root tests have poor power properties, robust variance ratio test is also
conducted.
Table IV summarizes the results of the variance ratio tests on daily and weekly returns of MSM-
30 index for the given period. The sampling intervals are 2, 5, 10 and 20 days, corresponding to
one-day, one week, one fortnight and one month calendar periods. For each interval only the
maximum absolute values of the test statistics are examined.
Results for weekly returns are summarized in table III; results reveal acceptance of null hypothesis for ADF and PP unit root test at 5% or lower level i.e. series has unit root or non-stationary series. According to KPSS unit root test, series has no unit root at 1% level but at higher levels it has unit root i.e. at 5% and above series is non-stationary. Therefore on both daily and weekly returns, there is no evidence against weak form efficiency of Muscat securities market but since unit root tests have poor power properties, robust variance ratio test is also conducted.
Table IV summarizes the results of the variance ratio tests on daily and weekly returns of MSM-30 index for the given period. The sampling intervals are 2, 5, 10 and 20 days, corresponding to one-day, one week, one fortnight and one month calendar periods. For each interval only the maximum absolute values of the test statistics are examined.
Table IV: Individual and Joint Test results for Variance Ratio based on daily & weekly returns
Table IV: Individual and Joint Test results for Variance Ratio based on daily & weekly returns Data
Type
Statistics q=2 q=5 q=10 q=20 Joint Test
Max |z|
(at period 2) Under Homoskedasticity
Daily Variance Ratio
0.551229 0.231355 0.125146 0.054104
Daily Z(q)-statistic -12.34733 -9.652798 -7.129039 -5.236520 12.34733
Daily Probability 0.0000 0.0000 0.0000 0.0000 0.0000
Data
Type
Statistics q=2 q=5 q=10 q=20 Joint Test
Max |z|
(at period 2) Under Heteroskedasticity
Daily Variance Ratio
0.551229 0.231355 0.125146 0.054104
Daily Z*(q)-statistic -3.013568 -2.850846 -2.579530 -2.372500 3.013568
Daily Probability 0.0000 0.0020 0.0100 0.0210 0.0100
Data
Type
Statistics q=2 q=5 q=10 q=20 Joint Test
Max |z|
(at period 2)
Under Homoskedasticity
Weekly Variance Ratio
0.540925 0.208433 0.091159 0.047472
Weekly Z(q)-statistic -5.584890 -4.395398 -3.274661 -2.331633 5.584890
Weekly Probability 0.0000 0.0000 0.0011 0.0197 0.0000
Data
Type
Statistics q=2 q=5 q=10 q=20 Joint Test
Max |z|
(at period 2)
Under Heteroskedasticity
Weekly Variance Ratio
0.540925 0.208433 0.091159 0.047472
Weekly Z*(q)-statistic -4.375854 -3.779718 -2.998561 -2.287134 4.375854
Weekly Probability 0.0000 0.0000 0.0010 0.0030 0.0000
1. Z(q)-test statistic for null hypothesis of homoskedastic increments random walk
2. Z*(q)-test statistic for null hypothesis of heteroskedastic increments random walk 3. q are sampling intervals in days
The null hypothesis that daily equity returns follow a homoskedastic random walk is rejected at all the values of sampling intervals(q), the highest absolute value Z(2) = -12.34733. Similarly for weekly returns the null hypothesis is rejected for all the values of q, the highest absolute value Z(2) = -5.584890. Therefore it is concluded that Muscat Securities market do not follow a random walk. Though, rejection of the null hypothesis under homoskedasticity could result from heteroskedasticity and/or autocorrelation in the return series. That is why a heteroskedastic consistent statistic is calculated and tested again, the null hypothesis is rejected at all the sampling intervals including the highest value of q, Z*(2) = -3.013568 for daily returns and Z*(2) = -4.375854 for weekly returns were also significant. The heteroskedastic random walk hypothesis is thus rejected because of autocorrelation in the daily increments of the returns on MSM-30 index. Joint test also gives the same result as it is done for the highest absolute value of sampling interval. The null hypothesis of a random walk under assumptions of both homoskedasticity and heteroskedasticity is rejected for MSM-30 index. Finally it is concluded that Muscat Securities market is not weak form efficient and results are consistent with the previous studies of Dahel & Laabas (1999) and Smith (2007).
12

Skyline Business Journal, Volume IX-Issue 1-2013-2014
Concluding RemarksThe rationale of this study is to explore and test the random walk and weak-form informational stock market efficiency in the Oman. To satisfy the requirement two different procedures are employed on daily and weekly returns of MSM-30 index: (i) ADF, PP and KPSS unit root tests and (ii) Variance ratio test. The findings show empirical evidence that Muscat stock index (MSM-30) exhibit unit root for both daily and weekly returns. All three unit root tests are consistent and are giving the same result that there is no evidence against weak form efficiency of Muscat securities market. In variance ratio test the rejection of null hypothesis of a random walk under assumptions of both homoskedasticity and heteroskedasticity is rejected for MSM-30 index concluding that Muscat Securities market is not weak form efficient. Therefore, it is expected that investors can generate abnormal or undue returns using past information and technical analysis which helps in identifying under-priced shares. The findings of this study will supplement existing literature on testing of random walk and weak-form market efficiency in the emerging markets, especially in GCC countries.
References:1.Abraham, A., Seyyed, F. J. & Aisakran, S.A. (2002). Testing the random walk behavior and efficiency of the Gulf stock markets. The Financial Review, 37:469-480.
2. Alam M. I., Hasan T. & Kadapakkam, P. (1999). An Application of Variance Ratio Test to Five Asian Stock Markets. Review of Pacific Basin Financial Markets and Policies, 2: 301-315.
3.Al-Jafari. (2012). An Empirical Investigation of the Day-of- the-Week Effect on Stock
Returns and Volatility: Evidence from Muscat Securities Market. International Journal of Economics and Finance,4(7):141-149
4.Al-Khazali, O M., Ding, D. K. & Pyun, C.S. (2007). A new variance ratio test of random walk in emerging markets: A revisit. The Financial Review, 42:303-317
5. Bachelier, Louis (1900). trans. James Boness. Theory of Speculation, In Cootner (ed.1964). The Random Character of Stock Market Prices: 17-78. MIT Press.
6. Benjelloun, H. & Squalli, J. (2008). Do General Indexes Mask Sectoral Efficiency? A Multiple Variance Ratio Assessment of Middle Eastern Equity Markets. International Journal of Managerial Finance, 4(2):136-151.
7. Chakraborty, M. (2006). Market Efficiency for the Pakistan Stock Market: Evidence from the Karachi Stock Exchange. South Asia Economic Journal , 7(1): 67-81.
8. Dahel, R. & Laabas, B. (1999). The Behavior of Stock Prices in the GCC Markets. Journal of Development & Economic Policies, 1: 89-105.
9. Fama, E. (1965). The behavior of stock market prices. Journal of Business, 38: 34-105.
10. Fama, E. (1970). Efficient capital markets: A review of theory and empirical work. Journal of Finance, 25:383-417.
11. Jennergren, L. P. & Korsvold, P. E. (1974). Price formation of the Norwegian and Swedish stock markets: Some random walk tests. The Swedish Journal of Economics,76: 171-185.
12. Lo, A. W., & MacKinlay, A. C. (1988). Stock Market Prices do not Follow Random Walks: Evidence from a Simple Specification Test. The Review of Financial Studies, 1(1): 41-66.
13. Lo, A.W. & A.C. MacKinlay. (1989). The Size and Power of the Variance Ratio Test in Finite Samples: A Monte Carlo Investigation. Journal of Econometrics,40:203—238
14. Marashdeh, H. & Shrestha, M. B. (2008). Efficiency in Emerging Markets- Evidence from the Emirates Securities Market. European Journal of Economics, Finance and Administrative Sciences, 12:143-150.
15. Mobarek,Asma & Keaven Keasey. (2000). Weak-form market efficiency of an emerging market: Evidence from Dhaka stock market of Bangladesh, presented at the ENBS conference held at Oslo, May 2000
16. Pan, M.S., Chiou, J.R., Hocking, R., & Rim, H.K. (1991). An examination of mean-reverting behavior of stock prices in Pacific -Basin stock markets. Pacific -Basin Capital Markets Research, 2: 333-342
17. Poshakwale, S. (2002). The Random Walk Hypothesis in the Emerging Indian Stock Market. Journal of Business Finance & Accounting, 29 (10): 1275-1299
18. Samuelson, P. (1965). Proof that properly anticipated prices fluctuate randomly. Industrial Management Review, 6:41-49.
19. Smith, G. (2007). Random Walks in Middle Eastern Stock Markets. Applied Financial Economics, 17: 587-596.
20. Worthington, A.C. & Higgs, H. (2006). Evaluating Financial Development in emerging Capital Markets with efficiency Benchmarks. Journal of Economic Development, 31(1): 1-27.
21. www.msm.gov.om
Dr. Dharmendra SinghAssistant Professor
Modern College of Business & ScienceMuscat, Sultanate of Oman
Email:[email protected]
Prof. Arvind KumarProf. & Head, Department of Commerce
University of Lucknow, IndiaEmail: [email protected]
13

Skyline Business Journal, Volume IX-Issue 1-2013-2014
THE COMPATIBILITY OF BUSINESS CURRICULUM AT PALESTINIAN UNIVERSITIES WITH THE ACTUAL DEMANDS OF THE LOCAL MARKET AS PERCEIVED BY BUSINESS GRADUATES
Usamah Shahwan
Abstract:
The research came in response to the growing concern among both academicians and practitioners in recent years regarding the relevance of the business curriculum taught in Palestinian universities to the actual demands and skills needed in the local market. This discrepancy negatively impacts employment opportunities for business graduates as well as their job performance. The researcher sought to find out whether the core business courses which the business majors in Palestinian universities are required to take, provide the students with the necessary skills to work successfully in the Palestinian local market. For this purpose, a study was designed, based on both a qualitative and quantitative analysis. Responses were collected from a number of Palestinian business managers using, in-depth interviews, and from a sample of business graduates from five Palestinian universities who have worked in Palestinian private enterprises during the last ten years. Content analysis of the material found in some major textbooks taught in core business courses was carried out to determine the content validity of the curriculum. For the quantitative part of the study a structured questionnaire was distributed to a sample of 125 employees in various for-profit enterprises. A variety of statistical tests were employed to analyze the results of the quantitative part of the research. Findings suggest both business managers and graduates perceive a mismatch between the business curriculum and the job demands of the Palestinian local market.
Keywords: mismatch, curriculum, market demands, skills, textbooks, training
1. Introduction In light of innumerable changes in technology, economy, politics and lifestyle in recent years there is a growing need all over the world to emphasize the match between workers’ qualifications and job requirements. This need has been voiced by many analysts in both the United States and Europe. A mismatch of skills and job openings has been considered as a possible contributor to unemployment in America as was the case in England during the eighties of the last century (Whitehouse, 2010). The match has also been considered as a major challenge for member states in the European Union which should pay more attention to the “interplay between the educational systems and the labor market”(Anderson, 2010).
The global economic crisis and the increasing constraints facing the Palestinian economy, make it imperative for local universities and other educational institutions to produce graduates whose competencies match the requirements of the job market. This will not only mean an efficient use of human resources but it will also enhance the performance and competitiveness of the Palestinian enterprises that face a world characterized by an intensive regional and global competition in all spheres
The establishment of business departments in Palestinian universities during the mid-seventies and early eighties of the last century was practically a response to the rising demand for business majors due to the increasing number of business enterprises whose number continued to rise despite the destructive impact of the two uprisings on the Palestinian economy. However, the design of the business curriculum in all the local universities has not been formulated on the basis of a strategic plan incorporating the various variables in the Palestinian environment and the volatile labor market demands, but was rather a copied version of the curricula applied in foreign universities which operate in somewhat different environments. Courses taught in the faculties of
business administration at Palestinian universities have been borrowed en mass from either American business schools (Bethlehem, Bir-Zeit, Arab American University) or from Arab universities especially Egypt and Jordan (An-Najah, Al-Kuds, Hebron etc). It is important to take into account that the business curricula in Western industrialized countries have been designed to address issues pertinent to a service, high tech and information based economy.
In spite of the relative improvement in the economy of the West Bank during the last few years, the rate of unemployment is still high especially among university graduates. Business enterprises operating in the Palestinian territories employ a significant number of graduates from business faculties of the local universities. However, there is a perception shared by many observers here that following graduation and employment, many business graduates feel a deep sense of alienation on the job and start to question the relevancy of what they have studied in college to the demands of their jobs. Appointees express disappointment at the lack of compatibility between what they learn at college and the job requirements they are asked to perform. This reflects a waste of resources that have to be addressed. Students majoring in the field of business administration need to know better how the market system works within.
Over the years, the researcher, who is a business professor, was approached by former students from different local universities asking that something be done to modify existing curriculum and tailor it to the actual needs of the Palestinian economy. Furthermore, informal probing carried out by the researcher indicates that this particular issue has never been researched in Palestine despite its crucial importance.
Importance of the researchThe research sheds light on a problem that is rarely addressed by development experts in the developing countries i.e the mismatch between local universities’ curricula and community
Skyline Business Journal, Volume IX-Issue 1-2013-2014
needs. This makes the majority of college graduates in these countries especially in business and management fields ill prepared to meet market demands, thus minimizing their chances to find suitable employment. Local economy in Palestine is dependent to a large degree on a network of small businesses in which about 91 percent are micro-businesses employing 1-2 individuals. Business courses taught in the local universities are tailored to fit the Western Industrialized economic model of large and medium-size enterprises and corporate management. This gap has negative implications for the prospects of economic development in the country. Research results may sensitize policy makers in the higher education sector to the importance of addressing the issue more seriously.
Research problemThe mismatch between business curriculum in Palestinian universities and local market demands has serious implications for employment opportunities for business graduates. Most of the courses taught are borrowed from foreign universities and have been designed to respond to the requirements of advanced industrial and service economies of welfare states. The skills these courses are intended to impart do not always fit the needs of the small business enterprises operating in the local markets. This lack of compatibility negatively impacts organizational performance and reduce operational efficiency. The discrepancy also undermines recruitment practices in the private sector, making the objective of job-ability fit difficult to realize. This places the management of many Palestinian enterprises at a weak competitive position with rival foreign firms in the region. Furthermore, a substantial number of business graduates prefer to emigrate in order to seek better work opportunities in foreign markets further stripping the Palestinian society of a resource that is vital in building a viable state.
Theoretical frameworkThe issue of compatibility between academic programs and market requirements evokes an old classical debate between the idealists and the pragmatists regarding whether knowledge is sought for its own intrinsic value or for its utilitarian benefits. In other words, should the business curriculum, for example be designed to respond exclusively to the particular needs of the economy or to satisfy the human thirst for knowledge? The controversy spills over to the status and role of the business school. Should the curriculum emphasize academic rigor or relevancy? The answer to this question has a very important implication in the formulation of academic and educational strategy in a country.
The world today is impacted by changes in the economic and political scene characterized by more depletion of natural resources and recurrent economic crises. The new reality calls for a reassessment of the relationship between academic training and the requirements of a volatile global market. Business schools have been tremendously affected by changes in the economy which made funding from central government more and more difficult. The result was a shift towards more relevance in order to secure more funds from the private sector. Zell (2001) articulated the new trend pointing out that business schools became “market-
driven” and started to perceive students as customers. In his judgment, the executive programs started by business faculties to provide much needed funding have downgraded the academic content of the curriculum to make the training programs easier and more attractive to participants. The transformation of the role of the student from learner to customer has had significant implications in terms of the classroom environment, relationship between teacher and student and more importantly in relation to the academic curriculum.
Jurse and Tomnic (2008) stressed the importance of taking seriously the requirements of the labor market when designing business curriculum, particularly during the early process of academic program development, to provide graduates with the necessary skills which help them perform better on their jobs. Calls for redesigning higher education curricula in order to align it with today’s local and global market demands have been voiced in a number of developing countries and major policy changes in the area of educational reform have been carried out in Latin America during recent years. In Chile “educational reform has figured prominently in the social policy agenda” Valverde (2004). Brewer, Harrigea and Mendonca (2006) proposed a “continuous improvement process framework in developing a comprehensive curriculum model’ in which each stakeholder is involved in defining curriculum objectives.
Many developing countries including Palestine face the challenge of aligning university curriculum with job openings as a strategy to minimize unemployment among college and university graduates plaguing these countries. In a keynote speech at the Biennial conference of the International council of Universities of St. Thomas Aquinas, January 26, 2011 President Aquino of the Philippines noted “the mismatch between job openings and courses offered in the universities and hinted at taking certain measures to strengthen ties between employers and higher institutions”(Official Gazette of the Philippines, 2011)
Job performance, however, is not exclusively dependent on the course contents to which a business graduate has been exposed to in his/her years of study. Competency is a product of various factors including cognitive, technical and interpersonal skills besides the proper match between personality and the type of job. But a significant number of these skills especially the technical and interpersonal ones can be learned through a variety of business and management courses. Content validity which describes the relevancy of the program contents to the actual skills needed in the market is of crucial importance in the future success of the job applicant.
Probably, the most serious weakness in the curriculum is pedagogical. There is generally an overemphasis on memorizing material and shunning innovative and “unorthodox” ideas. It is a chronic problem in the Arab educational system that engulfs both schools’ and universities’ approach to knowledge. Innovativeness has been a major factor behind the fame and success of business enterprises especially high-tech firms in the industrialized countries
14
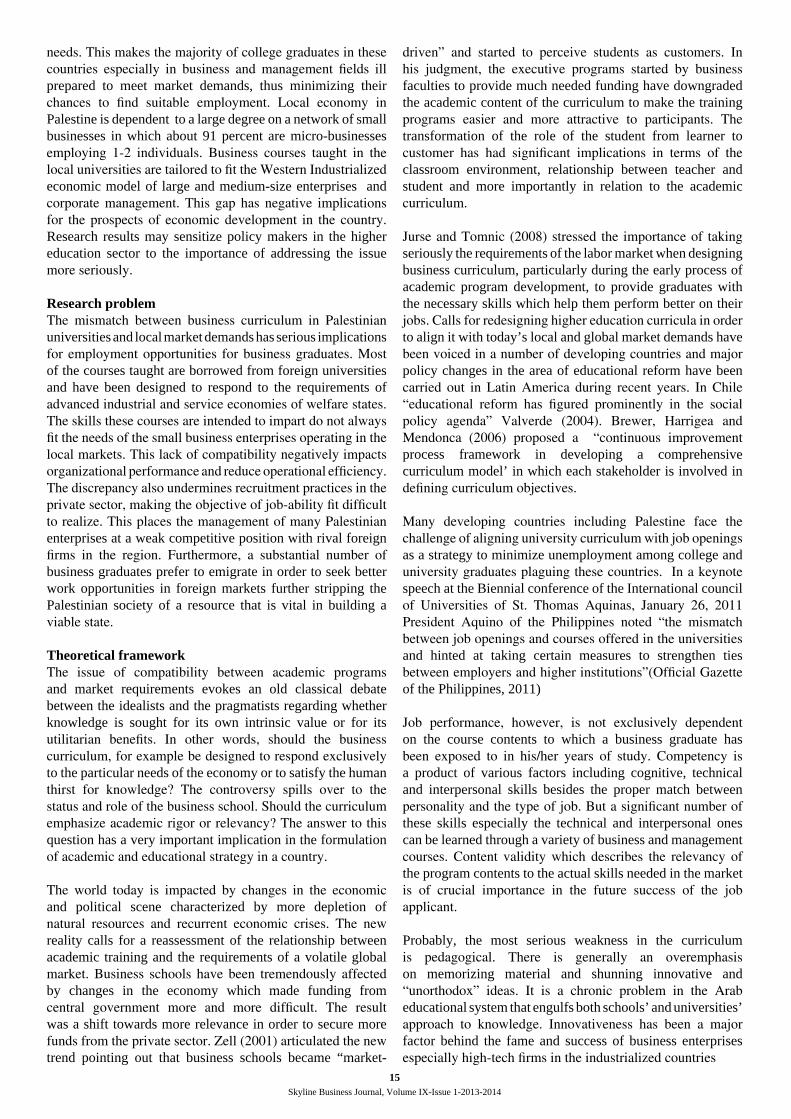
Skyline Business Journal, Volume IX-Issue 1-2013-2014
needs. This makes the majority of college graduates in these countries especially in business and management fields ill prepared to meet market demands, thus minimizing their chances to find suitable employment. Local economy in Palestine is dependent to a large degree on a network of small businesses in which about 91 percent are micro-businesses employing 1-2 individuals. Business courses taught in the local universities are tailored to fit the Western Industrialized economic model of large and medium-size enterprises and corporate management. This gap has negative implications for the prospects of economic development in the country. Research results may sensitize policy makers in the higher education sector to the importance of addressing the issue more seriously.
Research problemThe mismatch between business curriculum in Palestinian universities and local market demands has serious implications for employment opportunities for business graduates. Most of the courses taught are borrowed from foreign universities and have been designed to respond to the requirements of advanced industrial and service economies of welfare states. The skills these courses are intended to impart do not always fit the needs of the small business enterprises operating in the local markets. This lack of compatibility negatively impacts organizational performance and reduce operational efficiency. The discrepancy also undermines recruitment practices in the private sector, making the objective of job-ability fit difficult to realize. This places the management of many Palestinian enterprises at a weak competitive position with rival foreign firms in the region. Furthermore, a substantial number of business graduates prefer to emigrate in order to seek better work opportunities in foreign markets further stripping the Palestinian society of a resource that is vital in building a viable state.
Theoretical frameworkThe issue of compatibility between academic programs and market requirements evokes an old classical debate between the idealists and the pragmatists regarding whether knowledge is sought for its own intrinsic value or for its utilitarian benefits. In other words, should the business curriculum, for example be designed to respond exclusively to the particular needs of the economy or to satisfy the human thirst for knowledge? The controversy spills over to the status and role of the business school. Should the curriculum emphasize academic rigor or relevancy? The answer to this question has a very important implication in the formulation of academic and educational strategy in a country.
The world today is impacted by changes in the economic and political scene characterized by more depletion of natural resources and recurrent economic crises. The new reality calls for a reassessment of the relationship between academic training and the requirements of a volatile global market. Business schools have been tremendously affected by changes in the economy which made funding from central government more and more difficult. The result was a shift towards more relevance in order to secure more funds from the private sector. Zell (2001) articulated the new trend pointing out that business schools became “market-
driven” and started to perceive students as customers. In his judgment, the executive programs started by business faculties to provide much needed funding have downgraded the academic content of the curriculum to make the training programs easier and more attractive to participants. The transformation of the role of the student from learner to customer has had significant implications in terms of the classroom environment, relationship between teacher and student and more importantly in relation to the academic curriculum.
Jurse and Tomnic (2008) stressed the importance of taking seriously the requirements of the labor market when designing business curriculum, particularly during the early process of academic program development, to provide graduates with the necessary skills which help them perform better on their jobs. Calls for redesigning higher education curricula in order to align it with today’s local and global market demands have been voiced in a number of developing countries and major policy changes in the area of educational reform have been carried out in Latin America during recent years. In Chile “educational reform has figured prominently in the social policy agenda” Valverde (2004). Brewer, Harrigea and Mendonca (2006) proposed a “continuous improvement process framework in developing a comprehensive curriculum model’ in which each stakeholder is involved in defining curriculum objectives.
Many developing countries including Palestine face the challenge of aligning university curriculum with job openings as a strategy to minimize unemployment among college and university graduates plaguing these countries. In a keynote speech at the Biennial conference of the International council of Universities of St. Thomas Aquinas, January 26, 2011 President Aquino of the Philippines noted “the mismatch between job openings and courses offered in the universities and hinted at taking certain measures to strengthen ties between employers and higher institutions”(Official Gazette of the Philippines, 2011)
Job performance, however, is not exclusively dependent on the course contents to which a business graduate has been exposed to in his/her years of study. Competency is a product of various factors including cognitive, technical and interpersonal skills besides the proper match between personality and the type of job. But a significant number of these skills especially the technical and interpersonal ones can be learned through a variety of business and management courses. Content validity which describes the relevancy of the program contents to the actual skills needed in the market is of crucial importance in the future success of the job applicant.
Probably, the most serious weakness in the curriculum is pedagogical. There is generally an overemphasis on memorizing material and shunning innovative and “unorthodox” ideas. It is a chronic problem in the Arab educational system that engulfs both schools’ and universities’ approach to knowledge. Innovativeness has been a major factor behind the fame and success of business enterprises especially high-tech firms in the industrialized countries
15

Skyline Business Journal, Volume IX-Issue 1-2013-2014
2.2 Literature reviewAlmost all the research dealing with the academic curriculum in Palestine, and carried out by experts commissioned by the Palestinian Ministry of Education, including those of the business administration programs, focused on evaluating the feasibility of these programs and their relative academic standards vis-à-vis similar programs in a sample of international and regional universities. An independent desk study, entitled “Professional business leadership development program: needs assessment study of the local MBA programs” which was sponsored by the Welfare Association in Ramallah (January 2010), assessed the quality of the MBA programs offered in four Palestinian universities and the performance of the MBA graduates in the local market. It also sought to gauge the degree of satisfaction felt by employers towards employees carrying MBA degrees from Palestinian universities and working in their firms. The study recommended that the MBA programs in the universities under investigation should be restructured to respond to the needs of the local, regional and international markets. The study, however, was restricted to the MBA programs. The undergraduate business programs and their relevance to the market requirements were not included. A field research was conducted in Jordan for Al-Manar project at the National Center for Human Resource Development in Amman (2006) with the aim of identifying employable skills that determine the successful entrance of Jordanian university graduates in the labor market. The study revealed-among other things, that “leadership skills have the most significant correlation with graduates’ employment sector”. The researchers also found that there were significant differences in perception between employees working in the private sector and their counterparts employed in the public sector. For example, teamwork skills were rated as more useful for those working in the public sector. However, the study did not adequately address the relationship between the academic curriculum, particularly in the business faculties and labor demands.
The findings of a study which aimed at investigating the gap between required managerial skills and recruitment and selection practices adopted by large Palestinian enterprises indicated that recruitment and selection techniques applied by these organizations did not correspond to the skills required for the advertised jobs (jaabari 2010). The study, however, failed to link the sought- after skills to the nature of courses taught in the business curricula of the Palestinian universities. The match between business curriculum and market demands received much greater attention in the United States and some other countries. A number of studies were published in leading business journals during the past twenty years. Among these were Walker’s and Black’s (2000) entitled, “Reengineering the undergraduate business core curriculum: aligning business schools with business for improved performance” The authors proposed a process-centered model of undergraduate business education in line with the trend for process-managed organizations. In their view, the approach “provides a vehicle for the development of interdisciplinary faculty, encourages attention to the need for change, and provide a basis for aligning faculty and institutional rewards system”.
Another study by Finkle and Deeds (2001) under the title” Trends in the market for entrepreneurship Faculty 1989-1998” focused on the growing popularity of entrepreneurship programs in the schools of business and management during 1989-98 in the United States and the dramatic increase of entrepreneurship positions by 253 percent. The researchers noted that there was more recognition of the importance of the field in the economy.
An important research in this area was done by Divina Edralin (2010) of De Lassalle University in Manila, Philippines under the title “The Outlook of the Business Administration Courses and its Graduates in Philippines Amidst Global Challenges”. Her findings carried a very optimistic outlook for the future of business administration in the Philippines in light of the increasing market demands, labor supply of business graduates and other macro-economic factors. However, the researcher stressed the need for securing relevancy and quality of the business administration courses to make it more compatible with the existing market demands.
A revealing message from Yasuyki Nambu, the CEO of the Japanese PASONA GROUP to the shareholders of the company, a leader in Japanese employment and staffing (February 2011) highlights the consequences of the mismatch issue. Nambu writes:
There are of course many reasons why an individual is unable to find work. The most common involves a mismatch between the type and nature of work and the aspirations of the job seeker. When considering the difficulties that university students face when seeking employment, I believe there are three core areas of mismatch. The first relates to an information mismatch. The second is an education or training mismatch. The business environment has experienced volatile change. Compared with traditional skills and abilities the third mismatch revolves around individual awareness and by association commitment
Other researchers addressed a new dimension in the issue of re-designing business programs. Their concern was focused on the spiraling cases of corruption and unethical practices in today’s markets. In an article dealing with this problem, Maetz and Sharp (2004) suggested that the core business curriculum include courses on ethics and that the courses become an integral part of business academic program in business schools. Actually, this call for the inclusion of ethical training as part of the business curriculum goes back to the late eighties (Hosmer, 1988).
Research questions1. Is the business curriculum in the Palestinian universities
perceived to be relevant to the market requirements in the country?
2. Does the type of academic education provided for the students majoring in business administration including finance and accounting equip the students with the necessary analytic skills to understand the market, and perform successfully on managerial positions in business enterprises?
3. Is there a significant cause-effect relationship between
Skyline Business Journal, Volume IX-Issue 1-2013-2014
the kind of management and business education which the business majors receive in their schools and their failure to find suitable jobs in the market?
4. Are there differences in perception among respondents related to gender, years of experience, type of job and area of business specialization: accounting, finance and marketing
Research Design and MethodologyThe research comprised two stages: qualitative and quantitative. The first stage was exploratory. It aimed at gaining deeper insight into the problem. At this preliminary stage, the researcher carried out a critical review of the available secondary data including published and unpublished materials, statistics and official documents relating to the issue. Methods of collecting data included informal conversations with university professors and structured interviews with local CEOs who shared the same concern voiced by the researcher. A small focus group of Bethlehem University graduates working in different business enterprises in the West Bank was conducted with the purpose of exploring the different dimensions of the problem. In addition, the researcher carried out some content analysis of a number of textbooks which are required readings in most business schools in Palestine to see how much relevant the texts to the actual conditions in the country. These books were in the area of consumer behavior, human resources entrepreneurship and marketing.
The quantitative (conclusive) stage followed a descriptive design and employed the empirical tool of collecting field data. For this purpose a structured questionnaire was designed. The questionnaire was divided into four parts including both demographic and basic information. The target group consisted of employees in private for profit organizations and also those who are self-employed. To be included in the sample, respondents must be graduates from business faculties at local Palestinian universities after the year 2000. Employees currently working in non-profit NGOs or government must have worked for at least six months in a private-for-profit Palestinian enterprise, in order to be eligible
SamplingIn view of the absence of a credible data base covering the number, specializations and characteristics of business graduates and their distribution in the Palestinian market, it was extremely difficult to use random sampling techniques. A snowball sampling technique was adopted by the researcher to both locate and interview respondents. According to this technique, an initial group of respondents was randomly selected and were asked to identify others who belonged to the target population of interest. The process effectively resulted in reaching 131 individuals working in the West Bank. Gaza was excluded for security reasons. After reviewing the filled out questionnaires, six questionnaires were dropped for illegibility, inconsistency or incompleteness.
Figure 1- Distribution based on gender
Figure 2 Distribution based on area of specialization
Figure 3
Figure 4
Gender0%
Male
Female
Gender
Male62%
Female38%
Finance
Business administration (general)
Accounting
Marketing
MIS
Distribution based on major area ofspecialization in business
39% 37%
11% 11%
2%
Bethlehem University
Hebron University
Hebron Polytechnic
An-Najah National University
Bir-Zeit UniversityBir-Zeit University
Al-Kuds University
Al-Kuds Open University
Arab-American University
Distribution based on the University fromwhich respondents obtained their B.A in business
13%
12%
11% 21%
35%
4%2% 2%
Business enterprises
Commercial banks
Factories
Family business
Self-employed
Distribution based on type of business inwhich respondents are employed
5%8%10%
23%
54%
16
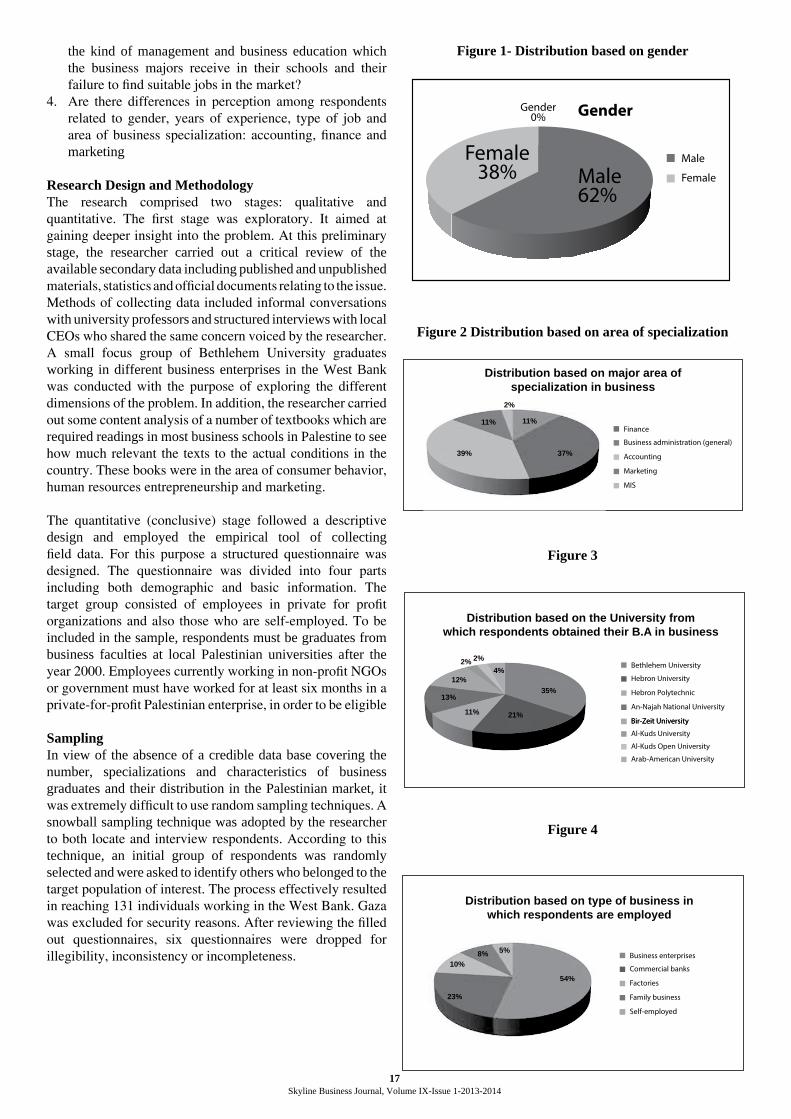
Skyline Business Journal, Volume IX-Issue 1-2013-2014
2.2 Literature reviewAlmost all the research dealing with the academic curriculum in Palestine, and carried out by experts commissioned by the Palestinian Ministry of Education, including those of the business administration programs, focused on evaluating the feasibility of these programs and their relative academic standards vis-à-vis similar programs in a sample of international and regional universities. An independent desk study, entitled “Professional business leadership development program: needs assessment study of the local MBA programs” which was sponsored by the Welfare Association in Ramallah (January 2010), assessed the quality of the MBA programs offered in four Palestinian universities and the performance of the MBA graduates in the local market. It also sought to gauge the degree of satisfaction felt by employers towards employees carrying MBA degrees from Palestinian universities and working in their firms. The study recommended that the MBA programs in the universities under investigation should be restructured to respond to the needs of the local, regional and international markets. The study, however, was restricted to the MBA programs. The undergraduate business programs and their relevance to the market requirements were not included. A field research was conducted in Jordan for Al-Manar project at the National Center for Human Resource Development in Amman (2006) with the aim of identifying employable skills that determine the successful entrance of Jordanian university graduates in the labor market. The study revealed-among other things, that “leadership skills have the most significant correlation with graduates’ employment sector”. The researchers also found that there were significant differences in perception between employees working in the private sector and their counterparts employed in the public sector. For example, teamwork skills were rated as more useful for those working in the public sector. However, the study did not adequately address the relationship between the academic curriculum, particularly in the business faculties and labor demands.
The findings of a study which aimed at investigating the gap between required managerial skills and recruitment and selection practices adopted by large Palestinian enterprises indicated that recruitment and selection techniques applied by these organizations did not correspond to the skills required for the advertised jobs (jaabari 2010). The study, however, failed to link the sought- after skills to the nature of courses taught in the business curricula of the Palestinian universities. The match between business curriculum and market demands received much greater attention in the United States and some other countries. A number of studies were published in leading business journals during the past twenty years. Among these were Walker’s and Black’s (2000) entitled, “Reengineering the undergraduate business core curriculum: aligning business schools with business for improved performance” The authors proposed a process-centered model of undergraduate business education in line with the trend for process-managed organizations. In their view, the approach “provides a vehicle for the development of interdisciplinary faculty, encourages attention to the need for change, and provide a basis for aligning faculty and institutional rewards system”.
Another study by Finkle and Deeds (2001) under the title” Trends in the market for entrepreneurship Faculty 1989-1998” focused on the growing popularity of entrepreneurship programs in the schools of business and management during 1989-98 in the United States and the dramatic increase of entrepreneurship positions by 253 percent. The researchers noted that there was more recognition of the importance of the field in the economy.
An important research in this area was done by Divina Edralin (2010) of De Lassalle University in Manila, Philippines under the title “The Outlook of the Business Administration Courses and its Graduates in Philippines Amidst Global Challenges”. Her findings carried a very optimistic outlook for the future of business administration in the Philippines in light of the increasing market demands, labor supply of business graduates and other macro-economic factors. However, the researcher stressed the need for securing relevancy and quality of the business administration courses to make it more compatible with the existing market demands.
A revealing message from Yasuyki Nambu, the CEO of the Japanese PASONA GROUP to the shareholders of the company, a leader in Japanese employment and staffing (February 2011) highlights the consequences of the mismatch issue. Nambu writes:
There are of course many reasons why an individual is unable to find work. The most common involves a mismatch between the type and nature of work and the aspirations of the job seeker. When considering the difficulties that university students face when seeking employment, I believe there are three core areas of mismatch. The first relates to an information mismatch. The second is an education or training mismatch. The business environment has experienced volatile change. Compared with traditional skills and abilities the third mismatch revolves around individual awareness and by association commitment
Other researchers addressed a new dimension in the issue of re-designing business programs. Their concern was focused on the spiraling cases of corruption and unethical practices in today’s markets. In an article dealing with this problem, Maetz and Sharp (2004) suggested that the core business curriculum include courses on ethics and that the courses become an integral part of business academic program in business schools. Actually, this call for the inclusion of ethical training as part of the business curriculum goes back to the late eighties (Hosmer, 1988).
Research questions1. Is the business curriculum in the Palestinian universities
perceived to be relevant to the market requirements in the country?
2. Does the type of academic education provided for the students majoring in business administration including finance and accounting equip the students with the necessary analytic skills to understand the market, and perform successfully on managerial positions in business enterprises?
3. Is there a significant cause-effect relationship between
Skyline Business Journal, Volume IX-Issue 1-2013-2014
the kind of management and business education which the business majors receive in their schools and their failure to find suitable jobs in the market?
4. Are there differences in perception among respondents related to gender, years of experience, type of job and area of business specialization: accounting, finance and marketing
Research Design and MethodologyThe research comprised two stages: qualitative and quantitative. The first stage was exploratory. It aimed at gaining deeper insight into the problem. At this preliminary stage, the researcher carried out a critical review of the available secondary data including published and unpublished materials, statistics and official documents relating to the issue. Methods of collecting data included informal conversations with university professors and structured interviews with local CEOs who shared the same concern voiced by the researcher. A small focus group of Bethlehem University graduates working in different business enterprises in the West Bank was conducted with the purpose of exploring the different dimensions of the problem. In addition, the researcher carried out some content analysis of a number of textbooks which are required readings in most business schools in Palestine to see how much relevant the texts to the actual conditions in the country. These books were in the area of consumer behavior, human resources entrepreneurship and marketing.
The quantitative (conclusive) stage followed a descriptive design and employed the empirical tool of collecting field data. For this purpose a structured questionnaire was designed. The questionnaire was divided into four parts including both demographic and basic information. The target group consisted of employees in private for profit organizations and also those who are self-employed. To be included in the sample, respondents must be graduates from business faculties at local Palestinian universities after the year 2000. Employees currently working in non-profit NGOs or government must have worked for at least six months in a private-for-profit Palestinian enterprise, in order to be eligible
SamplingIn view of the absence of a credible data base covering the number, specializations and characteristics of business graduates and their distribution in the Palestinian market, it was extremely difficult to use random sampling techniques. A snowball sampling technique was adopted by the researcher to both locate and interview respondents. According to this technique, an initial group of respondents was randomly selected and were asked to identify others who belonged to the target population of interest. The process effectively resulted in reaching 131 individuals working in the West Bank. Gaza was excluded for security reasons. After reviewing the filled out questionnaires, six questionnaires were dropped for illegibility, inconsistency or incompleteness.
Figure 1- Distribution based on gender
Figure 2 Distribution based on area of specialization
Figure 3
Figure 4
Gender0%
Male
Female
Gender
Male62%
Female38%
Finance
Business administration (general)
Accounting
Marketing
MIS
Distribution based on major area ofspecialization in business
39% 37%
11% 11%
2%
Bethlehem University
Hebron University
Hebron Polytechnic
An-Najah National University
Bir-Zeit UniversityBir-Zeit University
Al-Kuds University
Al-Kuds Open University
Arab-American University
Distribution based on the University fromwhich respondents obtained their B.A in business
13%
12%
11% 21%
35%
4%2% 2%
Business enterprises
Commercial banks
Factories
Family business
Self-employed
Distribution based on type of business inwhich respondents are employed
5%8%10%
23%
54%
Gender0%
Male
Female
Gender
Male62%
Female38%
Finance
Business administration (general)
Accounting
Marketing
MIS
Distribution based on major area ofspecialization in business
39% 37%
11% 11%
2%
Bethlehem University
Hebron University
Hebron Polytechnic
An-Najah National University
Bir-Zeit UniversityBir-Zeit University
Al-Kuds University
Al-Kuds Open University
Arab-American University
Distribution based on the University fromwhich respondents obtained their B.A in business
13%
12%
11% 21%
35%
4%2% 2%
Business enterprises
Commercial banks
Factories
Family business
Self-employed
Distribution based on type of business inwhich respondents are employed
5%8%10%
23%
54%
Gender0%
Male
Female
Gender
Male62%
Female38%
Finance
Business administration (general)
Accounting
Marketing
MIS
Distribution based on major area ofspecialization in business
39% 37%
11% 11%
2%
Bethlehem University
Hebron University
Hebron Polytechnic
An-Najah National University
Bir-Zeit UniversityBir-Zeit University
Al-Kuds University
Al-Kuds Open University
Arab-American University
Distribution based on the University fromwhich respondents obtained their B.A in business
13%
12%
11% 21%
35%
4%2% 2%
Business enterprises
Commercial banks
Factories
Family business
Self-employed
Distribution based on type of business inwhich respondents are employed
5%8%10%
23%
54%
Gender0%
Male
Female
Gender
Male62%
Female38%
Finance
Business administration (general)
Accounting
Marketing
MIS
Distribution based on major area ofspecialization in business
39% 37%
11% 11%
2%
Bethlehem University
Hebron University
Hebron Polytechnic
An-Najah National University
Bir-Zeit UniversityBir-Zeit University
Al-Kuds University
Al-Kuds Open University
Arab-American University
Distribution based on the University fromwhich respondents obtained their B.A in business
13%
12%
11% 21%
35%
4%2% 2%
Business enterprises
Commercial banks
Factories
Family business
Self-employed
Distribution based on type of business inwhich respondents are employed
5%8%10%
23%
54%
17

Skyline Business Journal, Volume IX-Issue 1-2013-2014
Research findingsQualitative resultsA. Focus groupDiscussions held with members of a focus group comprising business graduates working in the private sector confirmed the initial assumption of the researcher, i.e that a job-ability misfit exists, but in their assessment the extent of the gap between the curriculum taught at business schools and the labor demands is influenced by the type of job. For example, the gap is not significant in accounting, where, according to their opinions, the curriculum provides an acceptable background for performing the basic tasks of the job. However, members of the group offered the following suggestions: 1. Other useful courses that must be added to the curriculum
includes office management, proposal writing and project management
2. There should be a stronger linkage between business and IT. Students should be exposed to computerized programs and software necessary in the field of finance.
3. More psychology courses should be added especially in the area of consumer and organizational behavior
4. In light of what they perceived as discrimination against women laborers in the market, university female students should be given some training aimed at empowering them and giving them more self confidence to be able to perform more successfully in the local market.
B. Interviews with business managersThe interview part of the exploratory stage aimed at identifying both the actual demands of the Palestinian labor market and performance of business graduates on the jobs. There were five interviewees holding managerial positions in five private organizations. One is the chief of operations at the Arab Bank-Bethlehem branch. Three were factory managers, one of whom is the HR director of the factory and the fifth is a manager of an insurance company branch in the Hebron area. The five organizations employed a number of business graduates in different jobs.
Although the perspectives of the interviewees were not identical, there was an agreement among the five interviewees that a significant mismatch existed between what the graduates had learned in business schools and actual job requirements. However, almost all of them were not deeply troubled by the mismatch since, in their view, the situation could be remedied through training and coaching. But most interviewees expressed the view that the lack of compatibility, to a certain extent, negatively impacts, performance on the job. There were differences among interviewees regarding the courses that graduates should have taken before joining the labor market. The differences stemmed from the nature of the work in which the business enterprise was involved. For example, the bank manager stressed the importance of commercial legal training and bank management: the two courses are assigned peripheral status in the business curriculum. Three company managers, on the other hand, regarded interpersonal and communication skills as being critical for achieving success on the job. English language proficiency figured prominently in the list of requirements which business graduates need in order to compete successfully in the local market. More practical training was also demanded by one interviewee.
To summarize, the courses that need to be either added or emphasized in the curriculum are behavioral courses and English language in addition to providing more time for practical training which in the view of the majority are not given adequate time in the business schools. All interviewees, however, stressed the need for building bridges between the private sector and business schools in the local universities.A careful assessment of the responses of both the focus groups and company managers reveals that the two groups agree on the following points:1. There is a mismatch between the business curriculum
adopted in local Palestinian universities and market demands
2. There is a need to provide more courses in organizational and consumer behavior necessary for acquiring interpersonal and communications skills
3. Stronger relations should be built between the private sector and business schools in local Palestinian universities.
C. Content analysis of textbook materialA critical analysis of textbook material found in core courses in management, human resources, entrepreneurship, marketing, advertising, selling, strategic management, organizational and consumer behavior taught at the undergraduate level in business schools in Palestinian universities reveals that the contents are heavily contextual. They address issues and concerns that are more relevant to post-industrial and service economies with a solid corporate culture and flourishing small business sector. The textbooks target readers who are supposedly market-driven consumers and whose buying behavior is influenced by capitalist values. Notwithstanding the impact of increasing globalization on consumer behavior in developing countries, local cultural values and attitudes are still strong. The area in which the sharp contrast in value orientation appears is in the field of consumer behavior. Michael Solomon’s textbook “Consumer Behavior (2009),” a required text in both Bethlehem and Bir-Zeit universities projects lifestyles and patterns of consumption that are almost exclusively Western. Lifestyle is not defined by tradition or class as in the case of many developing societies but rather by the products and services a person buys. In chapter six, under the title: “Personality and Lifestyle” one finds the following sentence (page 255) “lifestyle defines a pattern of consumption that reflects a person’s choices on how to spend her time and money”. In the same page the author defines a person’s social status as follows “ In a modern consumer society, however, people are freerer to select the set of products, services, and activities that define themselves and, in turn, create a social identity they communicate to others”.Courses offered on entrepreneurship in business schools are potentially the most useful in the curriculum in view of the fact that the fragile economy of the Palestinian Territories is entirely dependent on small and medium enterprises. However, the literature as exists in textbooks on the topic, mirror the socio-economic conditions that prevail in Western industrialized countries especially the United States. Here again the contents in textbooks are highly contextual. The classic personality of the entrepreneur as an individualistic, achievement-oriented character (Lambing & Kuehl 2003) is rarely found in the Palestinian context. Nor does the material
18

Skyline Business Journal, Volume IX-Issue 1-2013-2014
on entrepreneurship address the numerous constraints encountered by the Palestinian entrepreneur and small business owner. The major challenge of the Palestinian entrepreneur is not opportunity recognition but rather the scarcity of start-up funds and lack of government support. The kind of public-private partnership essential for the development of a viable small business sector unfortunately does not exist in the Palestinian territories. Furthermore, the definition of small and medium enterprises in terms of the number of employees and the size of capital is different in the United States. Almost 92 percent of enterprises operating in Palestine are micro-businesses employing one or two workers each. Most of these enterprises are family owned. The problems that such very small businesses encounter are not sufficiently addressed in textbooks on entrepreneurship that form an integral part of the business curriculum in Palestinian universities.
The other field in which content validity is missing is the human resources management which is a required core course in all business administration departments in Palestine. In addition to the fact that few business organizations have functional human resources units, the contents of the HRM textbooks incorporate concepts, theories and practices that reflect the experiences of large corporations in the areas of recruitment, selection, training, employee performance and development. The concepts of job enlargement and job enrichment, competency-based job analysis as well as the issues of single parents recruitment and substance abuse in the workplace (Dessler (2011)are not relevant issues in the Palestinian context. This classic textbook contains material on very advanced and sophisticated recruitment and selection techniques including personality tests, management assessment centers and vestibule training which reflect the state of the art of human resources management. However, at the practical level, they offer little value for the undergraduate student in terms of their applicability in Palestinian business organizations. There is also a significant discrepancy between labor laws covering the private sector in Palestine and the labor laws in the United States and European countries. There are differences in matters of employment, compensation, equal opportunities, discipline, labor relations and others. In reality, with few exceptions, human resources management in the Palestinian private sector is still in the “archival’ stage of development which is similar to the status of personnel administration in the United States during the forties and fifties in the last century. Major functions of the human resources department are incorporated into the role of the chief executive officer of the firm.
Quantitative analysisValidity of the Study Tool The structured questionnaire was validated through review by a group of referees and expert arbitrators, who provided some comments on the tool. These comments were incorporated into the final version of the questionnaire. On the other hand, the validity was also measured statistically by factorial analysis, in order to examine the internal consistency of the questionnaire items. Findings indicate that all the study items combined measured the perception among business graduates working in the Palestinian for-profit sector regarding compatibility between business curriculum
and market demands in light of the theoretical framework which the tool of study is based upon.
Reliability of the Study Tool To test the reliability of the questionnaire, it was tested by calculating the internal consistency of the questionnaire items using the Cronbach Alpha Formula. Findings indicated that the questionnaire with its different dimensions was reliable (0.63).
Following data collection, data was reviewed in preparation for processing it into the computer; Lickert scale was used i.e. verbal answers were transformed into numbers with the following categories: strongly agree 5, agree 4, neutral 3, disagree 2, strongly disagree 1. In order to carry out the required statistical procedures for the data percentages, means, standard deviations and graphics were used. In addition, the following statistical tests were employed. t. test, One way analysis of variance, Cronbach Alpha, Factor Analysis, and figures, using statistical package for social sciences (SPSS). The findings from the representative sample of employees tend to substantiate the views of both focus group members and business managers interviewed. Regarding the first hypothesis, sample members perceive a mismatch between the curriculum and market demands. However, their perception of the mismatch is more moderate than that of the interviewees as shown in the table below
Table (l) Perception among respondents regarding compatibility between business curriculum and
market demands
15
Table (l) Perception among respondents regarding compatibility between business curriculum and market demands
Variable
N Mean Standard Deviation
Perception
125
2.92
0.29
With respect to the second hypothesis which assumes that the specialized education provided by the business departments does not adequately provide the graduate with the necessary skills required in the market. The answer to two critical questions in this regard confirm the hypothesis. In response to the question of whether serious technical deficiencies with negative practical implications for performance, exist in the business curriculum, the answer was affirmative with a mean of (4.16) and a standard deviation of (0.689). Additionally, there appears to be a strong perception among sample members that the curriculum used in local business faculties reflect job demands in the markets of Western Industrialized countries more than those of developing countries; (mean 3.86) and a standard deviation of (0.992)
The third hypothesis stating that there are no significant differences in perception among respondents regarding compatibility between business curriculum and market demands related to gender, university, type of job and area of specialization was confirmed,
19

Skyline Business Journal, Volume IX-Issue 1-2013-2014
Quantitative analysis of results reveals other interesting findings. There is nearly a consensus among responds that stronger relations should be built between private business and faculties of business administration in Palestine: mean (4.21) and standard deviation (0.699). There is also a strong support for inviting business leaders to participate in designing the curriculum with the academic staff of the business faculties (mean 4.14) and standard deviation (0.790).
Discussion and Conclusions 1. The findings indicate a near consensus among business
graduates working in Palestinian for-profit enterprises (irrespective of their specific areas of specialization) that there is a mismatch between the curriculum adopted in the business faculties in Palestinian universities and the specific demands of the local job market. This perception has been substantiated by the responses of a sample of business owners and managers who were interviewed for this purpose.
2. The majority of respondents believe that they were not adequately trained in their business faculties to perform satisfactorily in the labor market
3. There were no significant differences in the perception of sample members regarding lack of compatibility between the business curriculum and job demands related to gender, area of specialization, type of job or the university they graduated from
4. There is a problem of content-validity in the core courses taught in the business faculties. The textbook material in a number of courses are contextual reflecting the needs, demands and priorities of the markets in Western industrialized societies especially the United States
5. There is a need for more synchronization between the business curriculum in the Palestinian universities and the local job market
6. There is a pressing need for more training and practical experience for students majoring in the field of business administration in all Palestinian universities.
Research Limitations and suggestions for further researchThe research has certain limitations that should be understood within the political and economic context of the Palestinian Territories which are under Israeli occupation. To conduct a comprehensive field study under the present circumstances has never been an easy task. Furthermore, the absence of a solid data base on the number and characteristics of university graduates has made the choice of a random sample extremely difficult. Therefore, the researcher had to resort to convenience sampling in the form of a snow ball technique. Additionally, in light of the security issue and roadblocks, the researcher was able to reach only a limited number of business managers for interviews and comments. These managers were concentrated in two areas, Bethlehem and Hebron. Nevertheless, the researcher believes that the results of the study can be a good start for further research on this important issue. Furthermore, a comprehensive review of the business curriculum in Palestinian universities should be conducted by the academic staff and experts with the aim of identifying deficiencies and irrelevancies regarding the material taught to business majors in all areas of specialization. This should be coupled with a field study of the Palestinian labor market
must be launched to determine the needs of the market in terms of the skills required to perform satisfactorily in the workplace. Promoting more cooperation between academia and the local business sector in Palestine in the form of exchange of opinion and advice regarding the needs of the local market. Joints projects between the two sectors should be encouraged.
A re-designed curriculum modelThe suggested model represents a two-pronged approach comprising two categories of programs. The first category includes core or ‘rock bottom’ courses which constitute the major principles of the discipline that are taught in other international business schools around the world. The second category includes specific courses that are tailored to the needs of the local and regional market. Identifying these specific needs should depend on a comprehensive survey conducted by the universities in cooperation with representatives from the private for-profit sector. The emerging trends in the global market should also be taken into consideration when designing the specific courses to prepare graduates face the challenges of a highly competitive global markets. The new model should be characterized by a greater emphasis on entrepreneurial economics and the incorporation of information technology into the syllabus.
References Kenton B. Walker and Ervin L Black (2000), “Re-engineering the undergraduate business core curriculum: aligning business schools with business for improved performance, Business Process Management Journal, Vol 6, issue:3, pp 194-213
Todd A Finkle and David Deeds (2001), “Trends in the market for entrepreneurship faculty, 1989-1998, Journal of Business Venturing, Vol 16, Issue 6, November 2001, PP 613-630
La-Rue Tone Hosmer (1988), “Adding ethics to the business curriculum”, Business Horizons , Vol 31, Issue 4, July August 1988, PP 9-15
Mark Whitehouse (2010), “Job-openings are not what they used to be”, Outlook, Oct 11, 2010
De-one Zell, (2001), “The market-driven business school: has the pendulum swung too far?, Journal of management Inquiry”, December 2001, Vol.10, No 4, PP 324-338
Mazaya (2010), “professional business leadership development program needs assessment study of the local MBA programs” Welfare Association, Ramallah, Palestine, January 2010
Soren Kaj Anderson (2010), “Responses to growing unemployment and mismatch between skills and job openings in EU member states”, Employment Relations Research Center (FAOS), Department of Sociology, University of Copenhagen.
Official Gazette of the Philippines, www.gov.ph/2011/.../the-presidents-day-wednesday-january-26-2011
20

Skyline Business Journal, Volume IX-Issue 1-2013-2014
Yasuyuki Nambu, A message from GROUP CEO to our shareholders (February2011)www.pasonagroup.co.jp/english/ir/ir_message_e.html
Mark Baetz and David J Sharp(2004)” Integrating ethics content into the core business curriculum: Do core Teaching material do the job, Journal of Business Ethics Vol 51, No 1, PP 53-62
Peggy A. Lambing and Charles R. Kuehl (2003), Entrepreneurship, Prentice hall, New Jersey, Third edition
Michael R. Solomon (2009),Consumer Behavior, Buying, Having and Being, Pearson, Prentice Hall
Gary Dessler (2011), Human Resource Management, Pearson, Prentice Hall, Twelfth edition, Eighth edition
Mohammad Jaabari (2011), “Discrepancy between required managerial skills and recruitment policies in Palestine”, working paper delivered at the Second Palestinian Conference on Human Resources” 23-23 May, 2011, Al-ahliyah University College, Bethlehem, Palestine. Palestinian Central Bureau of Statistics(PCBS) 2010, Press release on the results of the labor force survey (October-December, 2010
Palestinian Central Bureau of Statistics (PCBS), 2011, Press release on the relationship between academic specializations and labor market, July 10, 2011
Palestinian Central Bureau of Statistics (PCBS), 2007, Census of economic enterprises. Nader Mryyan, H.Omari and Robert Palmer (2006), “From School to Career” Jordanian Graduates, Al-Manar, Amman- Jordan
Jurše, M., & Tominc, P. (2008). Professional competences of graduates as a labour market mechanism For aligning business school curriculum reform with the Bologna Declaration principles. Management: Journal of Contemporary Management Issues, 13(1), 17-36
Valverde, G. A. (2004). Curriculum convergence in Chile: The global and local context of reforms in curriculum policy. Comparative Education Review, 48(2), 174-201
Brewer, Jeffrey, Alka Harriger, and John Mendonca. “Beyond the model: Building an effective and dynamic IT curriculum.” Journal of Information Technology Education 5 (2006): 441-458
Dr. Usamah ShahwanBethlehem University
21

Skyline Business Journal, Volume IX-Issue 1-2013-2014
THE ROLE OF BLOGS AS EXPAT CONSUMERS SOURCE OF INFORMATION: AN EXPLORATORY STUDY
Shivakumar Krishnamurti, Ruchi Agarwal
Abstract:
The study examines the role of blogs as a source of information to expat consumers of products and services. A pre-designed questionnaire was used to collect the primary data from the respondents (experiences). Data were collected from sixty two respondents residing in and around the Emirates of Sharjah and Dubai of the United Arab Emirates. The collected data was analyzed with the help of statistical tools such as averages, percentages, factor analysis and Students t-test and structural equation model. Objectives of the study are: to know the reasons why expat consumers of products and services are motivated to use blogs as a source of information, to know whether the expat consumers of products and services share their opinions and experiences with other bloggers and to know the respondents’ future intentions towards blogging. The study revealed the following: The majority of respondents have not only the motivation to blog, but also to continue blogging because they use blogs: as a platform to express their thoughts on the views ventilated by fellow bloggers, to make enquiries about products and services in which they are interested, help them to share information on medical issues and are keen to motivate others to blog.
Keywords: Expat consumer, blog, blogging, information, products, services
IntroductionMarketing and the marketing communications mix are changing. New insights, new tools, new opportunities, and new challenges have emerged since the dawn of this century. Firms need to move their focus beyond the ‘one way’ tell medium of traditional broadcasting. Moving from ‘tell campaigns’ to ‘listening campaigns’ requires constant customer dialogue nurtured and integrated across many media.
Consumers have not only always educated each other more about products and services, but have also believed and trusted each other’s opinions more than any communication campaign. Marketers have since long acknowledged the importance of Word of Mouth, and now this is being facilitated by technology using online modes.
The consumer group: ‘The New Online Generation’ who likes technology, who gets the required information from online sources, has sent a clear message to the marketing community and the proponents of traditional mainstream media. Marketers now realize that online medium has become indispensable and can no longer be treated as ‘the other medium’ supplementing the traditional media. Firms need to use their experience with online technologies and tools to reinvent the whole corporate marketing function. The accelerated pace of evolution of Internet and progression of Consumer Generated Media, has resulted in the increased usage of blogs as one of the trusted sources of information.
Blogs are now acquiring the status of a principal communications channel for companies to link with their customers, a powerful tool that companies cannot afford to take a hands-off attitude towards them. A blog is a Web page operated by millions of ordinary people who have become content creators. It is a corporate or personal online journal with reflections, expression of emotions, comments and opinions, presentation of ideas and often hyperlinks that are provided by the writers. They display in chronological order the postings by individuals with links to comment on specific postings. Blogging is a commitment; it takes a lot of
time. Some blogs are confined to a fixed audience; say the employees and managers of a single company. Other times, blogs are public, available for reading by anyone.
The recent popularity of blogging brings us to some interesting questions. What makes people to blog? In other words, what motivates them to adopt this new tool? What impact does it have on marketing communications for products and services? Do the bloggers have an intention to continue blogging in the future?
Literature ReviewA few studies have been undertaken to understand the experiences of consumers using blogs as a source of information and an attempt has been made to review the studies undertaken by different scholars in the following pages.
Niederhoffer K., Mooth R., Wiesenfeld D., and Gordon J.(2007) conducted a study to understand the role of Consumer Generated Media in CPG(Consumer Packaged Goods) new product launches, to help marketers capitalise on it for communication planning and launch management purposes. They found that talking about something that is new, different and relevant to others brings an emotional and social benefit to the creator of CGM. The findings of their research suggest that buzz is something CPG marketers should consider in developing new product communication plans. Given its rapid proliferation, even marketers who work in traditionally low buzz categories should pay attention to what consumers are saying.
Chung Yuan S. H. L., Chung Yuan H.L.L, and Chung Yuan Y.T.Z. (2007) conducted a research study to examine the relationship between the motivations of bloggers and their intention and conducts of blogging. Most bloggers perceived the attractiveness or importance of intrinsic blogging rewards higher than those extrinsic rewards. The findings indicate that bloggers with higher total motivation scores on rewards have higher levels of blogging intention.
22
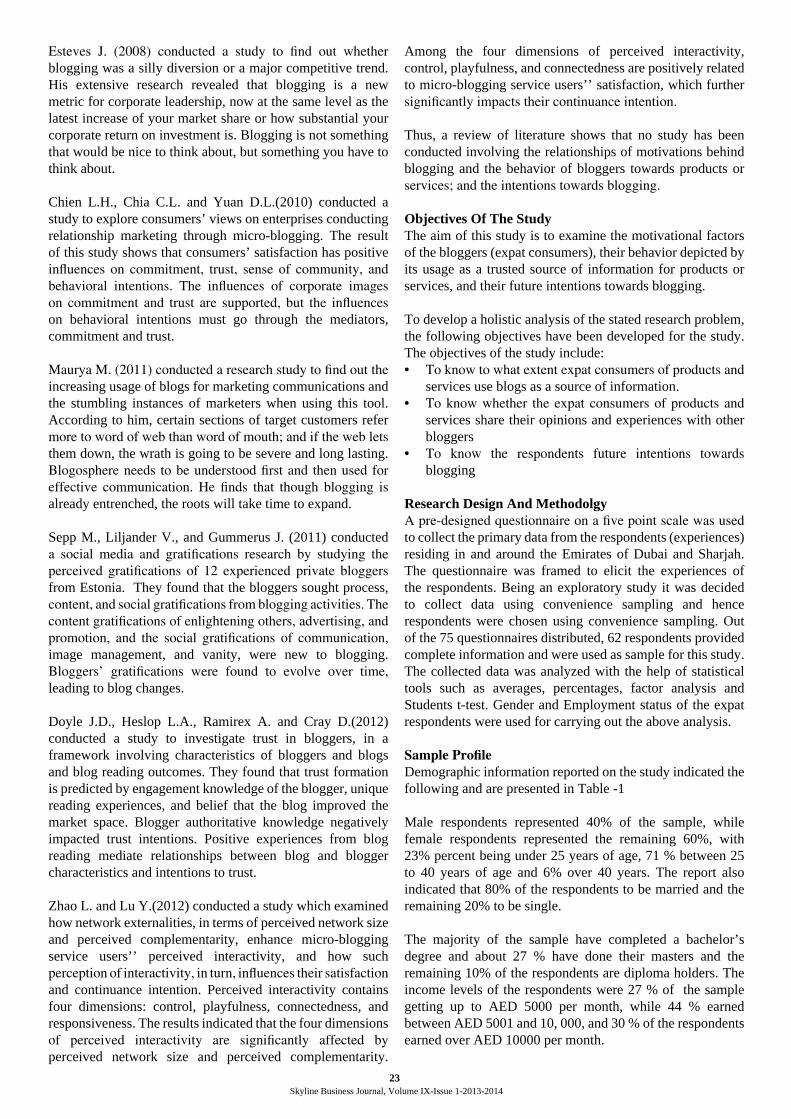
Skyline Business Journal, Volume IX-Issue 1-2013-2014
Esteves J. (2008) conducted a study to find out whether blogging was a silly diversion or a major competitive trend. His extensive research revealed that blogging is a new metric for corporate leadership, now at the same level as the latest increase of your market share or how substantial your corporate return on investment is. Blogging is not something that would be nice to think about, but something you have to think about.
Chien L.H., Chia C.L. and Yuan D.L.(2010) conducted a study to explore consumers’ views on enterprises conducting relationship marketing through micro-blogging. The result of this study shows that consumers’ satisfaction has positive influences on commitment, trust, sense of community, and behavioral intentions. The influences of corporate images on commitment and trust are supported, but the influences on behavioral intentions must go through the mediators, commitment and trust.
Maurya M. (2011) conducted a research study to find out the increasing usage of blogs for marketing communications and the stumbling instances of marketers when using this tool. According to him, certain sections of target customers refer more to word of web than word of mouth; and if the web lets them down, the wrath is going to be severe and long lasting. Blogosphere needs to be understood first and then used for effective communication. He finds that though blogging is already entrenched, the roots will take time to expand.
Sepp M., Liljander V., and Gummerus J. (2011) conducted a social media and gratifications research by studying the perceived gratifications of 12 experienced private bloggers from Estonia. They found that the bloggers sought process, content, and social gratifications from blogging activities. The content gratifications of enlightening others, advertising, and promotion, and the social gratifications of communication, image management, and vanity, were new to blogging. Bloggers’ gratifications were found to evolve over time, leading to blog changes.
Doyle J.D., Heslop L.A., Ramirex A. and Cray D.(2012) conducted a study to investigate trust in bloggers, in a framework involving characteristics of bloggers and blogs and blog reading outcomes. They found that trust formation is predicted by engagement knowledge of the blogger, unique reading experiences, and belief that the blog improved the market space. Blogger authoritative knowledge negatively impacted trust intentions. Positive experiences from blog reading mediate relationships between blog and blogger characteristics and intentions to trust.
Zhao L. and Lu Y.(2012) conducted a study which examined how network externalities, in terms of perceived network size and perceived complementarity, enhance micro-blogging service users’’ perceived interactivity, and how such perception of interactivity, in turn, influences their satisfaction and continuance intention. Perceived interactivity contains four dimensions: control, playfulness, connectedness, and responsiveness. The results indicated that the four dimensions of perceived interactivity are significantly affected by perceived network size and perceived complementarity.
Among the four dimensions of perceived interactivity, control, playfulness, and connectedness are positively related to micro-blogging service users’’ satisfaction, which further significantly impacts their continuance intention.
Thus, a review of literature shows that no study has been conducted involving the relationships of motivations behind blogging and the behavior of bloggers towards products or services; and the intentions towards blogging.
Objectives Of The StudyThe aim of this study is to examine the motivational factors of the bloggers (expat consumers), their behavior depicted by its usage as a trusted source of information for products or services, and their future intentions towards blogging.
To develop a holistic analysis of the stated research problem, the following objectives have been developed for the study. The objectives of the study include:• To know to what extent expat consumers of products and
services use blogs as a source of information. • To know whether the expat consumers of products and
services share their opinions and experiences with other bloggers
• To know the respondents future intentions towards blogging
Research Design And MethodolgyA pre-designed questionnaire on a five point scale was used to collect the primary data from the respondents (experiences) residing in and around the Emirates of Dubai and Sharjah. The questionnaire was framed to elicit the experiences of the respondents. Being an exploratory study it was decided to collect data using convenience sampling and hence respondents were chosen using convenience sampling. Out of the 75 questionnaires distributed, 62 respondents provided complete information and were used as sample for this study. The collected data was analyzed with the help of statistical tools such as averages, percentages, factor analysis and Students t-test. Gender and Employment status of the expat respondents were used for carrying out the above analysis.
Sample ProfileDemographic information reported on the study indicated the following and are presented in Table -1
Male respondents represented 40% of the sample, while female respondents represented the remaining 60%, with 23% percent being under 25 years of age, 71 % between 25 to 40 years of age and 6% over 40 years. The report also indicated that 80% of the respondents to be married and the remaining 20% to be single.
The majority of the sample have completed a bachelor’s degree and about 27 % have done their masters and the remaining 10% of the respondents are diploma holders. The income levels of the respondents were 27 % of the sample getting up to AED 5000 per month, while 44 % earned between AED 5001 and 10, 000, and 30 % of the respondents earned over AED 10000 per month.
23

Skyline Business Journal, Volume IX-Issue 1-2013-2014
Table – 1 Sample Profile S. No.
Demographic Characteristics Percentage
Age Group 1. Age- up to 25 22.58% Age- 26-40 70.96% Age- 41-50 6.45% Gender 2. Male 40.32% Female 59.67% Marital Status 3. Married 80.65% Single 19.35% Education 4. Diploma 9.67% Degree 59.67% Masters 27.41% Income 5 Less than AED 5000 26 % AED 5001-10000 44 % Above AED 10001- 15000 30 % Connection to social networks 6. Less connected 17.74% Moderately connected 51.61% Highly connected 30.65% Frequency of blogging 7 once a week 58% once a fortnight 24% once a month 18% Time spent on blogging 8 One hour 74% Two hours 14% More than two hours 10% Blogging habits of Respondents reported on the study indicated the following: Majority of the respondents appear to be moderately connected to social networks: Fifty eight percent of the respondents‟ blog at least once a week: About three-fourths of the surveyed respondents indicated that they spend an hour blogging during each session. RESULTS OF FACTOR ANALYSIS To identify and analyze the role of blogs as expat consumers‟ source of information 25 variables were identified for this study at the time of initial finalization of the questionnaire. In order to extract the various factors, that indicated the motivational factors of the bloggers, the bloggers behavior depicted by its usage as a trusted source of information for products or services, and the intention of continuing to blog, a Principal Component analysis was applied on all the 25 statements included in the interval scale. Retaining only such of those factors which had Eigen values greater than one (as suggested by Kaiser), we can infer that in total five factors have emerged. These five factors put together have explained 83.944 % of total variance. The results are presented in Table 2. Factor Dimensions Only such of those variables that had loadings > 0.50 have been included in the process of extracting individual factors from the analytical results. The results are presented in table 2. Thus, variables A to F constituted factor I. A close look at all the variables in the Factor I impelled the researchers to identify a common name. The factor was then conceptualized as
“Motivation to blog - Related Factor”. Variables G to N constituted factor II. A close look at the items in Factor II guided the researcher to conceptualize this factor as Search for Information -Related Factor. In a similar way, variables O to R formed factor III. This was grouped under the heading “Sharing products information -Related Factor” Factor IV is related to “Sharing service information - Related Factor” and comprised variables S to V. Finally, variables W, X and Y were all grouped under the heading “Interest to continue blogging and motivate others to blog - Related Factor TABLE 2: PRINCIPAL COMPONENT ANALYSIS FOR THE VARIABLES
Factor
Initial Eigen values
Total % of Variance Cumulative %
A 15.650 62.601 B 1.799 7.195 C 1.406 5.625 D 1.129 4.516 E 1.002 4.006 F .586 2.342 86.287 G .522 2.088 88.374 H .487 1.947 90.322 I .400 1.599 91.921 J .338 1.353 93.274 K .289 1.155 94.430 L .244 .976 95.406 M .227 .909 96.315 N .205 .821 97.135 O .137 .549 97.685 P .129 .517 98.202 Q .108 .434 98.635 R .086 .342 98.978 S .076 .303 99.281 T .056 .225 99.506 U .044 .176 99.682 V .037 .149 99.832 W .017 .068 99.899 X .013 .053 99.952 Y .012 .048 100.000 Extraction Method: Principal Component Analysis.
The major outcomes of the factor analysis are presented below: Receive peoples‟ comment on what the respondents post (Factor loading 0.893), Willing to comment on what other bloggers say about products (Factor loading 0.872) and Willingness to receive comments on what the respondents post about services (Factor loading 0.854) appear to be the primary reasons which motivate the respondents to blog: Convenience of blogs to search for information about products (Factor loading 0.941) , and services (Factor loading 0.888), seem to be the primary reasons for the surveyed respondents to use blogs as a source of information before they buy products or services. By Blogging respondents are able to share information about useful personal products (Factor loading 0.847), ready to cook mix products (Factor loading 0.820) and health products (Factor loading 0.819). It is also by blogging respondents share information on the symptoms of a disease/ disorder that may be experienced by someone (Factor loading 0.843), and information on how elderly people get good results from going to Health Club (Factor loading 0.835). Recommend others to join blogging (Factor loading 0.883), keen to spend more time blogging in the future (Factor loading 0.877) and intend to continue blogging (Factor
Table – 1 Sample Profile
Blogging habits of Respondents reported on the study indicated the following:The majority of the respondents appear to be moderately connected to social networks: Fifty eight percent of the respondents’ blog at least once a week: About three-fourths of the surveyed respondents indicated that they spend an hour blogging during each session.
Results of Factor AnalysisTo identify and analyze the role of blogs as expat consumers’ source of information 25 variables were identified for this study at the time of initial finalization of the questionnaire.
In order to extract the various factors that indicated the motivational factors of the bloggers, the bloggers behavior depicted by its usage as a trusted source of information for products or services, and the intention of continuing to blog, a Principal Component analysis was applied on all the 25 statements included in the interval scale. Retaining only such of those factors which had Eigen values greater than one (as suggested by Kaiser), we can infer that in total five factors have emerged. These five factors put together have explained 83.944 % of total variance. The results are presented in Table2
2. Factor DimensionsOnly such of those variables that had loadings > 0.50 have been included in the process of extracting individual factors from the analytical results. The results are presented in table 2. Thus, variables A to F constituted factor I. A close look at all the variables in the Factor I impelled the researchers to identify a common name. The factor was then conceptualized as “Motivation to blog - Related Factor”. Variables G to N constituted factor II. A close look at the items in Factor II guided the researcher to conceptualize this factor as Search for Information -Related Factor. In a similar way, variables O to R formed factor III. This was grouped under the heading “Sharing products information -Related Factor” Factor IV is related to “Sharing service information - Related Factor” and comprised variables S to V. Finally, variables W, X and Y were all grouped under the heading “Interest to continue blogging and motivate others to blog - Related Factor
Table 2: Principal Component Analysis for the Variables
Extraction Method: Principal Component Analysis.
The major outcomes of the factor analysis are presented below: Receive peoples’ comment on what the respondents post (Factor loading 0.893), Willing to comment on what other bloggers say about products (Factor loading 0.872) and Willingness to receive comments on what the respondents post about services (Factor loading 0.854) appear to be the primary reasons which motivate the respondents to blog: Convenience of blogs to search for information about products (Factor loading 0.941) , and services (Factor loading 0.888), seem to be the primary reasons for the surveyed
24
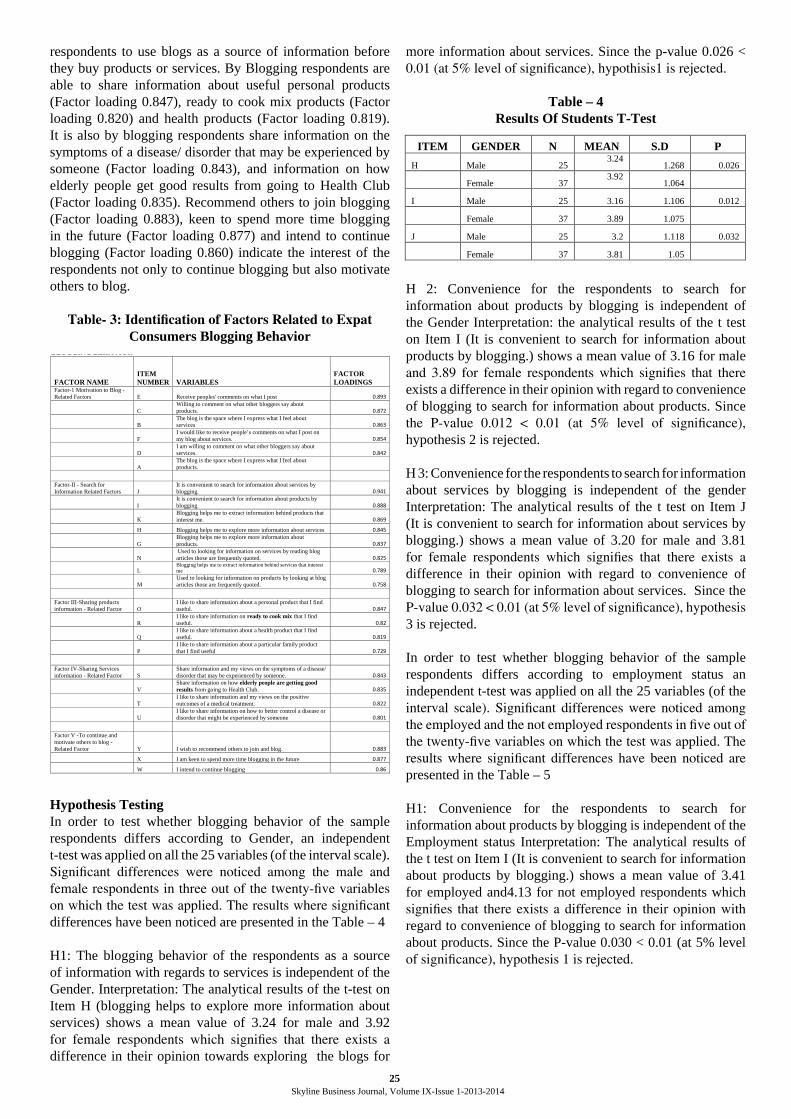
Skyline Business Journal, Volume IX-Issue 1-2013-2014
respondents to use blogs as a source of information before they buy products or services. By Blogging respondents are able to share information about useful personal products (Factor loading 0.847), ready to cook mix products (Factor loading 0.820) and health products (Factor loading 0.819). It is also by blogging respondents share information on the symptoms of a disease/ disorder that may be experienced by someone (Factor loading 0.843), and information on how elderly people get good results from going to Health Club (Factor loading 0.835). Recommend others to join blogging (Factor loading 0.883), keen to spend more time blogging in the future (Factor loading 0.877) and intend to continue blogging (Factor loading 0.860) indicate the interest of the respondents not only to continue blogging but also motivate others to blog.
Table- 3: Identification of Factors Related to Expat Consumers Blogging Behavior
loading 0.860) indicate the interest of the respondents not only to continue blogging but also motivate others to blog. TABLE- 3: IDENTIFICATION OF FACTORS RELATED TO EXPAT CONSUMERS BLOGGING BEHAVIOR
FACTOR NAME ITEM NUMBER VARIABLES
FACTOR LOADINGS
Factor-1 Motivation to Blog - Related Factors E Receive peoples' comments on what I post 0.893
C Willing to comment on what other bloggers say about products. 0.872
B The blog is the space where I express what I feel about services 0.863
F I would like to receive people‟s comments on what I post on my blog about services. 0.854
D I am willing to comment on what other bloggers say about services. 0.842
A The blog is the space where I express what I feel about products.
Factor-II - Search for Information Related Factors J
It is convenient to search for information about services by blogging. 0.941
I It is convenient to search for information about products by blogging 0.888
K Blogging helps me to extract information behind products that interest me. 0.869
H Blogging helps me to explore more information about services 0.845
G Blogging helps me to explore more information about products. 0.837
N Used to looking for information on services by reading blog articles those are frequently quoted. 0.825
L Blogging helps me to extract information behind services that interest me 0.789
M Used to looking for information on products by looking at blog articles those are frequently quoted. 0.758
Factor III-Sharing products information - Related Factor O
I like to share information about a personal product that I find useful. 0.847
R I like to share information on ready to cook mix that I find useful. 0.82
Q I like to share information about a health product that I find useful. 0.819
P I like to share information about a particular family product that I find useful 0.729
Factor IV-Sharing Services information - Related Factor S
Share information and my views on the symptoms of a disease/ disorder that may be experienced by someone. 0.843
V Share information on how elderly people are getting good results from going to Health Club. 0.835
T I like to share information and my views on the positive outcomes of a medical treatment. 0.822
U I like to share information on how to better control a disease or disorder that might be experienced by someone 0.801
Factor V -To continue and motivate others to blog - Related Factor Y I wish to recommend others to join and blog. 0.883
X I am keen to spend more time blogging in the future 0.877
W I intend to continue blogging 0.86
Hypothesis TestingIn order to test whether blogging behavior of the sample respondents differs according to Gender, an independent t-test was applied on all the 25 variables (of the interval scale). Significant differences were noticed among the male and female respondents in three out of the twenty-five variables on which the test was applied. The results where significant differences have been noticed are presented in the Table – 4
H1: The blogging behavior of the respondents as a source of information with regards to services is independent of the Gender. Interpretation: The analytical results of the t-test on Item H (blogging helps to explore more information about services) shows a mean value of 3.24 for male and 3.92 for female respondents which signifies that there exists a difference in their opinion towards exploring the blogs for
more information about services. Since the p-value 0.026 < 0.01 (at 5% level of significance), hypothisis1 is rejected.
Table – 4Results Of Students T-Test
HYPOTHESSES TESTING In order to test whether blogging behavior of the sample respondents differs according to Gender, an independent t-test was applied on all the 25 variables (of the interval scale). Significant differences were noticed among the male and female respondents in three out of the twenty-five variables on which the test was applied. The results where significant differences have been noticed are presented in the Table – 4 H1: The blogging behavior of the respondents as a source of information with regards to services is independent of the Gender. Interpretation: The analytical results of the t-test on Item H (blogging helps to explore more information about services) shows a mean value of 3.24 for male and 3.92 for female respondents which signifies that there exists a difference in their opinion towards exploring the blogs for more information about services. Since the p-value 0.026 < 0.01 (at 5% level of significance), hypothisis1 is rejected. TABLE – 4 RESULTS OF STUDENTS T-TEST
ITEM GENDER N MEAN S.D P H Male 25
3.24 1.268 0.026
Female 37 3.92
1.064
I Male 25 3.16 1.106 0.012
Female 37 3.89 1.075
J Male 25 3.2 1.118 0.032
Female 37 3.81 1.05 H 2: Convenience for the respondents to search for information about products by blogging is independent of the Gender Interpretation: The analytical results of the t test on Item I (It is convenient to search for information about products by blogging.) shows a mean value of 3.16 for male and 3.89 for female respondents which signifies that there exists a difference in their opinion with regard to convenience of blogging to search for information about products. Since the P-value 0.012 < 0.01 (at 5% level of significance), hypothesis 2 is rejected. H 3: Convenience for the respondents to search for information about services by blogging is independent of the Gender Interpretation: The analytical results of the t test on Item J (It is convenient to search for information about services by blogging.) shows a mean value of 3.20 for male and 3.81 for female respondents which signifies that there exists a difference in their opinion with regard to convenience of blogging to search for information about services. Since the P-value 0.032 < 0.01 (at 5% level of significance), hypothesis 3 is rejected. In order to test whether blogging behavior of the sample respondents differs according to Employment status an independent t-test was applied on all the 25 variables (of the interval scale). Significant differences were noticed among the employed and the not employed respondents in five out of the twenty-five variables on which the test was applied. The results where significant differences have been noticed are presented in the Table – 5 H 1: Convenience for the respondents to search for information about products by blogging is independent of the Employment status Interpretation: The analytical results of the t test on Item I (It is convenient to search for information about products by blogging.) shows a mean value of 3.41 for employed and4.13 for not employed respondents which signifies that there exists a difference in their opinion with regard to convenience of blogging to search for information about products. Since the P-value 0.030 < 0.01 (at 5% level of significance), hypothesis 1 is rejected.
H 2: Convenience for the respondents to search for information about products by blogging is independent of the Gender Interpretation: the analytical results of the t test on Item I (It is convenient to search for information about products by blogging.) shows a mean value of 3.16 for male and 3.89 for female respondents which signifies that there exists a difference in their opinion with regard to convenience of blogging to search for information about products. Since the P-value 0.012 < 0.01 (at 5% level of significance), hypothesis 2 is rejected.
H 3: Convenience for the respondents to search for information about services by blogging is independent of the gender Interpretation: The analytical results of the t test on Item J (It is convenient to search for information about services by blogging.) shows a mean value of 3.20 for male and 3.81 for female respondents which signifies that there exists a difference in their opinion with regard to convenience of blogging to search for information about services. Since the P-value 0.032 < 0.01 (at 5% level of significance), hypothesis 3 is rejected.
In order to test whether blogging behavior of the sample respondents differs according to employment status an independent t-test was applied on all the 25 variables (of the interval scale). Significant differences were noticed among the employed and the not employed respondents in five out of the twenty-five variables on which the test was applied. The results where significant differences have been noticed are presented in the Table – 5
H1: Convenience for the respondents to search for information about products by blogging is independent of the Employment status Interpretation: The analytical results of the t test on Item I (It is convenient to search for information about products by blogging.) shows a mean value of 3.41 for employed and4.13 for not employed respondents which signifies that there exists a difference in their opinion with regard to convenience of blogging to search for information about products. Since the P-value 0.030 < 0.01 (at 5% level of significance), hypothesis 1 is rejected.
25

Skyline Business Journal, Volume IX-Issue 1-2013-2014
TABLE – 5 RESULTS OF STUDENTS T-TEST
ITEM Employment
Status N MEAN S.D P I Employed 46
3.41 1.222 0.030
Not Employed 16 4.13
.619
J Employed 46 3.39 1.201 0.036
Not Employed 16 4.06 .574
N Employed 46 3.02 1.183 0.049
Not Employed 16 3.69 1.014
Q Employed 46 2.98 1.390 0.012
Not Employed 16 3.94 .854
W Employed 46 3.26 1.290 0.024
Not Employed 16 4.06 .854 H 2: Convenience for the respondents to search for information about services by blogging is independent of the Employment status Interpretation: The analytical results of the t test on Item J (It is convenient to search for information about services by blogging.) shows a mean value of 3.39 for employed and 4.06 for not employed respondents which signifies that there exists a difference in their opinion with regard to convenience of blogging to search for information about services. Since the P-value 0.036 < 0.01 (at 5% level of significance), hypothesis 2 is rejected. H 3: Looking for information on services by reading blog articles those are frequently quoted. is independent of the Employment status Interpretation: The analytical results of the t test on Item N (Looking for information on services by reading blog articles those are frequently quoted) shows a mean value of 3.02 for employed and 3.69 for not employed respondents which signifies that there exists a difference in their opinion with regard to looking for information on services by reading blog articles those are frequently quoted. Since the P-value 0.049 < 0.01 (at 5% level of significance), hypothesis 3 is rejected. H 4: I like to share information about a health product that I find useful is independent of the Employment status Interpretation: The analytical results of the t test on Item Q (I like to share information about a health product that I find useful) shows a mean value of 2.98 for employed and 3.94 for not employed respondents which signifies that there exists a difference in their opinion with regard to I like to share information about a health product that I find useful. Since the P-value 0.012 < 0.01 (at 5% level of significance), hypothesis 4 is rejected. H 5: I intend to continue blogging is independent of the Employment status Interpretation: The analytical results of the t test on Item W (I intend to continue blogging) shows a mean value of 3.26 for employed and 4.06 for not employed respondents which signifies that there exists a difference in their opinion with regard I intend to continue blogging. Since the P-value 0.024 < 0.01 (at 5% level of significance), hypothesis 5 is rejected. Future Intentions of Respondents towards Blogging
In order to test the respondents‟ future intentions towards blogging, Structural Equation Modeling technique with help of SAS software (9.0 Version) was applied. Four hypotheses: Motivation to blog predicts the future intentions towards blogging, Search for information predicts the future intentions towards blogging, Sharing product information predicts the future
Table – 5Results Of Students T-Test
H2: Convenience for the respondents to search for information about services by blogging is independent of the Employment status Interpretation: The analytical results of the t test on Item J (It is convenient to search for information about services by blogging.) shows a mean value of 3.39 for employed and 4.06 for not employed respondents which signifies that there exists a difference in their opinion with regard to convenience of blogging to search for information about services. Since the P-value 0.036 < 0.01 (at 5% level of significance), hypothesis 2 is rejected.
H3: Looking for information on services by reading blog articles those are frequently quoted. is independent of the Employment status Interpretation: The analytical results of the t test on Item N
(Looking for information on services by reading blog articles those are frequently quoted) shows a mean value of 3.02 for employed and 3.69 for not employed respondents which signifies that there exists a difference in their opinion with regard to looking for information on services by reading blog articles those are frequently quoted. Since the P-value 0.049 < 0.01 (at 5% level of significance), hypothesis 3 is rejected.H4: I like to share information about a health product that I find useful is independent of the Employment status Interpretation: The analytical results of the t test on Item Q (I like to share information about a health product that I find useful) shows a mean value of 2.98 for employed and 3.94 for not employed respondents which signifies that there exists a difference in their opinion with regard to I like to share information about a health product that I find useful. Since the P-value 0.012 < 0.01 (at 5% level of significance), hypothesis 4 is rejected.
H5: I intend to continue blogging is independent of the Employment status Interpretation: The analytical results of the t test on Item W (I intend to continue blogging) shows a mean value of 3.26 for employed and 4.06 for not employed respondents which signifies that there exists a difference in their opinion with regard I intend to continue blogging. Since the P-value 0.024 < 0.01 (at 5% level of significance), hypothesis 5 is rejected.
Future Intentions of Respondents towards BloggingIn order to test the respondents’ future intentions towards
blogging, Structural Equation Modeling technique with help of SAS software (9.0 Version) was applied. Four hypotheses: Motivation to blog predicts the future intentions towards blogging, Search for information predicts the future intentions towards blogging, Sharing product information predicts the future intentions towards blogging and sharing service information predicts the future intentions towards blogging were tested. The factors correlation matrix was used as an input in the model. The model is estimated using maximum likelihood method. Only H2 Search for information with t – value > 2.0 is found to be significant in predicting the future intentions of respondents towards blogging. The results are presented in Table-6 given below:
Table – 6: Results of the Structural Equation Modeling Technique
intentions towards blogging and sharing service information predicts the future intentions towards blogging were tested. The factors correlation matrix was used as an input in the model. The model is estimated using maximum likelihood method. Only H2 Search for information with t – value > 2.0 is found to be significant in predicting the future intentions of respondents towards blogging. The results are presented in Table-6 given below:
TABLE – 6: RESULTS OF THE STRUCTURAL EQUATION MODELING TECHQUINE
Hypothesis Statement Standard Error
Coefficient t-value Significance in predicting the Respondents future Intentions towards blogging
H1 Motivation to Blog predicts the future intentions of the respondents towards blogging
0.1411 -0.0954 -0.6312 Not significant
H2 Search for Information predicts the future intentions of the respondents towards blogging
0.1426 0.5186 3.6373 Significant
H3 Sharing product Information predicts the future intentions of the respondents towards blogging
0.1415 0.2 1.4139 Not significant
H4 Sharing Service Information predicts the future intentions of the respondents towards blogging
0.1352 0.2658 1.966 Not significant
Future intentions of respondents towards blogging = -0.0954*Motivation to Blog + 0.5186*Search for information + 0.2000*Sharing product information + 0.2658*Sharing Service Information + 1.0000 E1
Std Err 0.1411 b1 0.1426 b2 0.1415 b3 0.1352 b4t .value -0.6312 3.6373 1.4139 1.966
DiscussionOn the basis of different analyses that were carried out, the following picture emerges: The majority of the respondents appears to be moderately connected to social networks: Fifty eight percent of the respondents’ blog at least once a week: About three-fourth of the surveyed respondents indicated that they spend an hour blogging during each session.
Factor analysis of the data clearly grouped the statements included in the interval scale into the following five factors: Motivation to blog– Related Factors, Search for Information
26

Skyline Business Journal, Volume IX-Issue 1-2013-2014
-Related Factors, Sharing Product Information - Related Factors, Sharing Service Information - Related Factors and Interest to continue and motivate others to blog -Related Factors. These five factors put together have explained 83.944 % of total variance and further analysis of the five factors (based on factor loading) gave an insight about the importance attached to the variables within the factors by the respondents in the following manner: Receive peoples’ comments on what the respondents post, Willingness to comment on what other bloggers say about products and to receive comments on what the respondents post about services appear to be the primary reasons which motivate the respondents to blog: Convenience of blogs to search for information about products , and services seem to be the primary reasons for the surveyed respondents to use blogs as a source of information before they buy products or services. By Blogging respondents are able to share information about useful personal products, ready to cook mix products and health products. It is also by blogging, respondents share information on the symptoms of a disease/disorder that may be experienced by someone and information on how elderly people get good results from going to Health Club, recommend others to join blogging, keen to spend more time blogging in the future and intend to continue blogging indicate the interest of the respondents not only to continue blogging but also motivate others to blog.
Application of the t-test on all the 25 variables (of the interval scale) to test whether the blogging behavior of the sample respondents differs according to Gender showed significant differences among the male and female respondents in three out of the 25 variables on which the test was applied. On the basis of the t-test it was concluded that the blogging behavior of the respondents towards exploring the blogs for more information about services, convenience of blogging to search for information about product and services, are dependent on gender.
Application of the t-test on all the 25 variables (of the interval scale) to test whether the blogging behavior of the sample respondents differs according to Employment status, showed significant differences among the employed and not employed respondents in five out of the 25 variables on which the test was applied. On the basis of the t-test it was concluded that the blogging behavior of the respondents towards looking for information on services by reading blog articles those are frequently quoted, convenience of blogging to search for information about product and services, sharing information about a health product that they find useful and intention to continue blogging are dependent on the Employment status.Application of Structural Equation Modeling technique was applied on four factors to find out the future intentions of the respondents towards blogging showed only one factor- search for information with a t-value of 3.7363 to be significant in predicting the future intentions of the respondents towards blogging.
Hence, it will be profitable if the organizations segment their market both on the basis of gender and employment status of their consumers to get a better understanding as to how and to what extent their consumers use blogs as a trusted source
to search for information. This will help the organizations to provide the relevant information about their products and services to their consumers for their consideration before purchase and can also get the views and reactions of their consumers.
Limitations And Future ResearchFirstly any survey based method, including that adopted in this study, involves measurement error. In other words, the elicitation of a scale measurement, respondent’s ability to accurately report their level of agreement with the survey statements (Kelli Bodey, Debra Grace, 2006). However, efforts were made to design the administered tool to be simple, easy to understand and respond to convenient sampling was used to collect the data from seventy five residents living in and around the Emirates of Sharjah and Dubai.
Regarding future research, it is suggested that more samples from other Emirates can be taken for study. Further, separate studies can be undertaken on services and products.
ConclusionThe study clearly shows that expat consumers have started to not only use blogs but also are keen to continue blogging to search for information about products and services before making a purchase and are keen to share information about products and services with fellow bloggers. This provides an effective platform for organizations to be informative and disclose all possible details about their products and services to their consumers to enable the consumers to consider and evaluate their offerings before purchase and also gives an opportunity to the consumers to motivate fellow bloggers by sharing information and experiences with them.
References:
Maurya, Mohit.”Evolution of Blogs as a credible Marketing communication Tool”. Journal of Case Research; Jun2011, Vol. 2 Issue 1, p71-90. 20p.
Sepp, Marianne; Liljander, Veronica; Gummerus, Johanna. “Private bloggers’ motivations to produce content – a gratifications theory perspective”. Journal of Marketing Management; Dec2011, Vol. 27 Issue 13/14, p1479-1503.
Zhao, Ling; Lu, Yaobin. “Enhancing perceived interactivity through network externalities: An empirical study on micro-blogging service satisfaction and continuance intention”. Decision Support Systems; Nov2012, Vol. 53 Issue 4, p825-834.
Doyle, J.A.; Heslop, L.A.; Ramirex A.; Cray, D. “Trust intentions in readers of blogs”. Management Research Review; 2012, Vol. 35 Issue 9, p837-856.
Chien, L.A.; Chia, C. L.; Yuan D.L. “Effect of commitment and Trust Towards Micro- Blogs on consumer Behavioral Intention: A Relationship Marketing Perspective”. International Journal of Electronic Business Management; 2010, Vol. 8 Issue 4, p292-303.
27

Skyline Business Journal, Volume IX-Issue 1-2013-2014
Nekmat, E.; Gower, K.K. “Effects of Disclosure and Message Valence in Online Word-of-Mouth (eWOM) Communication: Implications for Integrated Marketing Communication”. International Journal of Integrated Marketing Communications; Spring2012, Vol. 4 Issue 1, p85-98.
Kumar, R., Novak, J., Raghavan, P., and Tomkins, A. 2005. “On the Bursty Evolution of Blogspace,” World Wide Web: Internet and Web Information Systems (8), pp. 159-178.
Kumar, R., Raghavan, P., Rajagopalan, S., and Tomkins, A. 1999. “Trawling the Web for Emerging Cyber-Communities,” Computer Networks (31:11-16), pp. 1481-1493.
Dr. Shivakumar Krishnamurti Professor
Skyline University CollegeP. O. Box - 1797
University City of SharjahSharjah, U.A.E
Dr. Ruchi AgarwalAdjunct Faculty
Skyline University CollegeP. O. Box - 1797
University City of SharjahSharjah, U.A.E
Ip, R. K. F., and Wagner, C. 2008. “Weblogging: A Study of Social Computing and its Impact on Organizations”. Decision Support Systems (45), pp. 242-250.
Kelly Bodey, Debra Grace. (2006). “Segmenting service “complainers” and “non-complainers” on the basis of consumer characteristics”. The Journal of Services Marketing 20 (3), p178.
28

Skyline Business Journal, Volume IX-Issue 1-2013-2014
JOB SATISFACTION: A STUDY OF PUBLIC AND PRIVATE SECTOR EMPLOYEES
Vishal Kumar, Savita
Abstract:
The Financial Services and Banking Industry in India are witnessing significant changes. Liberalization in a highly regulated industry, growth of the economy, and consumerism fuelling a surge in demand for retail credit have contributed to entry and growth of private sector banks, foreign banks and greater sense of competitiveness in the nationalized banks in the country. The maturing of the industry has also witnessed the commoditization of banks products and services, leading to greater focus on differentiation through sales, delivery and customer service. The main objective of the research is to make a comparative analysis of public and private sector bank employees regarding job satisfaction.
Keywords: Job Satisfaction, Bank Employees, Public Sector, Private Sector.
Introduction Indian Banking sector has been one of the key national sectors to embrace the philosophy, the pace and the content of changes in the wider market place, both in India and abroad. It is bracing itself, impatiently, to integrate with global banking and global marketplace. With the advantage of a fairly robust institutional and regulatory framework, it is repositioning itself to become a customer-centric sector. Indian banking sector is also one of the few in the world to absorb and use modern technology for providing value added services to the customer, at comparable costs. Issues around size, strength and soundness are beginning to dominate the life of Indian bankers. ‘Prudence in banking practices’ continues to remain at the top of bankers’ corporate agenda. Issues of channel profitability, product profitability, and customer profitability are all beginning to exert their pressures on the working of banks. Competition, both within and outside, thanks to the economic liberalization policies of the Government, is no more a scaring term. It has instead become a key driver for pursuing ambitious plans for balance sheet expansion, business and customer accretion, innovations of new products and services, expansion of delivery channels and maximizing shareholder value.
Importance of HR in Banking Land, Labour or Human Resources, Capital, Equipments/Technology, and Entrepreneurship are the most important factors of any industry. Of them, Human Resources are the most important factor governing all these other factors. Human Resources or Human Capital is the mix of quality and quantity of the manpower in an organization. Human Resources Management has further become important in banks due to the following reasons: • Last Voluntary Retirement Scheme. • Improper Deployment of Staff. • Expansion of Branches. • Substantial Increase in business at specified centers. • Closure/merger of branches and administrative offices
during recent past. • Regional imbalance/unequal VRS. • Restrictions on transfer of clerical staff. • Inter-zone transfer policy of officers up to specified scale
in various banks. • Uneven Promotions. • Computerization/Installation of ATMs/ Networking/Core
Banking Solution.
Objectives of the study The main objectives of the study are:1. To identify the influencing factors of job satisfaction of
the public and private sector bank employees. 2. To measure the job satisfaction of the bank employees
and determine the differences in job satisfaction based on personal characteristics, if any. Comparisons shall be made on the basis of eighteen attributes of job satisfaction to determine how important these attributes are.
3. To make a comparative analysis of public and private sector bank employees regarding job satisfaction.
Sample DesignFor the research studies, in most cases, it becomes impossible to examine the entire universe and the only alternative is to resort to sampling, this is true to the present study as well. On the other hand, time and money took their toil by way of constraints. Therefore, it is logical that a sample be neither too big nor too small.
A proportionate stratified sampling technique was used to retain its representatives and manageability because it commensurate with this quantitative research studies.
For the purpose of the study, target population was identified as bank employees of Ferozepur, Moga, and Ludhiana of the State Punjab (India) working in public and private sector banks belonging to top, middle, and lower level management viz. Senior Managers, Managers and End Users. The sample population consisted of 80 bank employees, out of which 40 belonged to private sector and 40 to public sector. 80 questionnaires were administered to the employees and all the questionnaires were returned.
Data Collection Methods and Research InstrumentsThis research used a self-administered questionnaire. The rationale for this choice was twofold:i. Given the research base, it was not possible to visit the site
of every organization in the survey; this was prohibitive in terms of both time, and finances.
ii. More importantly, as the study required more responses from managers and senior executives, the researcher felt that a better response rate was forthcoming if these people were allowed to complete the questionnaire in their own time.
29

Skyline Business Journal, Volume IX-Issue 1-2013-2014
The following table gives the distribution of respondents along various demographic variables included in the sample.
Table 1: Profile of the Respondents
4
Table 1: Profile of the Respondents
Data
Analysis The analysis of the data was undertaken with a view to give a clear cut idea about the positive and negative effects of variables considered under the research on employees in banks. Various tables and figures have been incorporated to make it more useful and easy to understand. The survey data was fed into computer and the software package SPSS was used to determine the mean score keeping in view the purpose(s) of the study. Separate paired sample t-tests were run on each of the variable to determine the perceptual difference between public and private sector bank employees towards the elements of job satisfaction:
Sr. No. Characteristics
No. of Respondents from Total
Public Banks Private Banks
1 Sex Male Female
28 12
23 17
51 29
2 Marital Status Married Unmarried
27 13
19 21
36 34
3
Age Less than 30 Yrs 30 to 45 years More than 45 Yrs
7
24 9
13 21 6
20 45 15
4
Experience Less than 2 Yrs 2 to 4 years 4 to 6 years 6 to 8 years More than 8 Yrs
4 7 9 7 13
8 7 9
11 5
12 14 18 18 18
5
Occupational Status Senior Manager Manager End User
4 8 28
5
11 24
9
19 52
6 Educational Status Graduate Post Graduate
17 23
9 31
26 54
Total 40 40 80
5
Table 2: Importance Rating of Male and Female Bank Employees Along With Various Attributes of Job Satisfaction
Rank Men Mean Women Mean
1. Compensation and Benefits 4.62 Compensation and Benefits 4.57
2. Company‟s Image 4.58 Recognition and Rewards 4.28
3. Facilities 4.16 Company‟s Image 4.07
4. Recognition and Rewards 4.11 Facilities 3.99
5. Role Clarity 3.76 Job Security 3.87
6. Advancement Opportunities 3.61 Role Clarity 3.47
7. Technology 3.57 Advancement Opportunities 3.27
8. Employee‟s Role 3.46 Technology 3.23
9. Job Content 3.25 Corporate Culture 3.21
10. Corporate Culture 3.19 Work Climate 3.06
11. Job Security 3.12 Teamwork and Cooperation 3.01
12. Employee Suggestions for Improvement
2.88 Job Content 2.99
13. Leadership and Interpersonal Relationships
2.86 Employee‟s Role 2.62
14. Teamwork and Cooperation 2.79 Leadership and Interpersonal Relationships
2.48
15. Work Climate 2.67 Employee Suggestions for Improvement
2.44
16. Training & Development 2.36 Training & Development 2.36
17. Performance Appraisal System 2.18 Performance Appraisal System 2.35
18. Supervisor Ratings 2.17 Supervisor Ratings 2.31
Table 2 shows that compensation and allied benefits provided by the organizations were the most important modulator of job satisfaction for the male as well as female employees. Male respondents considered company image as the second most important factor followed by facilities provided by the company. Whereas, for female bank employees. It was the recognition and rewards which is most important followed by the company image and facilities. Job security is also one of the most important factors for them. Bank employees were least bothered about the training and development opportunities, the performance appraisal systems and the supervisor ratings. The opinion of the male and female bank employees differed significantly along work climate, employee‟s role, job content and the job security in the organizations as an important moderator of job satisfaction
7
Table 4: Importance Rating of the Respondents Along With Various Attributes of Job Satisfaction (Age Wise)
Rank Less than 30 Years Mean 30 to 45 Years Mean More than 45
Years Mean
1. Compensation and Benefits
4.31 Compensation and Benefits
4.43 Compensation and Benefits
4.62
2. Recognition and Rewards
4.26 Recognition and Rewards
4.32 Recognition and Rewards
4.29
3. Advancement Opportunities
4.16 Advancement Opportunities
4.09 Company‟s Image 4.24
4. Company‟s Image 3.87 Company‟s Image
4.06 Job Security 4.21
5. Technology 3.71 Role Clarity 3.87 Role Clarity 4.18 6. Facilities 3.45 Technology 3.83 Facilities 4.01 7. Role Clarity 3.27 Facilities 3.82 Advancement
Opportunities 3.91
8. Training & Development
3.21 Job Security 3.59 Employee Suggestions for Improvement
3.72
9. Job Security 3.14 Job Content 3.28 Employee‟s Role 3.48 10. Employee
Suggestions for Improvement
3.14 Teamwork and Cooperation
3.27 Work Climate 3.42
11. Teamwork and Cooperation
3.12 Employee Suggestions for Improvement
3.27 Corporate Culture 3.41
12. Job Content 3.11 Work Climate 3.23 Teamwork and Cooperation
3.29
13. Corporate Culture 2.99 Employee‟s Role
3.22 Job Content 3.17
14. Employee‟s Role 2.96 Corporate Culture
3.11 Leadership and Interpersonal Relationships
3.12
15. Work Climate 2.94 Leadership and Interpersonal Relationships
2.91 Technology 3.05
16. Performance Appraisal System
2.88 Performance Appraisal System
2.76 Performance Appraisal System
2.91
17. Leadership and Interpersonal Relationships
2.87 Supervisor Ratings
2.70 Training & Development
2.58
18. Supervisor Ratings 2.68 Training & Development
2.61 Supervisor Ratings 2.37
AnalysisThe analysis of the data was undertaken with a view to give a clear cut idea about the positive and negative effects of vari-ables considered under the research on employees in banks. Various tables and figures have been incorporated to make it more useful and easy to understand. The survey data was fed into computer and the software package SPSS was used to determine the mean score keeping in view the purpose(s) of the study. Separate paired sample t-tests were run on each of the variable to determine the perceptual difference between public and private sector bank employees towards the ele-ments of job satisfaction:
Table 2: Importance Rating of Male and Female Bank Employees Along With Various Attributes of
Job Satisfaction
Table 2 shows that compensation and allied benefits provided
by the organizations were the most important modulator of job satisfaction for the male as well as female employees. Male respondents considered company image as the second most important factor followed by facilities provided by the company. Whereas, for female bank employees. It was the recognition and rewards which is most important followed by the company image and facilities. Job security is also one of the most important factors for them. Bank employees were least bothered about the training and development opportu-nities, the performance appraisal systems and the supervisor ratings. The opinion of the male and female bank employees differed significantly along work climate, employee’s role, job content and the job security in the organizations as an important moderator of job satisfaction
Table 3: Importance Rating on the Basis of Marital Sta-tus of Respondents Along with Various Attributes
of Job Satisfaction
6
Table 3: Importance Rating on the Basis of Marital Status of Respondents Along with Various Attributes of Job Satisfaction
Rank Married Mean Unmarried Mean
1. Compensation and Benefits 4.56 Compensation and Benefits 4.43
2. Recognition and Rewards 4.42 Recognition and Rewards 4.37
3. Facilities 4.37 Advancement Opportunities 4.24
4. Company‟s Image 4.29 Company‟s Image 4.16
5. Role Clarity 4.04 Facilities 4.12
6. Advancement Opportunities 3.98 Role Clarity 3.97
7. Job Security 3.64 Job Content 3.27
8. Job Content 3.48 Job Security 3.17
9. Work Climate 3.24 Technology 3.16
10. Employee‟s Role 3.13 Corporate Culture 3.01
11. Teamwork and Cooperation 3.11 Work Climate 2.96
12. Corporate Culture 2.91 Teamwork and Cooperation 2.93
13. Employee Suggestions for Improvement
2.78 Employee‟s Role 2.91
14. Leadership and Interpersonal Relationships
2.76 Leadership and Interpersonal Relationships
2.89
15. Technology 2.76 Employee Suggestions for Improvement
2.67
16. Supervisor Ratings 2.58 Training & Development 2.63
17. Training & Development 2.42 Supervisor Ratings 2.44
18. Performance Appraisal System 2.42 Performance Appraisal System 2.36
Table 3 shows that compensation and rewards emerged as the most important attributes for all the respondents irrespective of age groups. The bank employees who were less than 45 years considered advancement opportunities and the company image in which they work as the other important factor for job satisfaction whereas respondents who were above 45 years of age stressed on job security after the company image. There was a significant difference in the opinion about the employee suggestions for improvement and the work climate of the organization among the three groups of respondents.
Table 3 shows that compensation and rewards emerged as the most important attributes for all the respondents irrespective of age groups. The bank employees who were less than 45 years considered advancement opportunities and the company image in which they work as the other important factor for job satisfaction whereas respondents who were above 45 years of age stressed on job security after the company image. There was a significant difference in the opinion about the employee suggestions for improvement and the work climate of the organization among the three groups of respondents.
Table 4: Importance Rating of the Respondents Along With Various Attributes of Job Satisfaction
(Age Wise)
30

Skyline Business Journal, Volume IX-Issue 1-2013-2014
7
Table 4: Importance Rating of the Respondents Along With Various Attributes of Job Satisfaction (Age Wise)
Rank Less than 30 Years Mean 30 to 45 Years Mean More than 45
Years Mean
1. Compensation and Benefits
4.31 Compensation and Benefits
4.43 Compensation and Benefits
4.62
2. Recognition and Rewards
4.26 Recognition and Rewards
4.32 Recognition and Rewards
4.29
3. Advancement Opportunities
4.16 Advancement Opportunities
4.09 Company‟s Image 4.24
4. Company‟s Image 3.87 Company‟s Image
4.06 Job Security 4.21
5. Technology 3.71 Role Clarity 3.87 Role Clarity 4.18 6. Facilities 3.45 Technology 3.83 Facilities 4.01 7. Role Clarity 3.27 Facilities 3.82 Advancement
Opportunities 3.91
8. Training & Development
3.21 Job Security 3.59 Employee Suggestions for Improvement
3.72
9. Job Security 3.14 Job Content 3.28 Employee‟s Role 3.48 10. Employee
Suggestions for Improvement
3.14 Teamwork and Cooperation
3.27 Work Climate 3.42
11. Teamwork and Cooperation
3.12 Employee Suggestions for Improvement
3.27 Corporate Culture 3.41
12. Job Content 3.11 Work Climate 3.23 Teamwork and Cooperation
3.29
13. Corporate Culture 2.99 Employee‟s Role
3.22 Job Content 3.17
14. Employee‟s Role 2.96 Corporate Culture
3.11 Leadership and Interpersonal Relationships
3.12
15. Work Climate 2.94 Leadership and Interpersonal Relationships
2.91 Technology 3.05
16. Performance Appraisal System
2.88 Performance Appraisal System
2.76 Performance Appraisal System
2.91
17. Leadership and Interpersonal Relationships
2.87 Supervisor Ratings
2.70 Training & Development
2.58
18. Supervisor Ratings 2.68 Training & Development
2.61 Supervisor Ratings 2.37
8
Table 4 clearly indicates that compensation and recognition were the prime factors for job satisfaction in any organization for managers as well as end users, whereas, the advancement opportunities and the facilities provided by the companies matters highly for managers. Company‟s image was given due weightage at managerial level. Training and development was also agreed upon as a major factor of job satisfaction in the organizations by the three groups of respondents. Employee‟s role was rated at the lower side by top and middle managers, whereas, end user ranked supervisor ratings at the bottom.
Table 5: Importance Rating of the Respondents on the Basis of Occupational Status Along With Various Attributes of Job Satisfaction
Rank Senior Manager Mean Manager Mean End User Mean 1. Compensation and
Benefits 4.61 Compensation and
Benefits 4.59 Compensation and
Benefits 4.57
2. Advancement Opportunities
4.28 Recognition and Rewards
4.38 Recognition and Rewards
4.56
3. Recognition and Rewards
4.21 Facilities 4.17 Job Security 4.21
4. Training & Development
4.16 Advancement Opportunities
4.17 Facilities 4.12
5. Technology 4.15 Training & Development
4.08 Training & Development
3.91
6. Company‟s Image 4.13 Company‟s Image 4.04 Technology 3.87 7. Facilities 4.12 Leadership and
Interpersonal Relationships
3.97 Teamwork and Cooperation
3.74
8. Leadership and Interpersonal Relationships
4.11 Technology 3.93 Company‟s Image 3.69
9. Role Clarity 4.08 Role Clarity 3.92 Advancement Opportunities
3.64
10. Work Climate 4.01 Employee Suggestions for Improvement
3.86 Leadership and Interpersonal Relationships
3.51
11. Teamwork and Cooperation
3.98 Work Climate 3.84 Role Clarity 3.48
12. Corporate Culture 3.86 Teamwork and Cooperation
3.79 Work Climate 3.43
13. Job Security 3.81 Job Content 3.77 Job Content 3.34 14. Supervisor Ratings 3.77 Corporate Culture 3.72 Employee
Suggestions for Improvement
3.24
15. Employee Suggestions
3.73 Job Security 3.68 Corporate Culture 3.16
16. Job Content 3.56 Supervisor Ratings 3.49 Employee‟s Role 3.12 17. Performance
Appraisal System 3.54 Performance
Appraisal System 3.42 Performance
Appraisal System 2.88
18. Employee‟s Role 3.27 Employee‟s Role 3.35 Supervisor Ratings 2.85
Table 4 clearly indicates that compensation and recognition were the prime factors for job satisfaction in any organization for managers as well as end users, whereas, the advancement opportunities and the facilities provided by the companies matters highly for managers. Company’s image was given due weightage at managerial level. Training and development was also agreed upon as a major factor of job satisfaction in the organizations by the three groups of respondents. Employee’s role was rated at the lower side by top and middle managers, whereas, end user ranked supervisor ratings at the bottom.
Table 5: Importance Rating of the Respondents on the Basis of Occupational Status Along With Various
Attributes of Job Satisfaction
Table 5 shows that bank employees were more conscious about the money and recognition so ranked these attributes at the top. Bank employees from public sector laid slightly greater stress on leadership and interpersonal relations in the company as compared to private banks. There were however, some things all agreed on – the relative importance of
advancement opportunities and teamwork in the organizations as well as the relative importance of a sensible and fair performance appraisal system. While the employees of the public sector banks laid slightly greater stress on job security. Work climate was given more preference by the employees of private banks as compared to public sector banks at the rating level of importance
Table 6: Importance Rating of the Respondents on the Basis of Organizational Status Along With Various
Attributes Of Job Satisfaction
9
Table 5 shows that bank employees were more conscious about the money and recognition so ranked these attributes at the top. Bank employees from public sector laid slightly greater stress on leadership and interpersonal relations in the company as compared to private banks. There were however, some things all agreed on – the relative importance of advancement opportunities and teamwork in the organizations as well as the relative importance of a sensible and fair performance appraisal system. While the employees of the public sector banks laid slightly greater stress on job security. Work climate was given more preference by the employees of private banks as compared to public sector banks at the rating level of importance
Table 6 Importance Rating of the Respondents on the Basis of Organizational Status Along With Various Attributes Of Job Satisfaction
Rank Private Mean Public Mean
1. Compensation and Benefits
4.34 Compensation and Benefits
4.21
2. Recognition and Rewards
4.22 Recognition and Rewards
4.07
3. Corporate Culture 4.13 Leadership and Interpersonal Relationships
3.87
4. Company‟s Image 4.01 Job Security 3.82 5. Technology 3.99 Job Content 3.76 6. Role Clarity 3.91 Employee‟s Role 3.68 7. Advancement
Opportunities 3.87 Advancement
Opportunities 3.64
8. Work Climate 3.84 Employee Suggestions for Improvement
3.51
9. Facilities 3.82 Corporate Culture 3.49 10. Job Content 3.56 Company‟s Image 3.37 11. Employee Suggestions
for Improvement 3.43 Facilities 3.29
12. Employee‟s Role 3.42 Technology 3.18 13. Training &
Development 3.16 Role Clarity 3.12
14. Teamwork and Cooperation
3.14 Teamwork and Cooperation
3.10
15. Job Security 3.09 Work Climate 3.06 16. Supervisor Ratings 3.06 Training & Development 2.86 17. Leadership and
Interpersonal Relationships
3.01 Supervisor Ratings 2.63
18. Performance Appraisal System
2.97 Performance Appraisal System
2.54
Table 6 emerges the clear picture of the importance rating of constituent factors of job satisfaction among bank employees working in the corporate environment at different job positions. The respondents collectively agreed upon the compensation and recognition as the most important attributes for job satisfaction in their organizations.
Comparative Analysis of the Responses of Public and Private Bank Employees towards Job Satisfaction A comparative analysis of public and private sector bank employees was made regarding job satisfaction. Research revealed that there are no significant differences between the responses of public and private sector employees towards elements of job satisfaction except the Job Security element. From the results, it is evident that Company Image and Job Content are the highly perceived elements by private sector employees and Job Security is the highly perceived element by public sector employees as shown in Table 4.6.
The mean values indicate the perceptual differences on account of the decision variables covered in the study (Table 7). Separate paired sample t-tests were run on each of the variable to determine the perceptual difference between public and private sector bank employees towards the
31

Skyline Business Journal, Volume IX-Issue 1-2013-2014
elements of job satisfaction. It can be seen from the table that except Job Security element all other variable did not show any significant difference. This indicates that the responses of private and public sector bank employees do not show much significant difference towards the elements of job satisfaction.
Table 7: Comparative Analysis of Public and Private Sector Bank Employees
11
Table 7: Comparative Analysis of Public and Private Sector Bank Employees
Sr. No.
Attributes of Satisfaction Private Sector Mean Scores
Public Sector Mean Scores
Paired
‘t’ Test
Sig
(2 Tailed)
1 Leadership and Interpersonal Relationships
3.6250 3.5000 .565
2 Corporate Culture 3.4500 3.7250 .147
3 Teamwork and Cooperation 3.7750 3.6000 .360
4 Work Climate 3.8500 3.7500 .578
5 Technology 3.5750 3.8000 .323
6 Job Security 3.5250 4.1000 .001**
7 job content/ Timings and work load 4.0000 3.6000 .051
8 Employee's Role 3.4250 3.3500 .706
9 Training & Development 3.4500 3.3120 .172
10 Recognition and Rewards 3.6500 3.7000 .836
11 Company’s Image 4.750 3.9000 .303
12 Facilities 3.9250 3.8460 .797
13 Advancement Opportunities 3.6000 3.7250 .580
14 Supervisor Ratings 3.4210 3.2600 .421
15 Role Clarity 3.5750 3.7500 .399
16 Compensation and Benefits 3.7000 3.4000 .194
17 Performance Appraisal System 3.4750 3.5750 .634
18 Employee Suggestions for Improvement 3.6500 3.3750 .220
It can be seen from the table the mean scores are greater than 3 for all the variables, which are above neutral value on a 5 point scale. This means the perceptions towards the elements of job satisfaction are positive. Company Image and Job Content are the highly perceived elements by private sector employees with scores of above 4.0. The private sector employees also have positive perceptions regarding Facilities, Work Climate, Teamwork and Co-operation, and Compensation and Benefits. Job Security is the highly perceived element by public sector employees with a score of above 4.0. Public sector employees also have positive perceptions regarding, job security, Advancement Opportunities, Training and Development, and Technology. Leadership and Interpersonal Relationships, Work Climate, and Performance Appraisal System, proved to be a notable feature of this analysis.
ConclusionThis study focused on understanding the attitudes of employees’ towards job satisfaction. The study identified 18 factors which has significant impact on job satisfaction of the employees as detailed in the analysis. Based on the present study the researchers recommend the public and private sector banks to keep these identified influencing factors in mind while formulating and implementing Human Resource policies to enhance the bank employees’ productivity levels in their respective organizations. Maintaining a motivated and committed workforce has become extremely challenging for HR professionals. Near full employment, the changing values of younger employees, baby-boomer burnout, and the increased willingness of employees to “jump ship”
if the grass looks greener elsewhere have made this task much more difficult than in the past. Unfortunately, in many organizations senior management doesn’t have their finger on the pulse of how their employees feel. Traditional employee surveys can provide a good understanding of what employees like and dislike about their work life. Equally useful is an assessment of what is important to employees.
However, this survey asked about job satisfaction with various issues such as leadership, supervision, compensation, recognition, employee’s role, work climate, team work, job security, job content, technology, training and development, company’s image, facilities, advancement opportunities, role clarity, performance appraisal system and employee suggestions for improvement. The survey found that overall satisfaction among female employees was a little bit higher than men, there were some interesting components. Both men and women said that the industry performed well on only two of the Top 5 Most important attributes: Company Image and Job Security. Even within this area of agreement though, men were more satisfied than women on company image while women believed their jobs to be a little more secure and stable than men did. Women gave little importance to Inter-personal relationships but were most satisfied with it. While, men gave higher importance to this attribute, were less satisfied than women on this count. The other attributes on which both men and women were satisfied were however not placed very high on the list of importance. For instance, satisfaction on advancement opportunities (Long Term Overseas Opportunities) was high for both (though in order of importance it ranked 12th for men and 16th for women). Men were happy with short-term overseas opportunities though it ranked 14th in order of importance.
References1. Cranny, C.J., P.C. Smith & E.F. Stone (1992), Job Satisfaction: How People Feel About Their Jobs and How It Affects Their Performance, New York: Lexington Books.
2. Decker, P. & F. Borgen, (1993). “Dimensions of Work Appraisal: Stress, Strain, Coping, Job Satisfaction, and Negative Affectivity,” Journal of Counseling Psychology 40:470-478.
3. Falcone, S., (1991). “Self-assessment and Job Satisfaction in Public and Private Organizations,” Public Productivity & Management Review 16:385-396.
4. Ganguli, H. C. (1994) Job Satisfaction Scales for Effective Management: Manual for Managers and Social Scientists, Concept Publishing Company, New Delhi.
5. Glisson and Durick (1983). Job Satisfaction and Organizational Commitment as Predictors of Organizational Citizenship and In-Role Behaviors. Journal of Management, 17(3), 601-617.
6. Goh, C.T., H.C. Koh & C.K. Low, (1991). “Gender Effects on the Job Satisfaction of Accountants in Singapore,” Work and Stress 5(4): 341-48.7. Hoppock, (1999). ‘The Prevalence of Work-related
32

Skyline Business Journal, Volume IX-Issue 1-2013-2014
Neck and Upper Limb Disorders Among Office Workers in 7 Countries - a Pilot Study’, Reprints of International Conference on Ergonomics, Occupational Safety and Health and the Environment, Vol. 1, Beijing.
8Howard, J. & D. Frink, (1996). “The Effects of Organizational Restructure on Employee Satisfaction,” Group and Organization Management 21(3):278-303.
9. Hulin, C. & P. Smith (1996), “Sex Differences in Job Satisfaction,” Journal of Applied Psychology 48:88-92.
10. Jayarante and Chess and Vinokur-Kaplan, (1991). “Measuring The Job Satisfaction of Industrial Information Technology Persons,” Journal of Market¬ing.
11. Koh, H. C. & H.Y, Boo, (2001). “The Link Between Organizational Ethics and Job Satisfaction: A Study of Managers in Singapore,” Journal of Business Ethics 29: 309-324.
Dr. Vishal KumarAssistant Professor in Commerce Dev Samaj College for Women
Ferozepur City (PB)-152002Email: [email protected]
Dr. SavitaAssistant Professor in CommerceDev Samaj College for Women
Ferozepur City (PB)-152002Email: [email protected]
33

Skyline Business Journal, Volume IX-Issue 1-2013-2014
AN EXPLORATORY STUDY OF WORK-LIFE BALANCE AND WORK-FAMILY CONFLICTS IN THE UNITED ARAB EMIRATES
Nick Forster, Aisha Al Ali Ebrahim, Nadia Alma Ibrahim
Abstract:
This article describes how Emirate women cope with the competing demands of work and family life and how these, in turn, affect their job performance, well-being and home lives. We found that many Emirate women face the same challenges in dealing with work-life balance and work-family conflicts as working-women in western countries do, although these are much more significant issues for Emirate women who work for private sector companies in the UAE. The article then describes policies that could be implemented by the Federal Government, and organizations in the UAE, to help Emirate women balance their work and family responsibilities more effectively; policies that would enable them to achieve their career goals and help them to achieve leadership positions in their organizations in the future. The broader implications of these findings for the future economic diversification of the country are also discussed.
Keywords: Emirate women; work-family balance; work-family conflict.
IntroductionOver the last two decades, the UAE has witnessed what can be described as a ‘quiet revolution’ in the legal rights and economic power of Emirate women. Today, they have opportunities that their mothers and grandmothers could have only dreamed about; and the freedoms they now have are very different to those of young women in more conservative Middle-Eastern countries, such as Saudi Arabia (see, for example, Lacey, 2009 and 2001; Alsanea, 2008; Salloum, 2003). The number of Emirate women in the national workforce grew from 18,144 in 1995, to 38,657 in 2000, to more than 100,000 in 2009. By 2009, Emirate women comprised 66 percent of the workforce in the government sector, of which nearly one-third were in middle and senior management positions. There has also been a growing level of participation in the private sector, although the proportion of Emirate women working in this sector remains small (Ministry of State for Federal National Council Affairs, 2009, 12; Al Abed, 2007, 246; Allen et al, 2007).
However, the UAE remains in many ways a very traditional Muslim society, with all the implicit assumptions that are made about the ‘correct’ public and private roles of Emirate women, and their responsibilities to their community, their extended families, their husbands and their children. Although much has changed in Emirate society over the last two decades, it is still characterized by a patriarchal culture, and fathers still exert considerable control over their daughters’ lives and continue to make many of the important decisions that affect their education, careers, and choice of marriage partners. Some Emirate fathers do not allow their daughters to pursue certain careers, and others still do not permit them to work in mixed-gender workplaces (Marmenout, 2009; Metcalfe, 2006; Mostafa, 2005). According to the UAE Federal Government, women now enjoy equality of opportunity in the workplace, including pay equity with men, although there is a lack of independent research that might validate this claim (Al Abed, 2007: 244-249). We do know that the UAE is currently ranked first for gender equality in the MENA region, was ranked 29th in the UN’s Gender Empowerment Measure (GEM) in 2009 and ranked 43rd among 177 countries in the United Nations’ Gender-Related Development Index (cited by the Ministry of State for Federal
National Council Affairs, 2009, 3). Globally, however, it was ranked 103/134 countries in the World Economic Forum’s Global Gender Gap Report 2012 (World Economic Forum, 2012: 9).
The issues of work-life balance (WLB) and work-family conflict (WFC) have been the subject of hundreds of research articles and dozens of books over the last three decades. However, very little attention has been paid to these emergent issues in the Middle East and North Africa (MENA) region by either western or local management scholars, reflecting the general lack of research on organizations, business and management in this part of the world. And, it is only in very recent times that the phenomenon of dual-career couples has emerged in the UAE and, concurrently, public debates about the impact of work on family life, changes to the traditional (domestic) roles of Emirate women and, of course, Islamic beliefs and values (Trade Arabia, 2010). This article is the first to describe the emergence of WLB and WFC issues in one country in this region, the UAE, and the growing challenges that Emirate women face in balancing their work and family lives. It is divided into four parts. Part one describes a theoretical framework for understanding WLB and WFC issues in the UAE, derived from the recent academic literature. Part two addresses the survey research methodology, and part three describes the data derived from a questionnaire survey of 118 Emirate women. Part four begins by summarising the broader implications of the data results, and then recommends strategies for improving WLB, while reducing WFC, in the UAE. It also describes the limitations of this exploratory study and suggests some avenues for further research on this topic.
A Theoretical Framework for Understanding WLB and WFC Issues in the UAE
WLB is defined here as, ‘the ability to harmonise and cope effectively with the competing demands of work and family life’; and WFC is defined as, ‘situations where people find it difficult to balance the demands encountered in one domain (family) due to their involvement in the other domain (work)’ (adapted from Aycan, 2008). Four broad causes of WFC
34

Skyline Business Journal, Volume IX-Issue 1-2013-2014
have been identified in the international research literature and these form the basic theoretical framework for this study (adapted from, Lewis, 2010; Halpern and Cheung, 2008; Lewis et al, 2007; Gambles et al, 2006; Aycan, 2008; Drago, 2007; Yang, 2005; Aycan et al, 2004; Gelfand and Knight, 2003; Friedman, Christensen and Degroot, 2000):
Role or Strain Overload: arising from multiple demands (e.g. long hours) and activities at work (e.g. routine multi-tasking) that may affect employees’ ability to cope with family responsibilities. Several studies have found that work overload is strongly correlated with work life imbalance in many different cultures, reducing the amount of time that employees can spent with families and affecting other non-work personal relationships.
Work-to-family interference: when work responsibilities interfere with family life and make it difficult to perform household tasks or spend adequate time with children.
Family-to-work interference: when family responsibilities interfere with work demands, which may make it difficult - or impossible - to perform efficiently and effectively at work
Cultural (gendered) assumptions and expectations: the belief that women, even if they work outside the home, are still primarily responsible for management of the domestic unit, housework and childcare, even in dual-income relationships.
In addition to these, three deeply-rooted gender, organizational and cultural norms have been identified in this literature which influence the way that WLB and WFC issues are conceptualised by women, men, public and private sector organizations and by individual societies/cultures. These are the Motherhood Norm, the Ideal Worker Norm and the Individualism Norm (Aycan, 2008; Drago, 2007).
The Motherhood Norm: refers to the ancient and deeply held belief that women should be, primarily, mothers and managers of their households. In turn, this may discourage them from being fully committed to demanding professional, full-time jobs which, in turn, will prevent them from reaching higher positions in their careers because they are not regarded by their employers as, ‘ideal workers’.
The Ideal Worker Norm: refers to the belief that employees must be totally committed to their employers and available 24/7/365 in order to gain promotions, earn higher salaries and, if they have the ambition, to serve in leadership positions. They are, consequently, expected to be both ‘visible’ and ‘present’. This widely prevalent norm will affect the amount of time that employees have to spend with their families - unless they have other support-systems in place such as stay-at-home spouses, extended families or servants/nannies (see, for example, Forster, 2000, for an analysis of how Ideal Worker and Motherhood assumptions contributed to holding back British women academics in their careers during the 1990s).
The Individualism Norm: refers to the assumption that companies (and governments) should not, as a general rule,
interfere in the private lives of their citizens - unless their behaviour poses a threat to their employer, themselves, their families or others. While there are considerable variations in the amount of help and support given by national governments, and private sector companies, to help women employees balance their work and family responsibilities, the literature is very consistent about one major issue: most organizations, public or private, still view work and personal life as competing priorities in a zero-sum game, in which a gain in one area means a loss in the other. In their view, every time an employee’s personal interests win, the organization pays the price at the bottom line, and so they may often regard work-life programs as little more than corporate ‘welfare’ (see, inter alia, Lewis, 2010; Lewis et al, 2007; Donaghy, 2002; Thomas, 2004; Friedman et al, 2000; Thomas, 1996).
Utilising the four part theoretical framework described above, we created thirty research questions to address in this exploratory survey, of which eight are addressed in this article: How do working Emirate women conceptualise the issue of ‘work-life balance’ in general terms? How many hours a week, on average, do professional Emirate women work? How many hours a week are they able to spend with their children and immediate and extended families? What is the impact of work on the home lives of working Emirate women? Do their family responsibilities affect their work performance? What strategies do working Emirate women use to balance their work and family lives? Do employers in the UAE help working mothers to balance their work and family lives? What specific HR policies and services do they have in place to help with this?
Research Methodology
The questionnaire designed for this exploratory study compromised several descriptive items plus 40 Likert-scale items, some of which have been used in previous studies of WLB and WFC (e.g. Ayree et al, 2002; Gambles et al; 2006). It was divided into four sections:
Demographic profiles: information about the participants’ ages, number of children and their spouses’ employment status.
Occupational and employment profiles: information about the participants’ employment sector, average hours worked each week, and work designations.
Work-family balance and work-family conflict: time spent at home, interactions with their immediate and extended families, the effects of work responsibilities on their home lives, and how they balance the competing demands of work and home life.
WLB support provided by respondents’ employers: evaluations of the work-life balance policies in their organizations and information on how these could be improved by their employers. Having made contact with the HR Directors of 20 public (N = 12) and private sector organizations (N = 8) in Dubai and Abu Dhabi, two on-line questionnaire surveys were
35

Skyline Business Journal, Volume IX-Issue 1-2013-2014
distributed during March and October 2011 to 400 female Emirate employees in full-time jobs. After sending two rounds of reminders, we had received 210 questionnaires by early December 2011. However, 37 of these were incomplete and excluded from the data analysis. We then identified those respondents who were not married, or who were married but did not have children, and also excluded these (N = 55), leaving a valid sample of 118 questionnaires for data analysis (public sector employees N = 71; private sector N = 47). In addition to the questionnaire surveys, we also conducted 20 interviews with a sub-sample of respondents to elicit richer and more nuanced insights into how Emirate women cope with work-life balance issues. However, only the data from our questionnaire surveys are described in the remainder of this article. The data analysis, primarily using SPSSx, followed well-established practices in quantitative business and management research studies (e.g. Cavana, Delahaye and Sekaran, 2001).
Data Analysis
Demographic profile
21.10 percent of our sample were aged 20-25 years, 25.60 percent 25-30, 40 percent 30-35, and just 13.30 percent were aged 35 and above. (Note: all figures in text and in the data tables are rounded to the nearest decimal point). This demographic profile is representative of the relatively youthful female Emirate working population of the UAE, following the baby boom of the 1980s and 1990s and the increasing employment opportunities that became available to Emirate women during the 2000s. As noted above, all of these women were married; and 58 have one child, 35 have two, 18 have three and seven have four or more children. 93.5 percent of our respondents have husbands who were also working full-time or managing their own businesses.
Occupational and employment profiles
Our respondents worked in a variety of public (41.1 percent), semi-government (24.4 percent) and private sector organizations (34.5 percent), and included accountants, financial officers, human resource managers, research analysts, customs’ officers, medical professionals, university employees, import-export managers, airline employees, media employees, two women diplomats, police officers, a few women working in IT, school teachers, marketing managers, bank officers and branch managers. Most of these worked in supervisory or middle management roles. 38.5 percent had work experience of less than five years; 26.4 percent of our respondents had 6-10 years’ work experience and 23.1 percent had 11-15 years. Only 12 percent of these women had worked for more than 15 years. Again, these data reflect the relatively youthful age profile of this sample of Emirate women. On average, women in the private sector report working longer weeks than their sisters in the public sector (5.4 versus 5.0 days per week), and there are noticeable differences in the average hours they report working each day (Table I).
Table I: Daily hours worked by Emirate women in public, semi-government and private sector
organizations in the UAE
In the public sector sub-sample, a majority of respondents report being ‘neutral’ about the amount of time they spend at work, with 30.6 percent of respondents reporting that they were ‘happy’ and 11.9 percent ‘very happy’ with their working hours. However, more respondents in the private sector sub-sample felt ‘unhappy’ or ‘very unhappy’ about the amount of time they spend at work (37.4 percent compared to 11.4 percent among public sector employees). Furthermore, 61. 2 percent of private-sector employees reported that work pressures ‘sometimes make me feel very tired’ and only 10.5 percent reported that their work ‘never leaves me feeling tired’. And, while 31.8 percent of public sector employees reported that they had ‘sometimes’ dealt with work during weekends and holidays, this figure rose to 71.2 percent among those working in the private sector.
Work-life balance and work-life conflict
To develop a clearer picture of how our respondents cope with the competing demands of work and family life we asked them a general question, ‘Do you feel that you are able to balance your work responsibilities and family life?’ The results are presented in Table II.
Table II: Do you feel that you are able to balance your work responsibilities and family life?
The responses to this question show that most of the women who work in the public and semi-government sectors feel that they are able to balance their work responsibilities and family life, although three out of four public, and nearly 40 percent of semi-government employees, reported that it was sometimes difficult to balance the competing responsibilities of work and family. The situation for those working in the private sector is rather different, with nearly one-third reporting that they were ‘never’ or ‘rarely’ able to balance the demands of their jobs and families. There is also clear evidence of spillover between work and our respondents’ leisure time, with noticeable differences in the responses of
36

Skyline Business Journal, Volume IX-Issue 1-2013-2014
Table III: How often do you think about work when you are not actually at work or when traveling to work?
Table IV: Do you ever miss-out on quality time with your families and friends because of work pressures?
Hours per day (%)
< 2 hours 2-3 hours 3-4 hours > 4 hours Sector Public 12.60 29.40 38.20 19.80 Semi-government 12.60 33.10 46.50 7.80 Private 49.50 27.30 22.20 1.00
Hours per weekend (%)
< 4 hours 4-5 hours 5-6 hours > 6 hours Sector Public 3.60 12.40 26.20 57.80 Semi-government 5.60 16.40 28.00 50.00 Private 19.60 35.30 27.20 20.90
Care-person (%)
Spouse Parents, in-laws Servant or Nanny or close relatives Sector Public 9.60 42.40 48.00 Semi-government 9.60 41.90 50.50 Private 9.60 37.30 53.10
Sector Public Semi- Private government Impact (% of respondents who indicated this item*) My home life has no impact on
33.40
28.60
27.70
my work performance
Family responsibilities can reduce the time I have to work on job- related tasks
9.30
11.20
14.70
Family responsibilities can distract me from work-tasks 8.40 8.20 21.70 Problems at home can make me feel irritable at work
12.10
11.90
17.80
At times, work pressures
4.10
4.10
15.40
and family responsibilities can overwhelm me (* For items 2-5, respondents were asked to indicate ‘Yes’ or ‘Sometimes’. Only ‘Yes’ responses are reported here)
Table V: On an average working day, how much time do you have to spend with your children?
the private sector employees when compared to public and semi-government employees (Tables III and IV).
The data also suggested that work responsibilities had few negative effects on the amount of time that our public-sector respondents had to spend with their children. However, once again, the longer working hours required of those working in private sector companies in the UAE had a demonstrable effect on the time they could spend with their children (Tables V and VI).
Hours per day (%)
< 2 hours 2-3 hours 3-4 hours > 4 hours Sector Public 12.60 29.40 38.20 19.80 Semi-government 12.60 33.10 46.50 7.80 Private 49.50 27.30 22.20 1.00
Hours per weekend (%)
< 4 hours 4-5 hours 5-6 hours > 6 hours Sector Public 3.60 12.40 26.20 57.80 Semi-government 5.60 16.40 28.00 50.00 Private 19.60 35.30 27.20 20.90
Care-person (%)
Spouse Parents, in-laws Servant or Nanny or close relatives Sector Public 9.60 42.40 48.00 Semi-government 9.60 41.90 50.50 Private 9.60 37.30 53.10
Sector Public Semi- Private government Impact (% of respondents who indicated this item*) My home life has no impact on
33.40
28.60
27.70
my work performance
Family responsibilities can reduce the time I have to work on job- related tasks
9.30
11.20
14.70
Family responsibilities can distract me from work-tasks 8.40 8.20 21.70 Problems at home can make me feel irritable at work
12.10
11.90
17.80
At times, work pressures
4.10
4.10
15.40
and family responsibilities can overwhelm me (* For items 2-5, respondents were asked to indicate ‘Yes’ or ‘Sometimes’. Only ‘Yes’ responses are reported here)
Table VI : During an average weekend, how much time do you spend with your children?
Hours per day (%)
< 2 hours 2-3 hours 3-4 hours > 4 hours Sector Public 12.60 29.40 38.20 19.80 Semi-government 12.60 33.10 46.50 7.80 Private 49.50 27.30 22.20 1.00
Hours per weekend (%)
< 4 hours 4-5 hours 5-6 hours > 6 hours Sector Public 3.60 12.40 26.20 57.80 Semi-government 5.60 16.40 28.00 50.00 Private 19.60 35.30 27.20 20.90
Care-person (%)
Spouse Parents, in-laws Servant or Nanny or close relatives Sector Public 9.60 42.40 48.00 Semi-government 9.60 41.90 50.50 Private 9.60 37.30 53.10
Sector Public Semi- Private government Impact (% of respondents who indicated this item*) My home life has no impact on
33.40
28.60
27.70
my work performance
Family responsibilities can reduce the time I have to work on job- related tasks
9.30
11.20
14.70
Family responsibilities can distract me from work-tasks 8.40 8.20 21.70 Problems at home can make me feel irritable at work
12.10
11.90
17.80
At times, work pressures
4.10
4.10
15.40
and family responsibilities can overwhelm me (* For items 2-5, respondents were asked to indicate ‘Yes’ or ‘Sometimes’. Only ‘Yes’ responses are reported here)
Table VII: Who - primarily - takes care of your children while you are at work? Hours per day (%)
< 2 hours 2-3 hours 3-4 hours > 4 hours Sector Public 12.60 29.40 38.20 19.80 Semi-government 12.60 33.10 46.50 7.80 Private 49.50 27.30 22.20 1.00
Hours per weekend (%)
< 4 hours 4-5 hours 5-6 hours > 6 hours Sector Public 3.60 12.40 26.20 57.80 Semi-government 5.60 16.40 28.00 50.00 Private 19.60 35.30 27.20 20.90
Care-person (%)
Spouse Parents, in-laws Servant or Nanny or close relatives Sector Public 9.60 42.40 48.00 Semi-government 9.60 41.90 50.50 Private 9.60 37.30 53.10
Sector Public Semi- Private government Impact (% of respondents who indicated this item*) My home life has no impact on
33.40
28.60
27.70
my work performance
Family responsibilities can reduce the time I have to work on job- related tasks
9.30
11.20
14.70
Family responsibilities can distract me from work-tasks 8.40 8.20 21.70 Problems at home can make me feel irritable at work
12.10
11.90
17.80
At times, work pressures
4.10
4.10
15.40
and family responsibilities can overwhelm me (* For items 2-5, respondents were asked to indicate ‘Yes’ or ‘Sometimes’. Only ‘Yes’ responses are reported here)
Table VIII: What is the impact of home life on your work performance?
In order to evaluate how Emirate women coped with the competing demands of work and family, we asked several questions about childcare and the management of their households. The data show, unequivocally, that most working Emirate women - regardless of the employment sector that they work in - are still heavily dependent on extended families and older relatives for child care and support, or some combination of family support, nannies or
servants (who, by western standards, are extremely cheap to employ) (Table VII). Combined together, these make child-care a less onerous and expensive proposition for working Emirate women. However, as we will see later, extended kin networks are beginning to fragment in the UAE and some of our respondents can no longer rely on these for routine childcare. In addition, just over one-fifth of our respondents reported that they also had ongoing responsibilities for elderly or dependent relatives (22.5 percent), and seven reported that they had children with disabilities, requiring some specialised professional home-care.
To conclude this section, we asked our respondents five questions concerning the impact of their home lives on their work performance. Only a minority of our respondents felt overwhelmed by the competing demands of their home and work lives, but there was evidence of some strains and stresses being created by this, across the entire sample (Table VIII). These findings confirm the results of other studies on WLB, indicating the existence of a ‘high-pressure’ subgroup of one in seven Emirate women working in the private sector who, at times, really struggle to balance the competing demands of high-pressure jobs and busy family lives.
WLB support provided by respondents’ employers
In the final section of the survey, we examined the WLB support provided by our respondents’ employers. The data portray a very mixed picture of both the general availability of WLB support in UAE organizations (Table IX), and the
37

Skyline Business Journal, Volume IX-Issue 1-2013-2014
provision of specific services or HR policies that are known to help with the management of WLB (Table X).
Response (%)
Yes No Not sure/don’t know Sector Public 32.10 51.60 16.30 Semi-government 32.10 51.60 16.30 Private 22.60 57.30 1.10
Table IX: Does your company have any specific services or HR policies to help with work-life balance?
Response (%)
Yes No Not sure/don’t know Sector Public 32.10 51.60 16.30 Semi-government 32.10 51.60 16.30 Private 22.60 57.30 1.10 Table X: WLB support provided by respondents’
employers (excludes ‘Not sure/don’t know’ respondents)
In an open-ended question, we asked those respondents who had reported conflicts between their jobs and family lives, in Table VIII, to indicate which five factors they believed to be the greatest hindrance to achieving better WLB. In order of importance, these were ‘Negative/patriarchal/old-school attitudes of (male) senior managers, bosses or supervisors’ (N = 35); ‘Inadequate maternity leave provisions’ (N = 33); ‘Lack of childcare facilities at work’ (N =27); ‘Negative attitudes of family members’, ‘culture and religion’ (i.e. pressures to put family before work, or their husband’s career) (N= 25) and, ‘Technology’ (i.e. being accessible 24/7 for work-related matters) (N= 24). The final question we asked our respondents in the survey was, ‘Do you think that if employees enjoy a good balance between their work and family lives, then their work-performance will improve? 77.1 percent replied ‘Yes’, 21.1 percent replied ‘not sure’ and 1.8 percent replied ‘No’.
Summary
The data collected in this survey demonstrate that WLB and WFC are issues that concern many working Emirate women. However, there were noticeable and consistent differences in the responses of those in the private sector, when compared to those working in the public sector. Women in the former group reported longer working hours, had less time to spend with their children and families and experienced greater difficulties in balancing work and family commitments. In addition, both groups of women can still rely on the support
of extended families and kin, who routinely help out with childcare, or they can afford nannies and, in some cases, servants. This means that, at this moment in time, WLB is a less stressful issue than is typically the case for many working-women in western industrialised societies. However, some Emiratis will not be able to rely on their extended families for support in the future to the extent that they did in the past; an issue we return to in the discussion section. Last, both groups of women felt that the organizations they worked for could be more sympathetic to WLB and WFC issues, and they suggested a range of HR initiatives that could be implemented to help with these (flexi-hours and longer maternity leave, for example). These, they believe, would also enhance their prospects of becoming business and public sector leaders in the future. Their recommendations, and the implications of these findings for the career development of Emirate women, and the development and diversification of the UAE economy in the future, are discussed in the next section
Discussion
At the time of writing, WLB and WFC are not issues that are part of public discourse in the UAE to the extent that they are many western countries. However, WFC has already become an important professional and personal issue for those Emirate women who work in the private sector. And, as we will see in this section, WLB and WFC will become more significant issues in the UAE in the near future - particularly for private sector organisations - and these will require positive and creative solutions from business, public sector organizations and the UAE Federal Government if they are not to become impediments to the economic development of the UAE during the 2020s and 2030s. There are two main reasons for this.
The first, and most important, is the compelling need for the UAE economy to diversify away from oil. Only one Emirate (Abu Dhabi) has significant reserves of oil and gas, but even these passed their ‘peak-production’ levels during the late 2000s. Even before the economies of Dubai and the UAE began to recover from the downturn of the late 2000s and early 2010s, the country had already been facing a variety of economic, business, social and environmental challenges. The UAE Government Strategy Document 2008 and the Dubai Strategic Plan 2015 had made it clear in the late 2000s that the country had to focus on industrial and business diversification in order to safeguard the country’s economic growth and prosperity in the future. The strategic development priorities identified in these reports include transport, infrastructure, new technologies, health, education, tourism, the arts and environmental sustainability. These documents also clearly demonstrated that continuing economic development and diversification, at both macro and micro-levels, would remain key strategic priorities for the country, and each of the Emirates, during the 2010s and beyond.
In addition, several commentators had noted during the late 2000s that the makeup of the UAE’s economy was not well suited to the changing needs of university-educated and ambitious young Emirates, male or female. In 2009,
38

Skyline Business Journal, Volume IX-Issue 1-2013-2014
for example, Davidson had suggested that, ‘only a limited number of jobs is likely to be available in government departments, national oil companies or investment vehicles; and those nationals with alternative aspirations, abilities and qualifications will remain frustrated’ (2009, 65). After a period of rapid growth during the 2000s, the public sector had reached saturation point by the early 2010s, when abut two-thirds of those employed there were women. Increasing higher-education enrolments by women during the mid-2000s and early 2010s now means that the number of female Emirate graduates applying for public-sector positions exceeds demand, and there is now fierce competition for jobs in the one sector where most Emirate women still prefer to work. This preference will be difficult to change because it is a very attractive option for them. It combines perhaps the best public-sector pay rates and benefits in the world, short working hours and generous holiday entitlements (compared to the private sector), and working environments that respect local women and their religious/cultural values. Collectively, as our research has demonstrated, these factors allow them to enjoy a better job/family balance when compared to those who work in the private sector. The only thing that might change this situation is to make the public sector less attractive to Emirate women, and that is unlikely to happen in the near future.
The only remaining option is for private sector companies to implement employment policies that will make them more appealing to Emirate women (and our research clearly indicates that improved WLB policies is one factor that would help). With a persistent long-term unemployment rate of 15-20 percent among younger Emirates, it is becoming even more important that UAE nationals embrace careers in the private sector and as entrepreneurs (Holdsworth, 2010; Kahn, 2009, 267-270). The response of the UAE Federal Government to the low levels of participation by Emirate women (and men) in the private sector during the 2000s was to introduce a compulsory process of ‘Emeritisation’, whereby all companies operating in the UAE are required by law to recruit a percentage of national employees. To date, this initiative has had limited success because many Emiratis (female or male) still - for the reasons documented above - prefer to work in the public sector (Holdsworth, 2010; Dyes, 2009; Farrell, 2008; Al-Ali, 2008; Dubai Women’s Establishment, 2008 a & b;).
The second reason concerns the breakdown of extended kin networks in the UAE. In many cultures, such as in those in Southern Europe, Asia, Latin America, the Pacific Islands, the MENA region and sub-Saharan Africa, extended families are still commonplace. This, until very recently, was also true of the UAE where it was normal for three generations of a family to share a single household. It is true that this part of the world extended families are still much more common than they are in the west, but this has changed with the emergence of increasing numbers of nuclear families in recent times - ones that consist of a father, mother and their children - who can no longer rely on parents or other close relatives to look after their children while they are at work. The data from our research shows that a growing number of younger Emiratis, who may be both socially and geographically mobile, can
no longer rely on extended kin networks to the extent that their parents did. With the decline of extended kin networks in many western countries, employees are more reliant on government-mandated laws (e.g. for extended maternity leave or flexible working options), the discretionary WLB support provided by their employers, or (expensive) professional childcare.
The problem for Emirate women is that our research shows that the support provided by Emirate federal/state governments and private sector companies are negligible, which means that most Emirate women will continue ‘to vote with their feet’ and will not, if they can avoid it, pursue careers in the private sector. That situation, as we’ve already noted, is not sustainable in the context of the long term economic diversification of the UAE. Our research shows that some private sector companies offer some WLB support to their employees, but these are limited in scope. Others provide no support, other than that mandated by law (e.g. 45 days paid maternity leave). But, as we’ve seen, many of our respondents suggested simple polices that they believed will help them to achieve better WLB, would improve their performance at work, will increase their commitment to their organizations and also improve their chances of achieving leadership positions in the future. These would also encourage more women to work in private sector companies in the UAE.
To help with this, the UAE Federal Government could perhaps emulate countries like the UK, New Zealand and Australia who have promoted better work-life balance by launching a variety of targeted campaigns during the 2000s. The national governments of these countries have all developed websites to provide information to policy analysts, employees, employers and trade unions on the importance of improving work-life balance. In Australia, for example, The Equal Opportunity for Women in the Workplace Agency regards paid maternity leave as both an essential element in helping women and their families to have a balanced life, and something that also has a positive impact on gender equity in the workplace. In addition to this, Australia already recognizes the benefits of parental leave by allowing male employees the option of 12 months unpaid parental leave. A Work and Family Unit (WFU) has been established in the Department of Employment and Workplace Relations that provides information and advice to employers and employees on how to improve WLB. There are also a variety of resources on its website to assist with work-life harmonization and the WFU also oversees the annual Family Friendly Employer awards (Equal Opportunity for Women in the Workplace Agency, 2012). There is nothing - apart from tradition and myopic thinking - that is preventing the UAE Federal Government from adopting similar policies and creating support agencies that can help Emirate women balance their work and family lives more effectively.
Limitations of this exploratory study and directions for future research on WLB and WFC issues in the UAE
While this study generated some useful data, it has three major limitations. The first of these is the sample size. It took several months to acquire a valid sample that would allow us
39

Skyline Business Journal, Volume IX-Issue 1-2013-2014
to draw reasonable preliminary inferences about how Emirate women perceive and deal with WLB and WFC issues. Hence, while we now have a good platform to generate testable research hypotheses during Stage 2 of this research, we need to locate larger and more representative samples, covering a broader range of public and private sector companies in the UAE. Second, we only surveyed Emirate women working in large public and private sector organisations. An increasing number of Emirate women are opting for self-employment and we need to know if this helps them to cope with WLB and WFC more effectively, or whether they face the same challenges as other working women. Hence, in Stage 2, this research will be extended to cover a sample of 20 married women SME owners in Dubai and Abu-Dhabi. Third, no men participated in this survey. The second stage of this research will include a sample of Emirati males from public and private sector organisations in order to elicit their views about WLB and WFC issues, and to assess if their traditional roles as family patriarchs are also changing and evolving in dual-career households.
Conclusion
There are several conclusions that can be drawn from this exploratory study of WLB and WFC issues in the UAE. First, many working married Emirate women now have to deal with these and some of them experience regular conflicts between the demands of their jobs and their families. Second, they think about and deal with these in ways that are very similar to those of working women in western countries. Third, while many working Emirate women can still rely on a combination of extended families, nannies and servants to help with childcare, this will change in the future as Emiratis become more professionally and geographically mobile, as extended kin networks weaken and, as is beginning to happen, they marry non-Emiratis and move away from their home areas. Fourth, Emirate women working in the private sector experience considerably more difficulties in dealing with WLB and WFC, caused primarily by longer working hours, shorter holidays and greater work pressures. Fifth, the provision of WLB support at the governmental/legislative level is two to three decades behind leading western countries. The same appears to apply to the WLB support provided by private sector companies in the UAE, which lag well behind the employment practices of ‘Employer of Choice’ companies in the west such as IBM, Google, W. L. Gore, Coca Cola, the SAS institute and many others. Sixth, we argued that there is considerable room for improvement in this domain and several simple HR policy changes were identified which could improve WLB, while reducing the potential for WFC. Sixth, the additional pressures of work (combined with limited WLB support) in the private sector continue to act as major deterrents to younger Emirate women when they are making decisions about their future careers. Their strong preference for public-sector employment, and the implications of this for the future economic development and diversification of the UAE, economy have documented in the article.
While businesses in the UAE can learn from best-practice in companies that have well-established work-life balance
policies, these will have to be modified to suit the specific needs of Emirate women, and their cultural and religious beliefs. Having said this, the benefits for companies and employees of introducing supportive WLB polices have been well documented elsewhere, and there is no reason to suppose that companies in the UAE would not also enjoy these benefits. These include, higher levels of employee motivation, enhanced employee performance and productivity, greater engagement and emotional commitment, reduced absenteeism and labour turnover, increased retention of female talent and the considerable competitive advantage of being able to attract and select the best women employees (e.g. Lewis 2010; Halpern and Cheung, 2008; Yang, 2006; Catalyst, 2004). Private-sector companies in the UAE that take the lead in maternity leave, flexi-working, sensitivity to family responsibilities and childcare provision today will have a considerable advantage in recruiting the best and most talented Emirate women tomorrow. However, local companies also need to be aware that creating work-life policies, like all other aspects of organizational management, will require top-level leadership support and will take time, energy and commitment to ensure that they are implemented successfully.
References
Al-Ali, J. (2008). Emiratisation: drawing UAE nationals into their surging economy. International Journal of Sociology and Social Policy, 28: 365-379.
Allen E., Elam, A., Langowitz, N. and Dean, M. (2007). Global Entrepreneurship Monitor: Report on Women and Entrepreneurship. Babson College, USA: The Centre for Women’s Leadership.
Alsanea, R. (2008). The Girls of Riyadh. London: Penguin Books.
Aycan, Z. (2008). Cross-cultural perspectives to work-family conflict. In Korabik, K. and Lero, D. (Eds.), Handbook of Work-Family Conflict: 359-371. Cambridge: Cambridge University Press.
Aycan, Z., Ayman, R., Bardoel, A., Desai, T., Drach-Zahavy, A., Hammer , L. Huang, T., Korabik, K., Lero, D., Mawardi, A., Poelmans, S., Rajadhyaksha, U., Shafiro, M. and Somech, A. (2004). Work-family conflict in cultural context: A ten-country investigation. Paper presented at the 19th Annual SIOP Conference, Chicago, April.
Ayree, S., Luk, V. and Lo, S (2002). Role stressors, inter-role conflict and well-being: the moderating influence of spousal support and coping behaviours among employed parents on Hong-Kong. Journal of Vocational Behaviour, 54: 259-278.
Catalyst (2004). The Bottom Line: Connecting Corporate Performance and Gender Diversity. New York: Catalyst.
Cavana, R., Delahaye, B. and Sekaran, U. (2001). Applied Business Research: Qualitative and Quantitative Methods. New York: John Wiley and Sons.
Skyline Business Journal, Volume IX-Issue 1-2013-2014
Constantine, Z. (2010). Emirate men urged to spend more time with children. Available at: http://www.thenational.ae/news/uae-news/Emirate-men-urged-to-spend-more-time-with-children (accessed 29 December 2010)
Davidson, C. (2009). Abu Dhabi’s new economy: oil, investment and domestic development. Middle East Policy, 16: 59-79.
Donaghy, R. (2001). The Future of Work-Life Balance, Economic and Social Research Council. Swindon, United Kingdom, Economic and Social Research Council.
Drago, R. (2007). Striking a Balance: Work, Family, Life. Boston: Dollars and Sense.
Dubai Strategic Plan (2008). Dubai strategic plan 2015. Available at: http://egov.dubai.ae/opt/CMScontent/Active/Corp/en/Documents/DSPE.pdf (accessed 12 November 2008).
Dubai Women’s Establishment (2008a). Reasons behind UAE women’s reluctance to participate in activating the country’s strategy. Available at: http://www.dwe.gov.ae/countrys_strategy.aspx (accessed 28November 2010).Dubai Women’s Establishment (2008b). Female Emirate employees in Dubai for the year 2008. Available at: http://www.dwe.gov.ae/women_dubai_06.aspx (accessed 16 June 2010).
Dyes, R. A. (2009). Helping Emirati women join the private sector. Available at: Emirates 247: http://www.emirates247.com/2.273/uae-economy/helping-emirati-women- join-the-private-sector-2009-04-29-1.9763 (accessed 22 December 2010).
El Ghannam, A. (2002). Analytical study of women’s participation in economic activities in Arab societies’, Equal Opportunities International, 21: 1-18.
Erogul, M. and McCrohan, D. (2008). Preliminary investigation of Emirate women entrepreneurs in the UAE. African Journal of Business Management, 2: 177-185.
Erogul, M. and McCrohan, D. (2007a). Do socio-cultural factors affect female entrepreneurship in the UAE? Proceedings of the Cultures and Context Conference, Aberdeen, United Kingdom, September.
Erogul, M. and McCrohan, D. (2007b). Socio-cultural factors inhibiting female entrepreneurship in the United Arab Emirates. Working paper, College of Business Sciences, Zayed University, Dubai, United Arab Emirates.
Farrell, F. (2008). Voices on Emiratization: the impact of Emirati culture on the workforce participation of national women in the UAE private banking sector. Journal of Islamic Law and Culture, 10: 107-168.
Friedman, S., Christensen, P., and Degroot, J. (2000). Harvard Business Review on Work and Life Balance. Boston: Harvard
Business Review.
Gambles, R., Lewis, S., and Rapoport, R. (2006). The Myth of Work-Life Balance. The Challenge of our Time. London: John Wiley and Sons.
Gelfand, M. and Knight, A. (2003). Cross-cultural perspectives on work-family conflict. In Poelman, S. (Ed.), Work and Family: An International Research Perspective: 401-415. London: Lawrence Erlbaum.
Haan, H. (2004). Small enterprises: women entrepreneurs in the UAE. Labor Market Study No. 19. Dubai, United Arab Emirates: Centre for Labor Market Research and Information, TANMIA/CLMRI.
Haan, H. (2002,). Report on a survey of UAE nationals in micro, small and medium-sized enterprises. Policy Research Paper No. 6. Dubai, United Arab Emirates: Centre for Labor Market Research and Information, TANMIA/CLMRI.
Halpern, D., and Cheung, F. (2008). Women at the Top: Powerful Leaders Tell us How to Combine Work and Family. London: John Wiley and Sons.
Hofstede, G. (2001). Culture’s Consequences: Comparing Values, Behaviors, Institutions and Organizations Across Nations. Thousand Oaks, California: Sage Publications.
Holdsworth, P. (2010). Native workers in the UAE still avoid working in the private sector’. Available at: http://news.gulfjobsmarket.com/native-workers-in-the-uae-still-avoid-working-in-the-private-sector-7861475-news (accessed 20 March, 2011).
Joplin, J., Shaffer, M., Francesco, A. and Lau, T. (2003). The macro environment and work-family conflict: development of a cross-cultural comparative framework. International Journal of Cross-Cultural Management, 3: 305-328.
Korabik, K., Lero, D. and Ayman, R. (2003). A multi-level approach to cross-cultural work-family research: A micro- and macro- perspective. International Journal of Cross-Cultural Management, 3: 289-303.
Lacey, R. (2009). Inside the Kingdom: Kings, Clerics, Modernists, Terrorists, and the Struggle for Saudi Arabia. London: Penguin Books.
Lacey, R. (2001). The Kingdom: Arabia and the House of Saud. London: Penguin Books.
Lewis, S. (2010).Towards New Conceptions of Work-Life Balance. London: Wiley.
Lewis S., Gambles, R. and Rapoport, R. (2007). The constraints of a work-balance approach: An international perspective’, International Journal of Human Resource Management, 18: 360-373.
Marmenout, M. (2009). Breaking gender stereotypes in the 40

Skyline Business Journal, Volume IX-Issue 1-2013-2014
Constantine, Z. (2010). Emirate men urged to spend more time with children. Available at: http://www.thenational.ae/news/uae-news/Emirate-men-urged-to-spend-more-time-with-children (accessed 29 December 2010)
Davidson, C. (2009). Abu Dhabi’s new economy: oil, investment and domestic development. Middle East Policy, 16: 59-79.
Donaghy, R. (2001). The Future of Work-Life Balance, Economic and Social Research Council. Swindon, United Kingdom, Economic and Social Research Council.
Drago, R. (2007). Striking a Balance: Work, Family, Life. Boston: Dollars and Sense.
Dubai Strategic Plan (2008). Dubai strategic plan 2015. Available at: http://egov.dubai.ae/opt/CMScontent/Active/Corp/en/Documents/DSPE.pdf (accessed 12 November 2008).
Dubai Women’s Establishment (2008a). Reasons behind UAE women’s reluctance to participate in activating the country’s strategy. Available at: http://www.dwe.gov.ae/countrys_strategy.aspx (accessed 28November 2010).Dubai Women’s Establishment (2008b). Female Emirate employees in Dubai for the year 2008. Available at: http://www.dwe.gov.ae/women_dubai_06.aspx (accessed 16 June 2010).
Dyes, R. A. (2009). Helping Emirati women join the private sector. Available at: Emirates 247: http://www.emirates247.com/2.273/uae-economy/helping-emirati-women- join-the-private-sector-2009-04-29-1.9763 (accessed 22 December 2010).
El Ghannam, A. (2002). Analytical study of women’s participation in economic activities in Arab societies’, Equal Opportunities International, 21: 1-18.
Erogul, M. and McCrohan, D. (2008). Preliminary investigation of Emirate women entrepreneurs in the UAE. African Journal of Business Management, 2: 177-185.
Erogul, M. and McCrohan, D. (2007a). Do socio-cultural factors affect female entrepreneurship in the UAE? Proceedings of the Cultures and Context Conference, Aberdeen, United Kingdom, September.
Erogul, M. and McCrohan, D. (2007b). Socio-cultural factors inhibiting female entrepreneurship in the United Arab Emirates. Working paper, College of Business Sciences, Zayed University, Dubai, United Arab Emirates.
Farrell, F. (2008). Voices on Emiratization: the impact of Emirati culture on the workforce participation of national women in the UAE private banking sector. Journal of Islamic Law and Culture, 10: 107-168.
Friedman, S., Christensen, P., and Degroot, J. (2000). Harvard Business Review on Work and Life Balance. Boston: Harvard
Business Review.
Gambles, R., Lewis, S., and Rapoport, R. (2006). The Myth of Work-Life Balance. The Challenge of our Time. London: John Wiley and Sons.
Gelfand, M. and Knight, A. (2003). Cross-cultural perspectives on work-family conflict. In Poelman, S. (Ed.), Work and Family: An International Research Perspective: 401-415. London: Lawrence Erlbaum.
Haan, H. (2004). Small enterprises: women entrepreneurs in the UAE. Labor Market Study No. 19. Dubai, United Arab Emirates: Centre for Labor Market Research and Information, TANMIA/CLMRI.
Haan, H. (2002,). Report on a survey of UAE nationals in micro, small and medium-sized enterprises. Policy Research Paper No. 6. Dubai, United Arab Emirates: Centre for Labor Market Research and Information, TANMIA/CLMRI.
Halpern, D., and Cheung, F. (2008). Women at the Top: Powerful Leaders Tell us How to Combine Work and Family. London: John Wiley and Sons.
Hofstede, G. (2001). Culture’s Consequences: Comparing Values, Behaviors, Institutions and Organizations Across Nations. Thousand Oaks, California: Sage Publications.
Holdsworth, P. (2010). Native workers in the UAE still avoid working in the private sector’. Available at: http://news.gulfjobsmarket.com/native-workers-in-the-uae-still-avoid-working-in-the-private-sector-7861475-news (accessed 20 March, 2011).
Joplin, J., Shaffer, M., Francesco, A. and Lau, T. (2003). The macro environment and work-family conflict: development of a cross-cultural comparative framework. International Journal of Cross-Cultural Management, 3: 305-328.
Korabik, K., Lero, D. and Ayman, R. (2003). A multi-level approach to cross-cultural work-family research: A micro- and macro- perspective. International Journal of Cross-Cultural Management, 3: 289-303.
Lacey, R. (2009). Inside the Kingdom: Kings, Clerics, Modernists, Terrorists, and the Struggle for Saudi Arabia. London: Penguin Books.
Lacey, R. (2001). The Kingdom: Arabia and the House of Saud. London: Penguin Books.
Lewis, S. (2010).Towards New Conceptions of Work-Life Balance. London: Wiley.
Lewis S., Gambles, R. and Rapoport, R. (2007). The constraints of a work-balance approach: An international perspective’, International Journal of Human Resource Management, 18: 360-373.
Marmenout, M. (2009). Breaking gender stereotypes in the
41

Skyline Business Journal, Volume IX-Issue 1-2013-2014
Middle East’, Research on Women-Focused Leadership Development in the Middle East. Available at: http://knowledge.insead.edu/women-gender-stereotypes.cfm (accessed 15 April 2010).
McCrohan, D., Erogul, M., Vellinga, N., Tong, Q. (2009). National Global Entrepreneurship Monitor Report for the United Arab Emirates. Dubai, United Arab Emirate:s College of Business Sciences, Zayed University.
Mero, J. (2009). International power 50. Fortune, October: 76-82.
Metcalfe, B. (2006). Exploring cultural dimensions of gender and management in the Middle-East. Thunderbird International Business Review, 48: 93-107.
Ministry of Social Affairs Federal Law No. 2 of 2001 on Social Security (2001). Available at: http://www.msa.gov.ae/MSA/AR/Documents/RulesAndPolicies/.pdf (accessed 19 October, 2010).
Ministry of State for Federal National Council Affairs (2009). Women in the United Arab Emirates: A Portrait of Progress. Abu Dhabi, United Arab Emirates: Ministry of State for Federal National Council Affairs.
Moore, L. and Forster, N. (2009). An exploratory analysis of cross-cultural differences in sex-typing, gender self-attributes; and the emergence of androgynous leadership traits. Indian Journal of Management, 2, July-December: 4-15.Mostafa, M. (2005). Attitudes toward women managers in
the United Arab Emirates. Journal of Managerial Psychology, 20: 522-540.Salloum, H. (2003). Women in the United Arab Emirates. London: Contemporary Review.
Thomas, D. (2004). Diversity as Strategy. Harvard Business Review. September: 98-108.
Thomas, R. (1996). Redefining Diversity. New York: Amacom.
Trade Arabia (2010). Women’s forum explores work-life balance. Available at: http://www.tradearabia.com/news/media_173183.htm (accessed 26 October, 2010).
United Arab Emirates Government (2008). Abu-Dhabi, United Arab Emirates: UAE Government Strategy Document 2008.
World Economic Forum (2012). The Global Gender Gap Report 2012. Geneva: World Economic Forum,
Yang, J. (2006). Pepsi’s diversity push pays off. Fortune, 4 September: 20.
Yang, N. (2005). Individualism-collectivism and work-family interface: A Sino-US comparison. In Poelmans, S. (Ed.), Work and Family: An International Research Perspective: 287-319. London: Lawrence Erlbaum.
Prof. Nick ForsterCollege of Business
PO Box 50927Al Faisal University
Riyadh 11533Kingdom of Saudi Arabia
Email:[email protected]
Aisha Al Ali EbrahimAccounts Manager
Emirates Integrated Telecommunications CompanyDu PLC
PO Box 502666Dubai
United Arab Emirates
Nadia Alma IbrahimResearch AnalystEmirates Airlines,PO Box 500686
DubaiUnited Arab Emirates
42

Skyline Business Journal, Volume IX-Issue 1-2013-2014
CHANGES IN EMPLOYER-EMPLOYEE RELATIONSHIP: IMPACT OF PERCEIVED ORGANIZATIONAL SUPPORT ON SOCIAL EXCHANGE OF THE OUTSOURCING INDUSTRY IN SRI LANKA
Sivalogathasan,V., Ashmel Hashim
Abstract:
The employer–employee relationship identified as social exchange relationship in the organization. The exchange determines the employee work outcomes which are greatly influenced by the Perceived Organizational Support (POS) and Organizational Commitment (OC). This paper mainly focused to evaluate the social exchange and the impact on the employee work outcomes in the outsourcing industry in Sri Lanka. The questionnaire survey method was used among 200 Information Communication Technology (ICT) professionals. The results indicate that POS establishes significant positive relationship with social exchange. This distinguished relationships facilitated and moderated by the organizational commitment. The researcher identified that the employer-employee relationship becomes absolutely paramount for a business process outsourcing organization, since the human capital becomes the most critical success factor because the business solutions tailor-made for a delivery organization are brain-born babies of their employees.
Keywords: Perceived organizational support, Organizational commitment, and Social exchange.
1. Introduction Sri Lanka plays a major role in outsourcing business in today’s context. There are over 300 IT and BPO companies. Earnings from exports of IT-BPO sector have shown a steady upward trend during the past decade, Sri Lanka is clearly emerging as a global sourcing destination in the region. IT-BPO exports have reached an estimated $ 275 million in 2006. The industry has set a target of $ 1 billion in export revenue from IT-BPO sector by 2016. Developing ICT and professional services off shore opportunities should be a high priority for development-oriented countries such as Sri Lanka. Sri Lanka moving up the ranking highlights its improving strengths as an outsourcing destination. IT/BPO and Knowledge Service industry is targeted to grow to become a billion dollar industry by 2016.
The Global Services Location Index (GSLI), analyses and ranks the top 50 countries worldwide as the best destinations for providing outsourcing services, including IT services and support, contact centres, and back-office support. Sri Lanka ranked number 21 in the index in 2011. The report positively stated that Sri Lanka has been promoted in the rankings assisted by low costs compared to the rest of the destinations. The combination of high people skills, favourable business environment and low cost enables India, China and Malaysia to be in the top three slots.
The outsourcing industry in Sri Lanka continues to be one of the key drivers of economic growth. As per Central Bank of Sri Lanka, the outsourcing industry is growing about 23% per annum, work force to be increase from 5,000 in 2004 to 50,000 in 2012 and yield per employee to be increased from US$ 20 in 2004 to US$ 40 in 2012. Sri Lanka is emerging as a global IT-BPO destination of choice in number of key focus domains. Global Services Magazine ranked Sri Lanka among top 20 ‘Emerging Countries’. This is mainly due to the very competent labour pool among the IT workforce, 43% of people have a degree or higher qualification in IT; around 84% have more than a year’s experience. More than 5500 graduates with IT related degrees and post graduate degrees are now joining the workforce each year, Further, the country produces close to 400,000 English speaking, IT literate individuals each year.
The research question was that “Due to what factor is the highest attrition rate caused?” and “why ‘employer- employee social exchanges are not working well specially in the outsourcing industry?” Therefore, the objective of this study is to be : To find out the existing Employer- Employee social
exchange of professional employees of outsourcing companies in Sri Lanka.
To evaluate how the work outcomes are affected by the social exchange.
To identify and determine the factors that influence social exchange in order to gain better outcome.
Hence the purpose of the research is to identify the nature of social exchanges that exist in the delivery of organizations and demarcate the factors that influence the work outcomes.
2. Literature Social Exchange Process Social Exchange Theory explores relationships and their possible impact, and explaines that people continually seek a balance in what they invest in a relationship and what they receive in return. Cropanzano and Mitchell (2005) have studied, in particular, the effects of good interaction on employee’s trust and commitment. Sharing analogous principles and opinions helps those interactions (Lawler & Yoon 1996), while variability in these factors may have negative effect (Hooper & Martin 2008). Focusing on the relationship between supervisor and employees, Social Exchange Theory helps to analyse how staff social interactions facilitate the exchange of resources, knowledge, time and emotional support. However, the supervisor–subordinate relationship refers to a process model. Easier access to information, help and involvement in decision-making can be the consequences of an effective supervisor–subordinate relationship (Wang et al. 2005). Further, Blau and Boal (1989) explained, people determine how equitable a reward is after comparing their inputs and outcomes with those of their co-workers. A balance between inputs and outputs, in comparison to others, strengthens social bonds between the parties and enhances relationship longevity. Both psychological contract and organization
43

Skyline Business Journal, Volume IX-Issue 1-2013-2014
commitment literatures have emphasized the importance of employee perceptions of the exchange relationship with the organizations. The commitment is best conceptualised as a social exchange relationship in which perceived value or perceived organizational support represent the employer side of exchange (Eisenberger, et.al 1990).
In the literature, trust, investment and long-term orientation are viewed as the basis for the relationship underlying social exchanges. In fact, investment and trust are intertwined in exchange relationships with some inherent risk that the investment will not be repaid, requiring trust. However, social exchanges require a long-term orientation, since the exchange is ongoing and based on feelings of obligation (Blau, 1964; Eisenberger, et.al, 1987; Cotterell, et.al 1992; Rousseau, 1995).
Perceived organizational support Perceived organisational support is an example of workplace relationships and can be conceptualised using social exchange theory because it is also based on the idea of reciprocity between employees and the organisation. It is defined as an employee’s perception of the extent to which the organisation values the work done and cares about them (Allen et al. 2003). The training is likely to be put into practice if employees receive organisational support Gumuseli and Ergin (2002). In addition, in some studies, perceived organisational support has been found to have a greater impact on affective commitment compared with supervisor–subordinate relationships, and engagement of employees (Settoon et al. 1996; Saks 2006). Eisenberger et al. (2002) found that perceived organisational support significantly affected commitment, citizenship behaviour and retention, and the impact depended on the quality of perceived reciprocity that had occurred. However, there is less research examining the relationship between workplace relationship and engagement, especially in the ICT environment.
Perceived organisational support is defined as the extent to which employees perceive that their contributions are valued by their organization and that the firm cares about their well-being (Eisenberger et al., 1986; Cropanzano & Mitchell, 2005). Essentially, social exchange theory applied in the work context argues that employees are willing to exchange their effort and time for various rewards offered them by the organization. Social exchange theory posits that employees are willing to exchange work performance for additional factors that are less tangible such as feeling valued and supported. Perceived organisational support signals an employer’s commitment to employees whereby employees reciprocate with increased efforts to help the organization. High perceived organisational support provides an indication that extra effort and performance will be noted and rewarded. Low perceived organisational support, on the other hand, implies that employees are disadvantaged in their exchange relationship with the organization and they run the risk that their efforts and performance will fail to be adequately compensated (Olga Epitropaki and Robin Martin, 2013).
Employees perceptions of high perceived organisational support will be accompanied by views of increased access
to various resources. The high perceived organisational support will constitute a resource-munificent condition whereas low perceived organisational support will be experienced as a resource-constrained condition. When perceived organisational support is high, employees will trust the organization to provide them access to the valuable resources. As a result, employees will be likely to use soft tactics to influence a manager. Rhoades and Eisenberger (2002) indicated that three general categories of favourable treatment received by employees such as fairness of treatment, supervisors support, and rewards and job conditions are positively related to perceived organizational support, which, in turn, is associated with outcomes favoured by employees - increased job satisfaction, positive mood, and reduced stress and the organization - increased affective commitment and performance and reduced turnover.
Organizational Commitment Organizational commitment is the employee’s psychological attachment to the organization. It is an attitude which can be contrasted with other work and related employee attitudes. Beyond this general sense, organizational scientists have developed many definitions of organizational commitment. An individual’s perceptions of their reciprocal obligations are often generated very early in the employer-employee relationship and can cover a range of issues including promotional opportunities, training and development, and the level of decision-making responsibility that the employee will receive (Turnley and Feldman 2000). According to Meyer and Allen’s (1991) three-component model of commitment, which characterize an employee’s commitment to the organization. Affective Commitment: is defined as the employee’s positive emotional attachment to the organization. An employee who is affectively committed strongly identifies with the goals of the organization and desires to remain a part of the organization. Continuance Commitment: The individual commits to the organization because he or she perceives high costs of losing organizational membership, including economic costs (such as pension accruals) and social costs (friendship ties with co-workers) that would be incurred. And Normative Commitment: The individual commits to and remains with an organization because of feelings of obligation.
Superior Work Performance The human relations school of managerial thought (Roethlisberger and Dickson, 1967), which basically argues that employee performance will improve as the employment relationship improves, has resulted in a wide variety of theories attempting to explain why this change occurs. The explanation provided by social exchange argues that the employee may perform at a higher level because an employee perceives an obligation to reciprocate for social gifts granted by the employer (Organ, 1977). Given social exchange arguments and past empirical evidence, we believe that perceived organizational support will be linked to both task and contextual performance. Social exchange theory suggests that positive perceptions about the employment relationship will lead to beneficial work behaviours through the process of obligatory reciprocation (Blau, 1964). The concept of the commitment is close to the concept involvement and identification. It can be argued that commitment can be
44

Skyline Business Journal, Volume IX-Issue 1-2013-2014
commitment literatures have emphasized the importance of employee perceptions of the exchange relationship with the organizations. The commitment is best conceptualised as a social exchange relationship in which perceived value or perceived organizational support represent the employer side of exchange (Eisenberger, et.al 1990).
In the literature, trust, investment and long-term orientation are viewed as the basis for the relationship underlying social exchanges. In fact, investment and trust are intertwined in exchange relationships with some inherent risk that the investment will not be repaid, requiring trust. However, social exchanges require a long-term orientation, since the exchange is ongoing and based on feelings of obligation (Blau, 1964; Eisenberger, et.al, 1987; Cotterell, et.al 1992; Rousseau, 1995).
Perceived organizational support Perceived organisational support is an example of workplace relationships and can be conceptualised using social exchange theory because it is also based on the idea of reciprocity between employees and the organisation. It is defined as an employee’s perception of the extent to which the organisation values the work done and cares about them (Allen et al. 2003). The training is likely to be put into practice if employees receive organisational support Gumuseli and Ergin (2002). In addition, in some studies, perceived organisational support has been found to have a greater impact on affective commitment compared with supervisor–subordinate relationships, and engagement of employees (Settoon et al. 1996; Saks 2006). Eisenberger et al. (2002) found that perceived organisational support significantly affected commitment, citizenship behaviour and retention, and the impact depended on the quality of perceived reciprocity that had occurred. However, there is less research examining the relationship between workplace relationship and engagement, especially in the ICT environment.
Perceived organisational support is defined as the extent to which employees perceive that their contributions are valued by their organization and that the firm cares about their well-being (Eisenberger et al., 1986; Cropanzano & Mitchell, 2005). Essentially, social exchange theory applied in the work context argues that employees are willing to exchange their effort and time for various rewards offered them by the organization. Social exchange theory posits that employees are willing to exchange work performance for additional factors that are less tangible such as feeling valued and supported. Perceived organisational support signals an employer’s commitment to employees whereby employees reciprocate with increased efforts to help the organization. High perceived organisational support provides an indication that extra effort and performance will be noted and rewarded. Low perceived organisational support, on the other hand, implies that employees are disadvantaged in their exchange relationship with the organization and they run the risk that their efforts and performance will fail to be adequately compensated (Olga Epitropaki and Robin Martin, 2013).
Employees perceptions of high perceived organisational support will be accompanied by views of increased access
to various resources. The high perceived organisational support will constitute a resource-munificent condition whereas low perceived organisational support will be experienced as a resource-constrained condition. When perceived organisational support is high, employees will trust the organization to provide them access to the valuable resources. As a result, employees will be likely to use soft tactics to influence a manager. Rhoades and Eisenberger (2002) indicated that three general categories of favourable treatment received by employees such as fairness of treatment, supervisors support, and rewards and job conditions are positively related to perceived organizational support, which, in turn, is associated with outcomes favoured by employees - increased job satisfaction, positive mood, and reduced stress and the organization - increased affective commitment and performance and reduced turnover.
Organizational Commitment Organizational commitment is the employee’s psychological attachment to the organization. It is an attitude which can be contrasted with other work and related employee attitudes. Beyond this general sense, organizational scientists have developed many definitions of organizational commitment. An individual’s perceptions of their reciprocal obligations are often generated very early in the employer-employee relationship and can cover a range of issues including promotional opportunities, training and development, and the level of decision-making responsibility that the employee will receive (Turnley and Feldman 2000). According to Meyer and Allen’s (1991) three-component model of commitment, which characterize an employee’s commitment to the organization. Affective Commitment: is defined as the employee’s positive emotional attachment to the organization. An employee who is affectively committed strongly identifies with the goals of the organization and desires to remain a part of the organization. Continuance Commitment: The individual commits to the organization because he or she perceives high costs of losing organizational membership, including economic costs (such as pension accruals) and social costs (friendship ties with co-workers) that would be incurred. And Normative Commitment: The individual commits to and remains with an organization because of feelings of obligation.
Superior Work Performance The human relations school of managerial thought (Roethlisberger and Dickson, 1967), which basically argues that employee performance will improve as the employment relationship improves, has resulted in a wide variety of theories attempting to explain why this change occurs. The explanation provided by social exchange argues that the employee may perform at a higher level because an employee perceives an obligation to reciprocate for social gifts granted by the employer (Organ, 1977). Given social exchange arguments and past empirical evidence, we believe that perceived organizational support will be linked to both task and contextual performance. Social exchange theory suggests that positive perceptions about the employment relationship will lead to beneficial work behaviours through the process of obligatory reciprocation (Blau, 1964). The concept of the commitment is close to the concept involvement and identification. It can be argued that commitment can be
Skyline Business Journal, Volume IX-Issue 1-2013-2014
viewed as an attitude or proximity towards the organization which links or attaches the identity of the employee, often to the organization.
Organizational Citizenship Behaviours Organizational citizenship behaviour is a unique aspect of individual activity at work, first mentioned in the early 1980s. It represents individual behaviour that is discretionary, not directly or explicitly recognized by the formal reward system, and in the aggregate promotes the efficient and effective functioning of the organization Organ (1988). These behaviours are rather a matter of personal choice, such that their omissions are not generally understood as punishable. Organizational citizenship behaviours are thought to have an important impact on the effectiveness and efficiency of work teams and organizations, therefore contributing to the overall productivity of the organization. Organizational citizenship behaviours are often considered a subset of contextual performance, employee behaviours, although not critical to the task or job, serve to facilitate organizational functioning (Lee and Allen, 2002).
Relative Absenteeism Absenteeism is a habitual pattern of absence from a duty or obligation. Traditionally, absenteeism has been viewed as an indicator of poor individual performance, as well as a breach of an implicit contract between employee and employer; it was seen as a management problem, and framed in economic or quasi-economic terms. Frequent absence from the workplace may be indicative of poor morale or of sick building syndrome. However, many employers have implemented absence policies which make no distinction between absences for genuine illness and absence for inappropriate reasons. One of these policies is the calculation of the Bradford factor, which only takes the total number and frequency of absences into account, not the kind of absence. Employee absenteeism is the absence of an employee from work (Nelson & Quick 2008). It is two types: Innocent absenteeism - is one in which the employee is absent from work due to genuine cause or reason. It may be due to his illness or personal family problem or any other real reason and Culpable Absenteeism - is one in which a person is absent from work without any genuine reason or cause. He may be pretending to be ill or just wanted a holiday and stay at home.
Relative latenessLateness behaviour can be described as arriving at work after scheduled time (Shafritz, 1980). Typically, lateness is addressed in the literature as withdrawal behaviour, a category that includes absence and turnover as well (Herzberg 1957). Compared to the latter behaviours, lateness is a milder form of withdrawal, not every case of late arrival can be considered a violation of company rules. Another distinctive characteristic of lateness is that typically it is a violation of behaviour within the employees’ control. Whereas worker dismissal is an involuntary type of turn over, and certified sickness or funeral attendance can be classified as involuntary absence (March and Simon, 1958). Most of the lateness occurrence can be avoided. Indeed, although some cases of lateness are not made intentionally. Blau (1994) has indicated, that proper time management may reduce the tardiness even when the
immediate cause is not with the employee’s direct control. From the late employees perspective, lateness behaviour may indicate the initial withdrawal from the work, that may deteriorate towards more sever withdrawal such as absenteeism and turnover.
The literature constructively discusses the strategic subject’s areas which are required for this research in a standardized manner. While the contracts virtually exists in distinguished dimensions the incorporated literature illustrates that the social exchange to have relationship with superior work performance, organizational citizenship behaviour, relative absenteeism and relative lateness.
Perceived Organizational support
Organizational Commitment
Social Exchange
Superior Work Performance
OCB
Relative Absenteeism
Relate lateness
Figure 1: Illustrate the Conceptual Frame Work
The above conceptual diagram was developed based on the existing literature incorporated in this research study. It is constructively argued that perceived organizational support is linked to organizational exchange process via organizational commitment as a moderator. Further, the exchange process results in the social exchange which in turn influences the work related outcome of employees.Hypothesis1: Higher POS is positively correlated to social exchange process by moderating organizational commitment which leads to positive superior work performance and organizational citizenship behaviour.
Hypothesis2: Higher POS is positively correlated to social exchange process by moderating organizational commitment leads to negative relative absenteeism and relative lateness.
3. Research MethodologyA large number of small players primarily dominates the outsourcing industry in Sri Lanka. The study was limited to a few selected players in the outsourcing organizations located in Colombo city. The study has carried out user satisfied sampling approach within the 200 selected samples in five organizations. The sample included the male and female distribution rate as per the organizations proportionate. Population data was gathered using a quantitative technique method by standard questionnaire. The sample is realistic and purposeful. It is comprised of employees from all functional areas such as delivery, process, HR, finance, training, IT, and administration. The researcher meaningfully used the Likert scale to measure the deviation of answers. All variables were measured using a 7-point scale from 1 (strongly disagree) to 7 (strongly agree). Further the researcher used regression analysis, ANOVA analysis, and Correlation analysis to analyse the variables. The study used descriptive mean analysis, standard deviation and standard error analysis to validate the reliability of the data.
45

Skyline Business Journal, Volume IX-Issue 1-2013-2014
4. Analysis Descriptive Statistics Out of 200 usable questionnaires 144 responses were received with the response rate of 72%. The average mean age range is between 26-31. Averagely 60% of the employees have a first degree and 20% have a master’s level or diploma level qualification. It is highlighted that 1 out of 5 employees have a master’s level qualification such as MBA, MSc. However 1 employee out of 5 also is identified with Diploma or Advanced Diploma level qualification. The selected sample comprised of 48.2 % Male and 50% Female employees. It is evident that 42% of the females’ employees are employed in the junior- middle level layer. However only 28% of the male segment belongs to junior – middle level segments and 14% of the male segments belong to senior or higher role. This displays a very clear disparity in the male and female employment distribution. Further 70.1% of the employees are demarcated in the permanent cadre. 29.99% of the employees are identified either in the probation or contract status. It is evident that 54% of the employees were in the 6 -12 month tenure, 17% being in the 12-60 months tenure, 5% of the employees with greater than 60 months, and 24% of the employees belongs to less than 6 months tenure.
The study analysed the overall means of independent, depended variables and the attributes. It is highlighted that the perceived organizational support represent the maximum mean scale 7 among the rest. The social exchange and organization commitment were consecutively the highest scales at 6.67 and 6.75. The relative lateness accounts for the lower mean scale 1.80. Interestingly, superior work performance constitutes the highest average mean of 5.37 all entire variables. The second highest average mean is recorded by organizational commitment 5.05, followed by the third highest average means in the perceived organizational support 4.84. The above analysis justifies the validity and the reliability of the data. The average mean analysis, highest and lowest mean scale justify that the employees were able to concisely select or distinguish the individualistic answers easily incorporated in the questionnaire and constitute the reliability.
Perceived Organizational Support and Social Exchange (M1)The perceived organizational support was analysed using three dimensional frame work model which included a support from the organization, recognition for employee innovative ideas, and employee attitude towards organization brand equity. The employee attitude indicates the highest mean value of 5.12 while the factor support from the organization shows the lowest mean value of 4.68. All means values have low standard error and low standard deviation. Overall, perceived organizational support was calculated by averaging these values of attributes and the mean value of 4.84.
The research identified perceived organizational support illustrates a positive relationship with social exchange. The model summary explains R2 30.2 percent of total variation observed in the dependent variable of social exchange. The analysis of variance (ANOVA) of the model was highly significant at 0.01 level. The regression analyses explain
independent variable perceived organizational support has 51.2 percent positive impact on the depended variable social exchange. The coefficient demonstrates the marginal impact of an independent variable.
POS, Organizational Commitment and Social Exchange (M2) The model summary explains R2 44.9 percent of total variation observed in the dependent variable social exchange. This indicates when organizational commitment plays a moderator role 14.7% increased sensitive variation can be expected. This justify that organizational commitment plays a facilitation role with the independent variable. The analysis of variance (ANOVA) of the model was highly significant at the 0.01 level. The regression analysis explains independent variable perceived organizational support has 33.8% positive impact on the depended variable social exchange. However, moderator variable organizational commitment plays a very significant role by placing 49.7% positive impact on the social exchange. This shows that the organizational commitment plays a facilitation role with the perceived organizational support and holding the domination to a greater degree.
This study compared and contrast perceived organizational support, organizational commitment and social exchange to determine how the relationship distribution varies across distinguished male and female segments. The male vs female analysis doesn’t indicate significance variation on the total variation. The social exchange doesn’t significantly depend on gender. The analysis of variance (ANOVA) of the model was highly significant at the 0.01 level. The female segment coefficient analysis indicates that perceived organizational support shows relatively positive relationship of 27% with social exchange. The male segment coefficient analysis indicates that perceived organizational support shows a positive relationship of 15.2% with social exchange. The Female segments indicates perceived organizational support is relatively high 12% compared with male segment, the possible root cause is females generally seek better opportunities, the public relation has been comparatively less compared with male. Coefficient analysis indicates that the female segment shows very high positive relationship with social exchange and it is 7% higher compared to the male segment. The female segments shows relatively higher deviation compared with the male segment. It is possibly due to female takes longer period of time to build commitment and it is very consistent.
The study compared and contrast perceived organizational support, organizational commitment and social exchange to determine how the relationship distribution varies across the distinguished permanent and other categories of employees. The permanent vs. other employees’ analysis indicates 46% variation is the depended variable. Permanent vs. others analysis indicates decreasing positive variance 41% on the depended variable. However it is 5% less compared to the other segments, the other type of employees shows inferior social exchange compared to permanent employee. This is due to they are in the early stage or short term of their employment trying to build the social exchange with their organization. The Permanent employees disclose relatively better social exchange than the other type of employees.
Skyline Business Journal, Volume IX-Issue 1-2013-2014
It is evident that social exchange is built only in the long term basis and approach. The analysis of variance (ANOVA) of the model was highly significant at the 0.01 level. Coefficient analysis indicates that perceived organizational support shows a positive relationship of 38.9% with social exchange, Coefficient analysis indicates that perceived organizational support shows very inferior 7.7% positive relationship with social in the probation or contract employees. Probation or contract employees are not long lasting consistently, they disclose lower perceived organizational support. It is evident that perceived organizational support is not built in the short term. Permanent employee segment indicates that they disclose perceived organizational support very significantly compared with the probation or contract segment. It is evident that a perceived organizational support can be only build in longer term perspective.
Coefficient analysis indicates that organizational commitment shows significant variation on the dependent variable 4.3%. It discloses 65% with social exchange. Probationary or contract type segments illustrate a greater degree of commitment to the organization than the permanent employees since they wanted to achieve a better and stable position in the current organization, hence they keep higher energy and maintain higher organizational commitment. The permanent employee segment shows less organizational commitments compared with the probation and other type of employee segment. Maybe, they have already achieved stable positions in their job roles.
The work outcome is measured based on the data input. It is evident that all work outcomes resulted in considerable total variance on the social exchange while the perceived organizational support acted as the independent variable and the organizational commitment was moderated. The highest variation is monitored in the organizational citizenship behaviour 49.9%, the lowest was identified in the relative absenteeism 45.3%. Superior Work Performance and the relative absenteeism are accounts for 45.9 percent. Having considered the coefficient values it is possible to come to the decision that the perceived organizational support has 8.80 % positive relationship on the superior work outcome while the social exchanges acts as a dependent variable. Organizational citizenship behaviour accounts for 45.6% positive relationship. However, the coefficient value indicates that relative absenteeism and relative lateness has a negative relationship with perceived organizational support and social exchange. Relative absenteeism constitutes 29.7% negative relationship, whereas relative lateness has 18.9% negative relationship.
It is evident that overall the moderator organizational commitment enhances the relationship further than the perceived organizational support alone. The highest facilitation 47% was identified in the relative absenteeism and it is a negative impact. The lowest facilitation in relationship was identified in organizational citizenship behaviour 6.25%. Superior work performance and relative lateness consecutively accounts for 38 percent positive and 27% negative facilitation in their relationship with their specified variables.
5. Conclusions BPO organizations provide limited attention to distinguished dimension of productive exchange. The employer – employee social exchange is an existing reality. It is absolutely essential for BPO companies to maintain it to a rational level to consistently determine high productivity in employees work outcome. It is justifiable that the exchange process is primarily influenced by the culture, which opens many avenues for future research. Exchange process illustrates clear disparity among educational level, gender, experience, tenure and employee tier. It can be argued that the exchange process can be subjectively quantified and measured by establishing a human resource accounting system enabling the employees to have on Individual Exchange Index (IEI), possibly this can be utilized to determine productivity and ROIs. This subject area creates room for future research. Even though BPO companies understand and use productive exchange in a constructive manner, they are not using the exchange as a business strategy to generate profits due to a greater degree of risk imposed by the environmental factors.
Social exchange is built on a long term perspective and trust determines the baseline and is highly significant in the non-permanent segments; possibly they wanted to develop themselves as informal group to eliminate the risk factor oto their job role. Perceived organizational support and social exchange relationship is very significantly facilitated by the organizational commitment. It acts as a positive inducer in determining the superior work performance and organizational citizenship behaviour. Social exchange process remains high among the employees who have the correct combinations of managerial and technical knowledge. Does technical knowledge facilitate social exchange is interesting subject area for future research. Social exchange being very strong among the female employee compared with male workers in the BPO sector. Social exchange generate optimum productivity, however it is amazing to identify a less or number of female employees are holding managerial position in the BPO sector due to the Asian culture. Organizational citizenship behaviour is increasingly involved in social exchange. The availability of organizational citizenship behaviour is absolutely critical to generate productive exchange. The positive (superior work performance and organizational citizenship behaviour) and negative work outcomes (relative lateness and relative absenteeism) relationship, variation and impact are facilitated and moderated by the organizational commitment proportionally. Perceived organizational support generated positive relationship with the social exchange, the relationship is very negatively enhanced while the moderator organizational commitment is involved. Organizational commitment is comparatively very high among the contract and external employees than among permanent employees. Even though the social exchanges have received relatively less significant focus or limited attention in the BPO companies, they are strategic important elements or facts in the employment exchange or relationship. They are the baseline to decide whether retaining an employee is worth while or profitable for an organization in the long run. Possibly the research
46
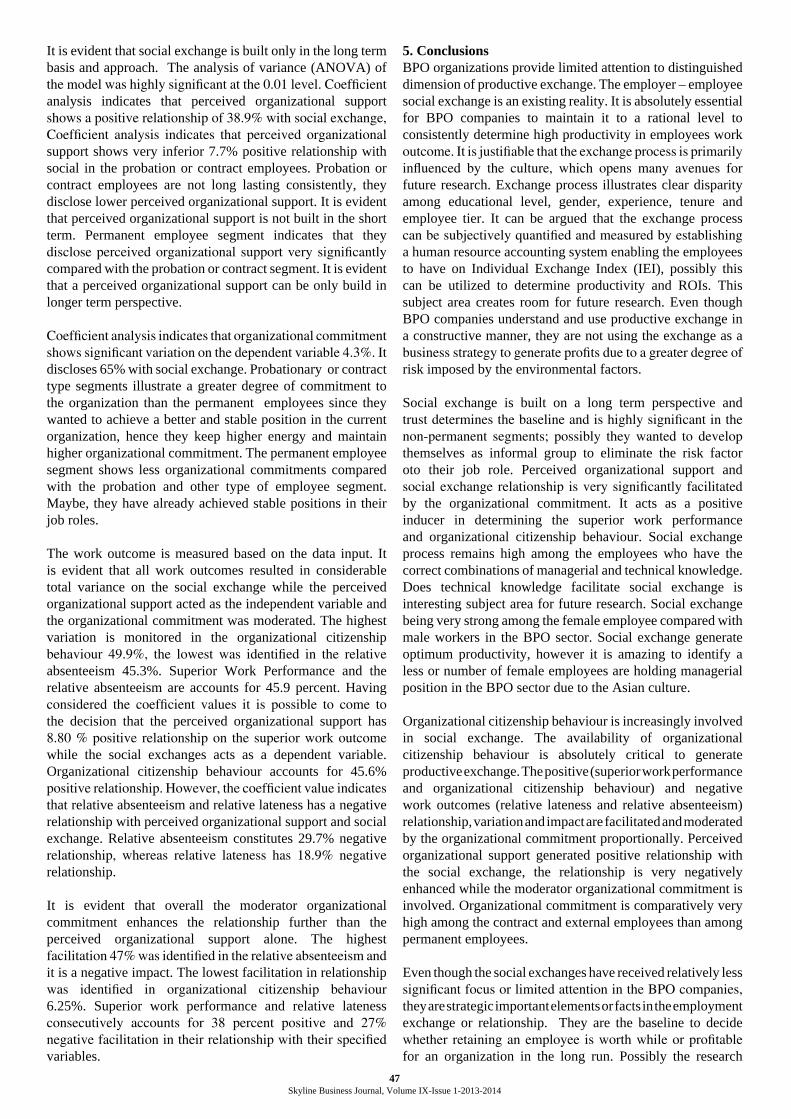
Skyline Business Journal, Volume IX-Issue 1-2013-2014
It is evident that social exchange is built only in the long term basis and approach. The analysis of variance (ANOVA) of the model was highly significant at the 0.01 level. Coefficient analysis indicates that perceived organizational support shows a positive relationship of 38.9% with social exchange, Coefficient analysis indicates that perceived organizational support shows very inferior 7.7% positive relationship with social in the probation or contract employees. Probation or contract employees are not long lasting consistently, they disclose lower perceived organizational support. It is evident that perceived organizational support is not built in the short term. Permanent employee segment indicates that they disclose perceived organizational support very significantly compared with the probation or contract segment. It is evident that a perceived organizational support can be only build in longer term perspective.
Coefficient analysis indicates that organizational commitment shows significant variation on the dependent variable 4.3%. It discloses 65% with social exchange. Probationary or contract type segments illustrate a greater degree of commitment to the organization than the permanent employees since they wanted to achieve a better and stable position in the current organization, hence they keep higher energy and maintain higher organizational commitment. The permanent employee segment shows less organizational commitments compared with the probation and other type of employee segment. Maybe, they have already achieved stable positions in their job roles.
The work outcome is measured based on the data input. It is evident that all work outcomes resulted in considerable total variance on the social exchange while the perceived organizational support acted as the independent variable and the organizational commitment was moderated. The highest variation is monitored in the organizational citizenship behaviour 49.9%, the lowest was identified in the relative absenteeism 45.3%. Superior Work Performance and the relative absenteeism are accounts for 45.9 percent. Having considered the coefficient values it is possible to come to the decision that the perceived organizational support has 8.80 % positive relationship on the superior work outcome while the social exchanges acts as a dependent variable. Organizational citizenship behaviour accounts for 45.6% positive relationship. However, the coefficient value indicates that relative absenteeism and relative lateness has a negative relationship with perceived organizational support and social exchange. Relative absenteeism constitutes 29.7% negative relationship, whereas relative lateness has 18.9% negative relationship.
It is evident that overall the moderator organizational commitment enhances the relationship further than the perceived organizational support alone. The highest facilitation 47% was identified in the relative absenteeism and it is a negative impact. The lowest facilitation in relationship was identified in organizational citizenship behaviour 6.25%. Superior work performance and relative lateness consecutively accounts for 38 percent positive and 27% negative facilitation in their relationship with their specified variables.
5. Conclusions BPO organizations provide limited attention to distinguished dimension of productive exchange. The employer – employee social exchange is an existing reality. It is absolutely essential for BPO companies to maintain it to a rational level to consistently determine high productivity in employees work outcome. It is justifiable that the exchange process is primarily influenced by the culture, which opens many avenues for future research. Exchange process illustrates clear disparity among educational level, gender, experience, tenure and employee tier. It can be argued that the exchange process can be subjectively quantified and measured by establishing a human resource accounting system enabling the employees to have on Individual Exchange Index (IEI), possibly this can be utilized to determine productivity and ROIs. This subject area creates room for future research. Even though BPO companies understand and use productive exchange in a constructive manner, they are not using the exchange as a business strategy to generate profits due to a greater degree of risk imposed by the environmental factors.
Social exchange is built on a long term perspective and trust determines the baseline and is highly significant in the non-permanent segments; possibly they wanted to develop themselves as informal group to eliminate the risk factor oto their job role. Perceived organizational support and social exchange relationship is very significantly facilitated by the organizational commitment. It acts as a positive inducer in determining the superior work performance and organizational citizenship behaviour. Social exchange process remains high among the employees who have the correct combinations of managerial and technical knowledge. Does technical knowledge facilitate social exchange is interesting subject area for future research. Social exchange being very strong among the female employee compared with male workers in the BPO sector. Social exchange generate optimum productivity, however it is amazing to identify a less or number of female employees are holding managerial position in the BPO sector due to the Asian culture. Organizational citizenship behaviour is increasingly involved in social exchange. The availability of organizational citizenship behaviour is absolutely critical to generate productive exchange. The positive (superior work performance and organizational citizenship behaviour) and negative work outcomes (relative lateness and relative absenteeism) relationship, variation and impact are facilitated and moderated by the organizational commitment proportionally. Perceived organizational support generated positive relationship with the social exchange, the relationship is very negatively enhanced while the moderator organizational commitment is involved. Organizational commitment is comparatively very high among the contract and external employees than among permanent employees. Even though the social exchanges have received relatively less significant focus or limited attention in the BPO companies, they are strategic important elements or facts in the employment exchange or relationship. They are the baseline to decide whether retaining an employee is worth while or profitable for an organization in the long run. Possibly the research
47
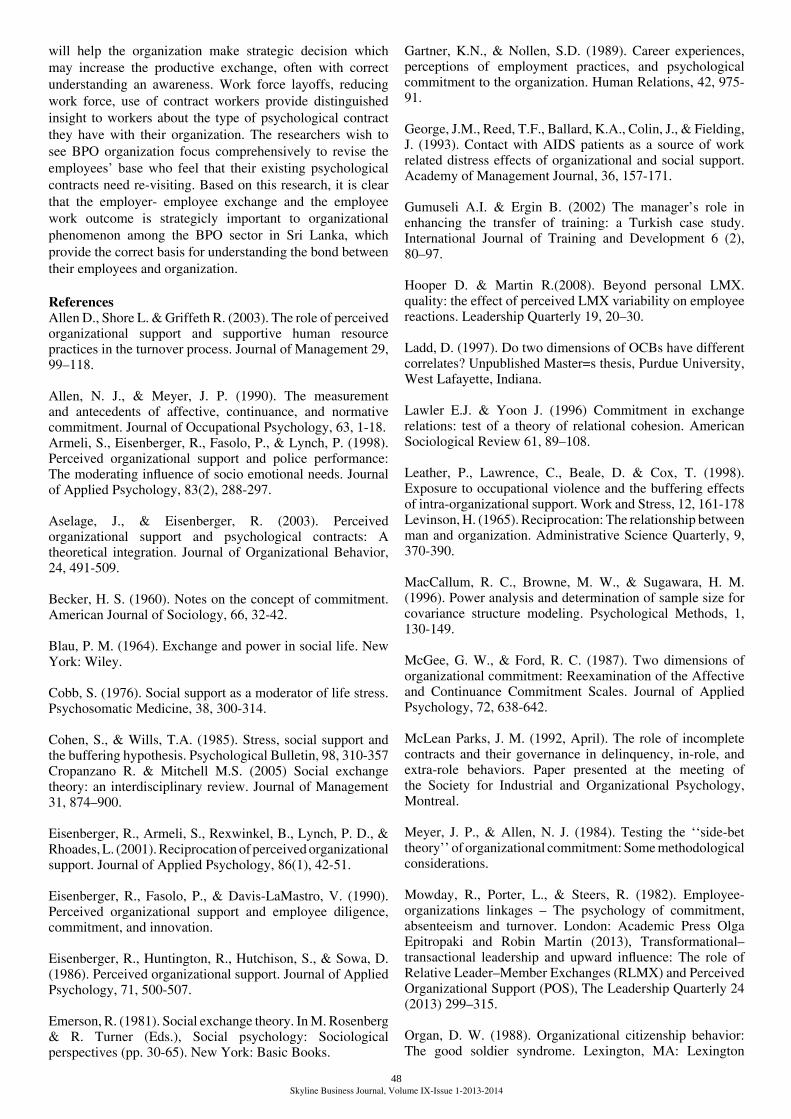
Skyline Business Journal, Volume IX-Issue 1-2013-2014
will help the organization make strategic decision which may increase the productive exchange, often with correct understanding an awareness. Work force layoffs, reducing work force, use of contract workers provide distinguished insight to workers about the type of psychological contract they have with their organization. The researchers wish to see BPO organization focus comprehensively to revise the employees’ base who feel that their existing psychological contracts need re-visiting. Based on this research, it is clear that the employer- employee exchange and the employee work outcome is strategicly important to organizational phenomenon among the BPO sector in Sri Lanka, which provide the correct basis for understanding the bond between their employees and organization.
ReferencesAllen D., Shore L. & Griffeth R. (2003). The role of perceived organizational support and supportive human resource practices in the turnover process. Journal of Management 29, 99–118.
Allen, N. J., & Meyer, J. P. (1990). The measurement and antecedents of affective, continuance, and normative commitment. Journal of Occupational Psychology, 63, 1-18.Armeli, S., Eisenberger, R., Fasolo, P., & Lynch, P. (1998). Perceived organizational support and police performance: The moderating influence of socio emotional needs. Journal of Applied Psychology, 83(2), 288-297.
Aselage, J., & Eisenberger, R. (2003). Perceived organizational support and psychological contracts: A theoretical integration. Journal of Organizational Behavior, 24, 491-509.
Becker, H. S. (1960). Notes on the concept of commitment. American Journal of Sociology, 66, 32-42.
Blau, P. M. (1964). Exchange and power in social life. New York: Wiley.
Cobb, S. (1976). Social support as a moderator of life stress. Psychosomatic Medicine, 38, 300-314.
Cohen, S., & Wills, T.A. (1985). Stress, social support and the buffering hypothesis. Psychological Bulletin, 98, 310-357Cropanzano R. & Mitchell M.S. (2005) Social exchange theory: an interdisciplinary review. Journal of Management 31, 874–900.
Eisenberger, R., Armeli, S., Rexwinkel, B., Lynch, P. D., & Rhoades, L. (2001). Reciprocation of perceived organizational support. Journal of Applied Psychology, 86(1), 42-51.
Eisenberger, R., Fasolo, P., & Davis-LaMastro, V. (1990). Perceived organizational support and employee diligence, commitment, and innovation.
Eisenberger, R., Huntington, R., Hutchison, S., & Sowa, D. (1986). Perceived organizational support. Journal of Applied Psychology, 71, 500-507.
Emerson, R. (1981). Social exchange theory. In M. Rosenberg & R. Turner (Eds.), Social psychology: Sociological perspectives (pp. 30-65). New York: Basic Books.
Gartner, K.N., & Nollen, S.D. (1989). Career experiences, perceptions of employment practices, and psychological commitment to the organization. Human Relations, 42, 975- 91.
George, J.M., Reed, T.F., Ballard, K.A., Colin, J., & Fielding, J. (1993). Contact with AIDS patients as a source of work related distress effects of organizational and social support. Academy of Management Journal, 36, 157-171.
Gumuseli A.I. & Ergin B. (2002) The manager’s role in enhancing the transfer of training: a Turkish case study. International Journal of Training and Development 6 (2), 80–97.
Hooper D. & Martin R.(2008). Beyond personal LMX. quality: the effect of perceived LMX variability on employee reactions. Leadership Quarterly 19, 20–30.
Ladd, D. (1997). Do two dimensions of OCBs have different correlates? Unpublished Master=s thesis, Purdue University, West Lafayette, Indiana.
Lawler E.J. & Yoon J. (1996) Commitment in exchange relations: test of a theory of relational cohesion. American Sociological Review 61, 89–108.
Leather, P., Lawrence, C., Beale, D. & Cox, T. (1998). Exposure to occupational violence and the buffering effects of intra-organizational support. Work and Stress, 12, 161-178Levinson, H. (1965). Reciprocation: The relationship between man and organization. Administrative Science Quarterly, 9, 370-390.
MacCallum, R. C., Browne, M. W., & Sugawara, H. M. (1996). Power analysis and determination of sample size for covariance structure modeling. Psychological Methods, 1, 130-149.
McGee, G. W., & Ford, R. C. (1987). Two dimensions of organizational commitment: Reexamination of the Affective and Continuance Commitment Scales. Journal of Applied Psychology, 72, 638-642.
McLean Parks, J. M. (1992, April). The role of incomplete contracts and their governance in delinquency, in-role, and extra-role behaviors. Paper presented at the meeting of the Society for Industrial and Organizational Psychology, Montreal.
Meyer, J. P., & Allen, N. J. (1984). Testing the ‘‘side-bet theory’’ of organizational commitment: Some methodological considerations.
Mowday, R., Porter, L., & Steers, R. (1982). Employee-organizations linkages – The psychology of commitment, absenteeism and turnover. London: Academic Press Olga Epitropaki and Robin Martin (2013), Transformational–transactional leadership and upward influence: The role of Relative Leader–Member Exchanges (RLMX) and Perceived Organizational Support (POS), The Leadership Quarterly 24 (2013) 299–315.
Organ, D. W. (1988). Organizational citizenship behavior: The good soldier syndrome. Lexington, MA: Lexington
Skyline Business Journal, Volume IX-Issue 1-2013-2014
Books.
Rhoades, L., & Eisenberger, R. (2002). Perceived organizational support: A review of the literature. Journal of Applied Psychology, 87(4), 698-714.
Rousseau, D. M. (1989). Psychological and implied contracts in organizations. Employee Rights and Responsibilities Journal, 2, 121-139.
Rousseau, D. M. (1990). New hire perceptions of their own and their employer’s obligations: A study of psychological contracts. Journal of Organizational Behavior, 11, 389-400.Rousseau, D. M. (1995). Psychological contracts in organizations: Understanding written and unwritten agreements. Thousand Oaks, CA: Sage.
Rousseau, D. M., & McLean Parks, J. M. (1993). The contracts of individuals and organizations. Research in Organizational Behavior, 15, 1-43.
Rousseau, D. M., & Tijoriwala, S. A. (1998). Assessing psychological contracts: Issues, alternatives and measures. Journal of Organizational Behavior, 19, 679-695.
Saks A.M. (2006) Antecedents and consequences of employee engagement. Journal of Managerial Psychology 21, 600– 619.
Settoon R.P., Bennett N. & Liden R.C. (1996) Social exchange in organizations: perceived organizational support, leader–member exchange and employee reciprocity. Journal of Applied Psychology 81, 219–227.
Shore, L. M., & Wayne, S. J. (1993). Commitment and employee behavior: Comparison of effective commitment and continuance commitment with perceived organizational support. Journal of Applied Psychology, 78, 774-780.
Shore, L.M. & Shore, T.H. (1995). Perceived organizational support and organizational justice. In Cropanzano, R.S. & K.M. Kacmar (Eds.). Organizational politics, justice, and support: Managing the social climate of the workplace, 149-164. Westport, CT: Quorum.
Smith, C. A., Organ, D. W., & Near, J. P. (1983). Organizational citizenship behavior: Its nature and antecedents. Journal of Applied Psychology, 68, 653-663.
Staw, B.M. (1995). Psychological dimensions of organizational behavior . (2nd ed.). New Jersey.
Wang H., Law K., Hackett R., Wang D. & Chen Z. (2005) Leader–member exchange as a mediator of the relationship between transformational leadership and followers’ performance and organizational citizenship behaviour. Academy of Management Journal 48, 420–432.
Witt, L.A. (1991). Exchange ideology as a moderator of job attitudes organizational citizenship behaviors relationships. Journal of Applied Social Psychology, 21, 1490-1501.
Table 1: Descriptive Statistics and RegressionAnalysis of models
Sivalogathasan,V.PhD Scholar, School of Management,
Zhejiang University, Hangzhou, China.&
Senior Lecturer in Management StudiesThe Faculty of Humanities and Social Science
The Open University of SriLankaNawala, Nugegoda
SriLankaEmail:[email protected]
Ashmel HashimSenior Lecturer
Al-Khawarizmi International CollegeUnited Arab Emirates (UAE)Email: [email protected]
Organizational politics, justice, and support: Managing the social climate of the workplace, 149-164. Westport, CT: Quorum
Smith, C. A., Organ, D. W., & Near, J. P. (1983). Organizational citizenship behavior: Its nature and antecedents. Journal of Applied Psychology, 68, 653-663.
Staw, B.M. (1995). Psychological dimensions of organizational behavior . (2nd ed.). New Jersey
Wang H., Law K., Hackett R., Wang D. & Chen Z. (2005) Leader–member exchange as a mediator of the relationship between transformational leadership and followers’ performance and organizational citizenship behaviour. Academy of Management Journal 48, 420–432.
Witt, L.A. (1991). Exchange ideology as a moderator of job attitudes organizational citizenship behaviors relationships. Journal of Applied Social Psychology, 21, 1490-1501.
Table 1: Descriptive Statistics and Regression Analysis of models
Variables Mean SD Social Exchange M1 M2
Perceived Organizational Support 4.84 1.04 a a Social Exchange 4.69 0.97 b b
Superior Work Performance 5.37 0.75 Organizational Citizenship Behaviour
4.82 0.49
Relative Absenteeism 4.55 0.68 Relative Lateness 3.43 1.00 Organizational Commitment 5.05 0.83 a R 0.550 0.670 R2 0.302 0.449 Adjusted R2 0.297 0441 Std.Error 0.814 0.726 F 61.43 57.35 Sig 0.000* 0.000*
a. Predictors: (Constant), Perceived Organizational Support, Organizational Commitment
b. Dependent Variable: Social Exchange, and * Significant at 0.05 level.
Table 2: Model Summary and Regression Analysis of Workout comes
Variables Mean Workout comes
SWP OCB RA RL Perceived Organizational Support Social Exchange
R2 0.307 0.393 0.327 0.321 Sig 0.000
* 0.000* 0.000
* 0.000*
ß +0.054
+0.048 -0.099
-0.014
Perceived Organizational Support + Organizational Commitment Social Exchange
R2 0.459 0.499 0.453 0.459 Sig 0.000
* 0.000* 0.000
* 0.000*
ß +0.088
+0.456 -0.297
-0.189
a. Predictors: (Constant), Perceived Organizational Support, Organizational Commitment
b. Dependent Variable: Social Exchange, Economic Exchange
* Significant at 0.05 level.
Table 2: Model Summary and Regression Analysis of Work Outcomes
48
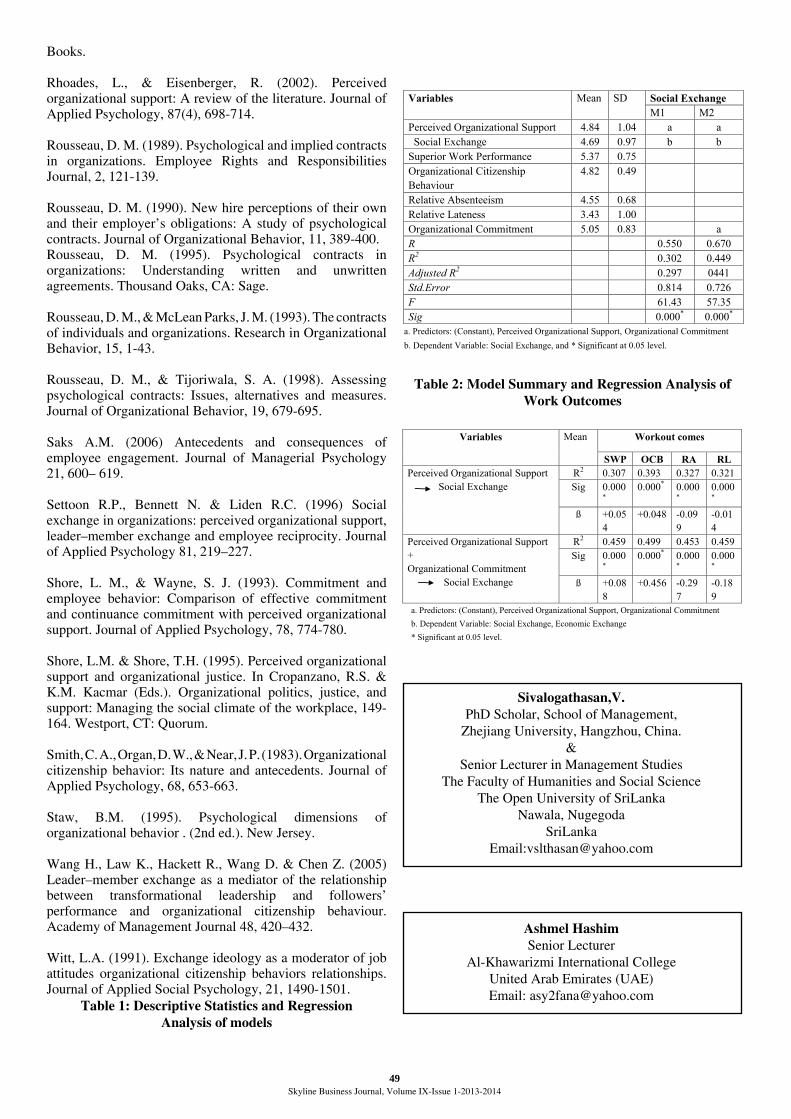
Skyline Business Journal, Volume IX-Issue 1-2013-2014
Books.
Rhoades, L., & Eisenberger, R. (2002). Perceived organizational support: A review of the literature. Journal of Applied Psychology, 87(4), 698-714.
Rousseau, D. M. (1989). Psychological and implied contracts in organizations. Employee Rights and Responsibilities Journal, 2, 121-139.
Rousseau, D. M. (1990). New hire perceptions of their own and their employer’s obligations: A study of psychological contracts. Journal of Organizational Behavior, 11, 389-400.Rousseau, D. M. (1995). Psychological contracts in organizations: Understanding written and unwritten agreements. Thousand Oaks, CA: Sage.
Rousseau, D. M., & McLean Parks, J. M. (1993). The contracts of individuals and organizations. Research in Organizational Behavior, 15, 1-43.
Rousseau, D. M., & Tijoriwala, S. A. (1998). Assessing psychological contracts: Issues, alternatives and measures. Journal of Organizational Behavior, 19, 679-695.
Saks A.M. (2006) Antecedents and consequences of employee engagement. Journal of Managerial Psychology 21, 600– 619.
Settoon R.P., Bennett N. & Liden R.C. (1996) Social exchange in organizations: perceived organizational support, leader–member exchange and employee reciprocity. Journal of Applied Psychology 81, 219–227.
Shore, L. M., & Wayne, S. J. (1993). Commitment and employee behavior: Comparison of effective commitment and continuance commitment with perceived organizational support. Journal of Applied Psychology, 78, 774-780.
Shore, L.M. & Shore, T.H. (1995). Perceived organizational support and organizational justice. In Cropanzano, R.S. & K.M. Kacmar (Eds.). Organizational politics, justice, and support: Managing the social climate of the workplace, 149-164. Westport, CT: Quorum.
Smith, C. A., Organ, D. W., & Near, J. P. (1983). Organizational citizenship behavior: Its nature and antecedents. Journal of Applied Psychology, 68, 653-663.
Staw, B.M. (1995). Psychological dimensions of organizational behavior . (2nd ed.). New Jersey.
Wang H., Law K., Hackett R., Wang D. & Chen Z. (2005) Leader–member exchange as a mediator of the relationship between transformational leadership and followers’ performance and organizational citizenship behaviour. Academy of Management Journal 48, 420–432.
Witt, L.A. (1991). Exchange ideology as a moderator of job attitudes organizational citizenship behaviors relationships. Journal of Applied Social Psychology, 21, 1490-1501.
Table 1: Descriptive Statistics and RegressionAnalysis of models
Sivalogathasan,V.PhD Scholar, School of Management,
Zhejiang University, Hangzhou, China.&
Senior Lecturer in Management StudiesThe Faculty of Humanities and Social Science
The Open University of SriLankaNawala, Nugegoda
SriLankaEmail:[email protected]
Ashmel HashimSenior Lecturer
Al-Khawarizmi International CollegeUnited Arab Emirates (UAE)Email: [email protected]
Organizational politics, justice, and support: Managing the social climate of the workplace, 149-164. Westport, CT: Quorum
Smith, C. A., Organ, D. W., & Near, J. P. (1983). Organizational citizenship behavior: Its nature and antecedents. Journal of Applied Psychology, 68, 653-663.
Staw, B.M. (1995). Psychological dimensions of organizational behavior . (2nd ed.). New Jersey
Wang H., Law K., Hackett R., Wang D. & Chen Z. (2005) Leader–member exchange as a mediator of the relationship between transformational leadership and followers’ performance and organizational citizenship behaviour. Academy of Management Journal 48, 420–432.
Witt, L.A. (1991). Exchange ideology as a moderator of job attitudes organizational citizenship behaviors relationships. Journal of Applied Social Psychology, 21, 1490-1501.
Table 1: Descriptive Statistics and Regression Analysis of models
Variables Mean SD Social Exchange M1 M2
Perceived Organizational Support 4.84 1.04 a a Social Exchange 4.69 0.97 b b
Superior Work Performance 5.37 0.75 Organizational Citizenship Behaviour
4.82 0.49
Relative Absenteeism 4.55 0.68 Relative Lateness 3.43 1.00 Organizational Commitment 5.05 0.83 a R 0.550 0.670 R2 0.302 0.449 Adjusted R2 0.297 0441 Std.Error 0.814 0.726 F 61.43 57.35 Sig 0.000* 0.000*
a. Predictors: (Constant), Perceived Organizational Support, Organizational Commitment
b. Dependent Variable: Social Exchange, and * Significant at 0.05 level.
Table 2: Model Summary and Regression Analysis of Workout comes
Variables Mean Workout comes
SWP OCB RA RL Perceived Organizational Support Social Exchange
R2 0.307 0.393 0.327 0.321 Sig 0.000
* 0.000* 0.000
* 0.000*
ß +0.054
+0.048 -0.099
-0.014
Perceived Organizational Support + Organizational Commitment Social Exchange
R2 0.459 0.499 0.453 0.459 Sig 0.000
* 0.000* 0.000
* 0.000*
ß +0.088
+0.456 -0.297
-0.189
a. Predictors: (Constant), Perceived Organizational Support, Organizational Commitment
b. Dependent Variable: Social Exchange, Economic Exchange
* Significant at 0.05 level.
Table 2: Model Summary and Regression Analysis of Work Outcomes
49
Skyline Business Journal, Volume IX-Issue 1-2013-2014
WORK-LIFE BALANCE AND BURNOUT AS PREDICTORS OF JOB SATISFACTION INPRIVATE BANKING SECTOR
V.Rama Devi , A.Nagini
Abstract:
People are considered to be the strategic resources of the organization. They contribute to the success of the organization and serve as the source of competitive advantage provided they are satisfied with their job. A high rate of employee job satisfaction is associated with high commitment levels, low absenteeism, high productivity and low turnover rate. The present research is undertaken in order to study job satisfaction of employees in private banking sector. An attempt is made to determine the impact of work-life balance and burnout on job satisfaction of employees. A sample of 103 employees is chosen from 9 private sector banks. The results revealed that there is positive relationship between work-life balance and job satisfaction and negative relationship between burnout and job satisfaction. Regression analysis demonstrated that job satisfaction is dependent on work-life balance and burnout experienced by the employees.
Keywords: Job satisfaction, Work-life balance, Burnout, Private banking sector.
Introduction People are the valuable resources of the organization and serve as the source of competitive advantage. This is possible only when employees are satisfied with their jobs. Employee satisfaction is a precursor to the success of any business. If employees are satisfied, the absenteeism rate will decrease, employee commitment & productivity will increase and the quality of service to the customers will improve. The essence is employee engagement increases which will result in increased retention rate. Progressive employers are taking different steps in order to ensure that the employees are satisfied because it can contribute positively in many directions to the organization. But in certain organizations employers do not realize the importance of this and fail in meeting their expectations.
There are radical changes in the banking sector over a period of time. Especially in the recent years, there are significant changes in the product & service portfolio of the banks. Due to increasing competition in banking sector with the dominance of private sector banks and the entry of foreign banks, there is clear shift in focus towards customers. To survive and thrive in competitive environment, banks are trying out new strategies to attract and satisfy the customers. There is increasing pressure on the employees of the banks in the form of increased deadlines & targets. They have to meet rising expectations of the bank in the process of satisfying the customers. Employees find their jobs more challenging and if such challenges are not properly met it may lead to stress, frustration and dissatisfaction among the employees with their job. Conceptual Framework: Work-Life Balance: - Work-life balance is defined as a state of equilibrium achieved by an employee when he/she is able to meet the demands of both his/her job and personal life comfortably. Now-a-days with increasing demands at work place employees are experiencing more stress which is invading their personal life. In this context, finding an appropriate balance between work and daily life is a challenge for the employees. According to Heery and Noon (2008), Work-life balance is the principle that paid employment should be integrated with personal life and community
participation in the interests of personal and social welfare. In the words of Morgenstern (2008), Work-life balance is not about the amount of time one spends working versus not-working. It’s more about how one spends time working and relaxing, recognizing that what a person does in one, fuels energy for the other.
Burnout: - Burnout is caused by long-term involvement in highly stressful situations. Burnout affects the employee as well as the organization adversely. From the organizational perspective, the damage will be from the negative attitudinal aspects or from the behavioral aspects of job performance of employee and eventual turnover.
Job Satisfaction: Job satisfaction is a pleasant feeling experienced by the employee when there is synchronization between what he expects and what he actually derives from his job. It refers to a positive or pleasurable emotional state resulting from the satisfaction derived from different facets of the job like salary, working conditions, recognition for work, interpersonal relationships, etc.
Literature Review: Relationship between Work-life balance, Burn out and Job Satisfaction:-
Karatepe and Mehmet (2006) based on their studies reported that work-family conflict increased emotional exhaustion and decreased job satisfaction among the frontline bank employees; Tsigilis , et al., (1994) expressed that there is negative relationship between job satisfaction and burnout reflecting that higher burnout results in lower job satisfaction and vice-versa.
Siw et al., (2008) highlighted the significance of exploring the relationship between work-family interaction and burnout over time. Their findings have shown bi-directional causal paths, i.e., both work family interaction and burnout may be either antecedent or outcome, resulting both loss and gain spirals as suggested by Conservation of Resources (COR) theory. Employees viewed that infringement of work responsibilities and pressures into their personal lives affected health adversely (Hyman et al., 2003). A study done
50

Skyline Business Journal, Volume IX-Issue 1-2013-2014
by Hughes and Bozioneles (2007) on bus drivers pointed that work-life imbalance was not only a source of anxiety for the respondents but also was the major source of dissatisfaction. In addition, the participants made a clear association between problems with work-life balance and withdrawal behaviors, comprising turnover intention and absenteeism due to sickness which was not genuine. Jyothi & Jyothi (2012) highlighted that human resources policies intended to help employees balance their work and family lives can positively affect performance, organizational commitment and employee willingness to go the extra mile on behalf of their employers. A healthy balance between family and job leads to higher job satisfaction and contribute to enhancing employee performance (Kanwar et al., 2009).
Factors of Job Satisfaction:-Group level task interdependence enhances the feeling of belongingness and coordination among employees and hence the degree of job satisfaction also increases (Vander, et al., 2001). When jobs are demanding in nature, they build an environment of satisfaction. Results of Jonge, et al., (2000) study provided empirical support for the perspective that high-strain jobs (high demand and low control) are contributing to ill health (emotional exhaustion and health complaints). Further, it shows that active job (high demands, high control) leads to positive outcomes (job challenge and job satisfaction). Organizational politics is a vital part of an organization. Vigoda (2000) reported that perception of organizational politics is negatively related to attitudes (job satisfaction and organizational commitment), positively related to intention to leave the job (exit), and more positively related to negligent behavior (neglect). The relationship between designation of the teaching staff and job satisfaction is found to be significant in both Central and State universities (Rama devi, 2006). The research conducted by Bajpai & Srivastava (2002) revealed that a secure job and good welfare policies increase the degree of job satisfaction whereas threat of layoff, rapid turnover, inadequate welfare schemes, and less opportunity for vertical growth increase the degree of job dissatisfaction.
Objectives of the Study:1. To study the work- life balance of employees in private
sector banks. 2. To study the burn out experienced by employees in
private sector banks.3. To determine the impact of demographic variables on
work- life balance and burnout.4. To determine the relationship between work-life balance,
burnout and job satisfaction of the employees in private sector banks.
Hypotheses of the Study:Hypothesis 1: Work- life balance is independent of
demographic variablesHypothesis 2: Burnout is independent of demographic
variablesHypothesis 3: Job satisfaction is not related to work-life
balanceHypothesis 4: Job satisfaction is not related to burnoutHypothesis 5: Job satisfaction is independent of work-life
balance and burnout
Research Methodology: Employees working in banking sector in Vijayawada constitute population for the study. The sample frame includes employees working in 9 private sector banks. The sample size is 103 and is drawn using simple random sampling method. Data is collected using a structured questionnaire with 72 questions designed for the purpose of the study. The first part of the questionnaire addresses demographic details and the second part of the questionnaire deals with different dimensions of job satisfaction, work-life balance and burnout. Data is analyzed using various statistical tools like mean, correlation, regression and ANOVA.
Results and Discussion:
Table IWork- life Balance
Table 1 depicts the overall work- life balance of the employees in banks. Statistics clearly state that majority (52.4) of the respondents reported that they are able to balance their work life and personal life pretty well and 12.6 % of the respondents expressed that they are not able to balance their work and personal life.
Table II
Demographic Variables and their Impact on Work- life Balance
Table 2 portrays that barring designation and marital status, all other demographic variables including gender, age, qualification, experience, nature of job, work status, nature of family, income and number of dependents significantly affect work-life balance of employees. This is in agreement with other research findings. Woodward (2007) reported that women with dependent children are finding it more difficult to balance their work life and personal life than those who do not have dependent children. Wei, Ying and Liangliang (2009) based on their research findings stated that the major factors - education, income ratio, professional experience, spouse stress and work load affect professional women’s work family conflict. Thriveni and Rama devi (2012) found that there is a significant relationship between demographic
Results and Discussion:
Table I
Work- life Balance
Work- life balance Frequency Per cent
Low 13 12.6
Medium 36 35.0
High 54 52.4
Total 103 100
Table 1 depicts the overall work- life balance of the employees in banks. Statistics clearly
state that majority (52.4) of the respondents reported that they are able to balance their work life
and personal life pretty well and 12.6 % of the respondents expressed that they are not able to
balance their work and personal life.
Table II Demographic Variables and their Impact on Work- life Balance
Demographic Variables Chi-square value Significance
Designation 138.515 Insignificant
Gender 106.542 Significant at 1% level
Age 122.638 Significant at 5% level
Qualification 118.741 Significant at 1% level
Marital status 225.67 Insignificant
Experience 147.051 Significant at 1% level
Nature of job 109.289 Significant at 1% level
Work status 106.916 Significant at 1% level
Nature of family 114.012 Significant at 1% level
Income 100.714 Significant at 1% level
Number of dependents 109.449 Significant at 1% level
Table 2 portrays that barring designation and marital status, all other demographic variables
including gender, age, qualification, experience, nature of job, work status, nature of family,
income and number of dependents significantly affect work-life balance of employees. This is in
agreement with other research findings. Woodward (2007) reported that women with dependent
children are finding it more difficult to balance their work life and personal life than those who
do not have dependent children. Wei, Ying and Liangliang (2009) based on their research
findings stated that the major factors - education, income ratio, professional experience, spouse
stress and work load affect professional women’s work family conflict. Thriveni and Rama devi
(2012) found that there is a significant relationship between demographic variables - age,
experience, income, type of family, number of dependents and perception of work- life balance
of women employees.
51

Skyline Business Journal, Volume IX-Issue 1-2013-2014
variables - age, experience, income, type of family, number of dependents and perception of work- life balance of women employees.
Table IIIBurnout
Table 3 reveals that 4.9 % of the respondents expressed that they are experiencing high level of burnout whereas majority (89.3%) of the respondents are experiencing low level of burn out.
Table IVDemographic Variables and their Impact on Burnout
Table 4 presents that designation, age, marital status, qualification, experience of the respondents significantly affects burnout while other demographic variables do not significantly affect burnout.
Table VRelationship between Work- Life Balance and Job
Satisfaction
** Correlation is significant at the 0.01 level (2-tailed).
Table 5 reveals that correlation between job satisfaction and work-life balance is positive with a value of 0.379 and it is highly significant. The positive correlation between job satisfaction and work life balance indicates that if work life balance increases, job satisfaction also increases. Therefore the null hypothesis that there is no relationship between job satisfaction and work-life balance is rejected and alternate
Table III
Burnout
Table 3 reveals that 4.9 % of the respondents expressed that they are experiencing high level of
burnout whereas majority (89.3%) of the respondents are experiencing low level of burn out.
Level of Burnout Frequency Per cent
Low 92 89.3
Medium 6 5.8
High 5 4.9
Total 103 100.0
Table IV
Demographic Variables and their Impact on Burnout
Demographic Variable Value Significant/Insignificant
Designation 1326.678 Significant at 1% level
Gender 28.655 Insignificant
Age 977.596 Significant at 1% level
Marital status 57.295 Significant at 1% level
Qualification 83.925 Significant at 5% level
Experience 242.250 Significant at 5% level
Nature of job 42.362 Insignificant
Work status 19.792 Insignificant
Nature of family 46.140 Insignificant
Income 222.748 Insignificant
Number of dependents 245.913 Insignificant
Table 4 presents that designation, age, marital status, qualification, experience of the respondents
significantly affects burnout while other demographic variables do not significantly affect
burnout.
Table V
Relationship between Work- Life Balance and Job Satisfaction
Job satisfaction
score
Work- life balance score
Pearson Correlation 1 .379** Job satisfaction score Sig. (2-tailed) .000
N 103 103
Work- life balance score Pearson Correlation .379** 1
Sig. (2-tailed) .000 N 103 103
** Correlation is significant at the 0.01 level (2-tailed).
Table 5 reveals that correlation between job satisfaction and work-life balance is positive
with a value of 0.379 and it is highly significant. The positive correlation between job
satisfaction and work life balance indicates that if work life balance increases, job satisfaction
also increases. Therefore the null hypothesis that there is no relationship between job satisfaction
and work-life balance is rejected and alternate hypothesis is accepted. The result substantiates
previous research findings of Kanwar et al., (2009) that a healthy work-life balance leads to
higher job satisfaction.
hypothesis is accepted. The result substantiates previous research findings of Kanwar et al., (2009) that a healthy work-life balance leads to higher job satisfaction.
Table VIRelationship between Burnout and Job Satisfaction
** Correlation is significant at the 0.01 level (2-tailed).
It is understood from table 6 that there is negative correlation between job satisfaction and burnout i.e., it indicates that if burnout increases job satisfaction decreases and vice versa. This is in conformity with previous research findings (Tsigilis, et al., 1994) that the relationship between job satisfaction and burnout is negative, implying that higher job satisfaction tends to be accompanied by lower level of burnout.
Table VIIRegression
a. Predictors: (Constant), burnout, work life balance
Table VIIIANOVA
a. Predictors: (Constant), burnout, work- life balanceb. Dependent Variable: job satisfaction
The regression analysis reveals that work-life balance and burn out significantly influence job satisfaction and hence the null hypothesis that job satisfaction is independent of work-life balance and burn-out is rejected and alternate hypothesis is accepted. Scope for the Future Study: The present study is confined only to private sector banks. The future researchers may conduct their study by taking into account both private and public sector banks so that the entire banking industry can be covered. The sampling frame and sample size may be increased in order to further validate the results.
Conclusion: It is an established fact today that it is human capital rather than financial and technological capital that provide companies with the competitive edge. In order to attract and retain the talent pool in the organization, employees should be
Table VI
Relationship between Burnout and Job Satisfaction
** Correlation is significant at the 0.01 level (2-tailed).
It is understood from table 6 that there is negative correlation between job
satisfaction and burnout i.e., it indicates that if burnout increases job satisfaction decreases and
vice versa. This is in conformity with previous research findings (Tsigilis, et al., 1994) that the
relationship between job satisfaction and burnout is negative, implying that higher job
satisfaction tends to be accompanied by lower level of burnout.
Job satisfaction score Burnout score
Job satisfaction score Pearson Correlation 1 -.434** Sig. (2-tailed) .000 N 103 103
Burnout score Pearson Correlation -.434** 1 Sig. (2-tailed) .000 N 103 103
Table VII
Regression
R Model Adjusted R Square
Std. Error of the
Estimate Change Statistics
R Square Change
F Change df1 df2
Sig. F Change
1 .583(a) .340 .327 .733 .340 25.775 2 100 .000 a. Predictors: (Constant), burnout, work life balance
Table VIII ANOVA
Model Sum of Squares Df Mean Square F Sig.
Regression 27.708 2 13.854 25.775 .000(a) Residual 53.749 100 .537 Total 81.456 102
a. Predictors: (Constant), burnout, work- life balance
b. Dependent Variable: job satisfaction
The regression analysis reveals that work-life balance and burn out significantly
influence job satisfaction and hence the null hypothesis that job satisfaction is independent of
work-life balance and burn-out is rejected and alternate hypothesis is accepted.
52

Skyline Business Journal, Volume IX-Issue 1-2013-2014
satisfied. The study revealed that majority of the employees reported good work-life balance and low level of burnout. The findings have shown that barring designation and marital status, all other demographic variables significantly influence work-life balance whereas designation, age, marital status, qualification, experience of the respondents significantly affect burnout experienced by the employees.
From the study it is clear that job satisfaction is positively related to work- life balance and negatively related to burnout. The study also revealed that work-life balance and burnout significantly predict job satisfaction of the employees. This conveys an important message to the employer that conducive policies have to be formulated in order to help the employees maintain a balance between their personal and work life and do not experience burn out which will in turn enhance job satisfaction of employees that is vital for the organization. References:Bajpai, N. & Srivastava, D. (2002). Sectorial comparison of factors influencing job satisfaction in Indian banking sector. Singapore Management Review, 26(2): 89-99.
Diana Woodward (2007). Work-life balancing strategies used by women managers in British modern universities. Equal Opportunities International, Patrington, 26 (1): 6.
Heery Edmund and Mike Noon (2008). A Dictionary of Human Resource Management, New York: Oxford University Press Inc.
Hughes, J., and Bozioneles, N. (2007). Work-life balance as source of job dissatisfaction and withdrawal attitudes-An exploratory study on the views of male workers. Personnel Review, 36(1): 145-154.
Hyman, J., Baldry, C., Scholarios, D. and Bunzel, D. (2003). Work-life imbalance in the new service sector economy. British Journal of Industrial Relations, 41: 215-39.
Jonge J., Dollord, F., Dormann,C., & Le Blance, P. (2000). The demand-control model: specific demands, specific control and well-defined groups. International Journal of Stress Management, 7(4): 269-287.
Jyothi V & Jyothi P. (2012). Assessing work-life balance: from emotional intelligence and role efficacy of career women. Advances in Management, 5(6):35-43.
Kanwar,Y.P.S., Singh, A.K. and Kodwani, A.D. (2009). Work-life balance and burnout as predictors of job satisfaction in the IT – ITES industry. Vision – The Journal of Business Perspective, 13(2): 1- 12.
Karatepe, O. and Tekinkus, M. (2006). The effects of work-family conflict, emotional exhaustion, and intrinsic motivation on job outcomes of front-line employees. International Journal of Bank Marketing, 24(3): 173-93.
Morgenstern Julie (2008). A Dictionary of Human Resource Management, New York: Oxford University Press Inc.
Rama Devi, V. (2006). Job satisfaction among university teachers. SCMS Journal of Indian Management, 3(4): 87-94.
Siw Tone Innstranda, Ellen Melbye Langballe, Geir Arild Espnes, Erik Falkum and Olaf Gjerløw Aasland (2008). Positive and negative work-family interaction and burnout: A longitudinal study of reciprocal relations. Work and Stress, 22(1): 1-15.
Thriveni and Rama Devi (2012). Impact of demographic variables on work-life balance of women employees (with special reference to Bangalore city). International Journal of Advances in Management and Economics, 1(6): 226-229.
Tsigilis, N., Koustelios, A., & Togia, A (2004). Multivariate relationship discriminant validity between job satisfaction and burnout. Journal of Managerial Psychology, 19: 666-675.
Vander, G., Emans, M., & VanDe, E, (2001). Patterns of interdependence in work teams: A two level investigation of the relation with job and team satisfaction. Personnel Psychology, 54(1): 51-69.
Vigoda, E. (2000). Organisational politics, job attitude and work outcomes: Exploration and implications for the public sector. Journal of Vocational Behaviour, 57(3): 326-347.
Dr. V.Rama DeviProfessor, School of Management Studies
Vignan University, Vadlamudi, Guntur (dt.)Pin – 522502, Andhra Pradesh
e-mail: [email protected]
Ms.A.NaginiKLU Business School
KL University, Vaddeswaram, Guntur (dt.)Pin – 522502, Andhra Pradesh
53

Skyline Business Journal, Volume IX-Issue 1-2013-2014
REGULATION, INTERPERSONAL RELATIONSHIP AND DEMISE OF A PROMISING COMPANY: THE CASE OF GREAT AFRICAN INSURANCE COMPANY
Anastas Kabral Nyamikeh
Abstract:
The case delineates the crass managerial ineptitude of the top management of a promising insurance company that cost the owners the very existence thereof. Taking advantage of a somewhat virgin insurance industry with weak competitors and an ineffective supervisory regime, the management of The Great Africa insurance company was able to augment premium income and market share in the industry, almost leading the industry within a decade and a half of its existence. However, brewing internal conflicts and authoritarian leadership style on the part of the chief executive officer culminated in the issue of a supplier’s bond with a value in excess of the capital employed of the insurance company to a dubious client .Unable to pay the third party claimant for guaranteeing their client’s faithful performance, the National Insurance Commission; the regulator of insurance businesses in Ghana compulsorily liquidated the company.
Keywords: Insurance, regulation, commission, liquidation.
1.0 General Background Insurance in Ghana began in the colonial era in the early 20th century with the establishment of the Royal Guardian Exchange now called the Enterprise Insurance Company which was British owned, the British by then being the colonial masters. The first indigenous private insurance company, the Gold Coast insurance company was established in 1955 followed after independence by the State Insurance Corporation, now The State Insurance Company since 1962. Eleven more insurance companies were established in 1971. Five years later in 1976, seven more companies were established together with one reinsurance company and two brokerage firms.
In December 2011, close to forty insurance companies were actively competing for policyholders in the Ghanaian insurance industry. The industry could also boast of a number of brokerage and actuarial firms, reinsurance companies and independent loss adjustment firms inclusive of thousands of intermediaries. Before parliament passed the 2006 Insurance ACT 724, insurance companies in Ghana were classified into three categories namely life: insurance, non-life insurance and composite insurance companies. Two companies Gemini Life insurance company and The United Life Insurance Company were solely in life insurance services and three companies namely Enterprise Insurance, Ghana Union Assurance and New India Assurance engaged exclusively in nonlife insurance products of fire, burglary, marine, aviation, good in transit, cash in transit and the like as in December 1979. Twelve companies engaged in composite insurance and underwrote all type of business in both life and non-life insurance. With the advent of the new Insurance law Act 724 of 2006, insurance companies ought not be composite but be either life or non- life. The drafters of the Act, considered the life business to be a specialized, long-term area of insurance which should not be combined with short term non -life businesses as far as general management and the investment of premium income were concerned. Section 26 of the Act captioned ‘restriction on licensing composite insurance companies and specialization’ stipulates among other provisions that the National Insurance Commission shall not issue a license that authorizes the insurer to operate a composite business. The implication of this provision was
that composite companies which existed prior to the passage of the ACT had to incorporate life subsidiaries and transfer their life insurance portfolios to the newly formed life offices. These companies just added the word ‘Life’ to their formers names for the names of the new life insurance companies they incorporated after the passage of Insurance ACT 724 and the word ‘ General’ to their already existing names for the general insurance companies that dealt in non-life insurances.Before Act 724, the 1989 Insurance Law, Provisional National Defense Council (PNDC) Law 227 established the National Insurance Commission, the regulator of insurance companies and intermediaries in Ghana. Currently government regulation through insurance laws in Ghana is mainly by Insurance Act 724, 2006 complemented somewhat by PNDC Law 227 of 1989 that covers both financial guarantees to be provided and the legal and technical reserves required. Prior to PNDC Law 227 of 1989, the regulation of insurance business in the country was generally weak and whatever form of regulation then took the shape of trying to enforce provisions in outdated insurance legislative instruments and the licensing of insurance companies . A desk for that purpose was situated in the offices of the Ministry of Finance under the direct supervision of the Minister. This innocuous regulatory regime provided opportunities for existing companies to under-price their insurance products and also created leeway for the entry of financially weak insurance companies into the industry. The resultant sunken image of the industry affected companies aimed at doing good insurance business.
A provision under The National Redemption Council Decree 95 of 1972 required no person to carry out insurance business in Ghana unless no less than 40% of the shares or other proprietary interest therein was owned by Ghanaians; this was also reiterated in the PNDC Law 227 which further stated that at least 20% of the capital or other proprietary interest in that business be owned by the government.
Act 724 provides for the regulations of the investment of insurance funds, insurance company investments being now regulated with respect to the types of investments, quality and percentage of total assets or surplus that can be invested in different investment instruments. The basic purpose is to prevent insurers from making unsound investments that
54

Skyline Business Journal, Volume IX-Issue 1-2013-2014
may threaten the company’s solvency and harm the policy owners. Life insurers typically invest in shares, bonds, policy loans and real estates. Property and casualty insurers are also enjoined to invest in shares, government and corporate bonds, short-term investments and cash with a relatively small percentage of assets invested in real estates. In both life and non-life, a substantial percentage of assets need be invested in liquid securities that can be sold quickly to pay claims if a catastrophe loss occurs, according to ACT 724.
Section 26(2) of Law 227, 1989 provides that in respect of life insurance, the investment of insurance funds shall be made up of 50% in government securities and 50% in such investment as shall be approved by the commissioner of insurance. In addition, a life insurer is required to publish its valuation at least every three years and a certificate of solvency to that effect be signed by a qualified actuary.
Regulation of insurance business by the National Insurance Commission is necessary to serve the public interest through a reduction of market imperfections. Characteristically, the insurance market is a far cry from a perfectly competitive market which has large numbers of sellers and buyers, low cost of entry and exit, low cost of information on cost and price. The insurance market place is plagued with considerable information inadequacy about product quality, insurer reputation, solvency and experience. Most consumers do not have sufficient information for comparing and determining the monetary value of different insurance contracts. It is difficult to compare dissimilar policies with different premiums because the necessary price and policy information is not readily available. Without good information, consumers cannot select the best insurance products. This failure reduces the impact that consumers have on insurance markets as well as the competitive incentive of consumers to improve product quality and lower price.
Thus, regulation is necessary to produce the same market effect that results from knowledgeable consumers purchasing products and services in highly competitive markets. In other words, it is needed to correct market imperfections and move market conduct closer to the competitive ideal especially in an era when the free market ideology is gaining considerable currency. Regulation is necessary to compensate for inadequate consumer knowledge.
The unregulated market does not provide adequate information and this necessitates regulation. It is difficult for consumers of insurance to obtain information about the quality of insurance in an unregulated market and this accelerates the risk of some consumers buying insurance from low quality and deceptive insurers. In Ghana the late 1980s to the late 1990s (a decade in the insurance history of this country) witnessed the rise and fall of a number of deceptive insurance companies often labeled derogatively by the then insurance commissioner on many platforms as ‘cow boys’ and ‘ buccaneers’.
The regulatory function of the NIC as regards licensing of insurance companies as stated under section 2(2) is further explained under Section 22 of the Act which provides that the NIC may issue an insurer’s license to an applicant after
being satisfied, among other provisions, that the applicant is qualified to carry on the insurance business for which the application is made and that each director and principal officer of the applicant is qualified to be concerned with the management of the class of business for which the application is made. Also mentioned under this section is the requirement that the organization, management and financial resources of the applicant be adequate for the carrying on of the class of business for which the application was made and that the insurance business will be conducted in accordance with sound insurance principles.
2.0 The Great African Insurance CompanyThe Great African Insurance Company burst onto the insurance industry in Ghana in 1985 as an aggressive composite insurer that awakened already existing sleepy companies with its aggressive functional-level strategies. Led by a team of seasoned insurance practitioners who had practiced insurance in the United States of America for decades, the emergence of the company revolutionized the Ghanaian insurance industry with its innovative marketing and product development practices.
Within the space of a decade spanning 1985 to 1995, the Great African Insurance company became a household name not only in the Ghanaian financial services industry but also in the manufacturing sector as well as among the generality of the people. With a blend of both American and locally trained human resource base, the company posed a formidable threat to other players in the industry both in terms of market share and as an employer of choice to insurance and non-insurance professionals.
With a not too strong regulatory framework within this period under reference as regards claims payment and premiums charged to policyholder, the company made considerable strides on the back of this regulatory fissure, increasing its cash inflows of premium income and minimizing its cash outflows of claims. This somewhat positive business environment oiled the wheels of the company in growth terms over this decade, the astute directors actualizing their mission of being in every nook and cranny of the market. Former Ghanaian work colleagues of some of the American trained directors with whom they worked in the United States were attracted to resign their posts in the US to work with the Great African Insurance Company. These were put on salary scales with notches comparable to where they were in the US. The result, in human capital terms, was a mixed bag of experienced, contented professionals with morale flying in the highest skies in readiness to assist the company in driving to its mission and vision. As at December 1995, the numerical staff strength of the company stood at three hundred and twenty-two spread out in all the ten regions of the country with employees sitting and earnestly working in head and branch offices throughout the country for their beloved company.
The company’s directors had a mental picture of being a holding company with subsidiaries in the neighboring Anglophone countries in the West African sub-region. Two executive directors in charge of finance and operations
55
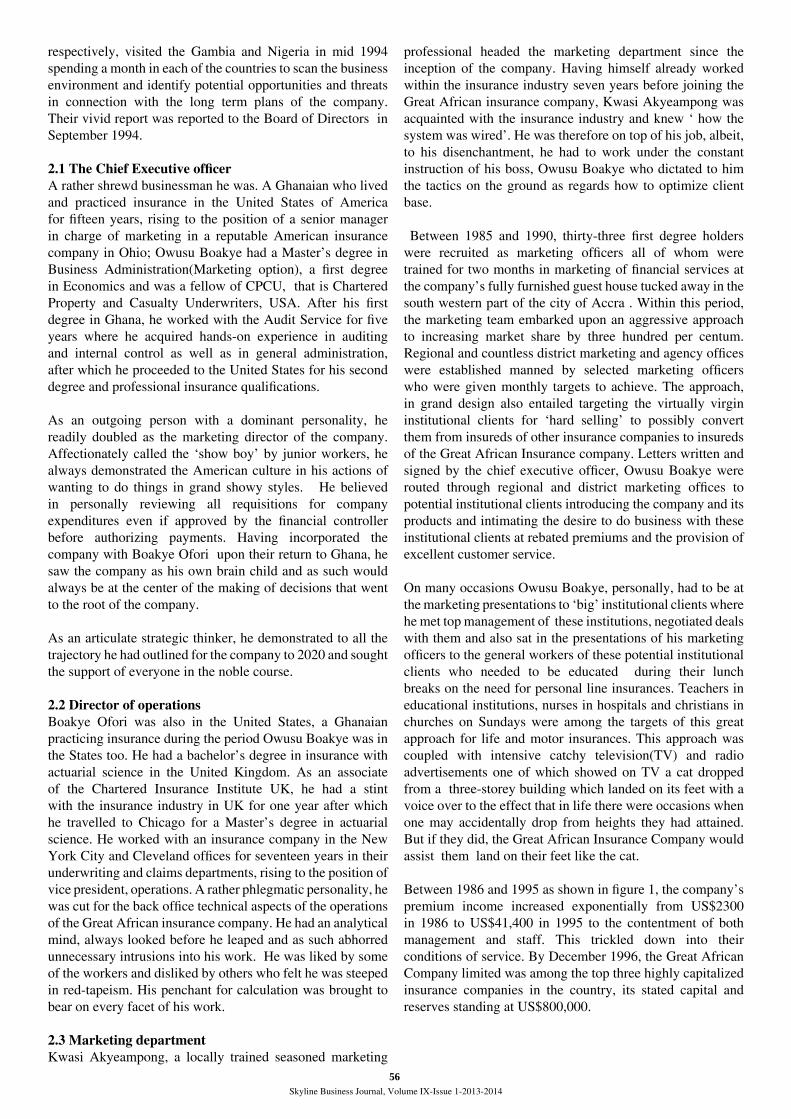
Skyline Business Journal, Volume IX-Issue 1-2013-2014
respectively, visited the Gambia and Nigeria in mid 1994 spending a month in each of the countries to scan the business environment and identify potential opportunities and threats in connection with the long term plans of the company. Their vivid report was reported to the Board of Directors in September 1994.
2.1 The Chief Executive officerA rather shrewd businessman he was. A Ghanaian who lived and practiced insurance in the United States of America for fifteen years, rising to the position of a senior manager in charge of marketing in a reputable American insurance company in Ohio; Owusu Boakye had a Master’s degree in Business Administration(Marketing option), a first degree in Economics and was a fellow of CPCU, that is Chartered Property and Casualty Underwriters, USA. After his first degree in Ghana, he worked with the Audit Service for five years where he acquired hands-on experience in auditing and internal control as well as in general administration, after which he proceeded to the United States for his second degree and professional insurance qualifications.
As an outgoing person with a dominant personality, he readily doubled as the marketing director of the company. Affectionately called the ‘show boy’ by junior workers, he always demonstrated the American culture in his actions of wanting to do things in grand showy styles. He believed in personally reviewing all requisitions for company expenditures even if approved by the financial controller before authorizing payments. Having incorporated the company with Boakye Ofori upon their return to Ghana, he saw the company as his own brain child and as such would always be at the center of the making of decisions that went to the root of the company.
As an articulate strategic thinker, he demonstrated to all the trajectory he had outlined for the company to 2020 and sought the support of everyone in the noble course.
2.2 Director of operationsBoakye Ofori was also in the United States, a Ghanaian practicing insurance during the period Owusu Boakye was in the States too. He had a bachelor’s degree in insurance with actuarial science in the United Kingdom. As an associate of the Chartered Insurance Institute UK, he had a stint with the insurance industry in UK for one year after which he travelled to Chicago for a Master’s degree in actuarial science. He worked with an insurance company in the New York City and Cleveland offices for seventeen years in their underwriting and claims departments, rising to the position of vice president, operations. A rather phlegmatic personality, he was cut for the back office technical aspects of the operations of the Great African insurance company. He had an analytical mind, always looked before he leaped and as such abhorred unnecessary intrusions into his work. He was liked by some of the workers and disliked by others who felt he was steeped in red-tapeism. His penchant for calculation was brought to bear on every facet of his work.
2.3 Marketing departmentKwasi Akyeampong, a locally trained seasoned marketing
professional headed the marketing department since the inception of the company. Having himself already worked within the insurance industry seven years before joining the Great African insurance company, Kwasi Akyeampong was acquainted with the insurance industry and knew ‘ how the system was wired’. He was therefore on top of his job, albeit, to his disenchantment, he had to work under the constant instruction of his boss, Owusu Boakye who dictated to him the tactics on the ground as regards how to optimize client base.
Between 1985 and 1990, thirty-three first degree holders were recruited as marketing officers all of whom were trained for two months in marketing of financial services at the company’s fully furnished guest house tucked away in the south western part of the city of Accra . Within this period, the marketing team embarked upon an aggressive approach to increasing market share by three hundred per centum. Regional and countless district marketing and agency offices were established manned by selected marketing officers who were given monthly targets to achieve. The approach, in grand design also entailed targeting the virtually virgin institutional clients for ‘hard selling’ to possibly convert them from insureds of other insurance companies to insureds of the Great African Insurance company. Letters written and signed by the chief executive officer, Owusu Boakye were routed through regional and district marketing offices to potential institutional clients introducing the company and its products and intimating the desire to do business with these institutional clients at rebated premiums and the provision of excellent customer service.
On many occasions Owusu Boakye, personally, had to be at the marketing presentations to ‘big’ institutional clients where he met top management of these institutions, negotiated deals with them and also sat in the presentations of his marketing officers to the general workers of these potential institutional clients who needed to be educated during their lunch breaks on the need for personal line insurances. Teachers in educational institutions, nurses in hospitals and christians in churches on Sundays were among the targets of this great approach for life and motor insurances. This approach was coupled with intensive catchy television(TV) and radio advertisements one of which showed on TV a cat dropped from a three-storey building which landed on its feet with a voice over to the effect that in life there were occasions when one may accidentally drop from heights they had attained. But if they did, the Great African Insurance Company would assist them land on their feet like the cat.
Between 1986 and 1995 as shown in figure 1, the company’s premium income increased exponentially from US$2300 in 1986 to US$41,400 in 1995 to the contentment of both management and staff. This trickled down into their conditions of service. By December 1996, the Great African Company limited was among the top three highly capitalized insurance companies in the country, its stated capital and reserves standing at US$800,000.
56
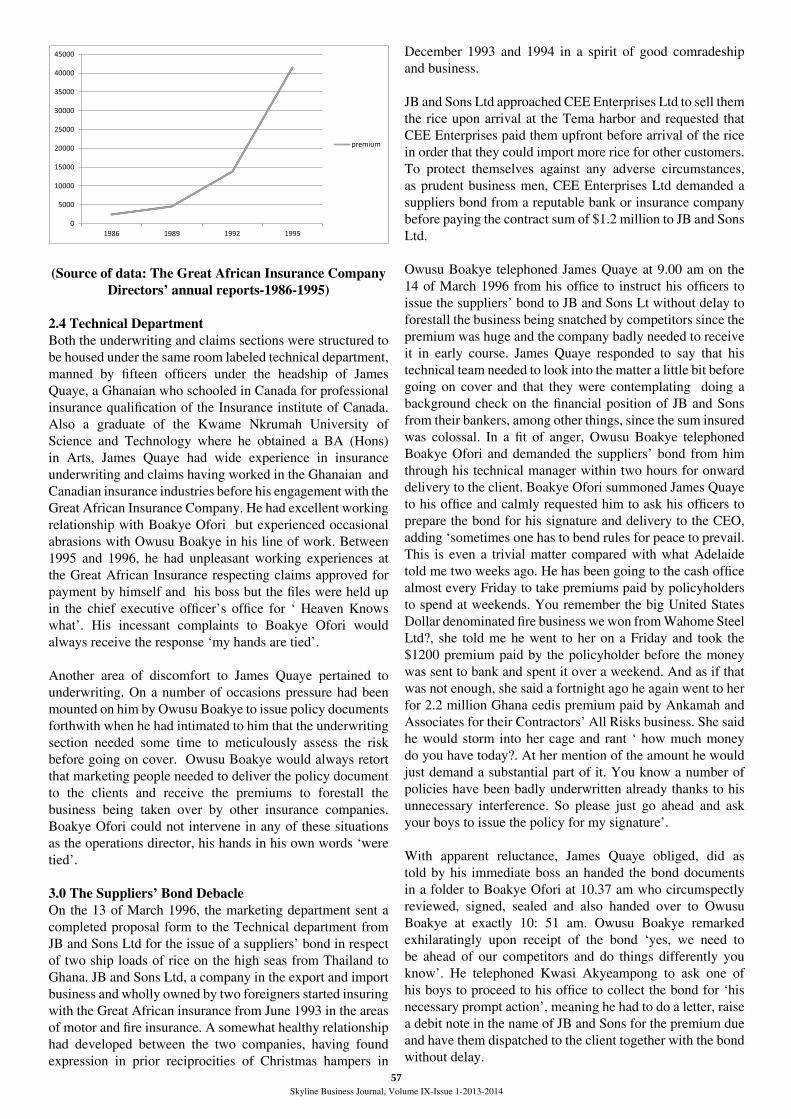
Skyline Business Journal, Volume IX-Issue 1-2013-2014
Pa
ge8
(Source of data: The Great African Insurance Company Directors’ annual reports-1986-1995)
2.4 Technical Department
Both the underwriting and claims sections were structured to be housed under the same room labeled technical department, manned by fifteen officers under the headship of James Quaye, a Ghanaian who schooled in Canada for professional insurance qualification of the Insurance institute of Canada. Also a graduate of the Kwame Nkrumah University of Science and Technology where he obtained a BA (Hons) in Arts, James Quaye had wide experience in insurance underwriting and claims having worked in the Ghanaian and Canadian insurance industries before his engagement with the Great African Insurance Company. He had excellent working relationship with Boakye Ofori but experienced occasional abrasions with Owusu Boakye in his line of work. Between 1995 and 1996, he had unpleasant working experiences at the Great African Insurance respecting claims approved for payment by himself and his boss but the �les were held up in the chief executive o�cer’s o�ce for ‘ Heaven Knows what’. His incessant complaints to Boakye Ofori would always receive the response ‘my hands are tied’.
Another area of discomfort to James Quaye pertained to underwriting. On a number of occasions pressure had been mounted on him by Owusu Boakye to issue policy documents forthwith when he had intimated to him that the underwriting section needed some time to meticulously assess the risk before going on cover. Owusu Boakye would always retort that marketing people needed to deliver the policy document to the clients and receive the premiums to forestall the business being taken over by other insurance companies. Boakye Ofori could not intervene in any of these situations as the operations director, his hands in his own words ‘were tied’.
0
5000
10000
15000
20000
25000
30000
35000
40000
45000
1986 1989 1992 1995
premium
(Source of data: The Great African Insurance Company Directors’ annual reports-1986-1995)
2.4 Technical DepartmentBoth the underwriting and claims sections were structured to be housed under the same room labeled technical department, manned by fifteen officers under the headship of James Quaye, a Ghanaian who schooled in Canada for professional insurance qualification of the Insurance institute of Canada. Also a graduate of the Kwame Nkrumah University of Science and Technology where he obtained a BA (Hons) in Arts, James Quaye had wide experience in insurance underwriting and claims having worked in the Ghanaian and Canadian insurance industries before his engagement with the Great African Insurance Company. He had excellent working relationship with Boakye Ofori but experienced occasional abrasions with Owusu Boakye in his line of work. Between 1995 and 1996, he had unpleasant working experiences at the Great African Insurance respecting claims approved for payment by himself and his boss but the files were held up in the chief executive officer’s office for ‘ Heaven Knows what’. His incessant complaints to Boakye Ofori would always receive the response ‘my hands are tied’.
Another area of discomfort to James Quaye pertained to underwriting. On a number of occasions pressure had been mounted on him by Owusu Boakye to issue policy documents forthwith when he had intimated to him that the underwriting section needed some time to meticulously assess the risk before going on cover. Owusu Boakye would always retort that marketing people needed to deliver the policy document to the clients and receive the premiums to forestall the business being taken over by other insurance companies. Boakye Ofori could not intervene in any of these situations as the operations director, his hands in his own words ‘were tied’.
3.0 The Suppliers’ Bond DebacleOn the 13 of March 1996, the marketing department sent a completed proposal form to the Technical department from JB and Sons Ltd for the issue of a suppliers’ bond in respect of two ship loads of rice on the high seas from Thailand to Ghana. JB and Sons Ltd, a company in the export and import business and wholly owned by two foreigners started insuring with the Great African insurance from June 1993 in the areas of motor and fire insurance. A somewhat healthy relationship had developed between the two companies, having found expression in prior reciprocities of Christmas hampers in
December 1993 and 1994 in a spirit of good comradeship and business.
JB and Sons Ltd approached CEE Enterprises Ltd to sell them the rice upon arrival at the Tema harbor and requested that CEE Enterprises paid them upfront before arrival of the rice in order that they could import more rice for other customers. To protect themselves against any adverse circumstances, as prudent business men, CEE Enterprises Ltd demanded a suppliers bond from a reputable bank or insurance company before paying the contract sum of $1.2 million to JB and Sons Ltd.
Owusu Boakye telephoned James Quaye at 9.00 am on the 14 of March 1996 from his office to instruct his officers to issue the suppliers’ bond to JB and Sons Lt without delay to forestall the business being snatched by competitors since the premium was huge and the company badly needed to receive it in early course. James Quaye responded to say that his technical team needed to look into the matter a little bit before going on cover and that they were contemplating doing a background check on the financial position of JB and Sons from their bankers, among other things, since the sum insured was colossal. In a fit of anger, Owusu Boakye telephoned Boakye Ofori and demanded the suppliers’ bond from him through his technical manager within two hours for onward delivery to the client. Boakye Ofori summoned James Quaye to his office and calmly requested him to ask his officers to prepare the bond for his signature and delivery to the CEO, adding ‘sometimes one has to bend rules for peace to prevail. This is even a trivial matter compared with what Adelaide told me two weeks ago. He has been going to the cash office almost every Friday to take premiums paid by policyholders to spend at weekends. You remember the big United States Dollar denominated fire business we won from Wahome Steel Ltd?, she told me he went to her on a Friday and took the $1200 premium paid by the policyholder before the money was sent to bank and spent it over a weekend. And as if that was not enough, she said a fortnight ago he again went to her for 2.2 million Ghana cedis premium paid by Ankamah and Associates for their Contractors’ All Risks business. She said he would storm into her cage and rant ‘ how much money do you have today?. At her mention of the amount he would just demand a substantial part of it. You know a number of policies have been badly underwritten already thanks to his unnecessary interference. So please just go ahead and ask your boys to issue the policy for my signature’.
With apparent reluctance, James Quaye obliged, did as told by his immediate boss an handed the bond documents in a folder to Boakye Ofori at 10.37 am who circumspectly reviewed, signed, sealed and also handed over to Owusu Boakye at exactly 10: 51 am. Owusu Boakye remarked exhilaratingly upon receipt of the bond ‘yes, we need to be ahead of our competitors and do things differently you know’. He telephoned Kwasi Akyeampong to ask one of his boys to proceed to his office to collect the bond for ‘his necessary prompt action’, meaning he had to do a letter, raise a debit note in the name of JB and Sons for the premium due and have them dispatched to the client together with the bond without delay.
57

Skyline Business Journal, Volume IX-Issue 1-2013-2014
The two ships carrying the rice worth $1.2million were due to arrive at the Tema port on 31 March 1996 but by May 16 the ships had still not arrived. In the meantime, JB and Sons Ltd had closed their offices since 1 April 1996 and investigations revealed that the key managers had flown out of the country and never returned. Boisterous effervescence and turmoil then commenced in the offices not only of CEE Enterprises Ltd but also in those of the Great African Insurance Company Ltd.
CEE Enterprises Ltd filed a claim at the Technical department of the Great African Insurance company on 31 May 1996 claiming a whooping sum of US$1.2 million.
4.0 The New Insurance CommissionerAygekum Pianim was appointed by the government in December 2005 to succeed Ohene Kyei, the then Commissioner of insurance, an elderly man. An LLM holder and a lawyer specialized in Insurance law, Agyekum had practiced law in the UK for almost a decade after which he returned to Ghana, his motherland in June 1995. His hobnobbing with politicians back home was facilitated by the fact that a number of his old school mates were already in government, some of whom held ministerial positions.
Bent on revolutionizing the insurance industry and awaken it from the then inertia with regards to regulation, he injected considerable dynamism and fever into the industry. Agyekum Pianim indicated on several platforms after resuming office that his preoccupation was to redeem the sunken image of the insurance industry in the eyes of the Ghanaian populace which was that of subterfuge and unwillingness to pay claims but a quickness to receive premium from clients. He would reiterate on those platforms that the raison d’être of insurance was the payment of claims and that public confidence in insurance hinged on claims handling and entreated the companies not to trifle with claims payments. A strength of Agyekum Pianin was his excellent interpersonal skills and command of the English Language, he was indeed a orator. Within months of taking office, he was able to establish rapport with all the Chief executive officers and senior managers in the industry. He was however, a quick tempered and no nonsense man. He introduced the motor insurance sticker system into the industry wherein insurance companies issued adhesive stickers indicating the expiry dates of the motor insurance held by motorists, to be displayed on their windscreens. The commissioner also introduced, during his tenure of office, the motor tariff system which forestalled the hitherto price under-cutting then widespread in the industry. To date, motor insurance is tariffed, the National Insurance Commission ( NIC) issuing and reviewing premiums for the various classes of motor vehicles plying the roads in Ghana. On the 11 of September 1996, the management of CEE Enterprises Ltd was at the complaints section of the National Insurance Commission to fill the complaints form for the Great African Insurance Company’s delay and failure to pay their suppliers’ bond claim. The sequel was a number of stakeholder meetings which culminated in Agyekum Pianin commissioning PMC Consult, a firm of management consultants specialized in organization development to investigate the matter in the offices of the Great African
Insurance Company and report to the NIC by 30 October 1996.
At the management meeting of the National Insurance commission held on 25 November 1996 and chaired by Agyekum Pianin, it was resolved that Compulsory Liquidations proceedings had to commence at the Great African Insurance Company in accordance with the provisions of the then Insolvency Act of 1962 and that a liquidator be appointed accordingly who would oversee inter alia, the payment of all claims outstanding in the books of the Great African Insurance company. The company was ordered not to accept any more insurance proposals during the period of liquidation effective 31 December 1996. Employees’ monthly salaries were halved between March 1997 and June 1997 by the liquidator. Between July and December 1997 workers were put on a quarter of what they were earning as of January 1997. By March 31 1998, liquidation had been completed and the Great African Insurance Company Ltd had been struck off the books both the National Insurance Commission and the Registrar of Companies. By March 2000 a good number of former employees of the company including senior managers were still unemployed for a variety of reasons ranging from lack of employment opportunities in the country generally to The Great African Insurance Company blemish.
QUESTIONS1. In what way and to what extent did the personality and
management style of Boakye Ofori contribute to the liquidation of the Great African Insurance Company Ltd? Contrast this with that of Owusu Boakye.
2. Identify the strategic focus of the management of the Great African Insurance company before the liquidation.
3. Outline the relationship between: a) Owusu Boakye and James Quaye b) Owusu Boakye and Boakye Ofori c) Owusu Boakye and Kwasi Akyeanpong d) Boakye Ofori and James Quaye.
Mr. Anastas Kabral NyamikehPost Office Box KT 143
Kotobabi, Accra Ghana
Email: [email protected]
58

Skyline Business Journal, Volume IX-Issue 1-2013-2014
Forthcoming ConferencesNo. Location Dates Area Website Address
1.
2.
3.
4.
5.
6.
7.
8.
9.
10.
11.
12.
13.
14.
15.
16.
Bangkok,Thailand
Valletta,Malta
Los Angeles, California, United States of America
Macau, China
Wellesley, Massachusetts, United States of America
Paris, France
Hong Kong
Sharjah, UAE
Geneva, Swit-zerland
Nagoya, Japan
Vienna, Austria
Seoul, Korea (south)
Istanbul, Turkey
Nadi, Fiji
Taichung, Taiwan
Lisbon, Portugal
1st to 3rd March 2014
2nd to 6th March 2014
7th to 8th March 2014
12th to 14th March 2014
20th to 21st March 2014
24th to 26th March 2014
26th to 28th March 2014
31st March to 02nd April 2014
2nd to 4th April 2014
2nd to 4th April 2014
6th to 10th April 2014
12th to 13th April 2014
13th to 16th April 2014
21st to 22nd April 2014
28th to 29th April 2014
15th to 16th May 2014
5th WLEC - Women’s Leadership and Empowerment Conference 2014
Mediterranean Conference for Academic Disciplines
2014 Spring Global Management Conference
2014 1st Journal Conference on Innovation, Management and Technology (JCIMT 2014 1st)
2nd International Conference on Management, Leadership and Governance – ICMLG
ICBTS 2014 Global International Conference on Business Tourism and Applied Sciences at Paris, France
The 2nd IBEA 2014, International Conference on Business, Economics and Accounting
International Conference onTourism Milestones -Preparing for tomorrow(ICTM 2014)
The 15th Corporate Strategies, Managerial Economic & Governance Forum
2014 International Symposium on Business and Management (ISBM 2014)
International Conference for Academic Disciplines (Vienna)
2014 3rd International Conference on Economics and Finance Research – ICEFR 2014
Istanbul 9th International Academic Conference - The IISES
Global Institute of Applied Business Research 2014 International Conference
2014 International Conference on Innovation, Service and Management- ICISM2014
5th international conference on Advances in Tourism Economics
http://www.tomorrowpeople.org/wlc-conference
http://www.internationaljournal.org/malta.html
http://www.uofriverside.com/conferences/globalmanagementconference/2014-spring-global-management-conference/
http://www.ijimt.org/jcimt/1st/
http://academic-conferences.org/icmlg/icmlg2014/icmlg14-home.htm
http://www.icbtstoronto.com/14115962/paris
http://www.caal-inteduorg.com/ibea2
http://www.skylineuniversity.ac.ae
http://csg-forum.review-gjsg.com/
http://tw-knowledge.org/isbm2014/
http://www.internationaljournal.org/vienna.html
http://www.icefr.org/
http://www.iises.net/conferences/istanbul-confer-ence-april-13-16-2014/
http://www.giabr.org
http://www.icism.org/
http://ate2014.apidt.com
59

Skyline Business Journal, Volume IX-Issue 1-2013-2014
No. Location Dates Area Website Address
17.
18.
19.
20.
21
22
23
24
25
26
27
28
29
30
31
32
33
Jakarta, Indo-nesia
Thessaloniki, Greece
Singapore
London, Eng-land, United Kingdom
Hong Kong, China
Tokyo, Japan
Placencia, Belize
Beppu, Oita, Japan
New York, United States of America
Istanbul, Turkey
London, United Kingdom
Singapore
Istanbul, Turkey
Dubrovnik, Croatia (Hrvat-ska)
Oxford, United Kingdom
Bangkok,Thailand
Lima, Peru
17th to 18th May 2014
23rd to 25th May 2014
12th to 13th June 2014
10th to 13th July 2014
22nd to 22nd July 2014
24th to 27th July 2014
24th to 28th July 2014
25th to 26th July 2014
26th to 29th July 2014
26th to 27th July 2014
28th to 29th July 2014
30th to 31st July 2014
31st July to 3rd August 2014
4th to 5th August 2014
4th to 5th August 2014
4th to 7th August 2014
5th to 8th August 2014
International Conference on Latest Trends in Management, Economics and Social Science - LTMES
International Conference on International Business
2nd Global Conference on Business Management (GCBM 2014)
The Economics, Finance, MIS & International Business Research Conference, London
2014 International Conference on Business and Computational Intelligence
The Global Business, Management Information System, Economics and Finance Research Conference, Tokyo
International Leadership Conference
2014 Summer Conference on Business & Economics Research
The Creativity Workshop in New York - July 26 - 29, 2014
IACSS 2014 - International Academic Conference on Social Sciences
International Conference on e-Business, e-Commerce, e-Management, e-Learning and e-Governance 2014
2nd Global Conference on Finance and Accounting (GCFA 2014)
The Finance, MIS, Economics & Global Business Research Conference, Istanbul
Business and Social Science Research Conference: Dubrovnik 2014
The Fourteenth International Conference on Knowledge, Culture, and Change in Organizations
7th International Colloquium on Tourism & Leisure (ICTL 2014) Conference
17th AMS World Marketing Congress
http://ltmes.theired.org
http://www.icib.eu/
http://academy.edu.sg/gcbm/
http://www.jaabc.com/london.html
http://www.foresight-hk.org/ICBI2014/
http://www.jaabc.com/Tokyo.html
http://www.icglgroup.org
http://www.apugsmconference.com
http://creativityworkshop.com/newyork.html
http://www.socscienceconf.com
http://www.ic5e.org
http://academy.edu.sg/gcfa/
http://www.jaabc.com/istanbul.html
http://macrotheme.com/conferences/dubrovnik
http://ontheorganization.com/the-conference
http://www.ictlconference.com
http://2014wmc.esan.edu.pe/
Skyline Business Journal, Volume IX-Issue 1-2013-2014
No. Location Dates Area Website Address
34
35
36
37
38
39
40
41
42
43
44
45
46
47
48
49
50
Taipei, Taiwan
Munich, Ba-varia, Germany
Amman, Jordan
Kuala Lumpur, Malaysia
Kuala Tereng-ganu, Tereng-ganu, Malaysia
Sarajevo, Bosnia and Herzegovina
Prague, Czech Republic
Albena, Bul-garia
Belfast, United Kingdom
Prague, Czech Republic
Paris, France
Rome, Italy
Hong Kong, China
Barcelona, Spain
Maui, Hawaii, United States of America
Pattaya, Chon-buri, Thailand
Macau
6th to 8th August 2014
7th to 8th August 2014
11th to 13th August 2014
16th to 17th August 2014
27th to 28th August 2014
29th to 31st August 2014
1st to 4th September 2014
2nd to 7th September 2014
9th to 11th September 2014
11th to 13th Septem-ber 2014
13th to 14th Septem-ber 2014
26th to 27th Septem-ber 2014
27th to 28th Septem-ber 2014
23rd to 25th October 2014
19th to 23rd Novem-ber 2014
10th to 12th December 2014
10th to 12th December 2014
International Conference on Education, Psychology, and Social Sciences
LCBR European Marketing Conference 2014
International Conference on Development of Research in Higher Education
International Conference on Business Strategy and Social Sciences
3rd International Conference on Accounting, Business and Economics
EUMMAS 2014 International Conference on Marketing, Management and Economics
Prague 12th International Academic Conference - The IISES
International Multidisciplinary Scientific Conferences on Social Sciences and Arts
British Academy of Management 2014 Conference - The Role of the Business School in Supporting Economic and Social Development
The 8th International days of Statistics and Economics
International Conference on Advances in Social Science, Economics and Management Study - ASEM 2014
The 2nd International Conference on Sustainable Development - ICSD2014
SIBR 2014 Hong Kong Conference on Interdisciplinary Business & Economics Research: Advancing Knowledge from Interdisciplinary Perspectives.
14th EBES Conference Barcelona
Applied Business and Entrepreneurship Association International (ABEAI)
Management and Innovation Technology International Conference
The 7th International Conference on Services Management (ICSM-7)
http://iceps2014.conf.tw/
http://www.european-marketing-conference.com/
http://www.researchconference2014.com/
http://www.pakrdw.com/?ic=details&id=3
http://icabec.umt.edu.my
http://conference.eummas.org
http://www.iises.net/conferences/prague-confer-ence-semtember-1-4-2014/
http://sgemsocial.org
http://bam.ac.uk/bam2014-ca-w
http://msed.vse.cz
http://asem.theired.org
http://www.ecsdev.org/index.php/conference
http://sibresearch.org/sibr-hongkong-conference-call.html
http://www.ebesweb.org/Conferences/14th-EBES-Conference-Barcelona.aspx
http://www.abeai.org
http://www.miticon.org
http://www.ift.edu.mo/icsm-7
60
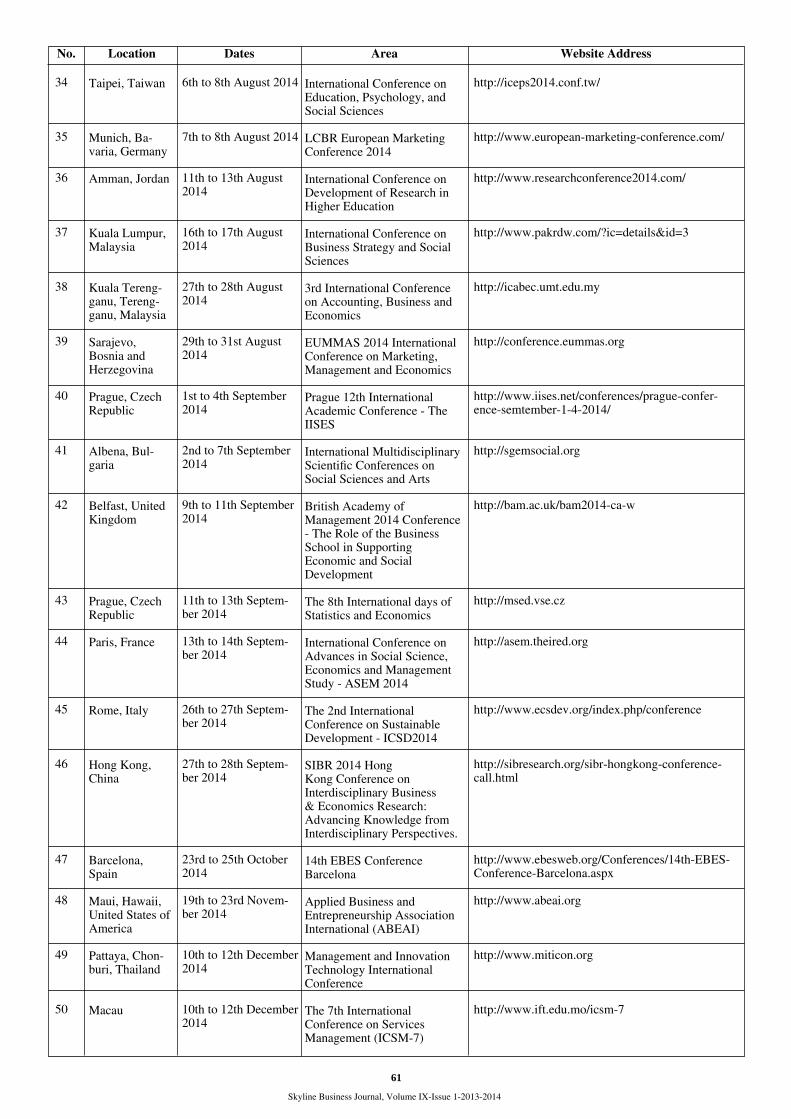
Skyline Business Journal, Volume IX-Issue 1-2013-2014
No. Location Dates Area Website Address
17.
18.
19.
20.
21
22
23
24
25
26
27
28
29
30
31
32
33
Jakarta, Indo-nesia
Thessaloniki, Greece
Singapore
London, Eng-land, United Kingdom
Hong Kong, China
Tokyo, Japan
Placencia, Belize
Beppu, Oita, Japan
New York, United States of America
Istanbul, Turkey
London, United Kingdom
Singapore
Istanbul, Turkey
Dubrovnik, Croatia (Hrvat-ska)
Oxford, United Kingdom
Bangkok,Thailand
Lima, Peru
17th to 18th May 2014
23rd to 25th May 2014
12th to 13th June 2014
10th to 13th July 2014
22nd to 22nd July 2014
24th to 27th July 2014
24th to 28th July 2014
25th to 26th July 2014
26th to 29th July 2014
26th to 27th July 2014
28th to 29th July 2014
30th to 31st July 2014
31st July to 3rd August 2014
4th to 5th August 2014
4th to 5th August 2014
4th to 7th August 2014
5th to 8th August 2014
International Conference on Latest Trends in Management, Economics and Social Science - LTMES
International Conference on International Business
2nd Global Conference on Business Management (GCBM 2014)
The Economics, Finance, MIS & International Business Research Conference, London
2014 International Conference on Business and Computational Intelligence
The Global Business, Management Information System, Economics and Finance Research Conference, Tokyo
International Leadership Conference
2014 Summer Conference on Business & Economics Research
The Creativity Workshop in New York - July 26 - 29, 2014
IACSS 2014 - International Academic Conference on Social Sciences
International Conference on e-Business, e-Commerce, e-Management, e-Learning and e-Governance 2014
2nd Global Conference on Finance and Accounting (GCFA 2014)
The Finance, MIS, Economics & Global Business Research Conference, Istanbul
Business and Social Science Research Conference: Dubrovnik 2014
The Fourteenth International Conference on Knowledge, Culture, and Change in Organizations
7th International Colloquium on Tourism & Leisure (ICTL 2014) Conference
17th AMS World Marketing Congress
http://ltmes.theired.org
http://www.icib.eu/
http://academy.edu.sg/gcbm/
http://www.jaabc.com/london.html
http://www.foresight-hk.org/ICBI2014/
http://www.jaabc.com/Tokyo.html
http://www.icglgroup.org
http://www.apugsmconference.com
http://creativityworkshop.com/newyork.html
http://www.socscienceconf.com
http://www.ic5e.org
http://academy.edu.sg/gcfa/
http://www.jaabc.com/istanbul.html
http://macrotheme.com/conferences/dubrovnik
http://ontheorganization.com/the-conference
http://www.ictlconference.com
http://2014wmc.esan.edu.pe/
Skyline Business Journal, Volume IX-Issue 1-2013-2014
No. Location Dates Area Website Address
34
35
36
37
38
39
40
41
42
43
44
45
46
47
48
49
50
Taipei, Taiwan
Munich, Ba-varia, Germany
Amman, Jordan
Kuala Lumpur, Malaysia
Kuala Tereng-ganu, Tereng-ganu, Malaysia
Sarajevo, Bosnia and Herzegovina
Prague, Czech Republic
Albena, Bul-garia
Belfast, United Kingdom
Prague, Czech Republic
Paris, France
Rome, Italy
Hong Kong, China
Barcelona, Spain
Maui, Hawaii, United States of America
Pattaya, Chon-buri, Thailand
Macau
6th to 8th August 2014
7th to 8th August 2014
11th to 13th August 2014
16th to 17th August 2014
27th to 28th August 2014
29th to 31st August 2014
1st to 4th September 2014
2nd to 7th September 2014
9th to 11th September 2014
11th to 13th Septem-ber 2014
13th to 14th Septem-ber 2014
26th to 27th Septem-ber 2014
27th to 28th Septem-ber 2014
23rd to 25th October 2014
19th to 23rd Novem-ber 2014
10th to 12th December 2014
10th to 12th December 2014
International Conference on Education, Psychology, and Social Sciences
LCBR European Marketing Conference 2014
International Conference on Development of Research in Higher Education
International Conference on Business Strategy and Social Sciences
3rd International Conference on Accounting, Business and Economics
EUMMAS 2014 International Conference on Marketing, Management and Economics
Prague 12th International Academic Conference - The IISES
International Multidisciplinary Scientific Conferences on Social Sciences and Arts
British Academy of Management 2014 Conference - The Role of the Business School in Supporting Economic and Social Development
The 8th International days of Statistics and Economics
International Conference on Advances in Social Science, Economics and Management Study - ASEM 2014
The 2nd International Conference on Sustainable Development - ICSD2014
SIBR 2014 Hong Kong Conference on Interdisciplinary Business & Economics Research: Advancing Knowledge from Interdisciplinary Perspectives.
14th EBES Conference Barcelona
Applied Business and Entrepreneurship Association International (ABEAI)
Management and Innovation Technology International Conference
The 7th International Conference on Services Management (ICSM-7)
http://iceps2014.conf.tw/
http://www.european-marketing-conference.com/
http://www.researchconference2014.com/
http://www.pakrdw.com/?ic=details&id=3
http://icabec.umt.edu.my
http://conference.eummas.org
http://www.iises.net/conferences/prague-confer-ence-semtember-1-4-2014/
http://sgemsocial.org
http://bam.ac.uk/bam2014-ca-w
http://msed.vse.cz
http://asem.theired.org
http://www.ecsdev.org/index.php/conference
http://sibresearch.org/sibr-hongkong-conference-call.html
http://www.ebesweb.org/Conferences/14th-EBES-Conference-Barcelona.aspx
http://www.abeai.org
http://www.miticon.org
http://www.ift.edu.mo/icsm-7
61

Skyline Business Journal, Volume IX-Issue 1-2013-2014
ISSN 1998 - 3425SKYLINE BUSINESS JOURNAL
Call for PapersSkyline Business Journal (SBJ) is an Annual publication of Skyline University College, Sharjah, U.A.E. SBJ invites original papers / Management Case Studies / Book Reviews from academicians and practitioners on management, business, tourism, finance, human resource management, information systems, marketing and organizational issues. Papers based on theoretical / empirical research or experience should illustrate the practical applicability and or the policy implications of work described.
Instructions for the Author
1. Electronic Copy: Authors are required to submit an electronic copy (soft copy) of the papers in MS-WORD format (.Doc format) via email to [email protected]. A single article (including charts, diagrams and pictures etc.,) should not exceed six thousand words. Times New Roman -Font size 12- to be used to type the manuscript.
2. Mailing Address: Complete Mailing Address along with Telephone and E-mail Address should be given.
3. Cover Page: The first cover page shall contain the title of the manuscript, the author’s name, and affiliation including ac-knowledgement, if any. This page will be removed before the manuscript is sent to a referee. The first page of text should show the title but NOT the author’s name.
4. Abstract and Keywords: Each manuscript should include an abstract of about 100-150 words. Key words used in the paper should also be given.
5. References: References must be typed on a separate page, double-spaced, at the end of the paper. American Psychological Association’s (APA) referencing method should be followed.
Articles Referred should be given as follows: Swann, W.B.,Jr., Milton, L.P., & Polzer, J.T. (2000). Should we create a niche or fall in line? Identity negotiation and
small group effectiveness. Journal of Personality and Social Psychology, 79: 238-250 Books Referred: Swann, W.B., Jr., Rentfrow, P.J & Guinn, J.S. (2002). Self verification: The search for coherence. In M.Leary & J.Tagney
(Eds.,). Handbook of self and identity: 367-383. New York: Guilford Press.
6. Main Conclusions: The article should end with a non-technical summary statement of the main conclusions. Lengthy mathematical proofs and very extensive detailed tables should be placed in appendix or omitted entirely. The author should make every effort to explain the meaning of mathematical proofs.
7. Tables: Tables must be numbered consecutively with Roman numerals. Please check that your text contains a reference to each table. Type each table on a separate page. Authors must check tables to be sure that amounts add up to the totals shown and that the title, column headings, captions, etc. are clear and to the point.
8. Figures: Figures must be titled and numbered consecutively with Arabic numerals (1, 2, 3……..0).
9. Equations: All but very short mathematical expressions should be displayed on a separate line and centered. Equations must be numbered consecutively on the right margin, using Arabic numerals in parentheses.
10. Clarity and Consistency: Please check your manuscript for clarity, grammar, spellings,punctuation, and consistency of references to minimize editorial changes.
11. Submission Fees: There is no fee for publication of articles.
12. Submission Deadline: Articles should be submitted before 15th June of every year for publication in the annual issue.
13. Editing: SBJ reserves the right of making editorial amendments in the final draft of the manuscript to suit the requirement of the journal.
14. Copyright: SBJ will have the copyright of all the materials accepted for publication. Wherever copyrighted material is used, the authors should be accurate in reproduction and obtain permission from copy-
right holders, if necessary. Articles published in SBJ should not be reproduced or reprinted in any form either in full or in part without prior written permission from the Editor-in-Chief.
15. Management Case Studies: Management Case Studies describe a real-life situation faced, a decision or action taken by an 62

Skyline Business Journal, Volume IX-Issue 1-2013-2014
Dr. Amitabh Upadhya Ph.D., Editor-in-Chief,
Skyline Business Journal,Skyline University College,University City of Sharjah
P. O. Box: 1797,SHARJAH- U.A.E
Phone: +971 6 5441155 Ext. 207Fax: +971 6 5441166
Email: [email protected] ;[email protected]
www.skylineuniversity.ac.ae
Please send your research papers to:
individual manager or by an organization at the strategic, functional or operational levels.
16. Book Reviews: Book Reviews cover review of current book on business.
17. Complimentary Copy: A free copy of the Journal will be mailed to the author whose article is published.
Skyline Business Journal, Volume IX-Issue 1-2013-2014
ISSN 1998 - 3425SKYLINE BUSINESS JOURNAL
Call for PapersSkyline Business Journal (SBJ) is an Annual publication of Skyline University College, Sharjah, U.A.E. SBJ invites original papers / Management Case Studies / Book Reviews from academicians and practitioners on management, business, tourism, finance, human resource management, information systems, marketing and organizational issues. Papers based on theoretical / empirical research or experience should illustrate the practical applicability and or the policy implications of work described.
Instructions for the Author
1. Electronic Copy: Authors are required to submit an electronic copy (soft copy) of the papers in MS-WORD format (.Doc format) via email to [email protected]. A single article (including charts, diagrams and pictures etc.,) should not exceed six thousand words. Times New Roman -Font size 12- to be used to type the manuscript.
2. Mailing Address: Complete Mailing Address along with Telephone and E-mail Address should be given.
3. Cover Page: The first cover page shall contain the title of the manuscript, the author’s name, and affiliation including ac-knowledgement, if any. This page will be removed before the manuscript is sent to a referee. The first page of text should show the title but NOT the author’s name.
4. Abstract and Keywords: Each manuscript should include an abstract of about 100-150 words. Key words used in the paper should also be given.
5. References: References must be typed on a separate page, double-spaced, at the end of the paper. American Psychological Association’s (APA) referencing method should be followed.
Articles Referred should be given as follows: Swann, W.B.,Jr., Milton, L.P., & Polzer, J.T. (2000). Should we create a niche or fall in line? Identity negotiation and
small group effectiveness. Journal of Personality and Social Psychology, 79: 238-250 Books Referred: Swann, W.B., Jr., Rentfrow, P.J & Guinn, J.S. (2002). Self verification: The search for coherence. In M.Leary & J.Tagney
(Eds.,). Handbook of self and identity: 367-383. New York: Guilford Press.
6. Main Conclusions: The article should end with a non-technical summary statement of the main conclusions. Lengthy mathematical proofs and very extensive detailed tables should be placed in appendix or omitted entirely. The author should make every effort to explain the meaning of mathematical proofs.
7. Tables: Tables must be numbered consecutively with Roman numerals. Please check that your text contains a reference to each table. Type each table on a separate page. Authors must check tables to be sure that amounts add up to the totals shown and that the title, column headings, captions, etc. are clear and to the point.
8. Figures: Figures must be titled and numbered consecutively with Arabic numerals (1, 2, 3……..0).
9. Equations: All but very short mathematical expressions should be displayed on a separate line and centered. Equations must be numbered consecutively on the right margin, using Arabic numerals in parentheses.
10. Clarity and Consistency: Please check your manuscript for clarity, grammar, spellings,punctuation, and consistency of references to minimize editorial changes.
11. Submission Fees: There is no fee for publication of articles.
12. Submission Deadline: Articles should be submitted before 15th June of every year for publication in the annual issue.
13. Editing: SBJ reserves the right of making editorial amendments in the final draft of the manuscript to suit the requirement of the journal.
14. Copyright: SBJ will have the copyright of all the materials accepted for publication. Wherever copyrighted material is used, the authors should be accurate in reproduction and obtain permission from copy-
right holders, if necessary. Articles published in SBJ should not be reproduced or reprinted in any form either in full or in part without prior written permission from the Editor-in-Chief.
15. Management Case Studies: Management Case Studies describe a real-life situation faced, a decision or action taken by an 63

Related Documents


