BI Analytics & CRM Health Check Date: 24-June-2011

Welcome message from author
This document is posted to help you gain knowledge. Please leave a comment to let me know what you think about it! Share it to your friends and learn new things together.
Transcript

BI Analytics &
CRM Health
Check
Date: 24-June-2011

Confidential | Valuefy Consultants Pvt Ltd 2
Contents
Page No. Topic
1. BI & Analytics Health Check Overview ----------------------------------- 4
2. Valuefy Health Check Matrix ---------------------------------------------- 7
4. Gap Analysis Report for IT Enabled Information Management ------- 14
5. Gap Analysis Report for Business Intelligence --------------------------- 21
6. Gap Analysis Report for Analytics & Scorecards ------------------------- 26
7. Gap Analysis Report for 3Ps ------------------------------------------------- 33
8. Credit Scoring ---------------------------------------------------------------- 37
9. BI Framework including KPIs ------------------------------------------------ 44
3. Timelines For Recommendations ------------------------------------------ 12

Confidential | Valuefy Consultants Pvt Ltd 3
BI & Analytics Health Check Overview
Methodology Adopted*
To study the existing policies, frameworks and systems at Mimo Finance
To provide an objective, third party assessment on the as-is state-of-the-house
To identify gaps in the current frameworks with respect to industry best practices, but relevant to Mimo
To provide recommendations/ action items with a roadmap depending on importance & criticality
Objectives of the Engagement
The following key business divisions were studied at Mimo Finance over the discussions with the members of senior management and junior staff
Organization Heads
JLG
MESO
Vigilance
Audit
MIS
IT Projects
* Details of Methodology Adopted shown in next page
Deliverables to MIMO
For each of the business divisions
the gaps between the current state
at Mimo and the best practices in
industry were identified and based
on these gaps, key business
recommendations for each of these
are being presented

Confidential | Valuefy Consultants Pvt Ltd 4
Valuefy Health Check Methodology
Study Module
• On-site study and assessment of current Mimo’s practices
• Study of systems, resources, strategies, scorecards and analysis done by Mimo
Analysis Module
• Analysis of Mimo’s practices
• Bench marking against the best in breed & identifying areas of improvement
Consulting module
• Final recommendations report
• Suggested approach to Mimo to deliver best practices
Valuefy On-site CRM Assessment
Valuefy Health Check Engine
Valuefy Health Check Report

Confidential | Valuefy Consultants Pvt Ltd 5
Thank You
We sincerely thank the whole Mimo Team for lending their whole hearted
support to us during our onsite study. Our best wishes to all the
members of the Mimo team.
We would specifically like to thank:
o Mr. Murali
o Mr. Manav
o Mr. Rahul
o Mr. Harshabardan
o Other members of the Mimo Team
Valuefy Health
Check Matrix Current State, Gaps & Recommendations

Confidential | Valuefy Consultants Pvt Ltd 7
Challenges
Challenge for Mimo Enablers
Achieve the aggressive growth targets with risk control
Create a brand name and build customer association
Create scalable systems and processes to support the growth
Scalable and forward looking customer acquisition process
Proactive risk and delinquency management
Robust IT systems and support mechanisms
Business Intelligence & Predictive Analytics

Confidential | Valuefy Consultants Pvt Ltd 8
Valuefy BI Analytics & CRM Health Check Matrix
Note: Refer Glossary for detailed explanation of the parameters
Single Source of Truth Comprehensive Zero Redundancy Closed Loop
IT Enabled Information Management
Data Maturity
IT Enablement
Structure Comprehensive/ Excellence Zero Redundancy/ Efficient Closed Loop
The 3Ps
People
Policies
Processes
Completely Achieved Not Achieved Further Analysis Required Partially Achieved Areas of strategic importance
Accessibility Comprehensive Analytical Capabilities Closed Loop
Business Intelligence Tools/Reports
Usage
Data Adequacy Comprehensive Analytical Rigor Closed Loop
Analytics & Scorecards
Customer Acquisition
Monitoring & Recovery
CRM Analytics

Confidential | Valuefy Consultants Pvt Ltd 9
Mimo’s standing on TDWI’s Maturity
Model
A representation of the five stages of TDWI Maturity Model. The Y-axis or the bell curve suggests the
percentage of organizations in any given stage.
Operational Reports
(static, inflexible)
Spreadmarts
Customization required
for any different report
Problems with data
integrity
GULF
Perception of BI as strategic
Funding
Data Quality
Comfort with spreadmarts
Adhoc step to BI
Multiple data marts
specific to department
Less control
First set of reports
Broader approach to BI
Central data warehouse
Business Intelligence
Unit formation
Usage of information to
make decisions
KPIs defined
Use of OLAP, yet ad hoc
reports
CHASM
Business Volatility & ownership
Standardizing semantics
Corporate centralized IT
Report chaos
Avoiding architectural inflexibility
TDWI (The Data Warehousing Institute) provides education, training, certification, news, and research for executives and information technology (IT) professionals worldwide. Founded in 1995, TDWI is the premier
educational institute for business intelligence and data warehousing.
Unified Architecture
with multilayered
enterprise warehouse
Comprehensive data
Just-In-Time delivery
Strategic viewpoint to
performance
Predictive analytics
BIU reports to CXO
Standard development
methodologies for
application propagation
Extended enterprise to
customers, suppliers etc.
Event driven
triggers/alarms
Advanced architectural
flexibility
MIMO

Confidential | Valuefy Consultants Pvt Ltd 10
Key Recommendations IT
En
able
d In
form
atio
n
Man
agem
ent
Recommendations Suggested Approach
Align organization structure to analytics
Have control over database & applications
Remove data duplication
Make data structure comprehensive
Merge IT & MIS, Create separate BIU, suggest business to participate in data requirement and analysis infrastructure set up
Speak to BR.Net for arrangement: Mimo should have full database control with unlimited query capability. If not possible, create in-house
Have a single organization data warehouse with applications feeding data into it and information/analyses flowing out of it
Integrate Audit data of FE and Branch grading
Capture Pre-GRT data to be used for analytics and completing the PDCA
Bu
sin
ess
Inte
llige
nce
Recommendations Suggested Approach
Improve accessibility
Enhance usability
Achieve comprehensiveness
Close Loops
Get direct access to database and reduce time for customized query/reports.
Create dashboards and mechanisms for decreasing the data collection and dissemination life cycle
Use OLAP tools for better analysis and extracting intelligence
Emphasize informed decision making across all aspects of customer lifecycle
Analyze end to end information for comprehensive analysis and creation of cause-effect relationship

Confidential | Valuefy Consultants Pvt Ltd 11
Key Recommendations A
nal
ytic
s &
Sco
reca
rds
Recommendations Suggested Approach
System Driven Expert Scorecard
Track & Monitor the performance
Create new product offerings through Analytics
Progress towards statistical scorecards for various lifecycle of customers
Back test the Judgmental Scorecard & include other parameters in Credit Decision system
Track the performance of attributes
Create Segmentation groups & cross-sell products
Designate a team who keep tracking campaigns & analytical reports
Complete the data entry in data warehousing
The
3P
’s (
Peo
ple
, Po
licie
s &
P
roce
sses
)
Recommendations Suggested Approach
Create/rename functional roles
Reduce overheads
Close Loops
Create Acquisition, risk and collection heads and avoid the same person handling the sales, collections and risk
Align with IT systems, bring agility by reducing human intervention, documents faxing etc.
Encourage and instill the process of tracking customer behavior/defaults with application information using BI tools
Create processes to capture ad hoc data at ground level, like demographic transition, which can be used for strategic intent

Timelines For Recommendations

Confidential | Valuefy Consultants Pvt Ltd 13
Key Action Items with timelines
Get pre-GRT data, Capture
demographic transitions, events,
competitor info
Transition to enterprise warehouse
Reduce data dissemination cycle,
reduce paperwork/overheads
IT & Data Consolidation
Get unlimited query control of
warehouse, reduce TAT of
customized information
Freeze & start measuring KPIs
Use information for decision
making
Eliminate report chaos
Information to Decision
Back tested & System driven
Judgemental scorecard
Segmentation framework for
Cross-sell of other products
Analytics & Usage
A
C
T
A
C
H
I
E
V
E
Single source of truth achieved
Better information availability
Integrated applications
BI capability
Cause effect analyses
3 Months 9 Months 1.5 Years
Increasing analytical capability, usage and strategic alignment
Statistical Scorecard for
Application Processing
Plan for Collections/ Recovery
Scorecard
Plan to develop Behavioral
Scorecard
Advanced Use of analytics
Create dashboards, OLAP reports
with graphics/charts
Triggers & Alarms
Close loops
Train users, create BIU
Accelerate BI alignment
Integrated scorecards

IT Enabled Information Management Gap Analysis Report

Confidential | Valuefy Consultants Pvt Ltd 15
IT Enabled Information Management
To create an infrastructure having comprehensive data storage mechanism, accessible on the fly to business users across the organization for analysis and decision making across the customer lifecycle.
A state-of-the-art Information Management is ensured by the following:
Enterprise Data Warehouse depicting single source of truth
Comprehensive & efficient data capture from all touch points
IT applications to support the business processes with a closed loop
Zero redundancy in data and applications
Data Warehouse completeness requires covering the following touch points:
Customer Acquisition
Payment Interactions
Delinquency cases
Fraud
Other interactions providing data for future use
Databases
Applications/Devices for data capture
Database programmers
Application programmers
Business Objective
Best Practices
Tools Skills
Ideal State

Confidential | Valuefy Consultants Pvt Ltd 16
IT Enabled Information Management
Database & Applications
BR.NET
Software as a service, web application with SQL server database, not open to query facilities
All customer data (post GRT) captured and maintained in BR.NET
Customer Data is captured from various touch points by field officers at a branch level
► Acquisition (New Customer): Post DPN, the customer data from forms in regional office is entered by MIS Team
► Collections: Data entered by Branches directly (system in process)
► Delinquency: Data entered in system with lag
The data is reflected in the database in 2 days time, first time OD gets reflected in 3-4 days at RMO
Operations Management
Developed by IT vendor, hosted on a cloud owned by Mimo
Data pre GRT to be captured, Other data to be updated via daily dump from BR.Net
Audit department data would be integrated into this
GIS
Data from third party sources, census etc. for visual geographical heat-map analysis (closed loop, integrated MIS)
HRMS
HR management for internal purposes
Outsourced hardware/software/cloud
MIS Team (9)
IT Projects (1)
Outsourced vendors
Tools Skills
Current State Current State

Confidential | Valuefy Consultants Pvt Ltd 17
IT Enabled Information Management - Gaps
Comprehensiveness - Not fully achieved
► Data storage post GRT. Data pre-GRT is not stored, data for rejects is not stored
► Few fields in application form entered as ad hoc fields, not fully integrated with the main warehouse
► Data from audit department to be integrated into the ops system
Architecture - High Redundancy Medium Scalability, Low Integration
► Ops management tool to replicate BR.Net data and have additional pre-GRT data, to be hosted on the cloud
► Distributed ad hoc systems with databases for individual systems
► Plan of further increasing the databases to be hosted on cloud
Information Accessibility - Limited
► Data resides with external vendor accessible through third-party application
► Limited query of data possible with paid ad-hoc requirements having a turn-around time of 5 days+
► Huge cost implication as data need grows
Capture and store all data from acquisition stage to payment to reap the BI & analytics benefits. Targets, Pre-GRT, rejected customers, audit, payment and other data to be captured in one database for seamless usage
Milk the multiple and frequent touch-point nature of basis to keep gathering data of existing and past customers. Capture data of demographics, non-customers in order to derive proactive intelligence for planning and target setting in the dynamic competitive scenario.
Eliminate data redundancy. Have a single source of truth, either with a customized package with BR.Net or a complete in-house application. Recommended to start streamlining distributed data sources and build a central data warehouse. Gradually start building in-house IT capability with outsourcing restricted to complex skill sets.
Integrate databases and systems with control over data warehouse
Refer ‘Recommended Information Management structure’ section for details for suggested architecture.
Get control of data warehouse
Provide unlimited query and analysis capability lest people develop the “Work with whatever available” syndrome
Not required Nice to do Long term musts Quick wins – To do immediately
Gaps Recommendations

Confidential | Valuefy Consultants Pvt Ltd 18
IT Enabled Information Management - Gaps Gaps Recommendations
Not required Nice to do Long term musts Quick wins – To do immediately
Efficiency & Productivity - Medium
► Data from source to MIS takes some time (2-3 days)
► Forms are not optimized for data entry, currently 100 applications per day which can be increased to 150+ per day
► First time OD gets noticed at RMO after 3-4 days
► Currently 42 registers across systems to tally and check
IT Enablement
► Good processes and systems coverage to begin with, however scalability can be an issue
► In its current state, the processes are well defined and there are significant amount of checks in the system, which are not IT enabled
► Huge collection of forms, paper work, well documented
Get the forms modified to enable optimized data entry and reduce overheads and lag.
Put IT enablement/systems in place to reduce the data capture and dissemination life cycle (Branch level entry, mobile etc.)
Reduce paper work and align with IT to enhance productivity and reduce human error
The processes for each department should be mapped and IT enabled as far as possible, reducing paper work and chances of human error
► Customer acquisition process flow: Pre GRT, DPN, DCN… approvals, checks etc. should happen online to save time and traceability
► Reviews and Checks should move from reviewee item to reviewer to closer via an IT enabled process e.g. Audit
► This would enable to tighten the loose ends, add to productivity and transparency
Reduce paper-load, digitize and keep essential papers only
Emphasize contribution towards low-carbon-footprint and ‘the first’ as a Mimo initiative

Confidential | Valuefy Consultants Pvt Ltd 19
Current IT Information Management Structure
Batch Run (ITG)
---- ---- ----
Reports
Daily Excel Dump
Engine Database
BR.NET APPLICATION
BUSINESS USERS MIS TEAM/BO/RO
DATA ENTRY ANALYSIS
---- ---- ----
Reports Engine Databases
FUTURE/OPS APPLICATION
OPS
Hosted on cloud
GIS
BR.NET database not accessible
Redundancy of data, processes and reporting applications
Data sanity might become an issue
Scalability issues

Confidential | Valuefy Consultants Pvt Ltd 20
Proposed IT Information Management Structure
GIS DATAMART CUSTOMER & OPERATIONS
ƒ(x) = п{ά + βXn + Xnƒn(s)/ds}
ANALYTICS ENGINE ANALYTICAL MODELS
OLAP CUBES
TRIGGERS & ALERTS
BI & ANALYTICS LAYER (WEB APPLICATION WITH OLAP FUNCTIONALITY FOR ANALYTICAL DECISION MAKING)
MIS/IT TEAM BRANCH/REG OFF OTHER USERS
HR & OTHERS
DATA WAREHOUSE
ANALYTICS APPLICATIONS
PROCESS ENGINE DATA ENTRY
PROCESS CONTROL
CLOSED LOOP
PROCESS APPLICATIONS
PMD VIGILANCE CXO BIU
C
L
O
U
D
H
O
S
T
I
N
G
M
I
M
O
O
W
N
E
R
S
H
I
P

Business Intelligence Gap Analysis Report

Confidential | Valuefy Consultants Pvt Ltd 22
Business Intelligence
To track and monitor performance, risk and other metrics across key functional areas
To benchmark the key metrics against the best in breed/targets
To provide pro-active insights and be a lever of strategy formulation and implementation
OLAP – Business Objects, Cognos, Brio, Third party softwares etc.
OLAP technical team
BIU team
Key Business Impact
Tools Skills
Best Practices
A BI framework that enables business users to make informed and proactive decision is characterized by:
On the fly accurate, availability of information with high degree of recency
Robust analytical engine with OLAP functionality allowing top-down analysis with spreadsheet and graphical view
Canned MIS mapped to hierarchical KPIs with fast turnaround for custom queries
Well defined dashboards for CXOs to get a top-level view
Trigger and Trip-wire mechanisms to catch attention and ensure response
Ideal State

Confidential | Valuefy Consultants Pvt Ltd 23
Business Intelligence
MIS Team for facilitating with BR.Net BR.NET : third party application
APPLICATION: BR.NET
MIS Reports being accessed from a third party application being used as SAAS
Reports structured under various relevant modules as required by business users
ACCESSIBILITY, COMPREHENSIVENESS & REDUNDANCY
BR.NET accessibility as per the roles and restrictions
Reports broadly cover all business areas under the following modules:
► Client
► Loan Module
► MIS Reports
► Microfinance Module
► Customized Reports and Others including P&L, Ledger etc. (For customized reports and analyses, MIS team facilitates with BR.NET – 5 days TAT)
Overlap of data in reports, some reports overlap to a large extent
BI/ANALYTICAL CAPABILITY
Simple tabular reports with no drill down, graphical facility
Availability of filters
Tools Skills
Current State
Current State

Confidential | Valuefy Consultants Pvt Ltd 24
Business Intelligence - Gaps Gaps Recommendations
Not required Nice to do Long term musts Quick wins – To do immediately
User Friendliness & Accessibility: Medium-Low
► Reports are available through BR.NET application
via the web
► Some reports and analysis created in excel
promoting proliferation of spreadmarts
► Basic reports provide data specific to certain
queries: in-depth reports required for analyses
are missing
► Custom information sought takes more than five
days: such delays can kill the motive for analyses
and lead to “work with whatever available”
approach
Comprehensiveness: Low
► Current set of reports do not comprehensively
capture key metrics.
► Low emphasis on customer analysis: Complete
customer information is not available for analysis
and it cannot be mapped to the payment behavior:
PDCA loop is missing
► Reports for transition of risk, defaulters etc.
though present are not easy to analyze
Comprehensive information must be made available on a
button click. Create infrastructure for reports that can be
readily used for analyses.
Avoid spreadmarts lest it becomes a comfortable habit
Reduce time required for custom information/reports to
less than 1.5 days: Discuss with vendor and get direct
query access to database.
Emphasize business users to derive intelligence from
reports
Align reports by business functions and KPIs thereof.
Create comprehensive information disbursement system
covering all aspects of the customer life cycle including* :
► Acquisition & CRM
Customer analysis
New product analysis
► Risk Management
Customer behavior analysis
Exposure analysis
Collections analysis
► Profitability Analysis
Profitability analysis
Operational Efficiency
* These are broad & indicative report heads. See BI Framework for details.

Confidential | Valuefy Consultants Pvt Ltd 25
Business Intelligence - Gaps Gaps Recommendations
Not required Nice to do Long term musts Quick wins – To do immediately
Redundancy: Medium
► The reports are dispersed and in quite a few cases have overlapping information
Strategic & Analytical Capability: Missing
► Reports are tabular in nature without any interactive features allowing drill down of data from top to bottom: hampers any analytical fact finding and subsequent decisioning
► Report structure is a bunch of reports rather than being aligned to functions/roles based KPIs
► No dashboards, incomplete hierarchical KPI measures and missing trigger and trip-wire mechanism
Merge reports which carry common data/analyses in a top-down hierarchy
Remove reports with no data and create a clean structure in BR.NET
Migrate from visualizing information to Business Intelligence using OLAP*
Create a new BI structure with the following:
► Well defined KPIs for hierarchies
► Dashboards are per the KPIs
► Triggers and trip-wire mechanisms
► Reports with Drill-down, Sort, Filter feature real-time on the report
► Ability to add/remove dimensions on the fly
► Mix of Graphical and Cross-tab, tabular reports
Create a group/sub-group as BIU who own and maintain the system from technical and business perspective
Train users on usage of these tools and emphasize the value add

Analytics & Scorecards Gap Analysis Reports

Confidential | Valuefy Consultants Pvt Ltd 27
Benefits of Analytics & Scoring to Mimo An organization in the stage of transformation or in the process of scaling up can benefit from the use of
Scorecards and Analytics in the following ways:
Streamline the lending process & reach out more clients
Improve loan officer efficiency & thus lowering the cists and enhancing the productivity
Increase the consistency of the evaluation process
Reduce human bias in the lending decision
Enable the bank to vary the credit policy according to risk classification
Quantification of expected losses for different risk classes of borrowers & managing default rates
Reduce time spent on collections
Improved client retention and Marketing Opportunities.
Create new products specific to a set of clients/ geography/ demand.

Confidential | Valuefy Consultants Pvt Ltd 28
Types of Analytical Scorecards – must have Following types of Analytical frameworks can be used for decision making, mapped to various stages of
Customer Development:
Application Scoring – Used for Customer Acquisition (Approval or Rejection of an application)
Behavioral Scoring – Used for Loan Management, Monitoring & Tracking defaults, predicting the likelihood of default of next payments for the customer.
Collections Scoring – Used for recovery from customers who are already in OD.
Segmentation – Used for analyzing the existing set of customers in designing new products as per the needs of the customer.

Confidential | Valuefy Consultants Pvt Ltd 29
Analytics & Modeling Key Business Impact
Best Practices
Tools Skills
Use of Credit Scoring System for Loan Evaluation and processing.
Use of Behavioural Score in Monitoring the existing Customer base, cross sell opportunities, top up loan
Use of segmentation framework to create new products, identify cross sell base and create campaigns.
Use of collection scores/ segments to prioritize the Recovery process
Periodic use of Analytical MIS & Reports to track Portfolio performance.
User friendly tools that aid the business users in monitoring the portfolio at various stages by various dimensions using the OLAP drill down capabilities.
Data Mining Tools (SAS, SPSS)
OLAP Tools
Data Mining specialists
Database specialists
Business Analysts
To understand customer behavior and increase customer acquisition rate, customer retention rate and customer profitability
To carry out mass Customization , drive new product development and identify prospects accurately for target marketing
To drive new product development
To provide best services to most valuable customers by effective cherry picking
Ideal State

Confidential | Valuefy Consultants Pvt Ltd 30
Analytics & Modeling
Excel Spreadsheets Well trained and experienced staff
MIMO currently follows a 6-parameter evaluation statistics for approving a JLG customer, and has well defined Judgmental Scorecards for each of the three products for MESO.
The scorecards developed by Mimo are of Judgmental in nature and have never been tracked for their effectiveness. The scorecards are assumed to keep the risk in control.
The customer scoring is done in hard copies or excel spreadsheets.
Post Approval, a Loan Utilization Check is conducted to figure out the purpose of loan utilization and level of utilization.
The repeat customers (even 3rd or the 4th time customers) take a lot of time in approval due to the absence of Behavioral Score.
For collections, the customers are divided in 3 categories – A, B, C. In determining these categories, the reason for non payment such as “absconding” are of prime importance.
Tools Skills
Current State
Current State

Confidential | Valuefy Consultants Pvt Ltd 31
Analytics & Modeling - Gaps Gaps Recommendations
Not required Nice to do Long term musts Quick wins – To do immediately
Acquisition
Current Scorecards used for the evaluation of Customers are not adequate
Almost 90% of the reported delinquency is due to Operation Staff
Inadequate historical data for statistical credit scoring.
Only Housing Index is some kind of objective evaluation criteria for JLG customers.
For Meso Operations, there are different judgmental scorecards for different products
The current scorecards are not back tested for performance.
The current scoring mechanism is carried out in excel spreadsheets by the Credit Officer
Monitoring/ Tracking
There is no mechanism to track the customer behavior, i.e. a customer having x days of arrear moving into y days of arrear
Only Loan Utilization Check is some kind of Post Acquisition monitoring of a customer.
Include the Field Officer Rating/ Branch Rating as one of the parameters in the Scorecard.
Capture additional data fields for JLG clients similar to MESO clients
Capture the data on Reject applicants in the system.
As the data starts building, back test the Scorecard parameters for their effectiveness in Credit Appraisal
Need to arrive at an optimum level of bad rate vs. approval rate using the current application scorecard. Mimo needs to evaluate the extent of additional loss it can bear for a particular increase in approvals to maximize profitability
Move from Judgmental Scorecard to Statistical Scorecard
Integrate the Scorecard with the IT Systems so that the information of scorecard characteristics is stored in the database for Scorecard Tracking & Quick Turn around.
A roll rate analysis needs to be done to identify what % of customers migrate over x days OD to y-days OD
Identify Branches , products & other characteristics where the movement from lower arrears to higher arrears are the highest.
Develop a Behavioral Scorecard based on the various parameters to track the behavior of a customer post acquisition.

Confidential | Valuefy Consultants Pvt Ltd 32
Analytics & Modeling - Gaps Gaps Recommendations
Not required Nice to do Long term musts Quick wins – To do immediately
Collections/ Recovery
Scorecards used in the area of recovery are not able to Quantify and are based on the reasons of not payment.
CRM Analytics
Skill sets in the area of building, recalibrating and tracking the effectiveness and validity of the models need to be supplemented
Sales & Marketing department is faced a problem with problem of attrition from the Competition.
Sales & Marketing also faces challenges in creation of new products for increasing the business.
Absence of structure and framework to support any Retention, Activation, Usage, New card Acquisition Strategy
No quantifiable Customer score available to gauge the value of a particular customer
Employ recovery scorecards/ segments with different level of recovery efforts.
Resources need training on the following
► Modeling
► Recalibration
► Monitoring and Tracking models
► Usefulness of models
► Incorporation of models into decision making
Modeling needs to be done to predict attrition
Leverage huge JLG customer base by cross selling Individual (MESO) loans by segmenting them on different dimensions.
Capture the demographic details, socio-economic details in the GIS Project to create the area specific products.
Run campaigns for customer development and product penetration.
A repeat customer should have lesser processes and the case load for repeat cases should increase

The 3Ps: People, Policies, Processes Gap Analysis Report

Confidential | Valuefy Consultants Pvt Ltd 34
People, Policies, Processes: The 3 Ps
To create an organization with committed people aligned to organizational goals, with policies as business enablers supported by scalable processes that can detect and reduce malfunctions.
Well defined organization structure mapped to business objectives and functions
Non-overlapping roles & responsibilities
Directionally Aligned (Risk & Marketing should not be under the same head)
Clear ownership
Capable team to implement the organization strategy
Clear and comprehensive policies for each business functions
Policies should be comprehensive to plug-in various gaps
Should have a closed-loop to ensure that what is achieved was what was aimed
Robust and efficient processes to reduce overheads
Processes to ensure policies are adhered to
IT enablement to reduce human bias, dependency and ease of tracking
Policy documents
IT enabled processes
As per business functions/units
Business Objective
Best Practices
Tools Skills
Ideal State

Confidential | Valuefy Consultants Pvt Ltd 35
People, Policies, Processes: The 3 Ps
Organization Structure & People
Excellent and committed team with ownership and understanding of responsibilities
Operations team structure by asset type (JLG & MISO) and functions (Planning, Audit, Vigilance, MIS, IT)
MESO person handling the Sales, Payment and Risk himself
Planning and Monitoring clearly involved at Acquisition stage
Vigilance oversees the payment and delinquency
Capable team with innovative mechanisms and plug-ins to processes (FEs transfer, people planted etc.)
Policies
Well laid out policies, non-compromising and adhered to
Processes
Robust processes to support the policies and people
A good amount of human intervention
Significant paper work (42 registers overall including collections, OD)
Low IT enablement of processes
Closed loop missing
Policy documents in place Skilled & Dedicated teams
Understanding of business
Shortage of team (one man army)
Tools Skills
Current State
Current State

Confidential | Valuefy Consultants Pvt Ltd 36
People, Policies, Processes: The 3 Ps - Gaps
Gaps Recommendations
Not required Nice to do Long term musts Quick wins – To do immediately
Role Overlap/Directional Alignment – Scope for Improvement
► Planning and Monitoring department is involved in acquisition, disbursement and collections. Since the FE doing the sale and collections is same, bias can creep in as the scale grows and monitoring becomes difficult
► MIS is only facilitating the ad hoc reporting and does data entry. IT looks after new projects.
► MESO: single person responsible for sales, default management and risk; not very scalable
Processes – Slight overhead
► Huge amount of paper work involved with human intervention
Closed Loop - Low-Medium
► Risk mapping at acquisition stage not mapped with payment behavior to validate risk policies
► Unilateral audit process not closed with BM/FE and not tracked against territory performance
► No clear process for indentifying demographic dynamics and pass on information for planning & new products
Since the business structure would remain the same, a very strong and efficient process is required to ensure risk control
► Process to track attendance, and not just amount, on a daily basis at collection centers is a must, else FE bias/judgment might result in the delinquency creep in getting noticed at a delay
Merge IT & MIS into one as the IT department. Create a separate BIU (Business Intelligence unit) as the data maturity and analytics maturity grows in organization
Bring MESO risk under Vigilance/Risk Dept. which should be solely responsible for risk
Strengthen the processes with IT backbone to minimize paper work and human involvement
Reduce faxing documents, manual checking wherever possible and align with IT systems with appropriate triggers based actions
Important to have a closed loop mechanism for all policies to ensure that the policies are right
► Regularly check performance of clients with their screening score to uphold/modify the screening parameters
► Allow BM/FE to play a role in audit ratings
► Allow system to capture demographics, competition etc. information to leverage the ‘frequent touch point’ nature of business

Credit Scoring

Confidential | Valuefy Consultants Pvt Ltd 38
Steps to Implement a Credit Scoring System
Segment Definition:
Identify the type of customers and products for which the scoring model will be used
Type of Scorecard:
Judgmental: structured from expert judgment and institutional experience
Statistical: A statistical model score predicts the probability of default for an individual borrower. This degree of precision makes it the most powerful scorecard type for risk management, pricing and provisioning.
Hybrid: A hybrid model can be back-tested on all historic cases to define historic probability of default at various score levels.
Scorecard Design:
Bad Definition: A precise, quantitative definition of “bad” is crucial for deriving numeric relationships between each risk measure and the “bad” loans. It is must have for a statistical scorecard, judgmental scorecard can be built without this, but for back testing it is required. A “bad” may be a client who might have been 15 days late in paying installment.
Characteristic Selection: Exploratory analysis of characteristics to consider for inclusion in the model and a basic understanding of the shape of the relationship between each characteristic and repayment risk. For a judgmental scorecard no advanced statistical knowledge or software is necessary except for Statistical/ Hybrid Scorecards.
Development: Development involves applying weights to the selected model factors and creating a scorecard. Statistical model weights are taken directly from the statistical outputs, such as a regression equation, while judgmental model weights are set manually based on the perceived importance of individual factors and the implications of their interactions. Hybrid scorecards combine the statistical and judgmental techniques explained above. One potential “hybridization” is the combination of a statistically derived score, such as a bureau score, with a judgmental score using a matrix approach

Confidential | Valuefy Consultants Pvt Ltd 39
Steps to Implement a Credit Scoring System
Scorecard Testing & Monitoring
back tests present the scorecard’s classifications for the entire set of data used to develop the card. For
judgmental models, we can perform similar analysis if we can gather a sample of data on repaid loans for
which we know whether the client was always good or at any point became bad.
A pilot testing of scorecard where the scorecard is run parallel with the existing system of Loan Approval is
done.
The end users should be trained on the usage of scorecards & it application, cut-offs, etc.
a scorecard can be deployed most effectively as an additional module to an existing software platform. The
maturity and flexibility of IT systems will influence how best to integrate the scorecard.
Model Management
Scorecard management is a long-term process that must live well beyond the initial development and
implementation. It requires checking for whether the Scorecard is able to classify the Good/ Bad Loans,
checking of individual parameters and their attributes in terms of classification power.

Confidential | Valuefy Consultants Pvt Ltd 40
Challenges in Implementing a Credit Scoring System
Collecting the accurate and comprehensive data necessary to develop a scorecard
As per the current state, the data is being stored at BR.NET. The system currently stores certain information with respect to normal processing, accounting, tracking etc. But the Credit Scoring details are not being fed into the system. This limits the availability of the data to track, monitor or create any Scorecard.
Investment in developing an MIS platform that can store the needed data and produce a result (integration)
The MIS system currently is not integrated with the Application screening system.
Large enough sample for creating “Bad”,”Good”, “Reject” clients.
In order to build a robust application scorecard, industry norms suggest that there need to be 1,800 good accounts, 1,800 bad accounts, and 1,800 rejected applications over an 18-24 month period. At Mimo, the information on rejects is not being captured at all. Very few number of bad cases again limit the creation of a Statistical Scorecard.
The data used to produce scorecards needs to be accurate to create accurate results. However, it doesn’t need to be perfect, as the data will always have some errors and randomness.
At times due to staff the data being captured is not accurate enough, for ex: reasons for OD – whether default from a client or staff is not being maintained and accuracy of some of the other information. The cases of such instances are not huge. Hence creating a statistical scorecard can be weighted towards subjective evaluation until the data quality is sufficiently improved.
Buy in from the staff
The staff (Credit Officer) is currently using an expert scorecard and hence the buy in from using Analytical Decision Making system is there but the same needs to be spread across others to scale up things.
Confidential | Valuefy Consultants Pvt Ltd 41
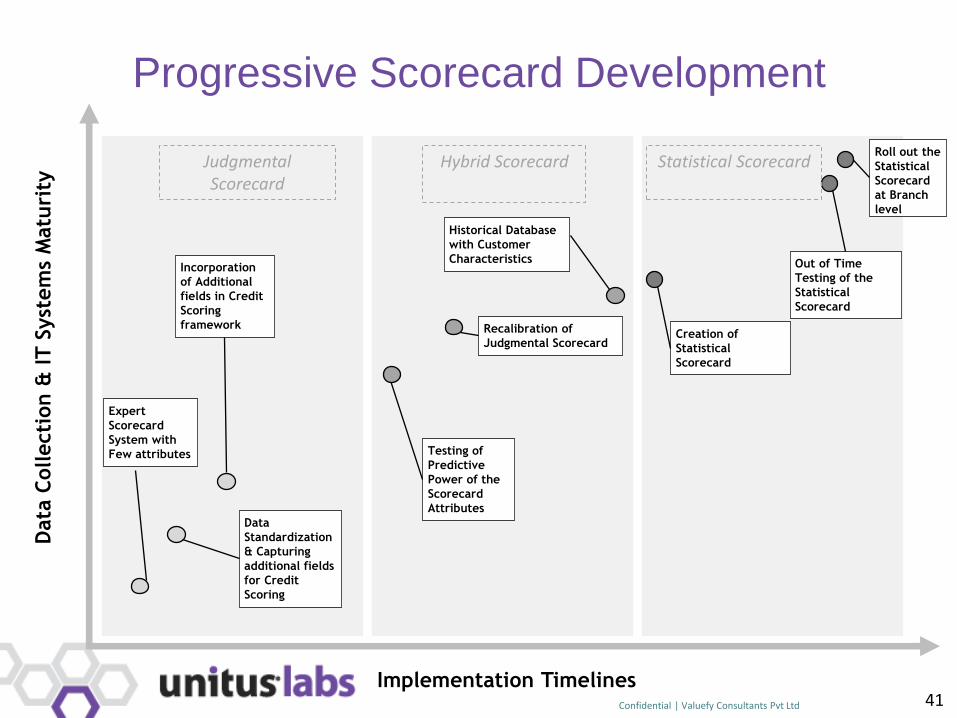
Progressive Scorecard Development
Implementation Timelines
Data
Collecti
on &
IT S
yst
em
s M
atu
rity
Data
Standardization
& Capturing
additional fields
for Credit
Scoring
Testing of
Predictive
Power of the
Scorecard
Attributes
Incorporation
of Additional
fields in Credit
Scoring
framework
Historical Database
with Customer
Characteristics
Creation of
Statistical
Scorecard
Recalibration of
Judgmental Scorecard
Roll out the
Statistical
Scorecard
at Branch
level
Expert
Scorecard
System with
Few attributes
Out of Time
Testing of the
Statistical
Scorecard
Judgmental Scorecard
Hybrid Scorecard Statistical Scorecard
Confidential | Valuefy Consultants Pvt Ltd 42
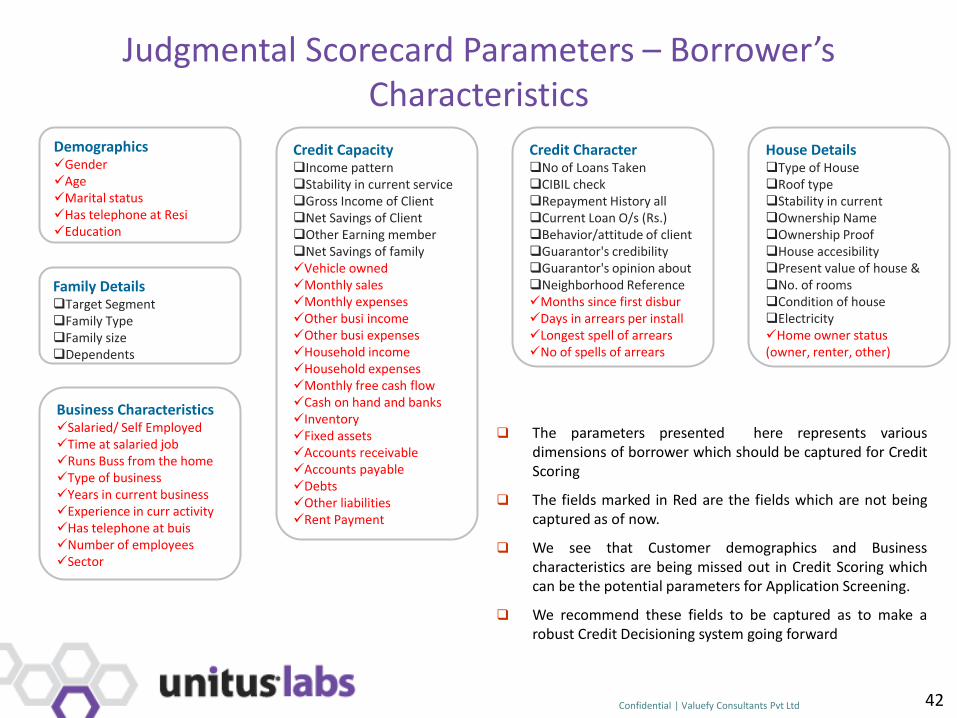
Judgmental Scorecard Parameters – Borrower’s Characteristics
Credit Capacity Income pattern Stability in current service Gross Income of Client Net Savings of Client Other Earning member Net Savings of family Vehicle owned Monthly sales Monthly expenses Other busi income Other busi expenses Household income Household expenses Monthly free cash flow Cash on hand and banks Inventory Fixed assets Accounts receivable Accounts payable Debts Other liabilities Rent Payment
Credit Character No of Loans Taken CIBIL check Repayment History all Current Loan O/s (Rs.) Behavior/attitude of client Guarantor's credibility Guarantor's opinion about Neighborhood Reference Months since first disbur Days in arrears per install Longest spell of arrears No of spells of arrears
House Details Type of House Roof type Stability in current Ownership Name Ownership Proof House accesibility Present value of house & No. of rooms Condition of house Electricity Home owner status (owner, renter, other)
Demographics Gender Age Marital status Has telephone at Resi Education
Family Details Target Segment Family Type Family size Dependents
Business Characteristics Salaried/ Self Employed Time at salaried job Runs Buss from the home Type of business Years in current business Experience in curr activity Has telephone at buis Number of employees Sector
The parameters presented here represents various dimensions of borrower which should be captured for Credit Scoring
The fields marked in Red are the fields which are not being captured as of now.
We see that Customer demographics and Business characteristics are being missed out in Credit Scoring which can be the potential parameters for Application Screening.
We recommend these fields to be captured as to make a robust Credit Decisioning system going forward

Confidential | Valuefy Consultants Pvt Ltd 43
Judgmental Scorecard Parameters – Other Characteristics
Lender Characteristics Branch Rating Loan officer Rating Loan Officer Experience
Product Specifications Purpose of construction Current rented out rooms Expected rent income Total Project cost Personal contribution Actual Utilization of loan
Loan Characteristics Type of Loan Month of disbursement Amount Requested Borrower's contribution to financing Tenor Inst to Income ratio
Apart from Borrower’s characteristics, there are other dimensions which significantly impact the propensity of default:
Loan Characteristics: such as Tenor, IIR can capture the re-paying capacity of a borrower and evaluate an applicant. These characteristics are not being captured as of now.
Product Specifications: These characteristics are being captured. These Characteristics vary as per the product – Business Loan, Home Improvement Loan, Dairy Loan. As and when new products are created, similar characteristics should be captured for evaluation.
Lender Characteristics: Lender’s rating, experience help in deciding the cut-off at an Organization level and keep portfolio risk at check. As most of the defaults happen due to FE than the customer, incorporating such parameters will be of prime importance.

Business Intelligence Framework Key Performance Indicators, Metrics & OLAP Structure

Confidential | Valuefy Consultants Pvt Ltd 45
Customers & Acquisition Key Questions
Customer #, Total Amount, Growth
% (Actual vs. Planned) The growth in number of customers by
number, loan amount on rolling basis.
Funding Requirement Funds required for disbursals for
applications in progress.
Opportunity (Size & Harnessed) The amount of disbursed loan that is
maturing in the next 4 weeks, clients
captured from the matured ones in past 3
months.
Customer Wait Days Average no of days from Customer entry
into the system to disbursement. On The
dashboard this would be the weighted
average figure for past 3 months. A figure
above planned 10 days should demand
probe/action.
The BIG Ys Key Metrics
What has been the growth in customers?
Have we met targets?
Is my growth concentrated?
How many repeat customers do we have? Which cycles?
How many customer who completed the cycle in last n months
are my customers?
How many customers switched to competitors?
Are the customers going to competitors for their 1+ term? Why?
Where is the opportunity?
How many customers are completing the cycle in coming n
weeks? What is the monetary value of the opportunity?
What is the opportunity that we captured in past 3 months?
Is there a product gap?
Has any of my customers met an event? (poultry, cattle, house,
shop, marriage, kid etc.)
Is there a demographic transition?
What is the need generated by the transition?
Key Questions

Confidential | Valuefy Consultants Pvt Ltd 46
Customers & Acquisition Key Questions
Customer Retention Ratio No of customers who are with Mimo in
their second term if they have taken the
second term from any provider (matured
in past n months).
This would require additional data
capture by FEs.
The BIG Ys Key Metrics
How effective is my customer acquisition?
What is the duration of my customer acquisition cycle?
Which stage takes the longest? (Intr., GRT, Funding…) is it a
bottleneck? Why?
Key Questions

Confidential | Valuefy Consultants Pvt Ltd 47
Customers & Acquisition CUBES
The OLAP Cubes
# of Customers (Actual, Planned)
Amount Disbursed (Actual, Planned)
# of Applications in Process
Notional Amount in Process (Final disbursable amount for applications)
Time Elapsed in Stage
FACTS
DIMENSIONS
Branch
Region
Center
Group
Gender
Purpose
FE
Age
Literacy Level
Occupation
Repeat Customer
Status (Active)
Cycle Number
Application Stage
MMYY
QQYY
YYYY
Cycle Start MMYY
Cycle End MMYY
Product

Confidential | Valuefy Consultants Pvt Ltd 48
Customers & Acquisition REPORTS
Targeted vs. Achieved # of customers, amount disbursed, targeted vs. achieved, new vs. renewed customers
Analyze by: Geography: Drilldown -> Overall -> Region -> Branch-> FE. Time: Year, Quarter,
Month. Product
Acquisition Efficiency # of customers, amount disbursed, Stage, Weighted aggregated Time taken
Analyze by: Geography: Drilldown -> Overall -> Region -> Branch-> FE.
Time: Year, Quarter, Month. Product
Customers in Process # of customers, amount to be disbursed, Time in process
Analyze by: Geography: Drilldown -> Overall -> Region -> Branch-> FE.
Time: Year, Quarter, Month. Application Status. Product
Customer Profile # of customers, amount disbursed
Analyze by Geography: Drilldown -> Overall -> Region -> Branch-> FE.
Profile: Age, Gender, Occupation, Recent Event. Ever Defaulted
Status: Active, Complete. Disbursement Cycle. Product
Analysis Reports

Confidential | Valuefy Consultants Pvt Ltd 49
Customers & Acquisition
Opportunity Size # of customers, amount disbursed maturing in the next 1,3, 6 months
Analyze by Geography: Drilldown -> Overall -> Region -> Branch.
Profile: Age, Gender, Occupation, Recent Event. Ever Defaulted. Product
Opportunity Harnessed # of customers, amount disbursed to customers who matured in past 1,3, 6 months
Analyze by: Geography: Drilldown -> Overall -> Region -> Branch.
Time: Year, Quarter, Month. Product
REPORTS
Analysis Reports

Confidential | Valuefy Consultants Pvt Ltd 50
Risk Management Key Questions
Total Loan Amt, Exposure and
growth Loan amount, Outstanding Amount,
Growth over 3 months
Portfolio At Risk (PaR) Number of customers, loan amount under
default.
PaR Growth Rate Change in PaR as compared to past 1
month. Should be negative ideally.
Weighted Organization DPD (WOD) The amount of unpaid amount with
respect to the DPD. Weighted average
DPD.
Client Interaction Ratio(%
Attendance) % attendance of clients in the past 1
month. Reducing attendance might be a
sign of impending default.
At RM/BM level watch the no of clients
absent more than once/twice in past 3
months.
The BIG Ys Key Metrics
What is my Risk?
What is my total exposure?
What amount of the payment due, has not been paid?
What is the corresponding total outstanding, PaR?
How old are the dues? Are they all concentrated?
How is my Risk profile changing?
Am I at lesser risk now as compared to some time back?
How much amount is added additionally to OD in past n
months? What is the growth rate of OD/PaR?
Can I know pro-actively know about defaults/ODs?
Why am I at risk?
Are my risky customers concentrated? How? By geography,
profile, FE?
Is there a relation between a customer profile and default
behavior?
Do defaults happen with some trend/event/month? E.g.
client event, FE movement, festival month etc.
Key Questions

Confidential | Valuefy Consultants Pvt Ltd 51
Risk Management Key Questions
Collection Target Collection Target for the next 1 month.
(1 week/day for RM/BMs)
Batting Average (% Collection) Collection as a % of target in the past 1
month. (1 week/day for RM/BMs)
The BIG Ys Key Metrics
How healthy is the collection/recovery scenario?
Are we collecting on time?
How is the OD profile changing?
Are larger part of my ODs recent or relate to earlier
defaults?
How good is the collection from ODs?
Key Questions

Confidential | Valuefy Consultants Pvt Ltd 52
Risk Management
# of Customers
Loan Amount
Outstanding Amount
Paid Amount/Collection
Overdue Amount
First Default Date, Recent Default Date
FACTS
DIMENSIONS
Branch
Region
Center
Group
Gender
Purpose
FE, Product
Age
Literacy Level
Occupation
Repeat Customer
Status (Active)
Cycle Number
Application Stage
MMYY
QQYY
YYYY
Cycle Start MMYY
Cycle End MMYY
OD Status (Current/Ever)
DPD Buckets
CUBES
The OLAP Cubes

Confidential | Valuefy Consultants Pvt Ltd 53
Risk Management REPORTS
Exposure Analysis # of customers, Amount Disbursed, Total exposure, Growth %
Analyze by: Geography: Drilldown -> Overall -> Region -> Branch-> FE.
Time: Year, Quarter, Month, As On Date. Product
Risk Analysis (OD) # of customers, Overdue Amount, Total Exposure (PaR), Total Loan Amount, Weighted DPD,
First/Recent Default Date
Analyze by: Geography: Drilldown -> Overall -> Region -> Branch-> FE.
Profile: Age, Gender, Occupation, Literacy, Purpose, House Quality, Application Score
Time: Year, Quarter, Month, As On Date. DPD Buckets. OD Status. Event. Product
Risk Analysis (OD Transition) # of customers, Overdue Amount
Analyze by Geography: Drilldown -> Overall -> Region -> Branch-> FE.
Time: From/To on 2 axes. DPD Buckets (Report in Matrix Format to analyze transition)
Event. Product
Risk Analysis (Proactive) # of customers, Exposure, Attendance (No of absents)
Analyze by Geography: Drilldown -> Overall -> Region -> Branch-> FE.
Profile: Age, Gender, Occupation, Literacy, Purpose, House Quality, Application Score
Time: Year, Quarter, Month, As On Date. DPD Buckets (Filter and analyze FE switch cases) .
Product
Analysis Reports

Confidential | Valuefy Consultants Pvt Ltd 54
Collections: Target and Achieved # of customers, Amount Disbursed, Total exposure, Target Collection, Achieved Collection,
Batting Average
Analyze by: Geography: Drilldown -> Overall -> Region -> Branch-> FE.
Time: Year, Quarter, Month, As On Date. Product
Overdue Collections Efficiency # of customers, Exposure, Overdue Amount, Collected Amount, Total Exposure (PaR), First/Recent Default
Date, Efficiency
Analyze by: Geography: Drilldown -> Overall -> Region -> Branch-> FE.
Profile: Age, Gender, Occupation, Literacy, Purpose
Time: Year, Quarter, Month, As On Date. DPD Buckets. Product
REPORTS Risk Management Analysis Reports

Confidential | Valuefy Consultants Pvt Ltd 55
Profitability & Productivity Key Questions
The BIG Ys Key Metrics
Key Questions
Profitability Quarterly – Overall, Region,
Branch/Cluster
Case Load Efficiency Number of customers, loan amount per
FE.
Case Load Efficiency Deviation Difference between Maximum & Minimum
CL.
What is my Profitability?
How uniformly the profitability distributed across
dimensions?
Which heads are causing the difference across regions and
over time?
Is there any anomaly in cost distribution?
Are this not-profitable regions/branches strategic with
expectation of profitability in future?
What is the organizational efficiency?
How many customers, amount is a FE handling?
Is the ratio of employees, customers, amount across
geographies consistent?

Confidential | Valuefy Consultants Pvt Ltd 56
FACTS
DIMENSIONS
CUBES
The OLAP Cubes
Profitability & Productivity
# of Customers
Amount Disbursed
Exposure
# of Applications in Process
Revenue, Expenses, Profitability
Branch
Region
Center
Group
Purpose
FE
MMYY
QQYY
YYYY
Cost/Revenue Heads
Product
Confidential | Valuefy Consultants Pvt Ltd 57
REPORTS
Analysis Reports
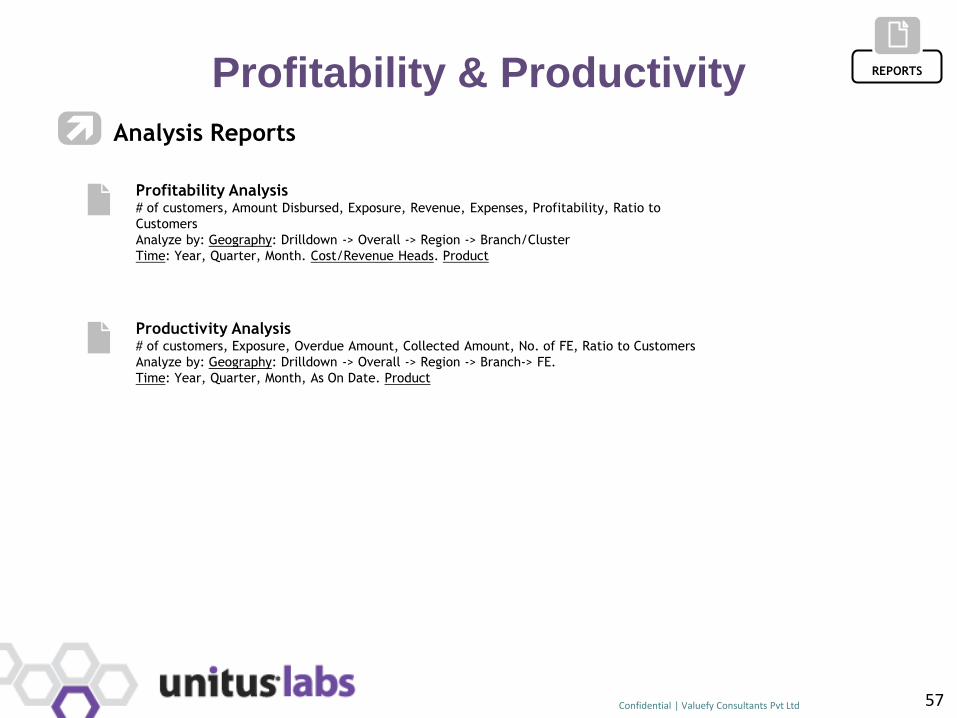
Profitability & Productivity
Profitability Analysis # of customers, Amount Disbursed, Exposure, Revenue, Expenses, Profitability, Ratio to
Customers
Analyze by: Geography: Drilldown -> Overall -> Region -> Branch/Cluster
Time: Year, Quarter, Month. Cost/Revenue Heads. Product
Productivity Analysis # of customers, Exposure, Overdue Amount, Collected Amount, No. of FE, Ratio to Customers
Analyze by: Geography: Drilldown -> Overall -> Region -> Branch-> FE.
Time: Year, Quarter, Month, As On Date. Product
Related Documents