Business Intelligence & Process Modelling Frank Takes Universiteit Leiden Lecture 4 — BI & Predictive Analytics BIPM — Lecture 4 — BI & Predictive Analytics 1 / 45

Welcome message from author
This document is posted to help you gain knowledge. Please leave a comment to let me know what you think about it! Share it to your friends and learn new things together.
Transcript
Business Intelligence & Process Modelling
Frank Takes
Universiteit Leiden
Lecture 4 — BI & Predictive Analytics
BIPM — Lecture 4 — BI & Predictive Analytics 1 / 45

Recap
Business Intelligence: anything that aims at providing actionableinformation that can be used to support business decision making
Business IntelligenceVisual AnalyticsDescriptive AnalyticsPredictive Analytics
Process Modelling (April and May)
BIPM — Lecture 4 — BI & Predictive Analytics 2 / 45
Categories of techniques
Machine learning
Supervised learning: learning on labeled dataSemi-supervised learning: partially labeled dataUnsupervised learning: leaning/mining on unlabeled dataReinforcement learning: agents learning to act in an environment
BIPM — Lecture 4 — BI & Predictive Analytics 3 / 45
Supervised learning
BIPM — Lecture 4 — BI & Predictive Analytics 4 / 45
Supervised learning
Regression
Classification
Bayesian Networks
Support Vector Machines
Link prediction
BIPM — Lecture 4 — BI & Predictive Analytics 5 / 45
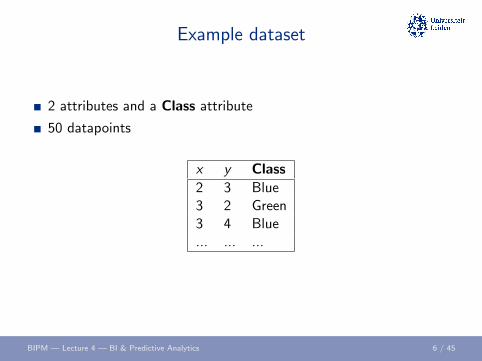
Example dataset
2 attributes and a Class attribute
50 datapoints
x y Class2 3 Blue3 2 Green3 4 Blue... ... ...
BIPM — Lecture 4 — BI & Predictive Analytics 6 / 45

Regression as a model
BIPM — Lecture 4 — BI & Predictive Analytics 7 / 45

Classification: Regression
Linear Regression
Given n variables x1, . . . xn
Find weights w0, . . .wn suchthatw0 + w1x1 + . . .wnxn ≥ 0
BIPM — Lecture 4 — BI & Predictive Analytics 8 / 45
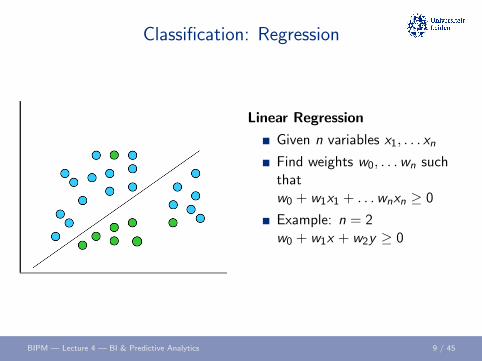
Classification: Regression
Linear Regression
Given n variables x1, . . . xn
Find weights w0, . . .wn suchthatw0 + w1x1 + . . .wnxn ≥ 0
Example: n = 2w0 + w1x + w2y ≥ 0
BIPM — Lecture 4 — BI & Predictive Analytics 9 / 45

Regression disclaimer
http://en.wikipedia.org/wiki/Linear_regression
BIPM — Lecture 4 — BI & Predictive Analytics 10 / 45

Correlation
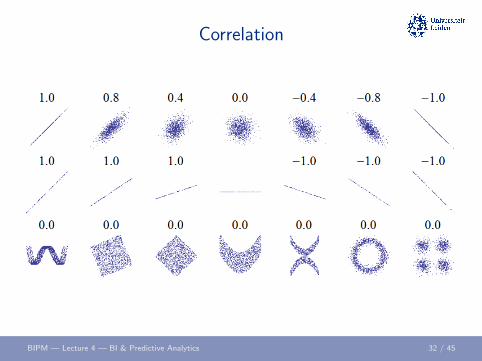
Pearson correlation r ∈ [0; 1] describing the extent to which therelation between variables can be described in a linear way.
BIPM — Lecture 4 — BI & Predictive Analytics 11 / 45

Correlation
Pearson correlation r ∈ [0; 1] describing the extent to which therelation between variables can be described in a linear way.
BIPM — Lecture 4 — BI & Predictive Analytics 11 / 45

Correlation
How do we perceive correlations?
Study by University of Cambridge — Gamification
http://guessthecorrelation.com
BIPM — Lecture 4 — BI & Predictive Analytics 12 / 45
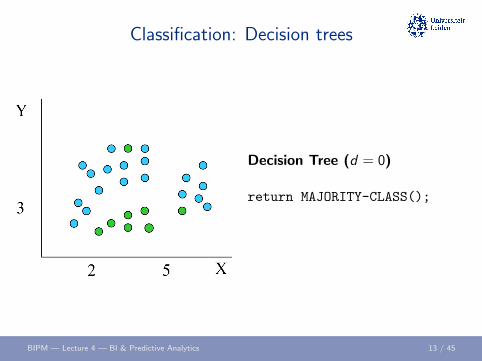
Classification: Decision trees
Decision Tree (d = 0)
return MAJORITY-CLASS();
BIPM — Lecture 4 — BI & Predictive Analytics 13 / 45

Classification: Decision trees
Decision Tree (d = 1)
if(X > 5) return BLUE;
else return GREEN; // oops!
BIPM — Lecture 4 — BI & Predictive Analytics 14 / 45
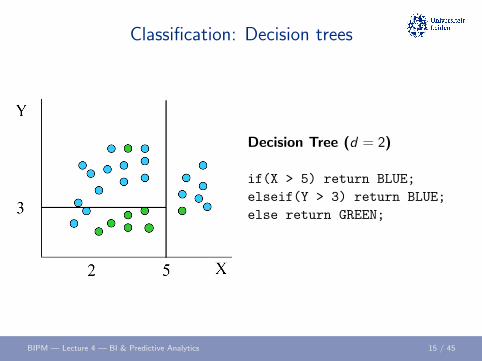
Classification: Decision trees
Decision Tree (d = 2)
if(X > 5) return BLUE;
elseif(Y > 3) return BLUE;
else return GREEN;
BIPM — Lecture 4 — BI & Predictive Analytics 15 / 45

Classification: Decision trees
Decision Tree (d = 3)
if(X > 5) return BLUE;
elseif(Y > 3) return BLUE;
elseif(X > 2) return GREEN;
else return BLUE;
BIPM — Lecture 4 — BI & Predictive Analytics 16 / 45
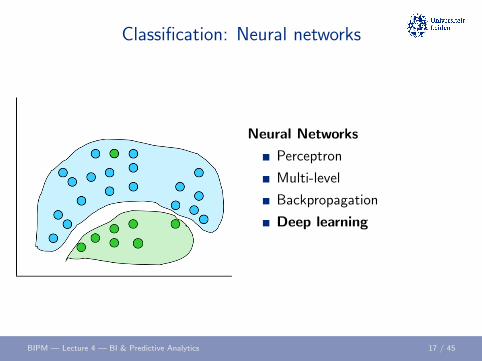
Classification: Neural networks
Neural Networks
Perceptron
Multi-level
Backpropagation
Deep learning
BIPM — Lecture 4 — BI & Predictive Analytics 17 / 45
Data mining results validation
BIPM — Lecture 4 — BI & Predictive Analytics 18 / 45
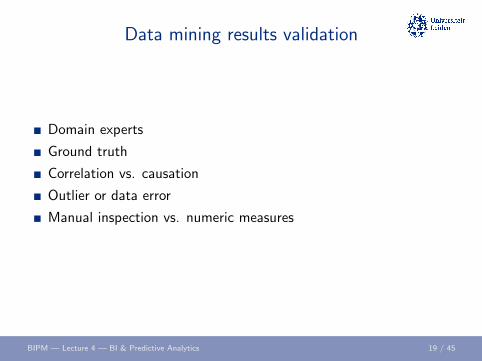
Data mining results validation
Domain experts
Ground truth
Correlation vs. causation
Outlier or data error
Manual inspection vs. numeric measures
BIPM — Lecture 4 — BI & Predictive Analytics 19 / 45

Evaluating results
200 student test results are predicted
grade ∈ {failed, passed, cum laude}
BIPM — Lecture 4 — BI & Predictive Analytics 20 / 45

Confusion matrix
BIPM — Lecture 4 — BI & Predictive Analytics 21 / 45

Data mining validation techniques
Confusion matrix measures
F-measure to balance precision and recall
F-measure = 2 · precision · recall
precision + recall
ROC curves
AUROC
Separate training, testing and validation sets — cross-validation
k-fold cross-validation
BIPM — Lecture 4 — BI & Predictive Analytics 22 / 45

ROC
BIPM — Lecture 4 — BI & Predictive Analytics 23 / 45

Cross-validation
BIPM — Lecture 4 — BI & Predictive Analytics 24 / 45
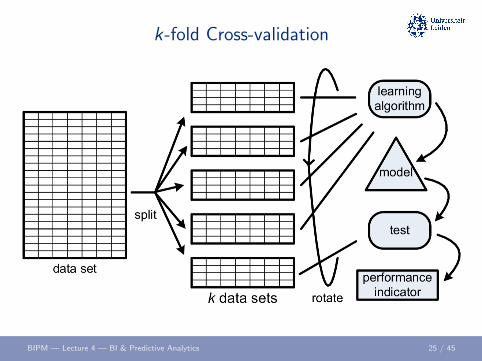
k-fold Cross-validation
BIPM — Lecture 4 — BI & Predictive Analytics 25 / 45

Occam’s razor
BIPM — Lecture 4 — BI & Predictive Analytics 26 / 45

Occam’s razor
William of Ockham
14th century logician
“One should not increase, beyond what is necessary, the number ofentities required to explain anything”
Minimal Description Length (MDL) principle: best model usesminimal number of bits to describe the data
Watch out for overfitting
BIPM — Lecture 4 — BI & Predictive Analytics 27 / 45

Curse of dimensionality
Too many attributes
Or: too many values per categorical attribute
Problematic:
Algorithms may have exponential runtime in the number of attributesSparse data on combinations of attributes makes training difficultTo get a statistically relevant results, required number of data recordsgrows exponentially
BIPM — Lecture 4 — BI & Predictive Analytics 28 / 45

Dimensionality reduction
Solve problem of many attributes
Possible solutions:
Principal Component Analysis (PCA)Backward Feature EliminationForward Feature Construction
http://www.kdnuggets.com/2015/05/
7-methods-data-dimensionality-reduction.html
BIPM — Lecture 4 — BI & Predictive Analytics 29 / 45
Feature extraction
Process of dimensionality reduction
Derive features from original data that are
InformativeNon-redundantFacilitating for the mining activity
Manual: Correlation matrix
BIPM — Lecture 4 — BI & Predictive Analytics 30 / 45
Correlation matrix
Correlation: extent to which two variables are
related (positive value between 0 and 1) orinversely related (negative value between −1 and 0)
Correlation matrix: matrix in which each cell represents thecorrelation of the variables represented by the respective row andcolumn
BIPM — Lecture 4 — BI & Predictive Analytics 31 / 45
Correlation
BIPM — Lecture 4 — BI & Predictive Analytics 32 / 45

https://www.bgc-jena.mpg.de/bgi/uploads/People/MaartenBraakhekke/correlationMatrix.png

Case: Churn prediction
Master project by P. Kusuma
Dutch telecom provider
700 million call records
Churn: customer switching to competitor
Use (data mining) techniques to predict churn
Problem: class imbalance
P.D. Kusuma et al., Combining Customer Attributes and Social Network Mining for Prepaid Mobile Churn Prediction, in
Proceedings of the 22th Belgian Dutch Conference on Machine Learning, pp. 50-58, 2013.
BIPM — Lecture 4 — BI & Predictive Analytics 34 / 45

Churn
http://www.exacaster.com/
BIPM — Lecture 4 — BI & Predictive Analytics 35 / 45

Customer attributes
Demographic characteristics (age)
Contractual information (type of subscription and package plan)
Handset information (handset model and manufacturer)
Service usage (voice call duration, SMS count and data usage)
Churn identification (churner or non-churner)
Network attributes (churners in call neighborhood, text,neighborhood, etc.)
BIPM — Lecture 4 — BI & Predictive Analytics 36 / 45
Techniques
Decision trees
Social Network models
Separate training, testing and validation sets
Rank customers based on their probability of being a churner
Gain chart: percentage of customers contacted (horizontal axis) vs.percentage of churning customers found (vertical axis)
Lift chart: percentage of customers contacted (horizontal axis) vs.gain improvement over random selection
BIPM — Lecture 4 — BI & Predictive Analytics 37 / 45
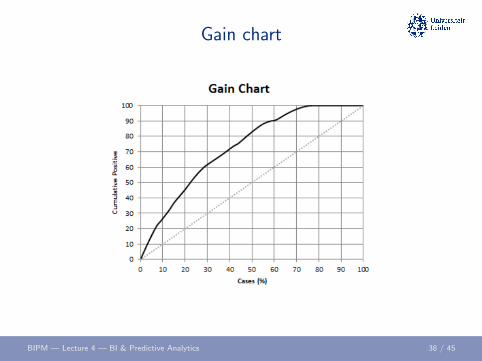
Gain chart
BIPM — Lecture 4 — BI & Predictive Analytics 38 / 45

Lift chart
BIPM — Lecture 4 — BI & Predictive Analytics 39 / 45

Categories of techniques
Supervised learning: learning on labeled data
Semi-supervised learning: partially labeled data
Unsupervised learning: leaning/mining on unlabeled data
Reinforcement learning: agents learning to act in an environment
BIPM — Lecture 4 — BI & Predictive Analytics 40 / 45

Semi-supervised learning
Semi-supervised learning: learning from both labeled andunlabeled data
Smoothness assumption: data points close to each other, are morelikely to share the same label
Cluster assumption: data tends to form discrete clusters, and pointsin the same cluster are more likely to share a label
Lower dimensionality assumption: probably, the effectivedimensionality of the data is much lower than the number of inputattributes
BIPM — Lecture 4 — BI & Predictive Analytics 41 / 45
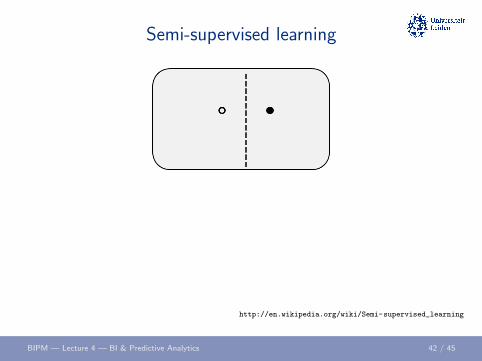
Semi-supervised learning
http://en.wikipedia.org/wiki/Semi-supervised_learning
BIPM — Lecture 4 — BI & Predictive Analytics 42 / 45

Semi-supervised learning
http://en.wikipedia.org/wiki/Semi-supervised_learning
BIPM — Lecture 4 — BI & Predictive Analytics 43 / 45

Lab session March 2
Finalize Assignment 1
Ask your final questions
BIPM — Lecture 4 — BI & Predictive Analytics 44 / 45

Credits
Lecture partially based on (slides of the (previous edition of the)) course book:W. van der Aalst, Process Mining: Data Science in Action, 2nd edition,Springer, 2016.
Slides partially based on “From Data Mining to Knowledge Discovery: An
Introduction” by Gregory Piatetsky-Shapiro (KDnuggets.com)
BIPM — Lecture 4 — BI & Predictive Analytics 45 / 45
Related Documents