1 WORKING PAPER NO: IIMB/IJSC/2020/002 India Japan Study Centre Indian Institute of Management Bangalore March 2020 Business Groups in India and Japan Prof. Subhashish Gupta Indian Institute of Management Bangalore [email protected]

Welcome message from author
This document is posted to help you gain knowledge. Please leave a comment to let me know what you think about it! Share it to your friends and learn new things together.
Transcript

1
WORKING PAPER NO: IIMB/IJSC/2020/002
India Japan Study Centre
Indian Institute of Management Bangalore
March 2020
Business Groups in India and Japan
Prof. Subhashish Gupta Indian Institute of Management
Bangalore

2
Table of Contents
Abstract ................................................................................................................................................. 3
Acknowledgements ................................................................................................................................ 4
1 Introduction ........................................................................................................................................ 5
2 Asian Business Systems ...................................................................................................................... 7
2.1 Institutional Characteristics: ........................................................................................................ 7
2.2 Types of Asian Business Systems: ................................................................................................. 7
2.3 The effect of MNEs on Asian Business Systems ........................................................................... 8
3 Business Groups ............................................................................................................................... 10
3.1 Business Groups and Alternative Structures ............................................................................. 11
3.2 Business Groups in Late and Early Industrializing Nations...................................................... 12
3.3 Factors Leading to the Creation of Business Groups ................................................................. 13
3.3.1 Diversified Business Groups .................................................................................................. 13
3.3.2 Pyramidal Business Groups .................................................................................................. 14
3.4 The Evolution of Business Groups.............................................................................................. 15
4.1 Origins of the Keiretsu ................................................................................................................ 17
4.2 Impact of Keiretsu ...................................................................................................................... 18
4.3 Keiretsu: The End? ..................................................................................................................... 19
5 Business Groups in India ................................................................................................................. 22
5.1 Regulation and Deregulation (1947-2006) .................................................................................. 23
5.2 Indian Business Groups: Some Distinctive Features ................................................................. 24
5.3 Dealing with the Business Environment ..................................................................................... 25
5.4 How have they fared? ................................................................................................................. 26
6 Japanese firms in India .................................................................................................................... 27
6.1 Location of Japanese Firms in India .......................................................................................... 29
6.2 Alliance Management between Japanese MNEs and Indian firms ........................................... 30
6.2.1 Case profiles: ......................................................................................................................... 31
6.3 Japanese company strategies ...................................................................................................... 32
7 Conclusion ........................................................................................................................................ 34
References............................................................................................................................................ 35
List of Tables ....................................................................................................................................... 36

3
Abstract
This paper starts by discussing Asian business systems, their institutional characteristics and the types of
Asian business systems. For example, on the job training is more prevalent in Japan, Korea and Taiwan
and Asian business groups are usually controlled by a family or is state controlled, with Japan being an
exception. The main types of Asian business systems are classified as post socialist, advanced city
economies (e.g. Singapore), advanced Northeast Asian (e.g. Taiwan) and the remaining. We further discuss
the effect of multinational enterprises on Asian business systems, which has been significant and the same
could be the experience with Japanese multinationals in India. We then go on to discuss business groups
in general, which is a prominent feature of Asian business systems. First we distinguish between business
groups and other structures such as conglomerates in terms of their internal structures and management.
This is followed by a discussion on the difference between business groups between developed and
developing economies. Another critical issue is the factors behind the creation of business groups, such as
imperfect markets. It may be surmised that as an economy develops the reason for the existence of business
groups disappears. After that we look at the features of Japanese and Indian business groups. Finally, we
discuss three papers on location choices of Japanese firms, management of alliances and strategies of
Japanese firms, respectively.
Key words: Business groups, types, MNE, family owned, tunelling, Keiretsu, location
JEL classification: L22, L23, L26, M16, N15, O17, P5, R1

4
Acknowledgements
I am pleased to acknowledge the research assistance of Nayantara Dutt and Bhaswati Dhar.
.
5
1 Introduction
Economic ties between India and Japan are expanding. Japan is the largest bilateral donor to India and the footprint of Japanese firms in India continues to expand. What would be the likely impact of this investment
and enlarged economic relationships? The effect may be no different from investment by other countries:
an increase in the capital stock of the nation and possibly increased productivity partly because of improved
processes. However, given the experience of some countries the effect of Japanese investment may be qualitatively different. (Urata 1993, Koike 2004).
Within the literature on economic development of Asia there is a thread which discusses the role of Japan. There is a notion that Japan was the first Asian country to become a modern industrialized nation and that
it was instrumental in the spread of modernization in its neighbours. First, in Taiwan and South Korea, its
erstwhile colonies and then to Southeast Asia and China. This is in essence the flying geese model with Japan acting as the leading goose and the other Asian countries following in its wake. This theory is
probably too generous about Japan’s role in the economic development of Southeast and East Asia, but it
is undeniable that Japanese investment played a considerable role (Encarnation 1999). It is conceivable
that given the interest shown by Japan in India of late a similar role is conceivable in the near future.
We will leave aside the issue of the effect of Japanese investment in Indian development. To delve into the
issue would require longitudinal data of some length for any effect to emerge. Instead there are other more micro level issues that one may choose to explore. One such issue is the role of business houses in Japan
and India. This is particularly interesting since large family held business groups are very prevalent in India
while the famous horizontal Japanese business groups, the keiretsu, are reportedly dead and vertical
business groups are also dying out. The Japanese business system is more like Western business systems according to Witt and Redding, 2014 while the Indian business system is more like former socialist
economies. How will these two supposedly very different types of industrial organizations interact? It
should also be remembered that Japan had family owned business houses like that of India, the zaibatsu, before the second world war. Ghosh (1974) commented on the similarity of the industrial organization of
Japan and India, in terms of concentration in 1968. The zaibatsu were disbanded during the American
occupation of Japan but soon remerged as the Keiretsu, though without family ownership. So in the not too distant past Japan also had business groups. Is it possible that some kind of keiretsu like structure will
emerge among Japanese firms operating in India or between Japanese and Indian firms? It would be
interesting to see if Japanese companies restrict their relationships with stand-alone Indian companies or
do, they transact equally with firms that belong to business houses.
One argument suggests that business groups emerge due to market imperfections and that as the economy
becomes more advanced arm’s length transactions are encouraged and business groups with unrelated product portfolios wither away. If so, one may suggest that the Indian market is far from perfection of any
kind as suggested by the prevalence of business groups. Given this state of affairs should Japanese firms
re-establish their networks of the horizontal and vertical kind in India. Bassino, Jensen and Morini (2018) suggest that Japanese firms replicated their network structures in ASEAN countries. If they do so will some
Indian and Japanese business groups be drawn into special relationships. For instance Reliance Industries,
part of the Reliance group has business links with Mitsui, while the Anil Ambani of the ADAG has
announced partnership with Nippon Life to channel Japanese investments in India and to eventually partner to set up a Reliance Bank in India. It would be interesting to see what kind of relations Japanese firms form
with Indian firms.
There are many reasons why a comparison of Indian and Japanese business groups may be useful. The
primary one is technology transfer, or product and process innovation. It may be the case that networked (formal or informal) firms find it easier to propagate processes and know how. To the extent we believe
that Indian firms (domestic or foreign) can move up the value chain and produce high end goods the effect
of such spill overs would be useful. Other reasons would be the different styles of corporate governance
that is practiced. Japanese management is, we are told, more consensus based while India is hierarchical.
6
In section 2 we will provide a discussion of Asian business systems and the impact of multinational
enterprises (MNEs) on Asian business systems. Casual empiricism suggests that the impact of foreign
multinationals on the Information Technology (IT) and other high tech sectors in India have been immense. It is possible that Japanese MNEs could have a similar impact on the Indian manufacturing sector. This is
meant to provide a foundation on the basis of which we can discuss Indian and Japanese business groups.
We follow up with a discussion of the structure of business groups and the rationale for their existence in Section 3. We will then go on to discuss Japanese business groups in Section 4, followed by Indian business
groups in Section 5. In Section 6 we discuss three papers by Horn and Cross (2016), Varma et. al. (2015)
and Kondo (2012). In a sense we start with the most general discussion and then proceed to get down to a
more granular level. Section 6 provides a glimpse of the situation on the ground. Horn and Cross (2016) analyse the location choices of Japanese firms in India. Varma et. al. look at three cases of joint ventures
between Indian and Japanese firms and draw lessons of the factors that cause success or failure. Finally,
Kondo discusses the strategies adopted by Japanese firms in India and compares them, unfavourably, to those of Korean and western firms. The methodology for this paper is based on reviews of the existing
literature and the objective is to discuss Indian and Japanese business groups.

7
2 Asian Business Systems To understand the relationship between Indian and Japanese business groups it is useful to visit the varieties
of capitalism debate (Hall and Soskice 2001) and to look at the general structure of Asian business systems,
a significant part of which comprises business groups. Witt and Redding 2014, suggest that the standard classification of Coordinated Market Economy (CME) (e.g. Germany) versus a Liberal Market Economy
(e.g. USA) does not apply to Asian business systems. There is much more variety and in fact the differences
between Western business systems seem minor when compared to Asian ones. They summarize the institutional structures of thirteen major Asian business systems – those of China, Hong Kong, India,
Indonesia, Japan, Laos, Malaysia, the Philippines, Singapore, Korea, Taiwan, Thailand, and Vietnam – as
well as those of five major Western states – France, Germany, Sweden, the UK, and the USA – as
comparison points. Their approach represents a mix of statistics and qualitative data.
2.1 Institutional Characteristics:
In majority of Asian economies, the acquisition of professional skills is left to private initiative, exceptions
being Japan, Korea, and Taiwan, where on the job training (OJT) is prevalent. In terms of employment
relationships the dominant organizational principle is the company union. Major exceptions to the rule are
the nominally socialist economies of the region, that is, China, Laos, and Vietnam where party controlled unitary unions are prevalent. The main source of external financing is banks. A common pattern is that
business groups maintain their own banks or similar financial institutions, which they can tap for long-term
funding. Credit allocation largely depends on relationships with banks and the state. Business groups are present in all Asian countries and are usually large conglomerates that are owned and/or controlled by the
same party (family or business) with Japan as an exception. Its business groups, the post-war Keiretsu,
which is pretty much extinct, had no one ultimate owner or controlling party. Major decisions in Asian firms rest in the hands of top management, but Japan features a relatively participatory mode of decision-
making cutting across levels and functions. Along with ownership patterns, management control of firms
usually also rests with families or the state. Decision-making in most Asian states is statist. The exception
is Japan, which involves the participation of various sectors of society.
2.2 Types of Asian Business Systems:
To identify the different types of Asian business systems present in the sample Witt and Reading (2014)
use cluster analysis.
The main Asian clusters are
1. The (post) socialist countries of China, Vietnam, Laos, and India.
2. The advanced city economies of Hong Kong and Singapore.
3. The remaining South East Asian nations.
4. The advanced North-East Asian economies of Korea and Taiwan.
The Western economies as well as Japan cluster separately from the Asian economies. Japan falls into the
coordinated branch, between Germany and France. Further, Chinese private business broadly clusters with the poorer South East Asian economies. Indian private business is on the same branch as Chinese private
business and the poorer South East Asian nations but splits off earlier into a branch of its own. This
structural similarity of Chinese and Indian business stem from the similarity of their business systems: the inefficiency of the state institutions on which the economy depends, the vibrancy of the private sector, the
dominance of bank financing, the power of personally dominated large firms with crony-capitalist
connections being a few of them.

8
Their research suggests that the total number of known types of capitalism in Asia and the West is at least
six and possibly as many as nine: four in Asia (post-socialist, advanced city-state, emerging South East
Asian, advanced North-East Asian), plus some two to five in the West (including Japan). It would be useful to incorporate social capital (interpersonal or relational trust, and institutionalized or system trust), and
cultural elements for business-systems analysis. The reliance on informality, so common in India, (reliance
on informal institutions such as unwritten norms, conventions, or codes of behaviour) in a business system and its interplay with formal institutions should also be investigated. Another interesting feature of Asian
business systems is multiplexity, which is the presence of multiple business systems within one economy.
India, again is a prominent example. The presence of multiplexity raises important questions. One is what
preconditions allow the coexistence of multiple business systems in the same institutional space. A second question relates to the concept of institutional convergence. If business systems converge, which one do
they converge to. Multiple business systems within the same nation complicates the dynamics of
convergence among different business systems.
It also raises questions about the compatibility and ability of Indian and Japanese business systems to work
together. Japanese firms will not only have to deal with one type of business system, different from its own
business system, but two. Further, the impact of Japanese firms may be to introduce yet another type of business system into India. So it would be useful to consider the effect of Multinational Enterprises (MNE)
on Asian Business Systems.
2.3 The effect of MNEs on Asian Business Systems
Giroud (2014) provides a comprehensive account of the impact of MNE activities in Asian Business systems. As he notes the literature on international business has recognized for a long time the interaction
between MNEs and the institutional structure of countries. MNEs have had to adapt to local conditions and
institutions and in turn they have left their imprint on these. This is a continuous process. Adaptations made by MNEs is response to the institutional context is termed as micro-politics while the effect that
MNEs have on the host country’s institutional context is called macro-politics, which is the focus of
Giroud’s work.
It has been long recognized that a firm’s activities, its strategies and its structure, and to some extent its
competitive advantage, derives from the institutional arrangements in the home country. By this we broadly
mean the structure of the employment system, the financial system, relationships within firms and the political system that binds it together. Firms from USA are more likely to rely on short-term, contract based
relationships with workers and suppliers while Japanese firms may prefer more long term relationships
based on cooperation and trust and not so much on formally defined contracts. Thus USA based firms may find it easier to work with the more dynamic parts of the private sector in India since it is to some extent it
mirrors USA institutions. Japanese firms, on the other hand, may find it easier to work with the larger
business groups in India since it has a history of business groups and has a system of coordinated capitalism.
The strategies that MNEs use can be characterized as efficiency seeking, market seeking and resource
seeking. These will have different effects on the institutional changes in the host country. For example
efficiency seeking firms will try and goad the government and municipalities to become more efficient in terms of ease of doing business and the provision of infrastructure. Market seeking firms will push for
open trade and better access. They will push for access to areas of the market that are currently closed and
may also support privatization and deregulation policies. Finally, those trying to get access to raw materials or human resources will push for better access to those resources. MNEs differ between themselves as to
what strategies they pursue and MNEs from different countries can have different effects.

9
At the firm level the main channels through which MNEs change the institutional structures of the host
country is through knowledge transfers, spill overs and linkages. The extent of knowledge transfer depends
on the strategies of firms and the ability of local firms to absorb such transfers. USA based multinationals typically rely on local hires for managerial expertise while Japanese firms rely more on expatriates.
Consequently, the possibility of knowledge transfer of processes is likely to be less in the case of Japanese
firms. Of course it is possible that formal processes at the level of governments, as in the case of Japanese investments in high-speed rail in India, may accelerate knowledge transfer. The other possibility is to
subcontract parts of production to local firms. Indeed, the participation and development of global value
chains or production networks in Asia has led to significant improving in the technology levels in firms in
Asia. The process has largely been led by multinationals from Western economies and Japan.
Spill overs also lead to knowledge transfers but indirectly. Economists term these beneficial externalities.
MNEs, which once operated mainly in manufacturing, are now engaging in more R&D and their activities are getting more technologically sophisticated. This has resulted in higher productivity among local firms.
Such effects may be transmitted either horizontally, through enhanced competition, or vertically, through
substituting capital for labour. Spill overs are generally positive or small. However, there is also a negative
side to MNE investment. They can drive away local firms or leave them restricted to unattractive markets. Linkages between MNEs and local businesses enhance knowledge transfer through spill overs, so it is
important to build networks to increase linkages. Networks can be formal and structured or informal, such
guanxi networks in Taiwan. In such situations both sided have to adapt to build functioning networks.

10
3 Business Groups The advent of the business group as an economic institution can be traced back to the early decades of the
twentieth century, when large enterprises started gaining prominence, especially in the emerging
economies. There were two types of large enterprises operating-state-owned enterprises with a focus on specific types of industries; and business groups with wide, unrelated (or related) product portfolios having
pyramidal structures usually owned by families. While state owned enterprises were on the decline by the
1980s, business groups remained central to large enterprises and have become an important subject of study due to the three features i.e., unrelated products, pyramidal structure and family-owned businesses. All of
these are to some extent looked down upon. The pyramidal structure of ownership allows promoters with
relatively small shareholdings to divert economic benefits from ordinary shareholders to themselves. These are typically family owned businesses and economic power thus tends to become concentrated in the hands
of a few elite families with its attendant social and political consequences. On the other hand, unrelated
product diversification does not have the benefit of knowledge sharing and low cost of production which
comes from producing related product categories and suffers from the conglomerate discount problem where the market value of the group is lower than the sum of individual units.
Business groups are organized under a collaboration mechanism between independent companies to enhance their collective welfare. This is different from the market mechanism under which companies
usually operate when they coordinate through price signals in competitive settings. The literature on
business groups recognize two types of business groups: there are network type business groups which
function under the alliance principle, and there are hierarchy type business groups which function under the authority principle. In network type business groups functioning under the alliance principle, no individual
firm holds controlling interests over other firms due to which most scholars consider them as business
networks rather than business groups. In hierarchy type business groups, there is a holding company at the top of the hierarchy which controls legally independent operating units via different economic mechanisms
like equity ties, interlocking directorates and so on. Often these types of business groups are family owned.
Hierarchy type business groups incorporate two different perspectives and business arrangements, and
hence are sub-divided into two categories – diversified business groups and pyramidal business groups.
From the perspective of the development economics and strategy literature, diversified business groups
consist of product portfolios that exhibit unrelated diversification and are legally independent firms operating in different industries under common control in the form of equity or family ties. Their
organizational structure differs from the usual multi-divisional enterprise with related product portfolios
which is the sort of large enterprise commonly found in mature industrial economies. On the other hand, from the perspective of the finance and governance literature, there are business groups that are arranged
as pyramidal structures which consist of affiliated listed firms under a common shareholder having the
largest controlling interest. In such arrangements, one group firm is a controlled subsidiary of another. This kind of arrangement may allow the tunnelling of profits at the cost of minority shareholder interests
through the separation of controlling rights from cash-flow rights. While both the perspectives are different,
developmental and strategic literature also looks at the intersection of diversified business groups having a
pyramidal structure of ownership which may be under family control. This is one of the dominant types of business groups that exist today, and hence will be explored in further detail. The two approaches also
recognize that the existence of business groups is a reaction to market imperfections that ultimately results
in the sub-optimal allocation of resources.

11
3.1 Business Groups and Alternative Structures
The alternative to business groups isn’t necessarily stand-alone firms. Groups of firms or businesses that
share some relation to each other are common. Individual lines of businesses or products are often legally
separate entities. Sometimes, different kinds of activity are housed within the same entity, only to be separated or sold at some appropriate time. Examples could be GE, Johnson and Johnson and the Mitsubishi
group.
For diversified business groups with unrelated products, alternative models would be mainly
multidivisional enterprises, conglomerate enterprises and holding company organizations. For pyramidal
business groups, the alternative is horizontal business groups where the shares of listed companies are
directly held by controlling owners and not through a subsidiary. Diversified business groups may have ownership structures that are pyramidal or horizontal. We briefly describe the main alternatives to
diversified business groups below. Diversified business groups and comparable structures fall under multi-
unit enterprises which consist of a headquarters unit and operating units where division of labor occurs according to administrative control and actual production of goods and services (Chandler, 1977).
Allocation of resources and monitoring the performance of legally independent operating units under
subsidiaries and affiliates is carried out by the headquarters unit of business groups.
Multidivisional enterprises – Large enterprises in mature economies exhibit this type of structure which has
related product categories. Operating units are internal divisions or rather they are quasi-autonomous, self-
contained divisions (Chandler, 1962). Internal divisions can also be legally independent subsidiaries but are administered within the enterprise i.e., they are under the strategic control of the headquarters’ unit
which helps in capturing and utilizing positive spill over effects in terms of knowledge and other benefits
for common product categories.
Conglomerate enterprises – Another significant type of multi-unit enterprise that resembles business groups
are conglomerate enterprises in which product profiles are not as closely related thus leading to limited spill over effects (Williamson, 1985). As a result, their internal control mechanism is less extensive. They may
contain either internal divisions or fully owned subsidiaries in multiple product categories which may be
related or unrelated. Originally the term ‘conglomerate’ refers to a company that diversified quickly
through mergers and acquisitions in unrelated products. To separate conglomerates from diversified groups, there are four aspects that need to be kept in mind: ownership of head unit, top management, public
trading status of operating unit and the administrative apparatus. While diversified groups are mostly
controlled by families, conglomerates are not confined to families but can be publicly held corporations. Salaried professionals in top management carry out the critical decision-making for conglomerates, but for
diversified groups the main decision-making body is almost always the family. Conglomerates own
operating units as fully owned subsidiaries, while shares are listed and publicly traded for the operating
units of diversified business groups which allows for the possible tunnelling of profit. While conglomerates may retain administrative control by the head unit only in terms of budget (financing and investment),
diversified groups retain administrative control by the head unit in terms of both strategic and some
financial control.
Holding company organizations – According to Williamson (1975), holding companies have loose
divisions in which there is limited and unsystematic control between the headquarters unit and the operational units. They have a narrow range of related products. They are similar to business groups in
terms of being in a position of control by virtue of its ownership of securities in other companies. The
rationale may be to pyramid the voting control in order to milk the operating companies as seen in the
pyramidal structure of business groups.

12
Thus, the main difference between business groups and other forms of organization is in the degree of
control and the amount of diversification. Business groups have relatively tight control often with members
of the family heading subsidiaries and are more diversified. Multidivisional enterprises exhibit the most control and the least amount of diversification. At the other extreme are holding companies that exhibit the
least control but are more diversified. All the alternatives to business groups rely on professional managers
rather than on members of the family for executive decisions.
3.2 Business Groups in Late and Early Industrializing Nations
In the twentieth century, as economies were going through a structural transformation into modern
industrial economies, business groups played a significant role. Most of the main economic players in
emerging economies are business groups that are family owned as well as government owned. Of the
family-controlled groups, most are diversified businesses while in the government-controlled groups, most are in petroleum related businesses or financial services. Business groups in emerging economies usually
consist of legally independent companies and, the majority of them have two or more listed subsidiaries
with a headquarters unit organized as a holding company.
From as early as the nineteenth century, family owned business groups with diversified product portfolios
and pyramidal ownership operated in the form of mercantile businesses such as the British overseas merchants, or in other business activities related to trading, manufacturing, distribution and financial
services, e.g., the sixteenth century Fugger family of Augsburg with subsidiaries throughout Europe. Thus,
the international trading concerns which formed the embryonic stage of modern industrialization and
internationalization paved the way for large enterprises to make their way into the modern global economy. These overseas trading companies came about as a result of inter-country market imperfections which
prompted them to explore overseas markets. However, if inter-regional and inter-economy market
imperfections relating to product, labor and capital markets are the reasons for diversification, we would have seen more diversification for today’s multinationals across countries. Evidence suggests that
multinational corporations usually stick to their home country’s products when expanding in emerging
markets.
Historically, diversified business groups existed within continental Europe and matured industrial
economies and were not just confined to those engaged in international trade. They were mostly family
owned groups, but mega-banks also functioned as apex organizations that controlled operating companies across diverse businesses. Some of these bank-led groups were hierarchy type groups while others were
involved only in financing relationships while keeping themselves away from strategic/budgetary decisions.
However, even if business groups were operating historically in mature economies, collectively they remained secondary players to various small and medium enterprises, or large enterprises with
technologically related diversification.
The evolution of business groups in early and late industrializing economies shows some dissimilarity. In the early industrialized economies, the development of the large enterprise sector experienced two waves.
Initially, in the first phase, business groups exhibited a diversified product portfolio. As the economy
matured, during the second phase large enterprises having related product portfolios came into existence. By contrast, in economies like Japan that experienced late industrialization, business groups that started in
the early phases of industrial development collectively remained leading business organizations up to the
twenty first century. The puzzle as to why diversified business groups failed to sustain their dominance in mature economies such as that of North America and Europe, even in the presence of market imperfections,
remains to be explained.

13
One of the reasons could be the contrasting nature of internal capabilities possessed by business groups
during the early industrialization and the late industrialization phases. As diversified business groups in
early industrializing nations faced tough competition from large enterprises with technologically related and multidivisional models, which became the mainstay of the economy, they retreated. Most such groups
could not establish product specific competitive assets or those which could transcend products/industries.
Business groups in mature economies could manage to survive only after strategic reorientation and re-concentration of their portfolios into product specific competitive capabilities and specialized businesses.
On the other hand, business groups in today’s emerging markets have established themselves well in dealing
with the competitive pressures of the twenty-first century business environment. It is the kind of ownership
that is responsible for accumulating competitive assets related to intangible resources like administrative, financial or product-specific capabilities.
By the late nineteenth century pyramidal business groups were also functioning in countries like the United States, Canada, and Europe. The evolution of such groups mostly depended on individual economies and
specific institutional conditions. For example, in Germany the pyramidal structure became popular after
the second World War due to dual class shares being banned. In the US, pyramidal structures were
prominent before the New Deal regulations were brought in during the 1930s. In other words, it is not just the degree of market imperfections in relation to the level of economic development but also institutional
forces that are independent of market forces that influence the formation of pyramidal business structures.
Moreover, the formation of pyramidal structures in the US may not always have been motivated with the
intent of tunnelling profits, and the pyramid form gained prominence only after 1888 when laws were
passed allowing corporations to hold securities in other corporations. Also, by the late nineteenth century, the US market was already a mature market. Therefore, pyramidal ownership structure in the US was not
a substitute for market imperfections at the institution level as such but probably, the conduct of some
businessmen to create monopolistic entities to distort competitive pricing.
3.3 Factors Leading to the Creation of Business Groups
3.3.1 Diversified Business Groups
a) Exogenous Factors
There are mainly two demand driven factors which facilitate the formation of business groups into diversified product categories. The first is that of unfulfilled demand due to the lack of functioning markets
possibly due to underdevelopment. An example could be the lack of high-end products in rural markets.
The size of the market may be too small and risky for an individual firm to enter and serve. A business
group with a diversified portfolio may be able to pool risks better to serve the market. The second arises from government policy. Often developing countries, such as India, have tried to pursue import substitution
as a developmental strategy. It was felt that import of consumer goods led to wastage of precious foreign
exchange which could be better utilized for the import of capital goods. Consequently, imports of foreign consumer goods were either banned or had to pay very high tariffs. As a result, there was a sudden demand
for domestic consumer goods, which were often met by domestic producers who had no expertise in these
sectors. This was sometimes accompanied by incentives, a supply side push, from the government to
produce certain goods which were deemed to be useful to the economy, such as fertilizers. It is no surprise that manufacturers produced these goods regardless of their focus.
Imperfect markets
One important strand of literature emphasizes market failure and imperfections as the cause behind the
emergence of business groups. It is felt that institutions and regulatory mechanisms are weak in developing
economies, which result in high transaction costs. Business groups are seen as a means to reduce these.

14
Product markets may not function well in spite of their being sufficient demand if there is an absence of
suppliers who can be trusted to provide good quality products. Inadequacy of information along with weak
contract enforcement may prompt business groups to diversify into different unrelated categories, creating an umbrella brand. Diversified groups can also act as a substitute for imperfect capital markets by creating
channels for internal capital transfer within the group to invest in new businesses, when investors are
unwilling to invest in markets with poor protective measures. This may help mitigate risk if the business group has a well-established reputation. Business groups are also a response to labour market imperfections
that arise due to a lack of qualified employees in emerging economies. Business groups can establish their
own training facilities, or rotate personnel to create their own internal labour market which make them more
efficient compared to the external market.
Role of the government
The second critical factor that facilitates the formation of business groups is government aid. In this argument, the government supports particular industries and promotes industrialization. The government
provides them with the necessary funds, charges lower interest, provides subsidies and protects the domestic
market. Once the government moves on to more advanced industries, businesses collaborating with the
government may upgrade their capabilities and diversify (Studwell 2014). However, government favours may lead to irregularities in the market relating to crony capitalism and rent seeking.
b) Endogenous Factors
Endogenous factors look at the internal competitiveness and capabilities of diversified groups. Normally,
firms with access to new technology (whether developed internally or sourced from outside) should be able to purchase or develop these abilities and introduce new products in the market. However, in many
developing markets, access to new technology is unavailable. Business groups with access to foreign firms
or with the government, may be better able to develop these technologies. It is easier for business groups
to enter into joint ventures or other technology transfer contracts.
This paves the way for profit opportunities for business groups in emerging markets through project
management and start-up capabilities. Business groups, therefore, diversify into different categories which may be related or unrelated. As new plants start functioning, the accumulated project management
capabilities act as competitive assets which prompt business groups to explore new industries. As the
market matures, businesses would tend to specialize in core domains and technologically related areas. However, on the whole they remain diversified due to what some have termed as ‘trans-product’ capabilities
resulting in shareable knowledge across product related categories giving them a sustainable advantage
even in competitive markets.
3.3.2 Pyramidal Business Groups
Pyramidal business groups exist because of the controlling interest that comes with limited capital
investment via pyramiding that allows for the tunnelling of profits. Separating the cash flow rights from
control rights comes at the cost of minority shareholders. However, in developing economies, where
investor protection and contract enforcement are weak, minority shareholders may not be directly affected if general shareholders accept the probability of profit diversion and share prices are discounted. Another
reason for the development of pyramidal business groups was because profitable groups could subsidize
unprofitable or nascent units for the group’s collective prosperity. Even when markets mature, pyramidal structures endure because of invisible assets like group reputation or political connections. Also, there may
be certain advantages relating to taxes and subsidies when state-owned enterprises are privatized. Hence,
pyramidal group structures may remain even if there are societal costs such as transfer of profits from minority shareholders, the underdevelopment of capital markets and the concentration of economic power
in the hands of a few wealthy families.

15
3.4 The Evolution of Business Groups
One might conclude that business groups should eventually die out as they have done in the mature
economies in America (Canada and USA) and in Europe. To be sure there are some old-style business groups that still function but usually their numbers are small and their role in the economy is not significant.
Japan could also be cited as an example where business groups have withered away. However, they are
still going strong in countries such as Korea and Thailand. One may say that given sufficient time and market style reforms that business groups must eventually disappear. That may be so, but how long will
that take and to what extend should markets be liberalized ? Most economies, some more than others, suffer
from some amount of market imperfections and should therefore remain a happy hunting ground for
business groups.
Also, non-market forces such as politics and legal institutions have played their part in determining the laws
and regulation of capital markets. As long as these factors are present, pyramidal business groups will exist within the institutional framework of the relevant economies, even if there are long run shifts towards a
competitive market structure. Pyramidal ownership structures may also survive because controlling
shareholders may have other incentives than tunnelling profits such as control of economic wealth that is
larger than the actual holdings they have in order to leverage the economic gains from favourable business transactions. They might also want to hold on to non-economic benefits like political power and social
prestige which comes from adopting a pyramidal structure. Maintaining a pyramidal structure can also
lower market risks by controlling shareholders, for innovative new products, by holding operating units legally independent and isolating the risk.
Business groups especially those that are family owned with a diversified portfolio have been searching for an effective organization model as they deal with market developments. On the one hand they are faced
with increasing domestic and foreign competition and on the other they are entering complex industries
such as information technology and financial services. Their problems are compounded by the amount and
complexity of information that the executives at the headquarters and the members of the family have to deal with. According to Chandler, this “overload in the decision making at the top” was the reason behind
the advent of the multidivisional structure of modern corporations.
The reason behind their entry into complex industries is that these are industries that afford the most
opportunities for growth and profits. It is usually difficult to generate high profits from mature industries
with many competitors. However, this poses strains on the capacity of the higher management. One possibility would be to relinquish control to professional managers. A second problem relates to retention
of capabilities that make the business group profitable in the first place. The entry into new businesses
reduces the shared knowledge and coordination that is necessary. One solution is to arrange related
products into strategic business units so that these can share information and coordination. The owners then can act more like portfolio managers, choosing which businesses to be in and the extent of their
investment. Of course, this raises the problem of inter business unit sharing of knowledge and information,
but maybe, this is the best that can be achieved.

16
4 Japanese Business Groups
Japanese business groups are an enigma. They started off as standard business groups: family controlled,
diversified with pyramidal structures. However, possibly because of Japans post second world war history
they morphed into structures known as keiretsu. By most accounts they were active from the 1950s till the
2000s. After that they slowly disappeared and according to scholars are now non-existent. However, the names of some of the business groups such as Mitsubishi still exist and are more like multidivisional firms.
One may wonder why we wish to devote space to a phenomenon that does not exist. First, it should be
granted that the keiretsu structure was unique and worthy of study in its own right. Second, it can be thought of as an intermediate stage between a traditional business group and a modern multidivisional firm or
conglomerate. It is possible that traditional business groups in developing countries may form similar
structures once buffeted by the winds of change. Finally, the nature of interaction between Japanese firms
and Indian firms (business groups or otherwise) are yet to be seen. As Japanese firms enter into India will the experience of countries like Malaysia and Thailand going to be repeated? Will some form of the Keiretsu
be resurrected or maybe nothing in particular is going to happen? Witt (2014), Taniuchi (2014), Aoli and
Lennerfors (2013), Matous and Yasuyuki (2015), Flath (2014), Dow, McGuire and Yoshikawa (2009) provide discussions on the nature of Japanese business houses.
Keiretsu structures fall between hierarchical structures and market-oriented structures. They are corporate groupings of Japanese firms where individual firms maintain their operational autonomy, but coordinate
with other firms in terms of strategy and the exchange of assets and resources. They also exhibit cross
shareholding patterns. There are two types of keiretsu. Horizontal keiretsu encompass a wide range of
diversified businesses centred on a dominant bank or trading company. Vertical manufacturing keiretsu are firms that are organized around particular industry value-chains. They are the flagship firms in the
chain, set within a cooperative pyramidal structure, having upstream connections with suppliers and
downstream connections with retailers and distributors. The core companies maintain joint investments, strategic alliances and cooperative R&D through the exchange of personnel and information from senior
management to junior. Apart from this there are the distribution keiretsu which consist of the retail network
of large manufacturers.
Keiretsu structures have both positive and negative effects on market efficiency and the ease of doing
business. While for Japanese firms there are enhanced synergies from trust-based interactions, foreign
firms have complained of experiencing barriers to entry as a result. However, such structures have also been charged with inertia when faced with low economic growth and are partly held to be responsible for
Japan’s lost decades. The zaibatsu is the pre-war progenitor of the keiretsu which had a hierarchical
structure, family control and state linkage. With their break-up by the US occupation, they were transformed into different entities similar to network forms of organization. The keiretsu form of
organization was significant in Japan from the 1950s to the early 2000s.

17
4.1 Origins of the Keiretsu
The keiretsu evolved from the zaibatsu which were industrially diversified business entities having multiple
layers and coordinated from the top by a family or a holding company. Like the business groups of the developing world, a small number of families acquired control over a large portion of the Japanese economy
through chains of cascading equity ties within a pyramidal structure. For example, the Mitsubishi zaibatsu
which started as a single integrated corporation was transformed into a business group with a pyramidal structure when it started turning internal divisions of shipping, mining and trading company into separate
legal entities. By the end of the second world war the big three zaibatsu, Mitsubishi, Mitsui and Sumitomo
were said to account for 35 percent of the total corporate capital in Japan. After the war, the stocks of the
zaibatsu were redistributed, and a number of companies fell prey to hostile takeovers. In defence, some of the former zaibatsu created a web of cross-shareholdings amongst themselves which ensured that the group
held the majority share of stocks of an affiliated firm. This prevented takeover by other firms and linked
together by cross-shareholding, executive transfers, preferential trading and regular meetings of chief executives in shacho-kai or the presidents’ councils, the big three zaibatsu were resurrected as keiretsu.
Three more groups, Fuyo, Sanwa and DKB Sankin, joined Mitsubishi, Mitsui and Sumitomo in the 1960s
and 1970s. These formed around the three banks, Fuji, Dai-Ichi and Sanwa and were more loosely structured. These six formed the top six horizontal keiretsu. The structures of keiretsu were not formalized
and there was no hierarchy among them. The coordination largely centred around the main bank, which
belonged to the keiretsu. The shacho-kai or presidents’ council provided met in ostensibly social gatherings but are suspected to have shared information and provided mutual assistance. In fact, it is difficult to
determine which firms belonged to which keiretsu and some seemed to belong to more than one. However,
a reasonably reliable indicator was membership in the council. Thus, keiretsu can be thought of as loose alliances of reasonably independent firms. New firms could also be drawn into their orbit through trading
or lending relations. So, the structures also changed with time and were more fluid than is usually
suggested.
The second major form of the keiretsu was the vertical form. It comprised of manufacturing groups:
suppliers and subcontractors organized across a vertical division of labour around a large industrial firm.
There is no counterpart to the shacho-kai in a vertical keiretsu but there is a loose association of suppliers maintained by manufacturers which are co-operative in nature. However due to the vertical structure,
personnel from the vertical keiretsu have greater cohesion which enables better co-ordination between
suppliers and consumers. They also have improved personnel flows through exchange of engineers and other trained executives, and the transfer of executives from higher to lower-tier firms which prevents their
redundancy and ensures the adherence to lifetime employment norms. Because of the support displayed
between upstream and downstream firms in a vertical keiretsu there is risk sharing with each party
supporting the other and absorbing some of the cost and risk.
It may be assumed that horizontal and vertical keiretsu are distinct business structures. However, that is
not the case and horizontal keiretsu may have vertical keiretsu within them. Furthermore, the vertical keiretsu may have firms that belong to the orbit of several horizontal keiretsu. For example, the Toyota
group is a vertical keiretsu aligned with the Mitsui horizontal keiretsu. However, Daihatsu, which belongs
to the Toyota vertical keiretsu belonged to the Sanwa horizontal keiretsu.

18
Identifying which firms belong to which keiretsu, under the circumstances, is a difficult task, not that it has
stopped scholars from trying. However, to some extent all such attempts are arbitrary. One way to identify
firms within a group is to use a network clustering algorithm using data on trade, lending, equity and direct transfer ties. This was done by Lincoln and Gerlach (2004) by taking many of the largest financials and
trading companies in the Japanese economy during the period 1978-1998. The keiretsu can be observed as
blocks or clusters of firms that occupy structurally equivalent positions in the network. However, every three years from 1978 to 1998, distinct keiretsu clusters are seen. Earlier clusters show more clearly and in
each succeeding period the empirically derived groups were fuzzier. By the 1990s, large-firm networks
don’t show up that clearly and point to the demise of the keiretsu. However, that does not necessarily
indicate that ties between clusters do not exist. It may be that the clusters have changed shape and may now be geographical or industry based. It may be worthwhile to use the existent data and analyse them
according to the advances made in network economics.
Apart from their evolution from the pre-war zaibatsu, there were a range of forces that drew the firms into
tighter relationships. Equally, there were forces which tended to push them apart. Banking relations, equity
ties and sharing of personnel drew them together. Sometimes geographical proximity or the use of bailouts
had the same effect. On the other hand, many keiretsu also expanded by setting up divisions with new products that were separate companies under the support and control of a parent firm. This was different
from the kind of autonomy that their counterparts in mature economies enjoyed. Due to the strong culture
and tight organization of Japanese enterprises, the keiretsu satellite created a substitute quasi-intrapreneurial business environment.
Keiretsu like business groups in emerging economies pursued strategies of unrelated diversification. There were however differences between horizontal and vertical keiretsu. Horizontal keiretsu usually contained
at least one firm from the major industrial sectors. In the vertical keiretsu, upstream suppliers or
downstream distributors to a large manufacturer often diversified and expanded into other arenas. For e.g.
Toyota started off as an assembler of sedans but expanded its product line to include trucks, minicars through its keiretsu partnerships with Hino and Daihatsu, respectively.
4.2 Impact of Keiretsu
The keiretsu structure can be evaluated in terms of their overall impact on the development of the post war
Japan economy. This can be done through the lens of development economics or through other sub
disciplines in economics. Quite often scholars from other areas such as strategy and finance have also
waded in.
The received view is that the keiretsu structure helped to overcome market imperfections and institutional
deficiencies. First, it helped firms get access to funds for the purpose of investment when Japanese capital markets were not serving the purpose. Secondly, given the deficiencies of the Japanese distribution systems
the keiretsu system allowed firms to bypass these provided coordination and economies of scale. Third,
the system allowed firms to set up upstream and downstream firms for the inputs and distribution, at a time
where supply chains were virtually non-existent. Finally, it also allowed entrepreneurs within the firms to innovate and come out with new products, which went on to become successful firms on their own. This
was an important role at a time when venture capital was largely absent.

19
There is a considerable amount of disagreement about the microeconomic effects of Keiretsu, ranging from
significant to no effect. The arrangements for information sharing and cooperation would raise the
suspicion of antitrust economists, who could sniff cartelization as well as abuse of dominance. If that was the case the financial performance of Keiretsu companies would be better than non-keiretsu firms: but that
was not the case. The Keiretsu structures could also be viewed as economizing on transaction and agency
costs, but that also should be reflected in superior performance. According to some, all that Keiretsu system does is risk sharing and resource shifting among affiliated firms. For example, in the 1970s, Sumitomo
Bank rescued the Mazda Motors though bank loans, arranging for lower input prices, sending managers
and other actions. There is a fair amount of evidence that affiliates in distress have received significant
help from their Keiretsu partners which led to the restoration of their fortunes. Yet when it comes to the economic viability of the groups, this could happen at the expense of their high performing counterparts.
Thus, the Keiretsu system could be viewed as a set of transfer payments from the better performing firms
to the poorer performing ones. This might have helped stave of bankruptcies and maintain the system of lifetime employment and no layoffs, but it didn’t provide good returns to the investor.
For the vertical keiretsu, the close and collaborative buyer-supplier relationships prevalent in vertical
structures lead to efficiency and innovation as documented by numerous studies. More than the horizontal keiretsu, the vertical version seems to perform an economically important function. The high degree of
trust, information sharing, efficient governance due to relationship specific investments along with
relatively customized processes make businesses more likely to choose keiretsu suppliers than independent suppliers when the complexity and specificity of the parts sourced is high. Similar to the horizontal keiretsu,
vertical keiretsu have also been able to share and pool risk. For example, a study finds that suppliers to
Japanese auto assemblers are more protected from the risk of demand fluctuations, which the car companies have to deal with.
4.3 Keiretsu: The End?
By the 1980s the breakdown of the keiretsu structure was evident. An examination of specific ties like equity ties document the unravelling of the keiretsu. Major banks and insurance companies sold off their
cross shareholding and replaced them with foreign institutional shareholders. During the 1990s, keiretsu
risk sharing activity declined further and Japanese firms like the Japanese electronics businesses began aligning themselves less with keiretsu firms and started forming strategic alliances with other domestic
firms instead, especially in areas such as research and development. The keiretsu structure gave way to
holding companies and conglomerates. The result can be seen in Table 4.1. The old and venerable
Mitsubishi, Mitsui and Sumitomo are still there but the extent of intra group links are unclear. Some of the old keiretsus have like Fuyo and Daiichi Kangyo have dissolved following restructuring. The number of
banks have reduced and are no longer, ostensibly, tied to the keiretsus. This has resulted in the emergence
of MUFJ, Mizuho, Nomura and SMBC. Companies like Toyota and Matsushita, which were part of vertical keiretsus, still remain. A slew of new firms such as Rakuten, Uniqlo and Softbank have emerged. So the
business landscape of Japan now exhibits considerable variety. The following are the main reasons for the
decline: banking consolidation, change in accounting rules, corporate governance reform, technological
change and lack of cultural and political legitimacy.

20
They are discussed below:
1. Banking consolidation: A wave of Japanese bank consolidations during the end of the 1990s brought lasting changes to the financial services landscape. This in turn altered the structure of
Japanese banking and their linkage with the horizontal groups. These mergers were large in scale
and reduced the number of banks that were supporting the keiretsu. Apart from banks, industrial mergers also took place beyond the keiretsu association. A parallel consolidation of non-keiretsu
industrial partners led to the formation of alliances related to distribution and maintenance.
2. Change in accounting rules: To increase the transparency of Japanese firms, financial reports were required to include the results of all affiliates however small the stake in the affiliate. The
tunnelling of profits ascribed to business groups was possible under old accounting rules which
allowed companies to hide assets and liabilities of associated firms. The new accounting rules prohibited keiretsu practices like transferring personnel to affiliates or bailouts. A major rule that
led to the unravelling of the keiretsu structure was the reporting of assets at market value rather
than book value. Many banks were discovered to be worse off and insufficiently capitalized to
support their lending activities. Thus, banks had to offload their cross-held shares.
3. Corporate governance reform: Regulatory changes were made relating to the composition of board
of directors and reducing the size of the board for speedy decision making. While large boards
played an important role in the keiretsu system of executive exchanges and inter-twined directorates, smaller boards and tighter rules on director participation made firms less likely to
indulge in the keiretsu practice of seconding bank and trading partners to be directors and
executives of affiliated firms. The option of using an independent auditor in line with the US system was also given to oversee corporate finance. The interests of shareholders and management
were brought into better alignment with the removal of legal restrictions on stock options.
4. Technological change: The competitive advantage that was enjoyed by the keiretsu style management structure faded during the 1990s. Modular manufacturing which requires less
integration and customization of production stages (Sturgeon 2005) was adopted by most firms.
Standardized parts used in multiple models and assemblies sourced from fewer and larger suppliers
helped lower costs. Online procurement systems enabled companies to automate some of the processes that were earlier being maintained through close supplier-customer ties within the
keiretsu. The global adherence to the Japanese lean production system adopted by Japan’s
competitors afforded less competitive advantage to Japanese manufacturers and eventually led to the decline of the vertical keiretsu. Japanese manufacturers also moved production abroad and
established new ties with foreign suppliers while breaking old keiretsu ties as a result of exchange
rate fluctuations, and labour or transport costs.
5. Lack of legitimacy: The general political and cultural disregard for the keiretsu system quickened
pace in the 1990s after firms found themselves rewarded in the stock market under the new rules
and initiatives that refused to bail out struggling affiliates or recognize subsidies as such, instead of as operating expenses.
During the 2000s, press reports noted the possible revival of the keiretsu structure as some Japanese firms
sought to regain control of suppliers from foreign ownership through vertical cross-shareholding of equity
stakes. But a closer look revealed that this was not the case. Instead companies hiked stakes in closely
affiliated firms and converted them into formal subsidiaries and internal divisions through acquisitions
Although Japan retains some distinctive feature of the keiretsu structure, today its corporate structure and
management resemble the Anglo-American West through greater internalization and more arms-length
market-like relations.

21
Table 1 - Current Japanese Conglomerates
Group Name Sectors Market Cap (JPY)
Mitsubishi Mining, shipbuilding, telecom, financial services 3.80 trillion (Mitsubishi corp.)
Mitsui Financial services, real estate, retailing, logistics 3.28 trillion
(Mitsui & Co ltd.)
Sumitomo Automobile, electronics, IT services, real estate 1.69 trillion
(Sumitomo corp.)
Toyota Automobile 25.42 trillion
KDDI Education, Analytics, Asset Management 7.06 trillion
Nomura Banking, securities, asset management 1.76 trillion
NTT Communications, IT Services, technology 10.29 trillion
Nidec Technology 7.70 trillion
Shin Etsu Chemicals 7.45 trillion
MUFJ Banking, securities, asset management 6.16 trillion
Mizuho Banking, securities, asset management 3.31 trillion
SMFG Banking, securities, asset management 4.33 trillion
SONY Electronics, Movies, Music 12.55 trillion
SoftBank Mobile services, Investment 16.07 trillion
Seven Eleven Retailing, investment services 3.24 trillion
Fast Retailing Apparel (Uniqlo, GU, Theory etc.) 9.16 trillion
Sompo Insurance, securities 1.54 trillion
Marubeni Trading (Consumer, Chemicals, Transportation etc) 1.18 trillion
JR Railways 7.42 trillion
Matsushita Manufacturing 2.88 trillion
Japan Post Postal, banking, insurance 3.56 trillion
Canon Electronics 2.71 trillion
Subaru Automobile 1.58 trillion
Bridgestone Motor Vehicle Tires 2.46 trillion
Hankyu
Hanshin
Transportation, Real Estate, Entertainment, Travel 837.86 billion
Furukawa Metals, machinery, chemicals, electronics 195.32 billion
Benesse Education, Childcare 206.01 billion
Kinetsu Transportation, Real Estate, Retail, Hotel and
Leisure
831.29 billion
Koei Tecmo Game development 793.71 billion
Daiwa Banking, asset management 787.15 billion
Sanwa Manufacturing, building interiors 279.05 billion
Dowa Materials, Metals, Environment 233.70 billion
Source: Author’s calculations based on Google search results
22
5 Business Groups in India
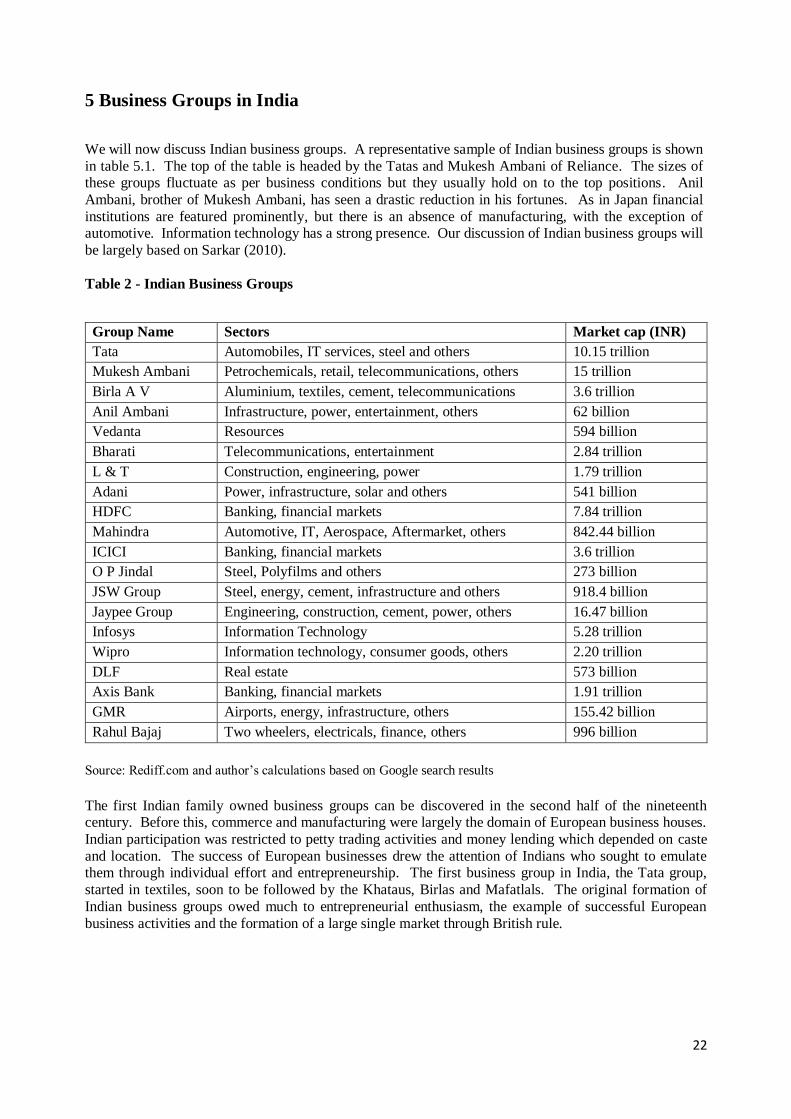
We will now discuss Indian business groups. A representative sample of Indian business groups is shown
in table 5.1. The top of the table is headed by the Tatas and Mukesh Ambani of Reliance. The sizes of these groups fluctuate as per business conditions but they usually hold on to the top positions. Anil
Ambani, brother of Mukesh Ambani, has seen a drastic reduction in his fortunes. As in Japan financial
institutions are featured prominently, but there is an absence of manufacturing, with the exception of automotive. Information technology has a strong presence. Our discussion of Indian business groups will
be largely based on Sarkar (2010).
Table 2 - Indian Business Groups
Group Name Sectors Market cap (INR)
Tata Automobiles, IT services, steel and others 10.15 trillion
Mukesh Ambani Petrochemicals, retail, telecommunications, others 15 trillion
Birla A V Aluminium, textiles, cement, telecommunications 3.6 trillion
Anil Ambani Infrastructure, power, entertainment, others 62 billion
Vedanta Resources 594 billion
Bharati Telecommunications, entertainment 2.84 trillion
L & T Construction, engineering, power 1.79 trillion
Adani Power, infrastructure, solar and others 541 billion
HDFC Banking, financial markets 7.84 trillion
Mahindra Automotive, IT, Aerospace, Aftermarket, others 842.44 billion
ICICI Banking, financial markets 3.6 trillion
O P Jindal Steel, Polyfilms and others 273 billion
JSW Group Steel, energy, cement, infrastructure and others 918.4 billion
Jaypee Group Engineering, construction, cement, power, others 16.47 billion
Infosys Information Technology 5.28 trillion
Wipro Information technology, consumer goods, others 2.20 trillion
DLF Real estate 573 billion
Axis Bank Banking, financial markets 1.91 trillion
GMR Airports, energy, infrastructure, others 155.42 billion
Rahul Bajaj Two wheelers, electricals, finance, others 996 billion
Source: Rediff.com and author’s calculations based on Google search results
The first Indian family owned business groups can be discovered in the second half of the nineteenth century. Before this, commerce and manufacturing were largely the domain of European business houses.
Indian participation was restricted to petty trading activities and money lending which depended on caste
and location. The success of European businesses drew the attention of Indians who sought to emulate them through individual effort and entrepreneurship. The first business group in India, the Tata group,
started in textiles, soon to be followed by the Khataus, Birlas and Mafatlals. The original formation of
Indian business groups owed much to entrepreneurial enthusiasm, the example of successful European
business activities and the formation of a large single market through British rule.

23
The evolution of group structure was aided by the role that family finance played in promoting new ventures
for Indian entrepreneurs. An underdeveloped stock market and banking system, under the control of the
British, who were loath to help Indians were the reason behind this development. Consequently, these enterprises became joint stock companies with shares owned by family members and friends and
acquaintances. The profits from the original companies were reinvested into other new concerns, partly
because the size of the market was small and there were many opportunities in a developing economy. Thus, group of companies formed that were associated with a particular family and there were a number of
such business groups. Some of these groups developed a pyramidical structure.
Each group also had a managing agency, as a proprietorship or partnership comprising family members that was entrusted with managerial responsibilities. Not only did this help with vertical and horizontal
integration which generated scale economies, but it also helped address the problems of a deficient
managerial market in the early years of industrialization. Further, all this could be achieved without market-based transactions, which would have been the norm if the members of the business groups had been
independent companies.
These family-based business groups benefitted from the extremely strong ties of trust and reciprocity that exist within the Indian joint family structure and also within certain communities. This characteristic
conforms to the sociological perspective on the formation of business groups which accentuate the network
effect. They were also diversified structures that were legally independent under common family administered control and as such were full-fledged economic entities which pursued economic goals. Such
groups were also seen as an institutional response to weak institutions and missing markets and helped
develop both the firm and the market. Thus, they adhered to all the standard criteria associated with business groups in many of these key aspects. During this period, the revenues generated, and experience
gained helped in the sustenance of internal capital as well as the development of the labour market, which
in turn enabled groups to overcome market imperfections and generate further growth for the economy.
Indian family groups proliferated and their share in capital employed went from 13 percent to 34 percent in the 1918-39 period with three of the top four groups being owned by Indians. As such, the business
groups, though much maligned in later years and probably even now, were instrumental in the development
process of India.
5.1 Regulation and Deregulation (1947-2006)
The institutional environment in the case of business groups for the years 1947 to 2006 can be broken up
into 3 distinct periods: the time taken from their inception in the late nineteenth century to 1947, the post-independence period up to 1991 when the environment was extensively regulated and subsequently the
period of liberalization and globalization that was ushered in for the Indian economy post 1991. The
economic development of India under colonial rule has been extensively discussed. On the one hand industry benefitted from being a part of the globalized British empire and planted roots in foreign countries,
but overall the policies of the British were not geared towards the economic development of India and India
performed dismally in terms of traditional measures of economy as increase in GDP per capita.
After independence in 1947 the state adopted a protectionist attitude and contrived to control the
“commanding heights of the economy.” The regulated industry policy entrusted a dominant role to the
public sector and a residual role to the private sector. The policy of import substitution along with industrial/import licensing, infant industry protection and regulations to curb the concentration of economic
power ensured that domestic industrial capabilities could not be effectively built up under protected
markets. The private sector tried to cope as best it could under very challenging circumstances. Restrictions on expansion in core businesses led to an increase in the portfolio of businesses for business group. Expand
where you can get a license was the motto. The protectionist and import substitution policies of the
government spawned the growth of many firms. The eviction of Coca Cola saw Indian substitutes emerge
such as Thums Up and Campa Cola. The retreat of IBM let to the emergence of personal computer manufacturers such as HCL and Wipro.

24
With mounting evidence on the ineffectiveness of the licensing regime to achieve economic growth or to
offer social justice (as the ostensible reason for regulation), attempts were first made to liberalize the
economy during the 1980s, which failed. The Indian economy which had begun to slow down faced a foreign-exchange crisis in 1991 which led to structural reforms in its industrial and trade policy regime.
The abolition of licensing and removal of curbs placed on large businesses eventually made business houses
able to expand, invest and diversify post 1991. Reducing trade barriers, deregulating the banking sector, allowing free pricing of primary issues and transparency in the stock market, permitting foreign institutional
investors to provide low cost finance were other measures that were initiated.
5.2 Indian Business Groups: Some Distinctive Features
Business groups in India are characterized by family ownership, diversified portfolios and pyramidal
structures as per the standard definition of business groups. Ownership is through equity as well as through
administrative control. Perhaps the standout feature of Indian business groups is the importance of family,
ethnicity or community.
There were 2922 firms affiliated with 560 business groups as identified from the Prowess database in 2006.
Group affiliates together account for almost 70 percent of asset share in 2006. The concentration of business groups though meant that only a few large groups (around 4) would account for most of the share
of business assets. This persisted in spite of the development of the market. There was some turnover of
rankings prior to 2000 among the top twenty with 11 new entrants and 9 previous ones. However, ranks have not changed much since then and there not much change in the distribution, so that by 2006, six of the
groups belonged to the pre-independence period (the oldest being Tata), nine belonged to the regulated
period of the 1950-70s, and the remaining belonged to the post liberalization period.
Family ownership has been through holding company structures, either in the form of a single holding
company like the Tata group or multiple ones like the Anil Dhirubhai Ambani group. Sometimes there is
no holding company but a flagship company at the helm around which has subsidiaries, private companies and trusts where family members have stakes. These are often organized as pyramids but also have intra
group shareholdings, making the structure very complicated. While the owner or promoter of the group
has absolute control, it can also exert informal control over affiliates lower in the pyramid with only minor equity stakes. In the period 2001-06, the direct stake of promoters was 41 percent whereas indirect
ownership amounted to 5.35 percent. However, direct ownership by family members was relatively low.
The family influence was indirect, either through closely held group holding companies (Tata Steel and
Reliance Communications) or through other privately-owned companies (Reliance Industries and Hindalco Industries) owned by promoters. Tunnelling of earnings has been a consistent concern with Indian business
groups. The extent of tunnelling is difficult to detect given the complex structures of these groups. In fact,
it is difficult to even appropriately value these groups given incomplete knowledge of earnings and shareholdings.
Two features of group affiliates are promoters as directors, and multiple directorships. The percentage of
companies in which the promoter serves as director or managing director is higher for group affiliates than non-affiliated companies while the percentage of directors with three or more directorships continues to
remain high (56 percent against 6 percent in the US). Business groups have more insider directors with
multiple directorships compared to ones which do not belong to business groups. This is also true for independent directors with multiple directorships. Managerial integration is also achieved via an inner
circle among group affiliates from which most inside directors as well as independent directors emerge
(often from a single group). This is in contrast to the inside or independent directors of non-affiliates where a larger share of directors from both categories are concentrated in non-affiliates themselves rather than
affiliated group companies.

25
5.3 Dealing with the Business Environment
The first notable feature of Indian business groups is diversification. Though family-based business groups
are by nature diversified, the scale of diversification in India is very high. However, this was driven more by environmental factors than deliberate strategy. During the colonial period lack of competitors and a
large market coupled with business opportunities saw business groups expand into many unrelated areas.
Even though, business groups differed in size and their portfolios they had similar strategies for expansion.
During the license regime raj business groups continued their march towards diversification, only their
reasons were different. They were now faced with a government policy that looked at them with suspicion
and stymied their efforts on expanding their businesses. Business groups developed considerable ingenuity in expanding regardless of such impediments. The primary weapon in the hands of the government were
industrial licenses, that were required for any sort of production among licensed goods. Access to credit
and foreign exchange and imports were also rationed. Once a particular firm within a business group reached its licensed production limit it had to diversify into other industries. They could not pick and
choose but had to produce what they could get licenses for, though they could get licenses through their
ability to work the system.
Economic liberalization and the subsequent deregulation and development of the external and internal
markets raised questions about the relevance of unrelated diversification. Some felt that there would be a
wave of mergers and acquisitions as business groups rationalized their businesses based on a coherent strategy. It should be mentioned that Indian markets, both external and internal are far from perfect, and if
one were to search for market imperfection to justify the existence of business groups, many such examples
can be found. Nevertheless, the process of liberalization and deregulation saw many firms streamline their businesses.
The strategic responses of Indian business groups during the post reform period varied. While some groups
focused on core competencies, some diversified either extensively or in select product categories. For the period 1991 to 2006, the core industries of Indian groups (with the exception of one group) remained the
same. While some chose to expand their core businesses (e.g. Reliance), others also pursued different lines
of activity relative to their core industry (e.g. Tata).
Unrelated diversification has also been observed along vertical lines. Firms may be tempted to avoid
transaction costs through vertical integration which in turn can also lead to diversification. For example, Reliance started in the 1960s with textiles and moved to in-house production of rayon because of the market
failed to provide adequate quantity and quality. As a result, the company moved forward through vertical
integration into retail and backward into petrochemicals and gas, and subsequently leveraged this
experience to foray into unrelated industries like cement and telecommunications.
The post-reform period also witnessed the growing internationalization of group companies through
outward direct foreign investment (ODFI). Even during the license raj regime Indian business groups ventured abroad given the problems they faced at home, even though the regulatory regime was far from
conducive to such expansion. Initially they concentrated on manufacturing in developing economies: an
environment that they were much more familiar with Later they changed their focus to services and
developed economies. The post liberalization period not only brought about market expansion through ODFI but also improved their global competitiveness and by creating value chains through backward and
forward linkages to become competitive globally. Most of the global acquisitions were done through group
affiliated companies. The forward linkages were focused on developing marketing and sales capabilities in developed economies to be served by low cost domestic operations.
26
5.4 How have they fared?
As far as performance is concerned, there is no significant difference in the performance of affiliated group
companies compared to stand-alone firms. Groups did not outperform stand-alone firms and their profits moved in tandem. However, group affiliated companies were larger in terms of sales and assets, more
leveraged and older, when compared to non-affiliated companies. Business group affiliated companies
have expended into information technology services, where Indian companies have demonstrated superior performance. They have also moved into financial services, telecommunications and retail. In these new
markets they have not demonstrated better performances than stand-alone firms.
The experiences of business groups can be summed up by the old adage: the more things change the more they remain the same. Business groups have had to face challenging environments as they evolved in
different institutional regimes. They have changed strategies, diversified and expanded along the way.
There has been some turmoil, with changes in the fortunes of some. However, they have more than managed to hold their own. The disappearance of the business group in India is quite some distance away.

27
6 Japanese firms in India According to the Japanese embassy the total number of Japanese companies registered in India stood at
1,454 at the end of October 2018 and the total number of Japanese business establishments stood at 5,022.
The largest number of Japanese establishments are in Maharashtra (815), followed by Tamil Nadu (600) and Karnataka (534). Prominent Japanese involvement in India include Suzuki, Toyota, Uniqlo,
Mitsubishi, Mitsui, Honda, Mizuho, Hitachi, Sony and Panasonic. Indian firms in Japan include Infosys,
TCS, HCL technologies, OYO, SBI, Quick Heal and Sun Pharma.
The literature on the behaviour of Japanese firms in India is relatively sparse. Broad studies on economic
relations and trade have been carried out by Sato (2012), Buckley, Cross and Horn (2012) and Taneja, Joshi, Bimal and Singh (2020). Similarly, Roy and Chanda (2020) look at trends in FDI inflows from Japan and
Chanda and Tokas (2020) consider the effects of trade agreements. Some authors have compared and
contrasted the behaviour of Japanese firms in India and China. A notable example is Anand and Delios
(1996). For our purposes the more interesting papers are Horn and Cross (2016) which looks at Japanese production networks, Varma, Awasthy, Narain and Nayaar (2015) and Masanori (2012), who investigates
Japanese company strategies in India. We will provide a brief discussion of Horn and Cross (2016) first.

28
Table shows the institutional characteristics of India and Japan, according to Witt and Redding (2014).
Table 3 - Institutional Characteristics of India and Japan
Source: Witt and Redding (2014)
Category Measure India Japan
Education and Skills Adult Literacy 0.61 0.99
Education Attainment Index
(2010)
0.45 0.883
Employment Tenure short (private), long (state- owned)
long
Skills Acquisition private, some
corporate
OJT
Employment Relations
Union Density 6.9% (2008) 18.5% (2010)
Organization Principle industry company
State Intervention in Wage Bargaining
low-medium low
Coordination 2 3
Belligerence: Days Lost to
Strikes, Average 2000– 2008
2,52,30,911 11,693
Financial System Main Source of External
Capital
banks banks
Allocation Criterion relationships, state market, relationships
Term long long
Interfirm Relations Presence of Business Groups business houses keiretsu
Noteworthy Other Networks caste or religion-based networks,
industrial clusters
(IT)
intra-industry loops with strong associations,
R&D consortia, supplier
and distribution networks
Internal Structure Decision- making Structure top-down participatory
Extent of Delegation low medium-high
Main Basis of Promotion and
Pay Raises
relationships,
seniority
seniority
Ownership and
Governance
Main Ownership Form,
Large Firms
family, state public
Main Controlling Owner family, state firms
Investor Protection Index
(out of 10) (2012)
6 7
Social Capital Interpersonal Trust high high
Institutionalized Trust: Rule
of Law
−0.06 1.31
State Type predatory with
developmental trend
residual developmental,
welfare elements
Decision- making top-down, variation
at state level
participatory through
associations and committees
Voice and Accountability 0.42 1.05
Government Effectiveness −0.01 1.4
Regulatory Quality −0.39 0.98

29
6.1 Location of Japanese Firms in India
Their study tries to answer the following research questions:
1. “How do subnational location characteristics influence the geographic dispersion of Japanese operations in India (as measured by investment project numbers)?
2. Can firm-level and industry-level variations in dispersion be detected?
3. To what extent is agglomerative behaviour – one of the key facets of Japanese corporate behaviour
- observed?
4. Can trends in the subnational distribution of investment project numbers be detected over time?”
Based on previous studies of FDI location determinants, the authors chooses five components to study.
They are
1. Market size and growth.
2. Human capital.
3. Infrastructure.
4. Agglomeration.
5. Manufacturing density.
Using these factors the authors suggest nine propositions:
Proposition 1: Japanese firms preferentially establish larger numbers of operations in more economically advanced regions of India.
Proposition 2: Japanese firms preferentially establish larger numbers of operations in regions of India with
higher economic growth rates.
Propositions 1 and 2 relate to market size and growth respectively. It seems fairly obvious that firms will
aim to serve areas that have a bigger market. It also stands to reason that firms would look at market
potential rather than immediate returns when choosing their locations.
The next two propositions relate location decisions with human capital. Again it seems fairly
straightforward to suggest that firms would like cheap but skilled labour. This might be a paradoxical desire for businesses but that would be the ideal situation. Since the degree of skills cannot be easily assessed one
needs to use proxies as indicators. Two readily suggest themselves: education levels and labour costs. One
may surmise that cheap labour equates to unskilled labour which in turn indicates lower productivity. One may as well pay more to get better quality labour.
Proposition 3: Japanese firms establish larger numbers of operations in regions of India with higher labour
costs. Proposition 4: Japanese firms preferentially establish larger numbers of operations in regions of India with
higher education attainment levels.
It is obvious that better infrastructure is an attraction which gives us proposition 5. Government incentives
in terms of special economic zones (SEZ) and the better quality infrastructure that is usually provided there
gives proposition 6.
Proposition 5: Japanese firms preferentially establish larger numbers of operations in regions of India with
superior infrastructure.
Proposition 6: Japanese firms preferentially establish larger numbers of operations in regions of India with greater numbers of SEZs.
Propositions 7, 8 and 9 concern agglomeration effects and manufacturing density. Japanese firms are reputed to follow in the footsteps of their countrymen. If a few Japanese firms establish business in some
part of the country then others will follow. This bandwagon effect is quite rational, particularly for
businesses. Japanese firms are well known for meticulous preparation and consensual decision making.

30
Consequently, taking a decision on location can be a painful and ardous process. A Japanese firm that
follows knows that preceding firms have gone through the same analysis and can then feel confident about
their choice. Higher levels of manufacturing activity can provide us another indicator of agglomeration effect. The effect of manufacturing density is captured in proposition 9.
Proposition 7: Japanese firms preferentially establish larger numbers of operations in regions of India with
higher numbers of prior Japanese-owned investment cases.
Proposition 8: Japanese firms preferentially establish larger numbers of operations in regions of India with
higher levels of manufacturing activity. Proposition 9: Japanese firms are more likely to preferentially establish larger numbers of operations in
regions of India with higher levels of manufacturing density than are other foreign firms.
The analysis is carried out using data for two periods: 1995/98 and 2004/2008. The authors find that JMNEs
exhibit a tendency to locate in regions of India characterized by high GDP levels. This finding holds
irrespective of industry affiliation. However GDP per capita has only a small effect on investment numbers
and regional growth figures also don’t seem to drive investment.
The relationship between wage structures and investment seems weak. After controlling for regional labour
productivity in India, the effects of wages on Japanese investment numbers diminishes. In both time periods Japanese corporate behaviour in India is driven more by labour productivity than wage considerations.
Indicators for quality of human capital at the state-level show that higher the availability of educated
personnel, more likely that instances of Japanese FDI will be observed.
The effect of Indian infrastructure on Japanese location decisions is equivocal. The period 1995/1998
exhibits a positive relationship with investment, with the effects for road infrastructure being small and
more pronounced for railway networks. The latter period (2004/2008) only shows a positive effect for railways. Most surveys on drivers of location in India as a whole or regionally flag poor infrastructure as
a major impediment. The analysis by Horn and Cross suggests otherwise. It is possible that Japanese
investment is directed at market development rather than using India as an export platform. In both periods, the existence of EPZs (1995/1998) and SEZ numbers (2004/2008) are positively correlated to Japanese
investment numbers.
In both time periods, there is a strong effect of prior Japanese investment projects as a location determinant.
In comparison to other independent variables this country of origin effect is by far the strongest. The GIS
data analysis confirms an intensification of agglomerative tendency among JMNEs in India over the two
periods under investigation.
Japanese investment is strongly and positively related to levels of manufacturing activity at regional levels.
This is true when levels of manufacturing activity is measured by the number of workers in manufacturing regionally. When measured proportionally to total number of workers or total population the effects are
less pronounced. The location effects are more pronounced for Japanese firms than for other nations. With
respect to industry effects, significant differences in investment strategies are exhibited for the electronics,
chemical and IT sectors. The IT sector seems to exhibit more pronounced agglomeration effects than others, but that would probably be true of Indian firms as well.
6.2 Alliance Management between Japanese MNEs and Indian firms
Varma, Awasthy, Narain and Nayyar (2015) attempt to understand alliance management capabilities
through the different phases of the alliance life cycle in the context of three Indo-Japanese joint ventures
(JV) with diverse alliance outcomes. This study, that uses the case method is pertinent to our paper in that
it highlights the connections and relationships that drive changes in business systems. To amaintain anonymity the names of the firms have been omitted in the paper.

31
There are typically three different stages in the life cycle of an alliance:
1. The formation phase where the firm evaluates its decision to form an alliance and selects an appropriate partner.
2. The design phase where the firm sets ups an appropriate governance structure and design for the
alliance. Alliance success depends on appropriate choices about the structure and contractual terms of that alliance.
3. The post-formation management phase where the firm has to manage the alliance after it is up and
running.
6.2.1 Case profiles:
JV1 was established in 1987. The partners were a Japanese firm with expertise in industrial automation and a leading Indian firms with a long history in refrigeration. There a third partner, a government of
Karnataka state enterprise. The Japanese were interested in entering India for strategic reasons and the
Indian firm wanted access to Japanese technology. Since this was at the time of the license raj the only way of getting a license was to involve a state owned enterprise, which exited after a period. It should be
noted that the Japanese had a long association with the Indian firm before it struck up the alliance. The
alliance worked successfully for 16 years before it finally ended amicably. The Indian firm achieved its
goal of technology transfer and training and the Japanese firm set up its own operations.
JV2 involved the auto components sector. This involved a JV with an existing Indo-Japanese joint venture.
The Indian partner supplied auto parts components to the older joint venture. The Indian firm primarily sought technology transfer which required detailed information including specification of machine tools,
auxiliary equipment and technical support for a period of seven years. Initially, the Japanese firm was
reluctant to take an active role in the venture, partly because of its experience with a previous JV. However, the Indian firm persisted and brought about changes in its processes and engaged in a long and painstaking
interaction with the Japanese firm, eventually wearing down its resistance. Eventually, the Japanese firm
was convinced about the Indian firm’s commitment and had a fruitful association which was still continuing
at the time the paper was written. The Indian firm went from strength to strength collecting many awards and signing joint ventures with other firms.
JV3 had all the markers of success as it was a joint venture between a leading Japanese telecommunications operator and a one of the leading business houses of India. Instead it was a failure. The Indian firms wanted
access to Japanese technology and investment and the Japanese firm wanted access to a growing Indian
market. The immediate cause for the collapse of the deal was the inability to get a license for Delhi circle,
a very lucrative market. After that the venture lost three licenses after they were cancelled by the Indian courts. Besides this there were differences between the working styles and the strategic intents of the two
entities. A compounding factor was the hyper competitive state of the Indian telecommunications market
at this stage.
There are a number of possible conclusions one can draw from these cases, though one must be aware of
the perils of generalisations on such a small sample. It would also do well to remember that two of the cases date back to a different policy regime while the third is of relatively recent provenance. First, the
policy regime left very little choice about the mode of entry of the Japanese MNEs into India at that time.
All the Indian partners were interested in technology transfer, and the Japanese wanted to enter a promising
market. In all instances mutual trust was instrumental in the establishment of the alliance and both formal and informal methods were necessary for the alliance to work.

32
In the case of JV1 and JV2 factors which helped in forming a good working relationship included
1. Clear roles.
2. Mutual trust.
3. Consensus and consultation in decision-making.
4. Mutual understanding of differences in culture.
5. an appreciation of the Japanese style of management and finally.
6. Communication. Trust and cultural compatibility in a business environment emerge as a key factor that drive the success of an alliance.
6.3 Japanese company strategies
The final paper that we will discuss is Kondo 2012, which looks at strategies adopted by Japanese firms for
their operations in India. The author compares favourably the relatively higher levels of success of Korean
firms and attributes it to their strategies. The paper does not use data sets or follow any particular
methodology and it is largely based on newspaper articles. Nonetheless it provides us with insights that could be investigated with data and is useful.
The main strategies that the paper discusses are
1. Large scale investment at the time of entry.
2. Working through joint ventures.
3. Central decision-making.
4. Adapting to the Indian market.
5. Large scale advertisement campaigns.
6. Corporate culture and fostering understanding.
7. Human resource relations
8. Chambers of commerce.
Kondo 2012 suggests that firms which enter the market on the back of large investments, like the Korean
firms of Samsung and LG are more likely to be successful. Small, tentative entry with an intent to understand the complex Indian market soon falter. He also notes that several Japanese firms that entered
the Indian market in a big way also came to rue their decision, but he nevertheless persists in his
prescription. He notes that the preferred route of entry for Japanese firms have been through joint ventures which require a lot of managing. In particular he notes that a lot of Indian firms are family businesses and
are not always transparent and do not follow the logic of markets or sound management. The commitment
of the top management to the Indian market is also very important. He notes that the success of Maruti-Suzuki depended a lot on the leadership of Osamu Suzuki.
33
Kondo suggests that adapting to the market has been a notable failure of Japanese firms. In contrast Korean
firms did extensive market research to find out which features were suitable for the Indian market.
However, some Japanese companies such as Panasonic and Daikin have been more proactive. Large
advertisement campaigns are also needed for the success of products as the example of Toyota Innova
shows. Of particular importance is the corporate culture of the Japanese firm. He notes that often there is
very little faith in the management capabilities of Indian managers among Japanese firms. The relationship
between the management of the subsidiary and the parent Japanese firm is often frosty and plagued by
mutual incomprehension. Expatriate Japanese managers typically find it difficult to fit in culturally and
have problems with food. The Korean firms on the other hand have again gone to great lengths to assuage
these problems. Training Indian staff has also proved to be a major challenge. Typically Japanese firms
rely on workers with very high skill levels and a sound understanding of Japanese production processes.
Getting Indian workers to these levels requires a lot of investment. There is need for training on the
Japanese side as well since finding Japanese workers who are conversant with India is a challenge. Japanese
firms are loath to delegate authority to Indian managers. This results in slower decision-making. On the
other hand it is also cheaper to hire Indian managers and the money saved could come in handy, particularly
in nascent stages. This is in contrast to western firms who have far more confidence in the abilities of
Indian managers. In terms of labour relations he notes that non-Japanese companies suffer fewer strikes
and there needs to be improvement. Finally, Japanese Chambers of Commerce and JETRO need to be more
proactive and emulate the Indo-German chambers of Commerce. It should be noted that Kondo’s paper is
quite old and much may have changed over time. Now there is a Indo Japanese Chamber of Commerce
and Industry and JETRO is more proactive.

34
7 Conclusion We have provided a discussion of business groups in general and Japanese and Indian business groups in
particular. This was motivated by the relatively recent Japanese commercial interest in India. More and
more Indian and Japanese businesses are interacting and sooner or later Japanese firms will have to interact with Indian business houses. The question is what shape this interaction will take. One of the reasons for
the existence of business houses is imperfect markets and that is a feature of Indian markets. Japanese
industrial structures were marked, in the past, by the presence of the zaibatsu and the keiretsu. It is possible that those structures may be replicated when Japanese businesses interact with Indian ones.
The current literature is limited and is based mostly on case studies. It is important to get more extensive data through which we can explore the interaction in quantifiable terms. The obvious next step is to find
some answers through surveys of Japanese and Indian businesses that interact with each other.

35
References Anand, J., and Delios A., 1996, Competing Globally: How Japanese MNCs Have Matched Goals and
Strategies in India and China, The Columbia Journal of World Business
Aoki K, and Lennenfors T. T., (2013), The New Improved Keiretsu, Harvard Business Review. Bassino, J, Jensen, P and Morini, M., (2018), The Evolution of Japanese Business Networks in ASEAN
Countries Since the 1960s, Complex Networks and their Applications, (Cherifi et al., eds). Springer
International Publishing. Chandler, A. D., Jr. (1962). Strategy and Structure: Chapters in The History of The American Industrial
Enterprise. Cambridge, Ma: MIT Press.
Chandler, A. D., Jr. (1977). The Visible Hand: The Managerial Revolution in American Business. Cambridge, Ma: Belknap Press.
Chandler, A. D., Jr. (1990a). Scale and Scope: The Dynamics of Industrial Capitalism Cambridge, Ma:
Belknap Press.
Colpan, A.M and Hikino, T (2010). “Foundations of Business Groups: Towards an Integrated Framework,” The Oxford Handbook of Business Groups, OUP
Dow, S, McGuire, J, Yoshikawa, T., (2011), Disaggregating the Group Effect: Vertical and Horizontal
Keiretsu in changing economic times, Asia Pacific Journal of Management 28. Giroud, Axele, MNEs in Asian Business Systems in The Oxford Handbook of Asian Business Systems,
OUP 2018.
Horn, S. and Cross, A., (2016), Japanese Production Networks in India: Spatial Distribution, Agglomeration
and Industry Effects, Asia Pacific Business Review, 22:4, 612-640. Japanese Multinationals in Asia, Dennis J. Encarnation (ed.), Oxford University Press, 1999.
Koike, R., (2004), Japan’s Foreign Direct Investment and Structural Changes in Japan and East Asia Trade,
IMES, Bank of Japan Kondo, Masanori (2012), Strategies for Japanese Companies in India, RIETI Discussion Paper Series 12-
E-064.
Lincoln, J. R., and Shimotani, M., (2010), Business Networks in Post-war Japan: Whither the Keiretsu? The Oxford Handbook of Business Groups, OUP
Matous, P and Yasuyuki, T, (2015), “Dissolve the Keiretsu or Die”: A longitudinal study of
disintermediation in the Japanese automobile manufacturing supply networks. RIETI discussion paper
15E039. Sarkar, J., (2010), Business Groups in India, The Oxford Handbook of Business Groups, OUP
Urata, S., (1993), Japanese Foreign Direct Investment and its Effect on Foreign Trade in Asia, NBER.
The Japanese Economy by David Flath, OUP 2014. The Japanese Economy by Mitsuro Taniuchi, gale Asia 2014.
Williamson, O. E. (1971). “The Vertical Integration of Production: Market Failure Considerations,”
American Economic Review, 61: 112–23. Williamson, O. E. (1985). The Economic Institutions of Capitalism. New York: Free Press.
Witt, Michael A. and Redding, G., (2014) Asian Business Systems: Implications and Perspectives for
Comparitive Business Systems and Varieties of Capitalism Research in The Oxford Handbook of Asian
Business Systems, OUP 2018 Witt, Michael A., (2014), Japan: Coordinated Capitalism Between Institutional Change and Structural
Inertia in The Oxford Handbook of Asian Business Systems, OUP 2018
Varma, S., Awasthy, R., Narain, K. and Nayyar, R., (2015), Cultural Determinants of alliance management capability-an analysis of Japanese MNCs in India, Asia Pacific Business Review, 21:3, 424-448.

36
List of Tables
Table 1 - Current Japanese Conglomerates ....................................................................................... 21
Table 2 - Indian Business Groups ....................................................................................................... 22
Table 3 - Institutional Characteristics of India and Japan ................................................................ 28
Related Documents


