Toll Free No. +44 203 8681 670 Assignment desk provides assignment help from professional UK writers. BUSINESS DECISION MAKING

Welcome message from author
This document is posted to help you gain knowledge. Please leave a comment to let me know what you think about it! Share it to your friends and learn new things together.
Transcript

Toll Free No. +44 203 8681 670
Assignment desk provides assignment help from professional UK writers.
BUSINESSDECISION MAKING

TABLE OF CONTENTSINTRODUCTION..........................................................................................................................1TASK 1...........................................................................................................................................21.1 Background.....................................................................................................................21.1 Rationale..........................................................................................................................31.1 Objectives of the research........................................................................................ 31.2 Methodology...................................................................................................................41.2 Data Analysis..................................................................................................................51.2 Time Frame.....................................................................................................................61.2 Budget section...............................................................................................................71.3 Questionnaire.................................................................................................................8
TASK 2........................................................................................................................................112.1 & 2.2 Mean, Mode and Median..............................................................................112.3 Range and Standard Deviation.............................................................................152.4 25th Percentile (Lower 25th Percentile (Lower Quartile) and 75thPercentile (Upper Quartile) and use of Percentile.................................................17
TASK 3........................................................................................................................................213.1 & 4.1 Produce line graph.........................................................................................21Scatter Plot on Advertising costs and sales.............................................................253.2 & 4.1 Trend Lines....................................................................................................... 273.3 Business presentation.............................................................................................. 293.4 Formal Business Report...........................................................................................29
TASK 4........................................................................................................................................324.2 Prepare a network diagram for activities using Microsoft Project...........32Calculate Project Duration..............................................................................................32Clearly mark the Critical Path....................................................................................... 33Prepare a Gantt chart and state the benefits of using it as a ProjectManagement Tool..............................................................................................................34
TASK 4 B....................................................................................................................................364.3 Calculation of Net present value and internal rate of return.................... 36Recommendations.............................................................................................................41
CONCLUSION............................................................................................................................42REFERENCE...............................................................................................................................43

Toll Free No. +44 203 8681 670
Assignment desk provides assignment help from professional UK writers.
INTRODUCTIONIn the present business environment, every business entity determines
various strategies in order to take different management decisions with anappropriate manner. The is because an efficient decision-making processensures the success of organization. By taking different strategic decisionswith an appropriate manner, management can improve operationalcapabilities and efficiency of business entity with reference to short and longterm business goals (Hofmann, 2007). In this process, managementexamines several factors that are having direct impact on outcomes ofbusiness decisions. It also supports management for selection of bestalternative from various options as per the distinct business requirement.The present report is carried out detail evaluation of different case studiesand business scenarios and develops appropriate strategies to generateappropriate outcomes. In this process, wide range of statistical tools andtechniques are applied for evaluation of distinct kind of data in order to takeappropriate decisions. In the context present study, this report also usesdifferent investment appraisal tactics through which an organization is ableto select best investment alternative for business expansion that wouldincrease profitability of company and reduces risk related to investment.

Toll Free No. +44 203 8681 670
Assignment desk provides assignment help from professional UK writers.
TASK 11.1 Background
As per the given, it is found that Government of UK is planning toinitiate a Crossrail Project through which the public authority of UK will beable to enhance the local transport connectivity within London. This projectwill increase transportation facilities so as citizen would get quick and highspeed mode of transportation. The primary objective of this project is to offercity transport facilities to more than 1.5 million. Furthermore, this projectprovides significant support to public authorities in the form of employment,leisure and other business operation. As per the case study, it is addressedthat the first cross-rail will be started from central London in late 2018 andwill carry more 200 million passenger annually. Furthermore, it will reducethe journey time across London with the help of a high speed and affordablemode of transportation. The project cross-rail will be beneficial of publicauthorities and local citizen because it will transform the rail transportationand increase the capacity of public transport by 10%. Therefore, it can bestated that success of the project is greatly depending on its timelycompletion so as government authorities have to develop various strategiesand need to take appropriate management decision in order to keep theproject on the right track.

Toll Free No. +44 203 8681 670
Assignment desk provides assignment help from professional UK writers.
1.1 RationaleThe primary objective this project is to enhance transportation services
to local citizen along with external so as people would get comfortable andquick transportation facilities. In addition to that this project will be foundvery effective in minimizing the road traffic through pollution level can becontrolled. It ensures safety of environment by lowering pollution level(Lucey, 2005). Furthermore, the investigator is focusing on assessment ofthe benefits of Crossrail project for the local community along with externalvisitor. Therefore, the present investigation is carried out to evaluate severalfactors of cross-rail project that assists researcher in facilitation ofappropriate and detail information about the benefits of the project ofgovernment officials and managers of public authorities.1.1 Objectives of the research
The primary objective of the present research is examining positiveaspect of the Cross Rail project for the local community of London. Inaddition to that the present research is scheduled to evaluate the budgetand time frame associated with cross-rail project. The three main objective ofthe present investigation are mentioned below:
To assess the positive outcomes of the project that would be assessedby general public.

Toll Free No. +44 203 8681 670
Assignment desk provides assignment help from professional UK writers.
To identify whether this project will provide significant benefits toeconomy of London.To evaluate the role of cross-rail project in completion of futuretransportation requirement.
1.2 MethodologyWith reference to present given scenario, investigator requires to
assess wide range of information to generate appropriate and accurateoutcomes therefore researcher is applying both primary and secondaryinformation associated with the Crossrail project that would assist public
This is a sample on BusinessDecision Making,
for complete Assignment writing Kindly,contact us at:

Toll Free No. +44 203 8681 670
Assignment desk provides assignment help from professional UK writers.
authority in order to take appropriate business decisions for attainmentproject goals. In this context, researcher has selected the random samplingapproach for selection of best sample through investigator would assessappropriate information for public authorities (Hacklin and Wallnöfer, 2012).For collection of first hand information, a sample of 50 local citizens will betaken by researcher who will be affected from cross-rail project. Firstly,qualitative techniques researcher will be found very effective to enhance theunderstanding about the perception of local people towards particularproject that would helps researcher for generating appropriate researchoutcomes as per the aim of present research. Along with this, usingquantitative techniques will be found very effective in evaluation of differentstatistics along with numerical data (Nicholson and Aman, 2012). In primarysection, people of London will be provided questionnaire for assessment ofthe perception of people about the project of cross-rail through which publicauthorities are able to take appropriate decision associated with the project.1.2 Data Analysis
In the present study, researcher will apply distinct tools for evaluationof data that have been gained from distinct sources. In this context, thematicand statistical approaches will be considered by researcher. However,thematic analysis will provide significant assistance in evaluation of the

Toll Free No. +44 203 8681 670
Assignment desk provides assignment help from professional UK writers.
subjective or qualitative that will be acquired in the form of primary data orthrough questionnaire (Wallnöfer and Hacklin, 2012). On the other hand,statistical approach will help investigation in order to interpret the numericalinformation associated with budget and cost of project along with its benefitsto public authorities1.2 Time FrameActivities/ durationin week
2 4 6 8 10 12 14 16
Analysing thesituations
Determination ofobjectives
Selection of anappropriateMethodology
Collecting qualitativeand quantitative data
Evaluation of data

Toll Free No. +44 203 8681 670
Assignment desk provides assignment help from professional UK writers.
Development of formalto report to presentdata
Estimation of thebudgets
Assessment of wholeproject and implementimprovement.
1.2 Budget sectionIt is considered as most important aspect of particular. The budget
section is determined the total expense that should be managed byresearcher for carrying out the research on Crossrail Project. However, theestimated cost of whole research is £2000 in which researcher will be ablemanage different operations of investigation.
Expenses Amount
Assessment of secondary data £500
Research collection from Primary £600

Toll Free No. +44 203 8681 670
Assignment desk provides assignment help from professional UK writers.
data
Stationary costs and researchsoftware cost
£700
Fuel Cost £120
Miscellaneous expenditure £80
Total £2000
1.3 QuestionnaireFor collection of primary data, researcher develops a questionnaire in
order to assess the perception of local people of community. Thequestionnaire for present investigation is mentioned below:Name:
1: Gender
Male
Female
2: Age Group :

Toll Free No. +44 203 8681 670
Assignment desk provides assignment help from professional UK writers.
16-20 years
21-25 years
26-30 years
31-35 years
35 and above
3: Do you have knowledge about the upcoming “Crossrail” project of thegovernment of UK?
Yes
No
4: According to you what is the most important benefit that would youassess from cross rail project?
Enhancing travel experience
Increase in connectivity of the public transportation
New experience of travelling around the capital
Reduction in load on existing transportation system
Toll Free No. +44 203 8681 670
Assignment desk provides assignment help from professional UK writers.
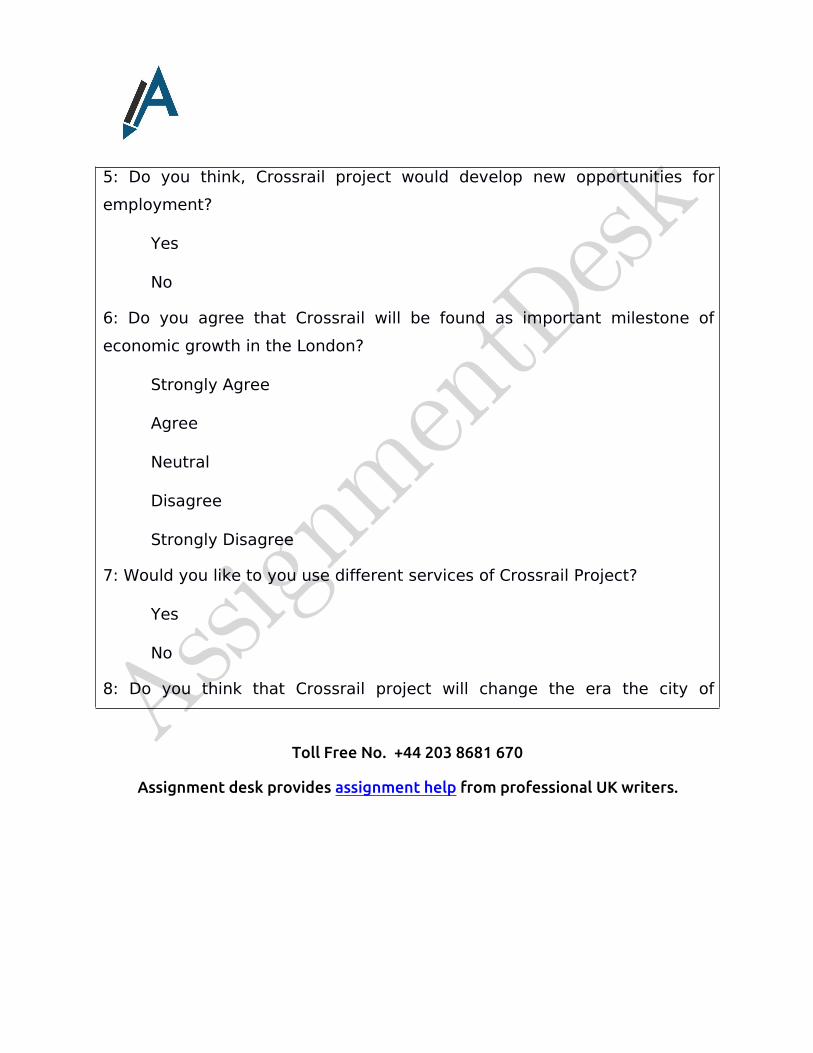
5: Do you think, Crossrail project would develop new opportunities foremployment?
Yes
No
6: Do you agree that Crossrail will be found as important milestone ofeconomic growth in the London?
Strongly Agree
Agree
Neutral
Disagree
Strongly Disagree
7: Would you like to you use different services of Crossrail Project?
Yes
No
8: Do you think that Crossrail project will change the era the city of

Toll Free No. +44 203 8681 670
Assignment desk provides assignment help from professional UK writers.
transportation?
Yes
No
9: Will cross-rail project reduce the pollution by lowering traffic?
Yes
No
Maybe
TASK 22.1 & 2.2 Mean, Mode and Median
Table 1: Descriptive Analysis
AmountSpent (£)
No. ofCustomers
(f)Mid-value
(x) FxCumulative
Frequency (CF)10-20 20 15 300 2020-30 22 25 550 4230-40 20 35 700 6240-50 14 45 630 76

Toll Free No. +44 203 8681 670
Assignment desk provides assignment help from professional UK writers.
50-60 16 55 880 9260-70 10 65 650 10270-80 8 75 600 11080-90 6 85 510 11690-100 4 95 380 120
120 5200
By using above descriptive analysis, store manager is able to takeappropriate decision regarding store promotion with the help of variouselements that play significant role in decision making process.
This is a sample on BusinessDecision Making,
for complete Assignment writing Kindly,contact us at:

Toll Free No. +44 203 8681 670
Assignment desk provides assignment help from professional UK writers.
Mean: This approach examines the sum of all numeric informationwhich has been collected from different sources as per the differentbusiness requirement. In the present study, the mean value is used toexamine the number of customers and their actual spending of cloths(Weygandt, Kimmel and Kieso, 2009). This information will supportowner of the Carmen clothing shop for taking wide range of businessdecision associated with the promotion and advertisement throughwhich profitability and sales of shop will be increased.
Mean = Total of Fx/ Total of number of customers
= 5200/120= 43.33
Mode: It is determined that number that consists maximum frequencywhile collection of different kind of data. In the present research, it hasbeen found that maximum number of customers is spending between£20 & £30 on clothes. This is because customer spending between £20& £30 has recorded highest frequency of 22 customers. Therefore,calculation of mode of present study is carried out below:

Toll Free No. +44 203 8681 670
Assignment desk provides assignment help from professional UK writers.
Mode = Lmo + (Δ1/ Δ1 + Δ2) * i
= 20 + (22-20) / (22-20) + (22-20)* 10= 25
Median: It is addressed as most important statistical time thatdetermines the middle value of the collected information (Platt andHuettel, 2008). The calculation of median for the present research iscarried out below:
Median = Lower limit + (60- CF of Previous Class Interval)/Frequency * Class interval
= 30 + (60-42)/20*10
= 30+18/20 *10
= 30+9
= 39

Toll Free No. +44 203 8681 670
Assignment desk provides assignment help from professional UK writers.
2.3 Range and Standard DeviationTable 2: Measure of Dispersion
Amount Spent(£)
No. ofcustomers(F)
Mid-value(X) X^2 Fx^2 Fx
10-20 20 15 225 4500 30020-30 22 25 625 13750 55030-40 20 35 1225 24500 70040-50 14 45 2025 28350 63050-60 16 55 3025 48400 88060-70 10 65 4225 42250 65070-80 8 75 5625 45000 60080-90 6 85 7225 43350 51090-100 4 95 9025 36100 380
120 495 33225286200 5200
Measurement of dispersion is termed as systematic process in veryeffective tool of data evaluation through which researcher examine how widespread the set of given data is in the defined variables. The process provides

Toll Free No. +44 203 8681 670
Assignment desk provides assignment help from professional UK writers.
significant support in evaluation of various facts and figures so asmanagement is able take different business decision as per the distinctbusiness requirement (Black, 2011). There are three major elements that areevaluated in measurement of dispersion that include Standard deviation,Range and variance. The evaluation of these factors is carried out below:
Standard Deviation: The term standard deviation provides significantassistance to researcher in order to assess the variation between givenset of information or among various variables (Kimmel, Weygandt andKieso, 2010). In the context of present investigation, standarddeviation helps owner of Carmen clothing shop for taking appropriatedecisions related to pricing of different product by checking whetherpricing stick below 40 price range or increase it above 40.
Variance = s2 = ∑Fx2 – ((∑Fx)2 /n)/ n – 1
Variance = 511.48
Standard Deviation = S= √s2
Standard Deviation = 22.61

Toll Free No. +44 203 8681 670
Assignment desk provides assignment help from professional UK writers.
Range: In the decision making process, range assists researcher incomputing the different between highest value and lowest value fromthe information which have been collected from different sources(Saaty, 2008). It also provides significant support in differentmanagement decisions.
Range = (100-(10/ (20+1))-(10/ (4+1)))
Range = 97.52
2.4 25th Percentile (Lower 25th Percentile (Lower Quartile) and 75thPercentile (Upper Quartile) and use of Percentile
Quartile:In general, quartile is addressed as most important statistical approach
which is applied in different management decision. It generates appropriatedata by dividing set of numbers into four different quarters as per therequirement of study which are denoted with: Q1, Q2, Q3, and Q4. The firstquartile (Q1) determines the data in the form of middle number which isoccurred between smallest number and the median of the predetermined setof data (Dew, Read, Sarasvathy and Wiltbank, 2009). On the other hand,

Toll Free No. +44 203 8681 670
Assignment desk provides assignment help from professional UK writers.
second quartile (Q2) is determined median of the data. In addition to thatthe third quartile (Q3) present the middle number which is occurred betweenhighest number and the median of particular set of data associated with acertain investigation.
Percentile:This statistical measure provides significant assistance to a decision
taker by defining the value which falls under a below with reference to aparticular set of percentage. For instance: 25th percentile determines 25portion of particular set of data.
This is a sample on BusinessDecision Making,
for complete Assignment writing Kindly,contact us at:

Toll Free No. +44 203 8681 670
Assignment desk provides assignment help from professional UK writers.
Lower quartile/25th percentile 24.5Upper quartile/75th percentile 58.8
Interquartile range:In general, inter-quartile range is used as a measure of variability
which is derived with reference to certain data that is divided into fourdifferent quarters. In other words, this term determine the variation betweenupper quartile and lower quartile. It plays important in decision makingprocess within an organization.Interquartile range 34.2
2.4 Calculating the correlation coefficient as per the additional informationprovided and discuss it advantages to a business
Sales (Units) Discounts (%)
20 1
40 4
50 6
55 6
60 10

Toll Free No. +44 203 8681 670
Assignment desk provides assignment help from professional UK writers.
70 12
80 13
90 14
100 15
The correlation coefficient of sales and discount are given below:
Table 3: Correlation and CoefficientParticular Sales (Units) Discounts
(%)
Sales (Units) 1 0.97
Discounts (%) 0.97 1
With reference to the formula R2 =0.97As per the above calculation of the correlation coefficient, there is
prefect correlation addressed between the sales and discounts variable.Therefore, it can be stated that if the sales of units is increased thendiscount rates are also increased in similar way and vice-verse. The value

Toll Free No. +44 203 8681 670
Assignment desk provides assignment help from professional UK writers.
coefficient of correlation is 0.97 that indicates that change in number ofsales units significantly influences rate of discount.TASK 33.1 & 4.1 Produce line graph
As per the present case, the Managing Director of Clothing Company isacquiring clothes from different countries in order to meet requirement ofconsumers with an appropriate manner. By satisfying client’s needs withdifferent kinds of clothes, company has gained loyalty of consumers Inregard to this, data of last 10 years associated with sales and advertisingcosts has evaluated to examine the growth in sales with reference toadvertisement expenditure.Line graph:

Toll Free No. +44 203 8681 670
Assignment desk provides assignment help from professional UK writers.
Illustration 1: Line graph
Pie Chart:

Toll Free No. +44 203 8681 670
Assignment desk provides assignment help from professional UK writers.
Bar Chart:
240
180160
140
130
Net income generated by 5 branches of company
LondonManchesterEdinburghCardif Liverpool
Illustration 2: Net Income Generated by 5 Branches of the company in2015

Toll Free No. +44 203 8681 670
Assignment desk provides assignment help from professional UK writers.
Advertising Costs and Sales Data of 2002 – 2015:
London Manchester Edinburgh Cardif Liverpool0
50
100
150
200
250
300
240
180160
140 130
Net income generated by 5 branches of company
Column B
Illustration 3: Bar Graph of Net Income Generated by 5 Branches of thecompany in 2015

Toll Free No. +44 203 8681 670
Assignment desk provides assignment help from professional UK writers.
Illustration 4: Advertising and Sales data 2000-2013
Scatter Plot on Advertising costs and sales

Toll Free No. +44 203 8681 670
Assignment desk provides assignment help from professional UK writers.
Illustration 5: Scatter Plot on Advertising costs and sales
As per the above charts and diagram, it is evaluated that the salesperformance of Clothing Company is showing positive trends and generatingattractive outcomes. There has been several factor identified that haveplayed important role in the success and growth of business. It includeschange in lifestyle of people, market trends and business environment thatare considered as key drivers of increased demand of the imported products

Toll Free No. +44 203 8681 670
Assignment desk provides assignment help from professional UK writers.
and services so as company acquires wide range of clothing products fromall over the world that leads positive impact on the sales and businessperformance of clothing company (Hacklin and Wallnöfer, 2012).Furthermore, it has found that advancement in marketing prospects alongwith the application of different kind of promotional tools have increased theadvertising related expenditures of business entity. In addition to that theuse of social media along with application of latest tools of digital advertisinghas influenced management of clothing company for investing the hugeamount of funds in marketing. This approach assists business entity toattract large number of audience that has led positive impact on the sales oforganization and increases marketing related expenditure.3.2 & 4.1 Trend LinesTrend lines of Advertising costs:

Toll Free No. +44 203 8681 670
Assignment desk provides assignment help from professional UK writers.
Illustration 6: Advertising costs
Trend line of Sales

Toll Free No. +44 203 8681 670
Assignment desk provides assignment help from professional UK writers.
Illustration 7: Sales
3.3 Business presentationEnclosed in PPT.
3.4 Formal Business ReportTo,The Board of Directors of Clothing CompanyDate: 7th January 2015

Toll Free No. +44 203 8681 670
Assignment desk provides assignment help from professional UK writers.
Subject: Information associated with last 10 years sales performance of thefirmINTRODUCTION
Clothing Company is making efforts to expand business associatedwith imported clothing products that are greatly attracting to people of UKand generating the demand of for company. In the process, managementrequires to take appropriate decision for business expansion. Therefore,this report carries out detail evaluation of sales data of the 5 differentbranches of clothing company. In addition to that evaluation of last 10 yearis carried out with the help of different graphs and charts.METHODOLOGY
For carrying out the present study with an appropriate manner,investigator has applied graphical presentation approach through whichinvestigator is able to present the information related to salesperformance with a systematic manner so as reader or evaluator of datacan easily access the information that have been presented in chart andbar diagram. Along with this, trend lines are also created to predict theadvertising cost and overall sales with in next five years that assistsmanagers for taking appropriate business decisions as per the long termgoals of company.

Toll Free No. +44 203 8681 670
Assignment desk provides assignment help from professional UK writers.
FINDINGSAs per the graphical presentation of sales and advertisement cost
data, it has been found that sales performance of clothing company isgrowing with an content rate due to high demand for imported clothingproducts among consumers of UK. With reference to pie chart, it hasaddressed that the London branch is termed as a most profitable branchbecause it is generating highest net income for the company. In addition tothat Manchester branch of Clothing company is also earning good profitwith the help of high sales volume. However, the assessment of the trendlines has determined that the sales performance of other branches such asLiverpool and Cardiff is also improving coming years because trend linesare showing positive trends.
CONCLUSIONAs per the above assessment, it can be stated that management of
company needs to develop various strategic plans and business strategiesin order to grab new business opportunities that would occur in near future.Apart from that, company is recommended to apply different kinds of

Toll Free No. +44 203 8681 670
Assignment desk provides assignment help from professional UK writers.
marketing tools and creative marketing tactics to increase aware ofdifferent clothing products among target consumers that would increasesales of business entity.
TASK 44.2 Prepare a network diagram for activities using Microsoft Project
Calculate Project DurationCritical Path: 1+2+4+5+6+7+11+12Critical Path duration: 4+3+10+4+6+9+12+20 = 72 days
Illustration 8: Network Diagram

Toll Free No. +44 203 8681 670
Assignment desk provides assignment help from professional UK writers.
Clearly mark the Critical Path
Task NameDuration
Start FinishPredecessors
Physical preparation 4 days 07/01/16 12/01/16 -Organisationalplanning
3 days 13/01/16 15/01/16A
Personal selection 15 days 13/01/16 02/02/16 AEquipmentinstallation
10 days 18/01/16 29/01/16B
Personnel training 4 days 01/02/16 04/02/16 DDetailed systemdesigning
6 days 05/02/16 04/02/16E
File conversion 9 days 15/02/16 25/02/16 FEstablishment ofstandards
2 days 13/02/16 04/02/16C
Programpreparation
10 days 18/01/16 29/01/16B
Program testing 9 days 01/02/16 11/02/16 DFinishingDocumentation
12 days 26/02/16 14/03/16G, H, I, J

Toll Free No. +44 203 8681 670
Assignment desk provides assignment help from professional UK writers.
Follow Up 20 days 15/03/16 11/04/16 K
Prepare a Gantt chart and state the benefits of using it as a ProjectManagement Tool
This is a sample on BusinessDecision Making,
for complete Assignment writing Kindly,contact us at:

Toll Free No. +44 203 8681 670
Assignment desk provides assignment help from professional UK writers.
Benefits of Project management tools:The application of the project management tool has provided
significant assistance to a project manager in the form of delegation thetasks and responsibilities with an appropriate manner, scheduling of differentactivities of the project, tracks the report of projects, ensuring the quality of
Illustration 9: Gantt chart

Toll Free No. +44 203 8681 670
Assignment desk provides assignment help from professional UK writers.
project outcomes, time management and etc (Albright, Winston and Zappe,2010). This increases the reliability and validity of the project.TASK 4 B4.3 Calculation of Net present value and internal rate of return
In the contemporary business environment, every organization has totake different management and investment decisions so as managementuses of kinds of investment appraisal approaches. It is a method which isused for analyzing the validity and suitability of an investment proposal(Milkman, Chugh and Bazerman, 2012). It supports management inevaluation of risk and return on investment. There are several techniques ofappraisals used by different companies such as NPV and IRR.

Toll Free No. +44 203 8681 670
Assignment desk provides assignment help from professional UK writers.
Net Present Value:NPV is termed as a most effective and quick tool for evaluating the
reliability and feasibility of different investment proposal through whichmanagement is able to select best alternative. In this process value of futurecash inflow is evaluated with reference to certain discount factor (Martin,2015). This tool plays important role in evaluation of time value of moneythrough which management is able to select most profitable proposal forcompany. Furthermore, higher value of NPV determines that particularproject is good for the investment.
Initial Investment: £200000 in both the ProjectsProject A @ 10%:
Table 4: Project A @ 10%Project A
Year Cash flows PV factor @10% Amount
1 55000 0.909 49995
2 67000 0.826 55342

Toll Free No. +44 203 8681 670
Assignment desk provides assignment help from professional UK writers.
3 72000 0.751 54072
4 80000 0.683 54640
5 90000 0.621 55890
Total 269939
Less: Initial Investment 200000
NPV 69939
Project A @ 20%:Table 5: Project A @ 20%
Project A
Year Cash flows PV factor @20% Amount
1 55000 0.833 45815
2 67000 0.694 46498
3 72000 0.579 41688
4 80000 0.482 38560

Toll Free No. +44 203 8681 670
Assignment desk provides assignment help from professional UK writers.
5 90000 0.402 36180
Total 208741
Less: Initial Investment 200000
NPV 8741
Project B @ 10%:Table 6: Project B @ 10%
Project B
Year Cash flows PV factor @10% Amount
1 42000 0.909 38178
2 75000 0.826 61950
3 82000 0.751 61582
4 63000 0.683 43029
5 35000 0.621 21735
Total 226474
Less: Initial Investment 200000

Toll Free No. +44 203 8681 670
Assignment desk provides assignment help from professional UK writers.
NPV 26474
Project B @ 20%:Table 7: Project B @ 20%
Project B
Year Cash flows PV factor @ 20% Amount
1 42000 0.833 34986
2 75000 0.694 52050
3 82000 0.579 47478
4 63000 0.482 30366
5 35000 0.402 14070
Total 178950
Less: Initial Investment 200000
NPV -21050
Internal rate of return:

Toll Free No. +44 203 8681 670
Assignment desk provides assignment help from professional UK writers.
The approach has found very effective in order to check the feasibilityof an investment proposal. It also evaluates the time value of money so asmanagers within particular organization can generate good return fromparticular investment proposal (Albright, Winston and Zappe, 2010). In thisprocess, IRR has found very effective in evaluation of the potential profit ofthe investment in terms of percentage. Following is computation of IRR forthe present projects:
Internal rate ofreturn
= lower discount rate + NPV at lower discountrate/ NPV at lower rate - NPV at higher rate*(Higher discount rate – discount rate)
Project A = 0.10+69939/ (69939-8741)*(0.20-0.10)= 21.42%
Project B = 0.10 + 26474/ (26474-(-21050) * (0.20-0.10)
= 15.57%
RecommendationsBy considering the above computation of investment appraisal
techniques, researcher has been found that Project A is beneficial for

Toll Free No. +44 203 8681 670
Assignment desk provides assignment help from professional UK writers.
company. This is because NPV of project A is 69939 which are higher thanthe Project B that is 26474. Therefore, on the basis of 10% discount factormanagement should have to invest in Project A. This is because the Project Ais generating more returns. In addition to that the internal rate of return is ofProject A is also higher as compared to NPV of the project B. Thus, it issuggested to business entity needs to invest funds in the Project A forgenerating greater returns. It will increase profitability of business andprovides good returns to firm.CONCLUSION
As per the above evaluation, it can be concluded that businessdecision making is identified as a most crucial aspect of businessmanagement which is having significant impact on the growth andprofitability of business entity. This study has found that an organization canincrease effectiveness of business decisions with the help of variousstatistical tools associated with descriptive statistics through management isable to evaluate different aspect and data such as sales performance andcost of different operations. This report has found that profitability ofbusiness entity during investment decisions is greatly influenced bymanagement decisions associated with selection of an appropriateinvestment appraisal tactics such as NPV and IRR.

Toll Free No. +44 203 8681 670
Assignment desk provides assignment help from professional UK writers.
REFERENCE● Albright, S.C.W.C., Winston, W. and Zappe, C., 2010. Data analysis and
decision making. Cengage Learning.● Black, K., 2011. Business statistics: for contemporary decision making.
John Wiley & Sons.● Dew, N., Read, S., Sarasvathy, S.D. and Wiltbank, R., 2009. Effectual
versus predictive logics in entrepreneurial decision-making: Differencesbetween experts and novices. Journal of business venturing.
● Hacklin, F. and Wallnöfer, M., 2012. Management Decision .The businessmodel in the practice of strategic decision making: insights from a casestudy.
● Hacklin, F. and Wallnöfer, M., 2012. The business model in the practice ofstrategic decision making: insights from a case study. ManagementDecision.
This is a sample on BusinessDecision Making,
for complete Assignment writing Kindly,contact us at:
Related Documents