A REFEREED JOURNAL OF SHRI RAM COLLEGE OF COMMERCE ANALYST BUSINESS Volume 35 Issue 1 ISSN 0973-211X April - September 2014 Construction of a Composite Index: Methodological Issues in Measuring Asian Financial Crisis K.V. BHANU MURTHY AND ANJALA KALSIE Short-Term Impact Of M&A on Shareholders' Returns: A Study Of Corporate Acquirer Firms in India ANSHU AGRAWAL, P.K. JAIN AND SUSHIL Financial Inclusion in India: Retrospect and Prospects RITURANJAN Role of Corporate Income Tax in India's Tax System VED PARKASH Limitations of Current Financial Reporting: A Case for Integrated Reporting POOJA DHINGRA, AJAY KUMAR SINGH AND GAURAV MAGU Management of External Debt in India SWAMI P SAXENA AND ISHAN SHANKER Measuring SME's Satisfaction With Export Credit Delivery System in Punjab: A Scale Development Approach MANPREET KAUR AND FULBAG SINGH Colours in Logos: A Study of Consumers' Perception of Colour and Brand Personality Associations GARIMA GUPTA, VIRAJ RAJPUT AND ADITYA JOSEPH JAMES

Welcome message from author
This document is posted to help you gain knowledge. Please leave a comment to let me know what you think about it! Share it to your friends and learn new things together.
Transcript
A REFEREED JOURNAL OF SHRI RAM COLLEGE OF COMMERCE
ANALYSTBUSINESS
Volume 35 Issue 1 ISSN 0973-211XApril - September 2014
Construction of a Composite Index: Methodological Issues in Measuring Asian Financial CrisisK.V. BHANU MURTHY AND ANJALA KALSIE
Short-Term Impact Of M&A on Shareholders' Returns: A Study Of Corporate Acquirer Firms in IndiaANSHU AGRAWAL, P.K. JAIN AND SUSHIL
Financial Inclusion in India: Retrospect and ProspectsRITURANJAN
Role of Corporate Income Tax in India's Tax SystemVED PARKASH
Limitations of Current Financial Reporting: A Case for Integrated ReportingPOOJA DHINGRA, AJAY KUMAR SINGH AND GAURAV MAGU
Management of External Debt in IndiaSWAMI P SAXENA AND ISHAN SHANKER
Measuring SME's Satisfaction With Export Credit Delivery System in Punjab: A Scale Development ApproachMANPREET KAUR AND FULBAG SINGH
Colours in Logos: A Study of Consumers' Perception of Colour and Brand Personality AssociationsGARIMA GUPTA, VIRAJ RAJPUT AND ADITYA JOSEPH JAMES
BUSINESS ANALYSTA REFEREED JOURNAL OF SHRI RAM COLLEGE OF COMMERCE
Volume 35 Issue 1 April - September, 2014 ISSN 0973-211X
* In alphabetical order
PATRONAjay S. ShriramChairman, Governing Body
PRINCIPAL (Acting)Ashok Sehgal
EDITORDeepashree
ASSOCIATE EDITORSSuman BhakriRachna JawaSantosh SabharwalKuljeet KaurAbhay Jain
REVIEW PANEL*
Altaf Khan Professor of Commerce. Former Head and Chairman, Department of Commerce and Business Studies, Jamia Millia Islamia, Delhi
Anupama Associate Professor, Faculty of Management Studies, University of DelhiArup Mitra Professor, Institute of Economic Growth, University of DelhiC.P. Gupta Professor, Department of Financial Studies, South Delhi Campus, University of DelhiDharmakriti Joshi Chief Economist, CRISIL Ltd.I.M. Pandey Director General, Delhi School of Business, Vivekananda Institute of Professional
Studies K. Ramesha Professor, National Institute of Bank ManagementL.C. Gupta Former Professor, Delhi School of Economics. Director, Society for Capital Market
Research and DevelopmentLallan Prasad Former Professor, Head and Dean, Department of Business Economics, South Delhi
Campus, University of Delhi.M.Damodaran Former Chairman, SEBI, UTI and IDBIMadhu Vij Professor, Faculty of Management Studies, University of DelhiMala Sinha Associate Professor, Faculty of Management Studies, University of DelhiNawal Kishore Professor, IGNOU, DelhiP.K. Jain Professor, Department of Management Studies, IIT, DelhiRamesh Chand Director, National Centre for Agriculture Economics and Policy ResearchSugan C Jain Former Professor and Head, Department of Accountancy and Business Statistics,
University of Rajasthan, Jaipur. Vice President, Rajasthan Chamber of Commerce and Industry
Suresh Aggarwal Professor and Head, Department of Business Economics, South Delhi Campus, University of Delhi
Business Analyst is an academic journal of India's pioneering institution Shri Ram College of Commerce. The journal endeavors to disseminate knowledge in the area of business, economics and management. It aims at promoting research in these areas and encourages empirical and inductive writings. It is catalogued in the 'Library of Congress',Washington, D.C.
Business Analyst is a refereed and reviewed journal, published twice a year in the months of March and September and is listed in Ulrich's International Periodicals Directory.
All correspondence relating to publication of the journal should be addressed to :
The EditorBusiness Analyst
Shri Ram College of CommerceUniversity of Delhi, Maurice Nagar
Delhi - 110 007Email: [email protected]
Phone: 11 - 27667905 Editor: 9811336466 Fax: 11 - 27666510

BUSINESS ANALYSTA REFEREED JOURNAL OF SHRI RAM COLLEGE OF COMMERCE
Volume 35 Issue 1 April - September 2014 ISSN 0973-211X
CONTENTSARTICLES
Construction of a Composite Index: Methodological Issues in Measuring Asian Financial CrisisK.V. Bhanu Murthy and Anjala Kalsie................................................................................................1
Short-Term Impact of M&A on Shareholders' Returns: A Study of Corporate Acquirer Firms in IndiaAnshu Agrawal, P.K. Jain and Sushil................................................................................................31
Financial Inclusion in India: Retrospect and ProspectsRituranjan..........................................................................................................................................61
Role of Corporate Income Tax in India's Tax SystemVed Parkash.......................................................................................................................................73
Limitations of Current Financial Reporting: A Case for Integrated ReportingPooja Dhingra , Ajay Kumar Singh and Gaurav Magu.....................................................................85
Management of External Debt in IndiaSwami P Saxena and Ishan Shanker................................................................................................111
Measuring SME's Satisfaction With Export Credit Delivery System in Punjab: A Scale Development ApproachManpreet Kaur and Fulbag Singh...................................................................................................123
Colours in Logos: A Study of Consumers' Perception of Colour and Brand Personality AssociationsGarima Gupta , Viraj Rajput and Aditya Joseph James
Spiritual CapitalA. J. C. Bose
..................................................................141
Book Review
....................................................................................................................................155

Format / Style
1. Paper should be submitted in duplicate with the declaration that the paper has not been published or submitted for publication elsewhere. It is to be typed on A4 size paper and double spaced. The length of the paper normally should not exceed 15-20 pages with running text font size 12 of Times New Roman.
2. The soft copy of the manuscript is to be sent in a CD and through email at [email protected] version is required to be in MS-Word-2003. Paper without a soft copy shall not be accepted.
3. Format of the article on the front page should be:
i) Title,
ii) Name(s) of the contributor(s),
iii) Abstract, and iv) Introduction.
4. The designation of the author(s) should be mentioned in footnote style on the first page of the article.
Executive Summary/Abstract
It should capture the essence of the article and entice the reader. Abstract should typically be of 100-200 words. It should be in italics.
Endnotes
Endnotes should be serially arranged at the end of the article well before the references and after conclusion.
Table / Figures
The first letter of the caption for table, figure and graph should be in capital letter and the other words to be in small letter, e.g. Table 1
References
The contributors are advised to follow Harvard system of citing the in-text references. References actually citied should be placed immediately after endnotes in accordance with the following examples:
Bhagwati, Jagdish. 1995. “U.S. trade police: The Infatuation with Free Trade Areas.” In The Dangerous Drift to Preferential Trade Agreements, ed. Jagdish Bhagwati and Anne O. Krueger. Washington, DC.
Bhagwati, Jagdish, and T.N. Srinivasan. 2002. “Trade and Poverty in the Poor Countries” American Economic Review 92(2), 180-3.
International Monetary Fund. 1998.World Economic Outlook, Financial Crisis: Causes and Indicators, Washington, DC.
Book Review
Book Review must provide the following information: name of the author, title of the book, place of publication, year of publication, name of the publisher, number of pages (Roman and Arabic figure to include preliminary pages), and price with binding specification (soft or hard).
Vol. 35 No. 1
1Department of Commerce, Delhi School of Economics, University of Delhi, 110007
2Faculty of Management Studies, University of Delhi, Delhi 110007
CONSTRUCTION OF A COMPOSITE INDEX:
METHODOLOGICAL ISSUES IN MEASURING ASIAN
FINANCIAL CRISIS
1 2K.V. Bhanu Murthy and Anjala Kalsie
This study is about the A5 (Indonesia, South Korea, Malaysia, Thailand and
Philippines) countries during the Asian Financial Crisis of 1997. A financial crisis is a
wide spread episode measured through a conglomerate of many factors. The attempt to
explain such a complex phenomenon in terms of a single (variable) indicator would be
partial and simplistic. Moreover, these variables tend to be correlated and they possess
common information.
This paper has developed a methodology for the construction of a composite index that
captures crisis. The composite index that is based on a large number of variables,
involves a three stage procedure, through Granger causality, correlation and Principal
Component Analysis.
Key words: Currency Crisis, Financial Crisis, Causality Test, Principal Component
Analysis, Correlation and Composite Index.
INTRODUCTION
The decade of the 1990s was certainly marked by a rather unusual number of financial
and economic crises such as the Mexican Peso Crisis of 1994-95, the Asian Crisis of
1997. While the different types of crises could range from the “garden variety” currency
crises to rather esoteric real estate bubbles, studies of such crises exhibit empirical and
theoretical commonalties. The literature distinguishes three varieties of financial crises:
currency crises, banking crises, and debt crises. The analysis in this study is primarily
focused on currency crises.
1
BUSINESS ANALYST April - September 2014
1Our task at hand is to analyze and measures the financial crisis in the A5 countries
during 1997. A financial crisis is often characterized by an episode of intense foreign
exchange market pressure. This phenomenon is known as a currency crisis and can be
defined simply as an episode in which a country experiences a substantial nominal
devaluation or depreciation. This criterion, however, would exclude instances where a
currency came under severe pressure but the authorities successfully defended it, by
intervening heavily in the foreign exchange market, by raising interest rates sharply, or
by both. Extant approaches have sometimes constructed an index of speculative market
pressures [Kaminsky, Reinhart and Lizondo (1998), Edison (2000), Goldstein,
Kaminsky and Reinhart (2000)].
The indices that have been developed in the earlier studies suffer from three problems:
21. Conceptually they include only exchange related variables and not other relevant
variables that are crucial for international trade and international finance.
2. The extant studies do not use a causal framework as a methodology for the selection
of variable.
3. Empirically they do not use more evolved statistical tools such as Principal
Component Analysis for constructing a composite index.
Our paper is a part of larger study that looks into a new approach to measure and analyze
international financial crisis. A crucial part of the study is to develop a new composite
Index of Crisis. This index is based on a large number of variables and involves a three
stage procedure which shall be discussed later.
The study consist of twelve sections section 1 talks about introduction, section 2 about
rationale, section 3 about conceptual issues, section 4 about methodology, section 5 talks
about causality test, section 6 about correlation matrix, section 7 principal component
analysis, section 8 composite index, section 9 result and analysis, section 10 analysis of
index of crises, section 11 about graphical interpretation and finally section 12 contains
conclusion.
2
1Malaysia, Philippines, Korea, Thailand and Indonesia.
2Weighted average of ER changes, Weighted average of RER changes, Reserves changes and Interest rate
changes.
RATIONALE
An attempt to explain a wide spread and complex phenomenon in terms of a single
dependent variable would be incomplete and partial, where dependent variables which
represents the crisis is itself a conglomerate of many factors. Since it is a complex
phenomenon it cannot be represented by one single variable. Moreover, these variables
tend to be correlated. Thus, the ordinary regression framework results in the problem of
mulicollinearity. Therefore an essential methodology is to measures the phenomenon of
the crisis with the help of composite indices, which would adequately represent the
complex phenomenon. This applies to both the cause and the effects of a crisis.
Among an array of factors which are quoted by different studies, as being related to crisis
we would like to conduct a causality test to determine which of these factors causes are
and which are the effects. In the further part of our larger study we have constructed
indices for both causal variables and impacted variables so as to relate them in a
regression framework, after having addressed the problem of multicollinearity.
However for the present paper we concentrate on the index of the impacted variable,
namely, the index of crises.
The final selection of variables is done on the basis of an elaborate procedure, which
ensures that the variables which are entering in the construction of the index of crisis are
the variables that are theoretically relevant, as they are drawn from extant studies and
empirically sound as they are tested for causality. In addition they are appropriate
because they have been checked for data redundancy.
CONCEPTUAL ISSUES
Prior Procedure
Several steps were undertaken as a part of the larger study to ensure the above
considerations:
31. A literature survey of empirical and conceptual studies was undertaken . On the
basis of a literature survey we had arrived at a data set consisting of a large number
of crises variables (30 variables including financial and macroeconomic variables).
3
3Moreno (1995) , Berg and Pattillo (1999) and Frankal and Rose (1996)
METHODOLOGICAL ISSUES IN MEASURING ASIAN FINANCIAL CRISISVol. 35 No. 1
4 BUSINESS ANALYST
2. We checked for data redundancy amongst a set of available variables. By data
redundancy we mean that many of the define variables in the data set are different
version of the same variable. We have used our judgment to retain some version
while dropping the other versions. For instance, which variables have been defined
in PPP $ or US $ or LCU, we have chosen only one of them.
3. A correlation exercise was carried out on these 30 variables. The purpose of this 4
exercise was to establish that crisis variables are ordinarily correlated .
4. We also undertook a dummy variables exercise wherein the data series for 6
countries for each of the 30 variables were tested to see whether there was any 5
structural break at 1997-98 , which is the crises window in the Asian financial crisis.
5. However the prior correlation analysis and dummy variable exercise did not tells us
any thing about the causality amongst the variables. The dummy variable exercise
is a univariate analysis that does not capture the complexity of the phenomenon.
Measurement of Crisis
After having undertaken the above empirical steps we proceeded with the measurement
of crisis. There are two parts of our methodology for the measurement of crises. In the
first part, which is the core of this paper we have developed, constructed and measured
the index of crises. In the second part this index has been used to model crises and predict 6
it. The second part of our measurement is not dealt with in this paper . However, there is a
relevant link between the two parts the index of crises that is being developed in this
paper is also the dependent variable in the modeling and prediction of the crises. It is
necessary to clarify the link between these two aspects. In the following discussion we
are therefore looking at some aspects of the regression framework and the crises
definition.
4The result of correlation exercise is not reported.
5In the dummy variable exercise the crises window is taken as 1997-98. The crises develop in November
1997 and it peaked in 1998, in many countries. Therefore, neither can 1997 nor can 1998 be ignored. This is
vindicated by the dummy variable exercise which shows a significant structural break across variables
during this crises window. The result of dummy variable exercise has not been reported.6
Malik (2008) 'Measurement and Analysis of International Currency Crises: Lesson for India.',
unpublished Phd. Thesis, University of Delhi.
April - September 2014
5
Crisis Definition
In certain other studies the crisis variables themselves have been defined in discrete 7
terms . Therefore, their understanding is that the dependent variable has a built-in
discrete change or kink. It should not be forgotten that the dependent variable is an effect
and not a cause. Our own understanding is that whatever change comes in the dependent
variable is not on its own account but on account of the causal variables. This includes
changes in the intercept, because the intercept also contributes towards the explanatory
power of the equation. In extant literature the distinction between discrete and
continuous crisis definitions has been captured only through having either a discrete or
continuous dependent variable. In a causal framework the mechanism to capture
discrete change has to necessarily rest upon the causal variables and not the dependent
variables. Accordingly, our methodology imputes to discrete change during crises to the
indicators of crisis and this would necessarily come from the causal variables. Our
methodology, hence, been tailored in such a manner that it does not pre-suppose the
nature of dependent variable that represent crises as being discrete. On the other hand the
explanatory variables are so endowed that they are capable of inducing discrete change
in the indicator of crises.
Our methodology is that the discrete definition has to be captured and measured in and
through the independent variable and not through the dependent variable. Essentially,
the understanding is that certain continuous changes can be captured through the causal
variables, which lead up to the crises. Our understanding is that this continuous change is
manifest in the volatility of the crises variables. In effect it implies that those countries
which were crises ridden had experienced a continuous trend of volatility to the extent,
that this built up continuously to discrete change resulting in a crises.
The merit in using a continuous crisis definition lies in its ability to capture both the
continuous influence on the crises variable (dependent variable) as well as its ability to
explain discrete change which is occurring in the crises variables during crises, due to
the causal variable.
Crises window
The crises window is taken as 1997-98. The crises develop in November 1997 and it
peaked in 1998, in many countries. Therefore, neither can 1997 nor can 1998 be ignored.
7Eliasson, Ann-Charlotte and Krevter, Christof (2000).
METHODOLOGICAL ISSUES IN MEASURING ASIAN FINANCIAL CRISISVol. 35 No. 1
6 BUSINESS ANALYST
This is vindicated by the dummy variable exercise which shows a significant structural
break across variables during this crises window. Some of the extant study have used
monthly data and define the crises window in terms of particular months. In our case we
were using annual data, therefore, it is not possible to have a crises window that
pinpoints the precise period of crises, nor are we interested in the process of the crises.
Therefore, our crises window is defined in annual terms.
Relevance of Control
An important issue of research design was the introduction of a control. It was noted that
in the case of India none of the relevant variables showed any statistically significant 8
change during the crises period . On this basis we established India as the control or as a
benchmark.
In the case of extant studies with a discrete crises definition the control was established
with reference to the pre-crises period since a control is meant to represent a normal
period or normal observation. In the present study by 'control' we mean a 'benchmark
country' that was not affected by the crises. For identifying the control we have used the
dummy variables exercise, wherein we found that in the case of India none of the
relevant variables (relevant variables means those variables which are identified
through literature review) were affected by the crises therefore we chose India as a
control. In other words none of the variables have shown any structural break in India,
during the crisis period 1997-98. Such an approach has the advantage of allowing both
inter-temporal as well as international comparisons. The extant studies permit only 9
inter-temporal comparisons .
Since India was established as a control it is reasonable to examine that all the relevant
variables would display a normal behavior in terms of cause and effect. Hence, the
causality tests were applied to the relevant variables in the case of India only. Often,
during crisis the co-variances get exaggerated. Therefore, the causality test must be
conducted on a 'normal country'. This is not possible if the comparisons are only inter-
temporal.
8Through the dummy variables exercise (not reported).
9Moreno (1995) and Kaminsky, Reinhart, Lizondo (1998)
April - September 2014
7
METHODOLOGY
To account for such a conception of the phenomenon of crises and causes of the
phenomenon, we felt the need for evolving an appropriate methodology. The two most
desirable feature of the methodology are that: firstly, it should capture the volatility or
variance in the relevant variables, because we believe that it is this volatility that leads up
to and results in crisis; secondly, it should also work with a large number of related
variables because a crisis according to our understanding is a complex phenomena
resulting from a large number of inter correlated variables.
The third dimension of methodology is that given the constraints of the data points and
degrees of freedom, the methodology should allow working with a parsimonious set of
variable. The statistical technique which possesses all these features is a PCA (Principal
Component Analysis). Unlike OLS wherein the procedure is to minimize the sum of the
squares of deviations in the case of PCA the procedure is to maximize the variance.
Second feature of PCA is that it segregates inter correlated variables in to the separate
orthogonal factors or Principal Components. Thirdly PCA can be used for developing a
composite index which collapses a set of variables into a single variable that represents a
complex phenomenon like financial crises.
Procedure of estimation
Our empirical procedure involves five distinct steps:
1. Granger causality test was applied to the data on India in respect of all the relevant
variables to find out which the causal variables are and which the impacted
variables are. The causality tests were carried out in the case of India, since it was the
control.
2. From step 1 the variables were separated into dependent, independent and common
variables. Through correlation we have found that a set of common variables were
correlated with the purely dependent variables. These would have similar
information.
3. Due the presence of a large number of correlated dependent variables we have
undertaken the next step in the procedure, that is, the application of Principal
Component Analysis, which helps in (i) data reduction and (ii) making the
dependent variables uncorrelated with other.
4. The next step was the formation of a composite index. The Composite index helps
METHODOLOGICAL ISSUES IN MEASURING ASIAN FINANCIAL CRISISVol. 35 No. 1
8 BUSINESS ANALYST
in representing the crises phenomenon where the crises phenomenon is manifest in
a large number of variables. This is the unique feature of our study.
CAUSALITY TEST
For developing a causal framework it is therefore essential to adopt a procedure by
which causal variables can be distinguish from impacted variables. Once the set of crises
variables have been sorted through this procedure it would be possible to develop an
index of crisis.
In the true spirit causality test tells us about the precedence of one variable over the other
it is therefore sometimes cautioned that the result of such tests may not be interpreted as
cause and effect relationship. Here, we would like to point out that in the present study
we are not depending on the Granger Causality Test; after using the test and after sorting
the variables as causal and impacted variables we use a structured causal framework
with the appropriate regression technique for establishing cause and effect. At present, it
was necessary to differentiate between the causal and impacted variables. This
necessitated the testing of causality among the relevant variables.
Granger Causality Test: For carrying out the granger causality test the following two
equations were tested the joint hypothesis for all the variables:
Ho: X does not cause Y.
Ho: Y does not cause X.
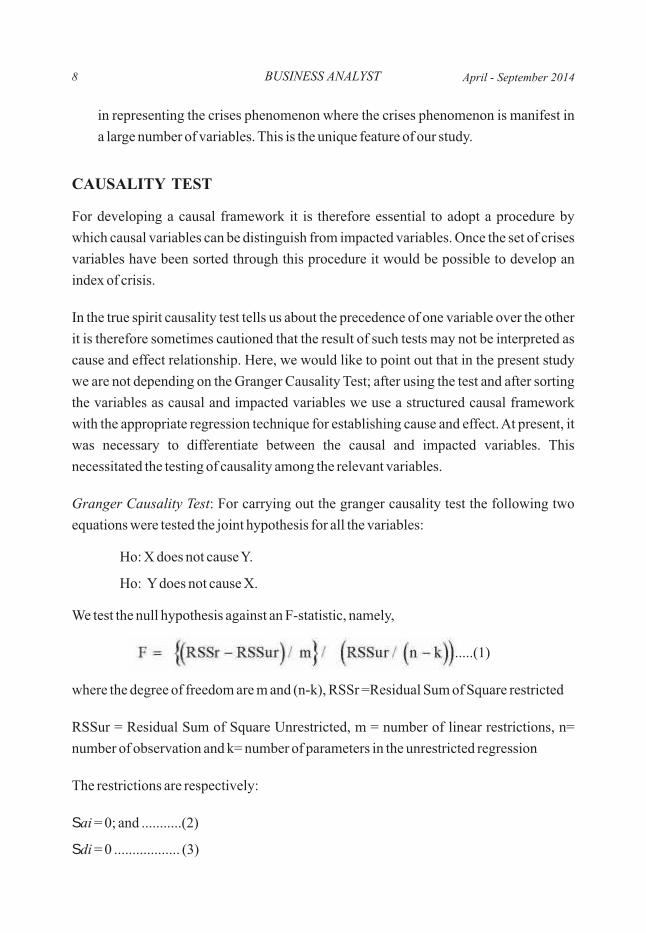
We test the null hypothesis against an F-statistic, namely,
.....(1)
where the degree of freedom are m and (n-k), RSSr =Residual Sum of Square restricted
RSSur = Residual Sum of Square Unrestricted, m = number of linear restrictions, n=
number of observation and k= number of parameters in the unrestricted regression
The restrictions are respectively:
Sai = 0; and ...........(2)
Sdi = 0 .................. (3)
April - September 2014
9
while test of causality is carried out through the following equation:
Yt = S ai Xt - i + S bi Yt - i + u1t ..................(4)
Xt = S ci Xt - i + S di Yt - i + u2t ..................(5)
i = 1, 2
It was also ensured that there was no two way causality among the relevant variables. As
a consequence of the causality test three sets of variables could be identified: (i) pure
causal variable (ii) pure impacted variable (iii) common variables which alternatively
appeared as causal and impacted variables although not as two way causality.
CORRELATION MATRIX
Through the causality test, it was found that there were some variables which were
common, that is, they were both impacted as well as causal variables, and thus making it
difficult to decide which variables is to be selected for constructing an index of crisis. To
solve this problem correlation matrix was used.
There are two objectives of studying the correlation matrix:
1. To segregate the set of dependent and independent variable.
2. To identify a set of crisis variables.
There were certain problems in the selection of variables as dependent and independent
variable. To meet these problems the following steps were undertaken:
1. Firstly, on bilateral basis, it was ensured that none of the variables were considered
for the modeling that had 'bi-way causality'. This precaution was taken so that
causal and impacted variable does not have a problem of one to one endogeneity.
2. Secondly, despite this that there was a set a variable that appear both as a causal and
impacted variables these have been labeled as common variables. The first
objective of studying the correlation matrix was to study this problem. Therefore,
the criteria used for selection of crisis variables was; that amongst the set of
common variables those variables which were correlated with the pure dependent
variable, were treated as dependent variables (or LHS variables) - that would go into
the formation of the Index of Crisis.
METHODOLOGICAL ISSUES IN MEASURING ASIAN FINANCIAL CRISISVol. 35 No. 1
10 BUSINESS ANALYST
PRINCIPAL COMPONENT ANALYSIS
Principal Components Analysis (henceforth PCA) is based on a linear transformation of
the variables so that they are orthogonal to each other; hence, no information contained
in the points in the event space is lost. The normality assumption is not essential in PCA
and with such a dispersed set of outcomes. PCA is ideally suited because it maximizes
the variance rather than minimizing the least square distance. Since we want to develop a
composite 'Index of Crisis' and relate it to two other indices of financial variables and
macro variables, we need to choose the essential variables and arrive at relative weights
for the purpose of consolidating these variables into a single index. This is facilitated by
PCA.
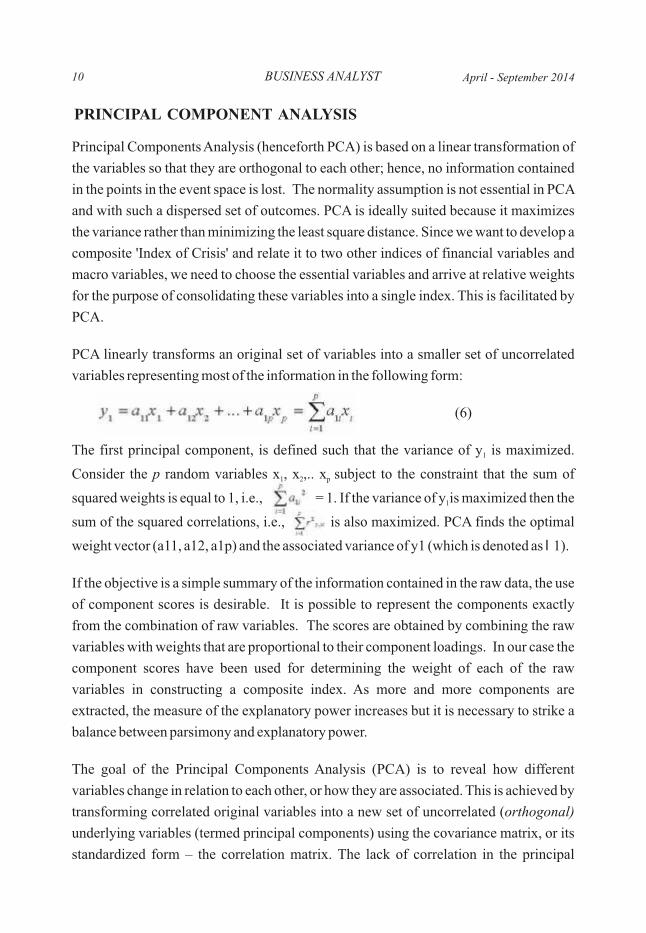
PCA linearly transforms an original set of variables into a smaller set of uncorrelated
variables representing most of the information in the following form:
(6)
The first principal component, is defined such that the variance of y is maximized. 1
Consider the p random variables x , x ,.. x subject to the constraint that the sum of 1 2 p
squared weights is equal to 1, i.e., = 1. If the variance of y is maximized then the 1
sum of the squared correlations, i.e., is also maximized. PCA finds the optimal
weight vector (a11, a12, a1p) and the associated variance of y1 (which is denoted as l1).
If the objective is a simple summary of the information contained in the raw data, the use
of component scores is desirable. It is possible to represent the components exactly
from the combination of raw variables. The scores are obtained by combining the raw
variables with weights that are proportional to their component loadings. In our case the
component scores have been used for determining the weight of each of the raw
variables in constructing a composite index. As more and more components are
extracted, the measure of the explanatory power increases but it is necessary to strike a
balance between parsimony and explanatory power.
The goal of the Principal Components Analysis (PCA) is to reveal how different
variables change in relation to each other, or how they are associated. This is achieved by
transforming correlated original variables into a new set of uncorrelated (orthogonal)
underlying variables (termed principal components) using the covariance matrix, or its
standardized form – the correlation matrix. The lack of correlation in the principal
April - September 2014
11
components is a useful property because it means that the principal components are
measuring different “statistical dimensions” in the data. The new variables are linear
combinations of the original ones and are sorted into descending order according to the
amount of variance that they account for in the original set of variables. Each new
variable accounts for as much of the remaining total variance of the original data as
possible. Cumulatively, all the new variables account for 100% of the variation. PCA
involves calculating the Eigen values and their corresponding eigenvectors of the
covariance matrix or correlation matrix. Each Eigen value represents the total remaining
variance that the corresponding new variable accounts for. The expectation from
conducting PCA is that correlations among original variables are large enough so that
the first few new variables or principal components account for most of the variance. If
this holds, no essential insight is lost by further analysis or decision making, and
parsimony and clarity in the structure of the relationships are achieved. Each factor is a
combination of variables which are correlated with the principal component.
This methodology has two purposes. Firstly, we have seen that both macro and financial
variables were correlated. Under such circumstance it is not possible to use the variables
in a regression framework on account of mulicollinearity. Secondly, when there were a
large number of impacted variables we need to collapse them into a single dependant
variable.
There is a relevance of using PCA analysis in our modeling. It allows for data reduction.
The reduced data set would contain the maximum information in all the variables, which
were being considered as dependent variable. As a result of PCA the reduced data sets
consists of variables which were not correlated to each other, since the principal
component are orthogonal (perpendicular) to each other.
The purpose of principal component analysis is:
1. Firstly to extract from amongst impacted variables that are correlated as reduced set
of principal components that are uncorrelated.
2. Secondly this set of principal components is used through Joliffe method for
selecting a reduced set of principle variables which are representatives of the
retained principal components.
3. The third step involves the extraction of the three sets of weights of the retained
principle variables that represent a phenomenon namely, the crisis.
METHODOLOGICAL ISSUES IN MEASURING ASIAN FINANCIAL CRISISVol. 35 No. 1
BUSINESS ANALYST12
4. Fourth step is to collapse the principle variables into a composite index with the help
of weights derived from step three.
Finally the PCA methodology enables us the construction of composite index. The crux
of our methodology is to represent complex interrelated phenomena such as a crisis with
the help of a single composite index, which could act as a unique dependent variable. It
may be argued that there are many other factors that influence crises, but our PCA
ensures that the variables which were chosen to construct crises index which was
constructed with the help of composite index as explained latter in the section by using
the weights, effectively represent the impact of all the crises variables. Since the
principal variables are highly correlated to the principal components they contained the
same information. One measure of the explanatory power of the index of the index
formed by this procedure is given by the variation explained by the retained principal
component.
COMPOSITE INDEX
Method for Construction of the Index
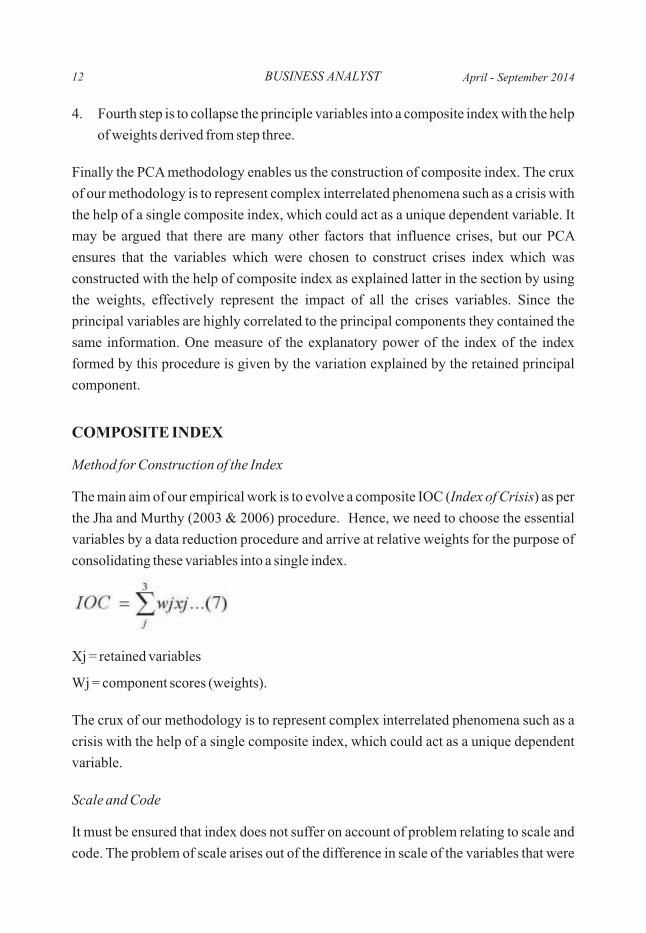
The main aim of our empirical work is to evolve a composite IOC (Index of Crisis) as per
the Jha and Murthy (2003 & 2006) procedure. Hence, we need to choose the essential
variables by a data reduction procedure and arrive at relative weights for the purpose of
consolidating these variables into a single index.
Xj = retained variables
Wj = component scores (weights).
The crux of our methodology is to represent complex interrelated phenomena such as a
crisis with the help of a single composite index, which could act as a unique dependent
variable.
Scale and Code
It must be ensured that index does not suffer on account of problem relating to scale and
code. The problem of scale arises out of the difference in scale of the variables that were
April - September 2014
13
components of the composite index. In our case the problem of the scale has been 10
handled by normalizing the variables . As a result variables are expressed in percentage
term. The code of the variable refers to the interpretation of the direction of change with
respect to the value or the measure of the index. For instance a high number in the index
should represent an increase in the phenomena that the composite index stands for
higher number should also be generated by the higher value of the component of the
index, which implies a rise in the phenomena. For instance if exchange rate is expressed
as a local currency unit per $ than we expect that during the crises there would be a sharp
devaluation or depreciation of the currency hence the magnitude of the variable should
rise. It is therefore necessary that there must be a consistency between the magnitude of
the code and the interpretation of direction of change of the phenomenon on the one hand
and also the consistency with- in the code in relation to the individual variables that
constitute the code. Therefore a composite index would be representative only if the
components of the index are representative and the scale and code both are consistent.
Advantage of the composite index:
To ascertain whether the composite index functions better than the individuals variables
we estimated as a regression equations by including the principal variable directly in the
regression. The results were not satisfactory and to the contrary a composite index
performs better. Apparently the complexity of the phenomenon was better represented
by a composite index that represents the combined information content. At the same time
it reduces the number of variables and permit higher degrees of freedom.
RESULT AND ANALYSIS
So far we have explained what would be our methodology and how it was different from
the earlier studies. The following sub-section interprets the results of various procedures
which were applied to the data set in order to arrive at some meaningful conclusion from
the raw data which was taken from the World Development Report and World
Development Indicators (World Bank).
10Through the dummy variables exercise (not reported).
METHODOLOGICAL ISSUES IN MEASURING ASIAN FINANCIAL CRISISVol. 35 No. 1
BUSINESS ANALYST14
Causality Test
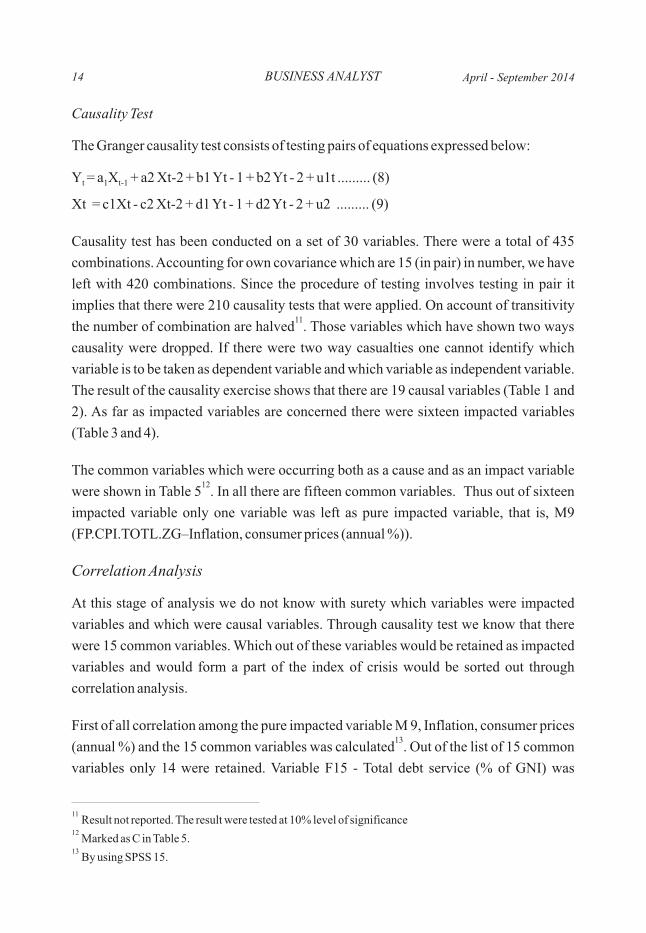
The Granger causality test consists of testing pairs of equations expressed below:
Y = a X + a2 Xt-2 + b1 Yt - 1 + b2 Yt - 2 + u1t ......... (8)t 1 t-1
Xt = c1Xt - c2 Xt-2 + d1 Yt - 1 + d2 Yt - 2 + u2 ......... (9)
Causality test has been conducted on a set of 30 variables. There were a total of 435
combinations. Accounting for own covariance which are 15 (in pair) in number, we have
left with 420 combinations. Since the procedure of testing involves testing in pair it
implies that there were 210 causality tests that were applied. On account of transitivity 11
the number of combination are halved . Those variables which have shown two ways
causality were dropped. If there were two way casualties one cannot identify which
variable is to be taken as dependent variable and which variable as independent variable.
The result of the causality exercise shows that there are 19 causal variables (Table 1 and
2). As far as impacted variables are concerned there were sixteen impacted variables
(Table 3 and 4).
The common variables which were occurring both as a cause and as an impact variable 12
were shown in Table 5 . In all there are fifteen common variables. Thus out of sixteen
impacted variable only one variable was left as pure impacted variable, that is, M9
(FP.CPI.TOTL.ZG–Inflation, consumer prices (annual %)).
Correlation Analysis
At this stage of analysis we do not know with surety which variables were impacted
variables and which were causal variables. Through causality test we know that there
were 15 common variables. Which out of these variables would be retained as impacted
variables and would form a part of the index of crisis would be sorted out through
correlation analysis.
First of all correlation among the pure impacted variable M 9, Inflation, consumer prices 13
(annual %) and the 15 common variables was calculated . Out of the list of 15 common
variables only 14 were retained. Variable F15 - Total debt service (% of GNI) was
11Result not reported. The result were tested at 10% level of significance
12Marked as C in Table 5.
13By using SPSS 15.
April - September 2014
15
dropped because of non availability of data in case of some countries. Common
variables that were correlated with the single impacted variable M9 Inflation, consumer
prices (annual %) were retained as impacted variable. One can afford that correlation
could be high in case of impacted variable, since we have to construct a composite index
out of it with he help of PCA that ensures that the correlation is removed. After applying
correlation analysis the variables which were found to be highly correlated with the pure
impacted variables have been reported in Table 6. At this stage we know which table is
to be considered for the construction of the index.
Formation of index of crises:
PCA was applied on impacted variables shown in Table 6. The purpose of applying PCA
was to arrive at a set of dependent variables that are inter-correlated and that retained the
maximum possible information contained in all the impacted variables, which were
being considered as dependent variables. The final procedure for the formation of the
index involved the following steps:
1. Determination of number of principal components to be retained. In this step we use
the Kaiser criteria and retain three principal components where eigen value was
greater than one. Table 7 shows the total variance explained by the extracted
principal component. It is evidenced that over 72% of the information is captured by
the retained component.
2. Rotation of component: with the help of varimax rotation with Kaiser
Normalization the component were rotated. This was done with a view to obtain the
clear interpretation of the components. This resulted in a set of component scores of
each of the nine variables with respect to the three retained components. Table 8
gives the component scores coefficient matrix.
3. Selection of principal variables: We have used the Joliffe procedure explained
earlier to select the principal variables. We have selected three variables in the
descending order beginning with the largest component. Accordingly the three
principal variable selected were; M 3 Exports of Goods and Services (% of GDP), M
10 Official Exchange Rate (LCU per US$, period average, % change over the
previous year) and F 8 Lending Interest Rate (%).
4. By using the weights from the component score coefficient matrix, which has been
given by the PCA analysis in step three we would construct the index of dependent
variables. Composite index of impacted variables (Y variable the LHS variable) was
METHODOLOGICAL ISSUES IN MEASURING ASIAN FINANCIAL CRISISVol. 35 No. 1
BUSINESS ANALYST16
calculated by multiplying the variables M 3 Exports of goods and services (% of GDP)
by .315, variable M 10 Official exchange rate (LCU per US$, period average, % change
over the previous year) by .402 and F 8 Lending interest rate (%) by .694 as weights .
..................... (10)
Working of the Index
The code of the variable refers to the value and direction of each included variable in
relation to the value and direction of the index. IOC measures the crises therefore a
higher value of the index should represent a higher degree of crises. Percentage change
in the Official exchange rate over the previous year has been expressed as LCU/$
therefore a rise in its value would represent depreciation of domestic currency. In affect a
higher value implies an increase in the degree of crises. With depreciation it may be
expected that value of exports of goods and services as a percentage of GDP increases
which also adds to the value of the crises index. Similarly we could expect a higher
lending interest rate as well during the period of crises. Hence all the three variables
conform to the desired code of IOC. That is the entire three variables rise in value term
when the rises increase. So also does the index of crises. Therefore the code of the
components of the index and the crises index itself share the same interpretation.
During crises in general there would be a tendency to inflation. Secondly there could be a
speculative bubble therefore it is expected that after monetary authority resort to tight
money policy. Hence the interest rate is likely to increase. The purpose of adopting this
elaborate procedure was dual. Firstly it was aimed at developing a composite index.
Secondly it was important to ensure that a correlation amongst retained variables is
minimized which is a merit of PCA methodology. After having constructed an index it
was necessary to verify the degree of correlation. Table 9 shows that the correlations
among the retained principal variables that have been used for constructing an index
were low and not statistically significant. Thus, our methodology summarizes
information from amongst the most important financial and macroeconomic variables
without distorting the estimates since the variables post PCA are uncorrelated.
ANALYSIS OF THE INDEX OF CRISIS
In the following section we shall be analyzing the trends in the index – across phases of
the crisis, namely, pre-crisis, crisis and post crisis. The first observation is that clearly
April - September 2014
17
during the crises window all countries have been affected including India. This is
evidence from a discrete jump in the index of crises across countries. However it can be
seen that the impact on India was minimal. One conclusion is that this justifies treating
India as the base because it was least effected yet it was not a country that was unrelated
to the crises.
The pre-crises period showed different patterns which can also be gauged by subsequent
analysis of mean and standard deviation. The index witnesses a marginal declining trend
in the case of Thailand. A stable but increasing trend was observed in the case of Korea. A
declining trend with stagnancy for four years in the case of Indonesia and a very similarly
trend in the case of Malaysia was observed. In the case of India there was a slight rise in
early 1990's and thereafter there was a declining trend during pre crises period.
The highest index was that of Korea which was in the range of 63-64 while the lowest
was of India which was slightly less than half at 31-32. Most of the countries during the
crises were in the range of 60's. In fact the highest index was of Indonesia which stood at
64.74. Another feature was that the index rose from between 1997-98 uniformly. In the
case of India the rise was less than one point on the scale. The maximum rise was in the
case of Indonesia that was around 17 points. Although the Korea has the highest index on
an average the jump was just about one point. Similarly in the case of Thailand and
Philippines the appreciation was around 3.5 points.
During the recovery phase the patterns were more stable in the case of India there was a
decline down to 40% and the recovery was almost complete except for a marginal
overall rise in comparison to the pre crises period. Philippines and Thailand both
experienced a halving of the index after crises and a mild decline towards pre crises
levels in the next three years. In the case of Korea while the dip in the index was down by
one third there was a marginal rise and a stable trend which resembled the late 80's. In
both Malaysia and Indonesia the decline was less than half and there was a mild tendency
towards a falling index which approximated there state at the end of 80's and beginning
of 90's. (All the results of the above analysis are reported in Table 10).
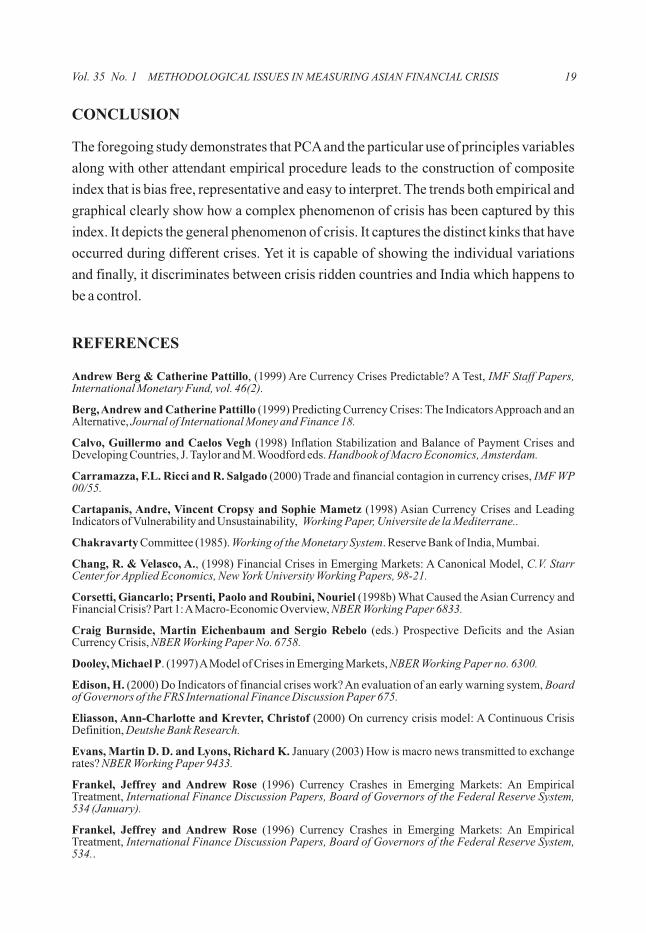
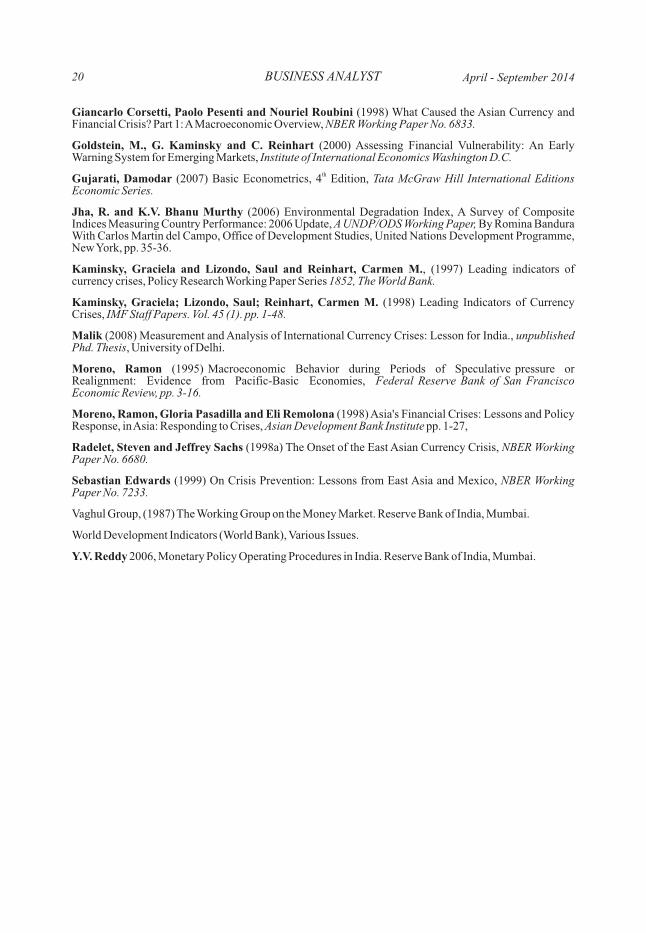
GRAPHICAL INTERPRETATION
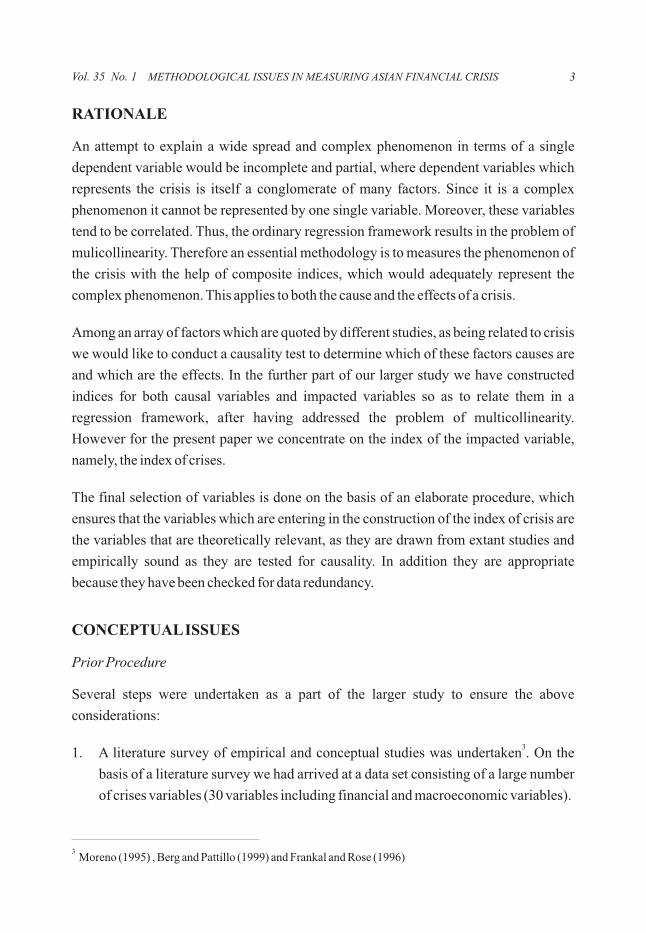
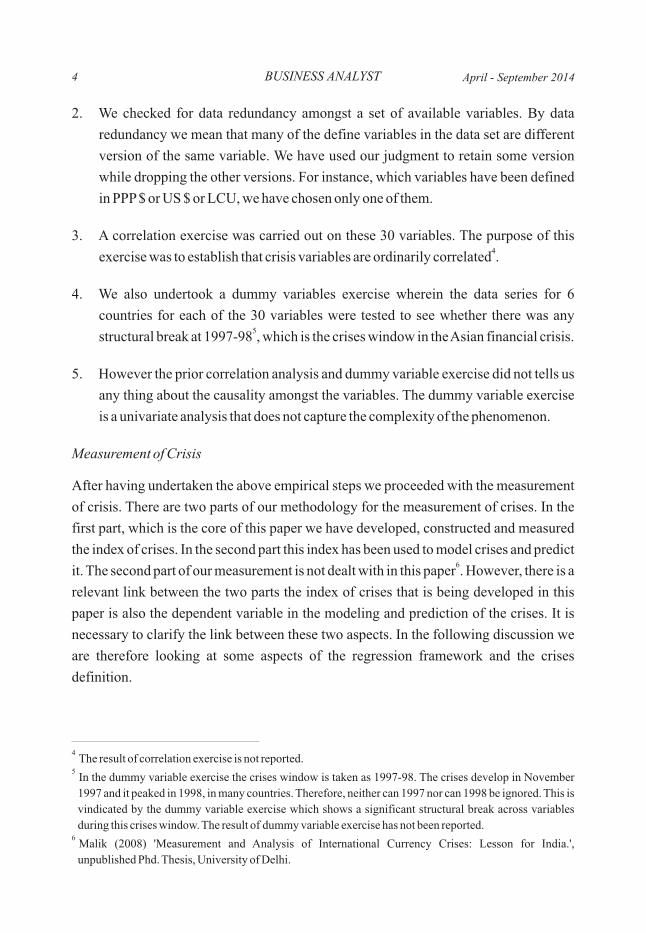
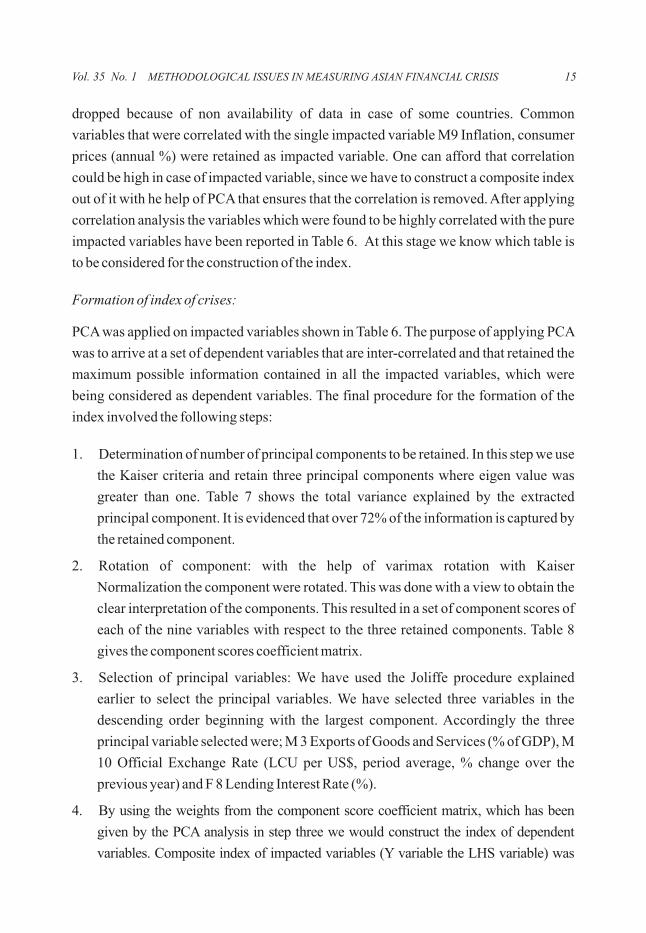
Most of the above trends were visible in the graph shown below (Figure 1 to Figure 5).
However, since the analysis only reveals the average we would like to comment on some
of the extreme points in the graphs. In Thailand the trend started around 23 points and
METHODOLOGICAL ISSUES IN MEASURING ASIAN FINANCIAL CRISISVol. 35 No. 1
BUSINESS ANALYST18
went up to high of 50. Even immediately after the crises it went down to 25. This shows
that the recovery was pretty fast and complete. At the end point the index interestingly
came back to 22. Philippines showed a much more volatile pattern it began at 32 and
went up to almost 35 in 1990 then it sharply fell to 18 at the beginning of the crises.
During crises it short up to 40 but the recovery was good because it stabilize around 20.
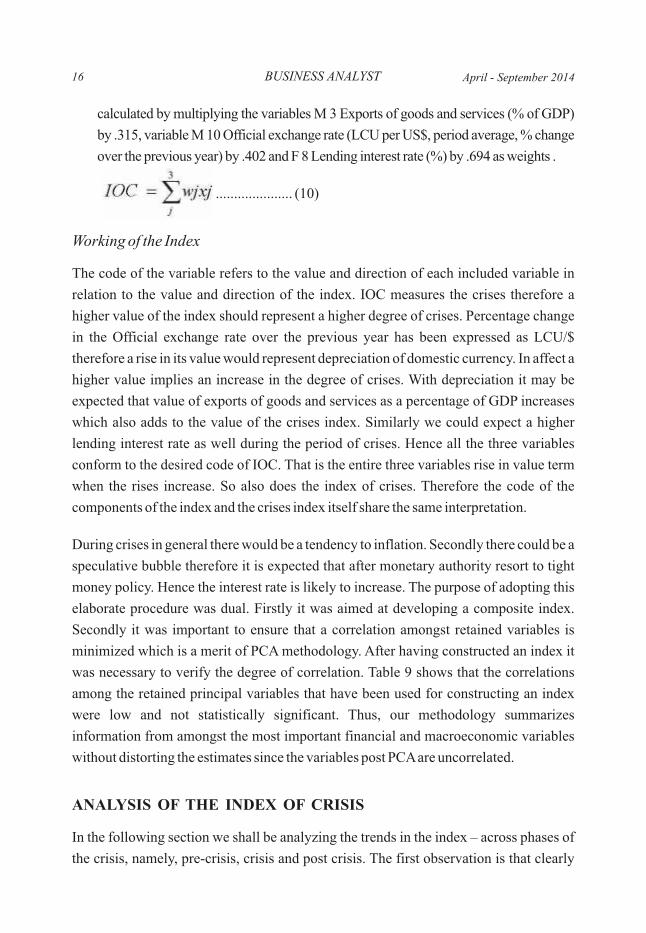
Korea showed a distinct pattern of a high level of the index hovering around 40 with a
sudden kink during a crises from 45 to 65. Indonesia clearly shows a slump with the pre
crises period having a low of 24. It peaked up to 65 and gradually tapered of to 33, which
was around the pre crises levels. The pattern of Malaysia was a mixture of Korea and
Indonesia. .It started around 40 and ended around 35. The general pattern was like Korea
with a long period of slump like Indonesia. It peaked up to 61.4 and the recovery period
was somewhat turbulent. Interestingly India's pattern was similar to that of Philippines.
There was an initial high of 24 in 1990 similarly to Philippines. There was a relatively
small period of stagnancy when the index went down to 10.
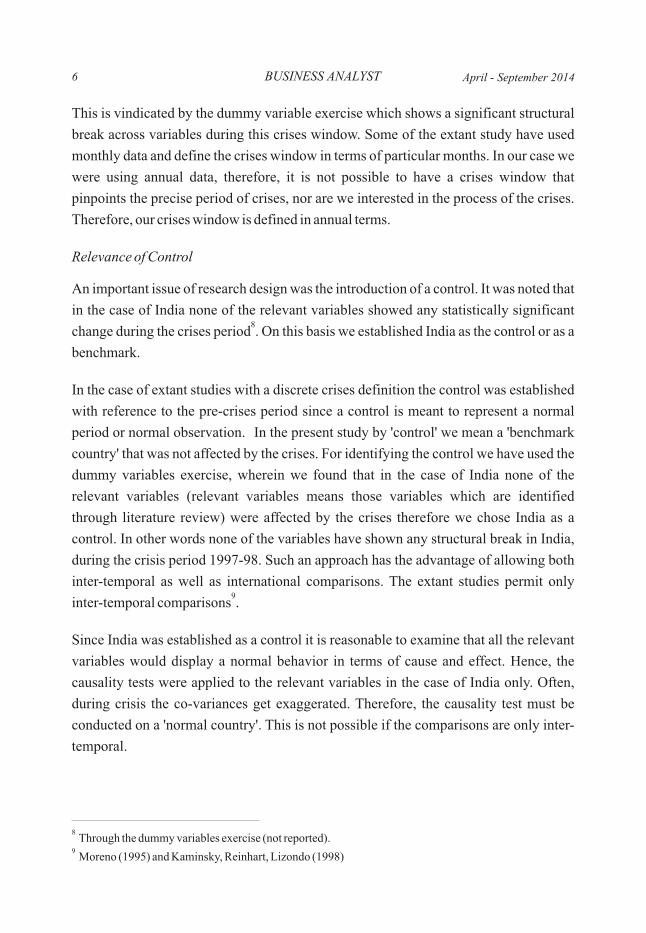
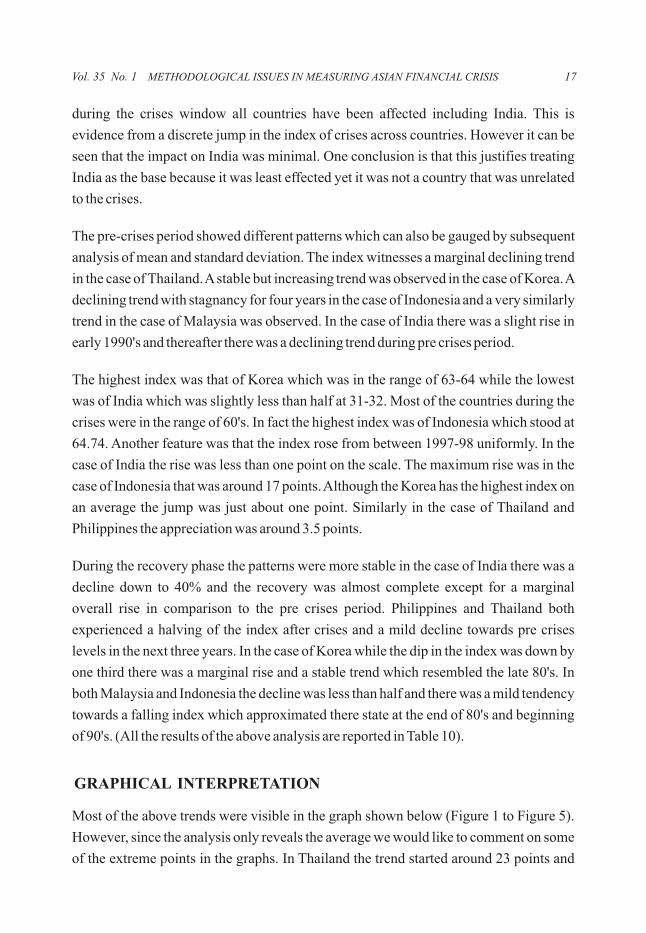
India started at a level of under 20 while other countries started at about twice that of
India's level of IOC. India faced an internal shock in 1990-91 because of which it
witnessed a peak in that year. However, it can be noticed that even this peak was well
below the entire range of all other countries in the pre-crisis period. The second peak of
India was around 31, in 1998. India's 'crisis peak' was below the average of other
countries. The highest peak was 64 (Indonesia). It must be noted that all these
comparisons are based on normalized variables and an in index form. Therefore, there is
no bias on account of size of the economy. If at all this should inflate India's values. On
the whole the level of the curve in India was consistently below, all other countries.
During the post crisis period also India's performance was much better. The IOC came
down to 12.62 and finally, India landed up at 12, in 2002, which is below where it had
started in 1987. The worst value of IOC during recovery in India was 14 whereas in
Korea it was 44.
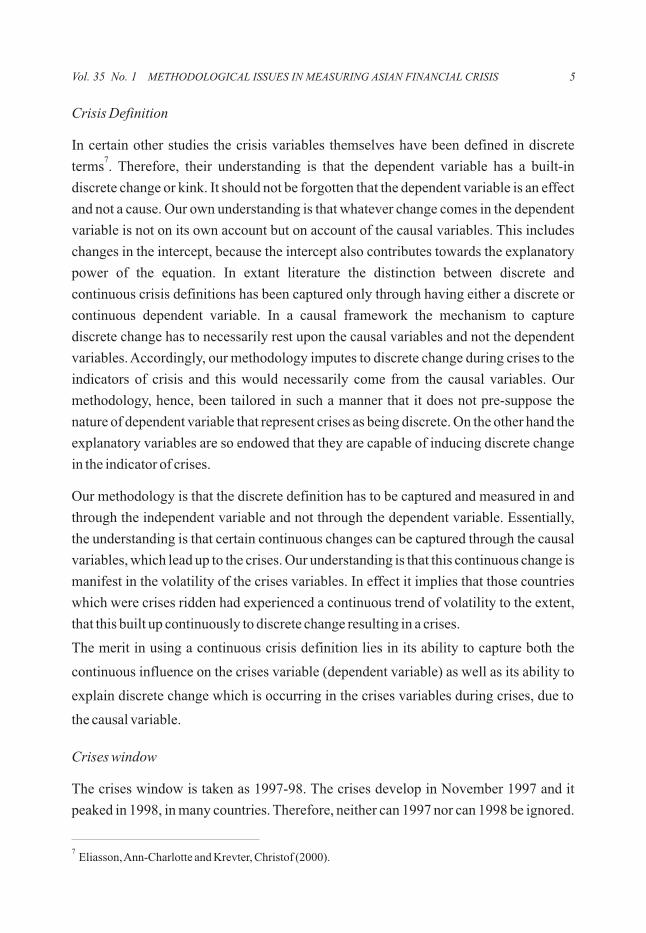
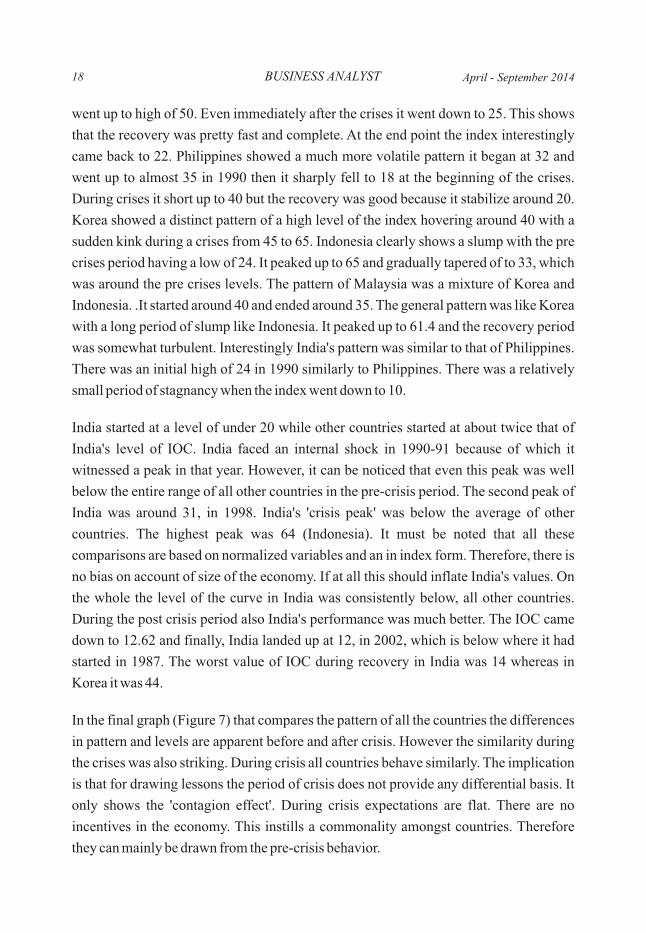
In the final graph (Figure 7) that compares the pattern of all the countries the differences
in pattern and levels are apparent before and after crisis. However the similarity during
the crises was also striking. During crisis all countries behave similarly. The implication
is that for drawing lessons the period of crisis does not provide any differential basis. It
only shows the 'contagion effect'. During crisis expectations are flat. There are no
incentives in the economy. This instills a commonality amongst countries. Therefore
they can mainly be drawn from the pre-crisis behavior.
April - September 2014
CONCLUSION
The foregoing study demonstrates that PCA and the particular use of principles variables
along with other attendant empirical procedure leads to the construction of composite
index that is bias free, representative and easy to interpret. The trends both empirical and
graphical clearly show how a complex phenomenon of crisis has been captured by this
index. It depicts the general phenomenon of crisis. It captures the distinct kinks that have
occurred during different crises. Yet it is capable of showing the individual variations
and finally, it discriminates between crisis ridden countries and India which happens to
be a control.
REFERENCES
Andrew Berg & Catherine Pattillo, (1999) Are Currency Crises Predictable? A Test, IMF Staff Papers, International Monetary Fund, vol. 46(2).
Berg, Andrew and Catherine Pattillo (1999) Predicting Currency Crises: The Indicators Approach and an Alternative, Journal of International Money and Finance 18.
Calvo, Guillermo and Caelos Vegh (1998) Inflation Stabilization and Balance of Payment Crises and Developing Countries, J. Taylor and M. Woodford eds. Handbook of Macro Economics, Amsterdam.
Carramazza, F.L. Ricci and R. Salgado (2000) Trade and financial contagion in currency crises, IMF WP 00/55.
Cartapanis, Andre, Vincent Cropsy and Sophie Mametz (1998) Asian Currency Crises and Leading Indicators of Vulnerability and Unsustainability, Working Paper, Universite de la Mediterrane..
Chakravarty Committee (1985). Working of the Monetary System. Reserve Bank of India, Mumbai.
Chang, R. & Velasco, A., (1998) Financial Crises in Emerging Markets: A Canonical Model, C.V. Starr Center for Applied Economics, New York University Working Papers, 98-21.
Corsetti, Giancarlo; Prsenti, Paolo and Roubini, Nouriel (1998b) What Caused the Asian Currency and Financial Crisis? Part 1: A Macro-Economic Overview, NBER Working Paper 6833.
Craig Burnside, Martin Eichenbaum and Sergio Rebelo (eds.) Prospective Deficits and the Asian Currency Crisis, NBER Working Paper No. 6758.
Dooley, Michael P. (1997) A Model of Crises in Emerging Markets, NBER Working Paper no. 6300.
Edison, H. (2000) Do Indicators of financial crises work? An evaluation of an early warning system, Board of Governors of the FRS International Finance Discussion Paper 675.
Eliasson, Ann-Charlotte and Krevter, Christof (2000) On currency crisis model: A Continuous Crisis Definition, Deutshe Bank Research.
Evans, Martin D. D. and Lyons, Richard K. January (2003) How is macro news transmitted to exchange rates? NBER Working Paper 9433.
Frankel, Jeffrey and Andrew Rose (1996) Currency Crashes in Emerging Markets: An Empirical Treatment, International Finance Discussion Papers, Board of Governors of the Federal Reserve System, 534 (January).
Frankel, Jeffrey and Andrew Rose (1996) Currency Crashes in Emerging Markets: An Empirical Treatment, International Finance Discussion Papers, Board of Governors of the Federal Reserve System, 534..
METHODOLOGICAL ISSUES IN MEASURING ASIAN FINANCIAL CRISIS 19Vol. 35 No. 1
Giancarlo Corsetti, Paolo Pesenti and Nouriel Roubini (1998) What Caused the Asian Currency and Financial Crisis? Part 1: A Macroeconomic Overview, NBER Working Paper No. 6833.
Goldstein, M., G. Kaminsky and C. Reinhart (2000) Assessing Financial Vulnerability: An Early Warning System for Emerging Markets, Institute of International Economics Washington D.C.
thGujarati, Damodar (2007) Basic Econometrics, 4 Edition, Tata McGraw Hill International Editions Economic Series.
Jha, R. and K.V. Bhanu Murthy (2006) Environmental Degradation Index, A Survey of Composite Indices Measuring Country Performance: 2006 Update, A UNDP/ODS Working Paper, By Romina Bandura With Carlos Martin del Campo, Office of Development Studies, United Nations Development Programme, New York, pp. 35-36.
Kaminsky, Graciela and Lizondo, Saul and Reinhart, Carmen M., (1997) Leading indicators of currency crises, Policy Research Working Paper Series 1852, The World Bank.
Kaminsky, Graciela; Lizondo, Saul; Reinhart, Carmen M. (1998) Leading Indicators of Currency Crises, IMF Staff Papers. Vol. 45 (1). pp. 1-48.
Malik (2008) Measurement and Analysis of International Currency Crises: Lesson for India., unpublished Phd. Thesis, University of Delhi.
Moreno, Ramon (1995) Macroeconomic Behavior during Periods of Speculative pressure or Realignment: Evidence from Pacific-Basic Economies, Federal Reserve Bank of San Francisco Economic Review, pp. 3-16.
Moreno, Ramon, Gloria Pasadilla and Eli Remolona (1998) Asia's Financial Crises: Lessons and Policy Response, in Asia: Responding to Crises, Asian Development Bank Institute pp. 1-27,
Radelet, Steven and Jeffrey Sachs (1998a) The Onset of the East Asian Currency Crisis, NBER Working Paper No. 6680.
Sebastian Edwards (1999) On Crisis Prevention: Lessons from East Asia and Mexico, NBER Working Paper No. 7233.
Vaghul Group, (1987) The Working Group on the Money Market. Reserve Bank of India, Mumbai.
World Development Indicators (World Bank), Various Issues.
Y.V. Reddy 2006, Monetary Policy Operating Procedures in India. Reserve Bank of India, Mumbai.
BUSINESS ANALYST20 April - September 2014
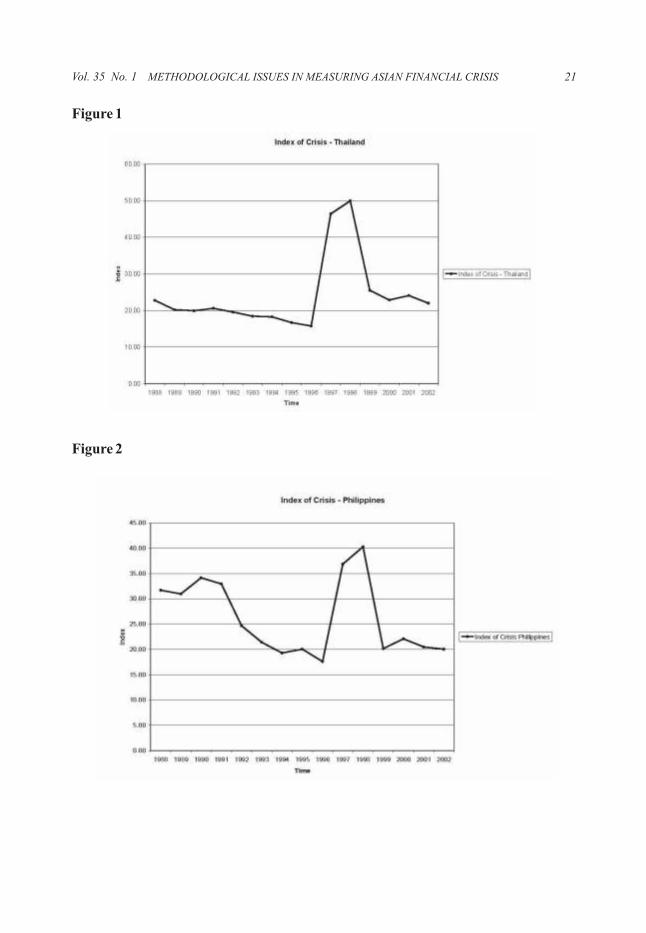
Figure 1
Figure 2
METHODOLOGICAL ISSUES IN MEASURING ASIAN FINANCIAL CRISIS 21Vol. 35 No. 1
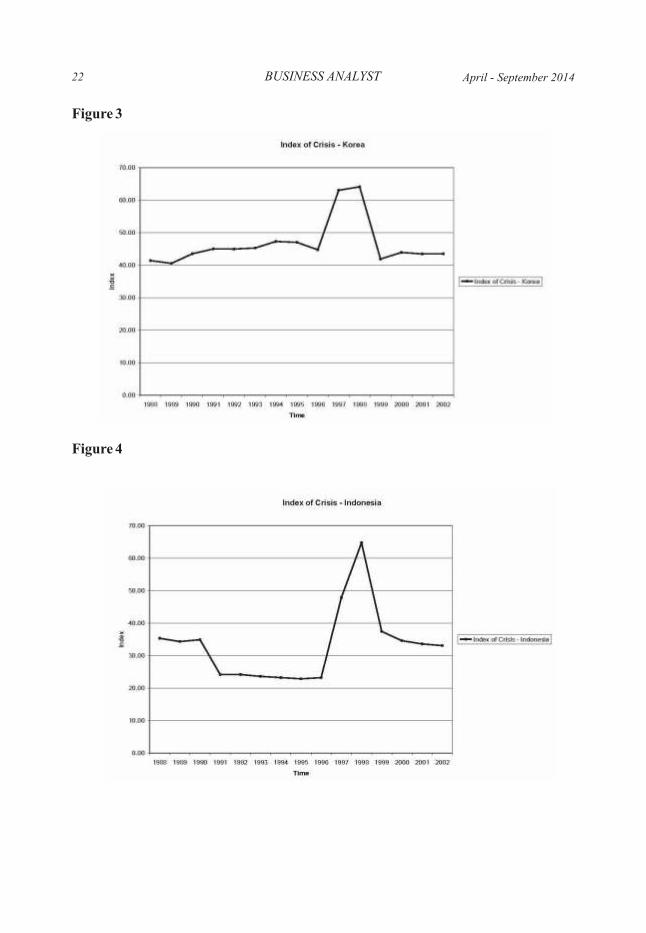
Figure 3
Figure 4
BUSINESS ANALYST22 April - September 2014
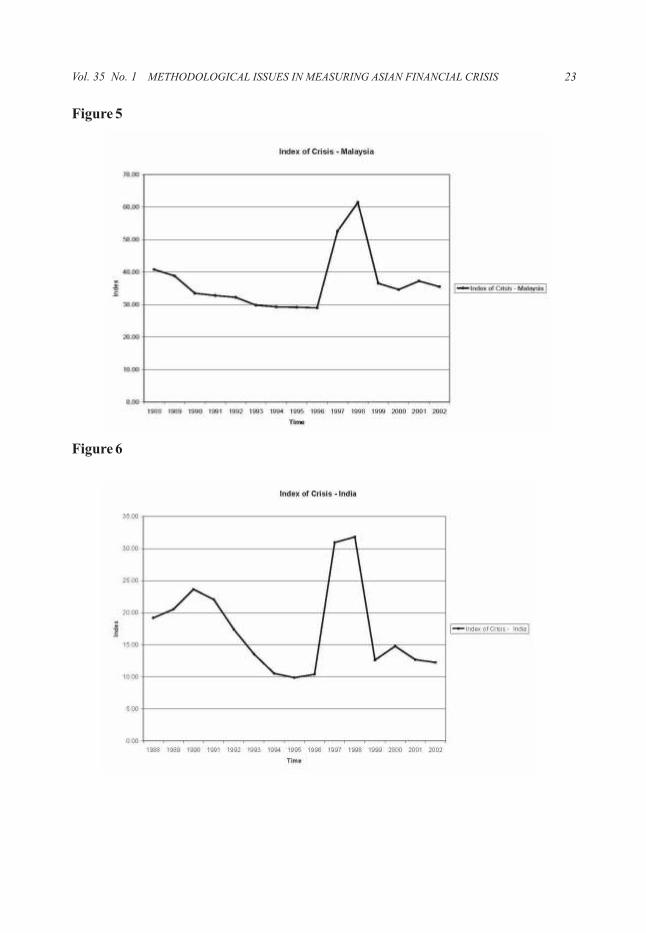
Figure 5
Figure 6
METHODOLOGICAL ISSUES IN MEASURING ASIAN FINANCIAL CRISIS 23Vol. 35 No. 1
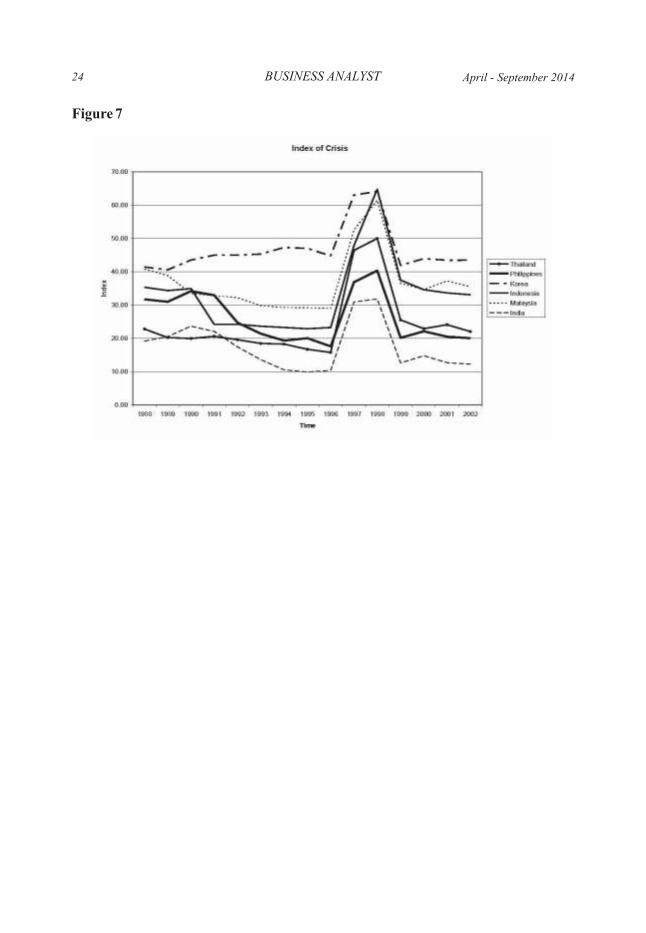
Figure 7
BUSINESS ANALYST24 April - September 2014
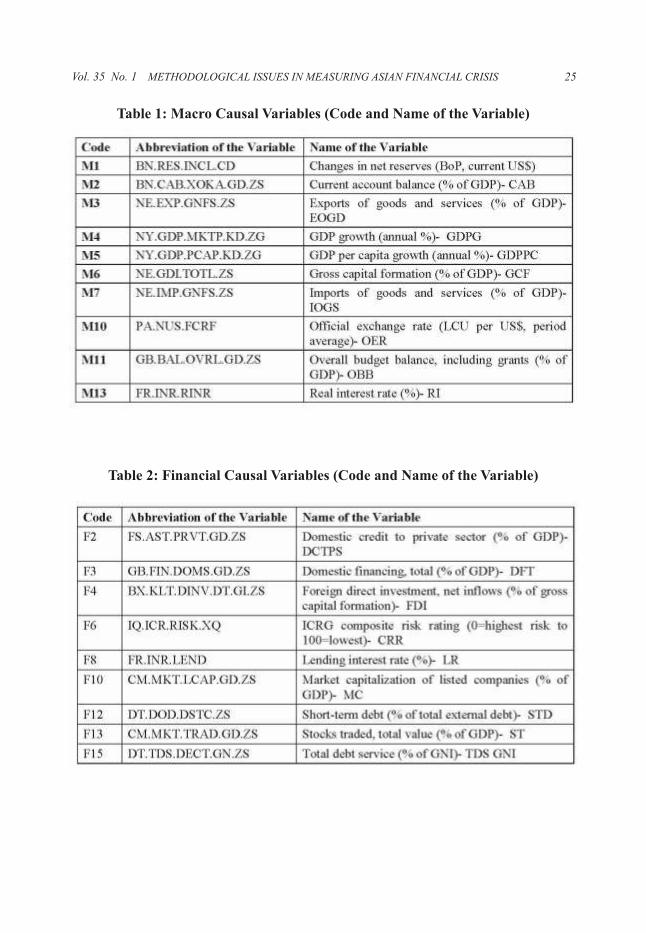
Table 1: Macro Causal Variables (Code and Name of the Variable)
Table 2: Financial Causal Variables (Code and Name of the Variable)
METHODOLOGICAL ISSUES IN MEASURING ASIAN FINANCIAL CRISIS 25Vol. 35 No. 1
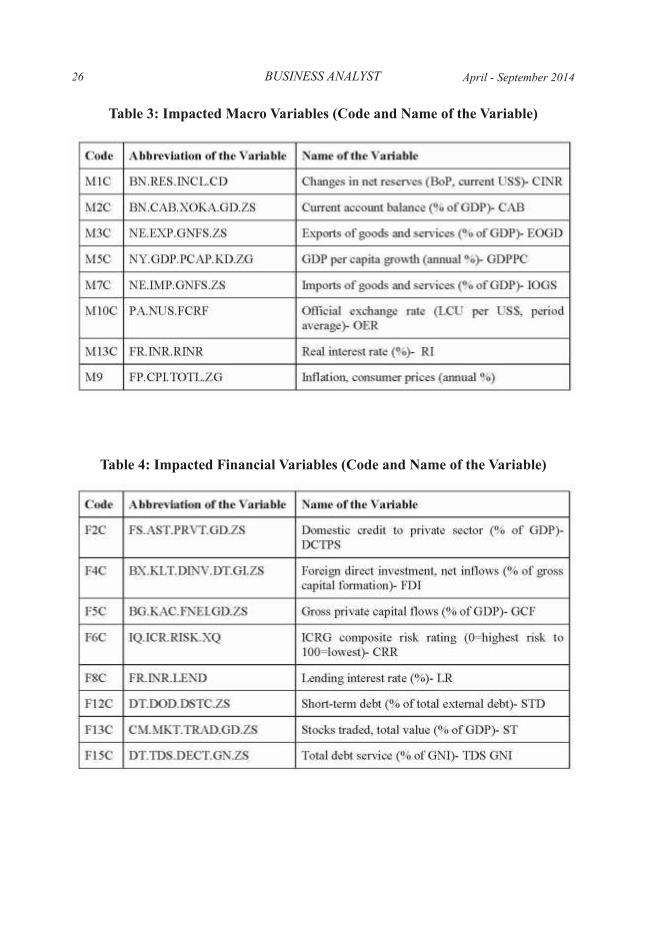
Table 3: Impacted Macro Variables (Code and Name of the Variable)
Table 4: Impacted Financial Variables (Code and Name of the Variable)
BUSINESS ANALYST26 April - September 2014
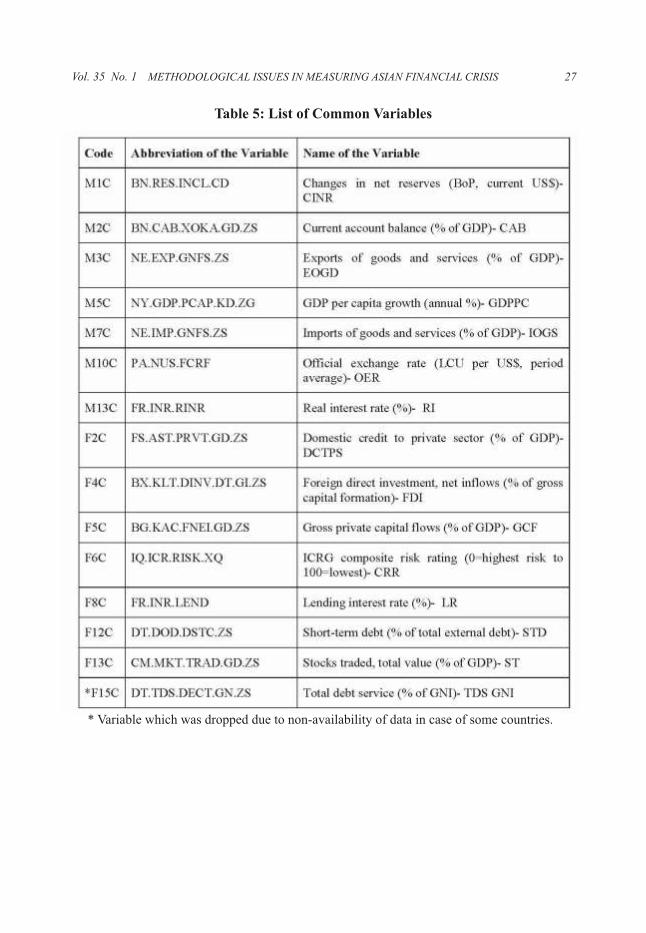
Table 5: List of Common Variables
* Variable which was dropped due to non-availability of data in case of some countries.
METHODOLOGICAL ISSUES IN MEASURING ASIAN FINANCIAL CRISIS 27Vol. 35 No. 1
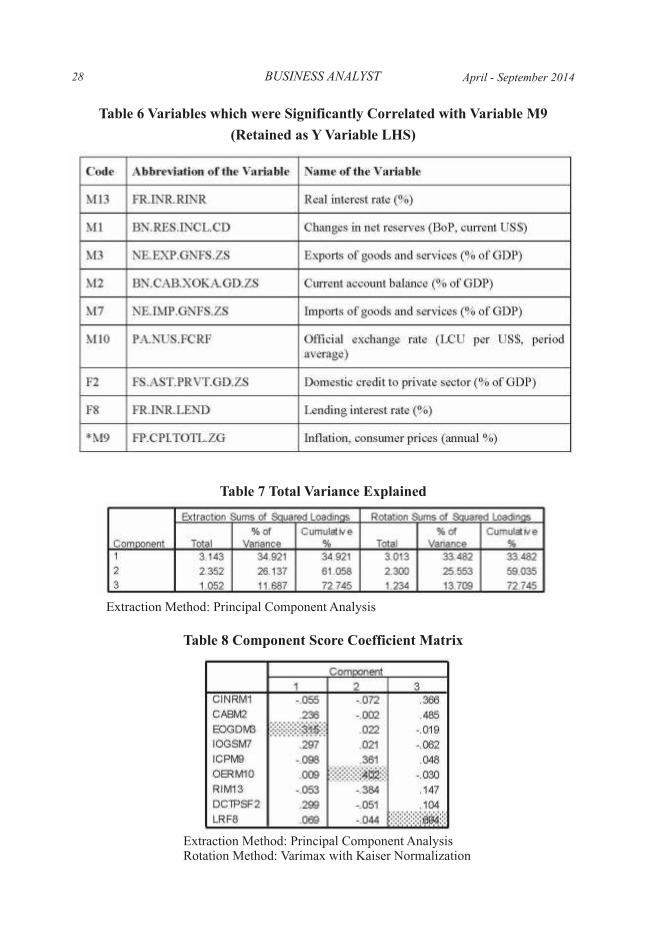
Table 6 Variables which were Significantly Correlated with Variable M9
(Retained as Y Variable LHS)
Table 7 Total Variance Explained
Table 8 Component Score Coefficient Matrix
Extraction Method: Principal Component Analysis
Extraction Method: Principal Component AnalysisRotation Method: Varimax with Kaiser Normalization
BUSINESS ANALYST28 April - September 2014
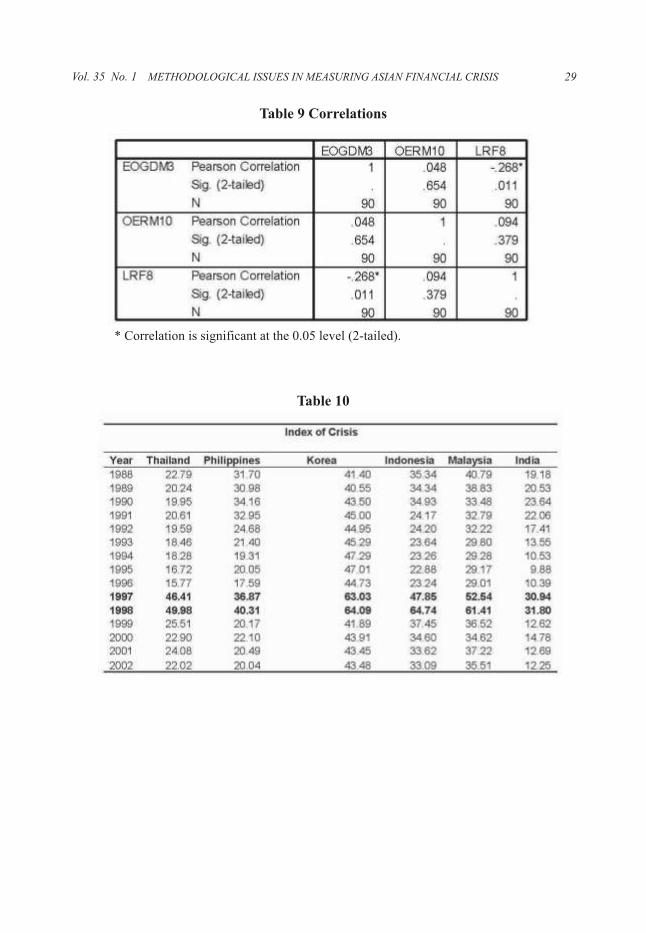
Table 9 Correlations
Table 10
* Correlation is significant at the 0.05 level (2-tailed).
METHODOLOGICAL ISSUES IN MEASURING ASIAN FINANCIAL CRISIS 29Vol. 35 No. 1

1PhD Scholar, Department of Management Studies, Indian Institute of Technology Delhi Vishwakarma
Bhavan, Hauz Khas, New Delhi - 110016.2
Professor, Department of Management Studies, Indian Institute of Technology Delhi Vishwakarma
Bhavan, Hauz Khas, New Delhi - 110016.3
Department of Management Studies, Indian Institute of Technology Delhi Vishwakarma Bhavan, Hauz
Khas, New Delhi - 110016.
,
,
,
SHORT-TERM IMPACT OF M&A ON SHAREHOLDERS'
RETURNS: A STUDY OF CORPORATE ACQUIRER FIRMS
IN INDIA
1 2 3Anshu Agrawal , P.K. Jain and Sushil
Mergers and acquisitions (M&A) constitute crucial investment decisions; being so, they
are expected to have significant implications for corporate firms' performance. To be
consistent with the objective of wealth-maximization, the M&A decisions should have
positive impact on the shareholders returns. The study assesses the stock returns for the
acquirer firms, associated with M&A announced in India during the years 2002-2008
(peak to peak); the present sample consists of 136 acquirer firms: 19 from auto-
ancillary, 42 from pharmaceutical, and 75 from IT sector. Results indicate that the M&A
announced in Indian corporate sector during the stated peak of M&A as value
creating/enhancing. Shareholders of acquirer firms have earned/ gained excess to
normal returns around M&A announcement; the magnitude of returns and the period of
returns-conducive window pertaining to IT was significantly better vis-a-vis auto-
ancillary and pharmaceutical sector; perhaps the IT boom period (observed 2004
onwards) could be reason. Further, we have observed that the stock market response to
M&A announcements lasts, by and large, for a weak only.
Key words: M&A Announcements; Abnormal Returns; Event Study; Acquirer Firms;
Clean Window; Contemporaneous Events
INTRODUCTION
M&A are vital corporate investment decisions. These decisions are reckoned as value-
creating strategies expected to bring synergistic benefits to the merging entities,
operating, marketing, managerial, and financing and so on. The darker side is that,
returns from M&A are highly uncertain; a large body of literature has observed M&A as
value-deteriorating strategy, particularly, from acquirer firms' perspective (Agrawal et
31Vol. 35 No. 1
BUSINESS ANALYST
al. 1992; King et al. 2004). To be consistent with the goal of wealth-maximization, M&A
should be able enhance/ improve the profitability/returns/ value to shareholders. The
underlying potential of M&A decisions starts reflecting much earlier, on their
announcements it-self, in form of share-price fluctuations. Since, M&A decisions
involve huge stake of funds, there potential merits assessment at earliest.
Since post-liberalization reforms (1990), the investment in M&A in India has been
evidencing a consistent growth pattern. Recent M&A wave (2002-08) has proved to be
the wave of M&A mania, with spurt growth observed in terms of value as well as
volume. During the year 2007 (before the recession set in) the M&A value in India was
all time high, recording USD 70 billion, revealing a growth rate of 150 per cent vis-a-vis
global growth rate of 49.11 per cent. After a minor correction, observed during the years
2008 and 2009, the M&A market in India has revived, registering a growth of 159 per
cent in 2010 (touching the same level as was witnessed during 2007). The parallel
movement of M&A activities with economy is suggestive of M&A activities to be a
significant part of economic development. More vivid M&A market is foreseen with the
rise in the level of economic growth in the coming years.
This paper attempts to assess the impact of M&A in India. As per efficient market
hypothesis, stock prices quickly absorb every new information/announcement/
corporate event in the market and transmit the same in forms of stock price fluctuation.
Therefore, it has been a general practice to assess the economic effect of corporate
events in terms of stock-returns using event study methodology. Using this
methodology, the study attempts to examine the abnormal returns associated with M&A
announcement pertaining to shareholders of acquirer firms in India. The study examines
the M&A announced during M&A wave pertaining to the time span of 2002-08; the
sample period has been assumed useful in bifurcating the returns during different
economic scenarios; for instance, the period 2002 onwards has witnessed economic
uprising; during 2007 M&A were at peak; the year 2008 was the recession year (Figure
1). Such a sample would be insightful for identifying the impact of economic changes on
M&A. The study covers three sectors, namely, auto-ancillary, IT, and pharmaceutical.
LITERATURE REVIEW
Announcement impact of M&A has been an extensively researched area in literature.
Notwithstanding the fact, the findings are non-convergent as to whether M&A decision
32 April - September 2014
adds to the value of shareholders' or deteriorates it. A brief review of stock-price studies
over three decades (1994 to 2005) by Kumar and Panneerselvam (2009) is suggestive of
the wide disparity in the empirical findings, albeit the similar methodology with minor
variations in data, periods, or region covered. Studies by Datta, et al. (1992), Bruner
(2002), King et al. (2004) also corroborate the same.
Large number of empirical studies support positive abnormal returns associated with
M&A announcement (Markides and Ittner 1994; Cakici et al. 1996; Schwert 1996;
Maquieira et al. 1998; Eckbo and Thorburn 2000; Kohers and Kohers 2000; Doukas et
al. 2002; Beitel et al. 2004; Anand and Singh 2008; Mittal, et al. 2012; Rani et al. 2013).
Fee and Thomas (2004) have witnessed abnormal returns of 3.06 per cent over a three
days window around announcement (day -1 to day +1) on analyzing 554 horizontal deals
taken place during 1980-97. Anand and Singh (2008) have examined the effects of M&A
announcements on private sector banks in India over a forty days event window;
findings have shown significant accumulations of abnormal wealth in three to eleven
days window for bidder as well as target banks.
Few studies docuent M&A as value-deteriorating decisions (Jensen 1986; Shleifer and
Vishney 1989; Kuipers et al. 2002; Martinez-Jerez 2002; Akbulut and Matsusaka 2003).
There are some studies, which have observed significant negative returns up to five cent
for the acquirer firms (Sirower 1997; Datta and Puia 1995; Corhay and Rad 2000;
Mulherin and Boone 2000; Mitchell and Stafford 2000; Walker 2000; DeLong 2001;
Houston et al. 2001; Goergen and Renneboog 2004).
There also exist studies that suggest no significant impact of M&A on the stock-returns.
For instance, study by Andrade et al. (2001) suggests 3-days abnormal returns around
announcement for target firms, whereas, no conclusive evidence has been noted for
abnormal returns to the acquirer firms. In a review study of 14 informal and 100
scientific studies (during 1971 to 2001), Bruner (2002) observed massive studies
indicating sizeable positive returns for shareholders of target firms, zero returns for
acquirer firms and positive combined returns for both bidder and acquirer firms.
Jensen and Ruback (1983) have observed significant difference in the shareholders
returns from mergers and acquisitions (as separate events); shareholders of bidding
firms have earned significant positive gains of 2.4 per cent to 6.7 per cent and weighted
average returns of 3.8 per cent in successful tender offers; in marked contrast,
zero/negligible returns have been noted for the shareholders of bidding firm for mergers.
SHORT-TERM IMPACT OF M&A ON SHAREHOLDERS' RETURNS 33Vol. 35 No. 1
34 BUSINESS ANALYST
Hassan et al. (2007) on assessing mergers and acquisitions (as separate events) in US
pharmaceutical industry have noted the abnormal returns (short-term as well as long-
term) in cases of acquisitions only. In Indian context, Kumar and Panneerselvam (2009)
have identified positive short-term abnormal returns from mergers as well as
acquisitions, which have taken place during 1998-2006.
The available studies along with inconclusive findings also reflect the regional disparity;
the available literature seems to be more focused on M&A activities pertaining to the
western developed economies; the developing economies such as India seem to be
inadequately attended, albeit the consistent momentum of M&A observed in these
economies. In spite of globalization, there exists wide difference in the corporate
culture, economic environment, investors' sentiments, regulatory environment, etc.; this
then constitutes rationale, for more comprehensive studies pertaining to M&A in India.
RESEARCH METHODOLOGY
The paper assesses the magnitude of stock returns associated with M&A announcements
using event-study methodology (Brown and Warner 1980; 1985). Event study is a
widely accepted approach/ statistical tool used for assessing the impact of particular type
of firm-specific events, such as, mergers, earnings/ dividend announcements, stock-
split, bonus announcements, etc. on the security prices of the affected firm.
Event study measures the extent of abnormality in the security price behaviour around
event announcements, i.e. the extent to which security returns react differently from the
expected returns. In particular, it measures the abnormal returns gained by firm's
shareholders due to unanticipated corporate events; the magnitude of the abnormal
returns around the event announcement is a measure of the impact of the particular
unanticipated event on the firm's shareholders wealth (Brown and Warner 1980); the
positive abnormal returns signify the value-creation and decrease in the returns indicate
value-deterioration.
Key constituents of event study analysis are the event, event date, event window,
estimation model, estimation window, and estimation period.
Event signifies the corporate action whose impact the researcher would like to examine;
in the present context, the event is the M&A announced during 2002-08 in auto-
ancillary, IT, and pharmaceutical sectors in India.
April - September 2014
Event date or 'zero date' refers to the first date of the public announcement of an event.
For the purpose of announcement, the corporate firms normally prefer newspapers,
magazines, stock-exchange websites, and companies' website. Present study reckons the
first date of M&A announcement, as per Centre of Monitoring Indian Economy (CMIE)
database PROWESS, as the event date; additionally, the validity of the event date is
cross-verified primarily using newspaper clippings, companies' website, websites of
Bombay Stock Exchange and National Stock Exchange.
Event-window refers to the period during which the event occurs. It has been observed
that the security prices are most vulnerable to the event information during this period.
Event study examines the impact of a corporate announcement on stock-price behavior
(regarded abnormal returns) during the event window.
As per efficient market hypothesis, market prices quickly adjust to new information
announced in the market. Literary findings also suggest that abnormal returns, in
general, last for less than a week around announcement; this then constitutes the
rationale for examining the economic effect of an event normally observed to persist for
a short- period (not extending beyond a week). To be on conservative side and keeping in
view the possibility of market-noise before the actual announcement, the present study
considers a relatively larger window of four weeks; event window (used in present
study) consists of 31 days, i.e. 15 days prior to M&A announcement and 15 days after the
announcement.
Estimation window refers to the period prior to the event window, during which the
share-prices are supposed to have no influence of the event announcement. The period is
used for estimating expected returns; this ensures that estimate of the normal returns are
not influenced by the event-related returns. In present context, estimation window of
120 days, ranging from -145 days to - 26 days has been considered; for better results, the
period of 10 days before event-window (-15 to +15) has been excluded. Thus, the total
estimation period used in the present study consists of 161 days: 31 days event window,
10 days left-out period and 120 days estimation-window (as portrayed by estimation
time line, Figure 2).
Estimation model refers to the model used to estimate the expected returns. The present
study uses the traditional single factor market model for the estimation the expected
returns; this model involves the regression of a stock's returns against market index. The
SHORT-TERM IMPACT OF M&A ON SHAREHOLDERS' RETURNS 35Vol. 35 No. 1
36 BUSINESS ANALYST
4present study uses S&P CNX 500 as the proxy of market returns (R ). m
3.1 Data collection and sample description
M&A announcement information has been collected from CMIE's database PROWESS
(version 4.1). To confirm the validity of announcements dates, the newspapers
clippings, websites of concerned companies, Bombay stock exchange (BSE), and
National Stock Exchange were also consulted. The daily share-prices information and
market index information has been collected from the archives of National Stock
Exchange of India (NSE) and Bombay Stock Exchange (BSE).
Selection criteria for sample firms
The acquirer firms that satisfy the following criteria form the part of study.
(i) The firm should be listed at National Stock Exchange (NSE) or at Bombay Stock
Exchange (BSE).
(ii) The daily share-prices information of the firm for the estimation period 161 days
should be available.
Additionally, to ensure capturing exclusive/pure impact of M&A, the study uses certain
sample selection criteria (McWilliams and Siegal 1997). The sound criterion requires
that event window should not be contaminated with any contemporaneous
announcement (i.e. the announcements likely to have bearing on the share-prices); for
the purpose, the sample firms have been filtered-out to ensure that during the select
event-window of 31-days no other announcements except M&A should have taken
place. The select list includes: announcements of the financial result; dividend
announcements; announcements or ex-dates of share split, stock dividends-issue of
bonus shares; announcements of new share issue in form of domestic or international
offering in form of Public Offer, Preferential Issue, Foreign Currency Convertible
Bonds (FCCB), and American Depository Receipts (GDR); announcement of capital
investment in a new project. It is customary that if a firm receives an order of substantial
4The S&P CNX Nifty is a stock market index and benchmark index for Indian equity market; it covers 22
sectors of the Indian economy, thus offering investment managers exposure to the Indian market in a single
portfolio. The S&P CNX Nifty index is a free float market capitalization weighted index. It represents
about 67.27% of the free float market capitalization of the stocks listed at National Stock Exchange (NSE)
as on September 30, 2012.
April - September 2014
value, or from prestigious customers, it informs about the same to Bombay Stock
Exchange, as these announcements are likely to have positive influence on the firm's
share-prices. The firms with such announcements during 31 days event window were
excluded from the sample.
The detailed sample description is contained in Table 1. After filtering, 136 firms (out of
341 firms) form the sample for the study, representing nearly 40 per cent of the acquirer
firms (involved in M&A) during the period of study; sector-wise observations are also,
by and large, similar. This may be considered statistically adequate sample representing
the universe; therefore, the results obtained from analysis may be regarded credible.
Key hypotheses and statistical significance test
Hypothesis: In view of corporate objective of shareholders' wealth-maximization, it has
been hypothesized that shareholders of acquirer firms would earn excess to normal
returns on M&A announcements.
Statistical test: To test the hypotheses, the study uses 'crude dependence adjustment test'
(Brown and Warner, 1980). The test compensates for the potential dependence of returns
across the security-events. For the purpose, Brown and Warner suggest the estimation of
standard deviation of abnormal returns from the time series of residual returns over the
estimation period; the use of single variance estimate for the entire sample would
overcome the potential problem of the unequal variance across the securities.
3.3 Computation of abnormal returns
The event study examines the extent of price movement actually caused by event
announcement, i.e. the abnormal behavior in the stock return. Analysis of abnormal
returns associated with the announcement of a corporate event is the core of event study
analysis. The study uses following computation steps to measure the abnormal returns
from M&A announcement.
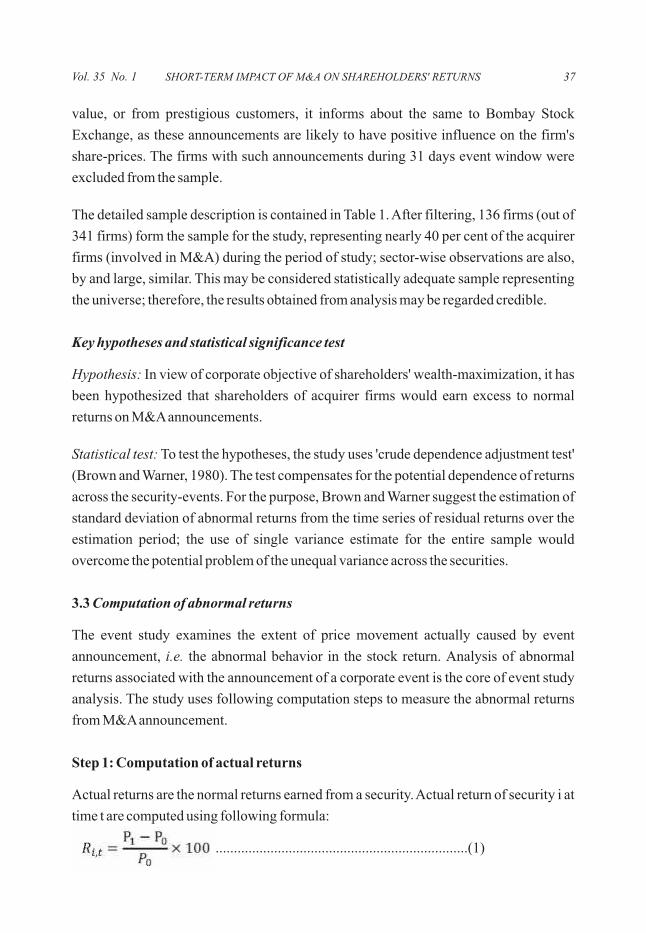
Step 1: Computation of actual returns
Actual returns are the normal returns earned from a security. Actual return of security i at
time t are computed using following formula:
.....................................................................(1)
SHORT-TERM IMPACT OF M&A ON SHAREHOLDERS' RETURNS 37Vol. 35 No. 1
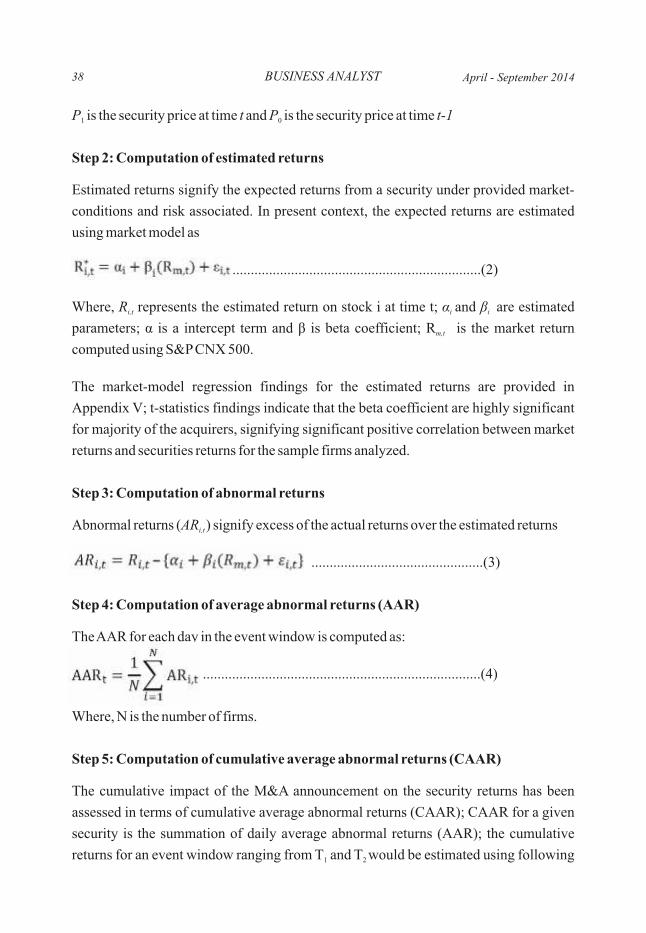
38 BUSINESS ANALYST
P is the security price at time t and P is the security price at time t-11 0
Step 2: Computation of estimated returns
Estimated returns signify the expected returns from a security under provided market-
conditions and risk associated. In present context, the expected returns are estimated
using market model as
....................................................................(2)
Where, R represents the estimated return on stock i at time t; α and β are estimated i,t i i
parameters; α is a intercept term and β is beta coefficient; R is the market return m,t
computed using S&P CNX 500.
The market-model regression findings for the estimated returns are provided in
Appendix V; t-statistics findings indicate that the beta coefficient are highly significant
for majority of the acquirers, signifying significant positive correlation between market
returns and securities returns for the sample firms analyzed.
Step 3: Computation of abnormal returns
Abnormal returns (AR ) signify excess of the actual returns over the estimated returnsi,t
...............................................(3)
Step 4: Computation of average abnormal returns (AAR)
The AAR for each day in the event window is computed as:
............................................................................(4)
Where, N is the number of firms.
Step 5: Computation of cumulative average abnormal returns (CAAR)
The cumulative impact of the M&A announcement on the security returns has been
assessed in terms of cumulative average abnormal returns (CAAR); CAAR for a given
security is the summation of daily average abnormal returns (AAR); the cumulative
returns for an event window ranging from T and T would be estimated using following 1 2
April - September 2014
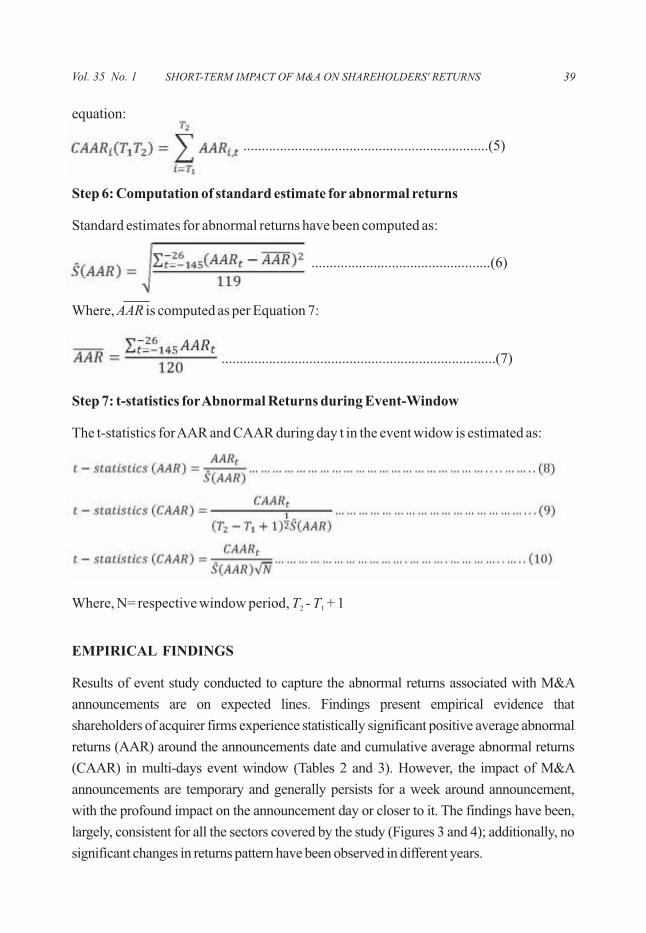
equation:
...................................................................(5)
Step 6: Computation of standard estimate for abnormal returns
Standard estimates for abnormal returns have been computed as:
.................................................(6)
Where, AAR is computed as per Equation 7:
...........................................................................(7)
Step 7: t-statistics for Abnormal Returns during Event-Window
The t-statistics for AAR and CAAR during day t in the event widow is estimated as:
Where, N= respective window period, T - T + 12 1
EMPIRICAL FINDINGS
Results of event study conducted to capture the abnormal returns associated with M&A
announcements are on expected lines. Findings present empirical evidence that
shareholders of acquirer firms experience statistically significant positive average abnormal
returns (AAR) around the announcements date and cumulative average abnormal returns
(CAAR) in multi-days event window (Tables 2 and 3). However, the impact of M&A
announcements are temporary and generally persists for a week around announcement,
with the profound impact on the announcement day or closer to it. The findings have been,
largely, consistent for all the sectors covered by the study (Figures 3 and 4); additionally, no
significant changes in returns pattern have been observed in different years.
SHORT-TERM IMPACT OF M&A ON SHAREHOLDERS' RETURNS 39Vol. 35 No. 1
40 BUSINESS ANALYST
Findings pertaining to auto-ancillary sector
For auto-ancillary sector, the AAR have been positive for sixteen days during 31-days
window; inter-se, the more robust impact has been observed closer to the announcement
date. For M&A announcements pertaining to 2002-08, the positive AAR have been
noted for eight to nine days around announcement date; two to three days prior (t=-3) and
four to five days (t=+5) after announcement (Table 2). The findings are similar for all the
years, covered by the study. The trend of AAR and CAAR accruing to the shareholders
of acquirer firms during the 31-days event- window are portrayed in Figures 5 and 6.
Figures manifest positive trend related to AAR and CAAR for each year subsequent to
M&A announcement from 2002 to 2008. All the seven lines (one for each year, i.e. six
lines plus one for the aggregated period 2002-08), by and large, appear to be moving in
congruence; implying M&A announcements provide consistent favorable short-term
returns to investors in the Indian stock market.
An in-depth examination of event window from investors perspective indicates, the
window ranging from day t (-3) to day (-1) to be the most conducive/rewarding window,
as maximum returns have been earned during this window period; the AAR of day t (-1)
seems to be high 2.43 per cent for all the years (2002-08); it is statistically significant (at
99 per cent confidence level).
From the perspective of cumulative returns, the increasing CAAR pattern has been
observed from two or three days prior to announcement up to day t (0), following modest
growth for five to seven days thereafter (Figure 5). Relevant data indicates that windows
of day t (-2) to day t (4) and from day t (-2) to day t (3) are most beneficial windows,
registering significant accumulation of returns in range of 4.5 to 5 per cent. Thus, the
findings are suggestive of such investments (made in shares of acquiring firms around
announcement date of M&A) as rewarding (Table 8).
Equally significant finding is that the AAR pattern on the event date, i.e. day t (0),
appears to be negligible or even negative for most of the years. The excess selling
pressure developed in the market, in response to the substantial hike in stock prices prior
to announcement, perhaps could be the reason. Notwithstanding the substantial fall in
the returns on day t (0), the pattern of positive AAR has shown a modest revival, which
continues for a few days. The resurgence of positive AAR wave after day t (0)
corroborates that the abnormal returns observed around announcement were due to
affirmative investors' perceptions for M&A.
April - September 2014
In view of preceding findings, it seems reasonable to conclude that M&A
announcements in auto-ancillary sector are positive news for the investors in the stock
market. The investors perceive M&A to be the value-creating decisions; as a
consequence positive AAR starts triggering, as soon as the M&A announcements noise
arrives in the market; however, it is not long lasting and vanishes within a week after
announcement.
Pharmaceutical sector
Findings pertaining to pharmaceutical sector are, largely, on the pattern of auto-ancillary
sector. Results (as anticipated) show favorable impact of M&A announcement on the
stock-returns of acquirer firms from Indian pharmaceutical sector. Relevant data
(contained in Table 4) indicates a positive drift in the AAR around the M&A
announcement. The findings for all the years appear to be in congruence, as depicted by
the parallel movement of the AAR and CAAR for all the years (Figures 7 and 8).
Results manifest positive abnormal returns for six days around M&A announcement,
initiated from day t (-3) to day (2). The AAR up to day t (-4) seems to be virtually
negative; there appears to be a positive momentum on day t (-3) in majority of the years
covered by the study; in fact, the years 2004-05 and 2005-06 exhibit significant
abnormal returns of 3 to 4 per cent. The AAR trend from day t (-2) to day t (0) also
appears to be positive, yet, there has been a significant decline in returns in relation to
returns observed on day t(-3); this might be due to the excess selling activity in the
market in response to the substantial price rise observed in the market on day t(-3). The
major impact of M&A announcement has been observed after the announcement date;
findings indicate the day t (2) to be the most beneficial/rewarding day, reflecting the
maximum or near to maximum returns during the entire window.
As far as accumulations of returns are concerned, negative CAAR has been noted during
the entire window; implying no significant accumulated returns to the shareholders of
the acquirer firms (Table 5 and Figure 8). CAAR from day t (-15) is evidencing a
consistent decline; however, from the day t (-4) onwards, the declining tendency seems
to have reduced as indicated by the upward slope of CAAR curve from day t (-3) to day t
(2) (though negative), prima-facie, signifying returns accumulation in six days window
(Figure 8).
The window from day t (-3) to day (2) has been identified as the most beneficial window,
SHORT-TERM IMPACT OF M&A ON SHAREHOLDERS' RETURNS 41Vol. 35 No. 1
with maximum accumulation of returns of 2.8 per cent; additionally, significant CAAR
of about 2 per cent has been observed in the window from day t (-1) to day t (2).
The findings corroborate positive impact of M&A announcements on stock-returns of
the acquirer firms from pharmaceutical sector in India; nevertheless, the impact subsists
for the very short-span of time, say, for a few days around M&A announcements.
Findings pertaining to IT sector
IT sector acquirer firms manifest positive abnormal returns and cumulative abnormal
returns associated with M&A announcement. Results show a pattern of positive AAR
throughout the event window for all the years analyzed; the AAR are positive for
eighteen days for M&A announced during the years 2002 to 2008; within this, the
returns for four days are statistically significant. The findings are, by and large,
consistent for all the years.
Although, the spread of positive returns seems to be during the entire window, yet, the
rigorous impact of M&A has been observed closer to the announcement date, either one-
two days prior (t=-2) to announcements or on event-date itself. The AAR on t (-1) or day t
(0) are positive and sizeable for most of the years analyzed, followed by significant fall
on day t (1) (Table 6 and Figure 9).
Rally of positive AAR evidenced throughout the window has yielded the accretion of
significant returns during the event-window. For instance, the CAAR are positive during
the entire-window for the years 2005 to 2008; consistent pattern of positive CAAR from
day t(-13) to day t (+1) has been noted for the year 2002-03; similarly, positive CAAR for
27 days has been noted for the announcements pertaining to 2003-04. The maximum
accumulation of returns has been evidenced in windows from day t (-1 to + 6), day (-1 to
+3), and day (-1 to +4).
Findings signify the significant accretion of returns in relatively larger windows for IT
sector vis-a-vis auto-ancillary and pharmaceutical sectors. For instance, for the M&A
announcements during the period of study (2002-08) window from day (-15 to +15) has
been identified as most beneficial, evidencing the trail of positive AAR and CAAR
during the entire window. Year-wise analysis also exhibits similar pattern of large
conducive windows; for the year 2002-03, CAAR of 4.9 per cent have been noted from
day t (-13) to day t(-1); year 2003-04 exhibits 8.5 per cent returns from day t(-14) to day
BUSINESS ANALYST42 April - September 2014
t(-8); for year 2004-05 accretion of 20.27 per cent of CAAR has been noted from day t(-
2) to day t(10); year 2005-06 has evidenced a significant accumulation of above 28 per
cent of CAAR from day t (-15) to day (14); the year 2007-08 has evidenced the CAAR of
nearly 12 per cent during the window of t (-15) to day t (2). The positive pattern of AAR
and CAAR observed during the entire window reflects the confident behaviour of
investors in the stock market, towards M&A announcement (Table 8).
In view of above findings, it is reasonable to conclude that M&A announcements
information has a positive effect on the share-prices of the acquirer firms in India. M&A
announcements are affirmative news of the investors in the stock market; investors
associate M&A announcement with bright future prospects of the acquirer firms,
leading to the favourable fluctuation in security prices for a few days around M&A
announcement.
In view of these empirical evidences, signifying the significant abnormal returns and
cumulative abnormal returns to the shareholders acquirer firms associated with M&A
announcement, the hypothesis that acquirer firms' shareholders earn excess to normal
returns associated with M&A announcement has been accepted.
CONCLUDING OBSERVATIONS
The paper addresses the impact of M&A announced in Indian corporate sector during the
years 2002-08 on stock returns of acquirer firms. M&A panorama has undergone
tremendous changes during different phases; recent/sixth M&A wave (the period
covered by the study), in fact, was reckoned in India as M&A tsunami, with valuation
touching USD 70 billion. Additionally, with the dynamism of environment (economic,
regulatory, industrial, technological), material changes have been observed in corporate
mission, vision and goals, risk taking attitude, investors sentiments, etc. The study adds
value to literature by exploring the returns gained by shareholders of acquirer firms in
India during recent M&A wave. Using multi-sectoral framework (involving acquirer
firms from auto-ancillary, IT and pharmaceutical sector), with the sample-mix
representative of manufacturing, service and ancillary sectors, the study has attempted
to provide a comprehensive view of entire industry. Additionally, study captures
exclusive impact of M&A (by cleaning the event window for contemporaneous events).
Results indicated that the M&A taken place in Indian corporate sectors during recent
M&A wave were value-augmenting; empirical findings showed the average abnormal
SHORT-TERM IMPACT OF M&A ON SHAREHOLDERS' RETURNS 43Vol. 35 No. 1
returns (AAR) for few days and cumulative average abnormal returns (CAAR) in multi-
days window earned by the shareholders of acquirer firms around M&A announcement
during the event window.
Findings are suggestive of M&A announcement as positive information for investors in
the Indian stock market. In other words, investors associate M&A as value-enhancing
strategies.
Figure 1 exhibits, the Nifty returns observed during 2002 to 2012. The present sample
covers two phases of economic development, first: accelerating phase (2002-2007) and
the diminishing phase (2007-08). Irrespective of the fact, no significant difference has
been observed in the pattern of returns across different phases of development. From this
perspective, it is reasonable to conclude that market is more responsive towards
current/latest events (a week older or slightly more).
Muti-sectoral framework of the study contributes in identifying the difference in M&A
impact across sectors; results show better stock-returns as well as relatively larger
return-conducing window for IT sector acquirer firms; where, auto-ancillary and
pharmaceutical sectors have shown positive trails of AAR from two to three days prior to
one to five days in the post-announcement window, for the IT sector, drift of positive
abnormal returns has been noted in the entire window. Additionally, maximum impact of
M&A announcement on acquirer firms affiliated to IT sector has been identified on the
announcement date, whereas, the auto-ancillary and pharmaceutical sectors have shown
negligible returns on the announcement date. Maximum abnormal returns for the auto-
ancillary have been observed prior to announcement date and for the pharmaceutical
sector prior to as well as two days after the announcement. The excess selling pressure
developed in the stock market, in response to the unexpected highly lucrative prices
observed prior to announcement, perhaps could have been the reason for low returns on
zero date. The resurgence of the modest positive returns for few days, following the
announcement day, indicates the possibility of the existence of speculative pressure
(also) in the pre-announcement window that seems to have wiped out subsequent to the
announcement; perhaps, this has caused the market to revert back to its normal price
level. It is worth mentioning that M&A wave was primarily attributable to IT sector
boom observed 2004 onwards. This perhaps could be the reason for better stock
performance observed of IT sector. These findings are suggestive of industry induced
M&A as more value-enhancing/ return conducive.
BUSINESS ANALYST44 April - September 2014
Findings corroborate M&A as wealth-augmenting decisions for investors in the Indian
stock market. Investors, from short-term investment perspective could gain substantial/
good returns by planning the sale and purchase of the securities of Indian corporate
acquirer firms closer to M&A announcement. From long-term investors' perspective,
positive response of stock market around M&A announcement signals bright future
prospects for the shareholders of the acquirer firms. The affirmative investors' response
to M&A announcement is prima-facie, suggestive of M&A potential; however, the
possibility of speculation cannot, perhaps, be completely ruled-out. Additionally, these
decisions involve long gestation period; further, M&A along with financial
restructuring, also involve integration of qualitative/non-financial aspects. For better
assessment, it would be useful to incorporate all possible aspects likely to be influenced
by M&A decisions (financial, non-financial, qualitative, quantitative, etc.).
REFERENCES
Agrawal A Jaffe J F and Mandelker G N. 1992. “The Post-Merger Performance of Acquiring Firms: A Re-Examination of an Anomaly” Journal of Finance 47, 1605-1621.
Akbulut M E and Matsusaka J G .2003. “Fifty Years of Diversification Announcements” Working paper, Marshall School of Business University of Southern California.
Andrade G Mitchell M Stafford E .2001. “New Evidence and Perspectives on Mergers” Journal of Economic Perspectives 15, 103-120.
Anand M and Singh J .2008. “Impact of Merger Announcements On Shareholders Wealth: Evidence from Indian Private Sector Banks” Vikalpa 33(1), 35-54.
Beitel P Schiereck D and Wahrenburg M .2004. “Explaining M&A Success In European Banks” European Financial Management 10, 109-139.
Brown S J and Warner J B .1980. “Measuring Security Price Performance” Journal of Financial Economics 8(3), 205-258.
Brown SJ and Warner JB .1985. “Using Daily Stock Returns: The Case of Event Studies” Journal of Financial Economics 14 (1), 3-31.
Bruner R F .2002. “Does M&A Pay? A Survey of Evidence for the Decision-Maker” Journal of Applied Finance 12 pp 48-68.
Cakici N Hessel C and Tandon K .1996. “Foreign Acquisitions in The United States: Effect on Shareholder Wealth of Foreign Acquiring Firms” Journal of Banking and Finance 20(2), 307-329.
Corhay A and Rad A T .2000. “International Acquisitions and Shareholder Wealth Evidence from the Netherlands” International Review of Financial Analysis 9(2), 163-174.
DeLong G .2001. “Stockholder Gains From Focusing Versus Diversifying Bank Mergers” Journal of Financial Economics 16 (2), 221-252.
Datta D K Pinches G E and Narayanan V K .1992. “Factors Influencing Wealth Creation from Mergers and Acquisitions - A Meta-Analysis” Strategic Management Journal 13, 67-84.
Datta D K and Puia G .1995. “Cross-Border Acquisitions: An Examination of the Influence of Relatedness and Cultural Fit on Shareholder Value Creation in Us Acquiring Firms” MIR: Management International Review 337-359.
SHORT-TERM IMPACT OF M&A ON SHAREHOLDERS' RETURNS 45Vol. 35 No. 1
Doukas J Holmen M and Travlos N .2002. “Diversification Ownership and Control of Swedish Corporations” European Financial Management 8, 281-314.
Eckbo E and Thorburn K .2000. “Gains to Bidder Firms Revisited: Domestic and Foreign Acquisitions in Canada” Journal of Financial and Quantitative Analysis 35 (1), 1-25.
Fee C E and Thomas S .2004. “Sources Of Gains In Horizontal Mergers: Evidence from Customer Supplier and Rival Firms” Journal of Financial Economics 74(3), 423-460.
Goergen M and Renneboog L .2004. “Shareholder Wealth Effects of European Domestic and Cross-Border Takeover Bids” European Financial Management 10, 9-45.
Hassan M Patro D K Tuckman H and Wang X .2007. “Do Mergers and Acquisitions Create Shareholder Wealth In The Pharmaceutical Industry? International Journal of Pharmaceutical and Healthcare Marketing 1(1), 58-78.
Houston J F James C M and Ryngaert M D .2001. “Where Do Merger Gains Come from? Bank Mergers from the Perspective of Insiders and Outsiders. Journal of Financial Economics 60, 285-331.
Jensen M C and Ruback R S .1983. “The Market for Corporate Control: The Scientific Evidence” Journal of Financial Economics 11, 3-50.
Jensen MC .1986. “Agency Costs of Free Cash Flow Corporate Finance and Takeovers” American Economic Review 76, 323-329.
King D R Dalton D R Daily C M and Covin J G .2004. “Meta-Analyses of Post-Acquisition Performance: Indications of Unidentified Moderators” Strategic Management Journal 25(2), 187-200.
Kohers N and Kohers T .2000. “The Value Creation Potential of High-Tech Mergers. Financial Analysts Journal 40-50.
Kumar Rajesh B and Paneerselvam S .2009. “Mergers Acquisitions and Wealth Creation: A Comparative Study in the Indian Context” IIMB Management Review 21 (3), 222-244.
Kuipers D Miller D and Patel A .2002. “Shareholder Wealth Effects in the Cross-Border” Market for Corporate Control Mimeo Indiana University.
Maquiera C Megginson W and Nail L .1998. “Wealth Creation versus Wealth Redistributions in Pure-Stock-For-Stock Mergers” Journal of Financial Economics 48, 3-33.
Markides C C and Ittner C D .1994. “Shareholder Benefits from Corporate International Diversification: Evidence from Us International Acquisitions” Journal of International Business Studies 343-366.
Martinez-Jerez F A .2002. “Interaction Between Accounting and Corporate Governance: Evidence from Business Combinations” Working Paper Harvard University.
Mittal A Sushil and Jain P K .2012. “Financial Perspective of Mergers and Acquisitions: A Study from Indian Pharmaceutical Sector” Journal of Accounting and Finance 26 (2), 38-69.
Morck R Shleifer A and RW Vishny .1990. “Do Managerial Objectives Drive Bad Acquisitions” Journal of Finance 45 (1), 31-48.
Mulherin H J and AL Boone .2000. “Comparing Acquisitions and Divestures” Journal of Corporate Finance 6, 116-139.
Rani N .2013b. “Mergers And Acquisitions: A Study of Short-Term Abnormal Returns Long-Term Financial Performance and Corporate Governance” PhD Dissertation submitted at Department of Management Studies Indian Institute of Technology Delhi.
Schwert GW .1996. “Markup Pricing in Mergers and Acquisitions” Journal of Financial Economics, 41, 153-192.
Sirower M L .1997. “The Synergy Trap: How Companies Lose the Acquisition Game” Free Press, New York.
Walker M M .2000. “Corporate Takeovers Strategic Objectives and Acquiring-Firm Shareholder Wealth” Financial management, 53-66.
BUSINESS ANALYST46 April - September 2014
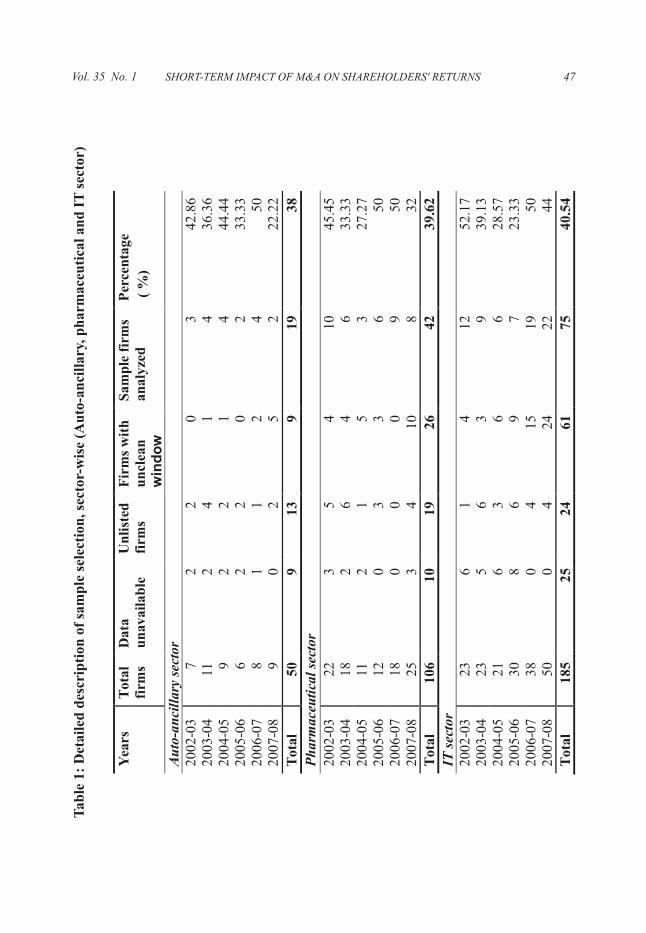
Yea
rs
Tot
al
firm
s D
ata
un
ava
ilab
le
Un
list
ed
firm
s
Fir
ms
wit
h
un
clea
n
win
do
w
Sam
ple
fir
ms
anal
yzed
P
erce
nta
ge
( %
)
Au
to-a
nci
llar
y se
ctor
200
2-0
3 7
2 2
0
3
42.8
6
200
3-0
4 11
2
4 1
4
36
.36
200
4-0
5 9
2 2
1
4
44.4
4
200
5-0
6 6
2 2
0
2
33.3
3
200
6-0
7 8
1 1
2
4
50
200
7-0
8 9
0 2
5
2
22.2
2
Tota
l 50
9
13
9
19
38
Ph
arm
aceu
tica
l se
ctor
200
2-0
3 22
3
5 4
10
45
.45
200
3-0
4 18
2
6 4
6
33
.33
200
4-0
5 11
2
1 5
3
27
.27
200
5-0
6 12
0
3 3
6
50
200
6-0
7 18
0
0 0
9
50
200
7-0
8 25
3
4 10
8
32
T
ota
l 10
6 10
19
26
42
39
.62
IT
sec
tor
200
2-0
3 23
6
1 4
12
52
.17
200
3-0
4 23
5
6 3
9
39
.13
200
4-0
5 21
6
3 6
6
28
.57
200
5-0
6 30
8
6 9
7
23
.33
200
6-0
7 38
0
4 15
19
50
200
7-0
8 50
0
4 24
22
44
T
ota
l 18
5 25
24
61
75
40
.54
Tab
le 1
: D
etai
led
des
crip
tion
of
sam
ple
sel
ecti
on, s
ecto
r-w
ise
(Au
to-a
nci
llar
y, p
har
mac
euti
cal
and
IT
sec
tor)
SHORT-TERM IMPACT OF M&A ON SHAREHOLDERS' RETURNS 47Vol. 35 No. 1
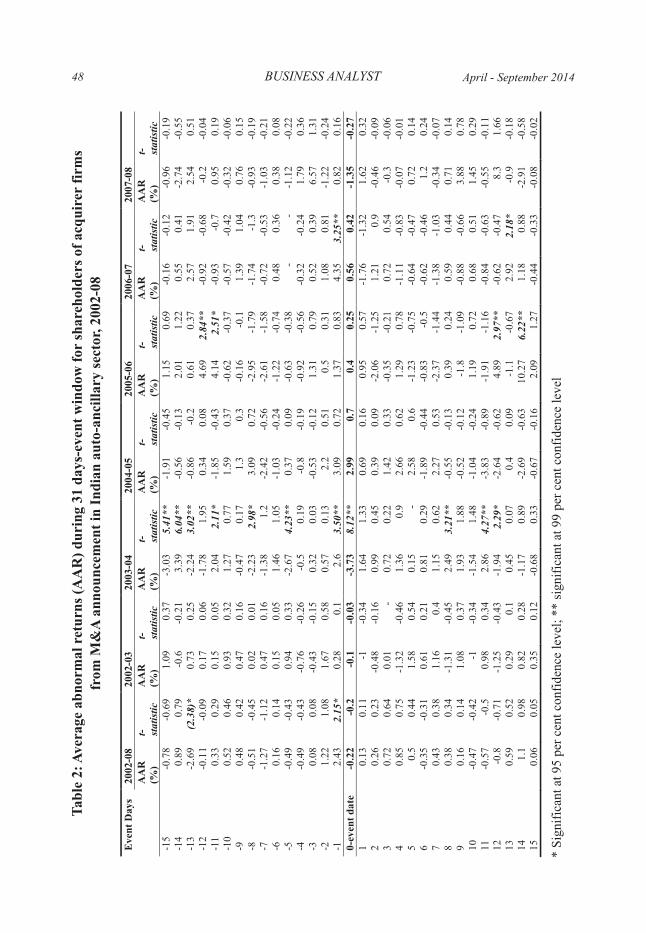
Tab
le 2
: A
vera
ge a
bn
orm
al r
etu
rns
(AA
R)
du
rin
g 31
day
s-ev
ent
win
dow
for
sh
areh
old
ers
of
acq
uir
er f
irm
s
from
M&
A a
nn
oun
cem
ent
in I
nd
ian
au
to-a
nci
llar
y se
ctor
, 200
2-08
* S
igni
fica
nt a
t 95
per
cen
t co
nfid
ence
lev
el;
** s
igni
fica
nt a
t 99
per
cen
t co
nfid
ence
lev
el
BUSINESS ANALYST48 April - September 2014
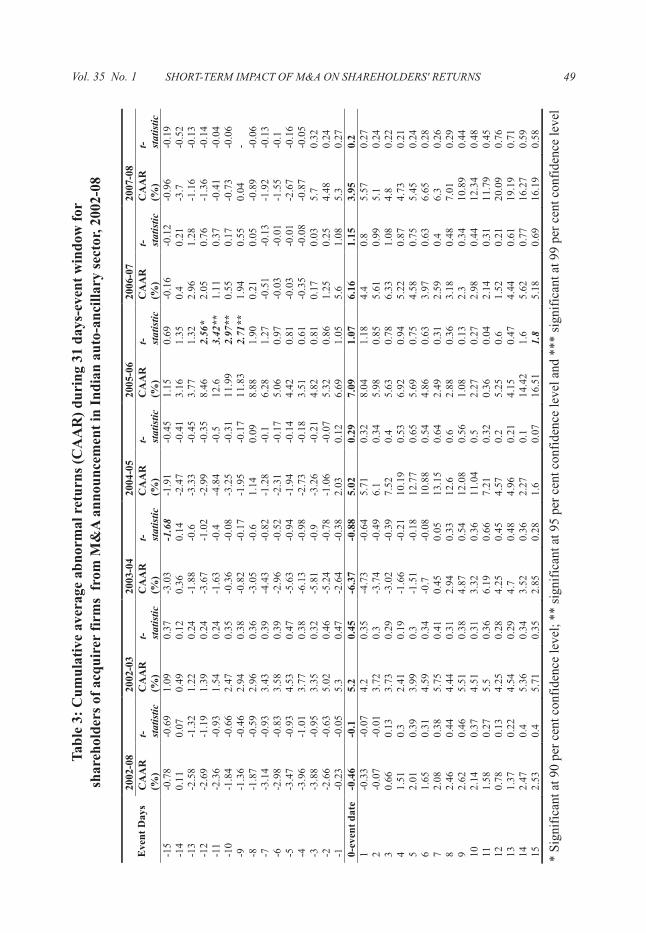
Tab
le 3
: C
um
ula
tive
ave
rage
ab
nor
mal
ret
urn
s (C
AA
R)
du
rin
g 31
day
s-ev
ent
win
dow
for
shar
ehol
der
s of
acq
uir
er f
irm
s f
rom
M&
A a
nn
oun
cem
ent
in I
nd
ian
au
to-a
nci
llar
y se
ctor
, 200
2-08
* S
igni
fica
nt a
t 90
per
cen
t co
nfid
ence
lev
el;
** s
igni
fica
nt a
t 95
per
cen
t co
nfid
ence
lev
el a
nd *
** s
igni
fica
nt a
t 99
per
cen
t co
nfid
ence
lev
el
SHORT-TERM IMPACT OF M&A ON SHAREHOLDERS' RETURNS 49Vol. 35 No. 1
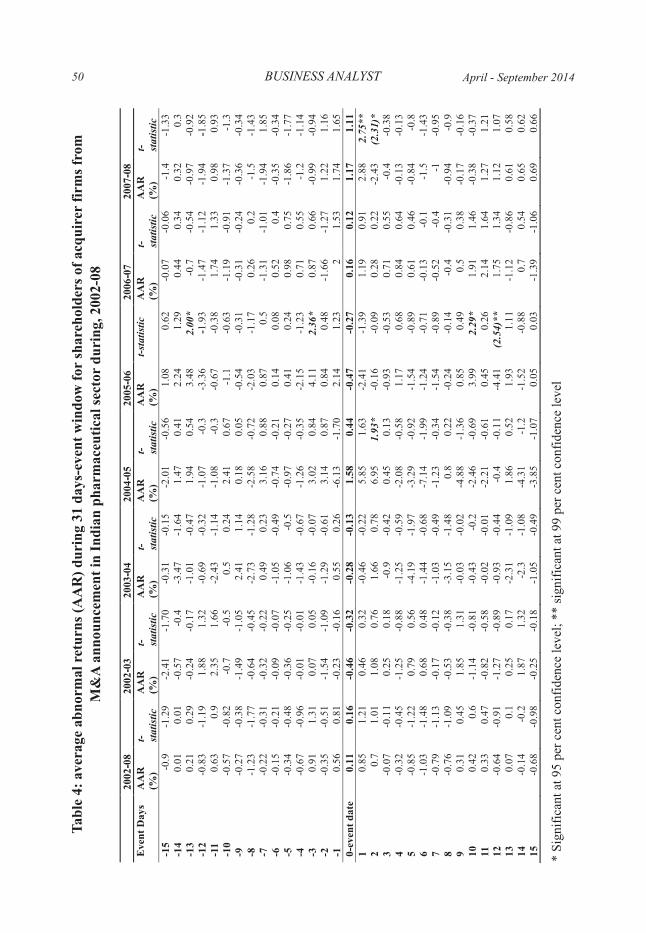
Tab
le 4
: av
erag
e ab
nor
mal
ret
urn
s (A
AR
) d
uri
ng
31 d
ays-
even
t w
ind
ow f
or s
har
ehol
der
s of
acq
uir
er f
irm
s fr
om
M&
A a
nn
oun
cem
ent
in I
nd
ian
ph
arm
aceu
tica
l se
ctor
du
rin
g, 2
002-
08
* S
igni
fica
nt a
t 95
per
cen
t co
nfid
ence
lev
el;
** s
igni
fica
nt a
t 99
per
cen
t co
nfid
ence
lev
el
BUSINESS ANALYST50 April - September 2014
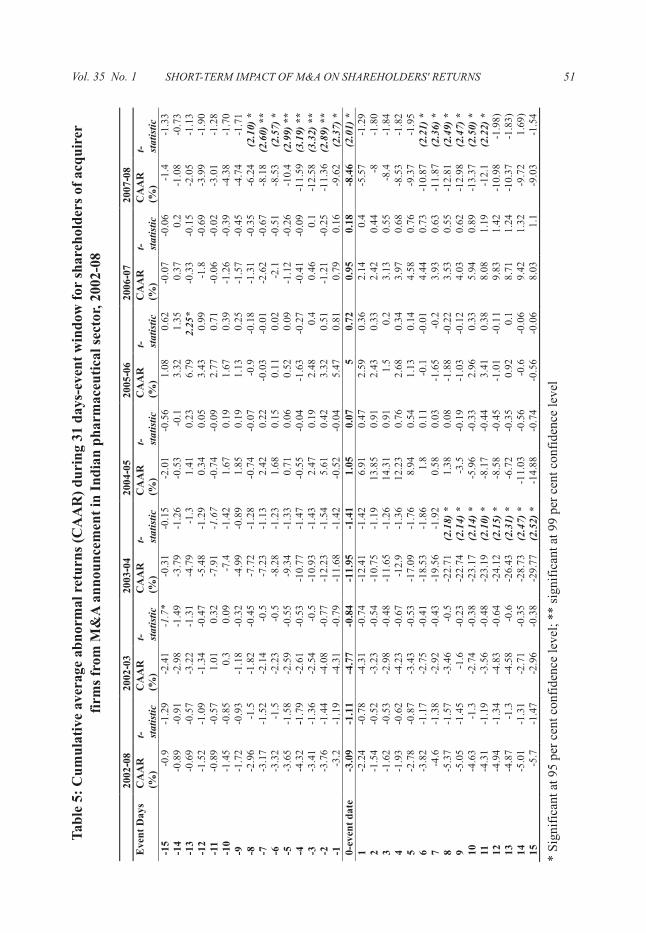
Tab
le 5
: C
um
ula
tive
ave
rage
ab
nor
mal
ret
urn
s (C
AA
R)
du
rin
g 31
day
s-ev
ent
win
dow
for
sh
areh
old
ers
of a
cqu
irer
firm
s fr
om M
&A
an
nou
nce
men
t in
In
dia
n p
har
mac
euti
cal
sect
or, 2
002-
08
* S
igni
fica
nt a
t 95
per
cen
t co
nfid
ence
lev
el;
** s
igni
fica
nt a
t 99
per
cen
t co
nfid
ence
lev
el
SHORT-TERM IMPACT OF M&A ON SHAREHOLDERS' RETURNS 51Vol. 35 No. 1
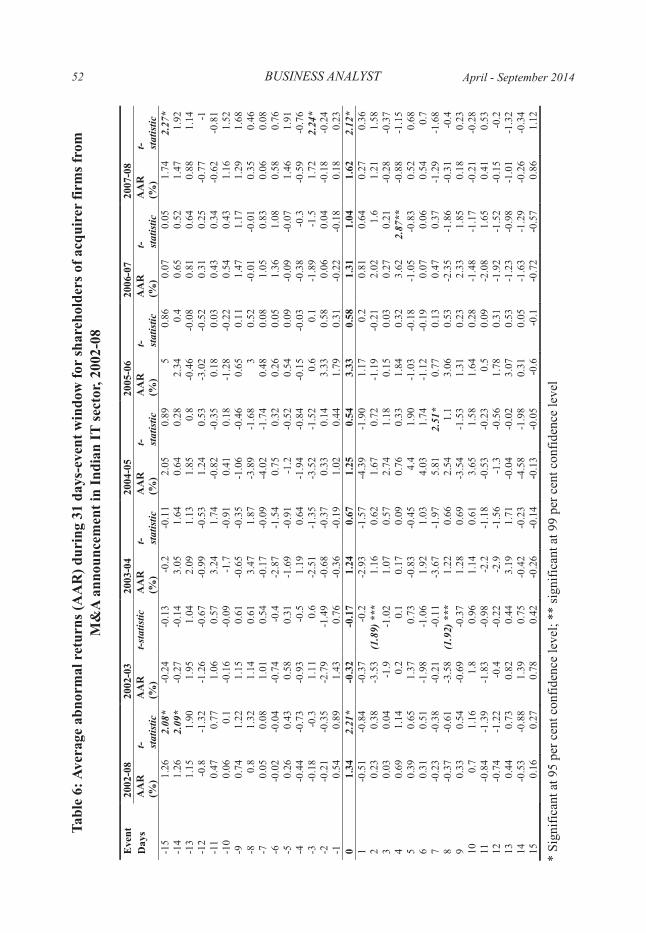
Tab
le 6
: A
vera
ge a
bn
orm
al r
etu
rns
(AA
R)
du
rin
g 31
day
s-ev
ent
win
dow
for
sh
areh
old
ers
of a
cqu
irer
fir
ms
from
M&
A a
nn
oun
cem
ent
in I
nd
ian
IT
sec
tor,
200
2-08
* S
igni
fica
nt a
t 95
per
cen
t co
nfid
ence
lev
el;
** s
igni
fica
nt a
t 99
per
cen
t co
nfid
ence
lev
el
BUSINESS ANALYST52 April - September 2014
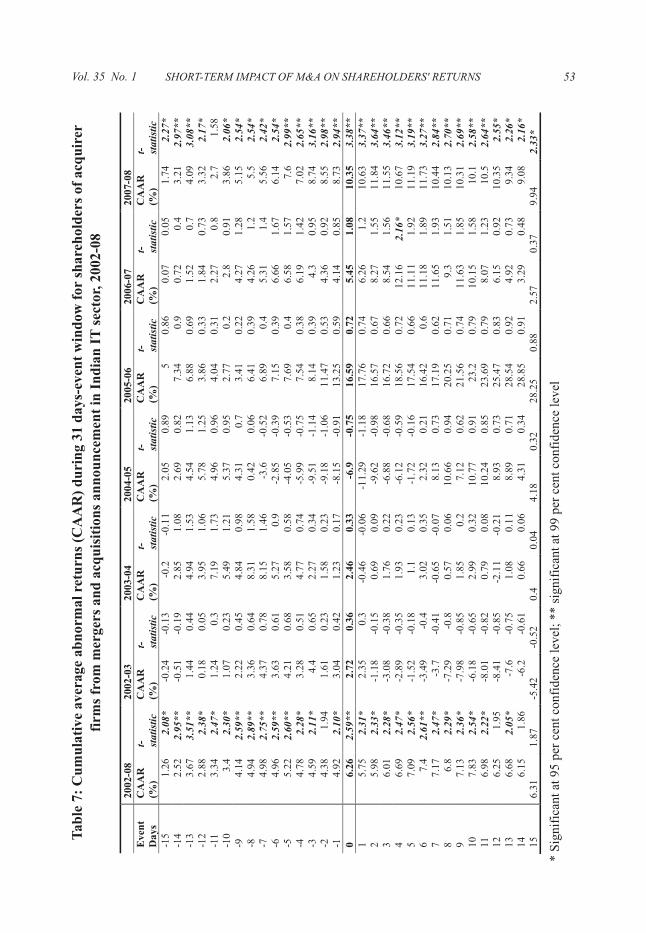
Tab
le 7
: C
um
ula
tive
ave
rage
ab
nor
mal
ret
urn
s (C
AA
R)
du
rin
g 31
day
s-ev
ent
win
dow
for
sh
areh
old
ers
of a
cqu
irer
firm
s fr
om m
erge
rs a
nd
acq
uis
itio
ns
ann
oun
cem
ent
in I
nd
ian
IT
sec
tor,
200
2-08
* S
igni
fica
nt a
t 95
per
cen
t co
nfid
ence
lev
el;
** s
igni
fica
nt a
t 99
per
cen
t co
nfid
ence
lev
el
SHORT-TERM IMPACT OF M&A ON SHAREHOLDERS' RETURNS 53Vol. 35 No. 1
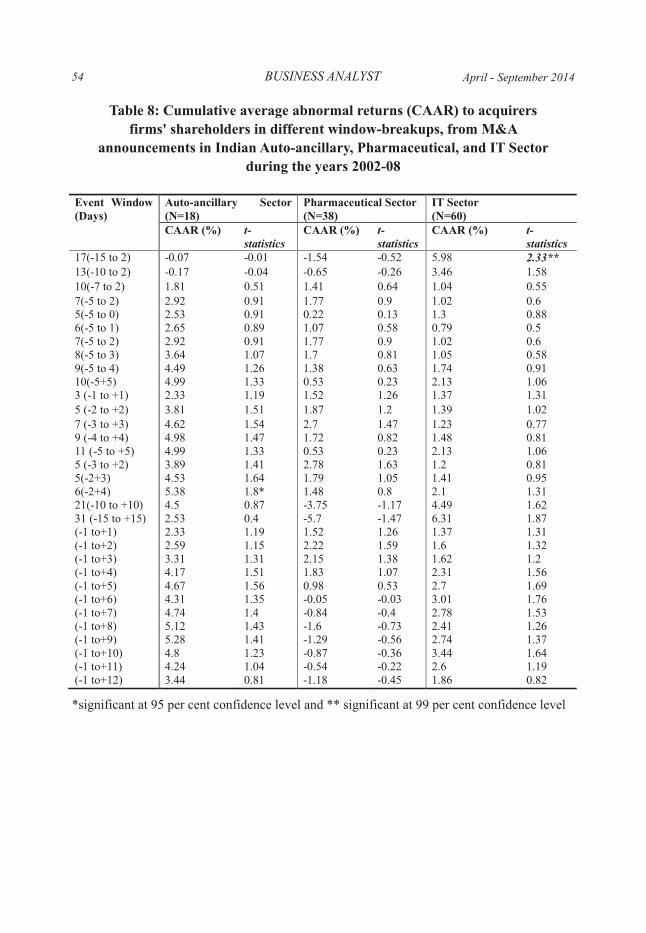
Table 8: Cumulative average abnormal returns (CAAR) to acquirers
firms' shareholders in different window-breakups, from M&A
announcements in Indian Auto-ancillary, Pharmaceutical, and IT Sector
during the years 2002-08
*significant at 95 per cent confidence level and ** significant at 99 per cent confidence level
BUSINESS ANALYST54 April - September 2014
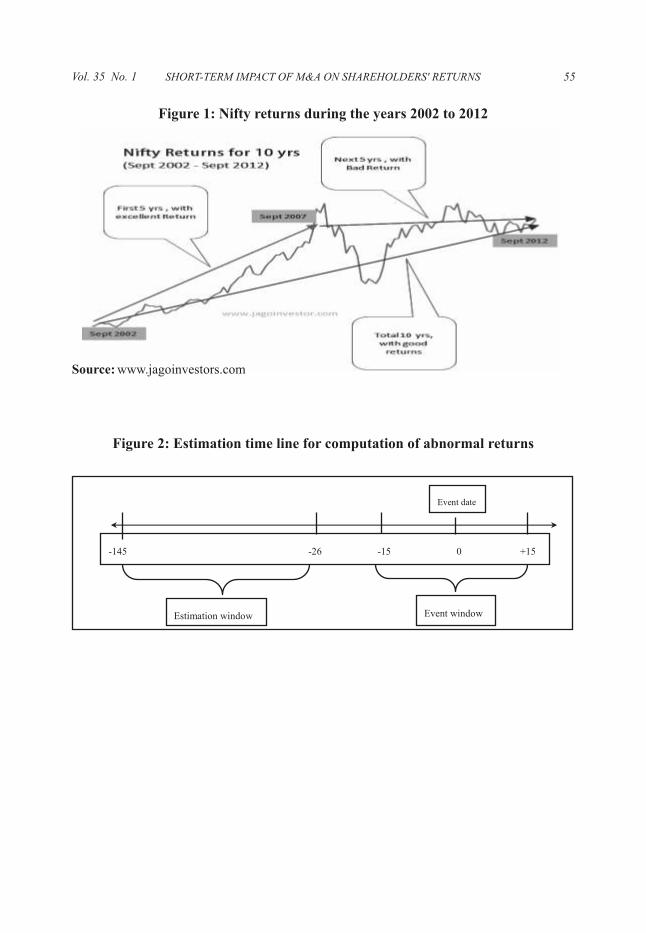
Figure 1: Nifty returns during the years 2002 to 2012
Source: www.jagoinvestors.com
Figure 2: Estimation time line for computation of abnormal returns
SHORT-TERM IMPACT OF M&A ON SHAREHOLDERS' RETURNS 55Vol. 35 No. 1
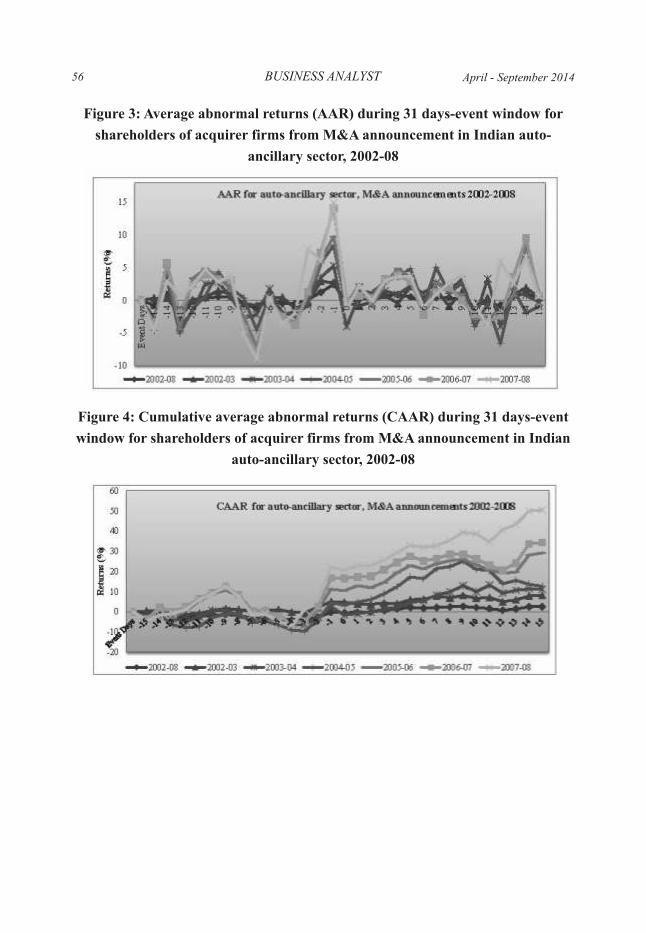
Figure 3: Average abnormal returns (AAR) during 31 days-event window for
shareholders of acquirer firms from M&A announcement in Indian auto-
ancillary sector, 2002-08
Figure 4: Cumulative average abnormal returns (CAAR) during 31 days-event
window for shareholders of acquirer firms from M&A announcement in Indian
auto-ancillary sector, 2002-08
BUSINESS ANALYST56 April - September 2014
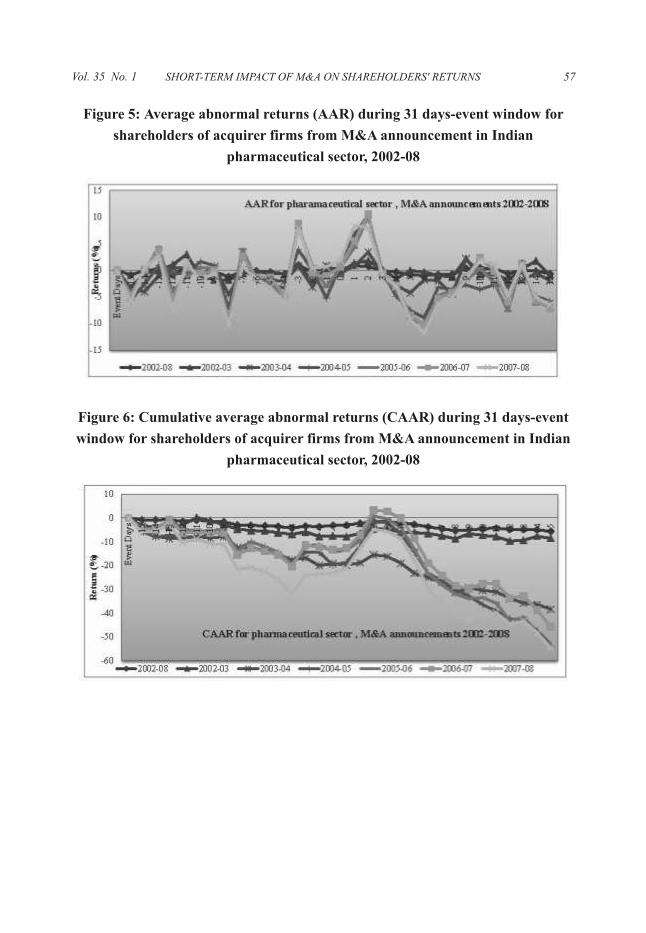
Figure 5: Average abnormal returns (AAR) during 31 days-event window for
shareholders of acquirer firms from M&A announcement in Indian
pharmaceutical sector, 2002-08
Figure 6: Cumulative average abnormal returns (CAAR) during 31 days-event
window for shareholders of acquirer firms from M&A announcement in Indian
pharmaceutical sector, 2002-08
SHORT-TERM IMPACT OF M&A ON SHAREHOLDERS' RETURNS 57Vol. 35 No. 1
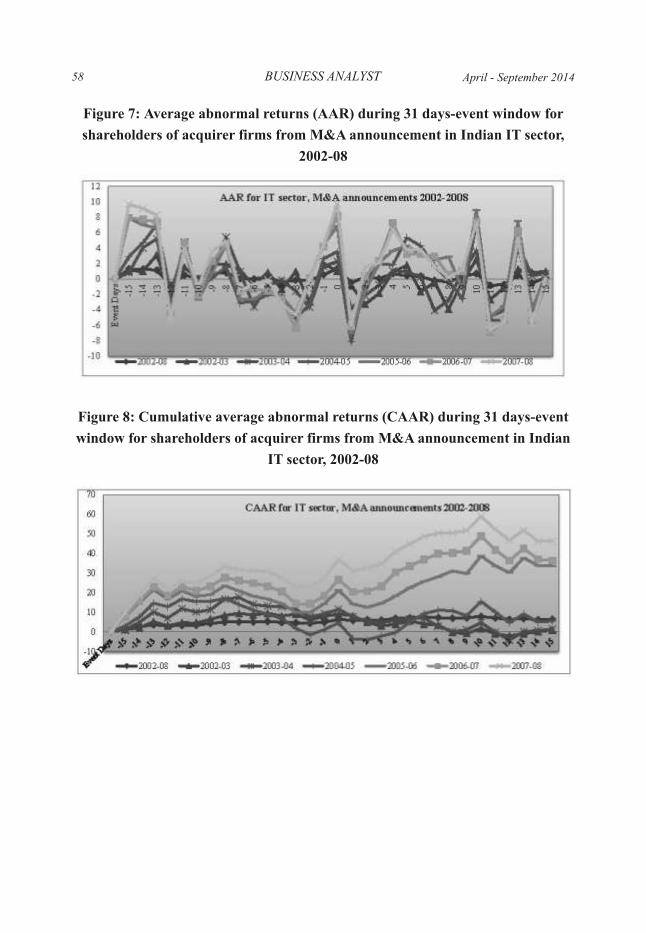
Figure 7: Average abnormal returns (AAR) during 31 days-event window for
shareholders of acquirer firms from M&A announcement in Indian IT sector,
2002-08
Figure 8: Cumulative average abnormal returns (CAAR) during 31 days-event
window for shareholders of acquirer firms from M&A announcement in Indian
IT sector, 2002-08
BUSINESS ANALYST58 April - September 2014
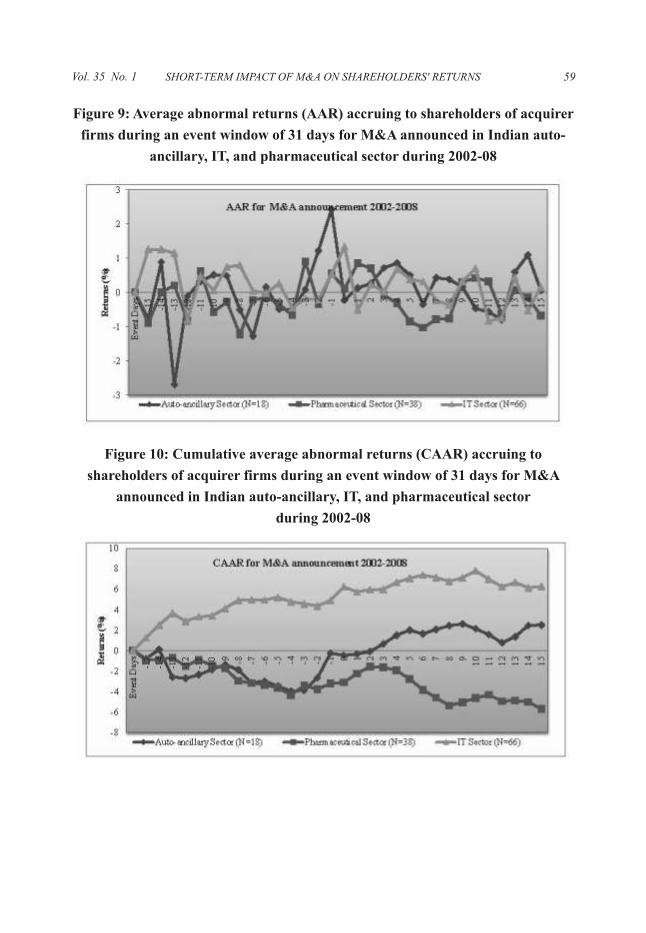
Figure 9: Average abnormal returns (AAR) accruing to shareholders of acquirer
firms during an event window of 31 days for M&A announced in Indian auto-
ancillary, IT, and pharmaceutical sector during 2002-08
Figure 10: Cumulative average abnormal returns (CAAR) accruing to
shareholders of acquirer firms during an event window of 31 days for M&A
announced in Indian auto-ancillary, IT, and pharmaceutical sector
during 2002-08
SHORT-TERM IMPACT OF M&A ON SHAREHOLDERS' RETURNS 59Vol. 35 No. 1

Vol. 35 No. 1
1Associate Professor, Department of Economics, Shri Ram College of Commerce, Delhi University.
FINANCIAL INCLUSION IN INDIA: RETROSPECT AND PROSPECTS
1Rituranjan
Financial inclusion has always remained a cherished objective of the planners and
policymakers in India but with the launching of Pradhan Mantri Jan Dhan Yojana in
August 2014, it has once again come to the centre-stage. The main area of concern in this
context is that despite the realisation of the significance of 'financial inclusion' for
economic development and social welfare and initiation of active steps in this direction
in the form of bank nationalisation, establishment of Regional Rural Banks, launching of
Lead Bank Scheme, promotion of Co-operative Banking and Self-Help Groups in the
provision of finance etc., the actual progress achieved on the front of 'financial inclusion'
remained far from satisfactory in India. In view of this, the monetary authority in recent
years has done a thorough reappraisal of its past policies concerning financial inclusion
and has identified some major defects and serious lacunae in this respect. By bridging
these lacunae and correcting for past policy defects, the Government and Reserve Bank
of India have of late come out with a renewed strategy that considers financial inclusion
as a commercially viable option and relies more on information technology and
envisages a better co-ordination among all stakeholders ranging from monetary
authority and other regulators to Non-Government Organisations, Civil Society
Institutions and the public at large. This new well-thought out, measured, balanced and
focussed policy approach can be reasonably expected to bring about 'financial inclusion
in India' in the real sense of the term in the foreseeable future.
INTRODUCTION
With the launching of Pradhan Mantri Jan Dhan Yojana on 28 August 2014, the issue of
'financial inclusion' has yet again come to the fore in the Indian economy. The idea of
financial inclusion, however, is not so new at least in the Indian context wherein the
planners and policymakers had realised well in time that with a view to establishing a
welfare state, banking and other financial services must be made accessible to the
ordinary public and common people especially those belonging to the poor and
downtrodden sections of the society.
61
BUSINESS ANALYST
Accordingly, 'financial inclusion' in some form or the other has always remained a
priority area on the part of monetary authority in India. Whether it was the
nationalisation of 14 and subsequently 6 major scheduled commercial banks in 1969 and
1980 respectively, the setting up of Regional Rural Banks (RRBs), the launching of Lead
Bank Scheme & Service Area Approach, the promotion of Co-operative Banking,
Micro-Finance and Self-Help Groups in the provision of finance, or simply the “cross-
subsidisation” of poor by the rich under the so-called “priority sector advancing”, all of
them reflected on the commitment of the State towards ensuring financial inclusion in
the Indian economy.
In this connection, Khan (2013) observes that Financial inclusion as a concept, process
and business proposition is not new for the banking sector of India and, in fact, it dates
back to the phase of nationalisation of banks and even beyond that when the Imperial
Bank was nationalised to become the State Bank of India in 1955 and its subsidiaries
were formed following the recommendations of the All India Rural Credit Survey
Committee (AIRCS) in 1954.
Yet, it has been empirically observed that in actual practice, very little progress could
actually be achieved on the front of 'financial inclusion' till recently in India as a large
part of rural and economically weaker segments of the population practically remained
'excluded' i.e. deprived of the services offered by formal banking channels and regulated
& organised financial markets in India.
Against this backdrop the present article tries to trace the developments on the front of
'financial inclusion' in India with a view to identifying as to what went wrong in the past
and how learning from its past mistakes, the monetary authority has, of late, geared up to
achieve 'financial inclusion' in every possible sense of the term in India.
Towards this end, the next section takes a closer look at the very concept as also
significance of 'financial inclusion' with special reference to the Indian economy. This is
followed by a detailed discussion of the potential benefits that are likely to accrue from
the attainment of financial inclusion especially in the case of a developing economy like
India. In the light of the significance and likely benefits of financial inclusion, what
active steps have been undertaken by the State and Reserve Bank of India in the direction
of its attainment forms the point of discussion of the subsequent section. The current
state of financial inclusion in the Indian economy is briefly analysed in the next section.
How the monetary authority, deriving lessons from the past failures, is trying its best to
62 April - September 2014
correct for the sorry state of affairs in this respect so as to achieve 'financial inclusion' in
the real sense of the term in India is discussed in detail in the next section. And finally, the
concluding section records the main findings and conclusions following from our
analysis.
Concept and Significance of Financial Inclusion
One of the primary guiding principle of economic planning and policy-making in India
is “Inclusive Growth”. What this essentially implies is that the benefits of economic
growth shall percolate down to the economically weaker and deprived sections of the
society who shall also be made to participate in and contribute to the process of planning
and policy making. This is very much in line with our long-cherished objective of
'people-oriented planning' and uplift of the downtrodden sections of the society with a
view to ultimately establishing a welfare state.
Owing to the inter-linkages between economic development and financial development,
however, it directly follows that the process of 'inclusive growth' cannot reach its logical
conclusion till its domain is widened and extended from the real sector to cover even the
financial sector in its ambit. This is what led to the increasing realisation of the
significance and importance of 'financial inclusion' on the part of planners and policy
makers in India. For, financial inclusion is nothing but the counterpart of inclusive
growth in the context of the overall financial system and delivery of financial services in
the economy.
Thus construed, financial inclusion may be defined as the process of making the poor
and economically weaker sections of the society an active participant in the functioning
of the financial system so that the benefits of financial services could reach out to the
masses rather than a selected few, i.e. rich people in the society. Towards this end, it is
imperative for the State and monetary authority to play a pro-active role in ensuring the
provision of timely and affordable financial services to the deprived, downtrodden and
economically worse-off sections of the society. This reasoning is quite analogous to the
State being called upon to directly play a pro-active role in ensuring a fairer distribution
of the fruits of growth so as to achieve 'inclusive growth' in the strict sense of the term in
view of various institutional rigidities and infrastructural bottlenecks due to which we
can no longer rely on the so-called “GNP Trickle-Down Hypothesis.”
It is against this backdrop that according to the Deputy Governor, Reserve Bank of India,
FINANCIAL INCLUSION IN INDIA: RETROSPECT AND PROSPECTS 63Vol. 35 No. 1
64 BUSINESS ANALYST
Chakrabarty (2013b), 'financial inclusion' is defined as the “process of ensuring access
to appropriate financial products and services needed by all sections of the society in
general and vulnerable groups such as weaker sections and low income groups in
particular, at an affordable cost in a fair and transparent manner by regulated,
mainstream institutional players”.
Benefits of Financial Inclusion
It is widely acknowledged in economic literature that an efficiently functioning financial
system is very crucial for ensuring economic growth and development. For, the financial
sector essentially acts as a link between savers and investors in the economy thereby
promoting savings, investment and growth. Thus when more and more economically
weaker and poorer sections of the society are brought under the purview of the financial
sector through the process of 'financial inclusion', it is but natural that the process of
economic growth would get a major boost. The fact of the matter is that apart from a
purely welfare-oriented measure, financial inclusion shall also be viewed as a 'prime
mover' behind growth and economic development. The rationale underlying this
contention is the plethora of positive external economies that are likely to generate
through the process of financial inclusion.
First and foremost, when masses are enabled to avail banking facilities and other
services offered by the financial system, it tends to promote savings of public. For, with
the availability of a wide variety of financial assets offering different combinations of
liquidity, convenience, safety and yield suiting preference pattern of different asset
holders, the saving behaviour of common public can be reasonably expected to get
encouraged. Moreover, when public keeps its saving in the form of financial assets, the
huge financial resources so mobilised can be directly channelized into socially
productive activities in the form of institutional credit provided to productive deficit
spenders and investors by financial institutions in the organised sector.
The provision of timely and concessional credit to deserving but economically poor
potential entrepreneurs as a part of the 'financial inclusion' process could itself be
instrumental in raising the level of investment and hence economic growth. For, several
budding talents especially from rural areas as also hitherto backward regions having the
skill, capacity and temperament for active investment would thereby be in a position to
overcome their financial constraint and give a concrete shape to their productive projects
and investment plans. In this context, the organised financial institutions committed to
April - September 2014
the objective of 'financial inclusion' could be particularly helpful by 'cross-subsiding' the
poor by charging a higher interest rate on loans from the richer and well-off segments of
the society and in turn providing loans at concessional interest rates to the under-
privileged and deprived sections of the society.
In this connection, Mundra (2014) observes that “Financial Inclusion helps build
domestic savings, bolster household, domestic and financial sector resilience and
stimulate business and entrepreneurial activity, while exclusion leads to increasing
inequality, impediments to growth and development”.
Side-by-side, the credit facilities being made available to common people by financial
intermediaries belonging to the organised sector under an era of 'financial inclusion' can
quite conceivably be expected to go a long way in liberating poor masses from the
clutches of exploitative moneylenders and indigenous bankers. These dubious elements
belonging to the unregulated and unorganised credit markets are essentially governed by
their whims and fancies rather than set or well-defined and unbiased ways of working.
Further, the moneylenders are notorious for indulging in the practice of 'usury' and are
known to charge exorbitant interest rates from needy and helpless people thereby
pushing them into a vicious cycle of 'debt trap'. Evidently, by loosening the grip of
unorganised credit markets, the financial inclusion process will establish a greater
'transparency and accountability' in the financial system.
In this context, Bhaskar (2014) expresses the view that by bringing low income groups
within the perimeter of formal banking sector; financial inclusion protects their financial
wealth and other resources in exigent circumstances. Financial inclusion also mitigates
the exploitation of vulnerable sections by the usurious money lenders by facilitating
easy access to formal credit.
In recent years, the focus of policy-makers has specially shifted towards 'financial
inclusion' as it is being perceived as an effective means or mechanism for plugging
leakages of the public delivery system and social welfare programmes officially
sponsored and financed by the Government. More specifically, it is believed that directly
depositing the financial assistance of these social welfare programmes in the personal
bank account of each of the targeted beneficiaries, would put a check on the leakages and
corruption that was so prevalent in the absence of financial inclusion. Towards this end, a
massive drive for opening bank accounts of poor and downtrodden masses is very much
a part and parcel of the overall process of financial inclusion in the Indian economy.
FINANCIAL INCLUSION IN INDIA: RETROSPECT AND PROSPECTS 65Vol. 35 No. 1
66 BUSINESS ANALYST
In addition, through 'financial inclusion', even the ordinary masses will get an
opportunity to transfer funds from one place to another with utmost efficiency and at the
least possible cost utilising the services of formal banking institutions that they remained
deprived of till recently in as much as they were largely excluded from the potential
gains and benefits of the organised financial sector so far.
It is thus clear from the foregoing discussion that 'financial inclusion' is instrumental in
promoting growth and economic development by encouraging saving as well as
investment along with raising the well-being of the masses in the economy.
Steps undertaken by the Monetary Authority with a view to attaining
Financial Inclusion in India
In recent years, recognising the significance of 'financial inclusion' for the growth and
development of India economy, the Government coupled with the Central Bank viz. the
Reserve Bank of India (RBI) has taken several active steps with a view to achieving
financial inclusion in India. The initiation of 'Pradhan Mantri Jan Dhan Yojana' on 28
August 2014 is merely a reflection of the commitment of the Government towards the
attainment of 'financial inclusion' in the Indian economy and signifies an intensification
of the efforts on the part of State in this direction. On the inaugural day itself, 1.5 Crore
bank accounts were opened under this ambitious scheme and it is likely to cover 7.5
Crore people by 26 January 2015.
The rationale underlying such well-planned and comprehensively conceptualised
schemes of the monetary authority is that opening up an account with a commercial bank
is the first step in the direction of 'financial inclusion'. For, owing to their vast network
across the length and breadth of the country that covers even rural areas and backward
regions, the commercial banks can quite conceivably be banked upon to effectively
reach out to the poor, underprivileged, vulnerable and downtrodden sections of the
society in the provision of financial services. Towards this end, the procedures for
opening a bank account are gradually being simplified especially for poorer sections of
the society wherein even the Know-Your-Customer i.e. KYC norms are themselves
being relaxed. For instance, instead of insisting on the requirement of 'introduction' in
the case of small accounts, just Aadhaar Card would suffice as a proof of identity and
address of common people.
In view of the economically weaker condition of the common masses, however, there is
April - September 2014
always a provision of opening 'no-frills', 'BSBD i.e. Basic Savings Bank Deposit' or
'zero-balance' accounts in all such officially sponsored schemes aimed at financial
inclusion in India. In fact, once a bank account of a poor person is opened in this manner,
it can be directly transferred financial assistance by the State under its numerous welfare
programmes through the Direct Benefit Transfer (DBT) Scheme in the most expeditious
and judicious manner. Apart from cutting down on the red-tape and administrative
delays, such a policy proposition can be reasonably expected to go a long way in
altogether rooting out or at least mitigating the corruption and leakages that prevailed
before the advent of such schemes. This way, the State would be in a better position to
ensure that the financial assistance provided by it under its various social welfare
schemes and developmental programmes reaches out to their targeted beneficiaries
which in turn is likely to prove an added advantage of 'Aadhaar Card-linked bank
accounts' and 'financial inclusion' in the Indian economy.
Side-by-side, a number of campaigns & schemes have been launched and various other
policy initiatives have been undertaken from time-to-time with the ultimate aim of
bringing about financial inclusion in India. For example, the 'Swavalamban pension
scheme' and 'Swabhimaan Campaign' launched since 2010 and 2011 respectively are
nothing but active steps in the direction of 'financial inclusion' in the Indian economy.
Likewise the massive expansion of branches of commercial banks in hitherto unbanked
areas, setting up of intermediate brick and mortar as also Ultra Small Branches (USBs),
deployment of Business Facilitators (BFs) and Business Correspondents (BCs) to
provide banking services, unprecedented expansion of Automated Teller Machines
(ATMs) and permission granted to even non-bank entities to establish, own and operate
an ATM in the form of 'White Label ATMs' and the like as observed in recent years also
represent vigorous attempts on the part of planners and policy makers to strive for
financial inclusion in India.
Of late, owing to the pioneering contribution of the National Payments Corporation of
India (NPCI), even the modern-day information technology has been extensively
employed so as to extend banking facilities to the masses in an expeditious yet cost-
effective manner via Unstructured Supplementary Service Data (USSD) based mobile
banking. As opposed to the prevalent Interbank Mobile Payment Systems (IMPS) based
Mobile Banking, the main advantage of USSD based Mobile Banking is that it does not
require the downloading of any special 'application' for availing of basic banking
facilities like balance enquiries, bill payments, money transfer etc. on a simple GSM
FINANCIAL INCLUSION IN INDIA: RETROSPECT AND PROSPECTS 67Vol. 35 No. 1
68 BUSINESS ANALYST
based Mobile phone. The introduction of USSD based mobile banking would no doubt
go a long way in facilitating the masses to avail banking services through their mobile
phones and thus can be reasonably considered to be a significant step or rather a 'big leap
forward' in the direction of attaining 'financial inclusion' in the Indian economy.
Current State of Financial Inclusion in India
According to a survey conducted by World Bank Findex in 2012, only 35% of Indian
adults had access to a formal bank account and 8% borrowed formally in the last 12
months. Only 2% of adults used an account to receive money from a family member
living in another area and 4% used an account to receive payment from the Government.
In this context, Chakrabarty (2013a) points out that the data released from the recent
census of India indicates that only 58.7% of households in India avail of banking
services with the figure being 54.4% for rural areas and 67.8% for urban areas. That this
is happening despite the introduction of various inclusive banking initiatives in the
country over the years ranging from cooperative movement to the nationalization of
banks and the setting-up of Regional Rural Banks, clearly suggests in the opinion of
Chakrabarty (2013b) that the number of people with access to the products and services
offered by the banking system continues to be very limited.
In view of this, Chakrabarty (2013b) notes with concern that it is regrettable that the
entire debate surrounding financial inclusion has generated significant heat and sound,
but little light.
Financial Inclusion in India: Looking Ahead by Learning Lessons from the
Past Experience
There is no denying the fact that despite the realisation and acknowledgement of the
significance of 'financial inclusion' by planners and policy makers rather early, the actual
progress achieved on this front in India has remained far from satisfactory in the past. On
closer examination, we find that the reasons behind this tardy progress of financial
inclusion in the Indian economy could in turn be located in the faulty formulation and
ineffective implementation of the policy pursued by the monetary authority in this
respect. In this context, Mundra (2014) observes that “there has never been a concerted
effort on the part of the banking system to identify specific business opportunities … and
to develop viable business models to realize them.”
April - September 2014
The fact of the matter is that with a view to achieving financial inclusion, the model of
'social banking' that was followed in the past ever since the inception of planned
economic development way back in the early 1950s, inherently treated it as a
commercially non-viable proposition essentially based on subsidisation by the State.
Thus upon the onset of economic and financial reforms with thrust on commercial
profitability and economic efficiency in the early 1990s, the agenda for social &
inclusive banking was practically given a go by and was relegated to the backseat as it
was thought to be incompatible with an increasingly market-driven competitive system
being put in place. This was the primary reason behind the debacle of the State policy for
financial inclusion in India in the past.
Another lacuna that could in part explain the failure of past policies aimed at financial
inclusion in India was observed at the stage of implementation wherein appropriate
technical support to the programme was largely lacking either because of a lack of
awareness in this behalf or because of suitable information technology not being
available on account of extreme scarcity of financial resources at the disposal of relevant
authorities to finance the same. It must further be realised that in some cases, the
requisite technology for the success of 'financial inclusion' had not even been developed
across the globe at that time!
In fact, typically the success of any such welfare-oriented programme of the
Government and macro-level policy of the State crucially hinges on how focussed the
approach of the policy-maker is and it is regrettable to note that a clear-cut 'focus' was
primarily missing in the approach of the monetary authority in the past at least as far as
the broader objective of 'financial inclusion' in India is concerned.
Learning from past mistakes, however, the monetary authority in recent years has
chalked out a new and effective strategy to embark on an era of financial inclusion in
India. Towards this end, first and foremost priority was to define the policy objective of
'financial inclusion' in a concrete and unequivocal manner in India. The Reserve Bank of
India has not only accomplished this now but rather has gone much beyond by issuing
clear-cut guidelines to all individual commercial banks to prepare their branch-wise
financial inclusion plans. Further, due emphasis has been laid on the utilisation of
'enabling technology' to meet the same end.
A distinguishing feature of the renewed approach of the monetary authority in this
respect is that instead of being treated as a compulsion, 'financial inclusion' is now being
FINANCIAL INCLUSION IN INDIA: RETROSPECT AND PROSPECTS 69Vol. 35 No. 1
70 BUSINESS ANALYST
treated as a profit-making and commercially viable option based on 'economies of scale'
and 'economies of scope' argument. Accordingly, the commercial banks entrusted with
the task of bringing about financial inclusion in the Indian economy have been advised
to develop a wide variety of financial assets specially in line with the preference pattern
of rural masses and offer a wide variety of financial services to the hitherto untapped and
unbanked poor masses so that average costs of banking fall down to such an extent as to
justify 'financial inclusion' as a strategy making business sense too.
Further, the present approach of the monetary authority as regards financial inclusion
actively involves all the stakeholders in this process ranging from Government, Reserve
Bank of India (RBI) and other regulatory bodies to commercial banks, other financial
institutions, Non-Government Organisations (NGOs), Civil Society Institutions,
Information Technology (IT) professionals, Media personnel as also the public at large
who are supposed to jointly achieve the collective endeavour of 'financial inclusion' for
the common good of the society.
Another major advancement in the strategy evolved by Government and RBI at present
is that it relies on a 'holistic' perspective wherein financial inclusion on the supply side is
to be largely achieved through the initiative and active efforts of commercial banks
which on the demand side are supplemented by the promotion of 'financial education'
among the masses so as to generate awareness and motivation among the proposed
beneficiaries belonging to the poor and economically worse-off sections of the society.
In this connection, Joshi (2013) is of the view that financial inclusion and financial
literacy need to go hand in hand to enable the common man to understand the need and
benefits of the products and services offered by formal financial institutions.
As the present policies of Government and RBI have sincerely tried to bridge all visible
gaps and lacunae of past policies on financial inclusion by following a well thought-out,
measured, balanced and focussed approach in this regard that develops it as a
commercially-viable option and relies more on relevant technology and co-ordination
among all stakeholders with an ever higher level of transparency and accountability, we
can reasonably look forward to having 'financial inclusion' in the strict sense of the term
in the Indian economy in the near future.
Conclusion
Financial inclusion in one form or the other has always remained a cherished objective
April - September 2014
of planners and policymakers in India. For, the monetary authority had realised the
importance of spreading financial services among public at large particularly the poor,
underprivileged, economically weaker, vulnerable and downtrodden sections of the
society well in time. The nationalisation of major scheduled commercial banks in 1969
and subsequently in 1980, the establishment of Regional Rural Banks (RRBs), the
initiation of Lead Bank Scheme, Service Area Approach, the provision of priority sector
advancing involving “cross-subsidisation” of the poor by charging concession interest
rates from them and higher interest rates from the rich borrowers and the promotion of
Co-operative Banking, Micro-Finance and Self-Help Groups in the provision of finance
are some of the active steps taken up by the monetary authority in the direction of
attaining 'financial inclusion' in the Indian economy.
Despite some apparent achievements and breakthroughs, however, all such officially
sponsored schemes and programmes of the State could not succeed to the extent
contemplated at least in the attainment of financial inclusion in India. Owing to the
significance of broad-based financial system in promoting saving, investment and
thereby economic growth as also the power of 'financial inclusion' in liberating poorer
sections from the clutches of exploitative moneylenders and informal credit markets, the
monetary authority in India had to take a fresh look at the entire issue in recent years as it
was also increasingly being realised that even the long-cherished aim of “inclusive
growth” cannot be achieved without bringing about inclusion in the financial sector.
Accordingly, of late, the monetary authority identified the major reasons behind the
failure of past strategies in terms of the lack of focus, loopholes, inadequacy of enabling
technology and other such lacunae and tried to bridge them. The renewed approach of
Government and RBI as regards financial inclusion is more pragmatic and relies on a
bank-led support on the supply side coupled with the promotion of 'financial education'
on the demand side. Instead of considering it as a compulsion or charity, the new
approach treats 'financial inclusion' as an opportunity to make commercial profitability
by fully reaping all possible 'economies of scale' as well as 'economies of scope' arising
in the entire process of expanding and diversifying banking business to hitherto
untapped, uncovered and unbanked areas and backward regions having an extremely
large number of potential customers. Towards this end, the present strategy of the
monetary authority is comprehensive enough to employ the requisite information
technology and actively involve all the stakeholders in pursuing the collective
endeavour of financial inclusion.
FINANCIAL INCLUSION IN INDIA: RETROSPECT AND PROSPECTS 71Vol. 35 No. 1
BUSINESS ANALYST72
In the light of the foregoing discussion, it can be reasonably concluded that the present
approach of the monetary authority as regards financial inclusion in India, which is
based on correcting for the past policy errors and represents a sincere effort at bridging
the lacunae of past policies, can be reasonably expected to bring about financial
inclusion in India in the real sense of the term in the foreseeable future.
REFERENCES
Bhaskar, P. Vijaya (2014), “Financial Inclusion in India – An Assessment” in Reserve Bank of India Monthly Bulletin, January 2014.
Chakrabarty, K. C. (2013a), “Revving up the Growth Engine throughFinancial Inclusion” in Reserve Bank of India Monthly Bulletin, July 2013.
Chakrabarty, K.C. (2013b), “Financial Inclusion in India: Journey so far and way forward” in Reserve Bank of India Monthly Bulletin, October 2013.
Joshi, Deepali Pant (2013), “Financial Education – Key to PromotingFinancial Inclusion and Customer Protection” in Reserve Bank of India Monthly Bulletin, November 2013.
Khan, Harun R. (2013), “Financial Inclusion & Payment Systems: Recent Trends, Current Challenges and Emerging Issues” in Reserve Bank of India Monthly Bulletin, February 2013.
Mundra, S.S. (2014), “Banking Renaissance: Inclusion, Innovation & Implementation”, Chief Guest Address at the Seventh Annual Banking Conference organised by the Narsee Monjee Institute of Management Studies, Mumbai on October 11, 2014.
April - September 2014
Vol. 35 No. 1
1Regional Provident Fund Commissioner (Grade-I), Employees' Provident Fund Organisation, Head
Office, Bhavishya Nidhi Bhawan, Bhikaiji-cama-Place, New Delhi-110066. Office Phone No.011-
26183245, Fax No.011-26179026, Mobile No.9868868789, e-mail: [email protected]
ROLE OF CORPORATE INCOME TAX IN INDIA'S TAX
SYSTEM
1Dr. Ved Parkash
The Corporate income tax has substantial support both on theoretical and practical
grounds, Moreover, it is politically feasible and administratively convenient to levy taxes
on few thousand corporations than millions of individuals. So, companies are subject to
a special tax treatment under Income Tax Act, 1961.
Having realized the importance of corporate taxation, many researchers have studied
diverse aspects of corporate income tax throughout the world. India is no exception to
this and many studies covering divergent aspects of corporate taxation in India have
been done from time to time. Moreover, there is a need to do a comprehensive study of all
the important aspects of corporate income taxation instead of studying one or two
aspects at a time as has been done by previous researchers.
The Scheme and working of corporate tax system in India: its elasticity and buoyancy;
the question of shifting or no shifting of corporate income tax and the impact of
corporate taxation on saving, investment, capital structure, sources of finance and
industrial growth.
INTRODUCTION
The fiscal policy of a country derives its meaning and direction from the aspirations and
goals of the society within which it operates, and the people whom it serves. In other
words, because of fundamental differences in the conditions of a developed and a
developing country, the objectives of tax and budgetary policy are likely to be different.
While the main problem before an advanced country is that of sustaining growth, a
developing economy suffers from a number of imperfections like inadequate
infrastructure, scarcity of capital, heavy dependence on primary sector, high rate of
unemployment, extreme inequalities of income and wealth etc. So the fiscal policy in a
developing and underdeveloped economy seeks to correct the above imbalances in a
73
BUSINESS ANALYST
planned manner through the formulation of a comprehensive fiscal policy and judicious
mix of the various fiscal tools.
Taxation as an instrument of fiscal policy is not only important in making available
resources to the government, but it also has a significant effect on the level and direction
of economic activity in both developed and developing economics. With the acceptance
of a positive role of fiscal policy specially in the context of economic growth, taxation as
a major source of revenue for the large development plans and for regulating the
behavior of private enterprises in a mixed economy, has acquired a new dimension than
merely being a theory of distribution of the tax burden on the economy equitably.
Direct taxes are preferred to indirect taxes on the ground that they are more equitable,
administratively effective and progressive.
Of all direct taxes, Income tax is considered the most significant because of its
progressive rate schedule and high resource mobilization. Among various assessees
subject to income taxation, the corporate sector is of crucial significance.
Corporate taxes are quite convenient to collect and offer the least chances of evasion.
On account of technical innovations and economics of large scale production, the role of
corporate form of organization and its contribution to the revenues of the government are
quite significant. Therefore, in this article, an attempt has been made to describe in detail
the role of corporate tax in India's Tax system. But before that, a few observations are to
be made.
OBJECTIVES OF CORPORATION TAX
Corporation tax, as an important instrument of the fiscal system, has a threefold role to
play: to transfer resources from the private to the public sector, to bring about equality in
income and wealth distribution, and to promote economic growth, stability and
efficiency. It is often said that the reason for such heavy dependence on corporate
taxation is not only its high contribution to corporate taxation but also its impersonal
character, which has the least effect on the voters. Moreover, it is considered an elastic
and progressive source of revenue.
74 April - September 2014
THEORY OF CORPORATE TAXATION
There are two different philosophies with respect to the tax treatment of companies.
Accounting to the first, a corporation does not have any taxable capacity separate from
its shareholders. All taxation being invariably personal taxation, a corporation is not a
person in the strict sense of the word and, therefore, it is argued that due tax credit must
be given to the holders of the stock for the tax paid by the corporation. In India, till the
assessment year 1959-60, compound system based on this philosophy was in existence
and partial credit was allowed to the stockholders in respect of the taxes paid by their
corporations. Under the income tax law provisions then existing, the income tax on
companies was refunded to the stockholders.
The other social philosophy rests on the argument that the corporate form gives a
separate entity to the company with the distinct capacity of its own to bear taxes. A
company enjoys definite legal privileges and it must, therefore, pay for such benefits.
The essence of this second point of view on company taxation lies in considering a
company as someone or something with its own identity and, therefore, as a natural tax
paying unit, side by side, with personal tax payers. On such a consideration the tax levied
on the company cannot be regarded as taxation on shareholders. This philosophy is a
recognized principle in the tax system of the most countries of the world today.
SCHEME OF TAXATION OF CORPORATE INCOME TAX IN
INDIA
Corporate taxation has been an essential part of scheme of taxation of income in any
country. In India, company as the special and separate (from shareholders) assessable
entity in the present as well as the previous Income Tax Act, was always required to pay
tax separately on their incomes or profits. This separate treatment of corporation income
tax is justified not only on economic grounds but also on account of easy administration
and enforcement of the tax laws because of it being the most advanced and organized
form of business organization.
A simple system of company taxation was followed in 1886 and the 1918 Act. However,
the growing complexities of business, increasing requirements of state's revenue and
amendments made in the Income Tax Act made the system complicated. The structure of
company taxation was made more complicated specially after Independence in view of
income tax being used as a fiscal instrument and a number of incentive provisions and
ROLE OF CORPORATE INCOME TAX IN INDIA'S TAX SYSTEM 75Vol. 35 No. 1
BUSINESS ANALYST
control elements were incorporated in the Act of 1961 and thereafter, by amendments to
this act through Finance Acts enacted every year.
In India, the expression 'Corporation Tax' means the income tax payable by a company
under the provisions of Indian Income tax and Finance Act. However, corporation tax
has been defined by article 366 (6) of the Indian Constitution as follows:
'Corporation Tax' means any tax on income so far as that tax is payable by companies
and is a tax in the case of which the following conditions are fulfilled:
(a) that it is not chargeable in respect of agricultural income;
(b) that no deduction in respect of tax paid by companies (by any other enactments
which may apply to the tax) is authorized to be made from dividends, payable by the
companies to individuals;
(c) that no provisions exists for taking the tax so paid into account in computing for the
purpose of Indian Income Tax, the total income of individuals receiving such
dividends, or in computing, the Indian Income Tax payable by or refundable to, such
individual.
Corporation Tax is paid by companies as per provisions of the Income Tax Act, 1961 on
the total income (excluding the agricultural income) of the previous year which is received
or is deemed to be received, accrues or arises or is deemed to accrue or arise in India.
'Corporation Tax' is the tax on 'total corporation income', inclusive of a wide range of
exempt receipts and deductible expenditure, which is subject to promotional tax rates,
and surcharge. In India, as in most countries of the world, the corporation tax varies
according to:
(1) The tax base i.e. 'total income' of 'distributed profits' or 'undistributed profits';
(2) The form of business i.e. priority or non-priority sector;
(3) The residence i.e. domestic or foreign.
Thus, companies are taxed generally at flat rates varying with the nature of income,
residential status and class of company.
ROLE OF CORPORATE TAX IN INDIA'S TAX SYSTEM
The corporate tax has occupied a very important place in India's tax system from the very
76 April - September 2014
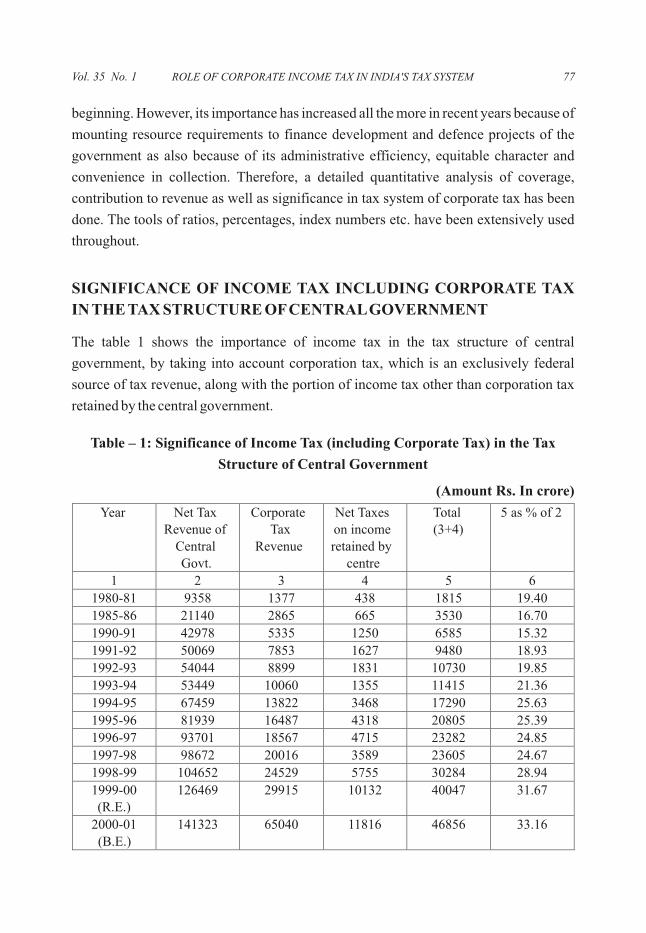
beginning. However, its importance has increased all the more in recent years because of
mounting resource requirements to finance development and defence projects of the
government as also because of its administrative efficiency, equitable character and
convenience in collection. Therefore, a detailed quantitative analysis of coverage,
contribution to revenue as well as significance in tax system of corporate tax has been
done. The tools of ratios, percentages, index numbers etc. have been extensively used
throughout.
SIGNIFICANCE OF INCOME TAX INCLUDING CORPORATE TAX
IN THE TAX STRUCTURE OF CENTRAL GOVERNMENT
The table 1 shows the importance of income tax in the tax structure of central
government, by taking into account corporation tax, which is an exclusively federal
source of tax revenue, along with the portion of income tax other than corporation tax
retained by the central government.
Table – 1: Significance of Income Tax (including Corporate Tax) in the Tax
Structure of Central Government
(Amount Rs. In crore)
ROLE OF CORPORATE INCOME TAX IN INDIA'S TAX SYSTEM 77Vol. 35 No. 1
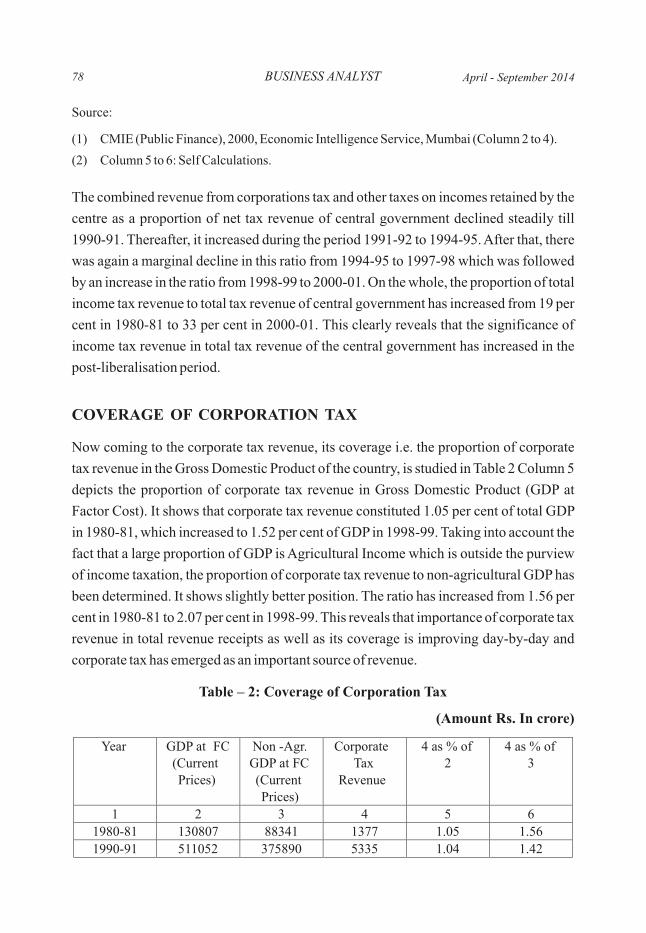
BUSINESS ANALYST
Source:
(1) CMIE (Public Finance), 2000, Economic Intelligence Service, Mumbai (Column 2 to 4).
(2) Column 5 to 6: Self Calculations.
The combined revenue from corporations tax and other taxes on incomes retained by the
centre as a proportion of net tax revenue of central government declined steadily till
1990-91. Thereafter, it increased during the period 1991-92 to 1994-95. After that, there
was again a marginal decline in this ratio from 1994-95 to 1997-98 which was followed
by an increase in the ratio from 1998-99 to 2000-01. On the whole, the proportion of total
income tax revenue to total tax revenue of central government has increased from 19 per
cent in 1980-81 to 33 per cent in 2000-01. This clearly reveals that the significance of
income tax revenue in total tax revenue of the central government has increased in the
post-liberalisation period.
COVERAGE OF CORPORATION TAX
Now coming to the corporate tax revenue, its coverage i.e. the proportion of corporate
tax revenue in the Gross Domestic Product of the country, is studied in Table 2 Column 5
depicts the proportion of corporate tax revenue in Gross Domestic Product (GDP at
Factor Cost). It shows that corporate tax revenue constituted 1.05 per cent of total GDP
in 1980-81, which increased to 1.52 per cent of GDP in 1998-99. Taking into account the
fact that a large proportion of GDP is Agricultural Income which is outside the purview
of income taxation, the proportion of corporate tax revenue to non-agricultural GDP has
been determined. It shows slightly better position. The ratio has increased from 1.56 per
cent in 1980-81 to 2.07 per cent in 1998-99. This reveals that importance of corporate tax
revenue in total revenue receipts as well as its coverage is improving day-by-day and
corporate tax has emerged as an important source of revenue.
Table – 2: Coverage of Corporation Tax
(Amount Rs. In crore)
78 April - September 2014
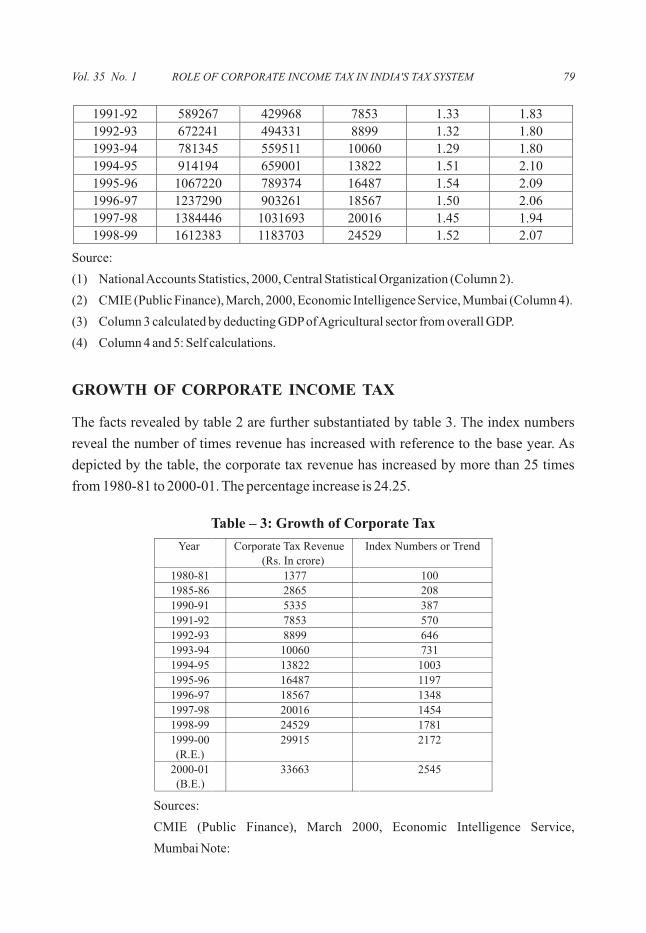
Source:
(1) National Accounts Statistics, 2000, Central Statistical Organization (Column 2).
(2) CMIE (Public Finance), March, 2000, Economic Intelligence Service, Mumbai (Column 4).
(3) Column 3 calculated by deducting GDP of Agricultural sector from overall GDP.
(4) Column 4 and 5: Self calculations.
GROWTH OF CORPORATE INCOME TAX
The facts revealed by table 2 are further substantiated by table 3. The index numbers
reveal the number of times revenue has increased with reference to the base year. As
depicted by the table, the corporate tax revenue has increased by more than 25 times
from 1980-81 to 2000-01. The percentage increase is 24.25.
Table – 3: Growth of Corporate Tax
Sources:
CMIE (Public Finance), March 2000, Economic Intelligence Service,
Mumbai Note:
ROLE OF CORPORATE INCOME TAX IN INDIA'S TAX SYSTEM 79Vol. 35 No. 1
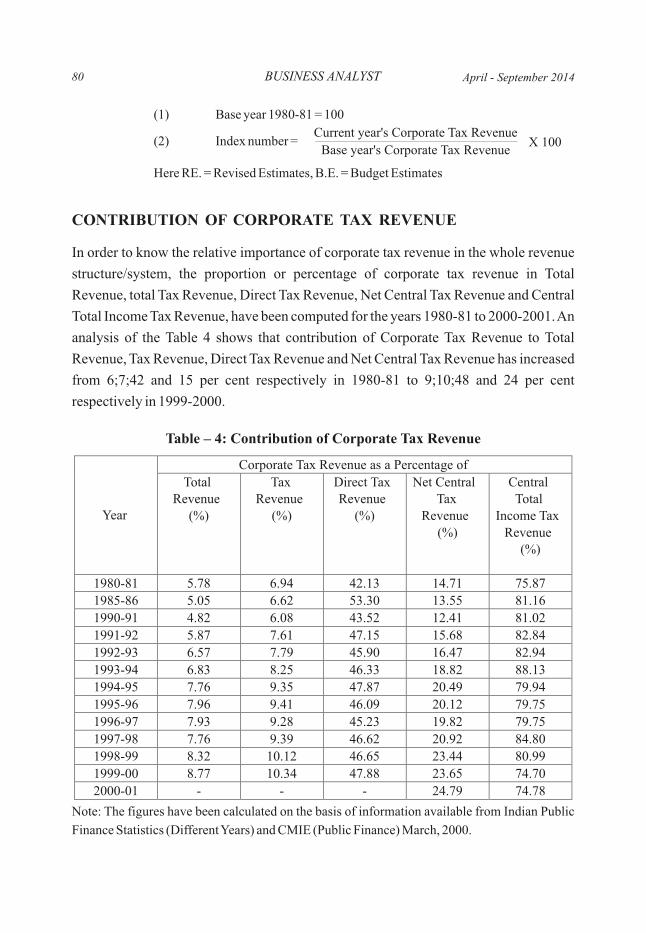
BUSINESS ANALYST
(1) Base year 1980-81 = 100
(2) Index number =
Here RE. = Revised Estimates, B.E. = Budget Estimates
CONTRIBUTION OF CORPORATE TAX REVENUE
In order to know the relative importance of corporate tax revenue in the whole revenue
structure/system, the proportion or percentage of corporate tax revenue in Total
Revenue, total Tax Revenue, Direct Tax Revenue, Net Central Tax Revenue and Central
Total Income Tax Revenue, have been computed for the years 1980-81 to 2000-2001. An
analysis of the Table 4 shows that contribution of Corporate Tax Revenue to Total
Revenue, Tax Revenue, Direct Tax Revenue and Net Central Tax Revenue has increased
from 6;7;42 and 15 per cent respectively in 1980-81 to 9;10;48 and 24 per cent
respectively in 1999-2000.
Table – 4: Contribution of Corporate Tax Revenue
Note: The figures have been calculated on the basis of information available from Indian Public
Finance Statistics (Different Years) and CMIE (Public Finance) March, 2000.
Current year's Corporate Tax Revenue
Base year's Corporate Tax Revenue X 100
80 April - September 2014
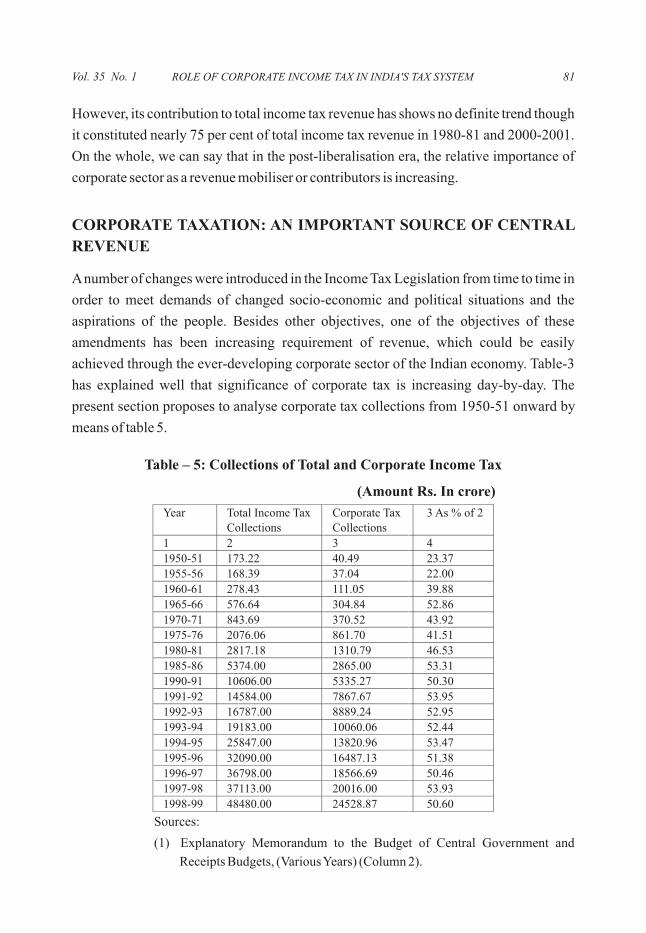
However, its contribution to total income tax revenue has shows no definite trend though
it constituted nearly 75 per cent of total income tax revenue in 1980-81 and 2000-2001.
On the whole, we can say that in the post-liberalisation era, the relative importance of
corporate sector as a revenue mobiliser or contributors is increasing.
CORPORATE TAXATION: AN IMPORTANT SOURCE OF CENTRAL
REVENUE
A number of changes were introduced in the Income Tax Legislation from time to time in
order to meet demands of changed socio-economic and political situations and the
aspirations of the people. Besides other objectives, one of the objectives of these
amendments has been increasing requirement of revenue, which could be easily
achieved through the ever-developing corporate sector of the Indian economy. Table-3
has explained well that significance of corporate tax is increasing day-by-day. The
present section proposes to analyse corporate tax collections from 1950-51 onward by
means of table 5.
Table – 5: Collections of Total and Corporate Income Tax
(Amount Rs. In crore)
Sources:
(1) Explanatory Memorandum to the Budget of Central Government and
Receipts Budgets, (Various Years) (Column 2).
ROLE OF CORPORATE INCOME TAX IN INDIA'S TAX SYSTEM 81Vol. 35 No. 1
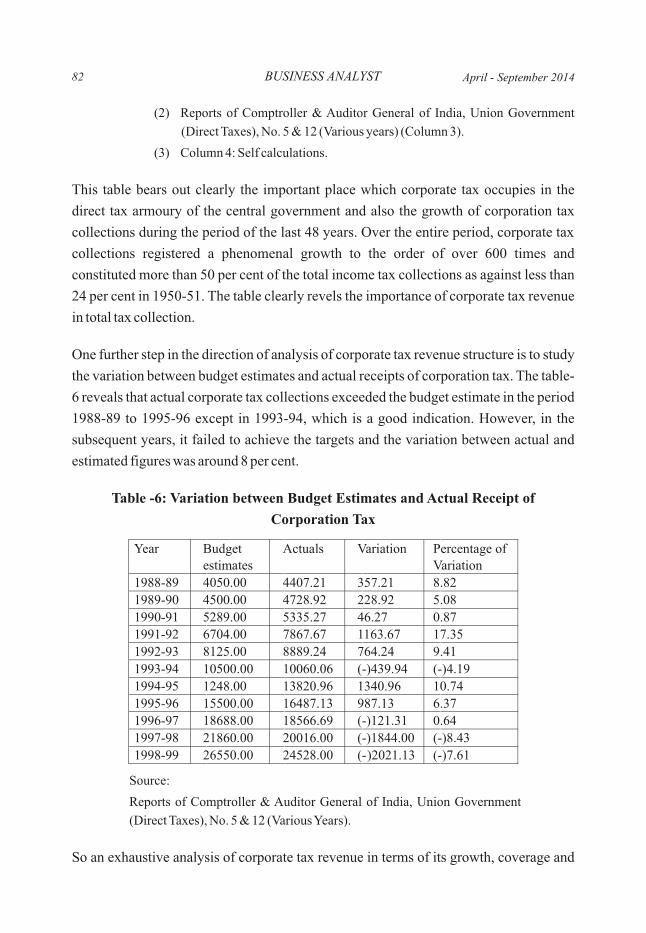
BUSINESS ANALYST
(2) Reports of Comptroller & Auditor General of India, Union Government
(Direct Taxes), No. 5 & 12 (Various years) (Column 3).
(3) Column 4: Self calculations.
This table bears out clearly the important place which corporate tax occupies in the
direct tax armoury of the central government and also the growth of corporation tax
collections during the period of the last 48 years. Over the entire period, corporate tax
collections registered a phenomenal growth to the order of over 600 times and
constituted more than 50 per cent of the total income tax collections as against less than
24 per cent in 1950-51. The table clearly revels the importance of corporate tax revenue
in total tax collection.
One further step in the direction of analysis of corporate tax revenue structure is to study
the variation between budget estimates and actual receipts of corporation tax. The table-
6 reveals that actual corporate tax collections exceeded the budget estimate in the period
1988-89 to 1995-96 except in 1993-94, which is a good indication. However, in the
subsequent years, it failed to achieve the targets and the variation between actual and
estimated figures was around 8 per cent.
Table -6: Variation between Budget Estimates and Actual Receipt of
Corporation Tax
Source:
Reports of Comptroller & Auditor General of India, Union Government
(Direct Taxes), No. 5 & 12 (Various Years).
So an exhaustive analysis of corporate tax revenue in terms of its growth, coverage and
82 April - September 2014
contribution to the whole revenue structure, establishes beyond doubt that significance or
role of Corporate Income Tax in the Indian Tax system has been continuously increasing,
Especially, in the post-liberalisation period, the resource requirements of government
have increased manifold. So, a more responsible and key role has been assigned to the
corporate sector for the growth and development of the country. In this background, we
are able to conclude that corporation tax has an important place in the Indian Tax System.
CONCLUSION OR FINDING OF THE STUDY
The suggestions made in the course of this study might give quite a disproportionate or
unusual strength to the corporate enterprise in the economy. But it should be
remembered that economic development implies heavy capital outlay and large
financial resources could be amassed only by the corporate form of organizations.
Moreover, an expansion in the corporate enterprise is just in line with the accepted socio
economic policies. This is not only because its ownership can be widely dispersed but
also it can easily be brought under social control. There are remote changes for the
corporate enterprise to assume disproportionate form and adopt anti social policies.
However, it should be kept in mind that sweeping changes have already been introduced
like rate reductions; MAT modifications, absorption of double taxation of dividends;
base expansion; presumptive tax; capital gains relief; etc. The need is to continue
consistent and determined efforts in this direction in order to completely rationalize and
streamline the corporate tax structure so that corporate tax is able to serve the role of
revenue mobilization and economic growth, efficiently and effectively.
REFERENCES
Water Heller, “Fiscal Policy for Under-developed Countries,” Taxes and Fiscal in Underdeveloped Countries, United Nations Report, p.1.
Vinay Kumar, Tax System in India and Role of Income Tax, (New Delhi: Deep & Deep Publications, 1988), p.15.
B.R. Agarwal, “Corporate Taxes and Financial Management,” Indian Journal of Commerce, Vol. 26, (No.90), December, 1971, pp.227-238.
Devendra Singh, Corporate Taxation and Industrial Growth. A Case Study of Some Industries in India, (Aligarh: Navman Prakashan Publishers, 1981), p.12.
Article 366 (6) of Indian Constitution.
Income Tax Act, 1961.
V.S. Sundaram, “The Law of Income Tax in India,” Reproduced by A.K. Roy, The Historical Evolution of
ROLE OF CORPORATE INCOME TAX IN INDIA'S TAX SYSTEM 83Vol. 35 No. 1

Corporation Tax in India, (Kolkata: Firmaklin Pvt. Ltd., 1987), p.14.
J.P. Niyogi, The Evolution of Indian Income Tax, (West Minister, London: P.S. Kinglons Ltd., 1929), p.141.
The Gazette of India, Various issues.
R.S. Patel and N.L. Choudhary, Income Tax, (Jaipur: Choudhary Prakashan, 2001), p.2.
Girish Ahuja and Ravi Gupta, Direct Taxes Ready Reckoner with Tax Planning, (New Delhi: Bharat Law House. Pvt. Ltd., 2001-02).
BUSINESS ANALYST84 April - September 2014
Vol. 35 No. 1
1Assistant Professor, Shri Ram College of Commerce, Delhi, M. Phil. Scholar (Accounting), Department of
Commerce, Faculty of Commerce and Business, Delhi School of Economics, University of Delhi, Delhi –
110007; Email: [email protected] ; Mobile:+9195609591792
Associate Professor, Faculty of Commerce and Business, Delhi School of Economics, University of Delhi,
Delhi – 110007; E-mail: [email protected]; Mobile: +9198101087673
Associate Director, SmartAnalyst, Gurgaon, India; Email: [email protected]
LIMITATIONS OF CURRENT FINANCIAL REPORTING: A
CASE FOR INTEGRATED REPORTING
(Use of factor analysis scores in multiple linear regression model for prediction of
disclosures sought in new form of reporting)
1 2 3Pooja Dhingra , Ajay Kumar Singh and Gaurav Magu
Purpose- The landscape of corporate reporting is about to change completely. The
article aims to determine the disclosures required if the new form of reporting is adopted
as an upshot of limitations of the current financial reporting and sustainability
reporting. Though top few companies have in the recent past started preparing
Corporate Social Responsibility (CSR) reports and sustainability report as per Global
Reporting Initiative (GRI) guidelines along with Annual Report, there seems to be
certain gaps which the companies need to fill. Though Integrated Reporting is
successfully adopted in South Africa and countries of Europe, its viability or need in
India has been examined with the help of current research paper.
Design/methodology/approach-The research paper comprises of a literature review,
extraction of factors using Exploratory Factor Analysis (EFA) and Multiple Regression
Analysis among the factors identified as dependent and independent. Factor scores of
limitations of financial reporting and the disclosures sought in new form of reporting
emerging due to the limitations were then used in the Multiple Regression to predict the
degree of dependence of disclosures sought as a result of failure of current financial
reporting.
Findings- A new form of reporting is evolving due to the limitations of current financial
reporting, which should have information about ecological footprints of operations,
Economic, Social, and Environmental impact.
Research limitations/implications- The research paper underpins the idea of
incorporation of Environmental, Social & Governance (ESG) issues and Sustainability
85
BUSINESS ANALYST
into the core strategy of business. It is hoped that this research will provide insights
relating to the importance of understanding environmental, and social sustainability in
achieving long term success.
Key words: ESG, Sustainability, Social and Environmental Impact, Non-Financial
Information, Integrated Reporting.
INTRODUCTION
The globally synchronized economic slump is “not an accidental event” and extends
beyond a purely financial crisis and “failure to address it soon will have more than
cyclical consequences” (Eccles & Kruzus, 2010).
When the bubble finally bust, many companies were found into bankruptcy and it
highlighted the growing concern among stakeholders that current financial reporting
practices enables business leaders to conceal unsustainable business strategies (Roberts,
Keeble, & Brown, 2002). Much of the information included in current corporate reports
is not designed to offer forward-looking information about strategy, performance, and
risk. There is an increasing sense among stakeholders that existing corporate reporting,
which is characterized by a strong focus on financial performance and a lack of
information about corporate strategy and non-financial performance, is becoming unfit
for the purpose (Busco et al., 2013). Since companies cater for a wide range of
stakeholders with different interests, the presentation of the company's financial
performance alone is not enough (IIRC, 2011); (IOD, 2009). Information on financial
performance is backward looking which does not help stakeholders with information for
decision making (Bray, 2011); (KPMG, 2012). India is third largest CO emitter in the 2
world. Significant changes to government policies and strategies, corporate behavior
and strategies are, therefore, required to decouple economic growth from greenhouse
gas emissions. This calls for the financial performance to be supplemented with other
information to enable the stakeholders to obtain a holistic view of the Company's
performance in order to assess its ability to create and sustain value. A new “green”
development paradigm needs to be developed to build more equitable, low-carbon,
resource productive and zero-waste economies (Swilling & Annecke, 2012) ; (Zyl,
2013).
Taking stakeholders' views into account is central to developing a robust understanding
86 April - September 2014
of a company's economic, environmental, and social impacts, and of how these relate to
business value and resilience. An ever-greater number of companies and other
organizations are recognizing the need to make their operations more sustainable. At the
same time, governments, stock exchanges, markets, investors, and society at large are
calling on companies to be transparent about their sustainability goals, performance, and
impacts (GRI, 2013). The premise behind these non-financial reports is that only the
impacts that are measured and accounted for in a report will receive the necessary
attention by the organization's management and owners. Reporting is, therefore, seen
essential to ensure that organizations are socially and environmentally responsible
(Triple Bottom-Line, 2009).
Although a few companies integrate their financial results with CSR/Sustainability
reporting, most companies issue separate reports. This tends to lead to reports that may
not reflect the significant interdependence between an organization's governance and
strategies of its financial and non-financial results (James, 2013); (IIRC, 2011).
According to if sustainability accounting does not make visible the
tension between capitalism and the planet's ability to bear the load, it is supporting the
status quo and this situation is a crucial impediment to any real progress (Gray & Milne,
2004); (Azcarate, Carrasco, & Fernandez, 2011) . In India The New Companies Act
2013 mandates that every company having a net worth of 500 crore INR, or more or a
turnover of 1000 crore INR or more, or a net profit of five crore INR or more, during any
financial year shall constitute the corporate social responsibility committee of the board,
these companies would be required to spend at least 2% of the average net-profits of the
immediately preceding three years on CSR activities, and if not spent, explanation for
the reasons thereof would need to be given in the director's report(section 135 of the
2013 Act). The committee shall formulate the policy on the following activities:
Ÿ Eradicating extreme hunger and poverty
Ÿ Promotion of education
Ÿ Promoting gender equality and empowering women
Ÿ Reducing child mortality and improving maternal health
Ÿ Combating human immunodeficiency virus, acquired immune deficiency syndrome,
malaria, and other diseases
Ÿ Ensuring environmental sustainability
Ÿ Employment enhancing vocational skills
Hibbitt (1999)
LIMITATIONS OF CURRENT FINANCIAL REPORTING 87Vol. 35 No. 1
BUSINESS ANALYST
Ÿ
Ÿ Contribution to the Prime Minister's National Relief Fund or any other fund set-up by
the central government or the state governments for socio-economic development
and relief, and funds for the welfare of the scheduled castes and Tribes, other
backward classes, minorities and women (www.mca.gov.in).
This clearly shows the Government's sensitization to CSR issues. Through this the
Government has made the Corporate its party in addressing social and environment
issues.
EMERGENCE OF INTEGRATED REPORTING
Integrated reporting is a new concept globally. South Africa has taken the lead by urging
its companies to embrace the concept in their reporting (Makiwane, 2012). Integrated
Reporting is now required for listed companies in South Africa on an 'apply or explain'
basis (KPMG, 2012). Many other companies throughout the world are starting to adopt
Integrated Thinking in day-to-day business decision-making, and are quite transparent
in their public disclosures (KPMG, 2012).
Integrated reporting will provide useful information for company executives to assist
them in planning, budgeting, and implementing strategies that lead to the efficient and
effective utilization of resources, which will tend to help control or reduce costs (James,
2013). Integrated reporting i.e., representation of the financial and non-financial
performance of a company in a single report, doesn't only mean merging financial and
sustainability reports into one report, its true meaning is to link sustainability strategy
to business strategy and help the company and its stakeholders identify the non-financial
priority areas. Integrated Reporting demonstrates the linkages between an organization's
strategy, governance, and financial performance and the social, environmental, and
economic context within which it operates.
OBJECTIVES OF THE RESEARCH PAPER
1. To study the construct of Limitations of Financial reporting.
2. To see the impact of those limitation on the need or evolution of a new form of
reporting.
3. To study the role of non-financial information on the value determination of an
Social business projects
88 April - September 2014
organization.
4. To predict the requirements of new form of reporting as outcomes of limitations of
financial reporting.
HYPOTHESES OF THE RESEARCH
H01: Limitations of financial reporting do not predict a new form of reporting
which should have information about system effectiveness.
Ha1: Limitations of financial reporting do predict a new form of reporting which
should have information about system effectiveness.
H02: Limitations of financial reporting do not predict a new form of reporting
which should have information about economic, social and environmental impact.
Ha2: Limitations of financial reporting do predict a new form of reporting which
should have information about economic, social and environmental impact.
H03: Limitations of financial reporting do not predict a new form of reporting
which should have information about ecological footprints of operations.
Ha3: Limitations of financial reporting do predict a new form of reporting which
should have information about ecological footprints of operations.
REVIEW OF LITERATURE
Literature review was considered to be instrumental in devising, identifying and
employing the survey instrument.
A study by Cronje (2007) shows that Corporate Annual Reports may be perceived as
product of two interconnected information processing systems-Mandatory financial
information system and discretionary financial information system, the study found that
the needs of the users to reduce uncertainty and risk in their decision making have an
impact on constantly evolving accounting practices (Cronje, 2007).
As intangible assets play an even more important role in companies' value-creating
process than ever before (Singh & Gupta, 2013) it has become more important to
communicate these “hidden” assets to external stakeholders. Singh and Gupta (2013)
found a significant impact of the human asset valuation information on investors'
decision regarding their selection of the company.
LIMITATIONS OF CURRENT FINANCIAL REPORTING 89Vol. 35 No. 1
BUSINESS ANALYST
Amir et al., (2012) investigated the relationship between environmental & social
disclosure and shareholders wealth in Singapore. They found that there is a positive and
considerable relationship between sustainability reporting and amount of paid dividend
and share price as well. Findings of this research show that there is a positive and
significant relationship between environmental & social performance disclosure and
revenue.
Singh (2013) recommends that the Sustainable Development and Business: Vision 2050
of WBCSD (World Business Council for Sustainable Development), should incorporate
higher level goals of development. Holistic development of human beings including the
spiritual dimensions and enhancement of levels of consciousness must be incorporated.
Further the integrated reporting also needs to be incorporated to make this challenging
vision a reality. The study further emphasized that we need to develop a culture of
learning organization which learns not only by itself but also from the learning of other
organizations.
Eccles et al., (2012) found that High Sustainability companies considerably
outperformed Low Sustainability companies over the long-term, both in terms of stock
market and accounting performance.
A study by Eccles et al., (2011) provided insights into market interest in nonfinancial
information. The study divided 247 nonfinancial metrics in this database in five groups:
1. Carbon Disclosure Project (CDP) data,
2. Environmental metrics,
3. Social metrics,
4. Governance metrics, and
5. Disclosure scores.
The study predicted that as more companies disclose more nonfinancial information, as
more knowledge is developed by research and teaching programs in business schools,
and as more sophisticated valuation models are developed by investors, market interest
in nonfinancial data will exponentially increase in the future.
According to the literature, it is clear that organizational reporting has evolved over the
last few decades from a purely financial focus, to embrace factors outside of traditional
financial reporting.
90 April - September 2014
1. Limitations of Current Financial Reporting leading to Emergence of
Integrated Reporting
1.1 Lack of Incorporation of Environmental, Social, and Governance Issues
(ESG)
The over-consumption of finite natural resources, the risk of catastrophic 'accidents,'
and the implications of climate change are possibly among the greatest challenges facing
the world today – financial reports as we currently know them do not include this
information, and investors cannot easily assess these risks. Over time, other types of
corporate reporting have grown to fill these gaps, including Corporate Social
Responsibility (CSR) reporting, carbon or environmental reporting, sustainability
reporting, and now integrated reporting. These additional reports disclose non‐financial
information about Environmental, Social, and Governance (ESG) strategies and
practices and perhaps more importantly, point towards additional material risks for a
company (e.g., British Petroleum, Nike, Coca Cola and other companies all faced
environmental risks that had significant downward impacts on their share prices because
investors were simply unaware of those risks, and those risks had not been discussed in
external reports).
1.2. Difficulties in Reporting of Sustainability Issues (DSI)
It is generally accepted that sustainable development calls for a convergence between
the three pillars of economic development, social equity, and environmental protection
(Singh, 2013). Sustainability of a company means conducting operations in a manner
that meets existing needs without compromising the ability of future generations to meet
their needs. It means having regard for the impact that the business operations have on
the economic life of the community in which it operates. Sustainability includes steconomic, social, and governance issues (IOD, 2009). Sustainability is a concept that 21
Century companies need to remember and incorporate into their businesses to ensure
their future success. The sustainability reports have had little impact on mainstream
financial accounting and corporate reporting methodologies, as they are often
disconnected from the corporate's financial reports and fail to provide a link between
sustainability issues and corporate's core strategy (King, 2011). Although the initiatives
have explicitly adopted the definition of sustainable development in the Brundtland
Report, the consequences and challenges of that definition have not been internalized
because the initiatives only cover aspects of weak sustainability thereby favoring
LIMITATIONS OF CURRENT FINANCIAL REPORTING 91Vol. 35 No. 1
BUSINESS ANALYST
managerial capture and consequently dashing the expectations that were generated
when the report was published (Azcarate et al., 2011).
1.3. Distrust for Corporate Actions (DCA)
Corporations are perceived by stakeholders as a collective entity capable of action
resulting from intentional and goal-oriented behavior. Corporate distrust reflects the
belief of stakeholders about the intent of corporate behavior in general. Corporate
distrust is developed by individuals as information is gathered from various sources such
as friends, co-workers, organizations, and media sources. This attitude can also be
influenced by one's experiences with specific organizations available in memory, as well
as experiences with organizations in general (Adams et al., 2010). In the aftermath of the
recent financial crisis and corporate scandals, many people increasingly perceive
business as one of the major causes of social, environmental, and economic problems
(Busco et al., 2013). There are many corporate disasters which have caused
environmental damage to a great magnitude such as, Bhopal Gas Tragedy, meltdown of
a nuclear reactor at the Three Mile Island, oil spills in Niger Delta, use of the Love Canal
as a dumping site by Hooker Chemical which led to a very high rate of miscarriages,
tumors, and birth defects among the residents. The massive flood and landslides
occurred in the State of Uttrakhand in India in June 2012 is also attributed to several
hydropower projects and mining projects going on in the river valleys in Uttrakhand
which were diverted through tunnels and the natural course of rivers were changed.
These power project companies unheeded the environmentalists' voice.
1.4. Failure of Financial Reporting To Provide a Complete Picture (FFR)
According to IIRC, 83 percent of a company's market value in 1975 could be determined
by the financial and physical assets on its balance sheet. In 2009, those assets accounted
for only 19 percent of a company's value. Investors have to look elsewhere to determine
the value of the other 81 percent. Unable to find objective or comprehensive information
on that value in financial reports, investors face more risk than they did in the past.
Integrated reporting is designed to provide more of the relevant information that
financial reports fail to offer. Singh (1999) provided the new dimensions of measuring
and reporting those aspects which are not being reported by organizations but are very
important for decision making particularly related to human capital. Singh & Gupta
(2008) have tested the contribution based model of measuring the value of human asset
in manufacturing companies and the importance of reporting the same properly by the
92 April - September 2014
companies so that proper decisions can be taken. Singh & Gupta (2013) validated the
results in service sector companies also.
2. Disclosures sought in new form of reporting (Integrated Reporting)
According to IIRC, “Integrated Reporting results in a broader explanation of
performance than traditional reporting” (IIRC, 2011). The alternative of the current
financial reports and the so-called sustainability reports starts with creation of an
Integrated Report. This method could ensure the necessary changes in corporate
behavior if the Integrated Report contains sufficient information to highlight the
weaknesses in the current corporate strategy and identify areas calling for improvement
and attention by management and the board (Zyl, 2013). Therefore, the quest of the
researcher in this journey was to find out the Limitations of Current Financial Reporting
in India; whether a superior form of reporting as developed and adopted by other
countries like South Africa, USA, countries of EU, is desired in India too. In order to
cater task, specific outcomes of having a new form of reporting were pre-decided
keeping in mind the support of the literature. The following could be the part of
information required to be contained in Integrated Report. Since there is no prescribed
guideline on the format and contents of it, therefore, IIRC and GRI are working together
on it. The possible inclusions are discussed below:
2.1 System Effectiveness & Process Effectiveness (SYSEFF)
System effectiveness is a measure of the extent to which a system can be expected to
complete its assigned mission within an established time frame under stated
environmental conditions. In a survey in 2011 by McKinsey the share of executives
citing operational efficiency and lowering costs as their company's top reasons for
addressing sustainability had risen 14 percentage points since 2010 to 33 per cent –
overtaking corporate reputation, which was chosen by 32 per cent of respondents. If the
preparation of an Integrated Report leads to more sustainable business processes and a
greater awareness of business operations that are not sustainable, the report should
contain sufficient information that would enable the companies to learn from the
process. The report would reveal that companies are beginning to understand their
positive and negative impacts relating to natural environment and society regarding
equity, health, and poverty (Zyl, 2013).
LIMITATIONS OF CURRENT FINANCIAL REPORTING 93Vol. 35 No. 1
BUSINESS ANALYST
2.2 Economic, Social and Environmental Impact (SOCENV)
There are some wrong perceptions about sustainable development that it means the
present level and pattern of development should be sustained for future generations as
well. Instead sustainable human development puts people at the center of development
and points out forcefully that the inequities of today are so great that to sustain the
present form of development is to perpetuate similar inequities for future generations
(Singh A. K., 2002). Economic sustainability can only be achieved if equity-also known
as social justice-is addressed. It can be described as the attempt to reverse the increasing
disparities in wealth and consumption through increasing the access to environmental
and other resources by disadvantaged sections of society (Gray, R., 2006). A rapid and
continuing rise in the use of fossil fuel-based energy and an accelerating use of natural
resources are continuing to affect key ecosystem services, threatening supplies of food,
freshwater, wood fiber, and fish. More frequent and severe weather disasters, droughts
and famines are also impacting communities around the world (Singh A.K., 2013).
There is broad consensus over the need to include indicators that help to measure and
compare business performance and enable visualization of the best social and
environmental practices (Grafé & Jankowska, 2001); (Azcarate, Carrasco, & Fernandez,
2011) According to Gray (1994) “a sustainable organization is one which leaves the
biosphere at the end of the accounting period no worse off than it was at the beginning of
the accounting period”; (Gray R. , 1994) (Azcarate, Carrasco, & Fernandez, 2011).
There is a need for indicators that report on business performance linked to the state of
the environment (Grafé & Jankowska, 2001).
2.3 Ecological Footprints of Operations & Innovations (ECOOP)
The Worldwatch Institute, an environmental group, argues in a recent report that, with
the rate at which natural resources are consumed more than doubling in the past 50 years
and up to 2bn more aspiring consumers, humanity is “outstripping its resource base at an
unprecedented global scale”. It is a message that companies need to take seriously. Some
companies are even putting hard numbers on their environmental footprint. Investors are
also increasingly interested in the environmental performance of the companies they put
money into. Humans already depend on the equivalent of 1.5 planets to provide the
resources they use and to absorb their waste, according to the Global Footprint Network.
This, it says, means it takes the earth a year and a half to regenerate what human beings
use in a year. In collaboration with the Global Footprint Network, WBCSD calculated
94 April - September 2014
the Vision 2050 ecological footprint against business-as-usual and found that by 2050,
despite increases in population, humanity will be using the equivalent of just over one
planet, based on the changes we embrace in Vision 2050, as opposed to the 2.3 planets
we would be using if we continue on the business-as- usual path we are on today. The
world will be in a much better position if we maintain the course implied in the pathway
and its elements (Singh, 2013).
Some companies believe that it is possible to grow while maintaining or reducing their
environmental footprint. Unilever, the Anglo-Dutch consumer goods company, says it
plans to double the company's size while halving its environmental footprint and
sourcing all of its agricultural raw materials sustainably. This will lead to innovations as
companies will find ways to make their operations sustainable.
RESEARCH METHODOLOGY
In the light of aforesaid objectives and hypotheses an instrument was developed to
collect opinion on accounting professionals on limitations of financial reporting
(Difficulties in reporting of sustainability issues, Distrust for Corporate Actions, Failure
of financial reporting, and Need for incorporation of ESG issues) and the disclosures
sought in the new form of reporting viz., System Effectiveness, Social and
Environmental impact, Ecological footprints of operations. Annual reports of BSE listed
companies of India were studied for the period between 2011 and 2013. A questionnaire
was then developed which comprised of 81 items selected to indicate the level of current
financial reporting, awareness on Integrated Reporting, disclosures sought in the new
form of reporting i.e., an Integrated Report and the benefits that may result from the
transition to new form of reporting. Items were divided in 4 sections named as follows.
A. Corporate Annual Reports- as a Communication Medium (43 statements)
B. Integrated Reporting (6 statements)
C. Information to be included in Integrated Report (17 statements)
D. What opportunities could be there from adoption of Integrated Reporting (15
statements).
The questionnaire was administered through Survey methodology and the technique
used for survey was Probability based Stratified Random Sampling. Out of the total
230 responses received 185 questionnaires deemed fit for analysis.
LIMITATIONS OF CURRENT FINANCIAL REPORTING 95Vol. 35 No. 1
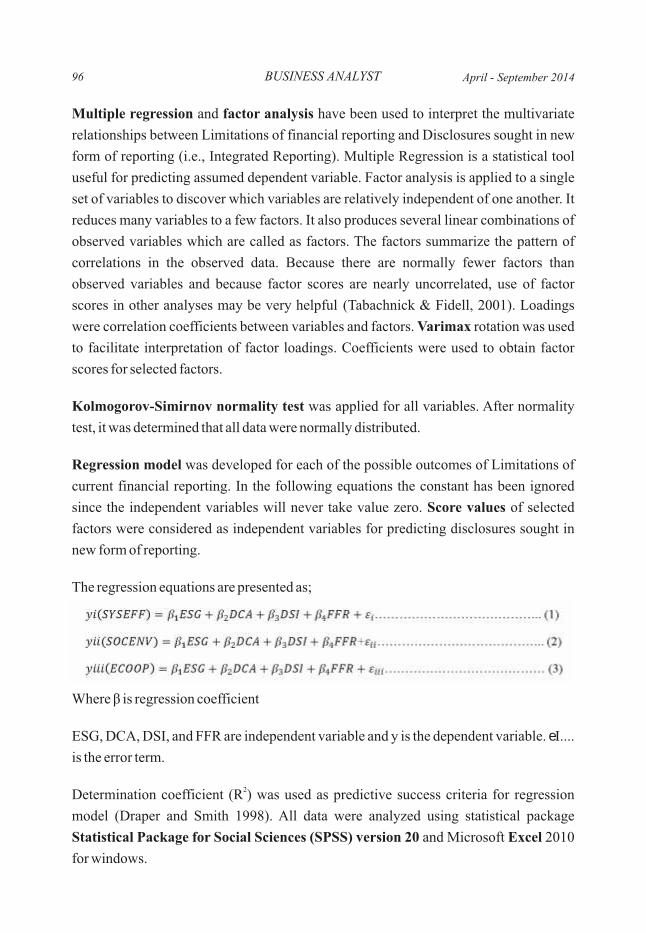
Multiple regression and factor analysis have been used to interpret the multivariate
relationships between Limitations of financial reporting and Disclosures sought in new
form of reporting (i.e., Integrated Reporting). Multiple Regression is a statistical tool
useful for predicting assumed dependent variable. Factor analysis is applied to a single
set of variables to discover which variables are relatively independent of one another. It
reduces many variables to a few factors. It also produces several linear combinations of
observed variables which are called as factors. The factors summarize the pattern of
correlations in the observed data. Because there are normally fewer factors than
observed variables and because factor scores are nearly uncorrelated, use of factor
scores in other analyses may be very helpful (Tabachnick & Fidell, 2001). Loadings
were correlation coefficients between variables and factors. Varimax rotation was used
to facilitate interpretation of factor loadings. Coefficients were used to obtain factor
scores for selected factors.
Kolmogorov-Simirnov normality test was applied for all variables. After normality
test, it was determined that all data were normally distributed.
Regression model was developed for each of the possible outcomes of Limitations of
current financial reporting. In the following equations the constant has been ignored
since the independent variables will never take value zero. Score values of selected
factors were considered as independent variables for predicting disclosures sought in
new form of reporting.
The regression equations are presented as;
Where β is regression coefficient
ESG, DCA, DSI, and FFR are independent variable and y is the dependent variable. eI....
is the error term.
2Determination coefficient (R ) was used as predictive success criteria for regression
model (Draper and Smith 1998). All data were analyzed using statistical package
Statistical Package for Social Sciences (SPSS) version 20 and Microsoft Excel 2010
for windows.
BUSINESS ANALYST96 April - September 2014
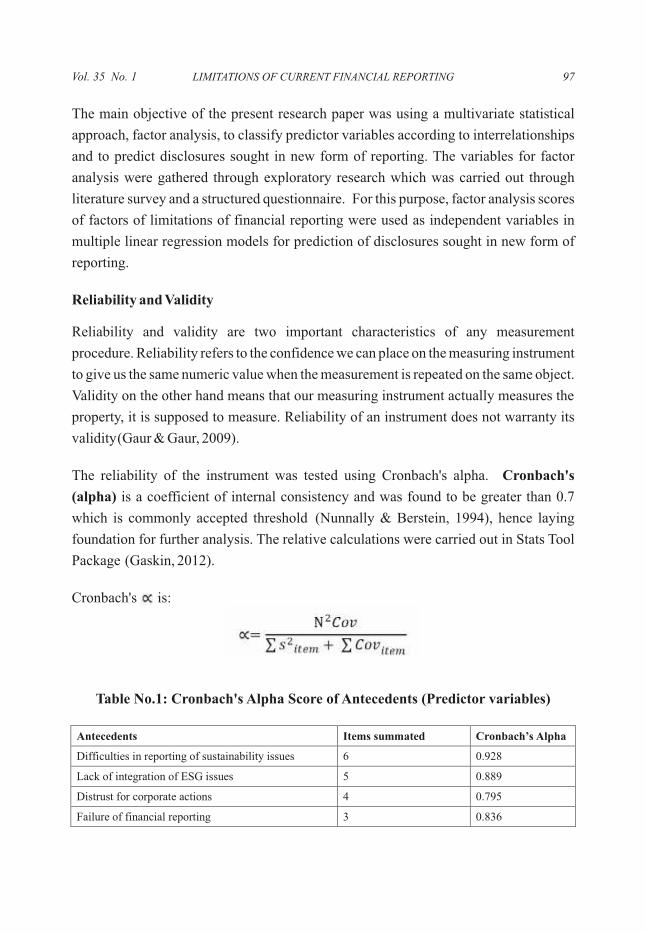
The main objective of the present research paper was using a multivariate statistical
approach, factor analysis, to classify predictor variables according to interrelationships
and to predict disclosures sought in new form of reporting. The variables for factor
analysis were gathered through exploratory research which was carried out through
literature survey and a structured questionnaire. For this purpose, factor analysis scores
of factors of limitations of financial reporting were used as independent variables in
multiple linear regression models for prediction of disclosures sought in new form of
reporting.
Reliability and Validity
Reliability and validity are two important characteristics of any measurement
procedure. Reliability refers to the confidence we can place on the measuring instrument
to give us the same numeric value when the measurement is repeated on the same object.
Validity on the other hand means that our measuring instrument actually measures the
property, it is supposed to measure. Reliability of an instrument does not warranty its
validity (Gaur & Gaur, 2009).
The reliability of the instrument was tested using Cronbach's alpha. Cronbach's
(alpha) is a coefficient of internal consistency and was found to be greater than 0.7
which is commonly accepted threshold (Nunnally & Berstein, 1994), hence laying
foundation for further analysis. The relative calculations were carried out in Stats Tool
Package (Gaskin, 2012).
Cronbach's is:
Table No.1: Cronbach's Alpha Score of Antecedents (Predictor variables)
LIMITATIONS OF CURRENT FINANCIAL REPORTING 97Vol. 35 No. 1
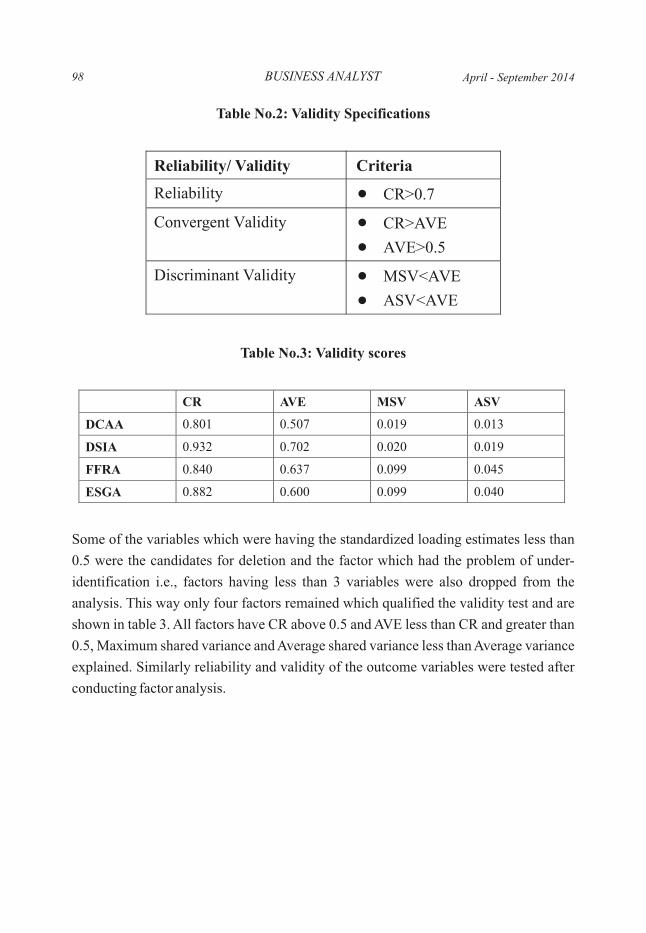
Table No.2: Validity Specifications
Table No.3: Validity scores
Some of the variables which were having the standardized loading estimates less than
0.5 were the candidates for deletion and the factor which had the problem of under-
identification i.e., factors having less than 3 variables were also dropped from the
analysis. This way only four factors remained which qualified the validity test and are
shown in table 3. All factors have CR above 0.5 and AVE less than CR and greater than
0.5, Maximum shared variance and Average shared variance less than Average variance
explained. Similarly reliability and validity of the outcome variables were tested after
conducting factor analysis.
BUSINESS ANALYST
CR AVE MSV ASV
DCAA 0.801 0.507 0.019 0.013
DSIA 0.932 0.702 0.020 0.019
FFRA 0.840 0.637 0.099 0.045
ESGA 0.882 0.600 0.099 0.040
98 April - September 2014
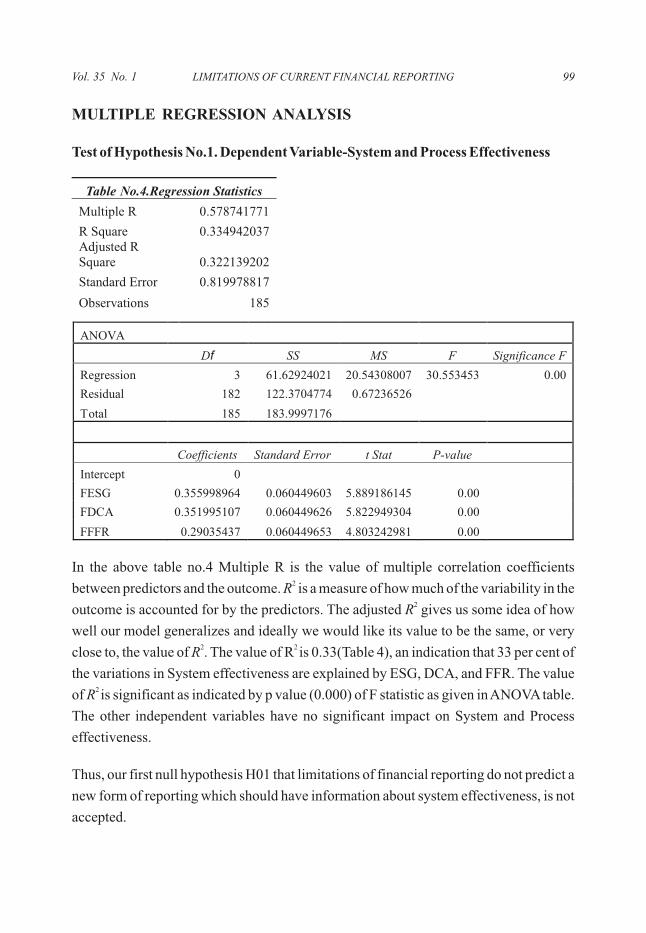
MULTIPLE REGRESSION ANALYSIS
Test of Hypothesis No.1. Dependent Variable-System and Process Effectiveness
In the above table no.4 Multiple R is the value of multiple correlation coefficients 2between predictors and the outcome. R is a measure of how much of the variability in the
2outcome is accounted for by the predictors. The adjusted R gives us some idea of how
well our model generalizes and ideally we would like its value to be the same, or very 2 2 close to, the value of R . The value of R is 0.33(Table 4), an indication that 33 per cent of
the variations in System effectiveness are explained by ESG, DCA, and FFR. The value 2
of R is significant as indicated by p value (0.000) of F statistic as given in ANOVA table.
The other independent variables have no significant impact on System and Process effectiveness.
Thus, our first null hypothesis H01 that limitations of financial reporting do not predict a
new form of reporting which should have information about system effectiveness, is not
accepted.
Table No.4.Regression Statistics
Multiple R
0.578741771
R Square 0.334942037Adjusted R Square 0.322139202
Standard Error 0.819978817
Observations 185
LIMITATIONS OF CURRENT FINANCIAL REPORTING 99Vol. 35 No. 1
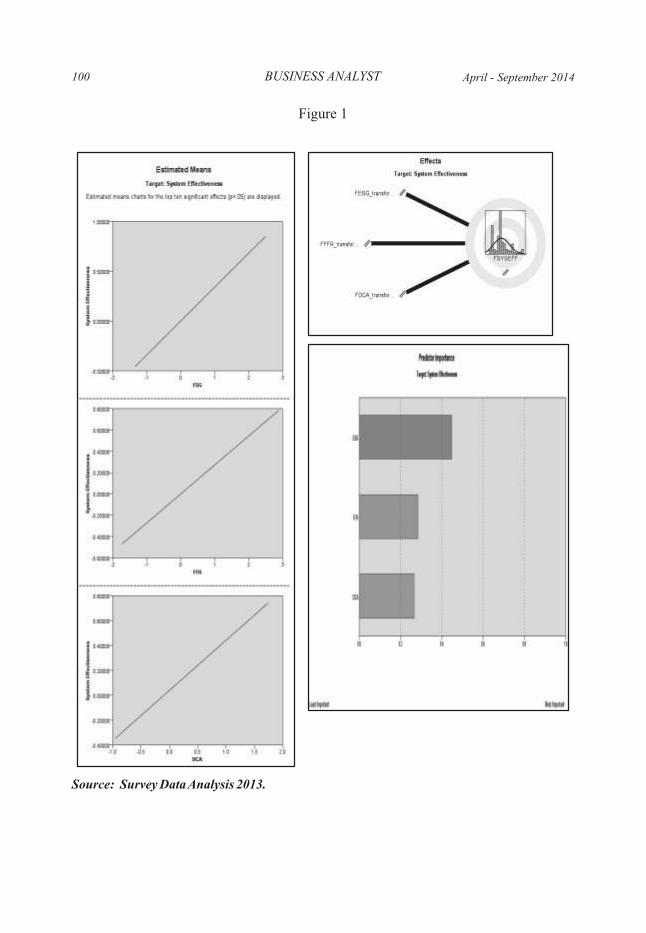
Figure 1
Source: Survey Data Analysis 2013.
BUSINESS ANALYST100 April - September 2014
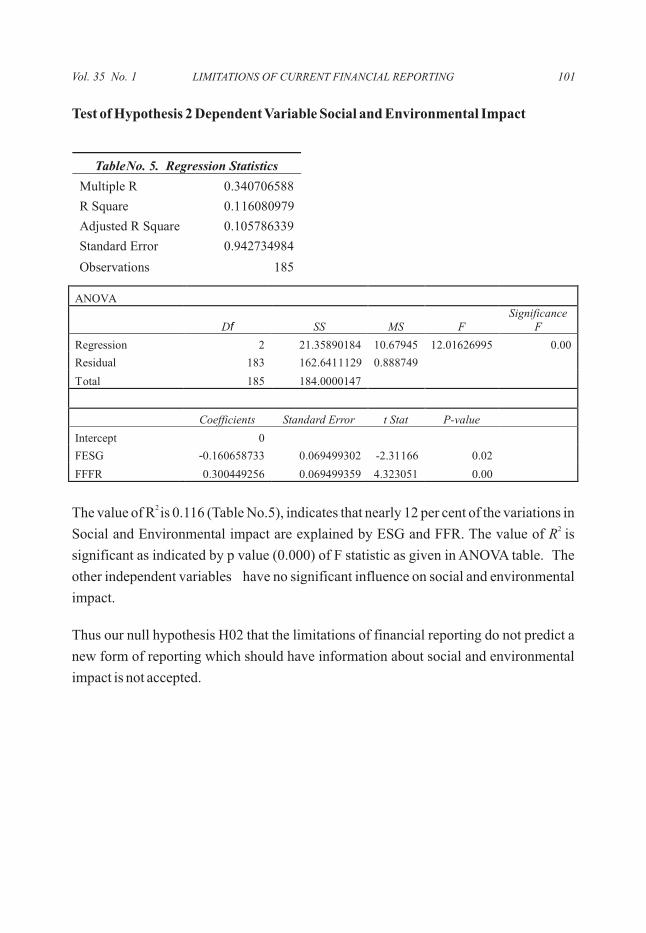
Test of Hypothesis 2 Dependent Variable Social and Environmental Impact
2 The value of R is 0.116 (Table No.5), indicates that nearly 12 per cent of the variations in
2 Social and Environmental impact are explained by ESG and FFR. The value of R is significant as indicated by p value (0.000) of F statistic as given in ANOVA table. The
other independent variables have no significant influence on social and environmental
impact.
Thus our null hypothesis H02 that the limitations of financial reporting do not predict a
new form of reporting which should have information about social and environmental
impact is not accepted.
TableNo. 5. Regression Statistics
Multiple R 0.340706588
R Square 0.116080979
Adjusted R Square 0.105786339
Standard Error 0.942734984
Observations 185
LIMITATIONS OF CURRENT FINANCIAL REPORTING 101Vol. 35 No. 1
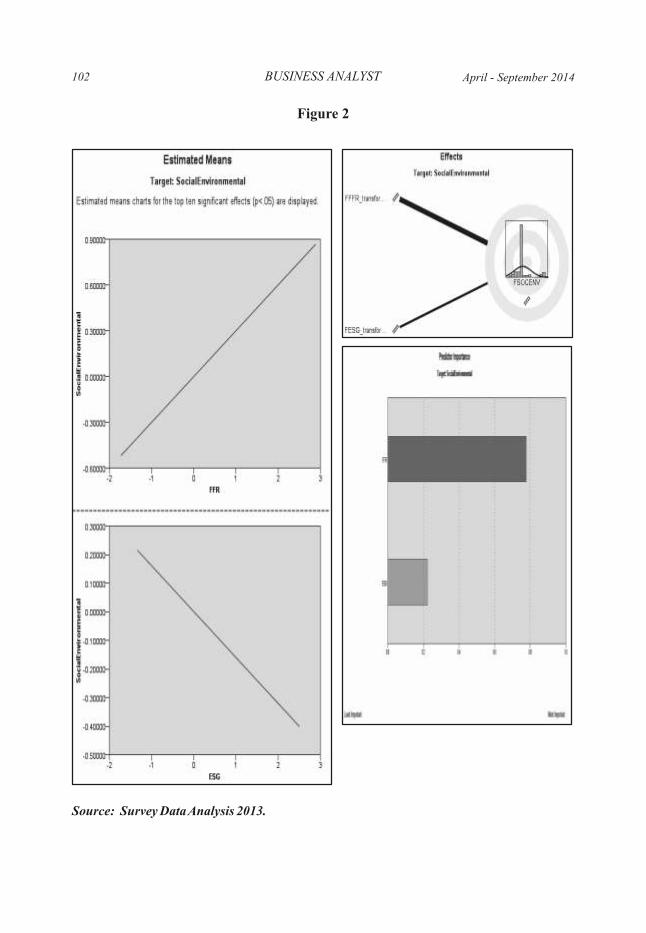
Figure 2
Source: Survey Data Analysis 2013.
102 BUSINESS ANALYST April - September 2014
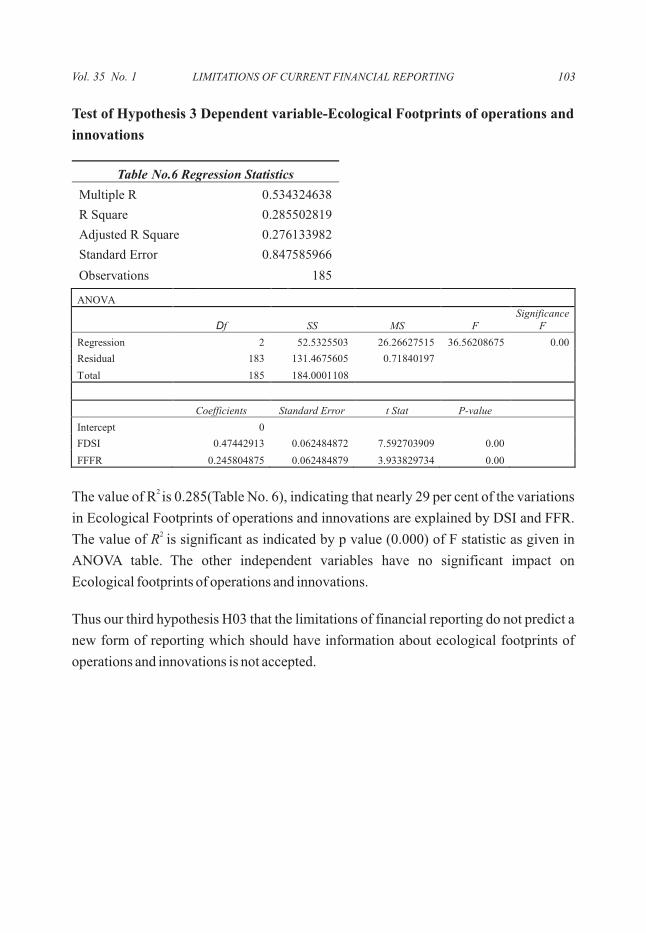
Test of Hypothesis 3 Dependent variable-Ecological Footprints of operations and
innovations
2 The value of R is 0.285(Table No. 6), indicating that nearly 29 per cent of the variations
in Ecological Footprints of operations and innovations are explained by DSI and FFR. 2 The value of R is significant as indicated by p value (0.000) of F statistic as given in
ANOVA table. The other independent variables have no significant impact on
Ecological footprints of operations and innovations.
Thus our third hypothesis H03 that the limitations of financial reporting do not predict a
new form of reporting which should have information about ecological footprints of
operations and innovations is not accepted.
LIMITATIONS OF CURRENT FINANCIAL REPORTING 103Vol. 35 No. 1
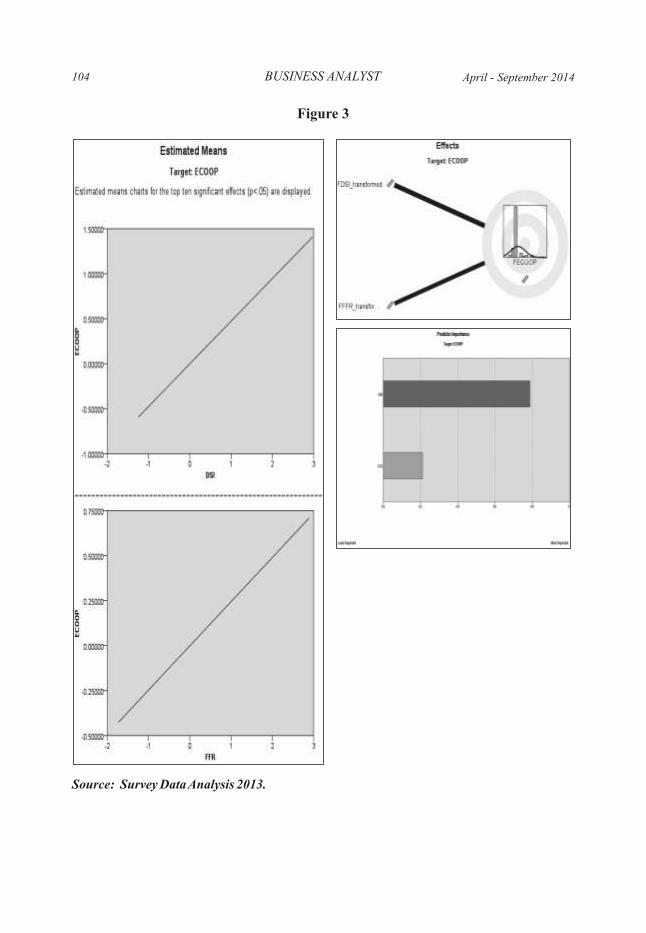
Figure 3
Source: Survey Data Analysis 2013.
104 BUSINESS ANALYST April - September 2014
CONCLUDING OBSERVATIONS
1. The research paper concludes that lack of integration of ESG issues, distrust for
corporate actions, and failure of financial reporting in giving complete picture of the
company call for a new reporting which should have information on System
effectiveness as 33 per cent of the variations in System effectiveness is explained by
these predictors.
2. The research paper found there is a need for the incorporation of sustainability
issues in to the core strategy of business. Though integrating non-financial
information into one report called as process of integrated reporting is not a
panacea in itself, still it can make management and board identify areas requiring
improvement and attention. In this way, the report can trigger the necessary changes
in corporate behavior and could move companies towards becoming more
sustainable.
3. The adoption of integrated reporting will lead to innovations as 29 per cent of the
variations in Ecological Footprints of operations and innovations are explained by
DSI and FFR together.
4. It is learnt that Environmental, Social, and Governance (ESG) performance index
should be developed and be made comparable, as it is found a factor responsible for
more information sought in integrated reporting.
5. Financial reports fail to address the distrust among civil society of the intentions and
practice of business. So, if the companies disclose more information on their
environmental activities and make the stakeholders aware of such initiatives, it
could add value to the firm.
6. By integrating sustainability issues into core business strategy, a firm will be able to
drive operational efficiencies and thereby the new strategy can be a source of
innovative and new environment friendly products.
7. The Companies Act 2013 makes an effort to introduce the culture of corporate
social responsibility (CSR) in Indian corporates by requiring companies to
formulate a corporate social responsibility policy and at least incur a given
minimum expenditure on social activities. So, its accounting and reporting will be a
permanent feature of the Company's annual reports in future.
LIMITATIONS OF CURRENT FINANCIAL REPORTING 105Vol. 35 No. 1
REFERENCES
Adams, J. E., Highhouse, S., & Zickar, M. J. (2010). Understanding General Distrust of Corporations. Corporate Reputation Review, 13(1), 38-51.
Amir, K., Nikhashemi, S. R., Yousefi, A., & Haque, A. (2012, March). Volunatary Sustainability Disclosure, Revenue and Shareholders Wealth- A perspective from Singaporean Companies. Business Management Dynamics, 1(9), 06-12.
Azcarate, F., Carrasco, F., & Fernandez, M. (2011). The role of integrated indicators in exhibiting business contribution to sustainable devleopment: A survey of sustainability reporting initiatives. Spanish Accounting Review, 14, 213-240.
Bray, M. (2011). Integrated Reporting Performance insight through better buisness reporting, The Business Case. KPMG in Australia. KPMG International Cooperative ("KPMG International").
Busco, C., Frigo, M. L., Quattrone, P., & Riccaboni, A. (2013, August). Redefining Corporate Accountability through Integrated Reporting. Strategic Finance(August), 33-42.
Cronje, C. J. (2007). Corporate Annual Reports: Accounting Practices in Transition,DCom thesis, U n i v e r s i t y o f P re t o r i a . [ O n l i n e ] Av a i l a b l e . R e t r i e v e d S e p 11 , 2 0 11 , f r o m http://upetd.up.ac.za/thesis/available/etd-11262007-135312/
Draper, N. R., & Smith, H. (1998). Applied Regression Analysis. New York, USA: John Wiley and Sons, Inc.
Eccles, R. G., & Kruzus, M. P. (2010). One Report: Integrated Reporting for a Sustainable Strategy. New Jersy: John Wiley & Sons, Inc.
Eccles, R. G., Ioannou, I., & Serafeim, G. (2012, March). HE IMPACT OF A CORPORATE CULTURE OF SUSTAINABILITY ON CORPORATE BEHAVIOR AND PERFORMANCE,Working Paper 17950. Retrieved from http://www.nber.org/papers/w17950
Eccles, R. G., Krzus, M. P., & Serafeim, G. (2011). Market Interest in Nonfinancial Information, Working paper.
G a s k i n , J . ( 2 0 1 2 ) . S t a t s To o l P a c k a g e . R e t r i e v e d D e c 1 2 , 2 0 1 2 , f r o m http://statwiki.kolobkreation.com/wiki/Main_Page
Gaur, A. S., & Gaur, S. S. (2009). Statistical Methods for Practice and Research: A guide to data analysis using SPSS. New Delhi: Response Books.
Grafé, B., & Jankowska, B. (2001). Conference Report. Towards a common framework for corporate sustainability reporting. Journal of Environmental Assessment Policy and Management, 3(1), pp. 123-165.
Gray, R. (1994). Corporate Reporting for Sustainable Development:Accounting for Sustainability in 2000AD. Environmental Values, 3(1), 17-45.
Gray, R. (2006). Does sustainability reporting improve corporate behaviour? Wrong question? Right time? Accounting and Business Research, International Accounting Policy Forum, 36(Special Issue), 65-88.
Gray, R., & Milne, M. (2004). Towards reporting on triple bottom line: mirages, methods and myths.The Triple Bottom Line: Does it All Add Up? pp. 70-80.
GRI. (2013). G4 Sustainability Reporting Guidelines. Global Reporting Initiative.
Hibbitt, C. (1999). Searching for the Lion's tracks not the Lion- A Commentary on GRI Exposure Draft: Sustainability Reporting Guidelines. Amersterdam.
IIRC. (2011). Towards Integrated Reporting: Communicating Value in 21st Century.International Integrated Reporting Committee (IIRC). Retrieved from www.theiirc.org
IOD. (2009). Institute of Directors in Southern Africa (IOD). King Report on Governance for South Africa.
James, M. L. (2013). Sustainability and Integrated Reporting: Opportunities and Strategies for Small and Midsize Companies. Entrepreneurial Executive, 18, 17-28.
106 BUSINESS ANALYST April - September 2014
King, M. E. (2011). Foreward. Integrated Rporting Committee (IRC) Framework for Integrated reporting and the Integrated Report: Discussion Paper. Retrieved from http://www.sustainabilitysa.org
KPMG. (2012). Integrated reporting, performance insight through better business reporting.
Makiwane, T. S. (2012). Evaluation of Corporate Integrated Reporting in South Africa Post King III R e l e a s e . R e t r i e v e d O c t 1 0 , 2 0 1 3 , f r o m http://wiredspace.wits.ac.za/bitstream/handle/10539/12125/FinalResearchReport_TSMakiwane%20100512.pdf?sequence=1
Nunnally, J., & Berstein, I. (1994). Psychometric Theory, McGraw-Hill Series in Psychology (3rd ed.). New York: McGraw-Hil, inc.
Roberts, S., Keeble, J., & Brown, D. (2002). The Business Case for Corporate Citizenship. Retrieved from http://www.adlittle.com/downloads/tx_adlreports/Business_Case_for_Corporate_Responsibility_01.pdf
Singh, A. K. (1999). Human Capital Information System. The Indian Journal of Accounting, 30(1), 40-50.
Singh, A. K. (2002). HUMAN DEVELOPMENT:A HOLISTIC PERSPECTIVE FOR DEVELOPING TRANSFORMATIOAL LEADERSHIP FROM WITHIN. Delhi Business Review, 3(1), 29-45.
Singh, A. K., & Gupta, N. (2008). Measurement of Human Asset An Empirical Analysis. Indian Journal of Accounting, 38(2), 13-22.
Singh, A. K. (2013). Holistic Vision in Sustainable Development,in Horská, Elena, et al. (2013) Sustainability in Business and Society: Global Challenges – Local Solutions, Scientific monograph of Slovak University of Agriculture in Nitra. Krakow: Wydawnictwo Episteme. 133-152.
Singh, A. K., & Gupta, N. (2013). AN EMPIRICAL ANALYSIS OF KEY COMPONENTS OF MEASUREMENT OF HUMAN ASSET. Delhi Business Review, 14(2), 43-55.
Swilling, M., & Annecke, E. (2012). Just Transitions: Explorations of sustainability in an unfair world. Cape Town: UCT Press.
Tabachnick , B. G., & Fidell, L. S. (2001). Using Multivariate Statistics. Boston: Allyn and Bacon A Pearson Company.
Triple Bottom-Line. (2009). The Economist. Retrieved from http://www.economist.com/node/14301663
www.mca.gov.in. (2014). Retrieved Jan 22, 2014, from Ministry of Corporate Affairs, Government of India: http://www.mca.gov.in/MinistryV2/xbrl_faq1.html
www.world-Exchanges.org. (2014). Retrieved Feb 12, 2014, from World Ferderation of Exchanges: http://www.world-exchanges.org/sustainability/WFE-ESG.pdf
Zyl, A. S. (2013, August). Sustainability and Integrated Reporting in the South African Corporate Sector. International Business & Economics Research Journal, 12(8), 903-906.
LIMITATIONS OF CURRENT FINANCIAL REPORTING 107Vol. 35 No. 1
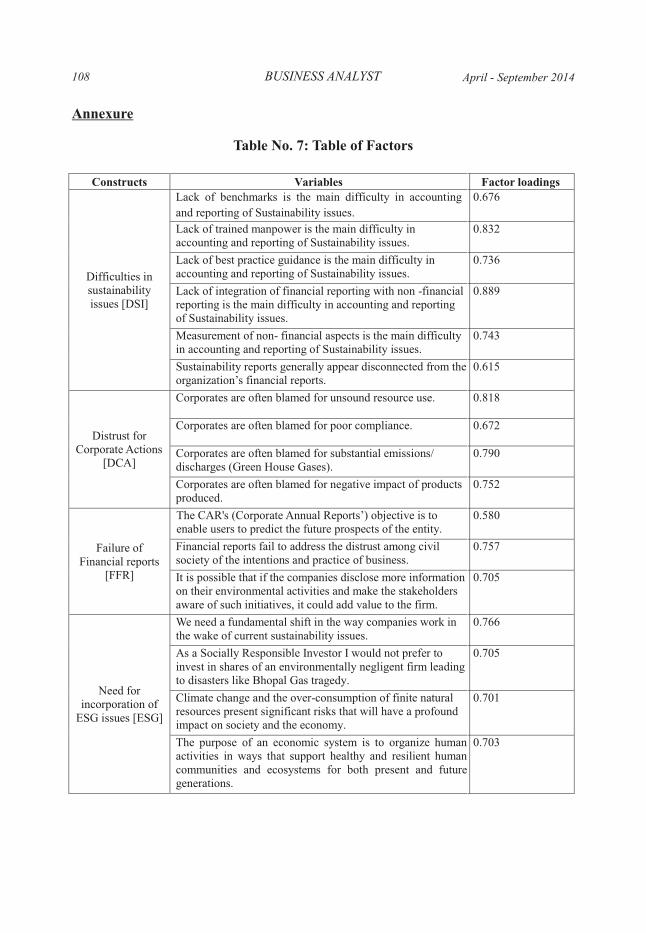
Annexure
Table No. 7: Table of Factors
108 BUSINESS ANALYST April - September 2014
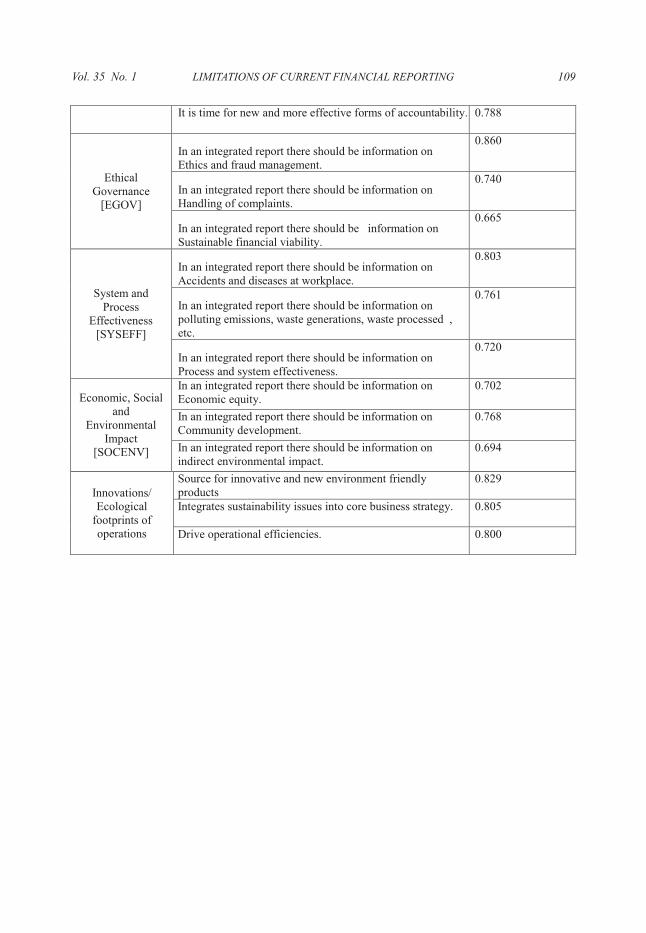
LIMITATIONS OF CURRENT FINANCIAL REPORTING 109Vol. 35 No. 1
Statement about ownership and other particulars about newspaper entitled ‘Business Analyst’, Delhi, as required to be published.
FORM IV (See Rule 8)
1. Place of publication : Shri Ram college of Commerce,University of Delhi, Maurice Nagar,Delhi - 110007
2. Periodicity of publication : Twice a year : April-September,October-March
3. Publisher’s name : Mr. P. K. Jain Whether citizen of India Yes Address Shri Ram College of Commerce
4. Editor’s name : Dr. Deepashree Whether citizen of India Yes Address Shri Ram College of Commerce
5. Name and address of : Shri Ram College of Commerce individuals who own the University of Delhi, Maurice Nagar, newspaper and partners Delhi - 110007 or Shareholders holding more than one per cent of the total paid up capital as on 1-8-1971.
I, P. K. Jain, hereby declare that the particulars given above are true to the best of my knowledge and belief.
(Sd.) P. K. Jain
Date: December, 2014 Signature of the publisher
Vol. 35 No. 1
1Associate Professor, Department of Applied Business Economics, Dayalbagh Educational Institute
(Deemed University) 2
Research Scholar, Department of Applied Business Economics, Dayalbagh Educational Institute
(Deemed University)
Email: [email protected]
MANAGEMENT OF EXTERNAL DEBT IN INDIA
1 2Swami P Saxena and Ishan Shanker
The external debt of a country is considered to be properly managed if it is under
sustainable limits. The Indian economy since 1991 has displayed episodes of
imbalances in its debt position, capital flows and external sector. This paper discusses
the perspectives of India's external debt management in the light of the external debt
policy measures adopted by government of India since 1991. It also analyses the
external debt sustainability position of India during the period from 1991-92 to 2012-13.
The approaches used to examine India's external debt management include (i) Review of
Policy Environment that accounts to policy changes done by Indian Planners, and (ii)
Sustainability Assessment of External Debt on the basis of Debt Indicators proposed by
IMF, World Bank, and also by Martin Feldstein.
Key words: External Debt Management, Debt Crisis, Debt Sustainability
INTRODUCTION
The balance of payment crisis in India that was initiated in 1985 became severe by the
end of 1990. The size of external debt reached US$ 83 billion by March 1991, of which
45 percent was contracted from private creditors at variable interest rates. By end of
1990, the government was close to default, the RBI refused new credit, and the foreign
exchange reserves reduced to such a point that India could barely finance three weeks'
imports. Accordingly, India had to airlift its gold reserves to pledge with International
Monetary Fund (IMF) for external debt.
To overcome all this fiscal and balance of payment (BoP) crisis the Government of India rdon 23 July 1991 launched process of economic reforms, where the Extended Fund
Facility (EFF) of International Monetary Fund (IMF) was provided to mitigate the crisis
given. This support put some obligatory conditionalities and led to emergence of so
called LPG policy based on Rao-Manmohan Model. It also raised the elevation of India's
111
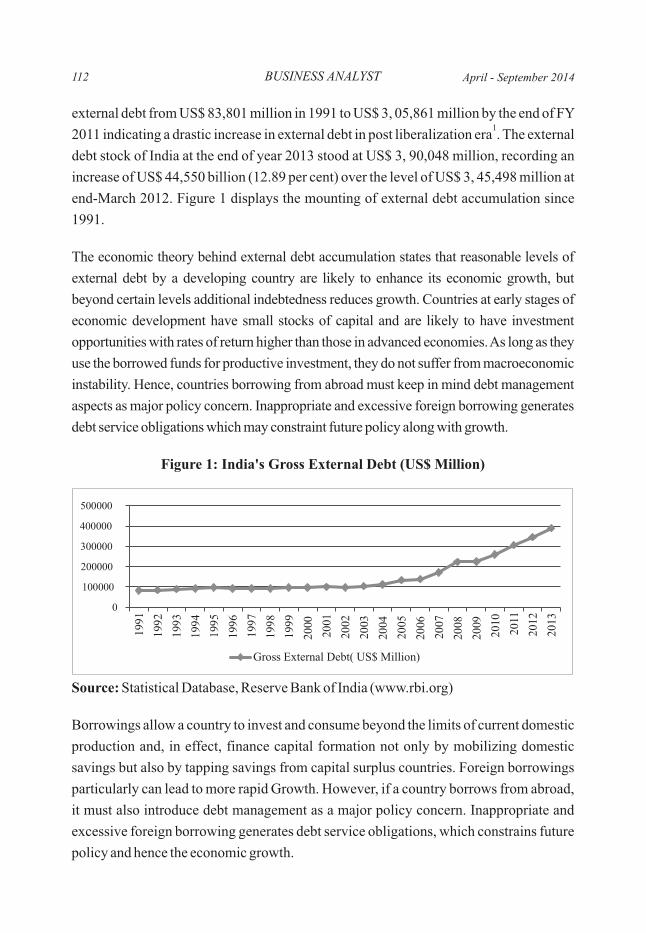
BUSINESS ANALYST
external debt from US$ 83,801 million in 1991 to US$ 3, 05,861 million by the end of FY 1
2011 indicating a drastic increase in external debt in post liberalization era . The external
debt stock of India at the end of year 2013 stood at US$ 3, 90,048 million, recording an
increase of US$ 44,550 billion (12.89 per cent) over the level of US$ 3, 45,498 million at
end-March 2012. Figure 1 displays the mounting of external debt accumulation since
1991.
The economic theory behind external debt accumulation states that reasonable levels of
external debt by a developing country are likely to enhance its economic growth, but
beyond certain levels additional indebtedness reduces growth. Countries at early stages of
economic development have small stocks of capital and are likely to have investment
opportunities with rates of return higher than those in advanced economies. As long as they
use the borrowed funds for productive investment, they do not suffer from macroeconomic
instability. Hence, countries borrowing from abroad must keep in mind debt management
aspects as major policy concern. Inappropriate and excessive foreign borrowing generates
debt service obligations which may constraint future policy along with growth.
Figure 1: India's Gross External Debt (US$ Million)
Source: Statistical Database, Reserve Bank of India (www.rbi.org)
Borrowings allow a country to invest and consume beyond the limits of current domestic
production and, in effect, finance capital formation not only by mobilizing domestic
savings but also by tapping savings from capital surplus countries. Foreign borrowings
particularly can lead to more rapid Growth. However, if a country borrows from abroad,
it must also introduce debt management as a major policy concern. Inappropriate and
excessive foreign borrowing generates debt service obligations, which constrains future
policy and hence the economic growth.
112
0
100000
200000
300000
400000
500000
199
1
199
2
199
3
199
4
199
5
199
6
199
7
199
8
199
9
2000
2001
2002
2003
2004
2005
2006
2007
2008
2009
201
0
2011
201
2
2013
Gross External Debt( US$ Million)
April - September 2014
MANAGEMENT OF EXTERNAL DEBT: THE GENESIS
External debt management refers to effective control of the level of the debt, its
composition, and its terms and conditions in order to keep it within the desired limits and
obtaining the best available terms of it. Since debt financing involves repayment
obligations, the debtor country must undergo severe strains which may limit the future
economic policy of the country. Thus, the external debt management is an integral part of
balance of payments and macroeconomic management, it has direct interface with
macroeconomic variables, such as, exchange rate, general price level, production,
aggregate demand, cyclical changes, excessive leveraging, and thereafter deleveraging
etc. impinge on borrowing requirements, capacity to borrow and debt servicing
capabilities and could have long lasting effect on economy.
The Report of World Bank and International Monetary Fund (IMF) on External debt
Sustainability (2001) stated that a country can be said to achieve external debt
sustainability if it can meet its current and future external debt service obligations in full,
without recourse to debt rescheduling or the accumulation of arrears and without
compromising growth. To this end the report prescribed that it can be attained “by
bringing the net present value (NPV) of external public debt down to about 150 percent 2
of a country's exports or 250 percent of a country's revenues”.
The objective of debt management policy is to achieve the benefits of external finance
without creating difficult problems of macroeconomic and balance of payments
stability. The external debt management broadly consists of two aspects, (i) external
debt sustainability, and (ii) the policy environment.
This paper is divided into six sections, viz., (i) Introduction (ii) The Genesis of External
Debt Management, (iii) Review of Policy Environment that accounts to policy changes
done by Indian Planners, (iv) Evaluation of India's External Debt Indicators, (v)
Sustainability Assessment of India's External Debt based on Debt Indicators proposed
by IMF, World Bank, and Martin Feldstein, and (vi) Conclusion.
EXTERNAL DEBT MANAGEMENT IN INDIA: A POLICY PERSPECTIVE
India experienced a near balance of payments crisis in 1991. One of the causes
2Report of World Bank and IMF (2001), “The Challenge of Maintaining Long Term External Debt
Sustainability”, Volume 1, P-6
MANAGEMENT OF EXTERNAL DEBT IN INDIA 113Vol. 35 No. 1
114 BUSINESS ANALYST
contributing to the crisis was the rapid growth in external indebtedness and the
consequent deterioration in key external debt indicators. India was however, able to
avoid a debt crisis and never defaulted on its debt obligations. The analysis of policy
measures attempted in this section aim at drawing out various policy measures
concerned with external debt which have taken place since 1991. The whole idea is to
point out what were the key policy aspects which led India towards lower indebtedness
since 1991.
The key policy areas in context of India's external debt management are: (i) External
Commercial Borrowings Policy, (ii) Short-term Debt Management, (iii) Non-Resident
Deposits (iv) Prepayment of High Cost Debt.
External Commercial Borrowings (ECB) Policy: External commercial borrowings
are the commercial loans taken from non-resident lenders for a minimum maturity
period of 3 years. ECBs can be raised from internationally recognized sources such as (i)
International Banks, International Capital Markets, Multilateral Financial Institutions
(such as IFC, ADB etc.), (ii) Export Credit Agencies, and (iii) Suppliers of Equipment, 3
Foreign Collaborators and Foreign Equity Holders . ECBs can be raised via (i)
Automatic Route, and (ii) Approval Route. The Indian planners looked ECB'S as
additional source to finance its development expenditure but in cautionary manner.
These are used to finance development expenditure in various projects of PSUs,
promotion of export sector, and other development projects. The use of ECB's in capital
market, real estate is prohibited to avoid any kind of speculations.
Short Term Debt Management: The policy regarding short-term debt is focused on
liquidity problems and maturity structure of short term external debt. India's short term
external debt management policy focuses on:
hort-term liabilities beyond six-months.
Ÿ
Ÿ A minimum maturity of one year for foreign currency denominated non-resident
deposits,
Ÿ Allowing short-term debt transactions only for import purposes, and
Ÿ Discouraging roll-over of s
Restricting the quantum of the short-term debt to manageable limits,
3Ibid, P-34
April - September 2014
India's short-term external debt policy is largely based on the lessons taken from balance
of payments crisis of 1991. One of the crucial factors that led to balance of payments
crisis in 1991 was the relatively high level of short-term debt, which stood at US$ 8.5
billion at end-March 1991, and the rollover difficulties associated with the short-term
liability. The whole idea behind short-term debt management policy of India is to restrict
the short term debt to avoid payment crises in future.
Non-Resident Deposits: The policies regarding non-resident deposits are aimed at
providing stability to such capital flows through various measures taken by Indian 4
planners. Some important features of policies regarding non-resident deposits are :
Ÿ Promotion of non-repatriable deposits.
Ÿ Rationalization of interest rates on rupee denominated deposits.
Ÿ Linking of interest rates to LIBOR for foreign currency denominated deposit.
Ÿ De-emphasizing short-term deposits (of up to 12 months' duration) in case of foreign
currency denominated deposits.
Ÿ An active use of reserve requirements in relation to the cycle of capital flows that has
been employed as a part of monetary management.
Ÿ Elimination of foreign exchange risk to the official agencies. Exchange guarantees
provided by RBI on such deposits were also discontinued.
Prepayment of High Cost of Debt:
The crux of the whole problem of long term external debt is concerned with low capital
formation and mounting burden of non-remunerative debt (of which terms & conditions
are unfavorable and interest rates are high). Indian planners have always tried to retire
such non-remunerative debt. Further, to boost capital formation and enhance forex
reserves, Indian planners, in the past, introduced some innovative products like, India
Millennium Deposits (IMDs). The Objective of the scheme was to provide an
investment opportunity for NRIs in long-term fixed income instruments. The tenure of
IMDs was five years denominated in US dollar, Pound, Sterling and Euro, with the
option of cumulating or non-cumulating interest. Government's guarantee, inter-alia,
covered Government's commitment to bear foreign exchange risk beyond one percent
per annum on a cumulative basis on the total pool of foreign currency deposits raised
4Ibid, P-37
MANAGEMENT OF EXTERNAL DEBT IN INDIA 115Vol. 35 No. 1
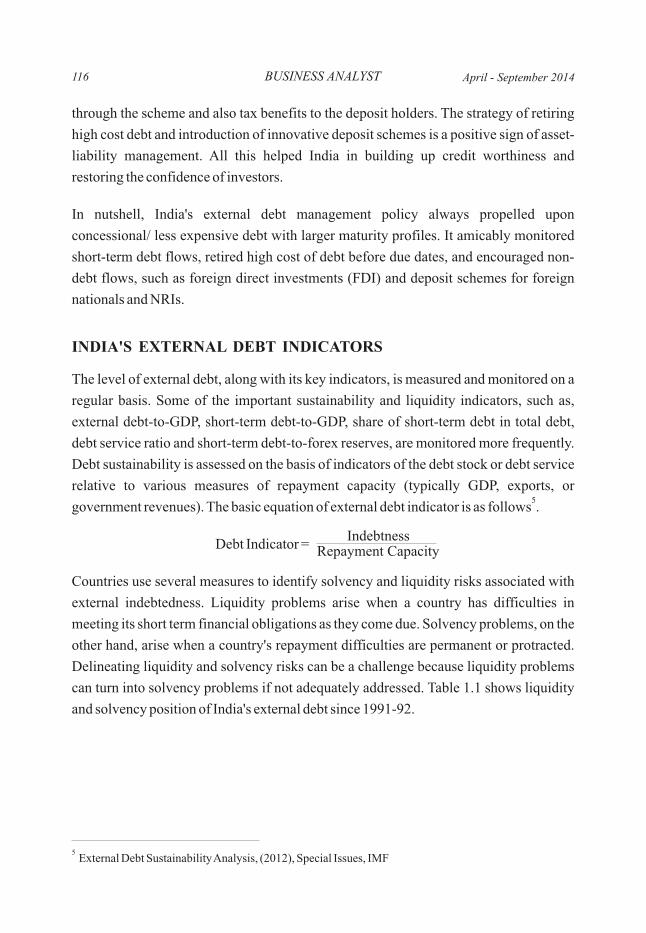
116 BUSINESS ANALYST
through the scheme and also tax benefits to the deposit holders. The strategy of retiring
high cost debt and introduction of innovative deposit schemes is a positive sign of asset-
liability management. All this helped India in building up credit worthiness and
restoring the confidence of investors.
In nutshell, India's external debt management policy always propelled upon
concessional/ less expensive debt with larger maturity profiles. It amicably monitored
short-term debt flows, retired high cost of debt before due dates, and encouraged non-
debt flows, such as foreign direct investments (FDI) and deposit schemes for foreign
nationals and NRIs.
INDIA'S EXTERNAL DEBT INDICATORS
The level of external debt, along with its key indicators, is measured and monitored on a
regular basis. Some of the important sustainability and liquidity indicators, such as,
external debt-to-GDP, short-term debt-to-GDP, share of short-term debt in total debt,
debt service ratio and short-term debt-to-forex reserves, are monitored more frequently.
Debt sustainability is assessed on the basis of indicators of the debt stock or debt service
relative to various measures of repayment capacity (typically GDP, exports, or 5
government revenues). The basic equation of external debt indicator is as follows .
Debt Indicator =
Countries use several measures to identify solvency and liquidity risks associated with
external indebtedness. Liquidity problems arise when a country has difficulties in
meeting its short term financial obligations as they come due. Solvency problems, on the
other hand, arise when a country's repayment difficulties are permanent or protracted.
Delineating liquidity and solvency risks can be a challenge because liquidity problems
can turn into solvency problems if not adequately addressed. Table 1.1 shows liquidity
and solvency position of India's external debt since 1991-92.
5External Debt Sustainability Analysis, (2012), Special Issues, IMF
IndebtnessRepayment Capacity
April - September 2014
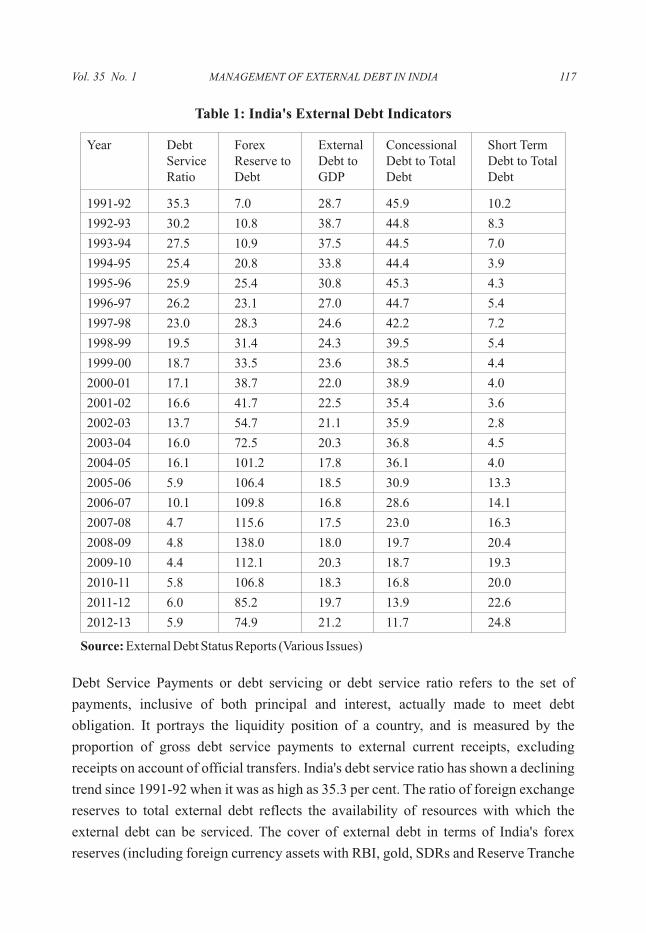
Table 1: India's External Debt Indicators
Source: External Debt Status Reports (Various Issues)
Debt Service Payments or debt servicing or debt service ratio refers to the set of
payments, inclusive of both principal and interest, actually made to meet debt
obligation. It portrays the liquidity position of a country, and is measured by the
proportion of gross debt service payments to external current receipts, excluding
receipts on account of official transfers. India's debt service ratio has shown a declining
trend since 1991-92 when it was as high as 35.3 per cent. The ratio of foreign exchange
reserves to total external debt reflects the availability of resources with which the
external debt can be serviced. The cover of external debt in terms of India's forex
reserves (including foreign currency assets with RBI, gold, SDRs and Reserve Tranche
Year Debt Forex External Concessional Short TermService Reserve to Debt to Debt to Total Debt to Total Ratio Debt GDP Debt Debt
1991-92 35.3 7.0 28.7 45.9 10.2
1992-93 30.2 10.8 38.7 44.8 8.3
1993-94 27.5 10.9 37.5 44.5 7.0
1994-95 25.4 20.8 33.8 44.4 3.9
1995-96 25.9 25.4 30.8 45.3 4.3
1996-97 26.2 23.1 27.0 44.7 5.4
1997-98 23.0 28.3 24.6 42.2 7.2
1998-99 19.5 31.4 24.3 39.5 5.4
1999-00 18.7 33.5 23.6 38.5 4.4
2000-01 17.1 38.7 22.0 38.9 4.0
2001-02 16.6 41.7 22.5 35.4 3.6
2002-03 13.7 54.7 21.1 35.9 2.8
2003-04 16.0 72.5 20.3 36.8 4.5
2004-05 16.1 101.2 17.8 36.1 4.0
2005-06 5.9 106.4 18.5 30.9 13.3
2006-07 10.1 109.8 16.8 28.6 14.1
2007-08 4.7 115.6 17.5 23.0 16.3
2008-09 4.8 138.0 18.0 19.7 20.4
2009-10 4.4 112.1 20.3 18.7 19.3
2010-11 5.8 106.8 18.3 16.8 20.0
2011-12 6.0 85.2 19.7 13.9 22.6
2012-13 5.9 74.9 21.2 11.7 24.8
MANAGEMENT OF EXTERNAL DEBT IN INDIA 117Vol. 35 No. 1
118 BUSINESS ANALYST
in IMF) has shown steady uptrend since 1990-91. The external debt-to-GDP ratio is
defined as the ratio of the total outstanding external debt (at the end of the year) to annual
GDP. By using GDP as a denominator the ratio provides some indication of country's
potential to service external debt by switching resources from production of domestic
goods to the production of exports. It is noteworthy that a country might have a large
debt-to-exports ratio but a low debt-to-GDP ratio if exports of the country comprise a
very small proportion of GDP. Table 1 shows that India's external debt to GDP ratio has
been declined since 1990-91.
The concessional component of a loan refers to its softer terms and conditions as
compared to the prevailing market conditions. Concessionality of a loan is reflected in
lower interest rates, extended grace period, longer maturity period or combination of all.
To measure the concessionality of a loan, the difference between the face value of loan
and sum of the discounted future debt service payments to be made by the borrower is
calculated. In India, loans from International Development Association (IDA),
International Fund for Agricultural Development (IFAD), Organization of Petroleum
Exporting Countries (OPEC), Government borrowings from bilateral sources (except
dollar denominated debt from Russia), and Rupee debt are included in concessional
debt. The ratio of concessional debt to total external debt of India has been declined
continuously since 1990-91. The short-term debt generally includes all types of trade
related credits up to one year, FII investment in treasury bills, and other short-term debt
instruments having a maturity of one year or less. Table 1 shows that the proportion of
short term debt in country's total debt has increased in last few years. This is mainly due
to improvement in the coverage of short-term debt.
INDIA'S EXTERNAL DEBT MANAGEMENT: SUSTAINABILITY
PERSPECTIVE
External debt Sustainability refers to “the level of debt which allows a debtor country to
meet its current and future debt service obligations in full, without recourse to further
debt relief or rescheduling, avoiding accumulation of arrears, while allowing an 6
acceptable level of economic growth” . Over time there have been several indicators and
thresholds used internationally to assess the debt sustainability of low income countries.
6Report of World Bank and IMF (2001), “The Challenge of Maintaining Long Term External Debt
Sustainability”, Volume 1, P-6
April - September 2014
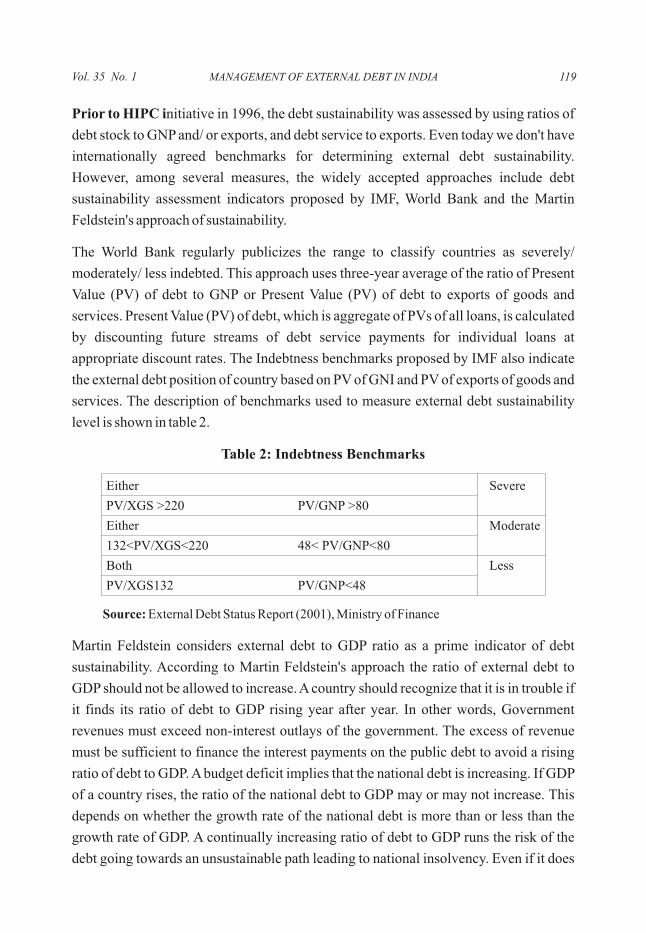
Prior to HIPC initiative in 1996, the debt sustainability was assessed by using ratios of
debt stock to GNP and/ or exports, and debt service to exports. Even today we don't have
internationally agreed benchmarks for determining external debt sustainability.
However, among several measures, the widely accepted approaches include debt
sustainability assessment indicators proposed by IMF, World Bank and the Martin
Feldstein's approach of sustainability.
The World Bank regularly publicizes the range to classify countries as severely/
moderately/ less indebted. This approach uses three-year average of the ratio of Present
Value (PV) of debt to GNP or Present Value (PV) of debt to exports of goods and
services. Present Value (PV) of debt, which is aggregate of PVs of all loans, is calculated
by discounting future streams of debt service payments for individual loans at
appropriate discount rates. The Indebtness benchmarks proposed by IMF also indicate
the external debt position of country based on PV of GNI and PV of exports of goods and
services. The description of benchmarks used to measure external debt sustainability
level is shown in table 2.
Table 2: Indebtness Benchmarks
Source: External Debt Status Report (2001), Ministry of Finance
Martin Feldstein considers external debt to GDP ratio as a prime indicator of debt
sustainability. According to Martin Feldstein's approach the ratio of external debt to
GDP should not be allowed to increase. A country should recognize that it is in trouble if
it finds its ratio of debt to GDP rising year after year. In other words, Government
revenues must exceed non-interest outlays of the government. The excess of revenue
must be sufficient to finance the interest payments on the public debt to avoid a rising
ratio of debt to GDP. A budget deficit implies that the national debt is increasing. If GDP
of a country rises, the ratio of the national debt to GDP may or may not increase. This
depends on whether the growth rate of the national debt is more than or less than the
growth rate of GDP. A continually increasing ratio of debt to GDP runs the risk of the
debt going towards an unsustainable path leading to national insolvency. Even if it does
Either Severe
PV/XGS >220 PV/GNP >80
Either Moderate
132<PV/XGS<220 48< PV/GNP<80
Both Less
PV/XGS132 PV/GNP<48
MANAGEMENT OF EXTERNAL DEBT IN INDIA 119Vol. 35 No. 1
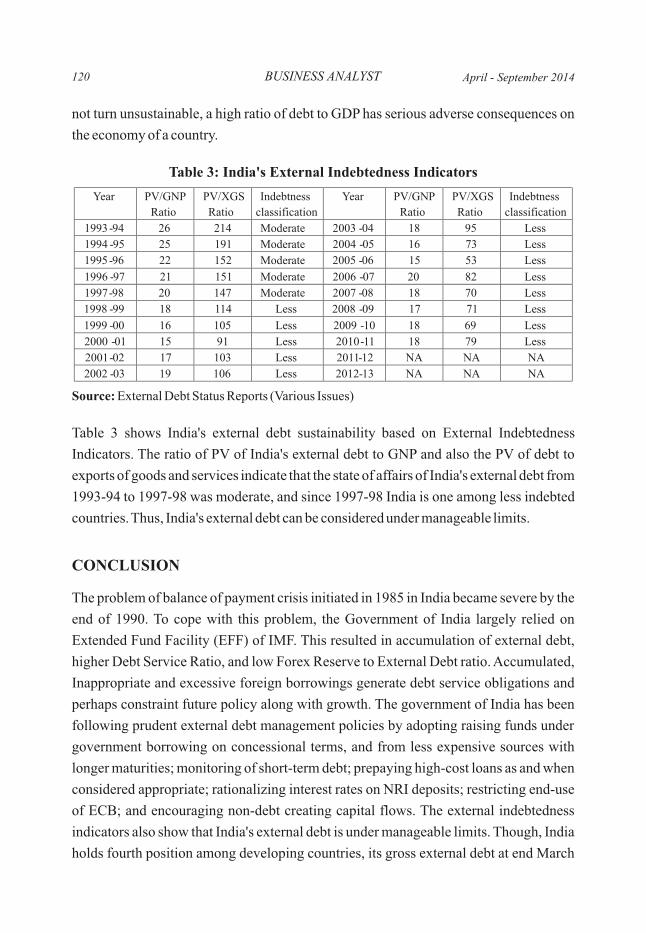
120 BUSINESS ANALYST
not turn unsustainable, a high ratio of debt to GDP has serious adverse consequences on
the economy of a country.
Table 3: India's External Indebtedness Indicators
Source: External Debt Status Reports (Various Issues)
Table 3 shows India's external debt sustainability based on External Indebtedness
Indicators. The ratio of PV of India's external debt to GNP and also the PV of debt to
exports of goods and services indicate that the state of affairs of India's external debt from
1993-94 to 1997-98 was moderate, and since 1997-98 India is one among less indebted
countries. Thus, India's external debt can be considered under manageable limits.
CONCLUSION
The problem of balance of payment crisis initiated in 1985 in India became severe by the
end of 1990. To cope with this problem, the Government of India largely relied on
Extended Fund Facility (EFF) of IMF. This resulted in accumulation of external debt,
higher Debt Service Ratio, and low Forex Reserve to External Debt ratio. Accumulated,
Inappropriate and excessive foreign borrowings generate debt service obligations and
perhaps constraint future policy along with growth. The government of India has been
following prudent external debt management policies by adopting raising funds under
government borrowing on concessional terms, and from less expensive sources with
longer maturities; monitoring of short-term debt; prepaying high-cost loans as and when
considered appropriate; rationalizing interest rates on NRI deposits; restricting end-use
of ECB; and encouraging non-debt creating capital flows. The external indebtedness
indicators also show that India's external debt is under manageable limits. Though, India
holds fourth position among developing countries, its gross external debt at end March
April - September 2014
2013 was all time high (US$ 3, 90,048 million). Mounting external debt and interest
thereon is a burden on country's GDP. If India's GDP will decline (as estimated by
international credit agencies: IMF and ADB in 2013), it may create situation of turmoil.
So, Indian planners and policy makers should consider the matter seriously and take
necessary steps timely to avoid chaos in the market.
REFERENCES
Acharya, Shankar (2001), “India's Macroeconomic Management in the Nineties”, Indian Council for Research on International Economic Relations, New Delhi
ndAgarwal AN and Kundan Lal (1994), “Economics of Development and Planning”, 2 Edition, Vikas Publications
Cuddington John T (1996), “Analyzing the Sustainability of Fiscal Deficits in Developing Countries”, National Bureau of Economic Research, Vol. 6,pp-23-24, (SSRN- id597231.pdf)
Daud Sitinurazra Mohd. (2009), “Issues in International Economics: An Empirical Study on Sustainability, External Debt and Reserve Management”, http//eprints.soton.ac.uk
IMF (2012), External Debt Sustainability Analysis, Special Issues
Klein, Thomas M (1994), External Debt Management: An Introduction, World Bank Technical Paper
Krugman P, (1988), “Financing vs. Forgiving: A Debt Overhang”, National Bureau of Economic Research, Working Paper No. 2486
Lynn, Aylward and Ruport Trone (1998), “An Economic Analysis of Countries Performance to International Monetary Fund”, WP/98/32
Ministry of Finance (2001), “Report on External Debt Status”, Government of India
Muwanga ESK Zake and Stephen N (1996), “The HIPC Debt Relief Initiative: Uganda's Experience”, UNCTAD Discussion Paper No. 2001/ 94.
Pinto, Brian, and Farah Zahir (2004), “India: Why Fiscal Adjustment Now”, Policy Research Working Paper No. WPS 3230
Rao Bhanoji (1999) “Hidden Costs of Debt” (Letters to Editor), The Economic and Political Weekly
Reserve Bank of India, Statistical Database
Savvides A (1992), “Investment Slowdown in Developing Countries during the 1980s: Debt Overhang or Foreign Capital Inflows”, Kyklos Publications, Vol. 45(3)
Thaker BC (1985), “Fiscal Policy, Monetary Analysis And Debt Management”(With Special Reference To stIndia),1 edition, Ashish publishing house, New Delhi.
Thirlwall AP (2006), “Growth and Development with Special Reference to Developing Economies”, 8th edition, Palgrave Mc Milan.
Warner AM, (1992), “Did the Debt Crisis Cause the Investment Crisis?”, Journal of Applied Sciences, Vol. 107 (4)
World Bank (2003), “India: Sustaining Reform, Reducing Poverty”, World Bank Development Policy Review, New Delhi, Oxford University Press
World Bank and IMF (2001), “The Challenge of Maintaining Long Term External Debt Sustainability”, Report, Volume 1
(www.rbi.org)
MANAGEMENT OF EXTERNAL DEBT IN INDIA 121Vol. 35 No. 1
The Asian
Economic ReviewJournal of the Indian Institute of Economics
Volume 56 September 2014 No.3
CONTENTS
The Indian Institute of Economics, Federation House, FAPCCI Marg , 11-6-841,Red Hills, Hyderabad-500 004.(India). Phone:(O) 23393512, Fax: 91-40-23395525.
Email: [email protected], website:http://www.iieasia.in
The Revised Subscription Rates and Membership Fees are as shown below:
Subscription Rates Membership
Category 1 yr 2 yrs 3 yrs Life Member Life Member Individual Institutional
Indian (in Rs) 500 950 1400 5,000 15,000Foreign
(in $ US) by Air Mail 100 175 — $ 500 $ 5000
*Faiza Umer: Impact of Trade Openness on Economic Growth of Pakistan: An ARDLApproach; *S.Gandhimathi, Savitha M, Priyanga G, RahiniR and Thilagavathi E:Impact of Economic Development on Carbon Emission in Selected World Economies -An Empirical Analysis; * Ijaiya, M.A, Lawal, W.A and Osemene, O.F.: Microfinanceand Mortgage Financing in Nigeria: A Rural Experience; *Ganapati Mendali andSanjukta Das: The Effect of Exchange Rate Variability on Exports: The Case of India;*Pravin Kumar and Rajeev Kumar : Foreign Direct Investment and Economic Growth:A Cross- Country Exploration in Asia using Panel Cointegration Technique;*M.C.Purohit: Taxation of Wheat and Wheat Products - The Issues for GST;*Jasmindeep Kaur Brar : Customer Protection in Indian Banking Sector - A Study ofBanking Ombudsman Scheme; *D.Satyanarayana Murthy, Suresh Kumar Patra andK. Mahendra Babu: Pace and Pattern of the Banking Sector Development in Indiaduring Pre & Post Reform Period; *Umer Jeelanie Banday, Anurag Asawa andGarima kaushik : Tourism and its Impact on Economic Growth and Environment;* Sulochna Meena and J. N. Sharma: Regional Disparity: A Case Study of IndustrialSector in Rajasthan; *G .Ramakrishna, G . Madhavankutty and P. Lalitha: Impactof Capital Account Openness, Trade Balances and Exchange Rates on Economic Growth:The Evidence from India (1990-2013).
ISSN 0004-4555
Please send the amount by DD/ Cheque favouring Indian Institute of Economics for timelyreceipt of the journal. For outstation Cheque please add bank charges at Rs.35 for amountbetween Rs.500 to 1000.
Vol. 35 No. 1
1Assistant Professor at Sri Aurobindo College of Commerce and Management, Ludhiana
2Professor at Dept. of Commerce, Guru Nanak Dev University, Amritsar
MEASURING SME'S SATISFACTION WITH EXPORT CREDIT DELIVERY SYSTEM IN PUNJAB: A SCALE
DEVELOPMENT APPROACH
1 Manpreet Kaur
Exports play a crucial role in economic development of any country and India is
certainly not an exception. A robust empirical determinant of long term economic
development of India has been the expansion and diversification of export sector. To give
thrust to export promotion, an export credit delivery system is operating in India where
liberal and cheaper credit is provided to exporters through commercial banks. But
commercial banks are there to make profits. Providing subsidised credit to exporters
may decrease their profits which puts a challenge on actual implementation of export
credit delivery system. Hence, in the present study, an attempt has been made to analyse
exporting SMEs' satisfaction regarding export credit delivery system. The study has
focused specifically on small and medium enterprises as voluminous amount of exports
are made from them. The findings revealed a low level of satisfaction of exporting SMEs
regarding export credit delivery system. Moreover, research has also resulted in a
reliable and valid instrument to measure SMEs' satisfaction regarding export credit
delivery system.
Key words: SMEs, Satisfaction, Commercial Banks, Exports.
INTRODUCTION
Small and Medium Enterprises in India
Small and medium enterprises have emerged as a dynamic and vibrant sector in Indian
economy. They have got two fold roles to play. Besides playing an economic role for
country's economic development, small and medium enterprises also play social and
political role in employment generation, increasing standard of living and balanced
regional development. Small and medium enterprises (SMEs) are the growth engine of
Indian economy because of their unique characteristics like, less investment
requirements, operational flexibility, location wise mobility, import substitution,
development of entrepreneurial talent, significant export earnings, lesser gestation
2and Fulbag Singh
123
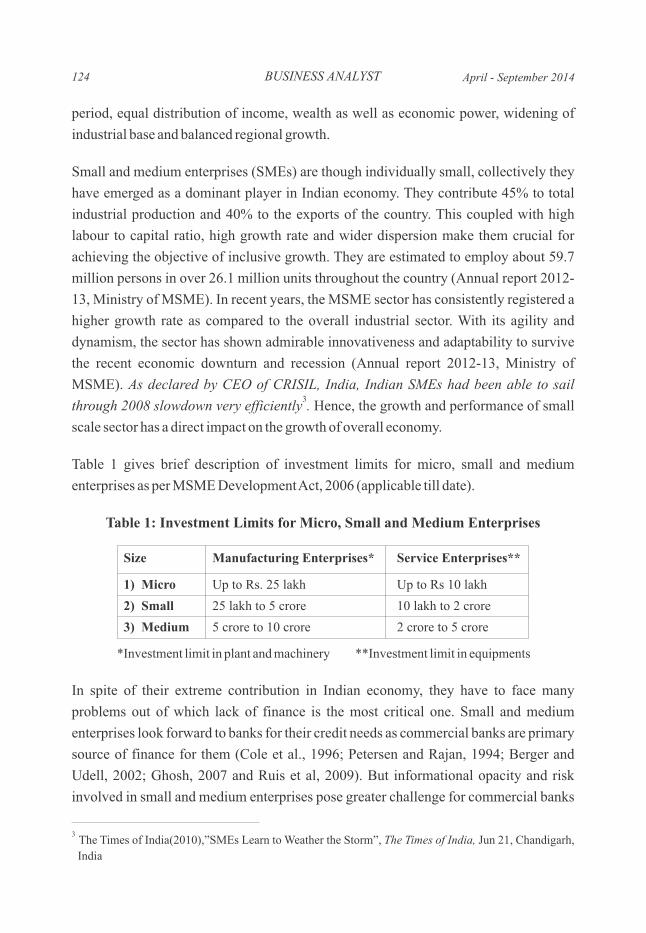
BUSINESS ANALYST
period, equal distribution of income, wealth as well as economic power, widening of
industrial base and balanced regional growth.
Small and medium enterprises (SMEs) are though individually small, collectively they
have emerged as a dominant player in Indian economy. They contribute 45% to total
industrial production and 40% to the exports of the country. This coupled with high
labour to capital ratio, high growth rate and wider dispersion make them crucial for
achieving the objective of inclusive growth. They are estimated to employ about 59.7
million persons in over 26.1 million units throughout the country (Annual report 2012-
13, Ministry of MSME). In recent years, the MSME sector has consistently registered a
higher growth rate as compared to the overall industrial sector. With its agility and
dynamism, the sector has shown admirable innovativeness and adaptability to survive
the recent economic downturn and recession (Annual report 2012-13, Ministry of
MSME). As declared by CEO of CRISIL, India, Indian SMEs had been able to sail 3
through 2008 slowdown very efficiently . Hence, the growth and performance of small
scale sector has a direct impact on the growth of overall economy.
Table 1 gives brief description of investment limits for micro, small and medium
enterprises as per MSME Development Act, 2006 (applicable till date).
Table 1: Investment Limits for Micro, Small and Medium Enterprises
*Investment limit in plant and machinery **Investment limit in equipments
In spite of their extreme contribution in Indian economy, they have to face many
problems out of which lack of finance is the most critical one. Small and medium
enterprises look forward to banks for their credit needs as commercial banks are primary
source of finance for them (Cole et al., 1996; Petersen and Rajan, 1994; Berger and
Udell, 2002; Ghosh, 2007 and Ruis et al, 2009). But informational opacity and risk
involved in small and medium enterprises pose greater challenge for commercial banks
124
3The Times of India(2010),”SMEs Learn to Weather the Storm”, The Times of India, Jun 21, Chandigarh,
India
Size Manufacturing Enterprises* Service Enterprises**
1) Micro Up to Rs. 25 lakh Up to Rs 10 lakh
2) Small 25 lakh to 5 crore 10 lakh to 2 crore
3) Medium 5 crore to 10 crore 2 crore to 5 crore
April - September 2014
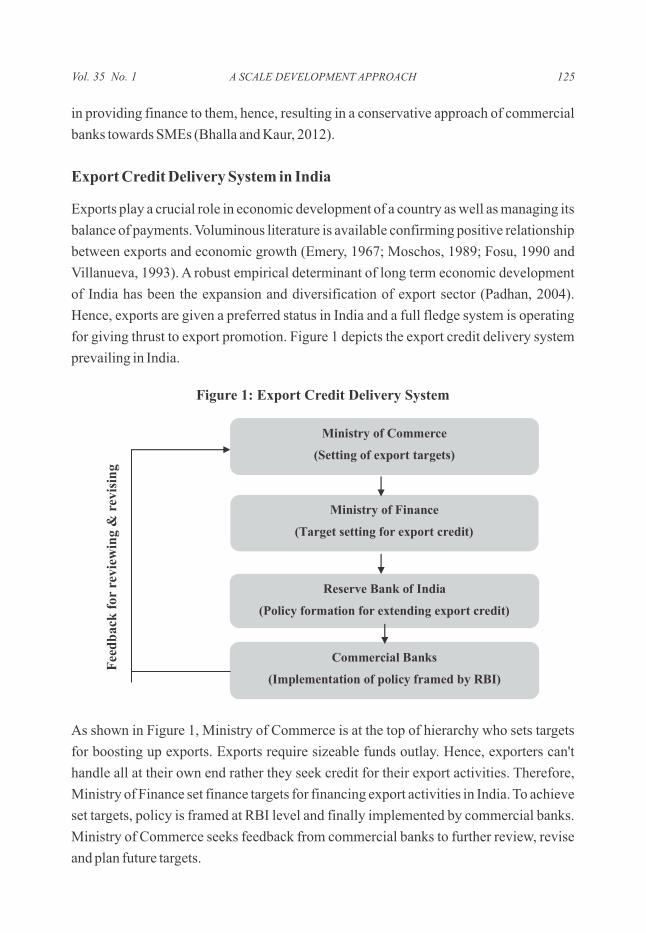
in providing finance to them, hence, resulting in a conservative approach of commercial
banks towards SMEs (Bhalla and Kaur, 2012).
Export Credit Delivery System in India
Exports play a crucial role in economic development of a country as well as managing its
balance of payments. Voluminous literature is available confirming positive relationship
between exports and economic growth (Emery, 1967; Moschos, 1989; Fosu, 1990 and
Villanueva, 1993). A robust empirical determinant of long term economic development
of India has been the expansion and diversification of export sector (Padhan, 2004).
Hence, exports are given a preferred status in India and a full fledge system is operating
for giving thrust to export promotion. Figure 1 depicts the export credit delivery system
prevailing in India.
Figure 1: Export Credit Delivery System
As shown in Figure 1, Ministry of Commerce is at the top of hierarchy who sets targets
for boosting up exports. Exports require sizeable funds outlay. Hence, exporters can't
handle all at their own end rather they seek credit for their export activities. Therefore,
Ministry of Finance set finance targets for financing export activities in India. To achieve
set targets, policy is framed at RBI level and finally implemented by commercial banks.
Ministry of Commerce seeks feedback from commercial banks to further review, revise
and plan future targets.
Commercial Banks
(Implementation of policy framed by RBI)
Reserve Bank of India
Ministry of Finance
(Target setting for export credit)
Fee
db
ack
for
rev
iew
ing
& r
evis
ing
Ministry of Commerce
(Setting of export targets)
(Policy formation for extending export credit)
A SCALE DEVELOPMENT APPROACH 125Vol. 35 No. 1
BUSINESS ANALYST
Voluminous amount of exports are made from small and medium enterprises. Given the
importance of SMEs in Indian economy, it would be of extreme importance to know
whether SMEs are satisfied with the export credit delivery system of commercial banks.
Hence, efforts have been made in the study to explore the satisfaction of exporting SMEs
with export credit delivery system.
REVIEW OF LITERATURE
Extensive research work has been done on SMEs banks relationship worldwide. This
section presents review of some relevant studies which have analysed SMEs satisfaction
with banks.
Smith (1989) aimed to identify service quality elements which were main sources of
satisfaction and dissatisfaction for small businesses. Primary data were obtained through
interviews from 50 small companies (about 50 % exporting firms) from greater
Manchester/ Stockport area of UK. Results revealed that thirty three firms rated
efficiency of staff, bank's system and procedures, personal qualities of staff, qualities of
bank manager, general support from bank and flexibility of bank as very good and good
whereas 17 firms rated the overall service as acceptable or poor. The major sources of
dissatisfaction were found to be inefficiency of staff, inflexibility of bank, bank charges,
insufficient information and decision making process.
Chaston (1993) analysed the satisfaction of SME clients with the banking relationships.
Primary data were collected through questionnaire from 71 SMEs who were engaged in
the process of starting a small business and 33 bank managers. Results revealed that
overall satisfaction of SMEs' clients was low and this view was reported by both SME
clients and bank managers. SMEs reported that banks were less interested in providing
support to them.
Chaston (1994) aimed to identify service gaps in bank -SME client relationship as well
as suggest remedies to close service gaps. A modified version of SERVQUAL developed
by Parasuraman (1985, 1988) was used as a research tool to determine the possible gaps
in the provision of banking services to South West small business community. Primary
data were retrieved from 102 bank branches and 76 small firms in UK. Results revealed
existence of all type of service gaps i.e. type 1,2,3,4 and 5 service gaps in the provision of
banking services to UK small business community.
126 April - September 2014
Orser, Riding and Swift (1994) analysed the satisfaction of micro businesses with their
banking relationships in Canada. Secondary data were retrieved from survey of 2763
small business owners carried out by Canadian Federation of Independent Businesses.
Findings revealed that micro businesses had less access to bank credit with strict terms of
credit and less favourable approval rates, interest rates and requirements for
cosignatories. Banks were found to be more selective in advancing credit to micro
businesses.
Gammie (1995) focused on satisfaction of small businesses with their banks in U.K. A
well structured questionnaire was used to collect primary data from 400 small businesses
out of which 232 usable responses were obtained. Results revealed that vast majority
(92%) were satisfied with their banks. Determinants of satisfaction were found to be
bank charges, working relationships, service, amount of loan received, collateral,
interest charges, turnover of account managers and ability to give advice. Most of the
respondents were satisfied with working relationships, service and amount of loan
received but they were dissatisfied with bank and interest charges.
Madill et al. (2002) analysed the role of account manager, branch staff and bank's
policies as well as procedures in determining satisfaction of Canadian SMEs with their
banking relationships. Primary data were collected from 3190 telephone based
interviews with key informants identified as the persons responsible for financial and
banking decisions in SMEs. The results revealed that all the three factors namely, namely
role of account manager, role of branch staff and bank' policies as well as procedures
were significantly related to SMEs' satisfaction with the bank with which they had their
primary relationship.
Zinger (2002) examined the satisfaction of small business owners with their banks in
Northern Ontario, Canada. Primary data were collected through a mail survey of 229
small businesses. Results revealed that 59% of the respondents were satisfied with bank
financing. The sources of dissatisfaction were found to be availability of funds and
collateral requirement.
Bandyopadhyay et al. (2003) aimed to examine the status of export credit delivery
system as well as satisfaction of Indian exporters with same. Primary survey was
conducted from bankers and exporters through different questionnaires. The sample of
exporters represented small, lower-medium, medium and large exporters roughly in the
ratio of 2:2:1:1 respectively. More than three fourth of the exporters were satisfied with
A SCALE DEVELOPMENT APPROACH 127Vol. 35 No. 1
BUSINESS ANALYST
the overall bank services relating to export credit delivery. As far as constraints faced by
exporters while raising bank finance were concerned, these were found to be difficulty in
getting pre-shipment loan sanctioned, complexity of filling application form and
problem of collateral security.
Bbenkele (2007) examined the perceptions of small and medium enterprises towards
services offered by commercial banks in South Africa. A comparative study of rural and
urban areas' SMEs was made by conducting focus group meeting with a group of 45
SMEs. Analysis of data revealed that SMEs from rural areas were having more negative
perceptions regarding the services offered by commercial banks. Non caring attitude of
banks and non meeting of their financial needs were main grievances reported by rural
SMEs whereas urban SMEs showed a positive attitude towards commercial banks.
Safakali (2007) aimed to measure service quality of commercial banks towards SMEs in
Northern Cyprus using SERVQUAL. Primary data were retrieved through a structured
questionnaire from 227 SMEs operating in versatile sectors at township of Nicosia. The
results indicated that commercial banks had not met the service expectations of SMEs for
all dimensions. Among the dimensions of service quality highest negative gap belonged
to 'empathy' i.e. caring and individualized attention that a firm provides to its customers.
Lundahl, Vegholm and Silver (2009) examined the impact of technical and functional
dimensions of banks' services on satisfaction of SMEs in Sweden. Primary data were
collected by getting 221 questionnaires filled from Swedish SMEs. Ordinal logistic
regression was run using three variables namely price, collateral as well as focus on
product under technical dimension and personal relationship, support during difficult
times and role of advisor under functional dimension to find out their impact on customer
satisfaction. The results indicated that both technical and functional dimensions of
service management were correlated with customer satisfaction.
Popli and Rao (2009) conducted an empirical study with objectives to analyse SMEs'
satisfaction from banks as well as to compare the service quality of public sector banks
with private sector banks towards SMEs customers. Primary data were obtained through
a pre-tested structured questionnaire from 100 SMEs. The results revealed that SMEs
had a low level of satisfaction regarding the services provided by banks as most of the
respondents reported problems like cumbersome and exhaustive loan approval
procedures, non meeting of their financial requirements, non availability of funds for
technology upgradation etc. It was also found that private sector or foreign banks were
128 April - September 2014
much better than public sector banks on the basis of professionalism, technology, easy
approach to management and competitiveness.
Yesseleva (2010) examined the financial constraints faced by Australian small
enterprises while raising money from banks. Secondary data were retrieved from survey
conducted by COSBOA (Council of Small Business of Australia) from 173 small
businesses. Results concluded that access to affordable credit was very important for
small businesses to operate well on day to day basis. Majority of respondents indicated
that they were not satisfied with the products and services offered by banks.
Badulescu (2012) analysed the effect of relationship banking on SMEs' satisfaction and
their access to bank finance. Primary data were collected through questionnaire from 595
small firms of Bihor County, Romania. It was found that length of relationship of SMEs
with bank, concentration, SMEs trust had no impact on banks and banks attached more
importance to collaterals and covenants. Moreover, a positive behaviour, such as prompt
or advance repayments of loans, didn't generate any positive feedback from the banks
side, leading to dissatisfaction among SMEs.
Chaudhary and Ahalawat (2014) analysed satisfaction of SMEs with bank services.
Primary data were collected from 60 SMEs of Jaipur with the help of questionnaires. But
SMEs of Bank of Baroda were contacted taking database form the bank itself. Findings
revealed a high level of satisfaction among SMEs.
Karedza et al. (2014) analysed obstacles faced by SMEs in Chinhoyi Zimbabwe.
Findings concluded that SMEs have problems in securing adequate finance since they
lack security and banks are not interested to fund their business activities.
RESEARCH METHODOLOGY
The present study is primarily based on primary data which have been collected through
pre-tested structured questionnaire which contained questions regarding satisfaction of
SMEs regarding commercial banks to be answered on a 5-point Likert scale ranging from
'Highly Satisfied' to 'Highly Dissatisfied'. Multi stage sampling has been used to select a
sample of 300 exporting SMEs from Punjab. In the first stage, quotas of SMEs from
above mentioned districts have been decided on the basis of their contribution in export
turnover of Punjab. Sample has been selected from these districts on the basis of quota
sampling. Quota sampling ensures that the composition of the sample is same as that of
A SCALE DEVELOPMENT APPROACH 129Vol. 35 No. 1
BUSINESS ANALYST
the population with respect to the characteristics of interest. Hence, this sampling
technique attempts to obtain representative samples at relatively lower cost (Malhotra
and Dash, 2011). In the second stage, main exporting industries of Punjab have been
analysed on the basis of their export turnover. Four industries namely, engineering,
hosiery, apparel and sports industry have been selected for the study because of their
major contribution to the total export turnover of Punjab. Lists of exporting SMEs of
each of these industries have been taken from respective Export Promotion Councils
(EPCs) for the year 2011-12. In the third stage, exporting SMEs have been selected from
the lists of Export Promotion Councils as per the decided quotas of districts with the help
of convenience sampling. Exploratory factor analysis, confirmatory factor analysis and
weighted average scores (WAS) have been used to analyse the data and get inferences.
ANALYSIS AND INTERPRETATION
Exploratory Factor Analysis
The questionnaire used in the research study has thirty two statements measuring
satisfaction of exporting SMEs regarding export credit delivery system of commercial
banks. The variables measuring SMEs' satisfaction with banks are factor analysed with
the help of PASW 18. Prior to the extraction of factors, the Bartlett test of sphericity
(approximate chi square = 13719.827, df = 496, significance = 0.000) and the KMO
measure of sampling adequacy (value = 0.888) have confirmed that there are significant
correlations among the variables to warrant the application of EFA. Only factors with
Eigen values greater than one have been selected and loadings greater than 0.5 have been
included in the analysis (Hair et al., 2010). Six factors have been extracted explaining
85.324 per cent of the variance as illustrated in Table 2.
The reliability of the collected responses in the research survey has been tested using
composite Cronbach's co-efficient alpha. The value of Cronbach alpha is found to be
0.942 which indicates significant level of reliability in the responses. Anti-image
correlations matrix has been generated which represents KMO measure of sampling
adequacy for individual variables which is found to be sufficiently high for all variables.
Reproduced matrix has been generated to analyse the fitness of EFA. Reproduced matrix
is the difference between observed correlation matrix and reproduced correlation matrix.
The lower it is the better it is. In the residual matrix, only 8 percent non redundant
residuals have been found with absolute values greater than 0.05 which indicates that
EFA model has good fit.
130 April - September 2014
The variables have been then rotated using the varimax rotation. The results indicate that
all the variables have loaded onto the six factors as have been expected and there are no
cross loadings of any variable. Table 2 represents the possible explanation of factors
along with their significant variables. Nomenclature of the factors derived has been done
on the basis of highest factor loadings of the variables loaded on the particular factor and
their common tone. Following is the brief explanation of the factors extracted:
Ÿ : Factor I indicates greatest variability in SMEs' response
regarding satisfaction regarding export credit delivery system of commercial banks
and is labelled as financial factors. Six variables that correlated to constitute first
factor are margin requirements, collateral requirements, bank charges clearly defined
and explained, processing charges, interest rates and fee structure, altogether
explaining 17.199 percent of total variance.
Ÿ Process Quality: Factor II is interpreted as process quality. Seven variables have
loaded onto this factor and highest loading is for the variable loan processing time
(.854) followed by timely release of credit after sanctioning loan (.848), adequacy of
amount sanctioned (.840), method of assessing working capital requirements (.836),
flexible repayment options (.832), ease in filling export credit sanction application
form (.817) and transparency in sanctioning loan (.781).
Ÿ Bank Personnel: Factor III is concerned with bank personnel. The variables which
loaded onto this factor are easy access to decision makers, behaviour of bank staff,
relationship management of bank officials, reliability of bank staff, availability of
trained staff and staff having knowledge of customer business.
Ÿ Service Speed & Efficiency: Factor IV considers service speed & efficiency while
measuring satisfaction of exporting SMEs towards export credit delivery system of
commercial banks. The variables with greatest loading on this factor are error free
records and lesser mistakes, procedural formalities, quick response to customer
queries, quick redressal of complaints, and modernization in work processing.
Ÿ Branch Characteristics: Factor V is labelled as branch characteristics covering five
variables i.e. convenient location, loan sanctioning power of branch, flexibility in
branches, arrangements with other banks in case of restricted letter of credit and
convenient operating hours.
Ÿ Customised Services: Factor VI is labelled as customised services covering three
variables i.e. accommodation of credit needs, wide range of products and services and
innovativeness in introducing new schemes.
Financial Factors
A SCALE DEVELOPMENT APPROACH 131Vol. 35 No. 1
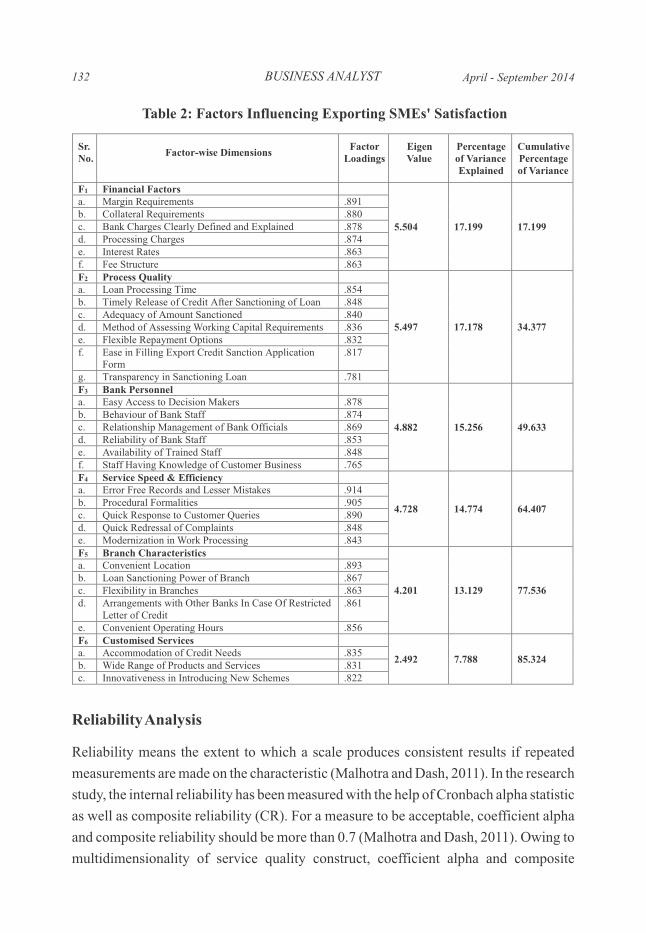
BUSINESS ANALYST
Table 2: Factors Influencing Exporting SMEs' Satisfaction
Reliability Analysis
Reliability means the extent to which a scale produces consistent results if repeated
measurements are made on the characteristic (Malhotra and Dash, 2011). In the research
study, the internal reliability has been measured with the help of Cronbach alpha statistic
as well as composite reliability (CR). For a measure to be acceptable, coefficient alpha
and composite reliability should be more than 0.7 (Malhotra and Dash, 2011). Owing to
multidimensionality of service quality construct, coefficient alpha and composite
132 April - September 2014
reliability have been computed separately for all the dimensions identified. In the
present study, values of Cronbach alpha and composite reliability are more than 0.80,
indicating good consistency among the items within each dimension. The results are
shown in Table 3.
Confirmatory Factor Analysis
Confirmatory factor analysis (CFA) provides enhanced control for assessing uni-
dimensionality (i.e. the extent to which items on a factor measure one single construct)
than exploratory factor analysis (EFA) and is more in line with the overall process of
construct validation. In this study, confirmatory factor analysis model has been run
through AMOS 18 and the key model statistics are shown in Table 3. Modification
indices have been used within constructs to improve the model fit. Modification indices
provide diagnostic indicators that can be helpful in deciding which additional paths from
latent variables to indicators might improve the fit of the model. They tell us roughly
how much the χ2 for the model will be improved by freeing each fixed path present in the
model (Loehlin, 2004). The CFA model has been found fit as CFI (Comparative Fit
Index) value, an incremental model fitness index, has been found as 0.926. These
different types of validity are checked:
i) Content Validity: The content validity of a construct can be defined as the degree to
which the measure spans the domain of the construct's theoretical definition
(Rungtusanatham, 1998). The best practice to ensure the content validity is to show
the set of possible variables in the construct to five academicians as well as five
industry experts. For the present study, the content validity of the instrument has
been ensured as dimensions of service quality of export credit delivery system of
commercial banks and items have been identified from the literature and thoroughly
reviewed by professionals and academicians. After analysing the advice received
from these experts, the constructs along with the set of variables have been
finalised.
A SCALE DEVELOPMENT APPROACH 133Vol. 35 No. 1
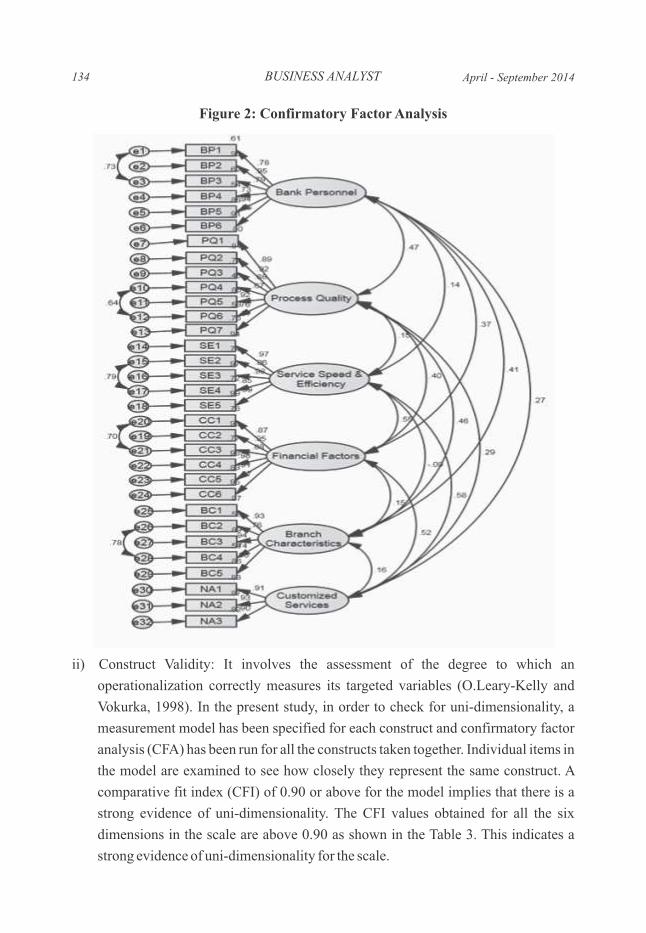
Figure 2: Confirmatory Factor Analysis
ii) Construct Validity: It involves the assessment of the degree to which an
operationalization correctly measures its targeted variables (O.Leary-Kelly and
Vokurka, 1998). In the present study, in order to check for uni-dimensionality, a
measurement model has been specified for each construct and confirmatory factor
analysis (CFA) has been run for all the constructs taken together. Individual items in
the model are examined to see how closely they represent the same construct. A
comparative fit index (CFI) of 0.90 or above for the model implies that there is a
strong evidence of uni-dimensionality. The CFI values obtained for all the six
dimensions in the scale are above 0.90 as shown in the Table 3. This indicates a
strong evidence of uni-dimensionality for the scale.
BUSINESS ANALYST134 April - September 2014
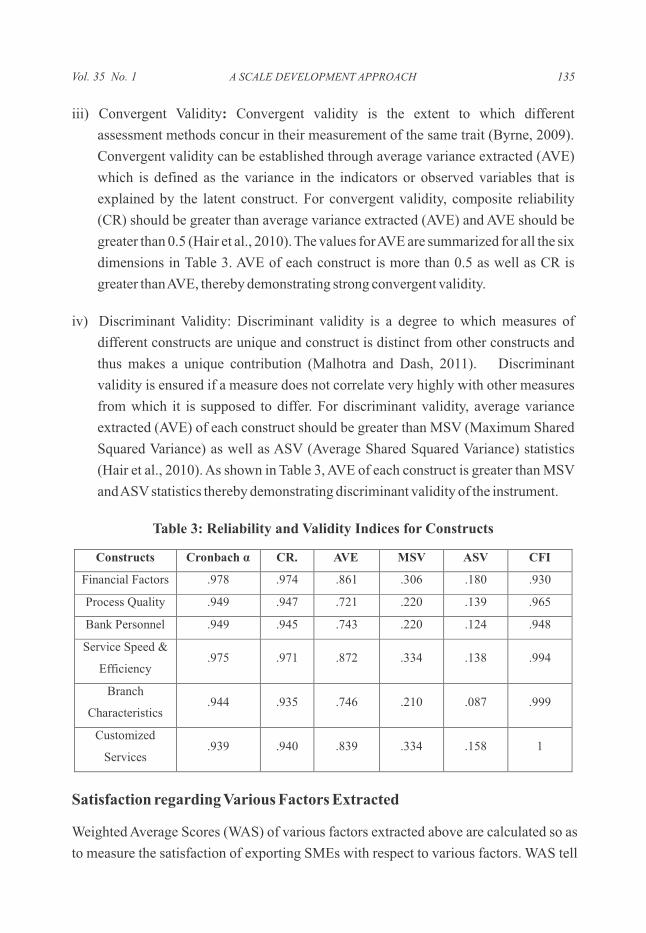
iii) Convergent Validity: Convergent validity is the extent to which different
assessment methods concur in their measurement of the same trait (Byrne, 2009).
Convergent validity can be established through average variance extracted (AVE)
which is defined as the variance in the indicators or observed variables that is
explained by the latent construct. For convergent validity, composite reliability
(CR) should be greater than average variance extracted (AVE) and AVE should be
greater than 0.5 (Hair et al., 2010). The values for AVE are summarized for all the six
dimensions in Table 3. AVE of each construct is more than 0.5 as well as CR is
greater than AVE, thereby demonstrating strong convergent validity.
iv) Discriminant Validity: Discriminant validity is a degree to which measures of
different constructs are unique and construct is distinct from other constructs and
thus makes a unique contribution (Malhotra and Dash, 2011). Discriminant
validity is ensured if a measure does not correlate very highly with other measures
from which it is supposed to differ. For discriminant validity, average variance
extracted (AVE) of each construct should be greater than MSV (Maximum Shared
Squared Variance) as well as ASV (Average Shared Squared Variance) statistics
(Hair et al., 2010). As shown in Table 3, AVE of each construct is greater than MSV
and ASV statistics thereby demonstrating discriminant validity of the instrument.
Table 3: Reliability and Validity Indices for Constructs
Satisfaction regarding Various Factors Extracted
Weighted Average Scores (WAS) of various factors extracted above are calculated so as
to measure the satisfaction of exporting SMEs with respect to various factors. WAS tell
Cronbach α CR. AVE MSV ASV CFI
Financial Factors .978 .974 .861 .306 .180 .930
Process Quality .949 .947 .721 .220 .139 .965
Bank Personnel .949 .945 .743 .220 .124 .948
Service Speed & .975 .971 .872 .334 .138 .994
Characteristics.944 .935 .746 .210 .087 .999
Constructs
Efficiency
Branch
Customized
Services .939 .940 .839 .334 .158 1
A SCALE DEVELOPMENT APPROACH 135Vol. 35 No. 1
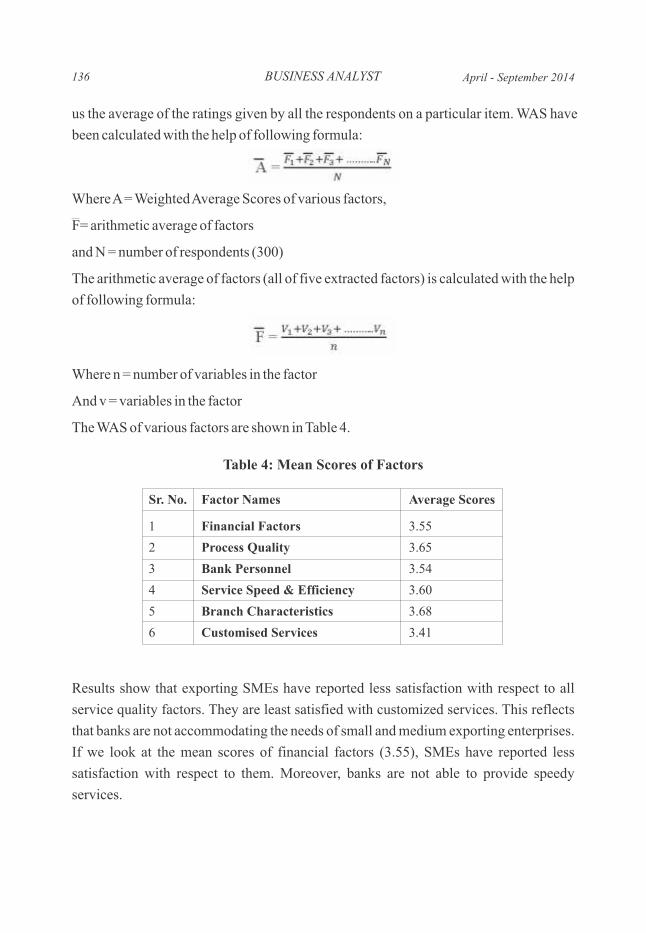
us the average of the ratings given by all the respondents on a particular item. WAS have
been calculated with the help of following formula:
Where A = Weighted Average Scores of various factors,
F= arithmetic average of factors
and N = number of respondents (300)
The arithmetic average of factors (all of five extracted factors) is calculated with the help
of following formula:
Where n = number of variables in the factor
And v = variables in the factor
The WAS of various factors are shown in Table 4.
Table 4: Mean Scores of Factors
Results show that exporting SMEs have reported less satisfaction with respect to all
service quality factors. They are least satisfied with customized services. This reflects
that banks are not accommodating the needs of small and medium exporting enterprises.
If we look at the mean scores of financial factors (3.55), SMEs have reported less
satisfaction with respect to them. Moreover, banks are not able to provide speedy
services.
Sr. No. Factor Names Average Scores
1 Financial Factors 3.55
2 Process Quality 3.65
3 Bank Personnel 3.54
4 Service Speed & Efficiency 3.60
5 Branch Characteristics 3.68
6 Customised Services 3.41
BUSINESS ANALYST136 April - September 2014
CONCLUSION
Exports play a crucial role in economic development of any country and India is certainly
not an exception. A robust empirical determinant of long term economic development of
India has been the expansion and diversification of export sector. To give thrust to export
promotion, an export credit delivery system is operating in India where liberal and
cheaper credit is provided to exporters through commercial banks. But commercial banks
are there to make profits. Providing subsidised credit to exporters may decrease their
profits which puts a challenge on actual implementation of export credit delivery system.
Hence, in the present study, an attempt has been made to analyse exporting SMEs'
satisfaction regarding export credit delivery system. The study has focused specifically
on SMEs as voluminous amount of exports are made from them. Out of the total sample,
only fifty two percent of the SMEs have reported satisfaction with export credit delivery
system of commercial banks. Hence, there is ample scope for improvement.
Six factors have emerged from the study which influence SMEs' perceptions of quality
of export credit delivery system namely, financial factors, process quality, bank
personnel, service speed & efficiency, branch characteristics and customised services.
Satisfaction level of small and medium exporting enterprises with respect to all the
service quality factors has been found to be low.
Indian banking sector has been witnessing a situation of severe competition due to
liberalization, privatization and globalisation during the last two decades. In this cut throat
competition, banks can survive only if they focus on customer satisfaction. Satisfying
customers lead to customers' loyalty towards banks ultimately resulting in customer
retention. Hence, banks should take efforts to improve satisfaction among exporting
SMEs. Moreover, RBI should keep a check on commercial banks. Being a regulatory
authority for commercial banks, RBI's responsibility doesn't end at framing policies for
providing export credit rather it should check implementation of policies framed as well as
satisfaction of exporters with the banks so as to improve export credit delivery system.
The research has resulted in the development of a reliable and valid instrument for
measuring SMEs' satisfaction regarding export credit delivery system of commercial
banks. All research has its limitations and this study is no exception. In the present study,
sample of SMEs have been taken from Punjab only. SMEs of other states can also be
covered for more robustness in results. Large exporters' satisfaction can also be analysed
with respect to export credit delivery system.
A SCALE DEVELOPMENT APPROACH 137Vol. 35 No. 1
REFERENCES
Badulescu, D. (2012), “SMEs Relationship Banking: Length, Loyalty, Trust, Do SMEs Get Something in Return?”, retrieved from http://www.waset.org/ journals/waset/v66/v66-11.pdf. (accessed on 8 June 2013).
Bandyopadhyay, S., Chadha, R. and Pant, D.K. (2003), “Export credit delivery system in India: how satisfied are exporters?” Margin, Vol. 35 No. 2, pp. 37-56.
Bbenkele, E.K. (2007), “An Investigation of small and medium enterprises perceptions towards services offered by commercial banks in South Africa”, African Journal of Accounting, Economics, Finance and Banking Research, Vol. 1 No. 1, pp. 13-24.
Berger, A.N. and Udell, G.F. (2002), “Small business credit availability and relationship lending: the importance of bank organisational structure”, The Economic Journal, Vol. 112 No. 477, pp. F32-F53.
Bhalla, A. and Kaur, M. (2012), “SMEs' access to finance: An analysis of attitude and decision making criteria of commercial banks”, Asia Pacific Journal of Management and Research Innovation, Vol. 8 No. 1, pp. 69-76.
Byrne, B.M. (2009), Structural Equation Modeling with AMOS: Basic Concepts, Applications and Programming, Sage Publications, UK.
Chaston, I. (1993), “Delivering customer satisfaction within the SME Client-banker relationship”, The Service Industries Journal, Vol. 13 No. 1, pp. 98-111.
Chaston, I. (1994), “Rebuilding small business confidence by identifying and closing service gaps in the bank/ SME client relationship”, International Small Business Journal, Vol. 13 No. 1, pp. 54-63.
Chaudhary, S. and Ahalawat, S. (2014), “Credit flow to SMEs in India: A study conducted at Bank of Baroda”, International Journal of Commerce, Business and Management, Vol. 3 No. 3, pp. 471-474.
Cole, R.A., Wolken, J.D. and Woodburn, R.L. (1996), “Bank and nonbank competition for small business credit: evidence from the 1987 and 1993 national surveys of small business finances”, Federal Reserve Bulletin, Nov. 1996, pp. 983-995.
Emery, R.F. (1967), “The relation of exports and economic development”, Kyklos, Vol. 20 No. 4, pp. 470-486.
Fosu, A.K. (1990), “Exports and economic growth: The African case”, World Development, Vol. 18 No. 6, pp. 831-35.
Gammie, B. (1995), “Small businesses and their banks: a post-charter analysis”, Management Decision, Vol. 33 No. 7, pp. 47-52.
Ghosh, S. (2007), “Bank debt use and firm size: Indian evidence”, Small Business Economics, Vol. 29 No. 1-2, pp. 15-23.
Hair, J.F., Black, W.C., Bablin, B.J. and Anderson, R.E. (2010), Multivariate Data Analysis, Prentice Hall Higher Education, India.
Karedza, G., Sikwila, M.N., Mpofu, T. and Makurumidze, S. (2014), “An Analysis of the Obstacles to the Success of SMEs in Chinhoyi Zimbabwe”, European Journal of Business and Management, Vol. 6 No. 6, pp. 38-42
Loehlin, J.C. (2004), Latent Variable Models: An Introduction to Factor, Path and Structural Equation Analysis, Lawrence Erlbaum Associates Publishers, New Jersey, London.
Lundahl, N., Vegholm, F. and Silver, L. (2009), “Technical and functional determinants of customer satisfaction in the bank-SME relationship”, Managing Service Quality, Vol. 19 No. 5, pp. 581-594.
Madill, J.J., Feeney, L., Riding, A. and Jr. Haines, G.H. (2002), “Determinants of SME owner's satisfaction with their banking relationships: a Canadian study”, International Journal of Bank Marketing, Vol. 20 No. 2, pp. 86-98.
Malhotra, N.K. and Dash, S. (2011), Marketing Research: An Applied Orientation, Pearson Publications, India.
BUSINESS ANALYST138 April - September 2014
Moschos, D. (1989), “Export expansion, growth and level of economic development: an empirical analysis”, Journal of Development Economics, Vol. 30 No. 1, pp. 93-102.
O.Leary-Kelly, S.W. and Vokurka, R.J. (1998), “The empirical assessment of construct validity”, Journal of Operations Management, Vol. 16 No. 4, pp. 387-405.
Orser, B.J., Riding, A.L. and Swift, C.S. (1994), “Banking experiences of Canadian small businesses”, Journal of Enterprising Culture, Vol. 1 No. 3 & 4, pp. 321-345.
Padhan, P.C. (2004), “Export and economic growth: an empirical analysis for India”, Artha Vijnana, Vol. XLVI No. 1-2, pp. 179-190.
Peterson, M.A. and Rajan, R.G. (1994), “The benefits of lending relationships: evidence from small business data”, The Journal of Finance, Vol. 49 No. 1, pp. 3-37.
Popli, G.S. and Rao, D.N. (2009), “Service quality of public sector banks to SME customers: An empirical study in the Indian context”, available at: http://ssrn.com/abstract=1412791 (accessed on 8 June 2012).
Ruis, A., Stel, A.V., Tsamis, A., Verhoeven, W. and Whittle, M. (2009), “Cyclicality of SME finance”, available at: http://ec.europa.eu/enterprise/newsroom/cf /_ getdocument .cfm?doc_id=3 127 (accessed on 8 June 2012).
Rungtusanatham, M.J. (1998), “Let's not overlook content validity”, Decision Line, Vol. July 1998, pp. 10-13.
Safakali, O.V. (2007), “Measuring service quality of commercial banks towards SMEs in Northern Cyprus”, Journal of Yasar University, Vol. 2 No. 8, pp. 827-839.
Smith, A.M. (1989), “Service quality: relationship between banks and their small business clients”, International Journal of Bank Marketing, Vol. 7 No. 5, pp. 28-35.
Villanueva, D. (1993), “Exports and economic development”, available at: http://ssrn.com /abstract=883496 (accessed on 10 May 2012).
Yesseleva, M. (2010), “Australian small enterprises and their business banking and finance needs”, International Research journal of Finance and Economics, Vol. 57, pp. 39-46.
Zinger, J.T. (2002), “The small enterprise-bank lender relationship: further empirical evidence”, Journal of Enterprising Culture, Vol. 10 No. 3, pp. 189-207.
A SCALE DEVELOPMENT APPROACH 139Vol. 35 No. 1
ARTICLES Institutional Framework of Industrial Relations in India: Still & Muddy Waters
K.R. ShyamSundar
Contract Employees
R Sridhar & S Panda
Human Capital Formation, Good Employment Opportunities & the Firm
Satya Prasad Padhi
Utilization of Surplus Rural Labor in Developing Economies- A Flexible SpreadsheetModel
Peter Errington
Impact of Economic Reforms on Productivity Performance of Manufacturing Sector
in South India
M.Manonmani
Key Indicators of Labor Market Flexibility & Skill Shortages
Ashutosh Bishnu Murti & Bino Paul GD
Organizational Citizenship Behavior & HRM Practices in Indian BanksSheelam Jain & Ravindra Jain
Does Employee Characteristics Impact HRD Climate? A Study in Banking SectorShweta Mittal
HRD Climate in Indian Banks: a Comparison between SBI & KVB
Srinivas LakkojuHigh Performing Startups in Education Sector in India: An Exploratory Study
Sanjay Kumar Singh
Indian B-School Students’ Perceptions of Best Employers
Jain Priya Mahavir & Srimannarayana
Employer Attractiveness: A Conceptual Framework & Scale DevelopmentSalila Kumar Pattnaik & Rajnish Kumar Misra
Cognitive Styles of Entrepreneurs, Knowledge Workers &Managers:
Adaptive or Innovative?
Omer Bin Sayeed
Psychological Capital, LMX, Employee Engagement & Work Role Performance
Swati Chaurasia &Archana Shukla
A Quarterly devoted to dissemination of knowledge in the fields of Industrial Relations and Human Resources,including releveant aspects of labour relations, personeel management and social and econmic issuies. Besides,communications from policy makers, socialand economic thinkers, managers and union leaders and Book reviewsare also incorporated.
EDITOR : N.K. NAIR
Subscription Rates : for India - Rs. 1500.00 for one year; 4000.00 for three years; Rs. 6500.00 for five years; and Rs.375.00 for a single copy . For foreign countries (Air Mail)-$100 for one year; $275 for three years and $375 for five years.For foreign courntires - (Sea mail)- $65 for one year; $175 for three years; and $250 for five years.
A Review of Economic & Social Development
CONTENTS VOLUME 50 NUMBER 2 OCTOBER, 2014
SHRI RAM CENTREFOR INDUSTRIAL RELATIONS AND HUMANRESOURCES, ECONOMIC & SOCIAL DEVELOPMENTUnit No.1078 (F/F), Central Square, Plaza-II, M. L. Khurana Marg(Barahindu Rao), Delhi-110 006Ph.: 011-23635815; Telefax: 23635816 e-mail: src@srcirhr .com; www.srcirhr.com
Vol. 35 No. 1
1Assistant Professor, Faculty of Management Studies, University of Delhi.
2MBA (Full-Time), Batch 2013-15, Faculty of Management Studies, University of
Delhi.3
Assistant Manager (Online Product Management), MakeMyTrip India Private Ltd., Gurgaon.
COLOURS IN LOGOS: A STUDY OF CONSUMERS'
PERCEPTION OF COLOUR AND BRAND PERSONALITY
ASSOCIATIONS
1 2 3Garima Gupta , Viraj Rajput and Aditya Joseph James
Brand logo as a prominent visual element of a brand plays a vital role in facilitating
brand recognition, association and distinction. Of the various elements of brand logo,
colours have been found to be influential at almost every level in the marketplace for
their meanings and associations with brand personality. However, though the
importance and impact of colours has been well examined by previous studies, research
integrating colours with personality traits is fairly lacking. The present work contributes
to the existing literature in this regard by providing an encompassing view of consumers'
perception of colours in conjunction with their association with various dimensions of
brand personality. The paper further examines the appropriateness of specific colours in
brand logo. The findings of the study may help the manufacturers and marketers in
making a more accurate choice of colours, thereby evoking a favorable perception and
response for their brands.
INTRODUCTION
Brands are critical to the success of companies (Wood, 2000) due to their ability to
provide primary points of differentiation between competitive offerings. The elements
that provide brand distinction in a product category include brand name, logos, symbols,
jingles, endorsers, slogans and packaging. An appropriate use of one or more of these
elements help the manufacturers and marketers in increasing brand awareness, creating
a unique product identity and keeping the consumer motivated about the choice process.
Of the various brand elements examined in the marketing literature, researchers have
found brand logo and personality to be the key point of association for consumers (e.g.
Pittard et al., 2007; Plummer, 2000). Though studies have established the importance of
various elements of brand logo in terms of affecting recall and recognition (Henderson
and Cote, 1998), brand identity and image, attitude and value (Adir, 2013), colour has
141
BUSINESS ANALYST
been found to be influential at almost every level in the marketplace with its importance
ranging from the identity of the brand in the form of brand logo, image, signage, display,
and packaging, to the product itself. However, despite being extensively research as an
independent marketing tool, studies on colour associations in brand logo are fairly
lacking. A few studies (e.g. Hynes, 2009) on use of colours in corporate logos have too
failed to include brand personality in the analysis. It is in this context that the present
work attempts to bridge the gap in existing literature by examining colour element of
brand logo for its meanings and associations with brand personality.
Colours and Personality Associations in Brand Logo: An Overview
Brand logo is one of the most salient visual elements of a brand (Wallace, 2001) which
facilitate its identification as well as differentiation from competing alternatives
(Janiszewski and Meyvis, 2001; MacInnis et al., 1999). Through a logo, a company
attempts to influence consumers' impressions of the brand (Colman et al., 1995),
impression of the retailer (Tractinsky and Lowengart, 2007) and the final purchase
intentions. According to the study by Kohli et al., (2002), logos can help a brand by either
being used in conjunction with the brand name or by being used in place of the actual
name. Thus, as a communication tool of brand image (Hynes, 2009), a logo should hold a
meaning beyond the individual elements used to create it and evoke an emotional
response from the consumer (Pittard et al., 2007).
Though a number of elements (such as images, colours, shapes, and words) are taken
into account while designing a logo, colour is considered to be of vital significance due
to its mnemonic quality in the areas of recognition and recall (Henderson and Cote,
1998). Researchers examining the importance and impact of colours in marketing have
considered it to be a part of the aesthetic appeal of the product that creates resonance with
consumers (Pittard et al., 2007), facilitates identification of the brand (Grossman and
Wisenblit, 1999), affects positive or negative feeling resulting out of product evaluation
(Tractinsky and Lowengart, 2007), induce reactions based on both instincts and
associations (Ridgeway, 2011) and play a substantial role in consumer decision making
when shopping time is limited (Silayoi and Speece, 2007).
In recognition of the influence of colours on brand identity, product design and
packaging, marketers and researchers have specifically examined the way consumers
perceive and associate with colours. A synthesis of literature in this regard provides an
142 April - September 2014
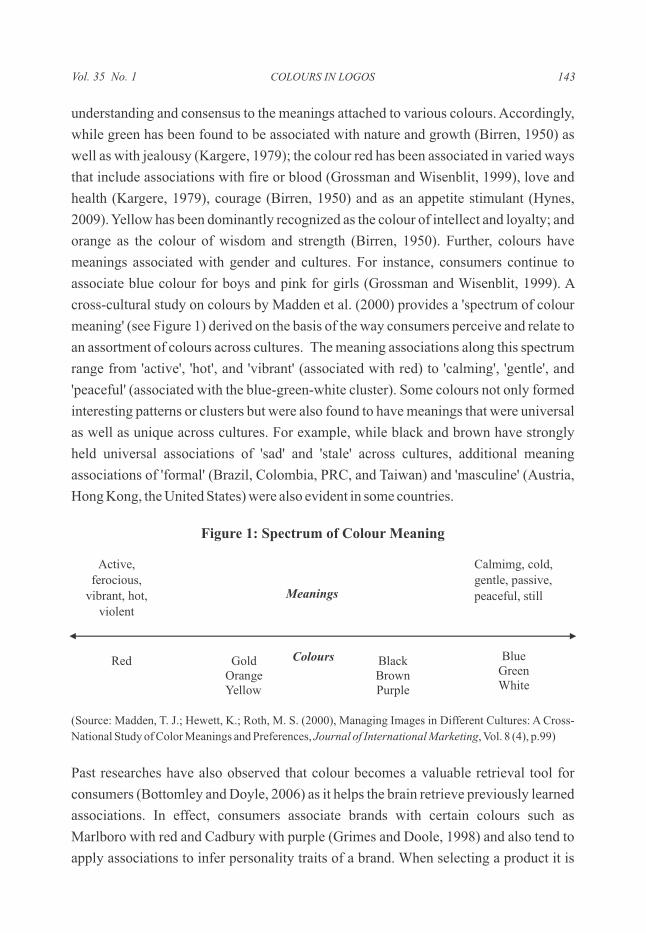
understanding and consensus to the meanings attached to various colours. Accordingly,
while green has been found to be associated with nature and growth (Birren, 1950) as
well as with jealousy (Kargere, 1979); the colour red has been associated in varied ways
that include associations with fire or blood (Grossman and Wisenblit, 1999), love and
health (Kargere, 1979), courage (Birren, 1950) and as an appetite stimulant (Hynes,
2009). Yellow has been dominantly recognized as the colour of intellect and loyalty; and
orange as the colour of wisdom and strength (Birren, 1950). Further, colours have
meanings associated with gender and cultures. For instance, consumers continue to
associate blue colour for boys and pink for girls (Grossman and Wisenblit, 1999). A
cross-cultural study on colours by Madden et al. (2000) provides a 'spectrum of colour
meaning' (see Figure 1) derived on the basis of the way consumers perceive and relate to
an assortment of colours across cultures. The meaning associations along this spectrum
range from 'active', 'hot', and 'vibrant' (associated with red) to 'calming', 'gentle', and
'peaceful' (associated with the blue-green-white cluster). Some colours not only formed
interesting patterns or clusters but were also found to have meanings that were universal
as well as unique across cultures. For example, while black and brown have strongly
held universal associations of 'sad' and 'stale' across cultures, additional meaning
associations of 'formal' (Brazil, Colombia, PRC, and Taiwan) and 'masculine' (Austria,
Hong Kong, the United States) were also evident in some countries.
Figure 1: Spectrum of Colour Meaning
(Source: Madden, T. J.; Hewett, K.; Roth, M. S. (2000), Managing Images in Different Cultures: A Cross-
National Study of Color Meanings and Preferences, Journal of International Marketing, Vol. 8 (4), p.99)
Past researches have also observed that colour becomes a valuable retrieval tool for
consumers (Bottomley and Doyle, 2006) as it helps the brain retrieve previously learned
associations. In effect, consumers associate brands with certain colours such as
Marlboro with red and Cadbury with purple (Grimes and Doole, 1998) and also tend to
apply associations to infer personality traits of a brand. When selecting a product it is
COLOURS IN LOGOS
ColoursRed GoldOrangeYellow
BlackBrownPurple
Blue Green White
Active, ferocious,
vibrant, hot, violent
Meanings
Calmimg, cold, gentle, passive,
peaceful, still
143Vol. 35 No. 1
144 BUSINESS ANALYST
likely that a consumer choose a product based on previously existing colour associations
that correspond to product category (Grossman and Wisnenblit, 1999). Repetitive
exposure to logo elements (including colours) thereby plays an important role in
conveying the intended characteristics of a brand's personality*. Further, researchers
have found that consumers establish a personality for most brands with limited cultural
differences (e.g. Aaker, 2001; Parker, 2009) and it is the congruence of colour
association with brand personality which makes specific colours appropriate for the
brand's logo (Bottomley and Doyle, 2006).
RESEARCH OBJECTIVES
In the light of the aforesaid discussion, the objectives of present study can be stated as
follows:
a) To examine the associations that consumers apply to a given colour in the logo.
b) To assess the personality traits that consumers attribute to various colours of a brand
logo.
c) To investigate the appropriateness of specific colours in brand logo.
RESEARCH METHODOLOGY
Using snowball sampling technique, responses for the study were collected through a
well-designed online questionnaire divided into four broad sections. The first section
related to a colour vision test and general profile of the respondents. The second section
examined the association that consumers had with colours in a logo. Following the
approach of Ridgway (2011), a logo was designed using three shapes namely, a triangle,
a square and a circle. Efforts were made to ensure that the designed logo was not similar
to any logo that currently exists. Using different values of red, green and blue (RGB
values), the same logo was developed in six different colours so as to assess the colour
preference of consumers. These colours were: blue (R= 20, G= 63, B= 141), green (R= 0,
G= 79, B= 47), pink (R= 239, G=37, B=119), red (R=231, G=27, B= 38), yellow (R=
243, G= 233, B= 13) and purple (R= 107, G= 33, B= 130). The associations given by
Hynes (2009) formed the basis for the colour association options provided to the
respondents. Respondents were asked to select an option (or association) that they
*Brand personality can be defined as attributing human characteristics to brands (Aaker, 1997).
April - September 2014
thought was the best fit for a particular colour. The next section of the questionnaire
included the list of 42 traits as developed by Aaker (1997). The respondents were asked
to choose all the traits they thought would be applicable to the logo that they were
assessing. The last section sought the opinion of the respondents regarding the
appropriateness of the logo colour. For this purpose, the same logo was provided along
with the description of the brand in terms of two personality traits. The personality traits,
adopted from Aaker's (1997) brand personality traits, were chosen from the same
dimension and were either congruent or incongruent with the colour associations. The
responses were obtained using a seven-point likert scale ranging from 'highly
inappropriate' (1) to 'highly appropriate' (7). The developed logo along with the sample
of the questions asked in various sections of the questionnaire for six logo colours is
provided in the Appendix.
Due to high reach and popularity of social networking sites, Facebook was chosen as a
medium to obtain participation for the survey. The link to the survey was made available rd thfor a period of one week (3 - 10 March, 2014) and users were encouraged to respond to
the survey. Of the total of 227 people who participated in the survey, only 137 provided
complete responses to the questionnaire and hence comprised the sample for the study.
One respondent was disqualified due to the failure in the colour vision test. The sample
constituted of 66% males and 34% females, with majority of respondents (43%) in the
age group of 18-24 years, followed by 52% respondents who were between 25-34 years.
In terms of the geographic diversity, the respondents were mainly from Karnataka 66
(49%), followed by Kerala 15 (11%), Maharashtra 9 (7%), Delhi 9 (7%) and Andhra
Pradesh 8 (6%). The data so collected was analyzed using Microsoft Excel 2007 and
SPSS 17.0 version. The results are discussed in the ensuing section of the paper.
ANALYSIS AND DISCUSSION
Ÿ
To understand the difference in proportion of respondents' selecting a colour association
for the logo that was developed in six different colours (blue, green, pink, red, yellow
and purple), chi-square test was performed. The color association with the highest
percentage is indicated (see Table 1) as it is the association that differ the most from the
other associations. As observed from the findings, the respondents chose trustworthy
(35%) over all the other options for colour blue, although playful was a close second
choice. The respondents chose healthy (59%) over all the options that were given for the
Assessing Consumers' Colour Associations
COLOURS IN LOGOS 145Vol. 35 No. 1
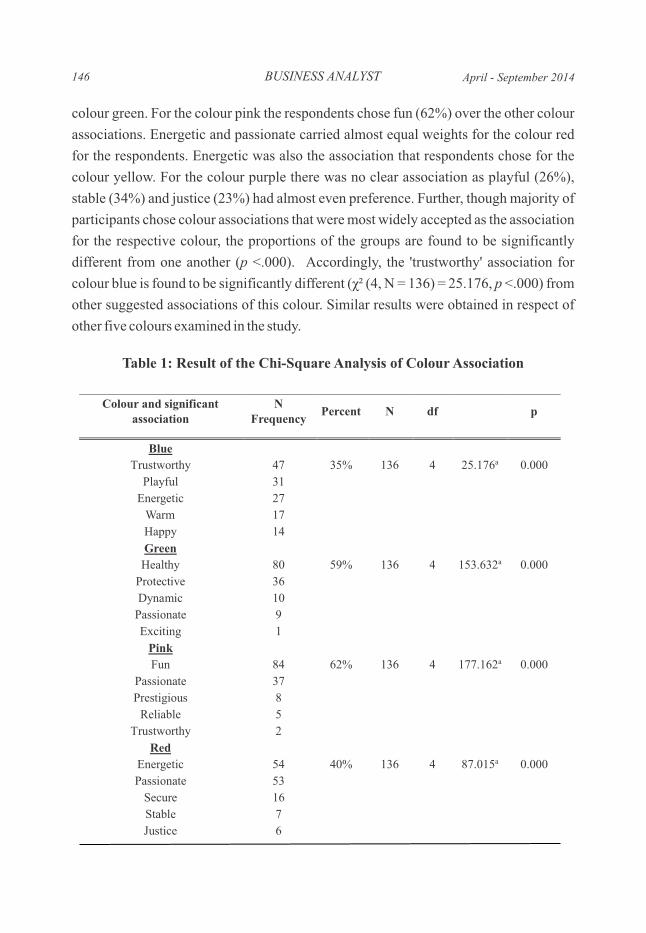
146 BUSINESS ANALYST
colour green. For the colour pink the respondents chose fun (62%) over the other colour
associations. Energetic and passionate carried almost equal weights for the colour red
for the respondents. Energetic was also the association that respondents chose for the
colour yellow. For the colour purple there was no clear association as playful (26%),
stable (34%) and justice (23%) had almost even preference. Further, though majority of
participants chose colour associations that were most widely accepted as the association
for the respective colour, the proportions of the groups are found to be significantly
different from one another (p <.000). Accordingly, the 'trustworthy' association for
colour blue is found to be significantly different (χ² (4, N = 136) = 25.176, p <.000) from
other suggested associations of this colour. Similar results were obtained in respect of
other five colours examined in the study.
Table 1: Result of the Chi-Square Analysis of Colour Association
April - September 2014
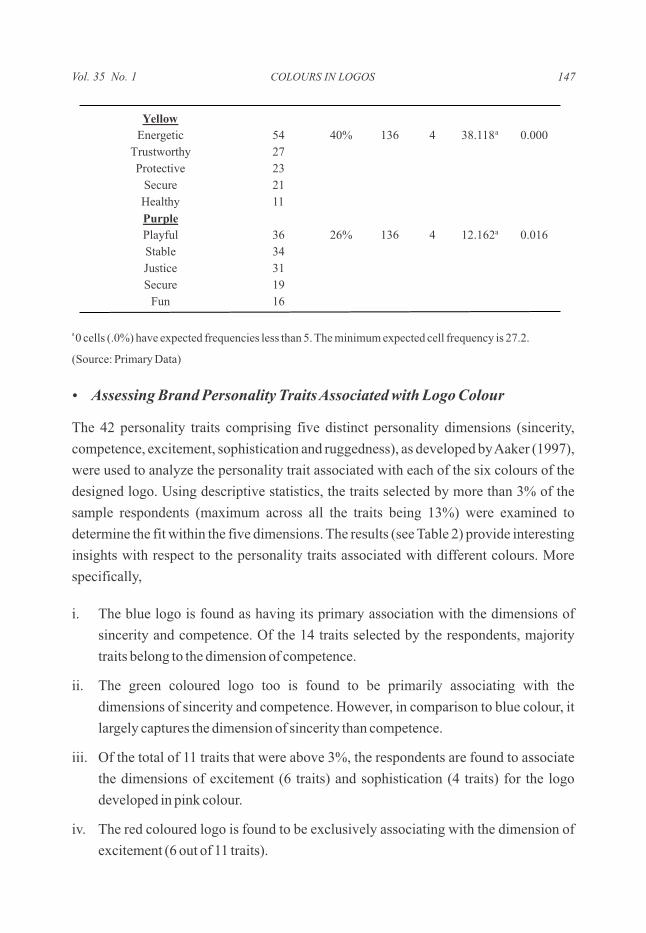
a 0 cells (.0%) have expected frequencies less than 5. The minimum expected cell frequency is 27.2.
(Source: Primary Data)
Ÿ
The 42 personality traits comprising five distinct personality dimensions (sincerity,
competence, excitement, sophistication and ruggedness), as developed by Aaker (1997),
were used to analyze the personality trait associated with each of the six colours of the
designed logo. Using descriptive statistics, the traits selected by more than 3% of the
sample respondents (maximum across all the traits being 13%) were examined to
determine the fit within the five dimensions. The results (see Table 2) provide interesting
insights with respect to the personality traits associated with different colours. More
specifically,
i. The blue logo is found as having its primary association with the dimensions of
sincerity and competence. Of the 14 traits selected by the respondents, majority
traits belong to the dimension of competence.
ii. The green coloured logo too is found to be primarily associating with the
dimensions of sincerity and competence. However, in comparison to blue colour, it
largely captures the dimension of sincerity than competence.
iii. Of the total of 11 traits that were above 3%, the respondents are found to associate
the dimensions of excitement (6 traits) and sophistication (4 traits) for the logo
developed in pink colour.
iv. The red coloured logo is found to be exclusively associating with the dimension of
excitement (6 out of 11 traits).
Assessing Brand Personality Traits Associated with Logo Colour
COLOURS IN LOGOS 147Vol. 35 No. 1
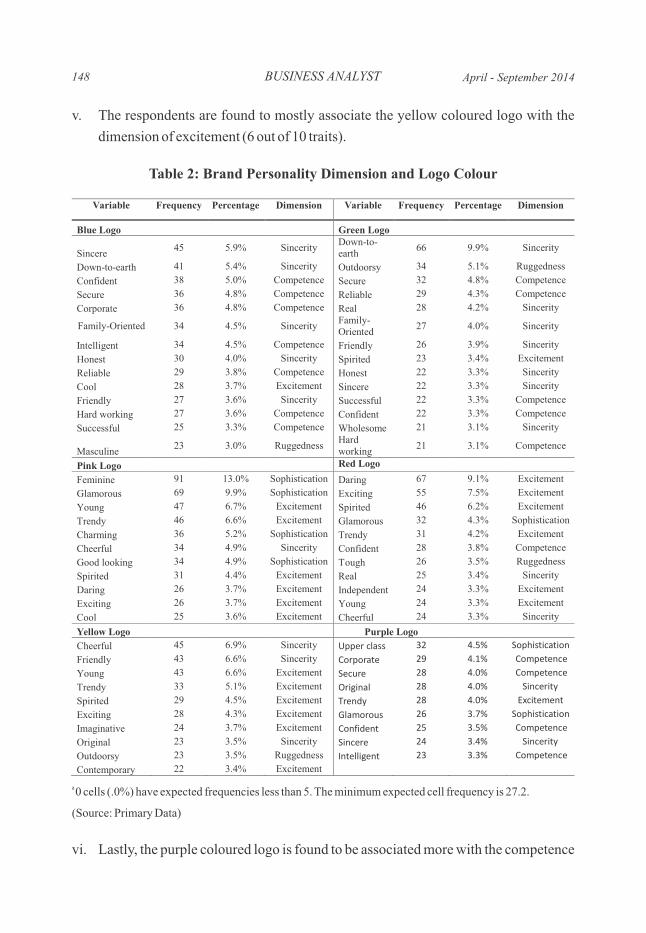
148 BUSINESS ANALYST
v. The respondents are found to mostly associate the yellow coloured logo with the
dimension of excitement (6 out of 10 traits).
Table 2: Brand Personality Dimension and Logo Colour
a 0 cells (.0%) have expected frequencies less than 5. The minimum expected cell frequency is 27.2.
(Source: Primary Data)
vi. Lastly, the purple coloured logo is found to be associated more with the competence
April - September 2014
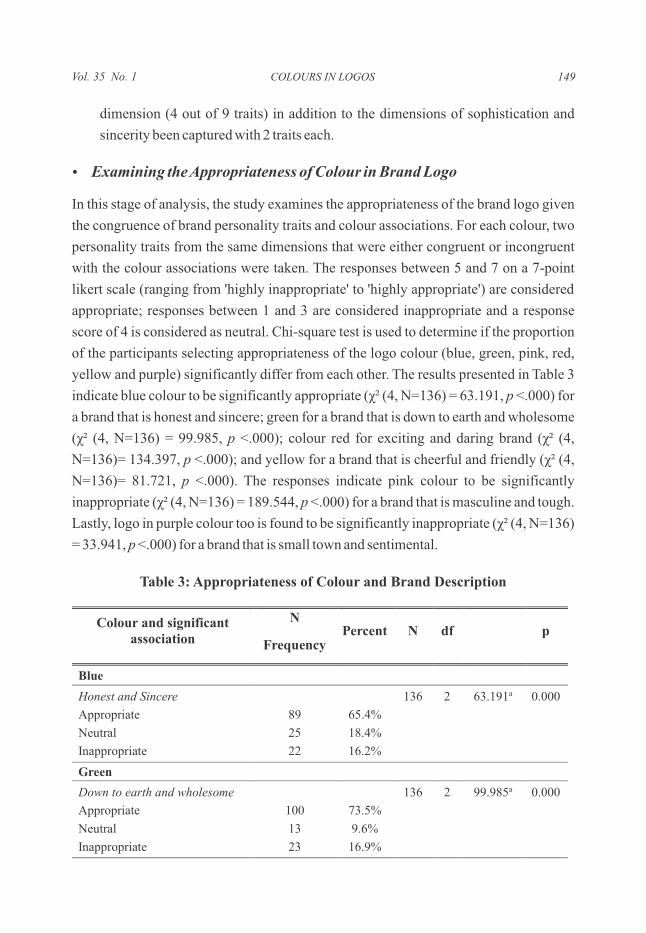
dimension (4 out of 9 traits) in addition to the dimensions of sophistication and
sincerity been captured with 2 traits each.
Ÿ
In this stage of analysis, the study examines the appropriateness of the brand logo given
the congruence of brand personality traits and colour associations. For each colour, two
personality traits from the same dimensions that were either congruent or incongruent
with the colour associations were taken. The responses between 5 and 7 on a 7-point
likert scale (ranging from 'highly inappropriate' to 'highly appropriate') are considered
appropriate; responses between 1 and 3 are considered inappropriate and a response
score of 4 is considered as neutral. Chi-square test is used to determine if the proportion
of the participants selecting appropriateness of the logo colour (blue, green, pink, red,
yellow and purple) significantly differ from each other. The results presented in Table 3
indicate blue colour to be significantly appropriate (χ² (4, N=136) = 63.191, p <.000) for
a brand that is honest and sincere; green for a brand that is down to earth and wholesome
(χ² (4, N=136) = 99.985, p <.000); colour red for exciting and daring brand (χ² (4,
N=136)= 134.397, p <.000); and yellow for a brand that is cheerful and friendly (χ² (4,
N=136)= 81.721, p <.000). The responses indicate pink colour to be significantly
inappropriate (χ² (4, N=136) = 189.544, p <.000) for a brand that is masculine and tough.
Lastly, logo in purple colour too is found to be significantly inappropriate (χ² (4, N=136)
= 33.941, p <.000) for a brand that is small town and sentimental.
Table 3: Appropriateness of Colour and Brand Description
Examining the Appropriateness of Colour in Brand Logo
COLOURS IN LOGOS 149Vol. 35 No. 1
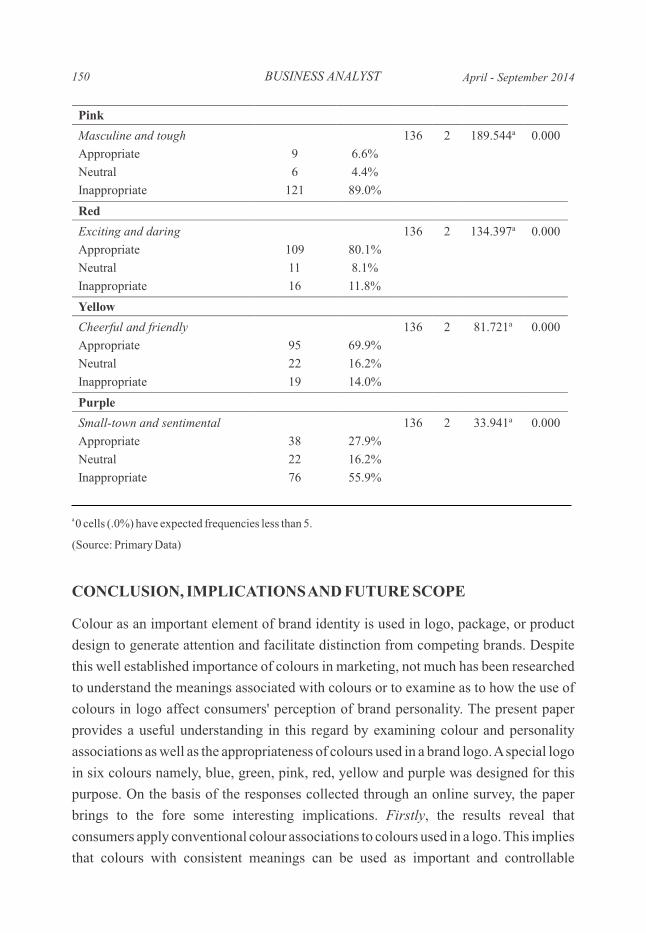
150 BUSINESS ANALYST
a 0 cells (.0%) have expected frequencies less than 5.
(Source: Primary Data)
CONCLUSION, IMPLICATIONS AND FUTURE SCOPE
Colour as an important element of brand identity is used in logo, package, or product
design to generate attention and facilitate distinction from competing brands. Despite
this well established importance of colours in marketing, not much has been researched
to understand the meanings associated with colours or to examine as to how the use of
colours in logo affect consumers' perception of brand personality. The present paper
provides a useful understanding in this regard by examining colour and personality
associations as well as the appropriateness of colours used in a brand logo. A special logo
in six colours namely, blue, green, pink, red, yellow and purple was designed for this
purpose. On the basis of the responses collected through an online survey, the paper
brings to the fore some interesting implications. Firstly, the results reveal that
consumers apply conventional colour associations to colours used in a logo. This implies
that colours with consistent meanings can be used as important and controllable
April - September 2014
marketing variable for managing a uniform image of the brand across cultures and
markets. The results are consistent with a cross-cultural study conducted by Madden et
al. (2000) that too suggested certain colours to manifest pan cultural meaning and
associations. Second, an assessment of colour associations in the context of brand
personality revealed varied traits of Aaker (2001) with which respondents associate each
of the colours. More specifically, while the colours blue and purple fell into the
dimension of competence which indicates a brand to be responsible, dependable and
secure; green colour captured the trait of sincerity which is described by a brand that is
warm and acceptable. The colours pink, red and yellow were described by the dimension
of excitement, thereby reflecting that the brand, through its logo colour, would be
perceived as sociable, energetic and active. Sophistication and ruggedness are not
clearly defined as they capture aspirational ideas rather than basic tendencies. This
possibly could be the reason that none of the colours reflected these two dimensions. The
results thus present useful insight with respect to the perception that a particular colour is
likely to create when it is used in a logo. Lastly, the study investigates the
appropriateness of colour choice in a logo when brand personality and colour
associations are congruent. Except for pink and purple, the remaining colours were
found to be having congruent associations. Manufacturers and marketers may use this
information to create logos in colours that evoke positive brand image and associations.
For instance, the trustworthy trait of a brand may best be represented by its logo in blue
colour due to its high association with dimension of 'competence' that captures the traits
of the brand being perceived as dependable and secure. The examples of the successful
use of this include the brand logos of Ford, Intel and Samsung. As the colour green in the
present work is represented by the dimension of 'sincerity' (associated with warmth,
wholesome and acceptance), the use of this colour in brand logo is suggested for the
products/companies which would like to stand for being eco-friendly and healthy. The
colour pink, represented by the dimension of 'excitement', should be used by a brand that
wants to be perceived as a trendy, unique and imaginative. Further, due to its
inappropriateness for masculine associations, this colour should not be used for brands/
products targeted at men. Red colour, generally associated with danger, was also found
to be represented with the dimension of 'excitement'. It would therefore be appropriate if
this colour is used in logos for the brands which stand for being up-to-date, daring, and
exciting. We see brands like Adobe, ESPN and Red Bull which fit into this description.
As against this, colour yellow may be used to connote a 'unique' or 'cool' brand and so
may provide a better fit for brands such as Nikon, Ferrari and Yellow Pages. It was
COLOURS IN LOGOS 151Vol. 35 No. 1
interesting to note that the colour purple associated with mixed dimensions of
'competence', 'sophistication' and 'sincerity'. As using this colour could send a different
and incongruent message to the consumers, a cautious use of this colour is suggested
through the results of the present study.
The limiting aspects of this study may be addressed by future researches. A larger and
more diversified sample may be taken so as to provide greater credibility and
representation to the research findings. Also, as the study was conducted via the online
medium, there exists a possibility of colours being perceived differently due to
difference in the configuration of respondents' computer screen. Some aspects such as
difference in colour meanings and associations across consumer demographics such as
age and gender have not been analyzed in the present work. It would be interesting to
note if the colour and personality associations vary for different profile of consumers. It
would also be worth examining whether the brand cues alter colour meaning and
associations i.e. whether colours are associated with same meanings for different brands
or are associated with different meanings in a brand context. An understanding of these
aspects would help in enhancing the effectiveness of colour-focused marketing
strategies in future.
REFERENCES
Aaker, J. L. 1997. “Dimensions of Brand Personality” Journal of Marketing Research, 34(3), 347-356.
Aaker, J. L. 2001. “Consumption Symbols as Carriers of Culture: A Study of Japanese and Spanish Brand Personality Constructs” Journal of Personality and Social Psychology, 81(3), 492-508.
Adir, V., Adira G. and Nicoleta E. P. 2013. “How to Design a Logo?” 2nd World Conference on Design, Arts and Education DAE-2013, Procedia - Social and Behavioral Sciences, 122, 140 – 144.
Birren, F. 1950. “Color Psychology and Color Therapy” McGraw-Hill Book Company, Inc.: New York.
Birren, F. 1978. “Color and Human Response: Aspects of Light and Color Bearing on the Reactions of Living Things and the Welfare of Human Beings” Van Nostrand Reinhold Co.: New York.
Bottomley, P. A., and Doyle, J. R. 2006. “The Interactive Effects of Colors and Products on Perceptions of Brand Logo Appropriateness” Marketing Theory, 63(6), 63-83.
Colman, A. M., Wober, J. M., and Norris, C. E. 1995. “Sight Bites: A Study of Viewers' Impressions of Corporate Logos in the Communications Industries” Journal of the Market Research Society, 37(4), 405-415.
Grimes, A. and Doole, I. 1998. “Exploring the Relationship Between Colour and International Branding: A Cross-Cultural Comparison of the UK and Taiwan” Journal of Marketing Management, 4, 799-817.
Grossman, R.P. and Wisenblit, J. Z. 1999. “What We Know About Consumers Color Choices”, Journal of Marketing Practice Applied Marketing Science, 5 (3), 77-89.
Henderson, P. W., and Cote, J. A. 1998. “Guidelines for Selecting or Modifying Logos” Journal of Marketing, 62(2), 14–30.
BUSINESS ANALYST152 April - September 2014
Hynes, N. 2009. “Colour and Meaning in Corporate Logos: An Empirical Study” Journal of Brand Management, 16(8), 545-555.
Janiszewski, C., and Meyvis, T. 2001. "Effects of Brand Logo Complexity, Repetition, and Spacing on Processing Fluency and Judgment” Journal of Consumer Research, 28 (6), 18-32.
Kargere, A. 1979. “Color and Personality” Noble Offset Printers Inc.: New York.
Kohli, C., Suri, R. and Thakur, M. 2002. “Creating Effective Logos: Insights from Theory and Practice” Business Horizons, May-June, 58-64.
MacInnis, D. J., Shapiro, S., and Mani, G. 1999. “Enhancing Brand Awareness through Brand Symbols” Advances in Consumer Research, 26, 601–608.
Madden, T. J., Hewett, K., Roth, M. S. 2000. “Managing Images in Different Cultures: A Cross-National Study of Color Meanings and Preferences” Journal of International Marketing, 8 (4), 90-107.
Parker, B. T. 2009. "A Comparison of Brand Personality and Brand User-Imagery Congruence" Journal of Consumer Marketing, 26 (3), 175 – 184.
Pittard, N., Ewing, M., and Jevons, C. 2007. “Aesthetic Theory and Logo Design: Examining Consumer Response to Proportion across Cultures” International Marketing Review, 24(4), 457-473.
Plummer, J. T. 2000. “How Personality Makes a Difference” Journal of advertising Research, 40 (6), 79 -83.
Ridgeway, J. L. 2011. “Brand Personality: Consumer's Perceptions of Color Used in Brand Logos” Thesis, Graduate School, University of Missouri.
Silayoi, P., and Speece, M. 2007. “The Importance of Packaging Attributes: A Conjoint Analysis Approach” European Journal of Marketing, 1495-1517.
Tractinsky, N., and Lowengart, O. 2007. “Web-Store Aesthetics in E-Retailing: A Conceptual Framework and Some Theoretical Implications” Academy of Marketing Science Review, 11(1), 1-18.
Wallace, R. 2001. “Proving Our Value: Measuring Package Design's Return on Investment” Design Management Journal, 12(3), 20-27.
Wood L. 2000. "Brands and Brand Equity: Definition and Management", Management Decision, 38(9), 662 – 669.
COLOURS IN LOGOS 153Vol. 35 No. 1
BUSINESS ANALYST
Appendix: Logo and Sample Questions
154 April - September 2014
Vol. 35 No. 1
1Associate Professor, Department of Economics, Shri Ram College of Commerce, Delhi.
Book Review
SPIRITUAL CAPITAL
A Moral Core for Social and Economic Justice
(Rima, Samuel D., Gower Publishing Limited, England, 2013, pp. 307,
Hard Bound, Price: £ 55)
1 A. J. C. Bose
Modern economics has been singularly obsessed with efficiency or cost-effectiveness or
market discipline whereas for the people of the world justice is actually more important
simply because for most of them life is unfair. There is need for replacing the modern
economics—the economics of the rational greedy economic man—by humanistic
economics that cares for the needs of the people. It is in this connection that the book
under review finds its relevance, and it is interesting to note the backdrop in which this
book had germinated.
On May 20, 2009, in the aftermath of the American-spawned global financial crisis, as
the author of the book informs us, the US Congress passed legislation entitled The Fraud
Enforcement and Recovery Act of 2009, which simultaneously created the Financial
Crisis Inquiry Commission (FCIC) to oversee the recovery efforts and explore the
precipitating causes of the crisis. In early 2010 the FCIC conducted a 48 hours of
contentious debate and discussion among experts from the fields of business, economics
and law in order to thrash out the origins of the financial crisis, and to the dismay of the
author, there was not a single recorded mention of the potential role that unbridled greed
or the lack of any moral or ethical core to the practice of neoliberal economics may have
played as a primary causal factor.
It is the contention of the author—rightly so—that in today's study of economics there is
no longer room for the application of philosophical fields of study such as morality,
ethics, and metaphysics, and yet, it may very well be that it is the absence of these precise
fields of study that are the root of today's financial crisis. Consequently, this book asserts
that the current global financial crisis is, at its root, a metaphysical crisis stemming from
profound moral, ethical, and spiritual failures within the world's capitalistic societies
related to the acquisition, use, and distribution of earth's resources. The author argues
155
BUSINESS ANALYST
that this book is a response to this problem by way of the development of a theory of
spiritual capital that can serve as a catalyst for individual, institutional, and societal
renewal, resulting in economic practice that is rooted in social ontology and guided by a
moral core.
The concepts of 'physical capital', 'human capital', 'natural capital' and 'social capital' are
by now well-known but the concept of 'spiritual capital' is relatively new and rather
ambiguous, although it can be viewed as a subset of social capital. The author gives a
succinct definition of spiritual capital as: Spiritual Capital is a metaphysical impulse that
animates and leverages other forms of capital to build capacity for advancing the
common good. It needs to be formed first in individuals and then transferred to
institutions in such a way that those institutions might substantively contribute to
promoting the common good and, as a direct result, comprehensive societal renewal.
What is common good or public interest? This is not spelt out although we can take it in
the implicit rhetorical sense that it refers to the good of the majority in the society or in
the sense of the wellbeing of the 99 percent against 1 percent—the slogan of the Occupy
Wall Street Movement.
The book is organized into four parts which cover nine chapters.
In part one, the author delineates the subjective and objective conceptions of the book.
The subjective conception refers to the author's own personal journey and the
incongruities he had experienced, particularly in a socio-economic context, between his
indigenous roots as a person of Native American heritage, and his exogenous
experiences as a Christian Minister. On this basis, he articulates how all of the historic
tragedies experienced by the indigenous people of North America, as well as the
abdication by the Christian Church of its biblically mandated mission of leading the way
in creating a socially and economically just society, both have their roots in economic
soil; beginning with the genocide of Native Americans and the enslavement of Native
Africans, continuing through the emergence of mercantilism and the rise of the
Industrial Revolution, and concluding in the practice of neoliberal capitalism. It was this
realization that spurred the author to consider what might be done to direct current
economic practice back to something more consistent with the indigenous economics
practiced by Native Americans, and the teachings of the Christian Scriptures, the Holy
Koran, and the Jewish Scriptures, as well as the teachings of other faiths. The objective
conception of the book relates to how neoliberal capitalism of the last roughly 100 years
156 April - September 2014
has created an economic environment that has fostered the greatest income gaps in the
history of the world, created socio-political schisms between the West and the rest of the
world, and spawned a consistent series of recurring, and worsening economic crises that
have led the world to the brink of total financial collapse.
In part two of the book, the author takes a historical look at how current forms of
capitalism have evolved from the earliest days of Old Testament and Islamic economic
practices and Aristotle's household economy, through the current practices of neoliberal
capitalism promoted by Milton Friedman, and the Chicago School of Economics.
Attention is given to the unique role of how the Protestant reformation provided the soil
necessary for the seeds of capitalism to flourish in the 'New World' and how American
Christianity has played a sympathetic role in the advent of advanced capitalism,
consumerism, and materialism, all of which have played a seminal role in the current
global crisis and increased the need for the transforming effects of Spiritual Capital. The
specific purpose of the author in this regard is to identify the general period during
American capitalism's evolution at which it lost its moral core and a corresponding
concern for social ontology.
Part three of the book traces the roots of neoliberal economic theory and its critics,
examines the newly emerging field of Spiritual Capital, and describes in detail the
research methodology used for generating the Spiritual Capital theory. The author
argues that Adam Smith's two books, viz., The Wealth of Nations, and Theory of Moral
Sentiments should more accurately be viewed as a single work in two parts so that the
case can be made that Smith never envisioned a day when the free market would become
wholly unregulated by the basic sentiments of human morality. Separating human
economic practice from concerns for such basic moral sentiments such as justice,
equality, charity, love, mercy, and a concern for the basic well-being of others causes the
free market to take a decidedly inhumane turn as the world has recently witnessed.
Besides establishing this point, the author also reviews some of the classical economic
theories that have become the basis of neoliberal economic ideology upon which the
current economy is based, and some of the prominent critiques of neoliberal capitalist
ideology that have been offered. He then proceeds to justify how the concept of Spiritual
Capital holds promise for reforming the more negative aspects of neoliberal capitalist
practice by regrounding it in metaphysics and social ontology, leading to a concern for
social and economic justice. The author discusses the rigorous theoretical basis as also
coherent definition for Spiritual Capital to become a truly efficacious reformative
Vol. 35 No. 1 SPIRITUAL CAPITAL 157
158 BUSINESS ANALYST
impulse. After which he elaborates his research methodology in terms of an ensemble of
four components, viz., Grounded Theory, Phenemenology, Critical Theory and Action
Research; and describes the fieldwork that he had undertaken in different parts of the
world.
Part four of the book focuses on how the author develops a theory of spiritual capital by
covering where it comes from, how it is formed and invested, and the significant return
on investment that can be realized for both the investor and society. In this connection
the author shares his fieldwork experience by introducing a distinctive group of people
and organizations who have been willing and able to leverage all of their other forms of
capital, often at great personal expense, to rescue child warriors in Uganda, create a
sustainable, transformational community in the Egyptian desert, bring entrepreneurial
hope to South Africans recovering from the suffocating effects of Apartheid, bring
employment to inner city gang members in Knoxville, Tennessee, create a new
economic way of life called “The Simple Way”, as well as other powerful stories. The
author then turns to the practical application of his Spiritual Capital theory—how
spiritual capital can be transferred from the individual to the institutional level with the
goal of bringing societal renewal; and how culture changes and the critical role
institutions play in that renewal. In the process, he also presents a case study of how this
transference of spiritual capital can take place from the individual to the institutional
level, and the impact it can have on catalyzing societal renewal. He also lays out an
energetic plan for trans-cultural Spiritual Capital formation and mutual engagement for
such renewal.
To conclude, this book is a very innovative contribution to addressing the pressing issues
of the troubled world with a clear cut message that social change for the better cannot
happen without personal and public moral codes. And these ethical codes, the author
examines, and examines well, in historical perspective. It is a good example of a thought
provoking, cutting edge book on Spiritual Economics that combines conceptual
insights, interdisciplinary rigour and practical relevance in key areas of business and
management and economic policy making. This is not all. The research methodology of
the author is laudable and worth copycatting.
April - September 2014
BUSINESS ANALYST makes an effort to expose business and economic
phenomena to modern techniques of theoretical analysis and objective
appraisal. Its aim is to promote research in these fields and to encourage
empirical and inductive writings. Persons engaged in studying complex
business and economic problems are invited to send their contributions for
publication. Since the journal provides full analytical freedom to writers, the
Editor and the Editorial Board do not accept any responsibility for conclusions
and findings derived from factual data or via empirical reasoning.
Annual Subscription to Business Analyst is ̀ 300 for two issues. Single Issue is
priced at ` 150. Those who wish to subscribe to this journal may send demand
draft for ` 300 for one year subscription in favour of 'Principal, Shri Ram
College of Commerce' payable at Delhi.
Facility of mutual exchange of Journal is also available.
Advertisement Tariff
Inside back cover (full) : ` 4000
Regular page (full) : ` 2500
Regular page (half) : ` 1500
Published by : P. K. Jain on behalf of Shri Ram College of Commerce, Delhi - 110 007.
Printed by : Sudha Printing Press, New Delhi - 110020
Editor : Deepashree
BUSINESS ANALYST

SHRI RAM COLLEGE OF COMMERCEUniversity of Delhi, Maurice Nagar Delhi - 110 007
Phone: 11 - 27667905 Fax: 11 - 27666510
ISSN 0973-211X
Related Documents