Burnt Tuna: Conditions Leading to Rapid Deterioration in the Quality of Raw Tuna J. L. CRAMER, R. M. NAKAMURA, A. E. DIZON, AND W. N. IKEHARA Introduction In Hawaii, raw tuna flesh which seems paler and softer than normal is characterized by buyers as being "burnt." High-quality tuna should be translucent, red, and firm. Burnt tuna, because of its poor texture, color, and slightly sour taste, while edible, is undesirable for raw con- sumption (as "sashimi"). It there- fore commands only a fraction of the selling price of high quality tuna, depending on the extent and the severity of burn. However, the burnt condition is not absolute in extent or degree; the affected area can vary from 5 to 100 percent of the total marketable meat of the fish and range in severity from marginal to severely burnt. The variability in occurrence compounds an already difficult diagnostic problem. The condition periodically occurs in the large (45-136 kg) tropical tunas-the yellowfin tuna, Thunnus albacares, and bigeye tuna, T. obesus-and was first brought to the attention of the National Marine Fisheries Service (NMFS) in 1974 by ABSTRACT-Burnt tuna is raw tuna which is paler and softer than normal. This study indicates that the burnt tuna condition results from muscle cell degeneration which begins prior to the death of the fish and proceeds more rapidly after death than in normal tuna. Female sex, longer fighting times, and less efficient chilling are positively cor- related with the occurrence and severity of the burnt tuna condition. 12 recreational fishermen who troll off Hawaii's Kona coast. The problem is now a major economic concern of the night handline fishery of the same island. This highly effective, cost efficient industry, found only in Hawaii and in the Philippines (Yuen, 1979), would be an excellent candidate for fishery development in export-poor Pacific island na- tions if the burn problem could be controlled. Whatever the causes of burn, we suspect that the problem is exacerbated by the limited chilling facilities found aboard most night handline and recreational fishing boats. In Hawaii, traditional marketing practices delay the discovery of burn. A typical fish changes hands at least twice in the first 48 hours after death. The fisherman consigns his catch to a wholesaler who then either sells it locally or ships it to a more distant market. If the fish is sold locally, the fish is butchered J. L. Cramer was with the Honolulu Laboratory, Southwest Fisheries Center, Na- tional Marine Fisheries Service, NOAA, 2570 Dole Street, Honolulu, Hawaii; present ad- dress: Northwest and Alaska Fisheries Center, National Marine Fisheries Service, NOAA, P.O. Box 21, Mukilteo, WA 98275. R. M. Nakamura is with the Department of Animal Sciences, University of Hawaii (Manoa), 1800 East-West Road, Honolulu, HI 96822. A. E. Dizon is with the Honolulu Laboratory, Southwest Fisheries Center, Na- tional Marine Fisheries Service, NOAA, 2570 Dole Street, Honolulu, HI 96812. W. N. Ikehara is with the Department of Zoology, University of Hawaii, Honolulu, HI 96822. and the burn is discovered relatively quickly, within 12 hours of catch- ing. However, if it is exported, butchering usually occurs after the fish is sold to the last and most dis- tant retailer, from 36 to 60 hours after catching. Transportation costs have thus been incurred before dis- covery of the condition. Upon discovery of burn, the fisherman is required to refund a portion of the auction price to the wholesalers which is then used to defray a fraction of the costs in- volved in the marketing and ship- ping. Rebates on burnt fish were reported to range from 5 to 75 per- cent of the original selling price in 1977. Annual losses to the night handline fishermen were estimated to be about 16 percent of the total value of the catch (Cramer et al.)'. Clearly the reduction of burn through improved fishing and handling methods is an important goal and some method must be developed to identify the condition of the fish early in the marketing se- quence before filleting. These requirements formed the motivation for our work. We reasoned that our best strategy to in- vestigate burn was to correlate quality of the fish with those measurable variables that would be likely to be responsible for, or at least indicate burn. Those correlates fell into three classes: 1) Fishing variables such as time of the year, temperature of the water, fighting time, and care of the catch; 2) biological characteristics such as sex, weight, species, and body temperature at death and after; and 3) biochemical, histological, and pH samples. We hoped that burnt fish would exhibit some differences in key characters relating to exercise or flesh quality. Thus, differences between burnt and normal tuna 'Cramer, J. L., R. s. Shomura, and H. S. H. Yuen. 1978. The problem of burnt tuna in the Hawaiian fishery. National Marine Fisheries Service, Southwest Fisheries Center Admin. Rep. IlH, 17 p. Marine Fisheries Review

Welcome message from author
This document is posted to help you gain knowledge. Please leave a comment to let me know what you think about it! Share it to your friends and learn new things together.
Transcript

Burnt Tuna: ConditionsLeading to Rapid Deteriorationin the Quality of Raw Tuna
J. L. CRAMER, R. M. NAKAMURA,A. E. DIZON, AND W. N. IKEHARA
Introduction
In Hawaii, raw tuna flesh whichseems paler and softer than normalis characterized by buyers as being"burnt." High-quality tuna shouldbe translucent, red, and firm. Burnttuna, because of its poor texture,color, and slightly sour taste, whileedible, is undesirable for raw consumption (as "sashimi"). It therefore commands only a fraction ofthe selling price of high qualitytuna, depending on the extent andthe severity of burn. However, theburnt condition is not absolute inextent or degree; the affected areacan vary from 5 to 100 percent ofthe total marketable meat of the fishand range in severity from marginalto severely burnt. The variability inoccurrence compounds an alreadydifficult diagnostic problem.
The condition periodically occursin the large (45-136 kg) tropicaltunas-the yellowfin tuna, Thunnusalbacares, and bigeye tuna, T.obesus-and was first brought tothe attention of the National MarineFisheries Service (NMFS) in 1974 by
ABSTRACT-Burnt tuna is raw tunawhich is paler and softer than normal.This study indicates that the burnt tunacondition results from muscle celldegeneration which begins prior to thedeath of the fish and proceeds morerapidly after death than in normal tuna.Female sex, longer fighting times, andless efficient chilling are positively correlated with the occurrence and severityof the burnt tuna condition.
12
recreational fishermen who troll offHawaii's Kona coast. The problemis now a major economic concern ofthe night handline fishery of thesame island. This highly effective,cost efficient industry, found onlyin Hawaii and in the Philippines(Yuen, 1979), would be an excellentcandidate for fishery developmentin export-poor Pacific island nations if the burn problem could becontrolled. Whatever the causes ofburn, we suspect that the problem isexacerbated by the limited chillingfacilities found aboard most nighthandline and recreational fishingboats.
In Hawaii, traditional marketingpractices delay the discovery ofburn. A typical fish changes handsat least twice in the first 48 hoursafter death. The fisherman consignshis catch to a wholesaler who theneither sells it locally or ships it to amore distant market. If the fish issold locally, the fish is butchered
J. L. Cramer was with the HonoluluLaboratory, Southwest Fisheries Center, National Marine Fisheries Service, NOAA, 2570Dole Street, Honolulu, Hawaii; present address: Northwest and Alaska FisheriesCenter, National Marine Fisheries Service,NOAA, P.O. Box 21, Mukilteo, WA 98275.R. M. Nakamura is with the Department ofAnimal Sciences, University of Hawaii(Manoa), 1800 East-West Road, Honolulu,HI 96822. A. E. Dizon is with the HonoluluLaboratory, Southwest Fisheries Center, National Marine Fisheries Service, NOAA, 2570Dole Street, Honolulu, HI 96812. W. N.Ikehara is with the Department of Zoology,University of Hawaii, Honolulu, HI 96822.
and the burn is discovered relativelyquickly, within 12 hours of catching. However, if it is exported,butchering usually occurs after thefish is sold to the last and most distant retailer, from 36 to 60 hoursafter catching. Transportation costshave thus been incurred before discovery of the condition.
Upon discovery of burn, thefisherman is required to refund aportion of the auction price to thewholesalers which is then used todefray a fraction of the costs involved in the marketing and shipping. Rebates on burnt fish werereported to range from 5 to 75 percent of the original selling price in1977. Annual losses to the nighthandline fishermen were estimatedto be about 16 percent of the totalvalue of the catch (Cramer et al.)'.
Clearly the reduction of burnthrough improved fishing andhandling methods is an importantgoal and some method must bedeveloped to identify the conditionof the fish early in the marketing sequence before filleting.
These requirements formed themotivation for our work. Wereasoned that our best strategy to investigate burn was to correlatequality of the fish with thosemeasurable variables that would belikely to be responsible for, or atleast indicate burn. Those correlatesfell into three classes: 1) Fishingvariables such as time of the year,temperature of the water, fightingtime, and care of the catch;2) biological characteristics such assex, weight, species, and bodytemperature at death and after; and3) biochemical, histological, andpH samples. We hoped that burntfish would exhibit some differencesin key characters relating to exerciseor flesh quality. Thus, differencesbetween burnt and normal tuna
'Cramer, J. L., R. s. Shomura, and H. S. H.Yuen. 1978. The problem of burnt tuna in theHawaiian fishery. National Marine FisheriesService, Southwest Fisheries Center Admin.Rep. IlH, 17 p.
Marine Fisheries Review

would indicate the causes and suggest remedies.
Materials and Methods
Fish
Bigeye and yellowfin tunas werestudied in this report. Three tunaswere obtained from commercialfishermen on the island of Hawaii.Seven fish were caught off Kona,Hawaii, and transported live in thebaitwell to the Kewalo ResearchFacility (KRF) in Honolulu and twofish were held in captivity at KRFfor over 6 months before being usedin these studies.
The date, area of catch, fightingtime, weight, species, and sex of thefish were recorded. The prechill interval (the time from landing tochilling) was also recorded.
Sampling and Testing
Temperature, blood, and musclesamples were recorded when the fishwere: 1) First landed on the boat,2) off-loaded from the boats, and3) at 24 hours after off-loading.
Blood was obtained by cardiacpuncture immediately after boatingthe fish using silicone-coated vacutainers (Kimble-Terumo, Elkton,MD.).2 Captive fish were bled justprior to killing, and 2 ml of wholeblood were immediately mixed with2 ml of 15 percent perchloric acidfor glucose and lactate determinations. The serum was separatedfrom the remaining blood and frozen for later testing.
A coring tool was used to obtaintissue samples from the deep musclenear the vertebral column. Tissueswere frozen on dry ice or fixed inDietrich's solution. The latter tissues were processed to obtainHemotoxylin and Eosin stained sections for microscopic examination.
An electronic thermometer with a12 cm probe was used to obtaintemperatures of deep (11 cm) or
'Reference to trade names or commercialfirms does not imply endorsement by the National Marine Fisheries Service, NOAA.
June 1981,43(6)
superficial (just under the skin) tissues of fish.
Fish held in captivity or transported live to KRF were placed inice water for 4-8 hours after killingto simulate normal commercial procedures for treatment of fish priorto off-loading.
The handling of fish during thefirst 24 hours after off-loading fromthe boats was evaluated and categorized. The fish were designated tohave received: 1) Excellent treatment when stored in ice water atO°C, 2) fair treatment when storedin refrigerators at 5°C, and 3) poortreatment when stored at ambienttemperature of 28°C.
After the fish were auctioned andquartered, the flesh was graded andscored on the basis of color and texture as: Excellent, 1 point; good, 2points; marginal, 3 points; poor, 4points; and very poor, 5 points.These subjective evaluations werecorroborated by discussions withthe auctioneer and correlated withthe price received per pound of fish.
Tests
Blood lactate and glucose concentrations were determined by enzymatic analysis utilizing the conversion of NAD to NADH asdescribed by Burgmeyer (1974). Acreatine phosphokinase (CPK) assaywas also conducted following themethod of Burgmeyer (1974). Theabove assays were performed at theUniversity of British Columbia,Vancouver, with the direction andassistance of P. Hochachka and J.Balantyne.
The pH of muscle tissue wasdetermined by titration and theamount of potassium carbonate required to lower the pH of the musclesuspension to a pH of 5.6-6.0. A pHmeter with a 4 mm diameter probewas used to determine the pH of themidsection and tail muscle tissue ofyellowfin or bigeye tuna on the auction floor. The pH was also determined by pH meter for maceratedmuscle tissue suspended in distilledwater.
Statistical Analysis
Correlations of quantitative variables were determined by simpleregression analysis. Correlations involving one or more nonparametricvariables were determined by usingSpearman's correlation rank test(Snedecor and Cochran, 1967).
The significance of differencesbetween mean values were determined using a t test for the differences of means (Snedecor andCochran, 1967).
Results
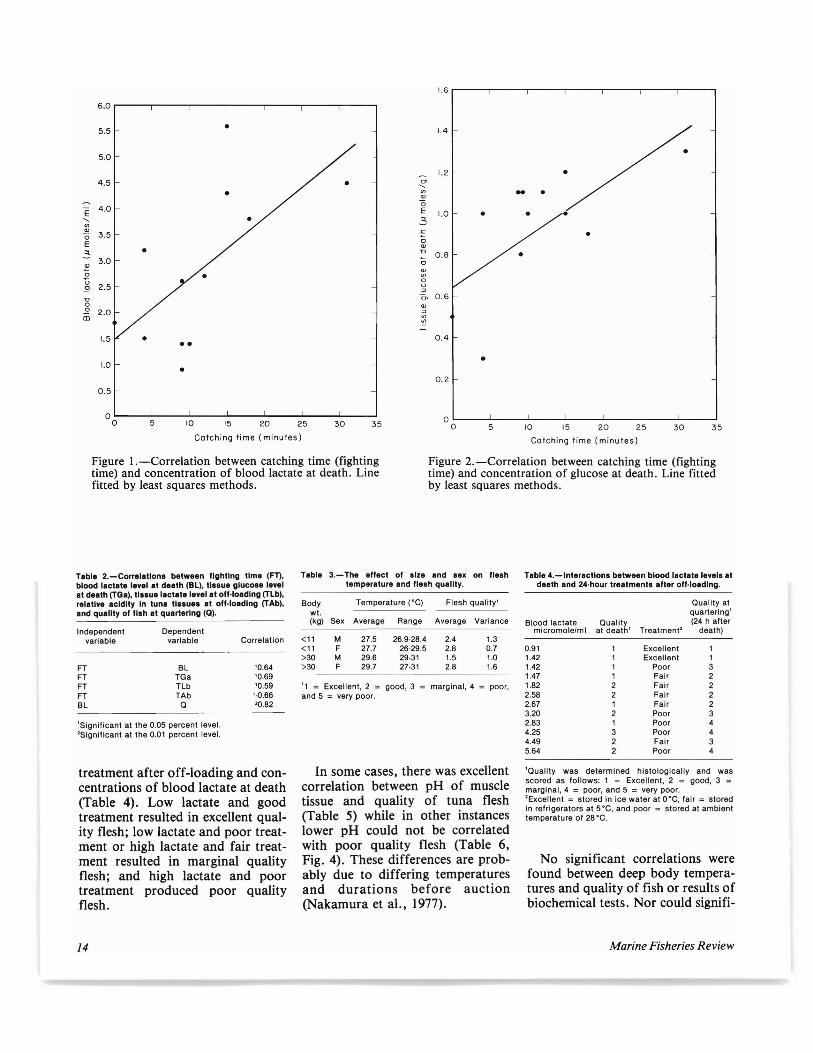
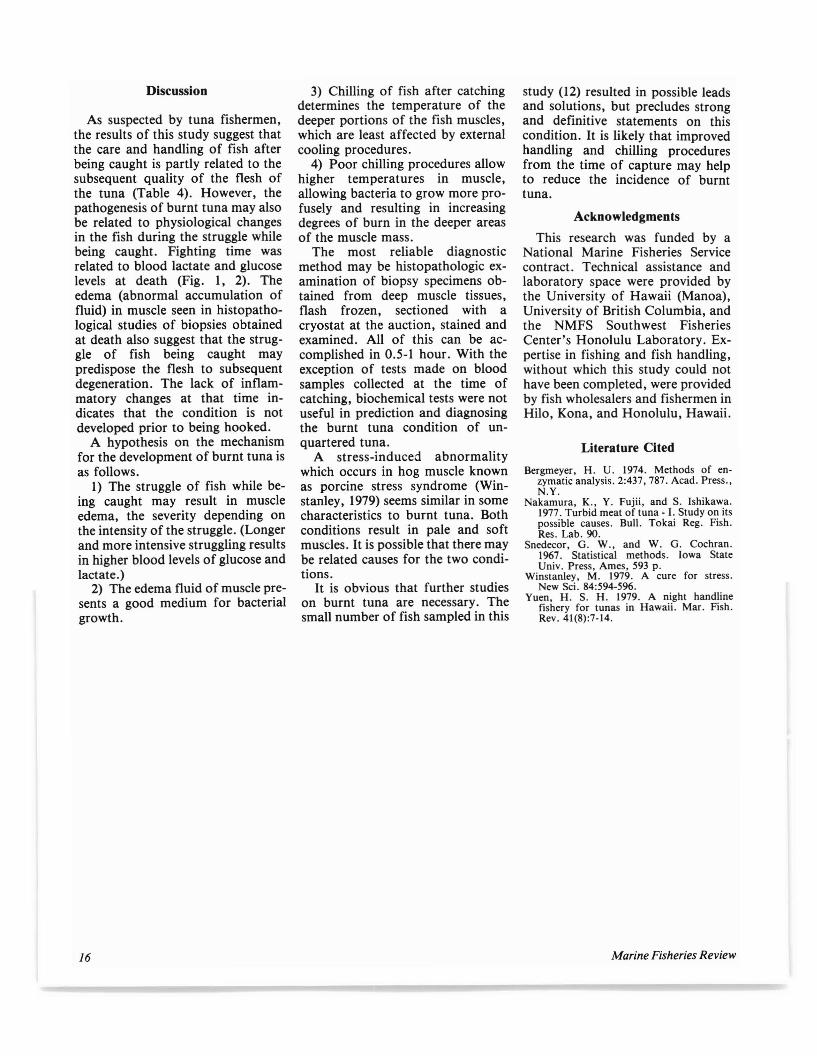
The fighting time and other relevant data on the 12 fish used in thisstudy are recorded in Table 1.Significant (P<0.05) positive correlations were found betweenfighting time and concentrations ofblood lactate (Fig. 1) and bloodglucose (Fig. 2) at death and between fighting time and tissue lactate (Fig. 3) when fish were beingoff-loaded from the boats. Anegative correlation was found between fighting time and relativeacidity of muscle at off-loading(Table 2). The correlations of theseparameters are also indicated inTable 2.
There was a significant difference(P<0.05) between sexes in quality offlesh of fish over 30 kg in weight(Table 3). The flesh of female fishwas more often of low quality. Aninteraction was found between
Table 1.-Data on fish studied.
Fight·Date ing
caught Area time Wt.(1978) caught (min.) (kg) Species Sex
21 Aug. Hila' 9 115.8 T. a/baeares M21 Aug. Hila' 10 63.6 T. a/baeares F27 Sept. Kewalo' 15 10.8 T. a/baeares F27 Sept. Kona2 9 5.2 T.obesus M27 Sept. Kana3 9 4.4 T.obesus M27 Sept. Kana3 4 3.4 T. a/baeares F27 Sept. Kana) 4 3.5 T. a/baeares F27 Sept. Kana) 12 3.7 T. a/baeares M27 Sept. Kana) 18 3.6 T. a/baea,es M27 Sept. Kana3 31 3.5 T. a/baeares F17 Oct. Kewalo' 0 9.4 T. a/baea,es F23 Oct. Kana' 15 50.4 T.obesus F
'Sampled at sea.'Captive fish.'Transported live to KRF.
13
• 0>"-
• '"'"0E
• .3.c0
• '""0
a• '"'"0
u::>
0>Q)
::>
'"'"f=• ••
•
Catching time (minutes)
6.0
5.5
5.0
4.5
E4.0
"-'"'" 3.5"0E.3
3.020
U2.5.!2
"00.!2 2.0CD
1.5
1.0
0.5
00 5 10
•
15 20 25 30 35
1.6
1.4
1.2 •- •1.0 • • •
•0.8 •
0.6
0.4
•0.2
oOL---L5----l.10---15-----J20---21..5---3LO---.J35
Catching time (minutes)
Figure I.-Correlation between catching time (fightingtime) and concentration of blood lactate at death. Linefitted by least squares methods.
Figure 2.-Correlation between catching time (fightingtime) and concentration of glucose at death. Line fittedby least squares methods.
Table 4.-lnteraetlona between blood laetatele.ela atdeath and 24·hour treatmenta after off·loadlng.
Quality atquartering'
Blood lactate Quality (24 h aftermicromole/ml at death' Treatment' death)
Table 3.-The effect of alze and aex on f1eahtemperature and fleah quality.
Body Temperature ('C) Flesh quality'wI.(kg) Sex Average Range Average Variance
<11 M 27.5 26.9·28.4 2.4 1.3<11 F 27.7 26·29.5 2.8 0.7>30 M 29.6 29·31 1.5 1.0>30 F 29.7 27·31 2.8 1.6
Table 2.-Coneletlona between fighting time (FT),blood lactate le.el at death (BL), tlaaue glueoae le.alat death (TGa), tlaaue lactate le.el at off·loadlng (TLb),relatl.e acidity In tuna tlaauea at off·loadlng (TAb),and quality of flah at quartering (0).
Independent Dependent.arlable variable Correlation
FT BL '0.64FT TGa '0.69FT TLb '0.59FT TAb '·0.66BL Q '0.82
'Significant at the 0.05 percent level.'Significant at the 0.01 percent level.
0.911.421.421.47
'1 = Excellent, 2 = good, 3 = marginal, 4 = poor, 1.82and 5 = very poor. 2.58
2.673.202.834.254.495.64
111122121322
ExcellentExcellent
PoorFairFairFairFairPoorPoorPoorFairPoor
113222234434
treatment after off-loading and concentrations of blood lactate at death(Table 4). Low lactate and goodtreatment resulted in excellent quality flesh; low lactate and poor treatment or high lactate and fair treatment resulted in marginal qualityflesh; and high lactate and poortreatment produced poor qualityflesh.
14
In some cases, there was excellentcorrelation between pH of muscletissue and quality of tuna flesh(Table 5) while in other instanceslower pH could not be correlatedwith poor quality flesh (Table 6,Fig. 4). These differences are probably due to differing temperaturesand durations before auction(Nakamura et al., 1977).
'Quality was determined histologically and wasscored as follows: 1 = Excellent, 2 = good, 3 =marginal, 4 = poor, and 5 = very poor.'Excellent = stared in ice water at 0 'C, fair = storedin refrigerators at 5 'C, and poor = stared at ambienttemperature of 28 ·C.
No significant correlations werefound between deep body temperatures and quality of fish or results ofbiochemical tests. Nor could signifi-
Marine Fisheries Review

60 0
•• •
•0>'- CV>., B"0 AE::t
0> 2.!:: 0"00
>-E- 30 • 0
0::>
C-;~ 30
"0 •E 20
~
~::>
::2' 410
6.0
Average pH
5.55'----'-------------__-'-_-'
353010 15 20 25
Catching time (minutes)
50'---"'---'-----'----'---'---"'---'o
Figure 3.-Correlation between catching time (fightingtime) and muscle lactate at off-loading. Line fitted byleast squares methods.
Figure 4.-Correlation between pH and auction quality(1 = excellent, 2 = good, 3 = marginal,4 = poor, and5 = very poor) of: A) all fish sampled, B) fish sampledon 28 July, C) Honolulu fish sampled on 10 August, andD) Hilo fish sampled on 10 August.
Honolulu fish
Mlds Tail Mids Tail Mids Tall
Table 6.-Quallty and pH 01 mldaactlona end talla 01yellowtln tuna at the Honolulu and Hllo tlah auctlona,10 Auguat 1978.
5.6 5.6 5.5 5.6 6.0 5.55.6 5.7 5.7 5.7 5.9 5.85.9 5.9 5.6 5.75.6 5.75.7 5.8
Mean 5.68 5.74 5.60 5.67 5.95 5.65Variance 0.2 0.01 0.01 0.00 0.08 0.02
PoorGood
Tuna quality
Excellent
Tabl. 5.-Quallty and pH ot mldaactlona and talla 01 yallowlln tuna at tha HonoluluIlah auction, 28 July 1978.
Tuna quality
Excellent Good Marginal Poor Very Poor
Mids Tall Mlds Tall Mlds Tall Mlds Tall Mids Tall
6.0 6.1 6.0 6.2 5.6 5.7 5.6 5.6 5.4 5.56.0 6.0 5.9 5.6 5.7 5.8 5.5 5.66.0 5.7 5.9 5.9 5.8 5.9 5.7 5.85.8 5.9 5.8 5.9 5.7 5.96.0 5.6 5.6 5.75.8 6.05.9 6.0
Mean 5.93 5.90 5.90 5.90 5.68 5.78 5.53 5.63Variance 0.01 0.03 0.01 0.06 0.01 0.02 0.03 0.03
cant correlations be found betweenthe pre-chill interval and quality offish or results of biochemical testsof blood and tissues.
Histopathologic studies of musclefrom a limited number of fishrevealed the following: 1) Inflammatory changes were not seen, suggesting that all changes occurred
shortly before or immediately afterdeath; 2) edema was seen in muscleobtained at the time of boating;3) extensive edema and musculardegeneration were seen in burnt fishat the time of auctioning; and4) tissue gram stain showed thatbacteria was associated with themuscular degenerative changes.
5.86.0
Mean 5.90Variance 0.02
Hilo fish
5.9 5.8 5.85.9 5.7 5.8
5.9 5.95.7 5.85.9 5.96.0 6.05.8 5.86.0 6.06.0 6.16.0 5.96.1 6.15.9 5.9
5.90 5.90 5.920.00 0.02 0.01
5.7 5.85.9 5.8
5.80 5.800.02 0.00
June 1981, 43(6) 15
Discussion
As suspected by tuna fishermen,the results of this study suggest thatthe care and handling of fish afterbeing caught is partly related to thesubsequent quality of the flesh ofthe tuna (Table 4). However, thepathogenesis of burnt tuna may alsobe related to physiological changesin the fish during the struggle whilebeing caught. Fighting time wasrelated to blood lactate and glucoselevels at death (Fig. 1, 2). Theedema (abnormal accumulation offluid) in muscle seen in histopathological studies of biopsies obtainedat death also suggest that the struggle of fish being caught maypredispose the flesh to subsequentdegeneration. The lack of inflammatory changes at that time indicates that the condition is notdeveloped prior to being hooked.
A hypothesis on the mechanismfor the development of burnt tuna isas follows.
1) The struggle of fish while being caught may result in muscleedema, the severity depending onthe intensity of the struggle. (Longerand more intensive struggling resultsin higher blood levels of glucose andlactate.)
2) The edema fluid of muscle presents a good medium for bacterialgrowth.
16
3) Chilling of fish after catchingdetermines the temperature of thedeeper portions of the fish muscles,which are least affected by externalcooling procedures.
4) Poor chilling procedures allowhigher temperatures in muscle,allowing bacteria to grow more profusely and resulting in increasingdegrees of burn in the deeper areasof the muscle mass.
The most reliable diagnosticmethod may be histopathologic examination of biopsy specimens obtained from deep muscle tissues,flash frozen, sectioned with acryostat at the auction, stained andexamined. All of this can be accomplished in 0.5-1 hour. With theexception of tests made on bloodsamples collected at the time ofcatching, biochemical tests were notuseful in prediction and diagnosingthe burnt tuna condition of unquartered tuna.
A stress-induced abnormalitywhich occurs in hog muscle knownas porcine stress syndrome (Winstanley, 1979) seems similar in somecharacteristics to burnt tuna. Bothconditions result in pale and softmuscles. It is possible that there maybe related causes for the two conditions.
It is obvious that further studieson burnt tuna are necessary. Thesmall number of fish sampled in this
study (12) resulted in possible leadsand solutions, but precludes strongand definitive statements on thiscondition. It is likely that improvedhandling and chilling proceduresfrom the time of capture may helpto reduce the incidence of burnttuna.
Acknowledgments
This research was funded by aNational Marine Fisheries Servicecontract. Technical assistance andlaboratory space were provided bythe University of Hawaii (Manoa),University of British Columbia, andthe NMFS Southwest FisheriesCenter's Honolulu Laboratory. Expertise in fishing and fish handling,without which this study could nothave been completed, were providedby fish wholesalers and fishermen inHilo, Kona, and Honolulu, Hawaii.
Literature Cited
Bergmeyer, H. U. 1974. Methods of enzymatic analysis. 2:437, 787. Acad. Press.,N.Y.
Nakamura, K., Y. Fujii, and S. Ishikawa.1977. Turbid meat of tuna - I. Study on itspossible causes. Bull. Tokai Reg. Fish.Res. Lab. 90.
Snedecor, G. W., and W. G. Cochran.1967. Statistical methods. Iowa StateUniv. Press, Ames, 593 p.
Winstanley, M. 1979. A cure for stress.New Sci. 84:594-596.
Yuen, H. S. H. 1979. A night handlinefishery for tunas in Hawaii. Mar. Fish.Rev. 41(8):7-14.
Marine Fisheries Review
Related Documents