Open Access Available online http://ccforum.com/content/11/4/R90 Page 1 of 11 (page number not for citation purposes) Vol 11 No 4 Research Burn size determines the inflammatory and hypermetabolic response Marc G Jeschke 1,2 , Ronald P Mlcak 1 , Celeste C Finnerty 1,2 , William B Norbury 1 , Gerd G Gauglitz 1,2 , Gabriela A Kulp 1 and David N Herndon 1,2 1 Shriners Hospitals for Children, 815 Market Street, Galveston, TX 77550, USA 2 Department of Surgery, University Texas Medical Branch, Galveston, TX, 77550 USA Corresponding author: Marc G Jeschke, [email protected] Received: 31 Jan 2007 Revisions requested: 2 Mar 2007 Revisions received: 20 Apr 2007 Accepted: 23 Aug 2007 Published: 23 Aug 2007 Critical Care 2007, 11:R90 (doi:10.1186/cc6102) This article is online at: http://ccforum.com/content/11/4/R90 © 2007 Jeschke et al.; licensee BioMed Central Ltd. This is an open access article distributed under the terms of the Creative Commons Attribution License (http://creativecommons.org/licenses/by/2.0 ), which permits unrestricted use, distribution, and reproduction in any medium, provided the original work is properly cited. Abstract Background Increased burn size leads to increased mortality of burned patients. Whether mortality is due to inflammation, hypermetabolism or other pathophysiologic contributing factors is not entirely determined. The purpose of the present study was to determine in a large prospective clinical trial whether different burn sizes are associated with differences in inflammation, body composition, protein synthesis, or organ function. Methods Pediatric burned patients were divided into four burn size groups: <40% total body surface area (TBSA) burn, 40– 59% TBSA burn, 60–79% TBSA burn, and >80% TBSA burn. Demographic and clinical data, hypermetabolism, the inflammatory response, body composition, the muscle protein net balance, serum and urine hormones and proteins, and cardiac function and changes in liver size were determined. Results One hundred and eighty-nine pediatric patients of similar age and gender distribution were included in the study (<40% TBSA burn, n = 43; 40–59% TBSA burn, n = 79; 60– 79% TBSA burn, n = 46; >80% TBSA burn, n = 21). Patients with larger burns had more operations, a greater incidence of infections and sepsis, and higher mortality rates compared with the other groups (P < 0.05). The percentage predicted resting energy expenditure was highest in the >80% TBSA group, followed by the 60–79% TBSA burn group (P < 0.05). Children with >80% burns lost the most body weight, lean body mass, muscle protein and bone mineral content (P < 0.05). The urine cortisol concentration was highest in the 80–99% and 60–79% TBSA burn groups, associated with significant myocardial depression and increased change in liver size (P < 0.05). The cytokine profile showed distinct differences in expression of IL- 8, TNF, IL-6, IL-12p70, monocyte chemoattractant protein-1 and granulocyte–macrophage colony-stimulating factor (P < 0.05). Conclusion Morbidity and mortality in burned patients is burn size dependent, starts at a 60% TBSA burn and is due to an increased hypermetabolic and inflammatory reaction, along with impaired cardiac function. Introduction The stress response to burn injury is similar to severe trauma or critical care but differs in its severity and duration. The inflammatory response starts immediately after trauma and persists for almost 5 weeks postburn [1]. The hypermetabolic response after a major burn is characterized by a hyperdy- namic response with increased body temperature, increased oxygen and glucose consumption, increased CO 2 production, increased glycogenolysis, increased proteolysis, increased lipolysis, and increased futile substrate cycling [2]. This response begins on the fifth day postinjury and continues up to 24 months postburn, causing the loss of lean body mass, the loss of bone density, muscle weakness, and poor wound healing [2-4]. The increased metabolic requirements cause tis- sue catabolism, leading to nitrogen loss and a potentially lethal depletion of essential protein stores [5]. The energy require- ments are met by the mobilization of proteins and amino acids. Increased protein turnover, degradation and negative nitrogen balance are all characteristic of this severe critical illness [2,5]. As a consequence, the structure and function of essential ELISA = enzyme-linked immunosorbent assay; IFN = interferon; IGF-I = insulin growth factor-I; IL = interleukin; REE = resting energy expenditure; TBSA = total body surface area; TNF = tumor necrosis factor.

Welcome message from author
This document is posted to help you gain knowledge. Please leave a comment to let me know what you think about it! Share it to your friends and learn new things together.
Transcript
Available online http://ccforum.com/content/11/4/R90
Open AccessVol 11 No 4ResearchBurn size determines the inflammatory and hypermetabolic responseMarc G Jeschke1,2, Ronald P Mlcak1, Celeste C Finnerty1,2, William B Norbury1, Gerd G Gauglitz1,2, Gabriela A Kulp1 and David N Herndon1,2
1Shriners Hospitals for Children, 815 Market Street, Galveston, TX 77550, USA2Department of Surgery, University Texas Medical Branch, Galveston, TX, 77550 USA
Corresponding author: Marc G Jeschke, [email protected]
Received: 31 Jan 2007 Revisions requested: 2 Mar 2007 Revisions received: 20 Apr 2007 Accepted: 23 Aug 2007 Published: 23 Aug 2007
Critical Care 2007, 11:R90 (doi:10.1186/cc6102)This article is online at: http://ccforum.com/content/11/4/R90© 2007 Jeschke et al.; licensee BioMed Central Ltd. This is an open access article distributed under the terms of the Creative Commons Attribution License (http://creativecommons.org/licenses/by/2.0), which permits unrestricted use, distribution, and reproduction in any medium, provided the original work is properly cited.
Abstract
Background Increased burn size leads to increased mortality ofburned patients. Whether mortality is due to inflammation,hypermetabolism or other pathophysiologic contributing factorsis not entirely determined. The purpose of the present study wasto determine in a large prospective clinical trial whether differentburn sizes are associated with differences in inflammation, bodycomposition, protein synthesis, or organ function.
Methods Pediatric burned patients were divided into four burnsize groups: <40% total body surface area (TBSA) burn, 40–59% TBSA burn, 60–79% TBSA burn, and >80% TBSA burn.Demographic and clinical data, hypermetabolism, theinflammatory response, body composition, the muscle proteinnet balance, serum and urine hormones and proteins, andcardiac function and changes in liver size were determined.
Results One hundred and eighty-nine pediatric patients ofsimilar age and gender distribution were included in the study(<40% TBSA burn, n = 43; 40–59% TBSA burn, n = 79; 60–79% TBSA burn, n = 46; >80% TBSA burn, n = 21). Patients
with larger burns had more operations, a greater incidence ofinfections and sepsis, and higher mortality rates compared withthe other groups (P < 0.05). The percentage predicted restingenergy expenditure was highest in the >80% TBSA group,followed by the 60–79% TBSA burn group (P < 0.05). Childrenwith >80% burns lost the most body weight, lean body mass,muscle protein and bone mineral content (P < 0.05). The urinecortisol concentration was highest in the 80–99% and 60–79%TBSA burn groups, associated with significant myocardialdepression and increased change in liver size (P < 0.05). Thecytokine profile showed distinct differences in expression of IL-8, TNF, IL-6, IL-12p70, monocyte chemoattractant protein-1 andgranulocyte–macrophage colony-stimulating factor (P < 0.05).
Conclusion Morbidity and mortality in burned patients is burnsize dependent, starts at a 60% TBSA burn and is due to anincreased hypermetabolic and inflammatory reaction, along withimpaired cardiac function.
IntroductionThe stress response to burn injury is similar to severe traumaor critical care but differs in its severity and duration. Theinflammatory response starts immediately after trauma andpersists for almost 5 weeks postburn [1]. The hypermetabolicresponse after a major burn is characterized by a hyperdy-namic response with increased body temperature, increasedoxygen and glucose consumption, increased CO2 production,increased glycogenolysis, increased proteolysis, increasedlipolysis, and increased futile substrate cycling [2]. This
response begins on the fifth day postinjury and continues upto 24 months postburn, causing the loss of lean body mass,the loss of bone density, muscle weakness, and poor woundhealing [2-4]. The increased metabolic requirements cause tis-sue catabolism, leading to nitrogen loss and a potentially lethaldepletion of essential protein stores [5]. The energy require-ments are met by the mobilization of proteins and amino acids.Increased protein turnover, degradation and negative nitrogenbalance are all characteristic of this severe critical illness [2,5].As a consequence, the structure and function of essential
Page 1 of 11(page number not for citation purposes)
ELISA = enzyme-linked immunosorbent assay; IFN = interferon; IGF-I = insulin growth factor-I; IL = interleukin; REE = resting energy expenditure; TBSA = total body surface area; TNF = tumor necrosis factor.
Critical Care Vol 11 No 4 Jeschke et al.
organs, such as the heart, the liver, skeletal muscle, the skin,the immune system and cellular membrane transport func-tions, are compromised [6-8].
Numerous studies show that an increased burn size leads toincreased mortality of burned patients [9,10]. Furthermore, itwas speculated that the burn size determines the extent of thehypermetabolic response. Whether mortality is due to inflam-mation, hypermetabolism or other pathophysiologic contribut-ing factors is not entirely determined. The purpose of thepresent study was to determine in a large prospective clinicaltrial whether different burn sizes are associated with differ-ences in inflammation, in body composition, in protein synthe-sis, and in organ function.
Patients and methodsParticipantsAll thermally injured children over a time period of 9 years whowere admitted to our burns unit and required at least one sur-gical intervention were included in the study. Patients wereresuscitated according to the Galveston formula usingRinger's lactate. Within 48 hours of admission all patientsunderwent total burn wound excision, in which the woundswere covered with the available autograft skin and an allograftwas used to cover any remaining open areas. After the firstoperative procedure it was 5–10 days until the donor site washealed, and patients were then taken back to the operatingtheater. The skin graft procedure was repeated until all openwound areas were covered with autologous skin material.
All patients underwent the same nutritional treatment to astandardized protocol. We used the Galveston formulas –Galveston Infant, Galveston Revised, and Galveston Adoles-cent. The formula changes with age based on the body sur-face alterations that occur with growth. The intake isapproximately calculated as 1,500 kcal/m2 body surface area+ 1,500 kcal/m2 area burn. The composition of the nutritionalsupplement is also important. The optimal dietary compositioncontains 1–2 g/kg/day protein, which provides a calorie-to-nitrogen ratio of approximately 100:1 with the suggestedcaloric intakes. Nonprotein calories can be given either as car-bohydrate or as fat, with clinical advantages for the carbohy-drates. The diet was delivered by enteral nutrition, if possible,in all our patients. Total parenteral nutrition was only used as asupplemental form of nutrition when the calculated intakecould not be achieved.
Patient demographics (age, date of burn and admission, sex,burn size and depth of burn) and concomitant injuries, such asinhalation injury, sepsis, morbidity and mortality, wererecorded. Sepsis was defined as a blood culture identifyingthe pathogen during hospitalization or at autopsy, in combina-tion with leucocytosis or leucopenia, hyperthermia or hypo-thermia, and tachycardia. Wound healing was evaluated from
the time of donor site healing, and therefore from the timebetween operative interventions.
Indirect calorimetryAs part of our routine clinical practice, all patients underwentresting energy expenditure (REE) measurements within 1week following hospital admission, at 2–4 weeks after hospitaladmission, at discharge, and at 6 months postburn. Measure-ments of REE were performed between midnight and 5:00 amwhile the patients were asleep and receiving continuous feed-ing. The REE was measured using a Sensor-Medics Vmax 29metabolic cart (Sensor-Medics, Yorba Linda, CA, USA). Sub-jects were tested in a supine position while under a large,clear, ventilated hood. The REE was calculated from the oxy-gen consumption and carbon dioxide production using equa-tions described by Weir [11] All REE measurements weremade at ambient temperatures of 30°C, which is the standardenvironmental setting for all patient rooms in our acute burnintensive care unit.
The REE measurements were used to guide nutritional man-agement and to assess the level of metabolism. The dischargeREE measurement was used to determine the level of hyper-metabolism when the burn wounds were 95% healed and wasincluded as part of the study. Measured values were com-pared with predicted norms based upon the Harris–Benedictequation [12]. The REE studies were repeated at 6, 9 and 12months postburn when the patients returned for outpatientsurgery. Assessments of the REE at these time points werecompleted utilizing the methodology and environmental set-tings as described above. For statistical comparison, energyexpenditure was expressed both as the absolute REE and asthe percentage of the basal metabolic rate predicted by theHarris–Benedict equation.
Muscle protein net balanceThe muscle protein net balance was calculated from the prod-uct of the amino acid concentration difference and the bloodflow, as previously published [13-16].
Body compositionThe height and the body weight were determined clinically 5days after admission and at discharge. The total body leanmass, fat, bone mineral density, and bone mineral contentwere measured by dual-energy X-ray absorptiometry. TheHologic model QDR-4500W DEXA (Hologic Inc., Waltham,MA, USA) was used to measure the body composition. Tominimize systematic deviations, the Hologic system was cali-brated daily against a spinal phantom in the anteroposterior,lateral, and single-beam modes. Individual pixels were cali-brated against a tissue bar phantom to determine whether thepixel was reading bone, fat, lean tissue, or air. Plain anterior–posterior and lateral tibia–fibula X-rays were taken of eachsubject at each follow-up period to evaluate for possible
Page 2 of 11(page number not for citation purposes)

Available online http://ccforum.com/content/11/4/R90
premature closure of epiphyseal plates induced by anabolicagents.
Serum hormones, proteins, and cytokinesBlood or urine was collected from the burn patients at the timeof admission, preoperatively, and 5 days postoperatively for 4weeks for serum hormone, protein, cytokine and urine hor-mone analysis. Blood was drawn in a serum-separator collec-tion tube (BD, Franklin Lakes, NJ, USA) and was centrifugedfor 10 minutes at 1,300 × g. The serum was then removed andstored at -70°C until assayed.
Serum hormones and acute phase proteins were determinedusing high-performance liquid chromatography and ELISAtechniques. The Bio-Plex Human Cytokine 17-Plex panel wasused with the Bio-Plex Suspension Array System (Bio-Rad,Hercules, CA, USA) to profile expression of 17 inflammatorymediators: IL-1β, IL-2, IL-4, IL-5, IL-6, IL-7, IL-8, IL-10, IL-12p70, IL-13, IL-17, granulocyte colony-stimulating factor,granulocyte–macrophage colony-stimulating factor, IFNγ,monocyte chemoattractant protein-1, macrophage inflamma-tory protein-1β, and TNF. The assay was performed accordingto the manufacturer's instructions. Briefly, serum sampleswere thawed and then centrifuged at 1,300 × g for 3 minutesat 4°C. Serum samples were then incubated with microbeadslabeled with specific antibodies to one of the aforementionedcytokines for 30 minutes. Following a washing step, the beadswere incubated with the detection antibody cocktail (eachantibody specific to a single cytokine). After another washingstep, the beads were incubated with streptavidin–phycoeryth-rin for 10 minutes, were washed again, and the concentrationsof each cytokine were then determined using the array reader.
Urine cortisol was determined by standard laboratory tech-niques, measuring for the urine amount, creatinine and creati-nine clearance.
Liver and cardiac changesUltrasound measurements in this study were made with theHP Sonos 100 CF echocardiogram (Hewlett Packard ImagingSystems, Andover, MA, USA). To obtain the ultrasound liverweight, a 3.5 MHz transducer was placed directly below themidline of the rib cage on the right upper quadrant on a verticalline running through the right nipple with the patient in thesupine position. Once the liver was visualized, measurementswere made by scanning in a plane perpendicular to the baseof the liver. The base of the liver, as well as the free edgehepatic dome, was marked on the display screen and the dis-tance between these two points was automatically measured.
The formula used for estimating the liver weight from the singlelongitudinal scan along the right nipple line was weight =(1.15 l)3d, where l3 represents the volume of a cube cut in halfdiagonally to visualize the approximate shape of the normalliver in situ. A factor of 1.15 was used to correct for the portion
of the liver (15%) lateral to the left nipple line and representingthe most inferior point of the liver. This correction was esti-mated from the liver at autopsy. The density (d) of the liver wasmeasured on several sections by water displacement. Deter-mining the right nipple line was not problematic unless the nip-ple was obliterated by a severe burn to the thorax. In thesecases an approximation was made and recorded as such. Theactual size was then compared with the predicted size.
M-mode echocardiograms were completed as follows. At thetime of the study, none of the patients presented with or previ-ously suffered from other concomitant diseases affecting car-diac function, such as diabetes mellitus, coronary arterydisease, longstanding hypertension, or hyperthyroidism. Thestudy variables included the resting cardiac output, the car-diac index, the stroke volume, the resting heart rate and the leftventricular ejection fraction. The stroke volume and cardiacoutput were adjusted for body surface area and wereexpressed as indexes. All ultrasound measurements weremade with the Sonosite Titan echocardiogram, with a 3.5 MHztransducer. Recordings were performed with the subjects in asupine position and breathing freely. M-mode tracings wereobtained at the level of the tips of the mitral leaflets in the par-asternal long axis position and measurements were performedaccording to the American Society of Echocardiography rec-ommendations. Left ventricular volumes determined at enddiastole and end systole were used to calculate the ejectionfraction, the stroke volume, the resting cardiac output and thecardiac index. Three measurements were performed and aver-aged for data analysis.
Ethics and statisticsThe study was reviewed and approved by the InstitutionalReview Board of the University Texas Medical Branch, Galve-ston, TX, USA. Prior to the study, each subject, parent orchild's legal guardian signed a written informed consent form.Analysis of variance with post-hoc Bonferroni correction,paired and unpaired Student's t tests, chi-square analysis, andMann–Whitney tests were used. Data are expressed as themean ± standard deviation in the tables or as the mean ±standard error of the mean in the figures. Significance wasaccepted at P < 0.05.
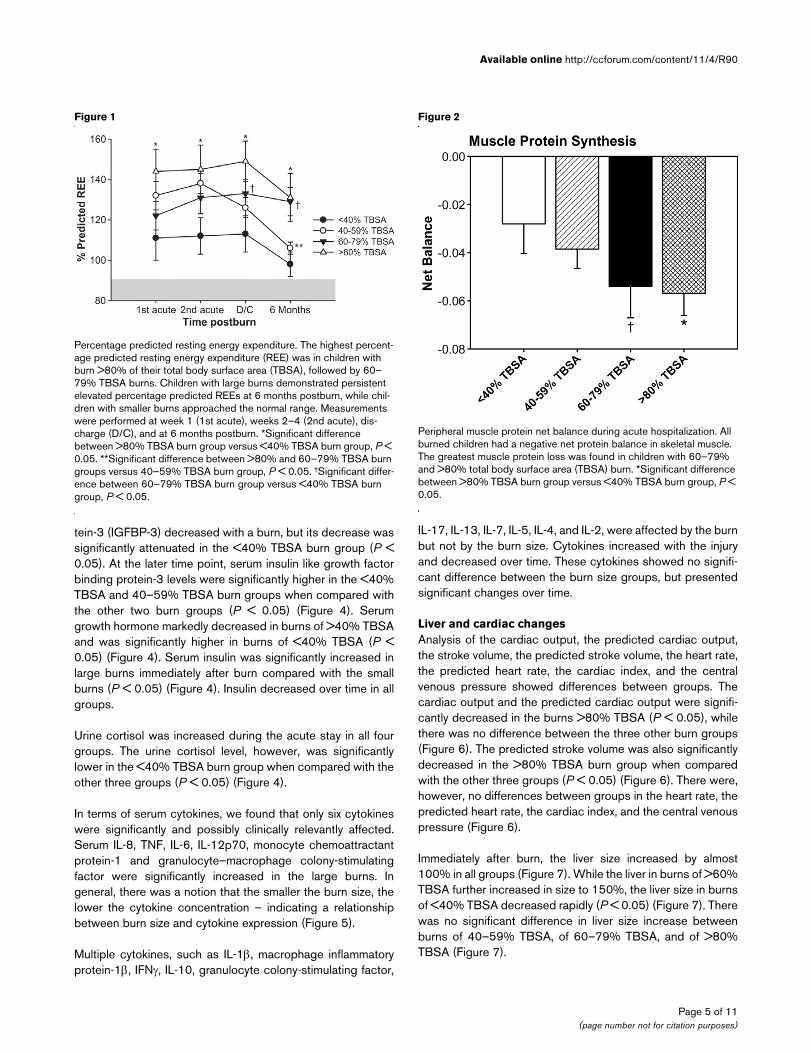
ResultsDemographicsOne hundred and eighty-nine severely burned children wereincluded in the present study. The patients' demographics arepresented in Table 1. There was no significant difference inage and in the gender distribution between the different burnsizes (Table 1).
The average time from burn to hospital admission was signifi-cantly shorter in the >80% TBSA burn group and in the 60–79% TBSA burn group when compared with the other twogroups (P < 0.05) (Table 1). The length of hospital stay was
Page 3 of 11(page number not for citation purposes)
Critical Care Vol 11 No 4 Jeschke et al.
shortest in the <40% TBSA burn group, followed by the 40–59% TBSA burn group, and was longest in the large burn sizegroups (60–79% and >80% TBSA burn groups, respectively)(P < 0.05) (Table 1). Similarly, the length of stay divided by theburn size was longest in the >80% TBSA burn group, followedby the 60–79% TBSA burn group (P < 0.05). There was nodifference between the <40% TBSA burn group and the 40–59% TBSA burn group. The number of operations was great-est in the larger burn groups followed by the 60–79% TBSA,40–59% TBSA and <40% TBSA required the least amount ofsurgeries. The >80% TBSA burn group had significantly morepatients with an inhalation injury and ventilator requirementcompared with the other three groups (P < 0.05). Similarly,infection, sepsis and mortality was highest in the large burnsgroup, followed by the 60–79% TBSA burn group and thenthe other two smaller burn groups (P < 0.05).
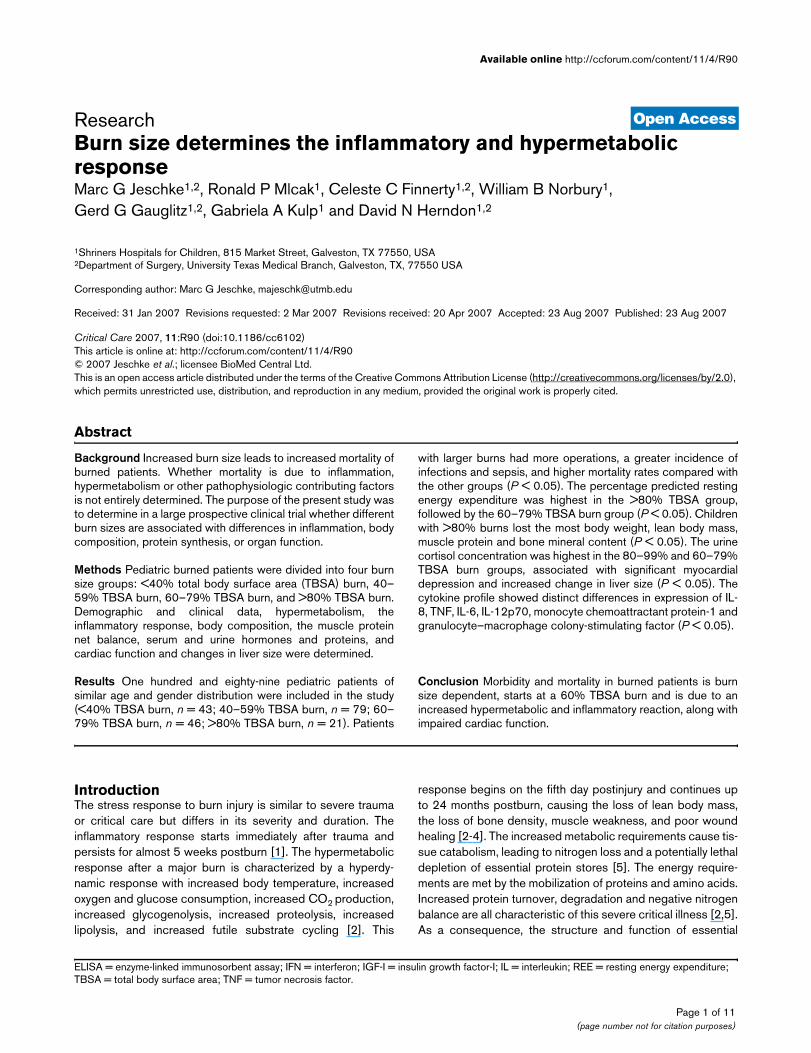
Indirect calorimetryThe percentage predicted REE was significantly differentbetween the four groups. Children suffering from burns of<40% TBSA had only a slight increase in the percentage pre-dicted REE and returned to the normal range at 6 monthspostburn (Figure 1). Children with 40–59% TBSA burn and60–79% TBSA burn had a significantly increased percentagepredicted REE compared with children with <40% TBSAburns (P < 0.05) (Figure 1). The highest percentage predictedREE was in children with burns of >80% TBSA (P < 0.05)(Figure 1). Children with large burns demonstrated persistentelevated percentage predicted REEs at 6 months postburn(Figure 1). This indicates persistent hypermetabolism in chil-
dren with burns of >60% TBSA at least up to 6 monthspostburn.
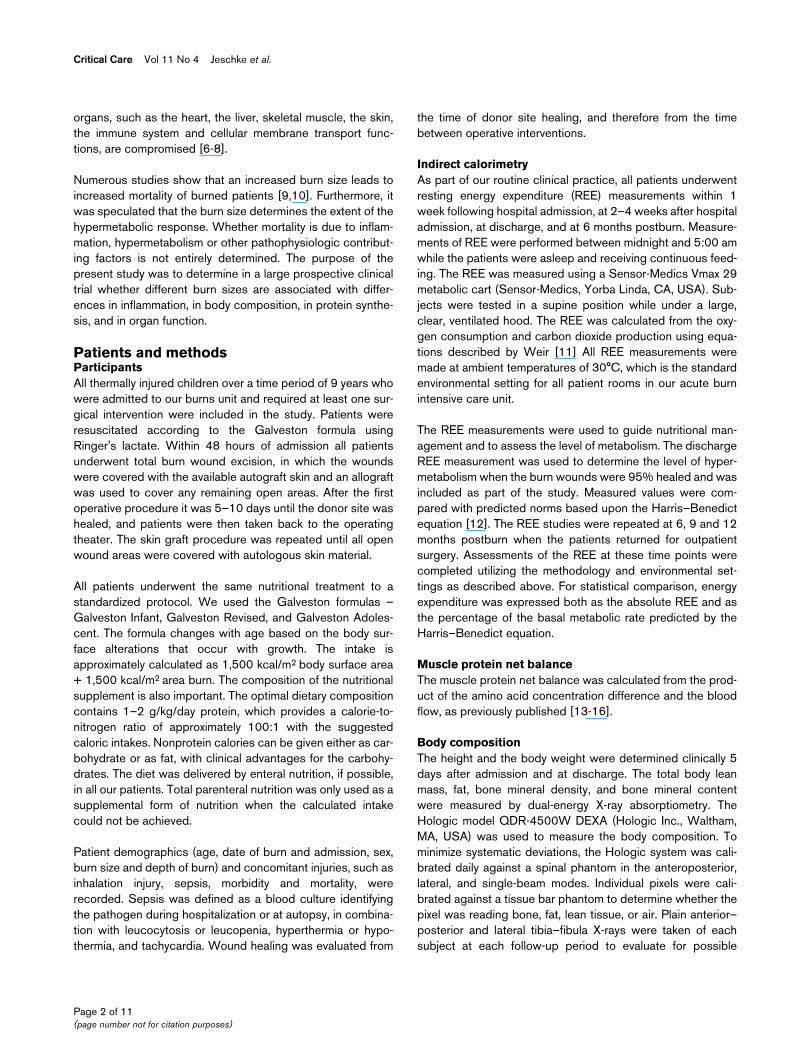
Peripheral muscle protein net balanceAll burned children had a negative net protein balance in skel-etal muscle. The greatest muscle protein loss was found inchildren with 60–79% TBSA burns and >80% TBSA burns,indicating increased hypermetabolism and catabolism inpatients sustaining a burn of >60% TBSA (P < 0.05) (Figure2).
Body compositionThere were distinct differences in body composition betweenthe four burn groups. Children with >80% TBSA burns lostthe most body weight, lean body mass and bone mineral con-tent compared with the other groups (P < 0.05) (Figure 3).The 60–79% TBSA burn group showed a significant loss inbody weight, lean body mass, and bone mineral content thatwas significant compared with the <40% and 40–59% TBSAburn groups (P < 0.05) (Figure 3). The <40% and 40–59%TBSA burn groups presented almost no loss of body weight,of lean body mass, and of bone mineral content (Figure 3).
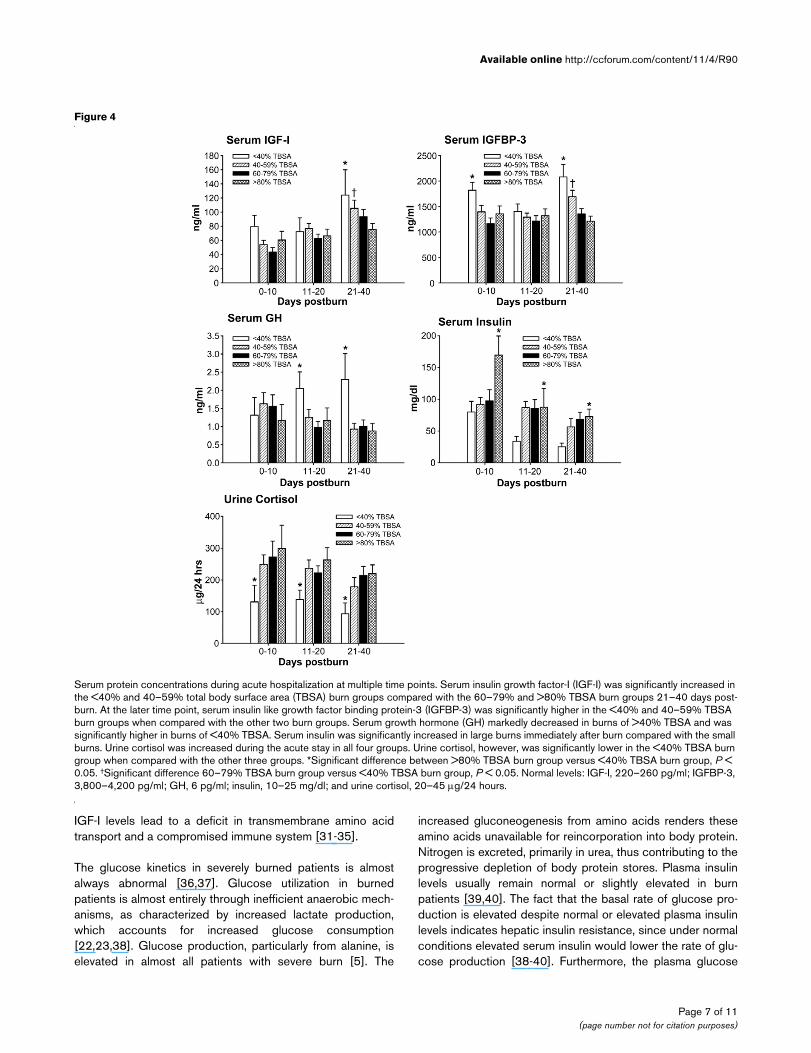
Serum hormones, proteins and cytokinesSerum insulin growth factor-I (IGF-I) decreased immediatelyafter burn in all four groups (Figure 4). In the <40% TBSA and40–59% TBSA burn groups, serum IGF-I increased over timeand was significantly increased compared with the 60–79%and >80% TBSA burn groups 21–40 days postburn (P <0.05) (Figure 4). Serum insulin like growth factor binding pro-
Table 1
Patient demographics
<40% TBSA burn group (n = 43)
40–59% TBSA burn group (n = 79)
60–79% TBSA burn group (n = 46)
>80% TBSA burn group (n = 21)
Age (years) 7.3 ± 0.8 7.9 ± 0.8 7.4 ± 0.7 8.8 ± 1.3
Gender (female/male) 19/24 31/48 19/27 7/14
Time to admission (days) 9 ± 2 7 ± 1 6 ± 1† 3 ± 1*
Length of stay (days) 20 ± 2 26 ± 2 45 ± 5† 70 ± 12*
TBSA (%) 34 ± 1 50 ± 1** 70 ± 1† 87 ± 1*
Third-degree burn (%) 24 ± 2 36 ± 2** 60 ± 2† 75 ± 5*
Length of stay/% TBSA (days/%) 0.55 ± 0.05 0.53 ± 0.03 0.64 ± 0.05† 0.79 ± 0.13*
Operations (n) 2 ± 0.2 3 ± 0.2 6 ± 0.5† 8 ± 1*
Inhalation injury (%) 30 28 46 71*
Ventilator (%) 0 10 15† 35*
Infection (%) 5 18 15 19*
Sepsis (%) 0 5 24† 38*
Mortality (%) 0 0 13† 29*
Data presented as the mean ± standard deviation or percentage. TBSA, total body surface area. * Significant difference between the >80% TBSA burn group compared with the <40% and 40–59% TBSA burn groups (P < 0.05). **Significant difference between 40–59% TBSA versus <40% TBSA burn group, P < 0.05. †Significant difference between the 60–79% TBSA burn group compared with the <40% and 40–59% TBSA burn groups (P < 0.05).
Page 4 of 11(page number not for citation purposes)
Available online http://ccforum.com/content/11/4/R90
tein-3 (IGFBP-3) decreased with a burn, but its decrease wassignificantly attenuated in the <40% TBSA burn group (P <0.05). At the later time point, serum insulin like growth factorbinding protein-3 levels were significantly higher in the <40%TBSA and 40–59% TBSA burn groups when compared withthe other two burn groups (P < 0.05) (Figure 4). Serumgrowth hormone markedly decreased in burns of >40% TBSAand was significantly higher in burns of <40% TBSA (P <0.05) (Figure 4). Serum insulin was significantly increased inlarge burns immediately after burn compared with the smallburns (P < 0.05) (Figure 4). Insulin decreased over time in allgroups.
Urine cortisol was increased during the acute stay in all fourgroups. The urine cortisol level, however, was significantlylower in the <40% TBSA burn group when compared with theother three groups (P < 0.05) (Figure 4).
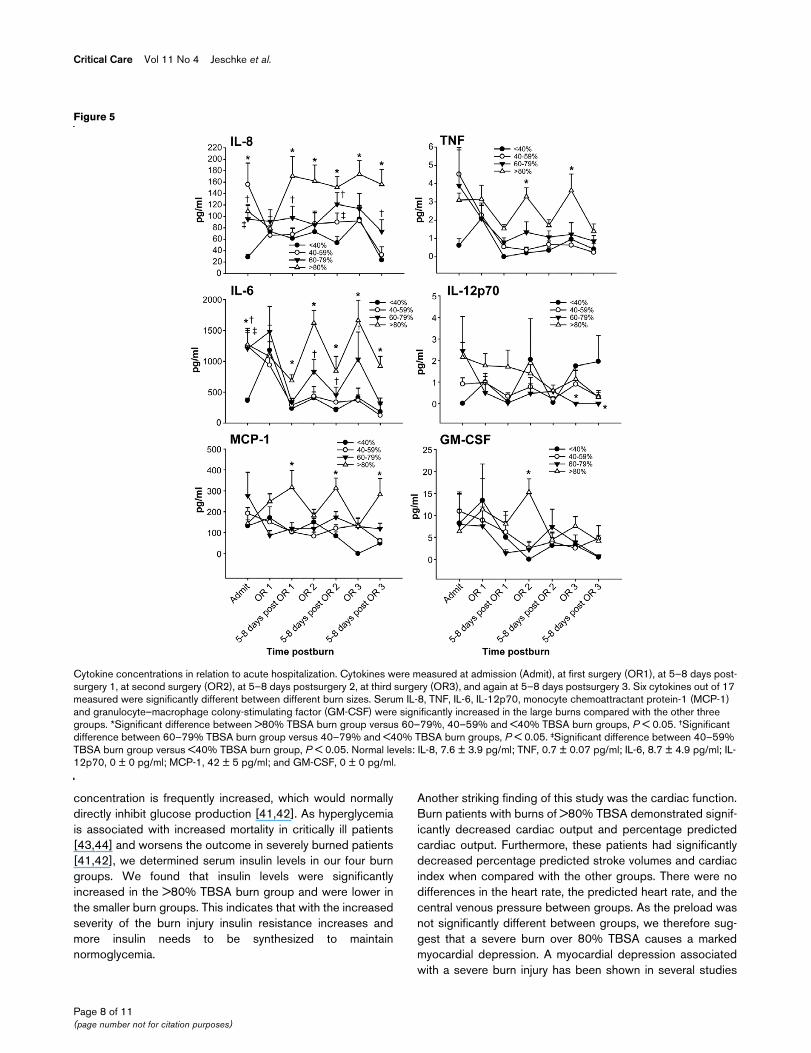
In terms of serum cytokines, we found that only six cytokineswere significantly and possibly clinically relevantly affected.Serum IL-8, TNF, IL-6, IL-12p70, monocyte chemoattractantprotein-1 and granulocyte–macrophage colony-stimulatingfactor were significantly increased in the large burns. Ingeneral, there was a notion that the smaller the burn size, thelower the cytokine concentration – indicating a relationshipbetween burn size and cytokine expression (Figure 5).
Multiple cytokines, such as IL-1β, macrophage inflammatoryprotein-1β, IFNγ, IL-10, granulocyte colony-stimulating factor,
IL-17, IL-13, IL-7, IL-5, IL-4, and IL-2, were affected by the burnbut not by the burn size. Cytokines increased with the injuryand decreased over time. These cytokines showed no signifi-cant difference between the burn size groups, but presentedsignificant changes over time.
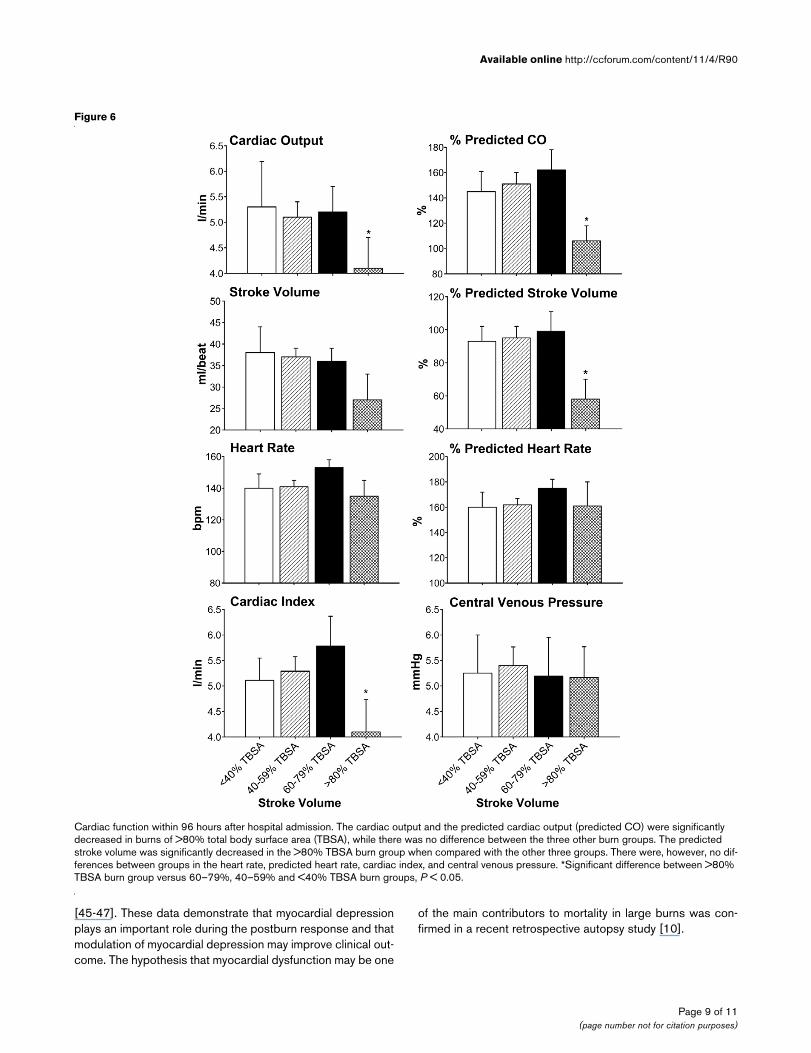
Liver and cardiac changesAnalysis of the cardiac output, the predicted cardiac output,the stroke volume, the predicted stroke volume, the heart rate,the predicted heart rate, the cardiac index, and the centralvenous pressure showed differences between groups. Thecardiac output and the predicted cardiac output were signifi-cantly decreased in the burns >80% TBSA (P < 0.05), whilethere was no difference between the three other burn groups(Figure 6). The predicted stroke volume was also significantlydecreased in the >80% TBSA burn group when comparedwith the other three groups (P < 0.05) (Figure 6). There were,however, no differences between groups in the heart rate, thepredicted heart rate, the cardiac index, and the central venouspressure (Figure 6).
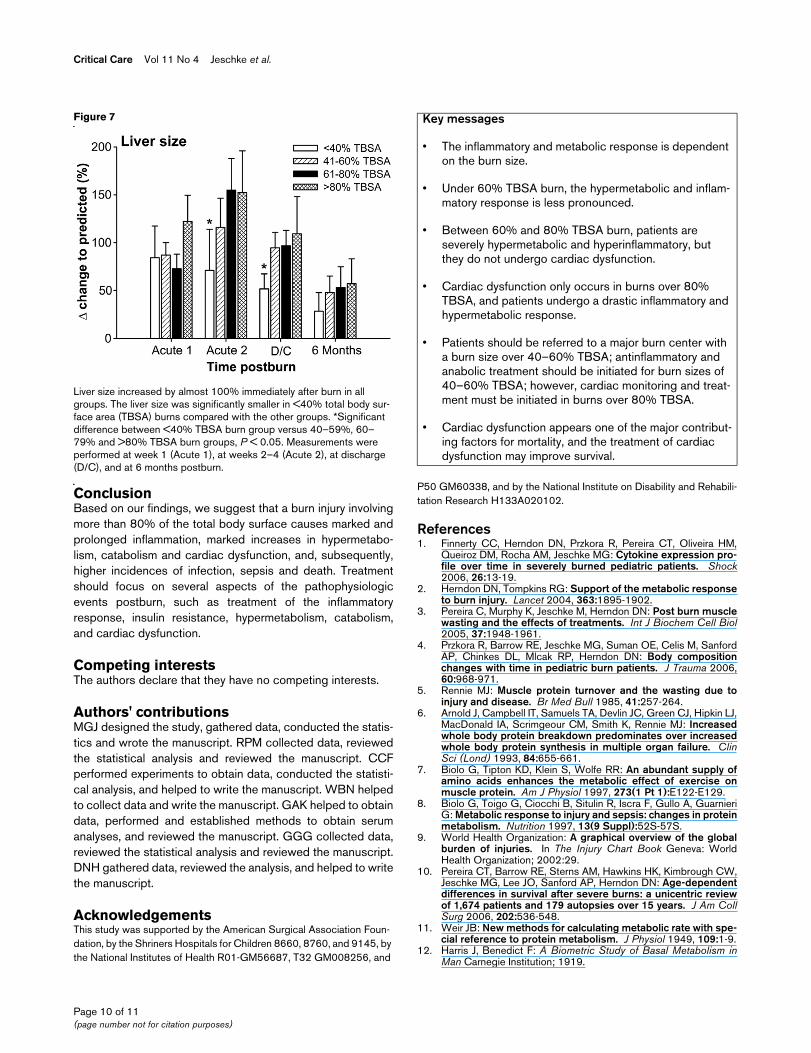
Immediately after burn, the liver size increased by almost100% in all groups (Figure 7). While the liver in burns of >60%TBSA further increased in size to 150%, the liver size in burnsof <40% TBSA decreased rapidly (P < 0.05) (Figure 7). Therewas no significant difference in liver size increase betweenburns of 40–59% TBSA, of 60–79% TBSA, and of >80%TBSA (Figure 7).
Figure 1
Percentage predicted resting energy expenditurePercentage predicted resting energy expenditure. The highest percent-age predicted resting energy expenditure (REE) was in children with burn >80% of their total body surface area (TBSA), followed by 60–79% TBSA burns. Children with large burns demonstrated persistent elevated percentage predicted REEs at 6 months postburn, while chil-dren with smaller burns approached the normal range. Measurements were performed at week 1 (1st acute), weeks 2–4 (2nd acute), dis-charge (D/C), and at 6 months postburn. *Significant difference between >80% TBSA burn group versus <40% TBSA burn group, P < 0.05. **Significant difference between >80% and 60–79% TBSA burn groups versus 40–59% TBSA burn group, P < 0.05. †Significant differ-ence between 60–79% TBSA burn group versus <40% TBSA burn group, P < 0.05.
Figure 2
Peripheral muscle protein net balance during acute hospitalizationPeripheral muscle protein net balance during acute hospitalization. All burned children had a negative net protein balance in skeletal muscle. The greatest muscle protein loss was found in children with 60–79% and >80% total body surface area (TBSA) burn. *Significant difference between >80% TBSA burn group versus <40% TBSA burn group, P < 0.05.
Page 5 of 11(page number not for citation purposes)

Critical Care Vol 11 No 4 Jeschke et al.
DiscussionThe metabolic rate in burns is extremely high, and energyrequirements are immense and are met by the mobilization ofproteins and amino acids [5]. As a consequence, the structureand function of essential organs such as skeletal muscle, skin,immune system, and cellular membrane transport functionsare compromised [17-19]. Catecholamines involved in thehypermetabolic response to burn injury are released fromsympathetic nerve ends and the adrenal medulla, and areraised two-fold to 10-fold in proportion to the burn size [20-23]. In the present study, by comparing four different burnsizes, we showed that an increase in burn size is associatedwith increased hypermetabolism, with persistent inflammation,with catabolism, with changes in body composition, withincreased stress hormone production, and with organ dys-function. Whether the correlation between these phenomenaand burn size is linear was not determined, but we clearlyobserved these pathophysiologic changes with increasedburn size.
Large burns cause a marked increase in inflammation and cat-echolamines, which leads to an increased metabolic rate. Inthe present study, we found that smaller burn injuries demon-strated decreased catecholamine and stress hormone levelsthat were associated with decreased hypermetabolism andcatabolism. Smaller burns had significantly decreased andshortened predicted REE, body weight loss, and net muscleprotein balance when compared with the larger burns. Furtherindicators that smaller burns are less hypermetabolic thanlarger burns are decreased acute stress hormones andincreased anabolic hormones. Catecholamines, cytokines andproinflammatory mediators are known to block, and thereforedecrease, endogenous anabolic agents via cellular mediators[24,25].
We showed in the present study that patients with large burnsdemonstrate a different cytokine expression profile comparedwith patients with smaller burn injuries. Patients with burnsover 80% TBSA had persistent and marked increased levelsof IL-8, IL-6, monocyte chemoattractant protein-1 and TNF. Allof these cytokines are proinflammatory and enhance catabo-lism and hypermetabolism via hyperinflammation. We there-fore suggest that these high levels of proinflammatory cellmediator trigger and enhance the hypermetabolic responsewith increased stress hormones and protein catabolism. Onthe other hand, lower inflammation and hypermetabolism wasassociated with higher endogenous anabolic hormone levels.Patients with smaller burns had lower inflammatory marker andstress hormones, which was associated with higher IGF-I,insulin like growth factor binding protein-3 and growth hor-mone levels. IGF-I was shown to exert anabolic effects on skel-etal muscle protein synthesis, to attenuate the hepatic acutephase response, and to improve dermal and epidermal regen-eration [26-30]. Furthermore, decreased growth hormone and
Figure 3
Change in body composition from admission to dischargeChange in body composition from admission to discharge. Children with >80% total body surface area (TBSA) burn lost the most body weight, lean body mass and bone mineral content compared with the other groups. The 60–79% TBSA burn group showed a significant loss in body weight, lean body mass and bone mineral content that was sig-nificant compared with the <40% and 40–59% TBSA groups. The <40% and 40–59% TBSA burn groups had almost no loss in body weight, lean body mass and bone mineral content. *Significant differ-ence between >80% TBSA burn group versus <40% TBSA burn group, P < 0.05. †Significant difference 60–79% TBSA burn group ver-sus <40% TBSA burn group, P < 0.05.
Page 6 of 11(page number not for citation purposes)
Available online http://ccforum.com/content/11/4/R90
IGF-I levels lead to a deficit in transmembrane amino acidtransport and a compromised immune system [31-35].
The glucose kinetics in severely burned patients is almostalways abnormal [36,37]. Glucose utilization in burnedpatients is almost entirely through inefficient anaerobic mech-anisms, as characterized by increased lactate production,which accounts for increased glucose consumption[22,23,38]. Glucose production, particularly from alanine, iselevated in almost all patients with severe burn [5]. The
increased gluconeogenesis from amino acids renders theseamino acids unavailable for reincorporation into body protein.Nitrogen is excreted, primarily in urea, thus contributing to theprogressive depletion of body protein stores. Plasma insulinlevels usually remain normal or slightly elevated in burnpatients [39,40]. The fact that the basal rate of glucose pro-duction is elevated despite normal or elevated plasma insulinlevels indicates hepatic insulin resistance, since under normalconditions elevated serum insulin would lower the rate of glu-cose production [38-40]. Furthermore, the plasma glucose
Figure 4
Serum protein concentrations during acute hospitalization at multiple time pointsSerum protein concentrations during acute hospitalization at multiple time points. Serum insulin growth factor-I (IGF-I) was significantly increased in the <40% and 40–59% total body surface area (TBSA) burn groups compared with the 60–79% and >80% TBSA burn groups 21–40 days post-burn. At the later time point, serum insulin like growth factor binding protein-3 (IGFBP-3) was significantly higher in the <40% and 40–59% TBSA burn groups when compared with the other two burn groups. Serum growth hormone (GH) markedly decreased in burns of >40% TBSA and was significantly higher in burns of <40% TBSA. Serum insulin was significantly increased in large burns immediately after burn compared with the small burns. Urine cortisol was increased during the acute stay in all four groups. Urine cortisol, however, was significantly lower in the <40% TBSA burn group when compared with the other three groups. *Significant difference between >80% TBSA burn group versus <40% TBSA burn group, P < 0.05. †Significant difference 60–79% TBSA burn group versus <40% TBSA burn group, P < 0.05. Normal levels: IGF-I, 220–260 pg/ml; IGFBP-3, 3,800–4,200 pg/ml; GH, 6 pg/ml; insulin, 10–25 mg/dl; and urine cortisol, 20–45 μg/24 hours.
Page 7 of 11(page number not for citation purposes)
Critical Care Vol 11 No 4 Jeschke et al.
concentration is frequently increased, which would normallydirectly inhibit glucose production [41,42]. As hyperglycemiais associated with increased mortality in critically ill patients[43,44] and worsens the outcome in severely burned patients[41,42], we determined serum insulin levels in our four burngroups. We found that insulin levels were significantlyincreased in the >80% TBSA burn group and were lower inthe smaller burn groups. This indicates that with the increasedseverity of the burn injury insulin resistance increases andmore insulin needs to be synthesized to maintainnormoglycemia.
Another striking finding of this study was the cardiac function.Burn patients with burns of >80% TBSA demonstrated signif-icantly decreased cardiac output and percentage predictedcardiac output. Furthermore, these patients had significantlydecreased percentage predicted stroke volumes and cardiacindex when compared with the other groups. There were nodifferences in the heart rate, the predicted heart rate, and thecentral venous pressure between groups. As the preload wasnot significantly different between groups, we therefore sug-gest that a severe burn over 80% TBSA causes a markedmyocardial depression. A myocardial depression associatedwith a severe burn injury has been shown in several studies
Figure 5
Cytokine concentrations in relation to acute hospitalizationCytokine concentrations in relation to acute hospitalization. Cytokines were measured at admission (Admit), at first surgery (OR1), at 5–8 days post-surgery 1, at second surgery (OR2), at 5–8 days postsurgery 2, at third surgery (OR3), and again at 5–8 days postsurgery 3. Six cytokines out of 17 measured were significantly different between different burn sizes. Serum IL-8, TNF, IL-6, IL-12p70, monocyte chemoattractant protein-1 (MCP-1) and granulocyte–macrophage colony-stimulating factor (GM-CSF) were significantly increased in the large burns compared with the other three groups. *Significant difference between >80% TBSA burn group versus 60–79%, 40–59% and <40% TBSA burn groups, P < 0.05. †Significant difference between 60–79% TBSA burn group versus 40–79% and <40% TBSA burn groups, P < 0.05. ‡Significant difference between 40–59% TBSA burn group versus <40% TBSA burn group, P < 0.05. Normal levels: IL-8, 7.6 ± 3.9 pg/ml; TNF, 0.7 ± 0.07 pg/ml; IL-6, 8.7 ± 4.9 pg/ml; IL-12p70, 0 ± 0 pg/ml; MCP-1, 42 ± 5 pg/ml; and GM-CSF, 0 ± 0 pg/ml.
Page 8 of 11(page number not for citation purposes)
Available online http://ccforum.com/content/11/4/R90
[45-47]. These data demonstrate that myocardial depressionplays an important role during the postburn response and thatmodulation of myocardial depression may improve clinical out-come. The hypothesis that myocardial dysfunction may be one
of the main contributors to mortality in large burns was con-firmed in a recent retrospective autopsy study [10].
Figure 6
Cardiac function within 96 hours after hospital admissionCardiac function within 96 hours after hospital admission. The cardiac output and the predicted cardiac output (predicted CO) were significantly decreased in burns of >80% total body surface area (TBSA), while there was no difference between the three other burn groups. The predicted stroke volume was significantly decreased in the >80% TBSA burn group when compared with the other three groups. There were, however, no dif-ferences between groups in the heart rate, predicted heart rate, cardiac index, and central venous pressure. *Significant difference between >80% TBSA burn group versus 60–79%, 40–59% and <40% TBSA burn groups, P < 0.05.
Page 9 of 11(page number not for citation purposes)
Critical Care Vol 11 No 4 Jeschke et al.
ConclusionBased on our findings, we suggest that a burn injury involvingmore than 80% of the total body surface causes marked andprolonged inflammation, marked increases in hypermetabo-lism, catabolism and cardiac dysfunction, and, subsequently,higher incidences of infection, sepsis and death. Treatmentshould focus on several aspects of the pathophysiologicevents postburn, such as treatment of the inflammatoryresponse, insulin resistance, hypermetabolism, catabolism,and cardiac dysfunction.
Competing interestsThe authors declare that they have no competing interests.
Authors' contributionsMGJ designed the study, gathered data, conducted the statis-tics and wrote the manuscript. RPM collected data, reviewedthe statistical analysis and reviewed the manuscript. CCFperformed experiments to obtain data, conducted the statisti-cal analysis, and helped to write the manuscript. WBN helpedto collect data and write the manuscript. GAK helped to obtaindata, performed and established methods to obtain serumanalyses, and reviewed the manuscript. GGG collected data,reviewed the statistical analysis and reviewed the manuscript.DNH gathered data, reviewed the analysis, and helped to writethe manuscript.
AcknowledgementsThis study was supported by the American Surgical Association Foun-dation, by the Shriners Hospitals for Children 8660, 8760, and 9145, by the National Institutes of Health R01-GM56687, T32 GM008256, and
P50 GM60338, and by the National Institute on Disability and Rehabili-tation Research H133A020102.
References1. Finnerty CC, Herndon DN, Przkora R, Pereira CT, Oliveira HM,
Queiroz DM, Rocha AM, Jeschke MG: Cytokine expression pro-file over time in severely burned pediatric patients. Shock2006, 26:13-19.
2. Herndon DN, Tompkins RG: Support of the metabolic responseto burn injury. Lancet 2004, 363:1895-1902.
3. Pereira C, Murphy K, Jeschke M, Herndon DN: Post burn musclewasting and the effects of treatments. Int J Biochem Cell Biol2005, 37:1948-1961.
4. Przkora R, Barrow RE, Jeschke MG, Suman OE, Celis M, SanfordAP, Chinkes DL, Mlcak RP, Herndon DN: Body compositionchanges with time in pediatric burn patients. J Trauma 2006,60:968-971.
5. Rennie MJ: Muscle protein turnover and the wasting due toinjury and disease. Br Med Bull 1985, 41:257-264.
6. Arnold J, Campbell IT, Samuels TA, Devlin JC, Green CJ, Hipkin LJ,MacDonald IA, Scrimgeour CM, Smith K, Rennie MJ: Increasedwhole body protein breakdown predominates over increasedwhole body protein synthesis in multiple organ failure. ClinSci (Lond) 1993, 84:655-661.
7. Biolo G, Tipton KD, Klein S, Wolfe RR: An abundant supply ofamino acids enhances the metabolic effect of exercise onmuscle protein. Am J Physiol 1997, 273(1 Pt 1):E122-E129.
8. Biolo G, Toigo G, Ciocchi B, Situlin R, Iscra F, Gullo A, GuarnieriG: Metabolic response to injury and sepsis: changes in proteinmetabolism. Nutrition 1997, 13(9 Suppl):52S-57S.
9. World Health Organization: A graphical overview of the globalburden of injuries. In The Injury Chart Book Geneva: WorldHealth Organization; 2002:29.
10. Pereira CT, Barrow RE, Sterns AM, Hawkins HK, Kimbrough CW,Jeschke MG, Lee JO, Sanford AP, Herndon DN: Age-dependentdifferences in survival after severe burns: a unicentric reviewof 1,674 patients and 179 autopsies over 15 years. J Am CollSurg 2006, 202:536-548.
11. Weir JB: New methods for calculating metabolic rate with spe-cial reference to protein metabolism. J Physiol 1949, 109:1-9.
12. Harris J, Benedict F: A Biometric Study of Basal Metabolism inMan Carnegie Institution; 1919.
Figure 7
Liver size increased by almost 100% immediately after burn in all groupsLiver size increased by almost 100% immediately after burn in all groups. The liver size was significantly smaller in <40% total body sur-face area (TBSA) burns compared with the other groups. *Significant difference between <40% TBSA burn group versus 40–59%, 60–79% and >80% TBSA burn groups, P < 0.05. Measurements were performed at week 1 (Acute 1), at weeks 2–4 (Acute 2), at discharge (D/C), and at 6 months postburn.
Key messages
• The inflammatory and metabolic response is dependent on the burn size.
• Under 60% TBSA burn, the hypermetabolic and inflam-matory response is less pronounced.
• Between 60% and 80% TBSA burn, patients are severely hypermetabolic and hyperinflammatory, but they do not undergo cardiac dysfunction.
• Cardiac dysfunction only occurs in burns over 80% TBSA, and patients undergo a drastic inflammatory and hypermetabolic response.
• Patients should be referred to a major burn center with a burn size over 40–60% TBSA; antinflammatory and anabolic treatment should be initiated for burn sizes of 40–60% TBSA; however, cardiac monitoring and treat-ment must be initiated in burns over 80% TBSA.
• Cardiac dysfunction appears one of the major contribut-ing factors for mortality, and the treatment of cardiac dysfunction may improve survival.
Page 10 of 11(page number not for citation purposes)
http://www.ncbi.nlm.nih.gov/entrez/query.fcgi?cmd=Retrieve&db=PubMed&dopt=Abstract&list_uids=3896381
http://www.ncbi.nlm.nih.gov/entrez/query.fcgi?cmd=Retrieve&db=PubMed&dopt=Abstract&list_uids=3896381
http://www.ncbi.nlm.nih.gov/entrez/query.fcgi?cmd=Retrieve&db=PubMed&dopt=Abstract&list_uids=8334812
http://www.ncbi.nlm.nih.gov/entrez/query.fcgi?cmd=Retrieve&db=PubMed&dopt=Abstract&list_uids=8334812
http://www.ncbi.nlm.nih.gov/entrez/query.fcgi?cmd=Retrieve&db=PubMed&dopt=Abstract&list_uids=8334812
http://www.ncbi.nlm.nih.gov/entrez/query.fcgi?cmd=Retrieve&db=PubMed&dopt=Abstract&list_uids=9252488
http://www.ncbi.nlm.nih.gov/entrez/query.fcgi?cmd=Retrieve&db=PubMed&dopt=Abstract&list_uids=9252488
http://www.ncbi.nlm.nih.gov/entrez/query.fcgi?cmd=Retrieve&db=PubMed&dopt=Abstract&list_uids=9252488
http://www.ncbi.nlm.nih.gov/entrez/query.fcgi?cmd=Retrieve&db=PubMed&dopt=Abstract&list_uids=9290110
Available online http://ccforum.com/content/11/4/R90
13. Wolfe RR, Chinkes DL: Principles and Practice of Kinetic AnalysisNJ: Wiley-Liss; 2005.
14. Hart DW, Wolf SE, Chinkes DL, Gore DC, Mlcak RP, BeaufordRB, Obeng MK, Lal S, Gold WF, Wolfe RR, et al.: Determinantsof skeletal muscle catabolism after severe burn. Ann Surg2000, 232:455-465.
15. Hart DW, Wolf SE, Herndon DN, Chinkes DL, Lal SO, Obeng MK,Beauford RB, Mlcak RR: Energy expenditure and caloric bal-ance after burn: increased feeding leads to fat rather than leanmass accretion. Ann Surg 2002, 235:152-161.
16. Hart DW, Wolf SE, Zhang XJ, Chinkes DL, Buffalo MC, Matin SI,DebRoy MA, Wolfe RR, Herndon DN: Efficacy of a high-carbo-hydrate diet in catabolic illness. Crit Care Med 2001,29:1318-1324.
17. Biolo G, Fleming RY, Maggi SP, Wolfe RR: Transmembranetransport and intracellular kinetics of amino acids in humanskeletal muscle. Am J Physiol 1995, 268(1 Pt 1):E75-E84.
18. Biolo G, Maggi SP, Williams BD, Tipton KD, Wolfe RR: Increasedrates of muscle protein turnover and amino acid transportafter resistance exercise in humans. Am J Physiol 1995, 268(3Pt 1):E514-E520.
19. Biolo G, Wolfe RR: Relationship between plasma amino acidkinetics and tissue protein synthesis and breakdown. Pro-ceedings of the IFAC Symposium on Modeling Control in Biolog-ical Systems 1994:358-359.
20. Goodall M, Stone C, Haynes BW Jr: Urinary output of adrenalineand noradrenaline in severe thermal burns. Ann Surg 1957,145:479-487.
21. Goodall MG: Sympathetic nerve and adrenal medullaryresponse to thermal burn. Clinical analysis of adrenaline andnoradrenaline depletion. Am Surg 1966, 32:448-452.
22. Wilmore DW: Hormonal responses and their effect onmetabolism. Surg Clin North Am 1976, 56:999-1018.
23. Wilmore DW, Long JM, Mason AD Jr, Skreen RW, Pruitt BA Jr:Catecholamines: mediator of the hypermetabolic response tothermal injury. Ann Surg 1974, 180:653-669.
24. Delhanty PJ: Interleukin-1 beta suppresses growth hormone-induced acid-labile subunit mRNA levels and secretion in pri-mary hepatocytes. Biochem Biophys Res Commun 1998,243:269-272.
25. Wang G, Lee HM, Englander E, Greeley GH Jr: Ghrelin – not justanother stomach hormone. Regul Pept 2002, 105:75-81.
26. Debroy MA, Wolf SE, Zhang XJ, Chinkes DL, Ferrando AA, WolfeRR, Herndon DN: Anabolic effects of insulin-like growth factorin combination with insulin-like growth factor binding protein-3 in severely burned adults. J Trauma 1999, 47:904-911.
27. Herndon DN, Ramzy PI, DebRoy MA, Zheng M, Ferrando AA,Chinkes DL, Barret JP, Wolfe RR, Wolf SE: Muscle protein catab-olism after severe burn: effects of IGF-1/IGFBP-3 treatment.Ann Surg 1999, 229:713-722.
28. Jeschke MG, Barrow RE, Suzuki F, Rai J, Benjamin D, HerndonDN: IGF-I/IGFBP-3 equilibrates ratios of pro- to anti-inflamma-tory cytokines, which are predictors for organ function inseverely burned pediatric patients. Mol Med 2002, 8:238-246.
29. Jeschke MG, Herndon DN, Barrow RE: Insulin-like growth factorI in combination with insulin-like growth factor binding protein3 affects the hepatic acute phase response and hepatic mor-phology in thermally injured rats. Ann Surg 2000,231:408-416.
30. Jeschke MG, Herndon DN, Vita R, Traber DL, Jauch KW, BarrowRE: IGF-I/BP-3 administration preserves hepatic homeostasisafter thermal injury which is associated with increases in noand hepatic NF-kappa B. Shock 2001, 16:373-379.
31. Binoux M: The IGF system in metabolism regulation. DiabeteMetab 1995, 21:330-337.
32. Ericsson A, Hamark B, Jansson N, Johansson BR, Powell TL, Jans-son T: Hormonal regulation of glucose and system A aminoacid transport in first trimester placental villous fragments. AmJ Physiol Regul Integr Comp Physiol 2005, 288:R656-R662.
33. Inoue Y, Copeland EM, Souba WW: Growth hormone enhancesamino acid uptake by the human small intestine. Ann Surg1994, 219:715-724.
34. Inoue Y, Fallon W, Souba WW: Growth hormone attenuatesNa(+)-dependent hepatic amino acid transport in endotox-emic rats. J Trauma 1993, 35:605-612.
35. Pacitti AJ, Inoue Y, Plumley DA, Copeland EM, Souba WW:Growth hormone regulates amino acid transport in human andrat liver. Ann Surg 1992, 216:353-362.
36. Demling RH, DeSanti L: Effect of a hypocaloric diet, increasedprotein intake and resistance training on lean mass gains andfat mass loss in overweight police officers. Ann Nutr Metab2000, 44:21-29.
37. Demling RH, Seigne P: Metabolic management of patients withsevere burns. World J Surg 2000, 24:673-680.
38. Gore DC, Ferrando A, Barnett J, Wolf SE, Desai M, Herndon DN,Goodwin C, Wolfe RR: Influence of glucose kinetics on plasmalactate concentration and energy expenditure in severelyburned patients. J Trauma 2000, 49:673-678.
39. Wolfe RR, Nadel ER, Shaw JH, Stephenson LA, Wolfe MH: Roleof changes in insulin and glucagon in glucose homeostasis inexercise. J Clin Invest 1986, 77:900-907.
40. Wolfe RR, Shaw JH, Jahoor F, Herndon DN, Wolfe MH: Responseto glucose infusion in humans: role of changes in insulinconcentration. Am J Physiol 1986, 250(3 Pt 1):E306-E311.
41. Gore DC, Chinkes D, Heggers J, Herndon DN, Wolf SE, Desai M:Association of hyperglycemia with increased mortality aftersevere burn injury. J Trauma 2001, 51:540-544.
42. Gore DC, Chinkes DL, Hart DW, Wolf SE, Herndon DN, SanfordAP: Hyperglycemia exacerbates muscle protein catabolism inburn-injured patients. Crit Care Med 2002, 30:2438-2442.
43. Van den Berghe G, Wilmer A, Hermans G, Meersseman W, Wout-ers PJ, Milants I, Van Wijngaerden E, Bobbaers H, Bouillon R:Intensive insulin therapy in the medical ICU. N Engl J Med2006, 354:449-461.
44. van den Berghe G, Wouters P, Weekers F, Verwaest C, Bruyn-inckx F, Schetz M, Vlasselaers D, Ferdinande P, Lauwers P, Bouil-lon R: Intensive insulin therapy in the critically ill patients. NEngl J Med 2001, 345:1359-1367.
45. Sambol JT, White J, Horton JW, Deitch EA: Burn-induced impair-ment of cardiac contractile function is due to gut-derived fac-tors transported in mesenteric lymph. Shock 2002,18:272-276.
46. Willis MS, Carlson DL, Dimaio JM, White MD, White DJ, AdamsGAt, Horton JW, Giroir BP: Macrophage migration inhibitoryfactor mediates late cardiac dysfunction after burn injury. AmJ Physiol Heart Circ Physiol 2005, 288:H795-H804.
47. Yang J, Yang Z, Chen F: Myocardial contractile and calciumtransport function after severe burn injury. Zhonghua ZhengXing Shao Shang Wai Ke Za Zhi 1998, 14:211-213.
Page 11 of 11(page number not for citation purposes)
http://www.ncbi.nlm.nih.gov/entrez/query.fcgi?cmd=Retrieve&db=PubMed&dopt=Abstract&list_uids=7840186
http://www.ncbi.nlm.nih.gov/entrez/query.fcgi?cmd=Retrieve&db=PubMed&dopt=Abstract&list_uids=7840186
http://www.ncbi.nlm.nih.gov/entrez/query.fcgi?cmd=Retrieve&db=PubMed&dopt=Abstract&list_uids=7840186
http://www.ncbi.nlm.nih.gov/entrez/query.fcgi?cmd=Retrieve&db=PubMed&dopt=Abstract&list_uids=7900797
http://www.ncbi.nlm.nih.gov/entrez/query.fcgi?cmd=Retrieve&db=PubMed&dopt=Abstract&list_uids=7900797
http://www.ncbi.nlm.nih.gov/entrez/query.fcgi?cmd=Retrieve&db=PubMed&dopt=Abstract&list_uids=7900797
http://www.ncbi.nlm.nih.gov/entrez/query.fcgi?cmd=Retrieve&db=PubMed&dopt=Abstract&list_uids=5938617
http://www.ncbi.nlm.nih.gov/entrez/query.fcgi?cmd=Retrieve&db=PubMed&dopt=Abstract&list_uids=5938617
http://www.ncbi.nlm.nih.gov/entrez/query.fcgi?cmd=Retrieve&db=PubMed&dopt=Abstract&list_uids=5938617
http://www.ncbi.nlm.nih.gov/entrez/query.fcgi?cmd=Retrieve&db=PubMed&dopt=Abstract&list_uids=4412350
http://www.ncbi.nlm.nih.gov/entrez/query.fcgi?cmd=Retrieve&db=PubMed&dopt=Abstract&list_uids=4412350
http://www.ncbi.nlm.nih.gov/entrez/query.fcgi?cmd=Retrieve&db=PubMed&dopt=Abstract&list_uids=4412350
http://www.ncbi.nlm.nih.gov/entrez/query.fcgi?cmd=Retrieve&db=PubMed&dopt=Abstract&list_uids=9473516
http://www.ncbi.nlm.nih.gov/entrez/query.fcgi?cmd=Retrieve&db=PubMed&dopt=Abstract&list_uids=9473516
http://www.ncbi.nlm.nih.gov/entrez/query.fcgi?cmd=Retrieve&db=PubMed&dopt=Abstract&list_uids=9473516
http://www.ncbi.nlm.nih.gov/entrez/query.fcgi?cmd=Retrieve&db=PubMed&dopt=Abstract&list_uids=8586149
http://www.ncbi.nlm.nih.gov/entrez/query.fcgi?cmd=Retrieve&db=PubMed&dopt=Abstract&list_uids=8203982
http://www.ncbi.nlm.nih.gov/entrez/query.fcgi?cmd=Retrieve&db=PubMed&dopt=Abstract&list_uids=8203982
http://www.ncbi.nlm.nih.gov/entrez/query.fcgi?cmd=Retrieve&db=PubMed&dopt=Abstract&list_uids=8411286
http://www.ncbi.nlm.nih.gov/entrez/query.fcgi?cmd=Retrieve&db=PubMed&dopt=Abstract&list_uids=8411286
http://www.ncbi.nlm.nih.gov/entrez/query.fcgi?cmd=Retrieve&db=PubMed&dopt=Abstract&list_uids=8411286
http://www.ncbi.nlm.nih.gov/entrez/query.fcgi?cmd=Retrieve&db=PubMed&dopt=Abstract&list_uids=1329681
http://www.ncbi.nlm.nih.gov/entrez/query.fcgi?cmd=Retrieve&db=PubMed&dopt=Abstract&list_uids=1329681
http://www.ncbi.nlm.nih.gov/entrez/query.fcgi?cmd=Retrieve&db=PubMed&dopt=Abstract&list_uids=1329681
http://www.ncbi.nlm.nih.gov/entrez/query.fcgi?cmd=Retrieve&db=PubMed&dopt=Abstract&list_uids=2869053
http://www.ncbi.nlm.nih.gov/entrez/query.fcgi?cmd=Retrieve&db=PubMed&dopt=Abstract&list_uids=2869053
http://www.ncbi.nlm.nih.gov/entrez/query.fcgi?cmd=Retrieve&db=PubMed&dopt=Abstract&list_uids=2869053
http://www.ncbi.nlm.nih.gov/entrez/query.fcgi?cmd=Retrieve&db=PubMed&dopt=Abstract&list_uids=2869694
http://www.ncbi.nlm.nih.gov/entrez/query.fcgi?cmd=Retrieve&db=PubMed&dopt=Abstract&list_uids=2869694
Related Documents