============================================================================ GUAM CONSUMER PRICE INDEX 2nd QUARTER 2012 Cost of Living Section VOL. XXXVIII, No. 2 ______________________________________________________________________________________ Bureau of Statistics and Plans Business and Economic Statistics Program Government of Guam THOMAS A. MORRISON DIRECTOR ALBERT M. PEREZ CHIEF ECONOMIST SELINA C. TENORIO STATISTICIAN II HEATHER R. PEREZ DATA CONTROL CLERK II MERNALEE A. SABLAN STATISTICAL TECHNICIAN I

Welcome message from author
This document is posted to help you gain knowledge. Please leave a comment to let me know what you think about it! Share it to your friends and learn new things together.
Transcript
============================================================================
GUAM CONSUMER PRICE INDEX
2nd QUARTER 2012
Cost of Living Section VOL. XXXVIII, No. 2 ______________________________________________________________________________________
Bureau of Statistics and Plans Business and Economic Statistics Program
Government of Guam
THOMAS A. MORRISON DIRECTOR
ALBERT M. PEREZ CHIEF ECONOMIST
SELINA C. TENORIO
STATISTICIAN II
HEATHER R. PEREZ DATA CONTROL CLERK II
MERNALEE A. SABLAN
STATISTICAL TECHNICIAN I
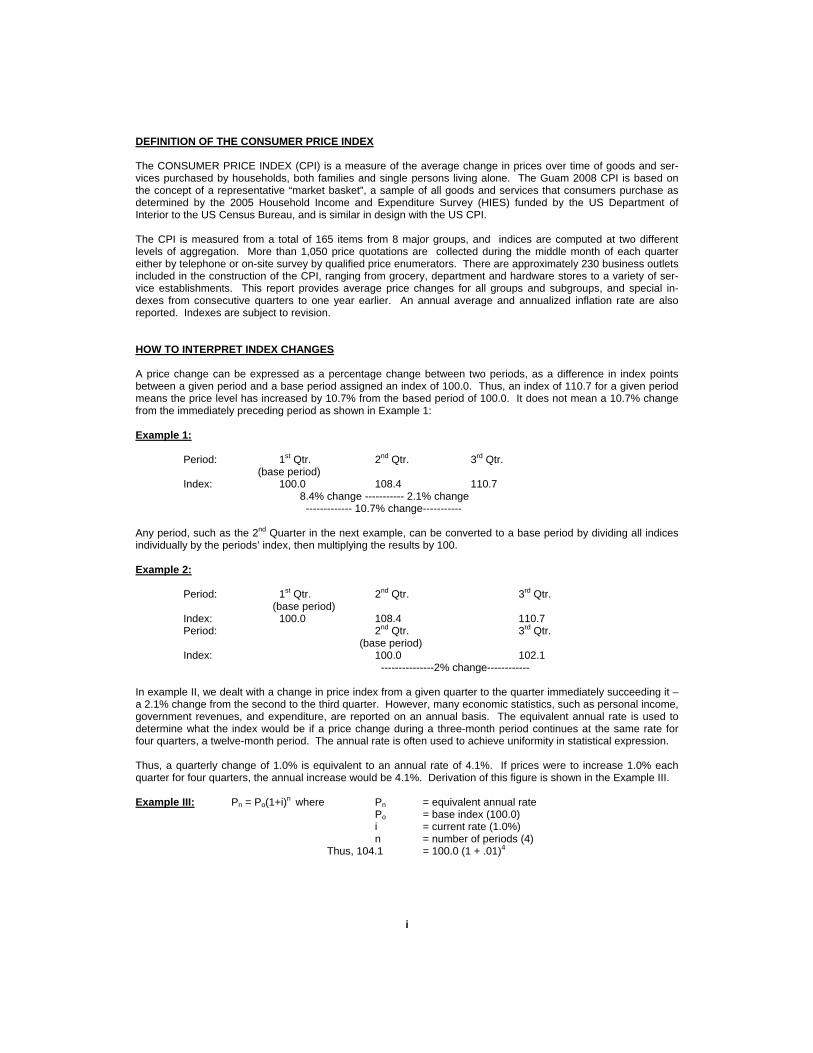
DEFINITION OF THE CONSUMER PRICE INDEX The CONSUMER PRICE INDEX (CPI) is a measure of the average change in prices over time of goods and ser-vices purchased by households, both families and single persons living alone. The Guam 2008 CPI is based on the concept of a representative “market basket”, a sample of all goods and services that consumers purchase as determined by the 2005 Household Income and Expenditure Survey (HIES) funded by the US Department of Interior to the US Census Bureau, and is similar in design with the US CPI. The CPI is measured from a total of 165 items from 8 major groups, and indices are computed at two different levels of aggregation. More than 1,050 price quotations are collected during the middle month of each quarter either by telephone or on-site survey by qualified price enumerators. There are approximately 230 business outlets included in the construction of the CPI, ranging from grocery, department and hardware stores to a variety of ser-vice establishments. This report provides average price changes for all groups and subgroups, and special in-dexes from consecutive quarters to one year earlier. An annual average and annualized inflation rate are also reported. Indexes are subject to revision. HOW TO INTERPRET INDEX CHANGES A price change can be expressed as a percentage change between two periods, as a difference in index points between a given period and a base period assigned an index of 100.0. Thus, an index of 110.7 for a given period means the price level has increased by 10.7% from the based period of 100.0. It does not mean a 10.7% change from the immediately preceding period as shown in Example 1: Example 1: Period: 1st Qtr. 2nd Qtr. 3rd Qtr. (base period) Index: 100.0 108.4 110.7 8.4% change ----------- 2.1% change ------------- 10.7% change----------- Any period, such as the 2nd Quarter in the next example, can be converted to a base period by dividing all indices individually by the periods’ index, then multiplying the results by 100. Example 2: Period: 1st Qtr. 2nd Qtr. 3rd Qtr. (base period) Index: 100.0 108.4 110.7 Period: 2nd Qtr. 3rd Qtr. (base period) Index: 100.0 102.1 ---------------2% change------------ In example II, we dealt with a change in price index from a given quarter to the quarter immediately succeeding it – a 2.1% change from the second to the third quarter. However, many economic statistics, such as personal income, government revenues, and expenditure, are reported on an annual basis. The equivalent annual rate is used to determine what the index would be if a price change during a three-month period continues at the same rate for four quarters, a twelve-month period. The annual rate is often used to achieve uniformity in statistical expression. Thus, a quarterly change of 1.0% is equivalent to an annual rate of 4.1%. If prices were to increase 1.0% each quarter for four quarters, the annual increase would be 4.1%. Derivation of this figure is shown in the Example III. Example III: Pn = Po(1+i)n where Pn = equivalent annual rate Po = base index (100.0) i = current rate (1.0%) n = number of periods (4) Thus, 104.1 = 100.0 (1 + .01)4
i
However, the equivalent annual rate should not be interpreted as a projection or price forecast. It is only a standard form for showing price changes that have occurred. The CPI only reports what has happened, while annual projections must be based on factors which determine future price changes. Please see www.bsp.guam.gov, for historical CPI data, and other state data resources.
GUAM CONSUMER PRICE INDEX
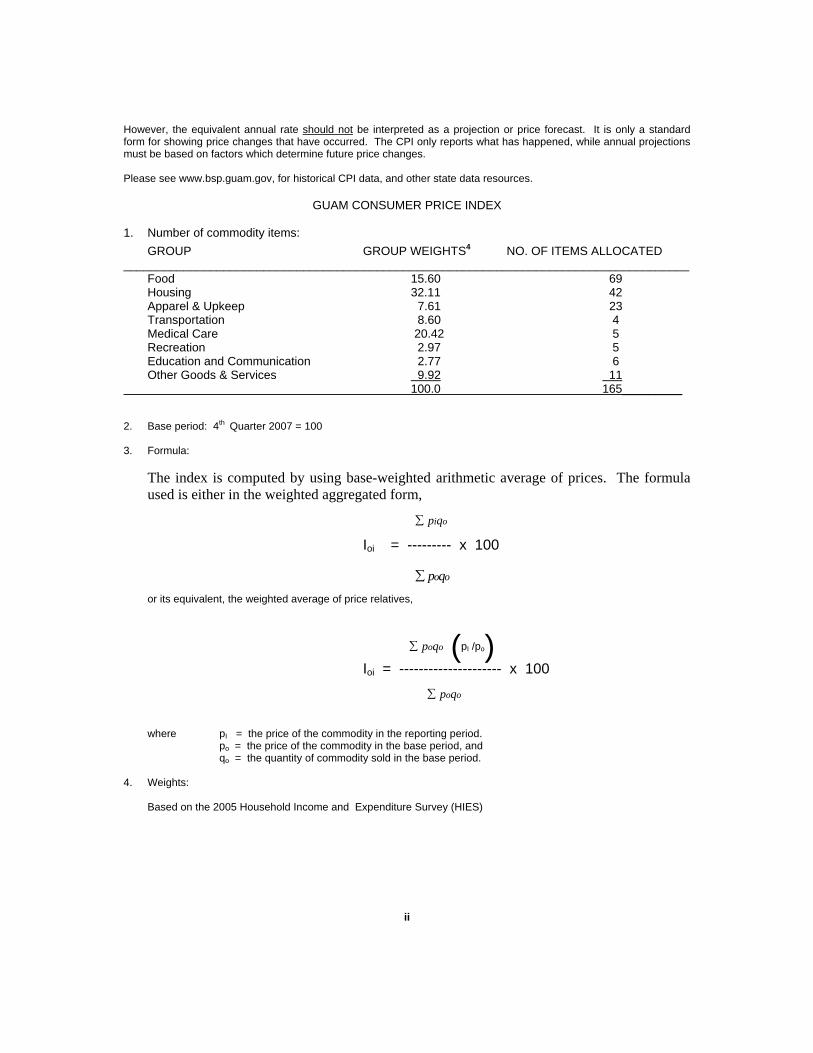
1. Number of commodity items:
GROUP GROUP WEIGHTS4 NO. OF ITEMS ALLOCATED _____________________________________________________________________________________
Food 15.60 69 Housing 32.11 42 Apparel & Upkeep 7.61 23 Transportation 8.60 4 Medical Care 20.42 5 Recreation 2.97 5 Education and Communication 2.77 6 Other Goods & Services 9.92 11
100.0 165_________ 2. Base period: 4th Quarter 2007 = 100 3. Formula:
The index is computed by using base-weighted arithmetic average of prices. The formula used is either in the weighted aggregated form,
Ioi = --------- x 100
or its equivalent, the weighted average of price relatives,
(pI /po) Ioi = --------------------- x 100
where pI = the price of the commodity in the reporting period.
po = the price of the commodity in the base period, and qo = the quantity of commodity sold in the base period. 4. Weights:
Based on the 2005 Household Income and Expenditure Survey (HIES)
ii
oiqp
ooqp
ooqp
ooqp
Guam Consumer Price Index (CPI)
2nd Quarter 2012
Volume No. XXXVIII, 2
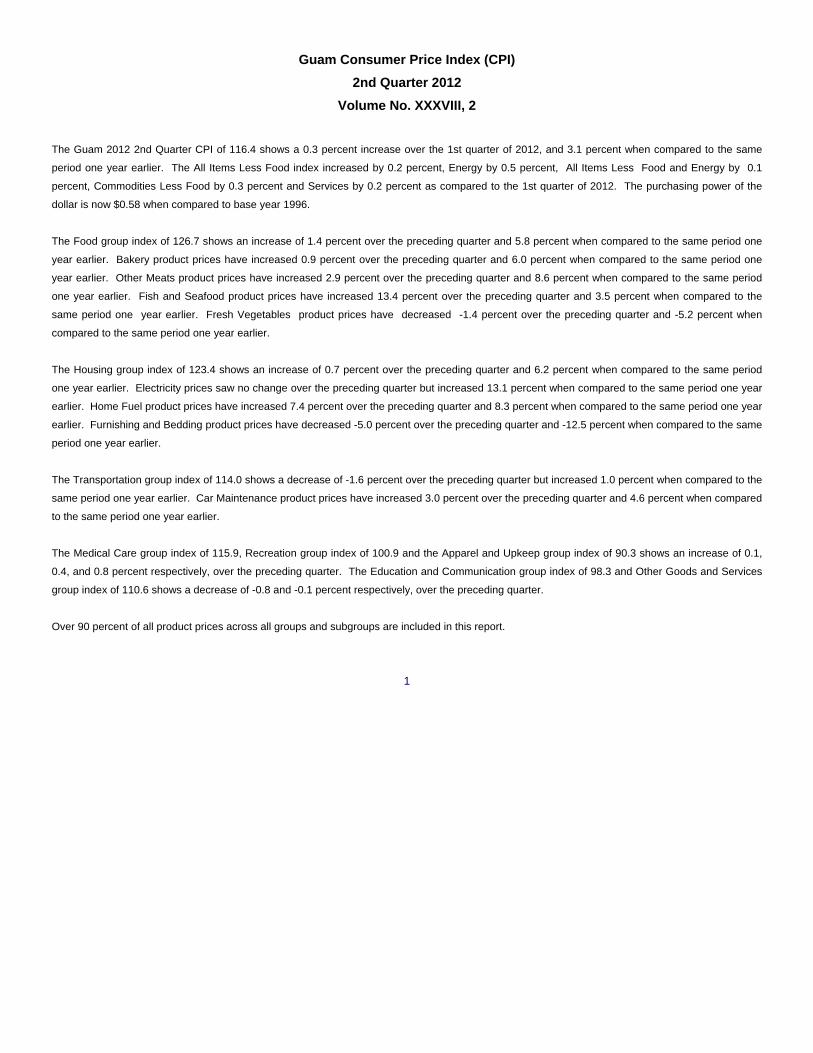
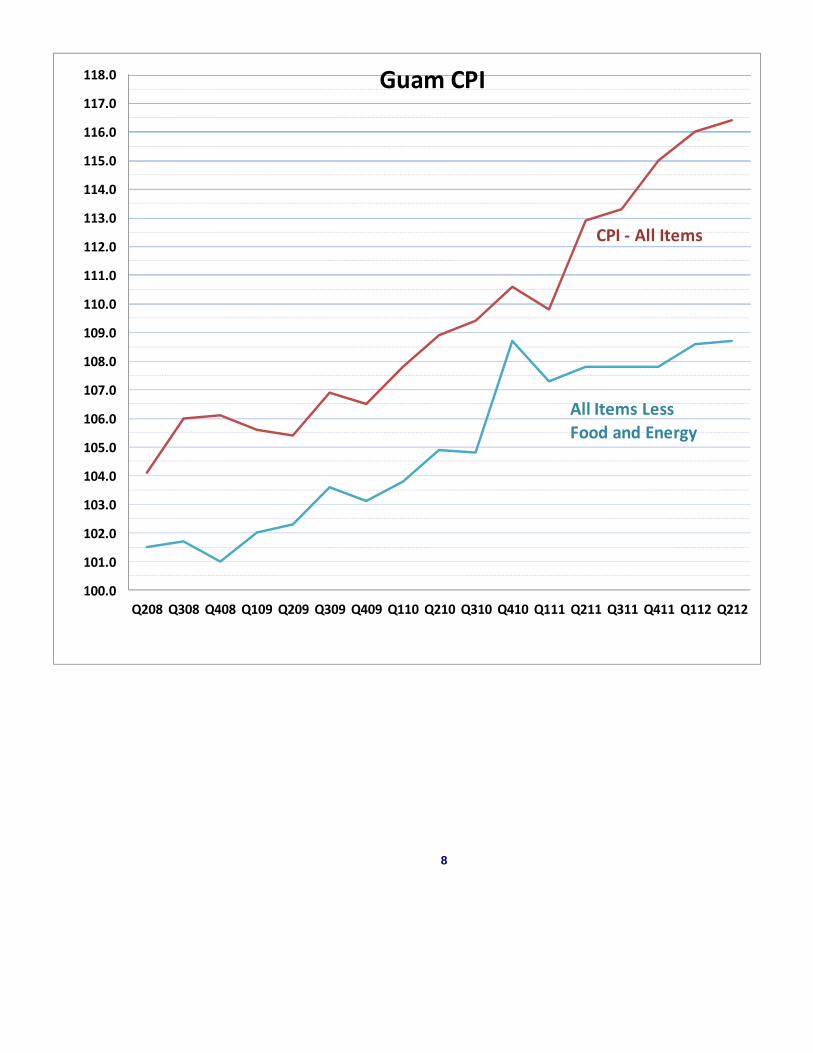
The Guam 2012 2nd Quarter CPI of 116.4 shows a 0.3 percent increase over the 1st quarter of 2012, and 3.1 percent when compared to the same
period one year earlier. The All Items Less Food index increased by 0.2 percent, Energy by 0.5 percent, All Items Less Food and Energy by 0.1
percent, Commodities Less Food by 0.3 percent and Services by 0.2 percent as compared to the 1st quarter of 2012. The purchasing power of the
dollar is now $0.58 when compared to base year 1996.
The Food group index of 126.7 shows an increase of 1.4 percent over the preceding quarter and 5.8 percent when compared to the same period one
year earlier. Bakery product prices have increased 0.9 percent over the preceding quarter and 6.0 percent when compared to the same period one
year earlier. Other Meats product prices have increased 2.9 percent over the preceding quarter and 8.6 percent when compared to the same period
one year earlier. Fish and Seafood product prices have increased 13.4 percent over the preceding quarter and 3.5 percent when compared to the
same period one year earlier. Fresh Vegetables product prices have decreased -1.4 percent over the preceding quarter and -5.2 percent when
compared to the same period one year earlier.
The Housing group index of 123.4 shows an increase of 0.7 percent over the preceding quarter and 6.2 percent when compared to the same period
one year earlier. Electricity prices saw no change over the preceding quarter but increased 13.1 percent when compared to the same period one year
earlier. Home Fuel product prices have increased 7.4 percent over the preceding quarter and 8.3 percent when compared to the same period one year
earlier. Furnishing and Bedding product prices have decreased -5.0 percent over the preceding quarter and -12.5 percent when compared to the same
period one year earlier.
The Transportation group index of 114.0 shows a decrease of -1.6 percent over the preceding quarter but increased 1.0 percent when compared to the
same period one year earlier. Car Maintenance product prices have increased 3.0 percent over the preceding quarter and 4.6 percent when compared
to the same period one year earlier.
The Medical Care group index of 115.9, Recreation group index of 100.9 and the Apparel and Upkeep group index of 90.3 shows an increase of 0.1,
0.4, and 0.8 percent respectively, over the preceding quarter. The Education and Communication group index of 98.3 and Other Goods and Services
group index of 110.6 shows a decrease of -0.8 and -0.1 percent respectively, over the preceding quarter.
Over 90 percent of all product prices across all groups and subgroups are included in this report.
1
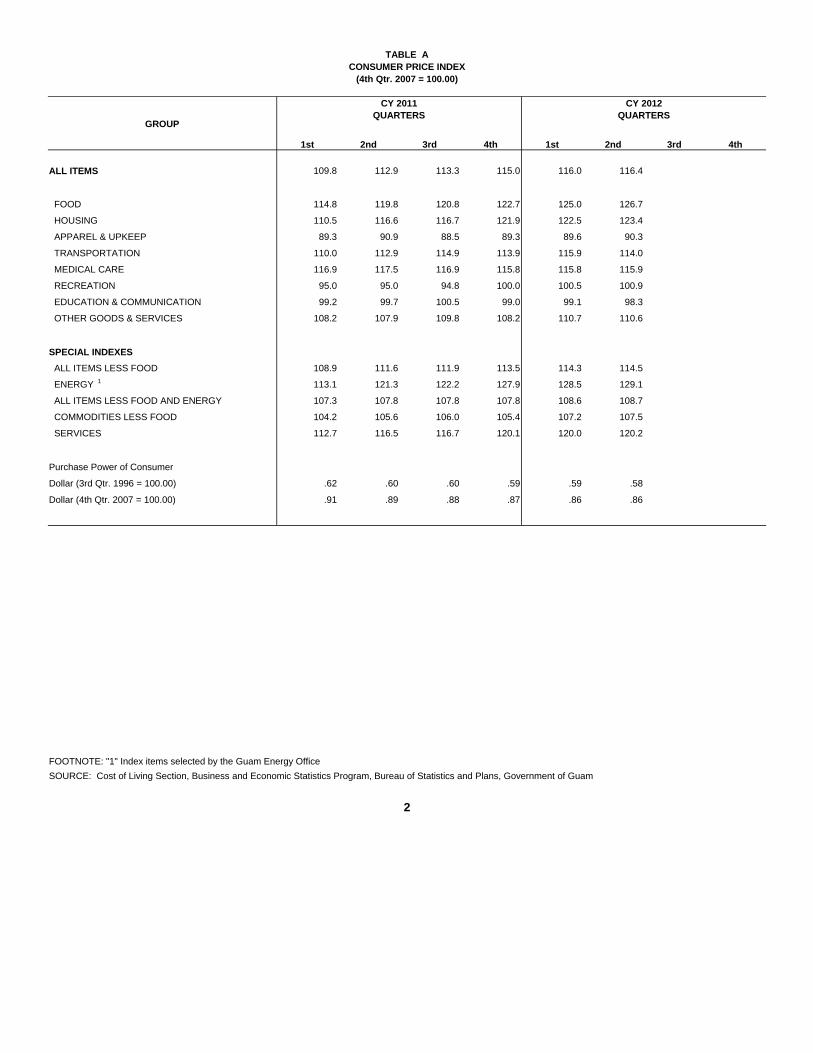
TABLE A CONSUMER PRICE INDEX
(4th Qtr. 2007 = 100.00) CY 2011 CY 2012
GROUP QUARTERS QUARTERS
1st 2nd 3rd 4th 1st 2nd 3rd 4th
ALL ITEMS 109.8 112.9 113.3 115.0 116.0 116.4
FOOD 114.8 119.8 120.8 122.7 125.0 126.7 HOUSING 110.5 116.6 116.7 121.9 122.5 123.4 APPAREL & UPKEEP 89.3 90.9 88.5 89.3 89.6 90.3 TRANSPORTATION 110.0 112.9 114.9 113.9 115.9 114.0 MEDICAL CARE 116.9 117.5 116.9 115.8 115.8 115.9 RECREATION 95.0 95.0 94.8 100.0 100.5 100.9 EDUCATION & COMMUNICATION 99.2 99.7 100.5 99.0 99.1 98.3 OTHER GOODS & SERVICES 108.2 107.9 109.8 108.2 110.7 110.6
SPECIAL INDEXES ALL ITEMS LESS FOOD 108.9 111.6 111.9 113.5 114.3 114.5 ENERGY 1 113.1 121.3 122.2 127.9 128.5 129.1 ALL ITEMS LESS FOOD AND ENERGY 107.3 107.8 107.8 107.8 108.6 108.7 COMMODITIES LESS FOOD 104.2 105.6 106.0 105.4 107.2 107.5 SERVICES 112.7 116.5 116.7 120.1 120.0 120.2
Purchase Power of Consumer Dollar (3rd Qtr. 1996 = 100.00) .62 .60 .60 .59 .59 .58 Dollar (4th Qtr. 2007 = 100.00) .91 .89 .88 .87 .86 .86 FOOTNOTE: "1" Index items selected by the Guam Energy Office SOURCE: Cost of Living Section, Business and Economic Statistics Program, Bureau of Statistics and Plans, Government of Guam
2
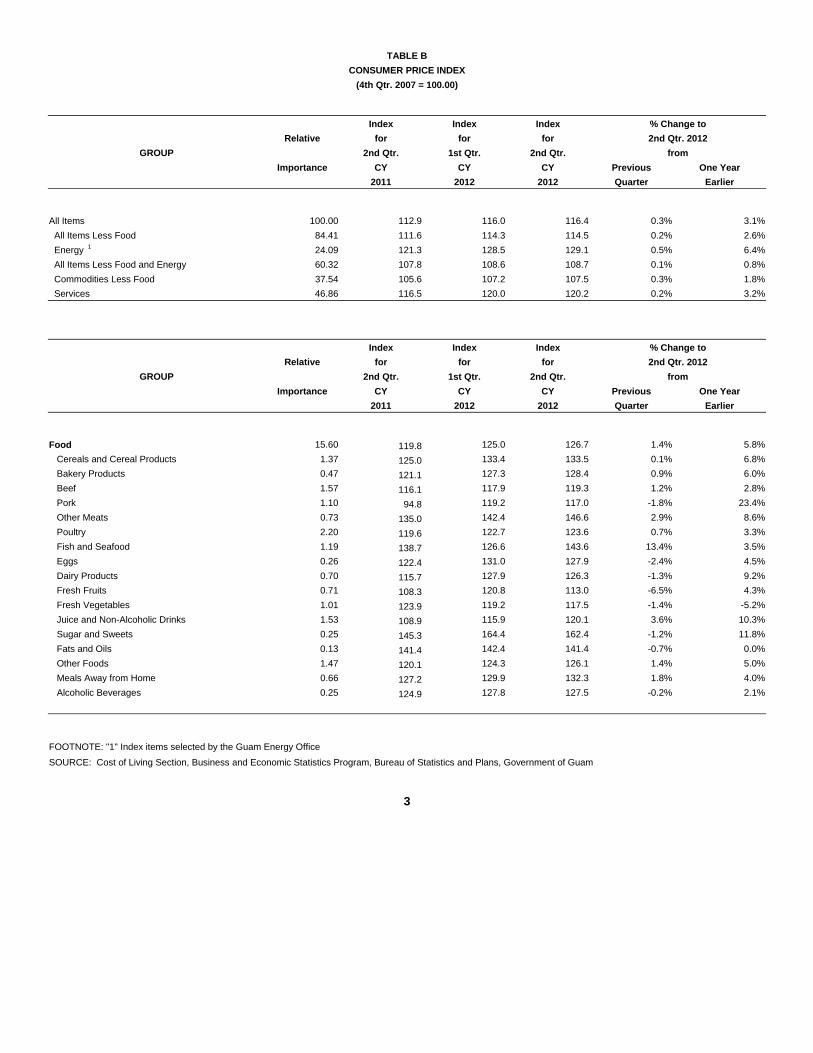
TABLE B
CONSUMER PRICE INDEX
(4th Qtr. 2007 = 100.00)
Index Index Index % Change to
GROUP
Relative
Importance
for for for 2nd Qtr. 2012
2nd Qtr. 1st Qtr. 2nd Qtr. from
CY CY CY Previous One Year
2011 2012 2012 Quarter Earlier
All Items 100.00 112.9 116.0 116.4 0.3% 3.1%
All Items Less Food 84.41 111.6 114.3 114.5 0.2% 2.6%
Energy 1 24.09 121.3 128.5 129.1 0.5% 6.4%
All Items Less Food and Energy 60.32 107.8 108.6 108.7 0.1% 0.8%
Commodities Less Food 37.54 105.6 107.2 107.5 0.3% 1.8%
Services 46.86 116.5 120.0 120.2 0.2% 3.2%
Index Index Index % Change to
GROUP
Relative
Importance
for for for 2nd Qtr. 2012
2nd Qtr. 1st Qtr. 2nd Qtr. from
CY CY CY Previous One Year
2011 2012 2012 Quarter Earlier
Food 15.60 119.8 125.0 126.7 1.4% 5.8%
Cereals and Cereal Products 1.37 125.0 133.4 133.5 0.1% 6.8%
Bakery Products 0.47 121.1 127.3 128.4 0.9% 6.0%
Beef 1.57 116.1 117.9 119.3 1.2% 2.8%
Pork 1.10 94.8 119.2 117.0 -1.8% 23.4%
Other Meats 0.73 135.0 142.4 146.6 2.9% 8.6%
Poultry 2.20 119.6 122.7 123.6 0.7% 3.3%
Fish and Seafood 1.19 138.7 126.6 143.6 13.4% 3.5%
Eggs 0.26 122.4 131.0 127.9 -2.4% 4.5%
Dairy Products 0.70 115.7 127.9 126.3 -1.3% 9.2%
Fresh Fruits 0.71 108.3 120.8 113.0 -6.5% 4.3%
Fresh Vegetables 1.01 123.9 119.2 117.5 -1.4% -5.2%
Juice and Non-Alcoholic Drinks 1.53 108.9 115.9 120.1 3.6% 10.3%
Sugar and Sweets 0.25 145.3 164.4 162.4 -1.2% 11.8%
Fats and Oils 0.13 141.4 142.4 141.4 -0.7% 0.0%
Other Foods 1.47 120.1 124.3 126.1 1.4% 5.0%
Meals Away from Home 0.66 127.2 129.9 132.3 1.8% 4.0%
Alcoholic Beverages 0.25 124.9 127.8 127.5 -0.2% 2.1%
FOOTNOTE: "1" Index items selected by the Guam Energy Office SOURCE: Cost of Living Section, Business and Economic Statistics Program, Bureau of Statistics and Plans, Government of Guam
3
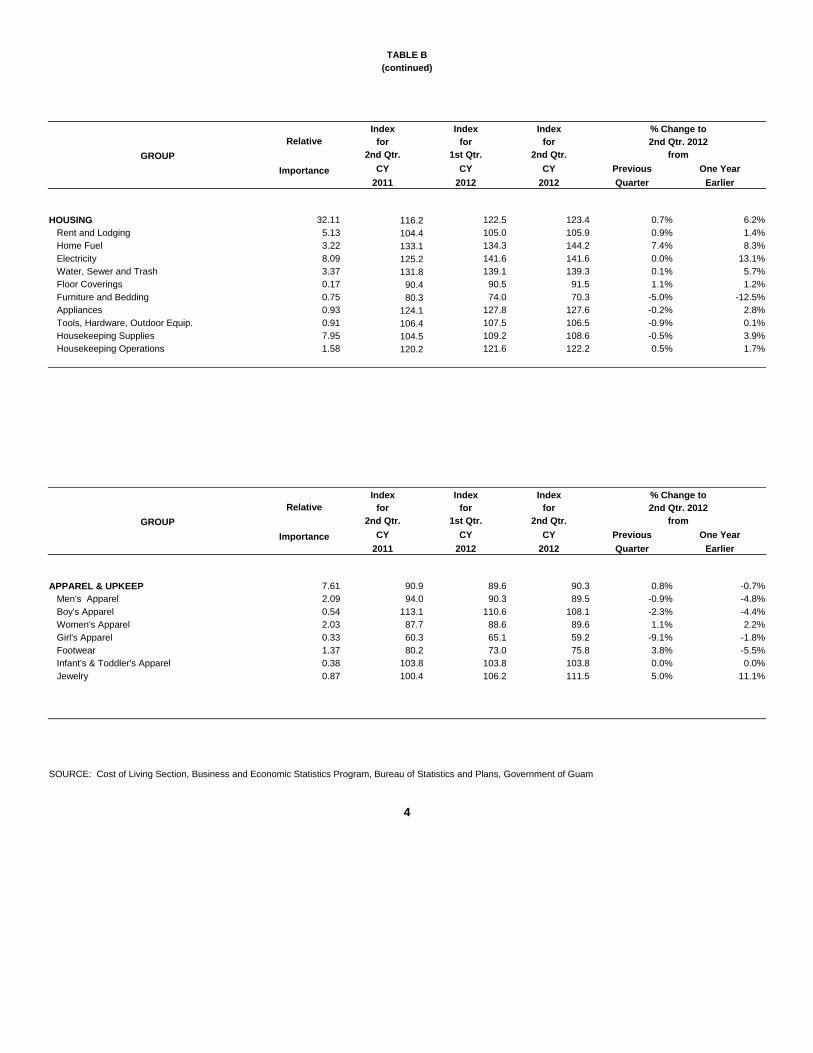
TABLE B (continued)
Index Index Index % Change to
GROUP
Relative
Importance
for for for 2nd Qtr. 2012 2nd Qtr. 1st Qtr. 2nd Qtr. from
CY CY CY Previous One Year
2011 2012 2012 Quarter Earlier
HOUSING 32.11 116.2 122.5 123.4 0.7% 6.2% Rent and Lodging 5.13 104.4 105.0 105.9 0.9% 1.4% Home Fuel 3.22 133.1 134.3 144.2 7.4% 8.3% Electricity 8.09 125.2 141.6 141.6 0.0% 13.1% Water, Sewer and Trash 3.37 131.8 139.1 139.3 0.1% 5.7% Floor Coverings 0.17 90.4 90.5 91.5 1.1% 1.2% Furniture and Bedding 0.75 80.3 74.0 70.3 -5.0% -12.5% Appliances 0.93 124.1 127.8 127.6 -0.2% 2.8% Tools, Hardware, Outdoor Equip. 0.91 106.4 107.5 106.5 -0.9% 0.1% Housekeeping Supplies 7.95 104.5 109.2 108.6 -0.5% 3.9% Housekeeping Operations 1.58 120.2 121.6 122.2 0.5% 1.7%
Index Index Index % Change to
GROUP
Relative
Importance
for for for 2nd Qtr. 2012 2nd Qtr. 1st Qtr. 2nd Qtr. from
CY CY CY Previous One Year
2011 2012 2012 Quarter Earlier
APPAREL & UPKEEP 7.61 90.9 89.6 90.3 0.8% -0.7% Men's Apparel 2.09 94.0 90.3 89.5 -0.9% -4.8% Boy's Apparel 0.54 113.1 110.6 108.1 -2.3% -4.4% Women's Apparel 2.03 87.7 88.6 89.6 1.1% 2.2% Girl's Apparel 0.33 60.3 65.1 59.2 -9.1% -1.8% Footwear 1.37 80.2 73.0 75.8 3.8% -5.5% Infant's & Toddler's Apparel 0.38 103.8 103.8 103.8 0.0% 0.0% Jewelry 0.87 100.4 106.2 111.5 5.0% 11.1%
SOURCE: Cost of Living Section, Business and Economic Statistics Program, Bureau of Statistics and Plans, Government of Guam
4
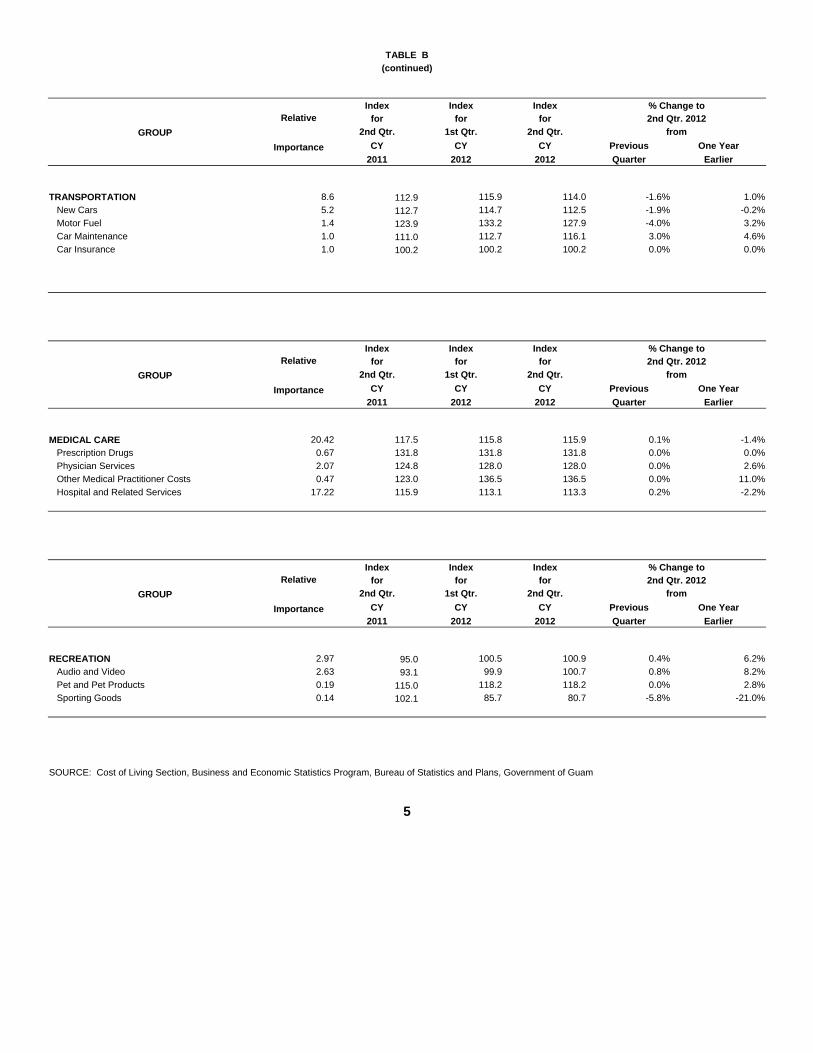
TABLE B
(continued)
Index Index Index % Change to
GROUP
Relative
Importance
for for for 2nd Qtr. 2012
2nd Qtr. 1st Qtr. 2nd Qtr. from
CY CY CY Previous One Year
2011 2012 2012 Quarter Earlier
TRANSPORTATION 8.6 112.9 115.9 114.0 -1.6% 1.0%
New Cars 5.2 112.7 114.7 112.5 -1.9% -0.2%
Motor Fuel 1.4 123.9 133.2 127.9 -4.0% 3.2%
Car Maintenance 1.0 111.0 112.7 116.1 3.0% 4.6%
Car Insurance 1.0 100.2 100.2 100.2 0.0% 0.0%
Index Index Index % Change to
GROUP
Relative
Importance
for for for 2nd Qtr. 2012
2nd Qtr. 1st Qtr. 2nd Qtr. from
CY CY CY Previous One Year
2011 2012 2012 Quarter Earlier
MEDICAL CARE 20.42 117.5 115.8 115.9 0.1% -1.4%
Prescription Drugs 0.67 131.8 131.8 131.8 0.0% 0.0%
Physician Services 2.07 124.8 128.0 128.0 0.0% 2.6%
Other Medical Practitioner Costs 0.47 123.0 136.5 136.5 0.0% 11.0%
Hospital and Related Services 17.22 115.9 113.1 113.3 0.2% -2.2%
Index Index Index % Change to
GROUP
Relative
Importance
for for for 2nd Qtr. 2012
2nd Qtr. 1st Qtr. 2nd Qtr. from
CY CY CY Previous One Year
2011 2012 2012 Quarter Earlier
RECREATION 2.97 95.0 100.5 100.9 0.4% 6.2%
Audio and Video 2.63 93.1 99.9 100.7 0.8% 8.2%
Pet and Pet Products 0.19 115.0 118.2 118.2 0.0% 2.8%
Sporting Goods 0.14 102.1 85.7 80.7 -5.8% -21.0%
SOURCE: Cost of Living Section, Business and Economic Statistics Program, Bureau of Statistics and Plans, Government of Guam
5
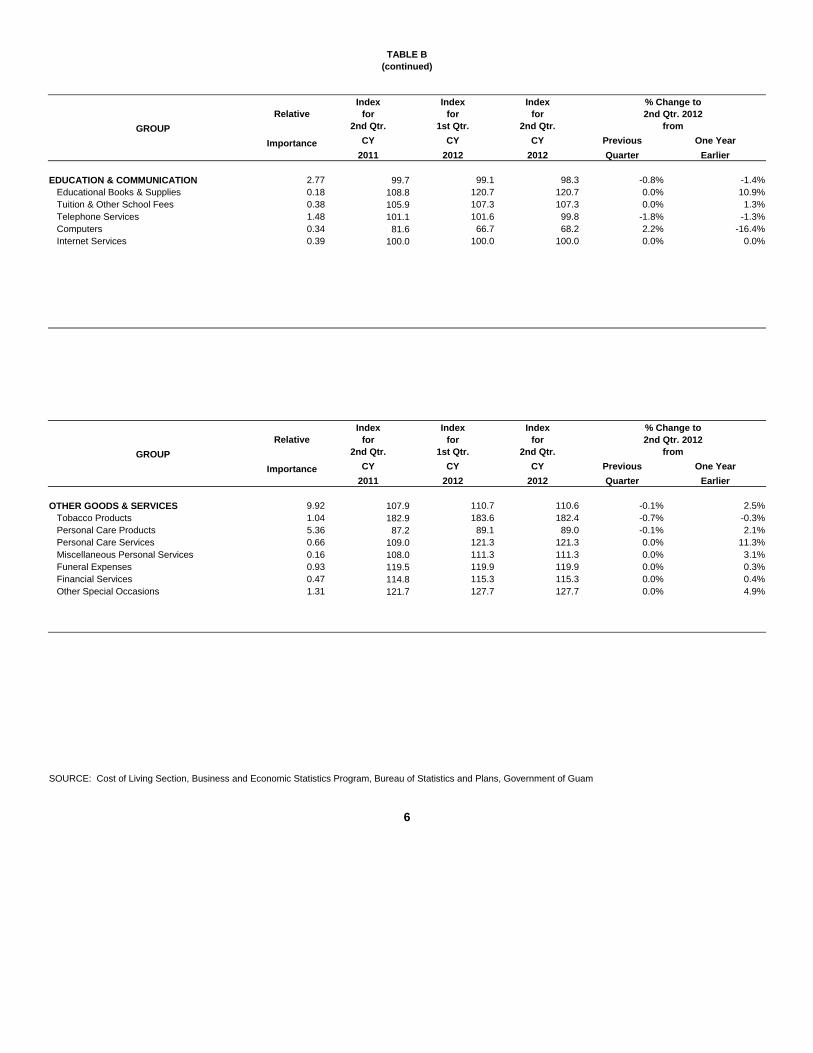
TABLE B (continued)
Index Index Index % Change to
GROUP
Relative
Importance
for for for 2nd Qtr. 2012 2nd Qtr. 1st Qtr. 2nd Qtr. from
CY CY CY Previous One Year
2011 2012 2012 Quarter Earlier EDUCATION & COMMUNICATION 2.77 99.7 99.1 98.3 -0.8% -1.4% Educational Books & Supplies 0.18 108.8 120.7 120.7 0.0% 10.9% Tuition & Other School Fees 0.38 105.9 107.3 107.3 0.0% 1.3% Telephone Services 1.48 101.1 101.6 99.8 -1.8% -1.3% Computers 0.34 81.6 66.7 68.2 2.2% -16.4% Internet Services 0.39 100.0 100.0 100.0 0.0% 0.0%
Index Index Index % Change to
GROUP
Relative
Importance
for for for 2nd Qtr. 2012 2nd Qtr. 1st Qtr. 2nd Qtr. from
CY CY CY Previous One Year
2011 2012 2012 Quarter Earlier OTHER GOODS & SERVICES 9.92 107.9 110.7 110.6 -0.1% 2.5% Tobacco Products 1.04 182.9 183.6 182.4 -0.7% -0.3% Personal Care Products 5.36 87.2 89.1 89.0 -0.1% 2.1% Personal Care Services 0.66 109.0 121.3 121.3 0.0% 11.3% Miscellaneous Personal Services 0.16 108.0 111.3 111.3 0.0% 3.1% Funeral Expenses 0.93 119.5 119.9 119.9 0.0% 0.3% Financial Services 0.47 114.8 115.3 115.3 0.0% 0.4% Other Special Occasions 1.31 121.7 127.7 127.7 0.0% 4.9%
SOURCE: Cost of Living Section, Business and Economic Statistics Program, Bureau of Statistics and Plans, Government of Guam
6
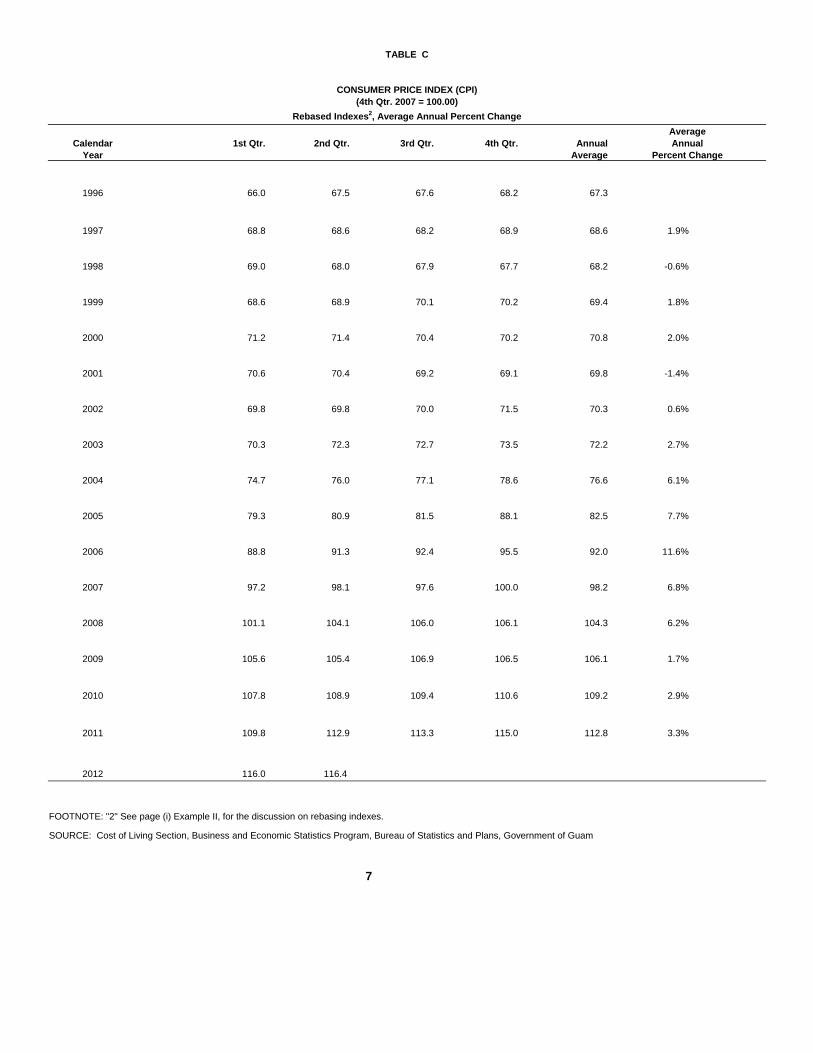
TABLE C
CONSUMER PRICE INDEX (CPI)
(4th Qtr. 2007 = 100.00)
Rebased Indexes2, Average Annual Percent Change
Average Calendar 1st Qtr. 2nd Qtr. 3rd Qtr. 4th Qtr. Annual Annual
Year Average Percent Change
1996 66.0 67.5 67.6 68.2 67.3
1997 68.8 68.6 68.2 68.9 68.6 1.9%
1998 69.0 68.0 67.9 67.7 68.2 -0.6%
1999 68.6 68.9 70.1 70.2 69.4 1.8%
2000 71.2 71.4 70.4 70.2 70.8 2.0%
2001 70.6 70.4 69.2 69.1 69.8 -1.4%
2002 69.8 69.8 70.0 71.5 70.3 0.6%
2003 70.3 72.3 72.7 73.5 72.2 2.7%
2004 74.7 76.0 77.1 78.6 76.6 6.1%
2005 79.3 80.9 81.5 88.1 82.5 7.7%
2006 88.8 91.3 92.4 95.5 92.0 11.6%
2007 97.2 98.1 97.6 100.0 98.2 6.8%
2008 101.1 104.1 106.0 106.1 104.3 6.2%
2009 105.6 105.4 106.9 106.5 106.1 1.7%
2010 107.8 108.9 109.4 110.6 109.2 2.9%
2011 109.8 112.9 113.3 115.0 112.8 3.3%
2012 116.0 116.4
FOOTNOTE: "2" See page (i) Example II, for the discussion on rebasing indexes. SOURCE: Cost of Living Section, Business and Economic Statistics Program, Bureau of Statistics and Plans, Government of Guam
7
100.0
101.0
102.0
103.0
104.0
105.0
106.0
107.0
108.0
109.0
110.0
111.0
112.0
113.0
114.0
115.0
116.0
117.0
118.0
Q208 Q308 Q408 Q109 Q209 Q309 Q409 Q110 Q210 Q310 Q410 Q111 Q211 Q311 Q411 Q112 Q212
CPI ‐ All Items
All Items Less
Food and Energy
Guam CPI
8
Bureau of Statistics and Plans
Government of Guam P. O. Box 2950
Hagatna, Guam 96932 Tel: (671) 472-4201, 475-9683
Fax: (671) 477-1812 Website: www.bsp.guam.gov
email: [email protected]
Related Documents