LGU Taxation and Revenue Practices DEPARTMENT OF FINANCE BUREAU OF LOCAL GOVERNMENT FINANCE

Welcome message from author
This document is posted to help you gain knowledge. Please leave a comment to let me know what you think about it! Share it to your friends and learn new things together.
Transcript

LGU Taxation and
Revenue Practices
DEPARTMENT OF FINANCE
BUREAU OF LOCAL GOVERNMENT FINANCE
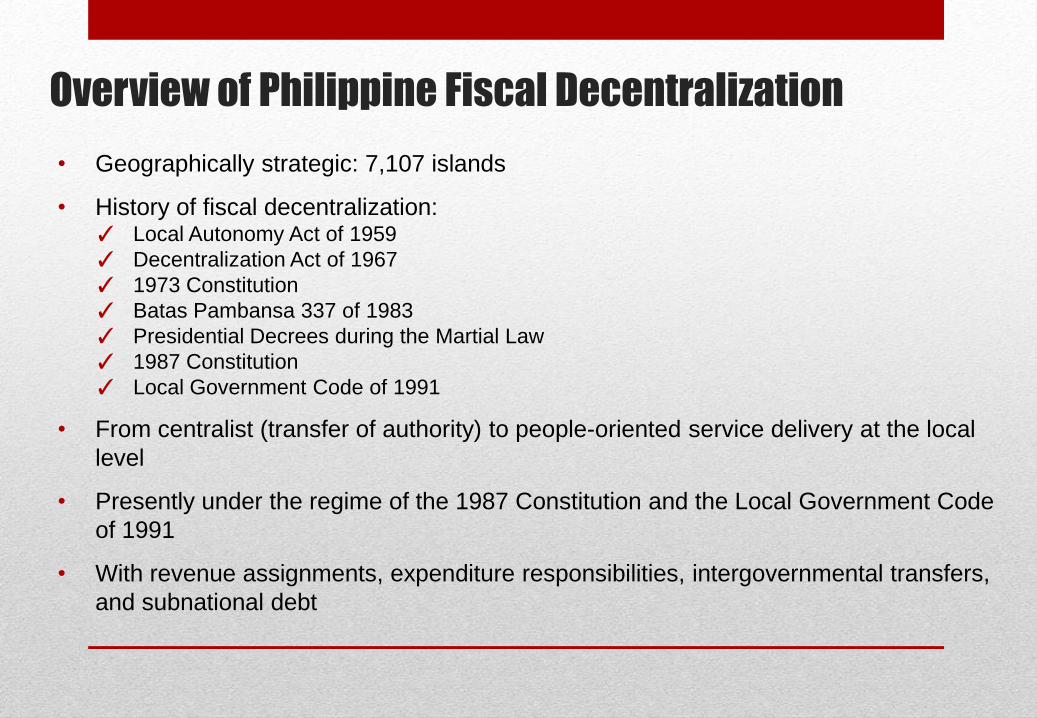
Overview of Philippine Fiscal Decentralization
• Geographically strategic: 7,107 islands
• History of fiscal decentralization: ✓ Local Autonomy Act of 1959
✓ Decentralization Act of 1967
✓ 1973 Constitution
✓ Batas Pambansa 337 of 1983
✓ Presidential Decrees during the Martial Law
✓ 1987 Constitution
✓ Local Government Code of 1991
• From centralist (transfer of authority) to people-oriented service delivery at the local
level
• Presently under the regime of the 1987 Constitution and the Local Government Code
of 1991
• With revenue assignments, expenditure responsibilities, intergovernmental transfers,
and subnational debt
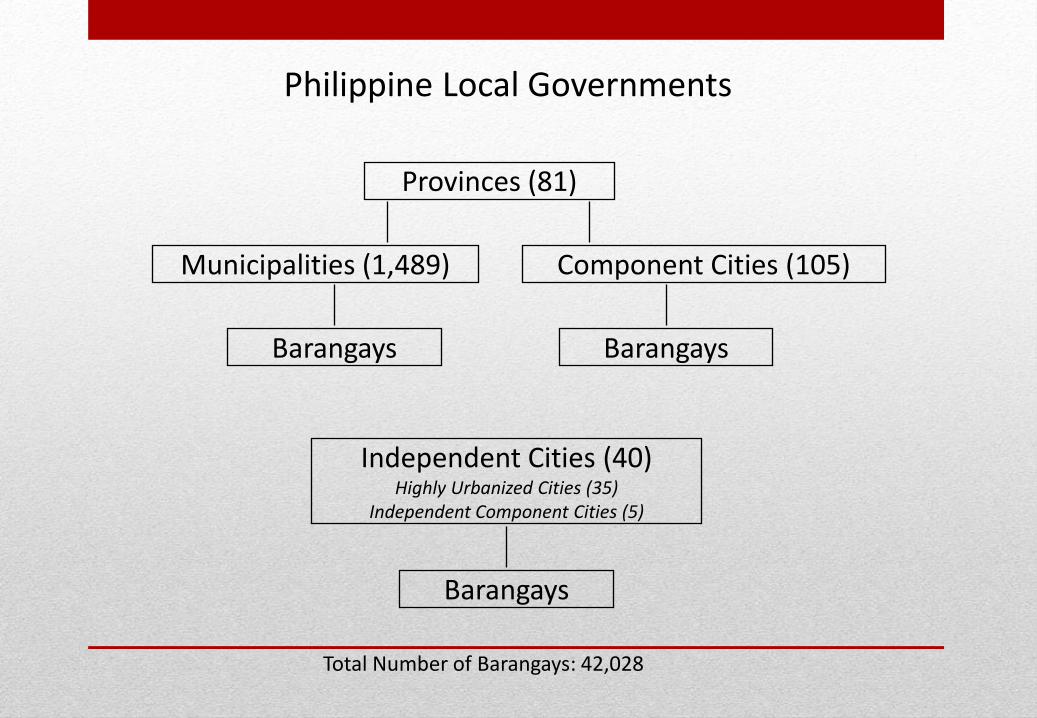
Philippine Local Governments
Provinces (81)
Municipalities (1,489) Component Cities (105)
Barangays Barangays
Independent Cities (40) Highly Urbanized Cities (35)
Independent Component Cities (5)
Barangays
Total Number of Barangays: 42,028
Administrative Structure
• Local governments as political and territorial subdivisions of the State
• Provinces, cities, and municipalities are directly headed by a local chief executive (Governor for provinces, and Mayor for cities and municipalities) and a vice (Vice Governor; Vice Mayor)
• Each local government has a local legislative council called “Sanggunian” (Provincial Board; City/Municipal/Barangay Council) composed of councilors, with the Vice Governor/Vice Mayor/Punong Barangay serving as Presiding Officer
• Barangays are headed by a Chairman
• Largely fixed (with maximum rates/ceilings) and not indexed to inflation
• Tax rates can only be adjusted up to 10% and once every 5 years
• Rates/levies must be legislated through local council
• Basis for real property tax is through a Schedule of Market Values, subject to revaluation/revision once every 3 years
Revenue Assignments of Local Governments
Revenue Assignments of Local Governments
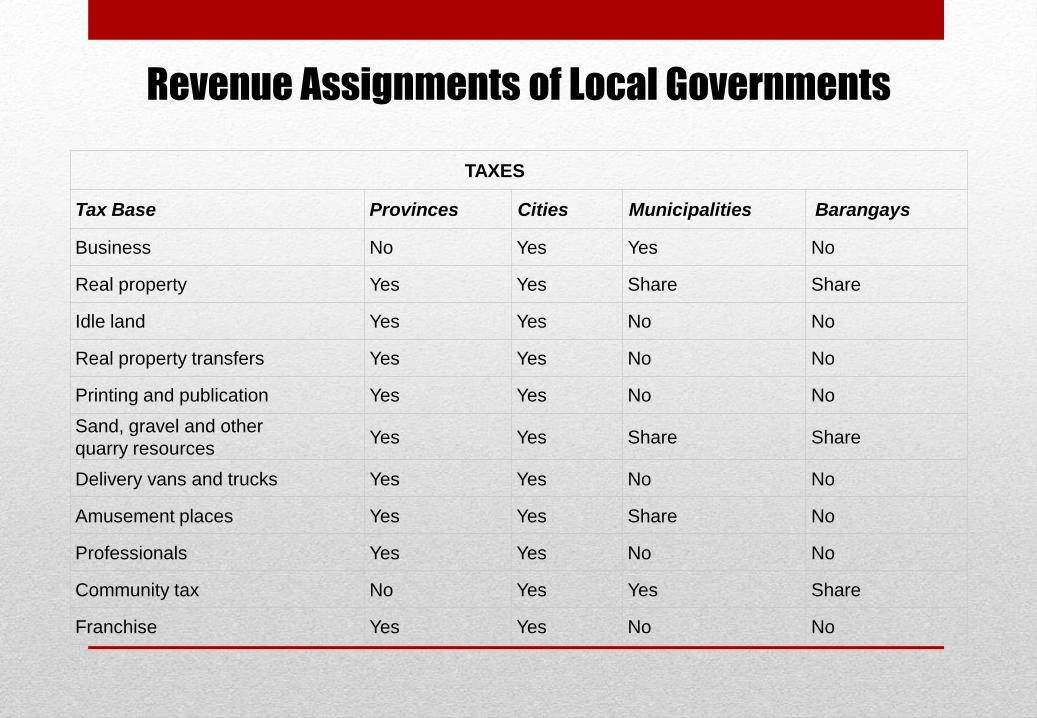
TAXES
Tax Base Provinces Cities Municipalities Barangays
Business No Yes Yes No
Real property Yes Yes Share Share
Idle land Yes Yes No No
Real property transfers Yes Yes No No
Printing and publication Yes Yes No No
Sand, gravel and other
quarry resources Yes Yes Share Share
Delivery vans and trucks Yes Yes No No
Amusement places Yes Yes Share No
Professionals Yes Yes No No
Community tax No Yes Yes Share
Franchise Yes Yes No No
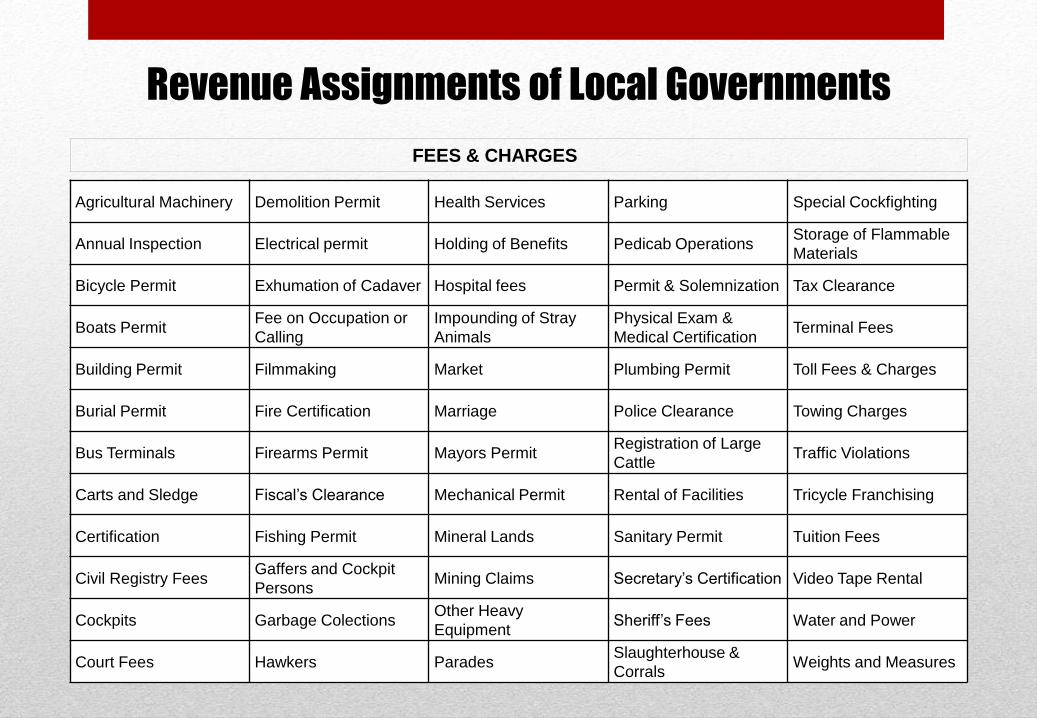
Revenue Assignments of Local Governments
FEES & CHARGES
Agricultural Machinery Demolition Permit Health Services Parking Special Cockfighting
Annual Inspection Electrical permit Holding of Benefits Pedicab Operations Storage of Flammable
Materials
Bicycle Permit Exhumation of Cadaver Hospital fees Permit & Solemnization Tax Clearance
Boats Permit Fee on Occupation or
Calling
Impounding of Stray
Animals
Physical Exam &
Medical Certification Terminal Fees
Building Permit Filmmaking Market Plumbing Permit Toll Fees & Charges
Burial Permit Fire Certification Marriage Police Clearance Towing Charges
Bus Terminals Firearms Permit Mayors Permit Registration of Large
Cattle Traffic Violations
Carts and Sledge Fiscal’s Clearance Mechanical Permit Rental of Facilities Tricycle Franchising
Certification Fishing Permit Mineral Lands Sanitary Permit Tuition Fees
Civil Registry Fees Gaffers and Cockpit
Persons Mining Claims Secretary’s Certification Video Tape Rental
Cockpits Garbage Colections Other Heavy
Equipment Sheriff’s Fees Water and Power
Court Fees Hawkers Parades Slaughterhouse &
Corrals Weights and Measures
Income Profile of Local
Government Units Provinces, Cities and Municipalities: 2009 - 2014
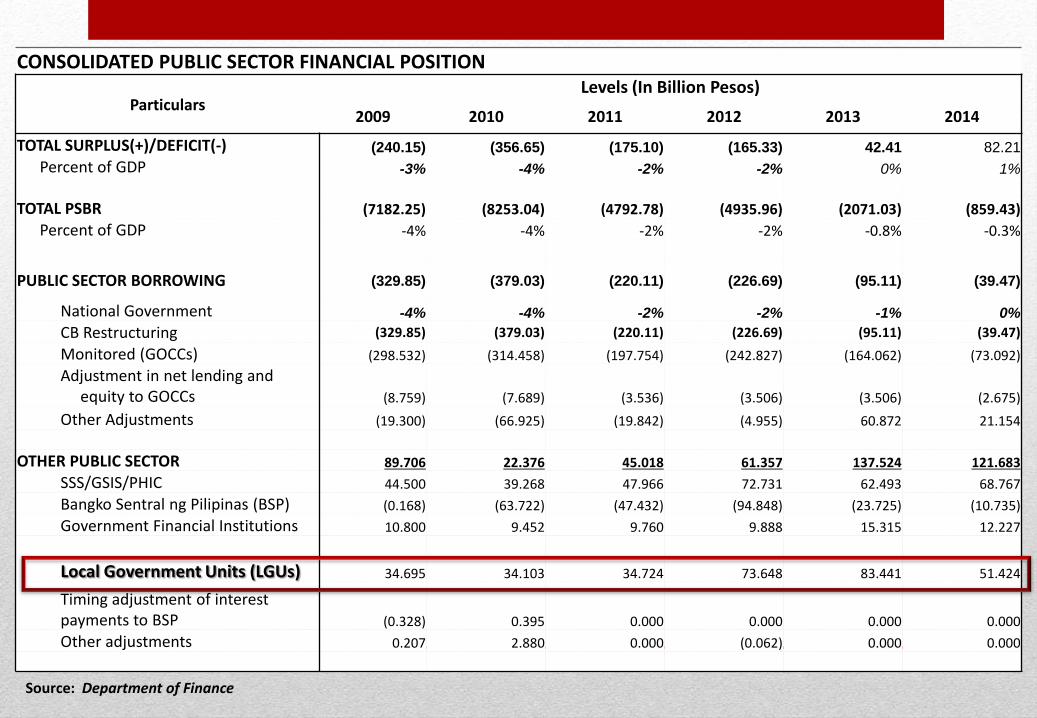
CONSOLIDATED PUBLIC SECTOR FINANCIAL POSITION
Particulars Levels (In Billion Pesos)
2009 2010 2011 2012 2013 2014
TOTAL SURPLUS(+)/DEFICIT(-) (240.15) (356.65) (175.10) (165.33) 42.41 82.21
Percent of GDP -3% -4% -2% -2% 0% 1%
TOTAL PSBR (7182.25) (8253.04) (4792.78) (4935.96) (2071.03) (859.43)
Percent of GDP -4% -4% -2% -2% -0.8% -0.3%
PUBLIC SECTOR BORROWING (329.85) (379.03) (220.11) (226.69) (95.11) (39.47)
National Government -4% -4% -2% -2% -1% 0%
CB Restructuring (329.85) (379.03) (220.11) (226.69) (95.11) (39.47)
Monitored (GOCCs) (298.532) (314.458) (197.754) (242.827) (164.062) (73.092)
Adjustment in net lending and equity to GOCCs (8.759) (7.689) (3.536) (3.506) (3.506) (2.675)
Other Adjustments (19.300) (66.925) (19.842) (4.955) 60.872 21.154
OTHER PUBLIC SECTOR 89.706 22.376 45.018 61.357 137.524 121.683
SSS/GSIS/PHIC 44.500 39.268 47.966 72.731 62.493 68.767
Bangko Sentral ng Pilipinas (BSP) (0.168) (63.722) (47.432) (94.848) (23.725) (10.735)
Government Financial Institutions 10.800 9.452 9.760 9.888 15.315 12.227
Local Government Units (LGUs) 34.695 34.103 34.724 73.648 83.441 51.424
Timing adjustment of interest payments to BSP (0.328) 0.395 0.000 0.000 0.000 0.000
Other adjustments 0.207 2.880 0.000 (0.062) 0.000 0.000
Source: Department of Finance

PARTICULARS 2009 2010 2011 2012 2013 2014 Average Amount in Million Pesos
Current Operating Income & Expenditures
Operating Income 311,011 336,613 366,093 367,912 389,558 429,429 366,769
Operating Expenditures 233,662 253,867 266,240 282,506 297,731 300,887 272,482
Net Operating Income/Loss 77,349 82,745 99,853 85,407 91,826 128,542 94,287
Non-Income Receipts & Non-Operating Expenditures
Non-Income Receipts 12,785 14,726 11,816 8,873 12,895 14,185 12,547
Non-Operating Expenditures 46,525 47,551 50,055 47,577 52,159 62,941 51,135
Net Increase/Decrease in Cash 43,608 49,921 61,614 46,703 52,562 79,785 55,699
Growth Rate
Current Operating Income & Expenditures
Income 8% 9% 0% 6% 10% 7%
Expenditures 9% 5% 6% 5% 1% 5%
Net Operating Income/Loss 7% 21% -14% 8% 40% 12%
Non-Income Receipts & Non-Operating Expenditures
Receipts 15% -20% -25% 45% 10% 5%
Expenditures 2% 5% -5% 10% 21% 7%
Growth rate of Net
Increase(Decrease) in Cash 14% 23% -24% 13% 52% 16%
Consolidated Statement of Receipts and Expenditures
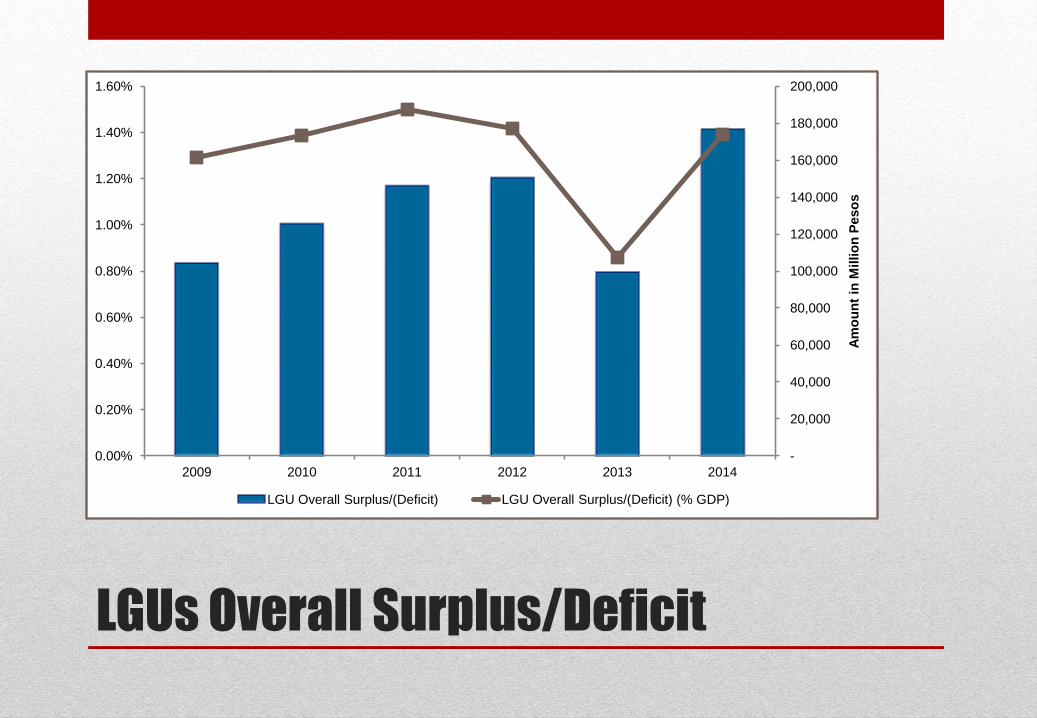
LGUs Overall Surplus/Deficit
0.00%
0.20%
0.40%
0.60%
0.80%
1.00%
1.20%
1.40%
1.60%
-
20,000
40,000
60,000
80,000
100,000
120,000
140,000
160,000
180,000
200,000
2009 2010 2011 2012 2013 2014
Am
ou
nt
in M
illio
n P
eso
s
LGU Overall Surplus/(Deficit) LGU Overall Surplus/(Deficit) (% GDP)

Net Operating Income(Loss): Growth Rate
-20%
-10%
0%
10%
20%
30%
40%
50%
0
50,000
100,000
150,000
200,000
250,000
300,000
350,000
400,000
450,000
2009 2010 2011 2012 2013 2014
Am
ou
nt in
Mill
ion
Pe
so
s
Operating Income Operating Expenditures Net Operating Income/Loss
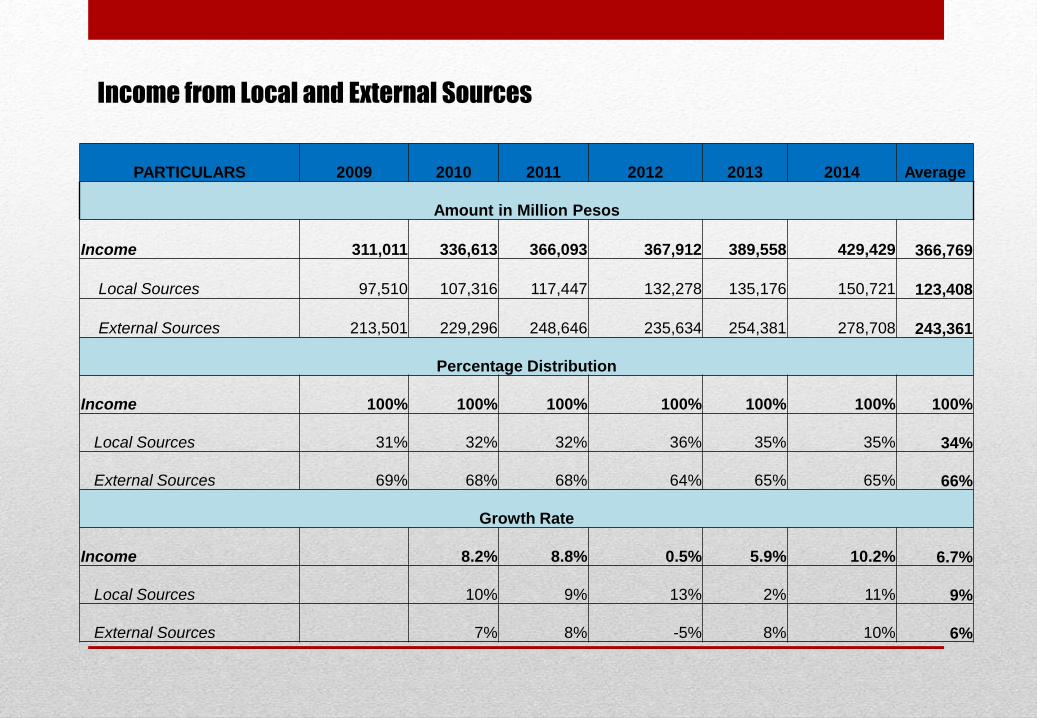
Income from Local and External Sources
PARTICULARS 2009 2010 2011 2012 2013 2014 Average
Amount in Million Pesos
Income
311,011
336,613
366,093
367,912
389,558
429,429
366,769
Local Sources
97,510
107,316
117,447
132,278
135,176
150,721
123,408
External Sources
213,501
229,296
248,646
235,634
254,381
278,708 243,361
Percentage Distribution
Income 100% 100% 100% 100% 100% 100% 100%
Local Sources 31% 32% 32% 36% 35% 35% 34%
External Sources 69% 68% 68% 64% 65% 65% 66%
Growth Rate
Income 8.2% 8.8% 0.5% 5.9% 10.2% 6.7%
Local Sources 10% 9% 13% 2% 11% 9%
External Sources 7% 8% -5% 8% 10% 6%
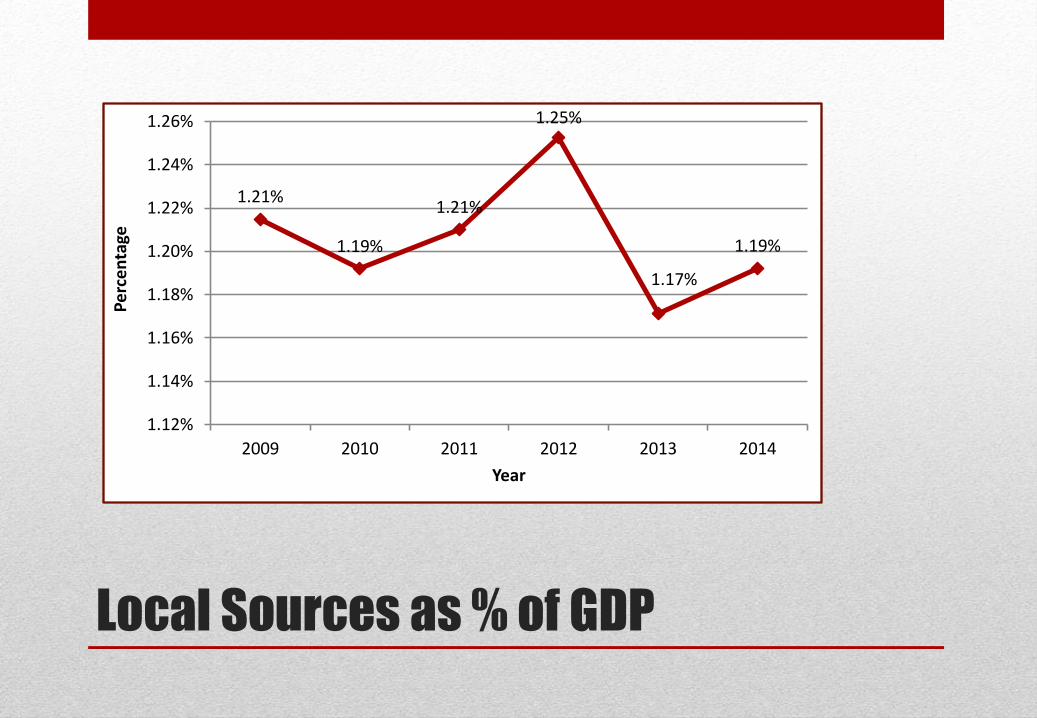
Local Sources as % of GDP
1.21%
1.19%
1.21%
1.25%
1.17%
1.19%
1.12%
1.14%
1.16%
1.18%
1.20%
1.22%
1.24%
1.26%
2009 2010 2011 2012 2013 2014
Pe
rce
nta
ge
Year

Local Sources vs. External Sources
Local Sources
34%
External Sources
66%
Local Sources vs. External Sources (Average Percentage Contribution)
2010 2011 2012 2013 2014
External Sources 7% 8% -5% 8% 10%
Local Sources 10% 9% 13% 2% 11%
-6%
-4%
-2%
0%
2%
4%
6%
8%
10%
12%
14%
Gro
wth
Rat
e
External Sources Local Sources
Growth Rate of Revenues from Local and External Sources
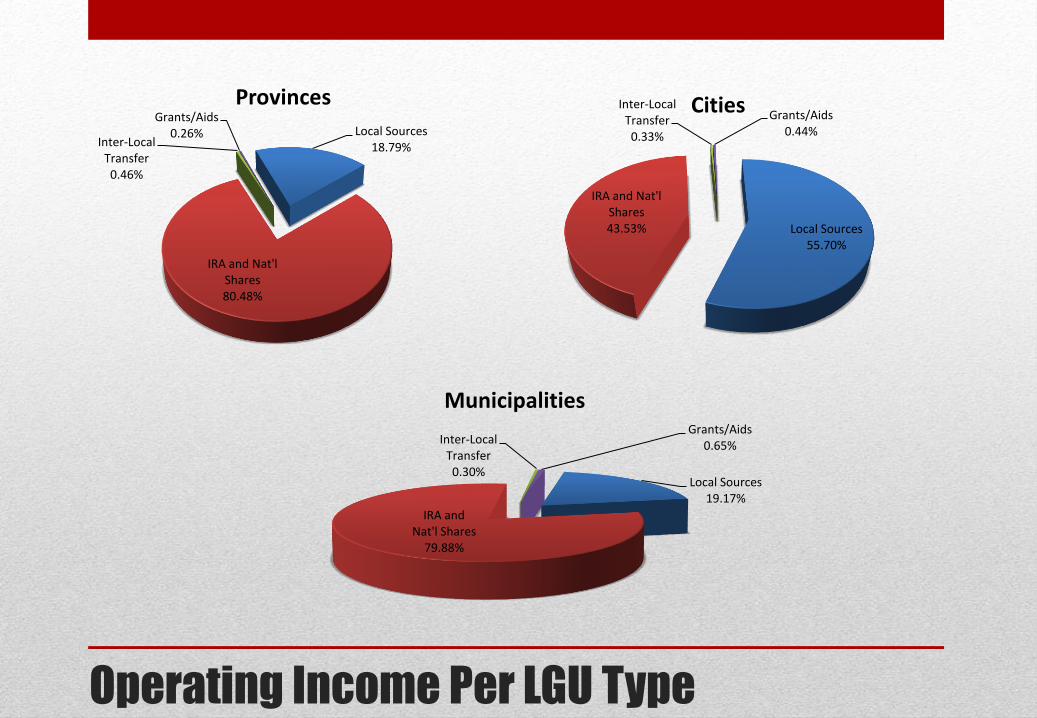
Operating Income Per LGU Type
Local Sources 18.79%
IRA and Nat'l Shares 80.48%
Inter-Local Transfer 0.46%
Grants/Aids 0.26%
Provinces
Local Sources 55.70%
IRA and Nat'l Shares 43.53%
Inter-Local Transfer 0.33%
Grants/Aids 0.44%
Cities
Local Sources 19.17%
IRA and Nat'l Shares
79.88%
Inter-Local Transfer 0.30%
Grants/Aids 0.65%
Municipalities
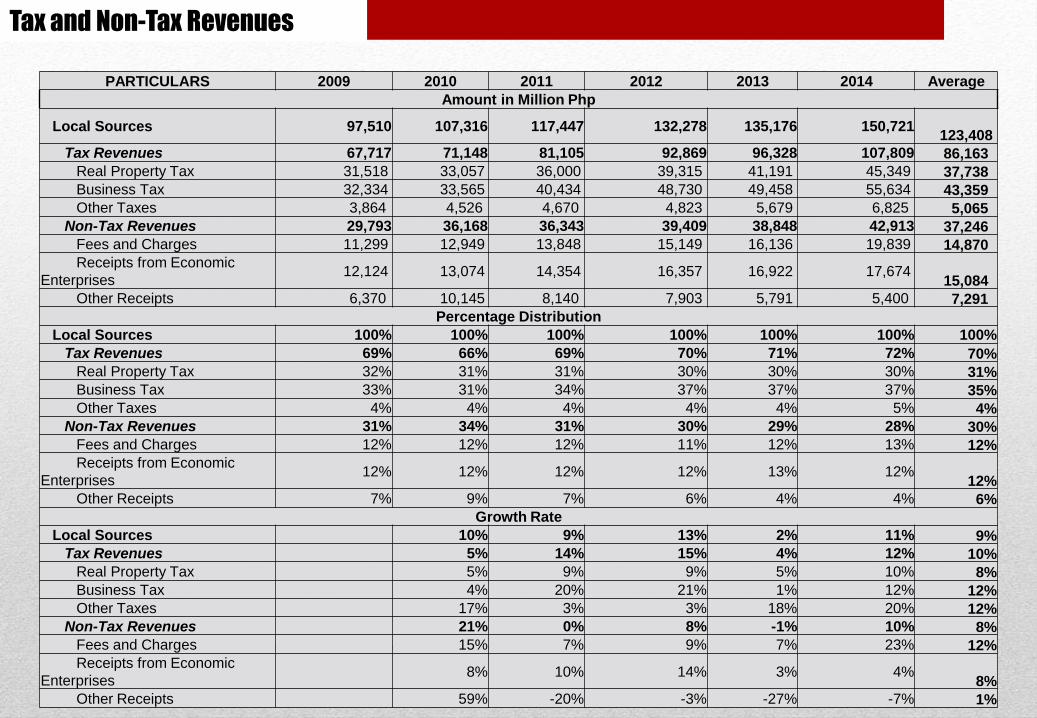
Tax and Non-Tax Revenues
PARTICULARS 2009 2010 2011 2012 2013 2014 Average
Amount in Million Php
Local Sources 97,510 107,316 117,447 132,278 135,176 150,721 123,408
Tax Revenues 67,717 71,148 81,105 92,869 96,328 107,809 86,163
Real Property Tax 31,518 33,057 36,000 39,315 41,191 45,349 37,738
Business Tax 32,334 33,565 40,434 48,730 49,458 55,634 43,359
Other Taxes 3,864 4,526 4,670 4,823 5,679 6,825 5,065
Non-Tax Revenues 29,793 36,168 36,343 39,409 38,848 42,913 37,246
Fees and Charges 11,299 12,949 13,848 15,149 16,136 19,839 14,870
Receipts from Economic
Enterprises 12,124 13,074 14,354 16,357 16,922 17,674
15,084
Other Receipts 6,370 10,145 8,140 7,903 5,791 5,400 7,291
Percentage Distribution
Local Sources 100% 100% 100% 100% 100% 100% 100%
Tax Revenues 69% 66% 69% 70% 71% 72% 70%
Real Property Tax 32% 31% 31% 30% 30% 30% 31%
Business Tax 33% 31% 34% 37% 37% 37% 35%
Other Taxes 4% 4% 4% 4% 4% 5% 4%
Non-Tax Revenues 31% 34% 31% 30% 29% 28% 30%
Fees and Charges 12% 12% 12% 11% 12% 13% 12%
Receipts from Economic
Enterprises 12% 12% 12% 12% 13% 12%
12%
Other Receipts 7% 9% 7% 6% 4% 4% 6%
Growth Rate
Local Sources 10% 9% 13% 2% 11% 9%
Tax Revenues 5% 14% 15% 4% 12% 10%
Real Property Tax 5% 9% 9% 5% 10% 8%
Business Tax 4% 20% 21% 1% 12% 12%
Other Taxes 17% 3% 3% 18% 20% 12%
Non-Tax Revenues 21% 0% 8% -1% 10% 8%
Fees and Charges 15% 7% 9% 7% 23% 12%
Receipts from Economic
Enterprises 8% 10% 14% 3% 4%
8%
Other Receipts 59% -20% -3% -27% -7% 1%
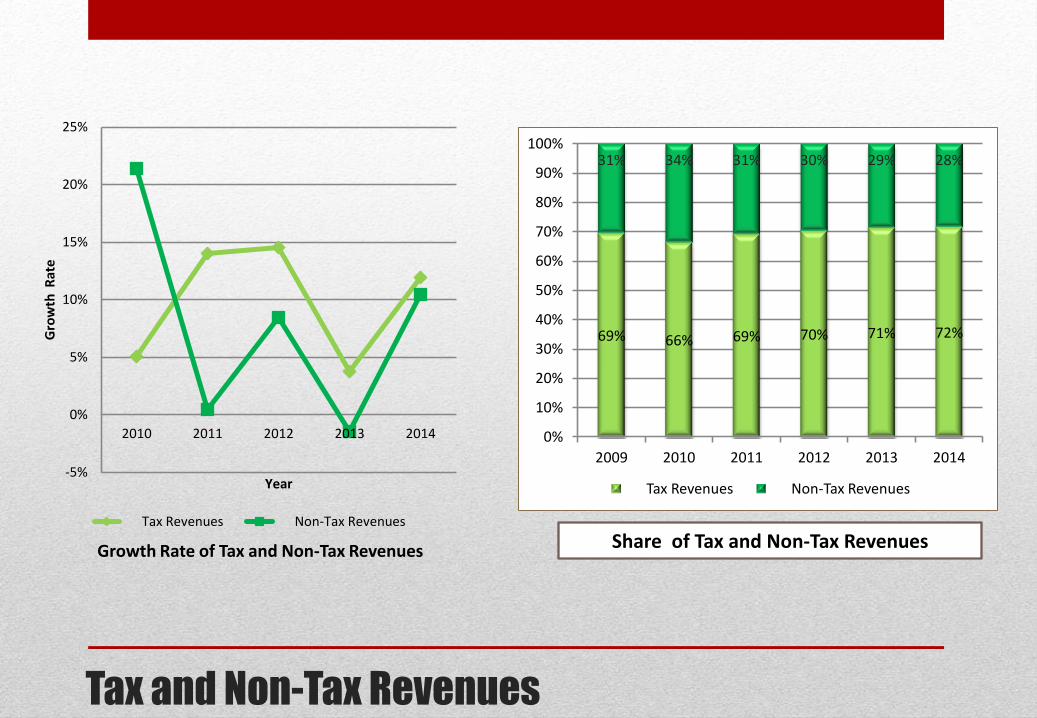
Tax and Non-Tax Revenues
-5%
0%
5%
10%
15%
20%
25%
2010 2011 2012 2013 2014
Gro
wth
Rat
e
Year
Tax Revenues Non-Tax Revenues
69% 66% 69% 70% 71% 72%
31% 34% 31% 30% 29% 28%
0%
10%
20%
30%
40%
50%
60%
70%
80%
90%
100%
2009 2010 2011 2012 2013 2014
Tax Revenues Non-Tax Revenues
Growth Rate of Tax and Non-Tax Revenues Share of Tax and Non-Tax Revenues
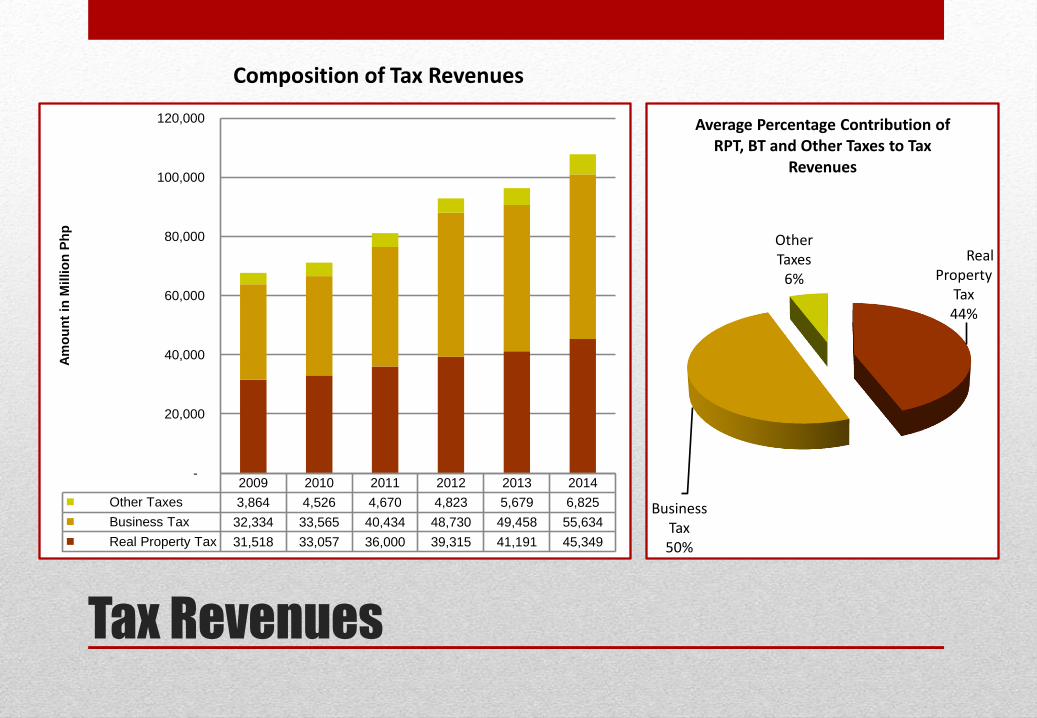
Tax Revenues
Real Property
Tax 44%
Business
Tax 50%
Other Taxes
6%
Average Percentage Contribution of RPT, BT and Other Taxes to Tax
Revenues
2009 2010 2011 2012 2013 2014
Other Taxes 3,864 4,526 4,670 4,823 5,679 6,825
Business Tax 32,334 33,565 40,434 48,730 49,458 55,634
Real Property Tax 31,518 33,057 36,000 39,315 41,191 45,349
-
20,000
40,000
60,000
80,000
100,000
120,000
Am
ou
nt
in M
illi
on
Ph
p
Composition of Tax Revenues
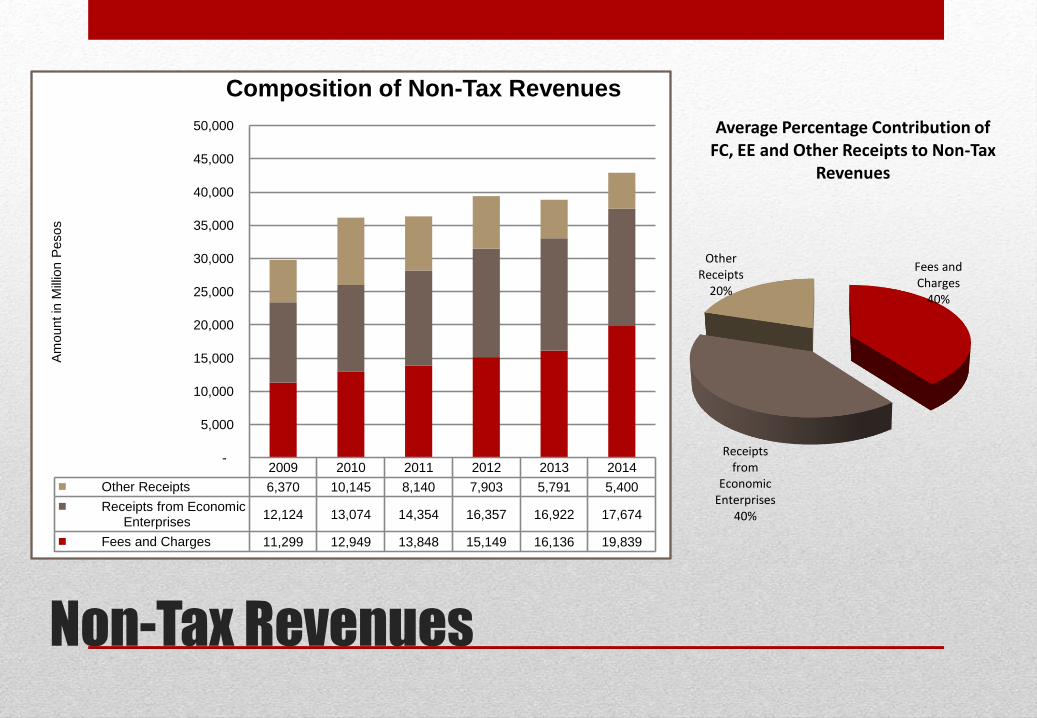
Non-Tax Revenues
Fees and Charges
40%
Receipts
from Economic
Enterprises 40%
Other Receipts
20%
Average Percentage Contribution of FC, EE and Other Receipts to Non-Tax
Revenues
2009 2010 2011 2012 2013 2014
Other Receipts 6,370 10,145 8,140 7,903 5,791 5,400
Receipts from Economic Enterprises
12,124 13,074 14,354 16,357 16,922 17,674
Fees and Charges 11,299 12,949 13,848 15,149 16,136 19,839
-
5,000
10,000
15,000
20,000
25,000
30,000
35,000
40,000
45,000
50,000
Am
ount in
Mill
ion P
esos
Composition of Non-Tax Revenues
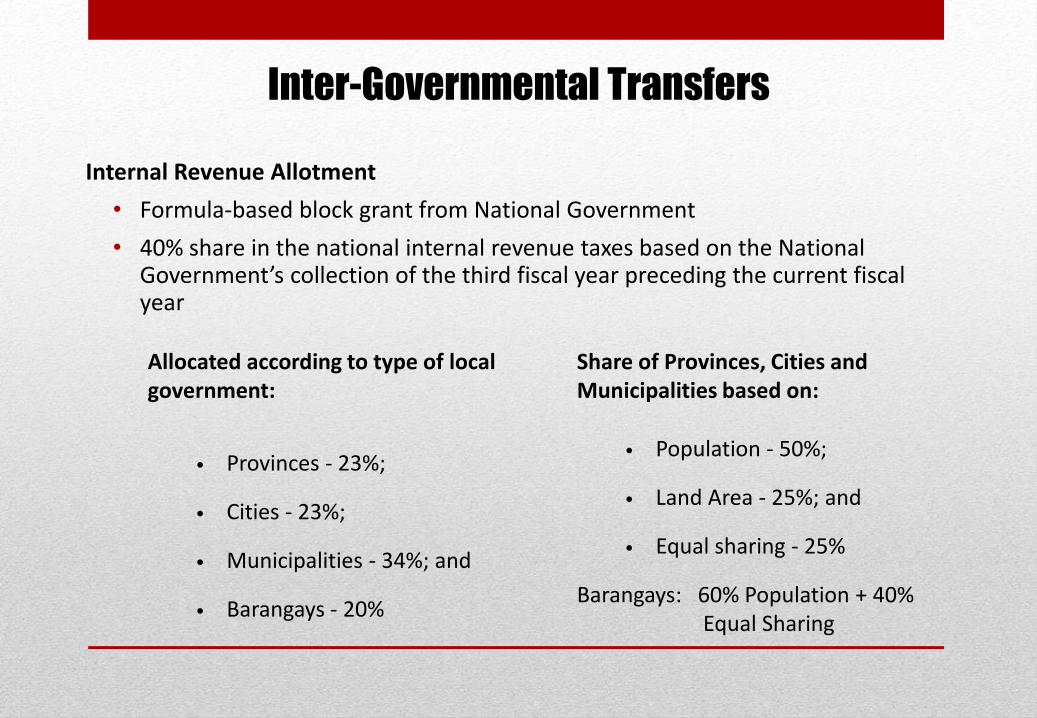
Internal Revenue Allotment
• Formula-based block grant from National Government
• 40% share in the national internal revenue taxes based on the National Government’s collection of the third fiscal year preceding the current fiscal year
Inter-Governmental Transfers
Allocated according to type of local government:
Share of Provinces, Cities and Municipalities based on:
• Provinces - 23%;
• Cities - 23%;
• Municipalities - 34%; and
• Barangays - 20%
• Population - 50%;
• Land Area - 25%; and
• Equal sharing - 25%
Barangays: 60% Population + 40% Equal Sharing
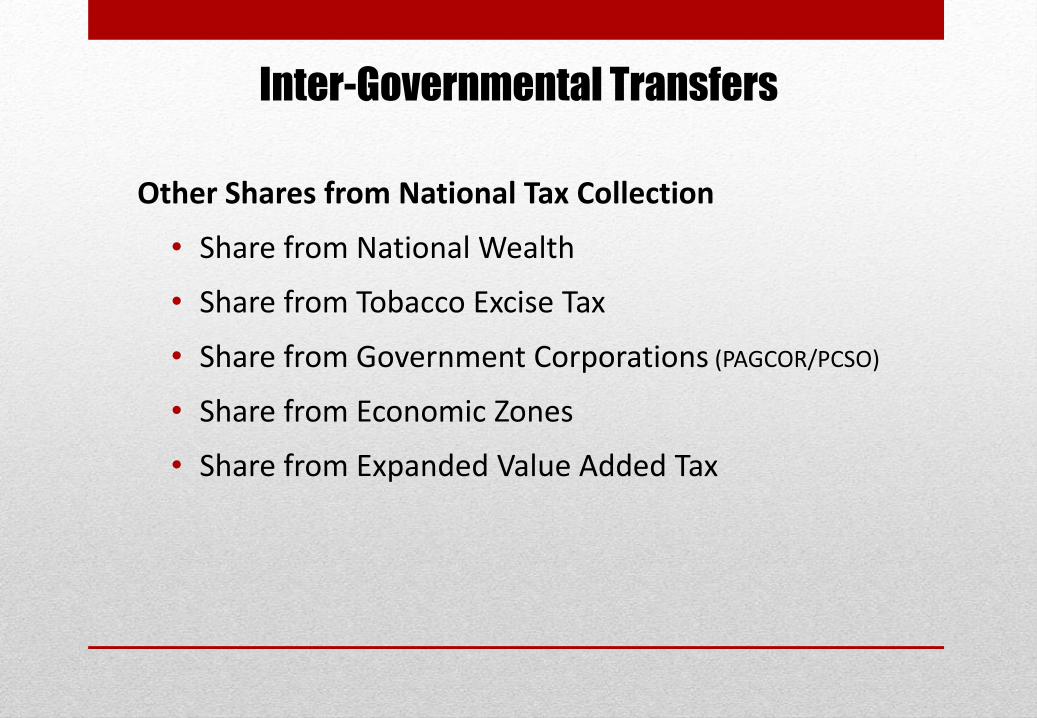
Other Shares from National Tax Collection
• Share from National Wealth
• Share from Tobacco Excise Tax
• Share from Government Corporations (PAGCOR/PCSO)
• Share from Economic Zones
• Share from Expanded Value Added Tax
Inter-Governmental Transfers

IRA and Other Shares from National Wealth
-
20,000.00
40,000.00
60,000.00
80,000.00
100,000.00
120,000.00
140,000.00
2009 2010 2011 2012 2013 2014
Am
ou
nt
in M
illi
on
Ph
p
Province
City
Municipality
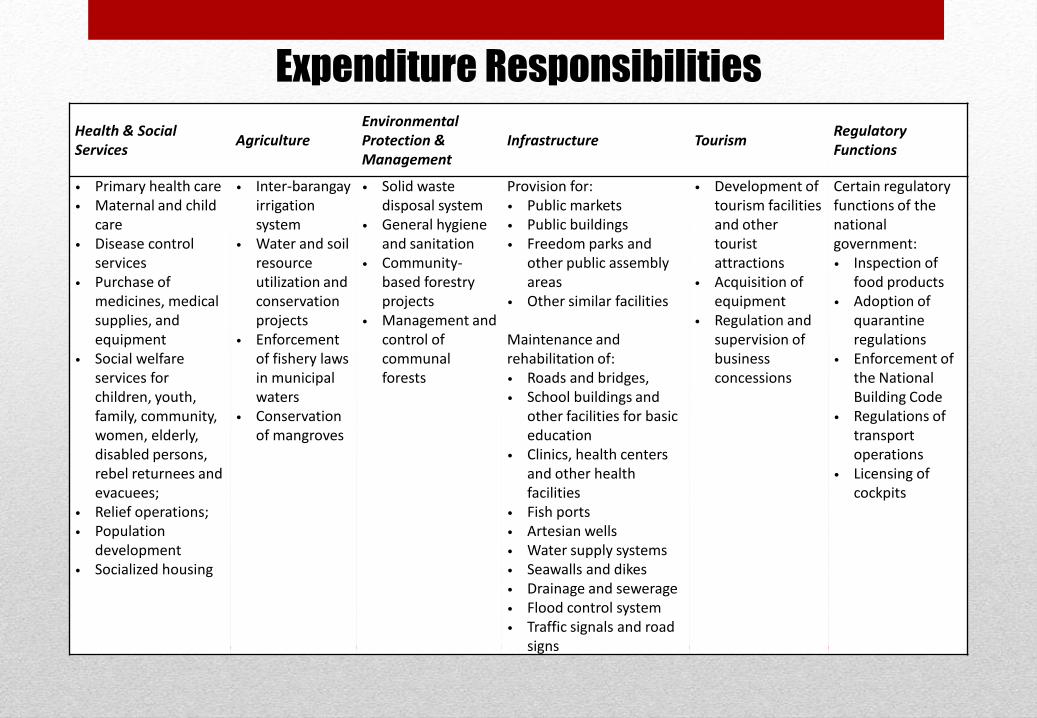
Expenditure Responsibilities
Health & Social Services
Agriculture Environmental Protection & Management
Infrastructure Tourism Regulatory Functions
• Primary health care • Maternal and child
care • Disease control
services • Purchase of
medicines, medical supplies, and equipment
• Social welfare services for children, youth, family, community, women, elderly, disabled persons, rebel returnees and evacuees;
• Relief operations; • Population
development • Socialized housing
• Inter-barangay irrigation system
• Water and soil resource utilization and conservation projects
• Enforcement of fishery laws in municipal waters
• Conservation of mangroves
• Solid waste disposal system
• General hygiene and sanitation
• Community-based forestry projects
• Management and control of communal forests
Provision for: • Public markets • Public buildings • Freedom parks and
other public assembly areas
• Other similar facilities Maintenance and rehabilitation of: • Roads and bridges, • School buildings and
other facilities for basic education
• Clinics, health centers and other health facilities
• Fish ports • Artesian wells • Water supply systems • Seawalls and dikes • Drainage and sewerage • Flood control system • Traffic signals and road
signs
• Development of tourism facilities and other tourist attractions
• Acquisition of equipment
• Regulation and supervision of business concessions
Certain regulatory functions of the national government: • Inspection of
food products • Adoption of
quarantine regulations
• Enforcement of the National Building Code
• Regulations of transport operations
• Licensing of cockpits
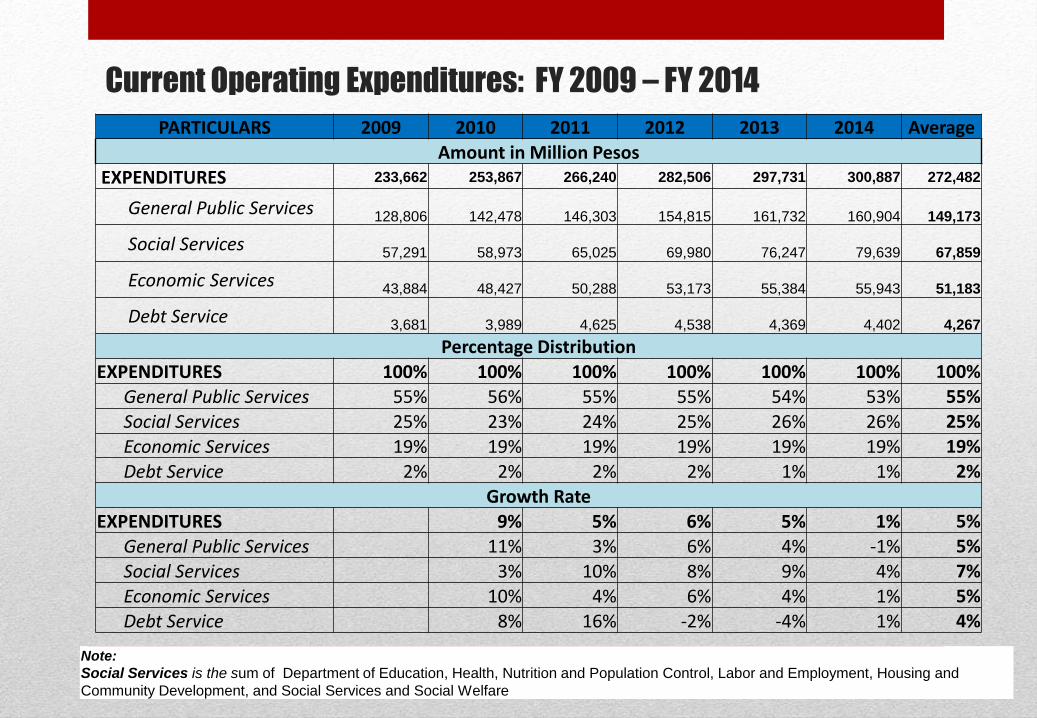
Current Operating Expenditures: FY 2009 – FY 2014
PARTICULARS 2009 2010 2011 2012 2013 2014 Average
Amount in Million Pesos EXPENDITURES 233,662 253,867 266,240 282,506 297,731 300,887 272,482
General Public Services
128,806 142,478 146,303
154,815 161,732
160,904 149,173
Social Services
57,291 58,973 65,025
69,980 76,247
79,639 67,859
Economic Services
43,884 48,427 50,288
53,173 55,384
55,943 51,183
Debt Service
3,681 3,989 4,625
4,538 4,369
4,402 4,267
Percentage Distribution
EXPENDITURES 100% 100% 100% 100% 100% 100% 100%
General Public Services 55% 56% 55% 55% 54% 53% 55%
Social Services 25% 23% 24% 25% 26% 26% 25%
Economic Services 19% 19% 19% 19% 19% 19% 19%
Debt Service 2% 2% 2% 2% 1% 1% 2%
Growth Rate EXPENDITURES 9% 5% 6% 5% 1% 5%
General Public Services 11% 3% 6% 4% -1% 5%
Social Services 3% 10% 8% 9% 4% 7%
Economic Services 10% 4% 6% 4% 1% 5%
Debt Service 8% 16% -2% -4% 1% 4%
Note:
Social Services is the sum of Department of Education, Health, Nutrition and Population Control, Labor and Employment, Housing and
Community Development, and Social Services and Social Welfare
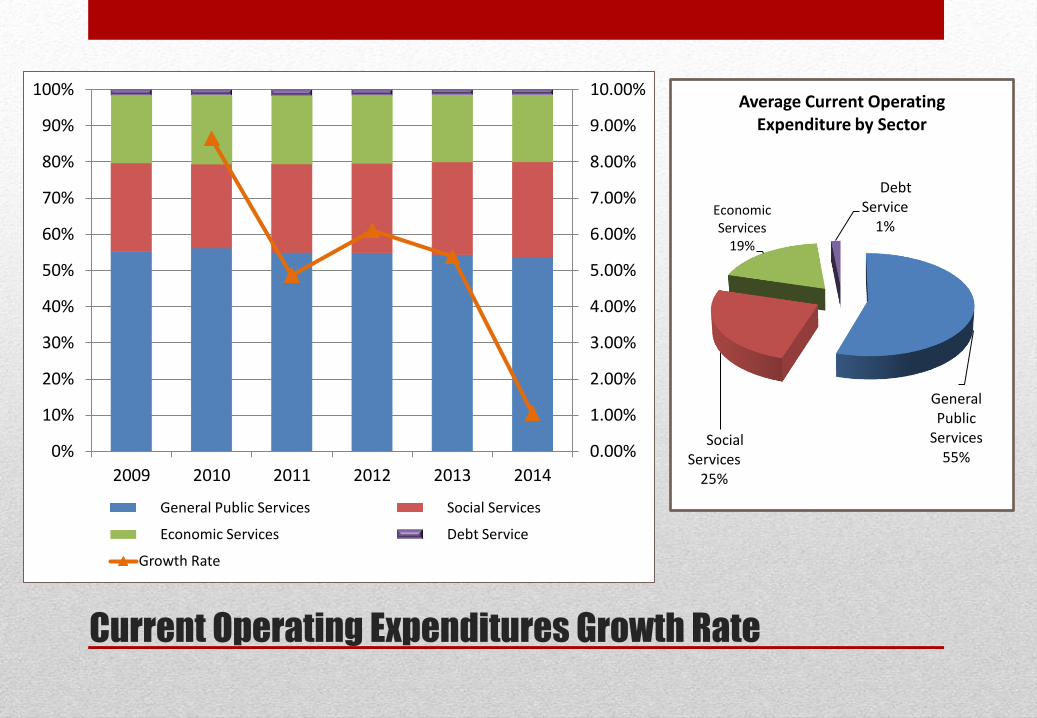
Current Operating Expenditures Growth Rate
0.00%
1.00%
2.00%
3.00%
4.00%
5.00%
6.00%
7.00%
8.00%
9.00%
10.00%
0%
10%
20%
30%
40%
50%
60%
70%
80%
90%
100%
2009 2010 2011 2012 2013 2014
General Public Services Social Services
Economic Services Debt Service
Growth Rate
General Public
Services 55%
Social Services
25%
Economic Services
19%
Debt Service
1%
Average Current Operating Expenditure by Sector
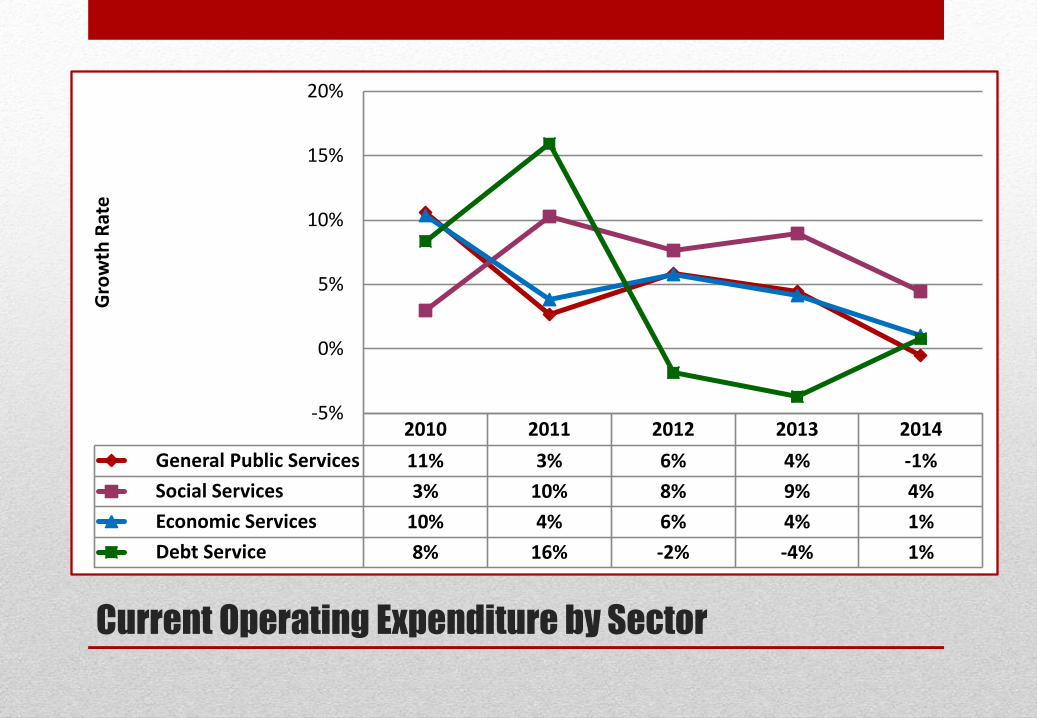
Current Operating Expenditure by Sector
2010 2011 2012 2013 2014
General Public Services 11% 3% 6% 4% -1%
Social Services 3% 10% 8% 9% 4%
Economic Services 10% 4% 6% 4% 1%
Debt Service 8% 16% -2% -4% 1%
-5%
0%
5%
10%
15%
20% G
row
th R
ate
• Any local government unit may create indebtedness, and avail of credit facilities to finance local infrastructure and other socio-economic development projects (based on the approved local development plan and public investment program)
• Forms of indebtedness/credit facilities: • Loans, deferred payment and other financial schemes • Bonds and other long-term securities • Inter-local government loans, grants, and subsidies. • Loans from funds secured by NG from foreign sources • Build-Operate-Transfer/Joint Ventures: financing, construction,
maintenance, operation, and management of infrastructure projects by the private sector
Sub-national Debt/Borrowing
• Statutory Limitations: the amount of appropriations for debt servicing shall not exceed 20% of the regular income of the local government unit concerned.
• Ex ante monitoring/regulations: DOF/BLGF certifies debts service ceiling and net borrowing capacity of LGUs; the Monetary Board issues opinion on the monetary and balance of payments implications for every proposed borrowing of local governments
• Policy preference to secure loans with government financial institutions
Sub-national Debt/Borrowing

LGU Borrowings
0.00%
0.10%
0.20%
0.30%
0.40%
0.50%
0.60%
0.70%
0.80%
0
10,000
20,000
30,000
40,000
50,000
60,000
70,000
80,000
2009 2010 2011 2012 2013 2014
Am
ou
nt
in M
illi
on
Ph
p
LGU Debt Service LGUs Loans Oustanding
LGU Debt Service (% of GDP) LGUs Loans Oustanding (% of GDP)
The Bureau of Local Government Finance
• Role of the BLGF
• Legal Basis & Mandate
• Clientele
• Organizational Structure
• Strategic Thrusts and Programs
• Special Projects
VISION:
The Bureau of Local Government Finance of the Department of Finance is the focal agency
and an authority in local finance that aims to be at the forefront of local economic growth
leading the way towards national development.
Role of the BLGF
• As an attached agency of the Department of Finance (DOF), the BLGF supports the DOF’s mandate to:
Supervise the revenue operations of all local government units; and
Monitor and support the implementation of policies and measures on local revenue administration;
• Provide technical assistance to local governments on local treasury and assessment operations, and overall revenue generation activities
• Assist in policy development and implementation to promote fiscal decentralization in the LGUs
• Assist the DOF in appointment and overall administrative supervision of local treasurers and in providing technical supervision to assessors in all local governments
Legal Basis & Mandate
Section 43 of Executive Order No. 127 of 1987, as amended
• Assist in the formulation and implementation of policies on local
government revenue administration and fund management;
• Assist LGUs in the development and implementation of Real Property Tax
Administration (RPTA) projects;
• Develop plans and programs for the improvement of tax collection
enforcement mechanisms and credit utilization schemes at the local levels;
• Exercise administrative and/or technical supervision over local treasury
and assessment operations;
• Exercise line supervision over its regional offices and coordinate regional
activities to maximize manpower and financial resources; and
• Perform such other appropriate functions as maybe assigned.
Legal Basis & Mandate
Local Government Code of 1991 (RA 7160) and its Implementing Rules & Regulations
• Assist in the promulgation of necessary rules and regulations for the classification, appraisal and assessment of real property necessary for taxation purposes (Sec. 201)
• Assist in the promulgation of necessary rules and regulations for simplified disbursement scheme designed for the speedy and effective enforcement of the IRA system (Sec. 288);
• Appointment of the treasurer of each LGU from at least three (3) ranking eligible recommendees of the Local Chief Executive, subject to civil service law, rules and regulations (Sec. 470 and 471);
• Certification of the requirements for the creation of LGU or conversion from one level to another (Sec. 7); and
• Income classification of LGUs (Sec. 8)
BLGF Clientele
• LGUs: Local Chief Executives, Local Legislative, Council,
Local Finance Committee, Local Treasurer, Assistant
Treasurer and Treasury Personnel, Local Assessor,
Assistant Assessor and Assessment Personnel
• National Government Agencies: DOF, DILG, DEN, DAR,
DBM, NEDA, CSC, COA, Ombudsman
• Government Financial Institutions: BSP, LBP, DBP, etc.
• Development Partners/Bilateral/Multilateral Institutions
• General Public/Taxpayers
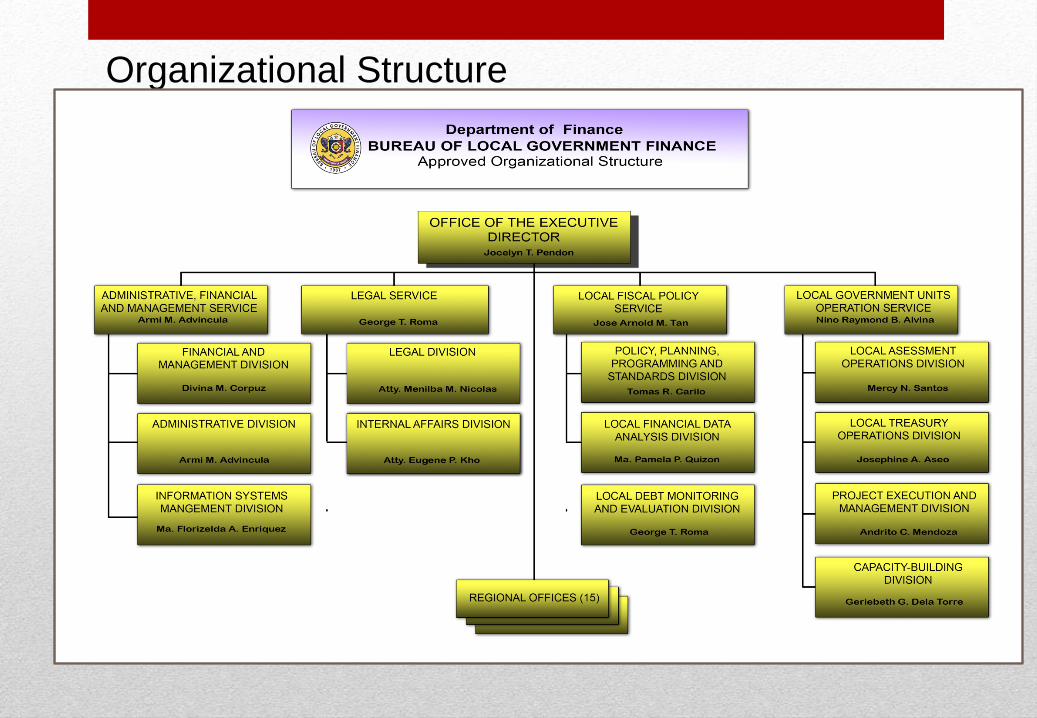
Organizational Structure

Special Projects
Local Government Finance and Development
Project (with MDFO)
Second Land Administration & Management
Project (with DENR, LRA)
LGU Public Financial Management (with DBM,
DILG, COA, NEDA)
Support to Local Government Revenue
Generation and Land Administration &
Management (with DENR)
LOGOFIND
EU PFM 2
ADB TA 7809
REGALA
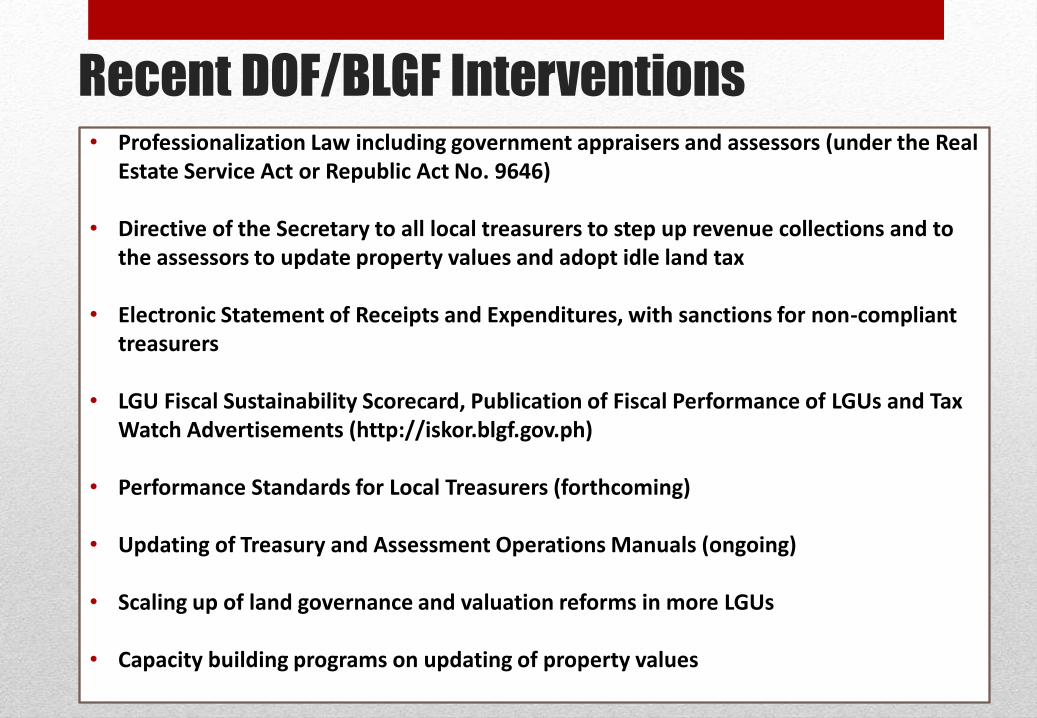
Recent DOF/BLGF Interventions • Professionalization Law including government appraisers and assessors (under the Real
Estate Service Act or Republic Act No. 9646)
• Directive of the Secretary to all local treasurers to step up revenue collections and to the assessors to update property values and adopt idle land tax
• Electronic Statement of Receipts and Expenditures, with sanctions for non-compliant treasurers
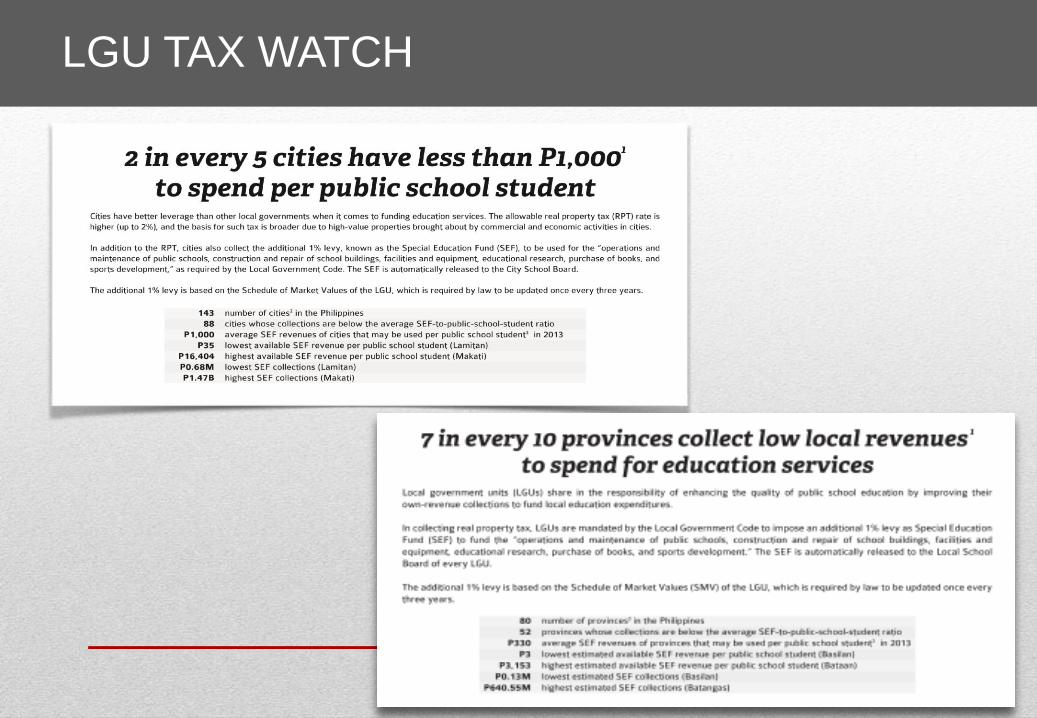
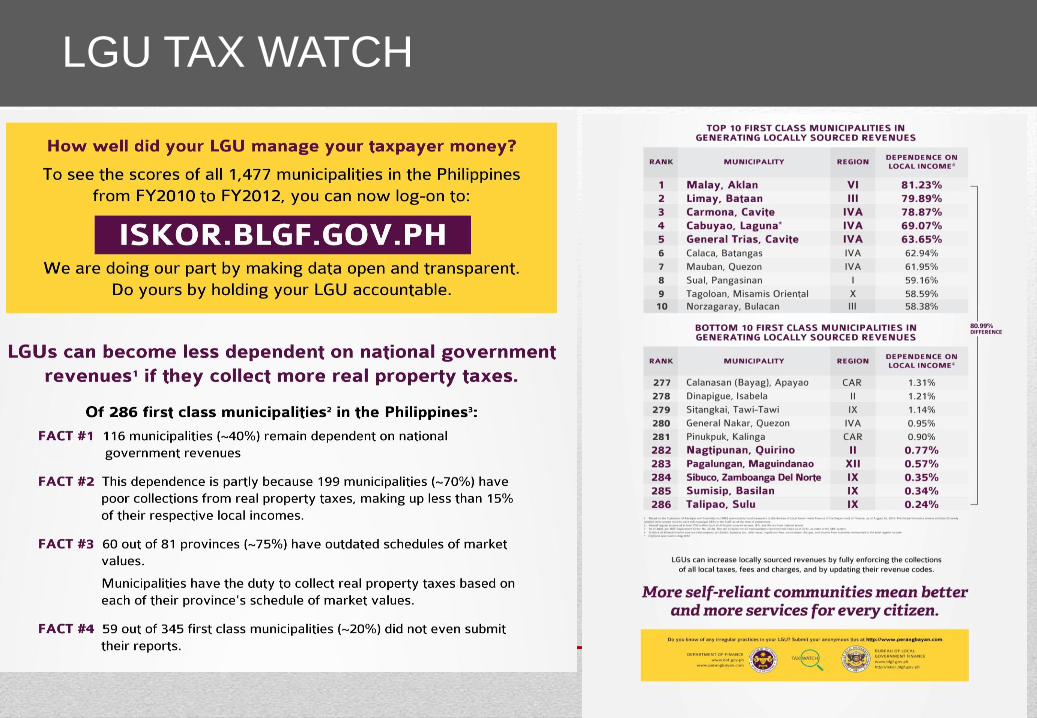
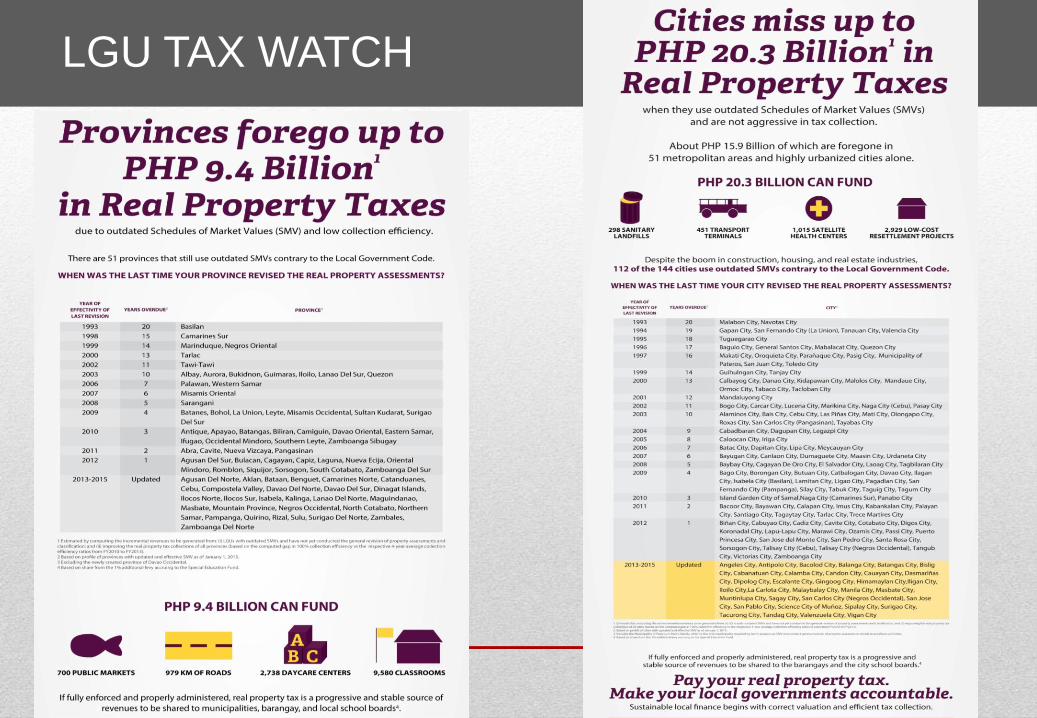
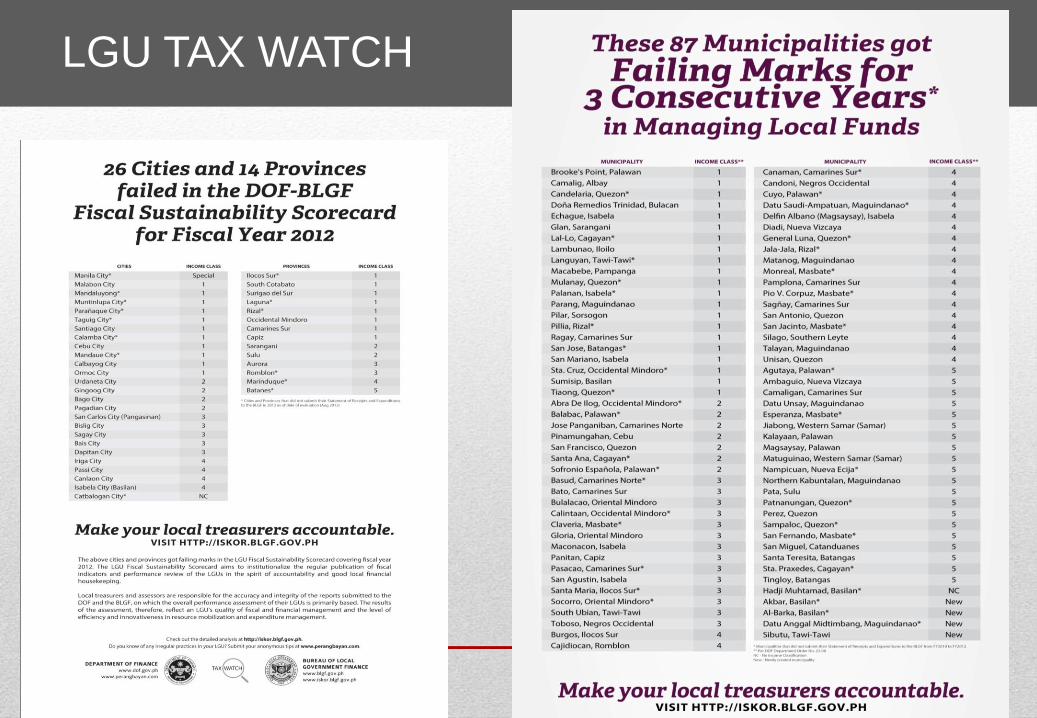
• LGU Fiscal Sustainability Scorecard, Publication of Fiscal Performance of LGUs and Tax Watch Advertisements (http://iskor.blgf.gov.ph)
• Performance Standards for Local Treasurers (forthcoming)
• Updating of Treasury and Assessment Operations Manuals (ongoing)
• Scaling up of land governance and valuation reforms in more LGUs
• Capacity building programs on updating of property values
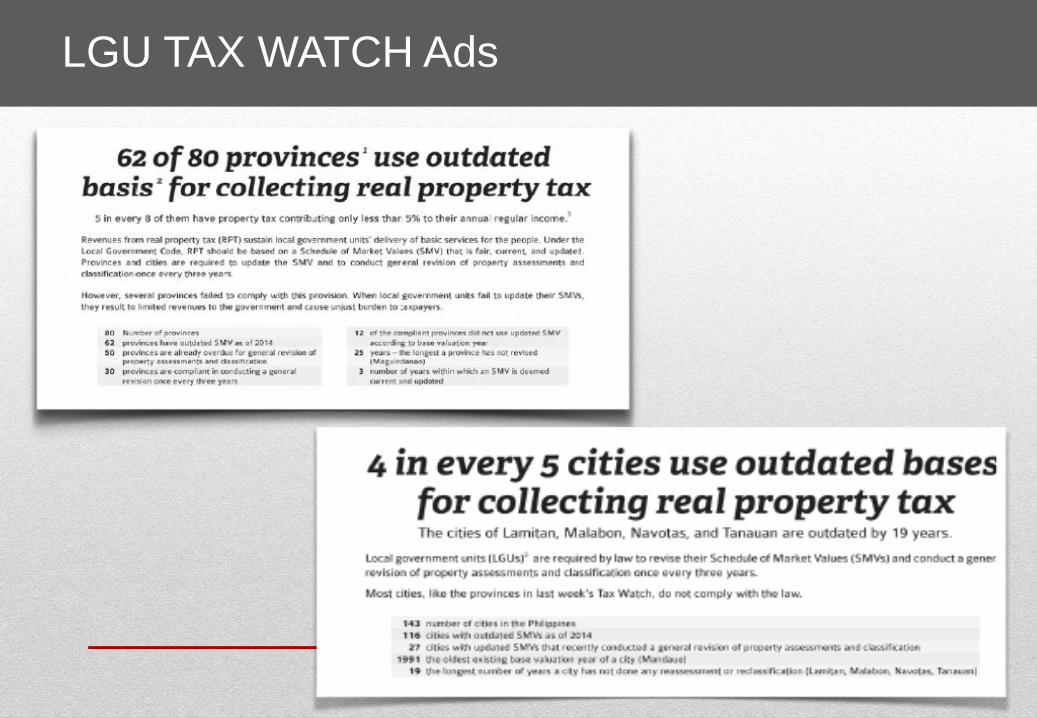
LGU TAX WATCH Ads
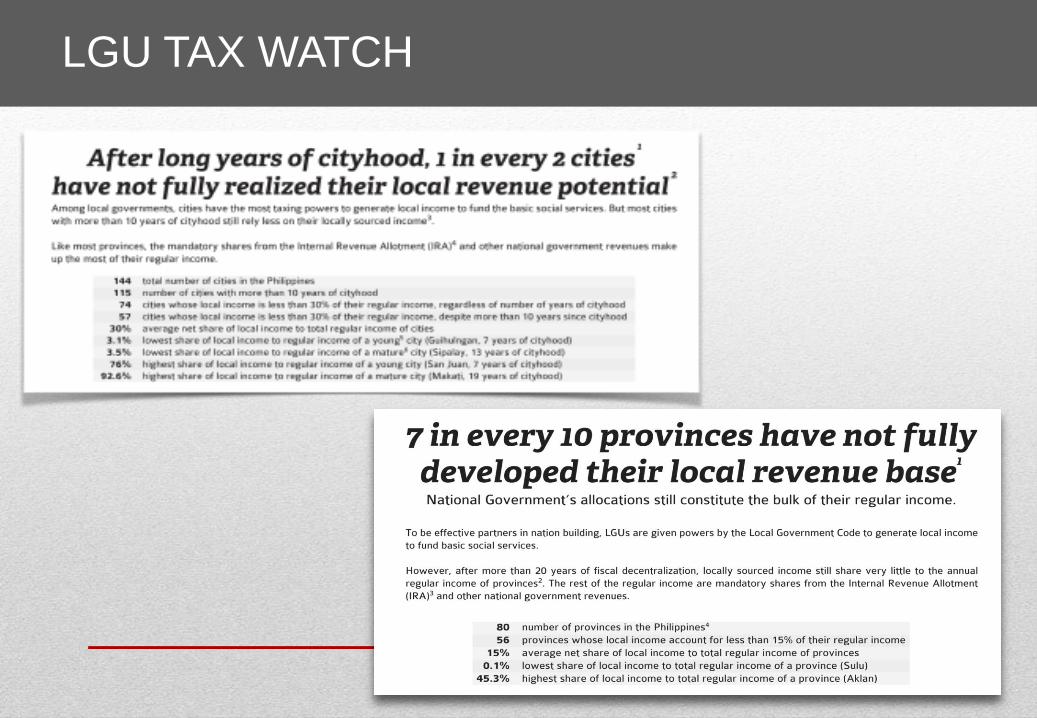
LGU TAX WATCH
LGU TAX WATCH
LGU TAX WATCH
LGU TAX WATCH
LGU TAX WATCH
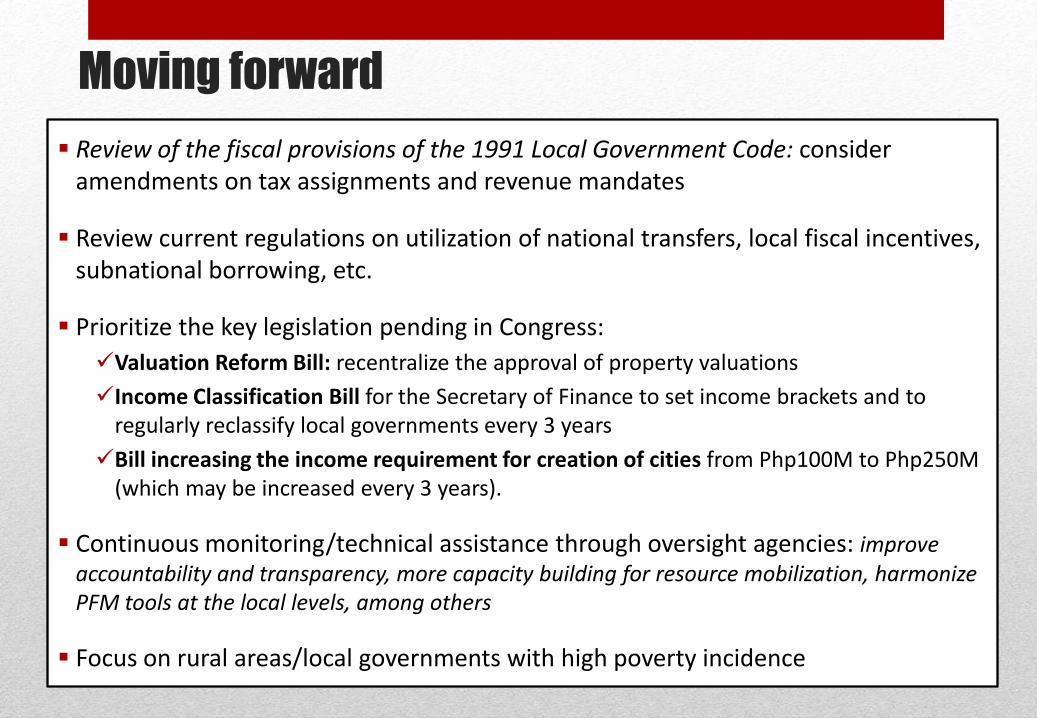
Moving forward
Review of the fiscal provisions of the 1991 Local Government Code: consider amendments on tax assignments and revenue mandates
Review current regulations on utilization of national transfers, local fiscal incentives, subnational borrowing, etc.
Prioritize the key legislation pending in Congress:
Valuation Reform Bill: recentralize the approval of property valuations
Income Classification Bill for the Secretary of Finance to set income brackets and to regularly reclassify local governments every 3 years
Bill increasing the income requirement for creation of cities from Php100M to Php250M (which may be increased every 3 years).
Continuous monitoring/technical assistance through oversight agencies: improve accountability and transparency, more capacity building for resource mobilization, harmonize PFM tools at the local levels, among others
Focus on rural areas/local governments with high poverty incidence

THANK YOU & MABUHAY!
Related Documents