Burden of tobacco use in Australia Australian Burden of Disease Study 2015

Welcome message from author
This document is posted to help you gain knowledge. Please leave a comment to let me know what you think about it! Share it to your friends and learn new things together.
Transcript
Stronger evidence, better decisions, improved health and welfare
Stronger evidence, better decisions, im
proved health and welfare
Burden of tobacco use in Australia
Australian Burden of Disease Study 2015
aihw.gov.au
Stronger evidence, better decisions, improved health and welfare
Burden of tobacco use in Australia: Australian Burden of Disease Study 2015
This report quantifies the health burden that tobacco use places on Australia. Tobacco use contributes to health burden more than any other risk factor and was responsible for 9.3% of the total burden of disease in Australia in 2015. The report highlights that health inequalities exist, with lower socioeconomic groups and more remote areas generally experiencing higher rates of disease burden due to tobacco use.

Australian Institute of Health and Welfare Canberra
Cat. no. BOD 20
Australian Burden of Disease Study Series
Number 21
Burden of tobacco use in Australia
Australian Burden of Disease Study 2015
The Australian Institute of Health and Welfare is a major national agency whose purpose is to create authoritative and accessible information and statistics that inform decisions and improve the health and welfare of all Australians.
© Australian Institute of Health and Welfare 2019
This product, excluding the AIHW logo, Commonwealth Coat of Arms and any material owned by a third party or protected by a trademark, has been released under a Creative Commons BY 3.0 (CC-BY 3.0) licence. Excluded material owned by third parties may include, for example, design and layout, images obtained under licence from third parties and signatures. We have made all reasonable efforts to identify and label material owned by third parties.
You may distribute, remix and build upon this work. However, you must attribute the AIHW as the copyright holder of the work in compliance with our attribution policy available at www.aihw.gov.au/copyright/. The full terms and conditions of this licence are available at http://creativecommons.org/licenses/by/3.0/au/.
This publication is part of the Australian Institute of Health and Welfare’s Australian Burden of Disease Study series. A complete list of the Institute’s publications is available from the Institute’s website www.aihw.gov.au.
ISSN 2204-4108 (Online) ISSN 2006-4508 (Print) ISBN 978-1-76054-630-4 (Online) ISBN 978-1-76054-631-1 (Print) DOI 10.25816/5ebca654fa7de
Suggested citation Australian Institute of Health and Welfare 2019. Burden of tobacco use in Australia: Australian Burden of Disease Study 2015. Australian Burden of Disease series no. 21. Cat. no. BOD 20. Canberra: AIHW.
Australian Institute of Health and Welfare Board Chair Chief Executive Officer Mrs Louise Markus Mr Barry Sandison
Any enquiries relating to copyright or comments on this publication should be directed to: Australian Institute of Health and Welfare GPO Box 570 Canberra ACT 2601 Tel: (02) 6244 1000 Email: [email protected]
Published by the Australian Institute of Health and Welfare
This publication is printed in accordance with ISO 14001 (Environmental Management Systems) and ISO 9001 (Quality Management Systems). The paper is sourced from sustainably managed certified forests.
Please note that there is the potential for minor revisions of data in this report. Please check the online version at www.aihw.gov.au for any amendments.
iii
Contents Summary ............................................................................................................................... v
1 Introduction ................................................................................................................... 1
1.1 Aims of this report .................................................................................................. 2
1.2 Tobacco use in Australia ........................................................................................ 2
1.3 Policy context ......................................................................................................... 2
1.4 Smoking across population groups ......................................................................... 3
1.5 What is burden of disease? .................................................................................... 4
1.6 How was exposure to tobacco use defined and estimated? .................................... 6
1.7 Structure of this report ............................................................................................ 7
2 Tobacco use in Australia .............................................................................................. 8
2.1 Burden from tobacco use ....................................................................................... 8
2.2 Burden from tobacco use by linked disease ......................................................... 11
2.3 What is the impact of using Australian effect size data? ....................................... 20
3 Tobacco use in key population groups in 2015 ......................................................... 23
3.1 State and territory ................................................................................................. 23
3.2 Remoteness area ................................................................................................. 25
3.3 Socioeconomic group ........................................................................................... 29
3.4 People diagnosed with a mental health condition: a scenario analysis ................. 33
4 Tobacco use over time ................................................................................................ 37
4.1 Changes in burden from tobacco use between 2003, 2011 and 2015 .................. 37
4.2 Drivers of change in total attributable burden over time ........................................ 39
4.3 Potential burden from tobacco use in 2020 and 2025 ........................................... 43
5 Tobacco, alcohol and illicit drug use combined ....................................................... 45
5.1 Burden from tobacco, alcohol and illicit drug use .................................................. 45
Appendix A: Detailed methods .......................................................................................... 47
How is attributable burden measured? .......................................................................... 47
Selection of linked diseases .......................................................................................... 47
Theoretical minimum risk exposure distribution ............................................................. 48
Estimates for key population groups .............................................................................. 51
Drivers of change in attributable burden over time ......................................................... 53
Estimating potential burden in 2020 and 2025 ............................................................... 54
Estimating the combined effect of tobacco, alcohol and illicit drug use .......................... 55
Appendix B: Additional tables ........................................................................................... 56
Acknowledgments .............................................................................................................. 68
iv
Abbreviations ..................................................................................................................... 69
Symbols .............................................................................................................................. 69
Glossary .............................................................................................................................. 70
References .......................................................................................................................... 72
List of tables ....................................................................................................................... 76
List of figures ..................................................................................................................... 78
Related publications .......................................................................................................... 80
v
Summary Tobacco use contributes to health burden more than any other risk factor and was responsible for 9.3% of the total burden of disease in Australia in 2015.
This report extends estimates published in the Australian Burden of Disease Study (ABDS) 2015 (AIHW 2019a). It provides insight into the health impact of tobacco use in Australia, including as a risk factor for specific diseases such as lung cancer, chronic obstructive pulmonary disease (COPD) and coronary heart disease. The health impact comprises both fatal burden (dying prematurely) and non-fatal burden (living with disease) and is reported using a summary measure of health called disability-adjusted life years, or DALY.
Most of the burden attributable to tobacco use was fatal Tobacco use contributed to 13% of deaths in Australia in 2015, equivalent to 20,933 deaths. It contributed to more deaths in males than females. Almost three-quarters of the tobacco use burden was due to fatal outcomes. Tobacco use was responsible for 14% of all fatal burden and 5.0% of all non-fatal burden.
Cancers accounted for nearly half of the burden due to tobacco use Forty-three per cent of the burden attributable to tobacco use was due to cancer, and almost two-thirds of this was from lung cancer (28% of total tobacco burden).
COPD accounted for 30% of the burden attributable to tobacco use, with the burden higher in females (38%) than males (25%).
Cardiovascular diseases were responsible for 17% of the burden due to tobacco use—primarily related to coronary heart disease (10%) and stroke (3.1%). Males experienced 2.2 times the amount of cardiovascular disease burden due to tobacco use than females.
Tobacco use burden is higher for some population groups The burden from tobacco use varied according to where a person lived, their socioeconomic group and mental health status. Age-standardised rates were higher in:
• the Northern Territory (2.1 times as high) than in all of Australia • the lowest socioeconomic areas (2.6 times as high) than in the highest socioeconomic
areas • Remote and very remote areas combined (1.8 times as high) than in Major cities • people with a mental health condition (1.5 times as high) than in people without a mental
health condition.
Past smoking is still causing disease burden, especially in females The overall burden attributable to tobacco use (number of DALY) rose by 2.0% between 2003 and 2015. The change in tobacco use burden between 2003 and 2015 varied by sex and for current and past smoking. There was a:
• 6.8% decrease for burden in males and a 17% increase in females • 20% decrease for burden linked to current smoking (23% in males and 14% in females) • 15% increase for burden linked to past smoking (3.2% in males and 33% in females).
vi
Given that some linked diseases such as lung cancer and COPD can take a number of years to develop, the effects of past smoking are expected to continue to have an impact on disease burden into the near future, particularly on females.
Tobacco use burden rate has decreased over time After accounting for population increase and ageing, the rate of disease burden due to tobacco use fell between 2003 and 2015 by 24%. The decrease was seen in all the leading 6 linked diseases: COPD, lung cancer, coronary heart disease, oesophageal cancer, stroke and asthma.
Potential burden rate is predicted to fall by 2020 and 2025 The age-standardised rate of attributable burden due to tobacco use is projected to decrease by 5.8% by 2020 (from 16.4 DALY per 1,000 population in 2015 to 15.5 DALY per 1,000 in 2020) and by 9.5% by 2025 (to 14.9 DALY per 1,000). The decline projected by 2025 is greater for males (a 12% decline) than for females (a 6.1% decline).
Tobacco, alcohol and illicit drug use combined contributed to more burden and deaths in males than in females Tobacco, alcohol and illicit drug use combined contributed to 16% of the total burden of disease in 2015. This was greater in males (19%) than in females (12%). After adjusting for age, the rate of combined burden for these risk factors was almost twice (1.9 times) as high in males (39 DALY per 1,000 population) than in females (20 per 1,000).
Together, tobacco, alcohol and illicit drug use contributed to 18% of deaths in Australia in 2015, equivalent to 28,552 deaths. These risk factors combined contributed to more than 1 in 5 deaths in males (21%), and 15% of deaths in females.
Burden of tobacco use in Australia: ABDS 2015 1
1 Introduction Tobacco use is responsible for substantial health burden in Australia as a risk factor for disease and premature death. The consumption of tobacco is widely recognised as a major cause of ill health in active smokers and, to a lesser extent, non-smokers through their exposure to second-hand smoke.
Health consequences for smokers include the development of chronic conditions, such as respiratory diseases, cardiovascular diseases and cancer (US DHHS 2014). Mortality is significantly increased in current smokers (with up to two-thirds of deaths in smokers attributable to smoking) and in past smokers, though mortality does decrease with more time since quitting (Banks et al. 2015; Carter et al. 2015). Over one-third of deaths from cardiovascular diseases and one-quarter of acute coronary syndrome hospitalisations in Australians aged under 65 can be attributed to smoking (Banks et al 2019). On average, people who have never smoked live 10–11 years longer than long-term smokers (Banks et al. 2015; Pirie et al. 2013).
No level of exposure to second-hand tobacco smoke is considered safe. Second-hand smoke affects people of all ages; it can cause low birthweight, sudden death of infants, and cardiovascular and respiratory diseases in adults, including coronary heart disease and lung cancer (WHO 2018).
Burden of disease analysis measures the combined impact of dying prematurely and of living with disease. It takes into account age at death and severity of disease for all diseases, conditions and injuries, in a consistent and comparable way. As well as describing the disease burden, the analysis estimates the contribution of various risk factors (termed ‘attributable burden’) to this health loss. The estimates produced from a burden of disease study are considered to be the best summary measure of a population’s health.
The Australian Burden of Disease Study (ABDS) 2015 estimated the burden of 216 specific diseases and injuries—and the contribution of more than 30 risk factors to this disease burden—for the Australian population in 2015, 2011 and 2003. The contribution of tobacco use as a risk factor for disease was measured (AIHW 2019a).
This report expands on the ABDS analysis to provide further insight into the health burden of tobacco use, and to highlight the importance of reducing the harm caused by tobacco. Estimates of the burden due to tobacco use are reported by different population groups (state and territory, remoteness, socioeconomic group). Other population groups, including Indigenous Australians, were out of scope of this study. While some population groups are discussed in more detail in this report, there may be further populations with a high prevalence of smoking.
These estimates highlight the varying and complex association between tobacco use and health, and they can be used to prioritise actions to minimise the harm of tobacco. This report also presents estimates of the potential burden due to tobacco use in 2020 and 2025 if current trends continue and includes an analysis of one particular population with higher rates of tobacco use: people diagnosed with a mental health condition.
2 Burden of tobacco use in Australia: ABDS 2015
1.1 Aims of this report This project:
• updates estimates of disease burden attributable to tobacco use based on the international and Australian-specific evidence on linked diseases and relative risks and on high-quality Australian estimates of exposure.
• provides detailed reporting for tobacco use separately for direct tobacco use (current/past) and second-hand smoke exposure. This includes detailed analysis of these enhanced estimates, including changes in burden between 2003, 2011 and 2015.
• provides estimates of burden attributable to tobacco use at sub-national levels (by state/territory, remoteness and socioeconomic group).
• provides estimates of burden attributable to current tobacco use in people with a mental health condition.
• uses projections to explore the potential impact on disease burden due to continuing trends in prevalence of tobacco use in 2020 and 2025. This provides an estimate of the expected future disease burden.
• explores the joint (combined) impact of tobacco use with alcohol and illicit drug use.
1.2 Tobacco use in Australia Australia has one of the lowest daily smoking rates among Organisation for Economic Co-operation and Development countries, ranking fifth alongside Canada and Norway (OECD 2019). Australia has made great progress in tobacco control in recent years; however, tobacco use remains an important risk factor and is associated with increased risk of chronic disease and premature death. Findings from the self-reported data in the National Drug Strategy Household Survey (NDSHS) 2016 show that, for people aged 14 and over:
• 12% were daily smokers and a further 2.7% smoked occasionally • 23% were ex-smokers • 62% had never smoked (AIHW 2018a).
Some positive trends in smoking rates have emerged from the survey data. From 1991 to 2016, the rate of daily smoking halved (24% to 12%). As well, the proportion of people reporting never having smoked rose from 49% to 62% over the same period (AIHW 2017). A significant reduction was seen in children exposed to second-hand smoke, from 31% of households where someone smoked inside in 1995 to 2.8% in 2016 (AIHW 2018a).
Data from the NDSHS were used in this report to estimate the burden attributable to tobacco use. The latest available estimates from the National Health Survey in 2017–18 show similar trends, but different rates, to the NDSHS (ABS 2019).
1.3 Policy context Australia’s progress in tobacco control over the last 25 years has been driven by a comprehensive range of measures that include (but are not limited to) smoke-free laws, tobacco excise increases, media campaigns and restrictions on tobacco advertising and promotion (Wakefield et al. 2014).
Burden of tobacco use in Australia: ABDS 2015 3
Australia’s approach to tobacco control is outlined in the National Tobacco Strategy (NTS) 2012–2018, a sub-strategy of the National Drug Strategy 2017–2026 (Department of Health 2017). The NTS sets out a national framework for the Australian, state and territory governments and non-government organisations to improve the health of all Australians by reducing the prevalence of smoking (and its associated health, social and economic costs) and the inequalities it causes. As the NTS 2012–2018 nominally ended in 2018, the next iteration of the NTS is currently being developed.
As part of the Australian Government’s Long Term Health Plan, released in August 2019, a 10-year National Preventive Health Strategy is being developed and implemented, which will include a $20 million National Tobacco Campaign over 4 years to continue to reduce tobacco use. This includes a target to reduce smoking rates to below 10% by 2025.
Australia is also one of 181 Parties to the WHO Framework Convention on Tobacco Control (FCTC), which aims to protect present and future generations from the devastating health, social, environmental and economic consequences of tobacco consumption and exposure to tobacco smoke. Under the FCTC, Australia must adopt and implement effective measures to prevent and reduce tobacco consumption, nicotine addiction and exposure to tobacco smoke. The FCTC also obliges Australia to take steps to protect its tobacco control setting and implementation from interference from the tobacco industry and its interests. Australia’s obligations under the FCTC are consistent with the scope of the NTS 2012–2018.
1.4 Smoking across population groups A range of population groups in Australia have higher smoking rates than the general population. There are a range of psychological, social, economic and cultural factors that influence smoking among different population groups. Social disadvantage and smoking rates are intrinsically linked. As levels of disadvantage accumulate, smoking rates increase (ANPHA 2013).
Geographical location Recent Australian data showed that daily smoking rates were highest in the Northern Territory (17%), Tasmania (16%) and Queensland (15%) (AIHW 2018a). Reported smoking levels are also higher in people living in rural and remote areas compared with metropolitan areas. This is partly due to social and environmental factors; it is also influenced by the more limited access to medical care and less successful health promotion campaigns in those areas (NRHA 2014).
Socioeconomic group Studies have shown that smoking is consistently associated with lower income (Casetta et al. 2017) and education level (Huisman et al. 2012). The mechanisms are complex but include factors that encourage the uptake of smoking, such as role modelling and access to cigarettes at home, and those that decrease smoking cessation, such as a lack of social support or motivation, higher stress levels or being more highly addicted (Hiscock et al. 2012). Characteristics of specific communities may also act as barriers to quitting smoking, including higher acceptability of smoking and less support from service providers (Twyman et al. 2014).
4 Burden of tobacco use in Australia: ABDS 2015
People with a mental health condition Evidence suggests that smoking rates are higher in those with poor mental health than in those with better mental health (Steinberg et al. 2015), and higher in those with severe mental health conditions than in those with less severe mental health conditions (Ragg & Ahmed 2008). The higher smoking levels in people with mental health conditions could be explained by genetic, biological, social or environmental factors (Morisano et al. 2009).
While smoking in the total population has declined over recent years, prevalence of smoking among those with a mental health condition has shown little change (Cook et al. 2014; Cooper et al. 2012). As well as having higher smoking rates, people with a mental health condition show lower rates of smoking cessation (Mendelsohn et al. 2015). It has been found that people who sought treatment for their mental health in the past year were more likely to quit smoking than those who did not (Cook et al. 2014).
1.5 What is burden of disease? Burden of disease analysis is a technique used to assess and compare the health impact of different diseases, conditions or injuries and risk factors on a population. It uses information from a range of sources to quantify the fatal (dying as a result of tobacco use) and non-fatal (for example, living with lung cancer caused by smoking) effects of these diseases in a summary measure of health called disability-adjusted life years, or DALY. Put simply, a DALY combines the impact of dying early and that of living with illness. It combines the estimates of years of life lost due to premature death (YLL) and years lived in ill health or with disability (YLD) to count the total years of healthy life lost from disease and injury. These and other key terms are defined in Box 1.1.
The health loss represents the difference between the current health status of the population and the ideal situation where everyone lived a long life, free of disease. Burden of disease estimates capture both the quantity and health-related quality of life, and reflect the magnitude, severity and impact of disease and injury within a population. This analysis also estimates the contribution of various risk factors to health loss, known as the attributable burden. Burden of disease does not attempt to quantify the social or financial consequences of disease and injury; however, burden of disease estimates can be used to inform population health monitoring, health policy formulation, health service planning and health promotion and management strategies.
For detailed information about the ABDS 2015, and further information on the methods used to calculate disease burden, see Australian Burden of Disease Study: impact and causes of illness and death in Australia 2015 (AIHW 2019a) and Australian Burden of Disease Study: methods and supplementary material 2015 (AIHW 2019b).
Box 1.1: Key terms Attributable burden: The disease burden attributed to a particular risk factor. It is the reduction in fatal and non-fatal burden that would have occurred if exposure to the risk factor had been avoided (or, more precisely, had been at its theoretical minimum). Burden of disease (and injury): A term referring to the quantified impact of a disease or injury on a population, using the disability-adjusted life year (DALY) measure.
(continued)
Burden of tobacco use in Australia: ABDS 2015 5
Box 1.1 (continued): Key terms Comparative risk assessment: The process for estimating the burden of disease attributable to selected risk factors. It involves 5 key steps: selection of risk–outcome pairs, estimation of exposure distribution, estimation of effect sizes, choice of theoretical minimum risk exposure level (TMRED), and the calculation of attributable burden. Confounding: Describes a situation when an observed association is due, in whole or part, to a third factor that is associated both with the exposure and with the outcome of interest. DALY (disability-adjusted life years): A measure (in years) of healthy life lost, either through premature death defined as dying before the ideal life span (YLL) or, equivalently, through living with ill health due to illness or injury (YLD). Disease: A broad term that, in this report, is applied to any health problem. It is often used synonymously with condition, disorder or problem. Disability weight: A factor that reflects the severity of non-fatal health loss from a particular health state on a scale from 0 (perfect health) to 1 (equivalent to death). Effect size: A statistical measure of the strength of the relationship between 2 variables (in this context, between a risk exposure and a disease outcome), expressed, for example, as a relative risk or hazard ratio. Excess burden: The reduction that would occur in overall disease burden if all groups had the same rate of burden as the least burdened group. Fatal burden: The burden from dying ‘prematurely’ as measured by years of life lost. Often used synonymously with YLL, and also referred to as ‘life lost’. Health state: The consequences of diseases and conditions, reflecting key differences in symptoms and functioning. Incidence: The number of new cases (of an illness or injury) occurring during a given period. Linked disease: A disease or condition on the causal pathway of the risk factor, and therefore more likely to develop if exposed to the risk. Non-fatal burden: The burden from living with ill-health as measured by years lived with disability. Often used synonymously with YLD; also referred to as ‘health loss’ in this report.
Prevalence: The number of cases of a disease or injury in a population at a given time. Relative risk (RR): The risk of an event relative to exposure, calculated as the ratio of the probability of the event’s occurring in the exposed group to the probability of its occurring in the non-exposed group. A relative risk of 1 implies no difference in risk; RR <1 implies the event is less likely to occur in the exposed group; RR >1 implies the event is more likely to occur in the exposed group. Risk factor: Any factor that represents a greater risk of a health condition or health event; for example, smoking, alcohol use, high body mass and so on. Second-hand smoke exposure: Involuntary exposure involving inhaling carcinogens and toxic components present in tobacco smoke. Also referred to as environmental tobacco exposure or passive smoking.
Sequela: The consequence of diseases; often used in the plural, sequelae. (continued)
6 Burden of tobacco use in Australia: ABDS 2015
Box 1.1 (continued): Key terms Smoking impact ratio (SIR): Population lung cancer mortality in excess of never-smokers, relative to excess lung cancer mortality for a known reference group of smokers. TMRED (theoretical minimum risk exposure distribution): The distribution of exposure to a risk factor that would have the lowest associated population risk. Tobacco use: Exposure to tobacco smoke either directly through current/past smoking or via second-hand smoke. The most common use of tobacco is by smoke inhalation from cigarettes, pipes and cigars. YLD (years lived with disability): A measure of the years of what could have been a healthy life but were instead spent in states of less than full health. YLD represent non-fatal burden. YLL (years of life lost): Years of life lost due to premature death, defined as dying before the ideal life span. YLL represent fatal burden.
1.6 How was exposure to tobacco use defined and estimated?
To capture the full impact of tobacco use on the burden of disease, 3 measures of exposure to tobacco use were used in this study: current tobacco use, second-hand smoke, and past smoking (estimated by the smoking impact ratio). Each of these exposures had different linked diseases. The analysis did not capture burden due to e-cigarettes.
Exposure to current tobacco use was defined as the 5-year lagged prevalence of tobacco use; for example, 2010 prevalence to estimate exposure in 2015. This is due to the time lag in the effect tobacco use has on causing linked diseases. Current tobacco use was linked to cardiovascular diseases, diabetes, asthma and respiratory infections.
Exposure to second-hand smoke was estimated as the prevalence of exposure to environmental tobacco smoke in the home, based on self-reports. This exposure was linked to respiratory infections in children, influenza, cardiovascular diseases, type 2 diabetes and 2 types of cancer.
Both current tobacco use and second-hand smoke exposure were estimated from the NDSHS. This survey is based on a sample of households; people who were homeless or institutionalised were not included.
Past smoking exposure was estimated by the smoking impact ratio, which has been the standard method to estimate the contribution of tobacco use to various types of cancers and chronic respiratory conditions globally (and is described by Peto et al. 1992). The method involves comparing lung cancer mortality rates in the year of study with those of a cohort of non-smokers. This exposure is linked to diseases with a long lag time (greater than 5 years) between exposure and disease onset, such as cancer and chronic respiratory conditions.
Burden of tobacco use in Australia: ABDS 2015 7
Box 1.2: Summary of data limitations in this study The methods used to estimate risk factor attributable burden are continually being updated as new evidence from the literature emerges. This may include additional linked diseases, new exposure to the risk factor or an improved model for the risk factor. The methods for this study were based on the most up-to-date methods available when the analysis was undertaken. For this study, the methods were adopted from the Global Burden of Disease (GBD) Study 2016, including the definition of exposure used for analysis, the TMRED, linked diseases and effect sizes (relative risks) (GBD 2016 Risk Factor Collaborators 2017). These methods included the additional linked diseases breast cancer, prostate cancer, dementia, Parkinson disease, multiple sclerosis, gallbladder and biliary tract disease, and low back pain when compared with the ABDS 2011—which was based on the GBD 2010 (Lim et al. 2012). It is possible that the effect sizes in the GBD 2016 are not ideal for the Australian context. Chapter 2 explores an Australian-specific data set (from the 45 and Up study; Banks et al. 2008) and the implications of the effect sizes that it found. The GBD 2016 included exposure to smokeless tobacco; however, the use of these products is low in Australia, and results from the NDSHS suggest that most people who use these products also smoke tobacco. Further, commercial supply of smokeless tobacco products is prohibited in Australia. For these reasons, this exposure was not included in this study.
1.7 Structure of this report This report quantifies the burden attributable to tobacco use in Australia in 2015.
Chapter 2 provides estimates for the burden of tobacco use in Australia for 2015 by sex, age and linked disease.
Chapter 3 presents estimates of tobacco use burden by state and territory, remoteness area, socioeconomic group and in people diagnosed with a mental health condition in 2015.
Chapter 4 compares rates of tobacco use burden in 2003, 2011 and 2015, and presents estimates of the potential burden expected in 2020 and 2025, based on current trends.
Chapter 5 presents estimates on the combined effect of tobacco, alcohol and illicit drug use in Australia for 2015.
Appendix A provides detailed information on the methods and data sources used in this report.
Appendix B includes further tables and figures of the results from this study.
8 Burden of tobacco use in Australia: ABDS 2015
2 Tobacco use in Australia This chapter presents estimates of the burden due to tobacco use in Australia. It outlines the total, non-fatal and fatal attributable burden by sex, age group and linked disease for 2015.
The list of diseases linked to tobacco use included in this analysis are in Table 2.4.
The impact of tobacco use as presented in this report captures the burden attributable to direct tobacco use from current and past smoking in people aged 30 and over (as most health impacts occur from this age onwards) and to exposure to second-hand smoke in the home in people of all ages.
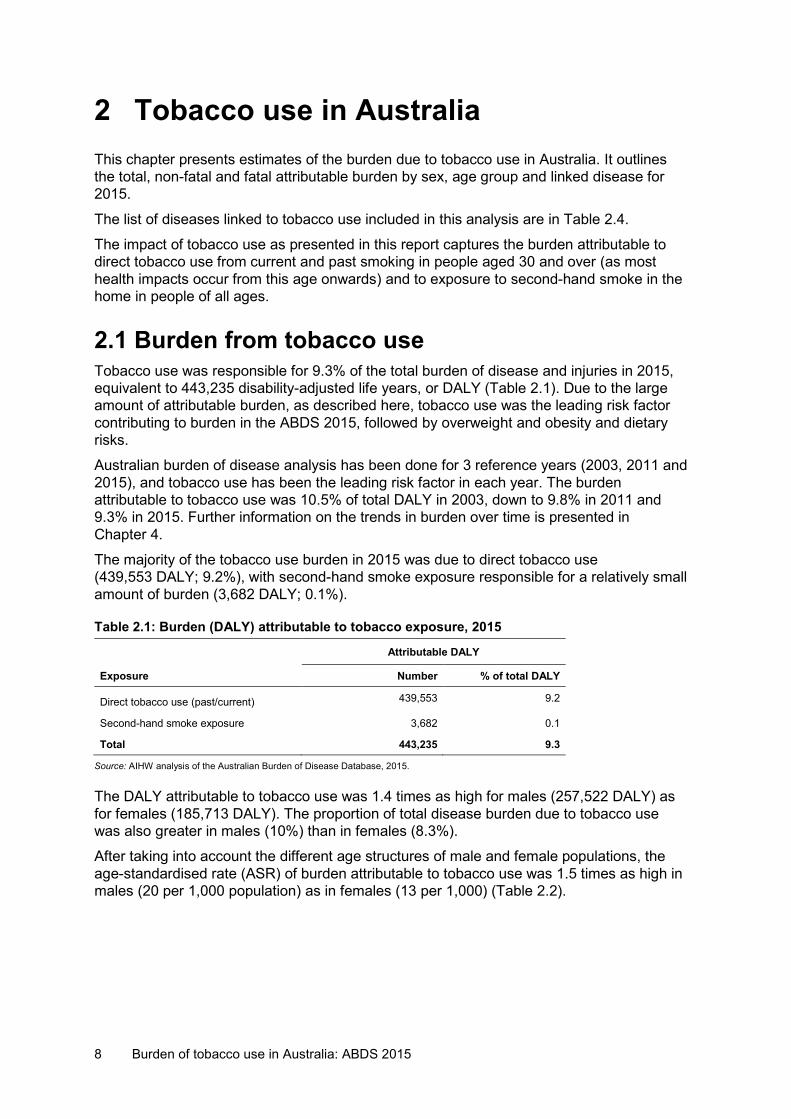
2.1 Burden from tobacco use Tobacco use was responsible for 9.3% of the total burden of disease and injuries in 2015, equivalent to 443,235 disability-adjusted life years, or DALY (Table 2.1). Due to the large amount of attributable burden, as described here, tobacco use was the leading risk factor contributing to burden in the ABDS 2015, followed by overweight and obesity and dietary risks.
Australian burden of disease analysis has been done for 3 reference years (2003, 2011 and 2015), and tobacco use has been the leading risk factor in each year. The burden attributable to tobacco use was 10.5% of total DALY in 2003, down to 9.8% in 2011 and 9.3% in 2015. Further information on the trends in burden over time is presented in Chapter 4.
The majority of the tobacco use burden in 2015 was due to direct tobacco use (439,553 DALY; 9.2%), with second-hand smoke exposure responsible for a relatively small amount of burden (3,682 DALY; 0.1%).
Table 2.1: Burden (DALY) attributable to tobacco exposure, 2015
Attributable DALY
Exposure Number % of total DALY
Direct tobacco use (past/current) 439,553 9.2
Second-hand smoke exposure 3,682 0.1
Total 443,235 9.3
Source: AIHW analysis of the Australian Burden of Disease Database, 2015.
The DALY attributable to tobacco use was 1.4 times as high for males (257,522 DALY) as for females (185,713 DALY). The proportion of total disease burden due to tobacco use was also greater in males (10%) than in females (8.3%).
After taking into account the different age structures of male and female populations, the age-standardised rate (ASR) of burden attributable to tobacco use was 1.5 times as high in males (20 per 1,000 population) as in females (13 per 1,000) (Table 2.2).
Burden of tobacco use in Australia: ABDS 2015 9
Table 2.2: Burden (DALY) attributable to tobacco use, by sex, 2015
Attributable DALY
Number % of total DALY ASR (per 1,000 population)
Males 257,522 10.2 20.1
Females 185,713 8.3 13.1
Persons 443,235 9.3 16.4
Note: The age-standardised rate (ASR) has been standardised to the 2001 Australian Standard Population.
Source: AIHW analysis of the Australian Burden of Disease Database, 2015.
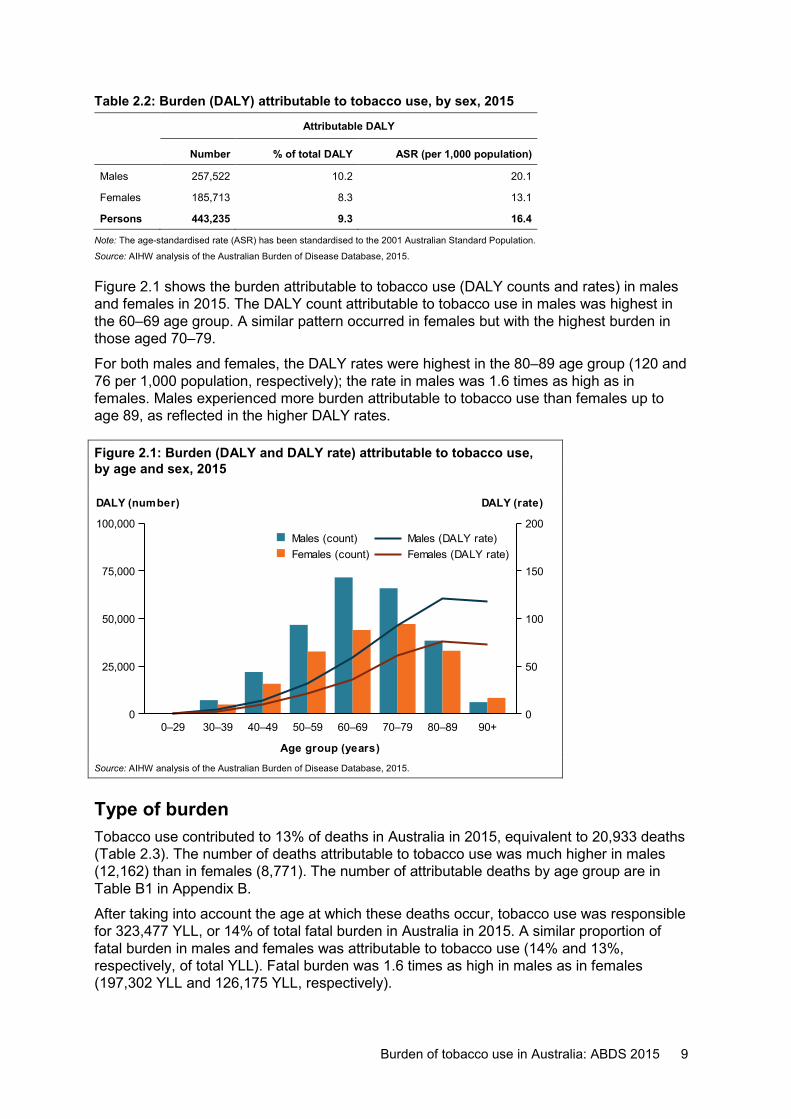
Figure 2.1 shows the burden attributable to tobacco use (DALY counts and rates) in males and females in 2015. The DALY count attributable to tobacco use in males was highest in the 60–69 age group. A similar pattern occurred in females but with the highest burden in those aged 70–79.
For both males and females, the DALY rates were highest in the 80–89 age group (120 and 76 per 1,000 population, respectively); the rate in males was 1.6 times as high as in females. Males experienced more burden attributable to tobacco use than females up to age 89, as reflected in the higher DALY rates.
Figure 2.1: Burden (DALY and DALY rate) attributable to tobacco use, by age and sex, 2015
Source: AIHW analysis of the Australian Burden of Disease Database, 2015.
Type of burden Tobacco use contributed to 13% of deaths in Australia in 2015, equivalent to 20,933 deaths (Table 2.3). The number of deaths attributable to tobacco use was much higher in males (12,162) than in females (8,771). The number of attributable deaths by age group are in Table B1 in Appendix B.
After taking into account the age at which these deaths occur, tobacco use was responsible for 323,477 YLL, or 14% of total fatal burden in Australia in 2015. A similar proportion of fatal burden in males and females was attributable to tobacco use (14% and 13%, respectively, of total YLL). Fatal burden was 1.6 times as high in males as in females (197,302 YLL and 126,175 YLL, respectively).
0–29 30–39 40–49 50–59 60–69 70–79 80–89 90+
Age group (years)
0
25,000
50,000
75,000
100,000
DALY (number)
0
50
100
150
200
DALY (rate)
Females (DALY rate)Males (DALY rate)
Females (count)Males (count)
10 Burden of tobacco use in Australia: ABDS 2015
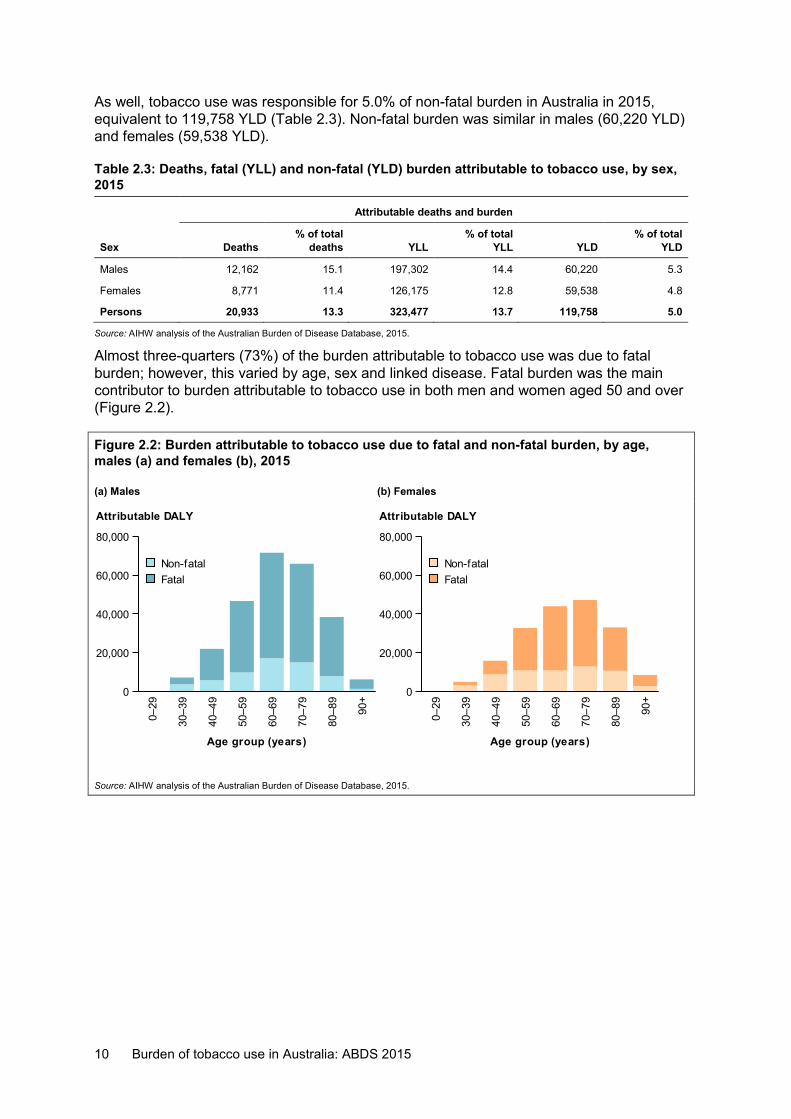
As well, tobacco use was responsible for 5.0% of non-fatal burden in Australia in 2015, equivalent to 119,758 YLD (Table 2.3). Non-fatal burden was similar in males (60,220 YLD) and females (59,538 YLD).
Table 2.3: Deaths, fatal (YLL) and non-fatal (YLD) burden attributable to tobacco use, by sex, 2015
Attributable deaths and burden
Sex Deaths % of total
deaths YLL % of total
YLL YLD % of total
YLD
Males 12,162 15.1 197,302 14.4 60,220 5.3
Females 8,771 11.4 126,175 12.8 59,538 4.8
Persons 20,933 13.3 323,477 13.7 119,758 5.0
Source: AIHW analysis of the Australian Burden of Disease Database, 2015.
Almost three-quarters (73%) of the burden attributable to tobacco use was due to fatal burden; however, this varied by age, sex and linked disease. Fatal burden was the main contributor to burden attributable to tobacco use in both men and women aged 50 and over (Figure 2.2).
Figure 2.2: Burden attributable to tobacco use due to fatal and non-fatal burden, by age, males (a) and females (b), 2015
(a) Males (b) Females
Source: AIHW analysis of the Australian Burden of Disease Database, 2015.
0–29
30–3
9
40–4
9
50–5
9
60–6
9
70–7
9
80–8
9
90+
Age group (years)
0
20,000
40,000
60,000
80,000
Attributable DALY
FatalNon-fatal
0–29
30–3
9
40–4
9
50–5
9
60–6
9
70–7
9
80–8
9
90+
Age group (years)
0
20,000
40,000
60,000
80,000
Attributable DALY
FatalNon-fatal
Burden of tobacco use in Australia: ABDS 2015 11
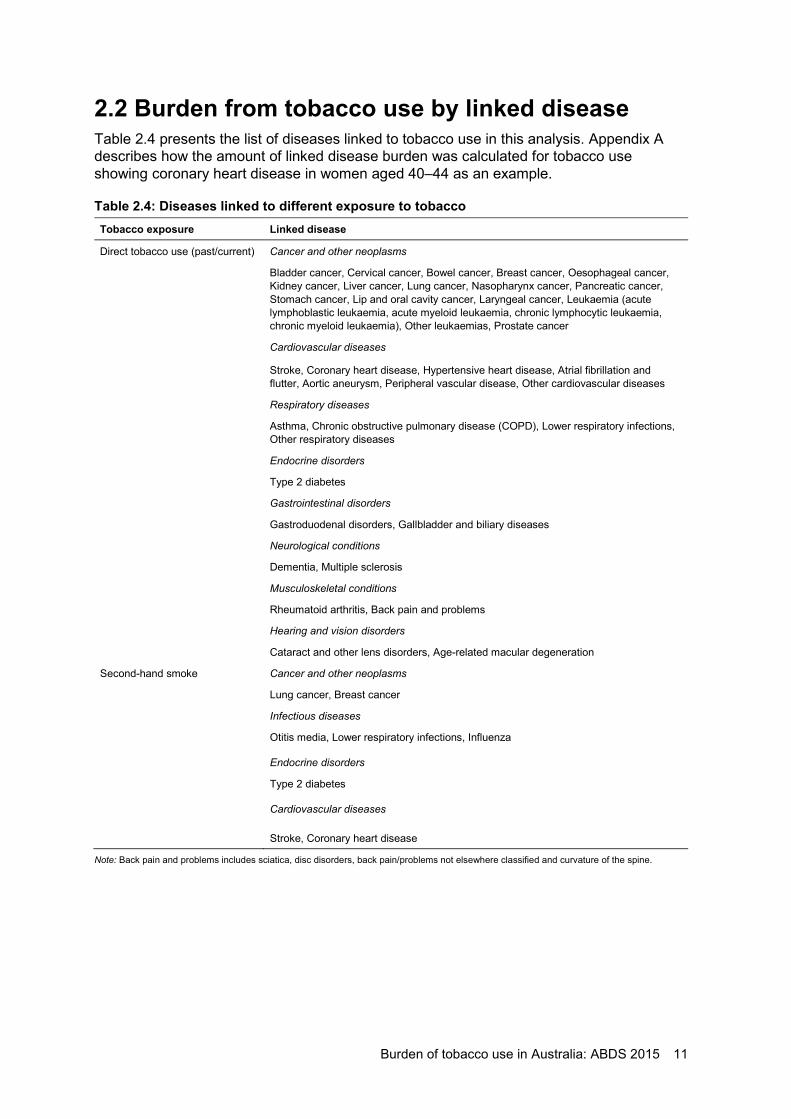
2.2 Burden from tobacco use by linked disease Table 2.4 presents the list of diseases linked to tobacco use in this analysis. Appendix A describes how the amount of linked disease burden was calculated for tobacco use showing coronary heart disease in women aged 40–44 as an example.
Table 2.4: Diseases linked to different exposure to tobacco Tobacco exposure Linked disease
Direct tobacco use (past/current) Cancer and other neoplasms
Bladder cancer, Cervical cancer, Bowel cancer, Breast cancer, Oesophageal cancer, Kidney cancer, Liver cancer, Lung cancer, Nasopharynx cancer, Pancreatic cancer, Stomach cancer, Lip and oral cavity cancer, Laryngeal cancer, Leukaemia (acute lymphoblastic leukaemia, acute myeloid leukaemia, chronic lymphocytic leukaemia, chronic myeloid leukaemia), Other leukaemias, Prostate cancer
Cardiovascular diseases
Stroke, Coronary heart disease, Hypertensive heart disease, Atrial fibrillation and flutter, Aortic aneurysm, Peripheral vascular disease, Other cardiovascular diseases
Respiratory diseases
Asthma, Chronic obstructive pulmonary disease (COPD), Lower respiratory infections, Other respiratory diseases
Endocrine disorders
Type 2 diabetes
Gastrointestinal disorders
Gastroduodenal disorders, Gallbladder and biliary diseases
Neurological conditions
Dementia, Multiple sclerosis
Musculoskeletal conditions
Rheumatoid arthritis, Back pain and problems
Hearing and vision disorders
Cataract and other lens disorders, Age-related macular degeneration
Second-hand smoke Cancer and other neoplasms
Lung cancer, Breast cancer
Infectious diseases
Otitis media, Lower respiratory infections, Influenza
Endocrine disorders
Type 2 diabetes
Cardiovascular diseases
Stroke, Coronary heart disease
Note: Back pain and problems includes sciatica, disc disorders, back pain/problems not elsewhere classified and curvature of the spine.
12 Burden of tobacco use in Australia: ABDS 2015
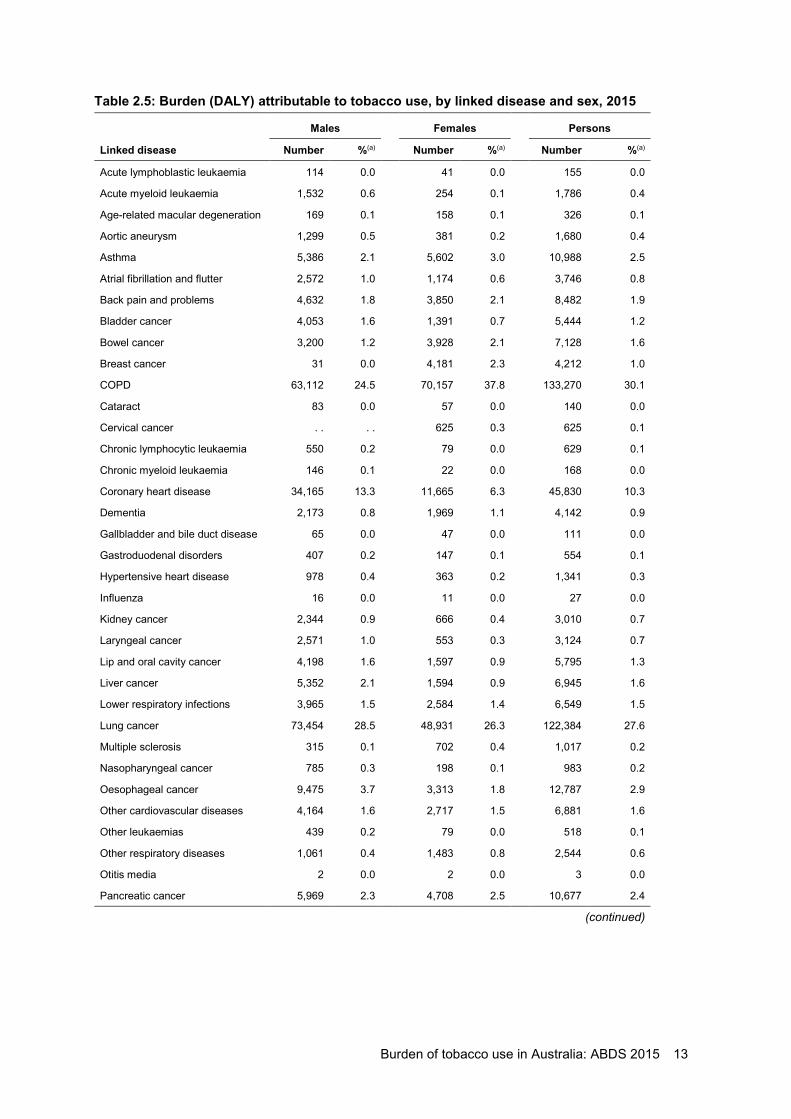
Table 2.5 shows that COPD accounted for 30% of burden attributable to tobacco use in 2015 (133,270 DALY). The burden of COPD due to tobacco use was higher in females than in males—70,157 DALY (38% of total tobacco use attributable burden) compared with 63,112 (25%).
Cancers accounted for 43% of the burden attributable to tobacco use (191,901 DALY). Almost two-thirds of this burden was from lung cancer (122,384 DALY; 28% of total burden). After lung cancer, pancreatic, oesophageal and bowel cancers were collectively responsible for the greatest number of attributable DALY (30,592; 6.9%).
Cardiovascular diseases were responsible for 17% of the burden due to tobacco use (74,150 DALY). This burden primarily related to coronary heart disease (10%) and stroke (3.1%). Males experienced 2.2 times the amount of cardiovascular disease burden as females (51,226 DALY and 22,924 DALY, respectively).
Asthma was responsible for 2.5% of the burden attributable to tobacco use (10,988 DALY), with similar amounts in males and females (5,386 and 5,602 DALY, respectively).
Burden of tobacco use in Australia: ABDS 2015 13
Table 2.5: Burden (DALY) attributable to tobacco use, by linked disease and sex, 2015
Males Females Persons
Linked disease Number %(a) Number %(a) Number %(a)
Acute lymphoblastic leukaemia 114 0.0 41 0.0 155 0.0
Acute myeloid leukaemia 1,532 0.6 254 0.1 1,786 0.4
Age-related macular degeneration 169 0.1 158 0.1 326 0.1
Aortic aneurysm 1,299 0.5 381 0.2 1,680 0.4
Asthma 5,386 2.1 5,602 3.0 10,988 2.5
Atrial fibrillation and flutter 2,572 1.0 1,174 0.6 3,746 0.8
Back pain and problems 4,632 1.8 3,850 2.1 8,482 1.9
Bladder cancer 4,053 1.6 1,391 0.7 5,444 1.2
Bowel cancer 3,200 1.2 3,928 2.1 7,128 1.6
Breast cancer 31 0.0 4,181 2.3 4,212 1.0
COPD 63,112 24.5 70,157 37.8 133,270 30.1
Cataract 83 0.0 57 0.0 140 0.0
Cervical cancer . . . . 625 0.3 625 0.1
Chronic lymphocytic leukaemia 550 0.2 79 0.0 629 0.1
Chronic myeloid leukaemia 146 0.1 22 0.0 168 0.0
Coronary heart disease 34,165 13.3 11,665 6.3 45,830 10.3
Dementia 2,173 0.8 1,969 1.1 4,142 0.9
Gallbladder and bile duct disease 65 0.0 47 0.0 111 0.0
Gastroduodenal disorders 407 0.2 147 0.1 554 0.1
Hypertensive heart disease 978 0.4 363 0.2 1,341 0.3
Influenza 16 0.0 11 0.0 27 0.0
Kidney cancer 2,344 0.9 666 0.4 3,010 0.7
Laryngeal cancer 2,571 1.0 553 0.3 3,124 0.7
Lip and oral cavity cancer 4,198 1.6 1,597 0.9 5,795 1.3
Liver cancer 5,352 2.1 1,594 0.9 6,945 1.6
Lower respiratory infections 3,965 1.5 2,584 1.4 6,549 1.5
Lung cancer 73,454 28.5 48,931 26.3 122,384 27.6
Multiple sclerosis 315 0.1 702 0.4 1,017 0.2
Nasopharyngeal cancer 785 0.3 198 0.1 983 0.2
Oesophageal cancer 9,475 3.7 3,313 1.8 12,787 2.9
Other cardiovascular diseases 4,164 1.6 2,717 1.5 6,881 1.6
Other leukaemias 439 0.2 79 0.0 518 0.1
Other respiratory diseases 1,061 0.4 1,483 0.8 2,544 0.6
Otitis media 2 0.0 2 0.0 3 0.0
Pancreatic cancer 5,969 2.3 4,708 2.5 10,677 2.4
(continued)
14 Burden of tobacco use in Australia: ABDS 2015
Table 2.5 (continued): Burden (DALY) attributable to tobacco use, by linked disease and sex, 2015
Males Females Persons
Linked disease Number %(a) Number %(a) Number %(a)
Peripheral vascular disease 500 0.2 284 0.2 785 0.2
Prostate cancer 2,615 1.0 . . . . 2,615 0.6
Rheumatoid arthritis 2,226 0.9 2,238 1.2 4,464 1.0
Stomach cancer 2,000 0.8 913 0.5 2,912 0.7
Stroke 7,548 2.9 6,341 3.4 13,888 3.1
Type 2 diabetes 3,857 1.5 710 0.4 4,567 1.0
Total 257,522 100.0 185,713 100.0 443,235 100.0
(a) Percentage of total burden attributable to tobacco use.
Note: Numbers and percentages may not add up to the total due to rounding.
Source: AIHW analysis of the Australian Burden of Disease Database, 2015.
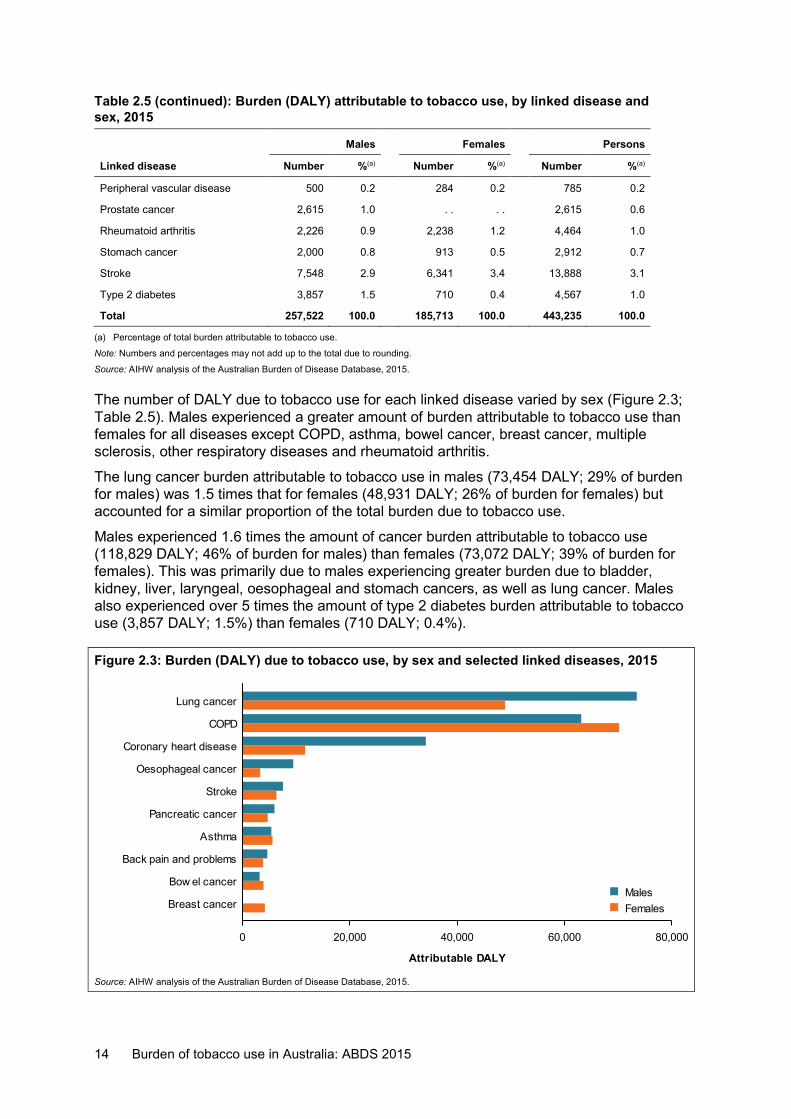
The number of DALY due to tobacco use for each linked disease varied by sex (Figure 2.3; Table 2.5). Males experienced a greater amount of burden attributable to tobacco use than females for all diseases except COPD, asthma, bowel cancer, breast cancer, multiple sclerosis, other respiratory diseases and rheumatoid arthritis.
The lung cancer burden attributable to tobacco use in males (73,454 DALY; 29% of burden for males) was 1.5 times that for females (48,931 DALY; 26% of burden for females) but accounted for a similar proportion of the total burden due to tobacco use.
Males experienced 1.6 times the amount of cancer burden attributable to tobacco use (118,829 DALY; 46% of burden for males) than females (73,072 DALY; 39% of burden for females). This was primarily due to males experiencing greater burden due to bladder, kidney, liver, laryngeal, oesophageal and stomach cancers, as well as lung cancer. Males also experienced over 5 times the amount of type 2 diabetes burden attributable to tobacco use (3,857 DALY; 1.5%) than females (710 DALY; 0.4%).
Figure 2.3: Burden (DALY) due to tobacco use, by sex and selected linked diseases, 2015
Source: AIHW analysis of the Australian Burden of Disease Database, 2015.
0 20,000 40,000 60,000 80,000
Attributable DALY
Breast cancer
Bow el cancer
Back pain and problems
Asthma
Pancreatic cancer
Stroke
Oesophageal cancer
Coronary heart disease
COPD
Lung cancer
FemalesMales
Burden of tobacco use in Australia: ABDS 2015 15
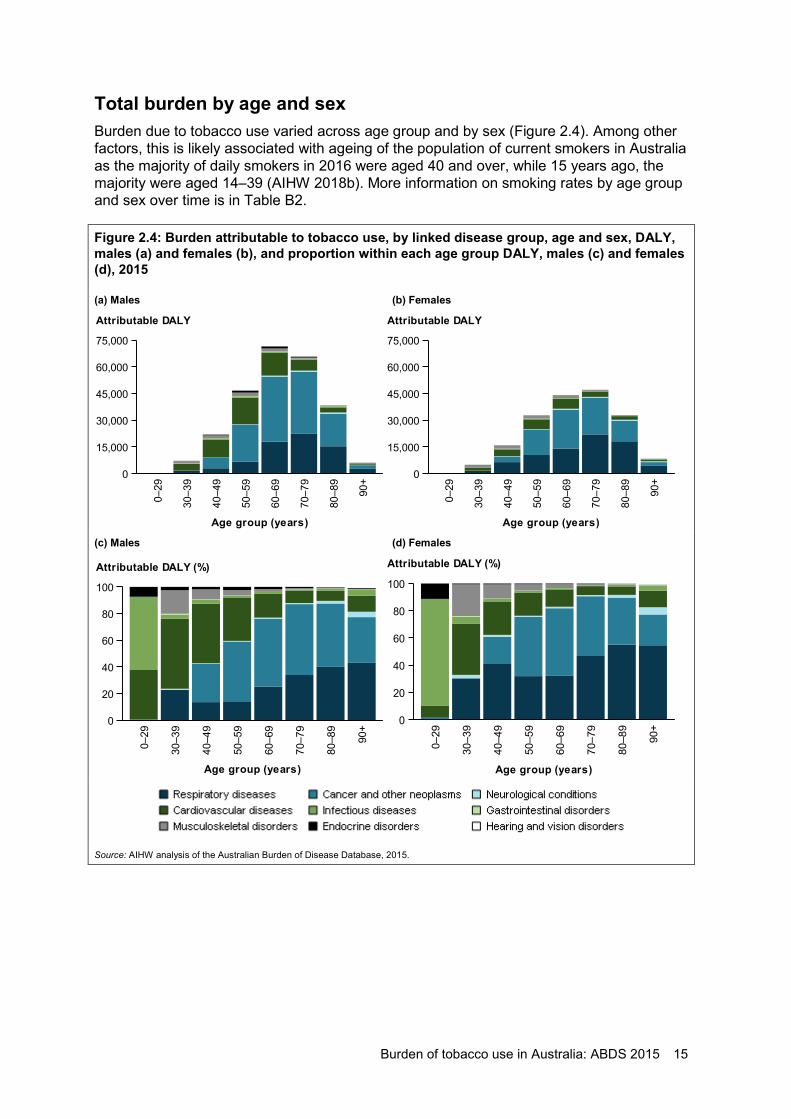
Total burden by age and sex Burden due to tobacco use varied across age group and by sex (Figure 2.4). Among other factors, this is likely associated with ageing of the population of current smokers in Australia as the majority of daily smokers in 2016 were aged 40 and over, while 15 years ago, the majority were aged 14–39 (AIHW 2018b). More information on smoking rates by age group and sex over time is in Table B2.
Figure 2.4: Burden attributable to tobacco use, by linked disease group, age and sex, DALY, males (a) and females (b), and proportion within each age group DALY, males (c) and females (d), 2015
(a) Males (b) Females
(c) Males (d) Females
Source: AIHW analysis of the Australian Burden of Disease Database, 2015.
0–29
30–3
9
40–4
9
50–5
9
60–6
9
70–7
9
80–8
9
90+
Age group (years)
0
15,000
30,000
45,000
60,000
75,000
Attributable DALY
0–29
30–3
9
40–4
9
50–5
9
60–6
9
70–7
9
80–8
9
90+
Age group (years)
0
15,000
30,000
45,000
60,000
75,000
Attributable DALY
0–29
30–3
9
40–4
9
50–5
9
60–6
9
70–7
9
80–8
9
90+
Age group (years)
0
20
40
60
80
100
Attributable DALY (%)
0–29
30–3
9
40–4
9
50–5
9
60–6
9
70–7
9
80–8
9
90+
Age group (years)
0
20
40
60
80
100
Attributable DALY (%)
16 Burden of tobacco use in Australia: ABDS 2015
Adults aged 0–29 In people aged between 0 and 29, infectious diseases such as lower respiratory infections were the main diseases contributing to the burden attributable to tobacco use. For females, more than three-quarters (78%) of the burden attributable to tobacco use in this age group was due to infectious diseases. For males, more than half of the burden was due to infectious diseases (55%). It is important to note that this age group contributed only 0.02% of the total burden due to tobacco use (99 DALY).
Adults aged 30–49 In adults aged between 30 and 49, cardiovascular diseases, cancer and respiratory diseases were the main diseases contributing to the burden attributable to tobacco use. This age group contributed 11% of the total burden due to tobacco use for both men and women. For men, almost half of the attributable burden in this age group was due to cardiovascular diseases (47%; 13,517 DALY), followed by cancer (22%; 6,271 DALY) and respiratory diseases (16%; 4,604 DALY). For women, over one-third of the attributable burden was due to respiratory diseases (38%; 7,914 DALY), followed by cardiovascular diseases (27%; 5,641 DALY) and cancer (15%; 3,156 DALY).
Adults aged 50–59
This age group contributed 18% of the total burden due to tobacco use for both men and women. Linked cancers were the main contributor to attributable burden for men (45%; 20,867 DALY) and women (44%; 14,214 DALY) in this age group. Almost one-third (32%) of the burden in women in this age group was due to respiratory diseases, while almost one-third (32%) of the burden in men was due to cardiovascular diseases.
Adults aged 60–69
This age group experienced the greatest proportion of burden due to tobacco use in men, contributing 28% to the total male burden (71,537 DALY). Slightly more than half of the attributable burden in this age group in men was due to cancer (51%; 36,464 DALY), followed by respiratory diseases (25%; 17,983 DALY).
Women in this age group contributed 24% (43,901 DALY) of the total female burden. Half the attributable burden in this age group in women was due to cancer (50%; 21,775 DALY) and almost one-third was due to respiratory diseases (32%; 14,126 DALY).
Adults aged 70–79
This age group experienced the greatest proportion of burden due to tobacco use in women, contributing 25% to the total female burden (47,092 DALY). Almost half of the attributable burden in this age group in women was due to respiratory diseases (47%; 22,001 DALY), followed by cancer (44%; 20,646 DALY).
Men also experienced a high proportion of burden in this age group, contributing 26% to the total male burden (65,802 DALY). More than half of the burden was due to cancer (53%; 34,915 DALY) and over one-third due to respiratory diseases (34%; 22,328 DALY).
Adults aged 80–89
This age group contributed 15% of the total burden due to tobacco use for males and 18% for females. The impact of tobacco use was mainly due to linked cancers and respiratory diseases in this age group. In women, more than half (55%; 18,188 DALY) of the burden was due to respiratory diseases and more than one-third (35%; 11,393 DALY) due to cancer. In men, 47% (18,213 DALY) of the burden was due to cancer and 40% (15,361 DALY) due to respiratory diseases.
Burden of tobacco use in Australia: ABDS 2015 17
Adults aged 90+
This age group contributed 2.4% of the total burden due to tobacco use for males and 4.5% for females. In this age group, more than half (55%; 4,578 DALY) of the burden in women was due to respiratory diseases and almost one-quarter (23%; 1,887 DALY) due to cancer. In men, 43% (2,631 DALY) of the burden was due to respiratory diseases and more than one-third (34%; 2,098 DALY) due to cancer. Cardiovascular diseases also contributed to the burden in both men and women in this age group (12% each), but the number of DALY was higher in women (737 and 1,026, respectively).
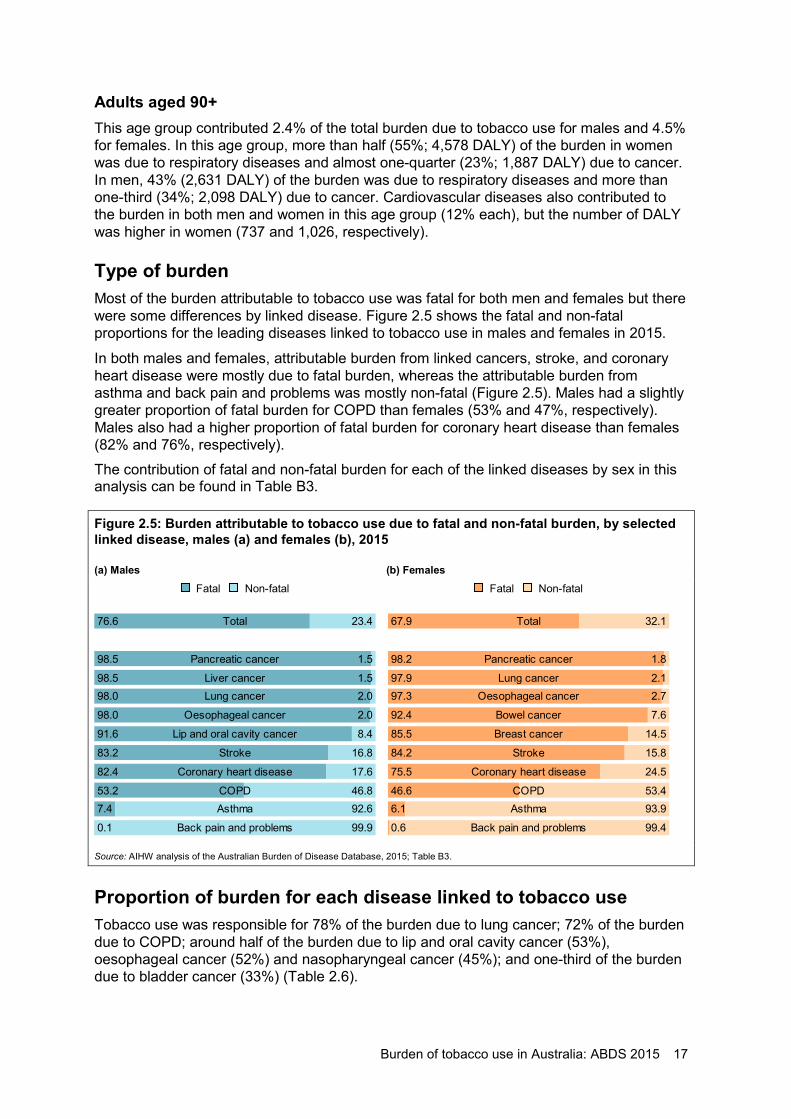
Type of burden Most of the burden attributable to tobacco use was fatal for both men and females but there were some differences by linked disease. Figure 2.5 shows the fatal and non-fatal proportions for the leading diseases linked to tobacco use in males and females in 2015.
In both males and females, attributable burden from linked cancers, stroke, and coronary heart disease were mostly due to fatal burden, whereas the attributable burden from asthma and back pain and problems was mostly non-fatal (Figure 2.5). Males had a slightly greater proportion of fatal burden for COPD than females (53% and 47%, respectively). Males also had a higher proportion of fatal burden for coronary heart disease than females (82% and 76%, respectively). The contribution of fatal and non-fatal burden for each of the linked diseases by sex in this analysis can be found in Table B3.
Figure 2.5: Burden attributable to tobacco use due to fatal and non-fatal burden, by selected linked disease, males (a) and females (b), 2015
(a) Males (b) Females
Source: AIHW analysis of the Australian Burden of Disease Database, 2015; Table B3.
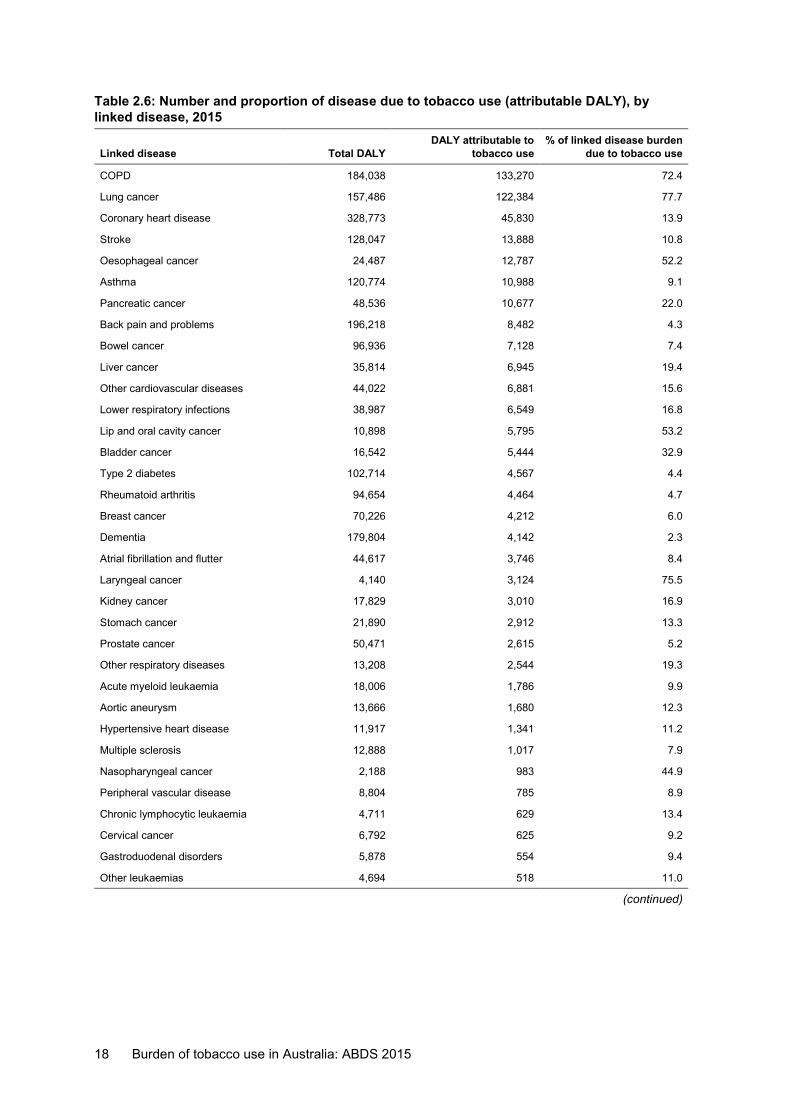
Proportion of burden for each disease linked to tobacco use Tobacco use was responsible for 78% of the burden due to lung cancer; 72% of the burden due to COPD; around half of the burden due to lip and oral cavity cancer (53%), oesophageal cancer (52%) and nasopharyngeal cancer (45%); and one-third of the burden due to bladder cancer (33%) (Table 2.6).
Non-fatalFatal
Total76.6 23.4
Pancreatic cancer98.5 1.5
Liver cancer98.5 1.5Lung cancer98.0 2.0
Oesophageal cancer98.0 2.0
Lip and oral cavity cancer91.6 8.4
Stroke83.2 16.8
Coronary heart disease82.4 17.6
COPD53.2 46.8Asthma7.4 92.6
Back pain and problems0.1 99.9
Non-fatalFatal
Total67.9 32.1
Pancreatic cancer98.2 1.8
Lung cancer97.9 2.1Oesophageal cancer97.3 2.7
Bowel cancer92.4 7.6
Breast cancer85.5 14.5
Stroke84.2 15.8
Coronary heart disease75.5 24.5
COPD46.6 53.4Asthma6.1 93.9
Back pain and problems0.6 99.4
18 Burden of tobacco use in Australia: ABDS 2015
Table 2.6: Number and proportion of disease due to tobacco use (attributable DALY), by linked disease, 2015
Linked disease Total DALY DALY attributable to
tobacco use % of linked disease burden
due to tobacco use
COPD 184,038 133,270 72.4
Lung cancer 157,486 122,384 77.7
Coronary heart disease 328,773 45,830 13.9
Stroke 128,047 13,888 10.8
Oesophageal cancer 24,487 12,787 52.2
Asthma 120,774 10,988 9.1
Pancreatic cancer 48,536 10,677 22.0
Back pain and problems 196,218 8,482 4.3
Bowel cancer 96,936 7,128 7.4
Liver cancer 35,814 6,945 19.4
Other cardiovascular diseases 44,022 6,881 15.6
Lower respiratory infections 38,987 6,549 16.8
Lip and oral cavity cancer 10,898 5,795 53.2
Bladder cancer 16,542 5,444 32.9
Type 2 diabetes 102,714 4,567 4.4
Rheumatoid arthritis 94,654 4,464 4.7
Breast cancer 70,226 4,212 6.0
Dementia 179,804 4,142 2.3
Atrial fibrillation and flutter 44,617 3,746 8.4
Laryngeal cancer 4,140 3,124 75.5
Kidney cancer 17,829 3,010 16.9
Stomach cancer 21,890 2,912 13.3
Prostate cancer 50,471 2,615 5.2
Other respiratory diseases 13,208 2,544 19.3
Acute myeloid leukaemia 18,006 1,786 9.9
Aortic aneurysm 13,666 1,680 12.3
Hypertensive heart disease 11,917 1,341 11.2
Multiple sclerosis 12,888 1,017 7.9
Nasopharyngeal cancer 2,188 983 44.9
Peripheral vascular disease 8,804 785 8.9
Chronic lymphocytic leukaemia 4,711 629 13.4
Cervical cancer 6,792 625 9.2
Gastroduodenal disorders 5,878 554 9.4
Other leukaemias 4,694 518 11.0
(continued)
Burden of tobacco use in Australia: ABDS 2015 19
Table 2.6 (continued): Number and proportion of disease due to tobacco use (attributable DALY), by linked disease, 2015
Linked disease Total DALY DALY attributable to
tobacco use % of linked disease
burden due to tobacco use
Age-related macular degeneration 7,406 326 4.4
Chronic myeloid leukaemia 1,562 168 10.8
Acute lymphoblastic leukaemia 4,573 155 3.4
Cataract 3,702 140 3.8
Gallbladder and bile duct disease 6,051 111 1.8
Influenza 5,568 27 0.5
Otitis media 519 3 0.6
Unlinked diseases 2,602,381 . . . .
All diseases and injuries 4,752,415 443,235 9.3
Notes
1. Numbers may not add up to the total due to rounding.
2. The % column is the attributable DALY divided by the linked disease burden in 2015 of that row and the ‘all diseases and injuries’ row includes the burden from all diseases and injuries in the ABDS 2015.
Source: AIHW analysis of the Australian Burden of Disease Database, 2015.
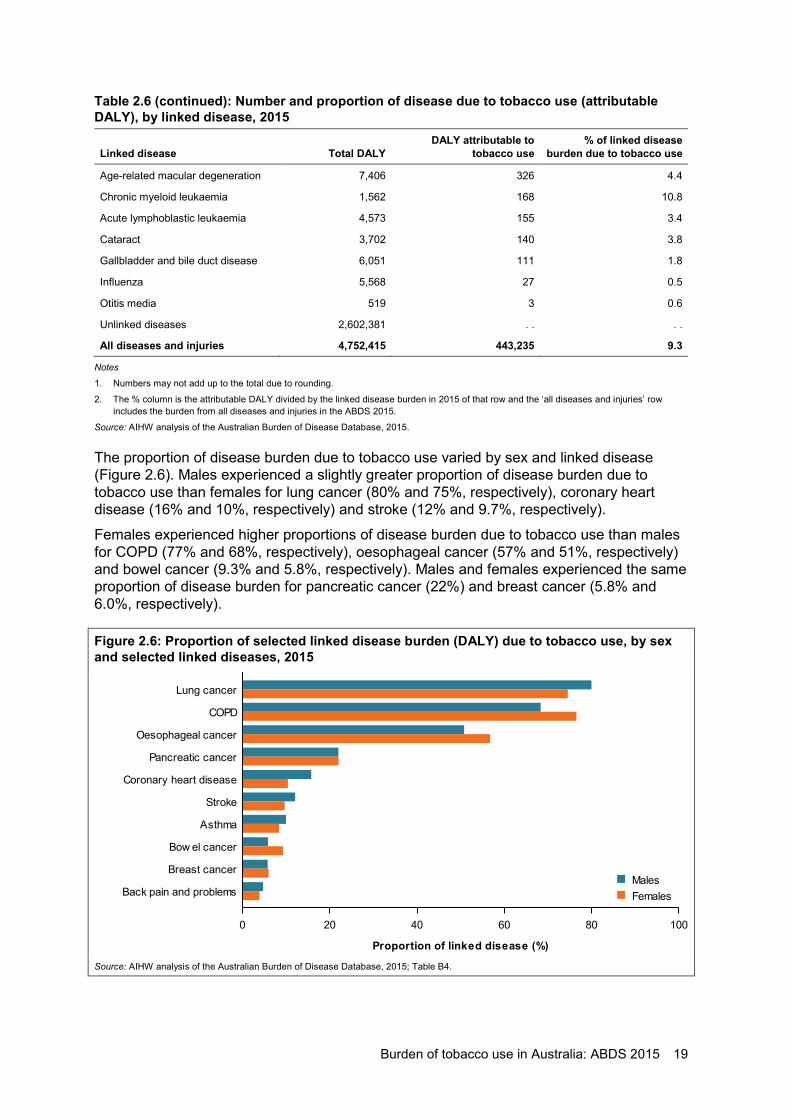
The proportion of disease burden due to tobacco use varied by sex and linked disease (Figure 2.6). Males experienced a slightly greater proportion of disease burden due to tobacco use than females for lung cancer (80% and 75%, respectively), coronary heart disease (16% and 10%, respectively) and stroke (12% and 9.7%, respectively).
Females experienced higher proportions of disease burden due to tobacco use than males for COPD (77% and 68%, respectively), oesophageal cancer (57% and 51%, respectively) and bowel cancer (9.3% and 5.8%, respectively). Males and females experienced the same proportion of disease burden for pancreatic cancer (22%) and breast cancer (5.8% and 6.0%, respectively).
Figure 2.6: Proportion of selected linked disease burden (DALY) due to tobacco use, by sex and selected linked diseases, 2015
Source: AIHW analysis of the Australian Burden of Disease Database, 2015; Table B4.
0 20 40 60 80 100
Proportion of linked disease (%)
Back pain and problems
Breast cancer
Bow el cancer
Asthma
Stroke
Coronary heart disease
Pancreatic cancer
Oesophageal cancer
COPD
Lung cancer
FemalesMales
20 Burden of tobacco use in Australia: ABDS 2015
2.3 What is the impact of using Australian effect size data?
In the ABDS, data inputs for estimating attributable burden are mostly sourced from the GBD study. The GBD study undertakes meta-analyses of estimates of effect sizes from large numbers of cohorts internationally to estimate the relative risks for each risk factor. However, because they are global estimates, they may not be ideal for the Australian context as there can be large differences in smoking-related relative risks between countries. Ideally, we would use relative risks from the Australian population to calculate burden attributable to risk factors.
The 45 and Up Study, a large ongoing cohort study in New South Wales, is a rich data source for investigating the burden of certain risk factors, including tobacco smoking, on the Australian population (Banks et al. 2008, 2015, 2019; Laaksonen et al. 2018). The Australian Institute of Health and Welfare (AIHW) collaborated with 45 and Up Study researchers at the Australian National University to explore the use of data from this study to estimate national level burden due to tobacco use.
Data from the 45 and Up Study are used in this sensitivity analysis to investigate the impact of Australian-specific effect size data on the estimates of burden attributable to direct tobacco use (for exposure to current and past smoking). Second-hand smoke exposure was not included in the analysis. Furthermore, it was not possible to use the 45 and Up Study for some linked diseases due to:
• insufficient sample size to estimate an effect size (for example, lip and oral cavity cancer)
• limitations of the study design and available linked data (for example, for asthma and type 2 diabetes)
• inconsistent findings in effect sizes with the GBD 2016 (for example, the GBD study found a significant association between breast and prostate cancer and tobacco use, while the 45 and Up Study did not).
For these linked diseases, the relative risks from the GBD study were used to estimate the overall impact of the burden attributable to tobacco use.
Effect sizes (estimated by hazard ratios using mortality outcomes) from the 45 and Up Study were used in this analysis for the following linked diseases: bowel cancer, COPD, coronary heart disease, liver cancer, lower respiratory infections, lung cancer, oesophageal cancer, other respiratory diseases, pancreatic cancer, stomach cancer and stroke. GBD effect sizes were used for all other linked diseases. More detailed information on the methods used to compare attributable burden using each data source are in Appendix A.
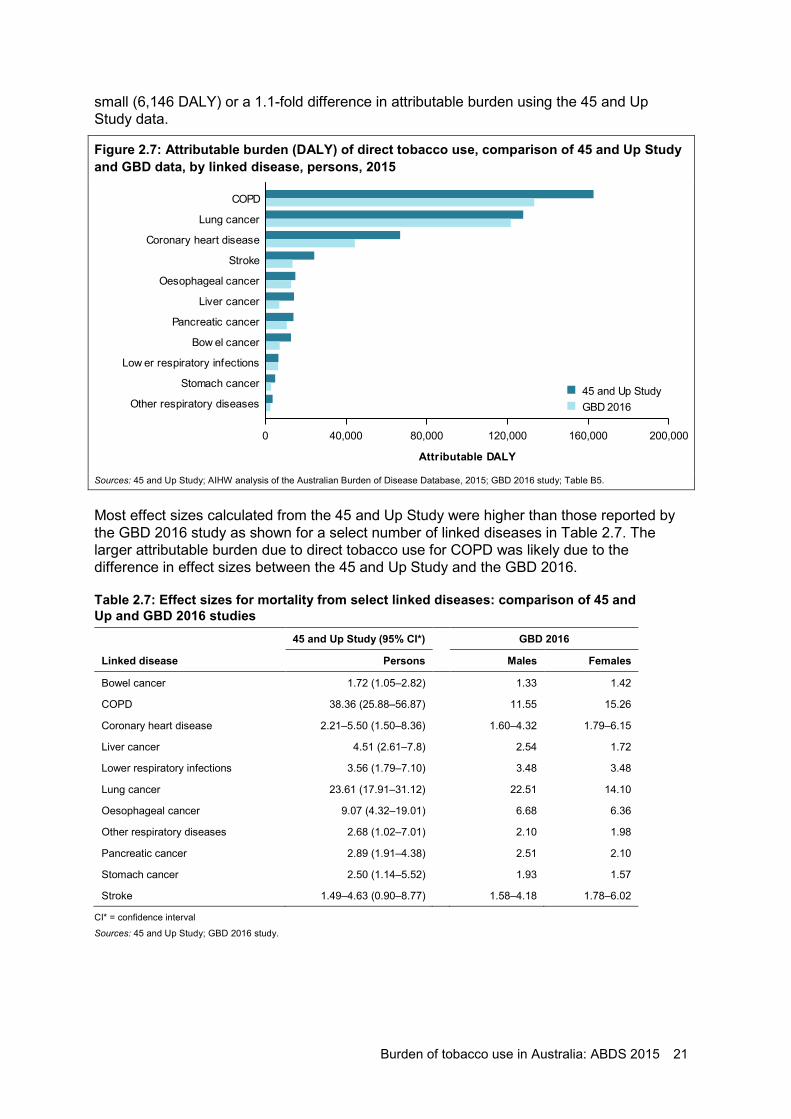
The burden (DALY) attributable to direct tobacco use using the 45 and Up Study data was 90,313 DALY higher than the estimates based on GBD data, representing a 1.2-fold difference (Table B5). Using 45 and Up Study data also resulted in a higher percentage of total DALY attributable to tobacco use (11% compared with 9.2% using GBD data).
Figure 2.7 shows the attributable burden for each of the linked diseases estimated, using the 45 and Up Study and the GBD data. In terms of numbers of DALY, the largest differences were for COPD and coronary heart disease, differing by 29,385 and 22,487 DALY, respectively (Figure 2.7). The estimates of attributable burden were similar for some of the linked diseases between the 2 studies. For example, while the attributable burden was large for lung cancer, the difference in burden between the data sources was relatively
Burden of tobacco use in Australia: ABDS 2015 21
small (6,146 DALY) or a 1.1-fold difference in attributable burden using the 45 and Up Study data.
Figure 2.7: Attributable burden (DALY) of direct tobacco use, comparison of 45 and Up Study and GBD data, by linked disease, persons, 2015
Sources: 45 and Up Study; AIHW analysis of the Australian Burden of Disease Database, 2015; GBD 2016 study; Table B5.
Most effect sizes calculated from the 45 and Up Study were higher than those reported by the GBD 2016 study as shown for a select number of linked diseases in Table 2.7. The larger attributable burden due to direct tobacco use for COPD was likely due to the difference in effect sizes between the 45 and Up Study and the GBD 2016.
Table 2.7: Effect sizes for mortality from select linked diseases: comparison of 45 and Up and GBD 2016 studies
45 and Up Study (95% CI*) GBD 2016
Linked disease Persons Males Females
Bowel cancer 1.72 (1.05–2.82) 1.33 1.42
COPD 38.36 (25.88–56.87) 11.55 15.26
Coronary heart disease 2.21–5.50 (1.50–8.36) 1.60–4.32 1.79–6.15
Liver cancer 4.51 (2.61–7.8) 2.54 1.72
Lower respiratory infections 3.56 (1.79–7.10) 3.48 3.48
Lung cancer 23.61 (17.91–31.12) 22.51 14.10
Oesophageal cancer 9.07 (4.32–19.01) 6.68 6.36
Other respiratory diseases 2.68 (1.02–7.01) 2.10 1.98
Pancreatic cancer 2.89 (1.91–4.38) 2.51 2.10
Stomach cancer 2.50 (1.14–5.52) 1.93 1.57
Stroke 1.49–4.63 (0.90–8.77) 1.58–4.18 1.78–6.02
CI* = confidence interval
Sources: 45 and Up Study; GBD 2016 study.
0 40,000 80,000 120,000 160,000 200,000
Attributable DALY
Other respiratory diseases
Stomach cancer
Low er respiratory infections
Bow el cancer
Pancreatic cancer
Liver cancer
Oesophageal cancer
Stroke
Coronary heart disease
Lung cancer
COPD
GBD 201645 and Up Study
22 Burden of tobacco use in Australia: ABDS 2015
While the effect size for COPD mortality from the 45 and Up Study may appear high compared with that for the GBD 2016, it is similar to estimates published by other international studies. The effect size for tobacco use linked to COPD mortality in a cohort of women in the United Kingdom was estimated to be 35.3 (Pirie et al. 2013); in a cohort of men and women in the United States aged over 55, the effect size was estimated to be 27.8 and 25.0, respectively (Carter et al. 2015). These estimates are from countries that are comparable to Australia—that is, where current tobacco use prevalence is low and is declining.
Next steps The GBD 2016 effect sizes are based on a meta-analysis that combines the estimates from multiple studies and, as a result, may be less susceptible to bias. However, they represent an average of findings across multiple countries. The results from the 45 and Up Study suggest the effect sizes in Australia for tobacco use for many of the linked diseases are higher than reported by the GBD 2016. This sensitivity analysis demonstrates the impact of using different effect size data to calculate attributable burden. The ABDS Study provides a platform to highlight the utility of local data while also assessing data limitations. Future studies may enable more detailed investigation and methods to incorporate available data while using international data to supplement data gaps.
Burden of tobacco use in Australia: ABDS 2015 23
3 Tobacco use in key population groups in 2015
The burden attributable to tobacco use is unevenly shared across different population groups in Australia. The results in this chapter present this burden by state and territory, remoteness, socioeconomic group and by people diagnosed with a mental health condition. Other population groups, including Indigenous Australians, were out of scope of this study. Note this section uses the relative risks from the GBD 2016 study.
3.1 State and territory This section focuses on the differences in the burden attributable to tobacco use across states and territories. Results are primarily presented as age-standardised rates, a method that removes the influence of differences in age structure but not those for other demographic, socioeconomic or environmental factors.
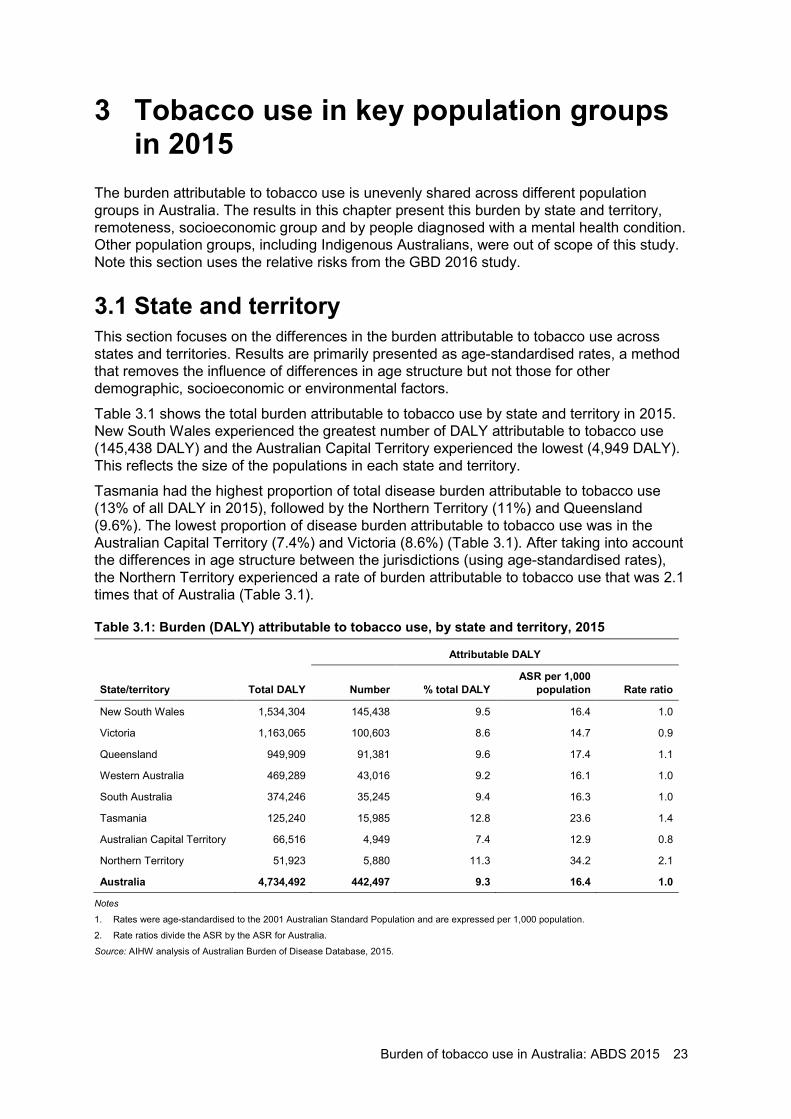
Table 3.1 shows the total burden attributable to tobacco use by state and territory in 2015. New South Wales experienced the greatest number of DALY attributable to tobacco use (145,438 DALY) and the Australian Capital Territory experienced the lowest (4,949 DALY). This reflects the size of the populations in each state and territory.
Tasmania had the highest proportion of total disease burden attributable to tobacco use (13% of all DALY in 2015), followed by the Northern Territory (11%) and Queensland (9.6%). The lowest proportion of disease burden attributable to tobacco use was in the Australian Capital Territory (7.4%) and Victoria (8.6%) (Table 3.1). After taking into account the differences in age structure between the jurisdictions (using age-standardised rates), the Northern Territory experienced a rate of burden attributable to tobacco use that was 2.1 times that of Australia (Table 3.1).
Table 3.1: Burden (DALY) attributable to tobacco use, by state and territory, 2015
Attributable DALY
State/territory Total DALY Number % total DALY ASR per 1,000
population Rate ratio
New South Wales 1,534,304 145,438 9.5 16.4 1.0
Victoria 1,163,065 100,603 8.6 14.7 0.9
Queensland 949,909 91,381 9.6 17.4 1.1
Western Australia 469,289 43,016 9.2 16.1 1.0
South Australia 374,246 35,245 9.4 16.3 1.0
Tasmania 125,240 15,985 12.8 23.6 1.4
Australian Capital Territory 66,516 4,949 7.4 12.9 0.8
Northern Territory 51,923 5,880 11.3 34.2 2.1
Australia 4,734,492 442,497 9.3 16.4 1.0
Notes
1. Rates were age-standardised to the 2001 Australian Standard Population and are expressed per 1,000 population.
2. Rate ratios divide the ASR by the ASR for Australia.
Source: AIHW analysis of Australian Burden of Disease Database, 2015.
24 Burden of tobacco use in Australia: ABDS 2015
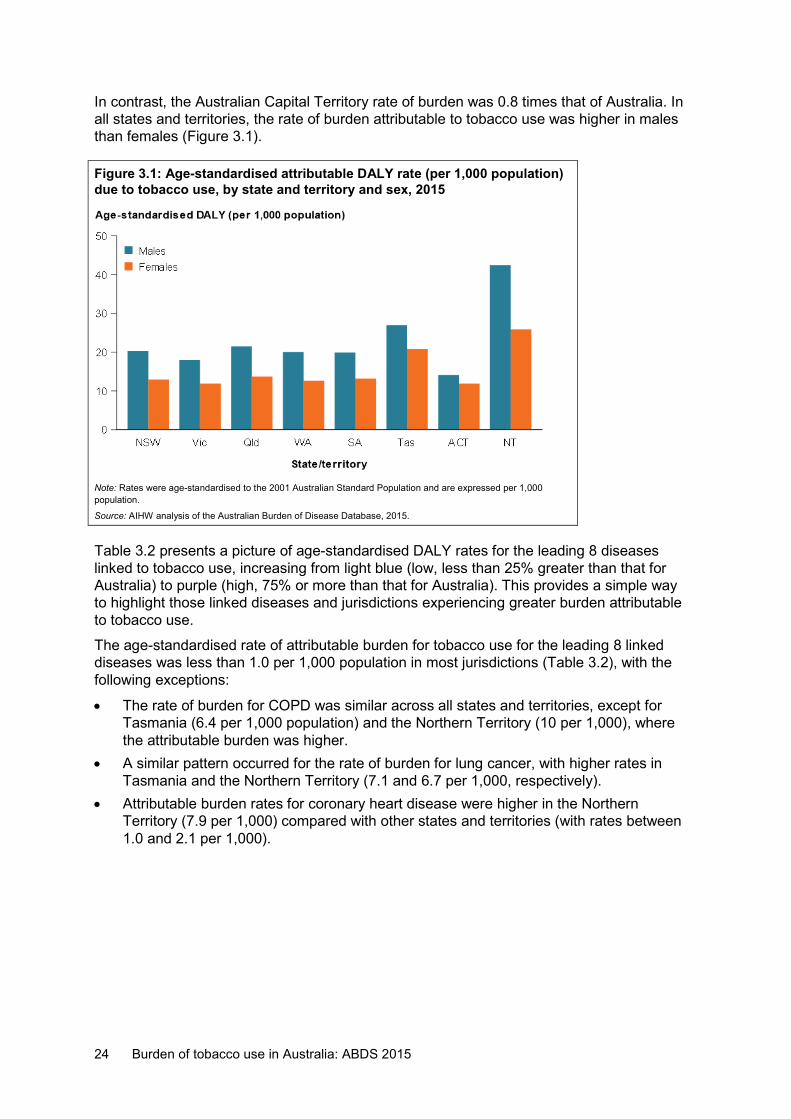
In contrast, the Australian Capital Territory rate of burden was 0.8 times that of Australia. In all states and territories, the rate of burden attributable to tobacco use was higher in males than females (Figure 3.1).
Figure 3.1: Age-standardised attributable DALY rate (per 1,000 population) due to tobacco use, by state and territory and sex, 2015
Note: Rates were age-standardised to the 2001 Australian Standard Population and are expressed per 1,000 population.
Source: AIHW analysis of the Australian Burden of Disease Database, 2015.
Table 3.2 presents a picture of age-standardised DALY rates for the leading 8 diseases linked to tobacco use, increasing from light blue (low, less than 25% greater than that for Australia) to purple (high, 75% or more than that for Australia). This provides a simple way to highlight those linked diseases and jurisdictions experiencing greater burden attributable to tobacco use.
The age-standardised rate of attributable burden for tobacco use for the leading 8 linked diseases was less than 1.0 per 1,000 population in most jurisdictions (Table 3.2), with the following exceptions:
• The rate of burden for COPD was similar across all states and territories, except for Tasmania (6.4 per 1,000 population) and the Northern Territory (10 per 1,000), where the attributable burden was higher.
• A similar pattern occurred for the rate of burden for lung cancer, with higher rates in Tasmania and the Northern Territory (7.1 and 6.7 per 1,000, respectively).
• Attributable burden rates for coronary heart disease were higher in the Northern Territory (7.9 per 1,000) compared with other states and territories (with rates between 1.0 and 2.1 per 1,000).
Burden of tobacco use in Australia: ABDS 2015 25
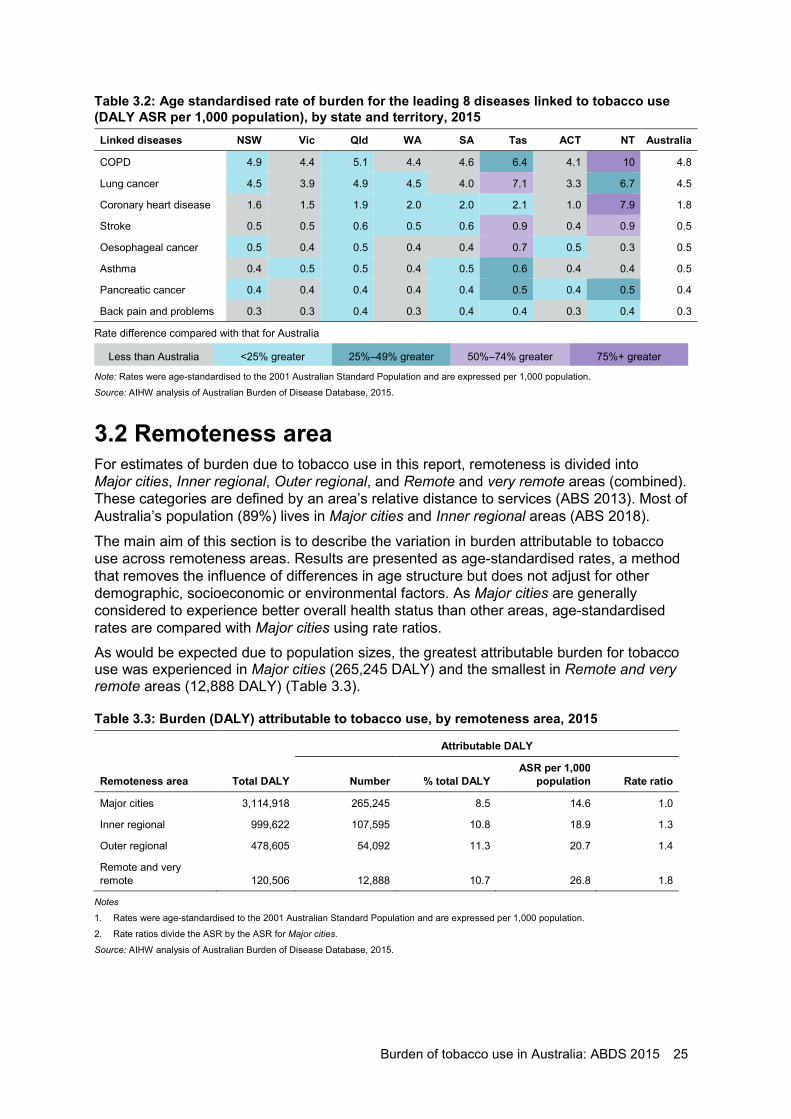
Table 3.2: Age standardised rate of burden for the leading 8 diseases linked to tobacco use (DALY ASR per 1,000 population), by state and territory, 2015 Linked diseases NSW Vic Qld WA SA Tas ACT NT Australia
COPD 4.9 4.4 5.1 4.4 4.6 6.4 4.1 10 4.8
Lung cancer 4.5 3.9 4.9 4.5 4.0 7.1 3.3 6.7 4.5
Coronary heart disease 1.6 1.5 1.9 2.0 2.0 2.1 1.0 7.9 1.8
Stroke 0.5 0.5 0.6 0.5 0.6 0.9 0.4 0.9 0.5
Oesophageal cancer 0.5 0.4 0.5 0.4 0.4 0.7 0.5 0.3 0.5
Asthma 0.4 0.5 0.5 0.4 0.5 0.6 0.4 0.4 0.5
Pancreatic cancer 0.4 0.4 0.4 0.4 0.4 0.5 0.4 0.5 0.4
Back pain and problems 0.3 0.3 0.4 0.3 0.4 0.4 0.3 0.4 0.3
Rate difference compared with that for Australia
Less than Australia <25% greater 25%–49% greater 50%–74% greater 75%+ greater
Note: Rates were age-standardised to the 2001 Australian Standard Population and are expressed per 1,000 population.
Source: AIHW analysis of Australian Burden of Disease Database, 2015.
3.2 Remoteness area For estimates of burden due to tobacco use in this report, remoteness is divided into Major cities, Inner regional, Outer regional, and Remote and very remote areas (combined). These categories are defined by an area’s relative distance to services (ABS 2013). Most of Australia’s population (89%) lives in Major cities and Inner regional areas (ABS 2018).
The main aim of this section is to describe the variation in burden attributable to tobacco use across remoteness areas. Results are presented as age-standardised rates, a method that removes the influence of differences in age structure but does not adjust for other demographic, socioeconomic or environmental factors. As Major cities are generally considered to experience better overall health status than other areas, age-standardised rates are compared with Major cities using rate ratios. As would be expected due to population sizes, the greatest attributable burden for tobacco use was experienced in Major cities (265,245 DALY) and the smallest in Remote and very remote areas (12,888 DALY) (Table 3.3).
Table 3.3: Burden (DALY) attributable to tobacco use, by remoteness area, 2015
Attributable DALY
Remoteness area Total DALY Number % total DALY ASR per 1,000
population Rate ratio
Major cities 3,114,918 265,245 8.5 14.6 1.0
Inner regional 999,622 107,595 10.8 18.9 1.3
Outer regional 478,605 54,092 11.3 20.7 1.4
Remote and very remote 120,506 12,888 10.7 26.8 1.8
Notes
1. Rates were age-standardised to the 2001 Australian Standard Population and are expressed per 1,000 population.
2. Rate ratios divide the ASR by the ASR for Major cities.
Source: AIHW analysis of Australian Burden of Disease Database, 2015.
26 Burden of tobacco use in Australia: ABDS 2015
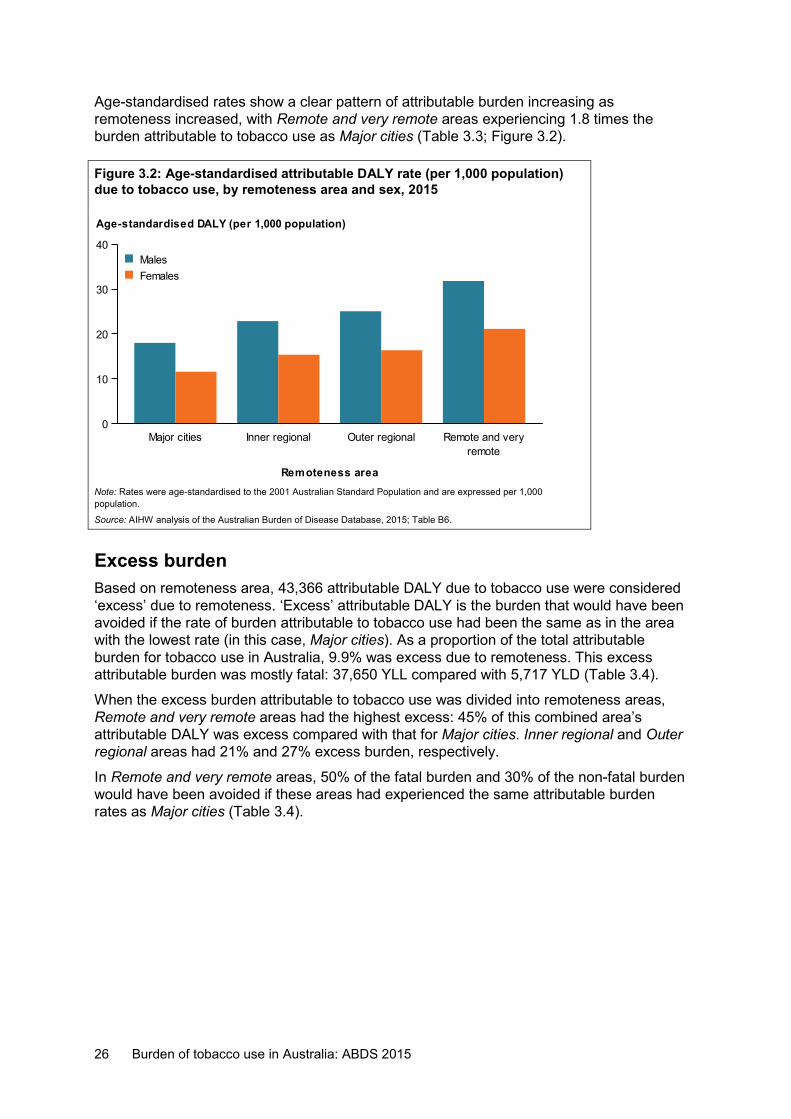
Age-standardised rates show a clear pattern of attributable burden increasing as remoteness increased, with Remote and very remote areas experiencing 1.8 times the burden attributable to tobacco use as Major cities (Table 3.3; Figure 3.2).
Figure 3.2: Age-standardised attributable DALY rate (per 1,000 population) due to tobacco use, by remoteness area and sex, 2015
Note: Rates were age-standardised to the 2001 Australian Standard Population and are expressed per 1,000 population.
Source: AIHW analysis of the Australian Burden of Disease Database, 2015; Table B6.
Excess burden Based on remoteness area, 43,366 attributable DALY due to tobacco use were considered ‘excess’ due to remoteness. ‘Excess’ attributable DALY is the burden that would have been avoided if the rate of burden attributable to tobacco use had been the same as in the area with the lowest rate (in this case, Major cities). As a proportion of the total attributable burden for tobacco use in Australia, 9.9% was excess due to remoteness. This excess attributable burden was mostly fatal: 37,650 YLL compared with 5,717 YLD (Table 3.4).
When the excess burden attributable to tobacco use was divided into remoteness areas, Remote and very remote areas had the highest excess: 45% of this combined area’s attributable DALY was excess compared with that for Major cities. Inner regional and Outer regional areas had 21% and 27% excess burden, respectively.
In Remote and very remote areas, 50% of the fatal burden and 30% of the non-fatal burden would have been avoided if these areas had experienced the same attributable burden rates as Major cities (Table 3.4).
Major cities Inner regional Outer regionalremote
Remote and very
Remoteness area
0
10
20
30
40
Age-standardised DALY (per 1,000 population)
FemalesMales
Burden of tobacco use in Australia: ABDS 2015 27
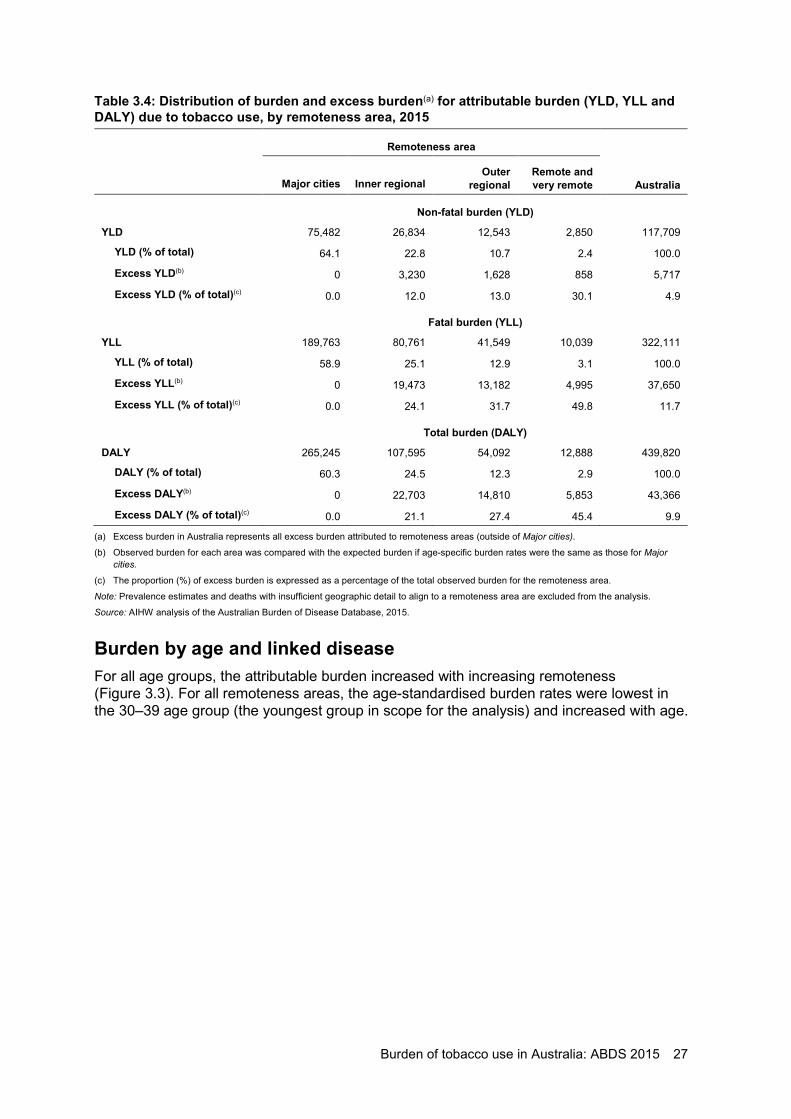
Table 3.4: Distribution of burden and excess burden(a) for attributable burden (YLD, YLL and DALY) due to tobacco use, by remoteness area, 2015
Remoteness area
Major cities Inner regional Outer
regional Remote and very remote Australia
Non-fatal burden (YLD)
YLD 75,482 26,834 12,543 2,850 117,709
YLD (% of total) 64.1 22.8 10.7 2.4 100.0
Excess YLD(b) 0 3,230 1,628 858 5,717
Excess YLD (% of total)(c) 0.0 12.0 13.0 30.1 4.9
Fatal burden (YLL)
YLL 189,763 80,761 41,549 10,039 322,111
YLL (% of total) 58.9 25.1 12.9 3.1 100.0
Excess YLL(b) 0 19,473 13,182 4,995 37,650
Excess YLL (% of total)(c) 0.0 24.1 31.7 49.8 11.7
Total burden (DALY)
DALY 265,245 107,595 54,092 12,888 439,820
DALY (% of total) 60.3 24.5 12.3 2.9 100.0
Excess DALY(b) 0 22,703 14,810 5,853 43,366
Excess DALY (% of total)(c) 0.0 21.1 27.4 45.4 9.9
(a) Excess burden in Australia represents all excess burden attributed to remoteness areas (outside of Major cities).
(b) Observed burden for each area was compared with the expected burden if age-specific burden rates were the same as those for Major cities.
(c) The proportion (%) of excess burden is expressed as a percentage of the total observed burden for the remoteness area.
Note: Prevalence estimates and deaths with insufficient geographic detail to align to a remoteness area are excluded from the analysis.
Source: AIHW analysis of the Australian Burden of Disease Database, 2015.
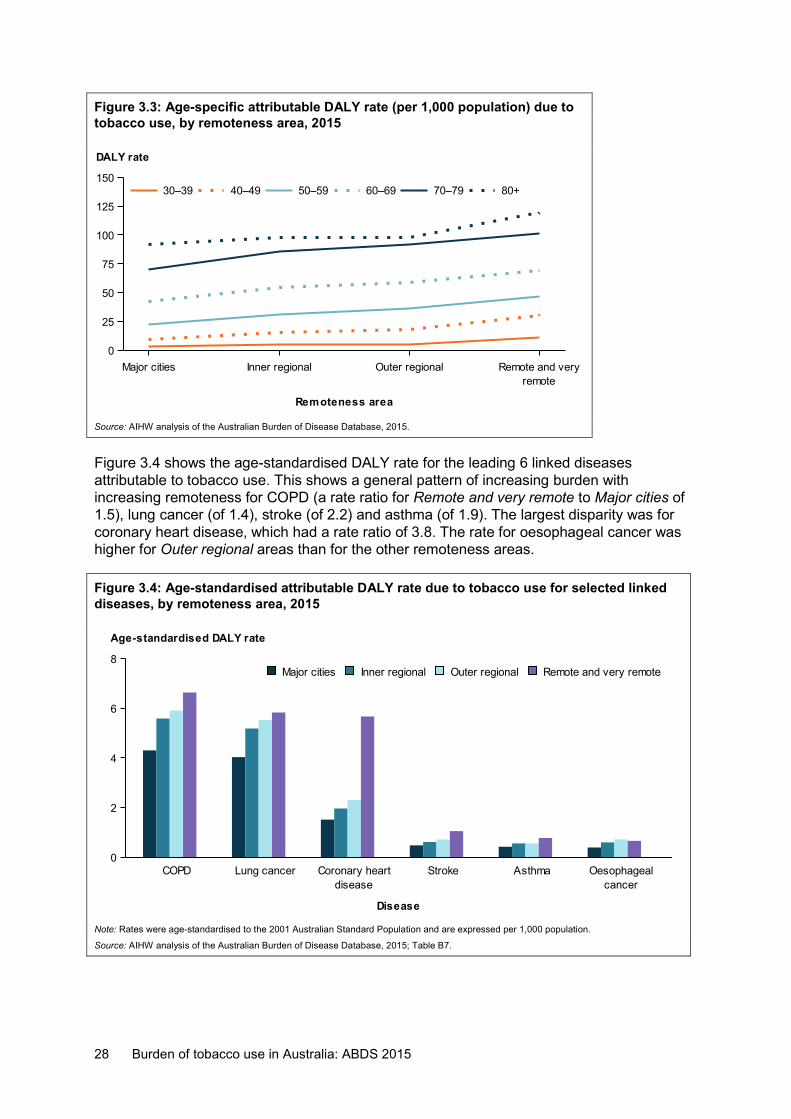
Burden by age and linked disease For all age groups, the attributable burden increased with increasing remoteness (Figure 3.3). For all remoteness areas, the age-standardised burden rates were lowest in the 30–39 age group (the youngest group in scope for the analysis) and increased with age.
28 Burden of tobacco use in Australia: ABDS 2015
Figure 3.3: Age-specific attributable DALY rate (per 1,000 population) due to tobacco use, by remoteness area, 2015
Source: AIHW analysis of the Australian Burden of Disease Database, 2015.
Figure 3.4 shows the age-standardised DALY rate for the leading 6 linked diseases attributable to tobacco use. This shows a general pattern of increasing burden with increasing remoteness for COPD (a rate ratio for Remote and very remote to Major cities of 1.5), lung cancer (of 1.4), stroke (of 2.2) and asthma (of 1.9). The largest disparity was for coronary heart disease, which had a rate ratio of 3.8. The rate for oesophageal cancer was higher for Outer regional areas than for the other remoteness areas.
Figure 3.4: Age-standardised attributable DALY rate due to tobacco use for selected linked diseases, by remoteness area, 2015
Note: Rates were age-standardised to the 2001 Australian Standard Population and are expressed per 1,000 population.
Source: AIHW analysis of the Australian Burden of Disease Database, 2015; Table B7.
Major cities Inner regional Outer regionalremote
Remote and very
Remoteness area
0
25
50
75
100
125
150
DALY rate
80+70–7960–6950–5940–4930–39
COPD Lung cancerdisease
Coronary heart Stroke Asthmacancer
Oesophageal
Disease
0
2
4
6
8
Age-standardised DALY rate
Remote and very remoteOuter regionalInner regionalMajor cities
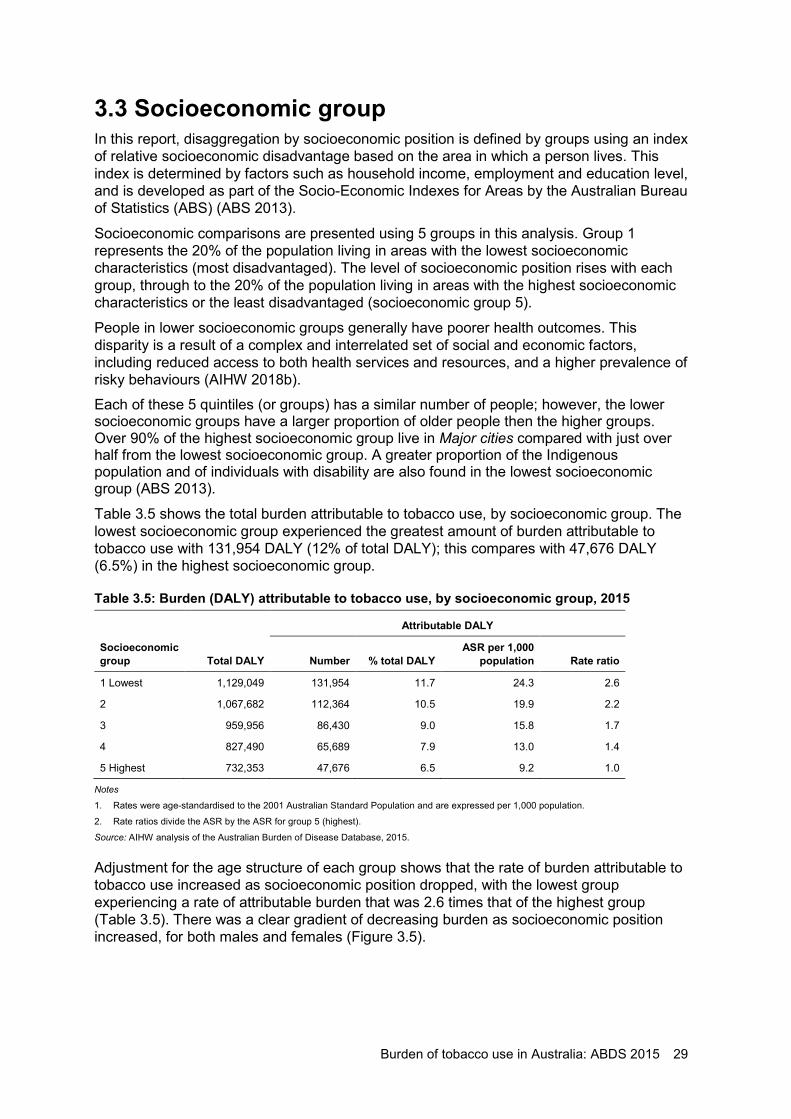
Burden of tobacco use in Australia: ABDS 2015 29
3.3 Socioeconomic group In this report, disaggregation by socioeconomic position is defined by groups using an index of relative socioeconomic disadvantage based on the area in which a person lives. This index is determined by factors such as household income, employment and education level, and is developed as part of the Socio-Economic Indexes for Areas by the Australian Bureau of Statistics (ABS) (ABS 2013).
Socioeconomic comparisons are presented using 5 groups in this analysis. Group 1 represents the 20% of the population living in areas with the lowest socioeconomic characteristics (most disadvantaged). The level of socioeconomic position rises with each group, through to the 20% of the population living in areas with the highest socioeconomic characteristics or the least disadvantaged (socioeconomic group 5).
People in lower socioeconomic groups generally have poorer health outcomes. This disparity is a result of a complex and interrelated set of social and economic factors, including reduced access to both health services and resources, and a higher prevalence of risky behaviours (AIHW 2018b). Each of these 5 quintiles (or groups) has a similar number of people; however, the lower socioeconomic groups have a larger proportion of older people then the higher groups. Over 90% of the highest socioeconomic group live in Major cities compared with just over half from the lowest socioeconomic group. A greater proportion of the Indigenous population and of individuals with disability are also found in the lowest socioeconomic group (ABS 2013).
Table 3.5 shows the total burden attributable to tobacco use, by socioeconomic group. The lowest socioeconomic group experienced the greatest amount of burden attributable to tobacco use with 131,954 DALY (12% of total DALY); this compares with 47,676 DALY (6.5%) in the highest socioeconomic group.
Table 3.5: Burden (DALY) attributable to tobacco use, by socioeconomic group, 2015
Attributable DALY
Socioeconomic group Total DALY Number % total DALY
ASR per 1,000 population Rate ratio
1 Lowest 1,129,049 131,954 11.7 24.3 2.6
2 1,067,682 112,364 10.5 19.9 2.2
3 959,956 86,430 9.0 15.8 1.7
4 827,490 65,689 7.9 13.0 1.4
5 Highest 732,353 47,676 6.5 9.2 1.0
Notes
1. Rates were age-standardised to the 2001 Australian Standard Population and are expressed per 1,000 population.
2. Rate ratios divide the ASR by the ASR for group 5 (highest).
Source: AIHW analysis of the Australian Burden of Disease Database, 2015.
Adjustment for the age structure of each group shows that the rate of burden attributable to tobacco use increased as socioeconomic position dropped, with the lowest group experiencing a rate of attributable burden that was 2.6 times that of the highest group (Table 3.5). There was a clear gradient of decreasing burden as socioeconomic position increased, for both males and females (Figure 3.5).
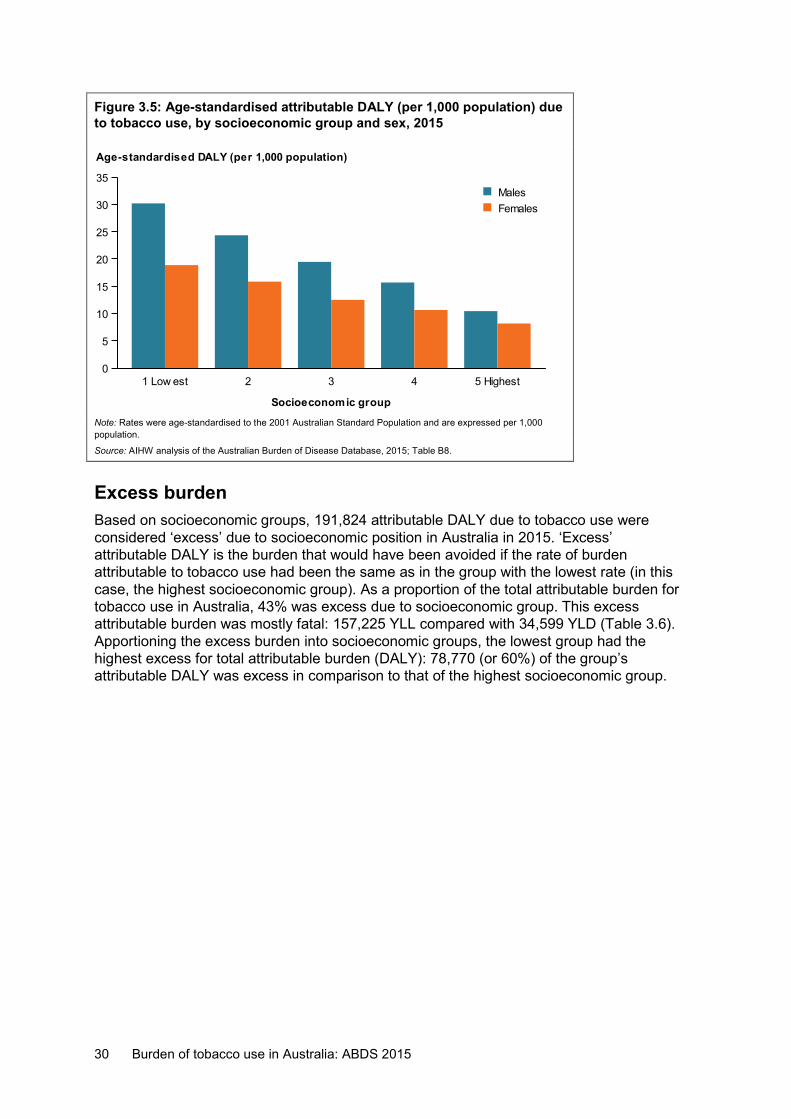
30 Burden of tobacco use in Australia: ABDS 2015
Figure 3.5: Age-standardised attributable DALY (per 1,000 population) due to tobacco use, by socioeconomic group and sex, 2015
Note: Rates were age-standardised to the 2001 Australian Standard Population and are expressed per 1,000 population.
Source: AIHW analysis of the Australian Burden of Disease Database, 2015; Table B8.
Excess burden Based on socioeconomic groups, 191,824 attributable DALY due to tobacco use were considered ‘excess’ due to socioeconomic position in Australia in 2015. ‘Excess’ attributable DALY is the burden that would have been avoided if the rate of burden attributable to tobacco use had been the same as in the group with the lowest rate (in this case, the highest socioeconomic group). As a proportion of the total attributable burden for tobacco use in Australia, 43% was excess due to socioeconomic group. This excess attributable burden was mostly fatal: 157,225 YLL compared with 34,599 YLD (Table 3.6). Apportioning the excess burden into socioeconomic groups, the lowest group had the highest excess for total attributable burden (DALY): 78,770 (or 60%) of the group’s attributable DALY was excess in comparison to that of the highest socioeconomic group.
1 Low est 2 3 4 5 Highest
Socioeconomic group
0
5
10
15
20
25
30
35
Age-standardised DALY (per 1,000 population)
FemalesMales
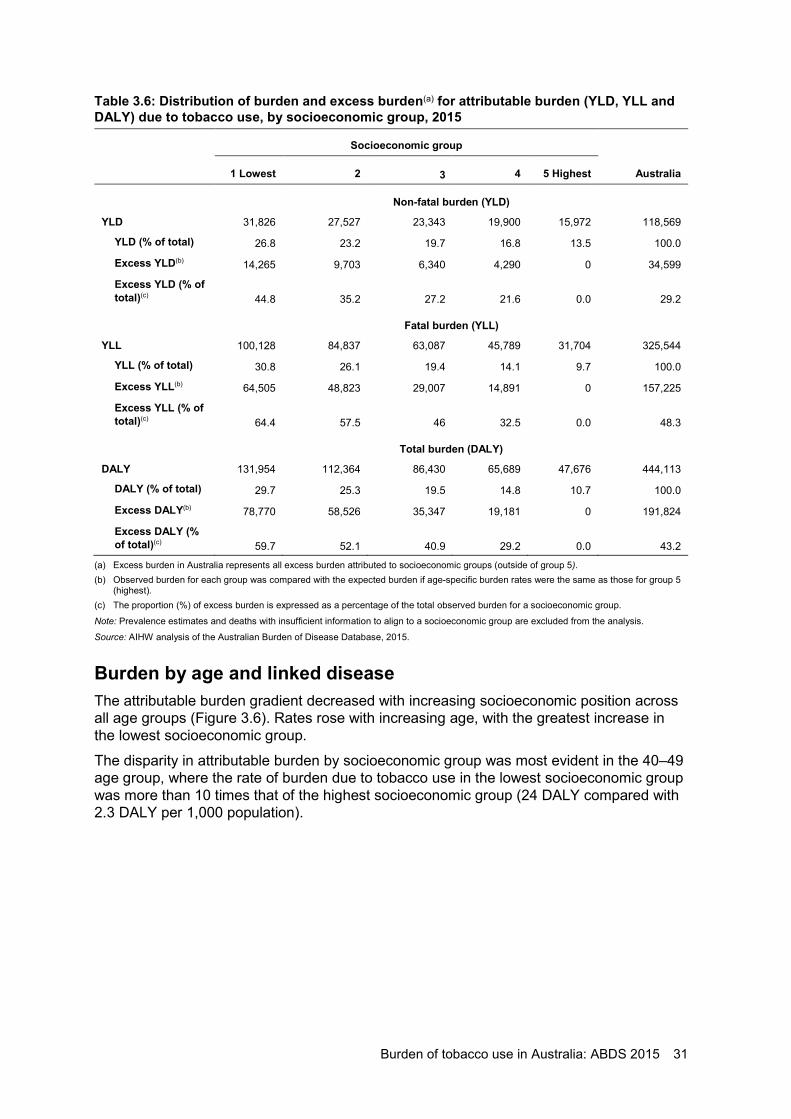
Burden of tobacco use in Australia: ABDS 2015 31
Table 3.6: Distribution of burden and excess burden(a) for attributable burden (YLD, YLL and DALY) due to tobacco use, by socioeconomic group, 2015
Socioeconomic group
1 Lowest 2 3 4 5 Highest Australia
Non-fatal burden (YLD)
YLD 31,826 27,527 23,343 19,900 15,972 118,569
YLD (% of total) 26.8 23.2 19.7 16.8 13.5 100.0
Excess YLD(b) 14,265 9,703 6,340 4,290 0 34,599
Excess YLD (% of total)(c) 44.8 35.2 27.2 21.6 0.0 29.2
Fatal burden (YLL)
YLL 100,128 84,837 63,087 45,789 31,704 325,544
YLL (% of total) 30.8 26.1 19.4 14.1 9.7 100.0
Excess YLL(b) 64,505 48,823 29,007 14,891 0 157,225
Excess YLL (% of total)(c) 64.4 57.5 46 32.5 0.0 48.3
Total burden (DALY)
DALY 131,954 112,364 86,430 65,689 47,676 444,113
DALY (% of total) 29.7 25.3 19.5 14.8 10.7 100.0
Excess DALY(b) 78,770 58,526 35,347 19,181 0 191,824
Excess DALY (% of total)(c) 59.7 52.1 40.9 29.2 0.0 43.2
(a) Excess burden in Australia represents all excess burden attributed to socioeconomic groups (outside of group 5). (b) Observed burden for each group was compared with the expected burden if age-specific burden rates were the same as those for group 5
(highest). (c) The proportion (%) of excess burden is expressed as a percentage of the total observed burden for a socioeconomic group.
Note: Prevalence estimates and deaths with insufficient information to align to a socioeconomic group are excluded from the analysis.
Source: AIHW analysis of the Australian Burden of Disease Database, 2015.
Burden by age and linked disease The attributable burden gradient decreased with increasing socioeconomic position across all age groups (Figure 3.6). Rates rose with increasing age, with the greatest increase in the lowest socioeconomic group.
The disparity in attributable burden by socioeconomic group was most evident in the 40–49 age group, where the rate of burden due to tobacco use in the lowest socioeconomic group was more than 10 times that of the highest socioeconomic group (24 DALY compared with 2.3 DALY per 1,000 population).
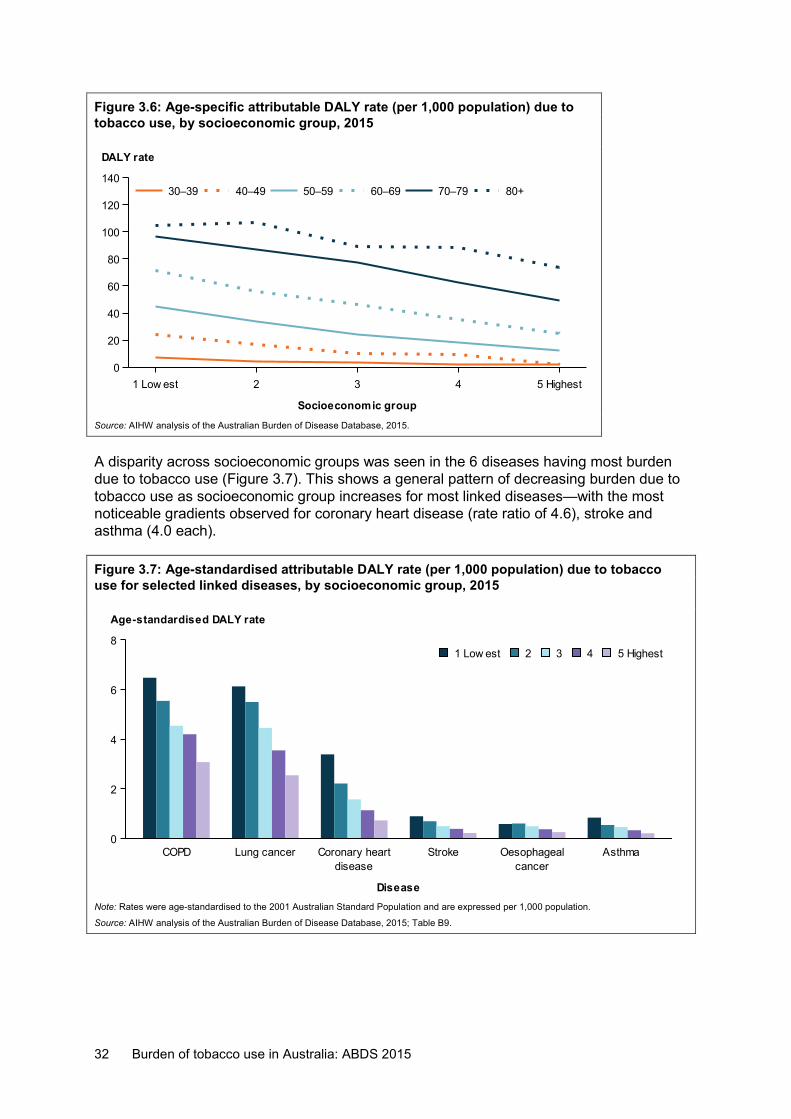
32 Burden of tobacco use in Australia: ABDS 2015
Figure 3.6: Age-specific attributable DALY rate (per 1,000 population) due to tobacco use, by socioeconomic group, 2015
Source: AIHW analysis of the Australian Burden of Disease Database, 2015.
A disparity across socioeconomic groups was seen in the 6 diseases having most burden due to tobacco use (Figure 3.7). This shows a general pattern of decreasing burden due to tobacco use as socioeconomic group increases for most linked diseases—with the most noticeable gradients observed for coronary heart disease (rate ratio of 4.6), stroke and asthma (4.0 each).
Figure 3.7: Age-standardised attributable DALY rate (per 1,000 population) due to tobacco use for selected linked diseases, by socioeconomic group, 2015
Note: Rates were age-standardised to the 2001 Australian Standard Population and are expressed per 1,000 population.
Source: AIHW analysis of the Australian Burden of Disease Database, 2015; Table B9.
1 Low est 2 3 4 5 Highest
Socioeconomic group
0
20
40
60
80
100
120
140
DALY rate
80+70–7960–6950–5940–4930–39
COPD Lung cancerdisease
Coronary heart Strokecancer
Oesophageal Asthma
Disease
0
2
4
6
8
Age-standardised DALY rate
5 Highest4321 Low est
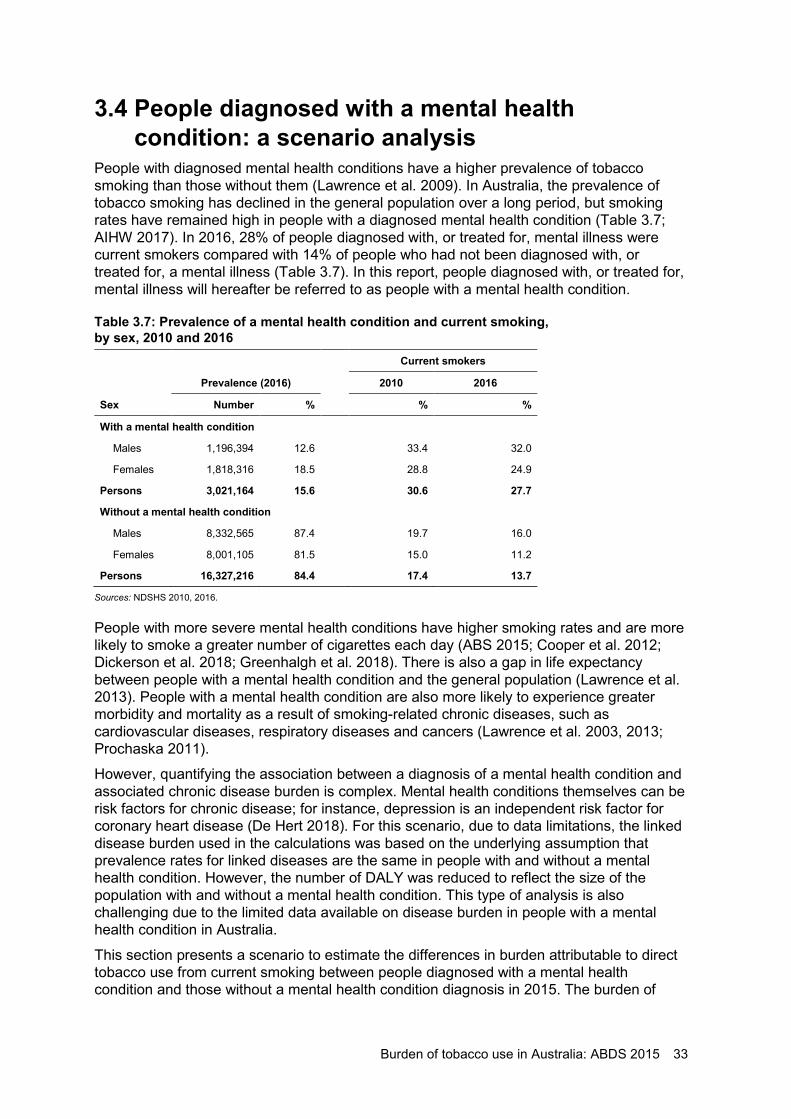
Burden of tobacco use in Australia: ABDS 2015 33
3.4 People diagnosed with a mental health condition: a scenario analysis
People with diagnosed mental health conditions have a higher prevalence of tobacco smoking than those without them (Lawrence et al. 2009). In Australia, the prevalence of tobacco smoking has declined in the general population over a long period, but smoking rates have remained high in people with a diagnosed mental health condition (Table 3.7; AIHW 2017). In 2016, 28% of people diagnosed with, or treated for, mental illness were current smokers compared with 14% of people who had not been diagnosed with, or treated for, a mental illness (Table 3.7). In this report, people diagnosed with, or treated for, mental illness will hereafter be referred to as people with a mental health condition.
Table 3.7: Prevalence of a mental health condition and current smoking, by sex, 2010 and 2016 Current smokers
Prevalence (2016) 2010 2016
Sex Number % % %
With a mental health condition
Males 1,196,394 12.6 33.4 32.0
Females 1,818,316 18.5 28.8 24.9
Persons 3,021,164 15.6 30.6 27.7
Without a mental health condition
Males 8,332,565 87.4 19.7 16.0
Females 8,001,105 81.5 15.0 11.2
Persons 16,327,216 84.4 17.4 13.7
Sources: NDSHS 2010, 2016.
People with more severe mental health conditions have higher smoking rates and are more likely to smoke a greater number of cigarettes each day (ABS 2015; Cooper et al. 2012; Dickerson et al. 2018; Greenhalgh et al. 2018). There is also a gap in life expectancy between people with a mental health condition and the general population (Lawrence et al. 2013). People with a mental health condition are also more likely to experience greater morbidity and mortality as a result of smoking-related chronic diseases, such as cardiovascular diseases, respiratory diseases and cancers (Lawrence et al. 2003, 2013; Prochaska 2011).
However, quantifying the association between a diagnosis of a mental health condition and associated chronic disease burden is complex. Mental health conditions themselves can be risk factors for chronic disease; for instance, depression is an independent risk factor for coronary heart disease (De Hert 2018). For this scenario, due to data limitations, the linked disease burden used in the calculations was based on the underlying assumption that prevalence rates for linked diseases are the same in people with and without a mental health condition. However, the number of DALY was reduced to reflect the size of the population with and without a mental health condition. This type of analysis is also challenging due to the limited data available on disease burden in people with a mental health condition in Australia.
This section presents a scenario to estimate the differences in burden attributable to direct tobacco use from current smoking between people diagnosed with a mental health condition and those without a mental health condition diagnosis in 2015. The burden of
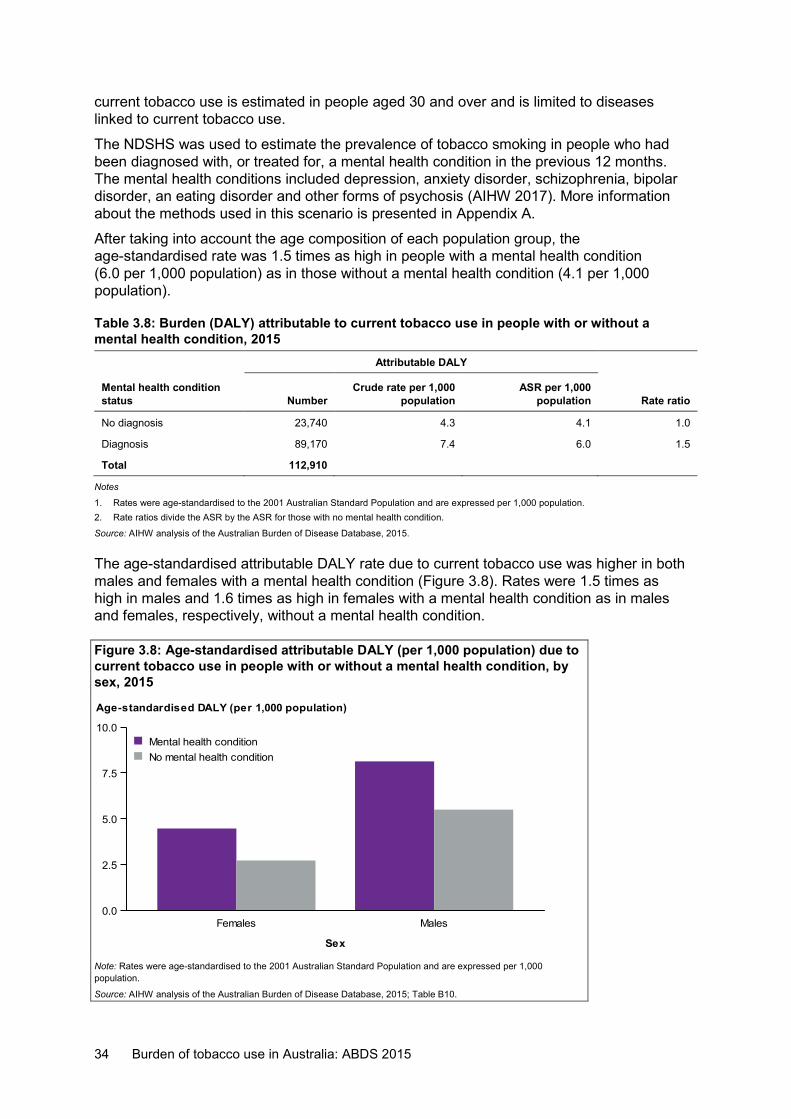
34 Burden of tobacco use in Australia: ABDS 2015
current tobacco use is estimated in people aged 30 and over and is limited to diseases linked to current tobacco use.
The NDSHS was used to estimate the prevalence of tobacco smoking in people who had been diagnosed with, or treated for, a mental health condition in the previous 12 months. The mental health conditions included depression, anxiety disorder, schizophrenia, bipolar disorder, an eating disorder and other forms of psychosis (AIHW 2017). More information about the methods used in this scenario is presented in Appendix A.
After taking into account the age composition of each population group, the age-standardised rate was 1.5 times as high in people with a mental health condition (6.0 per 1,000 population) as in those without a mental health condition (4.1 per 1,000 population).
Table 3.8: Burden (DALY) attributable to current tobacco use in people with or without a mental health condition, 2015
Attributable DALY
Mental health condition status Number
Crude rate per 1,000 population
ASR per 1,000 population Rate ratio
No diagnosis 23,740 4.3 4.1 1.0 Diagnosis 89,170 7.4 6.0 1.5
Total 112,910
Notes
1. Rates were age-standardised to the 2001 Australian Standard Population and are expressed per 1,000 population. 2. Rate ratios divide the ASR by the ASR for those with no mental health condition.
Source: AIHW analysis of the Australian Burden of Disease Database, 2015.
The age-standardised attributable DALY rate due to current tobacco use was higher in both males and females with a mental health condition (Figure 3.8). Rates were 1.5 times as high in males and 1.6 times as high in females with a mental health condition as in males and females, respectively, without a mental health condition.
Figure 3.8: Age-standardised attributable DALY (per 1,000 population) due to current tobacco use in people with or without a mental health condition, by sex, 2015
Note: Rates were age-standardised to the 2001 Australian Standard Population and are expressed per 1,000 population.
Source: AIHW analysis of the Australian Burden of Disease Database, 2015; Table B10.
Females Males
Sex
0.0
2.5
5.0
7.5
10.0
Age-standardised DALY (per 1,000 population)
No mental health conditionMental health condition
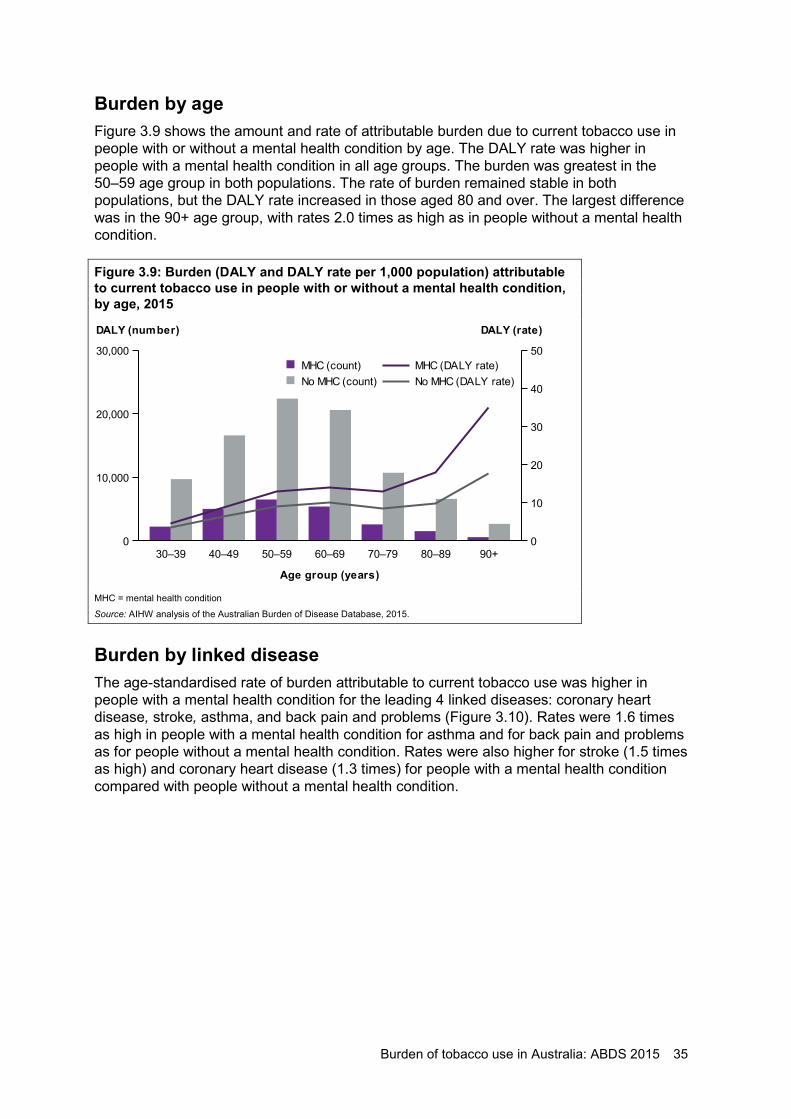
Burden of tobacco use in Australia: ABDS 2015 35
Burden by age Figure 3.9 shows the amount and rate of attributable burden due to current tobacco use in people with or without a mental health condition by age. The DALY rate was higher in people with a mental health condition in all age groups. The burden was greatest in the 50–59 age group in both populations. The rate of burden remained stable in both populations, but the DALY rate increased in those aged 80 and over. The largest difference was in the 90+ age group, with rates 2.0 times as high as in people without a mental health condition.
Figure 3.9: Burden (DALY and DALY rate per 1,000 population) attributable to current tobacco use in people with or without a mental health condition, by age, 2015
MHC = mental health condition
Source: AIHW analysis of the Australian Burden of Disease Database, 2015.
Burden by linked disease The age-standardised rate of burden attributable to current tobacco use was higher in people with a mental health condition for the leading 4 linked diseases: coronary heart disease, stroke, asthma, and back pain and problems (Figure 3.10). Rates were 1.6 times as high in people with a mental health condition for asthma and for back pain and problems as for people without a mental health condition. Rates were also higher for stroke (1.5 times as high) and coronary heart disease (1.3 times) for people with a mental health condition compared with people without a mental health condition.
30–39 40–49 50–59 60–69 70–79 80–89 90+
Age group (years)
0
10,000
20,000
30,000
DALY (number)
0
10
20
30
40
50
DALY (rate)
No MHC (DALY rate)MHC (DALY rate)
No MHC (count)MHC (count)
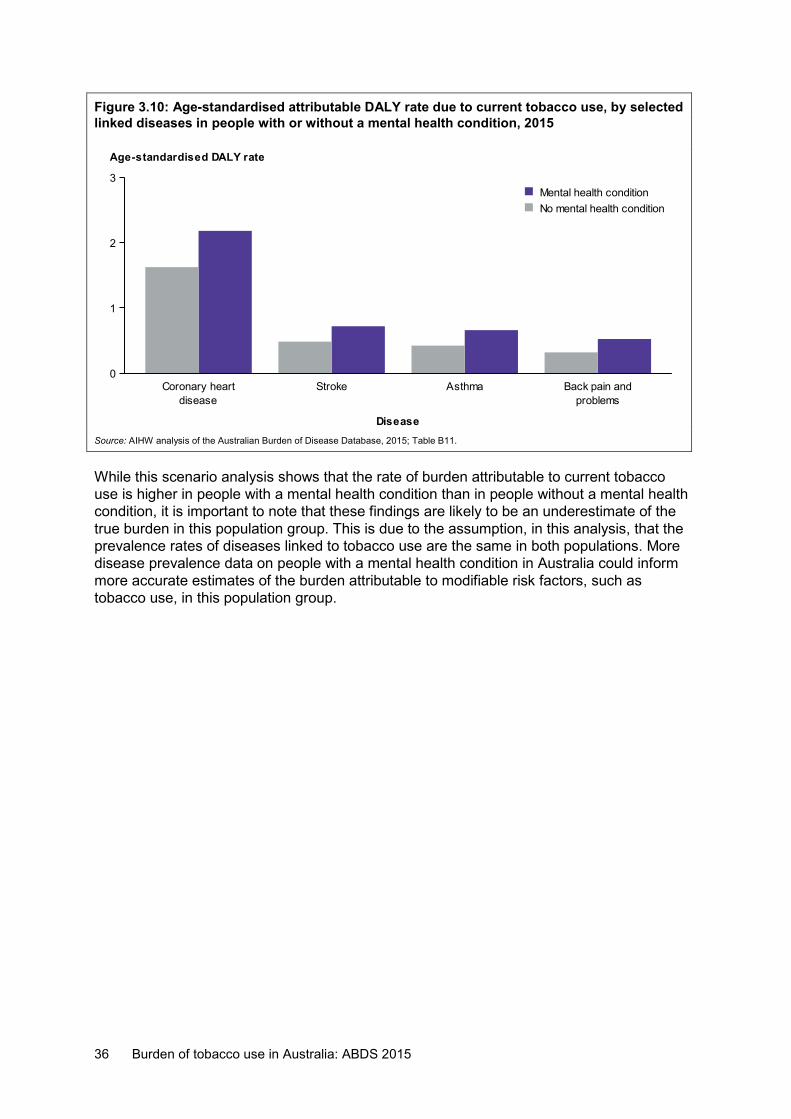
36 Burden of tobacco use in Australia: ABDS 2015
Figure 3.10: Age-standardised attributable DALY rate due to current tobacco use, by selected linked diseases in people with or without a mental health condition, 2015
Source: AIHW analysis of the Australian Burden of Disease Database, 2015; Table B11.
While this scenario analysis shows that the rate of burden attributable to current tobacco use is higher in people with a mental health condition than in people without a mental health condition, it is important to note that these findings are likely to be an underestimate of the true burden in this population group. This is due to the assumption, in this analysis, that the prevalence rates of diseases linked to tobacco use are the same in both populations. More disease prevalence data on people with a mental health condition in Australia could inform more accurate estimates of the burden attributable to modifiable risk factors, such as tobacco use, in this population group.
diseaseCoronary heart Stroke Asthma
problemsBack pain and
Disease
0
1
2
3
Age-standardised DALY rate
No mental health conditionMental health condition
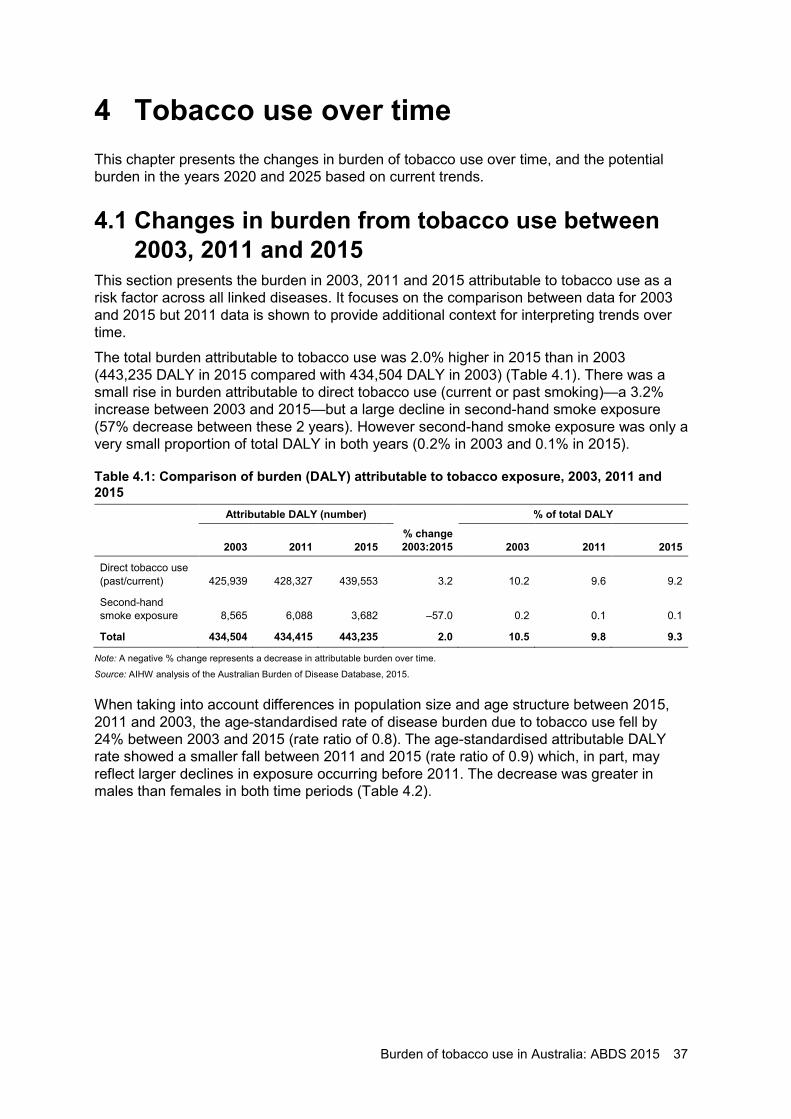
Burden of tobacco use in Australia: ABDS 2015 37
4 Tobacco use over time This chapter presents the changes in burden of tobacco use over time, and the potential burden in the years 2020 and 2025 based on current trends.
4.1 Changes in burden from tobacco use between 2003, 2011 and 2015
This section presents the burden in 2003, 2011 and 2015 attributable to tobacco use as a risk factor across all linked diseases. It focuses on the comparison between data for 2003 and 2015 but 2011 data is shown to provide additional context for interpreting trends over time.
The total burden attributable to tobacco use was 2.0% higher in 2015 than in 2003 (443,235 DALY in 2015 compared with 434,504 DALY in 2003) (Table 4.1). There was a small rise in burden attributable to direct tobacco use (current or past smoking)—a 3.2% increase between 2003 and 2015—but a large decline in second-hand smoke exposure (57% decrease between these 2 years). However second-hand smoke exposure was only a very small proportion of total DALY in both years (0.2% in 2003 and 0.1% in 2015).
Table 4.1: Comparison of burden (DALY) attributable to tobacco exposure, 2003, 2011 and 2015 Attributable DALY (number) % of total DALY
2003 2011 2015 % change 2003:2015 2003 2011 2015
Direct tobacco use (past/current) 425,939 428,327 439,553 3.2 10.2 9.6 9.2
Second-hand smoke exposure 8,565 6,088 3,682 –57.0 0.2 0.1 0.1
Total 434,504 434,415 443,235 2.0 10.5 9.8 9.3
Note: A negative % change represents a decrease in attributable burden over time.
Source: AIHW analysis of the Australian Burden of Disease Database, 2015.
When taking into account differences in population size and age structure between 2015, 2011 and 2003, the age-standardised rate of disease burden due to tobacco use fell by 24% between 2003 and 2015 (rate ratio of 0.8). The age-standardised attributable DALY rate showed a smaller fall between 2011 and 2015 (rate ratio of 0.9) which, in part, may reflect larger declines in exposure occurring before 2011. The decrease was greater in males than females in both time periods (Table 4.2).
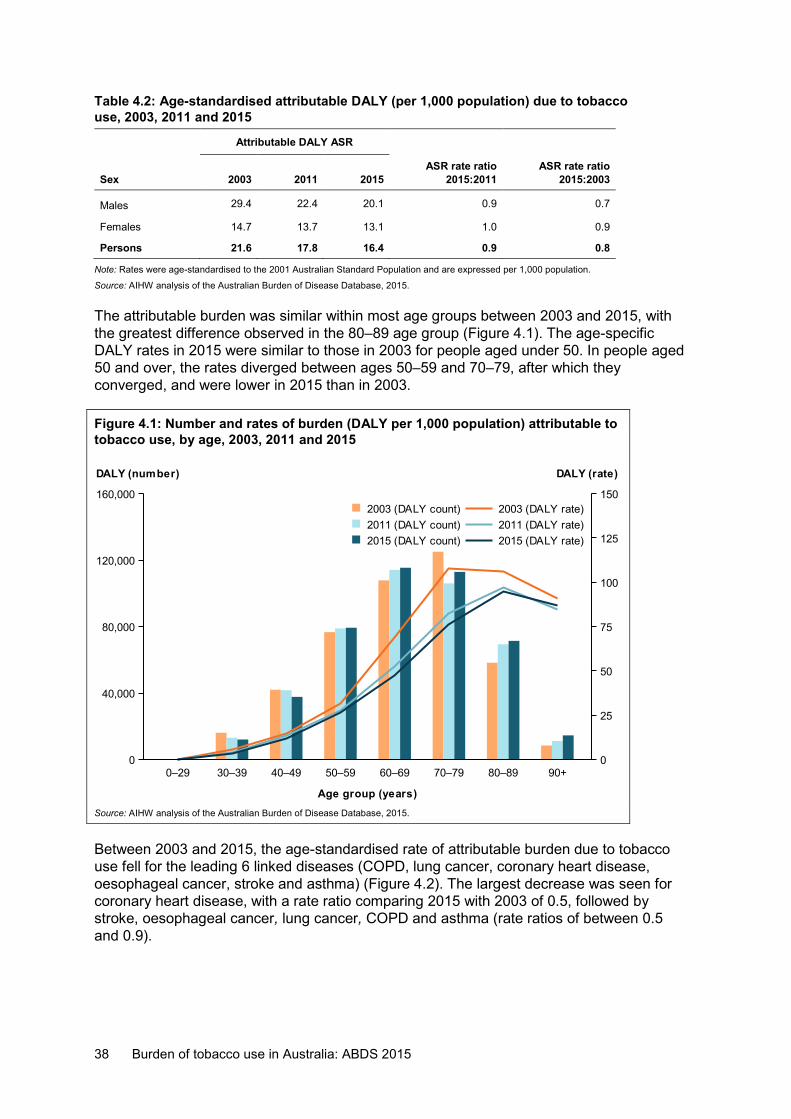
38 Burden of tobacco use in Australia: ABDS 2015
Table 4.2: Age-standardised attributable DALY (per 1,000 population) due to tobacco use, 2003, 2011 and 2015
Attributable DALY ASR
Sex 2003 2011 2015 ASR rate ratio
2015:2011 ASR rate ratio
2015:2003
Males 29.4 22.4 20.1 0.9 0.7
Females 14.7 13.7 13.1 1.0 0.9
Persons 21.6 17.8 16.4 0.9 0.8
Note: Rates were age-standardised to the 2001 Australian Standard Population and are expressed per 1,000 population.
Source: AIHW analysis of the Australian Burden of Disease Database, 2015.
The attributable burden was similar within most age groups between 2003 and 2015, with the greatest difference observed in the 80–89 age group (Figure 4.1). The age-specific DALY rates in 2015 were similar to those in 2003 for people aged under 50. In people aged 50 and over, the rates diverged between ages 50–59 and 70–79, after which they converged, and were lower in 2015 than in 2003.
Figure 4.1: Number and rates of burden (DALY per 1,000 population) attributable to tobacco use, by age, 2003, 2011 and 2015
Source: AIHW analysis of the Australian Burden of Disease Database, 2015.
Between 2003 and 2015, the age-standardised rate of attributable burden due to tobacco use fell for the leading 6 linked diseases (COPD, lung cancer, coronary heart disease, oesophageal cancer, stroke and asthma) (Figure 4.2). The largest decrease was seen for coronary heart disease, with a rate ratio comparing 2015 with 2003 of 0.5, followed by stroke, oesophageal cancer, lung cancer, COPD and asthma (rate ratios of between 0.5 and 0.9).
0–29 30–39 40–49 50–59 60–69 70–79 80–89 90+
Age group (years)
0
40,000
80,000
120,000
160,000
DALY (number)
0
25
50
75
100
125
150
DALY (rate)
2015 (DALY rate)2011 (DALY rate)2003 (DALY rate)
2015 (DALY count)2011 (DALY count)2003 (DALY count)
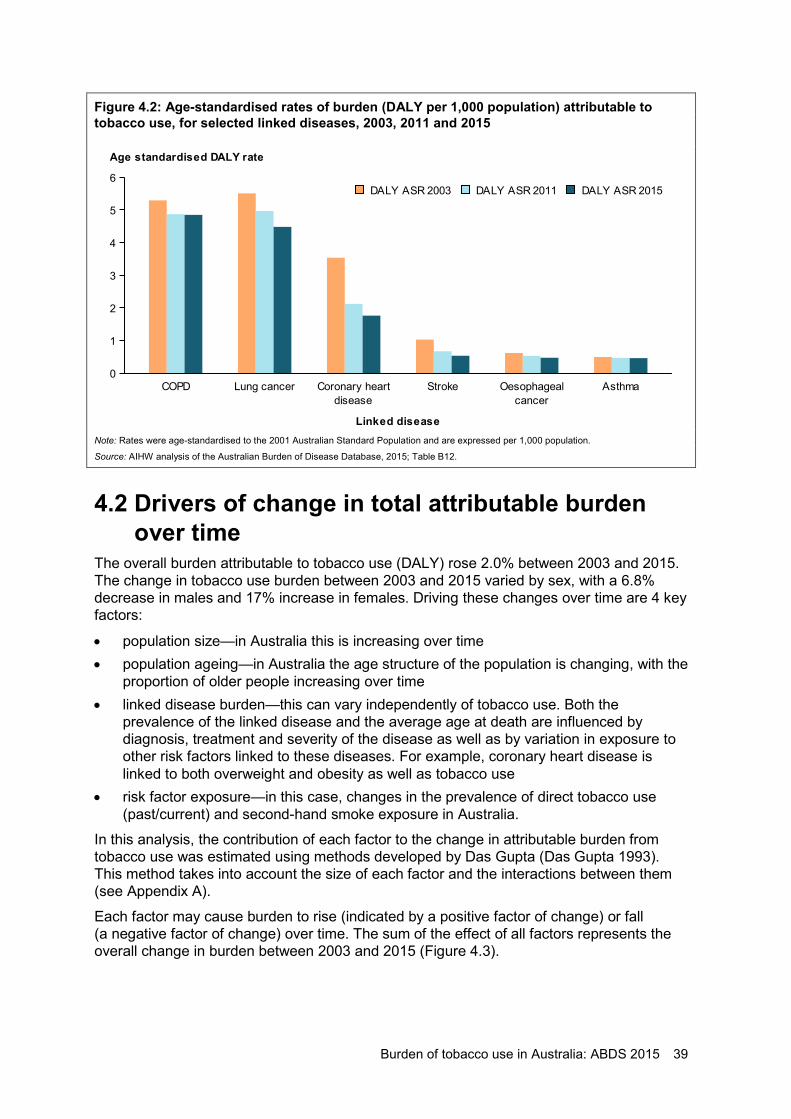
Burden of tobacco use in Australia: ABDS 2015 39
Figure 4.2: Age-standardised rates of burden (DALY per 1,000 population) attributable to tobacco use, for selected linked diseases, 2003, 2011 and 2015
Note: Rates were age-standardised to the 2001 Australian Standard Population and are expressed per 1,000 population.
Source: AIHW analysis of the Australian Burden of Disease Database, 2015; Table B12.
4.2 Drivers of change in total attributable burden over time
The overall burden attributable to tobacco use (DALY) rose 2.0% between 2003 and 2015. The change in tobacco use burden between 2003 and 2015 varied by sex, with a 6.8% decrease in males and 17% increase in females. Driving these changes over time are 4 key factors:
• population size—in Australia this is increasing over time • population ageing—in Australia the age structure of the population is changing, with the
proportion of older people increasing over time • linked disease burden—this can vary independently of tobacco use. Both the
prevalence of the linked disease and the average age at death are influenced by diagnosis, treatment and severity of the disease as well as by variation in exposure to other risk factors linked to these diseases. For example, coronary heart disease is linked to both overweight and obesity as well as tobacco use
• risk factor exposure—in this case, changes in the prevalence of direct tobacco use (past/current) and second-hand smoke exposure in Australia.
In this analysis, the contribution of each factor to the change in attributable burden from tobacco use was estimated using methods developed by Das Gupta (Das Gupta 1993). This method takes into account the size of each factor and the interactions between them (see Appendix A).
Each factor may cause burden to rise (indicated by a positive factor of change) or fall (a negative factor of change) over time. The sum of the effect of all factors represents the overall change in burden between 2003 and 2015 (Figure 4.3).
COPD Lung cancerdisease
Coronary heart Strokecancer
Oesophageal Asthma
Linked disease
0
1
2
3
4
5
6
Age standardised DALY rate
DALY ASR 2015DALY ASR 2011DALY ASR 2003
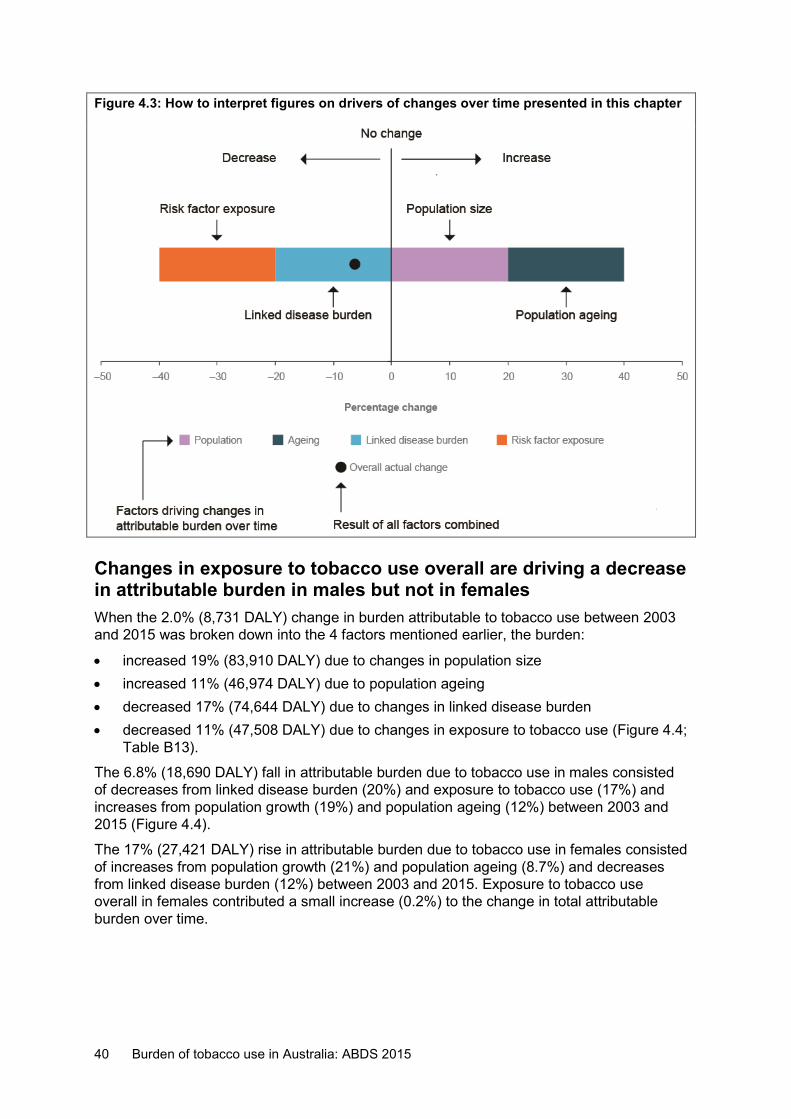
40 Burden of tobacco use in Australia: ABDS 2015
Figure 4.3: How to interpret figures on drivers of changes over time presented in this chapter
Changes in exposure to tobacco use overall are driving a decrease in attributable burden in males but not in females When the 2.0% (8,731 DALY) change in burden attributable to tobacco use between 2003 and 2015 was broken down into the 4 factors mentioned earlier, the burden:
• increased 19% (83,910 DALY) due to changes in population size • increased 11% (46,974 DALY) due to population ageing • decreased 17% (74,644 DALY) due to changes in linked disease burden • decreased 11% (47,508 DALY) due to changes in exposure to tobacco use (Figure 4.4;
Table B13).
The 6.8% (18,690 DALY) fall in attributable burden due to tobacco use in males consisted of decreases from linked disease burden (20%) and exposure to tobacco use (17%) and increases from population growth (19%) and population ageing (12%) between 2003 and 2015 (Figure 4.4).
The 17% (27,421 DALY) rise in attributable burden due to tobacco use in females consisted of increases from population growth (21%) and population ageing (8.7%) and decreases from linked disease burden (12%) between 2003 and 2015. Exposure to tobacco use overall in females contributed a small increase (0.2%) to the change in total attributable burden over time.
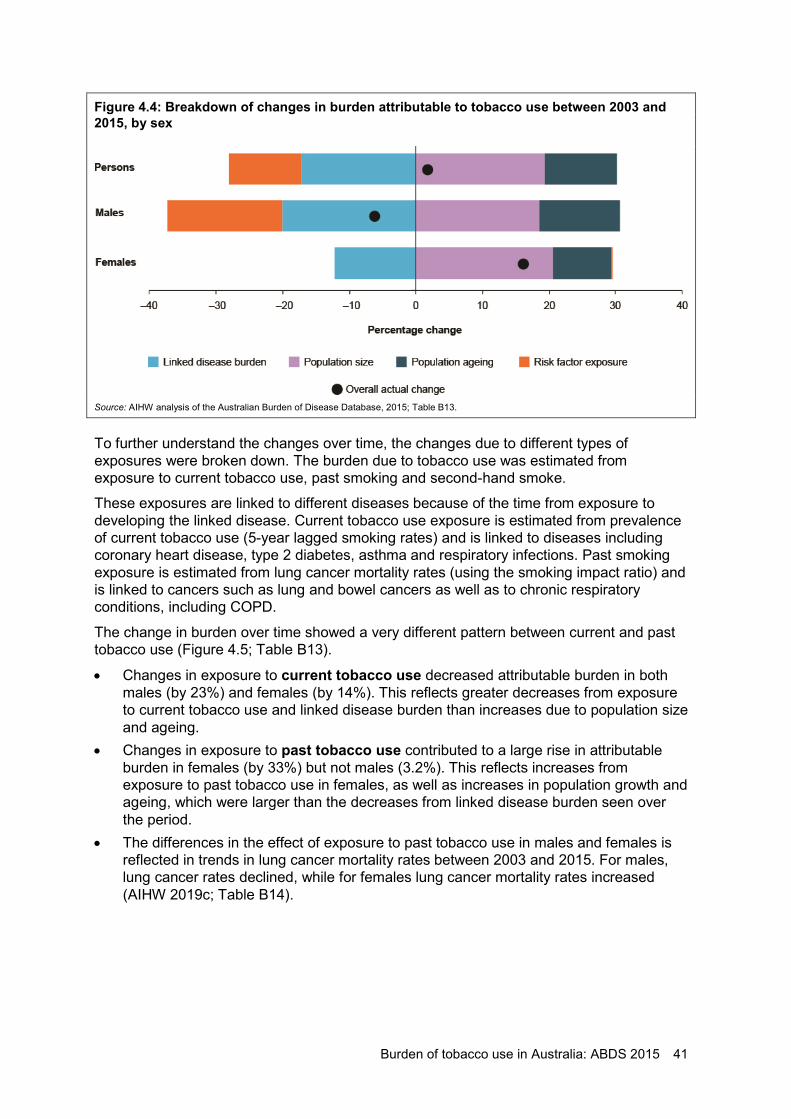
Burden of tobacco use in Australia: ABDS 2015 41
Figure 4.4: Breakdown of changes in burden attributable to tobacco use between 2003 and 2015, by sex
Source: AIHW analysis of the Australian Burden of Disease Database, 2015; Table B13.
To further understand the changes over time, the changes due to different types of exposures were broken down. The burden due to tobacco use was estimated from exposure to current tobacco use, past smoking and second-hand smoke.
These exposures are linked to different diseases because of the time from exposure to developing the linked disease. Current tobacco use exposure is estimated from prevalence of current tobacco use (5-year lagged smoking rates) and is linked to diseases including coronary heart disease, type 2 diabetes, asthma and respiratory infections. Past smoking exposure is estimated from lung cancer mortality rates (using the smoking impact ratio) and is linked to cancers such as lung and bowel cancers as well as to chronic respiratory conditions, including COPD.
The change in burden over time showed a very different pattern between current and past tobacco use (Figure 4.5; Table B13).
• Changes in exposure to current tobacco use decreased attributable burden in both males (by 23%) and females (by 14%). This reflects greater decreases from exposure to current tobacco use and linked disease burden than increases due to population size and ageing.
• Changes in exposure to past tobacco use contributed to a large rise in attributable burden in females (by 33%) but not males (3.2%). This reflects increases from exposure to past tobacco use in females, as well as increases in population growth and ageing, which were larger than the decreases from linked disease burden seen over the period.
• The differences in the effect of exposure to past tobacco use in males and females is reflected in trends in lung cancer mortality rates between 2003 and 2015. For males, lung cancer rates declined, while for females lung cancer mortality rates increased (AIHW 2019c; Table B14).
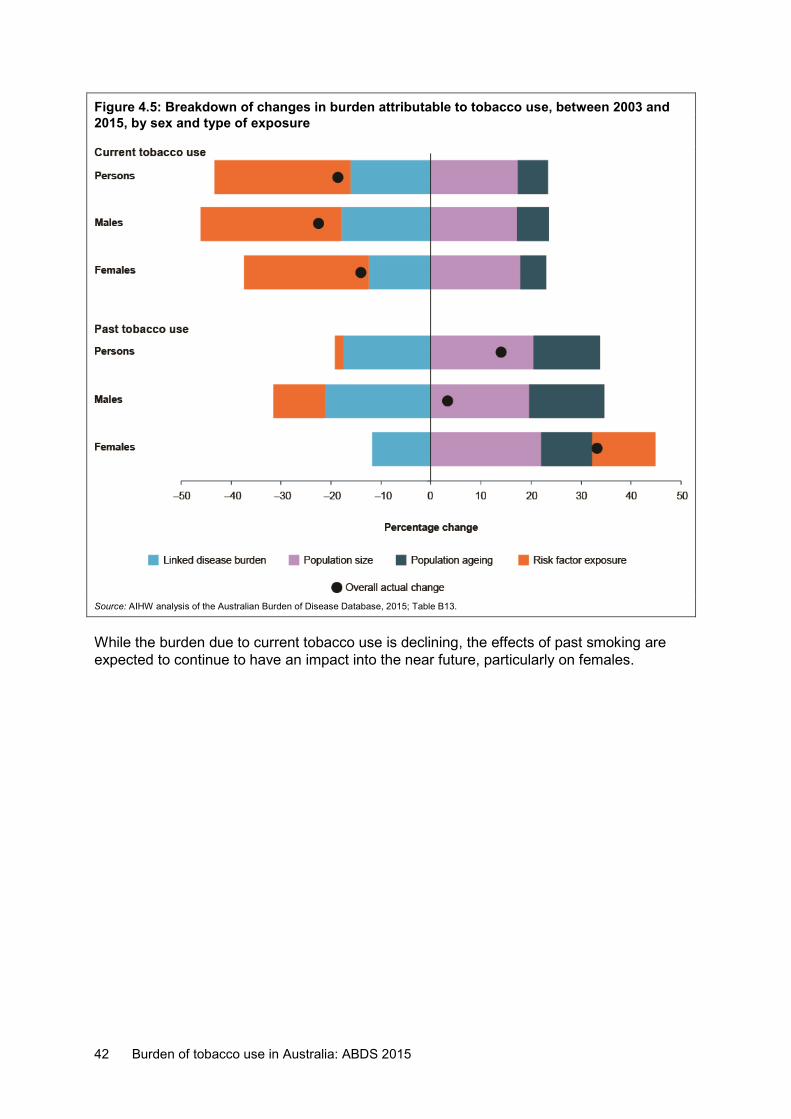
42 Burden of tobacco use in Australia: ABDS 2015
Figure 4.5: Breakdown of changes in burden attributable to tobacco use, between 2003 and 2015, by sex and type of exposure
Source: AIHW analysis of the Australian Burden of Disease Database, 2015; Table B13.
While the burden due to current tobacco use is declining, the effects of past smoking are expected to continue to have an impact into the near future, particularly on females.
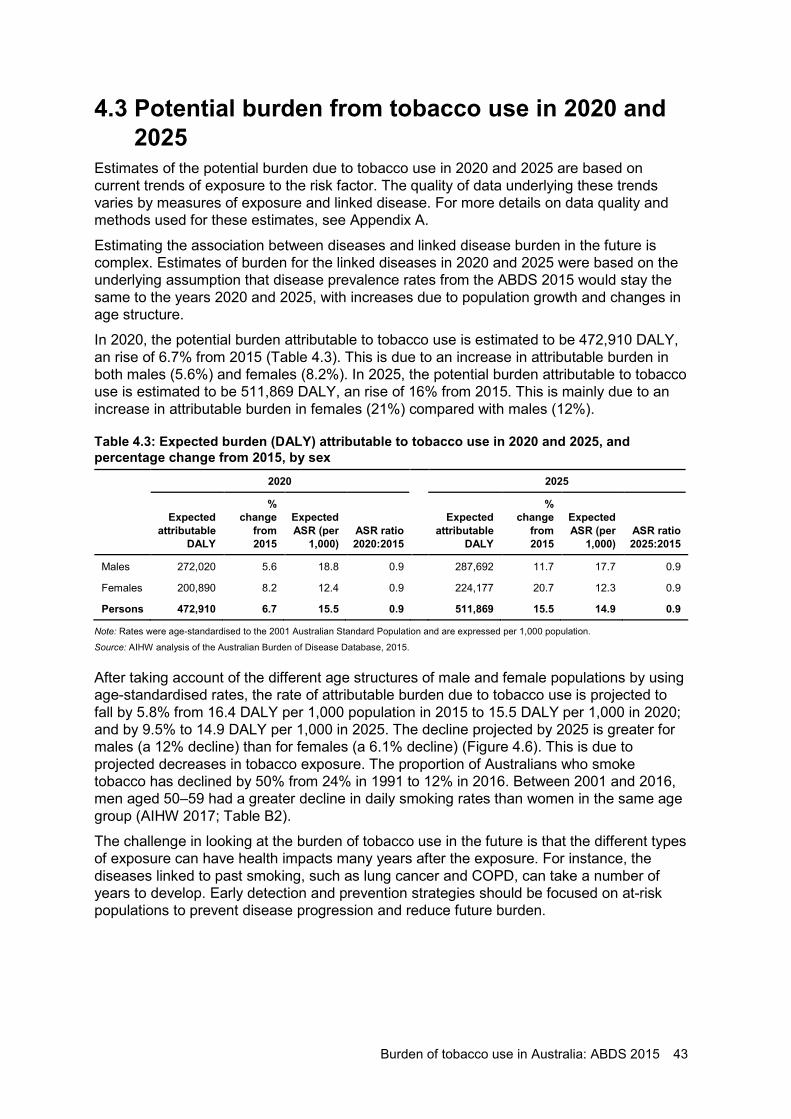
Burden of tobacco use in Australia: ABDS 2015 43
4.3 Potential burden from tobacco use in 2020 and 2025
Estimates of the potential burden due to tobacco use in 2020 and 2025 are based on current trends of exposure to the risk factor. The quality of data underlying these trends varies by measures of exposure and linked disease. For more details on data quality and methods used for these estimates, see Appendix A.
Estimating the association between diseases and linked disease burden in the future is complex. Estimates of burden for the linked diseases in 2020 and 2025 were based on the underlying assumption that disease prevalence rates from the ABDS 2015 would stay the same to the years 2020 and 2025, with increases due to population growth and changes in age structure.
In 2020, the potential burden attributable to tobacco use is estimated to be 472,910 DALY, an rise of 6.7% from 2015 (Table 4.3). This is due to an increase in attributable burden in both males (5.6%) and females (8.2%). In 2025, the potential burden attributable to tobacco use is estimated to be 511,869 DALY, an rise of 16% from 2015. This is mainly due to an increase in attributable burden in females (21%) compared with males (12%).
Table 4.3: Expected burden (DALY) attributable to tobacco use in 2020 and 2025, and percentage change from 2015, by sex
2020 2025
Expected attributable
DALY
% change
from 2015
Expected ASR (per
1,000) ASR ratio 2020:2015
Expected attributable
DALY
% change
from 2015
Expected ASR (per
1,000) ASR ratio 2025:2015
Males 272,020 5.6 18.8 0.9 287,692 11.7 17.7 0.9
Females 200,890 8.2 12.4 0.9 224,177 20.7 12.3 0.9
Persons 472,910 6.7 15.5 0.9 511,869 15.5 14.9 0.9
Note: Rates were age-standardised to the 2001 Australian Standard Population and are expressed per 1,000 population.
Source: AIHW analysis of the Australian Burden of Disease Database, 2015.
After taking account of the different age structures of male and female populations by using age-standardised rates, the rate of attributable burden due to tobacco use is projected to fall by 5.8% from 16.4 DALY per 1,000 population in 2015 to 15.5 DALY per 1,000 in 2020; and by 9.5% to 14.9 DALY per 1,000 in 2025. The decline projected by 2025 is greater for males (a 12% decline) than for females (a 6.1% decline) (Figure 4.6). This is due to projected decreases in tobacco exposure. The proportion of Australians who smoke tobacco has declined by 50% from 24% in 1991 to 12% in 2016. Between 2001 and 2016, men aged 50–59 had a greater decline in daily smoking rates than women in the same age group (AIHW 2017; Table B2).
The challenge in looking at the burden of tobacco use in the future is that the different types of exposure can have health impacts many years after the exposure. For instance, the diseases linked to past smoking, such as lung cancer and COPD, can take a number of years to develop. Early detection and prevention strategies should be focused on at-risk populations to prevent disease progression and reduce future burden.
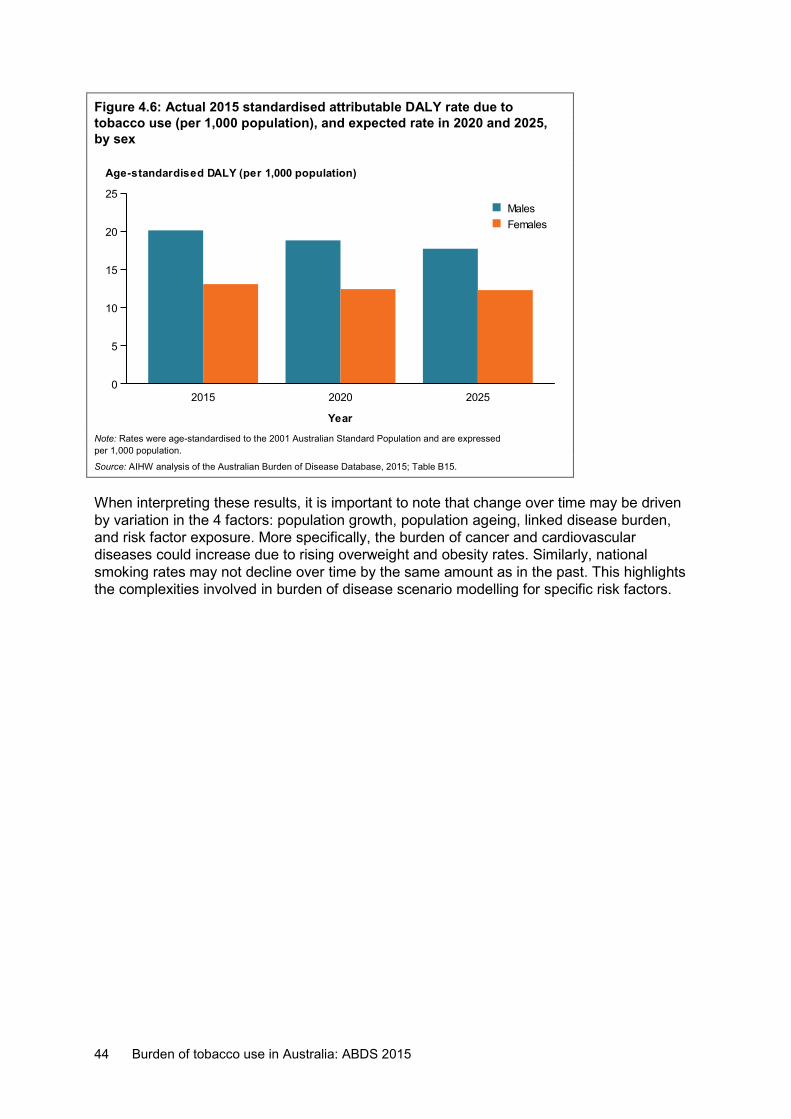
44 Burden of tobacco use in Australia: ABDS 2015
Figure 4.6: Actual 2015 standardised attributable DALY rate due to tobacco use (per 1,000 population), and expected rate in 2020 and 2025, by sex
Note: Rates were age-standardised to the 2001 Australian Standard Population and are expressed per 1,000 population.
Source: AIHW analysis of the Australian Burden of Disease Database, 2015; Table B15.
When interpreting these results, it is important to note that change over time may be driven by variation in the 4 factors: population growth, population ageing, linked disease burden, and risk factor exposure. More specifically, the burden of cancer and cardiovascular diseases could increase due to rising overweight and obesity rates. Similarly, national smoking rates may not decline over time by the same amount as in the past. This highlights the complexities involved in burden of disease scenario modelling for specific risk factors.
2015 2020 2025
Year
0
5
10
15
20
25
Age-standardised DALY (per 1,000 population)
FemalesMales
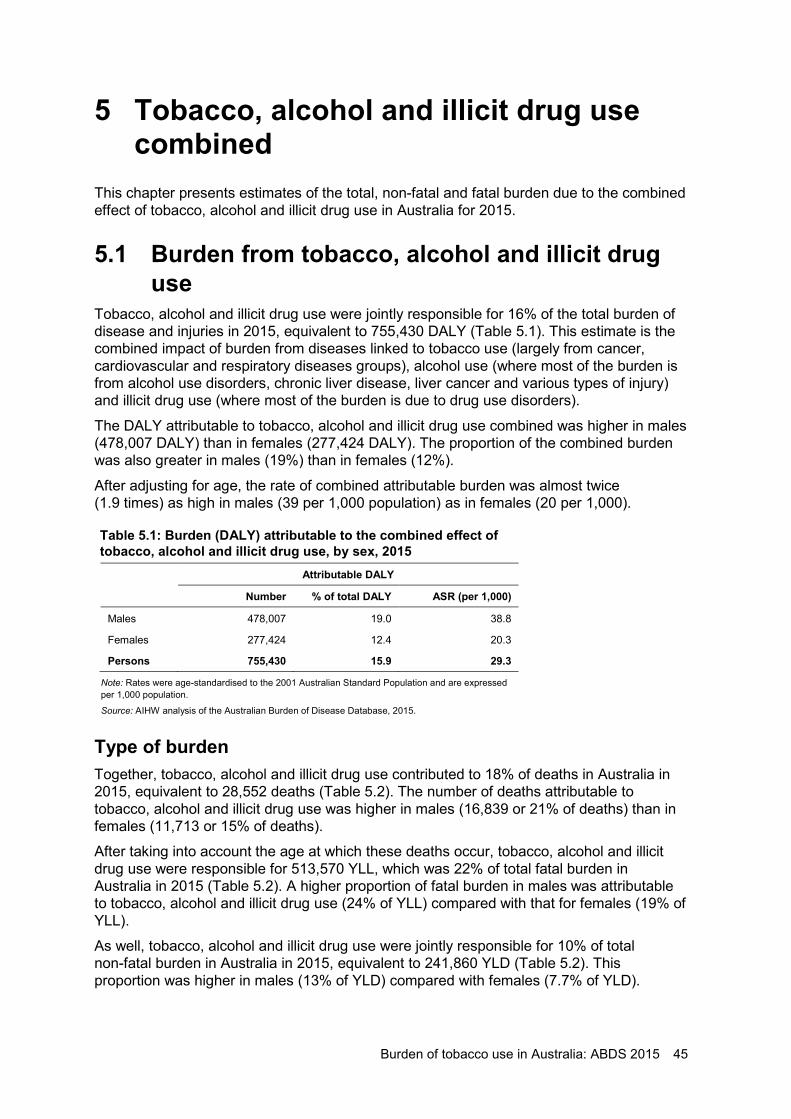
Burden of tobacco use in Australia: ABDS 2015 45
5 Tobacco, alcohol and illicit drug use combined
This chapter presents estimates of the total, non-fatal and fatal burden due to the combined effect of tobacco, alcohol and illicit drug use in Australia for 2015.
5.1 Burden from tobacco, alcohol and illicit drug use
Tobacco, alcohol and illicit drug use were jointly responsible for 16% of the total burden of disease and injuries in 2015, equivalent to 755,430 DALY (Table 5.1). This estimate is the combined impact of burden from diseases linked to tobacco use (largely from cancer, cardiovascular and respiratory diseases groups), alcohol use (where most of the burden is from alcohol use disorders, chronic liver disease, liver cancer and various types of injury) and illicit drug use (where most of the burden is due to drug use disorders).
The DALY attributable to tobacco, alcohol and illicit drug use combined was higher in males (478,007 DALY) than in females (277,424 DALY). The proportion of the combined burden was also greater in males (19%) than in females (12%).
After adjusting for age, the rate of combined attributable burden was almost twice (1.9 times) as high in males (39 per 1,000 population) as in females (20 per 1,000).
Table 5.1: Burden (DALY) attributable to the combined effect of tobacco, alcohol and illicit drug use, by sex, 2015
Attributable DALY
Number % of total DALY ASR (per 1,000)
Males 478,007 19.0 38.8
Females 277,424 12.4 20.3
Persons 755,430 15.9 29.3
Note: Rates were age-standardised to the 2001 Australian Standard Population and are expressed per 1,000 population.
Source: AIHW analysis of the Australian Burden of Disease Database, 2015.
Type of burden Together, tobacco, alcohol and illicit drug use contributed to 18% of deaths in Australia in 2015, equivalent to 28,552 deaths (Table 5.2). The number of deaths attributable to tobacco, alcohol and illicit drug use was higher in males (16,839 or 21% of deaths) than in females (11,713 or 15% of deaths).
After taking into account the age at which these deaths occur, tobacco, alcohol and illicit drug use were responsible for 513,570 YLL, which was 22% of total fatal burden in Australia in 2015 (Table 5.2). A higher proportion of fatal burden in males was attributable to tobacco, alcohol and illicit drug use (24% of YLL) compared with that for females (19% of YLL).
As well, tobacco, alcohol and illicit drug use were jointly responsible for 10% of total non-fatal burden in Australia in 2015, equivalent to 241,860 YLD (Table 5.2). This proportion was higher in males (13% of YLD) compared with females (7.7% of YLD).
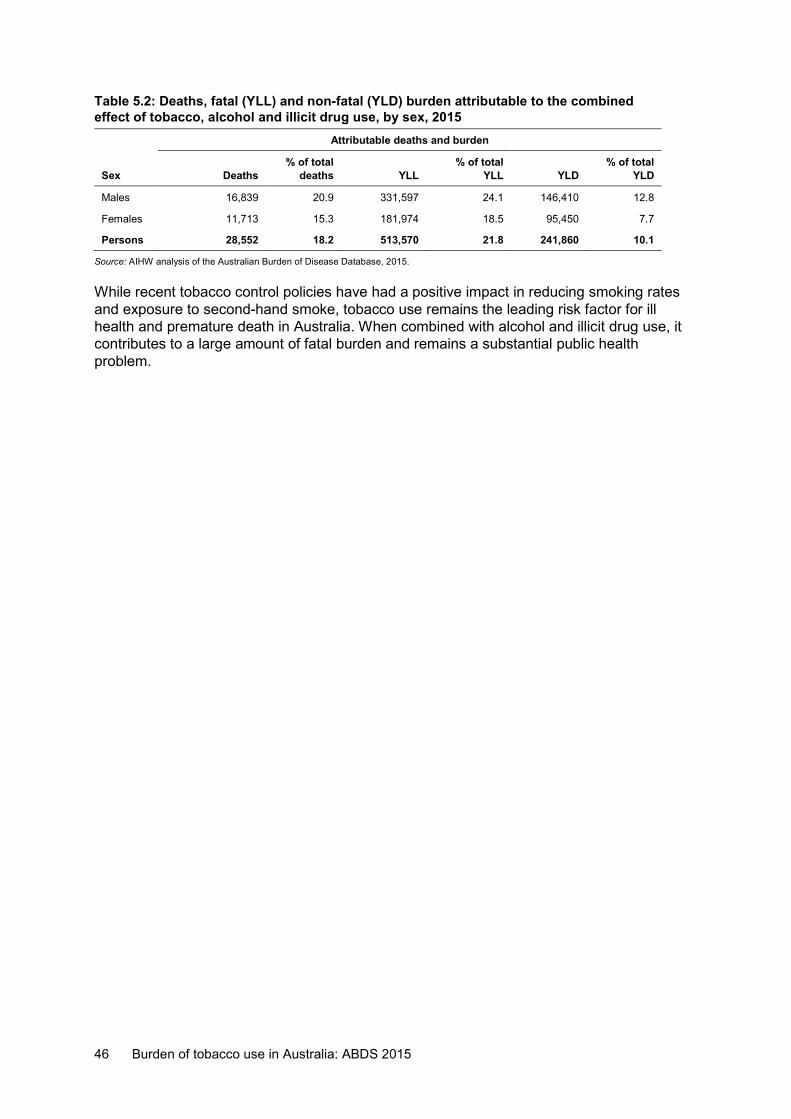
46 Burden of tobacco use in Australia: ABDS 2015
Table 5.2: Deaths, fatal (YLL) and non-fatal (YLD) burden attributable to the combined effect of tobacco, alcohol and illicit drug use, by sex, 2015
Attributable deaths and burden
Sex Deaths % of total
deaths YLL % of total
YLL YLD % of total
YLD
Males 16,839 20.9 331,597 24.1 146,410 12.8
Females 11,713 15.3 181,974 18.5 95,450 7.7
Persons 28,552 18.2 513,570 21.8 241,860 10.1
Source: AIHW analysis of the Australian Burden of Disease Database, 2015.
While recent tobacco control policies have had a positive impact in reducing smoking rates and exposure to second-hand smoke, tobacco use remains the leading risk factor for ill health and premature death in Australia. When combined with alcohol and illicit drug use, it contributes to a large amount of fatal burden and remains a substantial public health problem.
Burden of tobacco use in Australia: ABDS 2015 47
Appendix A: Detailed methods This Appendix describes in detail the methods used to estimate attributable burden due to tobacco use in this report.
How is attributable burden measured? Burden attributable to tobacco use was estimated using the comparative risk assessment methodology—a standard approach used globally in burden of disease risk factor analysis (Forouzanfar et al. 2016; Murray et al. 2003). For estimating the burden due to tobacco use, it involved:
• selecting risk-outcome pairs (linked diseases) and effect size (relative risks or hazard ratios)
• determining exposure to tobacco use in the population • defining the theoretical minimum risk exposure distribution (TMRED) • calculating the population attributable fraction (PAF) • quantifying the disease burden due to tobacco use.
Diseases with a strong causal association with tobacco use (termed ‘linked diseases’) were included in the study, following a review of the literature and review of the methods used by the GBD 2016. For each linked disease, the degree of additional risk (estimated by the effect size) was combined with categorical tobacco use prevalence data to determine the proportion (that is, the PAF) of disease burden due to tobacco use.
The estimated PAFs were applied to disease burden estimates from the ABDS 2015 to quantify the disease burden due to tobacco use in the population.
Selection of linked diseases In this study, as in the ABDS 2015, 41 diseases were linked to tobacco use (Table A1). The effect sizes for all linked diseases were sourced from the GBD 2016 study—except for the sensitivity analysis (see the ‘Effect sizes for tobacco use’ section later in this appendix for more detail).
Table A1: Diseases linked to different tobacco smoke exposures Tobacco exposure Linked diseases
Second-hand smoke Lung cancer, otitis media, lower respiratory infections, influenza, breast cancer, type 2 diabetes, stroke, coronary heart disease
Current smoking (5-year lagged)
Asthma, type 2 diabetes, gastroduodenal disorders, gallbladder and biliary diseases, dementia, multiple sclerosis, rheumatoid arthritis, back pain, cataract and other lens disorders, age-related macular degeneration, lower respiratory infections, coronary heart disease, stroke, hypertensive heart disease, atrial fibrillation and flutter, aortic aneurysm, peripheral vascular disease, other cardiovascular diseases
Past smoking (Smoking Impact Ratio)
Bladder cancer, COPD, cervical cancer, bowel cancer, oesophageal cancer, interstitial lung diseases, kidney cancer, liver cancer, lung cancer, mouth and pharyngeal cancer, other respiratory diseases, nasopharynx cancer, pancreatic cancer, stomach cancer, lip and oral cavity cancer, laryngeal cancer, breast cancer, prostate cancer, leukaemia (acute lymphoblastic leukaemia, acute myeloid leukaemia, chronic lymphocytic leukaemia, chronic myeloid leukaemia), other leukaemias
48 Burden of tobacco use in Australia: ABDS 2015
Diseases that were identified by the GBD as having a causal association with tobacco use are referred to as ‘linked diseases’. This analysis included only those with ‘convincing’ or ‘probable’ support of a causal association, based on a literature review, using criteria set by the World Cancer Research Fund (WCRF/AICR 2007).
Linked diseases were included in the analysis if there was an association with tobacco use based on high-quality epidemiological studies—preferably from a meta-analysis or prospective studies—with ‘convincing’ or ‘probable’ evidence, based on the World Cancer Research Fund criteria to judge the level of association.
Each potential linked disease was categorised based on the robustness and volume of studies showing a relationship. ‘Convincing’ evidence describes a causal relationship that is ‘robust enough to be highly unlikely to be modified in the foreseeable future as new evidence accumulates’ (WCRF/AICR 2007). ‘Probable’ evidence suggests that a causal relationship is often described and that this is unlikely to change with increased knowledge.
Theoretical minimum risk exposure distribution The estimated contribution of a risk factor to disease burden is calculated by comparing the observed risk factor distribution with an alternative, hypothetical distribution (the counterfactual scenario). This could be an rise or fall in levels of exposure, or changes in behaviour compared with what is currently observed in the population. In all ABDS studies, a TMRED scenario was adopted. This involved determining the hypothetical exposure distribution that would lead to the lowest conceivable disease burden.
The TMRED for tobacco use is ‘no tobacco use’. This includes no lifetime exposure to tobacco use or second-hand smoke.
Estimates of exposure to tobacco smoke in Australia
Exposure for 2015 estimates The NDSHS 2010 was used to estimate the proportion of the population who are current and former smokers. Data from 2010 enable the measurement of the effects of tobacco exposure after a 5-year lag. The NDSHS 2016 was used to estimate the proportion of non-smokers exposed to environmental tobacco in the home (second-hand smoke).
The PAFs for cardiovascular diseases, diabetes, asthma and respiratory infections were calculated from the proportion of individuals in the NDSHS 2010 who reported smoking daily, weekly or less than weekly. Using these data for current or former smokers allows for a 5-year lag between exposure and these disease outcomes.
Due to the much longer lag between smoking and the incidence of cancers and chronic respiratory conditions, the tobacco attributable burden for those disease outcomes cannot be estimated from data on the current or recent prevalence. For these conditions, the ‘smoking impact ratio’ (described by Peto et al. 1992) was used as an indirect method to estimate the accumulated risk from tobacco smoking. Lung cancer mortality in the 3 reference years (by age and sex) from the National Mortality Database was compared with lung cancer mortality rates among a cohort of smokers and never-smokers in the United States (Peto et al. 1992). The excess mortality seen in the Australian population, compared with the cohort of non-smokers, is used to determine the proportion of the population living with accumulated tobacco risk. The burden attributable to past smoking was estimated in people aged 40 and over because the small number of lung cancer deaths observed in those aged 30–39 resulted in unreliable PAFs.
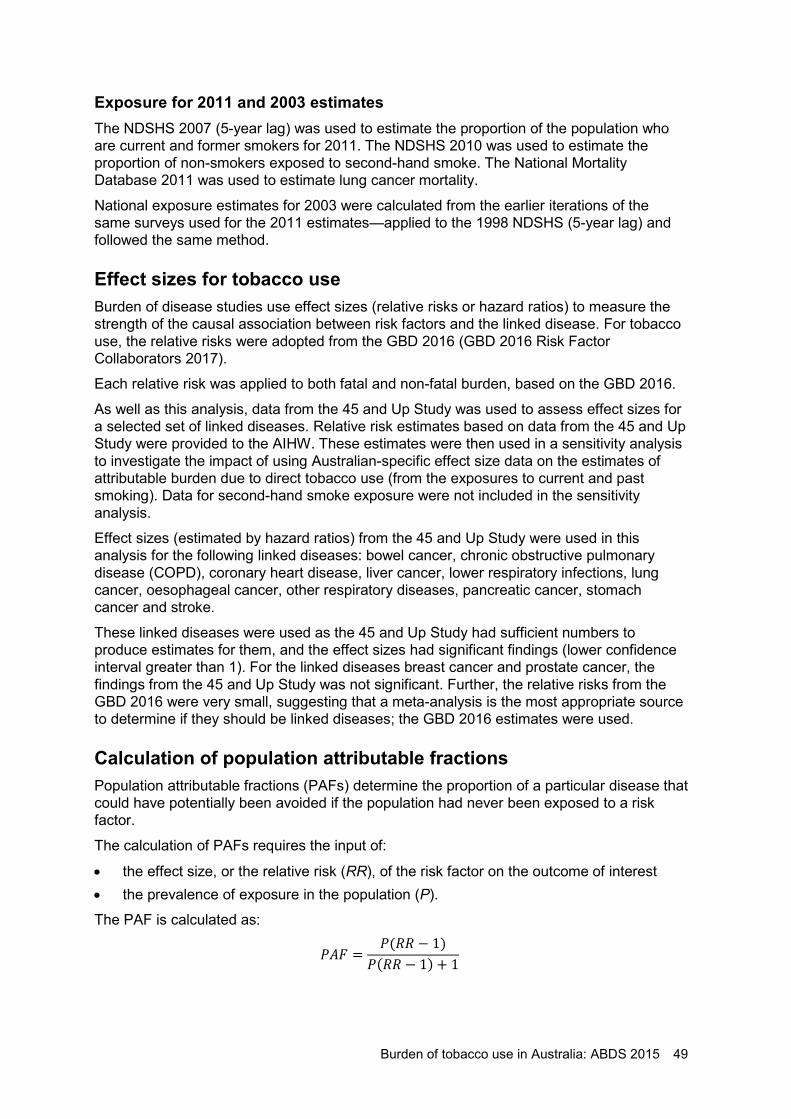
Burden of tobacco use in Australia: ABDS 2015 49
Exposure for 2011 and 2003 estimates The NDSHS 2007 (5-year lag) was used to estimate the proportion of the population who are current and former smokers for 2011. The NDSHS 2010 was used to estimate the proportion of non-smokers exposed to second-hand smoke. The National Mortality Database 2011 was used to estimate lung cancer mortality.
National exposure estimates for 2003 were calculated from the earlier iterations of the same surveys used for the 2011 estimates—applied to the 1998 NDSHS (5-year lag) and followed the same method.
Effect sizes for tobacco use Burden of disease studies use effect sizes (relative risks or hazard ratios) to measure the strength of the causal association between risk factors and the linked disease. For tobacco use, the relative risks were adopted from the GBD 2016 (GBD 2016 Risk Factor Collaborators 2017).
Each relative risk was applied to both fatal and non-fatal burden, based on the GBD 2016.
As well as this analysis, data from the 45 and Up Study was used to assess effect sizes for a selected set of linked diseases. Relative risk estimates based on data from the 45 and Up Study were provided to the AIHW. These estimates were then used in a sensitivity analysis to investigate the impact of using Australian-specific effect size data on the estimates of attributable burden due to direct tobacco use (from the exposures to current and past smoking). Data for second-hand smoke exposure were not included in the sensitivity analysis.
Effect sizes (estimated by hazard ratios) from the 45 and Up Study were used in this analysis for the following linked diseases: bowel cancer, chronic obstructive pulmonary disease (COPD), coronary heart disease, liver cancer, lower respiratory infections, lung cancer, oesophageal cancer, other respiratory diseases, pancreatic cancer, stomach cancer and stroke.
These linked diseases were used as the 45 and Up Study had sufficient numbers to produce estimates for them, and the effect sizes had significant findings (lower confidence interval greater than 1). For the linked diseases breast cancer and prostate cancer, the findings from the 45 and Up Study was not significant. Further, the relative risks from the GBD 2016 were very small, suggesting that a meta-analysis is the most appropriate source to determine if they should be linked diseases; the GBD 2016 estimates were used.
Calculation of population attributable fractions Population attributable fractions (PAFs) determine the proportion of a particular disease that could have potentially been avoided if the population had never been exposed to a risk factor.
The calculation of PAFs requires the input of:
• the effect size, or the relative risk (RR), of the risk factor on the outcome of interest • the prevalence of exposure in the population (P).
The PAF is calculated as:
𝑃𝑃𝑃𝑃𝑃𝑃 =𝑃𝑃(𝑅𝑅𝑅𝑅 − 1)
𝑃𝑃(𝑅𝑅𝑅𝑅 − 1) + 1
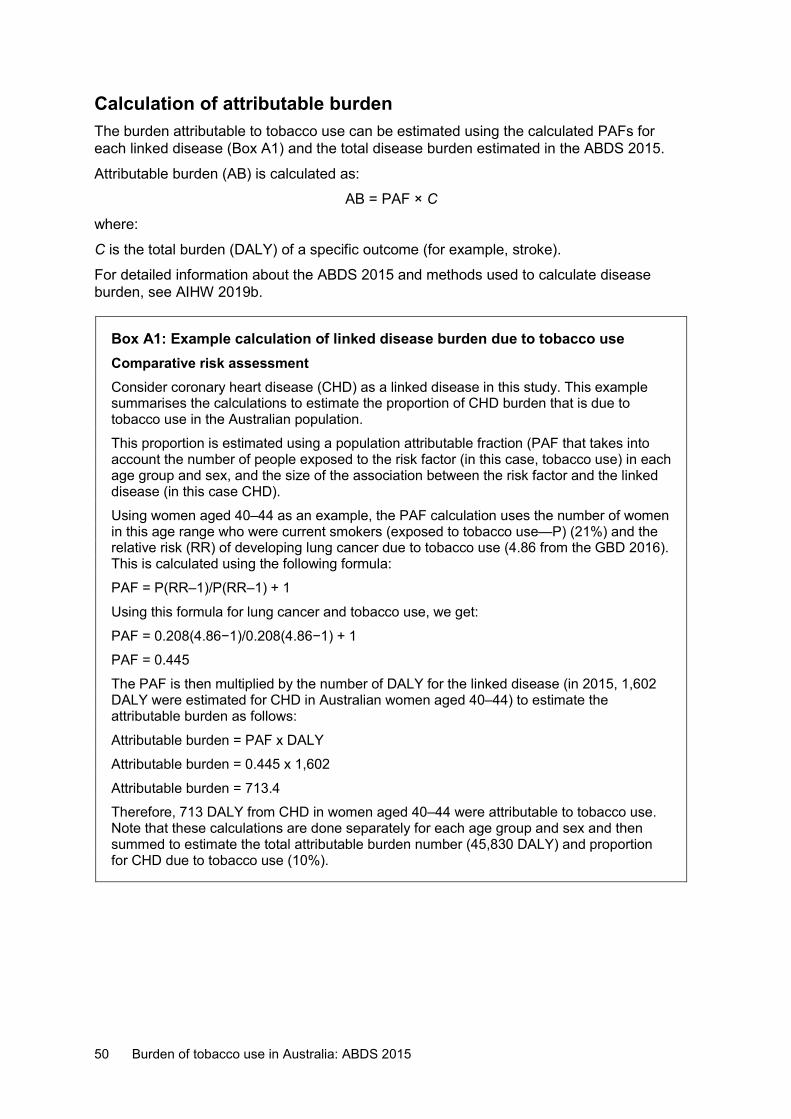
50 Burden of tobacco use in Australia: ABDS 2015
Calculation of attributable burden The burden attributable to tobacco use can be estimated using the calculated PAFs for each linked disease (Box A1) and the total disease burden estimated in the ABDS 2015.
Attributable burden (AB) is calculated as:
AB = PAF × C
where:
C is the total burden (DALY) of a specific outcome (for example, stroke).
For detailed information about the ABDS 2015 and methods used to calculate disease burden, see AIHW 2019b.
Box A1: Example calculation of linked disease burden due to tobacco use Comparative risk assessment Consider coronary heart disease (CHD) as a linked disease in this study. This example summarises the calculations to estimate the proportion of CHD burden that is due to tobacco use in the Australian population. This proportion is estimated using a population attributable fraction (PAF that takes into account the number of people exposed to the risk factor (in this case, tobacco use) in each age group and sex, and the size of the association between the risk factor and the linked disease (in this case CHD). Using women aged 40–44 as an example, the PAF calculation uses the number of women in this age range who were current smokers (exposed to tobacco use—P) (21%) and the relative risk (RR) of developing lung cancer due to tobacco use (4.86 from the GBD 2016). This is calculated using the following formula:
PAF = P(RR–1)/P(RR–1) + 1
Using this formula for lung cancer and tobacco use, we get:
PAF = 0.208(4.86−1)/0.208(4.86−1) + 1 PAF = 0.445 The PAF is then multiplied by the number of DALY for the linked disease (in 2015, 1,602 DALY were estimated for CHD in Australian women aged 40–44) to estimate the attributable burden as follows:
Attributable burden = PAF x DALY Attributable burden = 0.445 x 1,602
Attributable burden = 713.4 Therefore, 713 DALY from CHD in women aged 40–44 were attributable to tobacco use. Note that these calculations are done separately for each age group and sex and then summed to estimate the total attributable burden number (45,830 DALY) and proportion for CHD due to tobacco use (10%).
Burden of tobacco use in Australia: ABDS 2015 51
Estimates for key population groups Sub-national populations Sub-national estimates were produced by:
• state and territory for all 8 Australian jurisdictions • remoteness categories—based on the 2011 Australian Statistical Geographic
Standard, which is divided into 5 remoteness areas: Major cities, Inner regional, Outer regional, Remote and Very remote; in this report, data for Remote and Very remote were combined and are referred to as Remote and very remote areas
• socioeconomic groups—presented as groups from lowest (group 1), or most disadvantaged, to highest (group 5), or least disadvantaged, based on the relative socioeconomic characteristics of the area of residence as defined by the Socio-Economic Indexes for Areas.
Analysis by state and territory, remoteness area and socioeconomic group was based on:
• the risk exposure by these disaggregations from the same data source as the national data
• disease burden estimates by these disaggregations from the ABDS 2015 • the PAFs for tobacco use for these population groups.
People diagnosed with a mental health condition: a scenario analysis A scenario analysis was performed to compare the attributable burden due to tobacco use in people with and without a mental health condition. The methods used in this scenario analysis are outlined in Figure A1.
For this analysis, the methods for current tobacco use were used to calculate the proportion of relevant linked diseases attributable to direct tobacco use (excluding those linked to past smoking) in each population group. It was not possible to estimate the burden of past smoking, as this requires an estimate of lung cancer mortality in people with or without a mental health condition. It was also not possible to estimate the burden linked to second-hand smoke due to the small number of people exposed in Australia. The burden of current tobacco use in this scenario analysis was estimated in people aged 30 and over as most health impacts occur from this age onwards.
Current smoking exposure rates were obtained from the 2010 NDSHS (5-year lag) in people with and without a diagnosis of, or treatment for, a mental health condition in the previous 12 months. The mental health conditions included depression, anxiety disorder, schizophrenia, bipolar disorder, an eating disorder and other forms of psychosis (AIHW 2017). Effect sizes were based on relative risks from the GBD 2016 for current smokers and used to calculate PAFs for people with and without a mental health condition by age, sex and linked disease. Attributable burden for both population groups was calculated as described above (Box A1).
The burden of linked diseases (such as cardiovascular diseases and asthma) was kept at the same rate in people with and without a mental health condition. However, the number of DALY was reduced (weighted) to reflect the size of the population with and without a mental health condition.
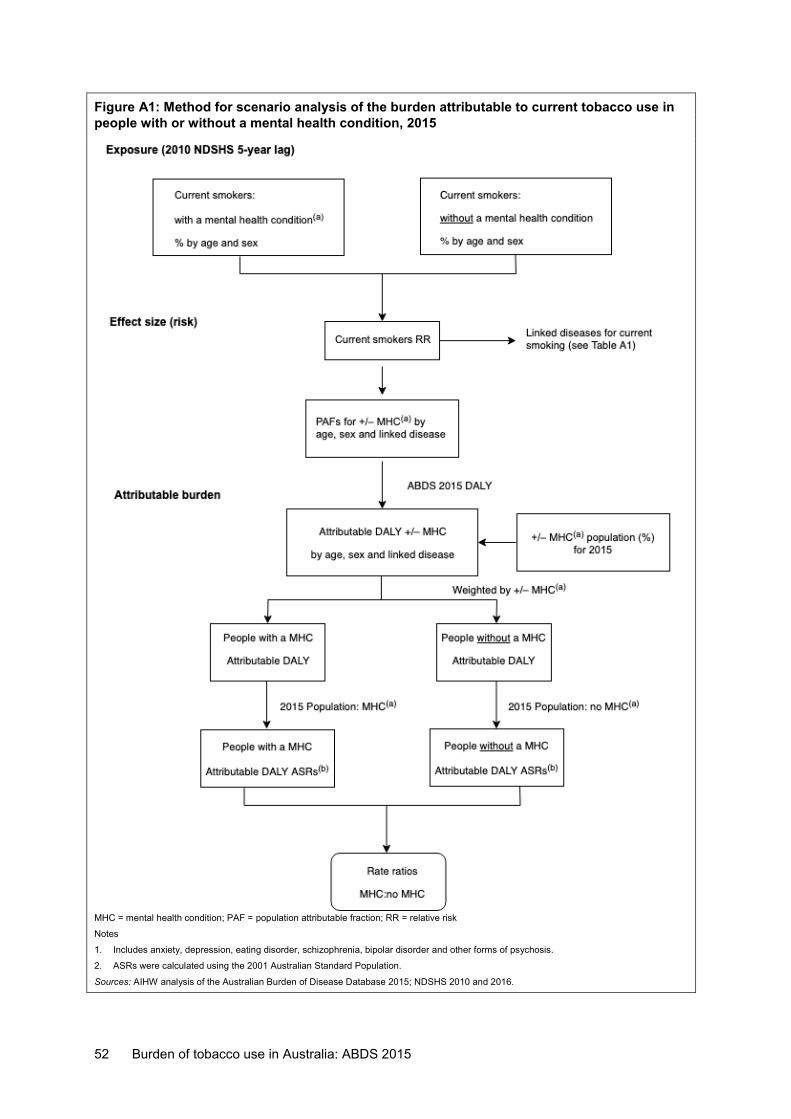
52 Burden of tobacco use in Australia: ABDS 2015
Figure A1: Method for scenario analysis of the burden attributable to current tobacco use in people with or without a mental health condition, 2015
MHC = mental health condition; PAF = population attributable fraction; RR = relative risk
Notes
1. Includes anxiety, depression, eating disorder, schizophrenia, bipolar disorder and other forms of psychosis.
2. ASRs were calculated using the 2001 Australian Standard Population.
Sources: AIHW analysis of the Australian Burden of Disease Database 2015; NDSHS 2010 and 2016.
Burden of tobacco use in Australia: ABDS 2015 53
Denominator population for calculating rates The 2016 NDSHS was used to determine the number of people with or without a mental health condition in 2015, which was then used as the denominator to calculate crude and age-standardised rates.
The prevalence rates of people with or without a mental health condition by age and sex from the 2016 NDSHS were applied to the 2015 Australian population used in the ABDS 2015 study. It was assumed that there was no mental health condition prevalence in the youngest age group. The prevalence of a mental health condition in boys aged 1–14 was modelled using a linear trend. In girls aged 1–14, the trend in boys was adjusted using male-to-female ratios calculated using mental health condition prevalence data from the ABDS 2011 study. The prevalence in people aged 90+ was modelled using an exponential growth curve and the data for people aged 65–89.
The 2016 NDSHS was considered to be the most appropriate available data source to use as the denominator for this scenario analysis as it was the closest to the ABDS reference year and used the same mental health condition definition as the 2010 NDHS data used in the numerator.
Drivers of change in attributable burden over time The Das Gupta method was used to decompose the changes in burden attributable to tobacco into 4 additive components (Das Gupta 1993). Using a series of scenarios, this method calculates the effect of each factor on the changes over time by assuming that all other factors, except the factor under consideration, remain the same at both time points. The benefit of this method compared with a step-wise method of decomposition is that the order of comparison does not matter. The method distributes the interaction effects (such as the relationship between an ageing population and disease burden) between the factors in proportion to the strength of the main effects (Zhai et al. 2017).
The change in attributable burden is decomposed into changes due to:
• population size—in Australia this is increasing over time • population ageing—in Australia the proportion of older people is increasing over time • linked disease burden—this varies with prevalence of the disease and the average age
at death, each of which is influenced by diagnosis, treatment and severity as well as by variation in exposure to other risk factors linked to these diseases
• risk factor exposure—in this case, changes in the prevalence of tobacco use and second-hand smoke in Australia.
Attributable burden is estimated as the product of these 4 factors using the formula:
𝐵𝐵𝑡𝑡 = ��𝑃𝑃𝑡𝑡
𝑚𝑚
𝑗𝑗=1
𝑛𝑛
𝑖𝑖=1
× 𝑆𝑆𝑖𝑖𝑗𝑗𝑡𝑡 × 𝑅𝑅𝑖𝑖𝑗𝑗𝑡𝑡 × 𝑃𝑃𝑖𝑖𝑗𝑗𝑡𝑡
where
Bt is the amount of burden (DALY) attributable to a particular risk factor at time point t
i is a type of exposure to the risk factor, such as current tobacco use
n is all types of exposure included in the estimate for the risk factor
j is an age and sex group
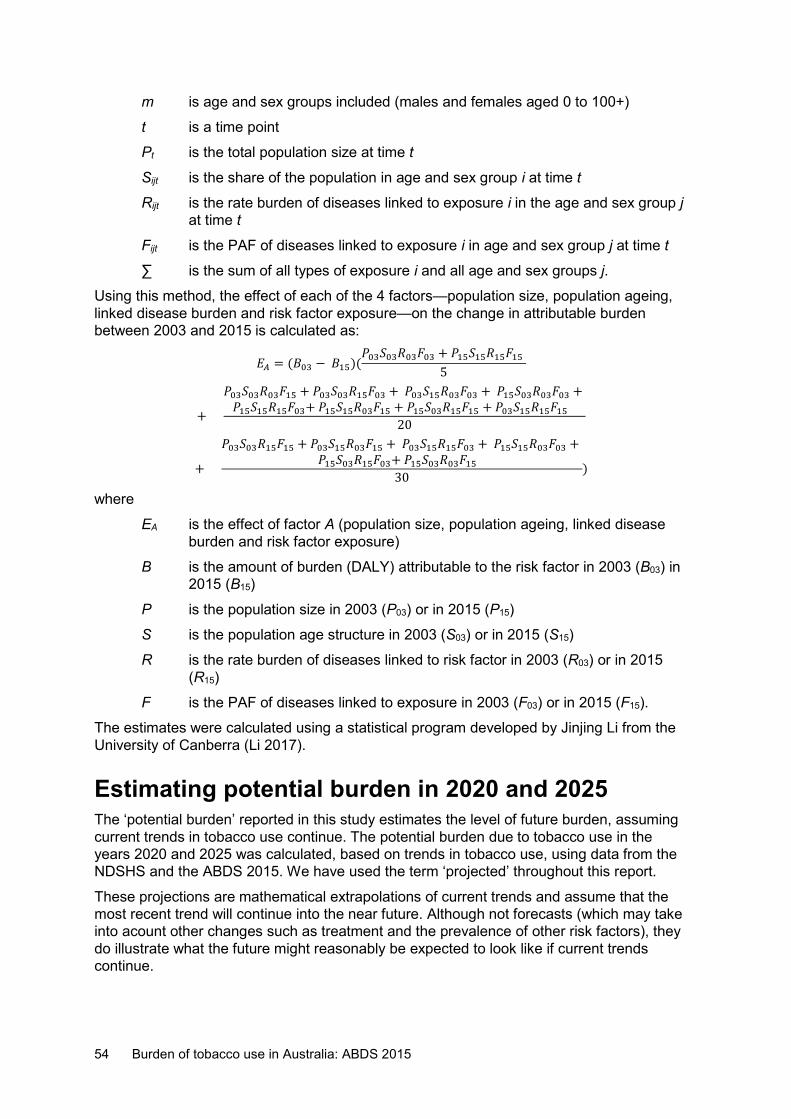
54 Burden of tobacco use in Australia: ABDS 2015
m is age and sex groups included (males and females aged 0 to 100+)
t is a time point
Pt is the total population size at time t
Sijt is the share of the population in age and sex group i at time t
Rijt is the rate burden of diseases linked to exposure i in the age and sex group j at time t
Fijt is the PAF of diseases linked to exposure i in age and sex group j at time t
∑ is the sum of all types of exposure i and all age and sex groups j.
Using this method, the effect of each of the 4 factors—population size, population ageing, linked disease burden and risk factor exposure—on the change in attributable burden between 2003 and 2015 is calculated as:
𝐸𝐸𝐴𝐴 = (𝐵𝐵03 − 𝐵𝐵15)(𝑃𝑃03𝑆𝑆03𝑅𝑅03𝑃𝑃03 + 𝑃𝑃15𝑆𝑆15𝑅𝑅15𝑃𝑃15
5
+
𝑃𝑃03𝑆𝑆03𝑅𝑅03𝑃𝑃15 + 𝑃𝑃03𝑆𝑆03𝑅𝑅15𝑃𝑃03 + 𝑃𝑃03𝑆𝑆15𝑅𝑅03𝑃𝑃03 + 𝑃𝑃15𝑆𝑆03𝑅𝑅03𝑃𝑃03 + 𝑃𝑃15𝑆𝑆15𝑅𝑅15𝑃𝑃03+ 𝑃𝑃15𝑆𝑆15𝑅𝑅03𝑃𝑃15 + 𝑃𝑃15𝑆𝑆03𝑅𝑅15𝑃𝑃15 + 𝑃𝑃03𝑆𝑆15𝑅𝑅15𝑃𝑃15
20
+
𝑃𝑃03𝑆𝑆03𝑅𝑅15𝑃𝑃15 + 𝑃𝑃03𝑆𝑆15𝑅𝑅03𝑃𝑃15 + 𝑃𝑃03𝑆𝑆15𝑅𝑅15𝑃𝑃03 + 𝑃𝑃15𝑆𝑆15𝑅𝑅03𝑃𝑃03 + 𝑃𝑃15𝑆𝑆03𝑅𝑅15𝑃𝑃03+ 𝑃𝑃15𝑆𝑆03𝑅𝑅03𝑃𝑃15
30)
where
EA is the effect of factor A (population size, population ageing, linked disease burden and risk factor exposure)
B is the amount of burden (DALY) attributable to the risk factor in 2003 (B03) in 2015 (B15)
P is the population size in 2003 (P03) or in 2015 (P15)
S is the population age structure in 2003 (S03) or in 2015 (S15)
R is the rate burden of diseases linked to risk factor in 2003 (R03) or in 2015 (R15)
F is the PAF of diseases linked to exposure in 2003 (F03) or in 2015 (F15).
The estimates were calculated using a statistical program developed by Jinjing Li from the University of Canberra (Li 2017).
Estimating potential burden in 2020 and 2025 The ‘potential burden’ reported in this study estimates the level of future burden, assuming current trends in tobacco use continue. The potential burden due to tobacco use in the years 2020 and 2025 was calculated, based on trends in tobacco use, using data from the NDSHS and the ABDS 2015. We have used the term ‘projected’ throughout this report.
These projections are mathematical extrapolations of current trends and assume that the most recent trend will continue into the near future. Although not forecasts (which may take into acount other changes such as treatment and the prevalence of other risk factors), they do illustrate what the future might reasonably be expected to look like if current trends continue.
Burden of tobacco use in Australia: ABDS 2015 55
For current tobacco use, estimates in 2020 of the prevalence of tobacco use from the NDSHS in 2016 (5-year lag) were used. For estimates in 2025 the prevalence of tobacco use was projected using the log-linear trends of actual prevalence in Australia, using successive NDSHS between 2004–2016.
For second-hand smoke, estimates in 2020 and 2025, log-linear trends in prevalence of second-hand smoke exposure from NDSHSs between 2004 and 2016 were used.
For past tobacco use, log-linear trends in national lung cancer mortality rates from the National Mortality Database were used to estimate mortality rates by age and sex in 2020 and 2025.
Estimating the combined effect of tobacco, alcohol and illicit drug use In the ABDS 2015, tobacco use, alcohol and illicit drug use were assessed as independent risk factors. This means that the attributable burden estimates for various risk factors in the ABDS 2015 cannot be added together. This is due to the complex relationships and interactions between risk factors.
To overcome this issue, the combined effect (known as the ‘joint effect’ in other reports) of selected risk factors can be estimated. In this study, the PAF for each linked disease was estimated using the combined effect of tobacco, alcohol and illicit drug use.
The PAF for the combined effect is calculated as:
PAF = 1 −�(1 – 𝑃𝑃𝑃𝑃𝑃𝑃r)
where:
• PAF is the population attributable fraction of burden attributable to a disease from the risk factors combined
• PAFr is the population attributable fraction for risk factor ‘r’ and linked disease • the product Π applies to all risk factors within the cluster.
This formula has been used in several other burden of disease studies as it caps the estimated combined attributable burden to 1 for each linked disease, therefore avoiding the possibility of the proportion’s exceeding the total disease burden.
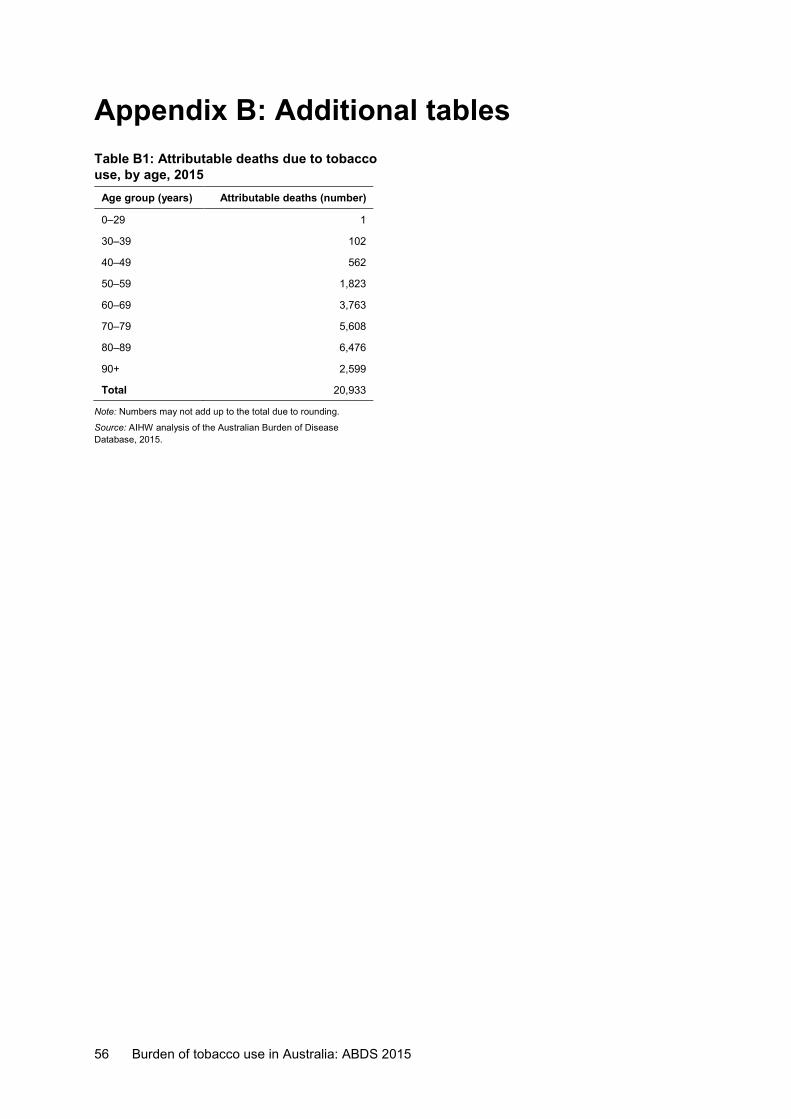
56 Burden of tobacco use in Australia: ABDS 2015
Appendix B: Additional tables Table B1: Attributable deaths due to tobacco use, by age, 2015
Age group (years) Attributable deaths (number)
0–29 1
30–39 102
40–49 562
50–59 1,823
60–69 3,763
70–79 5,608
80–89 6,476
90+ 2,599
Total 20,933
Note: Numbers may not add up to the total due to rounding.
Source: AIHW analysis of the Australian Burden of Disease Database, 2015.
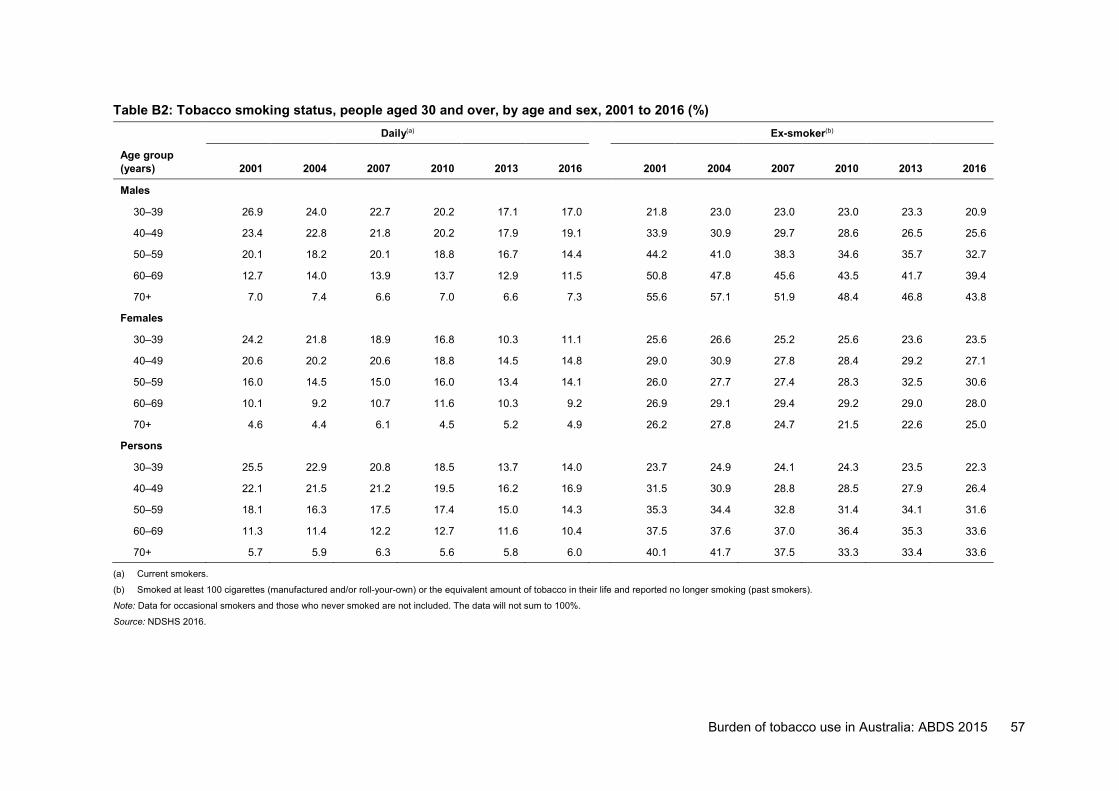
Burden of tobacco use in Australia: ABDS 2015 57
Table B2: Tobacco smoking status, people aged 30 and over, by age and sex, 2001 to 2016 (%) Daily(a) Ex-smoker(b)
Age group (years) 2001 2004 2007 2010 2013 2016 2001 2004 2007 2010 2013 2016
Males
30–39 26.9 24.0 22.7 20.2 17.1 17.0 21.8 23.0 23.0 23.0 23.3 20.9
40–49 23.4 22.8 21.8 20.2 17.9 19.1 33.9 30.9 29.7 28.6 26.5 25.6
50–59 20.1 18.2 20.1 18.8 16.7 14.4 44.2 41.0 38.3 34.6 35.7 32.7
60–69 12.7 14.0 13.9 13.7 12.9 11.5 50.8 47.8 45.6 43.5 41.7 39.4
70+ 7.0 7.4 6.6 7.0 6.6 7.3 55.6 57.1 51.9 48.4 46.8 43.8
Females
30–39 24.2 21.8 18.9 16.8 10.3 11.1 25.6 26.6 25.2 25.6 23.6 23.5
40–49 20.6 20.2 20.6 18.8 14.5 14.8 29.0 30.9 27.8 28.4 29.2 27.1
50–59 16.0 14.5 15.0 16.0 13.4 14.1 26.0 27.7 27.4 28.3 32.5 30.6
60–69 10.1 9.2 10.7 11.6 10.3 9.2 26.9 29.1 29.4 29.2 29.0 28.0
70+ 4.6 4.4 6.1 4.5 5.2 4.9 26.2 27.8 24.7 21.5 22.6 25.0
Persons
30–39 25.5 22.9 20.8 18.5 13.7 14.0 23.7 24.9 24.1 24.3 23.5 22.3
40–49 22.1 21.5 21.2 19.5 16.2 16.9 31.5 30.9 28.8 28.5 27.9 26.4
50–59 18.1 16.3 17.5 17.4 15.0 14.3 35.3 34.4 32.8 31.4 34.1 31.6
60–69 11.3 11.4 12.2 12.7 11.6 10.4 37.5 37.6 37.0 36.4 35.3 33.6
70+ 5.7 5.9 6.3 5.6 5.8 6.0 40.1 41.7 37.5 33.3 33.4 33.6
(a) Current smokers.
(b) Smoked at least 100 cigarettes (manufactured and/or roll-your-own) or the equivalent amount of tobacco in their life and reported no longer smoking (past smokers).
Note: Data for occasional smokers and those who never smoked are not included. The data will not sum to 100%.
Source: NDSHS 2016.
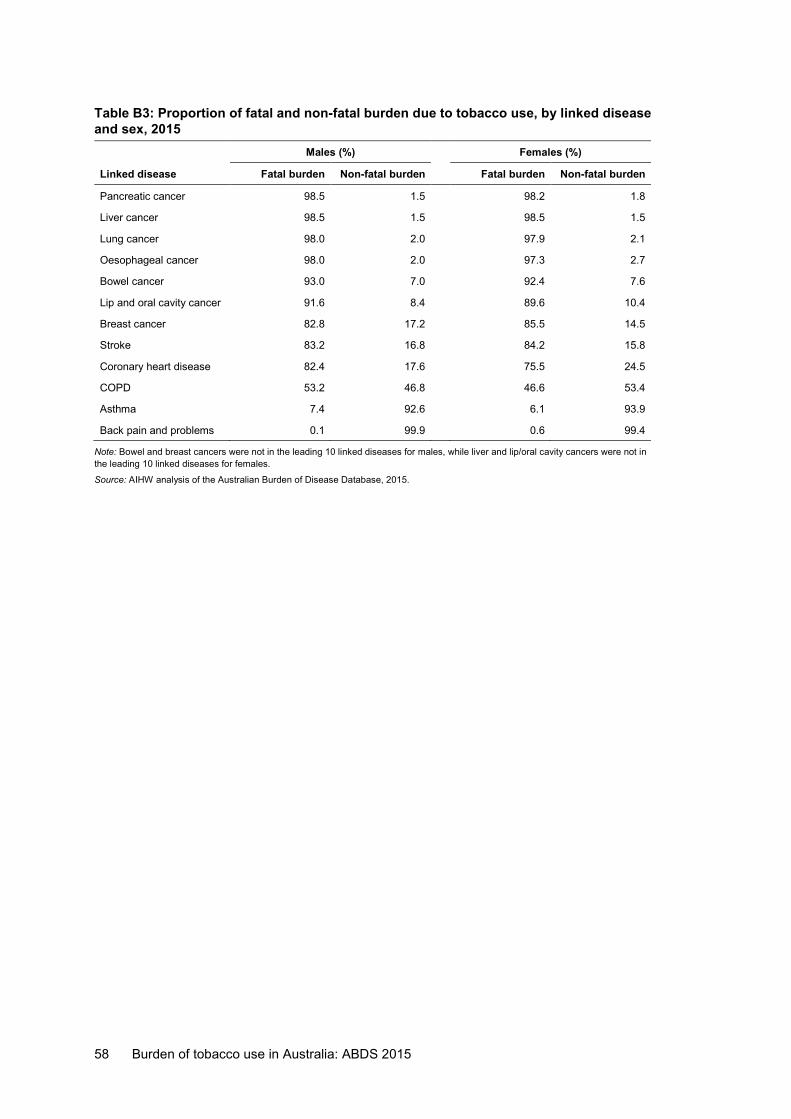
58 Burden of tobacco use in Australia: ABDS 2015
Table B3: Proportion of fatal and non-fatal burden due to tobacco use, by linked disease and sex, 2015 Males (%) Females (%)
Linked disease Fatal burden Non-fatal burden Fatal burden Non-fatal burden
Pancreatic cancer 98.5 1.5 98.2 1.8
Liver cancer 98.5 1.5 98.5 1.5
Lung cancer 98.0 2.0 97.9 2.1
Oesophageal cancer 98.0 2.0 97.3 2.7
Bowel cancer 93.0 7.0 92.4 7.6
Lip and oral cavity cancer 91.6 8.4 89.6 10.4
Breast cancer 82.8 17.2 85.5 14.5
Stroke 83.2 16.8 84.2 15.8
Coronary heart disease 82.4 17.6 75.5 24.5
COPD 53.2 46.8 46.6 53.4
Asthma 7.4 92.6 6.1 93.9
Back pain and problems 0.1 99.9 0.6 99.4
Note: Bowel and breast cancers were not in the leading 10 linked diseases for males, while liver and lip/oral cavity cancers were not in the leading 10 linked diseases for females.
Source: AIHW analysis of the Australian Burden of Disease Database, 2015.
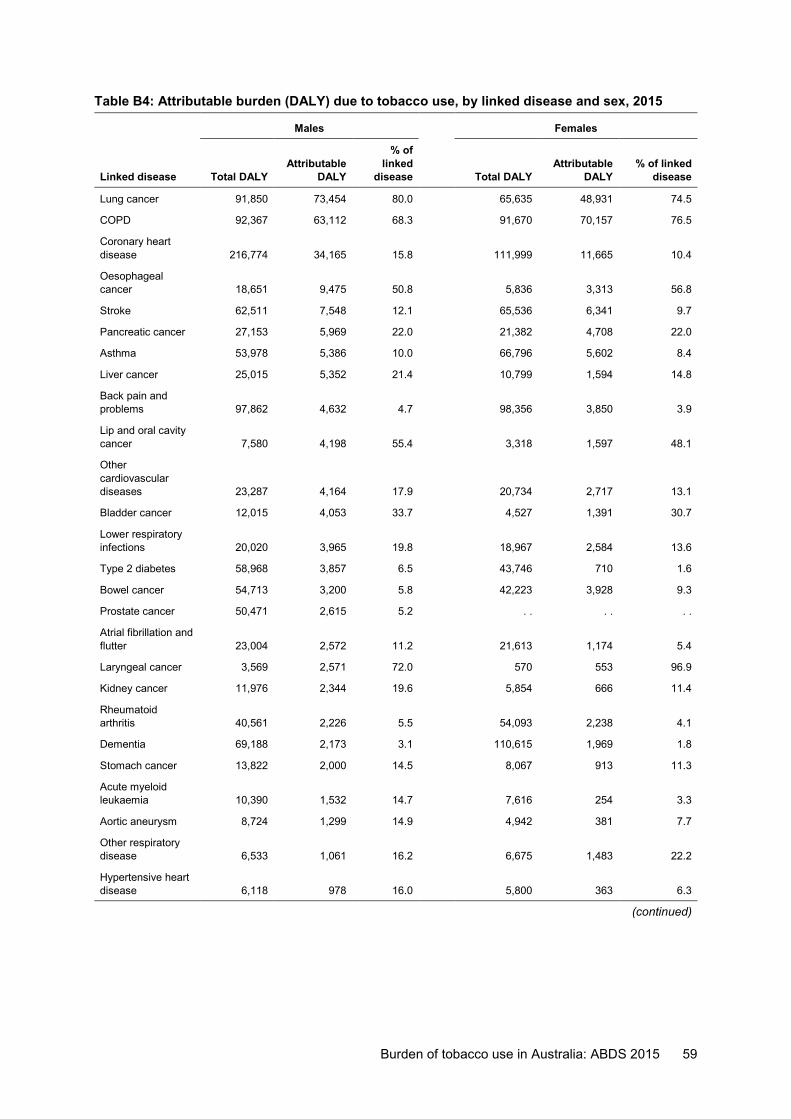
Burden of tobacco use in Australia: ABDS 2015 59
Table B4: Attributable burden (DALY) due to tobacco use, by linked disease and sex, 2015
Males Females
Linked disease Total DALY Attributable
DALY
% of linked
disease Total DALY Attributable
DALY % of linked
disease
Lung cancer 91,850 73,454 80.0 65,635 48,931 74.5
COPD 92,367 63,112 68.3 91,670 70,157 76.5
Coronary heart disease 216,774 34,165 15.8 111,999 11,665 10.4
Oesophageal cancer 18,651 9,475 50.8 5,836 3,313 56.8
Stroke 62,511 7,548 12.1 65,536 6,341 9.7
Pancreatic cancer 27,153 5,969 22.0 21,382 4,708 22.0
Asthma 53,978 5,386 10.0 66,796 5,602 8.4
Liver cancer 25,015 5,352 21.4 10,799 1,594 14.8
Back pain and problems 97,862 4,632 4.7 98,356 3,850 3.9
Lip and oral cavity cancer 7,580 4,198 55.4 3,318 1,597 48.1
Other cardiovascular diseases 23,287 4,164 17.9 20,734 2,717 13.1
Bladder cancer 12,015 4,053 33.7 4,527 1,391 30.7
Lower respiratory infections 20,020 3,965 19.8 18,967 2,584 13.6
Type 2 diabetes 58,968 3,857 6.5 43,746 710 1.6
Bowel cancer 54,713 3,200 5.8 42,223 3,928 9.3
Prostate cancer 50,471 2,615 5.2 . . . . . .
Atrial fibrillation and flutter 23,004 2,572 11.2 21,613 1,174 5.4
Laryngeal cancer 3,569 2,571 72.0 570 553 96.9
Kidney cancer 11,976 2,344 19.6 5,854 666 11.4
Rheumatoid arthritis 40,561 2,226 5.5 54,093 2,238 4.1
Dementia 69,188 2,173 3.1 110,615 1,969 1.8
Stomach cancer 13,822 2,000 14.5 8,067 913 11.3
Acute myeloid leukaemia 10,390 1,532 14.7 7,616 254 3.3
Aortic aneurysm 8,724 1,299 14.9 4,942 381 7.7
Other respiratory disease 6,533 1,061 16.2 6,675 1,483 22.2
Hypertensive heart disease 6,118 978 16.0 5,800 363 6.3
(continued)
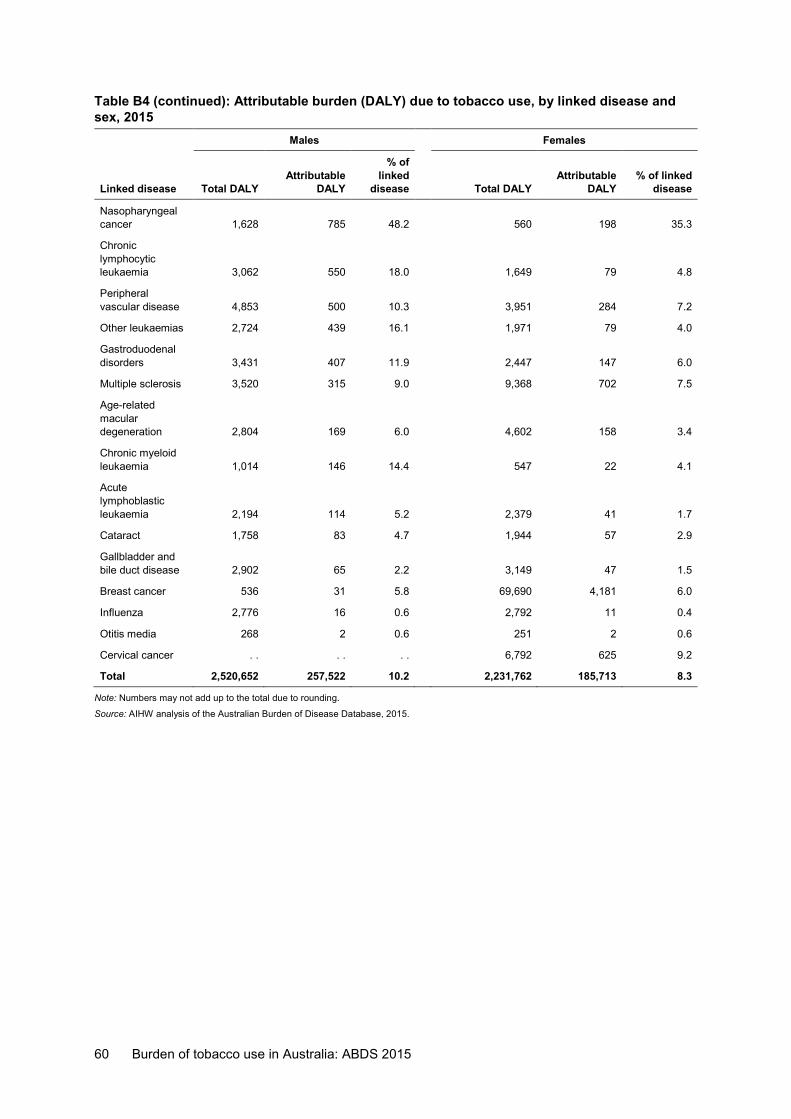
60 Burden of tobacco use in Australia: ABDS 2015
Table B4 (continued): Attributable burden (DALY) due to tobacco use, by linked disease and sex, 2015 Males Females
Linked disease Total DALY Attributable
DALY
% of linked
disease Total DALY Attributable
DALY % of linked
disease
Nasopharyngeal cancer 1,628 785 48.2 560 198 35.3
Chronic lymphocytic leukaemia 3,062 550 18.0 1,649 79 4.8
Peripheral vascular disease 4,853 500 10.3 3,951 284 7.2
Other leukaemias 2,724 439 16.1 1,971 79 4.0
Gastroduodenal disorders 3,431 407 11.9 2,447 147 6.0
Multiple sclerosis 3,520 315 9.0 9,368 702 7.5
Age-related macular degeneration 2,804 169 6.0 4,602 158 3.4
Chronic myeloid leukaemia 1,014 146 14.4 547 22 4.1
Acute lymphoblastic leukaemia 2,194 114 5.2 2,379 41 1.7
Cataract 1,758 83 4.7 1,944 57 2.9
Gallbladder and bile duct disease 2,902 65 2.2 3,149 47 1.5
Breast cancer 536 31 5.8 69,690 4,181 6.0
Influenza 2,776 16 0.6 2,792 11 0.4
Otitis media 268 2 0.6 251 2 0.6
Cervical cancer . . . . . . 6,792 625 9.2
Total 2,520,652 257,522 10.2 2,231,762 185,713 8.3
Note: Numbers may not add up to the total due to rounding.
Source: AIHW analysis of the Australian Burden of Disease Database, 2015.
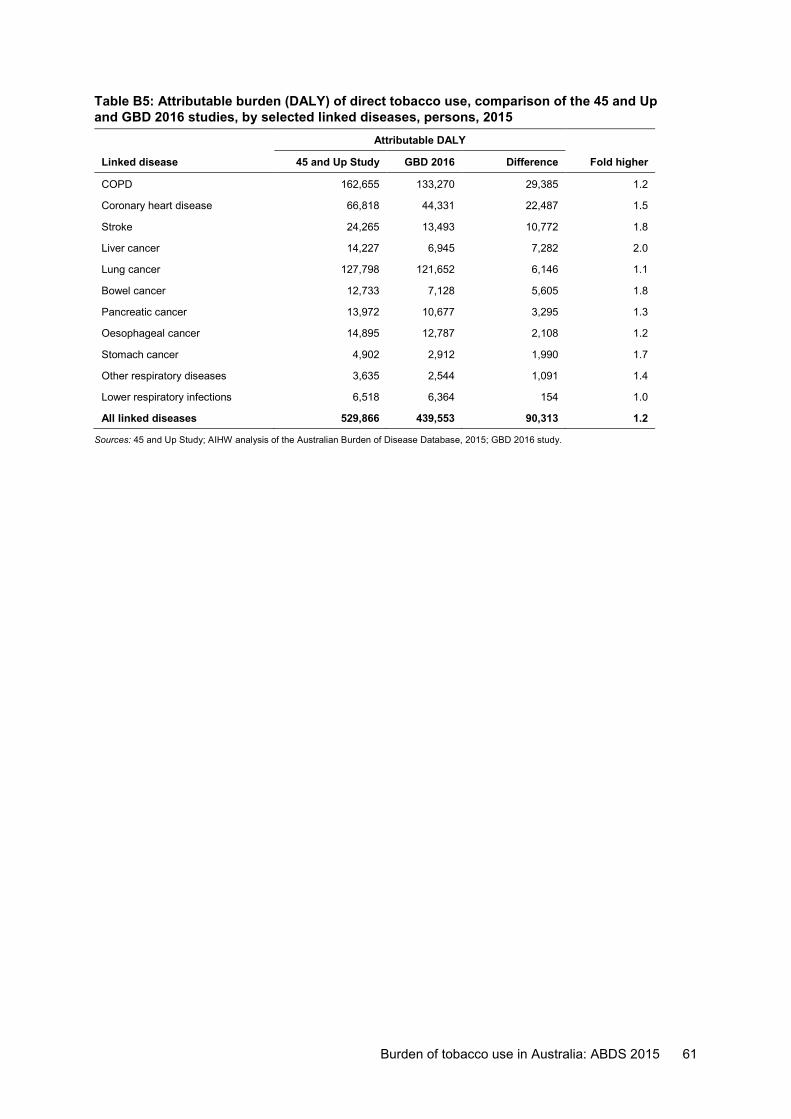
Burden of tobacco use in Australia: ABDS 2015 61
Table B5: Attributable burden (DALY) of direct tobacco use, comparison of the 45 and Up and GBD 2016 studies, by selected linked diseases, persons, 2015
Attributable DALY Linked disease 45 and Up Study GBD 2016 Difference Fold higher
COPD 162,655 133,270 29,385 1.2
Coronary heart disease 66,818 44,331 22,487 1.5
Stroke 24,265 13,493 10,772 1.8
Liver cancer 14,227 6,945 7,282 2.0
Lung cancer 127,798 121,652 6,146 1.1
Bowel cancer 12,733 7,128 5,605 1.8
Pancreatic cancer 13,972 10,677 3,295 1.3
Oesophageal cancer 14,895 12,787 2,108 1.2
Stomach cancer 4,902 2,912 1,990 1.7
Other respiratory diseases 3,635 2,544 1,091 1.4
Lower respiratory infections 6,518 6,364 154 1.0
All linked diseases 529,866 439,553 90,313 1.2
Sources: 45 and Up Study; AIHW analysis of the Australian Burden of Disease Database, 2015; GBD 2016 study.
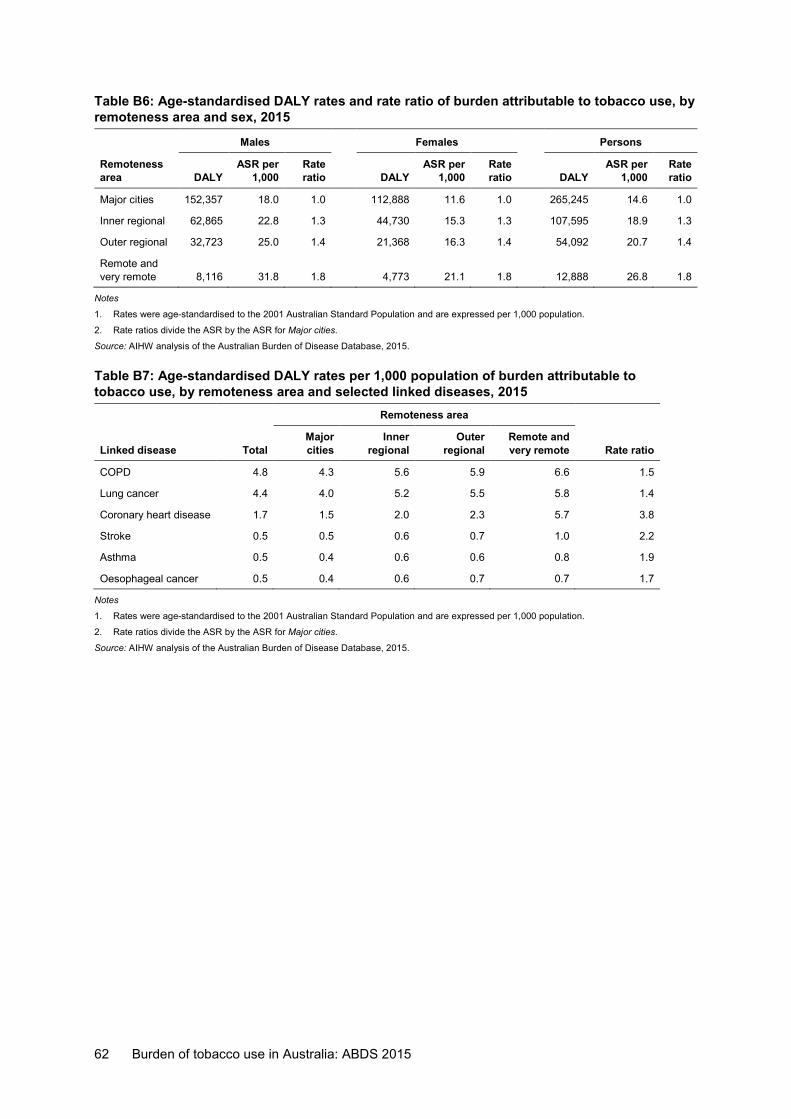
62 Burden of tobacco use in Australia: ABDS 2015
Table B6: Age-standardised DALY rates and rate ratio of burden attributable to tobacco use, by remoteness area and sex, 2015
Males Females Persons
Remoteness area DALY
ASR per 1,000
Rate ratio DALY
ASR per 1,000
Rate ratio DALY
ASR per 1,000
Rate ratio
Major cities 152,357 18.0 1.0 112,888 11.6 1.0 265,245 14.6 1.0
Inner regional 62,865 22.8 1.3 44,730 15.3 1.3 107,595 18.9 1.3
Outer regional 32,723 25.0 1.4 21,368 16.3 1.4 54,092 20.7 1.4
Remote and very remote 8,116 31.8 1.8 4,773 21.1 1.8 12,888 26.8 1.8
Notes
1. Rates were age-standardised to the 2001 Australian Standard Population and are expressed per 1,000 population.
2. Rate ratios divide the ASR by the ASR for Major cities.
Source: AIHW analysis of the Australian Burden of Disease Database, 2015.
Table B7: Age-standardised DALY rates per 1,000 population of burden attributable to tobacco use, by remoteness area and selected linked diseases, 2015 Remoteness area
Linked disease Total Major cities
Inner regional
Outer regional
Remote and very remote Rate ratio
COPD 4.8 4.3 5.6 5.9 6.6 1.5
Lung cancer 4.4 4.0 5.2 5.5 5.8 1.4
Coronary heart disease 1.7 1.5 2.0 2.3 5.7 3.8
Stroke 0.5 0.5 0.6 0.7 1.0 2.2
Asthma 0.5 0.4 0.6 0.6 0.8 1.9
Oesophageal cancer 0.5 0.4 0.6 0.7 0.7 1.7
Notes
1. Rates were age-standardised to the 2001 Australian Standard Population and are expressed per 1,000 population.
2. Rate ratios divide the ASR by the ASR for Major cities.
Source: AIHW analysis of the Australian Burden of Disease Database, 2015.
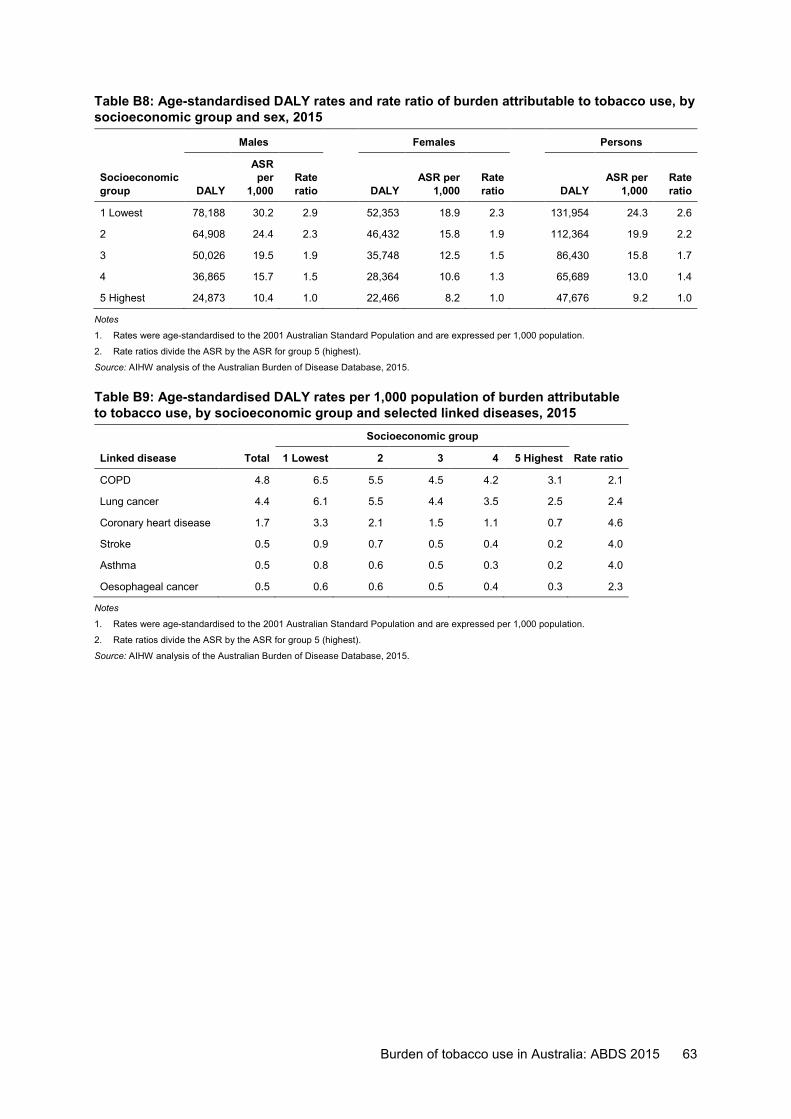
Burden of tobacco use in Australia: ABDS 2015 63
Table B8: Age-standardised DALY rates and rate ratio of burden attributable to tobacco use, by socioeconomic group and sex, 2015
Males Females Persons
Socioeconomic group DALY
ASR per
1,000 Rate ratio DALY
ASR per 1,000
Rate ratio DALY
ASR per 1,000
Rate ratio
1 Lowest 78,188 30.2 2.9 52,353 18.9 2.3 131,954 24.3 2.6
2 64,908 24.4 2.3 46,432 15.8 1.9 112,364 19.9 2.2
3 50,026 19.5 1.9 35,748 12.5 1.5 86,430 15.8 1.7
4 36,865 15.7 1.5 28,364 10.6 1.3 65,689 13.0 1.4
5 Highest 24,873 10.4 1.0 22,466 8.2 1.0 47,676 9.2 1.0
Notes
1. Rates were age-standardised to the 2001 Australian Standard Population and are expressed per 1,000 population.
2. Rate ratios divide the ASR by the ASR for group 5 (highest).
Source: AIHW analysis of the Australian Burden of Disease Database, 2015.
Table B9: Age-standardised DALY rates per 1,000 population of burden attributable to tobacco use, by socioeconomic group and selected linked diseases, 2015 Socioeconomic group
Linked disease Total 1 Lowest 2 3 4 5 Highest Rate ratio
COPD 4.8 6.5 5.5 4.5 4.2 3.1 2.1
Lung cancer 4.4 6.1 5.5 4.4 3.5 2.5 2.4
Coronary heart disease 1.7 3.3 2.1 1.5 1.1 0.7 4.6
Stroke 0.5 0.9 0.7 0.5 0.4 0.2 4.0
Asthma 0.5 0.8 0.6 0.5 0.3 0.2 4.0
Oesophageal cancer 0.5 0.6 0.6 0.5 0.4 0.3 2.3
Notes
1. Rates were age-standardised to the 2001 Australian Standard Population and are expressed per 1,000 population.
2. Rate ratios divide the ASR by the ASR for group 5 (highest).
Source: AIHW analysis of the Australian Burden of Disease Database, 2015.
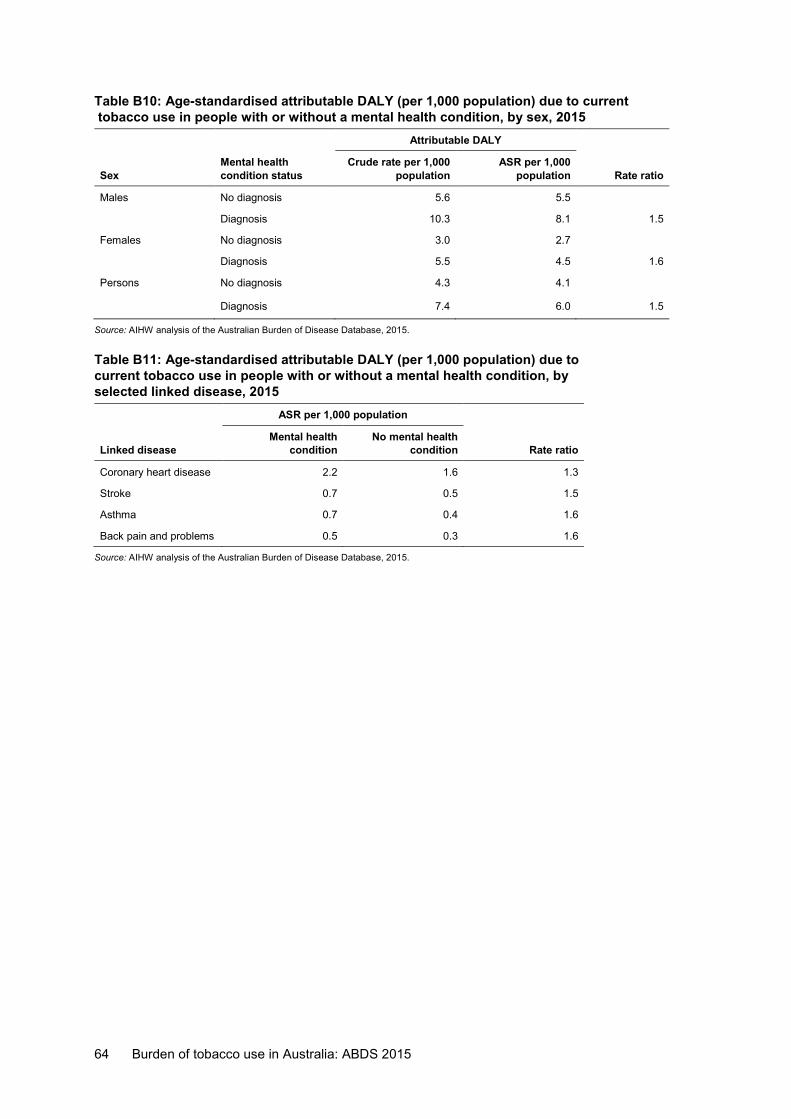
64 Burden of tobacco use in Australia: ABDS 2015
Table B10: Age-standardised attributable DALY (per 1,000 population) due to current tobacco use in people with or without a mental health condition, by sex, 2015 Attributable DALY
Sex Mental health condition status
Crude rate per 1,000 population
ASR per 1,000 population Rate ratio
Males No diagnosis 5.6 5.5
Diagnosis 10.3 8.1 1.5
Females No diagnosis 3.0 2.7
Diagnosis 5.5 4.5 1.6
Persons No diagnosis 4.3 4.1
Diagnosis 7.4 6.0 1.5
Source: AIHW analysis of the Australian Burden of Disease Database, 2015.
Table B11: Age-standardised attributable DALY (per 1,000 population) due to current tobacco use in people with or without a mental health condition, by selected linked disease, 2015 ASR per 1,000 population
Linked disease Mental health
condition No mental health
condition Rate ratio
Coronary heart disease 2.2 1.6 1.3
Stroke 0.7 0.5 1.5
Asthma 0.7 0.4 1.6
Back pain and problems 0.5 0.3 1.6
Source: AIHW analysis of the Australian Burden of Disease Database, 2015.
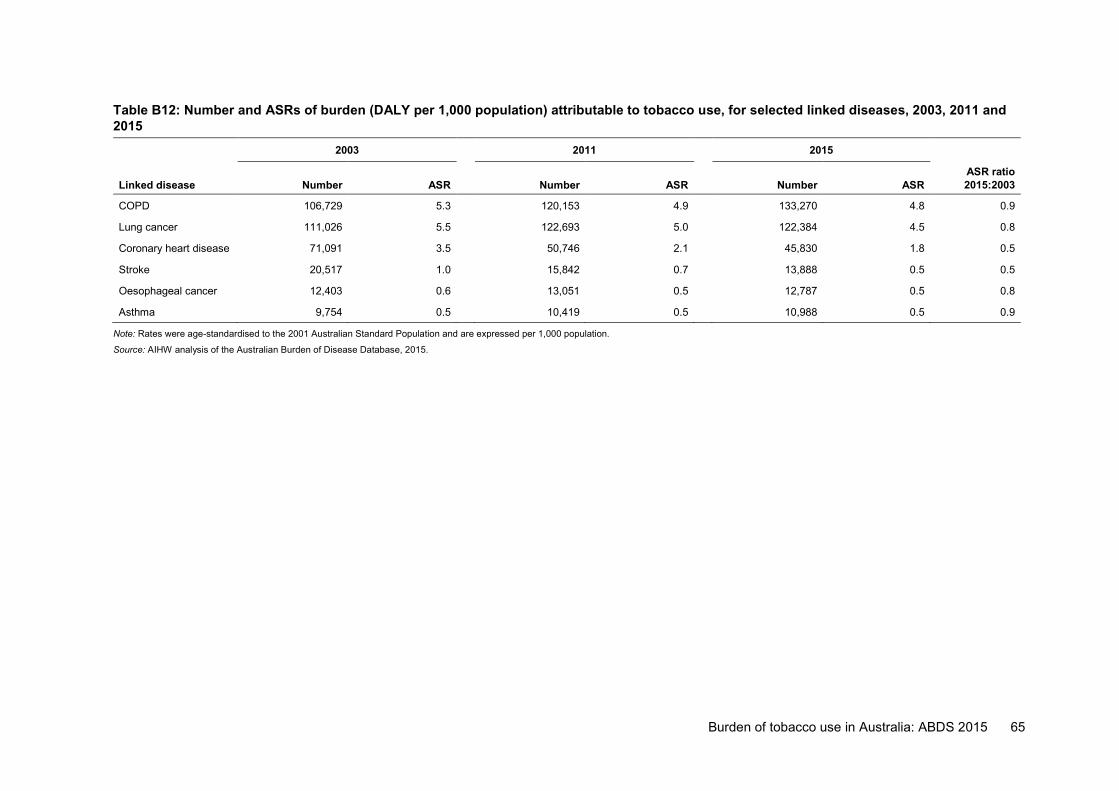
Burden of tobacco use in Australia: ABDS 2015 65
Table B12: Number and ASRs of burden (DALY per 1,000 population) attributable to tobacco use, for selected linked diseases, 2003, 2011 and 2015
2003 2011 2015
Linked disease Number ASR Number ASR Number ASR ASR ratio 2015:2003
COPD 106,729 5.3 120,153 4.9 133,270 4.8 0.9
Lung cancer 111,026 5.5 122,693 5.0 122,384 4.5 0.8
Coronary heart disease 71,091 3.5 50,746 2.1 45,830 1.8 0.5
Stroke 20,517 1.0 15,842 0.7 13,888 0.5 0.5
Oesophageal cancer 12,403 0.6 13,051 0.5 12,787 0.5 0.8
Asthma 9,754 0.5 10,419 0.5 10,988 0.5 0.9
Note: Rates were age-standardised to the 2001 Australian Standard Population and are expressed per 1,000 population.
Source: AIHW analysis of the Australian Burden of Disease Database, 2015.
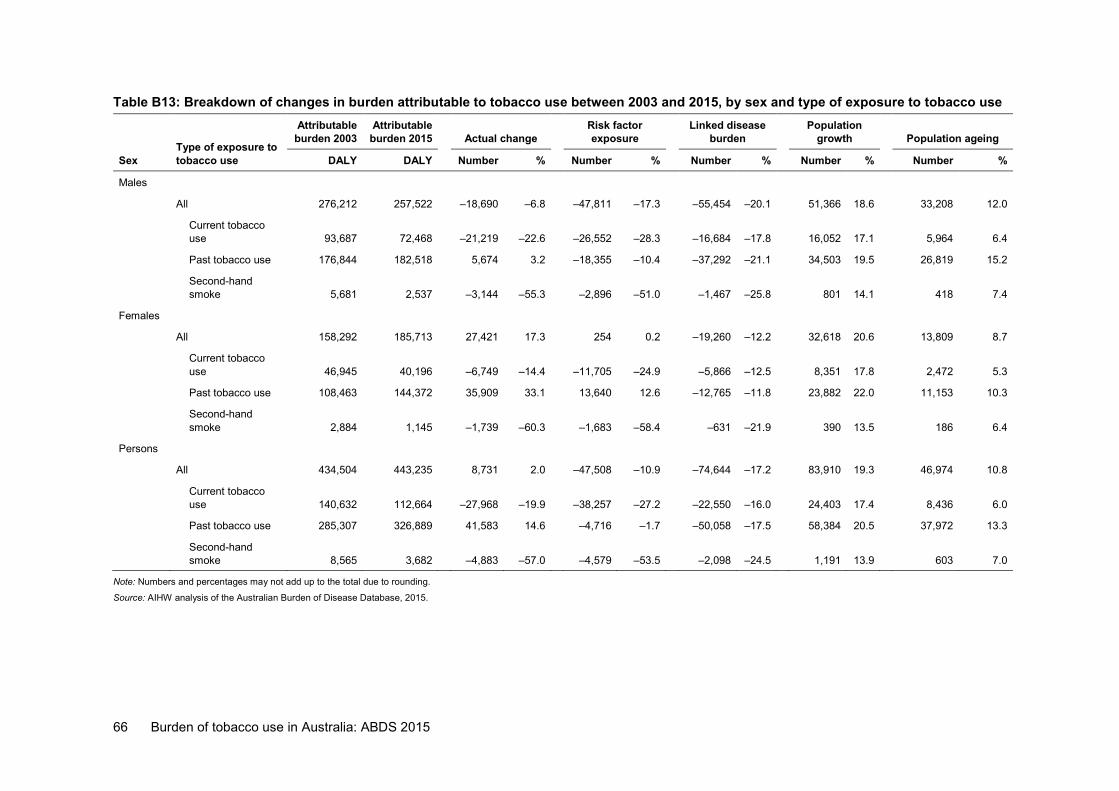
66 Burden of tobacco use in Australia: ABDS 2015
Table B13: Breakdown of changes in burden attributable to tobacco use between 2003 and 2015, by sex and type of exposure to tobacco use
Sex Type of exposure to tobacco use
Attributable burden 2003
Attributable burden 2015 Actual change
Risk factor exposure
Linked disease burden
Population growth Population ageing
DALY DALY Number % Number % Number % Number % Number %
Males All 276,212 257,522 –18,690 –6.8 –47,811 –17.3 –55,454 –20.1 51,366 18.6 33,208 12.0
Current tobacco use 93,687 72,468 –21,219 –22.6 –26,552 –28.3 –16,684 –17.8 16,052 17.1 5,964 6.4
Past tobacco use 176,844 182,518 5,674 3.2 –18,355 –10.4 –37,292 –21.1 34,503 19.5 26,819 15.2
Second-hand smoke 5,681 2,537 –3,144 –55.3 –2,896 –51.0 –1,467 –25.8 801 14.1 418 7.4
Females All 158,292 185,713 27,421 17.3 254 0.2 –19,260 –12.2 32,618 20.6 13,809 8.7
Current tobacco use 46,945 40,196 –6,749 –14.4 –11,705 –24.9 –5,866 –12.5 8,351 17.8 2,472 5.3
Past tobacco use 108,463 144,372 35,909 33.1 13,640 12.6 –12,765 –11.8 23,882 22.0 11,153 10.3
Second-hand smoke 2,884 1,145 –1,739 –60.3 –1,683 –58.4 –631 –21.9 390 13.5 186 6.4
Persons
All 434,504 443,235 8,731 2.0 –47,508 –10.9 –74,644 –17.2 83,910 19.3 46,974 10.8
Current tobacco use 140,632 112,664 –27,968 –19.9 –38,257 –27.2 –22,550 –16.0 24,403 17.4 8,436 6.0
Past tobacco use 285,307 326,889 41,583 14.6 –4,716 –1.7 –50,058 –17.5 58,384 20.5 37,972 13.3
Second-hand smoke 8,565 3,682 –4,883 –57.0 –4,579 –53.5 –2,098 –24.5 1,191 13.9 603 7.0
Note: Numbers and percentages may not add up to the total due to rounding.
Source: AIHW analysis of the Australian Burden of Disease Database, 2015.
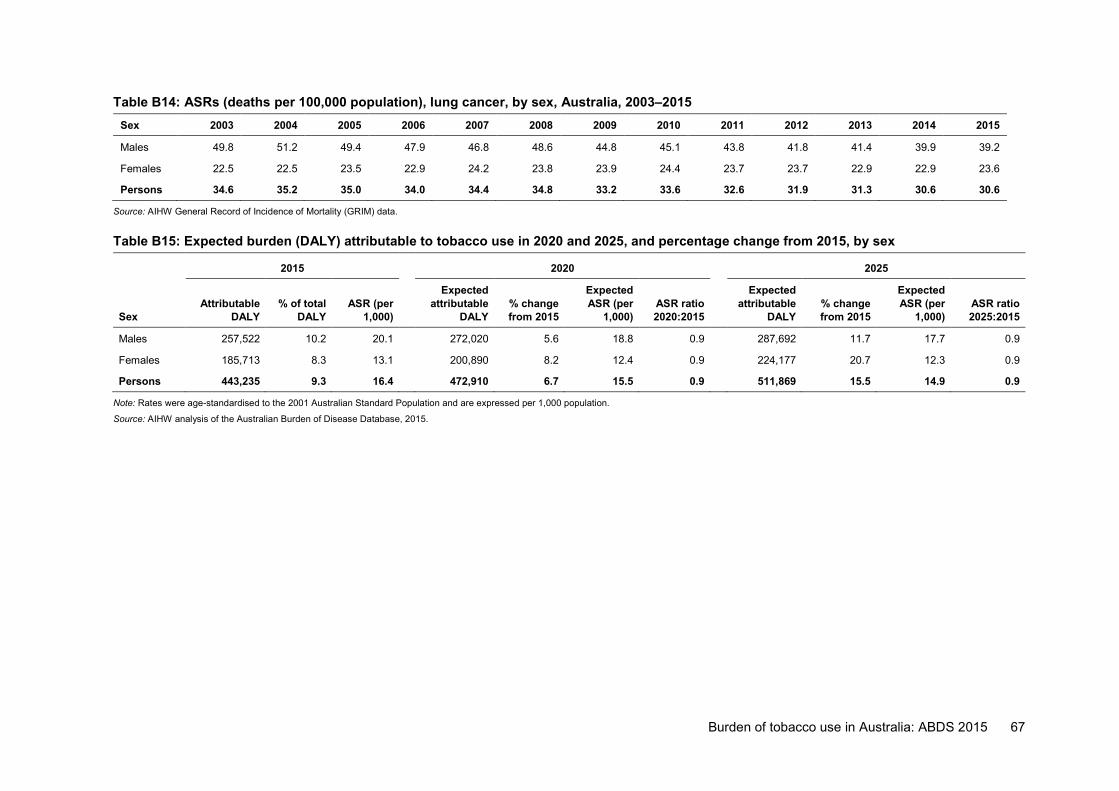
Burden of tobacco use in Australia: ABDS 2015 67
Table B14: ASRs (deaths per 100,000 population), lung cancer, by sex, Australia, 2003–2015 Sex 2003 2004 2005 2006 2007 2008 2009 2010 2011 2012 2013 2014 2015
Males 49.8 51.2 49.4 47.9 46.8 48.6 44.8 45.1 43.8 41.8 41.4 39.9 39.2
Females 22.5 22.5 23.5 22.9 24.2 23.8 23.9 24.4 23.7 23.7 22.9 22.9 23.6
Persons 34.6 35.2 35.0 34.0 34.4 34.8 33.2 33.6 32.6 31.9 31.3 30.6 30.6
Source: AIHW General Record of Incidence of Mortality (GRIM) data.
Table B15: Expected burden (DALY) attributable to tobacco use in 2020 and 2025, and percentage change from 2015, by sex
2015 2020 2025
Sex Attributable
DALY % of total
DALY ASR (per
1,000)
Expected attributable
DALY % change from 2015
Expected ASR (per
1,000) ASR ratio 2020:2015
Expected attributable
DALY % change from 2015
Expected ASR (per
1,000) ASR ratio 2025:2015
Males 257,522 10.2 20.1 272,020 5.6 18.8 0.9 287,692 11.7 17.7 0.9
Females 185,713 8.3 13.1 200,890 8.2 12.4 0.9 224,177 20.7 12.3 0.9
Persons 443,235 9.3 16.4 472,910 6.7 15.5 0.9 511,869 15.5 14.9 0.9
Note: Rates were age-standardised to the 2001 Australian Standard Population and are expressed per 1,000 population.
Source: AIHW analysis of the Australian Burden of Disease Database, 2015.
68 Burden of tobacco use in Australia: ABDS 2015
Acknowledgments This report was authored by Anna Reynolds, Vanessa Prescott and Paula Laws of the Burden of Disease and Mortality Unit at the Australian Institute of Health and Welfare (AIHW), under the guidance of Michelle Gourley, Karen Bishop and Richard Juckes.
Cathy Claydon, Julianne Garcia, Melanie Dunford, David Whitelaw and Moira Hewitt, also from the AIHW, provided constructive comments and review. Their contributions are gratefully acknowledged.
The authors would like to acknowledge the data and methodological advice provided by Emily Banks and Grace Joshy from the 45 and Up Study. This study is managed by the Sax Institute, in collaboration with its partners: Cancer Council NSW (the major partner), the National Heart Foundation of Australia (NSW Division), the NSW Ministry of Health, the NSW Department of Family and Community Services—Ageing, Carers and the Disability Council NSW, and the Australian Red Cross Blood Service.
The authors would like to acknowledge John Goss and Jinjing Li from the University of Canberra for providing us with an analytical tool and advice to be able to break down results over time, using the method developed by Prithwis Das Gupta.
The Department of Health funded this report. The authors acknowledge the valuable comments from individual staff members at that department.
Burden of tobacco use in Australia: ABDS 2015 69
Abbreviations ABDS Australian Burden of Disease Study
ABS Australian Bureau of Statistics
ACT Australian Capital Territory
AIHW Australian Institute of Health and Welfare
ASR age-standardised rate
CHD coronary heart disease
COPD chronic obstructive pulmonary disease
DALY disability-adjusted life years
FCTC Framework Convention on Tobacco Control
GBD Global Burden of Disease Study
NDSHS National Drug Strategy Household Survey
NTS National Tobacco Strategy
NSW New South Wales
NT Northern Territory
PAF population attributable fraction
Qld Queensland
SA South Australia
Tas Tasmania
TMRED theoretical minimum risk exposure distribution
Vic Victoria
WA Western Australia
YLD years lived with disability
YLL years of life lost
Symbols % per cent
. . not applicable
> greater than
< less than
70 Burden of tobacco use in Australia: ABDS 2015
Glossary attributable burden: The disease burden attributed to a particular risk factor. It is the reduction in burden that would have occurred if exposure to the risk factor had been avoided or had been reduced to its theoretical minimum risk exposure distribution.
chronic disease: A disease that tends to be long lasting and persistent in its symptoms or development. comparative risk assessment: The process for estimating the burden of disease attributable to selected risk factors. It involves 5 key steps: select linked diseases, estimate exposure distribution, estimate effect sizes, choose theoretical minimum risk exposure distribution level, and calculate attributable burden.
confounding: Describes an observed association that is due, in whole or part, to a third factor associated both with the exposure and with the outcome of interest.
disability-adjusted life year (DALY): A year of healthy life lost, either through premature death or, equivalently, through living with disability due to illness or injury.
disability weight: A factor that reflects the severity of non-fatal health loss from a particular health state on a scale from 0 (perfect health) to 1 (equivalent to death).
disease: A broad term that can be applied to any health problem. It is often used synonymously with condition, disorder or problem. effect size: A statistical measure of the strength of the relationship between 2 variables (in this context, between a risk exposure and a disease outcome), expressed, for example, as a relative risk or odds ratio.
excess burden: The reduction that would occur in overall disease burden if all groups had the same rate of burden as the least burdened group. fatal burden: The burden from dying ‘prematurely’ as measured by years of life lost. Often used synonymously with YLL, and also referred to as ‘life lost’. health state: The consequences of diseases and conditions, reflecting key differences in symptoms and functioning. illicit drug use: The use of illegal drugs (such as cannabis, cocaine, heroin and amphetamines) and probable misuse of opioids (pharmaceutical). incidence: The number of new cases (of an illness or injury) occurring during a given period. linked disease: A disease or condition on the causal pathway of the risk factor, which is therefore more likely to develop if exposed to the risk.
non-fatal burden: The burden from living with ill-health as measured by years lived with disability. It is often used synonymously with YLD, and also referred to as ‘health loss’ in this report.
population attributable fraction (PAF): For a particular risk factor and causally linked disease or injury, the percentage reduction in burden that would occur for a population if exposure to the risk factor were avoided or reduced to its theoretical minimum.
prevalence: The number of cases of a disease or injury in a population at a given time. The prevalence rate is the number of cases existing at a point in time (point prevalence) or over a specific period (period prevalence).
Burden of tobacco use in Australia: ABDS 2015 71
relative risk (RR): The risk of an event relative to exposure, calculated as the ratio of the probability of the event’s occurring in the exposed group to the probability of its occurring in the non-exposed group. A relative risk of 1 implies no difference in risk; RR <1 implies the event is less likely to occur in the exposed group; RR >1 implies the event is more likely to occur in the exposed group.
risk factor: Any factor that causes or increases the likelihood of a health disorder or other unwanted condition or event.
sequela: The consequence of diseases; often used in the plural, sequelae.
smoking impact ratio (SIR): The population lung cancer mortality in excess of never-smokers relative to excess lung cancer mortality for a known reference group of smokers. theoretical minimum risk exposure distribution (TMRED): The risk factor exposure distribution that will lead to the lowest conceivable disease burden.
tobacco use: Exposure to tobacco smoke either directly through current/past smoking or via second-hand smoke. The most common use of tobacco is by smoke inhalation from cigarettes, pipes and cigars. years lived with disability (YLD): A measure of the years of what could have been a healthy life that were instead spent in states of less than full health. This is also referred to as non-fatal burden.
years of life lost (YLL): A measure of the years of life lost due to premature mortality. This is also referred to as fatal burden.
72 Burden of tobacco use in Australia: ABDS 2015
References ABS (Australian Bureau of Statistics) 2013. Census of population and housing: Socio-Economic Indexes for Areas (SEIFA), Australia, 2011. ABS cat. no. 2033.0.55.001. Canberra: ABS.
ABS 2015. National Health Survey: first results, 2014–15. ABS cat. no. 4364.0.55.001. Canberra: ABS.
ABS 2018. Regional population growth, Australia, 2016–17. ABS cat. no. 3218.0. Canberra: ABS.
ABS 2019. National Health Survey: first results, 2017–18. ABS cat. no. 4364.0.55.001. Canberra: ABS.
AIHW 2017. National Drug Strategy Household Survey 2016: detailed findings. Drug Statistics series no. 31. Cat. no. PHE 214. Canberra: AIHW.
AIHW 2018a. Alcohol, tobacco and other drugs in Australia. Cat. no. PHE 221. Canberra: AIHW. Viewed 15 March 2019, https://www.aihw.gov.au/reports/alcohol/alcohol-tobacco-other-drugs-australia/contents/drug-types/tobacco.
AIHW 2018b. Australia’s health 2018. Australia’s health series no. 16. Cat. no. AUS 221. Canberra: AIHW.
AIHW 2019a. Australian Burden of Disease Study: impact and causes of illness and death in Australia 2015. Australian Burden of Disease series no. 19. Cat. no. BOD 22. Canberra: AIHW.
AIHW 2019b. Australian Burden of Disease Study: methods and supplementary material 2015. Australian Burden of Disease Study series no. 20. Cat. no. BOD 23. Canberra: AIHW.
AIHW 2019c. General Record of Incidence of Mortality (GRIM) data. Cat. no. PHE 229. Canberra: AIHW. Viewed 19 July 2019, https://www.aihw.gov.au/reports/life-expectancy-deaths/grim-books/contents/general-record-of-incidence-of-mortality-grim-data.
ANPHA (Australian National Preventive Health Agency) 2013. Smoking and disadvantage. Evidence brief. Canberra: ANPHA.
Banks E, Joshy G, Korda RJ, Stavreski B, Soga K, Egger S et al. 2019. Tobacco smoking and risk of 36 cardiovascular disease subtypes: fatal and non-fatal outcomes in a large prospective Australian study. BMC Medicine 17:128.
Banks E, Joshy G, Weber MF, Liu B, Grenfell R, Egger S et al. 2015. Tobacco smoking and all-cause mortality in a large Australian cohort study: findings from a mature epidemic with current low smoking prevalence. BMC Medicine 13(1):38.
Banks E, Redman S, Jorm L, Armstrong B, Bauman A, Beard J et al. 2008. Cohort profile: the 45 and Up study. International Journal of Epidemiology 37(5):941–7.
Carter BD, Abnet CC, Feskanich D, Freedman ND, Hartage P, Lewis CE et al. 2015. Smoking and mortality: beyond established causes. New England Journal of Medicine 372(7):631–40.
Casetta B, Videla AJ, Bardach A, Morello P, Soto N, Lee K et al. 2017. Association between cigarette smoking prevalence and income level: a systematic review and meta-analysis. Nicotine & Tobacco Research 19(12):1401–7. doi: 10.1093/ntr/ntw266.
Burden of tobacco use in Australia: ABDS 2015 73
Cook BL, Wayne GF, Kafali EN, Liu Z, Shu C & Flores M 2014. Trends in smoking among adults with mental illness and association between mental health treatment and smoking cessation. Journal of the American Medical Association 311(2):172–82.
Cooper J, Mancuso SG, Borland R, Slade T, Galletly C & Castle D 2012. Tobacco smoking among people living with a psychotic illness: the second Australian survey of psychosis. Australian and New Zealand Journal of Psychiatry 46(9):851–63.
Das Gupta P 1993. Standardization and decomposition of rates: a user’s manual. US Bureau of the Census, Current Population Reports, Series P23–186. Washington, DC: US Government Printing Office.
De Hert M, Detraux J & Vancampfort D 2018. The intriguing relationship between coronary heart disease and mental disorders. Dialogues in Clinical Neuroscience 20(1):31–40.
Dickerson F, Schroeder J, Katsafanas E, Khushalani S, Origoni AE, Savage C et al. 2018. Cigarette smoking by patients with serious mental illness, 1999–2016: an increasing disparity. Psychiatric Services 69:147–53.
Department of Health 2017. National Drug Strategy 2017–2026. Canberra: Department of Health.
Forouzanfar MH, Afshin A, Alexander LT, Anderson HR, Bhutta ZA, Biryukov S et al. 2016. Global, regional, and national comparative risk assessment of 79 behavioural, environmental and occupational, and metabolic risks or clusters of risks, 1990–2015. The Lancet 388(10053):1659–724.
GBD 2016 Risk Factor Collaborators 2017. Global, regional, and national comparative risk assessment of 84 behavioural, environmental and occupational, and metabolic risks or clusters of risks, 1990–2016: a systematic analysis for the Global Burden of Disease Study 2016. The Lancet 390(10100):1345–422.
Greenhalgh EM, Stillman S & Ford C 2018. 7.12 Smoking and mental health. In Scollo, MM and Winstanley, MH [editors]. Tobacco in Australia: Facts and issues. Melbourne: Cancer Council Victoria. Available from http://www.tobaccoinaustralia.org.au/chapter-7-cessation/7-12-smoking-and-mental-health (Accessed May 2019).
Hiscock R, Bauld L, Amos A, Fidler JA & Munafo M 2012. Socioeconomic status and smoking: a review. Annals of the New York Academy of Sciences 1248:107–23.
Huisman M, Van Lenthe FJ, Giskes K, Kamphuis CBM, Brug J & Mackenbach JP 2012. Explaining socio-economic inequalities in daily smoking: a social–ecological approach. European Journal of Public Health 22(2):238–43.
Laaksonen MA, Canfell K, MacInnis R, Arriaga ME, Banks E, Magliano DJ et al. 2018. The future burden of lung cancer attributable to current modifiable behaviours: a pooled study of seven Australian cohorts. International Journal of Epidemiology 47(6):1772–83.
Lawrence D, D’Arcy C, Holman J, Jablensky A & Hobbs M 2003. Death rate from ischaemic heart disease in Western Australian psychiatric patients 1980–1998. British Journal of Psychiatry 182(1):31–6.
Lawrence D, Hancock KJ & Kisley S 2013. The gap in life expectancy from preventable physical illness in psychiatric patients in Western Australia: retrospective analysis of population based registers. BMJ 346:f2539.
Lawrence D, Mitrou F & Zubrick SR 2009. Smoking and mental illness: results from population surveys in Australia and the United States. BMC Public Health 9:285.
74 Burden of tobacco use in Australia: ABDS 2015
Li J 2017. Rate decomposition for aggregate data using Das Gupta’s method. The Stata Journal 17(2):490–502.
Lim SS, Vos T, Flaxman AD, Danaei G, Shibuya K, Adair-Rohani H et al. 2012. A comparative risk assessment of burden of disease and injury attributable to 67 risk factors and risk factor clusters in 21 regions, 1990-2010: a systematic analysis for the Global Burden of Disease Study 2010. The Lancet 380(9859):2224–60.
Mendelsohn CP, Kirby DP & Castle DJ 2015. Smoking and mental illness: an update for psychiatrists. Australasian Psychiatry 23(1):37–43.
Morisano D, Bacher I, Audrain-McGovern J & George TP 2009. Mechanisms underlying the comorbidity of tobacco use in mental health and addictive disorders. Canadian Journal of Psychiatry 56(6):356–67.
Murray CJ, Ezzati M, Lopez AD, Rodgers A & Vander Hoorn S 2003. Comparative quantification of health risks conceptual framework and methodological issues. Population Health Metrics 1(1):1.
NRHA (National Rural Health Alliance Inc) 2014. Smoking and rural health. Fact sheet. Canberra: NRHA.
OECD (Organisation for Economic Co-operation and Development) 2019. OECD health statistics 2019. Non-medical determinants of health: tobacco consumption. Paris: OECD. Viewed 27 August 2019, http://www.oecd.org/els/health-systems/health-data.htm.
Peto R, Boreham J, Lopez AD, Thun M & Heath C 1992. Mortality from tobacco in developed countries: indirect estimation from national vital statistics. The Lancet 339(8804):1268–78.
Pirie K, Peto R, Reeves GK, Green J & Beral V 2013. The 21st century hazards of smoking and benefits of stopping: a prospective study of one million women in the UK. The Lancet 381:133–41.
Prochaska JJ 2011. Smoking and mental Illness—breaking the link. New England Journal of Medicine 365:196–8.
Ragg M & Ahmed T 2008. Smoke and mirrors: a review of the literature on smoking and mental illness. Tackling Tobacco Program Research Series No. 1. Sydney: Cancer Council NSW.
Steinberg ML, Williams JM & Li Y 2015. Poor mental health and reduced decline in smoking prevalence. American Journal of Preventive Medicine 49(3):362–9.
Twyman L, Bonevski B, Paul C & Bryant J 2014. Perceived barriers to smoking cessation in selected vulnerable groups: a systematic review of the qualitative and quantitative literature. BMJ Open 4(12):e006414. doi: 10.1136/bmjopen-2014-006414.
US DHHS (United States Department of Health and Human Services) 2014. The health consequences of smoking—50 years of progress: a report of the Surgeon General. Atlanta, GA: US DHHS, Centers for Disease Control and Prevention, National Center for Chronic Disease Prevention and Health Promotion, Office on Smoking and Health.
Wakefield M, Coomber K, Durkin S, Scollo M, Bayly M, Spittal MJ et al. 2014. Time series analysis of the impact of tobacco control policies on smoking prevalence among Australian adults, 2001–2011. Bulletin of the World Health Organization 92(413–22). Viewed 21 February 2019, http://www.who.int/bulletin/volumes/92/6/13-118448/en/.
WCRF/AICR (World Cancer Research Fund and American Institute for Cancer Research) 2007. Food, nutrition, physical activity, and the prevention of cancer: a global perspective. Washington DC: AICR.
Burden of tobacco use in Australia: ABDS 2015 75
WHO (World Health Organization) 2018. Tobacco. Fact sheet. Geneva: WHO. Viewed 7 March 2019, https://www.who.int/en/news-room/fact-sheets/detail/tobacco.
Zhai T, Goss J & Li J 2017. Main drivers of health expenditure growth in China: a decomposition analysis. BMC Health Services Research 17(1):185. doi:10.1186/s12913-017-2119-1.
76 Burden of tobacco use in Australia: ABDS 2015
List of tables Table 2.1: Burden (DALY) attributable to tobacco exposure, 2015 ........................................... 8
Table 2.2: Burden (DALY) attributable to tobacco use, by sex, 2015 ........................................ 9
Table 2.3: Deaths, fatal (YLL) and non-fatal (YLD) burden attributable to tobacco use, by sex, 2015 ............................................................................................................ 10
Table 2.4: Diseases linked to different exposure to tobacco ................................................... 11
Table 2.5: Burden (DALY) attributable to tobacco use, by linked disease and sex, 2015 ....... 13
Table 2.6: Number and proportion of disease due to tobacco use (attributable DALY), by linked disease, 2015 .......................................................................................... 18
Table 2.7: Effect sizes for mortality from select linked diseases: comparison of 45 and Up and GBD 2016 studies ...................................................................................... 21
Table 3.1: Burden (DALY) attributable to tobacco use, by state and territory, 2015 ............... 23
Table 3.2: Age standardised rate of burden for the leading 8 diseases linked to tobacco use (DALY ASR per 1,000 population), by state and territory, 2015 ...................... 25
Table 3.3: Burden (DALY) attributable to tobacco use, by remoteness area, 2015 ................ 25
Table 3.4: Distribution of burden and excess burden for attributable burden (YLD, YLL and DALY) due to tobacco use, by remoteness area, 2015 ................................... 27
Table 3.5: Burden (DALY) attributable to tobacco use, by socioeconomic group, 2015 ......... 29
Table 3.6: Distribution of burden and excess burden for attributable burden (YLD, YLL and DALY) due to tobacco use, by socioeconomic group, 2015 .......... 31
Table 3.7: Prevalence of a mental health condition and current smoking, by sex, 2010 and 2016 ................................................................................................................. 33
Table 3.8: Burden (DALY) attributable to current tobacco use in people with or without a mental health condition, 2015 .............................................................................. 34
Table 4.1: Comparison of burden (DALY) attributable to tobacco exposure, 2003, 2011 and 2015 ................................................................................................................. 37
Table 4.2: Age-standardised attributable DALY (per 1,000 population) due to tobacco use, 2003, 2011 and 2015 ...................................................................................... 38
Table 4.3: Expected burden (DALY) attributable to tobacco use in 2020 and 2025, and percentage change from 2015, by sex ................................................................... 43
Table 5.1: Burden (DALY) attributable to the combined effect of tobacco, alcohol and illicit drug use, by sex, 2015 .................................................................................... 45
Table 5.2: Deaths, fatal (YLL) and non-fatal (YLD) burden attributable to the combined effect of tobacco, alcohol and illicit drug use, by sex, 2015 .................................... 46
Table A1: Diseases linked to different tobacco smoke exposures .......................................... 47
Table B1: Attributable deaths due to tobacco use, by age, 2015 ........................................... 56
Table B2: Tobacco smoking status, people aged 30 and over, by age and sex, 2001 to 2016 (%) .................................................................................................................. 57
Table B3: Proportion of fatal and non-fatal burden due to tobacco use, by linked disease and sex, 2015.......................................................................................................... 58
Table B4: Attributable burden (DALY) due to tobacco use, by linked disease and sex, 2015 ........................................................................................................................ 59
Burden of tobacco use in Australia: ABDS 2015 77
Table B5: Attributable burden (DALY) of direct tobacco use, comparison of the 45 and Up and GBD 2016 studies, by selected linked diseases, persons, 2015 ..................... 61
Table B6: Age-standardised DALY rates and rate ratio of burden attributable to tobacco use, by remoteness area and sex, 2015 ................................................................. 62
Table B7: Age-standardised DALY rates per 1,000 population of burden attributable to tobacco use, by remoteness area and selected linked diseases, 2015 ................. 62
Table B8: Age-standardised DALY rates and rate ratio of burden attributable to tobacco use, by socioeconomic group and sex, 2015 .......................................................... 63
Table B9: Age-standardised DALY rates per 1,000 population of burden attributable to tobacco use, by socioeconomic group and selected linked diseases, 2015 .......... 63
Table B10: Age-standardised attributable DALY (per 1,000 population) due to current tobacco use in people with or without a mental health condition, by sex, 2015 ..... 64
Table B11: Age-standardised attributable DALY (per 1,000 population) due to current tobacco use in people with or without a mental health condition, by selected linked disease, 2015 ............................................................................................... 64
Table B12: Number and ASRs of burden (DALY per 1,000 population) attributable to tobacco use, for selected linked diseases, 2003, 2011 and 2015 .......................... 65
Table B13: Breakdown of changes in burden attributable to tobacco use between 2003 and 2015, by sex and type of exposure to tobacco use ......................................... 66
Table B14: ASRs (deaths per 100,000 population), lung cancer, by sex, Australia, 2003–2015 .............................................................................................................. 67
Table B15: Expected burden (DALY) attributable to tobacco use in 2020 and 2025, and percentage change from 2015, by sex ................................................................... 67
78 Burden of tobacco use in Australia: ABDS 2015
List of figures Figure 2.1: Burden (DALY and DALY rate) attributable to tobacco use, by age and sex,
2015 .......................................................................................................................... 9
Figure 2.2: Burden attributable to tobacco use due to fatal and non-fatal burden, by age, males (a) and females (b), 2015 ............................................................................. 10
Figure 2.3: Burden (DALY) due to tobacco use, by sex and selected linked diseases, 2015 .. 14
Figure 2.4: Burden attributable to tobacco use, by linked disease group, age and sex, DALY, males (a) and females (b), and proportion within each age group DALY, males (c) and females (d), 2015 ............................................................................. 15
Figure 2.5: Burden attributable to tobacco use due to fatal and non-fatal burden, by selected linked disease, males (a) and females (b), 2015 ..................................... 17
Figure 2.6: Proportion of selected linked disease burden (DALY) due to tobacco use, by sex and selected linked diseases, 2015 ................................................................. 19
Figure 2.7: Attributable burden (DALY) of direct tobacco use, comparison of 45 and Up Study and GBD data, by linked disease, persons, 2015 ........................................ 21
Figure 3.1: Age-standardised attributable DALY rate (per 1,000 population) due to tobacco use, by state and territory and sex, 2015 ................................................................ 24
Figure 3.2: Age-standardised attributable DALY rate (per 1,000 population) due to tobacco use, by remoteness area and sex, 2015 ................................................... 26
Figure 3.3: Age-specific attributable DALY rate (per 1,000 population) due to tobacco use, by remoteness area, 2015 .............................................................................. 28
Figure 3.4: Age-standardised attributable DALY rate due to tobacco use for selected linked diseases, by remoteness area, 2015 ........................................................... 28
Figure 3.5: Age-standardised attributable DALY (per 1,000 population) due to tobacco use, by socioeconomic group and sex, 2015 .......................................................... 30
Figure 3.6: Age-specific attributable DALY rate (per 1,000 population) due to tobacco use, by socioeconomic group, 2015 ....................................................................... 32
Figure 3.7: Age-standardised attributable DALY rate (per 1,000 population) due to tobacco use for selected linked diseases, by socioeconomic group, 2015 .......................... 32
Figure 3.8: Age-standardised attributable DALY (per 1,000 population) due to current tobacco use in people with or without a mental health condition, by sex, 2015 ..... 34
Figure 3.9: Burden (DALY and DALY rate per 1,000 population) attributable to current tobacco use in people with or without a mental health condition, by age, 2015 ..... 35
Figure 3.10: Age-standardised attributable DALY rate due to current tobacco use, by selected linked diseases in people with or without a mental health condition, 2015 ........................................................................................................................ 36
Figure 4.1: Number and rates of burden (DALY per 1,000 population) attributable to tobacco use, by age, 2003, 2011 and 2015 ............................................................ 38
Figure 4.2: Age-standardised rates of burden (DALY per 1,000 population) attributable to tobacco use, for selected linked diseases, 2003, 2011 and 2015 ...................... 39
Figure 4.3: How to interpret figures on drivers of changes over time presented in this chapter .................................................................................................................... 40
Figure 4.4: Breakdown of changes in burden attributable to tobacco use between 2003 and 2015, by sex ..................................................................................................... 41
Burden of tobacco use in Australia: ABDS 2015 79
Figure 4.5: Breakdown of changes in burden attributable to tobacco use, between 2003 and 2015, by sex and type of exposure .................................................................. 42
Figure 4.6: Actual 2015 standardised attributable DALY rate due to tobacco use (per 1,000 population), and expected rate in 2020 and 2025, by sex ...................................... 44
Figure A1: Method for scenario analysis of the burden attributable to current tobacco use in people with or without a mental health condition, 2015 ...................................... 52
80 Burden of tobacco use in Australia: ABDS 2015
Related publications This report and other AIHW publications can be downloaded for free from the AIHW website http://www.aihw.gov.au.
The website also includes information on ordering printed copies.
The following related AIHW publications might also be of interest:
• AIHW 2019. Australian Burden of Disease Study: impact and causes of illness and death in Australia 2015. Australian Burden of Disease Study series no. 19. Cat. no. BOD 22. Canberra: AIHW.
• AIHW 2019. Australian Burden of Disease Study: methods and supplementary material 2015. Australian Burden of Disease Study series no. 20. Cat. no. BOD 23. Canberra: AIHW.
• AIHW 2018. Impact of alcohol and illicit drug use on the burden of disease and injury in Australia: Australian Burden of Disease Study 2011. Australian Burden of Disease Study series no. 17. Cat. no. BOD 19. Canberra: AIHW.

Stronger evidence, better decisions, improved health and welfare
Stronger evidence, better decisions, im
proved health and welfare
Burden of tobacco use in Australia
Australian Burden of Disease Study 2015
aihw.gov.au
Stronger evidence, better decisions, improved health and welfare
Burden of tobacco use in Australia: Australian Burden of Disease Study 2015
This report quantifies the health burden that tobacco use places on Australia. Tobacco use contributes to health burden more than any other risk factor and was responsible for 9.3% of the total burden of disease in Australia in 2015. The report highlights that health inequalities exist, with lower socioeconomic groups and more remote areas generally experiencing higher rates of disease burden due to tobacco use.
Related Documents