Laurie C. Zephyrin, M.D., M.P.H., M.B.A. Vice President, Advancing Health Equity The Commonwealth Fund Burden of Maternal Morbidity and Mortality Advancing Maternal Health Equity and Reducing Maternal Mortality - A Virtual Workshop The National Academies of Sciences, Engineering, Medicine June 7 th , 2021

Welcome message from author
This document is posted to help you gain knowledge. Please leave a comment to let me know what you think about it! Share it to your friends and learn new things together.
Transcript

Laurie C. Zephyrin, M.D., M.P.H., M.B.A.Vice President, Advancing Health EquityThe Commonwealth Fund
Burden of Maternal Morbidity and Mortality
Advancing Maternal Health Equity and Reducing Maternal Mortality - A Virtual WorkshopThe National Academies of Sciences, Engineering, MedicineJune 7th, 2021

Source: Eugene Declercq and Laurie Zephyrin, Maternal Mortality in the United States: A Primer (Commonwealth Fund, Dec. 2020). https://doi.org/10.26099/ta1q-mw24
Maternal mortality had been gradually declining before recently rising.
0
100
200
300
400
500
600
700
800
900
1,000
Note: Shifts in measurement (e.g., not all states were part of registration system prior to 1933; infant race was based on race of the child until 1980 and on race of the mother post-1980) account for some of the variation over time. Years 2007–2016 based on two-year estimates of the pregnancy-related mortality rate: Emily E. Petersen et al., “Racial/Ethnic Disparities in Pregnancy-Related Deaths — United States, 2007–2016,” Morbidity and Mortality Weekly Report 68, no. 35 (Sept. 6, 2019): 762–65. Data for 2017 unavailable; data for 2018 based on official NVSS rate.
Data: NCHS, Maternal Mortality and Related Concepts, Vital & Health Statistics, Series 33, #3. & annual data reports. 1915–1960 data from NCHS, Vital Statistics Rates in the United States, 1940–1960.
Deaths per 100,000 births
6789
10111213141516
19901992199419961998200020022004200620082010201220142016

Source: Eugene Declercq and Laurie Zephyrin, Maternal Mortality in the United States: A Primer (Commonwealth Fund, Dec. 2020). https://doi.org/10.26099/ta1q-mw24
Black birthing people have been more likely to die than white mothers for 100 years.
0.0
1.0
2.0
3.0
4.0
5.0
6.0
1915
1917
1919
1921
1923
1925
1927
1929
1931
1933
1935
1937
1939
1941
1943
1945
1947
1949
1951
1953
1955
1957
1959
1961
1963
1965
1967
1969
1971
1973
1975
1977
1979
1981
1983
1985
1987
1989
1991
1993
1995
1997
1999
2001
2003
2005
2007
2009
2011
2013
2015
Notes: Shifts in measurement account for some of the variation over time. For example, not all states were part of registration system prior to 1933, and infant race was based on race of the child until 1980 and then race of the mother after 1980.
Data: National Center for Health Statistics (NCHS), “Maternal Mortality and Related Concepts,” Vital and Health Statistics, series 33, no. 3 (Feb. 2007); and NCHS annual data reports. Data for 1915–1960 from NCHS, Vital Statistics Rates in the United States 1940–1960. Data for 2007–2016 based on two-year estimates of the pregnancy-related mortality rate, from Emily E. Petersen et al., “Racial/Ethnic Disparities in Pregnancy-Related Deaths — United States, 2007–2016,” Morbidity and Mortality Weekly Report 68, no. 35 (Sept. 6, 2019): 762–65.
Ratio of Black to white maternal mortality

Source: Eugene Declercq and Laurie Zephyrin, Maternal Mortality in the United States: A Primer (Commonwealth Fund, Dec. 2020). https://doi.org/10.26099/ta1q-mw24
Even higher education does not protect Black mothers from pregnancy-related death (U.S., 2007–16).
25.0 25.2
11.77.8
45.6
59.1
41.0 40.2
12.6 11.2 9.4 9.3
< High school High school Some college College
White Black Hispanic
Data: Emily E. Petersen et al., “Racial/Ethnic Disparities in Pregnancy-Related Deaths — United States, 2007–2016,” Morbidity and Mortality Weekly Report 68, no. 35 (Sept. 6, 2019): 762–65.
Pregnancy-related mortality ratios per 100,000 births in the U.S., 2007–2016
Maternal deaths are more common among Black mothers with a college education than they are among white mothers with less than a high school
education.
Source: Eugene Declercq and Laurie Zephyrin, Maternal Mortality in the United States: A Primer (Commonwealth Fund, Dec. 2020). https://doi.org/10.26099/ta1q-mw24
A woman’s chance of dying in childbirth is twice as high in some states than in others (maternal mortality by state, U.S., 2018).
Data: National Center for Health Statistics, Maternal Mortality by State, 2018.
Not available
<15
15.0–19.9
20.0–29.9
30.0+
Maternal mortality ratio (per 100,000 births)
Variation in state maternal mortality rates, 2018

6
Maternal Morbidity
Say, L., Barreix, M., Chou, D. et al. Maternal morbidity measurement tool pilot: study protocol. Reprod Health 13, 69 (2016). https://doi.org/10.1186/s12978-016-0164-6

Burden of Maternal morbidity

8
Impacts of Social Determinants of Health Including safe accordable housing, living wage, quality education, transportation, availability of food, social connection and safety, job security
PRENATAL CAREPrimary care, midwifery care
POSTNATAL CAREPrimary care, midwifery care
Pre-pregnancyPrimary care, midwifery care
Common Drivers of Maternal Mortality
Post-pregnancy
BIRTH
PREGNANCYPre-pregnancy
31%
Maternal deaths duringpregnancy
17%
Maternal deaths arounddelivery
52%
Postnatal maternal deaths(up to 1 yr)
Impacts of Structural Racism

9
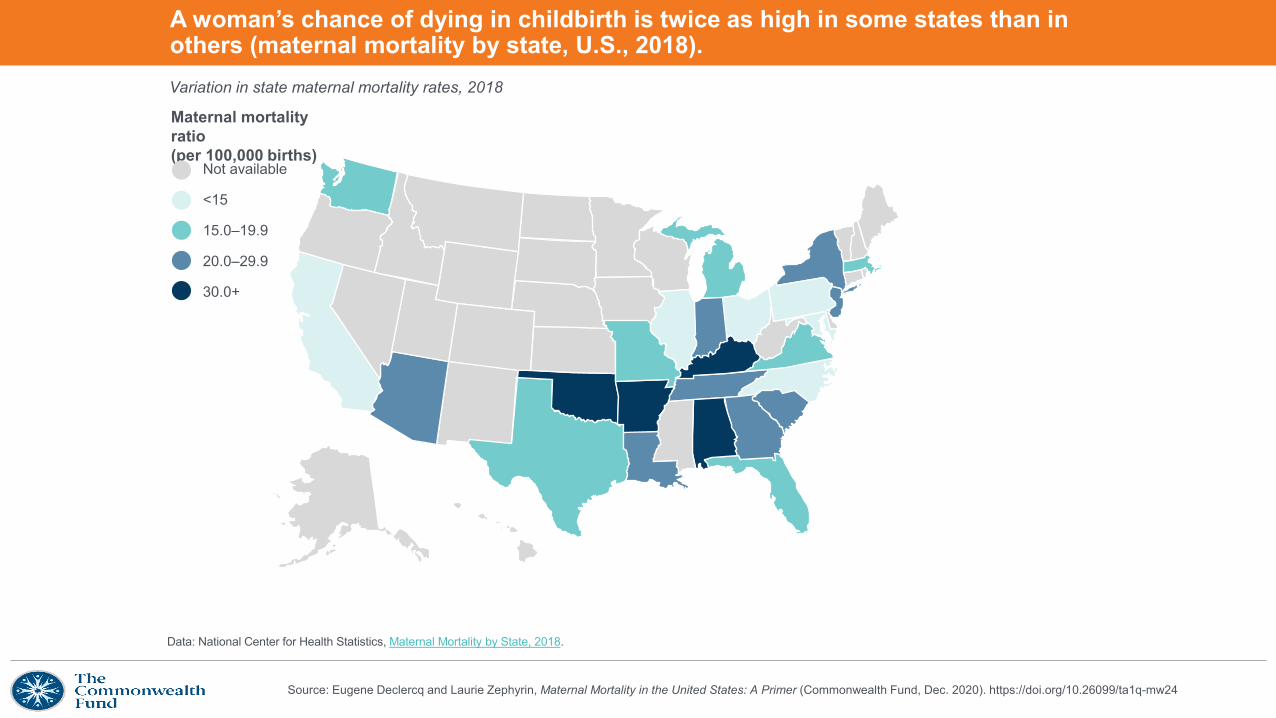
Notes: The maternal mortality ratio is defined by the World Health Organization as the death of a woman while pregnant or within 42 days of termination of pregnancy, irrespective of the duration and site of the pregnancy, from any cause related to or aggravated by the pregnancy or its management but not from accidental or incidental causes.Data: OECD Health Data 2020, showing data for 2018 except 2017 for Switzerland and the UK; 2016 for New Zealand; 2012 for France.Source: Roosa Tikkanen et al., Maternal Mortality and Maternity Care in the United States Compared to 10 Other Developed Countries (Commonwealth Fund, Nov. 2020). https://doi.org/10.26099/411v-9255
Maternal Mortality Ratios in Selected Countries
Deaths per 100,000 live births
10
The State of Maternal Health Care in the U.S.

11
* “Sum” (right of horizontal bars) may not reflect arithmetic sum of figures shown for Ob-Gyn and midwife providers because calculations were performed on exact figures, while the figure presents rounded figures. Data: OECD Health Data 2020, representing “practicing midwives” except: Canadian data reflect "professionally active" midwives; U.S. data reflect midwives "licensed to practice." Data for professionals "licensed to practice" tend to be higher than data for "professionally active," while numbers of "practicing" professionals tend to be the lowest. Data for 2018 except 2017 for Australia, Canada, Sweden, and 2015 for the U.S. Reflects midwifery professionals and midwifery associate professionals (ISCO-08 2222, 3222). U.S. data reflect CNM, CM, CPM; excludes noncertified (“lay”) midwives. “Sum” does not reflect total maternity care workforce, since primary care physicians/family practitioners are not shown.Source: Roosa Tikkanen et al., Maternal Mortality and Maternity Care in the United States Compared to 10 Other Developed Countries (Commonwealth Fund, Nov. 2020). https://doi.org/10.26099/411v-9255
Maternal care workforce
Supply of Midwives and Ob-Gyns, 2018 or Latest Year
Number of providers (head counts) per 1,000 live births*

12
Data: OECD Family Database, 2018 data. Data reflect paid maternity, parental, and home care leave available to mothers.Source: Roosa Tikkanen et al., Maternal Mortality and Maternity Care in the United States Compared to 10 Other Developed Countries (Commonwealth Fund, Nov. 2020). https://doi.org/10.26099/411v-9255
Maternity leave
Weeks of Paid Maternity Leave, 2018
Total weeks of paid leave available to mothers
13Source: Roosa Tikkanen et al., Maternal Mortality and Maternity Care in the United States Compared to 10 Other Developed Countries (Commonwealth Fund, Nov. 2020). https://doi.org/10.26099/411v-9255
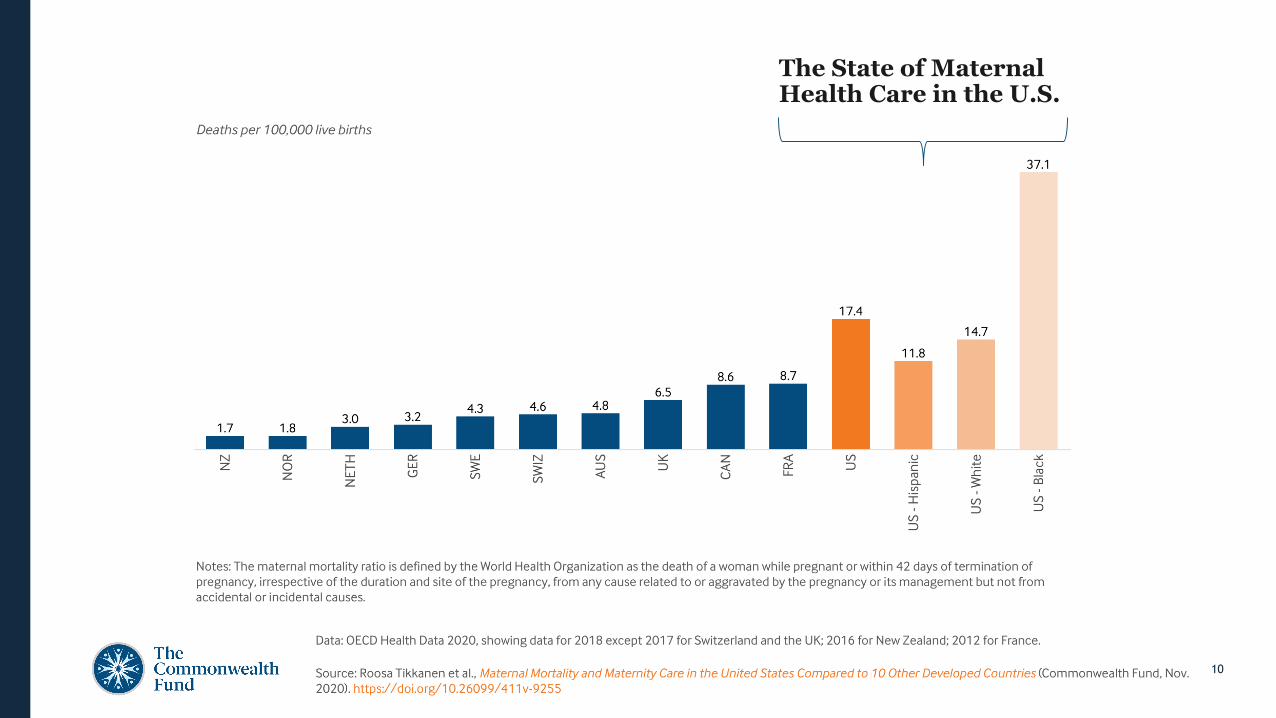
Postpartum care
Postpartum Home VisitsCountry Covered by national
insurance?Timing and number of covered visits
Australia Yes Within week 1, typically 1-3 visits
Canada Yes Contacted/visited within 24-48 h after going home
France Yes Starting within 24 h after discharge, 1-3 visits
Germany Yes Daily if needed until day 10, plus 16 visits as needed until 8 weeks weeks postpartum
Netherlands Yes Daily, starting immediately after birth and up to 10 days postpartum, staying at a minimum 4 h per day
New Zealand Yes ≥5 visits over 6 weeks, starting within 48 h postpartum
Norway Yes Midwife: Starting at 24 to 48 hours, or 3 days (for low-risk multiparous women) after going homeNurse: 1st visit on days 7 to 10 postpartum; 2nd visit on days 14 to 21
Sweden Yes 1st visit during week 1; visits thereafter every 1-2 weeks until week 8
Switzerland Yes Daily, up to 10 days postpartum
UK Yes At least until 10 days postpartum
US Some MedicaidSome health plans
Varies by state Medicaid prog. and by individual insurer

14
• Maternity Care Providers
- The U.S. has a relative undersupply of maternity care providers, especially midwives, and lacks comprehensive postpartum supports.
• Paid leave
- Women receiving paid leave use fewer health care services compared to women with only unpaid leave
• Postpartum care
- Expanding eligibility for Medicaid may lead to more stable postpartum coverage
Policy Implications

15
Medicaid and maternal health
Sources: National Partnership for Women and Families, “Fact Sheet - Medicaid: Ensuring Basic Health Care for Millions of Women and Children, April 2018, https://www.nationalpartnership.org/our-work/resources/health-care/medicaid-ensuring-basic-health-care-for-millions-of-women-and-children.pdf.; MACPAC, “Medicaid’s Role in Financing Maternity Care (2019),” https://www.macpac.gov/wp-content/uploads/2019/12/Medicaid%E2%80%99s-Role-in-Financing-Maternity-Care-presentation.pdf
One in five women of reproductive age are enrolled in Medicaid, with even higher proportions among women of color
20%
16%
31%
27%
48%
Overall
White
Black
Hispanic
Below federal poverty level
of all births are covered by Medicaid43%
The program’s coverage of family planning services, prenatal and maternity care plays a significant role in improving maternal health.
of all births by Black mothers are covered by Medicaid
66%
16
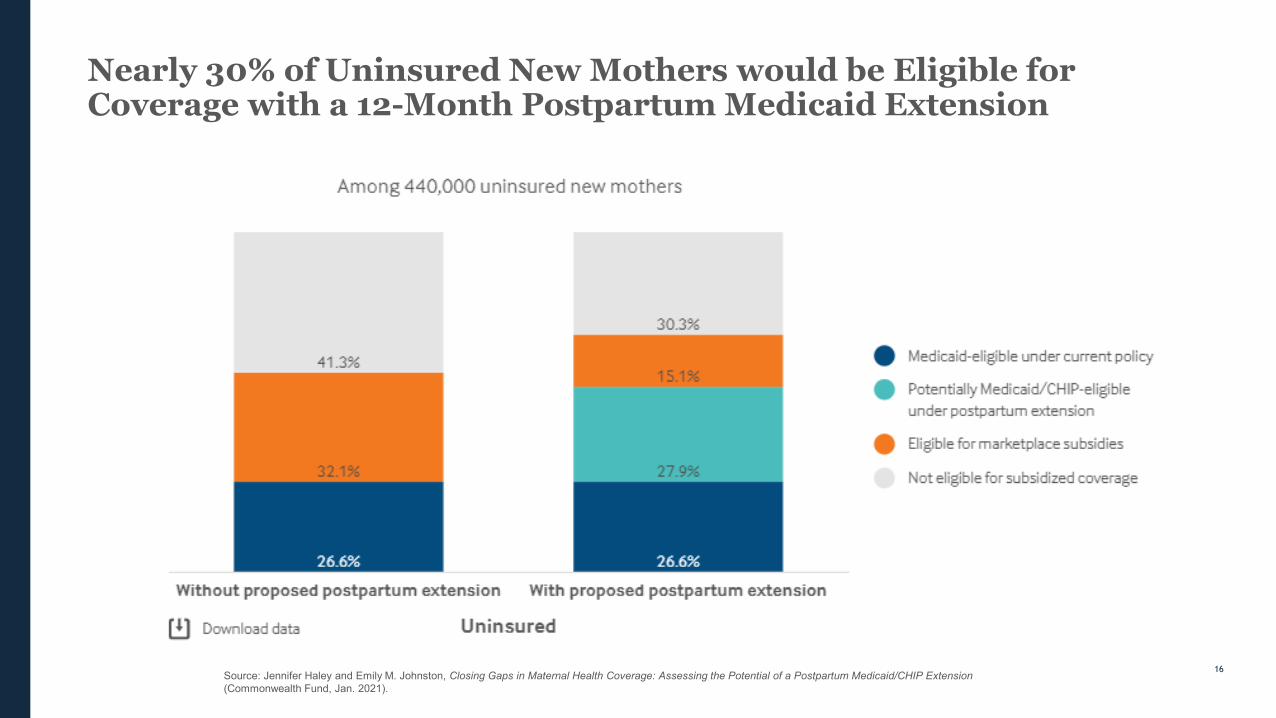
Nearly 30% of Uninsured New Mothers would be Eligible for Coverage with a 12-Month Postpartum Medicaid Extension
Source: Jennifer Haley and Emily M. Johnston, Closing Gaps in Maternal Health Coverage: Assessing the Potential of a Postpartum Medicaid/CHIP Extension(Commonwealth Fund, Jan. 2021).
17
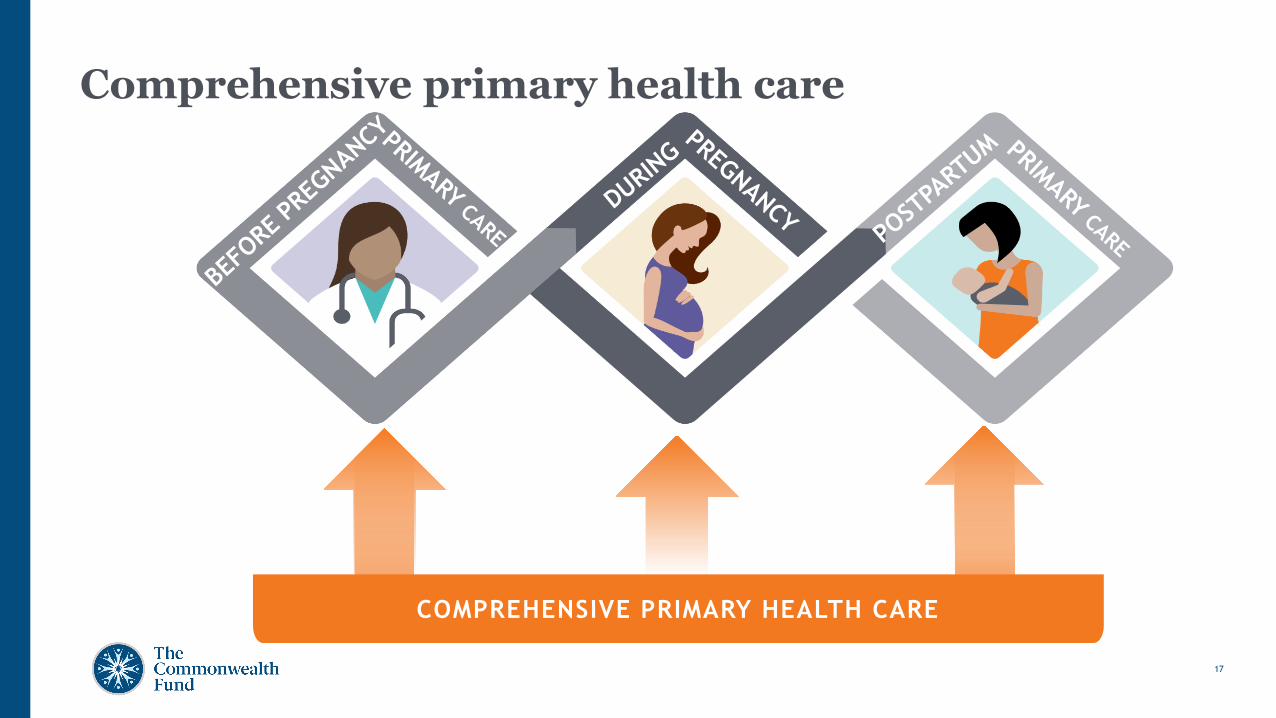
COMPREHENSIVE PRIMARY HEALTH CARE
Comprehensive primary health care
18
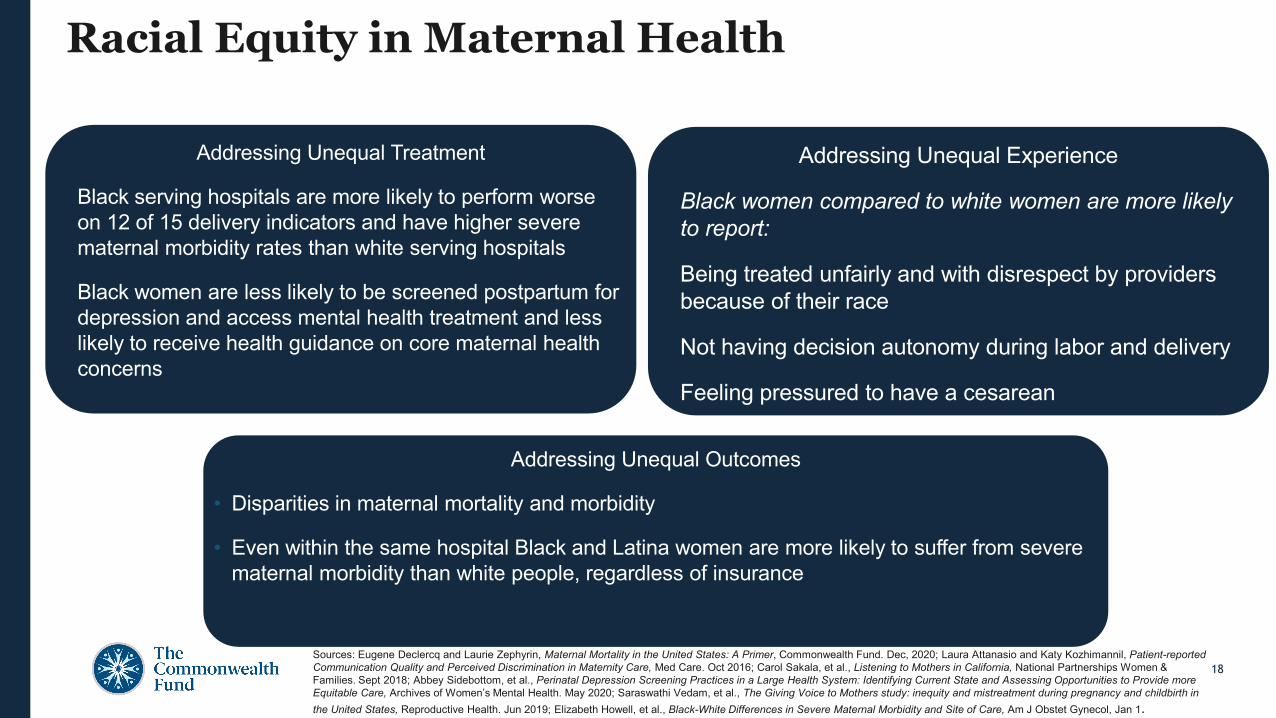
Racial Equity in Maternal Health
Addressing Unequal Treatment
• Black serving hospitals are more likely to perform worse on 12 of 15 delivery indicators and have higher severe maternal morbidity rates than white serving hospitals
• Black women are less likely to be screened postpartum for depression and access mental health treatment and less likely to receive health guidance on core maternal health concerns
Addressing Unequal Outcomes
• Disparities in maternal mortality and morbidity
• Even within the same hospital Black and Latina women are more likely to suffer from severe maternal morbidity than white people, regardless of insurance
Addressing Unequal Experience
• Black women compared to white women are more likely to report:
• Being treated unfairly and with disrespect by providers because of their race
• Not having decision autonomy during labor and delivery
• Feeling pressured to have a cesarean
Sources: Eugene Declercq and Laurie Zephyrin, Maternal Mortality in the United States: A Primer, Commonwealth Fund. Dec, 2020; Laura Attanasio and Katy Kozhimannil, Patient-reported Communication Quality and Perceived Discrimination in Maternity Care, Med Care. Oct 2016; Carol Sakala, et al., Listening to Mothers in California, National Partnerships Women & Families. Sept 2018; Abbey Sidebottom, et al., Perinatal Depression Screening Practices in a Large Health System: Identifying Current State and Assessing Opportunities to Provide more Equitable Care, Archives of Women’s Mental Health. May 2020; Saraswathi Vedam, et al., The Giving Voice to Mothers study: inequity and mistreatment during pregnancy and childbirth in the United States, Reproductive Health. Jun 2019; Elizabeth Howell, et al., Black-White Differences in Severe Maternal Morbidity and Site of Care, Am J Obstet Gynecol, Jan 1.

19

Source: Jesse Baumgartner et al., Inequities in Health and Health Care in Black and Latinx/Hispanic Communities: 23 Charts (Commonwealth Fund, June 2021).
73.7
78.6
All, 77.5
74.4
78.5 White, 77.8
68.1
74.9
Black, 72.8
80.3
81.8
Latinx/Hispanic, 78.8
1980 1990 2000 2010 2020
Notes: 1980–2017 data come from: United States Life Tables, National Vital Statistics Reports 68, no. 7 (June 24, 2019). Black and white data points before 2006 include Latinx/Hispanic people; starting in 2006, they represent non-Latinx/Hispanic Black and non-Latinx/Hispanic white. 2020 projections (dashed lines) appear in Andrafsay and Goldman (see below), representing the Institute for Health Metrics and Evaluation (IHME) current/medium projection (Oct. 2020).
Chart reproduced from: Theresa Andrasfay and Noreen Goldman, “Reductions in 2020 U.S. Life Expectancy Due to COVID-19 and the Disproportionate Impact on the Black and Latino Populations,” PNAS 118, no. 5 (Feb. 2021): e2014746118.
The gap in average life expectancy between Black and white adults has existed for generations, and COVID-19 erased recent progress.
Average life expectancy at birth (years), 1980–2020
21
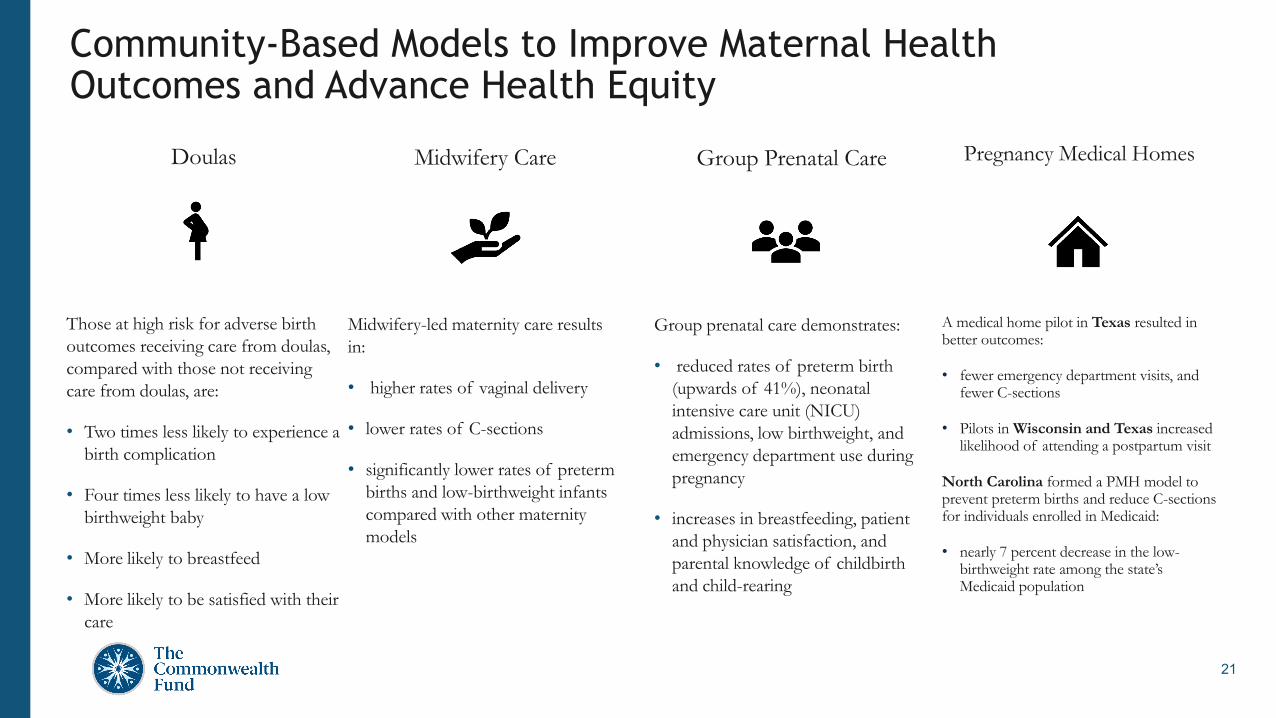
Group Prenatal Care
Group prenatal care demonstrates:
• reduced rates of preterm birth (upwards of 41%), neonatal intensive care unit (NICU) admissions, low birthweight, and emergency department use during pregnancy
• increases in breastfeeding, patient and physician satisfaction, and parental knowledge of childbirth and child-rearing
Doulas
Those at high risk for adverse birth outcomes receiving care from doulas, compared with those not receiving care from doulas, are:
• Two times less likely to experience a birth complication
• Four times less likely to have a low birthweight baby
• More likely to breastfeed
• More likely to be satisfied with their care
Community-Based Models to Improve Maternal Health Outcomes and Advance Health Equity
Midwifery Care
Midwifery-led maternity care results in:
• higher rates of vaginal delivery
• lower rates of C-sections
• significantly lower rates of preterm births and low-birthweight infants compared with other maternity models
Pregnancy Medical Homes
A medical home pilot in Texas resulted in better outcomes:
• fewer emergency department visits, and fewer C-sections
• Pilots in Wisconsin and Texas increased likelihood of attending a postpartum visit
North Carolina formed a PMH model to prevent preterm births and reduce C-sections for individuals enrolled in Medicaid:
• nearly 7 percent decrease in the low-birthweight rate among the state’s Medicaid population

22
COVID 19 Highlights the Need for High-Value Care
The same communities impacted by COVID19 are the same impacted by the crisis of maternal mortality and morbidity –making action more urgent.
Invest in a diverse perinatal workforce
Support and Strengthen Birthing Centers
Extend postpartum Medicaid coverage to 1
year
Thank You
Contact Dr. Laurie Zephyrin
Advancing Health Equity The Commonwealth Fund
[email protected] @LaurieZephyrin
Related Documents