RESEARCH ARTICLE Bumblebee flight performance in cluttered environments: effects of obstacle orientation, body size and acceleration James D. Crall 1, *, Sridhar Ravi 2 , Andrew M. Mountcastle 1 and Stacey A. Combes 1 ABSTRACT Locomotion through structurally complex environments is fundamental to the life history of most flying animals, and the costs associated with movement through clutter have important consequences for the ecology and evolution of volant taxa. However, few studies have directly investigated how flying animals navigate through cluttered environments, or examined which aspects of flight performance are most critical for this challenging task. Here, we examined how body size, acceleration and obstacle orientation affect the flight of bumblebees in an artificial, cluttered environment. Non-steady flight performance is often predicted to decrease with body size, as a result of a presumed reduction in acceleration capacity, but few empirical tests of this hypothesis have been performed in flying animals. We found that increased body size is associated with impaired flight performance (specifically transit time) in cluttered environments, but not with decreased peak accelerations. In addition, previous studies have shown that flying insects can produce higher accelerations along the lateral body axis, suggesting that if maneuvering is constrained by acceleration capacity, insects should perform better when maneuvering around objects laterally rather than vertically. Our data show that bumblebees do generate higher accelerations in the lateral direction, but we found no difference in their ability to pass through obstacle courses requiring lateral versus vertical maneuvering. In sum, our results suggest that acceleration capacity is not a primary determinant of flight performance in clutter, as is often assumed. Rather than being driven by the scaling of acceleration, we show that the reduced flight performance of larger bees in cluttered environments is driven by the allometry of both path sinuosity and mean flight speed. Specifically, differences in collision-avoidance behavior underlie much of the variation in flight performance across body size, with larger bees negotiating obstacles more cautiously. Thus, our results show that cluttered environments challenge the flight capacity of insects, but in surprising ways that emphasize the importance of behavioral and ecological context for understanding flight performance in complex environments. KEY WORDS: Insect flight, Collision avoidance, Bombus impatiens, Clutter, Environmental complexity, Locomotion INTRODUCTION Natural environments are highly variable over space and time, and this complexity has important consequences for animal locomotion (Combes and Dudley, 2009; Dickinson et al., 2000). The variable costs and constraints associated with locomotion in complex habitats affect broad ecological patterns of animal movement and habitat use (Combes and Dudley, 2009; Dickinson et al., 2000; Hadley and Betts, 2009; Shepard et al., 2013), as well as biotic interactions (Morice et al., 2013). Determining how environmental complexity affects and limits locomotion is thus key to understanding the ecology and evolution of animals whose fitness is tied to movement through natural environments. Flying insects must negotiate three-dimensional clutter consisting of biological features such as grass, shrubs and trees, as well as man-made structures such as buildings and cars. Successful navigation through cluttered environments results from a remarkable integration of sensory perception, control strategies, and physiological and morphological adaptations for producing aerodynamic forces and torques (Dudley, 2002b; Lin et al., 2014). The costs associated with moving through structurally complex environments may be particularly acute for flying animals, given the high metabolic costs of flight, particularly at low speeds (Dudley, 2002b). Historically, the ability to navigate through cluttered environments has been attributed to ‘maneuverability’, but the definition of this term is problematic. Interpretations can generally be divided into two broad categories: (1) narrower, physiological or mechanical definitions [e.g. minimum radius of curvature (Norberg and Rayner, 1987) or acceleration capacity (i.e. axial agility) (Buchwald and Dudley, 2010; Dillon and Dudley, 2004; Dudley, 2002a)] and (2) broader, integrative definitions [e.g. the ability to avoid collisions in cluttered environments (Stockwell, 2001; Swaddle and Witter, 1998) or the ability to evade a predator (Combes et al., 2012; Domenici, 2001)] that focus on successful performance of a complex task requiring turns and accelerations. Much of the previous quantitative work on maneuverability has focused on the narrower, physiological and mechanical concepts because these are easier to measure in the laboratory, and because integrative definitions of maneuverability are likely to be context specific (Dudley, 2002a); however, the connections between isolated maneuvers performed in the lab and complex tasks performed in natural environments are not always clear. For example, while both higher acceleration capacity and the ability to fly through cluttered environments are intuitively associated with maneuverability, it is not clear whether the former directly determines the latter. Despite a wealth of biomechanical and ecomorphological hypotheses, few studies exist that directly link biomechanical flight performance to navigation through clutter. For example, one common prediction is that higher maximum acceleration capacity (including both changes in velocity along a linear path and turning or radial accelerations) should allow for sharper turns and a lower minimum turning radius (Aldridge and Brigham, 1988; Andersson and Norberg, 1981; Thomas, 1996), thus improving biomechanical flight performance in cluttered environments (Norberg and Rayner, Received 17 February 2015; Accepted 30 June 2015 1 Concord Field Station, Department of Organismic and Evolutionary Biology, Harvard University, 100 Old Causeway Rd, Bedford, MA 01730, USA. 2 School of Aerospace Mechanical and Manufacturing Engineering, RMIT University, Melbourne, VIC 3001, Australia. *Author for correspondence ( [email protected]) 2728 © 2015. Published by The Company of Biologists Ltd | The Journal of Experimental Biology (2015) 218, 2728-2737 doi:10.1242/jeb.121293 The Journal of Experimental Biology

Welcome message from author
This document is posted to help you gain knowledge. Please leave a comment to let me know what you think about it! Share it to your friends and learn new things together.
Transcript
RESEARCH ARTICLE
Bumblebee flight performance in cluttered environments: effectsof obstacle orientation, body size and accelerationJames D. Crall1,*, Sridhar Ravi2, Andrew M. Mountcastle1 and Stacey A. Combes1
ABSTRACTLocomotion through structurally complex environments isfundamental to the life history of most flying animals, and the costsassociated with movement through clutter have importantconsequences for the ecology and evolution of volant taxa.However, few studies have directly investigated how flying animalsnavigate through cluttered environments, or examined which aspectsof flight performance are most critical for this challenging task. Here,we examined how body size, acceleration and obstacle orientationaffect the flight of bumblebees in an artificial, cluttered environment.Non-steady flight performance is often predicted to decrease withbody size, as a result of a presumed reduction in accelerationcapacity, but few empirical tests of this hypothesis have beenperformed in flying animals. We found that increased body size isassociated with impaired flight performance (specifically transit time)in cluttered environments, but not with decreased peak accelerations.In addition, previous studies have shown that flying insects canproduce higher accelerations along the lateral body axis, suggestingthat if maneuvering is constrained by acceleration capacity, insectsshould perform better when maneuvering around objects laterallyrather than vertically. Our data show that bumblebees do generatehigher accelerations in the lateral direction, but we found no differencein their ability to pass through obstacle courses requiring lateralversus vertical maneuvering. In sum, our results suggest thatacceleration capacity is not a primary determinant of flightperformance in clutter, as is often assumed. Rather than beingdriven by the scaling of acceleration, we show that the reduced flightperformance of larger bees in cluttered environments is driven by theallometry of both path sinuosity and mean flight speed. Specifically,differences in collision-avoidance behavior underlie much of thevariation in flight performance across body size, with larger beesnegotiating obstacles more cautiously. Thus, our results show thatcluttered environments challenge the flight capacity of insects, but insurprising ways that emphasize the importance of behavioral andecological context for understanding flight performance in complexenvironments.
KEY WORDS: Insect flight, Collision avoidance, Bombus impatiens,Clutter, Environmental complexity, Locomotion
INTRODUCTIONNatural environments are highly variable over space and time, andthis complexity has important consequences for animal locomotion
(Combes and Dudley, 2009; Dickinson et al., 2000). The variablecosts and constraints associated with locomotion in complexhabitats affect broad ecological patterns of animal movement andhabitat use (Combes and Dudley, 2009; Dickinson et al., 2000;Hadley and Betts, 2009; Shepard et al., 2013), as well as bioticinteractions (Morice et al., 2013). Determining how environmentalcomplexity affects and limits locomotion is thus key tounderstanding the ecology and evolution of animals whose fitnessis tied to movement through natural environments.
Flying insectsmust negotiate three-dimensional clutter consisting ofbiological features such as grass, shrubs and trees, aswell asman-madestructures such as buildings and cars. Successful navigation throughcluttered environments results froma remarkable integrationof sensoryperception, control strategies, and physiological and morphologicaladaptations for producing aerodynamic forces and torques (Dudley,2002b; Lin et al., 2014). The costs associated with moving throughstructurally complex environmentsmay be particularly acute for flyinganimals, given the high metabolic costs of flight, particularly at lowspeeds (Dudley, 2002b).
Historically, the ability to navigate through clutteredenvironments has been attributed to ‘maneuverability’, but thedefinition of this term is problematic. Interpretations can generallybe divided into two broad categories: (1) narrower, physiological ormechanical definitions [e.g. minimum radius of curvature (Norbergand Rayner, 1987) or acceleration capacity (i.e. axial agility)(Buchwald and Dudley, 2010; Dillon and Dudley, 2004; Dudley,2002a)] and (2) broader, integrative definitions [e.g. the ability toavoid collisions in cluttered environments (Stockwell, 2001;Swaddle and Witter, 1998) or the ability to evade a predator(Combes et al., 2012; Domenici, 2001)] that focus on successfulperformance of a complex task requiring turns and accelerations.
Much of the previous quantitative work on maneuverability hasfocused on the narrower, physiological and mechanical conceptsbecause these are easier to measure in the laboratory, and becauseintegrative definitions of maneuverability are likely to be contextspecific (Dudley, 2002a); however, the connections betweenisolated maneuvers performed in the lab and complex tasksperformed in natural environments are not always clear. Forexample, while both higher acceleration capacity and the ability tofly through cluttered environments are intuitively associated withmaneuverability, it is not clear whether the former directlydetermines the latter.
Despite a wealth of biomechanical and ecomorphologicalhypotheses, few studies exist that directly link biomechanicalflight performance to navigation through clutter. For example, onecommon prediction is that higher maximum acceleration capacity(including both changes in velocity along a linear path and turningor radial accelerations) should allow for sharper turns and a lowerminimum turning radius (Aldridge and Brigham, 1988; Anderssonand Norberg, 1981; Thomas, 1996), thus improving biomechanicalflight performance in cluttered environments (Norberg and Rayner,Received 17 February 2015; Accepted 30 June 2015
1Concord Field Station, Department of Organismic and Evolutionary Biology,Harvard University, 100 Old Causeway Rd, Bedford, MA 01730, USA. 2School ofAerospace Mechanical and Manufacturing Engineering, RMIT University,Melbourne, VIC 3001, Australia.
*Author for correspondence ( [email protected])
2728
© 2015. Published by The Company of Biologists Ltd | The Journal of Experimental Biology (2015) 218, 2728-2737 doi:10.1242/jeb.121293
TheJournal
ofEx
perim
entalB
iology
1987; Thomas and Balmford, 1995). This simple predictionassumes that animals flying through clutter regularly operate nearthe limits of their acceleration capacity, an assumption that remainsalmost entirely untested for most taxa. One goal of the current studywas therefore to provide direct, empirical data on flying bumblebeesthat reveal which aspects of biomechanical flight performance aremost relevant to the task of successfully navigating throughcomplex environments. We used the length of time required totraverse a cluttered environment (i.e. transit time) as our metric offlight performance. Because energy consumption is largelyindependent of flight speed in bumblebees (Dudley and Ellington,1990; Ellington et al., 1990), time spent in flight is closelycorrelated with total energy consumption, which is at the heart ofnearly all foraging decisions in bumblebees (Heinrich, 2004); thus,transit time is likely to be an ecologically relevant feature of flightperformance in natural environments.One salient component of environmental clutter is obstacle
orientation. Whereas obstacles in the natural world can occur in anyorientation, flying insects are unlikely to have equivalent capacitiesfor maneuvering in all directions. Rotational moments of inertiadiffer among the three body axes, and flapping wings play a largerrole in resisting rotations around some axes (e.g. flapping counter-torque; Hedrick et al., 2009). These differences are likely to affect aninsect’s ability to generate changes in body position or orientationalong various axes, as well as to resist changes imposed by externalperturbations. Recent work has shown that bumblebees flying inunsteady flow experience the greatest rotational instabilities aroundthe roll axis and the greatest translational instabilities in the lateraldirection, regardless of whether the oncoming flow disturbances areoriented vertically or horizontally (Ravi et al., 2013). Thisdirectional instability may arise from the body having a lowerrotational moment of inertia around the roll axis than around thepitch or yaw axes. At the same time, decreased inertia around the rollaxis could make it easier for bees to initiate voluntary rotationsaround the roll axis and to move laterally, suggesting that verticallyoriented obstacles (which require lateral maneuvers in order to avoidthem) may be easier for bees to negotiate than horizontal ones.Despite this potential anisotropy in maneuvering performance,previous studies have focused almost exclusively on lateralmaneuvering, in the context of both flight performance(Stockwell, 2001; Swaddle and Witter, 1998) and visualresponses to obstacles (Kern et al., 2012).
Body size is also hypothesized to affect flight performance inclutter, and this assertion is supported by at least one previous study,which showed that larger bats experience more collisions whenflying through an obstacle course (Stockwell, 2001). Mechanisticexplanations for the hypothesis that larger animals perform morepoorly in cluttered environments often invoke the predicteddecrease in mass-specific force production (and thus acceleration)with increased body size (Vogel, 1994). Maximum mass-specificforce production does decrease with body size in bees (Buchwaldand Dudley, 2010; Dillon and Dudley, 2004) (although perhaps notacross insects more broadly; see Marden, 1987), and there is someevidence that accelerations during free flight decrease with bodysize in midges (Crompton et al., 2003). Limits to accelerationcapacity may reduce an animal’s ability to rapidly change its speedand/or direction to avoid collisions, and may also impose limits onflight speed through cluttered environments, as increased speedalong a curved path requires higher radial acceleration. Therefore, ifbees do rely on maximum acceleration to maneuver throughcluttered environments, the predicted negative allometry ofacceleration capacity should restrict larger bees to moving moreslowly through these environments.
To examine the influence of body size and obstacle orientation onflight performance in cluttered environments, and to determinewhich aspects of performance are most critical for traversing theseenvironments, we filmed bumblebees (Bombus impatiens Cresson1863) flying through obstacle courses requiring either lateral orvertical maneuvers and reconstructed their three-dimensional flightpaths. We analyzed these flight paths to investigate (a) whetherflight performance through clutter is impaired in larger bees, (b)whether this effect is due to limitations on maximum acceleration,and (c) whether obstacle orientation affects flight performance incomplex environments.
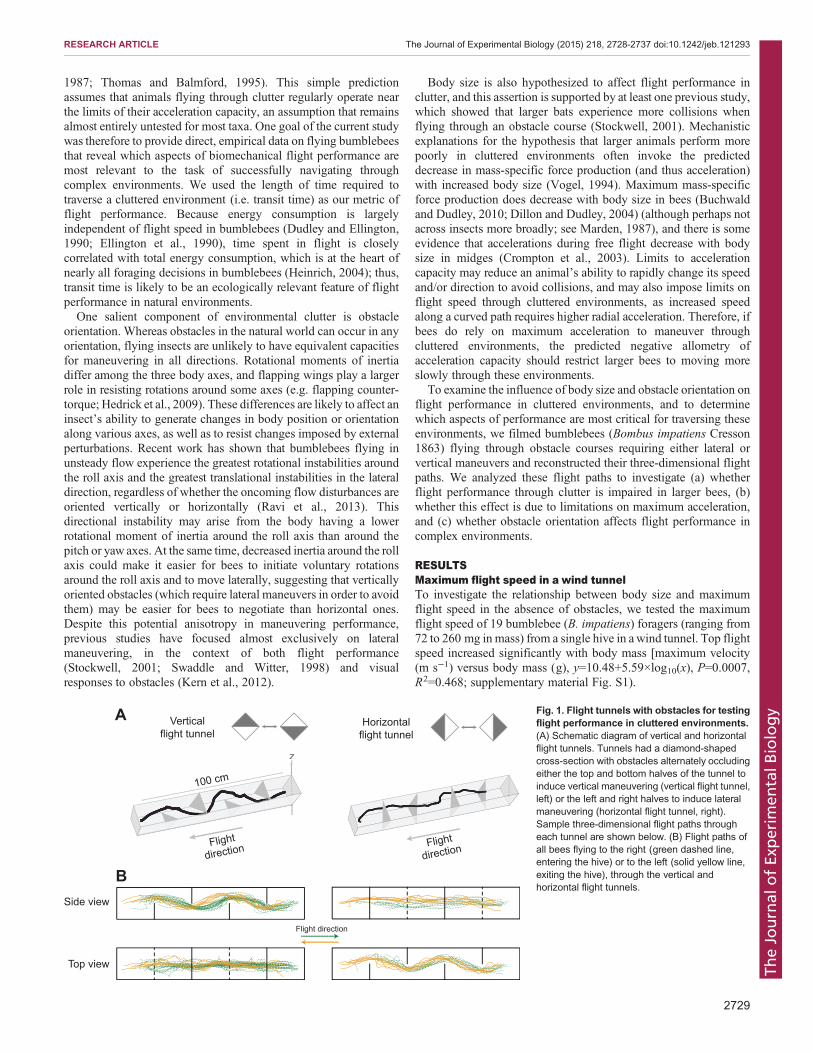
RESULTSMaximum flight speed in a wind tunnelTo investigate the relationship between body size and maximumflight speed in the absence of obstacles, we tested the maximumflight speed of 19 bumblebee (B. impatiens) foragers (ranging from72 to 260 mg in mass) from a single hive in awind tunnel. Top flightspeed increased significantly with body mass [maximum velocity(m s−1) versus body mass (g), y=10.48+5.59×log10(x), P=0.0007,R2=0.468; supplementary material Fig. S1).
Side view
Top view
Flight direction
100 cm
Verticalflight tunnel
Horizontalflight tunnel
100 cm
Flightdirection
z
A
B
Flightdirection
Fig. 1. Flight tunnels with obstacles for testingflight performance in cluttered environments.(A) Schematic diagram of vertical and horizontalflight tunnels. Tunnels had a diamond-shapedcross-section with obstacles alternately occludingeither the top and bottom halves of the tunnel toinduce vertical maneuvering (vertical flight tunnel,left) or the left and right halves to induce lateralmaneuvering (horizontal flight tunnel, right).Sample three-dimensional flight paths througheach tunnel are shown below. (B) Flight paths ofall bees flying to the right (green dashed line,entering the hive) or to the left (solid yellow line,exiting the hive), through the vertical andhorizontal flight tunnels.
2729
RESEARCH ARTICLE The Journal of Experimental Biology (2015) 218, 2728-2737 doi:10.1242/jeb.121293
TheJournal
ofEx
perim
entalB
iology
Flight performance in clutterTo investigate flight performance of bumblebees in clutteredenvironments, we recorded voluntary flight trajectories (N=56) ofindividual bumblebees either leaving or returning to the hivethrough one of two flight tunnels. One flight tunnel required thebees to maneuver vertically to avoid obstacles (referred to as the‘vertical’ flight tunnel, N=37), while the other required the bees tomaneuver laterally (the ‘horizontal’ flight tunnel, N=19; Fig. 1A).Bees followed a roughly sinusoidal path in the direction ofobstacle avoidance (i.e. maneuvering up/down in the vertical flighttunnel and left/right in the horizontal flight tunnel) whilemaintaining a relatively straight flight path along the other axis(Fig. 1B). Flight paths for bees entering and exiting the hive werequalitatively similar. Median axial velocity (i.e. flight speed alongthe major axis of the flight tunnel) across trials was 0.28±0.06 m s−1, in close agreement with (and not significantlydifferent from, t=−1.75, d.f.= 55, P=0.09) previously reportedbumblebee flight speeds of 0.29±0.05 m s−1 in an obstacle-freeflight tunnel with similar dimensions and strong optic flow (Bairdet al., 2010).In both obstacle courses, bees reduced axial velocity before
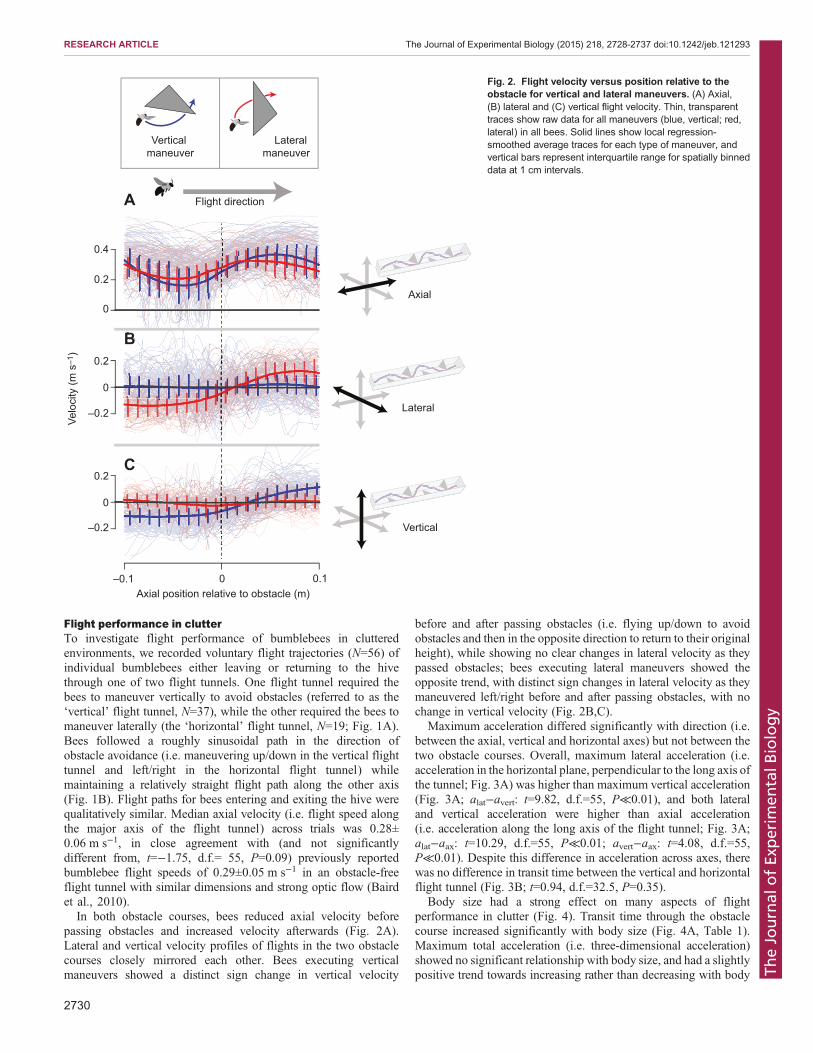
passing obstacles and increased velocity afterwards (Fig. 2A).Lateral and vertical velocity profiles of flights in the two obstaclecourses closely mirrored each other. Bees executing verticalmaneuvers showed a distinct sign change in vertical velocity
before and after passing obstacles (i.e. flying up/down to avoidobstacles and then in the opposite direction to return to their originalheight), while showing no clear changes in lateral velocity as theypassed obstacles; bees executing lateral maneuvers showed theopposite trend, with distinct sign changes in lateral velocity as theymaneuvered left/right before and after passing obstacles, with nochange in vertical velocity (Fig. 2B,C).
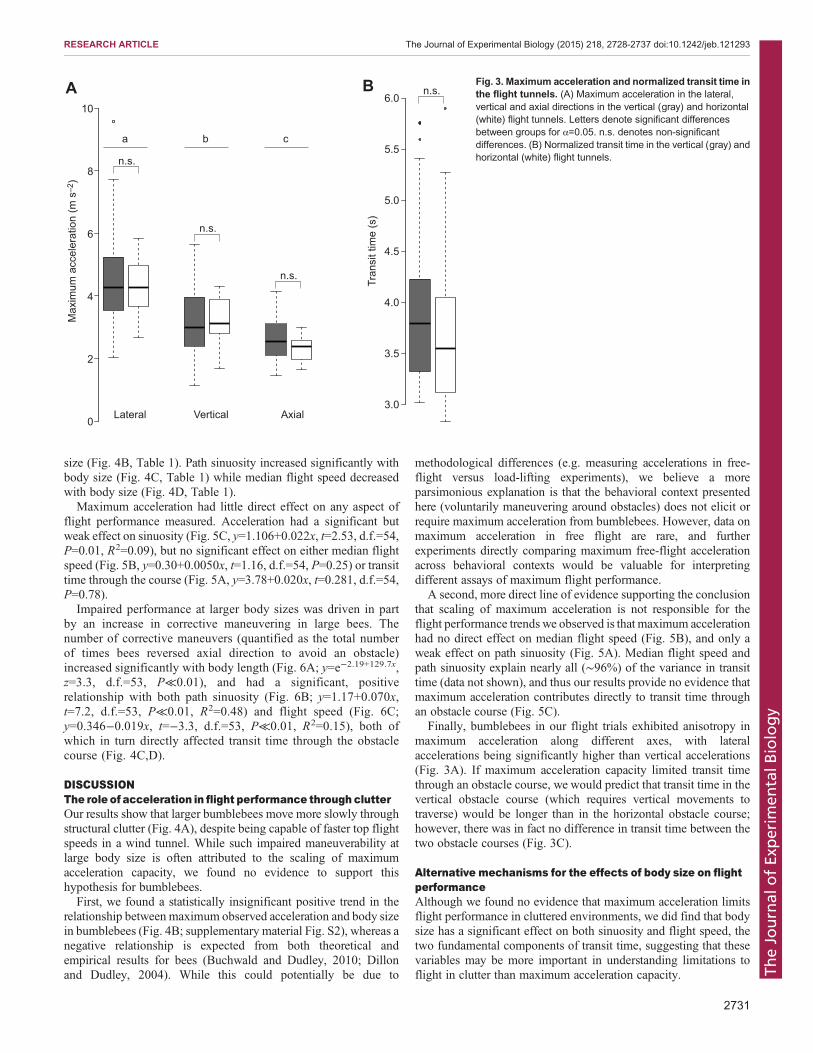
Maximum acceleration differed significantly with direction (i.e.between the axial, vertical and horizontal axes) but not between thetwo obstacle courses. Overall, maximum lateral acceleration (i.e.acceleration in the horizontal plane, perpendicular to the long axis ofthe tunnel; Fig. 3A) was higher than maximum vertical acceleration(Fig. 3A; alat−avert: t=9.82, d.f.=55, P≪0.01), and both lateraland vertical acceleration were higher than axial acceleration(i.e. acceleration along the long axis of the flight tunnel; Fig. 3A;alat−aax: t=10.29, d.f.=55, P≪0.01; avert−aax: t=4.08, d.f.=55,P≪0.01). Despite this difference in acceleration across axes, therewas no difference in transit time between the vertical and horizontalflight tunnel (Fig. 3B; t=0.94, d.f.=32.5, P=0.35).
Body size had a strong effect on many aspects of flightperformance in clutter (Fig. 4). Transit time through the obstaclecourse increased significantly with body size (Fig. 4A, Table 1).Maximum total acceleration (i.e. three-dimensional acceleration)showed no significant relationship with body size, and had a slightlypositive trend towards increasing rather than decreasing with body
Velo
city
(m s
–1)
Lateral
Vertical
Axial
0.4
–0.2
0
0
0.2
0.2
–0.2
0
0.2
Axial position relative to obstacle (m)0–0.1 0.1
Vertical maneuver
Lateral maneuver
Flight directionA
B
C
Fig. 2. Flight velocity versus position relative to theobstacle for vertical and lateral maneuvers. (A) Axial,(B) lateral and (C) vertical flight velocity. Thin, transparenttraces show raw data for all maneuvers (blue, vertical; red,lateral) in all bees. Solid lines show local regression-smoothed average traces for each type of maneuver, andvertical bars represent interquartile range for spatially binneddata at 1 cm intervals.
2730
RESEARCH ARTICLE The Journal of Experimental Biology (2015) 218, 2728-2737 doi:10.1242/jeb.121293
TheJournal
ofEx
perim
entalB
iology
size (Fig. 4B, Table 1). Path sinuosity increased significantly withbody size (Fig. 4C, Table 1) while median flight speed decreasedwith body size (Fig. 4D, Table 1).Maximum acceleration had little direct effect on any aspect of
flight performance measured. Acceleration had a significant butweak effect on sinuosity (Fig. 5C, y=1.106+0.022x, t=2.53, d.f.=54,P=0.01, R2=0.09), but no significant effect on either median flightspeed (Fig. 5B, y=0.30+0.0050x, t=1.16, d.f.=54, P=0.25) or transittime through the course (Fig. 5A, y=3.78+0.020x, t=0.281, d.f.=54,P=0.78).Impaired performance at larger body sizes was driven in part
by an increase in corrective maneuvering in large bees. Thenumber of corrective maneuvers (quantified as the total numberof times bees reversed axial direction to avoid an obstacle)increased significantly with body length (Fig. 6A; y=e−2.19+129.7x,z=3.3, d.f.=53, P≪0.01), and had a significant, positiverelationship with both path sinuosity (Fig. 6B; y=1.17+0.070x,t=7.2, d.f.=53, P≪0.01, R2=0.48) and flight speed (Fig. 6C;y=0.346−0.019x, t=−3.3, d.f.=53, P≪0.01, R2=0.15), both ofwhich in turn directly affected transit time through the obstaclecourse (Fig. 4C,D).
DISCUSSIONThe role of acceleration in flight performance through clutterOur results show that larger bumblebees move more slowly throughstructural clutter (Fig. 4A), despite being capable of faster top flightspeeds in a wind tunnel. While such impaired maneuverability atlarge body size is often attributed to the scaling of maximumacceleration capacity, we found no evidence to support thishypothesis for bumblebees.First, we found a statistically insignificant positive trend in the
relationship between maximum observed acceleration and body sizein bumblebees (Fig. 4B; supplementary material Fig. S2), whereas anegative relationship is expected from both theoretical andempirical results for bees (Buchwald and Dudley, 2010; Dillonand Dudley, 2004). While this could potentially be due to
methodological differences (e.g. measuring accelerations in free-flight versus load-lifting experiments), we believe a moreparsimonious explanation is that the behavioral context presentedhere (voluntarily maneuvering around obstacles) does not elicit orrequire maximum acceleration from bumblebees. However, data onmaximum acceleration in free flight are rare, and furtherexperiments directly comparing maximum free-flight accelerationacross behavioral contexts would be valuable for interpretingdifferent assays of maximum flight performance.
A second, more direct line of evidence supporting the conclusionthat scaling of maximum acceleration is not responsible for theflight performance trends we observed is that maximum accelerationhad no direct effect on median flight speed (Fig. 5B), and only aweak effect on path sinuosity (Fig. 5A). Median flight speed andpath sinuosity explain nearly all (∼96%) of the variance in transittime (data not shown), and thus our results provide no evidence thatmaximum acceleration contributes directly to transit time throughan obstacle course (Fig. 5C).
Finally, bumblebees in our flight trials exhibited anisotropy inmaximum acceleration along different axes, with lateralaccelerations being significantly higher than vertical accelerations(Fig. 3A). If maximum acceleration capacity limited transit timethrough an obstacle course, we would predict that transit time in thevertical obstacle course (which requires vertical movements totraverse) would be longer than in the horizontal obstacle course;however, there was in fact no difference in transit time between thetwo obstacle courses (Fig. 3C).
Alternative mechanisms for the effects of body size on flightperformanceAlthough we found no evidence that maximum acceleration limitsflight performance in cluttered environments, we did find that bodysize has a significant effect on both sinuosity and flight speed, thetwo fundamental components of transit time, suggesting that thesevariables may be more important in understanding limitations toflight in clutter than maximum acceleration capacity.
Max
imum
acc
eler
atio
n (m
s–2
)
0
2
4
6
8
10
Lateral Vertical Axial
Tran
sit t
ime
(s)
3.0
3.5
4.0
4.5
5.0
5.5
6.0A B
a
n.s.
b c
n.s.
n.s.
n.s.
Fig. 3. Maximum acceleration and normalized transit time inthe flight tunnels. (A) Maximum acceleration in the lateral,vertical and axial directions in the vertical (gray) and horizontal(white) flight tunnels. Letters denote significant differencesbetween groups for α=0.05. n.s. denotes non-significantdifferences. (B) Normalized transit time in the vertical (gray) andhorizontal (white) flight tunnels.
2731
RESEARCH ARTICLE The Journal of Experimental Biology (2015) 218, 2728-2737 doi:10.1242/jeb.121293
TheJournal
ofEx
perim
entalB
iology

Corrective maneuvers and flight performance in clutterOne important proximate factor in determining both path sinuosityand median flight speed was the number of corrective maneuversperformed by bees during flight trials. We found that performingmore corrective maneuvers significantly increased path sinuosityand decreased median flight speed (Fig. 6B,C), and that the numberof corrective maneuvers increased significantly with body size(Fig. 6A). These corrective maneuvers appear to be distinct fromsaccades or intermittent turns characteristic of flight in flies(Tammero and Dickinson, 2002) and bees (Boeddeker et al.,2010), as they were not distributed continuously throughout flights;corrective maneuvers were instead concentrated at times just before
the bees passed obstacles (visible as traces that drop below the x-axisin Fig. 2A), and thus appear to be a form of collision avoidancebehavior. The reason that corrective maneuvers affect path sinuosityseems clear, as such maneuvers necessarily increase the path lengthof flights. The relationship between corrective maneuvers andmedian speed is somewhat less clear, but is most likely driven by thereduction in velocity associated with the direction reversals thatwere performed as bees approached obstacles (Fig. 2).
Why do larger bees reverse direction to avoid obstaclesmore oftenthan smaller bees? Potential explanations include allometric scalingof the visual system among bumblebees (see below), as well as thepossibility that the extended body dimensions of larger bees increasethe risk of collision. If collisions aremore likely to occur in large beesas a result of their body dimensions and bees respond to impendingcollisions with corrective maneuvers (which appears to be true;Fig. 2A), then this could explain the greater number of correctivemaneuvers in larger bees. This hypothesis raises intriguing questionsabout how individual-level flight characteristics are tuned in bees.For example, do large and small bees have innate differences incollision avoidance behavior, or are these differences learned?Future studies addressing the role of learning and other factors
Tran
sit t
ime
(s)
3
4
5
6
Max
imum
acc
eler
atio
n(m
s–2
)
4
6
8
1012
Sin
uosi
ty
1.2
1.4
1.6
Body length (mm)
Flig
ht s
peed
(m s
–1)
12 16 20 24
0.2
0.3
0.4
A
B
C
D
Fig. 4. Effect of body size on flight performance across trials in the flighttunnels. Log-transformed (A) transit time, (B) maximum acceleration,(C) sinuosity and (D) flight speed data versus body length for the verticalflight tunnel (filled circles) and horizontal flight tunnel (open diamonds). Redlines show results of ordinary least squares (solid) and major axis (dashed)regression for variables where body length has a significant effect at theα=0.05 level (Table 1).
Sin
uosi
ty1.2
1.4
1.6
Maximum acceleration (m s–2)
Tran
sit t
ime
(s)
4 6 8 10 12
3
4
5
6
Flig
ht s
peed
(m s
–1)
0.2
0.3
0.4
A
B
C
Fig. 5. Effect of maximum acceleration on flight performance acrosstrials in the flight tunnels. (A) Transit time, (B) flight speed and (C) sinuositydata are shown versusmaximum acceleration for the vertical flight tunnel (filledcircles) and horizontal flight tunnel (open diamonds). Red lines show results ofordinary least squares regression for variables where maximum accelerationhas a significant effect at the α=0.05 level.
2732
RESEARCH ARTICLE The Journal of Experimental Biology (2015) 218, 2728-2737 doi:10.1242/jeb.121293
TheJournal
ofEx
perim
entalB
iology

contributing to the flight path characteristics of individual beesflying through complex environments will be of particular interest inparsing these intriguing hypotheses.
Additional drivers of sinuosity and flight speedCorrective maneuvers explain some, but not all, of the effect of bodysize on flight performance; the number of corrective maneuvers canaccount for approximately 67% of the variation in sinuosity and45% of the variation in flight speed (see Materials and methods,‘Are corrective maneuvers sufficient to explain variation in speed
and sinuosity?’). Some of the additional variation in path sinuositywith body size could result from simple geometry: larger bees haveto leave more space between their body centroid and nearbyobstacles to avoid collisions, and this necessarily results in longer,more sinuous flight paths. Assuming geometric similarity in flightpaths, minimum path length through the obstacle course should beapproximately 12% higher in a 24 mm bee versus a 12 mm one(assuming a clearance radius equal to half body length), perhapshelping to explain some of the residual variation in sinuosity.
The variation in flight speed across bees is somewhat less wellexplained by the number of course corrections, implying that otherimportant factors contribute to the relationship between body sizeand flight speed. One known driver of free-flight speed in insects iscage size; in hawkmoths (Manduca sexta), smaller cages result inlower flight speeds, particularly near walls (Stevenson et al., 1995).If bumblebees react similarly to cages, and if the effects of cage sizeare relative to body length rather than being a function of absolutedistance, then the same obstacle course may induce slower flight inlarger bees than in smaller ones.
The mechanism that would drive such a body size-specificresponse to similar obstacle spacing is not clear, but it could berelated to the processing of optic flow (i.e. the pattern of imagemotion across the eye), which many insects use to regulate flightspeed. When enclosure size decreases, the rate of optic flowincreases as a result of the increased proximity of enclosure surfacesand edges. Hawkmoths likely decrease flight speed in smallenclosures in response to the increased optic flow rate near surfaces.Honeybees (Srinivasanet al., 1996) and bumblebees (Baird et al.,2010) similarly reduce flight speed in narrower tunnels in responseto increased optic flow rate. The allometric scaling of the visualsystem in bumblebees could also contribute to this effect. Visualacuity (measured as the inverse of ommatidial acceptance angle) andthe number of ommatidia per eye both increase with body size inbumblebees (Spaethe, 2003), and these factors could potentiallyaffect the sensing of optic flow rate.
Regardless of the mechanisms involved, one of the ultimatereasons for reducing flight speed with body size in clutteredenvironments could be the scaling of material stresses (and theassociated structural damage) during collisions with obstacles. Inparticular, material stress (τ) is defined as τ=F/A, where F is forceand A is area. Assuming constant velocity and impact time, the forceduring a collision with an immovable object will be proportional tomass, and area will be proportional to surface area. As the ratio ofvolume (i.e. mass) to surface area increases with body size, thisimplies that material stresses (and thus potential damage) increasewith body size. The scaling of material stress plays an important rolein the allometry of body design and posture in mammals (Biewener,1990), and may play an important role in the allometry of collisionsduring terrestrial locomotion in insects (Jayaram and Full, 2015).Thus, reducing flight velocity could be a strategy for reducingmomentum and the potential damage that would result from
Sin
uosi
ty
1.1
1.3
1.5
Body length (mm)
No.
of c
orre
ctiv
e m
aneu
vers
No. of corrective maneuvers
Flig
ht s
peed
(m s
–1)
0 1 2 3 40.20
0.30
0.40
12 16 20 24
0
1
2
3
4
B
C
A
Fig. 6. Body length, sinuosity and flight speed versus number ofcorrective maneuvers. (A) Number of corrective maneuvers versus bodylength across all trials for the vertical flight tunnel (filled circles) and horizontalflight tunnel (open diamonds). Solid red line shows the predicted values ±1 s.d.(dashed lines) from a generalized model. (B) Sinuosity and (C) flight speedversus the number of corrective maneuvers across trials. Solid red linesrepresent the results of ordinary least squares regression for variables wherethe number of corrective maneuvers has a significant effect at the α=0.05 level.
Table 1. Results from ordinary least squares and major axis regression of four flight metrics against body size
OLS MA
Variable (y) P R2 Slope Intercept Slope Intercept
Transit time (s) ≪0.01 0.26 0.53 1.55 1.10 2.58Max. acceleration (m s−2) 0.10 0.03 0.24 1.17 4.22 8.4Sinuosity ≪0.01 0.30 0.24 0.52 0.28 0.59Median flight speed (m s−1) ≪0.01 0.20 −0.38 −1.19 −0.72 −1.80
OLS, ordinary least squares; MA, major axis.All equations are of the form log10(y)=intercept+slope×log10(body length), where body length is in m.
2733
RESEARCH ARTICLE The Journal of Experimental Biology (2015) 218, 2728-2737 doi:10.1242/jeb.121293
TheJournal
ofEx
perim
entalB
iology
collisions in larger bees. The need to mitigate damage resulting fromcollisions has clearly played an important role in shaping insectwing morphology (Foster and Cartar, 2011; Mountcastle andCombes, 2014), but few data exist to directly address the hypothesisthat collision damage scales allometrically in insects.
Anisotropy of acceleration performanceOur finding that maximum accelerations are larger along the lateralaxis is in accordance with previous findings that bumblebees flyingthrough unsteady flow display the greatest accelerations in thelateral direction (Ravi et al., 2013). While in the previous study itwas difficult to distinguish the effects of flow perturbations fromvoluntary flight maneuvers, the accelerations observed in the currentstudy were clearly voluntary. Whether these results reflect afundamental mechanical limitation on accelerations produced alongthe vertical and longitudinal axes, or whether there is an alternativeexplanation (such as behavioral disposition to lateral movements)remains unclear. Roll-based, lateral maneuvers are also dominant inhoneybee flight (Boeddeker et al., 2010), so this may be a generalfeature of hymenopteran flight, or of insect flight more broadly;however, comparative data on movement along various axes duringfree flight in a wide range of insects is necessary to determine thegenerality of these results.
ConclusionsOur results show that maximum acceleration capacity is not the mostimportant driver of flight performance in cluttered environments.Rather, flight speed and path length seem to be more critical indetermining how quickly bees can negotiate complex environments.Both of these components may be strongly affected by learning, andone important limitation to the current study is that individualexperience was not controlled, nor were individuals tracked overrepeated trials to determine whether their performance changed withexperience. While we do not believe that experience is likely toconfound our results concerning body size, as the average size ofbumblebee workers typically does not change over time (Couvillonet al., 2010) (so bees of different sizes should not differ systematicallyin age and experience level), this study cannot directly address theimportance of learning for flight performance in clutteredenvironments. However, previous work clearly shows that on alarger spatial scale, bumblebees optimize flight routes (Lihoreau et al.,2012) and increase flight speed (Ohashi et al., 2008) with experience.Likewise, age may have important effects on flight performance(Vance et al., 2009), either through physiological changes or throughthe accumulation of morphological damage (Cartar, 1992). Futurework addressing the role of behavioral context, learning and pathoptimization within individuals across time will be particularlyimportant for understanding how flying insects negotiate complexnatural environments.Another limitation of not tracking individual bees is that single
bees could be represented multiple times in the dataset, potentiallyresulting in pseudoreplication of the data. While we do not believethat pseudoreplication plays a significant role in our dataset, becausewe recorded trials from only a small fraction of the total foragingtrips from the hive per day (∼20 trials recorded per day out of severalhundred foraging trips), our methodology cannot directly addressthe importance of this effect.We also performed the current work with a single colony of
B. impatiens, and social insects can display marked behavioraldifferences between colonies (LeBoeuf and Grozinger, 2014;Pinter-Wollman, 2012; Maebe et al., 2013). There has been noprevious work to our knowledge exploring colony-level variation in
flight performance, and our single-hive experimental design did notallow us to test for colony-level effects. Investigating colony-leveldifferences in flight performance is an important future direction forstudies of the biomechanics and behavioral responses of bees flyingin complex environments.
Regardless of the mechanisms driving the effect of body sizeon flight performance, our results support the hypothesis thatconfined environments reduce flight speed compared with openenvironments, thereby increasing flight energy cost for bumblebees.This cost appears to be higher for larger bees; our wind tunnel testsdemonstrate that larger individuals are capable of faster forwardflight (and thus lower cost of transport, or energy required to move agiven distance), but they are restricted to operating at flight speedslower than those of small individuals when flying in clutter(Fig. 4D). This finding suggests an intriguing way in which therelationship between body size and flight speed may be affected byobstacle spacing in natural environments. At high spatial frequency(i.e. with small distances between obstacles), small bees can movethrough the environment more rapidly than large ones, while at verylow spatial frequency (i.e. functionally open environments), largebees likely move faster. This implies that at some intermediatespatial frequency, there should be no effect of body size on flightperformance. Future work investigating how the spatial frequencyof obstacles affects the relationship between body size and flightperformance, and exploring the variation in spatial frequenciesfound in natural environments would be particularly interesting.
The tradeoff we have demonstrated between flight performancein cluttered versus open environments also has importantimplications for the evolution of body size in insects, and inbumblebees in particular, as workers from the same hive can vary byup to an order of magnitude in size (Goulson, 2003). Largebumblebee workers outperform small workers in nearly every taskmeasured to date (Cnaani and Hefetz, 1994; Goulson et al., 2002;Kapustjanskij et al., 2007; although see Couvillon and Dornhaus,2010), but spatially complex environments may provide animportant context where small body size is favored (Foster andCartar, 2011). Future work investigating whether the differences intransit time observed here translate to differential resourceacquisition rates in cluttered environments would be of particularinterest in understanding the ecological implications of our findings.
MATERIALS AND METHODSMaximum flight speed in a wind tunnelA captive, mature colony of B. impatiens (BioBest) was given unlimitedaccess to nectar and pollen in a foraging chamber. Individual foragers wereremoved from the chamber, weighed and introduced into the workingsection (90×45×45 cm) of a wind tunnel. Wind speed was set at 2 m s−1
until bees initiated upwind flight, then raised incrementally after 8 s ofsustained flight at each speed until the bee was unable to maintain forwardflight. Wind speed was then reduced until bees resumed flight. Thisprocedure was repeated two more times to collect three total estimates oftop flight speed, the highest of which was recorded as maximum flightspeed.
An important limitation of this wind tunnel assay, which is inherent tomost lab-based locomotory studies, is that lab-based assays of flightperformance may not always be reflective of performance in naturalenvironments (Combes et al., 2012; Riley et al., 1999). Our wind tunneldiffers from natural environments in important ways. First, the arena throughwhich insects fly is greatly reduced. Second, in our arena, bees receive littleto no optic flow despite flying at high speeds. While this situation has apotential natural analog (i.e. a bee flying into a strong headwind with a highwind speed but low or zero ground speed; see Riley et al., 1999 for adiscussion of bumblebee flight in crosswinds), it is nonetheless important tonote that top flight speeds in a wind tunnel may not accurately reflect top
2734
RESEARCH ARTICLE The Journal of Experimental Biology (2015) 218, 2728-2737 doi:10.1242/jeb.121293
TheJournal
ofEx
perim
entalB
iology

flight speeds in natural environments. While we do not believe this willchange the overall direction of the allometry of top flight speed (as largerbees are more likely to be impaired by the size constraints of the tunnel thansmall bees), laboratory assays of flight performance often underestimate trueflight capacity (Combes et al., 2012; Riley et al., 1999); thus, we consider itlikely that bumblebees flying in open, natural environments are capable offaster top flight speeds than those reported here.
Flight performance in clutterTwo flight tunnels (13×13×100 cm) were connected at one end to a foragingchamber containing a single mature, captive colony of B. impatiens and atthe other end to openings allowing access to the outdoor environment. Thecolony was provided with nectar but not pollen in the hive, motivatingforagers to exit and enter the hive through the flight tunnels to gather pollen.Each flight tunnel was diamond-shaped in cross-section and contained fourtriangular obstacles; the obstacles blocked half the cross-sectional area of thetunnel and were evenly spaced 20 cm apart in alternating orientations(Fig. 1), forcing bees to maneuver around the obstacles. In the ‘vertical’flight tunnel, alternating triangles blocked the upper and lower halves of thetunnel, forcing bees to maneuver up and down. In the ‘horizontal’ tunnel,triangles blocked the left and right sides of the tunnel, forcing bees tomaneuver side-to-side (Fig. 1).
The bottom two surfaces of the flight tunnels were covered with a blackand white textured floral pattern that provided strong optic flow, while theupper two surfaces of the tunnels were left open to allow for filming anddigitization. Obstacles were covered in tan paper that allowed them to bedistinguished from the background, but did not obstruct visualization anddigitization. The hive and flight tunnels were located in a temperature-controlled room maintained at 22°C and were surrounded on three sides bywindows that provided natural lighting. The clear tunnel walls allowed beesat least a partial view of objects within the naturalistic arena of the roomwhere experiments were conducted. All trials were collected between 3 and6 June 2013 between 10:00 h and 18:00 h, a period during whichbumblebees typically forage. Any flight sequences where bees did notmake clear progress through the flight tunnels or where they collided withthe external walls of the tunnel were excluded from the analysis.
Three-dimensional flight paths were recorded at 125 frames s−1 using twocalibrated and synchronized Photron SA3 video cameras positionedapproximately 1.5 m lateral to and 0.5 m above the two tunnels, with anangle of approximately 60 deg between them. Body centroids were digitizedusing DLTdv5 (Hedrick, 2008) and position traces were filtered (10 Hz low-pass, fifth order Butterworth) in Matlab. Body length was measured fromeach video sequence by digitizing the position of the head and tip of theabdomen, and measuring the three-dimensional distance between thesepoints. These measurements were performed in three frames from differentsegments of the same video, to account for any potential effects of posture,and the mean of these three measurements was used as an estimate of bodylength. Average pair-wise correlations between the three independentmeasurements of body length for each bee were high (mean r=0.92),indicating that this is a reliable estimate of body length. Body length and wetbody mass were also found to be highly correlated in a random sample of 20B. impatiens workers from a separate BioBest hive (Pearson correlationcoefficient=0.95, supplementary material Fig. S3), as is common in manyinsects (Rogers et al., 1977).
To investigate characteristic velocity profiles of bees maneuvering aroundobstacles, we separated each trial into spatially discrete turning maneuvers,each spanning from 10 cm before to 10 cm after one of the four obstacles inthe axial direction (Fig. 2). These maneuvers were composed of fourdifferent types: two types of lateral maneuvers (maneuvering either to theleft or to the right of an obstacle) and two types of vertical maneuvers(maneuvering either over or under an obstacle). Because of qualitativesimilarity (see supplementary material Fig. S4), maneuvers to the right of anobstacle were reflected across the x–z plane and pooled with maneuvers tothe left of an obstacle. Similarly, maneuvers over an obstacle were reflectedacross the x–y plane and combined with maneuvers under an obstacle. Wealso pooled maneuvers from different parts of the obstacle courses (i.e. thefirst versus the last obstacle encountered) because there were no clearqualitative differences between these (see supplementary material Fig. S5).
Through this process, all maneuvers performed by bees traversing the twoobstacle courses were condensed down to two basic types: a lateralmaneuver or a vertical maneuver. Trends in axial, lateral and verticalvelocity during these manuevers were characterized using local regressionsmoothing and spatial binning of instantaneous velocity values (Fig. 2).
Transit timewas calculated as the total number of digitized frames dividedby the frame rate, normalized by the proportion of the obstacle coursetraversed during the sequence (i.e. linear distance traveled along the longaxis of the tunnel divided by total tunnel length). Path sinuosity wascalculated as the total path length (i.e. the sum of instantaneousdisplacements along the entire flight trajectory) divided by lineardisplacement, or the three-dimensional distance between the start and endpoints of the flight path. Instantaneous flight speeds were calculated asinstantaneous displacement divided by frame length (0.008 s), and medianspeed along the flight path was determined for each trial.
Instantaneous accelerations were calculated along three axes in a globalframe of reference, with the axial axis parallel to the long axis of the flighttunnel, the lateral axis perpendicular to the tunnel axis in the horizontalplane, and the vertical axis oriented in the direction of gravity. Accelerationsmeasured along these global axes are not necessarily correlated withaccelerations produced in the bee’s frame of reference, as the bee’slongitudinal body axis can rotate (e.g. yaw) relative to the longitudinal axisof the flight tunnel. In our experiments, however, bumblebees appeared tomaintain a forward-facing body orientation (in line with the longitudinalaxis of the tunnel) nearly continuously throughout all flights; this isconsistent with the largely roll-based, lateral maneuvering that bumblebeesperform when flying towards a target in oncoming flow (Ravi et al., 2013),as well as with landmark-oriented flights in honeybees (Boeddeker andHemmi, 2010). Under these conditions, global accelerations are highlycorrelated with accelerations in the bee’s frame of reference, and thus weconsider global accelerations to be reliable estimates of accelerationsproduced in the local body frame.
Instantaneous total acceleration was calculated at each time step fromacceleration vectors in the three global axes by applying the Pythagoreantheorem in three dimensions. The resulting total accelerationencompasses both tangential acceleration (i.e. change in speed along alinear trajectory) and radial acceleration (i.e. acceleration perpendicular tothe flight trajectory associated with turning). We estimated maximumacceleration during each trial as the 95th percentile of instantaneousaccelerations throughout the sequence. This metric provides aconservative estimate of maximum acceleration, which minimizes theeffects of noise introduced by digitizing and differentiation; two lessconservative estimates (98th percentile of accelerations and the average ofthe two highest acceleration peaks) yielded qualitatively similar results(supplementary material Fig. S2).
The number of corrective maneuvers performed was quantified bysumming the number of sign changes in axial velocity, then dividing thisnumber by two and rounding up to the nearest integer. If a bee flyingforward comes to a stop in front of an obstacle, flies backward briefly, thencontinues flying forward past the obstacle, this counts as a single correctivemaneuver. Sign changes in axial velocity can be caused by either voluntarycorrective maneuvers or involuntary collisions with obstacles. In practice,however, apparent collisions were rare (accounting for less than 10% of signchanges in axial velocity), and often occurred as part of a voluntarydeceleration (i.e. the bee had begun to decelerate and then lightly clipped theobstacle before completely decelerating). Because of their relative rarity andbecause video resolution made it nearly impossible to distinguish betweennear-collisions and maneuvers where the bees made physical contact withthe obstacle, all sign changes of axial velocity were included in the count ofcorrective maneuvers.
Data analysisAll statistical analyses were performed in R (R Development Core Team,2008) with α=0.05. To test for differences in lateral versus verticalacceleration between the two different flight tunnels, we performed a two-way ANOVAwith acceleration direction and obstacle course orientation asexplanatory factors, and maximum acceleration as a response variable; thiswas followed by post hoc t-tests (paired between acceleration axes, unpaired
2735
RESEARCH ARTICLE The Journal of Experimental Biology (2015) 218, 2728-2737 doi:10.1242/jeb.121293
TheJournal
ofEx
perim
entalB
iology

between obstacle courses). To test for overall transit time differencesbetween the two flight tunnels, we performed an unpaired t-test ofnormalized transit time versus obstacle orientation.
The relationships between log-transformed body size (preferable forallometric data; Mascaro et al., 2014) and flight metrics were analyzed withlinear regression models, including obstacle orientation (vertical versushorizontal) and flight direction (exiting versus entering the hive) ascovariates, using the lm( ) function in R. No significant effects of obstacleorientation or flight direction were found for any of the flight metrics, sothese variables were removed. Final models (with all trials pooled) analyzedthe relationship between flight metrics and body size using major axisregression (generally more appropriate for allometric data than ordinaryleast squares regression; Warton et al., 2006), using the lmodel2 package inR. Results from both ordinary least squares regression and major axisregression are reported in Table 1 and shown in Fig. 4.
Because accelerations are particularly sensitive to digitizing noise and theeffects of filtering frequency, we performed a sensitivity analysis on thelinear regression between log-transformed maximum acceleration and bodylength, comparing the slope and significance of this relationship as filteringfrequency changes, and using three different metrics of maximumacceleration (peak acceleration, 98th percentile and 95th percentile).Although acceleration metrics and filter frequency strongly affected boththe slope and significance of the relationship, the estimated slope betweenthese variables was always positive (supplementary material Fig. S2).
We used ordinary least squares regression to test the effect of maximumacceleration on path sinuosity, median flight speed and transit time (Fig. 5),and the effect of the number of corrective maneuvers on path sinuosity(Fig. 6B) and median flight velocity (Fig. 6C). To test the effects of bodysize on the number of corrective maneuvers (Fig. 6A), we created ageneralized linear model with a Poisson distribution (more appropriate forcount data than simple linear regression) and log link using the glm( )function in R (R Development Core Team, 2008).
It is important to note that the number of observations differed betweenthe two flight arenas, with the vertical flight tunnel having nearly twice asmany (N=37) trials as the horizontal flight tunnel (N=19). The horizontalflight tunnel also had relatively few trials with large bees (i.e. bees over17 mm in length). To determine whether this affected our findings, we ranthe same analyses on data from the vertical and horizontal flight tunnelsseparately (results not shown). Data from the vertical flight tunnel displayedthe same relationships and qualitative patterns of significance as the pooleddata in all analyses. Data from the horizontal flight tunnel showed the samerelationships as the pooled data in all analyses, and the same levels ofsignificance in most analyses, with two exceptions: the effect of body sizeon flight speed (Fig. 4D) was only marginally significant for the horizontaltunnel data alone (P=0.06) and the effect of maximum acceleration on pathsinuosity (Fig. 5C) was not significant (P=0.42). The lack of statisticalsignificance in these two relationships for the horizontal data alone may bedue to the smaller number of data points for large bees in this flight tunnel,which would reduce our power to identify statistical trends.
Arecorrectivemaneuvers sufficient to explain variation in speedand sinuosity?One way to address this question is to combine the models of (a) effects ofbody size on the number of corrective maneuvers and (b) effects ofcorrective maneuvers on sinuosity and flight speed to predict the effect sizeof observed variation in sinuosity and flight speed. These estimates can thenbe compared with the observed variation in sinuosity and speed across bodysize. For example, our model predicts roughly 0.53 corrective maneuvers fora 12 mm bee on average and 2.53 corrective maneuvers for a 24 mm bee(Fig. 6A). In turn, our model of the effect of corrective maneuvers onsinuosity predicts a sinuosity of 1.20 for 0.53 corrective maneuvers and asinuosity of 1.34 for 2.53 corrective maneuvers (Fig. 6B). In combination,these models thus predict that path sinuosity will change from 1.2 to 1.34,going from a 12 to a 24 mm bee (an effect size of 0.14). Our ordinary leastsquares model of the effect of body length on sinuosity, however, predicts ashift in path sinuosity from 1.16 to 1.37 over the same size range, with aneffect size of 0.21 (Fig. 4C). From this, we conclude that the effect of bodylength on the number of corrective maneuvers can explain roughly 67% of
the variance in sinuosity across body size. For median flight speed, wepredict a shift from 0.336 m s−1 to 0.299 m s−1 (Fig. 6C) over the samerange of body length. The actual shift over this range is from 0.355 m s−1 to0.272 m s−1 (Fig. 6C), indicating that the effect of body size on correctivemaneuvers can explain around 45% of the observed variation in flight speedacross body size. It should also be noted that these estimates are based onordinary least squares regression, which offers a more conservativeprediction of the effect of body size than major axis regression.
AcknowledgementsThe authors would like to thank Jude Russo and Teressa Alexander for assistancewith data processing, and John Tuthill and Kaushik Jayaram for helpful discussionson optic flow and collision damage in insects, respectively.
Competing interestsThe authors declare no competing or financial interests.
Author contributionsJ.D.C., S.R., A.M.M. and S.A.C. designed the experiments. J.D.C. and S.R.performed the experimental trials. J.D.C. performed computational and statisticalanalyses. J.D.C., S.R., A.M.M. and S.A.C. wrote the manuscript.
FundingThis work was supported by National Science Foundation (NSF) grant CCF-0926158 and an NSF GRFP fellowship to J.D.C.
Supplementary materialSupplementary material available online athttp://jeb.biologists.org/lookup/suppl/doi:10.1242/jeb.121293/-/DC1
ReferencesAldridge, H. D. J. N. and Brigham, R. M. (1988). Load carrying and
maneuverability in an insectivorous bat: a test of the 5% ‘rule’ of radio-telemetry. J. Mamm. 69, 379-382.
Andersson, M. and Norberg, R. Å. (1981). Evolution of reversed sexual sizedimorphism and role partitioning among predatory birds, with a size scaling offlight performance. Biol. J. Linn. Soc. 15, 105-130.
Baird, E., Kornfeldt, T. and Dacke, M. (2010). Minimum viewing angle for visuallyguided ground speed control in bumblebees. J. Exp. Biol. 213, 1625-1632.
Biewener, A. A. (1990). Biomechanics of mammalian terrestrial locomotion.Science 250, 1097-1103.
Boeddeker, N. and Hemmi, J. M. (2010). Visual gaze control during peering flightmanoeuvres in honeybees. Proc. R. Soc. B Biol. Sci. 277, 1209-1217.
Boeddeker, N., Dittmar, L., Sturzl, W. and Egelhaaf, M. (2010). The fine structureof honeybee head and body yaw movements in a homing task. Proc. R. Soc. BBiol. Sci. 277, 1899-1906.
Buchwald, R. and Dudley, R. (2010). Limits to vertical force and power productionin bumblebees (Hymenoptera: Bombus impatiens). J. Exp. Biol. 213, 426-432.
Cnaani, J. and Hefetz, A. (1994). The effect of workers size frequency distributionon colony development in Bombus terrestris. Insect. Soc. 41, 301-307.
Cartar, R. V. (1992). Morphological senescence and longevity: an experimentrelating wing wear and life span in foraging wild bumble bees. J. Anim. Ecol. 61,225-231.
Combes, S. A. and Dudley, R. (2009). Turbulence-driven instabilities limit insectflight performance. Proc. Natl. Acad. Sci. USA 106, 9105-9108.
Combes, S. A., Rundle, D. E., Iwasaki, J. M. and Crall, J. D. (2012). Linkingbiomechanics and ecology through predator-prey interactions: flight performanceof dragonflies and their prey. J. Exp. Biol. 215, 903-913.
Couvillon, M. J., Jandt, J. M., Duong, N. and Dornhaus, A. (2010). Ontogeny ofworker body size distribution in bumble bee (Bombus impatiens) colonies. Ecol.Entomol. 35, 424-435.
Crompton, B., Thomason, J. C. and McLachlan, A. (2003). Mating in a viscousuniverse: the race is to the agile, not to the swift. Proc. R. Soc. B Biol. Sci. 270,1991-1995.
Dickinson, M. H., Farley, C. T., Full, R. J., Koehl, M. A. R., Kram, R. and Lehman,S. (2000). How animals move: an integrative view. Science 288, 100-106.
Dillon, M. E. and Dudley, R. (2004). Allometry of maximum vertical force productionduring hovering flight of neotropical orchid bees (Apidae: Euglossini). J. Exp. Biol.207, 417-425.
Domenici, P. (2001). The scaling of locomotor performance in predator-preyencounters: from fish to killer whales. Comp. Biochem. Physiol. A Mol. Integr.Physiol. 131, 169-182.
Dudley, R. (2002a). Mechanisms and implications of animal flight maneuverability.Integr. Comp. Biol. 42, 135-140.
Dudley, R. (2002b). The Biomechanics of Insect Flight. Princeton: PrincetonUniversity Press.
2736
RESEARCH ARTICLE The Journal of Experimental Biology (2015) 218, 2728-2737 doi:10.1242/jeb.121293
TheJournal
ofEx
perim
entalB
iology

Dudley, R. and Ellington, C. P. (1990). Mechanics of forward flight in bumblebees:II. Quasi-steady lift and power requirements. J. Exp. Biol. 148, 53-88.
Ellington, C. P., Machin, K. E. and Casey, T. M. (1990). Oxygen consumption ofbumblebees in forward flight. Nature 347, 472-473.
Foster, D. J. and Cartar, R. V. (2011). What causes wing wear in foraging bumblebees? J. Exp. Biol. 214, 1896-1901.
Goulson, D. (2003). Bumblebees. USA: Oxford University Press.Goulson, D., Peat, J., Stout, J. C., Tucker, J., Darvill, B., Derwent, L. C. andHughes, W. O. H. (2002). Can alloethism in workers of the bumblebee, Bombusterrestris, be explained in terms of foraging efficiency? Anim. Behav. 64, 123-130.
Hadley, A. S. and Betts, M. G. (2009). Tropical deforestation alters hummingbirdmovement patterns. Biol. Lett. 5, 207-210.
Hedrick, T. L. (2008). Software techniques for two- and three-dimensional kinematicmeasurements of biological and biomimetic systems. Bioinspir. Biomim. 3,034001.
Hedrick, T. L., Cheng, B. and Deng, X. (2009). Wingbeat time and the scaling ofpassive rotational damping in flapping flight. Science 324, 252-255.
Heinrich, B. (2004). Bumblebee Economics. Harvard: Harvard University Press.Jayaram, K. and Full, R. J. (2015). Body size limit predictions for mechanicallymediated maneuvers. Int. Comp. Biol. 55, E88.
Kapustjanskij, A., Streinzer, M., Paulus, H. F. and Spaethe, J. (2007). Bigger isbetter: implications of body size for flight ability under different light conditions andthe evolution of alloethism in bumblebees. Funct. Ecol. 21, 1130-1136.
Kern, R., Boeddeker, N., Dittmar, L. and Egelhaaf, M. (2012). Blowfly flightcharacteristics are shaped by environmental features and controlled by optic flowinformation. J. Exp. Biol. 215, 2501-2514.
LeBoeuf, A. C. and Grozinger, C. M. (2014). Me and we: the interplay betweenindividual and group behavioral variation in social collectives. Curr. Opin. InsectSci. 5, 16-24.
Lihoreau, M., Chittka, L., Le Comber, S. C. and Raine, N. E. (2012). Bees do notuse nearest-neighbour rules for optimization of multi-location routes. Biol. Lett. 8,13-16.
Lin, H.-T., Ros, I. G. and Biewener, A. A. (2014). Through the eyes of a bird:modelling visually guided obstacle flight. J. R. Soc. Interface 11, 20140239-20140239.
Maebe, K., Meeus, I. and Smagghe, G. (2013). Recruitment to forage ofbumblebees in artificial low light is less impaired in light sensitive colonies, andnot only determined by external morphological parameters. J. Insect Physiol. 59,913-918.
Marden, J. H. (1987). Maximum lift production during takeoff in flying animals.J. Exp. Biol. 130, 235-258.
Mascaro, J., Litton, C. M. and Hughes, R. F. (2014). Is logarithmic transformationnecessary in allometry? Ten, one-hundred, one-thousand-times yes. Biol. J. 111,230-233.
Morice, S., Pincebourde, S., Darboux, F., Kaiser, W. and Casas, J. (2013).Predator-Prey Pursuit-Evasion games in structurally complex environments.Integr. Comp. Biol. 53, 767-779.
Mountcastle, A. M. and Combes, S. A. (2014). Biomechanical strategies formitigating collision damage in insect wings: structural design versus embeddedelastic materials. J. Exp. Biol. 217, 1108-1115.
Norberg, U. M. and Rayner, J. M. (1987). Ecological morphology and flight in bats(Mammalia; Chiroptera): wing adaptations, flight performance, foraging strategyand echolocation. Philos. Trans. R. Soc. Lond. B Biol. Sci. 316, 335-427.
Ohashi, K., Leslie, A. and Thomson, J. D. (2008). Trapline foraging by bumblebees: V. Effects of experience and priority on competitive performance. Behav.Ecol. 19, 936-948.
Pinter-Wollman, N. (2012). Personality in social insects: how does workerpersonality determine colony personality. Curr. Zool. 58, 579-587.
R Development Core Team (2008). R: A Language and Environment for StatisticalComputing. R Foundation for Statistical Computing, Vienna, Austria. ISBN3-900051-07-0, URL http://www.R-project.org.
Ravi, S., Crall, J. D., Fisher, A. and Combes, S. A. (2013). Rolling with the flow:bumblebees flying in unsteady wakes. J. Exp. Biol. 216, 4299-4309.
Riley, J. R., Reynolds, D. R., Smith, A. D., Edwards, A. S., Osborne, J. L.,Williams, I. H. and McCartney, H. A. (1999). Compensation for wind drift bybumble-bees. Nature 400, 126.
Rogers, L. E., Buschbom, R. L. and Watson, C. R. (1977). Length-weightrelationships of shrub-steppe invertebrates. Ann. Entomol. Soc. Am. 70, 51-53.
Shepard, E. L. C., Wilson, R. P., Rees, W. G., Grundy, E., Lambertucci, S. A. andVosper, S. B. (2013). Energy landscapes shape animal movement ecology. Am.Nat. 182, 298-312.
Spaethe, J. (2003). Interindividual variation of eye optics and single objectresolution in bumblebees. J. Exp. Biol. 206, 3447-3453.
Srinivasan, M., Zhang, S. W., Lehrer, M. and Collett, T. (1996). Honeybeenavigation en route to the goal: visual flight control and odometry. J. Exp. Biol. 199,237-244.
Stevenson, R., Corbo, K., Baca, L. and Le, Q. (1995). Cage size and flight speed ofthe tobacco hawkmoth Manduca sexta. J. Exp. Biol. 198, 1665-1672.
Stockwell, E. F. (2001). Morphology and flight manoeuvrability in New World leaf-nosed bats (Chiroptera: Phyllostomidae). J. Zool. 254, 505-514.
Swaddle, J. P. andWitter, M. S. (1998). Cluttered habitats reduce wing asymmetryand increase flight performance in European starlings. Behav. Ecol. Sociobiol. 42,281-287.
Tammero, L. F. and Dickinson, M. H. (2002). The influence of visual landscape onthe free flight behavior of the fruit fly Drosophila melanogaster. J. Exp. Biol. 205,327-343.
Thomas, A. L. R. (1996). The flight of birds that have wings and a tail: variablegeometry expands the envelope of flight performance. J. Theor. Biol. 183,237-245.
Thomas, A. L. R. and Balmford, A. (1995). How natural selection shapes birds’tails. Am. Nat. 146, 848-868.
Vance, J. T., Williams, J. B., Elekonich, M. M. and Roberts, S. P. (2009). Theeffects of age and behavioral development on honey bee (Apis mellifera) flightperformance. J. Exp. Biol. 212, 2604-2611.
Vogel, S. (1994). Life in Moving Fluids. Princeton: Princeton University Press.Warton, D. I., Wright, I. J., Falster, D. S. and Westoby, M. (2006). Bivariate line-
fitting methods for allometry. Biol. Rev. 81, 259.
2737
RESEARCH ARTICLE The Journal of Experimental Biology (2015) 218, 2728-2737 doi:10.1242/jeb.121293
TheJournal
ofEx
perim
entalB
iology
Related Documents


