BULLYING IN A MULTICULTURAL CONTEXT The Influences of Race, Immigrant Status, and School Climate on the Incidence of Bullying in Canadian Children and Adolescents by ANNE-CLAIRE LAROCHETTE A thesis submitted to the Department of Psychology in conformity with the requirements for the degree of Master of Science Queen's University Kingston, Ontario, Canada September, 2009 Copyright © Anne-Claire Larochette, 2009

Welcome message from author
This document is posted to help you gain knowledge. Please leave a comment to let me know what you think about it! Share it to your friends and learn new things together.
Transcript

BULLYING IN A MULTICULTURAL CONTEXT
The Influences of Race, Immigrant Status, and School Climate
on the Incidence of Bullying in Canadian Children and Adolescents
by
ANNE-CLAIRE LAROCHETTE
A thesis submitted to the Department of Psychology
in conformity with the requirements for
the degree of Master of Science
Queen's University
Kingston, Ontario, Canada
September, 2009
Copyright © Anne-Claire Larochette, 2009

i
ABSTRACT
Strong group affiliations based on race have been found in children at a very young age
(Aboud, 1988) and may lead to a higher risk of involvement in bullying for certain racial
groups. Little research, however, has addressed the relationship among bullying, race,
and immigrant status in a Canadian sample. As well, few studies have directly examined
racial bullying and victimization. Thus, the two studies in the current project aim to
examine race and immigrant status as individual risk factors for bullying involvement,
while also examining the individual- and school-level factors associated with racial
bullying. In Chapter Two, an empirical examination of the relationship among race,
immigrant status, and bullying and victimization in adolescence reveals that racial
minority adolescents experience racial bullying. Immigrant status, however, does not
appear to predict victimization, but it may be a risk factor for bullying others. In Chapter
Three, a multilevel investigation of racial bullying and victimization at the individual and
school levels indicates that African-Canadian students are at risk of engaging in both
racial bullying and victimization, and that being male is also associated with participation
in this type of bullying. At the school level, school climate is not found to account for the
differences in racial bullying and victimization across schools, but increased school
support is associated with decreased racial bullying in schools with more teacher
diversity. Together, the results of the current research clarify the roles of race and
immigrant status in bullying and victimization, but these results also raise important
concerns and further questions regarding possible interventions in schools for students
who engage in racial bullying and racial victimization.

ii
CO-AUTHORSHIP
I assumed primary responsibility for the conceptualization, design, and execution
of the research reported in this thesis. My supervisor, Dr. Wendy Craig, assisted in all
aspects of this thesis and in the preparation of the manuscripts and appears as co-author
on both manuscripts.
The research reported in Chapter Two was based on longitudinal data from
collaborative projects in which Drs. Debra Pepler and Jennifer Connolly of York
University were co-investigators with Dr. Wendy Craig. Therefore, Drs. Pepler and
Connolly are listed as co-authors on this manuscript.

iii
ACKNOWLEDGEMENTS
I would like to thank my supervisor, Dr. Wendy Craig. Her guidance, support,
encouragement, and feedback have helped me grow both as a researcher and as a person.
I am extremely grateful to her for all of her patience and understanding, and am looking
forward to working together with her during the next stage of my academic journey.
A huge thanks also goes to Joanna Sue and Ashley Murphy. I have never met two
nicer people in my life, and I feel very fortunate to have the privilege of having them as
my lab mates and friends. We’ll always have Connecticut! Also, thank-you to my friend
Talia Troister, without whom I would not have been able to submit my thesis on time. I
owe you one.
Finally, thank-you to Martin. I couldn’t have done it without you.

iv
TABLE OF CONTENTS
ABSTRACT ......................................................................................................................... i CO-AUTHORSHIP ............................................................................................................. ii ACKNOWLEDGEMENTS ............................................................................................... iii TABLE OF CONTENTS ................................................................................................... iv
LIST OF TABLES ............................................................................................................. vi CHAPTER ONE ................................................................................................................. 1
General Introduction .................................................................................................. 1
CHAPTER TWO................................................................................................................. 8
The Influences of Race and Immigrant Status on Bullying and Victimization in Early and Late Adolescence ................................................................................................................ 8
Abstract ...................................................................................................................... 9
The Influences of Race and Immigrant Status on Bullying and Victimization in Early and Late Adolescence .................................................................................... 10
Methods ................................................................................................................... 15
Design ............................................................................................................. 15
Participants ..................................................................................................... 15
Measures ......................................................................................................... 17
Results ...................................................................................................................... 19
General Bullying ............................................................................................ 21
Physical Bullying ........................................................................................... 21
Social Bullying ............................................................................................... 22
Racial Bullying - Elementary School ............................................................. 23
General Victimization .................................................................................... 23
Physical Victimization ................................................................................... 24
Social Victimization ....................................................................................... 24
Racial Victimization – Elementary School .................................................... 25
Discussion ................................................................................................................ 25
CHAPTER THREE ........................................................................................................... 39
Racial bullying and victimization in Canadian school-aged children: Individual and school level effects ............................................................................................................ 39
Abstract .................................................................................................................... 40
Racial bullying and victimization in Canadian school-aged children: .................... 41
Individual and school level effects .......................................................................... 41
Methods ................................................................................................................... 47
Study Design .................................................................................................. 47
Participants ..................................................................................................... 48
Measures ......................................................................................................... 48 Results……………………………………………………………………………...51
Data Analyses ................................................................................................. 51
Multilevel Models .......................................................................................... 52
Discussion ................................................................................................................ 55
CHAPTER FOUR ............................................................................................................. 66
General Discussion .................................................................................................. 66

v
Future Research .............................................................................................. 71
Summary ........................................................................................................ 74
REFERENCES .................................................................................................................. 75
APPENDIX A ................................................................................................................... 84
STUDY 1 BULLYING AND VICTIMIZATION SCALES ............................................ 84
APPENDIX B ................................................................................................................... 87
HBSC SCALES ................................................................................................................ 87

vi
LIST OF TABLES
Table 2.1 Elementary and high school bullying and victimization prevalence by percent of racial group………………………………………………………..31
Table 2.2 Correlations among study variables – Elementary school sample……………....32
Table 2.3
Correlations among study variables – High school sample……………………...33
Table 2.4 Elementary school multiple regressions of bullying over time………….............34
Table 2.5 Elementary school multiple regressions of victimization over time……………..35
Table 2.6 High school multiple regressions of bullying over time……………………...….36
Table 2.7 High school multiple regressions of victimization over time……………...…….37
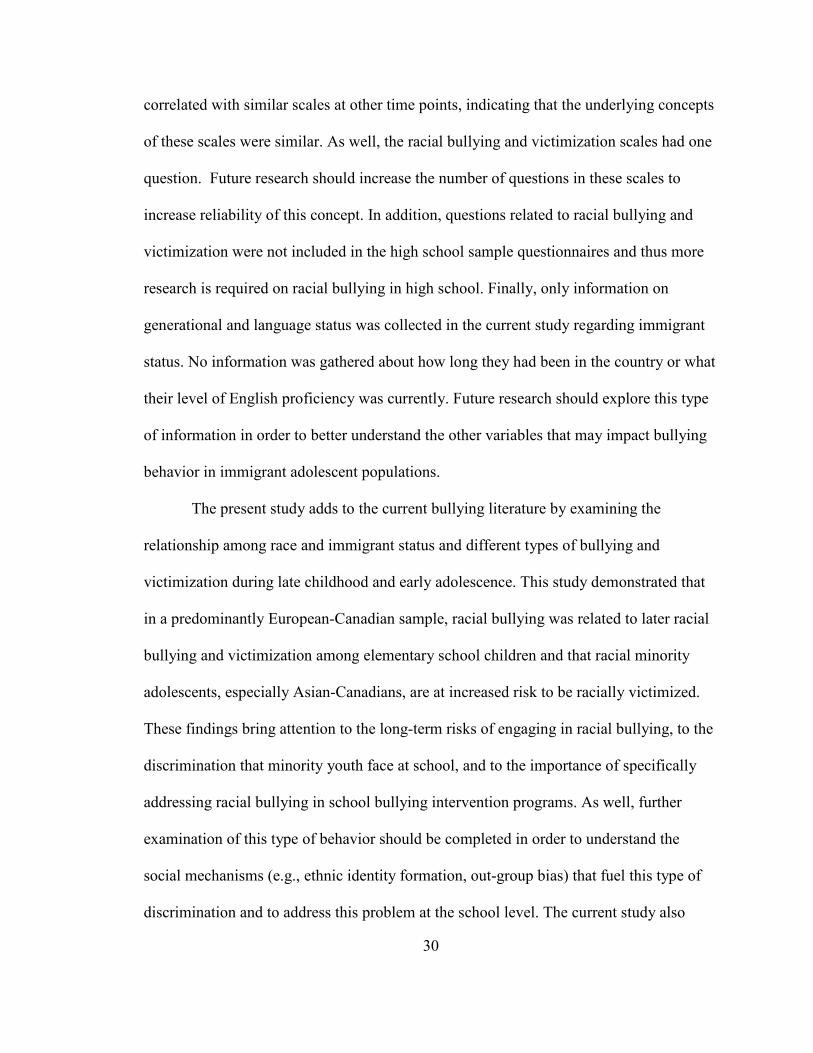
Table 3.1. Descriptive Statistics for Level-1 and Level-2 Variables……………….……….61 Table 3.2
Correlations for Level-1 and Level-2 Variables………………………….…..….62
Table 3.3 HLM models for Racial Bullying………………………………………….…….63
Table 3.4 HLM models for Racial Victimization………………………………….….……64

1
CHAPTER ONE
General Introduction
Bullying is a serious social problem in children and adolescents and its long-term
effects have been studied extensively (Garandeau & Cillessen, 2006; Houbre, Tarquinio,
Thuillier, & Hergott, 2006; Jacobsen & Bauman, 2007; Pepler, Craig, & O’Connell,
1999; Scheithauer, Hayer, Peterman & Jugert, 2006). This behavior has not, however,
been well researched in a multicultural context in Canada. Specifically, the influence of
race on bullying and the incidence of racial bullying have not been well investigated in
this country. As well, the literature has outlined the social and cultural difficulties faced
by immigrant youth (Yeh et al., 2003), but it has not evaluated their increased risk of
experiencing bullying compared to their peers. The impact of the school environment on
racial bullying and victimization has also not been examined in Canada, despite the
potential influence of this social context on racial bullying behavior (Verkuyten & Thijs,
2002). The current thesis, consisting of two studies, attempts to clarify the role of race
and immigrant status in bullying and victimization, while also exploring the influence of
the school environment on racial bullying and victimization in Canadian school-aged
children.
Canada currently has over five million citizens who are members of visible racial
minority groups, and who represent over 16% of the population (Statistics Canada, 2008).
As well, one in five Canadian citizens was born outside Canada. Thus, immigrants
represent 20% of the current population, with 95% of these citizens residing in urban
areas (Statistics Canada, 2009). This demographic information indicates that school
children in urban areas across the country are regularly socializing and interacting with

2
students from a variety of racial and ethnic backgrounds. Although these experiences are
positive for many children, they may also lead to bullying among different racial groups.
Countries such as The Netherlands, the United States, Austria, and Greece have directly
studied multiracial and immigrant issues as part of their investigations of bullying in
schools (Motti-Stefanidi et al., 2008; Spriggs et al., 2007; Strohmeier, Spiel, &
Gradinger, 2008; Verkuyten & Thijs, 2002). Canadian bullying researchers, however, are
lagging behind despite the differences in racial minority groups found in Canada
compared to other countries, and the lack of studies examining racial bullying itself.
Developmental theories describing racial in-group formation have also revealed
reasons why racial minority children may be at risk of bullying and should be included in
studies of this behavior. Specifically, the development of group affiliations based on race
in children has been conceptualized using the theory of in-group bias, described by Tajfel
and Turner (1979) as a theory of intergroup conflict. This theory states that in-groups
form when individuals perceive themselves as belonging to the same social category and
when they are able to compare and distinguish themselves from out-groups (Tajfel &
Turner). In-group biases based on race have been consistently observed in very young
children (Doyle & Aboud, 1995; Nesdale, Griffiths, Durkin, & Maass, 2007) and may
occur due to children’s inability to see any similarities between themselves and someone
of another race (Piaget & Weil, 1951). Aboud (1988) posited that this early racial bias
might lead to hostility and prejudice between groups of different racial backgrounds.
These biases may also change during development from childhood to early and late
adolescence. Ethnic identity research indicates that these biases may weaken with age as
younger children show more ethnic pride and out-group bias, whereas older adolescents

3
show more integration and ethnic identity exploration (Marks et al., 2006). Bullying
behaviors may, in fact, mirror these racial group biases throughout development, leading
to increased bullying of racial minority youth in elementary school children and
decreased bullying of these youth in high school children. These developmental studies in
racial minority and immigrant youth are important to establish the developmental course
of these biases in order to plan appropriate prevention and intervention programs.
Race has, in fact, been identified in the literature as a risk factor for bullying
involvement. In the United States, children and adolescents from a variety of racial
groups, such as African-American and Hispanic-American, have all been found to be at
an increased risk of being bullied compared to their peers of European descent (Peskin,
Tortolero, & Markham, 2006; Spriggs et al., 2007). Many limitations exist in this
literature, including a lack of examinations of different types of bullying (e.g., social,
physical) in racial minority groups, no longitudinal studies, and a lack of consideration of
racial bullying specifically. Immigrant youth are also absent from most bullying studies,
despite American research demonstrating their experiences with social isolation,
stereotyping, and discrimination (Yeh et al., 2003). One Canadian study of immigrant
youth by McKenney and colleagues (2006), however, did report that second-generation
immigrant youth are at risk for racial victimization, highlighting the importance of
including multiracial and immigrant populations in the study of bullying in Canada.
To gain further insight into an understudied behavior such as racial bullying,
however, the broader context must be examined in addition to individual characteristics
such as race. Bronfenbrenner’s (1977) ecological theory outlines the importance of
broader environments in shaping individual development. His ecological systems theory

4
conceptualized development as occurring within the context of numerous environmental
systems. Of particular interest to the bullying literature is the microsystem, described by
Bronfenbrenner as the immediate environment in which an individual lives. This system
includes a child’s most direct social learning environments, including the school
environment, where most bullying occurs. By examining bullying as an individual
behavior, and within the microsystem in which it occurs, the contextual influences on this
social behavior can be better understood. Lerner’s (1986) developmental contextualism
framework also underlined the importance of viewing development in relation to
different levels of organization. (e.g., peer groups, school system, natural and built
physical surroundings). Thus, Lerner (1996) felt that a dynamic systems perspective of
development that included a relational unit of analysis was essential. By this, Lerner
meant that variables associated with a particular level of organization are always related
to variables at another level of organization and should be conceptualized and studied in a
multilevel manner. Taken together, these theoretical perspectives highlight the
importance of considering not only the individual variables that may contribute to
behavior such as racial bullying, but also to examine the social context in which this
behavior occurs.
In the bullying literature, the school environment has been repeatedly identified as
the primary social context in which bullying occurs (Olweus, 1993; Whitney, Nabuzoka,
& Smith, 1992). School climate can be defined as the beliefs, attitudes, and values that
impact the interactions of students and teachers within their school environment
(Emmons, Comer, & Haynes, 1996). Studies have taken an ecological perspective on
bullying and demonstrated that changes in school environments, especially changes in

5
school climate, can affect the occurrence of individual behavior such as bullying
(Kuperminc, Leadbeater, & Blatt, 2001; Verkuyten and Thijs, 2002; Wilson, 2004). For
example, Ma (2002) found that students who reported a good disciplinary climate at
school also reported less bullying involvement. In addition to the climate provided in
schools, the social relationships of racial minority students can also be affected by the
racial diversity of those around them. In the United States, Jackson and colleagues (2006)
highlighted this point by reporting that African-American children received more
favorable peer nominations if they were more numerous in their classroom and if their
teacher was also African-American (Jackson, Barth, Powell, & Lochman, 2006).
Similarly, Verkuyten and Thijs (2002) found that ethnic minority children in The
Netherlands reported more incidences of racism when they were a numerical minority
within their classroom. Children reported fewer incidences of racial bullying, however,
when they felt that they could tell their teacher and that their teacher would help them
with the situation. Both of these studies clearly demonstrate the impact that both diversity
and a supportive school environment can have on peer relationships and racial
victimization. They also highlight the importance of including these contextual aspects in
the study of individual behaviors such as racial bullying. These cross-level effects
outlined above (e.g., between the individual and the school) are common in the social
sciences and have been recently addressed methodologically with a statistical method
known as hierarchical linear modeling (HLM; Raudenbush & Bryk, 2002). This
technique allows for the proper evaluation of nested data and permits researchers to
examine the influences of both individual- and school-level variables on individual
behavior. To date, HLM has not often been used to study bullying, but it was utilized in

6
the current thesis as a unique opportunity to better understand racial bullying and the
school context in which it occurs.
The particular goals of this thesis are to address the gaps in the current bullying
literature by examining race and immigrant status as individual risk factors for bullying
longitudinally in a Canadian population. In addition, the current thesis aims to apply an
ecological perspective to the study of racial bullying and victimization by using
multilevel modeling to determine both the individual- and school-level variables that
impact this behavior.
The first manuscript in this thesis is an empirical investigation of different types
of bullying in a Canadian sample, with a particular focus on the influence of race and
immigrant status on bullying and victimization. The research questions addressed in the
first manuscript are as follows:
1) What are the relationships among race, immigrant status, bullying, and
victimization in a Canadian sample?
2) Do these relationships change with different types of bullying and
victimization?
3) Do these relationships differ between early and late adolescents?
The second manuscript in this thesis is a multilevel examination of racial bullying
and victimization in a national Canadian sample of school-aged children. Individual
characteristics as well as school characteristics are examined in order to better understand
the potential influences on this specific type of bullying. The particular research
questions addressed in the second manuscript are as follows:

7
1) What specific individual-level factors predict racial bullying and racial
victimization in a Canadian sample of school-aged children?
2) What specific school-level factors predict racial bullying and racial
victimization in a Canadian sample of school-aged children?
3) Do schools vary on racial bullying and racial victimization and how much of
this variance is accounted for by individual- and school-level factors?
Due to the lack of studies of Canadian racial minorities in the bullying literature,
the current thesis is unique in its potential to inform current research. First, these studies
will inform current theories about in-group biases based on race and how they may
manifest in adolescence. As well, the inclusion of a variety of racial minority groups in
the current studies may help identify potential at-risk groups in Canada that may not have
been previously identified. Finally, identifying the school characteristics that impact
racial bullying in schools could help Canadian schools better reduce the incidence of this
behavior in their schools. Thus, by addressing the above research questions, the current
thesis aims to fill the gaps in the current bullying literature and provide a better
understanding of bullying in a multicultural context for Canadian children.

8
CHAPTER TWO
THE INFLUENCES OF RACE AND IMMIGRANT STATUS ON BULLYING AND
VICTIMIZATION IN EARLY AND LATE ADOLESCENCE
Anne-Claire Larochette & Wendy M. Craig
Queen’s University
Debra J. Pepler & Jennifer A. Connolly
York University

9
Abstract
Recent studies have indicated that being a racial minority and being an immigrant
may result in an increased risk of involvement in bullying. The influences of race and
immigrant status have not, however, been studied in a Canadian sample and the
incidence of racial bullying specifically has also not been addressed in this country.
This study examined the relationships among race, immigrant status, and different
types of bullying in two groups of Canadian students from a large metropolitan area.
The sample included 463 elementary school students from grades 5 to 7 who
completed a bullying questionnaire in the fall and spring of their school year. The
sample also included 366 high school students from grades 10 to 12 who completed a
bullying questionnaire one year apart. Results indicated that racial minority groups
experienced racial victimization in elementary school, and Asian-Canadian students
were identified as the most at risk group for racial victimization. Immigrant status
was generally not related to bullying or victimization, but some interactions indicated
an increased risk in bullying others, especially in those immigrant youth who were in
the ‘Other’ racial group. In addition, more bullying involvement was found in
elementary school students than high schools students, and racial bullying was related
to racial bullying, racial victimization, and other types of victimization over time.

10
The Influences of Race and Immigrant Status on Bullying and Victimization in Early and
Late Adolescence
Bullying is defined as a relationship problem in which children who bully learn to
use power to intimidate and control others, whereas children who are repeatedly
victimized become increasingly powerless in the relationship (Pepler, Craig, &
O’Connell, 1999). Bullying has been associated with serious short- and long-term
consequences (Houbre, Tarquinio, Thuillier, & Hergott, 2006) and can take many forms
including physical (Scheithauer, Hayer, Peterman & Jugert, 2006), verbal (Jacobsen &
Bauman, 2007), and social (Garandeau & Cillessen, 2006). Only recently, however, have
the influence of ethnicity and the incidence of racial bullying and victimization been
investigated. Recent studies have found that visible racial minority children may be at a
higher risk for bullying and victimization than children of European descent (Hanish &
Guerra, 2000; Spriggs et al., 2007). Little research, however, has examined the risk
associated with specific types of bullying in racial groups. As well, despite research
outlining the social and cultural difficulties faced by immigrant youth (Mesch, Turjeman,
& Fishman, 2008; Sabatier & Berry, 2008; Yeh et al., 2003), the extent of their increased
risk of being victimized or bullying their peers at different ages is rarely examined. The
aim of the current study was to examine the influence of race and immigrant status on the
involvement in different types of bullying and victimization in early and late adolescence.
The increased vulnerability of minority racial groups and of immigrant youth to
bullying may be conceptualized using the theory of in-group bias. This theory is used to
describe the racial discrimination and prejudice displayed by children towards children of
different racial groups. The theory of in-group bias states that members of the in-group

11
are favored and perceived as superior, whereas members of the out-group are perceived
as potentially threatening and inferior (Brewer, 1999). Group affiliations based on race
are thought to provide the basis for in-group and out-group membership, which can lead
to hostility between members of different racial groups based on these affiliations
(Aboud, 1988). The process of in-group formation can begin at a very young age. For
example, children of European descent as young as 3 and 6 years old display strong pro-
European and anti-African attitudes on standardized measures of prejudice (Doyle &
Aboud, 1995). When rating out-group members, children aged 7 to 10 years old rated
individuals of a different ethnicity as more different than when rating out-group members
of the same ethnicity (Nesdale, Griffiths, Durkin, & Maass, 2007). Besides being easily
identifiable, certain racial groups may be targeted as an out-group because of children’s
racial attitudes learned from their parents (White & Gleitzman, 2006) or stereotypic
attitudes held by children towards a racial group (Slone, Tarrasch, & Hallis, 2006).
Although these biases can begin at an early age, they can continue throughout
development and may place minority groups at a higher risk for bullying involvement
with their peers.
In fact, studies suggest that adolescents in certain minority racial groups may be at
an increased risk of involvement in specific bullying behaviors as a result of this in-group
bias. Peskin, Tortolero, and Markham (2006) found that African-American students of
low socioeconomic status are at a higher risk of involvement in bullying and
victimization than are Hispanic-American students, with a peak in this behavior found in
Grade 9. As well, specific types of bullying, such as teasing and upsetting others for fun,
was most prevalent in African-American and Hispanic-American youth. African-

12
American adolescent boys who represent a minority in their school have also been
identified as the most overtly aggressive and the most likely to physically fight with
others at school (McLaughlin, Hilt, & Nolen-Hoeksema, 2007; Peskin, 2006), whereas
Spriggs and colleagues (2007) found that Hispanic-American students reported more
victimization than did their African-American peers. Racial minority out-groups may also
be at a higher risk of victimization at different developmental periods. Ethnic identity
research states that younger children show more ethnic pride and out-group bias, whereas
older adolescents show more integration and ethnic identity exploration prior to forming
a strong ethnic identity (Marks et al., 2006). Thus, students in elementary school may
bully racial minority youth more due to feelings of ethnic pride. High school students
who are more open in their exploration of ethnic identity may, however, show less of
these out-group bullying behaviors. Findings regarding the developmental changes in risk
for bullying and victimization in racial minority youth have been inconsistent across
studies (Hanish & Guerra, 2000; Mouttapa et al., 2004; Putallaz, et al., 2007) and have
not been investigated in a multiracial Canadian sample. To better inform prevention and
intervention at the elementary and high school level, the current study aimed to determine
if being a member of a Canadian minority racial group is related to specific types of
bullying and victimization and if this pattern differs at different developmental stages.
Immigrant adolescents are another understudied minority group in Canada who
may represent an out-group and may be at a higher risk for bullying involvement.
Currently, 20% of the Canadian population was born in another country, including 19%
of children under the age of 15 (Statistics Canada, 2006). The recognition of immigrant
youth as an identifiable out-group has been described in studies outlining the cultural

13
adjustment issues faced by many immigrant adolescents. For example, immigrant youth
in the United States have been found to experience social isolation due to a lack of
proficiency in the English language (Yeh et al., 2003). This lack of English-language
proficiency may not only place immigrant children at a higher risk of social bullying by
peers, but may also prevent them from defending themselves verbally, leading to
aggressive behavior or physical bullying (Dawson & Williams, 2008). Immigrant youth
may also face verbal and social bullying in the form of stereotyping and discrimination
(Mesch et al., 2008). Being part of a visible racial minority may also place some
immigrant youth at an increased risk of bullying compared to their majority peers. Social
exclusion may be aggravated when an immigrant youth is a visible minority and is trying
to adjust to a new cultural environment. For example, Asian-American immigrant youth
who demonstrate traditional Asian cultural values such as humility and emotional self-
control (Kim, Yang, Atkinson, Wolfe, & Hong, 2001) may be targeted by bullying both
because they are a visible minority and because of their cultural differences. As a result,
racial victimization may also be more prevalent in immigrant youth. Indeed, McKenney
and colleagues (2006) recently found that second-generation immigrant youth in Canada
were at a higher risk for racial victimization, but they did not examine other types of
bullying or victimization. Thus, immigrant adolescents may be at a particularly high risk
for bullying involvement, but studies examining their risk for specific types of bullying
and how this risk interacts with ethnicity have not been completed to date.
The process of ethnic identity formation may also influence the incidence of
bullying and victimization at different developmental periods. The formation of cultural
identity similar to that of ethnic identity may also occur in older immigrant adolescents

14
and younger immigrant adolescents may be less open to other cultural groups. This
pattern may lead to increased out-group identification in younger samples and, as a result,
more bullying of immigrant youth at a younger age than in adolescence. In fact, the
developmental pattern for the discrimination and involvement in bullying behaviors of
immigrant adolescents is unclear due to a paucity of research in this area. Those studies
examining this population of youth have often combined samples of early and late
adolescents (McKenney et al., 2006; Motti-Stefanini et al., 2008; Sabatier & Berry, 2008;
Yeh et al., 2003). The current study aims to fill in these gaps in research by exploring
whether bullying and victimization towards Canadian immigrant youth differ between
early and late adolescence, as these behaviors may be influenced by developmental
changes.
In the current study we had two main objectives: 1) To examine the relationship
among race, bullying, and victimization in a Canadian sample and compare this
relationship between early and mid-adolescents. We hypothesized that race would be
related to bullying and victimization across both age groups, with minority racial groups
being more likely to report different types of bullying and victimization than European
students. 2) To investigate the relationship among immigrant status, bullying, and
victimization in a Canadian sample and compare this relationship between early and mid-
adolescents. We hypothesized that immigrant status will be related to bullying and
victimization across both age groups, with a stronger relationship between different types
of victimization for immigrant students and non-immigrant students.

15
Methods
Design
Analyses in the current study were based on data drawn from a longitudinal study
entitled The Adolescent Relationship Study (Connolly, Craig, & Pepler, 2003). Data were
collected from two cohorts of children and youth (elementary and high school) from
seven schools within a large metropolitan area. Parental consent was obtained from
children under the age of 18, and all participants also provided their own consent. Data
from the current elementary school sample were collected at the beginning of the school
year and again six months later. Data from the current high school sample were collected
at the beginning of the school year and one year later. Specific statistical comparisons of
both age groups were not completed due to this difference in time between observations.
Participants
Elementary School Sample. Participants in the elementary sample were 463
children (male = 216, female = 247). Of these, 116 were in Grade 5, 158 were in Grade 6,
and 189 were in Grade 7. Children ranged in age from 9 to 13, with a mean age of 11.2
(SD = 0.9). The majority of this sample was European-Canadian (74%), 13% were Asian-
Canadian, 4% were African-Canadian, and 9% were of other ethnicities grouped in the
category ‘Other’ (i.e. Native-Canadian, Mixed, self-identified as ‘Other’). In total, the
majority was born in Canada (84%). The majority of participants (78.6%) lived with both
natural parents, and 12.5% lived with their mother only. Socioeconomic status (SES) was
calculated independently for mothers and fathers as follows: parents’ jobs were coded
using the 1981 Socioeconomic Index for Occupations in Canada (Blishen, Carroll, &
Moore, 1987). The mean index codes for mothers and fathers were then translated into a

16
National Occupational Classification code (NOC code; Human Resource and
Development Canada, 2009), which provided a representative occupation title and its
associated hourly wage. The NOC codes represented an average hourly wage of
$15.78/hour for fathers and $14.16 for mothers. These wages are slightly lower than the
national average hourly wage ($18.07; Statistics Canada, 2006). There were no
significant differences between excluded participants and included participants on grade,
race, and most of the bullying outcome variables. More boys than girls were excluded
from the final sample (χ² = 6.3; p < .05), and excluded participants reported significantly
more general victimization (Z = -2.2; p < .05), physical bullying (Z = -2.5; p < .05),
physical victimization (Z = -2.1; p < .05), and racial victimization (Z = -2.6; p < .05).
High School Sample. Participants in the high school sample were 366 adolescents
(male = 136, female = 230), ranging in age from 15-18, with a mean of 16.0 (SD = 0.9).
Students in this sample were in grade 10 (n = 157), grade 11 (n = 152), and grade 12 (n =
57). Like the elementary sample, the majority of the high school students was European-
Canadian (77%), whereas 18% were Asian-Canadian, 4% were African-Canadian, and
3% were ‘Other’ (i.e., Latin-Canadian, self-identified as ‘Other’). Most students in the
high school sample were born in Canada (82%). The majority of students in the high
school sample lived with both their natural parents (76.2%) or with their mother only
(11.7%). Parental education data but not SES data were collected for the high school
sample. These data indicated that most mothers had graduated university (31%) or
received a post-graduate or professional degree (24%). Similarly, most fathers had
graduated university (34%) or received a post-graduate or professional degree (31%).
There were no significant differences between excluded participants and included

17
participants on the outcome measures and immigrant status. Excluded participants
included more Grade 12 students (χ² = 25.1; p < .01), fewer girls (χ² = 25.1; p < .01), and
fewer European students (χ² = 9.51; p < .05) than included participants.
Measures
Demographics. The Focus on You questionnaire (Connolly & Konarski, 1994)
was administered to gather demographic information including: age, sex, grade, race,
immigrant status, whether parents were born in Canada, and language spoken at home.
Immigrant status was operationalized based on generational and language status.
Participants received one point for generational status, for a maximum of three points, for
each of the following: if they were not born in Canada, if their mother was not born in
Canada, and if their father was not born in Canada. For language status, participants
received one point if they reported speaking English and another language at home, or if
they reported speaking little or no English at home. No point was given for language
status if participants reported speaking only English at home. Generational status and
language status were then combined to provide a final immigrant status score, which
ranged from 0 to 4. In the elementary school sample, the mean immigrant status was 1.3
(SD = 1.3). In the high school sample, the mean immigrant status was 1.42 (SD = 1.39).
Bullying and Victimization – Elementary School Sample. An abbreviated version
of the Bullying and Victimization Student Questionnaire (Olweus, 1989) was used to
measure participants’ involvement in bullying behavior. This self-report questionnaire
included 14 questions asking respondents to identify how many times they had
participated in, or been victimized by, specific bullying behaviors. Participants responded
to each question on an 11-point scale that ranged from ‘0 times’ to ‘more than 9 times.’

18
General bullying scores were the mean of student answers on five aggression items (e.g.,
“How many times have you teased someone?”; Time 1 Cronbach’s α = .70, Time 2
Cronbach’s α = .78). General victimization scores were the mean of student answers on
five victimization items (e.g., “How many times were you teased by someone?”; Time 1
Cronbach’s α = .71, Time 2 Cronbach’s α = .80). Physical bullying scores were the mean
of student answers on two physical bullying items (e.g., “How many times have you
punched, beaten or choked another child?; Time 1 Cronbach’s α = .54, Time 2
Cronbach’s α = .73). Physical victimization scores were the mean of student answers on
two physical victimization items (e.g., “How many times were you punched, beaten or
choked by another child?”; Time 1 Cronbach’s α = .57, Time 2 Cronbach’s α = .66).
Social/verbal bullying scores were the mean of student answers on four social/verbal
bullying items (e.g., “How many times have you teased someone?”; Time 1 Cronbach’s α
= .56, Time 2 Cronbach’s α = .75). Social/verbal victimization scores were the mean of
student answers on four social/verbal victimization items (e.g., “How many times were
you teased by someone?”; Time 1 Cronbach’s α = .54, Time 2 Cronbach’s α = .72).
Racial bullying and victimization scores were student answers on one racial
bullying/victimization item (“How many times have you bullied/been bullied about your
race since the beginning of the school year?”).
Bullying and Victimization – High School Sample. For the high school sample, an
abbreviated version of the Bullying and Victimization Student Questionnaire (Olweus,
1989) was also used to measure participants’ involvement in bullying behavior. In the
high school version, this self-report questionnaire included 12 questions asking
respondents to identify how often they had been involved in bullying behaviors in the

19
past six months. Participants responded to each question on a 5-point scale (0 = “never”;
4 = “always”). General bullying scores were the mean of student answers on eight
aggression items (Time 1 Cronbach’s α = .85, Time 2 Cronbach’s α = .87). General
victimization scores were the mean of student answers on eight victimization items (Time
1 Cronbach’s α = .86, Time 2 Cronbach’s α = .87). Physical bullying scores were the
mean of student answers on five physical bullying items (e.g., slapping, kicking or biting
another person; Time 1 Cronbach’s α = .86, Time 2 Cronbach’s α = .87). Physical
victimization scores were the mean of student answers on two physical victimization
items (e.g., slapping, kicking, or biting done to you; Time 1 Cronbach’s α = .86, Time 2
Cronbach’s α = .87). Social bullying scores were the mean of student answers on three
social bullying items (e.g., telling rumors or mean lies to make a person unpopular; Time
1 Cronbach’s α = .77, Time 2 Cronbach’s α = .75). Social victimization scores were the
mean of student answers on three social/verbal victimization items (e.g., rumors or mean
lies being told about you to make you unpopular; Time 1 Cronbach’s α = .76, Time 2
Cronbach’s α = .77). Racial bullying questions were not included on the high school
questionnaire, therefore, racial bullying could not be examined in this sample.
Results
The prevalence of bullying and victimization in the two samples by racial group
can be found in Table 1. Z-scores for proportions with a Bonferroni correction were used
to compare the proportion of students involved in bullying and victimization between
each racial group. In the elementary school sample, a higher proportion of African-
Canadian students were involved in physical bullying at Time 1 than both European-
Canadian (z = -3.62, p < .001) and Asian-Canadian students (z = -4.02; p < .001). In

20
addition, a greater proportion of African-Canadian students (z = -4.00, p < .001) were
racially victimized at Time 1 compared to European-Canadian students, whereas more
Asian-Canadian students (z = -3.75, p < .001), African-Canadian students (z = -4.14, p <
.001), and students in the ‘Other’ racial group (z = -4.15, p < .001) were racially
victimized than European-Canadian students at Time 2. The most notable difference
between racial groups was that visible minority racial groups in elementary school
reported significantly more racial victimization than did European-Canadian students. In
the high school sample, the proportion of students who bullied and were victimized in
each racial group did not significantly differ although a higher proportion of students in
the ‘Other’ racial group were involved in social bullying at Time 2 than African-
Canadian students (z = -3.82; p < .001). Z-scores for proportions also indicated that there
were significantly more adolescents in the ‘Other’ racial group with immigrant status
scores greater than zero in both the elementary school (z = -2.02; p < .05) and high school
samples (z = -2.34; p < .05).
The correlations of the variables of interest for the elementary and high school
sample can be found in Tables 2 and 3, respectively. In the elementary school sample,
immigrant status was significantly related with physical victimization at Time 2. As well,
the different types of bullying and victimization were generally significantly positively
related to each other. The exception to this finding was that racial bullying and
victimization at Times 1 and 2 were not related to the other forms of bullying at both time
points. In the high school sample, immigrant status was significantly related to social
victimization at Time 1, and all forms of bullying and victimization were significantly
related to one another.

21
A series of multiple regressions were conducted in both the elementary school and
high school samples. For each sample, a different regression was conducted with each
type of bullying and victimization at Time 2 included as the outcome variable. Grade,
sex, race, immigrant status, bullying and victimization at Time 1, and their interactions
were included as predictors in each model. Simultaneous regressions were conducted
such that variables and interactions that did not significantly contribute to the overall
accuracy of a model were removed. The final regression results for the bullying and
victimization analyses can be found in Tables 4 to 7. Simple slopes analyses were used to
interpret all significant interactions (Aiken & West, 1991).
General Bullying
The overall model for predicting general bullying was significant for both
elementary school, R² = .29; F(14,448) = 12.80, p < .001, and high school, R² = .49;
F(7,358) = 15.76, p < .001. In elementary school, grade was a significant predictor of
general bullying, with increasing general bullying in higher grades. A significant effect
was also found for general bullying and victimization at Time 1. Also in the elementary
school sample, the interaction between race and immigrant status was significant;
t(1,462) = 2.69, p <.01. This means that compared to European-Canadian students,
students from ‘Other’ racial groups of increasing immigrant status had increased general
bullying at Time 2. In high school, however, the only significant effect was that general
bullying at Time 1 was a significant predictor of general bullying at Time 2.
Physical Bullying
The overall model for predicting physical bullying at Time 2 was also significant
in elementary school, R² = .25; F(12,450) = 12.80, p < .001, and high school, R² = .22;

22
F(10,355) = 10.00, p < .001. In the elementary school sample, sex was a significant
predictor, with more boys engaging in physical bullying at Time 2 than girls did.
Significant effects were also found for both physical bullying at Time 1 and physical
victimization at Time 1. In addition, a significant interaction between immigrant status
and physical bullying at Time 1 was found (t(1,462) = 3.61, p <.001), indicating that
physical bullying at Time 1 positively predicted physical bullying at Time 2 with
increased immigrant status scores. This finding was not expected given our prediction
that students with higher immigrant status scores would report more victimization, rather
than report engaging in more bullying. Significant interactions were also found in the
elementary sample between physical bullying at Time 1 and each of the three racial
minority racial groups: Asian-Canadians (t(1,462) = -3.21, p <.01), African-Canadians
(t(1,462) = -3.39, p <.01, and the ‘Other’ racial group (t(1,462) = -2.95, p <.01). These
interactions indicated that all three groups had a weaker relationship between physical
bullying at Time 1 and physical bullying at Time 2 compared to European-Canadian
students.
Some similar main effects were found in the high school sample including sex
and physical bullying at Time 1 predicting physical bullying at Time 2. However, grade
was the only other significant effect in this sample, with decreased physical bullying with
increasing grade. Unlike the elementary school sample, no interactions were significant
in this sample.
Social Bullying
The overall model for predicting social bullying at Time 2 was significant for
both the elementary school students, R² = .27; F(11,451) = 15.50, p < .001, and the high

23
school students, R² = .26; F(7,357) = 17.50, p < .001. For the elementary school students,
significant effects were found for both social bullying and social victimization at Time 1.
As with general bullying, a significant interaction was found between race and immigrant
status (t(1,462) = 2.12, p <.05). Compared to European-Canadian students, students from
‘Other’ racial groups of increasing immigrant status had increased levels of social
bullying at Time 2. In the high school sample, social bullying and victimization at Time 1
were the only significant effects.
Racial Bullying - Elementary School
The overall model for racial bullying at Time 2 was significant, R² = .10; F(8,454)
= 6.10, p < .001. As expected, increased racial bullying at Time 1 predicted increased
racial bullying at Time 2. In addition, a significant interaction was found between
immigrant status and racial bullying at Time 1 (t(1,462) = -2.71, p <.01). Simple slopes
analyses indicated that the relationship between racial bullying at Time 1 and racial
bullying at Time 2 was weaker with increasing immigrant status; hence, the relationship
was stronger for non-immigrant children. This was expected as immigrant children were
predicted to report less bullying involvement and more victimization than non-immigrant
children.
General Victimization
The overall model for general victimization was significant for both the
elementary school sample, R² = .38; F(10,452) = 28.20, p < .001, and the high school
sample, R² = .25; F(7,358) = 16.70, p < .001. In elementary school, sex was a significant
predictor of general victimization, with boys reporting more general victimization at
Time 2 than girls. Increased general victimization at Time 1 also significantly predicted

24
increased general victimization at Time 2 in elementary school students. In the high
school sample, however, general bullying and victimization were the only significant
effects.
Physical Victimization
The overall model for physical victimization at Time 2 was significant in
elementary school, R² = .30; F(10,452) = 19.20, p < .001, and high school, R² = .23;
F(11,354) = 9.30, p < .001. Similar effects were found for the elementary and high school
samples. As found with general victimization, sex was a significant predictor of physical
victimization at Time 2 in the elementary school sample, with more boys than girls
reporting physical victimization. Increased physical victimization at Time 1 also
predicted increased physical victimization at Time 2 for the elementary school students.
Like the elementary school students, high school boys reported increased physical
victimization at Time 2, and physical victimization at Time 1 also positively predicted
physical victimization at Time 2 in high school. In addition, being in a higher grade
predicted lower levels of physical victimization at Time 2 for the high school students.
Social Victimization
The overall regression model for social victimization at Time 2 was significant in
elementary school, R² = .36; F(11,451) = 23.40, p < .001 , and high school, R² = .24;
F(7,357) = 16.10, p < .001. In the elementary school sample, social victimization at Time
1 significantly and positively predicted social victimization at Time 2. As well, contrary
to our predictions, students from ‘Other’ racial groups reported significantly decreased
social victimization at Time 2 compared to European-Canadian students. A significant
interaction was also found between immigrant status and social victimization at Time 1

25
(t(1,462) = -2.15, p <.05). Simple slopes analyses revealed a stronger relationship
between social victimization at Time 1 and Time 2 for students with lower immigrant
status scores, which was also contrary to our hypotheses. Unlike the elementary school
sample, both social bullying and social victimization were significant effects in the high
school sample. No interactions were found in this sample.
Racial Victimization – Elementary School
As expected, race was a strong predictor of racial victimization at Time 2.
Belonging to a minority racial group predicted increased racial victimization at Time 2
than for European-Canadian students. The strongest relationship was found between
Asian-Canadian students and racial victimization at Time 2. Significant interactions were
also found between each racial group and racial victimization at Time 1: Asian-
Canadians (t(1,462) = 11.60, p <.001), African-Canadians (t(1,462) = 3.17, p <.01), and
the ‘Other’ racial group (t(1,462) = 2.48, p <.05). Belonging to a racial group other than
European-Canadian indicated a stronger relationship between racial victimization at Time
1 and Time 2 than for European-Canadian students. The relationship was strongest for
Asian-Canadian students, followed by African-Canadian, then those in ‘Other’ racial
groups.
Discussion
The purpose of the current study was to examine the relationship among specific
types of bullying and victimization, race, and immigrant status in a Canadian sample and
to determine if these relationships differed between early and late adolescence. For
elementary school students, findings revealed that being in a racial minority group was
strongly related to racial victimization in elementary school. As well, Asian-Canadian

26
elementary school students were the most consistently racially victimized over time.
Racial bullying in elementary school also consistently predicted both racial bullying and
racial victimization over time. Immigrant status was associated with increased physical
bullying over time and was also associated with increased general and social bullying
over time in early adolescents in ‘Other’ racial groups. A developmental pattern also
emerged indicating that bullying and victimization were more prevalent in elementary
school than in high school.
Racial bullying in elementary school appeared to be a unique type of bullying, as
it was not related to general, physical, or social bullying, but it was related to all three of
these types of victimization. As well, those who engaged in this type of bullying did so
consistently over time, indicating a relationship between increases in racial bullying and
victimization. This finding indicates that peers may reciprocate the aggressive styles of
interactions of those who racially bully by victimizing these individuals. In addition,
there seems to be continuity between racially bullying others and being racially
victimized. Thus, by marginalizing others as out-group members, those who racially
bully are in turn being marginalized as a racial out-group themselves. This pattern of
behavior is concerning because those who become perpetrators and who are also
victimized by bullying are most at risk for negative psychosocial outcomes (Haynie et al.,
2001). In addition, the salient out-group features of racial bullying and victimization may
place these “bully/victims” at an even higher risk for long-term negative consequences.
Identifying and supporting those who engage in racial bullying is important to prevent
these youth from continuing to marginalize others over time and to prevent them from
becoming high risk racial bully/victims.

27
In terms of at-risk groups, minority racial groups in this sample were at a higher
risk for racial victimization than their European-Canadian peers, but they did not appear
to be at a higher risk for other types of bullying and victimization. This specificity in
bullying involvement supports our hypothesis of an in-group bias based on race by
indicating that peers specifically marginalize racial minority groups based on overt racial
in-group preferences. The finding that European-Canadian students racially bullied others
was expected, as they are the majority racial in-group, but Asian-Canadian students were
also found to be perpetrators of racial bullying over time. In the current sample, Asian-
Canadian students represented the second largest racial group and also represent 7% of
the general Canadian population (Statistics Canada, 2008). The fact that both of these
groups engaged in racial bullying may imply that both groups attempt to assert their
social dominance by marginalizing others based on racial in-group affiliations. Due to
their own status as a large racial minority out-group, however, Asian-Canadian students
may be seen as a particularly threatening racial out-group and in turn be targeted and
victimized by others (Brewer, 1999). Indeed, African-American students represent the
second largest minority group in the United States (United States Census Bureau, 2009)
and have also been found to both bully others and be bullied themselves (McLaughlin,
Hilt, & Nolen-Hoeksema, 2007; Peskin, 2006). Further investigations are needed to
explore the influence of racial minority group size on engagement in racial bullying and
victimization in Canada.
Overall, immigrant status was related only to physical bullying in that an increase
in physical bullying over time was found for those with higher immigrant status scores.
Although English-language proficiency was not directly measured, higher immigrant

28
status scores may be related to lower English-language proficiency. For example,
Dawson and Williams (2008) reported more externalizing behaviors in Latino-American
children with lower English-language proficiency. Thus, a reduced ability to properly
express themselves verbally may have increased the likelihood of aggressive behavior in
the immigrant students in the current sample. Yeh and colleaugues (2008) stressed the
importance of communication in the adjustment process and for positive social
interaction between immigrant youth and their peers. Lower English-language
proficiency may also account for the observed interaction between immigrant status and
social victimization in the current study as higher immigrant status scores were related to
lower reported social victimization. Perhaps immigrant students with a limited
understanding of English do not perceive that they are being socially victimized due to
the subtle verbal nature of this type of victimization. Future research should explore the
impact of English-language proficiency on levels of reported victimization in Canadian
immigrant adolescents.
Early adolescent immigrants in the ‘Other’ racial groups may also represent an at-
risk group compared to their European peers with regards to general and social bullying.
The fact that ‘Other’ racial groups were overrepresented in participants with higher
immigrant status scores may account for this finding. As well, it is difficult to interpret
these findings as this group represents a heterogeneous racial group encompassing early
adolescents who did not identify with any of the larger minority groups. However, this
lack of identification with a large racial group, combined with being an immigrant, may
result in the perception of all other racial groups as being out-groups and may result in
increased bullying behaviors. In addition, these marginalized students may have difficulty

29
forming a strong ethnic identity (Phinney, 1989, 1993), leading to further isolation and
hostility towards others. Engagement in bullying behaviors may indeed represent a
coping response for these students who do not feel they belong to a specific racial group.
The development of ethnic identity may also help explain the differential patterns
of results in the elementary and high school samples. Students in the high school sample
showed a lower prevalence of bullying, with less variability in these behaviors than the
elementary school sample, and all results relating race or immigrant status to bullying and
victimization were found in the elementary school sample only. The literature states that
prior to fully forming their ethnic identity, older adolescents engage in more identity
exploration than younger adolescents, thereby potentially reducing the racial in-group-
out-group bias (Phinney, 1993). As well, research has found an increase in positive social
desirability (i.e., greater desire to interact with children who are from a different racial
group) with development. Specifically, older adolescents are more likely than younger
children to interact with adolescents of other racial groups. In fact, younger racial
minority children tend to show stronger ethnic pride and hence an in-group bias, whereas
older adolescents tend to have more social integration (Marks et al., 2006). Future
research should further explore ethnic integration in older adolescence and examine the
mechanisms of social interaction between majority and minority youth as they mature to
test this hypothesis as it relates to bullying and victimization in the school environment.
This study had a number of limitations that may affect the generalizability of the
results. Some of the scales used in the current study had low reliability at certain time
points. And hence may have affected the strength of the relationships found. It should be
noted, however, that even the scales with relatively low reliability were still highly
30
correlated with similar scales at other time points, indicating that the underlying concepts
of these scales were similar. As well, the racial bullying and victimization scales had one
question. Future research should increase the number of questions in these scales to
increase reliability of this concept. In addition, questions related to racial bullying and
victimization were not included in the high school sample questionnaires and thus more
research is required on racial bullying in high school. Finally, only information on
generational and language status was collected in the current study regarding immigrant
status. No information was gathered about how long they had been in the country or what
their level of English proficiency was currently. Future research should explore this type
of information in order to better understand the other variables that may impact bullying
behavior in immigrant adolescent populations.
The present study adds to the current bullying literature by examining the
relationship among race and immigrant status and different types of bullying and
victimization during late childhood and early adolescence. This study demonstrated that
in a predominantly European-Canadian sample, racial bullying was related to later racial
bullying and victimization among elementary school children and that racial minority
adolescents, especially Asian-Canadians, are at increased risk to be racially victimized.
These findings bring attention to the long-term risks of engaging in racial bullying, to the
discrimination that minority youth face at school, and to the importance of specifically
addressing racial bullying in school bullying intervention programs. As well, further
examination of this type of behavior should be completed in order to understand the
social mechanisms (e.g., ethnic identity formation, out-group bias) that fuel this type of
discrimination and to address this problem at the school level. The current study also

31
revealed that adolescents who are immigrants and part of a smaller racial group might be
at an increased risk of engaging in bullying behaviors. Special attention should be paid to
these students in future research so that their experience as an out-group can be better
understood. More research on marginalized youth such as these will also help schools
become better equipped to support such students and lessen the social burden of bullying
and victimization of minority youth at school.

32
Tab
le 2
.1.E
lem
enta
ry a
nd h
igh
scho
ol b
ully
ing
and
vict
imiz
atio
n pr
eval
ence
by
perc
ent o
f rac
ial g
roup
.
Gen
eral
Ph
ysic
al
Soci
al
Rac
ial
T
ime
1 T
ime
2 T
ime
1 T
ime
2 T
ime
1 T
ime
2 T
ime
1 T
ime
2
Rac
ial G
roup
(ES/
HS)
E
S (%
) H
S (%
) E
S (%
) H
S (%
) E
S
(%)
HS
(%
) E
S (%
) H
S (%
) E
S (%
) H
S (%
) E
S (%
) H
S
(%)
ES
(%)
ES
(%)
Bul
lyin
g
Eur
opea
n (n
=
344/
280)
22
3
24
2 13
3
18
1 24
11
40
5
4 3
Asi
an (n
= 6
0/64
) 22
2
27
3 10
2
10
0 27
11
35
8
2 2
Afr
ican
(n =
19/
13)
53
0 32
0
47a,
b 0
16
0 42
8
47
0 0
0
Oth
er (n
= 4
0/9)
28
11
18
0
13
0 10
0
28
22
40
22c
0 0
Vic
timiz
atio
n
Eur
opea
n (n
=
344/
280)
38
3
31
1 28
1
29
1 41
10
55
6
3 1
Asi
an (n
= 6
0/64
) 32
3
32
5 27
3
28
3 35
11
45
13
10
10
a
Afr
ican
(n =
19/
13)
47
8 11
0
42
8 21
0
63
8 47
0
21a
16a
Oth
er (n
= 4
0/9)
35
0
15
0 15
0
20
0 40
0
48
11
13
13a
Note.
ES
= E
lem
enta
ry S
choo
l; H
S =
Hig
h Sc
hool
. a =
sig
nifi
cant
ly d
iffe
rent
from
Eur
opea
n; b
= s
igni
fica
ntly
dif
fere
nt fr
om A
sian
; c
= si
gnif
ican
tly d
iffe
rent
Afr
ican
(all p
< .0
01).

33
Tab
le 2
.2. C
orre
latio
ns a
mon
g st
udy
vari
able
s –
Ele
men
tary
sch
ool s
ampl
e.
Var
iabl
es
1 2
3 4
5 6
7 8
9 10
11
12
13
14
15
16
17
1. Im
mig
rant
Sta
tus
- -.0
6 -.0
08
-.07
-.10
-.07
-.02
.02
.09
-.06
-.08
-.06
-.10*
-.0
5 -.0
8 -.0
2 .0
9
2. G
ener
al B
ully
ing
T1
-
.64*
* .7
4**
.60*
* .9
4**
.55*
* .2
3**
.21*
* .4
9**
.35*
* .3
6**
.40*
* .5
0**
.37*
* .0
6 .1
7**
3. G
ener
al V
ictim
izat
ion
T1
- .5
6**
.82*
* .5
6**
.92*
* .2
3**
.26*
* .3
9**
.60*
* .3
2**
.51*
* .4
2**
.60*
* .1
6**
.17*
*
4. P
hysi
cal B
ully
ing
T1
-
.67*
* .4
8**
.39*
* .1
5**
.08
.36*
* .3
1**
.38*
* .3
7**
.31*
* .2
4**
-.01
.09
5. P
hysi
cal V
ictim
izat
ion
T1
- .4
5**
.54*
* .2
2**
.20*
* .3
7**
.50*
* .4
0**
.52*
* .3
5**
.43*
* .1
3**
.14*
*
6. S
ocia
l Bul
lyin
g T
1
- .5
4**
.24*
* .2
3*
.46*
* .3
1**
.27*
* .3
3**
.49*
* .3
6**
.08
.18*
*
7. S
ocia
l Vic
timiz
atio
n T
1
-
.20*
* .2
4**
.33*
* .5
4**
.20*
* .4
0**
.39*
* .5
8**
.15*
* .1
5**
8. R
acia
l Bul
lyin
g T
1
- .5
5**
.03
.05
.19*
* .1
7**
.08
.08
.27*
* .2
4**
9. R
acia
l Vic
timiz
atio
n T
1
-
.02
.09
.09*
.1
8**
.07
.10*
.1
7**
.51*
*
10. G
ener
al B
ully
ing
T2
-
.57*
* .6
6**
.53*
* .8
9**
.52*
* .0
9 .0
7
11. G
ener
al V
ictim
izat
ion
T2
- .4
6**
.75*
* .5
1**
.88*
* .1
8**
.17*
*
12. P
hysi
cal B
ully
ing
T2
-
.68*
* .5
2**
.39*
* .1
1*
.06
13. P
hysi
cal V
ictim
izat
ion
T2
- .5
0**
.63*
* .2
6**
.21*
*
14. S
ocia
l Bul
lyin
g T
2
- .5
8**
.18*
* .1
1*
15. S
ocia
l Vic
timiz
atio
n T
2
-
.22*
* .1
5**
16. R
acia
l Bul
lyin
g T
2
- .0
7
17. R
acia
l Vic
timiz
atio
n T
2
-
Note. T
1 =
Tim
e 1;
T2
= T
ime
2.
*p <
.05,
2-t
aile
d; **p
< .0
1, 2
-tai
led.

34
Tab
le 2
.3. C
orre
latio
ns a
mon
g st
udy
vari
able
s –
Hig
h sc
hool
sam
ple.
V
aria
bles
1
2 3
4 5
6 7
8 9
10
11
12
13
1. Im
mig
rant
Sta
tus
- -.0
8 -.0
9 -.0
8 -.0
5 -.0
7 -.1
0*
-.01
-.09
-.04
-.07
.03
-.08
2. G
ener
al B
ully
ing
T1
-
.71*
* .8
4**
.64*
* .8
4**
.58*
* .4
7**
.44*
* .4
3**
.40*
* .3
9**
.38*
*
3. G
ener
al V
ictim
izat
ion
T1
- .7
2**
.86*
* .4
7**
.88*
* .3
7**
.46*
* .3
7**
.42*
* .2
7**
.39*
*
4. P
hysi
cal B
ully
ing
T1
-
.83*
* .4
2**
.43*
* .3
6**
.37*
* .4
3**
.41*
* .1
8**
.23*
*
5. P
hysi
cal V
ictim
izat
ion
T1
- .2
5**
.50*
* .2
7**
.37*
* .3
5**
.42*
* .1
1*
.23*
*
6. S
ocia
l Bul
lyin
g T
1
- .5
6**
.44*
* .3
7**
.29*
* .2
5**
.48*
* .4
0**
7. S
ocia
l Vic
timiz
atio
n T
1
-
.37*
* .4
3**
.30*
* .3
1**
.35*
* .4
5**
8. G
ener
al B
ully
ing
T2
-
.88*
* .8
9**
.84*
* .8
6**
.70*
*
9. G
ener
al V
ictim
izat
ion
T2
- .8
1**
.88*
* .7
2**
.88*
*
10. P
hysi
cal B
ully
ing
T2
-
.92*
* .5
2**
.50*
*
11. P
hysi
cal V
ictim
izat
ion
T2
- .5
3**
.55*
*
12. S
ocia
l Bul
lyin
g T
2
- .7
3**
13. S
ocia
l Vic
timiz
atio
n T
2
-
Note. T
1 =
Tim
e 1;
T2
= T
ime
2.
*p <
.05,
2-t
aile
d; **p
< .0
1, 2
-tai
led.

35
Table 2.4. Elementary school multiple regressions of bullying over time. General Bullying T2 Physical Bullying T2 Social Bullying T2 Racial Bullying T2
Variables β B SE β B SE β B SE β B SE
Grade T1 .09* .08 .04 .07 .08 .05 - - - - - - Sex -.07 -.10 .07 -.12** -.25 .09 -.04 -.13 .12 -.08 -.03 .02
Asian -.06 -.13 .15 -.08 -.25 .09 -.04 -.16 .29 -.03 -.01 .03 African -.03 -.11 .29 -.06 -.30 .24 -.03 -.22 .51 -.03 -.02 .04
Other -.05 -.14 .12 -.06 -.20 .15 -.04 -.20 .23 -.04 -.02 .03 Immigrant Status -.10 -.06 .03 .01 .01 .04 -.04 -.04 .06 .004 0 .00
7 Bullying T1 .44*** .49 .07 .42*** .61 .10 .40*** .86 .10 .23*** .14 .03 Victimization T1 .11* .10 .05 .20** .21 .06 .16** .32 .09 .04 .02 .02
Grade X Sex - - - - - - - - - - - - IS X Bullying T1 - - - .18*** .21 .06 - - - -.13** -.07 .02
Bullying T1 X Asian -.03 -.09 .13 -.17** -.65 .20 - - - - - -
Bullying T1 X African -.04 -.12 .17 -.18** -.70 .21 - - - - - -
Bullying T1 X Other -.03 -.10 .17 -.13** -.56 .20 - - - - - -
IS X Asian .05 .06 .09 - - - -.001 -.003 .18 - - -
IS X African .01 .02 .18 - - - -.03 -.12 .34 - - - IS X Other .14** .25 .09 - - - .10* .34 .16 - - -
R² (adjusted) .26 .23 .26 .08
Note. T1 = Time 1; T2 = Time 2. ; IS = Immigrant Status; - = variable not included in final model. *p < .05; **p < .01; ***p < .001

36
Table 2.5. Elementary school multiple regressions of victimization over time. General Victimization
T2 Physical Victimization
T2 Social Victimization
T2 Racial Victimization
T2 Variables β B SE β B SE β B SE β B SE
Grade T1 - - - - - - - - - - - - Sex -.10* -.17 .07 -.16*** -.39 .11 -.03 -.10 .12 -.04 -.02 .02
Asian .02 .04 .16 .02 .06 .16 -.04 -.20 .29 .32*** .26 .04 African -.02 -.07 .29 .01 .09 .27 -.02 -.17 .52 .17*** .24 .06
Other -.07 -.21 .13 -.02 -.08 .18 -.10* -.56 .23 .21*** .20 .05 Immigrant Status -.06 -.04 .04 -.07 -.06 .04 -.05 -.06 .06 .04 .01 .01
Bullying T1 -.04 -.05 .06 .05 .08 .10 .09 .20 .11 .15** .16 .05 Victimization T1 .60*** .62 .05 .41*** .51 .07 .53*** 1.12 .10 .06 .04 .05
IS X Victimization T1
- - - - - - -.08* -.13 .06 .11 .05 .03
Victimization T1 X Asian - - - .05 .18 .15 - - - .43*** .53 .07
Victimization T1 X African - - - .02 .12 .23 - - - .24*** .48 .10
Victimization T1 X Other - - - -.02 -.12 .21 - - - .12* .22 .09
IS X Asian .02 .03 .10 - - - .04 .10 .18 - - - IS X African -.04 -.10 .19 - - - -.05 -.26 .34 - - -
IS X Other .08 .17 .09 - - - .08 .29 .16 - - - Adjusted R² .37 .28 .35 .41
Note. T1 = Time 1; T2 = Time 2. ; IS = Immigrant Status; - = variable not included in final model. *p < .05; **p < .01; ***p < .001.

37
Table 2.6. High school multiple regressions of bullying over time. General Bullying
T2 Physical Bullying T2 Social Bullying T2
Variables β B SE β B SE β B SE Grade T1 - - - -.18* -.07 .03 - - - Sex -.07 -.04 .03 -.12* -.07 .03 -.01 -.004 .04 Asian .03 .02 .04 -.03 -.02 .04 .09 .09 .05 African -.06 -.09 .07 -.05 -.07 .07 -.05 -.11 .10 Other .02 .03 .08 -.01 -.02 .08 .05 .13 .12 Immigrant Status .03 .01 .01 .03 .01 .01 .03 .01 .02
Bullying T1 .40*** .39 .06 .47*** .46 .09 .41*** .36 .05
Victimization T1 .08 .08 .06 -.05 -.05 .09 .13* .12 .05
Grade X Sex - - - .14 .06 .04 - - - IS X Bullying T1 - - - .09 .07 .04 - - -
Bullying T1 X Asian - - - - - - - - -
Bullying T1 X African - - - - - - - - -
Bullying T1 X Other - - - - - - - - -
IS X Asian - - - - - - - - - IS X African - - - - - - - - - IS X Other - - - - - - - - - R² (adjusted) .22 .20 .24 Note. T1 = Time 1; T2 = Time 2. ; IS = Immigrant Status; - = variable not included in final model. *p < .05; **p < .01; ***p < .001.

38
Table 2.7. High school multiple regressions of victimization over time. General Victimization
T2 Physical
Victimization T2 Social Victimization
T2 Variables β B SE β B SE β B SE Grade T1 - - - -.09* -.03 .02 - - - Sex -.06 -.03 .03 -.12* -.06 .03 -.004 -.003 .04 Asian .02 .02 .04 -.02 -.01 .04 .05 .05 .05 African -.05 -.07 .07 -.02 -.03 .07 -.04 -.09 .10 Other -.01 -.01 .08 -.02 -.03 .08 .004 .01 .12 Immigrant Status -.04 -.01 .01 -.03 -.01 .01 -.05 -.02 .02
Bullying T1 .22** .22 .06 .12 .12 .08 .22*** .20 .05 Victimization T1 .30*** .28 .06 .33** .33 .10 .32*** .28 .05
IS X Victimization T1
- - - - - - - - -
Victimization T1 X Asian - - - -.05 -.08 .10 - - -
Victimization T1 X African - - - -.09 -.32 .19 - - -
Victimization T1 X Other - - - .02 .25 .50 - - -
IS X Asian - - - - - - - - - IS X African - - - - - - - - - IS X Other - - - - - - - - - Adjusted R² .23 .20 .23 Note. T1 = Time 1; T2 = Time 2. ; IS = Immigrant Status; - = variable not included in final model. *p < .05; **p < .01; ***p < .001.

39
CHAPTER THREE
RACIAL BULLYING AND VICTIMIZATION IN CANADIAN SCHOOL-AGED
CHILDREN: INDIVIDUAL AND SCHOOL LEVEL EFFECTS
Anne-Claire Larochette & Wendy M. Craig
Queen’s University

40
Abstract
Numerous individual factors, including race, have been identified to date that may
place children at risk for bullying involvement. The importance of the school’s
environment on bullying behaviors has also been highlighted, as the majority of
bullying occurs at school. The variables associated with racial bullying and
victimization, however, have rarely been specifically examined. The purpose of the
current study, therefore, was to determine which individual- and school-level factors
are associated with racial bullying and victimization. Canadian records from the
2001/2002 Health Behaviors in School-Aged Children Survey (HBSC) were used for
the current analyses. Participants included 3,684 students and their principals from
116 schools from across the country. Results indicated that racial bullying and racial
victimization were more strongly related to individual factors such as race and sex
than school-level factors. African-Canadian students were found to engage in racial
bullying as well as report being racially victimized. In addition, school climate did
not account for observed differences between schools on racial bullying and
victimization, but racial bullying appeared to decrease in supportive schools with
higher teacher diversity.

41
Racial bullying and victimization in Canadian school-aged children:
Individual and school level effects
Bullying is a serious relationship problem in which children use power through
frequent acts of aggression to intimidate and control others, and make others feel
powerless in their relationships (Pepler, Craig, & O’Connell, 1999). Research in this area
has outlined the severe mental health consequences associated with both bullying others
and being victimized by bullying (Houbre, Tarquinio, Thuillier, & Hergott, 2006). To
date, numerous individual factors have been identified that can place children and
adolescents at risk for involvement in bullying behaviors including gender, age, low self-
esteem, and social anxiety (Egan & Perry, 1998; Ma, 2002; Slee, 1994). Race has also
been identified as an individual risk factor for bullying involvement (Peskin, Tortolero, &
Markham, 2006; Spriggs et al., 2007), providing evidence for an in-group bias based on
race in children (Aboud, 1988; Larochette, Craig, Pepler, & Connolly, submitted). Focus
in the bullying literature has slowly turned to the examination of bullying within a
broader ecological perspective (Bronfenbrenner, 1977), including the study of bullying
within the school context. Studies reveal that school characteristics can impact rates of
bullying and victimization (Ma, 2002), but little research has examined the impact of
school climate on specific forms of bullying, such as racial bullying, in a Canadian
context. The aim of the current study was to explore what factors influence racial
bullying and victimization both at the individual and school levels.
Race may be an individual risk factor for bullying and victimization based on the
theory of in-group bias. This theory states that individuals form in-groups based on
shared characteristics, and those who are not included in the in-group are considered

42
members of the out-group. Out-group members are perceived as threatening and
dissimilar to members of the in-group, and these both groups can be formed on the basis
of race (Doyle & Aboud, 1995). Racial prejudice and hostile behavior between racial
groups both can manifest as a result of these strong group affiliations (Aboud, 1988).
Strong affiliations with in-group members based on race begin at a young age. European
children demonstrate a strong pro-European/anti-African bias as young as 3 years old
(Katz & Kofkin, 1997), and minority children also express preference for their racial
group after the age of 7 (Clark & Clark, 1947). Children of European descent aged 7 to
10 years old also rated out-group members of a different ethnicity as more different than
out-group members of the same ethnicity (Nesdale, Griffiths, Durkin, & Maass, 2007).
Racial majority children may also develop in-group biases based on race as a function of
their parents’ racial attitudes (White & Gleitzman, 2006), stereotypic beliefs held towards
a racial minority group (Slone, Tarrasch, & Hallis, 2006), or by lack of exposure to racial
minority groups (Kowalski, 1998). Racial prejudices held by children and adolescents
can, however, develop into aggressive behavior towards peers of different racial groups
in the form of bullying.
Evidence from current research suggests an increased risk of bullying
involvement in certain racial minority groups as a result of this in-group bias based on
race. Recently, Spriggs and colleagues (2007) found that Hispanic-American students
were more frequently victimized by bullying than their African-American or European-
American peers. Hanish and Guerra (2000) also identified Hispanic-American students as
most at risk of being victimized by their peers in a predominantly African-American and
Hispanic-American school. Socioeconomic status has also been found to influence

43
bullying involvement in racial minority youth. For example, Peskin, Tortolero, and
Markham (2006) found that African-American students of low socioeconomic status
were at a higher risk of involvement in bullying and victimization than were Hispanic-
American students. Furthermore, sex may also play a role in the bullying involvement of
minority youth as McLaughlin and colleagues (2007) identified African-American
adolescent boys who represent a minority group in their school as the most overtly
aggressive and the most likely to physically fight with others at school. Studies from
different regions differ in their findings regarding at-risk racial minority groups. One
British study, for example, identified children of Asian descent as being at a higher risk
of being racially bullied (Eslea & Mukhtar, 2000). Like general bullying, peer racial
discrimination can have serious long-term consequences. Brody and colleagues (2006)
found that more perceived discrimination in African-American adolescents was
associated with the development of conduct problems and depressive symptoms five
years later. The first study in this thesis indicated that Asian-Canadian students might be
at risk for bullying involvement in Canada due to racial in-group biases. Little is known,
however, about what other individual factors may lead to racial bullying and racial
victimization in Canadian students. The current study aims to determine which individual
characteristics (sex, age, SES, race) are associated with racial bullying and racial
victimization in a large Canadian sample of school-aged children.
It is not enough, however, to explore individual risk factors such as race in
bullying and victimization in isolation. Current research has increasingly acknowledged
that bullying must be examined from a broader ecological perspective. Ecological
systems theory, as posited by Bronfenbrenner (1977), emphasizes the development of

44
individual behavior within a number of interconnected social environments known as the
microsystem, the mesosystem, the exosystem, and the macrosystem. The microsystem,
the immediate environment in which a child lives, has been the subject of extensive
research as this theoretical system includes the child’s parents, peer groups, and school,
and is where the child’s most direct social learning occurs. Lerner’s (1986)
developmental contextualism framework also emphasizes multiple levels of organization
in human life ranging from the biological level (e.g., genes), the social relational level
(e.g., peer groups), the sociocultural level (e.g., school system), and physical ecologies
(e.g., natural and built physical surroundings). Lerner (1996) postulated that a systems
perspective of behavior and development should be adopted such that variables
associated with one level of organization are studied in relation to variables associated
with another level of organization to capture their interconnected nature. Only by
examining human behavior at multiple levels could the dimensions of a given variable be
properly analyzed.
Researchers have embraced this ecological perspective by studying bullying
involvement within the broader context of the school, as the majority of individual
bullying behaviors occur within this complex social system (Olweus, 1993). School
climate, for instance, is defined as the values, beliefs, and attitudes that impact the
relationships between students, teachers, and administrators at school (Emmons, Comer,
& Haynes, 1996) and plays an important role in moderating the behaviors and
interactions of its students (Kuperminc et al., 1997). For example, students who reported
good disciplinary climates at their schools also reported less bullying (Ma, 2002), and
students who reported poor perceptions of their school climate were more likely to

45
engage in bullying and delinquent behavior (Kuperminc, Leadbeater, & Blatt, 2001).
Wilson (2004) specifically studied students’ feelings of school connectedness and found
that a feeling of having a strong relationship with teachers and other students predicted
less frequent involvement in bullying and victimization. Aspects of school climate are
particularly useful to examine with respect to bullying because they represent features
that schools can control and improve upon, thus having practical implications for change.
The school context, including student and teacher diversity, can set the stage for
the formation of specific in-groups and out-groups, resulting in vulnerabilities to bullying
and prejudice for certain racial minority children. For example, Verkuyten and Thijs
(2002) investigated the classroom-level factors affecting racial victimization in children
of different ethnic backgrounds in The Netherlands. They found that ethnic minority
children reported more incidences of racism when they were a numerical minority within
their classroom. This study also revealed that fewer children reported incidences of racial
bullying when they felt that they could tell their teacher and that the teacher would help
them. In addition, levels of racial diversity within schools can impact peer victimization,
with ethnically integrated schools providing a higher risk of victimization for European-
American children in one elementary school sample (Hanish & Guerra, 2000). Compared
to European-American children, African-American children also received more favorable
peer nominations as a function of an increased representation within their classroom and
the race of their teacher (Jackson, Barth, Powell, & Lochman, 2006). This finding
highlights the importance of the social impact of both student diversity and teacher
diversity within a school, and their potential impact on racial group relations. In addition,
Spriggs et al. (2007) also found that school satisfaction was related to bullying for

46
African-American and Hispanic-American students and that feeling unsafe at school was
related to victimization for European-American students in an ethnically diverse school.
Racial mixing and racial fairness are also strongly related to student integration attitudes
and behaviors (Walberg & Genova, 1983). Lawrence (2005) found that teachers’
perceptions of antiracist classroom programs were more optimistic when they also
reported a positive school climate, highlighting the importance of school climate in
supporting such initiatives. Currently, limited research has examined the influence of
specific aspects of school climate, such as school cohesion, school safety, and school
satisfaction, which may have a significant impact on the social interactions of students
and, hence, the level of racial bullying and victimization found within a school. As well,
no Canadian studies have examined the impact of student and teacher diversity within
schools on reports of racial bullying. The present study aims to combine the examination
of individual factors and school climate factors to better understand racial bullying and
racial victimization within a school context.
The current study had three primary objectives. 1) To determine if specific
individual-level factors (sex, age, SES, race) predict racial bullying and racial
victimization in a nationally representative Canadian sample of adolescents. At the
individual level, we hypothesized that being male, younger, of lower socioeconomic
status, and a racial minority would predict higher levels of both racial bullying and racial
victimization. 2) To determine if specific school-level factors (diversity, school climate)
predict racial bullying and racial victimization. We hypothesized that higher levels of
student and teacher diversity and more positive ratings of school climate would predict
less racial bullying and racial victimization. 3) To determine if schools vary on racial

47
bullying and racial victimization and how much of this variance is accounted for by
individual and school-level factors. We hypothesized that schools would vary on reports
of racial bullying and victimization and that the individual and school level factors named
above would predict the majority of this variance.
Methods
Study Design
The current study was based on Canadian records from the World Health
Organization’s 2001/2002 Health Behavior in School-Aged Children Survey (HBSC).
The HBSC is a cross-national research collaboration initiated in 1982 with the aim of
identifying factors that influence youth health and social behaviors. The 2001/2002
HBSC survey involved the administration of cross-sectional surveys in 36 different
countries to children aged 11-15 years old and their school principals (Currie et al.,
2001). The international protocol involved the selection of classes within schools by
using a weighted probability technique to ensure that students were equally likely to be
included and that the sample was representative by regional geography and key
demographic features (community size, school size, etc.). Selected students and
principals were administered an anonymous paper questionnaire in their classroom and
school setting, respectively, that included questions about a variety of topics. For
students, questionnaire items asked about demographic characteristics, social behaviors,
and reports of school climate, whereas principal questionnaire items addressed school-
wide demographic characteristics and the availability of certain school programs.

48
Participants
Participants were selected from an original sample of 7,235 Canadian students
and 170 principals from their schools. Due to missing data from students and principals
on variables of interest, 3,551 students were excluded, resulting in a final sample of 3,684
students and 116 principals. The final sample consisted of students from grades 6-10. Of
these students, 56% were female, and students were evenly represented across grades,
with 25.9% in Grade 6, 20.8% in Grade 7, 19% in Grade 8, 18% in Grade 9, and 16.2%
in Grade 10. Students were predominantly European-Canadian (90.1%), but racial
minorities were also represented in the sample, with 1.6% identifying as African-
Canadian, 2.7% as East Asian-Canadian (e.g., Chinese, Japanese), 2% as Native-
Canadian, 1.8% as South Asian-Canadian (e.g., Filipino), and 1.8% as South East Asian-
Canadian (e.g., Indian). Principals reported that their schools ranged in size from 118
students to 1528 students, with a mean school size of 517 students (SD = 335.9).
Principals reported on average that 14.4% of students in their schools were visible
minorities (SD = 21.4), and that 19.8% were from disadvantaged families (SD = 17.0).
Measures
Dependent Variables
Racial bullying and victimization. Reported experiences of racial bullying and
victimization were measured using two items with 5-point Likert-type scales. For racial
victimization, students were asked how often they had been bullied because of their race
or color in the past couple of months (1 = I have not been bullied in this way in the past
couple of months; to 5 = Several times a week). For racial bullying, students were asked

49
how often they had bullied other students because of their race or color in the past couple
of months.
Independent Variables
Independent variables were separated into two levels for the current analysis.
Level-1 independent variables represented the individual-level variables and were based
on responses from students regarding individual characteristics. Level-2 independent
variables represented the school-level variables and were based on principals’ responses
and school aggregates of students’ responses regarding school characteristics.
Individual-Level Variables
Demographics and bullying
The demographic variables that were entered at Level-1 were sex, grade,
socioeconomic status, and race. Sex was dummy coded as male = 0 and female = 1, and
grade was included as a continuous variable from 6-10. Race was also dummy coded,
with European-Canadian as the reference group. Socioeconomic status was computed
based on the four-item Family Affluence Scale (FAS; Currie et al., 1997) developed for
the HBSC survey. The scale is a sum of four items about a variety of indicators of family
wealth: “Does your family own a car, van, or truck?” (No = 0, Yes = 1); “Do you have
your own bedroom for yourself?” (No = 0, Yes = 1); “During the past 12 months, how
many times did you travel away on holiday with your family?” (Not at all = 1, Once = 2,
Twice = 3, More than twice = 4); and, “How many computers does your family own?”
(None = 1, One = 2, Two = 3, More than two = 4). A summed score ranging from 0-2 is
considered low, 3-5 is considered medium, and 6-9 is considered high. In the current
sample, 3.2% had low scores, 39.7% had medium scores, and 57.2% had high scores.

50
General bullying and general victimization were also entered as control variables at
Level-1 because these behaviors are closely related to racial victimization and bullying,
respectively, and they often co-occur. As well, general bullying and victimization were
entered into the models as control variables to control for children who were both
bullying others and being victimized. General bullying and victimization were each
measured with one item asking students how often they had taken part in bullying, or
how often they had been bullied, in the past couple of months. Students answered on a 5-
point Likert-type scale (1 = I haven’t bullied/been bullied in the past couple of months; to
5 = Several times a week). School-Level Variables
School diversity. School diversity was measured using two items on the principal
questionnaire. Student diversity within schools was measured with one item asking
principals what percentage of the students in their school were visible minorities. Teacher
diversity within schools was measured with one item asking principals how many
teachers in their school were visible minorities. This number was converted to a
percentage by dividing by the total number of teachers in the school, as reported by the
principals.
School climate. Specific aspects of school climate were measured with 13 items
on the student questionnaire comprising three different subscales. A Principal Axis Factor
Analysis of the items was conducted and all factor loadings were above .54. The school
safety subscale was comprised of the average of four items asking students how safe and
fair their school is (α = .82; e.g., I feel safe at this school). The school support subscale
was comprised of the average of five items asking students how much they feel they
receive help and support at their school (α = .84; e.g., Our teachers treat us fairly). The

51
school peer cohesion subscale was comprised of the average of four items asking students
how much peer support and cohesion they feel at their school (α = .78; e.g., Most of the
students in my class are kind and helpful).
Results
Data Analyses
To determine if the prevalence of racial bullying and victimization varied
according to school-level context, multi-level regressions were conducted using
Hierarchical Linear Modeling (HLM) software designed by Raudenbush, Bryk, and
Congdon (HLM Version 6.06; 2008). Students (Level-1) were nested within schools
(Level-2) with the following Level-1 predictors: sex, SES, grade, and race. Grade was
centered on the grand mean for all schools. General bullying was entered as a control
variable at Level-1 for racial victimization as the outcome, and general victimization was
also entered as a control variable at Level-1 when racial bullying was the outcome
variable. At Level-2, aggregate scores on the school climate subscales for each school
and student and teacher diversity were added as predictors, centered on the grand mean
for all schools. Outcomes were student reports of racial bullying and racial victimization.
Descriptive Statistics
Descriptive statistics for all continuous Level-1 and Level-2 variables were
calculated and are outlined in Table 1. As can be seen in Table 1, the means for racial and
general bullying and victimization were relatively low overall. In this sample, 3.5% of
students reported racially bullying others, and 4.4% of students reported being racially
victimized. General bullying and victimization were more prevalent in this sample, with
42.5% and 38% of students reporting involvement in these behaviors, respectively.

52
Aggressive behaviors such as racial bullying are normally infrequent, and the current
sample is representative of the general pattern of responses seen in the bullying literature.
Correlations among all continuous Level-1 and Level-2 variables were also
calculated and are outlined in Table 2. At the individual level, SES was not strongly
correlated with racial or general bullying and victimization, contrary to stated hypotheses.
Grade was weakly correlated with these variables, indicating no significant differences in
these behaviors at different ages. As expected, racial bullying and victimization were
weakly but significantly correlated with both general bullying and victimization,
indicating that students who engaged in racial bullying behaviors tended to engage in
general bullying behaviors. At Level-2, student and teacher diversity were strongly
positively correlated with one another and student diversity was related to student reports
of a safe and fair school. Teacher diversity was not significantly correlated to any of the
school climate variables. It was hypothesized, however, that these variables would
interact to predict racial bullying and victimization; therefore, the interactions of each
school climate variable and teacher diversity were included in the multilevel models. All
school climate variables were strongly positively correlated, indicating that students who
reported high scores on one school climate variable tended to report high scores on the
other school climate variables as well.
Multilevel Models
Multilevel models using HLM were constructed to test if specific aspects of
school climate accounted for individuals’ reports of racial bullying and racial
victimization over and above their own individual demographic characteristics and levels
of general bullying and victimization. First, a fully unconditional model was constructed

53
to determine the proportion of variance in these outcome measures that could be
accounted for by both within- and between-school differences. Second, a model including
just the Level-1 predictors was constructed to determine the proportion of additional
variance accounted for by only within-school differences. Finally, a model including both
Level-1 and Level-2 predictors as well as Level-2 interactions among teacher diversity
and school climate variables was constructed to determine the proportion of variance that
was accounted for by both individual and school variables combined. The results
presented for each analysis represent the final model after eliminating non-significant
interactions.
Racial Bullying
The results for the models constructed at each level with racial bullying as an
outcome are presented in Table 3. The variance components of the null model indicated
that 1.5% of the variance for racial bullying can be accounted for by variance across
schools and that 98.5% by variance within schools. Although the majority of the variance
could be accounted for by variance within schools, significant variation across schools
remained to be explained (χ2 = 172.09, p < .01).
The Level-1 model, which includes the individual-level variables only, revealed a
number of significant predictors of racial bullying. Specifically, being male, being older,
being African-Canadian, and experiencing general victimization were all significantly
associated with increased racial bullying. The addition of the Level-1 predictors into the
model accounted for an additional 2.7% of the individual variance among students. The
finding that being male was a significant predictor of racial bullying was consistent with
our stated hypotheses, but being older was contrary to our stated hypotheses. The fact that

54
being African-Canadian was a significant predictor of racial bullying was also not an
expected finding and was not in line with findings from the first study in this thesis.
The addition of the Level-2 variables into the model did not appear to add to the
model a great deal. The addition of the school-level variables in the model accounted for
an additional 0.7% of the variance observed between schools. With the addition of these
variables, being older was no longer significantly associated with racial bullying at
Level-1. Contrary to our stated hypotheses, at the school level, student diversity, teacher
diversity, and all three school climate variables were not significantly associated with
racial bullying. An interaction between teacher diversity and school support was
significantly associated with racial bullying (t(1,115) = -3.32, p < .01). Simple slopes
analyses were conducted to investigate the nature of the interaction between teacher
diversity and school support (Aiken & West, 1991). Results revealed that increased
school support was negatively related to racial bullying, and that this relationship was
stronger with higher levels of teacher diversity. Thus, schools with more racially diverse
teachers and a more supportive school climate showed less racial bullying.
Racial Victimization
The results for the models constructed for racial victimization as an outcome are
presented in Table 4. The variance components of the null model indicated that 2.9% of
the variance for racial victimization could be accounted for by variance across schools,
but that 97.1% of the variance could be accounted for by variance within schools. Thus,
more variance was accounted for across schools than within compared to racial bullying,
and significant variation across schools also remained to be explained (χ2 = 243.72, p <
.001).

55
When the individual-level variables were added to the Level-1 model, a number
of variables were significantly related to racial victimization. Reports of increased
general bullying were positively associated with increased racial victimization, and race
was also significantly positively associated with racial victimization for students who
were African-Canadian, East Asian-Canadian, Native-Canadian, and South East Asian-
Canadian. Sex, grade, and SES were not significantly associated with racial
victimization, contrary to our hypotheses. The addition of the Level-1 variables into the
model accounted for an additional 3% of the individual variance within schools.
Contrary to our hypotheses, the addition of the Level-2 variables into the racial
victimization model did not reveal any variables at the school level that were
significantly associated with racial victimization. As well, with the addition of the Level-
2 variables, many of the effects of the race variables at the individual level were no
longer significant, except for African-Canadian students. Being male and individual
reports of general bullying were both significantly associated with racial victimization in
this final model.
Discussion
The purpose of the present study was to determine which individual- and school-
level factors predicted racial bullying and racial victimization in a national sample of
Canadian school-aged children. The current results suggest that racial bullying and racial
victimization are better predicted by individual-level factors, such as race and sex, than
by school-level factors. Indeed, African-Canadian students engaged in more racial
bullying and victimization than European-Canadian students did, and boys also engaged
in racial bullying and victimization more than girls. In addition, school climate did not

56
appear to account for differences in these bullying behaviors across schools. More school
support, however, decreased racial bullying to a greater degree when there was higher
teacher diversity, but this effect was not found for racial victimization.
According to the current results, reported rates of racial bullying and racial
victimization are more strongly related to individual characteristics, such as sex and race,
than school characteristics. For both racial bullying and racial victimization, male
students were more likely to report engaging in these behaviors than were female
students. This finding is in line with the general bullying literature in that boys are more
likely to engage in bullying than girls (Whitney & Smith, 1993). Research would suggest
that in-group preferences based on race develop in both girls and boys (Aboud, 1988);
however, this type of bullying may be too aggressive and overt for girls to engage in, as
girls tend to engage in more relational forms of aggression (Kuppens et al., 2008; see
Lafferty, 2007). Perhaps girls express their race-based in-group preferences in other
forms that are less overt than racial bullying, such as excluding certain people because of
their race. Future research should further explore whether school-aged female students
engage in social racial bullying more than do male students or whether this group
affiliation based on race is simply not as salient in girls.
Race was also an individual predictor of racial bullying and victimization in the
current sample. The fact that African-Canadian students reported involvement in both of
these behaviors may indicate reciprocal in-group biases, meaning that African-Canadian
students are not only being victimized because of their race, but they are also forming
their own in-groups and victimizing other racial out-groups at the same time (Clark &
Clark, 1947). The African-Canadian population is among the largest visible minority

57
groups in Canada, representing more than 2% of the Canadian population (Statistics
Canada, 2001). Thus, African-Canadian students may be targeted as a racial out-group
because they are seen as a threat to the European-Canadian racial majority. At the same
time, this relatively large visible minority group may also be trying to assert their
dominance by engaging in racial bullying themselves. We can only speculate, however,
who or by whom this group of students is being racially bullied. Perhaps African-
Canadian students are bullying racial minority as well as racial majority students. Future
research should further examine the group mechanisms of racial bullying and
victimization longitudinally to determine between which groups these behaviors are
occurring and the developmental sequence of these behaviors over time.
Racial bullying and racial victimization did not differ greatly across schools.
Hence, most of the differences found in the schools included in this study were found
between individuals within schools rather than between schools. Thus, changes in school
characteristics may have little impact on school rates of racial bullying and racial
victimization. This finding is similar to other general bullying and school context
multilevel models in which most of the variability in bullying behaviors could be
accounted for by individual variance (Ma, 2002). Changes in the school environment may
not easily affect deep-seated in-group biases based on race when individual factors such
as being a racial minority or being male are present. More variability in racial
victimization exists across schools, however, that was not accounted for by individual
factors than for racial bullying. Consequently, changes in school characteristics may have
greater potential to have some impact on school rates of racial victimization than for
racial bullying.

58
Despite the fact that racial victimization differed across schools, the school
climate factors that were examined did not account for this difference. The literature on
racial prejudice in schools indicates that observed differences across schools may be due
to classroom contextual factors. Verkuyten and Thijs (2002) examined the classroom-
level effects of racism in The Netherlands and found that minority children reported more
racist bullying when they were the minority in their classroom. This study also found that
classroom effects accounted for less than 7 percent of the variance in racial bullying.
Jackson and colleagues (2006) also reported less than 10% variance at the classroom
level for the sociometric nominations of African-American students, but they found that
African-American students received more favorable nominations when they were the
majority in their classroom. Perhaps the in-group processes related to race and racial
bullying and victimization are more influenced by the classroom or peer microsystem,
rather than being influenced by the greater school context. In addition to classroom
context, other school characteristics may account for the reports of racial victimization
not accounted for by individual factors. Other school-related variables that were not
examined, such as school size, may be accounting for some of the variability in racial
bullying and racial victimization observed across schools. Smaller schools might have
more interactions between the same students from different racial in-groups, thus
increasing opportunities for racial bullying and victimization to occur. Continued
research in this area should further examine school context features aside from school
climate to determine what school characteristics can protect against racial bullying and
victimization at the school level. This type of research might help schools understand if

59
there are aspects of their school they can alter to help lessen racial bullying and racial
victimization when it is occurring in their schools.
One promising finding was the significant interaction between school support and
teacher diversity that was observed at the school level for racial bullying. The implication
is that more school support decreases racial bullying to a greater degree with higher
teacher diversity. When looking at the items included in the measurement of school
support, many items refer to teachers directly supporting students (e.g., “Our teachers
treat us fairly;” “My teachers are interested in me as a person.”). This sense of support
appears to come from a perception that teachers are not only supportive within the school
environment but are also accepting of the students as people. This climate may be related
to the incidence of racial bullying by making students feel less inclined to use aggression
in their interactions with their peers when they feel supported and cared for by their
teacher. Previous research has stated that incidences of racism diminish when teachers
react to these incidents (Verkuyten & Thijs, 2002), and that racial minority children
receive higher sociometric ratings when the teacher was also a racial minority (Jackon et
al., 2006). The fact that increased teacher diversity increases this relationship may
indicate that the feeling of belonging to an in-group that includes the teacher and not
feeling the need to bully others based on this characteristic. European-Canadian majority
students may also feel it is inappropriate to bully others based on this racial in-group bias
if their teacher is also a member of a racial out-group. The broader implications of this
finding are that schools who are witnessing racial bullying could ensure that the diversity
of their teachers is representative of the diversity of their student body in order to help
make students feel more supported and less inclined to bully others based on race.

60
This study had some limitations that may have affected the generalizability of the
results. First, the current study was cross-sectional in nature, meaning that no conclusions
on the directionality of the relationships between variables can be made. Longitudinal
research in this area needs to be completed to determine if racial victimization occurs
prior to racial bullying and if school-level variables precede incidences of racial bullying.
Despite this fact, however, the current study shed some light on the relationships of racial
bullying behaviors with both individual- and school-level variables in a large Canadian
sample. Second, due to missing data from a number of principals and students, the
current sample did not include the entire representative sample of Canadian children
collected as part of the 2001/2002 HBSC survey. Because approximately half of the
sample was lost due to missing data on variables of interest, the current sample cannot be
said to be fully representative of Canadian school-aged children. Certain students who
chose not to answer questions regarding race or principals choosing not to answer
questions about student diversity may represent schools in Canada with more diversity
who may actually be experiencing problems with racial bullying and victimization.
Despite this limitation, however, the current study represents a large sample of Canadian
children from over 100 schools and provides valuable information about the state of these
behaviors in schools across the country.
Finally, the current study was entirely based on self-report measures of behavior
and school characteristics. Students may not have been honest in their reports of
engagement in racial bullying and victimization due to the sensitive nature of this topic,
meaning that the current study may be an underestimate of current rates of these
behaviors. Principals may also have been biased in their reports of student and teacher

61
diversity and may have overestimated the levels of diversity in these schools. Despite
these possible biases, the currents study is based on a large enough sample to that self-
report bias would not affect the results to any significant extent.
The current study demonstrated the largely individual nature of racial bullying
and victimization and concluded that specific aspects of school climate may not have a
significant effect on rates of this type of bullying. The interaction between school support
and teacher diversity for racial bullying does, however, demonstrate the importance of
taking an ecological perspective in studying these bullying behaviors. By examining the
school environment in which students interact with one another, a better understanding of
the importance of both a supportive environment and the exposure of students to teachers
of diverse racial and ethnic backgrounds in reducing racial bullying behavior can be
gained. Nonetheless, much more work in this area is needed in order to determine other
school or classroom contextual factors that may be accounting for differences in racial
bullying and victimization across schools. By further exploring these other factors, a
greater understanding of those actions schools can take to help diminish racial bullying
and racial victimization can be determined and implemented.
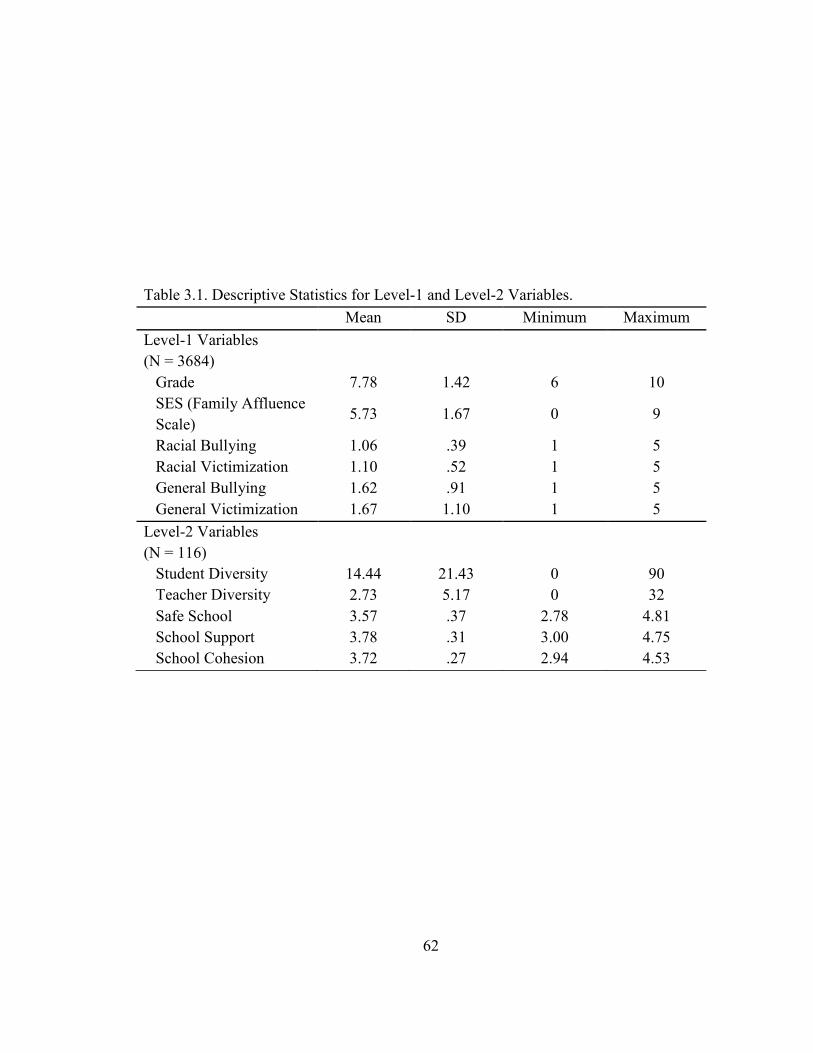
62
Table 3.1. Descriptive Statistics for Level-1 and Level-2 Variables. Mean SD Minimum Maximum Level-1 Variables (N = 3684)
Grade 7.78 1.42 6 10 SES (Family Affluence Scale)
5.73 1.67 0 9
Racial Bullying 1.06 .39 1 5 Racial Victimization 1.10 .52 1 5
General Bullying 1.62 .91 1 5 General Victimization 1.67 1.10 1 5
Level-2 Variables (N = 116)
Student Diversity 14.44 21.43 0 90 Teacher Diversity 2.73 5.17 0 32
Safe School 3.57 .37 2.78 4.81 School Support 3.78 .31 3.00 4.75 School Cohesion 3.72 .27 2.94 4.53

63
Table 3.2. Correlations for Level-1 and Level-2 Variables. 1. 2. 3. 4. 5. 6. Level-1 Variables
1.Grade - 2. SES (Family Affluence Scale)
-.06** -
3. Racial Bullying .03 .02 - 4. Racial Victimization -.04* .01 .25** - 5. General Bullying .03 .05** .33** .13** - 6. General Victimization -.09** -.02 .10** .30** .18** -
7. 8. 9. 10. 11. Level-2 Variables
7. Student Diversity - 8. Teacher Diversity .56** - 9. Safe School .20* .09 - 10. School Support .15 .07 .71** - 11. School Cohesion .10 -.01 .59** .53** -
** Correlation is significant at the 0.01 level (2-tailed). * Correlation is significant at the 0.05 level (2-tailed).

64
Table 3.3. HLM models for Racial Bullying. Null Model
Level-1 Model Standardized
Coefficients (SE)
Level-2 Model Standardized
Coefficients (SE)
Individual Variables
Sex -.08 (.01)*** -.08 (.01)***
Grade .01 (.00)** .01 (.00)
SES (FAS) .00 (.00) .00 (.00)
African .25 (.11)* .25 (.11)*
East Asian .09 (.05) .08 (.05)
Native .05 (.06) .05 (.06)
South Asian .02 (.06) .01 (.06)
South East Asian .11 (.06) .11 (.06)
General Victimization .04 (.01)*** .04 (.01)***
School Variables
Student Diversity .00 (.00)
Teacher Diversity .00 (.00)
Safe School -.03 (.04)
School Support -.03 (.04)
School Cohesion .04 (.04)
School Support X Teacher Diversity -.01 (.00)*
Variance
Between Schools (Tau) .00227 (1.5%) .00172 .00128
Between Students (Sigma squared) .14676 (98.5%) 0.14286 0.14293
Total Variance .14903 (100%)
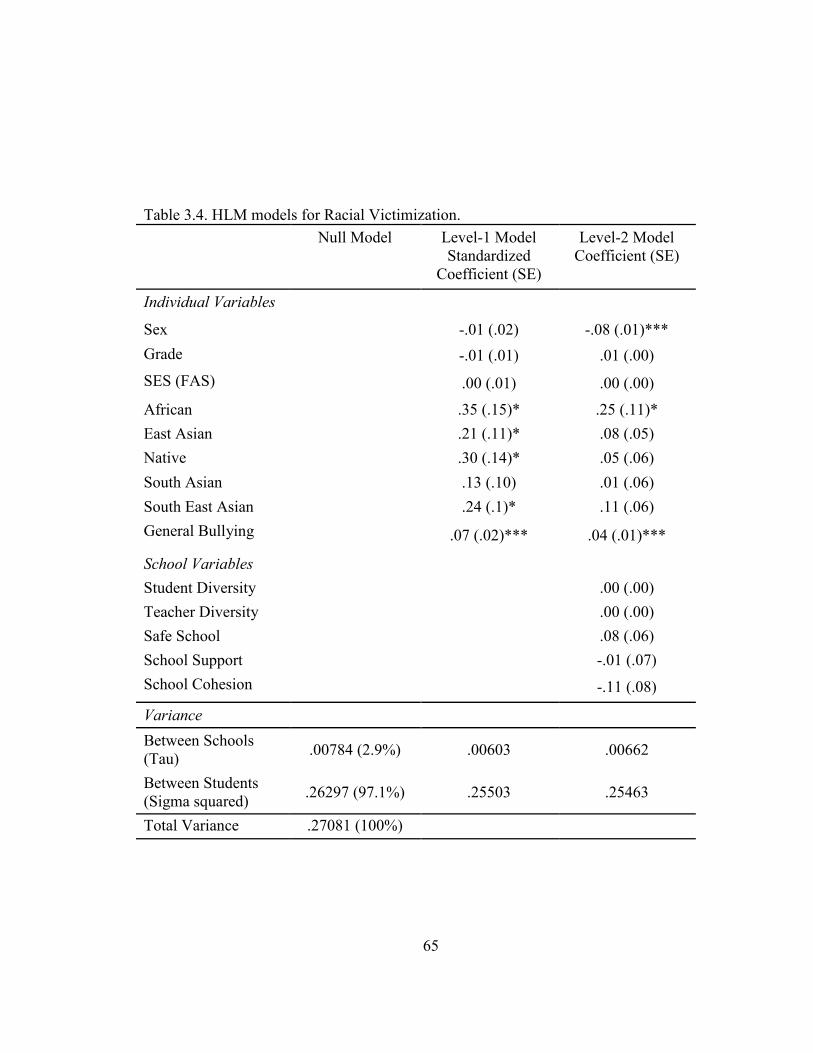
65
Table 3.4. HLM models for Racial Victimization. Null Model
Level-1 Model Standardized
Coefficient (SE)
Level-2 Model Coefficient (SE)
Individual Variables
Sex -.01 (.02) -.08 (.01)***
Grade -.01 (.01) .01 (.00)
SES (FAS) .00 (.01) .00 (.00)
African .35 (.15)* .25 (.11)*
East Asian .21 (.11)* .08 (.05)
Native .30 (.14)* .05 (.06)
South Asian .13 (.10) .01 (.06)
South East Asian .24 (.1)* .11 (.06)
General Bullying .07 (.02)*** .04 (.01)***
School Variables
Student Diversity .00 (.00)
Teacher Diversity .00 (.00)
Safe School .08 (.06)
School Support -.01 (.07)
School Cohesion -.11 (.08)
Variance
Between Schools (Tau) .00784 (2.9%) .00603 .00662
Between Students (Sigma squared) .26297 (97.1%) .25503 .25463
Total Variance .27081 (100%)

66
CHAPTER FOUR
General Discussion
The examination of bullying in a multicultural context in Canada has been lacking
in recent years. The two studies in this thesis were designed to fill this gap in research by
exploring race and immigrant status as potential risk factors for bullying in Canadian
adolescents. As well, the current studies further examined how these risk factors change
throughout adolescence and investigated racial bullying and victimization specifically in
a Canadian school context. The findings of the current thesis have led to a number of
conclusions about these particular risk factors and bullying behaviors in Canada while
also raising several important questions for future exploration.
First, the current thesis provides evidence for an in-group bias based on race in
Canadian youth, as indicated in both studies by the increased rates of racial victimization
over time in racial minority groups compared to their European-Canadian peers. This
finding not only supports the existence of group affiliations based on race that have been
described in very young children (Katz & Kofkin, 1997; Nesdale, Griffiths, Durkin, &
Maass, 2007), but also provides evidence that this bias persists into early adolescence and
results in inter-group conflict. In addition, the observed developmental trajectory of
bullying in the first study is consistent with the theoretical development of ethnic identity.
This theory states that younger children display more ethnic pride and are less likely to
interact with those of different racial backgrounds, whereas older adolescents are more
open to ethnic identity exploration with different racial groups (Marks et al., 2006). In
fact, the results of this study demonstrate that race was related only to specific bullying
behaviors in elementary school and not in high school. High school students were not

67
engaging in aggression towards racial minority groups as frequently as students in
elementary school. The important implication of both of these findings is that
intervention and cultural education aimed at preventing this behavior should begin at
younger ages when ethnic group affiliation may be a more salient issue. Positive
integration of younger children from different racial and cultural backgrounds may
reduce the effect of ethnic differentiation in the form of in-group and out-group biases
and encourage children to focus on the similarities they may have with those of other
racial groups rather than focusing on them as out-group members.
The fact that immigrant status was generally not associated with victimization
may be indicative of the salience of being a racial minority for in-group formation. The
more subtle cultural differences of immigrant adolescents may not be as immediately
recognizable to their school peers. Thus, these cultural differences may play a lesser role
in determining in-groups than the more obvious physical characteristics associated with
being a visible minority. This conclusion is somewhat tentative, however, given that no
interaction was found between race and immigrant status that would indicate that
immigrant youth who were also racial minorities were being victimized more frequently.
Immigrant youth did seem, however, to be at an increased risk of engaging in bullying
others over time, especially immigrant youth from ‘Other’ racial groups. Although this
finding could be due to more immigrant youth belonging to ‘Other’ racial groups than
non-immigrant youth, these youth may also represent smaller minority groups who do
have difficulties forming their own racial in-groups and thus may not feel a sense of
belonging to any group. As a result, these youth may cope with their social isolation by
interacting with their peers in an aggressive manner (Dawson & Williams, 2008; Yeh et

68
al., 2003). This aggressive behavior may also be exacerbated by difficulties with English
proficiency. Regardless, these findings are an indication to schools that immigrant youth
likely need more support in their social transitions to school and be provided with
programs to help them interact with others in a positive manner if they feel alone and
unaccepted.
The results of this thesis also imply that specific racial minority groups, namely
larger minority groups in Canada, may be most at risk of involvement in racial bullying
behavior. Both Asian-Canadian and African-Canadian students were identified as the two
groups that were most at risk of racial victimization in elementary school, and these two
represent the largest minority groups in Canada (Statistics Canada, 2006). Similar
findings have been reported in American studies. African-American students have been
identified as being more at risk of bullying others and being victimized themselves
(McLaughlin, Hilt, & Nolen-Hoeksema, 2007; Peskin 2006) and also represent the
second-largest visible minority group in the United States (United States Census Bureau,
2006). The fact that both of these visible minority groups appeared to be more targeted by
racial victimization may have some interesting theoretical implications regarding inter-
group conflict based on race. Perhaps these two groups are specifically targeted because
the European-Canadian majority sees them as a more threatening out-group because they
are more numerous than smaller racial minority groups. At the same time, these groups
may also be targeted more often simply because they are more numerous; hence, there
are more opportunities for their be victimization. Future research should determine the
processes that lead larger minority groups to be racially victimized more often to further

69
inform theory and to guide the implementation of practical interventions in these at-risk
groups.
Another important implication stemming from this finding is the potentially
serious mental health consequences that these targeted racial minority youth may face.
Little is currently known about the short- and long-term effects of being racially
victimized at school. Previous studies of racial discrimination in youth of African descent
have indicated, however, that this type of discrimination is associated with the
development of conduct problems and depression five years later (Brody et al., 2006).
African- and Asian-Canadian students may face similar consequences as a result of being
racially victimized, and this type of victimization may also affect their healthy
development of ethnic self-esteem and ethnic identity. In addition, the second study in
this thesis indicated that African-Canadian youth were most likely to not only be racially
victimized, but also to racially bully others. This finding is concerning because it implies
that African-Canadian youth may be at risk of becoming racial bully/victims. The
research on bully/victims is clear in its indication that both bullying others and being
victimized is associated with particularly serious psychological consequences including
depressive symptoms and poor school functioning (Haynie et al., 2001). Being a racial
bully/victim may also result in serious mental health and social consequences due to the
inherently aggressive and marginalizing nature of this behavior. In sum, Asian-Canadian
and African-Canadian youth seem to be high-risk groups with regards to racial bullying
and victimization. More research is needed to understand why these groups are being
targeted, what can be done to prevent this from occurring, and how to support those
children who also engage in this behavior themselves.

70
Finally, one of the most interesting findings of the current thesis was that the
school environment, as measured by specific aspects of school climate, does not account
for observed differences in racial bullying and victimization across schools. Results from
the second study, indicate that this type of bullying is more strongly associated with
individual characteristics such as sex and race. The use of multilevel modeling to
examine racial bullying and victimization from an ecological perspective, however, was
still useful in the current thesis. Namely, this statistical technique revealed that some
differences between schools in racial bullying and racial victimization were not fully
accounted for by the individual characteristics of their students. Thus, other variables are
accounting for these differences between schools that were not measured in this thesis.
Perhaps classroom contextual variables such as having a visible minority teacher may
have more impact on this behavior in younger children than the larger school
environment (Jackson, Barth, Powell, & Lochman, 2006; Verkuyten and Thijs, 2002). In
fact, the finding that reports of racial bullying decreased in schools with more support
and more teacher diversity strengthens this hypothesis.
The influence of peer groups within schools may also account for these
differences as the peer group has been found to play an important role in influencing
bullying behaviors (Dijkstra, Lindenberg, & Veenstra, 2008). This particular type of
bullying may vary more as a function of the racial diversity of peer groups within the
school rather than the school environment as a whole. Perhaps schools in which children
are members of racially diverse peer groups have lower reports of racial bullying than
schools in which these peer groups are segregated by race. Thus, a racially diverse school
with segregated peer groups may have more in-group biases compared to a school that is

71
less diverse but whose racial minority students are in the same peer groups. In sum, the
current findings regarding the influence of the school environment raise more questions
than answers about what factors may be accounting for the differences found between
schools. This situation, however, demonstrates a unique opportunity for future research in
this area to identify these variables and to use them to develop proper interventions at the
school level that can be implemented to help reduce this behavior.
Future Research
Although the current thesis clarified the roles of race, immigrant status, and
school context with regards to racial bullying, this project also raised a number of
questions that should be addressed in further studies of this behavior. First, the current
results are indications only of the racial in-group biases and group affiliations based on
race described in the developmental literature. The current studies did not directly
measure the specific processes involved in the social interactions between adolescents of
different racial groups and immigrant backgrounds. Future research will need to explore
the specific make-up of the bully-victim dyads to determine if in fact racial majority
students are racially bullying students from racial minority groups. This type of study
would involve a closer examination at the racial diversity of the peer groups in which this
behavior is occurring. In-group biases based on race would be further confirmed if peer
groups were segregated by race and racial bullying was occurring across and not within
these peer groups. Thus, the direct measurement and exploration of these processes and
how they lead to the aggressive and discriminatory treatment of Canadian visible
minority youth should be explored in more detail in future work in this area.

72
The development of racial bullying and racial victimization should also be
investigated in a high school population as this information was not available for the
current project. Because other bullying behaviors appear to occur less in older
adolescents compared to younger adolescents, racial bullying will likely also occur less at
older ages. However, this conclusion is only speculation based on theory and the
developmental patterns found with regards to other types of bullying in younger samples.
It is important, however, to confirm this hypothesis in the future to ensure that racial
minority adolescents in high school are not at risk of being racially aggressed by their
peers. This information could easily be gathered by including questions on a bullying
questionnaire asking older students if they racially bully others or if they are racially
bullied themselves. Taken together, this information will not only help clarify in-group
biases and developmental processes that may be occurring, but it will also aid in
designing proper interventions to address these biases at various periods in adolescent
social development.
In addition, numerous questions remain about the development of racial
bully/victims in African-Canadian youth. Perhaps this group is trying to assert its
dominance by marginalizing other groups based on race and are then targeted as a result.
Conversely, these youth may be marginalized as a racial out-group first and racially
bullying others as a coping mechanism for this isolation. Although the current data
indicated that racial bullying leads to future racial victimization, the development of this
behavior over time should be further explored. This research would involve following
African youth who engage in racial bullying over a longer period of time and determining
if they report racial victimization at a later time period. As well, these youth could be

73
specifically assessed about the quality of their relationships with peers of other racial
groups to determine who they are targeting and why. Once racial bullying and
victimization and the mechanisms of its development are better understood, intervention
efforts and specific support for bully/victims will be more effective and focused on
addressing the mechanisms through which this behavior develops.
The current results also indicate the need for further investigation on the factors
that could aid immigrant youth with their social transitions. Although immigrant status
was not generally related to victimization, some findings did indicate that immigrant
youth may bully others over time, which justifies a closer look at why this behavior is
occurring. Engagement in bullying behaviors in immigrant youth may indicate
adjustment difficulties related to a lack of classroom or peer support. At the elementary
school level, the influence of the classroom peer context would be important to examine
as a supportive and integrated classroom may reduce bullying behavior in immigrant
children. In high school, peer group factors may be more important to investigate. For
example, the factors that determine the formation of a supportive peer group for
immigrant youth could be investigated as well as whether these prevent engagement in
bullying behavior. Multilevel modeling could be used to investigate the differences
between classrooms in elementary school and the differences between peer groups in
high school in the bullying behaviors of immigrant youth and determine if changes in
these areas could be made to support these youth.
Finally, future research should determine what school contextual characteristics
are accounting for the observed differences between schools on racial bullying and
victimization. The role of diversity in both the classroom context and the peer group

74
within schools may be particularly important in affecting the prevalence of racial
bullying. In younger children, for example, the race of the classroom teacher may be an
important influence on this behavior. Racial minority teachers may reduce this behavior
simply by representing other racial minority students in the class. These teachers may
also be more sensitive to the interactions between children of different racial groups and
help children feel less inclined to engage in racial bullying. In older children, having
racially diverse peer groups may also reduce the incidence of racial bullying and should
be further explored using sociometric methods. Although racial bullying and
victimization are largely driven by individual factors, any method by which schools could
influence classroom or peer processes to help reduce this behavior could make a
significant difference for those who are affected by this type of bullying.
Summary
Canada is racially diverse and the bullying research in this country should account
for the different experiences of bullying in numerous racial groups. As well, the early
identification of at-risk minority groups and of those children engaging in racial bullying
may be important in preventing future prejudice. This perspective is also important to
help identify contextual factors that schools can focus on to support at-risk minority
groups and to prevent the development of racial bullying in the future. Although the
current thesis clarified many of these issues, this thesis also raised many important
questions about bullying in these areas that remain to be addressed. We hope that these
issues will be addressed in future investigations of bullying so that research informing
bullying preventions and interventions in this country can be representative of the diverse
population of Canadian children and their complex social interactions.

75
REFERENCES
Aboud, F.E. (1988). Children and prejudice. New York: Blackwell.
Aboud, F.E. (2003). The formation of in-group favoritism and out-group prejudice in
young children: Are they distinct attitudes? Developmental Psychology, 39, 48-
60.
Blishen, B. R., Carroll, W. K. & Moore, C. (1987). The 1981 socioeconomic index for
occupations in Canada. Review of Canadian Sociology and Anthropology, 24,
465-487.
Brewer, M.B. (1999). The psychology of prejudice: In-group love or out-group hate?
Journal of Social Issues, 55, 429-444.
Brody, G. H., Chen, Y.-f., Murry, V. M., Ge, X., Simons, R. L., Gibbons, F. X., Gerrard,
M., & Cutrona, C. (2006). Perceived discrimination and the adjustment of African
American youths: A five-year longitudinal analysis with contextual moderation
effects. Child Development, 77, 1170-1189.
Bronfenbrenner, U. (1977). Toward an experimental ecology of human development.
American Psychologist, 32, 269-279.
Chibbaro, J.S. (2007). School counselors and the cyberbully: Interventions and
implications. Professional School Counseling, 11, 65-68.
Clark, K., & Clark, M. (1947). Racial identification and preference in Negro children. In
T. Newcomb & E. Hartley (Eds.), Readings in social psychology. New York:
Holt.
Connolly, J., Craig, W. & Pepler, D. (2003). [The Adolescent Relationship study].
Unpublished raw data.

76
Connolly, J., & Konarski, R. (1994). Peer self-concept in adolescence: Analysis of factor
structure and of associations with peer experience. Journal of Research on
Adolescence, 4, 385-403.
Craig, W.M. & Pepler, D.J. (2007). Understanding bullying: From research to practice.
Canadian Psychology, 48, 86-93.
Currie, C., Samdal, O. Boyce, W., & Smith, R. (Eds.) (2001). Health Behvior in School-
aged Children: A WHO Cross-National Study (HBSC), Research Protocal for the
2001/2002 Survey. Child and Adolescent Health Research Unit (CAHRU),
University of Edinburgh.
Currie, C. E., Elton, R. A., Todd, J., & Platt, S. (1997). Indicators of socioeconomic
status for adolescents: The WHO health behavior in school-aged children survey.
Health Education Research, 12, 385-397.
Dawson, B. & Williams, S. (2008). The impact of language status as an acculturative
stressor on internalizing and externalizing symptoms among Latino/a children: A
longitudinal analysis from school entry through third grade. Journal of Youth and
Adolescence, 37, 399-411.
Dijkstra, J.K., Lindenberg, S., & Veenstra, R. (2008). Beyond the Class Norm: Bullying
Behavior of Popular Adolescents and its Relation to Peer Acceptance and
Rejection. Journal of Abnormal Child Psychology, 36, 1289-1299.
Doyle, A.B., & Aboud, F.E. (1995). A longitudinal study of White children’s racial
prejudice as a social cognitive development. Merrill-Palmer Quarterly, 41, 210-
229.

77
Egan, S. K.; Perry, D. G. (1998) Does low self-regard invite victimization?
Developmental Psychology, 34, 299-309.
Emmons, C. L., Comer, J. P., & Haynes, N. M. (1996). Translating theory into practice:
Comer’s theory of school reform. In J. P. Comer, N. M. Haynes, E. Joyner, & M.
Ben-Avie (Eds.), Rallying the whole village (pp. 27-41). New York: Teachers
College Press.
Eslea, M. & Mukhtar, K. (2000). Bullying and racism among Asian schoolchildren in
Britain. Educational Research, 42, 207-217.
Garandeau, C.F. & Cillessen, A. (2006). From indirect aggression to invisible aggression:
A conceptual view on bullying and peer group manipulation. Aggression and
Violent Behavior, 11, 612-625.
Hanish, L. D., & Guerra, N. G. (2000). The roles of ethnicity and school context in
predicting children’s victimization by peers. American Journal of Community
Psychology, 28, 201-223.
Haynie, D. L., Nansel, T., Eisel, P., Crump, A. D., Saylor, K., Yu, K., et al. (2001).
Bullies, victims, and bully/victims: Distinct groups of at-risk youth. The Journal
of Early Adolescence, 21, 29-49.
Houbre, B., Tarquinio, C., Thuillier, I., & Hergott, E. (2006). Bullying among students
and its consequences on health. European Journal of Psychology of Education,
21, 183-208.
Human Resource and Development Canada (2009). National Occupational Classification
(NOC) 2006. Retrieved March 8, 2009, from
http://www.hrsdc.gc.ca/eng/workplaceskills/noc/index.shtml

78
Jackson, M. F., Barth, J.M., Powell, N., & Lochman, J.E. (2006). Classroom contextual
effects of race on children’s peer nominations. Child Development, 77, 1325-
1337.
Jacobsen, K.E. & Bauman, S. (2007). Bullying in schools: School counselors’ responses
to three types of bullying incidents. Professional School Counseling, 11, 1-8.
Katz, P.A., & J.A. Kofkin. (1997) Race, gender, and young children. In S. Luthar, J.
Burack, D. Cicchetti, & J. Weisz, (Eds.), Developmental perspectives on risk and
pathology, (pp. 51–74). New York: Cambridge University Press.
Kim, B.S., Yang, P.H., Atkinson, D.R., Wolfe, M.M., & Hong, S. (2001). Cultural value
similarities and differences among Asian American ethnic groups. Cultural
Diversity and Ethnic Minority Psychology, 7, 343-361.
Kowalski, K. (1998). The impact of vicarious exposure to diversity on preschooler’s
emerging ethnic/racial attitudes. Early Child Development and Care, 146, 41-51.
Kuperminc, G. P., Leadbeater, B. J., Emmons, C., & Blatt, S. J. (1997). Perceived school
climate and difficulties in the social adjustment of middle school students.
Applied Developmental Science, 1, 76-88.
Kuperminc, G. P., Leadbeater, B. J., & Blatt, S. J. (2001). School social climate and
individual differences in vulnerability to psychopathology among middle school
students. Journal of School Psychology, 39, 141-159.
Kuppens, S., Grietens, H., Onghena, P., Michiels, D., & Subramanian, S.V. (2008).
Individual and classroom variables associated with relational aggression in
elementary school-aged children: A multilevel analysis. Journal of School
Psychology, 46, 639-660.

79
Lafferty, J. A. (2007). Sugar and spice and everything nice? A contemporary review of
girls' social and aggressive behaviors. US: American Psychological Association.
Lawrence, S. M. (2005). Contextual matters: Teachers’ perceptions of the success of
antiracist classroom practices. The Journal of Educational Research, 98, 350–
365.
Lerner, R. M. (1986). Concepts and theories of human development (2nd ed.) New York:
Random House.
Lerner, R. M. (1996). Relative plasticity, integration, temporality, and diversity in human
development: A developmental contextual perspective about theory, process, and
method. Developmental Psychology, 32, 781-786.
Ma, X. (2002). Bullying in middle school: Individual and school characteristics of
victims and offenders. School Effectiveness and School Improvement, 13, 63-89.
Marks, A. K., Szalacha, L. A., Lamarre, M., Boyd, M. J., & Coll, C. G. (2006). Emerging
ethnic identity and interethnic group social preferences in middle childhood:
Findings from the Children of Immigrants Development in Context (CIDC) study.
International Journal of Behavioral Development, 31, 501-513.
McLaughlin, K. A., Hilt, L. M., & Nolen-Hoeksema, S. (2007). Racial/ethnic differences
in internalizing and externalizing symptoms in adolescents. Journal of Abnormal
Child Psychology, 35, 801-816.
Mesch, G. S., Turjeman, H. & Fishman, G. (2008). Perceived discrimination and the
well-being of immigrant adolescents. Journal of Youth and Adolescence, 37, 592-
604.

80
McKenney, K. S., Pepler, D. Craig, W. M., Connolly, J. (2006). Peer victimization and
psychosocial adjustment: The experiences of Canadian immigrant youth.
Electronic Journal of Research in Educational Psychology, 9, 1696-2095.
Moffitt, T.E., Silva, P.A. (1988). Self-reported delinquency, neuropsychological deficit,
and history of attention deficit disorder. Journal of Abnormal Child Psychology,
16, 553-569.
Motti-Stefanini, F., Pavlopoulos, V., Obradovi, J., Dalla, M., Takis, N., Papathanassiou,
A. S. M. (2008). Immigration as a risk factor for adolescent adaptation in Greek
urban schools. European Journal of Developmental Psychology, 5, 235-261.
Mouttapa, M., Valente, T., Gallaher, P., Rohrback, L. A. & Unger, J. B. (2004). Social
network predictors of bullying and victimization. Adolescence, 39, 315-335.
Nesdale, D., Griffiths, J.A., Durkin, K., & Maass, A. (2007). Effects of group
membership, intergroup competition and out-group ethnicity on children’s ratings
of in-group and out-group similarity and positivity. British Journal of
Developmental Psychology, 25, 359-373.
Olweus, D. (1989). The Student Questionnaire. Bergen, Norway: Unpublished ms.
Olweus, D. (1993). Bullying at school: What we know and what we can do. Oxford:
Blackwell.
Padilla, A.M. (2006). Bicultural social development. Hispanic Journal of Behavioral
Sciences, 28, 467-497.
Pepler, D. J., Craig, W. M., & O’Connell, P. (1999). Understanding bullying and
victimization from a dynamic systems perspective. In A. Slater and D. Muir

81
(Eds.) Developmental Psychology: An advanced Reader, (pp. 441-451).
Blackwell: England.
Peskin, M.F., Tortolero, S.R., & Markham, C.M. (2006). Bullying and victimization
among Black and Hispanic adolescents. Adolescence, 41, 467-484.
Phinney, J. S. (1989). Stages of ethnic identity development in minority group
adolescents. Journal of Early Adolescence, 9, 34-49.
Piaget, J., & Wiel, A. M. (1951). The development in children of the idea of the
homeland and of relations to other countries. International Social Science
Journal, 3, 561-578.
Putallaz, M., Grimes, C. L., Foster, K. J., Kupersmidt, J. B., Coie, J. D., & Dearing, K.
(2007). Overt and relational aggression and victimization: Multiple perspectives
within the school setting. Journal of School Psychology, 45, 533-547.
Raudenbush, S. W., & Bryk, A. S. (2002). Hierarchical linear models: Application and
data analysis methods. Thousand Oaks, CA: Sage Publications.
Raudenbush, S. W., Bryk, A., S., & Congdon, R. (2008). HLM 6.06. Lincolnwood, IL:
Scientific Software International.
Scheithauer, H., Hayer, T., Petermann, F., & Jugert, G. (2006). Physical, verbal, and
relational forms of bullying among German students: Age trends, gender
differences, and correlates. Aggressive Behavior, 32, 261-275.
Sabatier, C. & Berry, J. W. (2008). The role of family acculturation, parental style, and
perceived discrimination in the adaptation of second-generation immigrant youth
in France and Canada. European Journal of Developmental Psychology, 5, 159-
185.

82
Slee, P. T. (1994). Situational and interpersonal correlates of anxiety associated with peer
victimization. Child Psychology and Human Development, 25, 97-107.
Slone, M, Tarrasch, R., & Hallis, D. (2000). Ethnic stereotypic attitudes among Israeli
children: Two intervention programs. Merrill-Palmer Quarterly, 46, 370-389.
Spriggs, A.L., Iannotti, R.J., Nansel, T.R., & Haynie, D.L. (2007). Adolescent bullying
involvement and perceived family, peer and school relations: Commonalities and
differences across race/ethnicity. Journal of Adolescent Health, 41, 283-293.
Statistics Canada (2008) Visible minority groups, 2006 counts, for Canada, provinces
and territories - 20% sample. Retrieved July 7, 2009, from
http://www12.statcan.ca/english/census06/data/highlights/ethnic/pages/Page.cfm?
Lang=E&Geo=PR&Code=01&Table=1&Data=Count&StartRec=1&Sort=2&Dis
play=Page
Statistics Canada (2009). Population by immigrant status and period of immigration,
2006 counts, for Canada, provinces and territories - 20% sample data. Retrieved
July 7, 2009, from http://www12.statcan.ca/census-recensement/2006/dp-
pd/hlt/97-557/T403-eng.cfm?Lang=E&T=403&GH=4&SC=1&S=99&O=A
Tajfel, H. & Turner, J. (1979). An integrative theory of intergroup conflict, in W.G.
Austin and S. Worschel (Eds.), The Social Psychology of Intergroup Relations
(pp. 33-47). Pacific Grove, CA: Brooks/Cole Publishing.
United States Census Bureau (2009). USA State & County QuickFacts. Retrieved July 15,
2009, from http://quickfacts.census.gov/qfd/states/00000.html

83
Vedder, P., Sam, D.L., & Liebkind, K. (2007). The acculturation and adaptation of
Turkish adolescents in north-western Europe. Applied Developmental Science, 11,
126-136.
Verkuyten, M. & Thijs, J. (2002). Racist victimiztaion among children in The
Netherlands: The effect of ethnic group and school. Ethnic and Racial Studies, 25,
310-331.
Walberg, H. J., & Genova W. J. (1983). School practices and climates that promote
integration. Contemporary Educational Psychology, 8, 87-100.
White, F.A., & Gleitzman, M. (2006). An examination of family socialization processes
as moderators of racial prejudice transmission between adolescents and their
parents. Journal of Family Studies, 12, 247-260.
Whitney, I., Nabuzoka, D., & Smith, P. K. (1992). Bullying in schools: Mainstream and
special needs. Support for Learning, 7, 3-7.
Whitney, I., & Smith, P. K. (1993). A survey of the nature and extent of bullying in
junior/middle and secondary schools. Educational Research, 35, 3-25.
Williams, K.R. & Guerra, N.G. (2007). Prevalence and predicators of Internet bullying.
Journal of Adolescent Health, 41, S14-S21.
Wilson, D. (2004). The interface of school climate and school connectedness and
relationships with aggression and victimization. Journal of School Health, 74,
293-299.
Yeh, C.J., Arora, A.K., Inose, M., Okubo, Y., Li, R.H., & Greene, P. (2003). The cultural
adjustment and mental health of Japanese immigrant youth. Adolescence, 38, 481-
500.

84
APPENDIX A
STUDY 1 BULLYING AND VICTIMIZATION SCALES
Bullying and Victimization – Elementary School (Time 1 and Time 2)
The next questions deal with your actions toward someone else since the beginning of the year.
General Bullying/Victimization
1. Have you slapped or kicked/been slapped or kicked by another child?
Yes No
How many times? (Circle the number) 0 1 2 3 4 5 6 7 8 9 more than 9
2. Have you punched, beaten or choked/been punched beaten or choked by another child?
Yes No
How many times? (Circle the number) 0 1 2 3 4 5 6 7 8 9 more than 9
3. Have you spread a rumour about someone/has someone spread a rumour about you?
Yes No
How many times? (Circle the number) 0 1 2 3 4 5 6 7 8 9 more than 9
4. Have you teased someone/has someone teased you?
Yes No
How many times? (Circle the number) 0 1 2 3 4 5 6 7 8 9 more than 9
5. Have you said/has someone said to you “We don’t want to play with you”?
Yes No
How many times? (Circle the number) 0 1 2 3 4 5 6 7 8 9 more than 9
Physical Bullying/Victimization
1. Have you slapped or kicked/been slapped or kicked by another child?
Yes No
How many times? (Circle the number) 0 1 2 3 4 5 6 7 8 9 more than 9
2. Have you punched, beaten or choked/been punched beaten or choked by another child?
Yes No
How many times? (Circle the number) 0 1 2 3 4 5 6 7 8 9 more than 9

85
Social/Verbal Bullying/Victimization
1. Have you spread a rumour about someone/has someone spread a rumour about you?
Yes No
How many times? (Circle the number) 0 1 2 3 4 5 6 7 8 9 more than 9
2. Have you teased someone/has someone teased you?
Yes No
How many times? (Circle the number) 0 1 2 3 4 5 6 7 8 9 more than 9
3. Have you said/has someone said to you “We don’t want to play with you”?
Yes No
How many times? (Circle the number) 0 1 2 3 4 5 6 7 8 9 more than 9
4. Have you ever threatened someone/been threatened by someone with a knife?
Yes No
How many times? (Circle the number) 0 1 2 3 4 5 6 7 8 9 more than 9
Bullying and Victimization – High School (Time 1 and Time 2)
The following is a list of behaviours that sometimes happen between people your age. For each behavior, circle the number that best described how often these things were done to you, and also how often these things were done by you to each person listed, during the last six months. Response options: 0 = Never; 1 = Rarely; 2 = Sometimes; 3 = Often; 4 = Always.
General Bullying/Victimization
1. Pushing, grabbing, or shoving during an argument (done to you/by you).
2. Slapping or kicking during an argument (done to you/by you).
3. Throwing, smashing, hitting, or kicking an object during an argument (done to you/by
you).
4. Hitting or trying to hit with an object during an argument (done to you/by you).
5. Choking, punching, or beating during an argument (done to you/by you).
6. Telling rumours or mean lies to make a person unpopular (done to you/by you).
7. Getting even with a person by keeping them from being in a group of friends (done to
you/by you).
8. Ignoring or not talking to a person out of anger (done to you/by you).

86
Physical Bullying/Victimization
1. Pushing, grabbing, or shoving during an argument (done to you/by you).
2. Slapping or kicking during an argument (done to you/by you).
3. Throwing, smashing, hitting, or kicking an object during an argument (done to you/by
you).
4. Hitting or trying to hit with an object during an argument (done to you/by you).
5. Choking, punching, or beating during an argument (done to you/by you).
Social Bullying/Victimization
1. Telling rumours or mean lies to make a person unpopular (done to you/by you).
2. Getting even with a person by keeping them from being in a group of friends (done to
you/by you).
3. Ignoring or not talking to a person out of anger (done to you/by you).

87
APPENDIX B
HBSC SCALES
Principal Questionnaire
1. What is the total number of students in your school? ____ students
2. What is the total number of teachers in your school? _____ teachers
3. What percentage of students in your school are visible minorities? _____ percent
4. How many teachers in your school are visible minorities? _____ teachers
Student Questionnaire
Here are some statements about your school/teachers. Please show how much you agree or disagree with each one. (Please mark one box for each line).
Safe School
Strongly Agree Neither Disagree Strongly Agree Agree or Disagree Disagree
a. The rules in this school are fair.
b. Our school is a nice place to
c. I feel I belong at this school.
d. I feel safe at this school.
School Support
Strongly Agree Neither Disagree Strongly Agree Agree or Disagree
Disagree a. I am encouraged to express
my own views in my class.
b. Our teachers treat us fairly.
c. When I need extra help, I can
get it.
d. My teachers are interested in me

88
as a person.
e. Most of my teachers are friendly.
School Cohesion
Strongly Agree Neither Disagree Strongly Agree Agree or Disagree
Disagree a. The students in my class enjoy
being together.
b. Most of the students in my class
are kind and helpful.
c. Other students accept me as I am.
d. When a student in my class is
feeling down, someone else in class
tries to help.
Racial Bullying and Victimization
How often have you bullied/have you bullied another student(s) at school in the past couple of months in the ways listed below? (Please mark one box for each line)
Strongly Agree Neither Disagree Strongly Agree Agree or Disagree
Disagree a. I made fun of him or her because
of his or race or colour.
a. I was made fun of for my
race or colour.
Related Documents