Full-Scale Catalyst Regeneration Experience At The Coal-Fired Indiantown Generating Plant Douglas W. Bullock, P.E. Hans Hartenstein National Energy Power Co. LLC SCR-Tech LLC Indiantown Generating Plant DOE 2003 SCR/SNCR Workshop

Welcome message from author
This document is posted to help you gain knowledge. Please leave a comment to let me know what you think about it! Share it to your friends and learn new things together.
Transcript
8/7/2019 Bullock.DOE 03 Indiantown Paper
http://slidepdf.com/reader/full/bullockdoe-03-indiantown-paper 1/22
Full-Scale Catalyst Regeneration ExperienceAt The Coal-Fired Indiantown Generating Plant
Douglas W. Bullock, P.E. Hans HartensteinNational Energy Power Co. LLC SCR-Tech LLCIndiantown Generating Plant
DOE 2003 SCR/SNCR Workshop

8/7/2019 Bullock.DOE 03 Indiantown Paper
http://slidepdf.com/reader/full/bullockdoe-03-indiantown-paper 2/22
The Indiantown Generating Plant
Location: Indiantown, Florida
Owner: ICLP – IndiantownCogenerationLimited Partnership
Operator: National EnergyPower CompanyLLC
Capacity: 360 MW electricity,270 t process steam
Start-up: 1995
Boiler: Bituminous coal,PC-wall-fired
SCR: 3 layer reactor,~ 55% NOx removalefficiency
8/7/2019 Bullock.DOE 03 Indiantown Paper
http://slidepdf.com/reader/full/bullockdoe-03-indiantown-paper 3/22
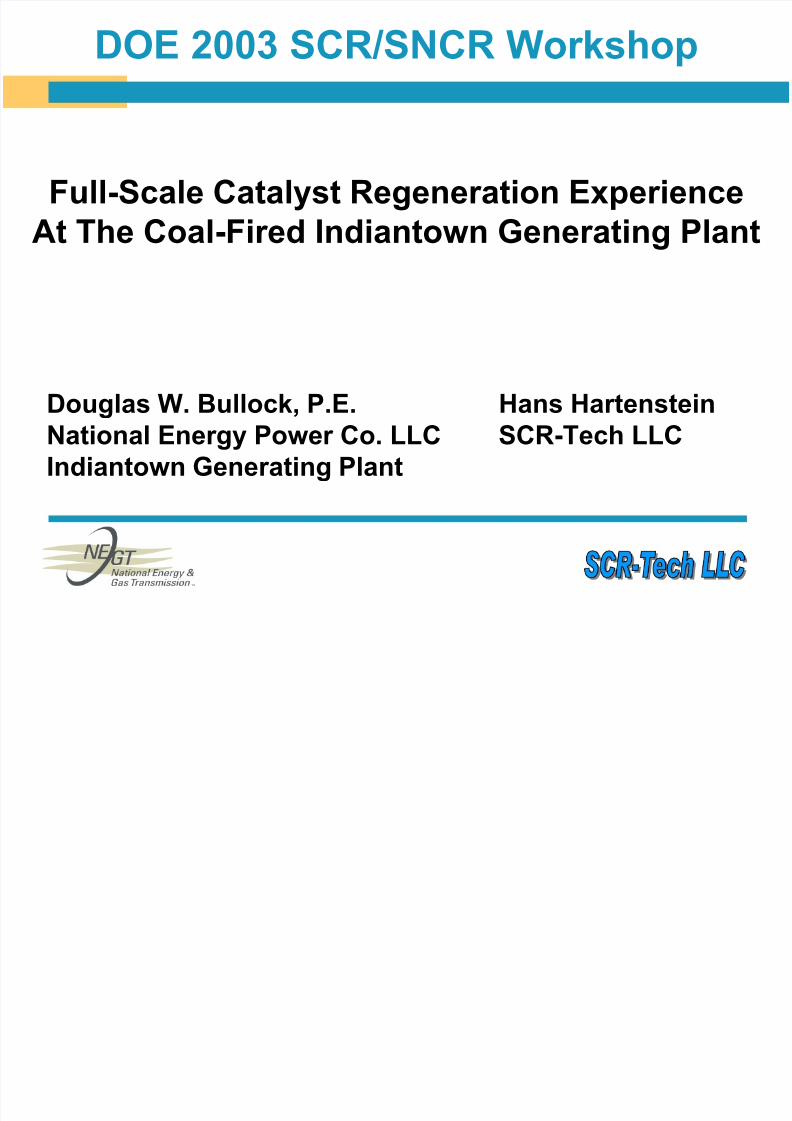
Catalyst Addition 1995 – 2000
After start-up on the initial catalyst fill of 2 half-layers in summer 1995,additional half-layers of catalyst were installed as soon as the ammoniaconcentration in the fly ash exceeded acceptable levels. This led to thefollowing schedule of catalyst addition:
summer 95 fall 96 spring 99 spring 00 fall 00
initial fill catalyst
addition of new catalyst

8/7/2019 Bullock.DOE 03 Indiantown Paper
http://slidepdf.com/reader/full/bullockdoe-03-indiantown-paper 4/22
Catalyst Exchange Plan Since 2002
The transition from a former 3 full-layer SCR operating scheme to the new 4half-layer SCR operating scheme has been started. This schedule calls for the following future catalyst exchange and regeneration cycles:
spring 02 spring 03 fall 03 1st
future 2nd
futureexchange exchangeinitial fill catalyst
addition of new catalyst
addition/exchange and regeneration of catalyst
8/7/2019 Bullock.DOE 03 Indiantown Paper
http://slidepdf.com/reader/full/bullockdoe-03-indiantown-paper 5/22
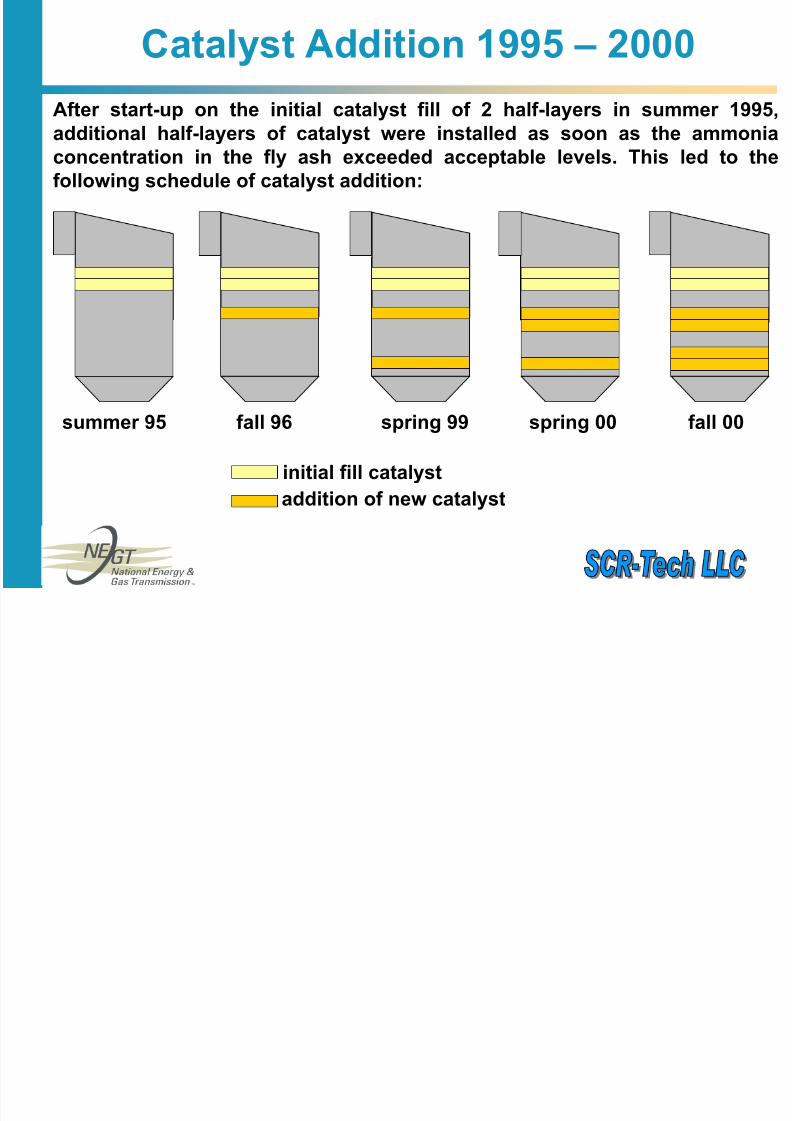
Catalyst Regeneration – Timeline
Spring 2002: Removal of catalyst layer 1, 80 full modules after ~ 57,000
operating hours at a K/K0 ~ 0.4.
Replacement by a new half-layer, 80 half-modules.
Fall 2002: Decision to regenerate and split the 80 full modules of layer 1 into 160 half-modules.
January 2003: Catalyst regeneration and split of modules by SCR-Tech.
March 2003: Delivery of 160 fully regenerated half-modules to Indiantown.
April 2003: Installation of the first 80 half-modules of regeneratedcatalyst as the top half-layer.
October 2003: Removal of catalyst layer 2, 80 full modules after ~ 60,000operating hours.Installation of the second 80 half-modules of regenerated
catalyst as the third half-layer.
8/7/2019 Bullock.DOE 03 Indiantown Paper
http://slidepdf.com/reader/full/bullockdoe-03-indiantown-paper 6/22
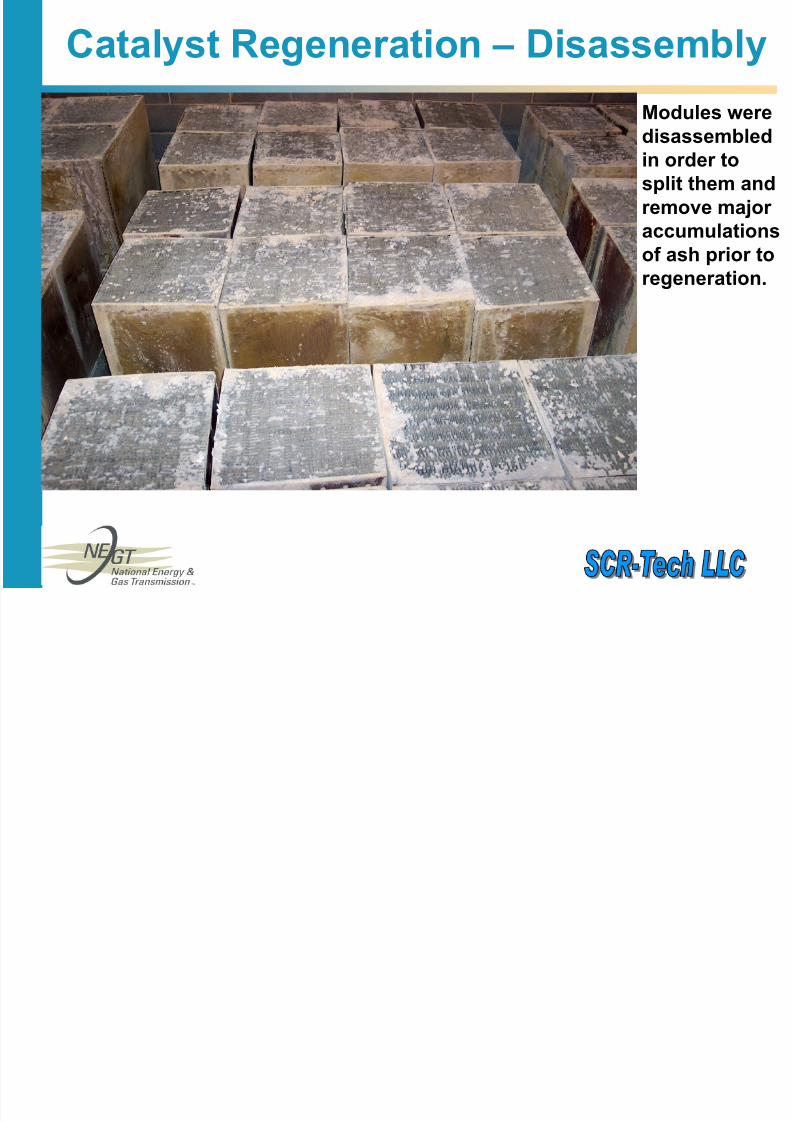
Catalyst Regeneration – Disassembly
Modules weredisassembledin order tosplit them and
remove major accumulationsof ash prior toregeneration.
8/7/2019 Bullock.DOE 03 Indiantown Paper
http://slidepdf.com/reader/full/bullockdoe-03-indiantown-paper 7/22
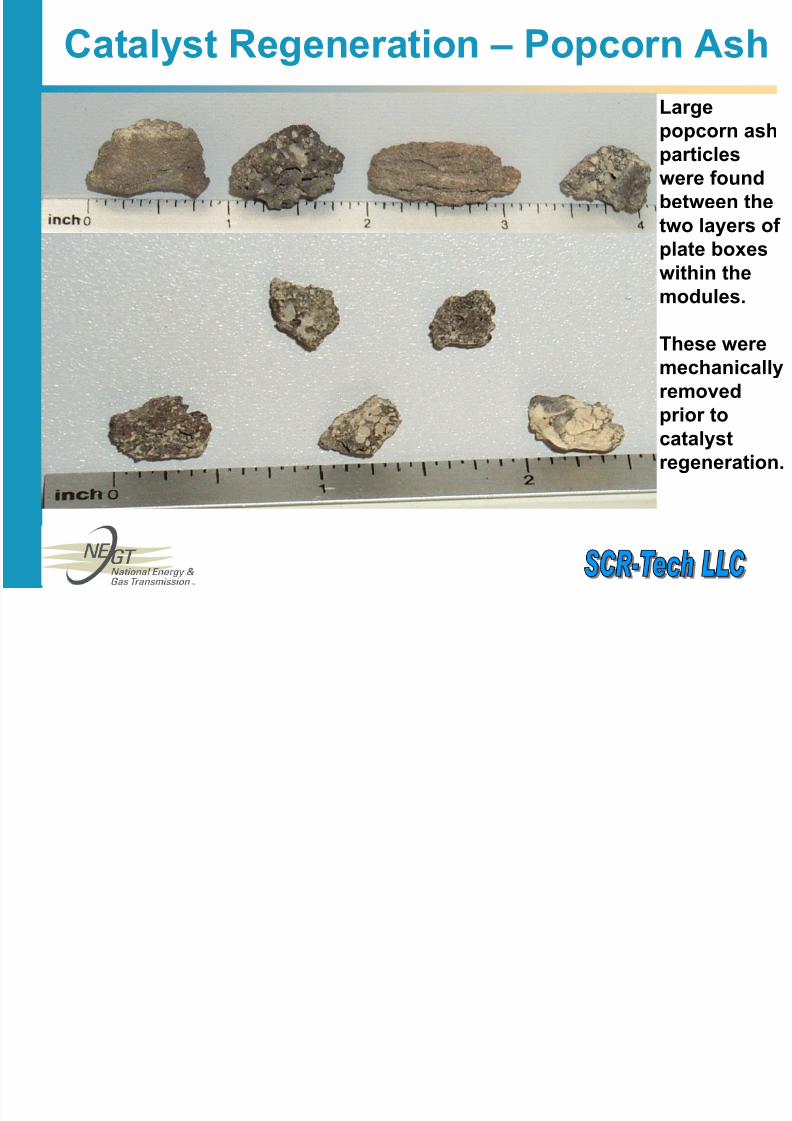
Catalyst Regeneration – Popcorn Ash
Largepopcorn ashparticleswere found
between thetwo layers of plate boxeswithin themodules.
These weremechanicallyremoved
prior tocatalystregeneration.

8/7/2019 Bullock.DOE 03 Indiantown Paper
http://slidepdf.com/reader/full/bullockdoe-03-indiantown-paper 8/22
Catalyst Regeneration – Results
catalyst surface analysis before and after regeneration
0
0.4
0.8
1.2
1.6
2
As MgO Na2O K2Ocatalyst poisons
c o n c e n t r a t i o n i n %
before regeneration
after regeneration
8/7/2019 Bullock.DOE 03 Indiantown Paper
http://slidepdf.com/reader/full/bullockdoe-03-indiantown-paper 9/22
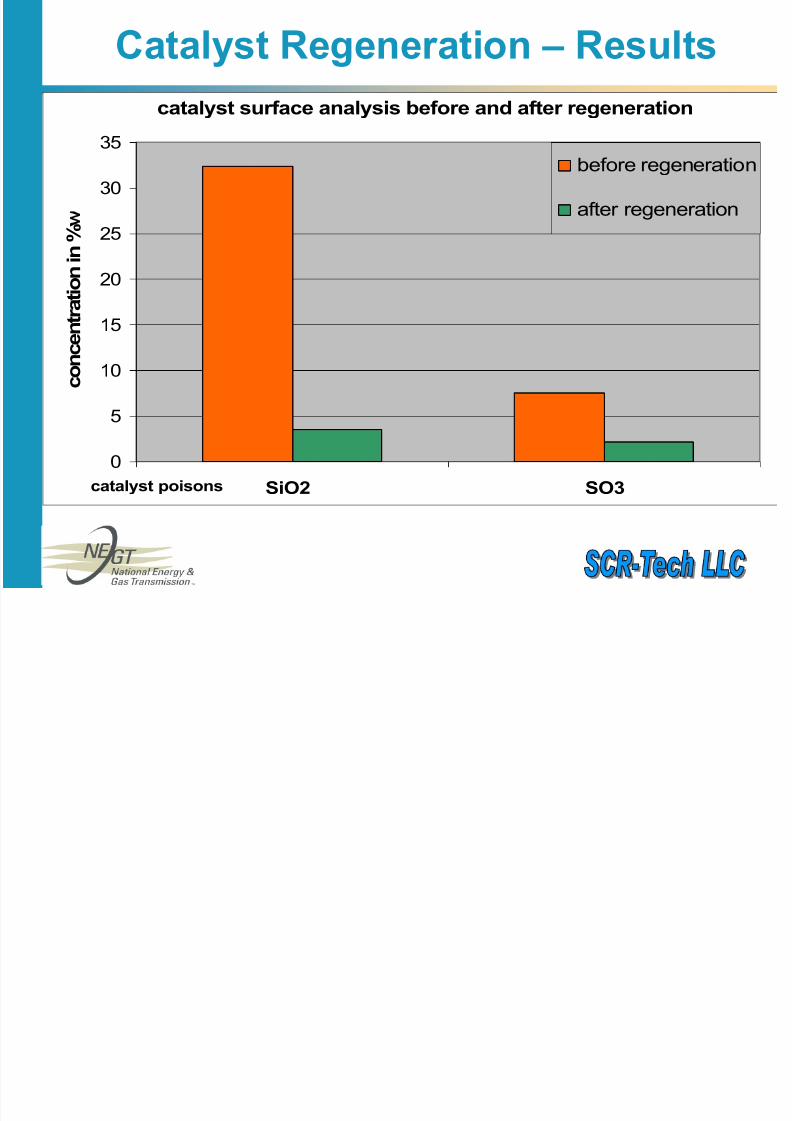
catalyst surface analysis before and after regeneration
0
5
10
15
20
25
30
35
SiO2 SO3catalyst poisons
c o n c e n t r a t i o n i n %
before regeneration
after regeneration
Catalyst Regeneration – Results

8/7/2019 Bullock.DOE 03 Indiantown Paper
http://slidepdf.com/reader/full/bullockdoe-03-indiantown-paper 10/22

8/7/2019 Bullock.DOE 03 Indiantown Paper
http://slidepdf.com/reader/full/bullockdoe-03-indiantown-paper 11/22

8/7/2019 Bullock.DOE 03 Indiantown Paper
http://slidepdf.com/reader/full/bullockdoe-03-indiantown-paper 12/22
Catalyst Regeneration – Results
regeneration result of Indiantown catalyst
0
0.2
0.4
0.6
0.8
1
new catalyst guarantee regenerated catalyst
S
O 2 / S O 3 - c o n
v e r s i o n [ K / K 0 ]

8/7/2019 Bullock.DOE 03 Indiantown Paper
http://slidepdf.com/reader/full/bullockdoe-03-indiantown-paper 13/22
Catalyst Regeneration – Results
The catalyst regeneration results can be summarized as:
1. Catalyst was deactivated as expected (K/K0 ~ 0.4)
2. Catalyst poisons were successfully removed
3. Catalyst activity after regeneration was Kreg /K0 = 1.03
4. The SO2 /SO3-conversion rate decreased significantly after
regeneration to almost half of the manufacturer’s original
SO2 /SO3-conversion rate guarantee for the new catalyst in1995.
Conclusion: Catalyst regeneration was very successful.
8/7/2019 Bullock.DOE 03 Indiantown Paper
http://slidepdf.com/reader/full/bullockdoe-03-indiantown-paper 14/22
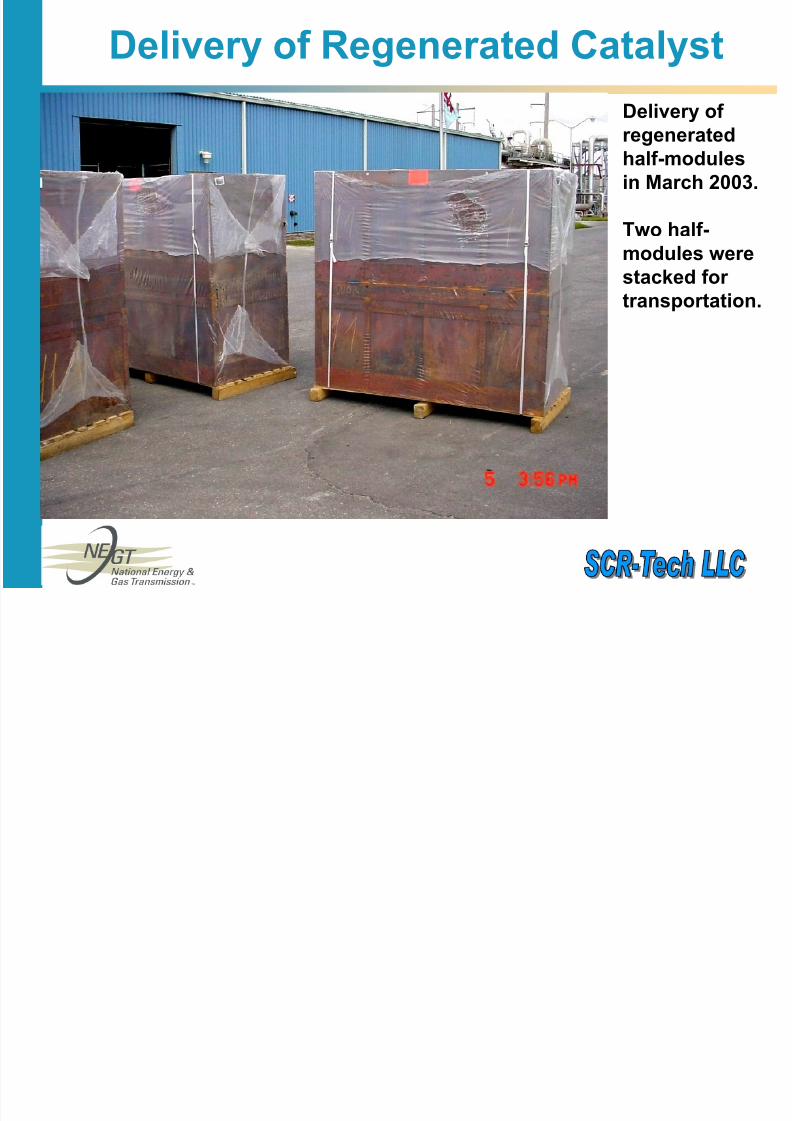
Delivery of Regenerated Catalyst
Delivery of regeneratedhalf-modulesin March 2003.
Two half-modules werestacked for transportation.
8/7/2019 Bullock.DOE 03 Indiantown Paper
http://slidepdf.com/reader/full/bullockdoe-03-indiantown-paper 15/22
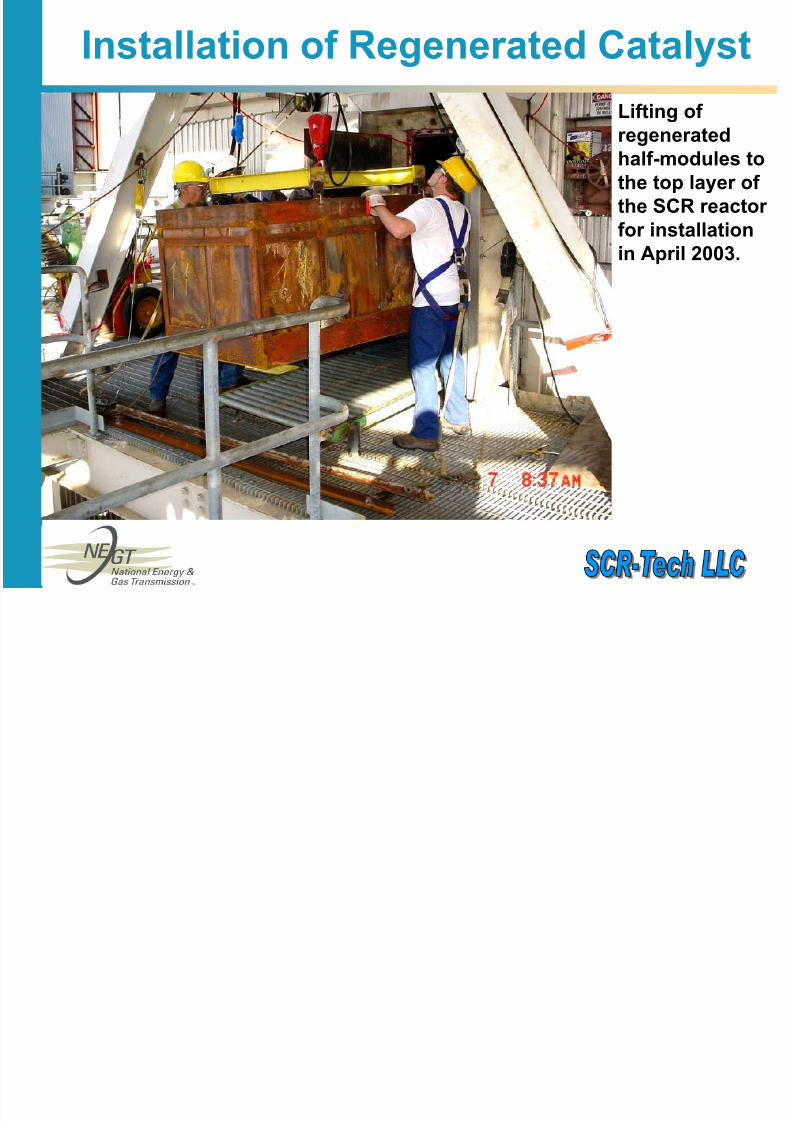
Installation of Regenerated Catalyst
Lifting of regeneratedhalf-modules tothe top layer of
the SCR reactor for installationin April 2003.
8/7/2019 Bullock.DOE 03 Indiantown Paper
http://slidepdf.com/reader/full/bullockdoe-03-indiantown-paper 16/22
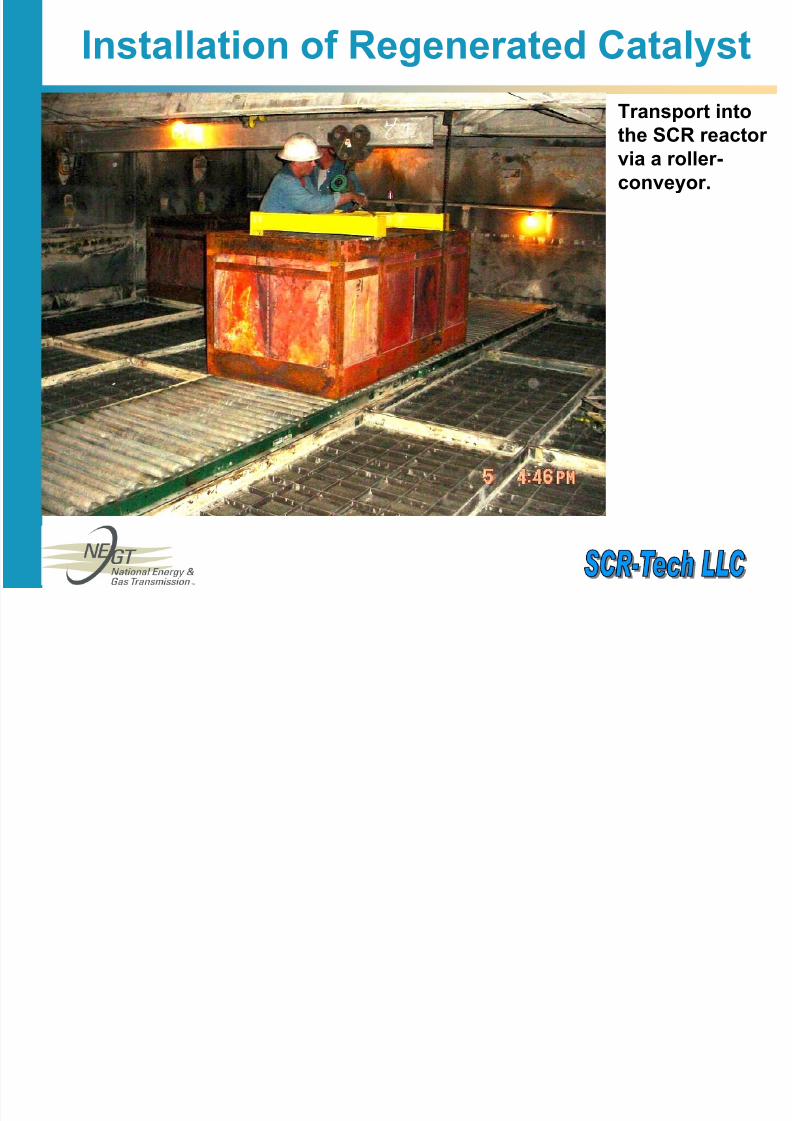
Installation of Regenerated Catalyst
Transport intothe SCR reactor via a roller-conveyor.

8/7/2019 Bullock.DOE 03 Indiantown Paper
http://slidepdf.com/reader/full/bullockdoe-03-indiantown-paper 17/22
Installation of Regenerated Catalyst
April 2003:Placement of the regeneratedhalf-modules
on top of thehalf-layer of new catalyst,which wasinstalled inspring 2002.
8/7/2019 Bullock.DOE 03 Indiantown Paper
http://slidepdf.com/reader/full/bullockdoe-03-indiantown-paper 18/22
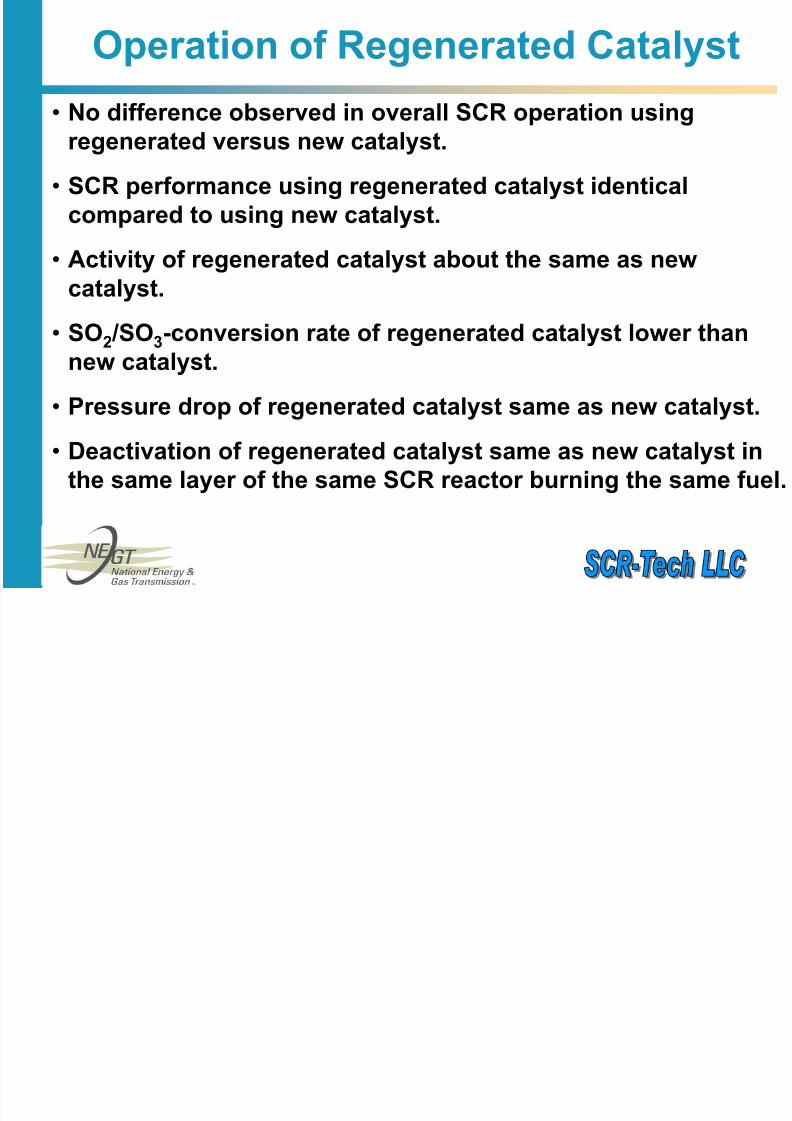
Operation of Regenerated Catalyst
• No difference observed in overall SCR operation usingregenerated versus new catalyst.
• SCR performance using regenerated catalyst identical
compared to using new catalyst.
• Activity of regenerated catalyst about the same as newcatalyst.
• SO2 /SO3-conversion rate of regenerated catalyst lower thannew catalyst.
•Pressure drop of regenerated catalyst same as new catalyst.
• Deactivation of regenerated catalyst same as new catalyst inthe same layer of the same SCR reactor burning the same fuel.

8/7/2019 Bullock.DOE 03 Indiantown Paper
http://slidepdf.com/reader/full/bullockdoe-03-indiantown-paper 19/22
Deactivation of Regenerated Catalyst
deactivation new versus regenerated catalyst
0 1000 2000 3000 4000 5000 6000 7000operating hours
a c t i v
i t y K [ m / h ]
new catalyst
regenerated catalyst

8/7/2019 Bullock.DOE 03 Indiantown Paper
http://slidepdf.com/reader/full/bullockdoe-03-indiantown-paper 20/22
Future Catalyst Management Strategy
The original catalyst management strategy was based ona 3 full-layer operation with a perpetual replacement of 1 full-layer as needed by new catalyst and disposal of
spent catalyst.The new catalyst management strategy is based on 4 half-layers installed with a perpetual exchange of 1 half-layer as needed by a regenerated half-layer kept in stand-by atSCR-Tech.
Advantages:
• Annual savings of over $ 330,000 in O&M cost
• Reduced SO3 load in the system
• No catalyst disposal issues

8/7/2019 Bullock.DOE 03 Indiantown Paper
http://slidepdf.com/reader/full/bullockdoe-03-indiantown-paper 21/22
Conclusions
• Catalyst regeneration was very successful.
• Operating experience with regenerated catalyst is positive.No difference was observed between operating the SCR with
new versus regenerated catalyst.
• Catalyst deactivation of the regenerated catalyst is identicalto the new catalyst in the same layer of the SCR reactor.
• Lower SO2 /SO3-conversion benefits the plant’s equipment.
• O&M cost savings of about $ 330,000 per year on averageby using regeneration over new catalyst replacement
(> $ 5 million over a 20 year period).
• Cost & potential future long term hazardous waste liabilitiesassociated with catalyst disposal were avoided.
8/7/2019 Bullock.DOE 03 Indiantown Paper
http://slidepdf.com/reader/full/bullockdoe-03-indiantown-paper 22/22
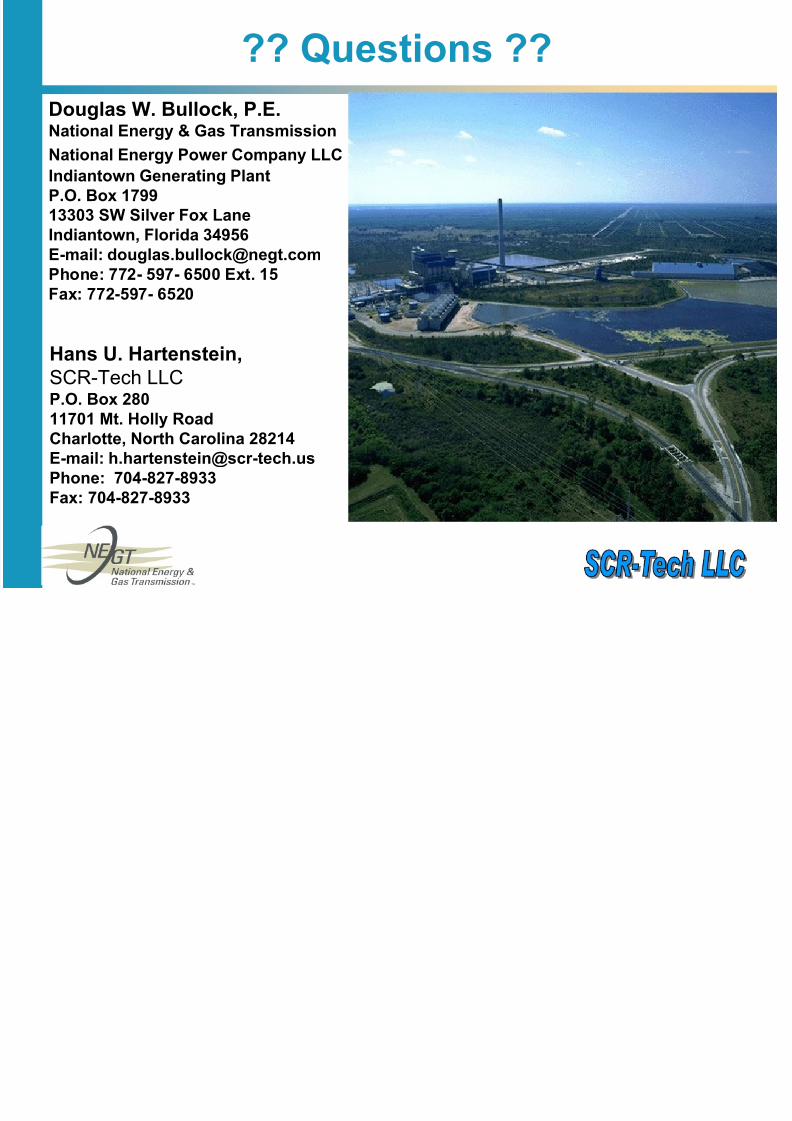
Douglas W. Bullock, P.E.National Energy & Gas Transmission
National Energy Power Company LLC
Indiantown Generating PlantP.O. Box 1799
13303 SW Silver Fox LaneIndiantown, Florida 34956E-mail: [email protected]: 772- 597- 6500 Ext. 15Fax: 772-597- 6520
Hans U. Hartenstein,SCR-Tech LLC
P.O. Box 280
11701 Mt. Holly RoadCharlotte, North Carolina 28214E-mail: [email protected]: 704-827-8933Fax: 704-827-8933
?? Questions ??
Related Documents