U.S. Department of Justice Office of Justice Programs Bureau of Justice Statistics Bulletin Bureau of Justice Statistics December 2010, NCJ 231675 O n December 31, 2009, state and federal correctional authorities had jurisdiction over 1,613,740 prisoners, an increase of 3,981 prisoners from yearend 2008 (figure 1). 1 is 0.2% increase marked the third consecutive year of slower growth in the U.S. prison population and the smallest increase during the decade. Jurisdiction refers to the legal authority over a prisoner, regardless of where the prisoner is held. e slowing in the growth of the total U.S. prison population masked an increase in the federal prison population (3.4%) during 2009, while the number of prisoners under jurisdiction of state correctional authorities declined by 0.2%, the first decline in the state prison population since 1977 (figure 2). e increase in the growth rate of the federal prison population reflected a shiſt from the general pattern of declining annual growth rates in that population. e decline in the growth rate of the state prison population during 2009 continued the 3-year trend of declining annual growth rates for state prisoners. Prisoners in 2009 Heather C. West, Ph.D. and William J. Sabol, Ph.D. BJS Statisticians, and Sarah J. Greenman, BJS Program Assistant Highlights e U.S. prison population grew at its slowest rate (0.2%) since 2000, reaching 1,613,740 prisoners at yearend 2009. Prison admissions (down 2.5%) and prison releases (up 2.2%) converged from 2006 through 2009, slowing the growth of the nation’s prison population. e imprisonment rate—the number of sentenced prison- ers per 100,000 U.S. residents—declined for the second straight year, falling to 502 per 100,000 from 506 per 100,000 in 2007. From 2000 to 2008, the state prison population increased by 159,200 prisoners, and violent offenders accounted for 60% of this increase. e number of drug offenders in state prisons declined by 12,400 over this period. FIGURE 1 Prisoners under state and federal jurisdiction at yearend, 2000-2009 1,000,000 1,250,000 1,500,000 1,750,000 0.0% 0.5% 1.0% 1.5% 2.0% 2.5% 3.0% Number of prisoners Annual percent change Annual percent change 2009 2008 2007 2006 2005 2004 2003 2002 2001 2000 On December 31 1 is number is 84 prisoners higher than reported in the BJS Data Brief, Pris- oners at Yearend 2009: Advance Counts, NCJ 230189, June 2010. BJS permits respondents to update their data to reflect their most accurate counts. -1.0% 0 1.0% 2.0% 3.0% 4.0% 5.0% 6.0% 7.0% 8.0% Federal State 2009 2008 2007 2006 2005 2004 2003 2002 2001 2000 Percent change On December 31 FIGURE 2 Change in the number of prisoners under state and federal jurisdiction, 2000-2009 For a list of publications in this series go to http://www.bjs.gov/index.cfm?ty=pbse&sid=40 Revised 10/27/2011

Welcome message from author
This document is posted to help you gain knowledge. Please leave a comment to let me know what you think about it! Share it to your friends and learn new things together.
Transcript
U.S. Department of Justice Office of Justice Programs Bureau of Justice Statistics
BulletinBureau of Justice Statistics
December 2010, NCJ 231675
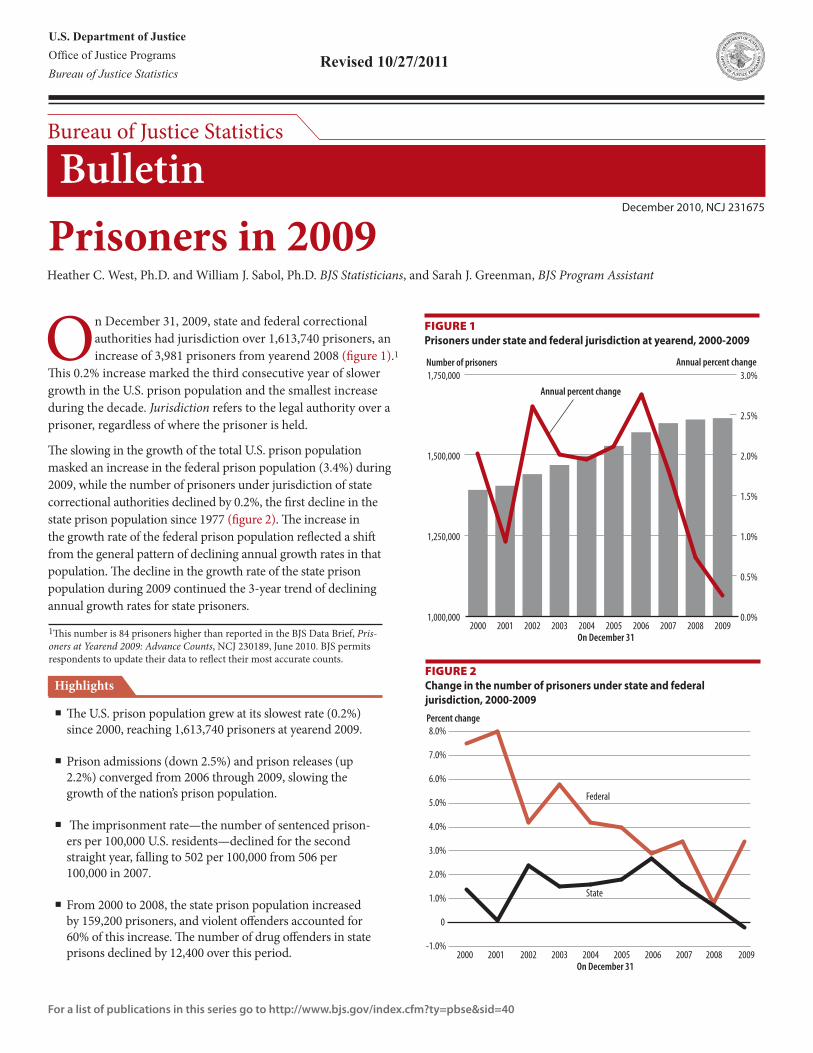
On December 31, 2009, state and federal correctional authorities had jurisdiction over 1,613,740 prisoners, an increase of 3,981 prisoners from yearend 2008 (figure 1).1
This 0.2% increase marked the third consecutive year of slower growth in the U.S. prison population and the smallest increase during the decade. Jurisdiction refers to the legal authority over a prisoner, regardless of where the prisoner is held.
The slowing in the growth of the total U.S. prison population masked an increase in the federal prison population (3.4%) during 2009, while the number of prisoners under jurisdiction of state correctional authorities declined by 0.2%, the first decline in the state prison population since 1977 (figure 2). The increase in the growth rate of the federal prison population reflected a shift from the general pattern of declining annual growth rates in that population. The decline in the growth rate of the state prison population during 2009 continued the 3-year trend of declining annual growth rates for state prisoners.
Prisoners in 2009Heather C. West, Ph.D. and William J. Sabol, Ph.D. BJS Statisticians, and Sarah J. Greenman, BJS Program Assistant
Highlights
� The U.S. prison population grew at its slowest rate (0.2%) since 2000, reaching 1,613,740 prisoners at yearend 2009.
� Prison admissions (down 2.5%) and prison releases (up 2.2%) converged from 2006 through 2009, slowing the growth of the nation’s prison population.
� The imprisonment rate—the number of sentenced prison-ers per 100,000 U.S. residents—declined for the second straight year, falling to 502 per 100,000 from 506 per 100,000 in 2007.
� From 2000 to 2008, the state prison population increased by 159,200 prisoners, and violent offenders accounted for 60% of this increase. The number of drug offenders in state prisons declined by 12,400 over this period.
Figure 1 Prisoners under state and federal jurisdiction at yearend, 2000-2009
1,000,000
1,250,000
1,500,000
1,750,000
0.0%
0.5%
1.0%
1.5%
2.0%
2.5%
3.0%Number of prisoners Annual percent change
Annual percent change
2009200820072006200520042003200220012000On December 31
1This number is 84 prisoners higher than reported in the BJS Data Brief, Pris-oners at Yearend 2009: Advance Counts, NCJ 230189, June 2010. BJS permits respondents to update their data to reflect their most accurate counts.
-1.0%
0
1.0%
2.0%
3.0%
4.0%
5.0%
6.0%
7.0%
8.0%
Federal
State
2009200820072006200520042003200220012000
Percent change
On December 31
Figure 2 Change in the number of prisoners under state and federal jurisdiction, 2000-2009
For a list of publications in this series go to http://www.bjs.gov/index.cfm?ty=pbse&sid=40
Revised 10/27/2011
2 Prisoners in 2009
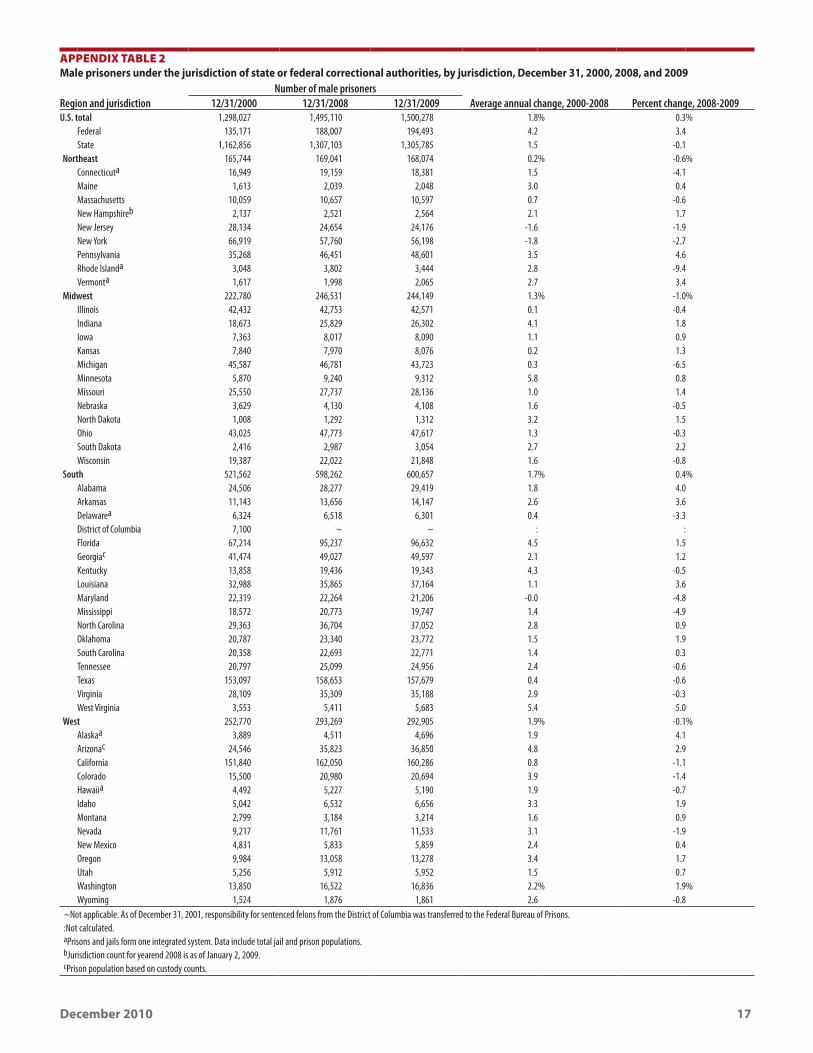
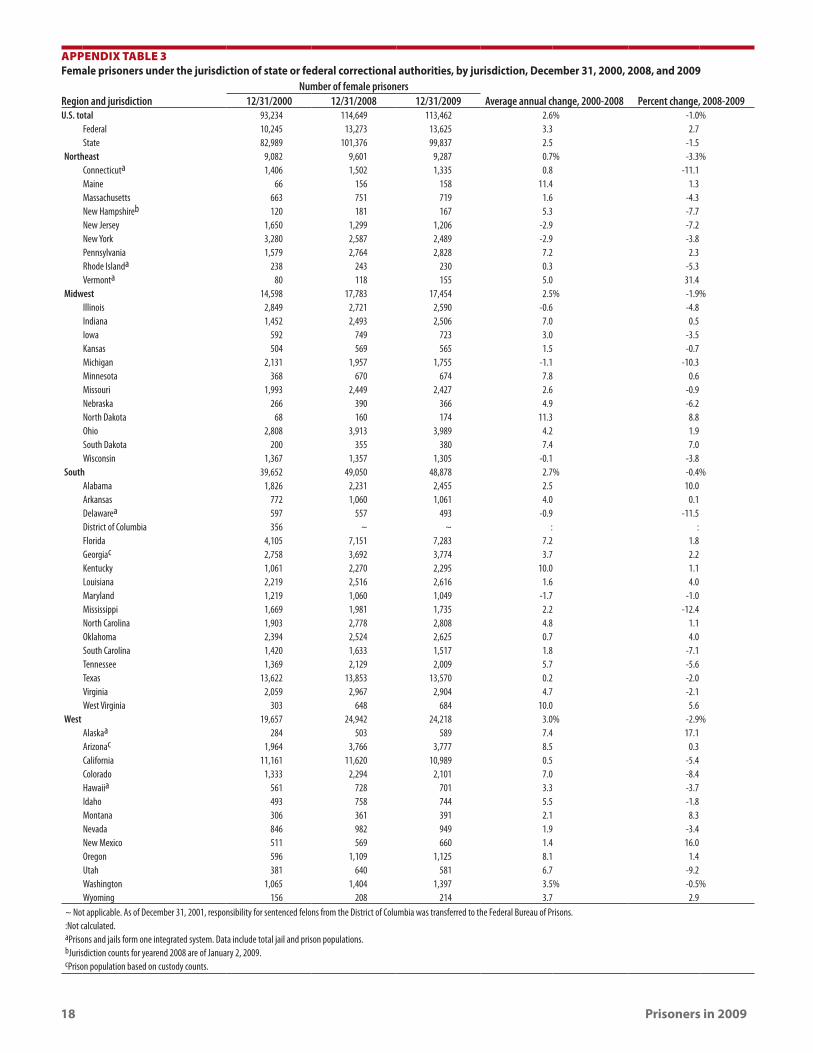
The federal prison population reached 208,118 prisoners at yearend 2009, while state authorities had jurisdiction over 1,405,622 prisoners on December 31, 2009 (table 1). The number of male prisoners, accounting for 93% of all prisoners, increased by 0.3% during 2009, while the number of female prisoners declined by 0.1%.
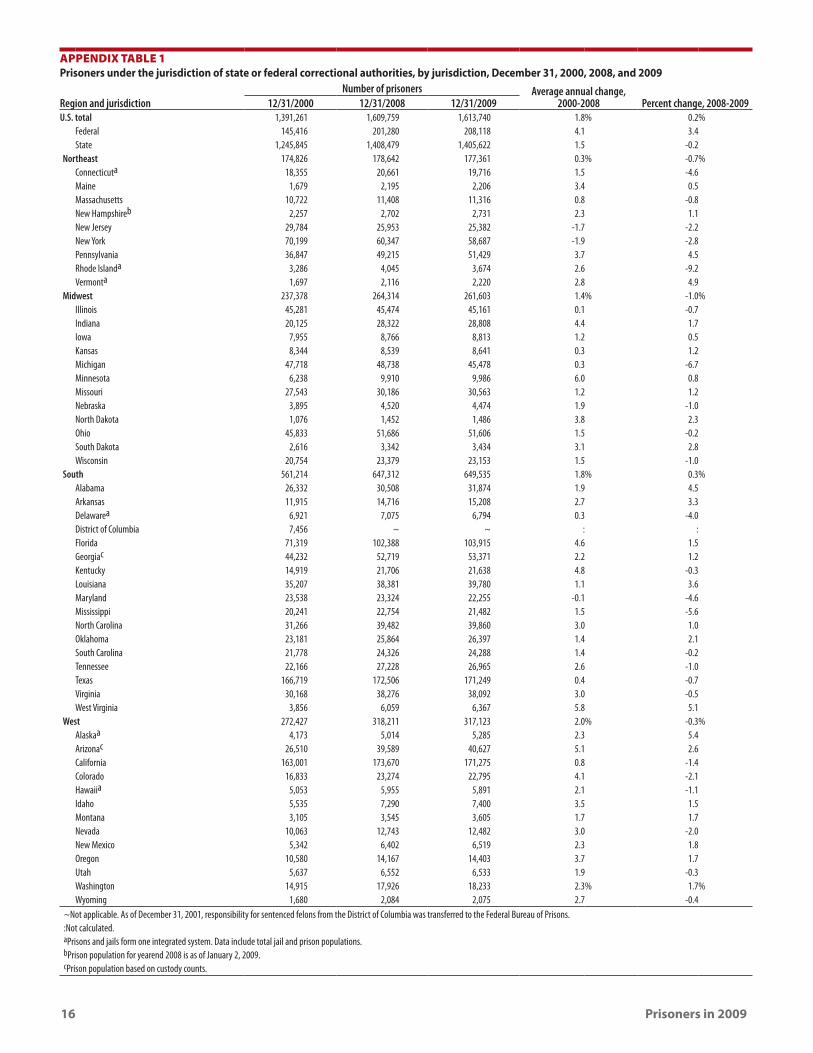
Twenty-four state departments of corrections reported decreases in their prison populations during 2009 (appendix table 1). Michigan (down 3,260) and California (down 2,395) reported the largest declines in absolute numbers, followed by New York (down 1,660), Mississippi (down 1,272), and Texas (down 1,257). Rhode Island (down 9.2%) reported the largest percentage decrease the state prison population between yearend 2008 and yearend 2009, followed by Michigan (down 6.7%), Mississippi (down 5.6%), and Maryland and Connecticut (down 4.6% each).
Among states that experienced declines in their prison population during 2009, only in New York, New Jersey, and Maryland did the decrease continue a longer-term pattern of decline over the 8-year period from 2000 to 2008. Illinois, Michigan, Delaware, and Texas also experienced a decline in their prison population during 2009, and their growth rates from 2000 through 2008 averaged less than one-half of 1 percent.
The remaining 26 state departments of corrections reported increases in their prison populations. Pennsylvania (up 2,214) reported the largest increase in absolute numbers, followed by Florida (up 1,527), Louisiana (up 1,399), and Alabama (up 1,366). Alaska (up 5.4%) reported the largest percentage increase in the state prison population, followed by West Virginia (up 5.1%), Vermont (up 4.9%), and Pennsylvania and Alabama (up 4.5% each).
Table 1 Prisoners under the jurisdiction of state or federal correctional authorities, December 31, 2000–2009
Year Total Federal State Male FemaleSentenced to more
than 1 yearaImprisonment
rateb
2000 1,391,261 145,416 1,245,845 1,298,027 93,234 1,331,278 4782001 1,404,032 156,993 1,247,039 1,311,053 92,979 1,345,217 4702002 1,440,144 163,528 1,276,616 1,342,513 97,631 1,380,516 4762003 1,468,601 173,059 1,295,542 1,367,755 100,846 1,408,361 4822004 1,497,100 180,328 1,316,772 1,392,278 104,822 1,433,728 4862005 1,527,929 187,618 1,340,311 1,420,303 107,626 1,462,866 4912006 1,569,945 193,046 1,376,899 1,457,486 112,459 1,504,660 5012007 1,598,245 199,618 1,398,627 1,483,740 114,505 1,532,850 5062008 1,609,759 201,280 1,408,479 1,495,110 114,649 1,547,742 5042009 1,613,740 208,118 1,405,622 1,500,278 113,462 1,548,721 502Average annual change, 2000–2008 1.8% 4.1% 1.5% 1.8% 2.6% 1.9% 0.7%Percent change, 2008–2009 0.2 3.4 -0.2 0.3 -1.0 0.1 -0.4
Note: Jurisdiction refers to the legal authority over a prisoner, regardless of where the prisoner is held.aIncludes prisoners under the legal authority of state or federal correctional officials with sentences of more than 1 year, regardless of where they are held.bImprisonment rate is the number of prisoners sentenced to more than 1 year under state or federal jurisdiction per 100,000 U.S. residents. Resident population estimates are from the U.S. Census Bureau for January 1 of the following year for the yearend estimates.
December 2010 3
The imprisonment rate declined between yearend 2008 and 2009
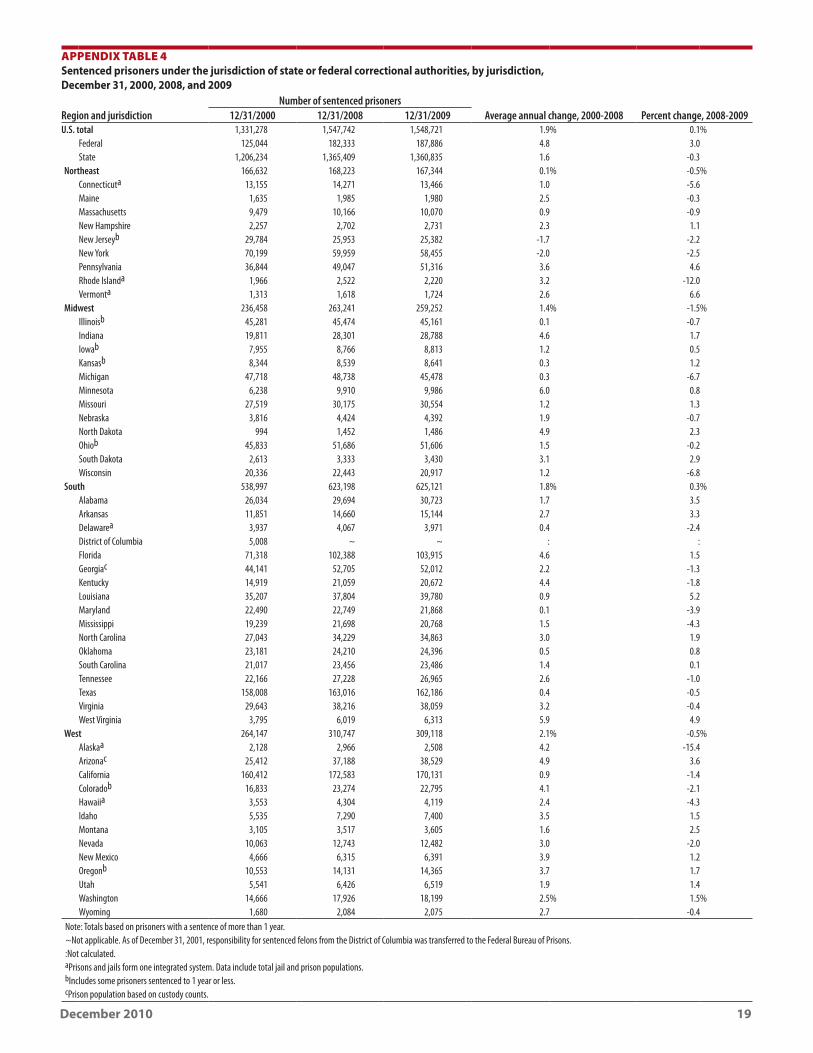
The U.S. imprisonment rate—the number of sentenced prisoners per 100,000 U.S. residents—declined slightly from 504 to 502 prisoners per 100,000 U.S. residents between yearend 2008 and 2009 (appendix table 9). Imprisonment rates decreased in 28 states during this period, and increased in 18 states and the federal system. Four states reported little change to their imprisonment rates during 2009. Alaska (down 73 prisoners per 100,000 U.S. residents) reported the largest decrease in the state imprisonment rate at yearend 2009; Louisiana (up 28 prisoners per 100,000 U.S. residents) reported the largest increase.
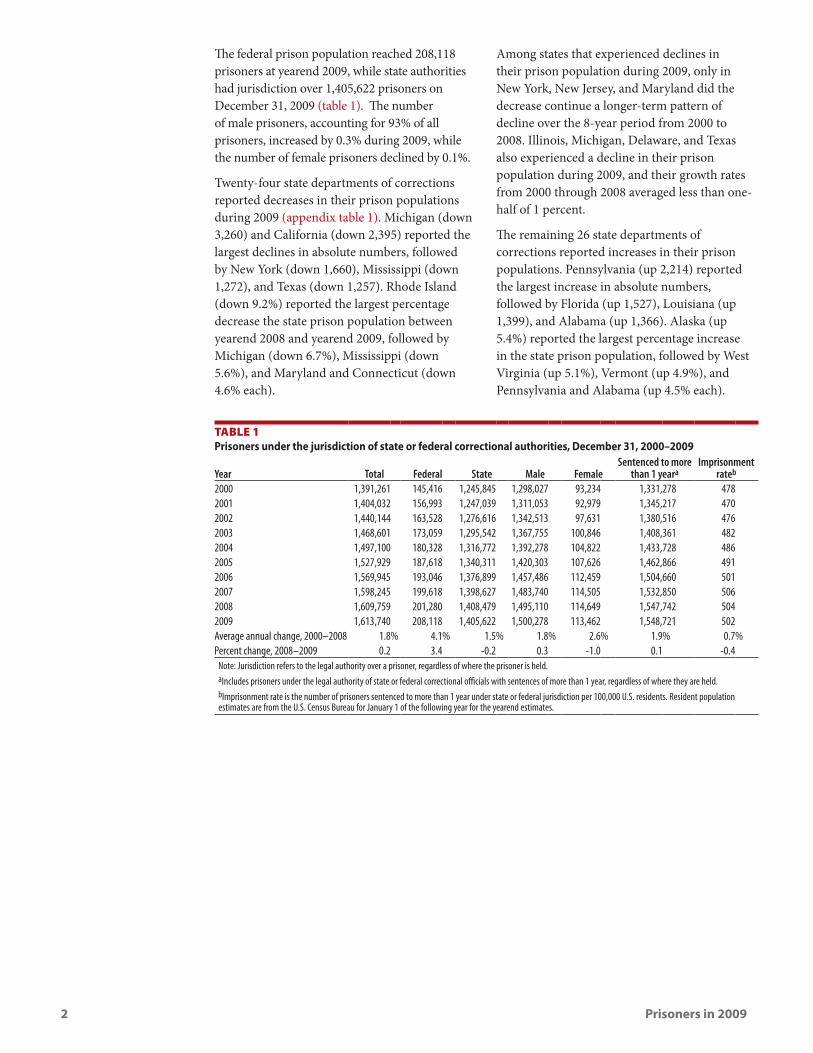
The decline in the U.S. imprisonment rate stems from a decline in the imprisonment rate for state prisoners. The imprisonment rate for the federal prison population increased during 2009, reaching 61 per 100,000 U.S. residents (figure 3).
While the imprisonment rate of sentenced federal prisoners trended upward since 1990, the rate of increase slowed from 2000 to 2009. Compared to the increase in the number of federal prisoners, the imprisonment rate for this population has increased more slowly since 2000. The number of sentenced prisoners increased by an average of 4.6% per year from 125,044 in 2000 to 187,886 in 2009. The federal imprisonment rate increased by an average of 3.4% per year over this period.
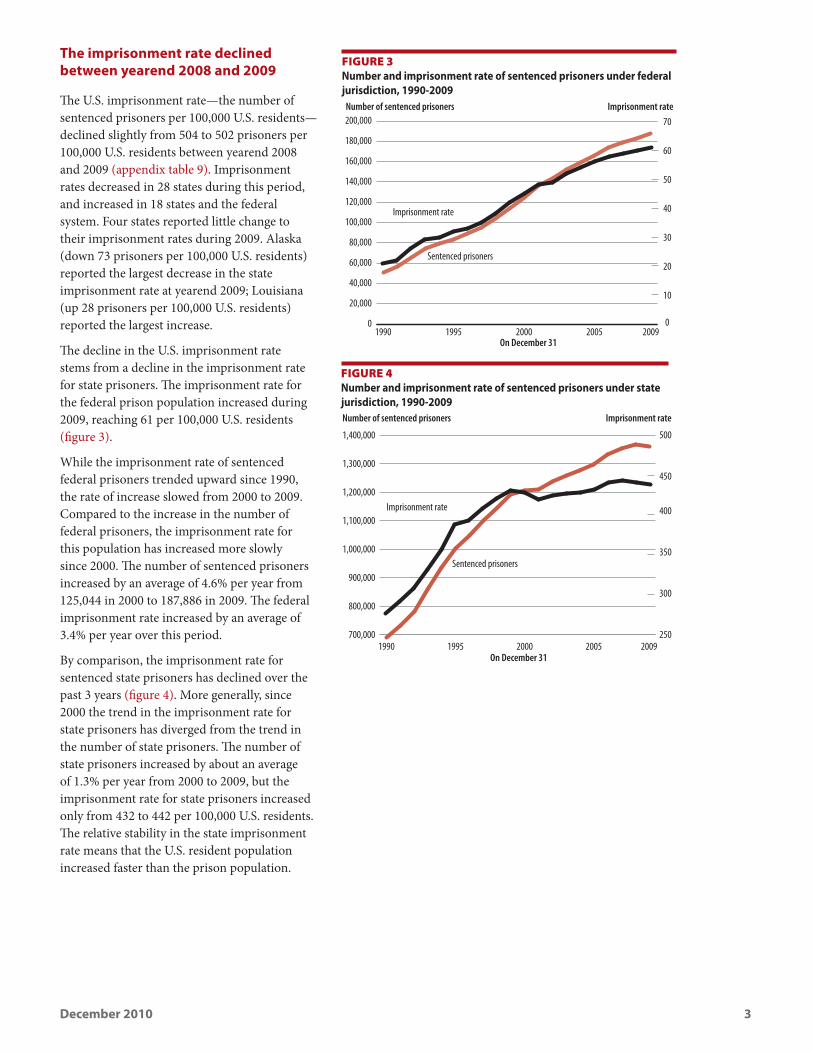
By comparison, the imprisonment rate for sentenced state prisoners has declined over the past 3 years (figure 4). More generally, since 2000 the trend in the imprisonment rate for state prisoners has diverged from the trend in the number of state prisoners. The number of state prisoners increased by about an average of 1.3% per year from 2000 to 2009, but the imprisonment rate for state prisoners increased only from 432 to 442 per 100,000 U.S. residents. The relative stability in the state imprisonment rate means that the U.S. resident population increased faster than the prison population.
Figure 3 Number and imprisonment rate of sentenced prisoners under federal jurisdiction, 1990-2009
0
20,000
40,000
60,000
80,000
100,000
120,000
140,000
160,000
180,000
200,000
Sentenced prisoners
20092005200019951990On December 31
Number of sentenced prisoners Imprisonment rate
0
10
20
30
40
50
60
70
Imprisonment rate
700,000
800,000
900,000
1,000,000
1,100,000
1,200,000
1,300,000
1,400,000
Imprisonment rate
Sentenced prisoners
20092005200019951990250
300
350
400
450
500
Imprisonment rateNumber of sentenced prisoners
On December 31
Figure 4 Number and imprisonment rate of sentenced prisoners under state jurisdiction, 1990-2009
4 Prisoners in 2009
Prison admissions and releases converged in recent years
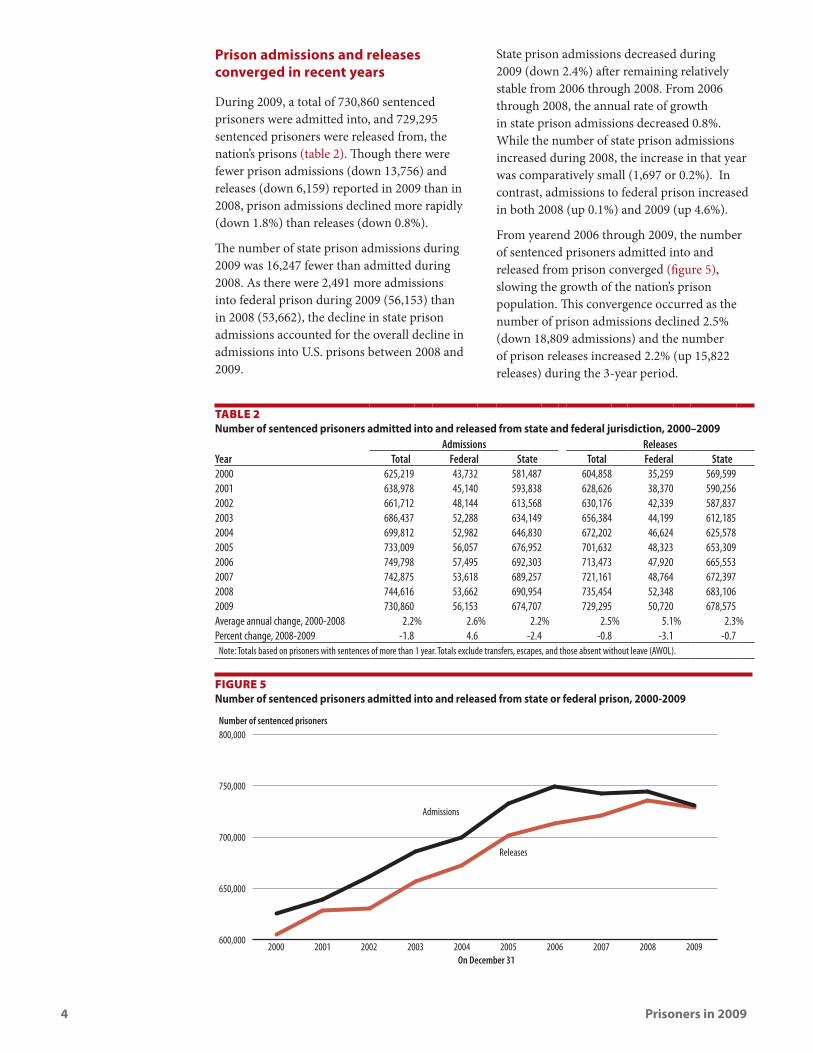
During 2009, a total of 730,860 sentenced prisoners were admitted into, and 729,295 sentenced prisoners were released from, the nation’s prisons (table 2). Though there were fewer prison admissions (down 13,756) and releases (down 6,159) reported in 2009 than in 2008, prison admissions declined more rapidly (down 1.8%) than releases (down 0.8%).
The number of state prison admissions during 2009 was 16,247 fewer than admitted during 2008. As there were 2,491 more admissions into federal prison during 2009 (56,153) than in 2008 (53,662), the decline in state prison admissions accounted for the overall decline in admissions into U.S. prisons between 2008 and 2009.
State prison admissions decreased during 2009 (down 2.4%) after remaining relatively stable from 2006 through 2008. From 2006 through 2008, the annual rate of growth in state prison admissions decreased 0.8%. While the number of state prison admissions increased during 2008, the increase in that year was comparatively small (1,697 or 0.2%). In contrast, admissions to federal prison increased in both 2008 (up 0.1%) and 2009 (up 4.6%).
From yearend 2006 through 2009, the number of sentenced prisoners admitted into and released from prison converged (figure 5), slowing the growth of the nation’s prison population. This convergence occurred as the number of prison admissions declined 2.5% (down 18,809 admissions) and the number of prison releases increased 2.2% (up 15,822 releases) during the 3-year period.
600,000
650,000
700,000
750,000
800,000
Releases
Admissions
2009200820072006200520042003200220012000On December 31
Number of sentenced prisoners
Figure 5 Number of sentenced prisoners admitted into and released from state or federal prison, 2000-2009
Table 2 Number of sentenced prisoners admitted into and released from state and federal jurisdiction, 2000–2009
Admissions ReleasesYear Total Federal State Total Federal State2000 625,219 43,732 581,487 604,858 35,259 569,5992001 638,978 45,140 593,838 628,626 38,370 590,2562002 661,712 48,144 613,568 630,176 42,339 587,8372003 686,437 52,288 634,149 656,384 44,199 612,1852004 699,812 52,982 646,830 672,202 46,624 625,5782005 733,009 56,057 676,952 701,632 48,323 653,3092006 749,798 57,495 692,303 713,473 47,920 665,5532007 742,875 53,618 689,257 721,161 48,764 672,3972008 744,616 53,662 690,954 735,454 52,348 683,1062009 730,860 56,153 674,707 729,295 50,720 678,575Average annual change, 2000-2008 2.2% 2.6% 2.2% 2.5% 5.1% 2.3%Percent change, 2008-2009 -1.8 4.6 -2.4 -0.8 -3.1 -0.7
Note: Totals based on prisoners with sentences of more than 1 year. Totals exclude transfers, escapes, and those absent without leave (AWOL).
December 2010 5
From 2006 through 2008, prison population growth slowed because of declines in admissions and increases in releases. During 2009, both admissions and releases declined and prison population growth slowed due to a larger decrease in admissions than releases.
Although small, the 0.8% decrease in the number of prisoners released from state (down 0.7%) and federal (down 3.1%) prisons during 2009 was the first decline in the number of prison releases since 2000. The decline in the number of prisoners released in 2009 was the first decrease in state prison releases since 2002 when releases dropped by 0.4%, and the second decrease in federal prison releases since 2000.
Decline in state prison admissions was led by a decrease in parole violators admitted in California
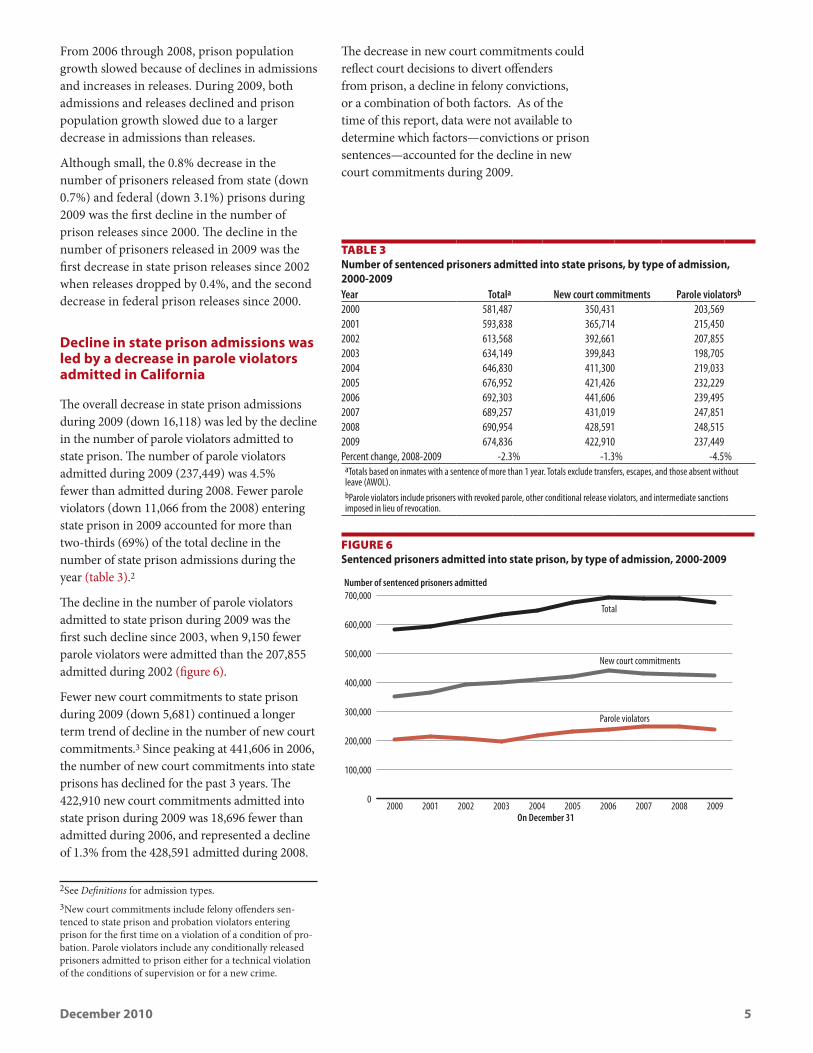
The overall decrease in state prison admissions during 2009 (down 16,118) was led by the decline in the number of parole violators admitted to state prison. The number of parole violators admitted during 2009 (237,449) was 4.5% fewer than admitted during 2008. Fewer parole violators (down 11,066 from the 2008) entering state prison in 2009 accounted for more than two-thirds (69%) of the total decline in the number of state prison admissions during the year (table 3).2
The decline in the number of parole violators admitted to state prison during 2009 was the first such decline since 2003, when 9,150 fewer parole violators were admitted than the 207,855 admitted during 2002 (figure 6).
Fewer new court commitments to state prison during 2009 (down 5,681) continued a longer term trend of decline in the number of new court commitments.3 Since peaking at 441,606 in 2006, the number of new court commitments into state prisons has declined for the past 3 years. The 422,910 new court commitments admitted into state prison during 2009 was 18,696 fewer than admitted during 2006, and represented a decline of 1.3% from the 428,591 admitted during 2008.
The decrease in new court commitments could reflect court decisions to divert offenders from prison, a decline in felony convictions, or a combination of both factors. As of the time of this report, data were not available to determine which factors—convictions or prison sentences—accounted for the decline in new court commitments during 2009.
2See Definitions for admission types. 3New court commitments include felony offenders sen-tenced to state prison and probation violators entering prison for the first time on a violation of a condition of pro-bation. Parole violators include any conditionally released prisoners admitted to prison either for a technical violation of the conditions of supervision or for a new crime.
0
100,000
200,000
300,000
400,000
500,000
600,000
700,000
Parole violators
New court commitments
Total
2009200820072006200520042003200220012000On December 31
Number of sentenced prisoners admitted
Figure 6 Sentenced prisoners admitted into state prison, by type of admission, 2000-2009
Table 3 Number of sentenced prisoners admitted into state prisons, by type of admission, 2000-2009Year Totala New court commitments Parole violatorsb
2000 581,487 350,431 203,5692001 593,838 365,714 215,4502002 613,568 392,661 207,8552003 634,149 399,843 198,7052004 646,830 411,300 219,0332005 676,952 421,426 232,2292006 692,303 441,606 239,4952007 689,257 431,019 247,8512008 690,954 428,591 248,5152009 674,836 422,910 237,449Percent change, 2008-2009 -2.3% -1.3% -4.5%
aTotals based on inmates with a sentence of more than 1 year. Totals exclude transfers, escapes, and those absent without leave (AWOL).bParole violators include prisoners with revoked parole, other conditional release violators, and intermediate sanctions imposed in lieu of revocation.
6 Prisoners in 2009
More than half (29) of the state departments of corrections reported decreases in prison admissions between yearend 2008 and yearend 2009 (appendix table 10). California reported a decline of 11,122 admissions in 2009, a decrease that was almost 4 times greater than any other state. California’s change in admissions had a large influence on the number of state prison admissions nationwide, particularly the decrease in the number of admissions to California state prisons for parole violations (down 9,668) during 2009. Fewer admissions for parole violations accounted for almost 87% of the decline in the number of California state prison admissions, and about 87% of the decline in the number of parole violators entering state prison nationwide during the year.
Excluding California, parole violators admitted to state prison would have decreased by 1,398 instead of 11,066. Comparatively, fewer new court commitments to California state prison made up about a quarter (26%) of the decline in new court commitments to state prison nationwide. Excluding California, the number of new court commitments would have decreased by 4,227 instead of 5,681 in 2009.
Decrease in state prison releases led by the decline in the number of prisoners released unconditionally
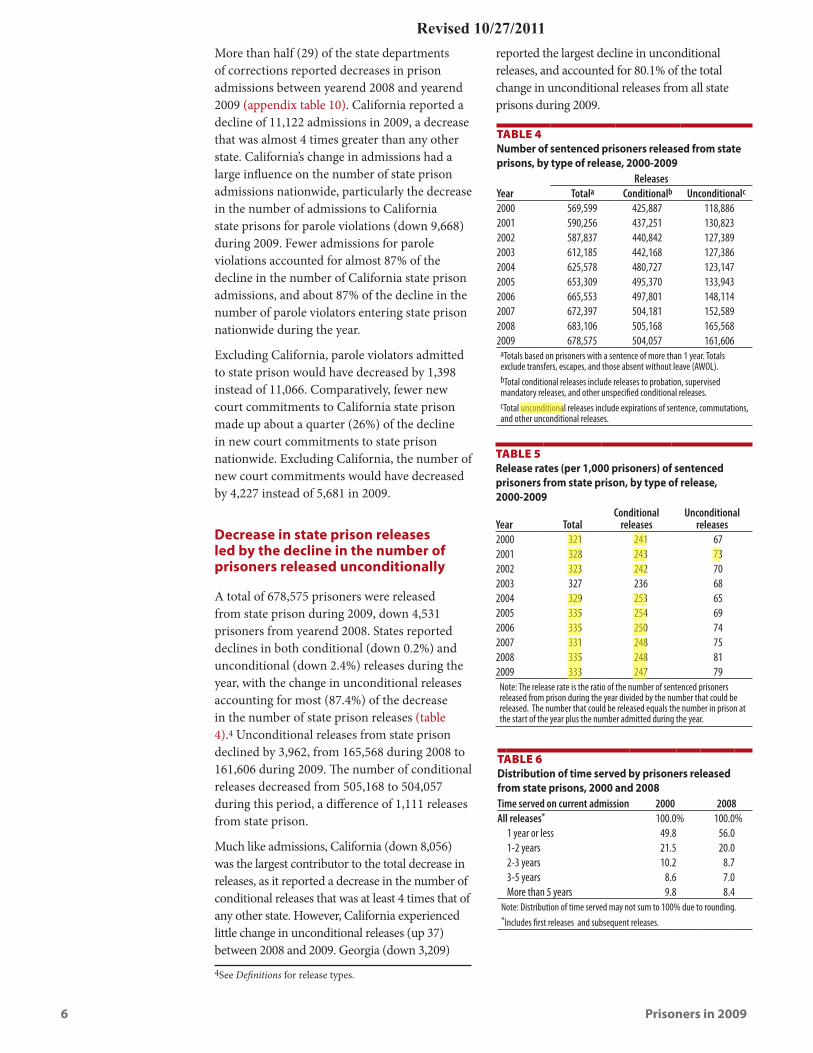
A total of 678,575 prisoners were released from state prison during 2009, down 4,531 prisoners from yearend 2008. States reported declines in both conditional (down 0.2%) and unconditional (down 2.4%) releases during the year, with the change in unconditional releases accounting for most (87.4%) of the decrease in the number of state prison releases (table 4).4 Unconditional releases from state prison declined by 3,962, from 165,568 during 2008 to 161,606 during 2009. The number of conditional releases decreased from 505,168 to 504,057 during this period, a difference of 1,111 releases from state prison.
Much like admissions, California (down 8,056) was the largest contributor to the total decrease in releases, as it reported a decrease in the number of conditional releases that was at least 4 times that of any other state. However, California experienced little change in unconditional releases (up 37) between 2008 and 2009. Georgia (down 3,209)
reported the largest decline in unconditional releases, and accounted for 80.1% of the total change in unconditional releases from all state prisons during 2009.
4See Definitions for release types.
Table 4 Number of sentenced prisoners released from state prisons, by type of release, 2000-2009
ReleasesYear Totala Conditionalb Unconditionalc
2000 569,599 425,887 118,8862001 590,256 437,251 130,8232002 587,837 440,842 127,3892003 612,185 442,168 127,3862004 625,578 480,727 123,1472005 653,309 495,370 133,9432006 665,553 497,801 148,1142007 672,397 504,181 152,5892008 683,106 505,168 165,5682009 678,575 504,057 161,606
aTotals based on prisoners with a sentence of more than 1 year. Totals exclude transfers, escapes, and those absent without leave (AWOL).bTotal conditional releases include releases to probation, supervised mandatory releases, and other unspecified conditional releases.cTotal unconditional releases include expirations of sentence, commutations, and other unconditional releases.
Table 5 Release rates (per 1,000 prisoners) of sentenced prisoners from state prison, by type of release, 2000-2009
Year TotalConditional
releasesUnconditional
releases2000 321 241 672001 328 243 732002 323 242 702003 327 236 682004 329 253 652005 335 254 692006 335 250 742007 331 248 752008 335 248 812009 333 247 79
Note: The release rate is the ratio of the number of sentenced prisoners released from prison during the year divided by the number that could be released. The number that could be released equals the number in prison at the start of the year plus the number admitted during the year.
Table 6 Distribution of time served by prisoners released
from state prisons, 2000 and 2008Time served on current admission 2000 2008All releases* 100.0% 100.0%
1 year or less 49.8 56.01-2 years 21.5 20.02-3 years 10.2 8.73-5 years 8.6 7.0More than 5 years 9.8 8.4
Note: Distribution of time served may not sum to 100% due to rounding.*Includes first releases and subsequent releases.
Revised 10/27/2011
dorseyt
Highlight
dorseyt
Highlight
dorseyt
Highlight
dorseyt
Highlight
dorseyt
Highlight
dorseyt
Highlight
dorseyt
Highlight
dorseyt
Highlight
dorseyt
Highlight
dorseyt
Highlight
dorseyt
Highlight
dorseyt
Highlight
dorseyt
Highlight
dorseyt
Highlight
dorseyt
Highlight
dorseyt
Highlight
dorseyt
Highlight
dorseyt
Highlight
dorseyt
Highlight
dorseyt
Highlight
December 2010 7
Release rates increased
The release rate is the ratio of the number of sentenced prisoners released from prison during a year, divided by the sum of the start of the year population of sentenced prisoners plus the number of sentenced prisoners admitted during the year, and is expressed per 1,000 prisoners who could be released. The measure used in this report includes all types of releases, including releases from new court commitments (so-called first releases), releases of parole violators, and releases by other means, including death and other exceptional types of release. The release rate gives an indication of turnover in the prison population and consequently of length of stay in prison. As the release rate increases, the length of stay in prison decreases.
From 2002 through 2005, the total release rate increased (321 to 337 per 1,000 prisoners), and after dipping slightly in 2006 (332 per 1,000), it has remained relatively stable through 2009 (table 5). The overall relative stability in the release rate masks differences by type of release. From 2006 through 2009, the release rate for conditional releases (prisoners released to some form of post-prison supervision) was comparatively stable (around 246 per 1,000 prisoners), while the release rate for unconditional releases and those whose sentences expired increased slightly. For unconditional releases, the release rate increased from 74 per 1,000 prisoners (in 2006) to 79 per 1,000 (in 2009), and for prisoners whose sentences expired, the release rate also increased slightly from 67 (in 2006) to 73 per 1,000 prisoners (in 2009).
Accompanying the increase in the release rate of state prisoners was a slight change in the distribution of time served until release from prison. During 2000, about half of all sentenced offenders released from state prison served 1 year or less in prison, and 71% served 2 years or less (table 6).5 By 2008 (the year of the most recent detailed BJS data available at the time of this report), 56% of sentenced offenders released from state prison had served 1 year or less, and
76% had served 2 years or less. As the share of released prisoners with shorter lengths of stay increased, the share of those serving longer time declined. In 2000, about 10% of sentenced prisoners released from state prison had served more than 5 years. This percentage declined to about 8% in 2008.
Violent offenders accounted for 60% of the growth in the size of the state prison population from 2000 through 2008
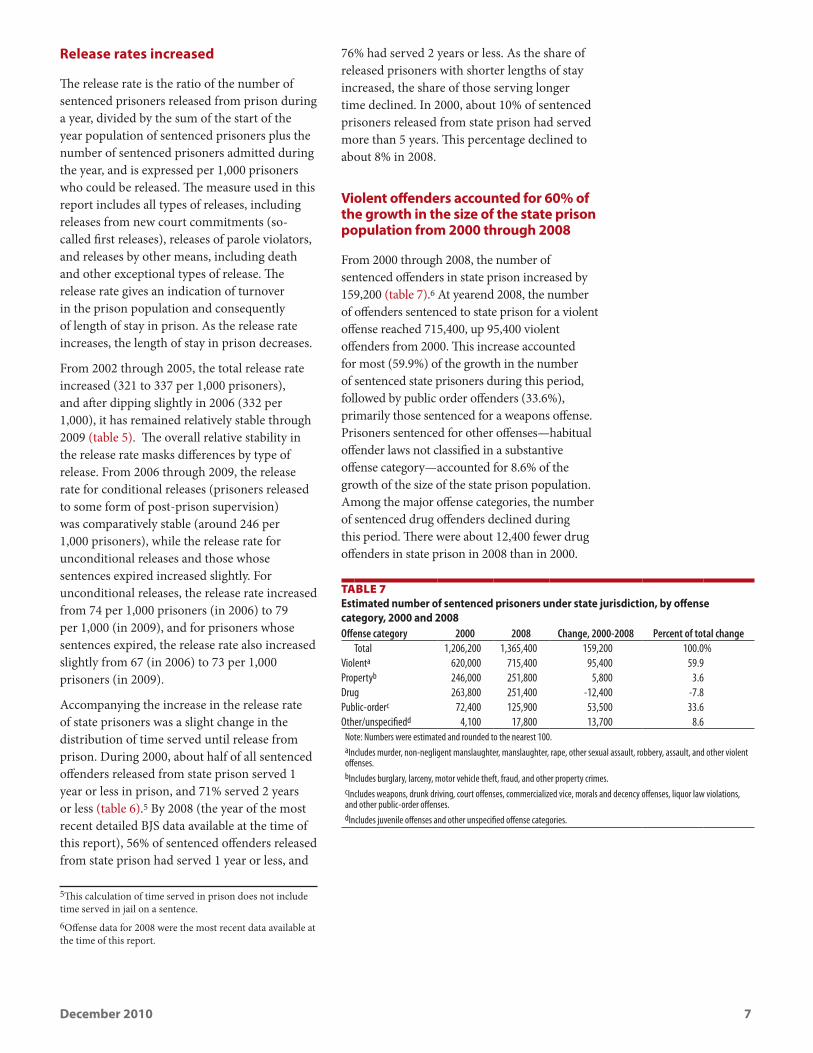
From 2000 through 2008, the number of sentenced offenders in state prison increased by 159,200 (table 7).6 At yearend 2008, the number of offenders sentenced to state prison for a violent offense reached 715,400, up 95,400 violent offenders from 2000. This increase accounted for most (59.9%) of the growth in the number of sentenced state prisoners during this period, followed by public order offenders (33.6%), primarily those sentenced for a weapons offense. Prisoners sentenced for other offenses—habitual offender laws not classified in a substantive offense category—accounted for 8.6% of the growth of the size of the state prison population. Among the major offense categories, the number of sentenced drug offenders declined during this period. There were about 12,400 fewer drug offenders in state prison in 2008 than in 2000.
Table 7 Estimated number of sentenced prisoners under state jurisdiction, by offense category, 2000 and 2008Offense category 2000 2008 Change, 2000-2008 Percent of total change
Total 1,206,200 1,365,400 159,200 100.0%Violenta 620,000 715,400 95,400 59.9Propertyb 246,000 251,800 5,800 3.6Drug 263,800 251,400 -12,400 -7.8Public-orderc 72,400 125,900 53,500 33.6Other/unspecifiedd 4,100 17,800 13,700 8.6
Note: Numbers were estimated and rounded to the nearest 100.aIncludes murder, non-negligent manslaughter, manslaughter, rape, other sexual assault, robbery, assault, and other violent offenses.bIncludes burglary, larceny, motor vehicle theft, fraud, and other property crimes.cIncludes weapons, drunk driving, court offenses, commercialized vice, morals and decency offenses, liquor law violations, and other public-order offenses.dIncludes juvenile offenses and other unspecified offense categories.
5This calculation of time served in prison does not include time served in jail on a sentence. 6Offense data for 2008 were the most recent data available at the time of this report.
8 Prisoners in 2009
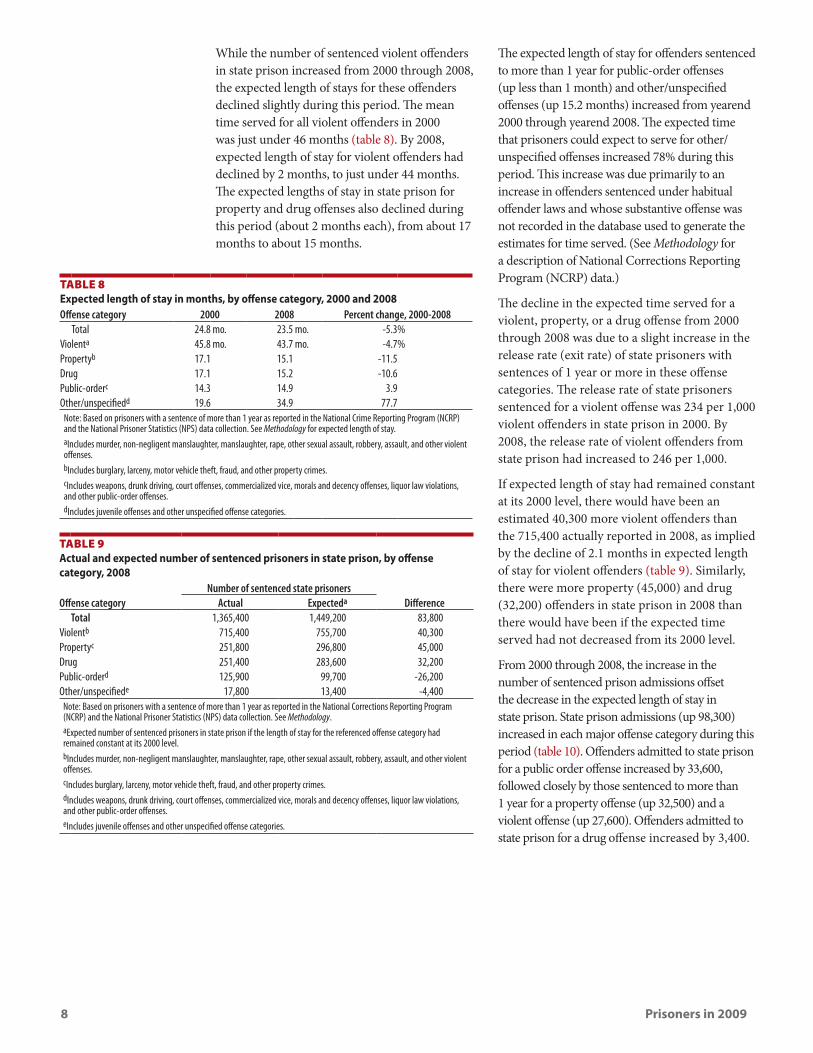
While the number of sentenced violent offenders in state prison increased from 2000 through 2008, the expected length of stays for these offenders declined slightly during this period. The mean time served for all violent offenders in 2000 was just under 46 months (table 8). By 2008, expected length of stay for violent offenders had declined by 2 months, to just under 44 months. The expected lengths of stay in state prison for property and drug offenses also declined during this period (about 2 months each), from about 17 months to about 15 months.
The expected length of stay for offenders sentenced to more than 1 year for public-order offenses (up less than 1 month) and other/unspecified offenses (up 15.2 months) increased from yearend 2000 through yearend 2008. The expected time that prisoners could expect to serve for other/unspecified offenses increased 78% during this period. This increase was due primarily to an increase in offenders sentenced under habitual offender laws and whose substantive offense was not recorded in the database used to generate the estimates for time served. (See Methodology for a description of National Corrections Reporting Program (NCRP) data.)
The decline in the expected time served for a violent, property, or a drug offense from 2000 through 2008 was due to a slight increase in the release rate (exit rate) of state prisoners with sentences of 1 year or more in these offense categories. The release rate of state prisoners sentenced for a violent offense was 234 per 1,000 violent offenders in state prison in 2000. By 2008, the release rate of violent offenders from state prison had increased to 246 per 1,000.
If expected length of stay had remained constant at its 2000 level, there would have been an estimated 40,300 more violent offenders than the 715,400 actually reported in 2008, as implied by the decline of 2.1 months in expected length of stay for violent offenders (table 9). Similarly, there were more property (45,000) and drug (32,200) offenders in state prison in 2008 than there would have been if the expected time served had not decreased from its 2000 level.
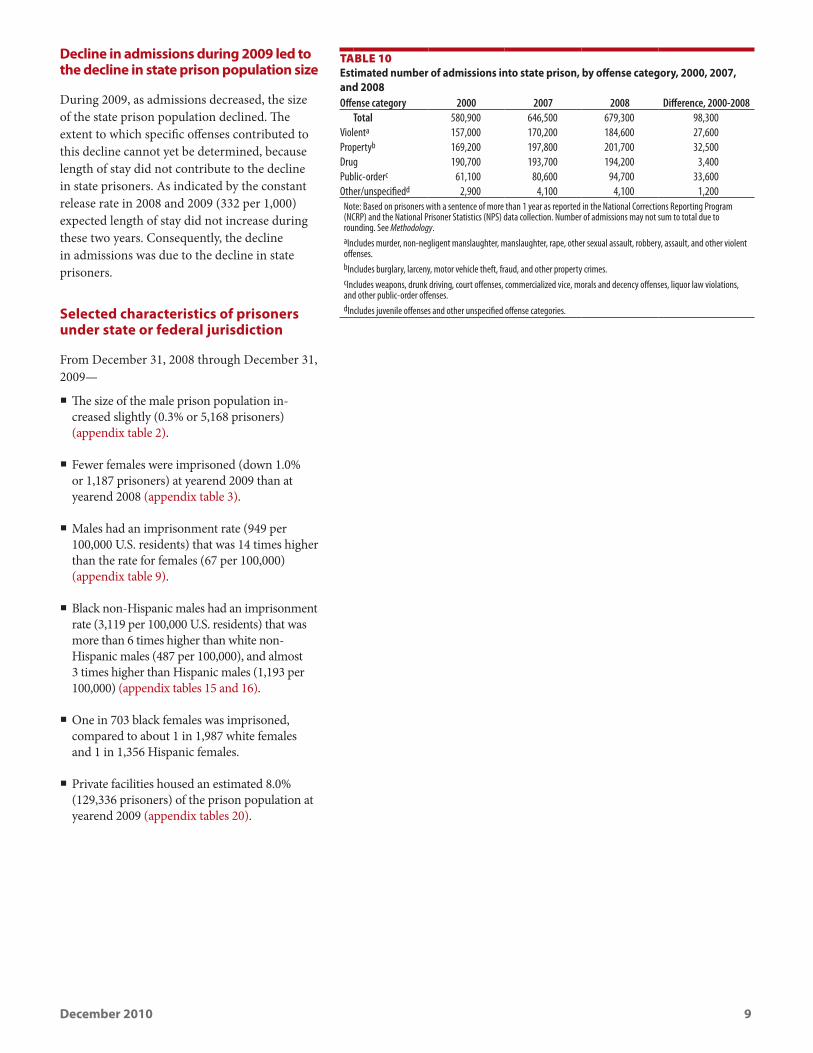
From 2000 through 2008, the increase in the number of sentenced prison admissions offset the decrease in the expected length of stay in state prison. State prison admissions (up 98,300) increased in each major offense category during this period (table 10). Offenders admitted to state prison for a public order offense increased by 33,600, followed closely by those sentenced to more than 1 year for a property offense (up 32,500) and a violent offense (up 27,600). Offenders admitted to state prison for a drug offense increased by 3,400.
Table 9 Actual and expected number of sentenced prisoners in state prison, by offense category, 2008
Number of sentenced state prisonersOffense category Actual Expecteda Difference
Total 1,365,400 1,449,200 83,800Violentb 715,400 755,700 40,300Propertyc 251,800 296,800 45,000Drug 251,400 283,600 32,200Public-orderd 125,900 99,700 -26,200Other/unspecifiede 17,800 13,400 -4,400
Note: Based on prisoners with a sentence of more than 1 year as reported in the National Corrections Reporting Program (NCRP) and the National Prisoner Statistics (NPS) data collection. See Methodology.aExpected number of sentenced prisoners in state prison if the length of stay for the referenced offense category had remained constant at its 2000 level.bIncludes murder, non-negligent manslaughter, manslaughter, rape, other sexual assault, robbery, assault, and other violent offenses.cIncludes burglary, larceny, motor vehicle theft, fraud, and other property crimes.dIncludes weapons, drunk driving, court offenses, commercialized vice, morals and decency offenses, liquor law violations, and other public-order offenses.eIncludes juvenile offenses and other unspecified offense categories.
Table 8 Expected length of stay in months, by offense category, 2000 and 2008Offense category 2000 2008 Percent change, 2000-2008
Total 24.8 mo. 23.5 mo. -5.3%Violenta 45.8 mo. 43.7 mo. -4.7%Propertyb 17.1 15.1 -11.5Drug 17.1 15.2 -10.6Public-orderc 14.3 14.9 3.9Other/unspecifiedd 19.6 34.9 77.7
Note: Based on prisoners with a sentence of more than 1 year as reported in the National Crime Reporting Program (NCRP) and the National Prisoner Statistics (NPS) data collection. See Methodology for expected length of stay.aIncludes murder, non-negligent manslaughter, manslaughter, rape, other sexual assault, robbery, assault, and other violent offenses.bIncludes burglary, larceny, motor vehicle theft, fraud, and other property crimes.cIncludes weapons, drunk driving, court offenses, commercialized vice, morals and decency offenses, liquor law violations, and other public-order offenses.dIncludes juvenile offenses and other unspecified offense categories.
December 2010 9
Decline in admissions during 2009 led to the decline in state prison population size
During 2009, as admissions decreased, the size of the state prison population declined. The extent to which specific offenses contributed to this decline cannot yet be determined, because length of stay did not contribute to the decline in state prisoners. As indicated by the constant release rate in 2008 and 2009 (332 per 1,000) expected length of stay did not increase during these two years. Consequently, the decline in admissions was due to the decline in state prisoners.
Selected characteristics of prisoners under state or federal jurisdiction
From December 31, 2008 through December 31, 2009—
� The size of the male prison population in-creased slightly (0.3% or 5,168 prisoners) (appendix table 2).
� Fewer females were imprisoned (down 1.0% or 1,187 prisoners) at yearend 2009 than at yearend 2008 (appendix table 3).
� Males had an imprisonment rate (949 per 100,000 U.S. residents) that was 14 times higher than the rate for females (67 per 100,000) (appendix table 9).
� Black non-Hispanic males had an imprisonment rate (3,119 per 100,000 U.S. residents) that was more than 6 times higher than white non-Hispanic males (487 per 100,000), and almost 3 times higher than Hispanic males (1,193 per 100,000) (appendix tables 15 and 16).
� One in 703 black females was imprisoned, compared to about 1 in 1,987 white females and 1 in 1,356 Hispanic females.
� Private facilities housed an estimated 8.0% (129,336 prisoners) of the prison population at yearend 2009 (appendix tables 20).
Table 10 Estimated number of admissions into state prison, by offense category, 2000, 2007, and 2008Offense category 2000 2007 2008 Difference, 2000-2008
Total 580,900 646,500 679,300 98,300Violenta 157,000 170,200 184,600 27,600Propertyb 169,200 197,800 201,700 32,500Drug 190,700 193,700 194,200 3,400Public-orderc 61,100 80,600 94,700 33,600Other/unspecifiedd 2,900 4,100 4,100 1,200
Note: Based on prisoners with a sentence of more than 1 year as reported in the National Corrections Reporting Program (NCRP) and the National Prisoner Statistics (NPS) data collection. Number of admissions may not sum to total due to rounding. See Methodology.aIncludes murder, non-negligent manslaughter, manslaughter, rape, other sexual assault, robbery, assault, and other violent offenses.bIncludes burglary, larceny, motor vehicle theft, fraud, and other property crimes.cIncludes weapons, drunk driving, court offenses, commercialized vice, morals and decency offenses, liquor law violations, and other public-order offenses.dIncludes juvenile offenses and other unspecified offense categories.
10 Prisoners in 2009
Methodology
National Prisoner Statistics
Begun in 1926 under a mandate from Congress, the National Prisoner Statistics (NPS) program collects statistics on prisoners at midyear and yearend. The U.S. Census Bureau serves as the data collection agent for the Bureau of Justice Statistics (BJS). BJS depends entirely upon the voluntary participation by state departments of corrections and the Federal Bureau of Prisons for NPS data.
The NPS distinguishes between prisoners in custody and prisoners under jurisdiction. To have custody of a prisoner, a state or federal prison must hold that prisoner in one of its facilities. To have jurisdiction over a prisoner, a state or federal prison must have legal authority over that prisoner. Some states are unable to provide counts that distinguish between custody and jurisdiction.
The NPS jurisdiction counts include prisoners serving a sentence within a jurisdiction’s facilities. These facilities include prisons, penitentiaries, correctional facilities, halfway houses, boot camps, farms, training or treatment centers, and hospitals. The NPS includes prisoners who are—
� temporarily absent (less than 30 days), out to court, or on work release
� housed in privately operated facilities, local jails, other state or federal facilities
� serving concurrent sentences for more than one correctional authority.
The NPS custody counts include all inmates held within a respondent’s facilities, including inmates housed for other correctional facilities. The custody counts exclude inmates held in local jails and in other jurisdictions. The NPS custody counts include inmates held in privately operated facilities.
Additionally, NPS data include counts of inmates in combined jail-prison systems in Alaska, Connecticut, Delaware, Hawaii, Rhode Island, and Vermont. The District of Columbia has operated only a jail system since yearend 2001. Prisoners sentenced under the District of Columbia criminal code are housed in federal facilities. Selected previously published prisoner counts and the
percent population change statistics include DC jail inmates for 2001, the last year of collection. Additional information is provided in the notes to the tables, where applicable.
BJS allows respondents—state departments of corrections and the Federal Bureau of Prisons—to update the data previously submitted. This report includes the most recent data reported. Additional information about the NPS data collection instrument is available on the BJS website at http://bjs.gov.
Other inmate counts
Federal prisoner data used to calculate race and offense distributions are obtained from BJS’ Federal Justice Statistics Program (FJSP). The FJSP obtains its data from the Federal Bureau of Prisons. These data include individual-level records of prisoners in federal facilities as of September 30. Specifically, the FJSP provides counts of sentenced federal inmates by sex, race, Hispanic origin, and offense.
Estimating age-specific imprisonment rates
Estimates are provided for the number of sentenced prisoners under state or federal jurisdiction by sex. Furthermore, prisoners are characterized within sexes by age group, race (non-Hispanic white and non-Hispanic black), and Hispanic origin. The detailed race and Hispanic origin categories exclude estimates of persons identifying two or more races.
Estimates produced separately for prisoners under state or federal jurisdiction were combined to obtain a total estimated population for 2000 and 2009. State estimates were prepared by combining information about the sex of prisoners from the NPS with information reported during inmate interviews on race and Hispanic origin in the 2004 Survey of Inmates of State Correctional Facilities.
For the estimates of federal prisoners, the distributions of FJSP counts of sentenced federal prisoners by sex, age, race, and Hispanic origin on September 30, 2009, were applied to the NPS counts of sentenced federal prisoners by sex at yearend 2009.
Estimates of the U.S. resident population for January 1, 2010, by age, sex, race, and Hispanic origin were generated by applying the December 31, 2009, age distributions within sex, race, and
December 2010 11
Hispanic origin groups to the January 1, 2010 population estimates by sex. The U.S. Census Bureau provided the population estimates.
Age-specific rates of imprisonment for each demographic group were calculated by dividing the estimated number of sentenced prisoners within each age group by the estimated number of U.S. residents in each age group. The result was multiplied by 100,000 and rounded to the nearest whole number. Totals by sex include all prisoners and U.S. residents regardless of racial or Hispanic origin. Detailed race and Hispanic origin imprisonment rates exclude persons identifying two or more races.
Calculating admission and release rates
All admission and release rates were calculated by dividing the number of admitted or released prisoners for a particular year by the sentenced population at yearend of the previous year. The result was was multiplied by 1,000, and then rounded to the nearest whole number.
Estimating expected length of stay
Admissions and release data from the NPS and individual-level time served data from the National Corrections Reporting Program (NCRP) were used to estimate length of stay. The NCRP data are administrative data on prisoners entering and exiting custody or supervision. These data are gathered annually from all state departments of corrections and parole agencies in about 41 states.
Four separate datasets from NCRP were constructed for the analysis: 2000 and 2008 prison release and 2000 and 2008 sentenced prison population (prison stock or stock population). The prison release datasets consisted of data from 36 states. Due to lower participation rates, the prison stock datasets consisted of data from 24 states. Most of the selected states submitted data during both 2000 and 2008. Data from adjacent years (1 to 2 years after 2000, or 1 to 3 years before 2008) were used to supplement the missing values for those states that did not submit data during both years. Two states, Illinois and Mississippi, did not participate in NCRP between 2004 and 2008. Data from 2003 were drawn to supplement the missing values in the 2008 prison release and prison stock datasets for these two states.
BJS used a post-stratification weight computed from NPS and NCRP to adjust the individual-level NCRP counts to the national totals. The weight is a ratio of the proportion of sentenced prisoners in the sample (NCRP) to the proportion of sentenced prisoners in the population (NPS). For each state in the NCRP, a post-stratification weight was calculated using the following formula:
Wh=(nh.∑h=1
H Nh)(Nh.∑h=1
H nh)
-1
In this formula, h represents the state stratum, wh is the post-stratification weight, nh is the number of cases in the stratum in the NCRP, and Nh is the number of cases in the stratum in the NPS. The total number of states for the stratum (h) equals 50 in NPS, 36 in the prison release datasets, and 24 in the prison stock datasets.
The method used to estimate the mean length of stay in prison was based on the exit rate and adjusts for the growth rate of the prison population (Patterson and Preston 2008).7 This measure is represented by the following equation, where
For the estimates of federal prisoners, the distributions of FJSP counts of sentenced federal prisoners by sex, age, race, and Hispanic origin on September 30,2009, were applied to the NPS counts of sentenced federal prisoners by sex at yearend 2009.
Estimates of the U.S. resident population for January 1, 2010, by age, sex, race, and Hispanic origin were generated by applying the December 31, 2009, age distributions within sex, race, and Hispanic origin groups to the January 1, 2010 population estimates by sex. The population estimates were provided by the U.S. Census Bureau.
Age-specific rates of imprisonment for each demographic group were calculated by dividing the estimated number of sentenced prisoners within each age group by the estimated number of U.S. residents in each age group. That number was multiplied by 100,000 and then rounded to the nearest whole number. Totals by gender include all prisoners and U.S. residents regardless of racial or Hispanic origin. Detailed race and Hispanic origin imprisonment rates exclude persons identifying two or more races.
Calculating admission and release rates
All admission and release rates were calculated by dividing the number of admitted or released prisoners for a particular year by the sentenced population from yearend the previous year. That number was multiplied by 1,000, and then rounded to the nearest whole number.
Estimating length of stay
Admissions and release data from the NPS and individual-level time served data collected in the National Corrections Reporting Program (NCRP) were used to estimate length of stay. The NCRP data are administrative data gathered annually from the Departments of Corrections and Parole in about 41 states on prisoners entering and leaving custody or supervision.
Four separate datasets from NCRP were constructed for the analysis: 2000 and 2008 prison release, and 2000 and 2008 prison stock. The prison release datasets consisted of data from 36 states. Due to lower participation rates, the prison stock datasets contained data from 24 states. Most of the selected states submitted data during both years. Of those that did not, data collected from adjacent years (1-2 years after 2000 or 1-3 years before 2008) were used to supplement missing values. Two states, Illinois and Mississippi, did not participate in NCRP between 2004 and 2008. Data from 2003 were drawn to supplement missing values in the 2008 prison release and prison stock datasets for these two states.
The individual-level NCRP counts were adjusted to the national totals using a post-stratification weight computed from NPS and NCRP. The weight is a ratio of the proportion of sentenced prisoners in the sample (NCRP) to the proportion of sentenced prisoners in the population (NPS). For each state in the NCRP, a post-stratification weight was calculated using the following formula:
�� � ���� � ��
�
���
����� � ��
�
���
���
where h represents the state stratum, �� is the post-stratification weight, �� is the number of cases in the stratum in NCRP, and �� is the number of cases in the stratum in NPS. H is the total number of states for the stratum, which equals 50 in NPS, 36 in the prison release datasets, and 24 in the prison stock datasets.
The method used to estimate the mean length of stay in prison is based on the exit rate and adjusts for the growth rate of the prison population (Patterson and Preston 2008)l This measure is represented by the following equation:
��� � �
������������� , is the estimator, d is the
exit rate of the stable population, r is the growth rate of the prison population, AD is the mean duration at exit, and AP is the mean duration of the stock population:
For the estimates of federal prisoners, the distributions of FJSP counts of sentenced federal prisoners by sex, age, race, and Hispanic origin on September 30,2009, were applied to the NPS counts of sentenced federal prisoners by sex at yearend 2009.
Estimates of the U.S. resident population for January 1, 2010, by age, sex, race, and Hispanic origin were generated by applying the December 31, 2009, age distributions within sex, race, and Hispanic origin groups to the January 1, 2010 population estimates by sex. The population estimates were provided by the U.S. Census Bureau.
Age-specific rates of imprisonment for each demographic group were calculated by dividing the estimated number of sentenced prisoners within each age group by the estimated number of U.S. residents in each age group. That number was multiplied by 100,000 and then rounded to the nearest whole number. Totals by gender include all prisoners and U.S. residents regardless of racial or Hispanic origin. Detailed race and Hispanic origin imprisonment rates exclude persons identifying two or more races.
Calculating admission and release rates
All admission and release rates were calculated by dividing the number of admitted or released prisoners for a particular year by the sentenced population from yearend the previous year. That number was multiplied by 1,000, and then rounded to the nearest whole number.
Estimating length of stay
Admissions and release data from the NPS and individual-level time served data collected in the National Corrections Reporting Program (NCRP) were used to estimate length of stay. The NCRP data are administrative data gathered annually from the Departments of Corrections and Parole in about 41 states on prisoners entering and leaving custody or supervision.
Four separate datasets from NCRP were constructed for the analysis: 2000 and 2008 prison release, and 2000 and 2008 prison stock. The prison release datasets consisted of data from 36 states. Due to lower participation rates, the prison stock datasets contained data from 24 states. Most of the selected states submitted data during both years. Of those that did not, data collected from adjacent years (1-2 years after 2000 or 1-3 years before 2008) were used to supplement missing values. Two states, Illinois and Mississippi, did not participate in NCRP between 2004 and 2008. Data from 2003 were drawn to supplement missing values in the 2008 prison release and prison stock datasets for these two states.
The individual-level NCRP counts were adjusted to the national totals using a post-stratification weight computed from NPS and NCRP. The weight is a ratio of the proportion of sentenced prisoners in the sample (NCRP) to the proportion of sentenced prisoners in the population (NPS). For each state in the NCRP, a post-stratification weight was calculated using the following formula:
�� � ���� � ��
�
���
����� � ��
�
���
���
where h represents the state stratum, �� is the post-stratification weight, �� is the number of cases in the stratum in NCRP, and �� is the number of cases in the stratum in NPS. H is the total number of states for the stratum, which equals 50 in NPS, 36 in the prison release datasets, and 24 in the prison stock datasets.
The method used to estimate the mean length of stay in prison is based on the exit rate and adjusts for the growth rate of the prison population (Patterson and Preston 2008)l This measure is represented by the following equation:
��� � �
������������� ,
Estimating the mean length of stay included several steps. First, a post-stratification weight was calculated and applied to the NCRP data reported by each state. The analysis was limited to inmates with a sentence of more than 12 months to exclude jail inmates who typically have shorter sentences. Exit rates (d) for both years (2000 and 2008) were calculated by dividing the number of prisoners released during the year by the size of the sentenced prison population reported in the NPS at yearend. NPS data were also used to estimate growth in the prison population (r) from yearend 1999 through yearend 2000 and from yearend 2007 to yearend 2008. Weighted data from the 36 states in the prison release datasets were selected to estimate the mean durations at exit (AD) in 2000 and 2008. Similarly, weighted 7Evelyn J. Patterson and Samuel H. Preston, 2008. “Estimat-ing Mean Length of Stay in Prison: Methods and Applica-tions,” Journal of Quantitative Criminology, Volume 24, pages 33-49.
12 Prisoners in 2009
data from the 24 states in the prison stock datasets were aggregated to estimate the mean durations of the stock population (AP) in 2000 and 2008. Lastly, the estimates obtained from the previous steps were entered into the estimator to compute the mean length of stay for the overall prison population in 2000 and 2008.
With the exceptions of the steps taken to calculate the exit and growth rates, BJS used the above procedures to estimate the mean lengths of stay for subgroups defined by the 5 main offense and admission types. For the calculation of the exit rates and growth rates for these subgroups, the percentage of cases in the main offense and admission categories was obtained from the weighted NCRP data. The percentage was applied to the state population counts in NPS to generate group totals for prison releases and prison stock in those categories. The adjusted group totals for prison releases were divided by the corresponding adjusted totals for the sentenced prison population to calculate the exit rates. The growth rates for 2000 and 2008 were derived from the changes in the adjusted sentenced prison populations in those categories from 1999 to 2000 and from 2007 to 2008, respectively.
The analysis also provided estimates of mean length of stay and percentage change in length of stay for individual states providing valid prison release and prison stock data to the NCRP either for 2000 and 2008 or for adjacent years. The weighted NCRP data was used to calculate the average lengths of time served in 2000 and 2008. State-level prison population data from the NPS were used to calculate exit rates and growth rates.
To assess states’ contributions to change in length of stay, the overall length of stay in all state prisons was reestimated by setting the states’ 2008 values in mean time served on current admission, number of prison releases, yearend sentenced prison population, and prison growth at their 2000 levels. The difference between the new estimate and the previous estimate was divided by the total amount of changes in estimated length of stay from 2000 to 2008 in the overall state prison population. The result, when presented in the form of percent change, indicates the extent to which the overall estimated length of stay in prison would have risen or fallen had the changes in the state from 2000 to 2008 not occurred.
Prison capacities
State and federal correctional authorities provide three measures of their facilities’ capacity: design capacity, operational capacity, and rated capacity. Estimates of the prison populations as a percentage of capacity are based on a state or Federal Bureau of Prison’s custody population. In general, a state’s capacity and custody counts exclude inmates held in private facilities. Some states include prisoners held in private facilities as part of the capacity of their prison systems. Where this occurs, prison population as a percent of capacity includes private facilities.
Definitions
Average annual change—arithmetic average (mean) annual change across a specific period.
Conditional releases—Includes releases to probation, parole, supervised mandatory releases, and other unspecified conditional releases.
Conditional release violators—admissions that include prisoners released by discretionary parole release, mandatory parole release, release to probation, or expiration of sentence with post-custody supervision.
Custody—the number of inmates held in state or federal prisons or local jails, regardless of sentence length or authority having jurisdiction.
Design capacity—the number of inmates that planners or architects intended for a facility.
Expected length of stay or mean expected time to be served—an estimate of the amount of time that offenders admitted into prison can expect to serve prior to release. It differs from other measures of time served that are based solely on data of offenders released from prison. The estimate of mean time to be served takes into account the dynamics of growth in the prison population. See Methodology.
Highest capacity—the sum of the maximum number of beds reported across the three capacity measures: design capacity, operational capacity, and rated capacity.
Revised 10/27/2011
dorseyt
Highlight
dorseyt
Highlight
December 2010 13
Imprisonment rate—the number of prisoners under state or federal jurisdiction sentenced to more than 1 year per 100,000 U.S. residents.
Incarceration rate—see total incarceration rate.
Inmates—individuals held in custody in state or federal prisons or in local jails.
Jail—confinement facilities usually administered by a local law enforcement agency, intended for adults, but sometimes holding juveniles, before and after adjudication. Facilities include jails and city/county correctional centers, special jail facilities such as medical treatment or release centers, halfway houses, work farms, and temporary holding or lockup facilities that are part of the jail’s combined function. Inmates sentenced to jail facilities usually have a sentence of 1 year or less.
Jurisdiction—the number of prisoners under the legal authority of state or federal correctional officials, regardless of where the prisoner is held.
Lowest capacity—the sum of the minimum number of beds across three capacity measures: design capacity, operational capacity, and rated capacity.
Operational capacity—the number of inmates that can be accommodated based on a facility’s staff, existing programs, and services.
Parole violators—admissions that include all conditional release violators returned to prison for either violation of conditions of release or new crimes. Some states include prisoners on post-custody supervision. See Jurisdiction notes.
Prisons—compared to jail facilities, prisons are longer-term facilities run by a state or the federal government, and typically hold felons and prisoners with sentences of more than 1 year. However, sentence length may vary by state. Connecticut, Rhode Island, Vermont, Delaware, Alaska, and Hawaii operate integrated systems, which combine prisons and jails.
Prisoners—individuals confined in correctional facilities under the legal authority (jurisdiction) of state and federal correctional officials.
Rated capacity—the number of beds or inmates assigned by a rating official to institutions within the jurisdiction.
Release rate—the number of sentenced prisoners released from prison during the year divided by the sum of the start of the year sentence prisoner population plus the number of sentenced prisoners admitted during the year.
Sentenced prisoner—a prisoner sentenced to more than 1 year.
Total incarceration rate—the number of inmates held in custody of state or federal prisons or in local jails, per 100,000 U.S. residents.
Unconditional release—Includes expirations of sentence, commutations, and other unconditional releases.
Revised 10/27/2011
dorseyt
Highlight
14 Prisoners in 2009
NPS jurisdiction notes
Alabama—Operational capacity represents physical capacity for inmates but is not based on staffing, programs, and services.
Alaska—Prisons and jails form one integrated system. All NPS data include jail and prison populations housed both in and out of state. Jurisdiction totals include individuals in electronic and special monitoring programs.
Arizona—Population counts are based on custody data and inmates in contracted beds.
California—Jurisdiction counts include felons and unsentenced inmates who are temporarily absent ( i.e. housed in local jails, hospitals). Population counts for “unsentenced inmates” include civil addicts who are temporarily absent because they are under the California Department of Corrections’ jurisdiction and are typically returned to prison within 30 days.
Colorado—Counts include 222 male and 10 female inmates in the Youthful Offender System, which was established primarily for violent juvenile offenders.
Connecticut—Prisons and jails form one integrated system. All NPS data include jail and prison populations. Legislation in July 1995 abolished the capacity law. The capacity of a facility is a fluid number based upon the needs of the department. The needs are dictated by security issues, populations, court decrees, legal mandates, staffing, and physical plant areas or facilities that are serving other purposes or have been decommissioned. The actual capacity of a facility is subject to change.
Delaware—Prisons and jails form one integrated system. All NPS data include jail and prison populations.
Federal Bureau of Prisons—Expirations of sentence include good conduct releases that usually have a separate and distinct term of supervision.
Georgia—Counts are based on custody data. Population counts exclude an undetermined number of inmates housed in local jails awaiting transfer to prison. Number may not compare to previous years due to a system conversion.
Hawaii—Prisons and jails form one integrated systems. All NPS data include jail and prison populations.
Illinois—Population counts for prisoners with a sentence of more than 1 year include an undetermined number of prisoners with sentences of 1 year.
Iowa—The jurisdiction count for December 31, 2009 is not comparable to previous years due to a change in measurement. As of 2009, the Iowa Department of Corrections began including the Operating While Intoxicated population, prisoners on work release, and prisoners housed in out of state prisons. Numbers reported in prior years were custody numbers.
Kansas—Admission and release data for the years 2006 through 2009 are not comparable to previous years due to change in reporting.
Maine—Parole is not valid in the state of Maine. Parole numbers reflect post sentence probation.
Massachusetts—Jurisdiction count excludes approximately 4,012, male inmates in local jails and houses of corrections serving a sentence of more than 1 year. .
Montana—Counts may not be comparable to previous years due to a change in reporting.
New Jersey—Jurisdiction counts for prisoners with sentences of more than 1 year include prisoners with sentences of 1 year.
North Carolina—Standard operational capacity is equal to one inmate per cell or 50 square feet per inmate in a dormitory setting.
Ohio—Population counts for prisoners with a sentence of more than 1 year include an undetermined number of prisoners with sentences of 1 year or less.
Oklahoma—Population counts for inmates with sentences of less than a year consist mainly of offenders ordered by the court to the Delayed Sentencing Program for Young Adults pursuant to 22 O.S. 996 through 996.3.
Oregon—Counts include an undetermined number of inmates with sentences of a year or less. County authorities retain jurisdiction over the majority of these types of inmates.
Rhode Island—Prisons and jails form one integrated system. All NPS data include jail and prison populations.
Vermont—Prisons and jails form one integrated system. All NPS data include jail and prison populations.
Wisconsin—The population decline from yearend 2008 through yearend 2009 may reflect the initiation of earned release policies. The decline in admissions reflects the impact of the truth-in-sentencing.
Revised 10/27/2011
dorseyt
Highlight
dorseyt
Highlight
December 2010 15
Appendix table contents
Appendix table 1. Prisoners under the jurisdiction of state or federal correctional authorities, by jurisdiction, December 31, 2000, 2008, and 2009
Appendix table 2. Male prisoners under the jurisdiction of state or federal correctional authorities, by jurisdiction, December 31, 2000, 2008, and 2009
Appendix table 3. Female prisoners under the jurisdiction of state or federal correctional authorities, by jurisdiction, December 31, 2000, 2008, and 2009
Appendix table 4. Sentenced prisoners under the jurisdiction of state or federal correctional authorities, by jurisdiction, December 31, 2000, 2008, and 2009
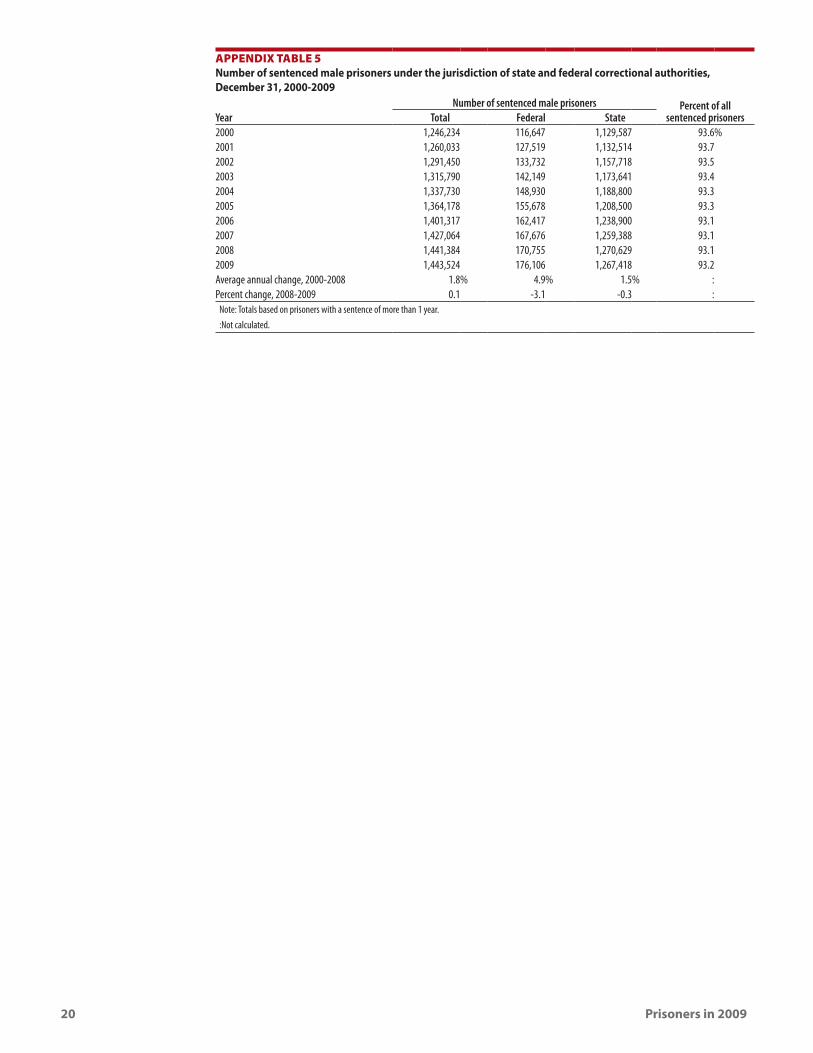
Appendix table 5. Number of sentenced male prisoners under the jurisdiction of state and federal correctional authorities, December 31, 2000-2009
Appendix table 6. Sentenced male prisoners under the jurisdiction of state or federal correctional authorities, by jurisdiction, December 31, 2000, 2008, and 2009
Appendix table 7. Number of sentenced female prisoners under the jurisdiction of state or federal correctional authorities, December 31, 2000-2009
Appendix table 8. Sentenced female prisoners under the jurisdiction of state or federal correctional authorities, by jurisdiction, December 31, 2000, 2008, and 2009
Appendix table 9. Imprisonment rates of sentenced prisoners under jurisdiction of state and federal correctional authorities, by sex and jurisdiction, December 31, 2008 and 2009
Appendix table 10. Number of sentenced prisoners admitted and released from state or federal jurisdiction, by jurisdiction, December 31, 2000, 2008, and 2009
Appendix table 11. Number of sentenced prisoners admitted and released from state or federal jurisdiction, by type, December 31, 2009
Appendix table 12. Estimated number of sentenced prisoners under state or federal jurisdiction, by gender, race, and Hispanic origin, December 31, 2000-2009
Appendix table 13. Estimated number of sentenced prisoners under state or federal jurisdiction, by gender, race, Hispanic origin, and age, December 31, 2009
Appendix table 14. Estimated rate of sentenced prisoners under state or federal jurisdiction, per 100,000 U.S. residents, by gender, race, and Hispanic origin, December 31, 2000-2009
Appendix table 15. Estimated number of sentenced prisoners under state or federal jurisdiction per 100,000 U.S. residents, by gender, race, Hispanic origin, and age, December 31, 2009
Appendix table 16a. Estimated number of sentenced prisoners under state jurisdiction, by offense, gender, race, and Hispanic origin, yearend 2006
Appendix table 16b. Estimated number of sentenced prisoners under state jurisdiction, by offense, gender, race, and Hispanic origin, yearend 2007
Appendix table 16c. Estimated number of sentenced prisoners under state jurisdiction, by offense, gender, race, and Hispanic origin, yearend 2008
Appendix table 17a. Estimated percent of sentenced prisoners under state jurisdiction, by offense, gender, race, and Hispanic origin, yearend 2006
Appendix table 17b. Estimated percent of sentenced prisoners under state jurisdiction, by offense, gender, race, and Hispanic origin, yearend 2007
Appendix table 17c. Estimated percent of sentenced prisoners under state jurisdiction, by offense, gender, race, and Hispanic origin, yearend 2008
Appendix table 18. Number of sentenced prisoners in federal prison, by most serious offense, 2000, 2008, and 2009
Appendix table 19. Number of state or federal prisoners in private facilities, December 31, 2000-2009
Appendix table 20. Number of state and federal prisoners in private facilities, by jurisdiction, December 31, 2000, 2008, and 2009
Appendix table 21. Number of state or federal prisoners in local facilities, December 31, 2000-2009
Appendix table 22. Number of state and federal prisoners in local facilities, by jurisdiction, December 31, 2000, 2008, and 2009
Appendix table 23. Reported state and federal prison capacities, December 31, 2009
16 Prisoners in 2009
appendix Table 1 Prisoners under the jurisdiction of state or federal correctional authorities, by jurisdiction, December 31, 2000, 2008, and 2009
Region and jurisdictionNumber of prisoners Average annual change,
2000-2008 Percent change, 2008-200912/31/2000 12/31/2008 12/31/2009U.S. total 1,391,261 1,609,759 1,613,740 1.8% 0.2%
Federal 145,416 201,280 208,118 4.1 3.4State 1,245,845 1,408,479 1,405,622 1.5 -0.2
Northeast 174,826 178,642 177,361 0.3% -0.7%Connecticuta 18,355 20,661 19,716 1.5 -4.6Maine 1,679 2,195 2,206 3.4 0.5Massachusetts 10,722 11,408 11,316 0.8 -0.8New Hampshireb 2,257 2,702 2,731 2.3 1.1New Jersey 29,784 25,953 25,382 -1.7 -2.2New York 70,199 60,347 58,687 -1.9 -2.8Pennsylvania 36,847 49,215 51,429 3.7 4.5Rhode Islanda 3,286 4,045 3,674 2.6 -9.2Vermonta 1,697 2,116 2,220 2.8 4.9
Midwest 237,378 264,314 261,603 1.4% -1.0%Illinois 45,281 45,474 45,161 0.1 -0.7Indiana 20,125 28,322 28,808 4.4 1.7Iowa 7,955 8,766 8,813 1.2 0.5Kansas 8,344 8,539 8,641 0.3 1.2Michigan 47,718 48,738 45,478 0.3 -6.7Minnesota 6,238 9,910 9,986 6.0 0.8Missouri 27,543 30,186 30,563 1.2 1.2Nebraska 3,895 4,520 4,474 1.9 -1.0North Dakota 1,076 1,452 1,486 3.8 2.3Ohio 45,833 51,686 51,606 1.5 -0.2South Dakota 2,616 3,342 3,434 3.1 2.8Wisconsin 20,754 23,379 23,153 1.5 -1.0
South 561,214 647,312 649,535 1.8% 0.3%Alabama 26,332 30,508 31,874 1.9 4.5Arkansas 11,915 14,716 15,208 2.7 3.3Delawarea 6,921 7,075 6,794 0.3 -4.0District of Columbia 7,456 ~ ~ : :Florida 71,319 102,388 103,915 4.6 1.5Georgiac 44,232 52,719 53,371 2.2 1.2Kentucky 14,919 21,706 21,638 4.8 -0.3Louisiana 35,207 38,381 39,780 1.1 3.6Maryland 23,538 23,324 22,255 -0.1 -4.6Mississippi 20,241 22,754 21,482 1.5 -5.6North Carolina 31,266 39,482 39,860 3.0 1.0Oklahoma 23,181 25,864 26,397 1.4 2.1South Carolina 21,778 24,326 24,288 1.4 -0.2Tennessee 22,166 27,228 26,965 2.6 -1.0Texas 166,719 172,506 171,249 0.4 -0.7Virginia 30,168 38,276 38,092 3.0 -0.5West Virginia 3,856 6,059 6,367 5.8 5.1
West 272,427 318,211 317,123 2.0% -0.3%Alaskaa 4,173 5,014 5,285 2.3 5.4Arizonac 26,510 39,589 40,627 5.1 2.6California 163,001 173,670 171,275 0.8 -1.4Colorado 16,833 23,274 22,795 4.1 -2.1Hawaiia 5,053 5,955 5,891 2.1 -1.1Idaho 5,535 7,290 7,400 3.5 1.5Montana 3,105 3,545 3,605 1.7 1.7Nevada 10,063 12,743 12,482 3.0 -2.0New Mexico 5,342 6,402 6,519 2.3 1.8Oregon 10,580 14,167 14,403 3.7 1.7Utah 5,637 6,552 6,533 1.9 -0.3Washington 14,915 17,926 18,233 2.3% 1.7%Wyoming 1,680 2,084 2,075 2.7 -0.4
~Not applicable. As of December 31, 2001, responsibility for sentenced felons from the District of Columbia was transferred to the Federal Bureau of Prisons.:Not calculated.aPrisons and jails form one integrated system. Data include total jail and prison populations.bPrison population for yearend 2008 is as of January 2, 2009.cPrison population based on custody counts.
December 2010 17
appendix Table 2 Male prisoners under the jurisdiction of state or federal correctional authorities, by jurisdiction, December 31, 2000, 2008, and 2009
Region and jurisdictionNumber of male prisoners
Average annual change, 2000-2008 Percent change, 2008-200912/31/2000 12/31/2008 12/31/2009U.S. total 1,298,027 1,495,110 1,500,278 1.8% 0.3%
Federal 135,171 188,007 194,493 4.2 3.4State 1,162,856 1,307,103 1,305,785 1.5 -0.1
Northeast 165,744 169,041 168,074 0.2% -0.6%Connecticuta 16,949 19,159 18,381 1.5 -4.1Maine 1,613 2,039 2,048 3.0 0.4Massachusetts 10,059 10,657 10,597 0.7 -0.6New Hampshireb 2,137 2,521 2,564 2.1 1.7New Jersey 28,134 24,654 24,176 -1.6 -1.9New York 66,919 57,760 56,198 -1.8 -2.7Pennsylvania 35,268 46,451 48,601 3.5 4.6Rhode Islanda 3,048 3,802 3,444 2.8 -9.4Vermonta 1,617 1,998 2,065 2.7 3.4
Midwest 222,780 246,531 244,149 1.3% -1.0%Illinois 42,432 42,753 42,571 0.1 -0.4Indiana 18,673 25,829 26,302 4.1 1.8Iowa 7,363 8,017 8,090 1.1 0.9Kansas 7,840 7,970 8,076 0.2 1.3Michigan 45,587 46,781 43,723 0.3 -6.5Minnesota 5,870 9,240 9,312 5.8 0.8Missouri 25,550 27,737 28,136 1.0 1.4Nebraska 3,629 4,130 4,108 1.6 -0.5North Dakota 1,008 1,292 1,312 3.2 1.5Ohio 43,025 47,773 47,617 1.3 -0.3South Dakota 2,416 2,987 3,054 2.7 2.2Wisconsin 19,387 22,022 21,848 1.6 -0.8
South 521,562 598,262 600,657 1.7% 0.4%Alabama 24,506 28,277 29,419 1.8 4.0Arkansas 11,143 13,656 14,147 2.6 3.6Delawarea 6,324 6,518 6,301 0.4 -3.3District of Columbia 7,100 ~ ~ : :Florida 67,214 95,237 96,632 4.5 1.5Georgiac 41,474 49,027 49,597 2.1 1.2Kentucky 13,858 19,436 19,343 4.3 -0.5Louisiana 32,988 35,865 37,164 1.1 3.6Maryland 22,319 22,264 21,206 -0.0 -4.8Mississippi 18,572 20,773 19,747 1.4 -4.9North Carolina 29,363 36,704 37,052 2.8 0.9Oklahoma 20,787 23,340 23,772 1.5 1.9South Carolina 20,358 22,693 22,771 1.4 0.3Tennessee 20,797 25,099 24,956 2.4 -0.6Texas 153,097 158,653 157,679 0.4 -0.6Virginia 28,109 35,309 35,188 2.9 -0.3West Virginia 3,553 5,411 5,683 5.4 5.0
West 252,770 293,269 292,905 1.9% -0.1%Alaskaa 3,889 4,511 4,696 1.9 4.1Arizonac 24,546 35,823 36,850 4.8 2.9California 151,840 162,050 160,286 0.8 -1.1Colorado 15,500 20,980 20,694 3.9 -1.4Hawaiia 4,492 5,227 5,190 1.9 -0.7Idaho 5,042 6,532 6,656 3.3 1.9Montana 2,799 3,184 3,214 1.6 0.9Nevada 9,217 11,761 11,533 3.1 -1.9New Mexico 4,831 5,833 5,859 2.4 0.4Oregon 9,984 13,058 13,278 3.4 1.7Utah 5,256 5,912 5,952 1.5 0.7Washington 13,850 16,522 16,836 2.2% 1.9%Wyoming 1,524 1,876 1,861 2.6 -0.8
~Not applicable. As of December 31, 2001, responsibility for sentenced felons from the District of Columbia was transferred to the Federal Bureau of Prisons.:Not calculated.aPrisons and jails form one integrated system. Data include total jail and prison populations.bJurisdiction count for yearend 2008 is as of January 2, 2009.cPrison population based on custody counts.
18 Prisoners in 2009
appendix Table 3 Female prisoners under the jurisdiction of state or federal correctional authorities, by jurisdiction, December 31, 2000, 2008, and 2009
Region and jurisdictionNumber of female prisoners
Average annual change, 2000-2008 Percent change, 2008-200912/31/2000 12/31/2008 12/31/2009U.S. total 93,234 114,649 113,462 2.6% -1.0%
Federal 10,245 13,273 13,625 3.3 2.7State 82,989 101,376 99,837 2.5 -1.5
Northeast 9,082 9,601 9,287 0.7% -3.3%Connecticuta 1,406 1,502 1,335 0.8 -11.1Maine 66 156 158 11.4 1.3Massachusetts 663 751 719 1.6 -4.3New Hampshireb 120 181 167 5.3 -7.7New Jersey 1,650 1,299 1,206 -2.9 -7.2New York 3,280 2,587 2,489 -2.9 -3.8Pennsylvania 1,579 2,764 2,828 7.2 2.3Rhode Islanda 238 243 230 0.3 -5.3Vermonta 80 118 155 5.0 31.4
Midwest 14,598 17,783 17,454 2.5% -1.9%Illinois 2,849 2,721 2,590 -0.6 -4.8Indiana 1,452 2,493 2,506 7.0 0.5Iowa 592 749 723 3.0 -3.5Kansas 504 569 565 1.5 -0.7Michigan 2,131 1,957 1,755 -1.1 -10.3Minnesota 368 670 674 7.8 0.6Missouri 1,993 2,449 2,427 2.6 -0.9Nebraska 266 390 366 4.9 -6.2North Dakota 68 160 174 11.3 8.8Ohio 2,808 3,913 3,989 4.2 1.9South Dakota 200 355 380 7.4 7.0Wisconsin 1,367 1,357 1,305 -0.1 -3.8
South 39,652 49,050 48,878 2.7% -0.4%Alabama 1,826 2,231 2,455 2.5 10.0Arkansas 772 1,060 1,061 4.0 0.1Delawarea 597 557 493 -0.9 -11.5District of Columbia 356 ~ ~ : :Florida 4,105 7,151 7,283 7.2 1.8Georgiac 2,758 3,692 3,774 3.7 2.2Kentucky 1,061 2,270 2,295 10.0 1.1Louisiana 2,219 2,516 2,616 1.6 4.0Maryland 1,219 1,060 1,049 -1.7 -1.0Mississippi 1,669 1,981 1,735 2.2 -12.4North Carolina 1,903 2,778 2,808 4.8 1.1Oklahoma 2,394 2,524 2,625 0.7 4.0South Carolina 1,420 1,633 1,517 1.8 -7.1Tennessee 1,369 2,129 2,009 5.7 -5.6Texas 13,622 13,853 13,570 0.2 -2.0Virginia 2,059 2,967 2,904 4.7 -2.1West Virginia 303 648 684 10.0 5.6
West 19,657 24,942 24,218 3.0% -2.9%Alaskaa 284 503 589 7.4 17.1Arizonac 1,964 3,766 3,777 8.5 0.3California 11,161 11,620 10,989 0.5 -5.4Colorado 1,333 2,294 2,101 7.0 -8.4Hawaiia 561 728 701 3.3 -3.7Idaho 493 758 744 5.5 -1.8Montana 306 361 391 2.1 8.3Nevada 846 982 949 1.9 -3.4New Mexico 511 569 660 1.4 16.0Oregon 596 1,109 1,125 8.1 1.4Utah 381 640 581 6.7 -9.2Washington 1,065 1,404 1,397 3.5% -0.5%Wyoming 156 208 214 3.7 2.9
~ Not applicable. As of December 31, 2001, responsibility for sentenced felons from the District of Columbia was transferred to the Federal Bureau of Prisons.:Not calculated.aPrisons and jails form one integrated system. Data include total jail and prison populations.bJurisdiction counts for yearend 2008 are of January 2, 2009.cPrison population based on custody counts.
December 2010 19
appendix Table 4 Sentenced prisoners under the jurisdiction of state or federal correctional authorities, by jurisdiction, December 31, 2000, 2008, and 2009
Region and jurisdictionNumber of sentenced prisoners
Average annual change, 2000-2008 Percent change, 2008-200912/31/2000 12/31/2008 12/31/2009U.S. total 1,331,278 1,547,742 1,548,721 1.9% 0.1%
Federal 125,044 182,333 187,886 4.8 3.0State 1,206,234 1,365,409 1,360,835 1.6 -0.3
Northeast 166,632 168,223 167,344 0.1% -0.5%Connecticuta 13,155 14,271 13,466 1.0 -5.6Maine 1,635 1,985 1,980 2.5 -0.3Massachusetts 9,479 10,166 10,070 0.9 -0.9New Hampshire 2,257 2,702 2,731 2.3 1.1New Jerseyb 29,784 25,953 25,382 -1.7 -2.2New York 70,199 59,959 58,455 -2.0 -2.5Pennsylvania 36,844 49,047 51,316 3.6 4.6Rhode Islanda 1,966 2,522 2,220 3.2 -12.0Vermonta 1,313 1,618 1,724 2.6 6.6
Midwest 236,458 263,241 259,252 1.4% -1.5%Illinoisb 45,281 45,474 45,161 0.1 -0.7Indiana 19,811 28,301 28,788 4.6 1.7Iowab 7,955 8,766 8,813 1.2 0.5Kansasb 8,344 8,539 8,641 0.3 1.2Michigan 47,718 48,738 45,478 0.3 -6.7Minnesota 6,238 9,910 9,986 6.0 0.8Missouri 27,519 30,175 30,554 1.2 1.3Nebraska 3,816 4,424 4,392 1.9 -0.7North Dakota 994 1,452 1,486 4.9 2.3Ohiob 45,833 51,686 51,606 1.5 -0.2South Dakota 2,613 3,333 3,430 3.1 2.9Wisconsin 20,336 22,443 20,917 1.2 -6.8
South 538,997 623,198 625,121 1.8% 0.3%Alabama 26,034 29,694 30,723 1.7 3.5Arkansas 11,851 14,660 15,144 2.7 3.3Delawarea 3,937 4,067 3,971 0.4 -2.4District of Columbia 5,008 ~ ~ : :Florida 71,318 102,388 103,915 4.6 1.5Georgiac 44,141 52,705 52,012 2.2 -1.3Kentucky 14,919 21,059 20,672 4.4 -1.8Louisiana 35,207 37,804 39,780 0.9 5.2Maryland 22,490 22,749 21,868 0.1 -3.9Mississippi 19,239 21,698 20,768 1.5 -4.3North Carolina 27,043 34,229 34,863 3.0 1.9Oklahoma 23,181 24,210 24,396 0.5 0.8South Carolina 21,017 23,456 23,486 1.4 0.1Tennessee 22,166 27,228 26,965 2.6 -1.0Texas 158,008 163,016 162,186 0.4 -0.5Virginia 29,643 38,216 38,059 3.2 -0.4West Virginia 3,795 6,019 6,313 5.9 4.9
West 264,147 310,747 309,118 2.1% -0.5%Alaskaa 2,128 2,966 2,508 4.2 -15.4Arizonac 25,412 37,188 38,529 4.9 3.6California 160,412 172,583 170,131 0.9 -1.4Coloradob 16,833 23,274 22,795 4.1 -2.1Hawaiia 3,553 4,304 4,119 2.4 -4.3Idaho 5,535 7,290 7,400 3.5 1.5Montana 3,105 3,517 3,605 1.6 2.5Nevada 10,063 12,743 12,482 3.0 -2.0New Mexico 4,666 6,315 6,391 3.9 1.2Oregonb 10,553 14,131 14,365 3.7 1.7Utah 5,541 6,426 6,519 1.9 1.4Washington 14,666 17,926 18,199 2.5% 1.5%Wyoming 1,680 2,084 2,075 2.7 -0.4
Note: Totals based on prisoners with a sentence of more than 1 year.~Not applicable. As of December 31, 2001, responsibility for sentenced felons from the District of Columbia was transferred to the Federal Bureau of Prisons.:Not calculated.aPrisons and jails form one integrated system. Data include total jail and prison populations. bIncludes some prisoners sentenced to 1 year or less. cPrison population based on custody counts.
20 Prisoners in 2009
appendix Table 5 Number of sentenced male prisoners under the jurisdiction of state and federal correctional authorities, December 31, 2000-2009
Number of sentenced male prisoners Percent of all sentenced prisonersYear Total Federal State
2000 1,246,234 116,647 1,129,587 93.6%2001 1,260,033 127,519 1,132,514 93.72002 1,291,450 133,732 1,157,718 93.52003 1,315,790 142,149 1,173,641 93.42004 1,337,730 148,930 1,188,800 93.32005 1,364,178 155,678 1,208,500 93.32006 1,401,317 162,417 1,238,900 93.12007 1,427,064 167,676 1,259,388 93.12008 1,441,384 170,755 1,270,629 93.12009 1,443,524 176,106 1,267,418 93.2Average annual change, 2000-2008 1.8% 4.9% 1.5% :Percent change, 2008-2009 0.1 -3.1 -0.3 :
Note: Totals based on prisoners with a sentence of more than 1 year.:Not calculated.
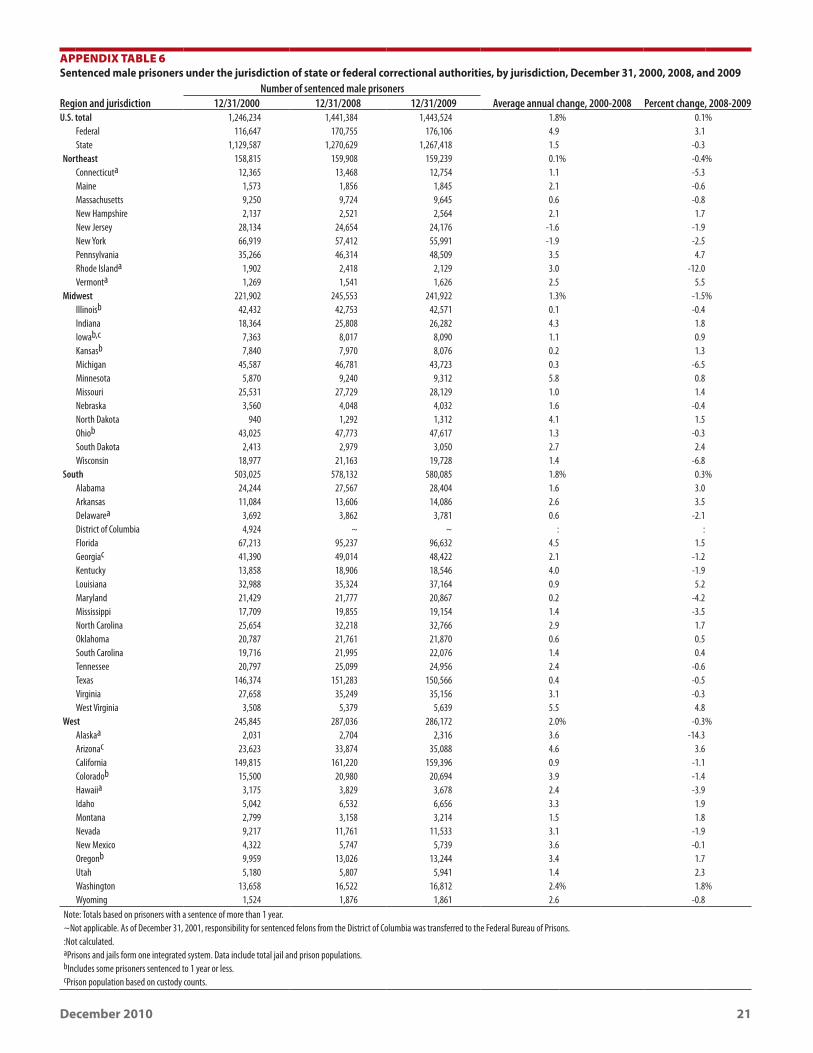
December 2010 21
appendix Table 6 Sentenced male prisoners under the jurisdiction of state or federal correctional authorities, by jurisdiction, December 31, 2000, 2008, and 2009
Region and jurisdictionNumber of sentenced male prisoners
Average annual change, 2000-2008 Percent change, 2008-200912/31/2000 12/31/2008 12/31/2009U.S. total 1,246,234 1,441,384 1,443,524 1.8% 0.1%
Federal 116,647 170,755 176,106 4.9 3.1State 1,129,587 1,270,629 1,267,418 1.5 -0.3
Northeast 158,815 159,908 159,239 0.1% -0.4%Connecticuta 12,365 13,468 12,754 1.1 -5.3Maine 1,573 1,856 1,845 2.1 -0.6Massachusetts 9,250 9,724 9,645 0.6 -0.8New Hampshire 2,137 2,521 2,564 2.1 1.7New Jersey 28,134 24,654 24,176 -1.6 -1.9New York 66,919 57,412 55,991 -1.9 -2.5Pennsylvania 35,266 46,314 48,509 3.5 4.7Rhode Islanda 1,902 2,418 2,129 3.0 -12.0Vermonta 1,269 1,541 1,626 2.5 5.5
Midwest 221,902 245,553 241,922 1.3% -1.5%Illinoisb 42,432 42,753 42,571 0.1 -0.4Indiana 18,364 25,808 26,282 4.3 1.8Iowab,c 7,363 8,017 8,090 1.1 0.9Kansasb 7,840 7,970 8,076 0.2 1.3Michigan 45,587 46,781 43,723 0.3 -6.5Minnesota 5,870 9,240 9,312 5.8 0.8Missouri 25,531 27,729 28,129 1.0 1.4Nebraska 3,560 4,048 4,032 1.6 -0.4North Dakota 940 1,292 1,312 4.1 1.5Ohiob 43,025 47,773 47,617 1.3 -0.3South Dakota 2,413 2,979 3,050 2.7 2.4Wisconsin 18,977 21,163 19,728 1.4 -6.8
South 503,025 578,132 580,085 1.8% 0.3%Alabama 24,244 27,567 28,404 1.6 3.0Arkansas 11,084 13,606 14,086 2.6 3.5Delawarea 3,692 3,862 3,781 0.6 -2.1District of Columbia 4,924 ~ ~ : :Florida 67,213 95,237 96,632 4.5 1.5Georgiac 41,390 49,014 48,422 2.1 -1.2Kentucky 13,858 18,906 18,546 4.0 -1.9Louisiana 32,988 35,324 37,164 0.9 5.2Maryland 21,429 21,777 20,867 0.2 -4.2Mississippi 17,709 19,855 19,154 1.4 -3.5North Carolina 25,654 32,218 32,766 2.9 1.7Oklahoma 20,787 21,761 21,870 0.6 0.5South Carolina 19,716 21,995 22,076 1.4 0.4Tennessee 20,797 25,099 24,956 2.4 -0.6Texas 146,374 151,283 150,566 0.4 -0.5Virginia 27,658 35,249 35,156 3.1 -0.3West Virginia 3,508 5,379 5,639 5.5 4.8
West 245,845 287,036 286,172 2.0% -0.3%Alaskaa 2,031 2,704 2,316 3.6 -14.3Arizonac 23,623 33,874 35,088 4.6 3.6California 149,815 161,220 159,396 0.9 -1.1Coloradob 15,500 20,980 20,694 3.9 -1.4Hawaiia 3,175 3,829 3,678 2.4 -3.9Idaho 5,042 6,532 6,656 3.3 1.9Montana 2,799 3,158 3,214 1.5 1.8Nevada 9,217 11,761 11,533 3.1 -1.9New Mexico 4,322 5,747 5,739 3.6 -0.1Oregonb 9,959 13,026 13,244 3.4 1.7Utah 5,180 5,807 5,941 1.4 2.3Washington 13,658 16,522 16,812 2.4% 1.8%Wyoming 1,524 1,876 1,861 2.6 -0.8
Note: Totals based on prisoners with a sentence of more than 1 year.~Not applicable. As of December 31, 2001, responsibility for sentenced felons from the District of Columbia was transferred to the Federal Bureau of Prisons.:Not calculated.aPrisons and jails form one integrated system. Data include total jail and prison populations. bIncludes some prisoners sentenced to 1 year or less. cPrison population based on custody counts.
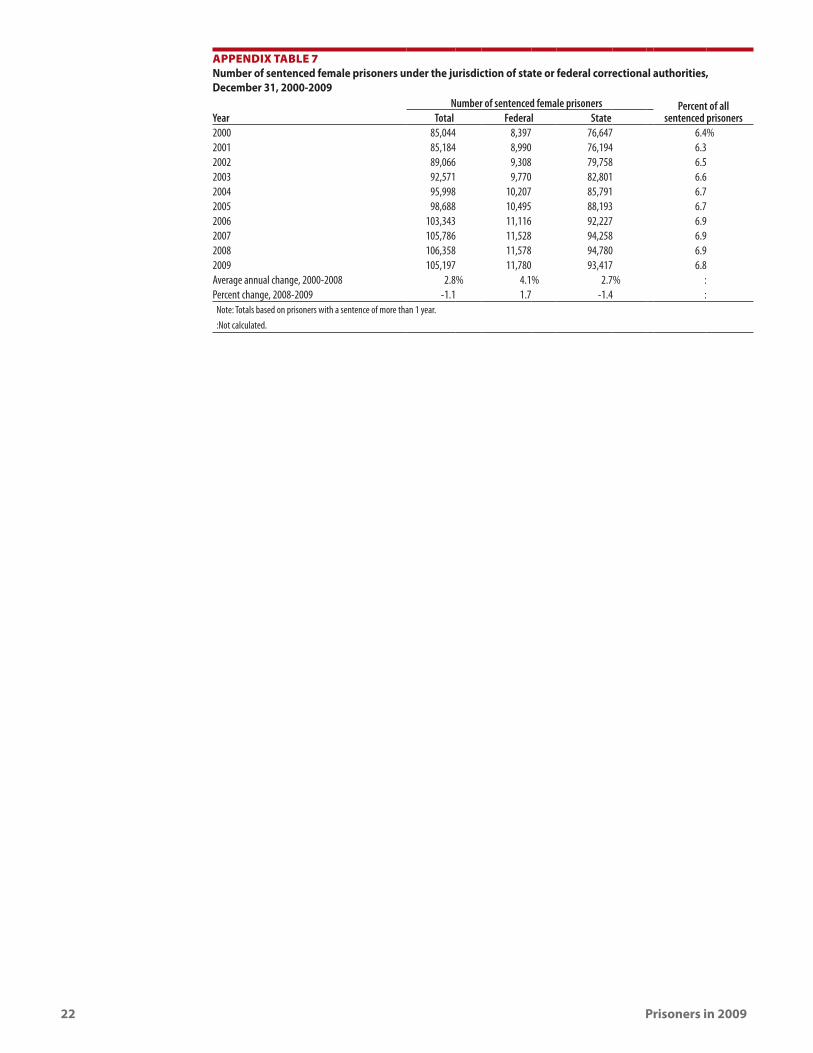
22 Prisoners in 2009
appendix Table 7 Number of sentenced female prisoners under the jurisdiction of state or federal correctional authorities, December 31, 2000-2009
Number of sentenced female prisoners Percent of all sentenced prisonersYear Total Federal State
2000 85,044 8,397 76,647 6.4%2001 85,184 8,990 76,194 6.32002 89,066 9,308 79,758 6.52003 92,571 9,770 82,801 6.62004 95,998 10,207 85,791 6.72005 98,688 10,495 88,193 6.72006 103,343 11,116 92,227 6.92007 105,786 11,528 94,258 6.92008 106,358 11,578 94,780 6.92009 105,197 11,780 93,417 6.8Average annual change, 2000-2008 2.8% 4.1% 2.7% :Percent change, 2008-2009 -1.1 1.7 -1.4 :
Note: Totals based on prisoners with a sentence of more than 1 year.:Not calculated.
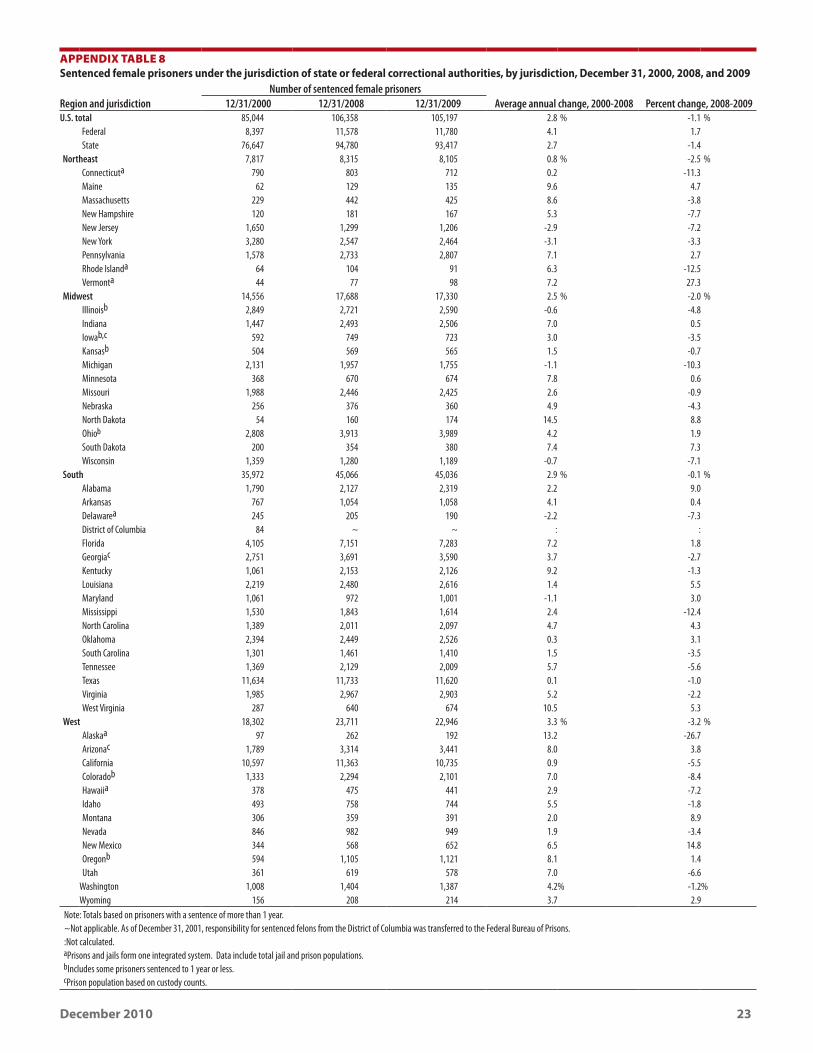
December 2010 23
appendix Table 8 Sentenced female prisoners under the jurisdiction of state or federal correctional authorities, by jurisdiction, December 31, 2000, 2008, and 2009
Region and jurisdictionNumber of sentenced female prisoners
Average annual change, 2000-2008 Percent change, 2008-200912/31/2000 12/31/2008 12/31/2009U.S. total 85,044 106,358 105,197 2.8 % -1.1 %
Federal 8,397 11,578 11,780 4.1 1.7State 76,647 94,780 93,417 2.7 -1.4
Northeast 7,817 8,315 8,105 0.8 % -2.5 %Connecticuta 790 803 712 0.2 -11.3Maine 62 129 135 9.6 4.7Massachusetts 229 442 425 8.6 -3.8New Hampshire 120 181 167 5.3 -7.7New Jersey 1,650 1,299 1,206 -2.9 -7.2New York 3,280 2,547 2,464 -3.1 -3.3Pennsylvania 1,578 2,733 2,807 7.1 2.7Rhode Islanda 64 104 91 6.3 -12.5Vermonta 44 77 98 7.2 27.3
Midwest 14,556 17,688 17,330 2.5 % -2.0 %Illinoisb 2,849 2,721 2,590 -0.6 -4.8Indiana 1,447 2,493 2,506 7.0 0.5Iowab,c 592 749 723 3.0 -3.5Kansasb 504 569 565 1.5 -0.7Michigan 2,131 1,957 1,755 -1.1 -10.3Minnesota 368 670 674 7.8 0.6Missouri 1,988 2,446 2,425 2.6 -0.9Nebraska 256 376 360 4.9 -4.3North Dakota 54 160 174 14.5 8.8Ohiob 2,808 3,913 3,989 4.2 1.9South Dakota 200 354 380 7.4 7.3Wisconsin 1,359 1,280 1,189 -0.7 -7.1
South 35,972 45,066 45,036 2.9 % -0.1 %Alabama 1,790 2,127 2,319 2.2 9.0Arkansas 767 1,054 1,058 4.1 0.4Delawarea 245 205 190 -2.2 -7.3District of Columbia 84 ~ ~ : :Florida 4,105 7,151 7,283 7.2 1.8Georgiac 2,751 3,691 3,590 3.7 -2.7Kentucky 1,061 2,153 2,126 9.2 -1.3Louisiana 2,219 2,480 2,616 1.4 5.5Maryland 1,061 972 1,001 -1.1 3.0Mississippi 1,530 1,843 1,614 2.4 -12.4North Carolina 1,389 2,011 2,097 4.7 4.3Oklahoma 2,394 2,449 2,526 0.3 3.1South Carolina 1,301 1,461 1,410 1.5 -3.5Tennessee 1,369 2,129 2,009 5.7 -5.6Texas 11,634 11,733 11,620 0.1 -1.0Virginia 1,985 2,967 2,903 5.2 -2.2West Virginia 287 640 674 10.5 5.3
West 18,302 23,711 22,946 3.3 % -3.2 %Alaskaa 97 262 192 13.2 -26.7Arizonac 1,789 3,314 3,441 8.0 3.8California 10,597 11,363 10,735 0.9 -5.5Coloradob 1,333 2,294 2,101 7.0 -8.4Hawaiia 378 475 441 2.9 -7.2Idaho 493 758 744 5.5 -1.8Montana 306 359 391 2.0 8.9Nevada 846 982 949 1.9 -3.4New Mexico 344 568 652 6.5 14.8Oregonb 594 1,105 1,121 8.1 1.4Utah 361 619 578 7.0 -6.6
Washington 1,008 1,404 1,387 4.2% -1.2%Wyoming 156 208 214 3.7 2.9
Note: Totals based on prisoners with a sentence of more than 1 year.~Not applicable. As of December 31, 2001, responsibility for sentenced felons from the District of Columbia was transferred to the Federal Bureau of Prisons.:Not calculated.aPrisons and jails form one integrated system. Data include total jail and prison populations. bIncludes some prisoners sentenced to 1 year or less. cPrison population based on custody counts.
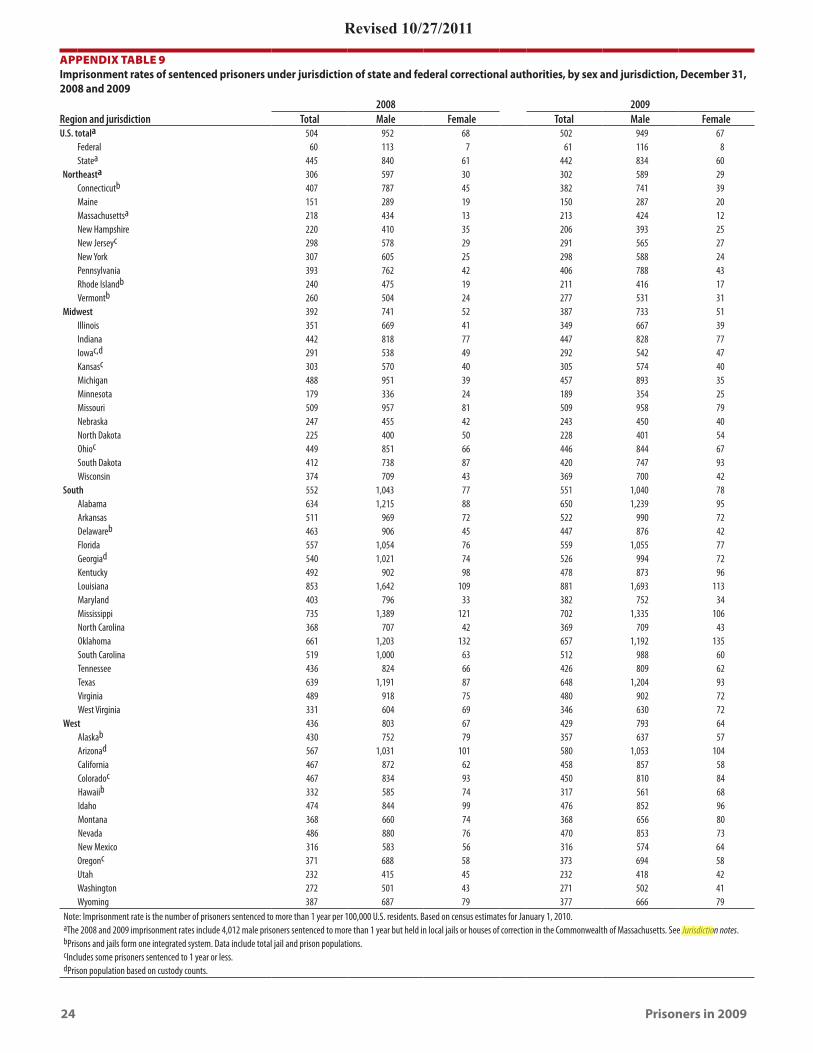
24 Prisoners in 2009
appendix Table 9 Imprisonment rates of sentenced prisoners under jurisdiction of state and federal correctional authorities, by sex and jurisdiction, December 31, 2008 and 2009
Region and jurisdiction2008 2009
Total Male Female Total Male FemaleU.S. totala 504 952 68 502 949 67
Federal 60 113 7 61 116 8Statea 445 840 61 442 834 60
Northeasta 306 597 30 302 589 29Connecticutb 407 787 45 382 741 39Maine 151 289 19 150 287 20Massachusettsa 218 434 13 213 424 12New Hampshire 220 410 35 206 393 25New Jerseyc 298 578 29 291 565 27New York 307 605 25 298 588 24Pennsylvania 393 762 42 406 788 43Rhode Islandb 240 475 19 211 416 17Vermontb 260 504 24 277 531 31
Midwest 392 741 52 387 733 51Illinois 351 669 41 349 667 39Indiana 442 818 77 447 828 77Iowac,d 291 538 49 292 542 47Kansasc 303 570 40 305 574 40Michigan 488 951 39 457 893 35Minnesota 179 336 24 189 354 25Missouri 509 957 81 509 958 79Nebraska 247 455 42 243 450 40North Dakota 225 400 50 228 401 54Ohioc 449 851 66 446 844 67South Dakota 412 738 87 420 747 93Wisconsin 374 709 43 369 700 42
South 552 1,043 77 551 1,040 78Alabama 634 1,215 88 650 1,239 95Arkansas 511 969 72 522 990 72Delawareb 463 906 45 447 876 42Florida 557 1,054 76 559 1,055 77Georgiad 540 1,021 74 526 994 72Kentucky 492 902 98 478 873 96Louisiana 853 1,642 109 881 1,693 113Maryland 403 796 33 382 752 34Mississippi 735 1,389 121 702 1,335 106North Carolina 368 707 42 369 709 43Oklahoma 661 1,203 132 657 1,192 135South Carolina 519 1,000 63 512 988 60Tennessee 436 824 66 426 809 62Texas 639 1,191 87 648 1,204 93Virginia 489 918 75 480 902 72West Virginia 331 604 69 346 630 72
West 436 803 67 429 793 64Alaskab 430 752 79 357 637 57Arizonad 567 1,031 101 580 1,053 104California 467 872 62 458 857 58Coloradoc 467 834 93 450 810 84Hawaiib 332 585 74 317 561 68Idaho 474 844 99 476 852 96Montana 368 660 74 368 656 80Nevada 486 880 76 470 853 73New Mexico 316 583 56 316 574 64Oregonc 371 688 58 373 694 58Utah 232 415 45 232 418 42Washington 272 501 43 271 502 41Wyoming 387 687 79 377 666 79
Note: Imprisonment rate is the number of prisoners sentenced to more than 1 year per 100,000 U.S. residents. Based on census estimates for January 1, 2010.aThe 2008 and 2009 imprisonment rates include 4,012 male prisoners sentenced to more than 1 year but held in local jails or houses of correction in the Commonwealth of Massachusetts. See Jurisdiction notes.bPrisons and jails form one integrated system. Data include total jail and prison populations.cIncludes some prisoners sentenced to 1 year or less.dPrison population based on custody counts.
Revised 10/27/2011
dorseyt
Highlight
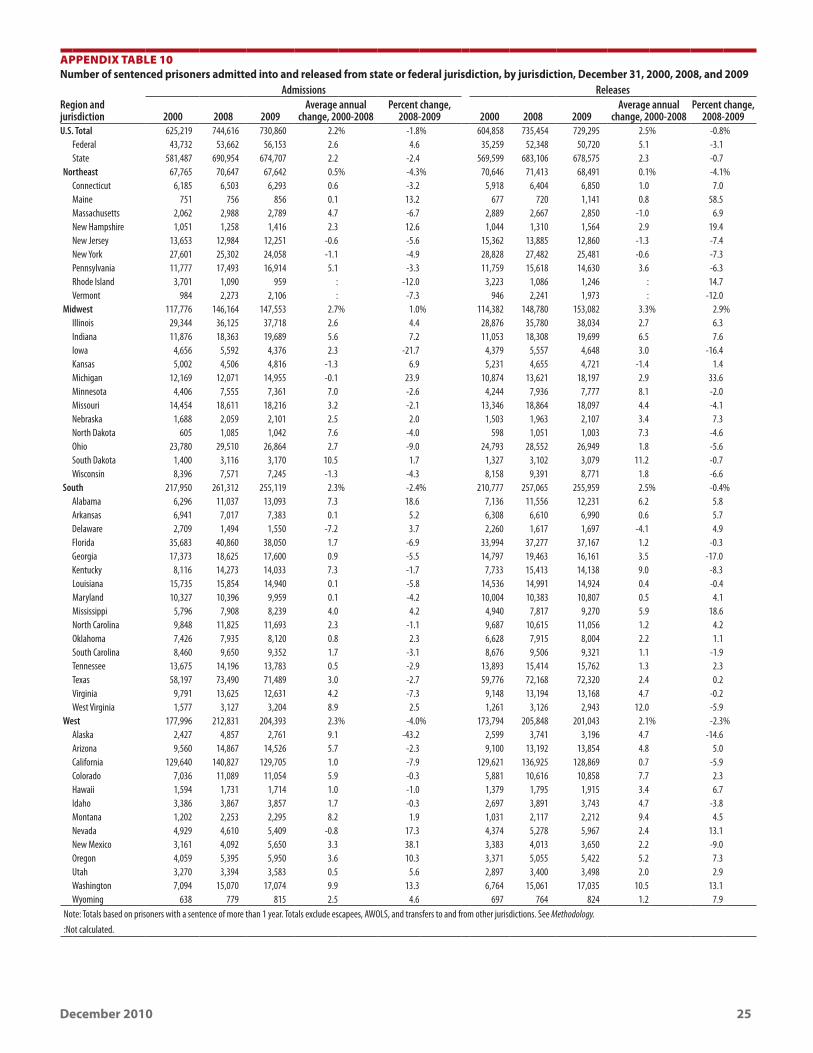
December 2010 25
appendix Table 10 Number of sentenced prisoners admitted into and released from state or federal jurisdiction, by jurisdiction, December 31, 2000, 2008, and 2009
Admissions ReleasesRegion and jurisdiction 2000 2008 2009
Average annual change, 2000-2008
Percent change, 2008-2009 2000 2008 2009
Average annual change, 2000-2008
Percent change, 2008-2009
U.S. Total 625,219 744,616 730,860 2.2% -1.8% 604,858 735,454 729,295 2.5% -0.8%Federal 43,732 53,662 56,153 2.6 4.6 35,259 52,348 50,720 5.1 -3.1State 581,487 690,954 674,707 2.2 -2.4 569,599 683,106 678,575 2.3 -0.7
Northeast 67,765 70,647 67,642 0.5% -4.3% 70,646 71,413 68,491 0.1% -4.1%Connecticut 6,185 6,503 6,293 0.6 -3.2 5,918 6,404 6,850 1.0 7.0Maine 751 756 856 0.1 13.2 677 720 1,141 0.8 58.5Massachusetts 2,062 2,988 2,789 4.7 -6.7 2,889 2,667 2,850 -1.0 6.9New Hampshire 1,051 1,258 1,416 2.3 12.6 1,044 1,310 1,564 2.9 19.4New Jersey 13,653 12,984 12,251 -0.6 -5.6 15,362 13,885 12,860 -1.3 -7.4New York 27,601 25,302 24,058 -1.1 -4.9 28,828 27,482 25,481 -0.6 -7.3Pennsylvania 11,777 17,493 16,914 5.1 -3.3 11,759 15,618 14,630 3.6 -6.3Rhode Island 3,701 1,090 959 : -12.0 3,223 1,086 1,246 : 14.7Vermont 984 2,273 2,106 : -7.3 946 2,241 1,973 : -12.0
Midwest 117,776 146,164 147,553 2.7% 1.0% 114,382 148,780 153,082 3.3% 2.9%Illinois 29,344 36,125 37,718 2.6 4.4 28,876 35,780 38,034 2.7 6.3Indiana 11,876 18,363 19,689 5.6 7.2 11,053 18,308 19,699 6.5 7.6Iowa 4,656 5,592 4,376 2.3 -21.7 4,379 5,557 4,648 3.0 -16.4Kansas 5,002 4,506 4,816 -1.3 6.9 5,231 4,655 4,721 -1.4 1.4Michigan 12,169 12,071 14,955 -0.1 23.9 10,874 13,621 18,197 2.9 33.6Minnesota 4,406 7,555 7,361 7.0 -2.6 4,244 7,936 7,777 8.1 -2.0Missouri 14,454 18,611 18,216 3.2 -2.1 13,346 18,864 18,097 4.4 -4.1Nebraska 1,688 2,059 2,101 2.5 2.0 1,503 1,963 2,107 3.4 7.3North Dakota 605 1,085 1,042 7.6 -4.0 598 1,051 1,003 7.3 -4.6Ohio 23,780 29,510 26,864 2.7 -9.0 24,793 28,552 26,949 1.8 -5.6South Dakota 1,400 3,116 3,170 10.5 1.7 1,327 3,102 3,079 11.2 -0.7Wisconsin 8,396 7,571 7,245 -1.3 -4.3 8,158 9,391 8,771 1.8 -6.6
South 217,950 261,312 255,119 2.3% -2.4% 210,777 257,065 255,959 2.5% -0.4%Alabama 6,296 11,037 13,093 7.3 18.6 7,136 11,556 12,231 6.2 5.8Arkansas 6,941 7,017 7,383 0.1 5.2 6,308 6,610 6,990 0.6 5.7Delaware 2,709 1,494 1,550 -7.2 3.7 2,260 1,617 1,697 -4.1 4.9Florida 35,683 40,860 38,050 1.7 -6.9 33,994 37,277 37,167 1.2 -0.3Georgia 17,373 18,625 17,600 0.9 -5.5 14,797 19,463 16,161 3.5 -17.0Kentucky 8,116 14,273 14,033 7.3 -1.7 7,733 15,413 14,138 9.0 -8.3Louisiana 15,735 15,854 14,940 0.1 -5.8 14,536 14,991 14,924 0.4 -0.4Maryland 10,327 10,396 9,959 0.1 -4.2 10,004 10,383 10,807 0.5 4.1Mississippi 5,796 7,908 8,239 4.0 4.2 4,940 7,817 9,270 5.9 18.6North Carolina 9,848 11,825 11,693 2.3 -1.1 9,687 10,615 11,056 1.2 4.2Oklahoma 7,426 7,935 8,120 0.8 2.3 6,628 7,915 8,004 2.2 1.1South Carolina 8,460 9,650 9,352 1.7 -3.1 8,676 9,506 9,321 1.1 -1.9Tennessee 13,675 14,196 13,783 0.5 -2.9 13,893 15,414 15,762 1.3 2.3Texas 58,197 73,490 71,489 3.0 -2.7 59,776 72,168 72,320 2.4 0.2Virginia 9,791 13,625 12,631 4.2 -7.3 9,148 13,194 13,168 4.7 -0.2West Virginia 1,577 3,127 3,204 8.9 2.5 1,261 3,126 2,943 12.0 -5.9
West 177,996 212,831 204,393 2.3% -4.0% 173,794 205,848 201,043 2.1% -2.3%Alaska 2,427 4,857 2,761 9.1 -43.2 2,599 3,741 3,196 4.7 -14.6Arizona 9,560 14,867 14,526 5.7 -2.3 9,100 13,192 13,854 4.8 5.0California 129,640 140,827 129,705 1.0 -7.9 129,621 136,925 128,869 0.7 -5.9Colorado 7,036 11,089 11,054 5.9 -0.3 5,881 10,616 10,858 7.7 2.3Hawaii 1,594 1,731 1,714 1.0 -1.0 1,379 1,795 1,915 3.4 6.7Idaho 3,386 3,867 3,857 1.7 -0.3 2,697 3,891 3,743 4.7 -3.8Montana 1,202 2,253 2,295 8.2 1.9 1,031 2,117 2,212 9.4 4.5Nevada 4,929 4,610 5,409 -0.8 17.3 4,374 5,278 5,967 2.4 13.1New Mexico 3,161 4,092 5,650 3.3 38.1 3,383 4,013 3,650 2.2 -9.0Oregon 4,059 5,395 5,950 3.6 10.3 3,371 5,055 5,422 5.2 7.3Utah 3,270 3,394 3,583 0.5 5.6 2,897 3,400 3,498 2.0 2.9Washington 7,094 15,070 17,074 9.9 13.3 6,764 15,061 17,035 10.5 13.1Wyoming 638 779 815 2.5 4.6 697 764 824 1.2 7.9
Note: Totals based on prisoners with a sentence of more than 1 year. Totals exclude escapees, AWOLS, and transfers to and from other jurisdictions. See Methodology.:Not calculated.
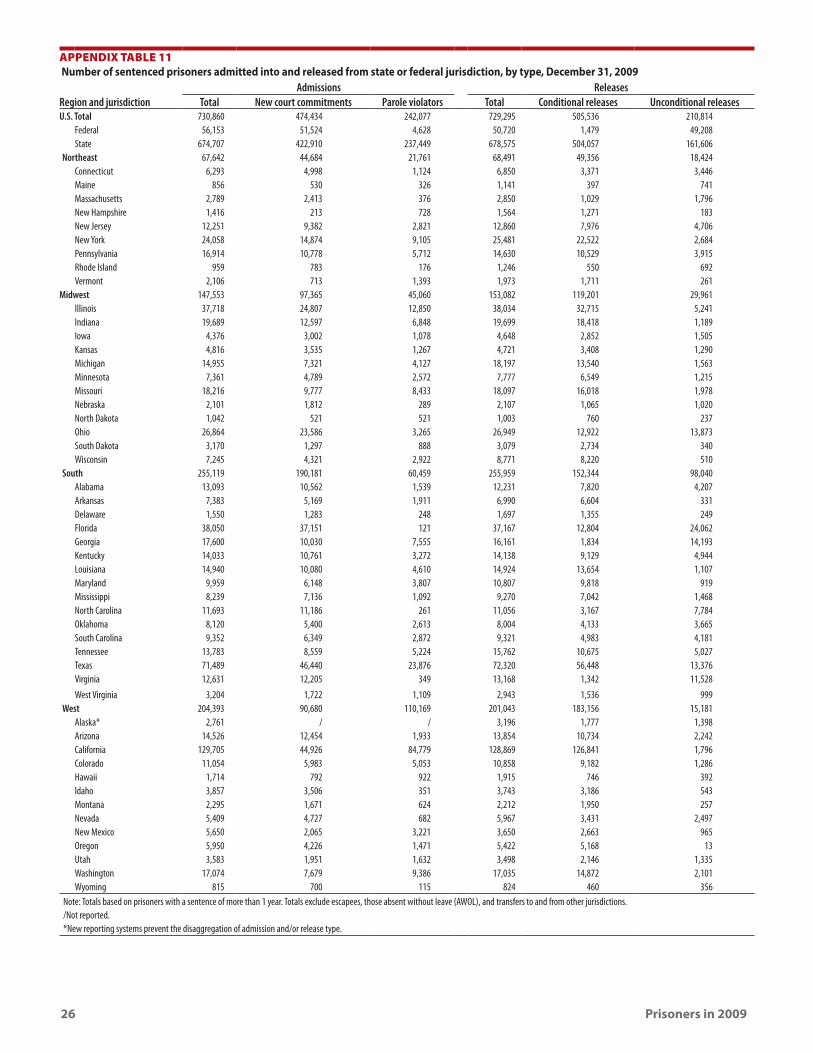
26 Prisoners in 2009
appendix Table 11 Number of sentenced prisoners admitted into and released from state or federal jurisdiction, by type, December 31, 2009
Admissions ReleasesRegion and jurisdiction Total New court commitments Parole violators Total Conditional releases Unconditional releasesU.S. Total 730,860 474,434 242,077 729,295 505,536 210,814
Federal 56,153 51,524 4,628 50,720 1,479 49,208State 674,707 422,910 237,449 678,575 504,057 161,606
Northeast 67,642 44,684 21,761 68,491 49,356 18,424Connecticut 6,293 4,998 1,124 6,850 3,371 3,446Maine 856 530 326 1,141 397 741Massachusetts 2,789 2,413 376 2,850 1,029 1,796New Hampshire 1,416 213 728 1,564 1,271 183New Jersey 12,251 9,382 2,821 12,860 7,976 4,706New York 24,058 14,874 9,105 25,481 22,522 2,684Pennsylvania 16,914 10,778 5,712 14,630 10,529 3,915Rhode Island 959 783 176 1,246 550 692Vermont 2,106 713 1,393 1,973 1,711 261
Midwest 147,553 97,365 45,060 153,082 119,201 29,961Illinois 37,718 24,807 12,850 38,034 32,715 5,241Indiana 19,689 12,597 6,848 19,699 18,418 1,189Iowa 4,376 3,002 1,078 4,648 2,852 1,505Kansas 4,816 3,535 1,267 4,721 3,408 1,290Michigan 14,955 7,321 4,127 18,197 13,540 1,563Minnesota 7,361 4,789 2,572 7,777 6,549 1,215Missouri 18,216 9,777 8,433 18,097 16,018 1,978Nebraska 2,101 1,812 289 2,107 1,065 1,020North Dakota 1,042 521 521 1,003 760 237Ohio 26,864 23,586 3,265 26,949 12,922 13,873South Dakota 3,170 1,297 888 3,079 2,734 340Wisconsin 7,245 4,321 2,922 8,771 8,220 510
South 255,119 190,181 60,459 255,959 152,344 98,040Alabama 13,093 10,562 1,539 12,231 7,820 4,207Arkansas 7,383 5,169 1,911 6,990 6,604 331Delaware 1,550 1,283 248 1,697 1,355 249Florida 38,050 37,151 121 37,167 12,804 24,062Georgia 17,600 10,030 7,555 16,161 1,834 14,193Kentucky 14,033 10,761 3,272 14,138 9,129 4,944Louisiana 14,940 10,080 4,610 14,924 13,654 1,107Maryland 9,959 6,148 3,807 10,807 9,818 919Mississippi 8,239 7,136 1,092 9,270 7,042 1,468North Carolina 11,693 11,186 261 11,056 3,167 7,784Oklahoma 8,120 5,400 2,613 8,004 4,133 3,665South Carolina 9,352 6,349 2,872 9,321 4,983 4,181Tennessee 13,783 8,559 5,224 15,762 10,675 5,027Texas 71,489 46,440 23,876 72,320 56,448 13,376Virginia 12,631 12,205 349 13,168 1,342 11,528West Virginia 3,204 1,722 1,109 2,943 1,536 999
West 204,393 90,680 110,169 201,043 183,156 15,181Alaska* 2,761 / / 3,196 1,777 1,398Arizona 14,526 12,454 1,933 13,854 10,734 2,242California 129,705 44,926 84,779 128,869 126,841 1,796Colorado 11,054 5,983 5,053 10,858 9,182 1,286Hawaii 1,714 792 922 1,915 746 392Idaho 3,857 3,506 351 3,743 3,186 543Montana 2,295 1,671 624 2,212 1,950 257Nevada 5,409 4,727 682 5,967 3,431 2,497New Mexico 5,650 2,065 3,221 3,650 2,663 965Oregon 5,950 4,226 1,471 5,422 5,168 13Utah 3,583 1,951 1,632 3,498 2,146 1,335Washington 17,074 7,679 9,386 17,035 14,872 2,101Wyoming 815 700 115 824 460 356
Note: Totals based on prisoners with a sentence of more than 1 year. Totals exclude escapees, those absent without leave (AWOL), and transfers to and from other jurisdictions./Not reported.*New reporting systems prevent the disaggregation of admission and/or release type.
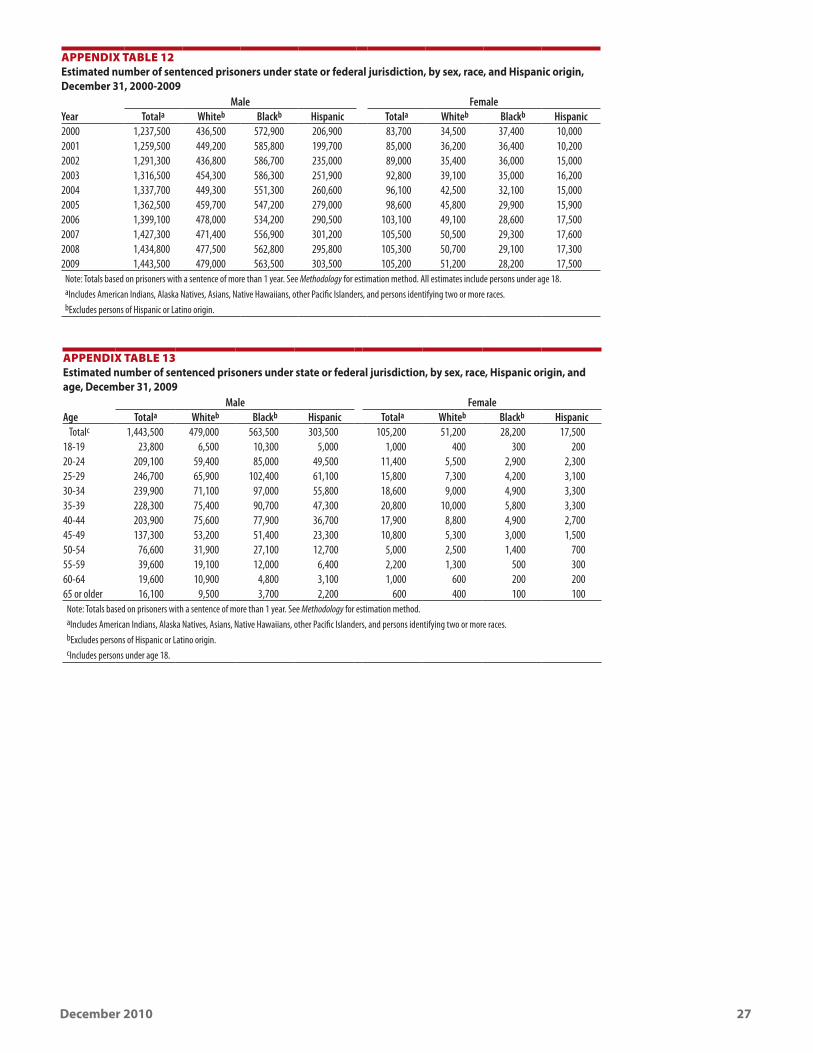
December 2010 27
appendix Table 12 Estimated number of sentenced prisoners under state or federal jurisdiction, by sex, race, and Hispanic origin, December 31, 2000-2009
Male FemaleYear Totala Whiteb Blackb Hispanic Totala Whiteb Blackb Hispanic2000 1,237,500 436,500 572,900 206,900 83,700 34,500 37,400 10,0002001 1,259,500 449,200 585,800 199,700 85,000 36,200 36,400 10,2002002 1,291,300 436,800 586,700 235,000 89,000 35,400 36,000 15,0002003 1,316,500 454,300 586,300 251,900 92,800 39,100 35,000 16,2002004 1,337,700 449,300 551,300 260,600 96,100 42,500 32,100 15,0002005 1,362,500 459,700 547,200 279,000 98,600 45,800 29,900 15,9002006 1,399,100 478,000 534,200 290,500 103,100 49,100 28,600 17,5002007 1,427,300 471,400 556,900 301,200 105,500 50,500 29,300 17,6002008 1,434,800 477,500 562,800 295,800 105,300 50,700 29,100 17,3002009 1,443,500 479,000 563,500 303,500 105,200 51,200 28,200 17,500
Note: Totals based on prisoners with a sentence of more than 1 year. See Methodology for estimation method. All estimates include persons under age 18.aIncludes American Indians, Alaska Natives, Asians, Native Hawaiians, other Pacific Islanders, and persons identifying two or more races. bExcludes persons of Hispanic or Latino origin.
appendix Table 13 Estimated number of sentenced prisoners under state or federal jurisdiction, by sex, race, Hispanic origin, and age, December 31, 2009
Male FemaleAge Totala Whiteb Blackb Hispanic Totala Whiteb Blackb Hispanic
Totalc 1,443,500 479,000 563,500 303,500 105,200 51,200 28,200 17,50018-19 23,800 6,500 10,300 5,000 1,000 400 300 20020-24 209,100 59,400 85,000 49,500 11,400 5,500 2,900 2,30025-29 246,700 65,900 102,400 61,100 15,800 7,300 4,200 3,10030-34 239,900 71,100 97,000 55,800 18,600 9,000 4,900 3,30035-39 228,300 75,400 90,700 47,300 20,800 10,000 5,800 3,30040-44 203,900 75,600 77,900 36,700 17,900 8,800 4,900 2,70045-49 137,300 53,200 51,400 23,300 10,800 5,300 3,000 1,50050-54 76,600 31,900 27,100 12,700 5,000 2,500 1,400 70055-59 39,600 19,100 12,000 6,400 2,200 1,300 500 30060-64 19,600 10,900 4,800 3,100 1,000 600 200 20065 or older 16,100 9,500 3,700 2,200 600 400 100 100
Note: Totals based on prisoners with a sentence of more than 1 year. See Methodology for estimation method. aIncludes American Indians, Alaska Natives, Asians, Native Hawaiians, other Pacific Islanders, and persons identifying two or more races. bExcludes persons of Hispanic or Latino origin. cIncludes persons under age 18.
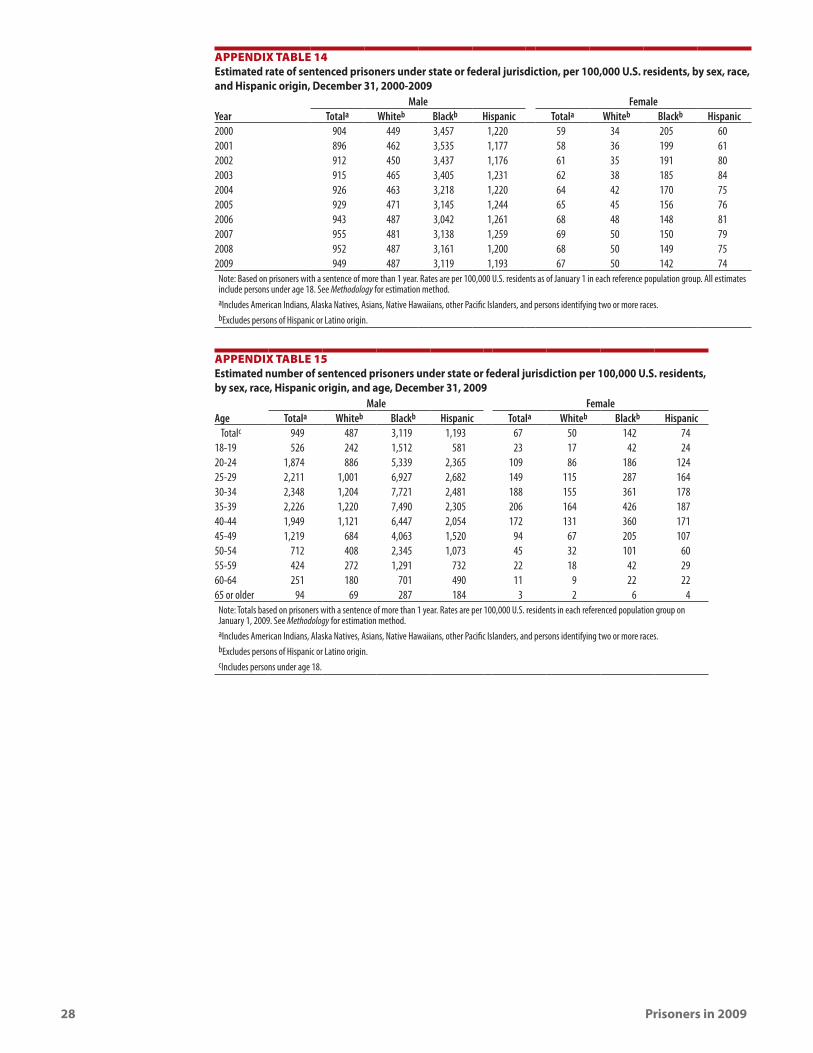
28 Prisoners in 2009
appendix Table 14 Estimated rate of sentenced prisoners under state or federal jurisdiction, per 100,000 U.S. residents, by sex, race, and Hispanic origin, December 31, 2000-2009
Male FemaleYear Totala Whiteb Blackb Hispanic Totala Whiteb Blackb Hispanic2000 904 449 3,457 1,220 59 34 205 602001 896 462 3,535 1,177 58 36 199 612002 912 450 3,437 1,176 61 35 191 802003 915 465 3,405 1,231 62 38 185 842004 926 463 3,218 1,220 64 42 170 752005 929 471 3,145 1,244 65 45 156 762006 943 487 3,042 1,261 68 48 148 812007 955 481 3,138 1,259 69 50 150 792008 952 487 3,161 1,200 68 50 149 752009 949 487 3,119 1,193 67 50 142 74
Note: Based on prisoners with a sentence of more than 1 year. Rates are per 100,000 U.S. residents as of January 1 in each reference population group. All estimates include persons under age 18. See Methodology for estimation method. aIncludes American Indians, Alaska Natives, Asians, Native Hawaiians, other Pacific Islanders, and persons identifying two or more races. bExcludes persons of Hispanic or Latino origin.
appendix Table 15 Estimated number of sentenced prisoners under state or federal jurisdiction per 100,000 U.S. residents, by sex, race, Hispanic origin, and age, December 31, 2009
Male FemaleAge Totala Whiteb Blackb Hispanic Totala Whiteb Blackb Hispanic
Totalc 949 487 3,119 1,193 67 50 142 7418-19 526 242 1,512 581 23 17 42 2420-24 1,874 886 5,339 2,365 109 86 186 12425-29 2,211 1,001 6,927 2,682 149 115 287 16430-34 2,348 1,204 7,721 2,481 188 155 361 17835-39 2,226 1,220 7,490 2,305 206 164 426 18740-44 1,949 1,121 6,447 2,054 172 131 360 17145-49 1,219 684 4,063 1,520 94 67 205 10750-54 712 408 2,345 1,073 45 32 101 6055-59 424 272 1,291 732 22 18 42 2960-64 251 180 701 490 11 9 22 2265 or older 94 69 287 184 3 2 6 4
Note: Totals based on prisoners with a sentence of more than 1 year. Rates are per 100,000 U.S. residents in each referenced population group on January 1, 2009. See Methodology for estimation method.aIncludes American Indians, Alaska Natives, Asians, Native Hawaiians, other Pacific Islanders, and persons identifying two or more races. bExcludes persons of Hispanic or Latino origin. cIncludes persons under age 18.
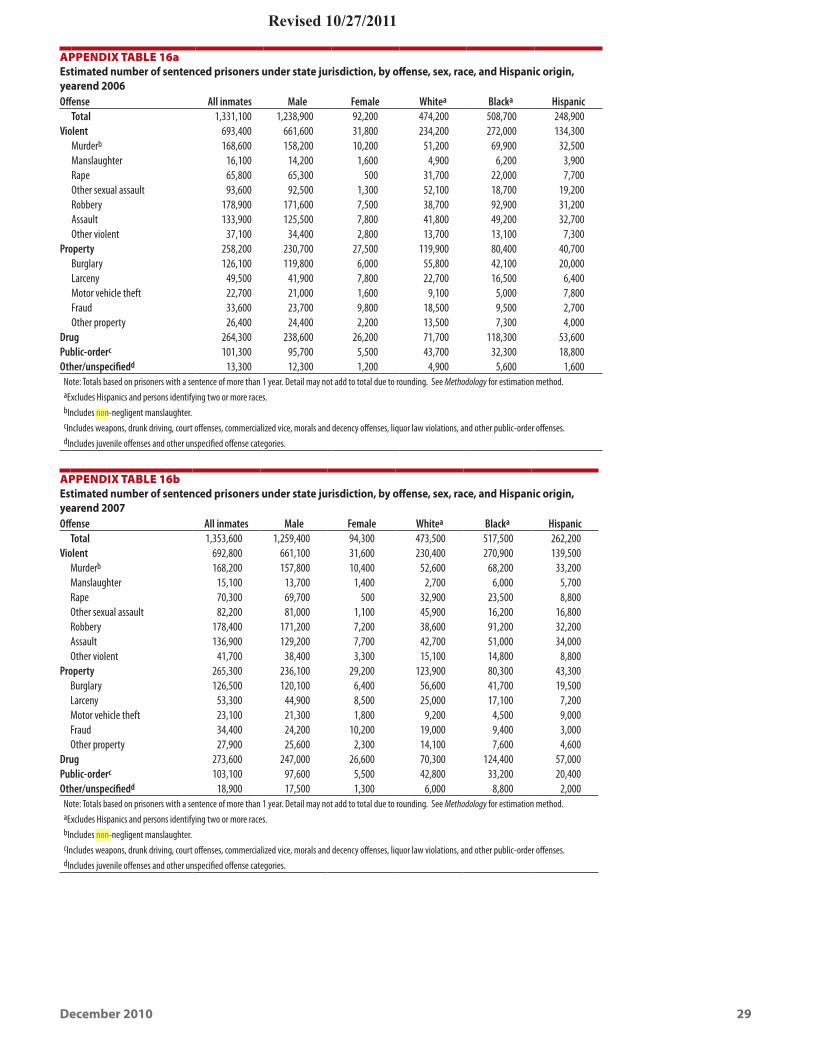
December 2010 29
appendix Table 16a Estimated number of sentenced prisoners under state jurisdiction, by offense, sex, race, and Hispanic origin, yearend 2006Offense All inmates Male Female Whitea Blacka Hispanic
Total 1,331,100 1,238,900 92,200 474,200 508,700 248,900Violent 693,400 661,600 31,800 234,200 272,000 134,300
Murderb 168,600 158,200 10,200 51,200 69,900 32,500Manslaughter 16,100 14,200 1,600 4,900 6,200 3,900Rape 65,800 65,300 500 31,700 22,000 7,700Other sexual assault 93,600 92,500 1,300 52,100 18,700 19,200Robbery 178,900 171,600 7,500 38,700 92,900 31,200Assault 133,900 125,500 7,800 41,800 49,200 32,700Other violent 37,100 34,400 2,800 13,700 13,100 7,300
Property 258,200 230,700 27,500 119,900 80,400 40,700Burglary 126,100 119,800 6,000 55,800 42,100 20,000Larceny 49,500 41,900 7,800 22,700 16,500 6,400Motor vehicle theft 22,700 21,000 1,600 9,100 5,000 7,800Fraud 33,600 23,700 9,800 18,500 9,500 2,700Other property 26,400 24,400 2,200 13,500 7,300 4,000
Drug 264,300 238,600 26,200 71,700 118,300 53,600Public-orderc 101,300 95,700 5,500 43,700 32,300 18,800Other/unspecifiedd 13,300 12,300 1,200 4,900 5,600 1,600
Note: Totals based on prisoners with a sentence of more than 1 year. Detail may not add to total due to rounding. See Methodology for estimation method.aExcludes Hispanics and persons identifying two or more races.bIncludes non-negligent manslaughter.cIncludes weapons, drunk driving, court offenses, commercialized vice, morals and decency offenses, liquor law violations, and other public-order offenses.dIncludes juvenile offenses and other unspecified offense categories.
appendix Table 16b Estimated number of sentenced prisoners under state jurisdiction, by offense, sex, race, and Hispanic origin, yearend 2007Offense All inmates Male Female Whitea Blacka Hispanic
Total 1,353,600 1,259,400 94,300 473,500 517,500 262,200Violent 692,800 661,100 31,600 230,400 270,900 139,500
Murderb 168,200 157,800 10,400 52,600 68,200 33,200Manslaughter 15,100 13,700 1,400 2,700 6,000 5,700Rape 70,300 69,700 500 32,900 23,500 8,800Other sexual assault 82,200 81,000 1,100 45,900 16,200 16,800Robbery 178,400 171,200 7,200 38,600 91,200 32,200Assault 136,900 129,200 7,700 42,700 51,000 34,000Other violent 41,700 38,400 3,300 15,100 14,800 8,800
Property 265,300 236,100 29,200 123,900 80,300 43,300Burglary 126,500 120,100 6,400 56,600 41,700 19,500Larceny 53,300 44,900 8,500 25,000 17,100 7,200Motor vehicle theft 23,100 21,300 1,800 9,200 4,500 9,000Fraud 34,400 24,200 10,200 19,000 9,400 3,000Other property 27,900 25,600 2,300 14,100 7,600 4,600
Drug 273,600 247,000 26,600 70,300 124,400 57,000Public-orderc 103,100 97,600 5,500 42,800 33,200 20,400Other/unspecifiedd 18,900 17,500 1,300 6,000 8,800 2,000
Note: Totals based on prisoners with a sentence of more than 1 year. Detail may not add to total due to rounding. See Methodology for estimation method.aExcludes Hispanics and persons identifying two or more races.bIncludes non-negligent manslaughter.cIncludes weapons, drunk driving, court offenses, commercialized vice, morals and decency offenses, liquor law violations, and other public-order offenses.dIncludes juvenile offenses and other unspecified offense categories.
Revised 10/27/2011
dorseyt
Highlight
dorseyt
Highlight
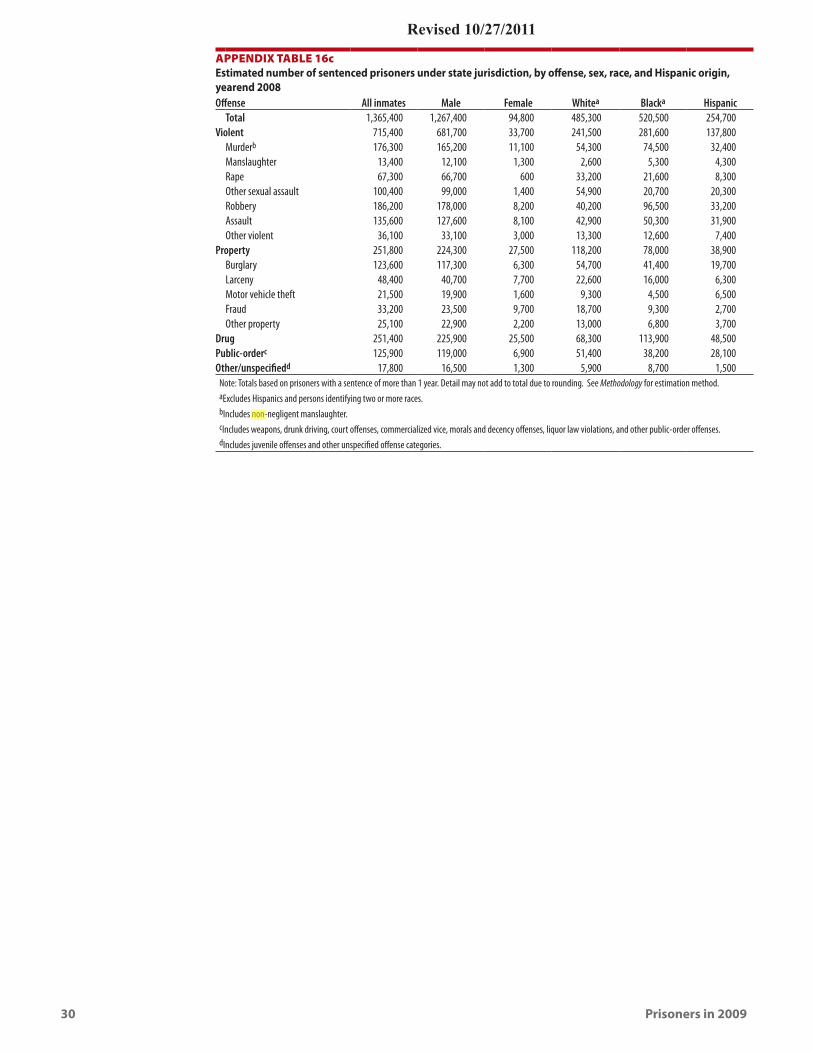
30 Prisoners in 2009
appendix Table 16c Estimated number of sentenced prisoners under state jurisdiction, by offense, sex, race, and Hispanic origin, yearend 2008Offense All inmates Male Female Whitea Blacka Hispanic
Total 1,365,400 1,267,400 94,800 485,300 520,500 254,700Violent 715,400 681,700 33,700 241,500 281,600 137,800
Murderb 176,300 165,200 11,100 54,300 74,500 32,400Manslaughter 13,400 12,100 1,300 2,600 5,300 4,300Rape 67,300 66,700 600 33,200 21,600 8,300Other sexual assault 100,400 99,000 1,400 54,900 20,700 20,300Robbery 186,200 178,000 8,200 40,200 96,500 33,200Assault 135,600 127,600 8,100 42,900 50,300 31,900Other violent 36,100 33,100 3,000 13,300 12,600 7,400
Property 251,800 224,300 27,500 118,200 78,000 38,900Burglary 123,600 117,300 6,300 54,700 41,400 19,700Larceny 48,400 40,700 7,700 22,600 16,000 6,300Motor vehicle theft 21,500 19,900 1,600 9,300 4,500 6,500Fraud 33,200 23,500 9,700 18,700 9,300 2,700Other property 25,100 22,900 2,200 13,000 6,800 3,700
Drug 251,400 225,900 25,500 68,300 113,900 48,500Public-orderc 125,900 119,000 6,900 51,400 38,200 28,100Other/unspecifiedd 17,800 16,500 1,300 5,900 8,700 1,500
Note: Totals based on prisoners with a sentence of more than 1 year. Detail may not add to total due to rounding. See Methodology for estimation method.aExcludes Hispanics and persons identifying two or more races.bIncludes non-negligent manslaughter.cIncludes weapons, drunk driving, court offenses, commercialized vice, morals and decency offenses, liquor law violations, and other public-order offenses.dIncludes juvenile offenses and other unspecified offense categories.
Revised 10/27/2011
dorseyt
Highlight
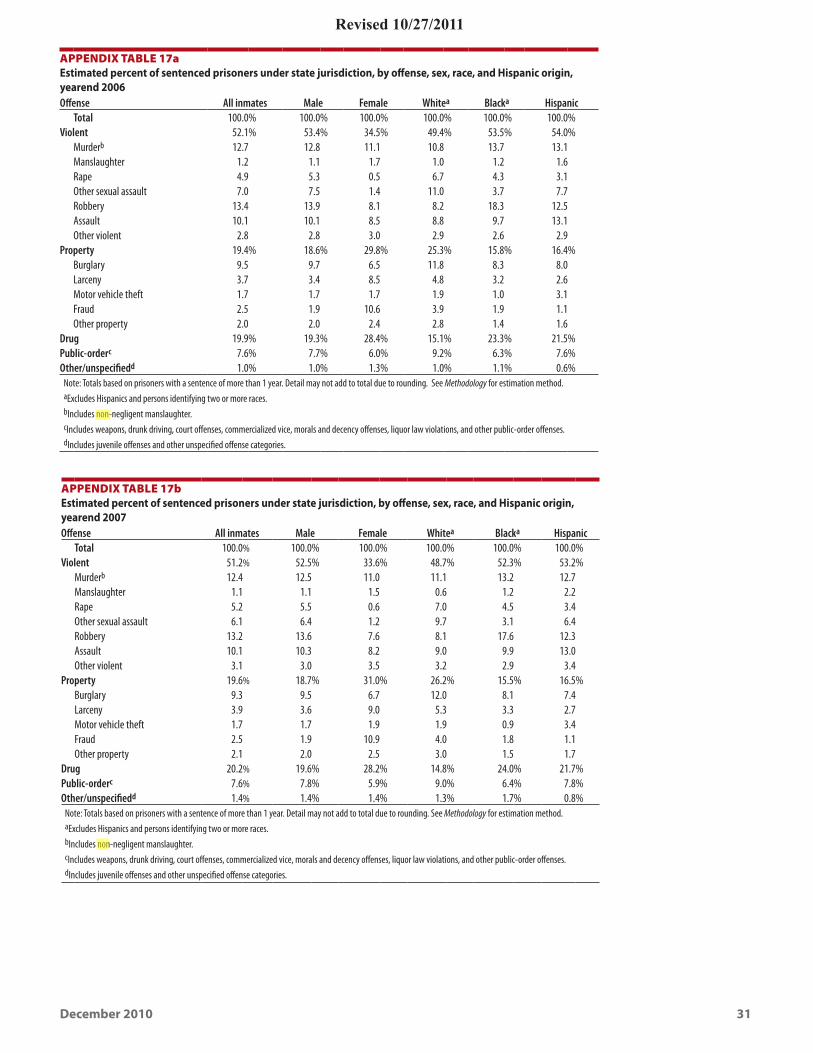
December 2010 31
appendix Table 17a Estimated percent of sentenced prisoners under state jurisdiction, by offense, sex, race, and Hispanic origin, yearend 2006Offense All inmates Male Female Whitea Blacka Hispanic
Total 100.0% 100.0% 100.0% 100.0% 100.0% 100.0%Violent 52.1% 53.4% 34.5% 49.4% 53.5% 54.0%
Murderb 12.7 12.8 11.1 10.8 13.7 13.1Manslaughter 1.2 1.1 1.7 1.0 1.2 1.6Rape 4.9 5.3 0.5 6.7 4.3 3.1Other sexual assault 7.0 7.5 1.4 11.0 3.7 7.7Robbery 13.4 13.9 8.1 8.2 18.3 12.5Assault 10.1 10.1 8.5 8.8 9.7 13.1Other violent 2.8 2.8 3.0 2.9 2.6 2.9
Property 19.4% 18.6% 29.8% 25.3% 15.8% 16.4%Burglary 9.5 9.7 6.5 11.8 8.3 8.0Larceny 3.7 3.4 8.5 4.8 3.2 2.6Motor vehicle theft 1.7 1.7 1.7 1.9 1.0 3.1Fraud 2.5 1.9 10.6 3.9 1.9 1.1Other property 2.0 2.0 2.4 2.8 1.4 1.6
Drug 19.9% 19.3% 28.4% 15.1% 23.3% 21.5%Public-orderc 7.6% 7.7% 6.0% 9.2% 6.3% 7.6%Other/unspecifiedd 1.0% 1.0% 1.3% 1.0% 1.1% 0.6%
Note: Totals based on prisoners with a sentence of more than 1 year. Detail may not add to total due to rounding. See Methodology for estimation method.aExcludes Hispanics and persons identifying two or more races.bIncludes non-negligent manslaughter.cIncludes weapons, drunk driving, court offenses, commercialized vice, morals and decency offenses, liquor law violations, and other public-order offenses.dIncludes juvenile offenses and other unspecified offense categories.
appendix Table 17b Estimated percent of sentenced prisoners under state jurisdiction, by offense, sex, race, and Hispanic origin, yearend 2007Offense All inmates Male Female Whitea Blacka Hispanic
Total 100.0% 100.0% 100.0% 100.0% 100.0% 100.0%Violent 51.2% 52.5% 33.6% 48.7% 52.3% 53.2%
Murderb 12.4 12.5 11.0 11.1 13.2 12.7Manslaughter 1.1 1.1 1.5 0.6 1.2 2.2Rape 5.2 5.5 0.6 7.0 4.5 3.4Other sexual assault 6.1 6.4 1.2 9.7 3.1 6.4Robbery 13.2 13.6 7.6 8.1 17.6 12.3Assault 10.1 10.3 8.2 9.0 9.9 13.0Other violent 3.1 3.0 3.5 3.2 2.9 3.4
Property 19.6% 18.7% 31.0% 26.2% 15.5% 16.5%Burglary 9.3 9.5 6.7 12.0 8.1 7.4Larceny 3.9 3.6 9.0 5.3 3.3 2.7Motor vehicle theft 1.7 1.7 1.9 1.9 0.9 3.4Fraud 2.5 1.9 10.9 4.0 1.8 1.1Other property 2.1 2.0 2.5 3.0 1.5 1.7
Drug 20.2% 19.6% 28.2% 14.8% 24.0% 21.7%Public-orderc 7.6% 7.8% 5.9% 9.0% 6.4% 7.8%Other/unspecifiedd 1.4% 1.4% 1.4% 1.3% 1.7% 0.8%
Note: Totals based on prisoners with a sentence of more than 1 year. Detail may not add to total due to rounding. See Methodology for estimation method.aExcludes Hispanics and persons identifying two or more races.bIncludes non-negligent manslaughter.cIncludes weapons, drunk driving, court offenses, commercialized vice, morals and decency offenses, liquor law violations, and other public-order offenses.dIncludes juvenile offenses and other unspecified offense categories.
Revised 10/27/2011
dorseyt
Highlight
dorseyt
Highlight
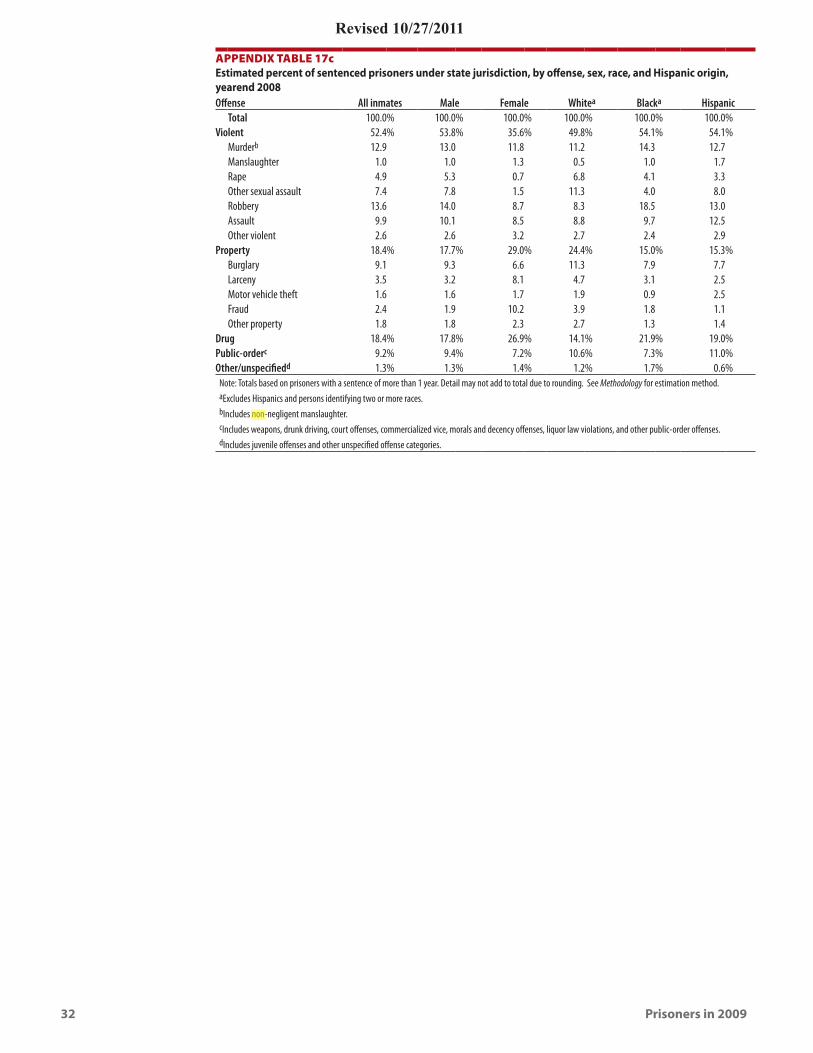
32 Prisoners in 2009
appendix Table 17c Estimated percent of sentenced prisoners under state jurisdiction, by offense, sex, race, and Hispanic origin, yearend 2008Offense All inmates Male Female Whitea Blacka Hispanic
Total 100.0% 100.0% 100.0% 100.0% 100.0% 100.0%Violent 52.4% 53.8% 35.6% 49.8% 54.1% 54.1%
Murderb 12.9 13.0 11.8 11.2 14.3 12.7Manslaughter 1.0 1.0 1.3 0.5 1.0 1.7Rape 4.9 5.3 0.7 6.8 4.1 3.3Other sexual assault 7.4 7.8 1.5 11.3 4.0 8.0Robbery 13.6 14.0 8.7 8.3 18.5 13.0Assault 9.9 10.1 8.5 8.8 9.7 12.5Other violent 2.6 2.6 3.2 2.7 2.4 2.9
Property 18.4% 17.7% 29.0% 24.4% 15.0% 15.3%Burglary 9.1 9.3 6.6 11.3 7.9 7.7Larceny 3.5 3.2 8.1 4.7 3.1 2.5Motor vehicle theft 1.6 1.6 1.7 1.9 0.9 2.5Fraud 2.4 1.9 10.2 3.9 1.8 1.1Other property 1.8 1.8 2.3 2.7 1.3 1.4
Drug 18.4% 17.8% 26.9% 14.1% 21.9% 19.0%Public-orderc 9.2% 9.4% 7.2% 10.6% 7.3% 11.0%Other/unspecifiedd 1.3% 1.3% 1.4% 1.2% 1.7% 0.6%
Note: Totals based on prisoners with a sentence of more than 1 year. Detail may not add to total due to rounding. See Methodology for estimation method.aExcludes Hispanics and persons identifying two or more races.bIncludes non-negligent manslaughter.cIncludes weapons, drunk driving, court offenses, commercialized vice, morals and decency offenses, liquor law violations, and other public-order offenses.dIncludes juvenile offenses and other unspecified offense categories.
Revised 10/27/2011
dorseyt
Highlight
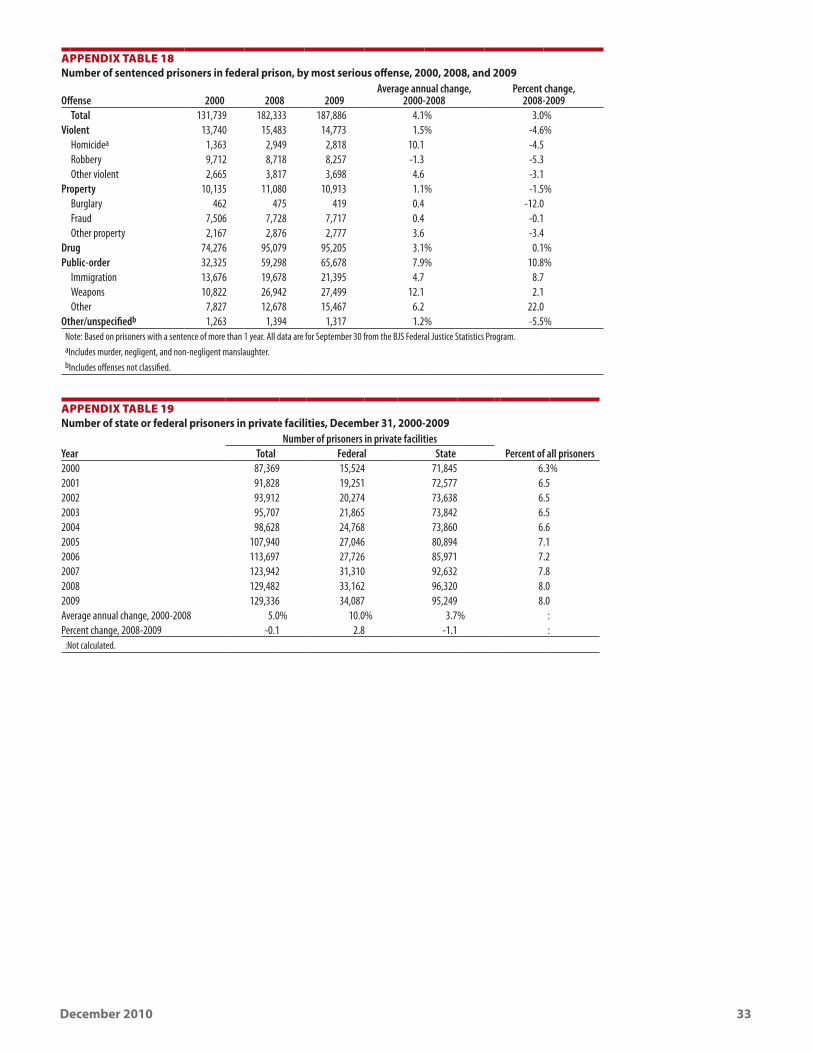
December 2010 33
appendix Table 18 Number of sentenced prisoners in federal prison, by most serious offense, 2000, 2008, and 2009
Offense 2000 2008 2009Average annual change,
2000-2008Percent change,
2008-2009Total 131,739 182,333 187,886 4.1% 3.0%
Violent 13,740 15,483 14,773 1.5% -4.6%Homicidea 1,363 2,949 2,818 10.1 -4.5Robbery 9,712 8,718 8,257 -1.3 -5.3Other violent 2,665 3,817 3,698 4.6 -3.1
Property 10,135 11,080 10,913 1.1% -1.5%Burglary 462 475 419 0.4 -12.0Fraud 7,506 7,728 7,717 0.4 -0.1Other property 2,167 2,876 2,777 3.6 -3.4
Drug 74,276 95,079 95,205 3.1% 0.1%Public-order 32,325 59,298 65,678 7.9% 10.8%
Immigration 13,676 19,678 21,395 4.7 8.7Weapons 10,822 26,942 27,499 12.1 2.1Other 7,827 12,678 15,467 6.2 22.0
Other/unspecifiedb 1,263 1,394 1,317 1.2% -5.5%Note: Based on prisoners with a sentence of more than 1 year. All data are for September 30 from the BJS Federal Justice Statistics Program. aIncludes murder, negligent, and non-negligent manslaughter.bIncludes offenses not classified.
appendix Table 19 Number of state or federal prisoners in private facilities, December 31, 2000-2009
Number of prisoners in private facilitiesYear Total Federal State Percent of all prisoners2000 87,369 15,524 71,845 6.3%2001 91,828 19,251 72,577 6.52002 93,912 20,274 73,638 6.52003 95,707 21,865 73,842 6.52004 98,628 24,768 73,860 6.62005 107,940 27,046 80,894 7.12006 113,697 27,726 85,971 7.22007 123,942 31,310 92,632 7.82008 129,482 33,162 96,320 8.02009 129,336 34,087 95,249 8.0Average annual change, 2000-2008 5.0% 10.0% 3.7% :Percent change, 2008-2009 -0.1 2.8 -1.1 :
:Not calculated.
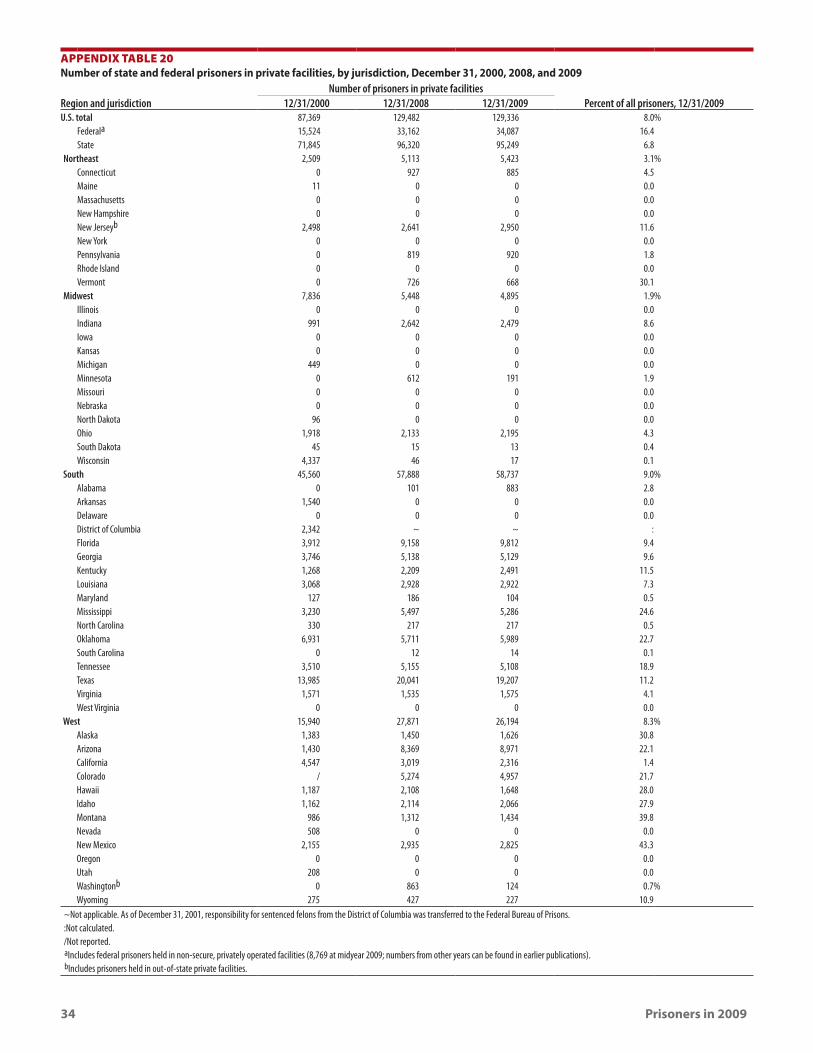
34 Prisoners in 2009
appendix Table 20 Number of state and federal prisoners in private facilities, by jurisdiction, December 31, 2000, 2008, and 2009
Region and jurisdictionNumber of prisoners in private facilities
Percent of all prisoners, 12/31/200912/31/2000 12/31/2008 12/31/2009U.S. total 87,369 129,482 129,336 8.0%
Federala 15,524 33,162 34,087 16.4State 71,845 96,320 95,249 6.8
Northeast 2,509 5,113 5,423 3.1%Connecticut 0 927 885 4.5Maine 11 0 0 0.0Massachusetts 0 0 0 0.0New Hampshire 0 0 0 0.0New Jerseyb 2,498 2,641 2,950 11.6New York 0 0 0 0.0Pennsylvania 0 819 920 1.8Rhode Island 0 0 0 0.0Vermont 0 726 668 30.1
Midwest 7,836 5,448 4,895 1.9%Illinois 0 0 0 0.0Indiana 991 2,642 2,479 8.6Iowa 0 0 0 0.0Kansas 0 0 0 0.0Michigan 449 0 0 0.0Minnesota 0 612 191 1.9Missouri 0 0 0 0.0Nebraska 0 0 0 0.0North Dakota 96 0 0 0.0Ohio 1,918 2,133 2,195 4.3South Dakota 45 15 13 0.4Wisconsin 4,337 46 17 0.1
South 45,560 57,888 58,737 9.0%Alabama 0 101 883 2.8Arkansas 1,540 0 0 0.0Delaware 0 0 0 0.0District of Columbia 2,342 ~ ~ :Florida 3,912 9,158 9,812 9.4Georgia 3,746 5,138 5,129 9.6Kentucky 1,268 2,209 2,491 11.5Louisiana 3,068 2,928 2,922 7.3Maryland 127 186 104 0.5Mississippi 3,230 5,497 5,286 24.6North Carolina 330 217 217 0.5Oklahoma 6,931 5,711 5,989 22.7South Carolina 0 12 14 0.1Tennessee 3,510 5,155 5,108 18.9Texas 13,985 20,041 19,207 11.2Virginia 1,571 1,535 1,575 4.1West Virginia 0 0 0 0.0
West 15,940 27,871 26,194 8.3%Alaska 1,383 1,450 1,626 30.8Arizona 1,430 8,369 8,971 22.1California 4,547 3,019 2,316 1.4Colorado / 5,274 4,957 21.7Hawaii 1,187 2,108 1,648 28.0Idaho 1,162 2,114 2,066 27.9Montana 986 1,312 1,434 39.8Nevada 508 0 0 0.0New Mexico 2,155 2,935 2,825 43.3Oregon 0 0 0 0.0Utah 208 0 0 0.0Washingtonb 0 863 124 0.7%Wyoming 275 427 227 10.9
~Not applicable. As of December 31, 2001, responsibility for sentenced felons from the District of Columbia was transferred to the Federal Bureau of Prisons.:Not calculated./Not reported.aIncludes federal prisoners held in non-secure, privately operated facilities (8,769 at midyear 2009; numbers from other years can be found in earlier publications).bIncludes prisoners held in out-of-state private facilities.
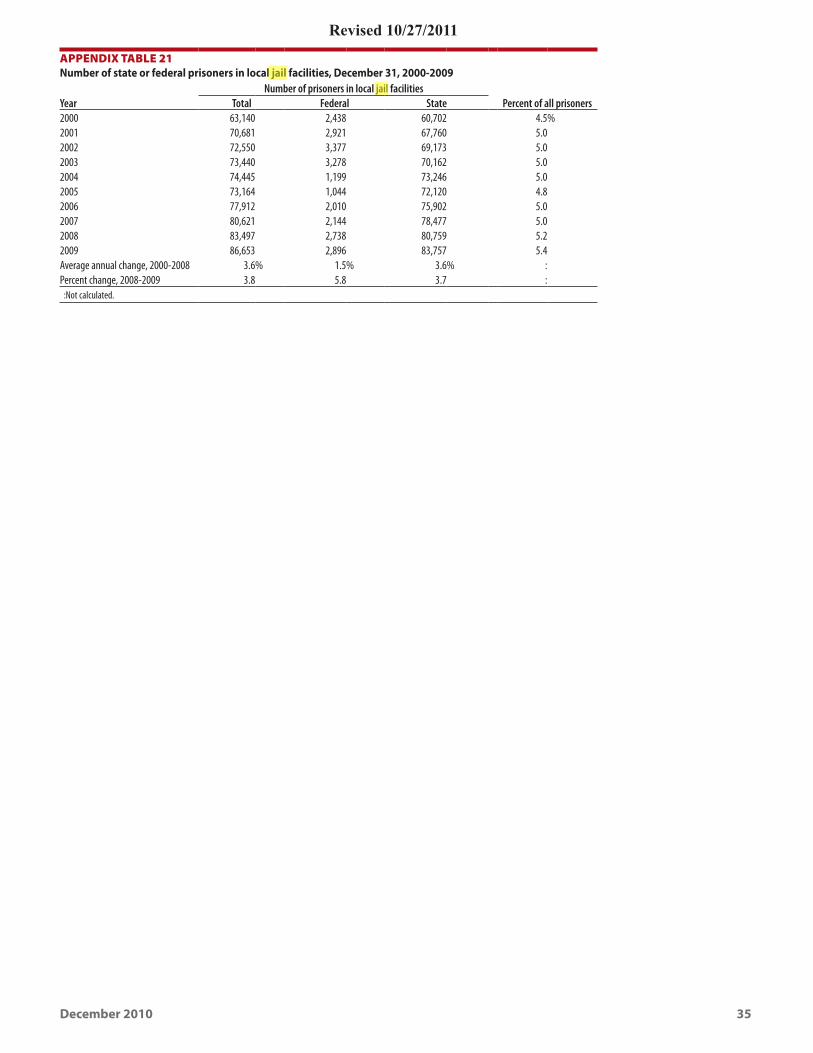
December 2010 35
appendix Table 21 Number of state or federal prisoners in local jail facilities, December 31, 2000-2009
Number of prisoners in local jail facilitiesYear Total Federal State Percent of all prisoners2000 63,140 2,438 60,702 4.5%2001 70,681 2,921 67,760 5.02002 72,550 3,377 69,173 5.02003 73,440 3,278 70,162 5.02004 74,445 1,199 73,246 5.02005 73,164 1,044 72,120 4.82006 77,912 2,010 75,902 5.02007 80,621 2,144 78,477 5.02008 83,497 2,738 80,759 5.22009 86,653 2,896 83,757 5.4Average annual change, 2000-2008 3.6% 1.5% 3.6% :Percent change, 2008-2009 3.8 5.8 3.7 :
:Not calculated.
Revised 10/27/2011
dorseyt
Highlight
dorseyt
Highlight
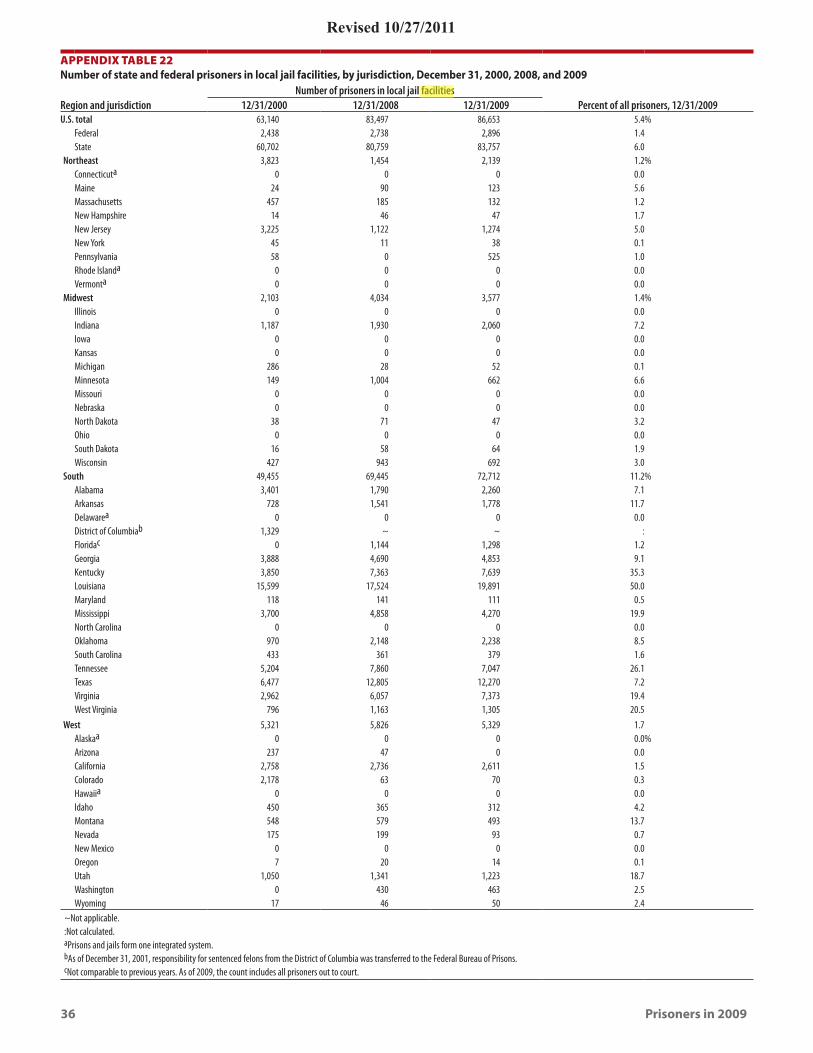
36 Prisoners in 2009
appendix Table 22 Number of state and federal prisoners in local jail facilities, by jurisdiction, December 31, 2000, 2008, and 2009
Number of prisoners in local jail facilitiesRegion and jurisdiction 12/31/2000 12/31/2008 12/31/2009 Percent of all prisoners, 12/31/2009U.S. total 63,140 83,497 86,653 5.4%
Federal 2,438 2,738 2,896 1.4State 60,702 80,759 83,757 6.0
Northeast 3,823 1,454 2,139 1.2%Connecticuta 0 0 0 0.0Maine 24 90 123 5.6Massachusetts 457 185 132 1.2New Hampshire 14 46 47 1.7New Jersey 3,225 1,122 1,274 5.0New York 45 11 38 0.1Pennsylvania 58 0 525 1.0Rhode Islanda 0 0 0 0.0Vermonta 0 0 0 0.0
Midwest 2,103 4,034 3,577 1.4%Illinois 0 0 0 0.0Indiana 1,187 1,930 2,060 7.2Iowa 0 0 0 0.0Kansas 0 0 0 0.0Michigan 286 28 52 0.1Minnesota 149 1,004 662 6.6Missouri 0 0 0 0.0Nebraska 0 0 0 0.0North Dakota 38 71 47 3.2Ohio 0 0 0 0.0South Dakota 16 58 64 1.9Wisconsin 427 943 692 3.0
South 49,455 69,445 72,712 11.2%Alabama 3,401 1,790 2,260 7.1Arkansas 728 1,541 1,778 11.7Delawarea 0 0 0 0.0District of Columbiab 1,329 ~ ~ :Floridac 0 1,144 1,298 1.2Georgia 3,888 4,690 4,853 9.1Kentucky 3,850 7,363 7,639 35.3Louisiana 15,599 17,524 19,891 50.0Maryland 118 141 111 0.5Mississippi 3,700 4,858 4,270 19.9North Carolina 0 0 0 0.0Oklahoma 970 2,148 2,238 8.5South Carolina 433 361 379 1.6Tennessee 5,204 7,860 7,047 26.1Texas 6,477 12,805 12,270 7.2Virginia 2,962 6,057 7,373 19.4West Virginia 796 1,163 1,305 20.5
West 5,321 5,826 5,329 1.7Alaskaa 0 0 0 0.0%Arizona 237 47 0 0.0California 2,758 2,736 2,611 1.5Colorado 2,178 63 70 0.3Hawaiia 0 0 0 0.0Idaho 450 365 312 4.2Montana 548 579 493 13.7Nevada 175 199 93 0.7New Mexico 0 0 0 0.0Oregon 7 20 14 0.1Utah 1,050 1,341 1,223 18.7Washington 0 430 463 2.5Wyoming 17 46 50 2.4
~Not applicable.:Not calculated.aPrisons and jails form one integrated system. bAs of December 31, 2001, responsibility for sentenced felons from the District of Columbia was transferred to the Federal Bureau of Prisons.cNot comparable to previous years. As of 2009, the count includes all prisoners out to court.
Revised 10/27/2011
dorseyt
Highlight
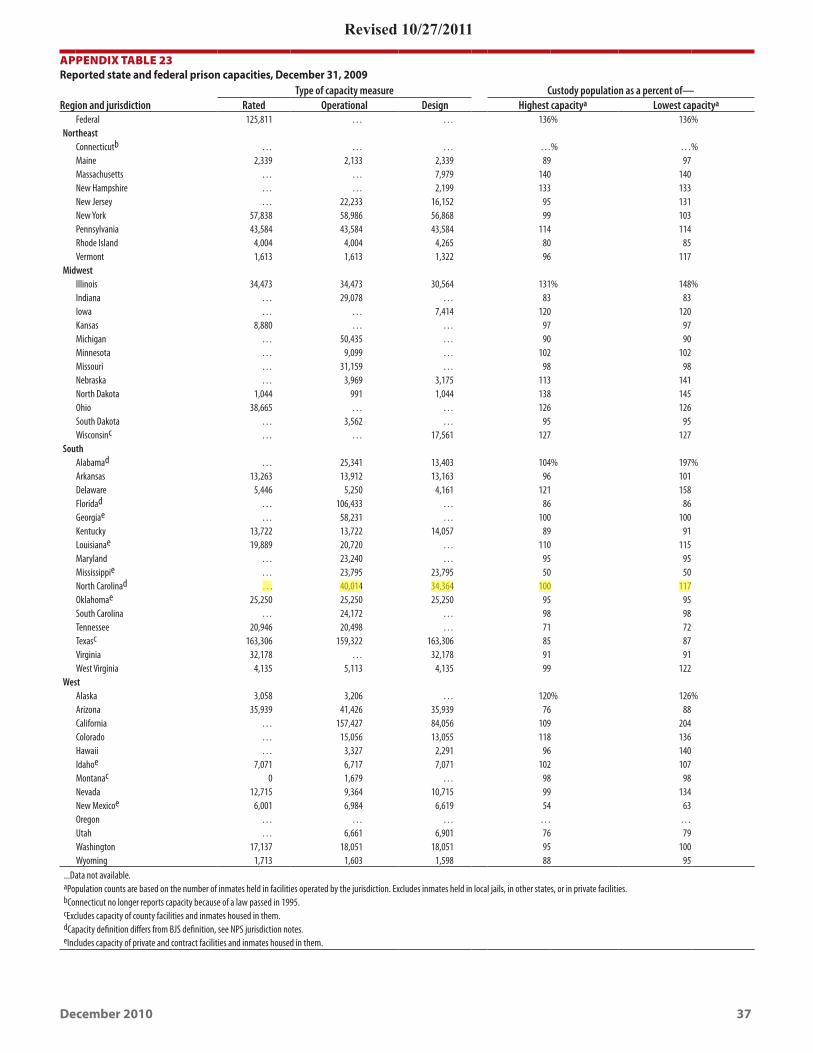
December 2010 37
appendix Table 23 Reported state and federal prison capacities, December 31, 2009
Type of capacity measure Custody population as a percent of—Region and jurisdiction Rated Operational Design Highest capacitya Lowest capacitya
Federal 125,811 … … 136% 136%Northeast
Connecticutb … … … …% …%Maine 2,339 2,133 2,339 89 97Massachusetts … … 7,979 140 140New Hampshire … … 2,199 133 133New Jersey … 22,233 16,152 95 131New York 57,838 58,986 56,868 99 103Pennsylvania 43,584 43,584 43,584 114 114Rhode Island 4,004 4,004 4,265 80 85Vermont 1,613 1,613 1,322 96 117
MidwestIllinois 34,473 34,473 30,564 131% 148%Indiana … 29,078 … 83 83Iowa … … 7,414 120 120Kansas 8,880 … … 97 97Michigan … 50,435 … 90 90Minnesota … 9,099 … 102 102Missouri … 31,159 … 98 98Nebraska … 3,969 3,175 113 141North Dakota 1,044 991 1,044 138 145Ohio 38,665 … … 126 126South Dakota … 3,562 … 95 95Wisconsinc … … 17,561 127 127
SouthAlabamad … 25,341 13,403 104% 197%Arkansas 13,263 13,912 13,163 96 101Delaware 5,446 5,250 4,161 121 158Floridad … 106,433 … 86 86Georgiae … 58,231 … 100 100Kentucky 13,722 13,722 14,057 89 91Louisianae 19,889 20,720 … 110 115Maryland … 23,240 … 95 95Mississippie … 23,795 23,795 50 50North Carolinad . . . 40,014 34,364 100 117Oklahomae 25,250 25,250 25,250 95 95South Carolina … 24,172 … 98 98Tennessee 20,946 20,498 … 71 72Texasc 163,306 159,322 163,306 85 87Virginia 32,178 … 32,178 91 91West Virginia 4,135 5,113 4,135 99 122
WestAlaska 3,058 3,206 … 120% 126%Arizona 35,939 41,426 35,939 76 88California … 157,427 84,056 109 204Colorado … 15,056 13,055 118 136Hawaii … 3,327 2,291 96 140Idahoe 7,071 6,717 7,071 102 107Montanac 0 1,679 … 98 98Nevada 12,715 9,364 10,715 99 134New Mexicoe 6,001 6,984 6,619 54 63Oregon … … … … …Utah … 6,661 6,901 76 79Washington 17,137 18,051 18,051 95 100Wyoming 1,713 1,603 1,598 88 95
...Data not available. aPopulation counts are based on the number of inmates held in facilities operated by the jurisdiction. Excludes inmates held in local jails, in other states, or in private facilities.bConnecticut no longer reports capacity because of a law passed in 1995.cExcludes capacity of county facilities and inmates housed in them.dCapacity definition differs from BJS definition, see NPS jurisdiction notes.eIncludes capacity of private and contract facilities and inmates housed in them.
Revised 10/27/2011
dorseyt
Highlight
Office of Justice Programs • Innovation • Partnerships • Safer Neighborhoods • http://www.ojp.usdoj.gov
U.S. Department of JusticeOffice of Justice ProgramsBureau of Justice Statistics
Washington, DC 20531
Official BusinessPenalty for Private Use $300
PRESORTED STANDARDPOSTAGE & FEES PAID
DOJ/BJSPermit No. G-91
ncj231675
The Bureau of Justice Statistics is the statistical agency of the U.S. Department of Justice. James P. Lynch is Director.
This Bulletin was written by Heather C. West, Ph.D, William J. Sabol, Ph.D., and Sarah J. Greenman, BJS Program Assistant. Spencer Li, BJS Statistician, contributed analyses to this report. Todd Minton and Lauren Glaze provided statistical review and verification on the report.
Joshua Giunta carried out the data collection and processing under the supervision of Steve Simoncini, Governments Division, Census Bureau, U.S. Department of Commerce.
Georgette Walsh and Jill Duncan edited the report, Barbara Quinn produced the report, and Jayne Robinson prepared the report for final printing under the supervision of Doris J. James.
December 2010, NCJ 231675
This report in portable document format and in ASCII and its related statistical data and tables are available at the BJS website: http://www.bjs.gov/index.cfm?ty=pbdetail&iid=2232.
Related Documents