A bull in the China shop? Urbanisation Rate (%) 3 China Australia 100% 90% 80% 70% 60% 50% 40% 30% 20% 10% 0% 1980 2011 Relative Performance of Capital Markets 4 Dec 09 Mar 10 Jun 10 Sep 10 Dec 10 Mar 11 Jun 11 Sep 11 Dec 11 Mar 12 Jun 12 Sep 12 USA Australia China Exchange Rates (Yuan against AUD & USD) 4 8.5 8.0 7.5 7.0 6.5 6.0 5.5 5.0 4.5 4.0 USA Australia China Nov 2003 Nov 2004 Nov 2005 Nov 2006 Nov 2007 Nov 2008 Nov 2009 Nov 2010 Nov 2011 Nov 2012 Nov 2002 The China shop scenarios 5 Scenario 1: Slowdown due to property market melt- down or financial disturbance, China GDP down 6%. Scenario 2: Recession in the advanced economies (global GDP forecast at 3 ppts below baseline). In this scenario, commodity prices would fall by 25%. Australian GDP 2.5 ppts below baseline by end of second year at which point Australia would be in technical recession. Luck As JFK said in 1964, luck is the collision of opportunity and preparation. If you haven’t already positioned your business to access the potential of Chinese growth (directly or indirectly) now is the time to consider your strategy and model the potential impact. If your business is already exposed to Chinese trade, do you have plans in place to accommodate short term reductions in volumes? Market Capitalisation ($Trillion) 4 China $13.6 USA $12.7 Australia $1.2 Sources: 1) IMF; 2) DFAT China factsheet; 3) World Bank Database; 4) Bloomberg; 5) NAB China’s significance to Australia 1 Total exports globally: $313.3B Total exports to China: $76.8B Resources $57.2 Services $5.7 Education $4.0 Personal Travel $0.7 Other $9.2 Iron ore exports to China: $43.4B Capital investment in China: $17B Australia’s significance to China (GDP $Trillion) 1 1 - USA $15.1 2 - China $7.3 3 - Japan $5.9 4 - Germany $3.6 12 - Australia $1.5 Capital investment in Australia: $19B 1 PER 14X PER 17X PER 11X

Welcome message from author
This document is posted to help you gain knowledge. Please leave a comment to let me know what you think about it! Share it to your friends and learn new things together.
Transcript
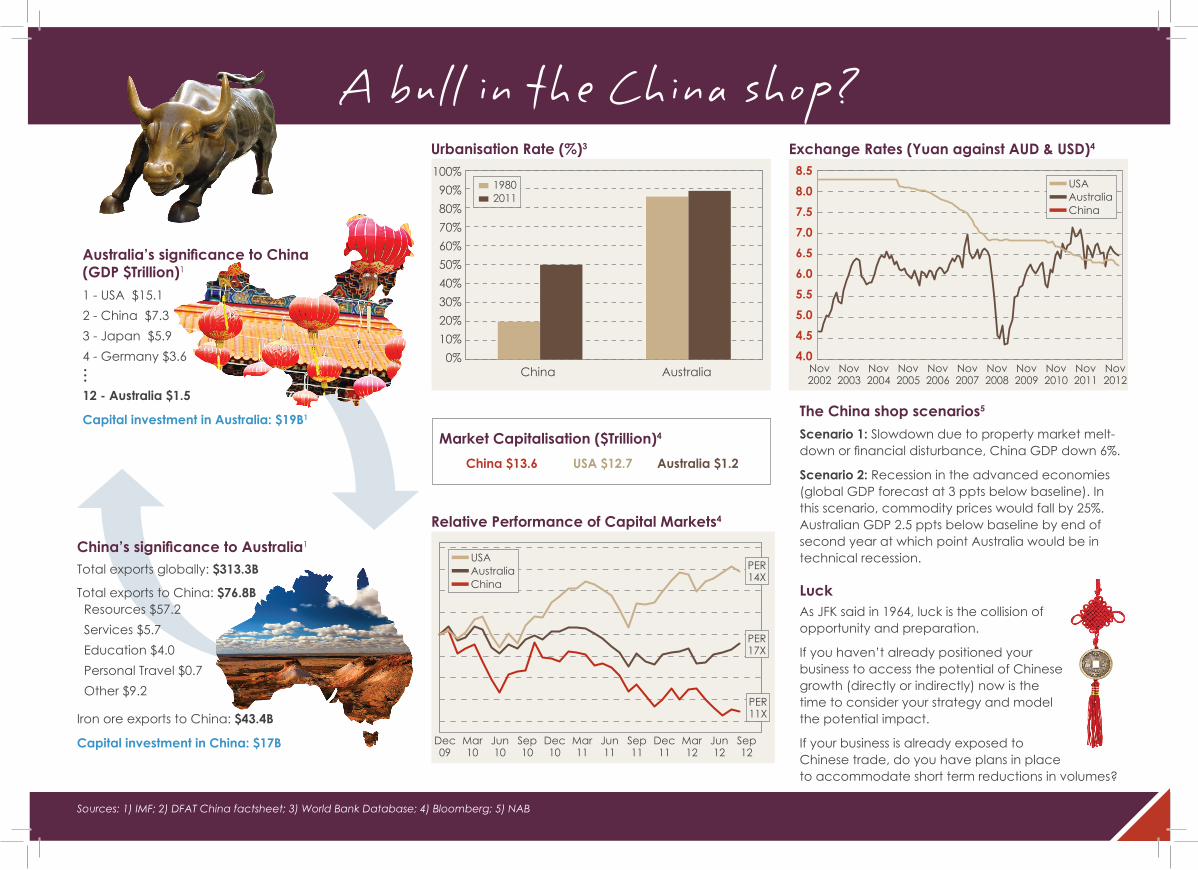
A bull in the China shop?Urbanisation Rate (%)3
China Australia
100%90%80%70%60%50%40%30%20%10%0%
19802011
Relative Performance of Capital Markets4
Dec09
Mar 10
Jun10
Sep10
Dec10
Mar11
Jun11
Sep11
Dec11
Mar12
Jun12
Sep12
USAAustraliaChina
Exchange Rates (Yuan against AUD & USD)4
8.58.07.57.06.56.05.55.04.54.0
USAAustraliaChina
Nov 2003
Nov2004
Nov2005
Nov 2006
Nov 2007
Nov 2008
Nov 2009
Nov 2010
Nov 2011
Nov 2012
Nov 2002
The China shop scenarios5
Scenario 1: Slowdown due to property market melt-down or financial disturbance, China GDP down 6%.
Scenario 2: Recession in the advanced economies (global GDP forecast at 3 ppts below baseline). In this scenario, commodity prices would fall by 25%. Australian GDP 2.5 ppts below baseline by end of second year at which point Australia would be in technical recession.
LuckAs JFK said in 1964, luck is the collision of opportunity and preparation.
If you haven’t already positioned your business to access the potential of Chinese growth (directly or indirectly) now is the time to consider your strategy and model the potential impact.
If your business is already exposed to Chinese trade, do you have plans in place to accommodate short term reductions in volumes?
Market Capitalisation ($Trillion)4
China $13.6 USA $12.7 Australia $1.2
Sources: 1) IMF; 2) DFAT China factsheet; 3) World Bank Database; 4) Bloomberg; 5) NAB
China’s significance to Australia1
Total exports globally: $313.3B
Total exports to China: $76.8B Resources $57.2 Services $5.7 Education $4.0 Personal Travel $0.7 Other $9.2
Iron ore exports to China: $43.4B
Capital investment in China: $17B
Australia’s significance to China (GDP $Trillion)1
1 - USA $15.12 - China $7.33 - Japan $5.94 - Germany $3.6
12 - Australia $1.5
Capital investment in Australia: $19B1
PER 14X
PER 17X
PER 11X
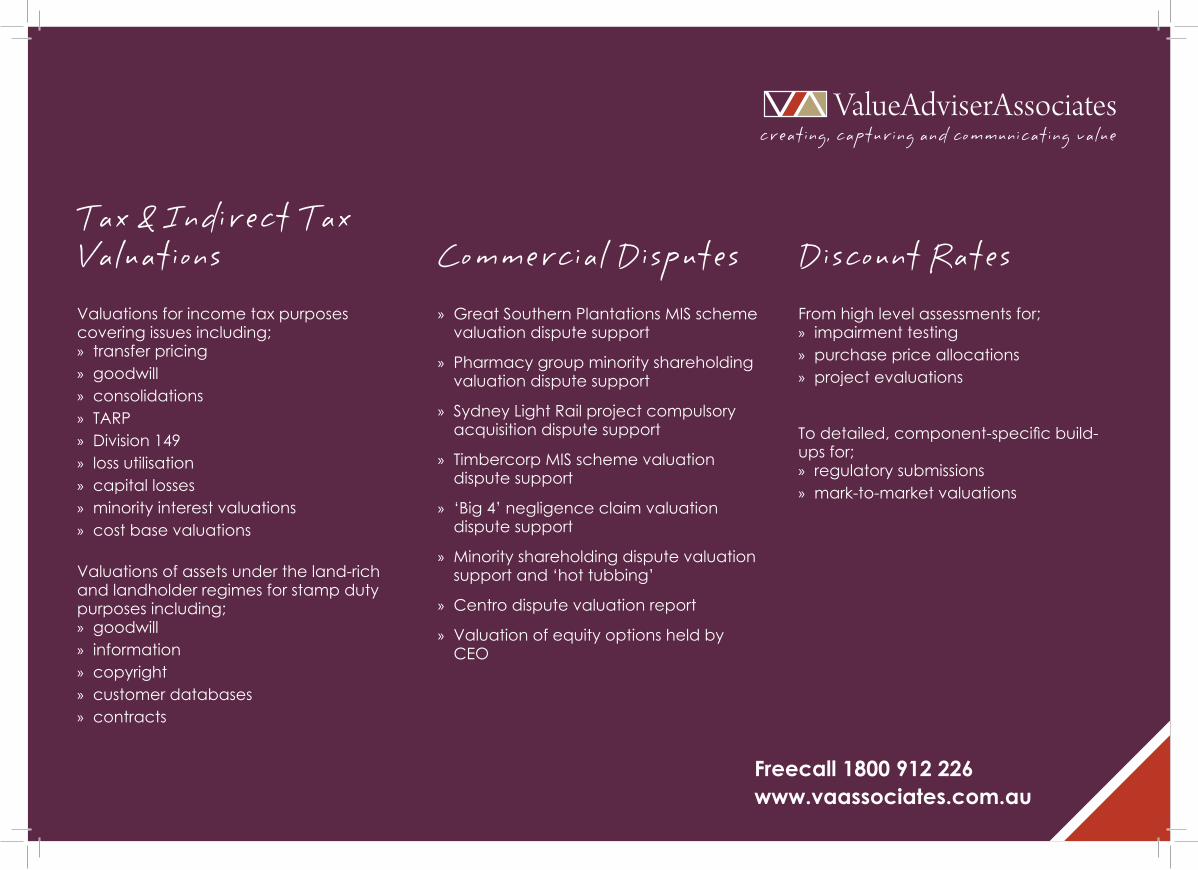
Tax & Indirect Tax ValuationsValuations for income tax purposes covering issues including; » transfer pricing » goodwill » consolidations » TARP » Division 149 » loss utilisation » capital losses » minority interest valuations » cost base valuations
Valuations of assets under the land-rich and landholder regimes for stamp duty purposes including; » goodwill » information » copyright » customer databases » contracts
» Great Southern Plantations MIS scheme valuation dispute support
» Pharmacy group minority shareholding valuation dispute support
» Sydney Light Rail project compulsory acquisition dispute support
» Timbercorp MIS scheme valuation dispute support
» ‘Big 4’ negligence claim valuation dispute support
» Minority shareholding dispute valuation support and ‘hot tubbing’
» Centro dispute valuation report
» Valuation of equity options held by CEO
Commercial Disputes Discount RatesFrom high level assessments for; » impairment testing » purchase price allocations » project evaluations
To detailed, component-specific build-ups for; » regulatory submissions » mark-to-market valuations
Freecall 1800 912 226 www.vaassociates.com.au
Related Documents