Bulk RNA-Seq Analysis on the DNAnexus platform Pet FitzGald Head Genome Analysis Unit Director of BTEP program

Welcome message from author
This document is posted to help you gain knowledge. Please leave a comment to let me know what you think about it! Share it to your friends and learn new things together.
Transcript

Bulk RNA-Seq Analysis on the DNAnexus platform
Peter FitzGerald Head Genome Analysis UnitDirector of BTEP program
RNA-Seq Week
• Make you aware of the resource
• Explain what it does
• Inputs
• Outputs
• Who should use it
• Strengths and Weaknesses
• How to access it
Specific Resource-Talk Goals
Today’s Agenda• Introduction to DNAnexus and Cloud Computing
• Introduction to Salmon - RNA-SEQ “mapping”
• RNA-Seq Workflow
• Trimming - QC
• Alignment/Mapping
• Data Exploration
• Introduction to R-Shiny - Interactive tools
• How to gain access to these tools

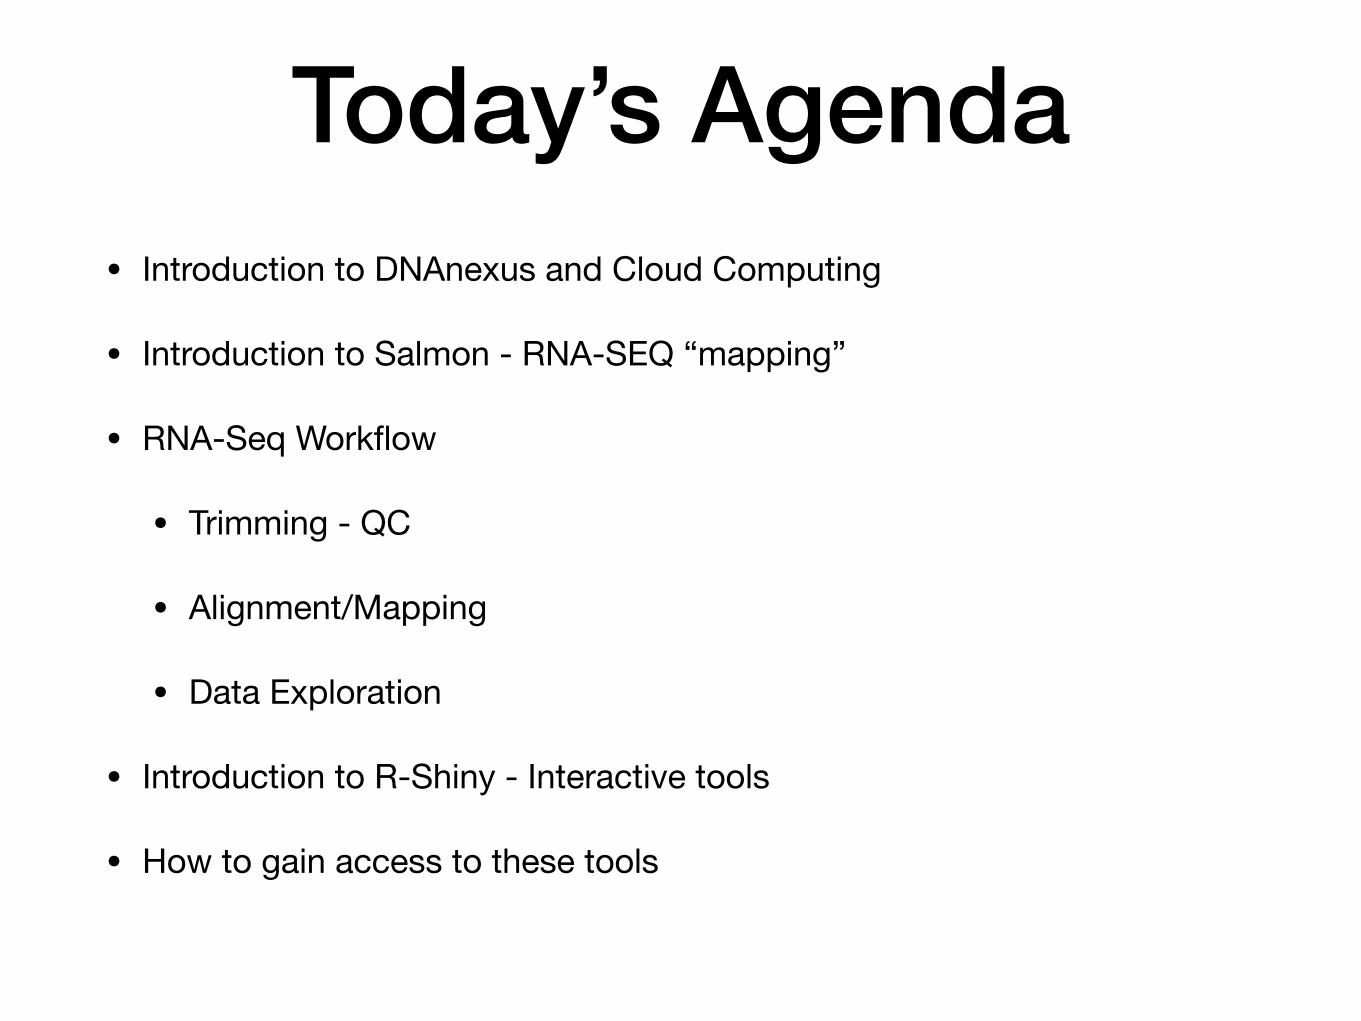
Cloud Computing made simple and safe
"DNAnexus provides a cloud-based platform optimized to address the challenges of security, scalability, and collaboration, for organizations that are pursuing genomic-based approaches to health, in the clinic and in the research lab."
Practically this equates to a Web Interface to secure Compute and Storage facilities on the Amazon Cloud (AWS) within which CCR scientist can run a variety of application for the analysis of NGS data. The typical interface is via the Web but the resources is also available through command line commands and scripts.
I believe the greatest asset of this system is that it gives researchers direct access to powerful open source tools in a controlled environment.

Key Features of DNAnexus DNAnexus provides ready access to a variety of prebuilt (by DNAnexus , local experts and other organizations) tools and workflows for the analysis of Genomic Data, within a “User friendly” Web interface.
The platform is cloud based which means there is no hardware to buy or maintain, or data to backup
Provides a ready means of sharing data, results and analytical methodology with intra and extramural colleagues
Ready access to a vast computational resource, with multiple levels of parallelism
Access to Web-based (Shiny etc) applications on dedicated “servers”
As well as a Web interface all the applications on the system can be accessed via command line instructions or scripts.
Cloud Computing
Web Interface
Command line Interface

RNA-Seq Mapping
Exon ExonExon
Genomic DNA
mRNA
cDNA (transcriptome)

Salmon
Patro, R., Duggal, G., Love, M. I., Irizarry, R. A., & Kingsford, C. (2017). Salmon provides fast and bias-aware quantification of transcript expression. Nature Methods.https://www.nature.com/articles/nmeth.4197https://combine-lab.github.io/salmon/Srivastava, A., Malik, L., Sarkar, H. et al. Alignment and mapping methodology influence transcript abundance estimation. Genome Biol 21, 239 (2020). https://doi.org/10.1186/s13059-020-02151-8
Fast, accurate and bias-aware transcript quantification from RNA-seq data
Three modes: Transcriptome only
Transcriptome + similar regions of the genome (as background/decoy)
Transcriptome + the rest of the genome (as background/decoy)
Genomes - Human, Mouse - Gencode annotation
More Accurate Faster

RNA-Seq Anaysis on DNAnexus
Trimmed QC Mapping
Data Combine
Trimming
TCC iDEPPCA-Explorer
Computation
Interactive - Shiny
More
(The DNAnexus implementation has largely been the work of Carl McIntosh)

Fastq.gz
Trimmer
Trimmed QC Mapping
Data Combine
Trimmed Fastq.gz Report
Raw Gene Raw Transcript
Gene Count Transcript Count
Report
Report
Report
Report
Salmon
RNA-Seq Workflow

Strengths and Weaknesses
It is fast and lightweight - multi stages of parallelism Does a great job generating basic expression data - gene or transcript (some argue that it is the most accurate method at the moment).
Cannot be used to look for novel splice variants (but will find annotated variants) Does not produce an alignment (bam file) and so is not readily manually verified
RNA-Seq Workflow

Inputs/Outputs
Fastq.gz files (adaptor trimmer or not)
INPUT
OUTPUT
Raw counts for gene and transcripts TPM counts for gene and transcripts Gene Matrix file (with/without filter of zero count genes) Reports
Normalized data Lists of Differentially Expressed Genes Heat Maps, MA plots, Volcano Plots etc. (Many plots are interactive) Reports
Main Workflow
Interactive Shiny Apps
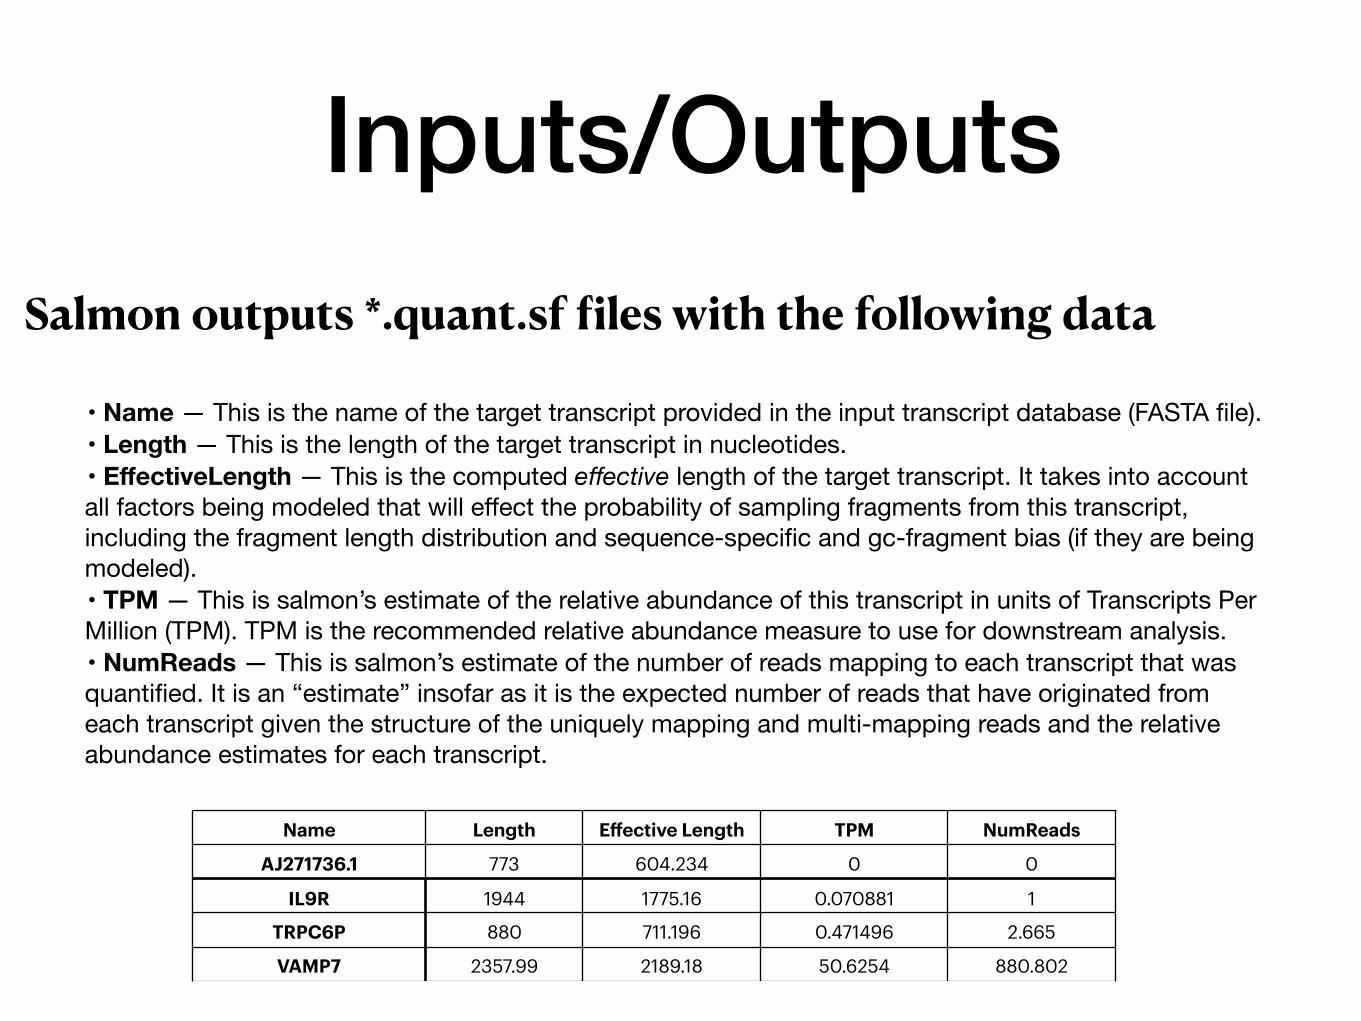
Inputs/OutputsSalmon outputs *.quant.sf files with the following data
• Name — This is the name of the target transcript provided in the input transcript database (FASTA file).• Length — This is the length of the target transcript in nucleotides.• EffectiveLength — This is the computed effective length of the target transcript. It takes into account all factors being modeled that will effect the probability of sampling fragments from this transcript, including the fragment length distribution and sequence-specific and gc-fragment bias (if they are being modeled).• TPM — This is salmon’s estimate of the relative abundance of this transcript in units of Transcripts Per Million (TPM). TPM is the recommended relative abundance measure to use for downstream analysis.• NumReads — This is salmon’s estimate of the number of reads mapping to each transcript that was quantified. It is an “estimate” insofar as it is the expected number of reads that have originated from each transcript given the structure of the uniquely mapping and multi-mapping reads and the relative abundance estimates for each transcript.
Name Length Effective Length TPM NumReads
AJ271736.1 773 604.234 0 0
IL9R 1944 1775.16 0.070881 1
TRPC6P 880 711.196 0.471496 2.665
VAMP7 2357.99 2189.18 50.6254 880.802
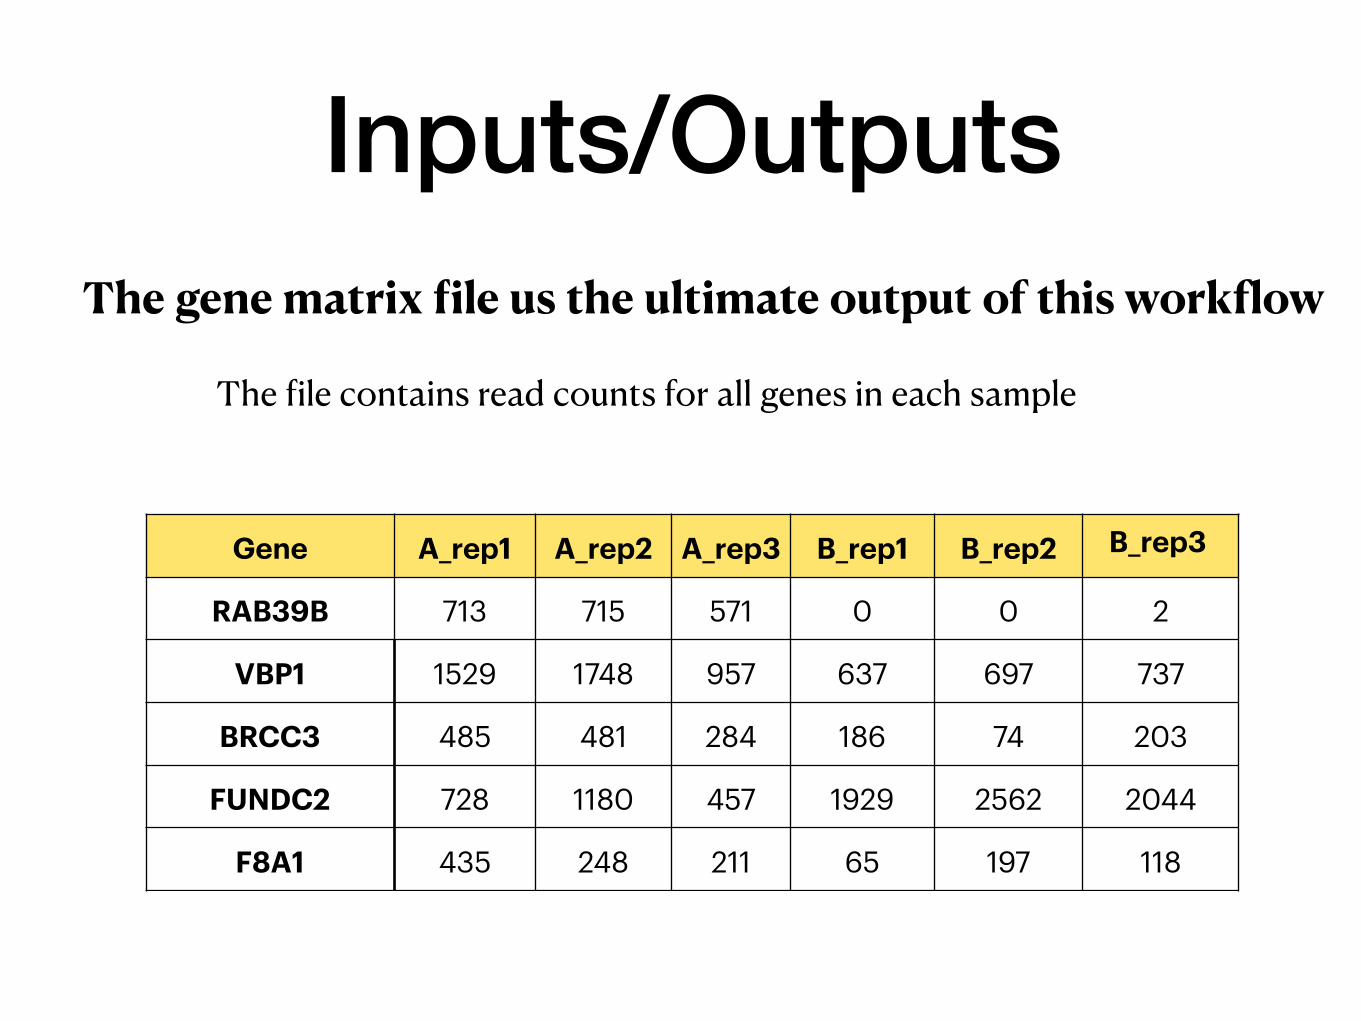
Inputs/OutputsThe gene matrix file us the ultimate output of this workflow
The file contains read counts for all genes in each sample
Gene A_rep1 A_rep2 A_rep3 B_rep1 B_rep2 B_rep3
RAB39B 713 715 571 0 0 2
VBP1 1529 1748 957 637 697 737
BRCC3 485 481 284 186 74 203
FUNDC2 728 1180 457 1929 2562 2044
F8A1 435 248 211 65 197 118
RNA-Seq Workflow Demo
FASTQ - > Count Matrix Pre-recorded

R Shiny
Shiny is an R package that makes it easy to build interactive web apps straight from R.
Shiny provides access to many R tools via simple to use Graphic User interfaces
DNAnexus provides the means of running R Shiny apps on a dedicated server (made available on demand) without the hassle of
worrying about installation, dependencies or coding.
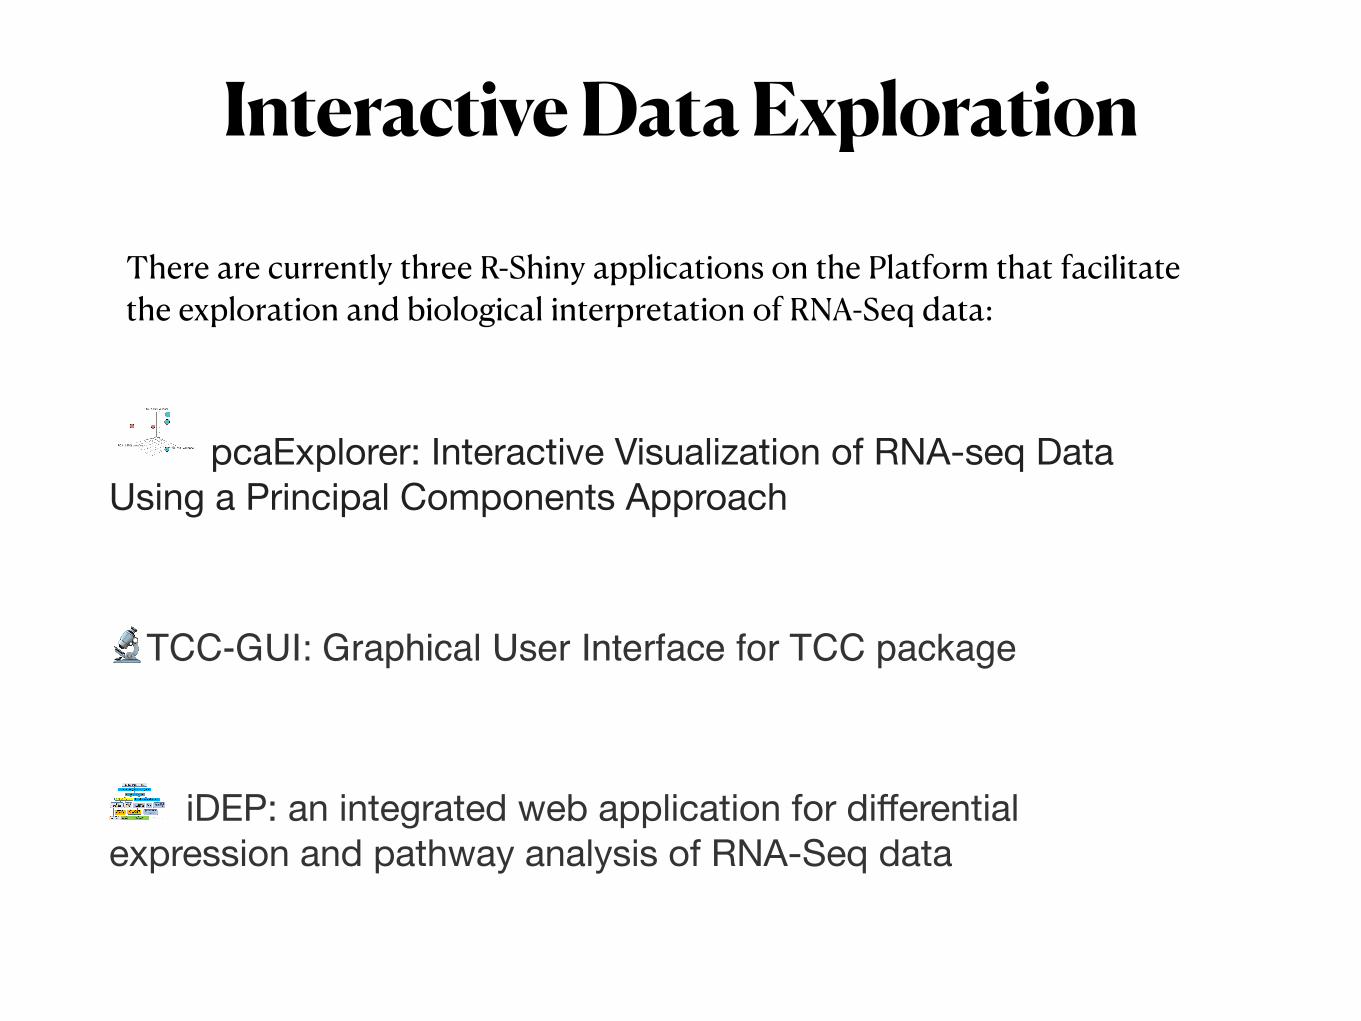
Interactive Data Exploration
There are currently three R-Shiny applications on the Platform that facilitate the exploration and biological interpretation of RNA-Seq data:
🔬TCC-GUI: Graphical User Interface for TCC package
pcaExplorer: Interactive Visualization of RNA-seq Data Using a Principal Components Approach
iDEP: an integrated web application for differential expression and pathway analysis of RNA-Seq data

Marini, F., Binder, H. pcaExplorer: an R/Bioconductor package for interacting with RNA-seq principal components. BMC Bioinformatics 20, 331 (2019). https://doi.org/10.1186/s12859-019-2879-1
pcaExplorer: Interactive Visualization of RNA-seq Data Using a Principal Components Approach This package provides functionality for interactive visualization of RNA-seq datasets based on Principal Components Analysis. The methods provided allow for quick information extraction and effective data exploration. A Shiny application encapsulates the whole analysis.
pcaExplorer
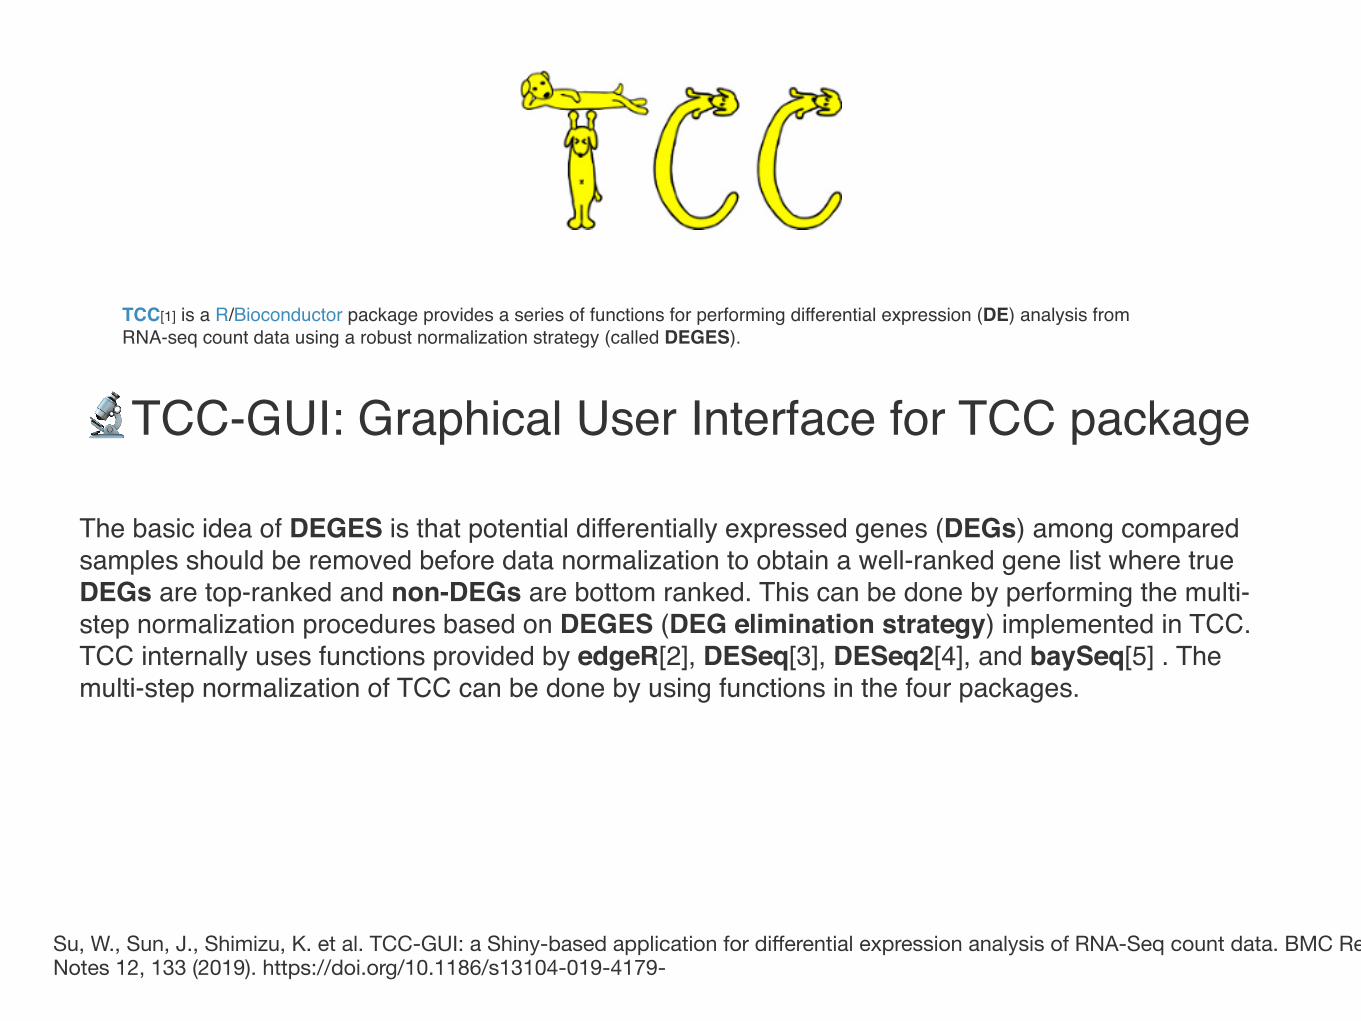
Su, W., Sun, J., Shimizu, K. et al. TCC-GUI: a Shiny-based application for differential expression analysis of RNA-Seq count data. BMC Res Notes 12, 133 (2019). https://doi.org/10.1186/s13104-019-4179-
TCC[1] is a R/Bioconductor package provides a series of functions for performing differential expression (DE) analysis from RNA-seq count data using a robust normalization strategy (called DEGES).
The basic idea of DEGES is that potential differentially expressed genes (DEGs) among compared samples should be removed before data normalization to obtain a well-ranked gene list where true DEGs are top-ranked and non-DEGs are bottom ranked. This can be done by performing the multi-step normalization procedures based on DEGES (DEG elimination strategy) implemented in TCC.TCC internally uses functions provided by edgeR[2], DESeq[3], DESeq2[4], and baySeq[5] . The multi-step normalization of TCC can be done by using functions in the four packages.
🔬TCC-GUI: Graphical User Interface for TCC package
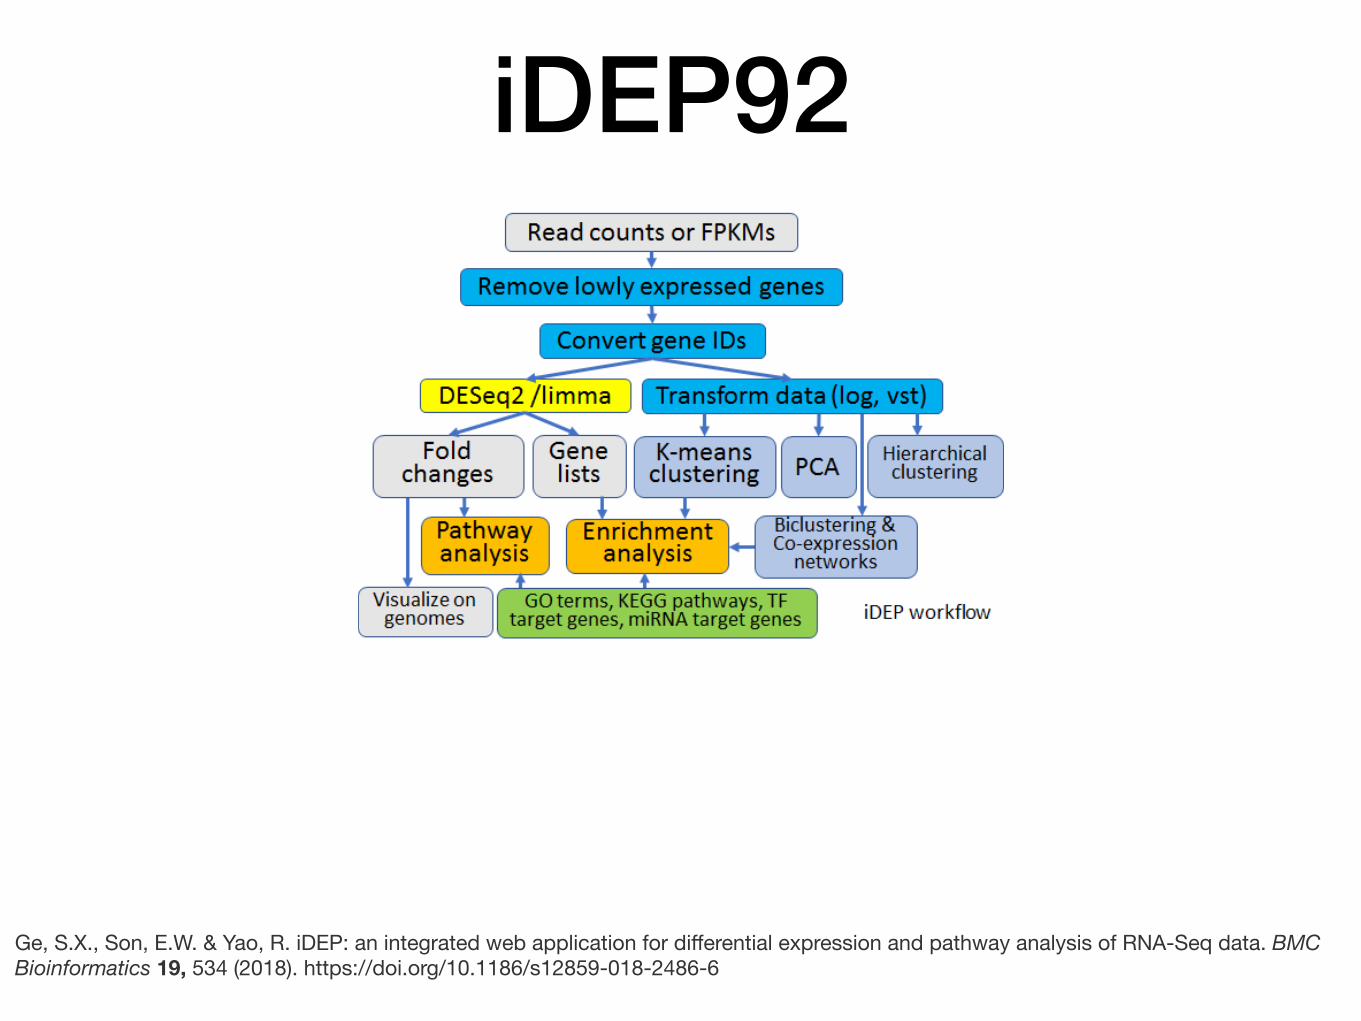
iDEP92
Ge, S.X., Son, E.W. & Yao, R. iDEP: an integrated web application for differential expression and pathway analysis of RNA-Seq data. BMC Bioinformatics 19, 534 (2018). https://doi.org/10.1186/s12859-018-2486-6

Strengths and Weaknesses
Great for exploring the data and or parameter choice effects. Generate interactive graphics Generate multipage reports Can quickly provide biological inside Great for pilot experiments
Not the best for reproducible science Slow startup Finite lifetime and Shiny inactive state termination… not the best for interrupted work
Shiny Apps
RNA-Seq Workflow Demo
Interactive DEG Apps Pre-recorded

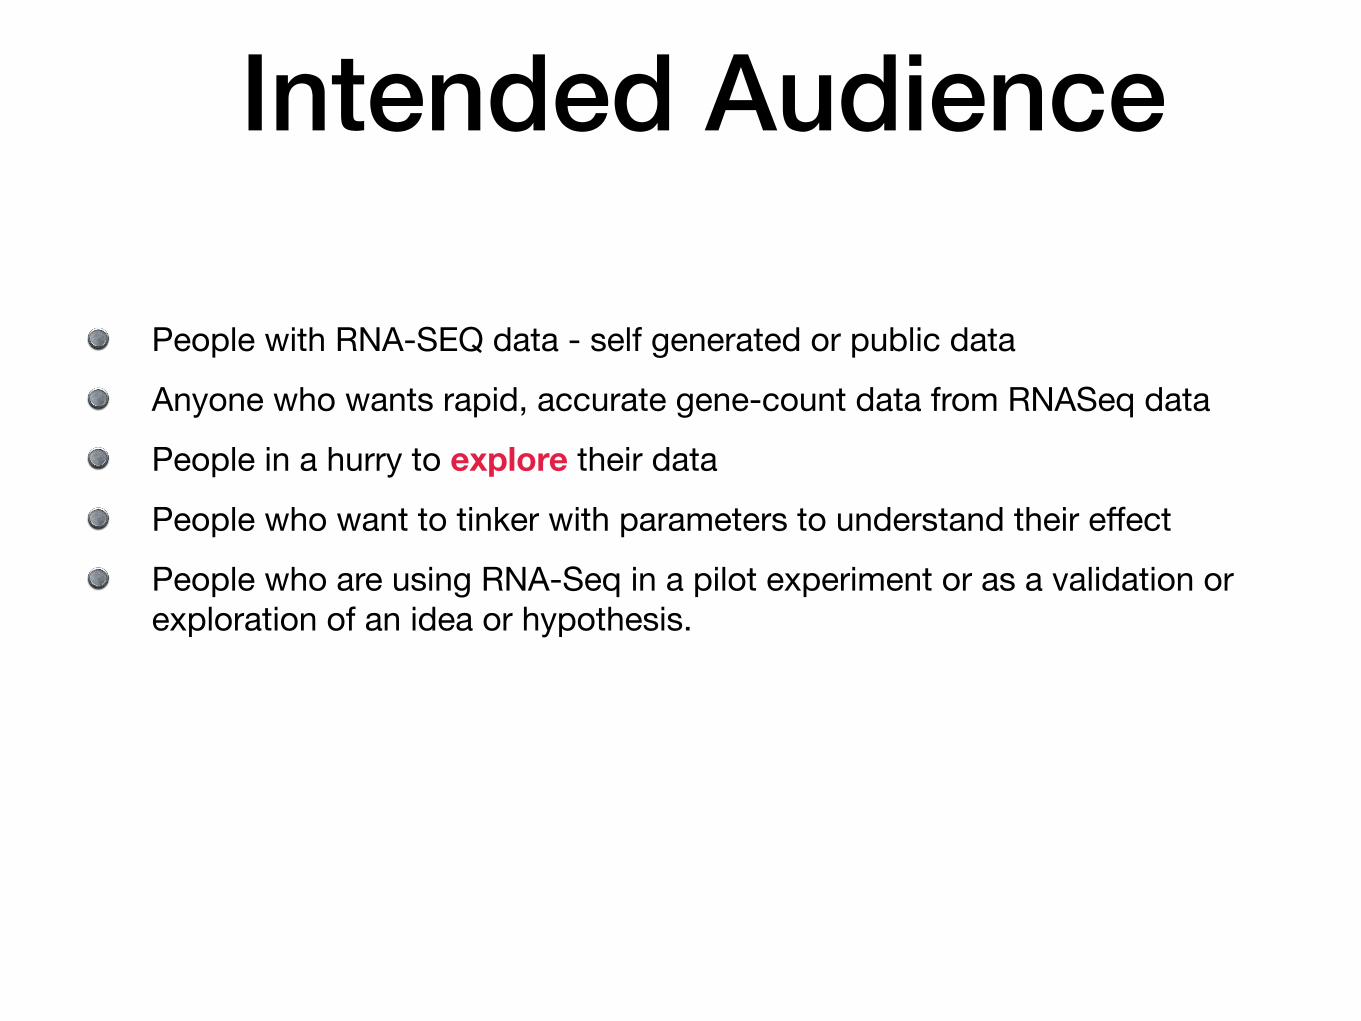
Intended Audience
People with RNA-SEQ data - self generated or public data
Anyone who wants rapid, accurate gene-count data from RNASeq data
People in a hurry to explore their data
People who want to tinker with parameters to understand their effect
People who are using RNA-Seq in a pilot experiment or as a validation or exploration of an idea or hypothesis.

How to Access DNAnexus
CCR has a group license for DNAnexus and is currently funding all reasonable projects
If interested in pursuing the use of this platform send email to:
Peter Fitzgerald [email protected]
DNAnexus also host many different NGS workflows, including many custom built analysis packages for select tasks
Related Documents