RESEARCH ARTICLE Building the Foundation for International Conservation Planning for Breeding Ducks across the U.S. and Canadian Border Kevin E. Doherty 1 *, Jeffrey S. Evans 2 , Johann Walker 3 , James H. Devries 4 , David W. Howerter 4 1 United States Fish & Wildlife Service, 134 Union Blvd, Lakewood, Colorado, United States of America, 2 The Nature Conservancy, Fort Collins, CO, 80524, United States of America & Department of Zoology and Physiology, University of Wyoming, Laramie, WY, 82071, United States of America, 3 Ducks Unlimited, Great Plains Region, 2525 River Road, Bismarck, North Dakota, United States of America, 4 Institute for Wetland and Waterfowl Research, Ducks Unlimited Canada, P.O. Box 1160 Stonewall, Manitoba, Canada * [email protected] Abstract We used publically available data on duck breeding distribution and recently compiled geos- patial data on upland habitat and environmental conditions to develop a spatially explicit model of breeding duck populations across the entire Prairie Pothole Region (PPR). Our spatial population models were able to identify key areas for duck conservation across the PPR and predict between 62.1 – 79.1% (68.4% avg.) of the variation in duck counts by year from 2002 – 2010. The median difference in observed vs. predicted duck counts at a tran- sect segment level was 4.6 ducks. Our models are the first seamless spatially explicit mod- els of waterfowl abundance across the entire PPR and represent an initial step toward joint conservation planning between Prairie Pothole and Prairie Habitat Joint Ventures. Our work demonstrates that when spatial and temporal variation for highly mobile birds is incorporat- ed into conservation planning it will likely increase the habitat area required to support de- fined population goals. A major goal of the current North American Waterfowl Management Plan and subsequent action plan is the linking of harvest and habitat management. We con- tend incorporation of spatial aspects will increase the likelihood of coherent joint harvest and habitat management decisions. Our results show at a minimum, it is possible to pro- duce spatially explicit waterfowl abundance models that when summed across survey strata will produce similar strata level population estimates as the design-based Waterfowl Breed- ing Pair and Habitat Survey (r 2 = 0.977). This is important because these design-based pop- ulation estimates are currently used to set duck harvest regulations and to set duck population and habitat goals for the North American Waterfowl Management Plan. We hope this effort generates discussion on the important linkages between spatial and temporal var- iation in population size, and distribution relative to habitat quantity and quality when linking habitat and population goals across this important region. PLOS ONE | DOI:10.1371/journal.pone.0116735 February 25, 2015 1 / 23 OPEN ACCESS Citation: Doherty KE, Evans JS, Walker J, Devries JH, Howerter DW (2015) Building the Foundation for International Conservation Planning for Breeding Ducks across the U.S. and Canadian Border. PLoS ONE 10(2): e0116735. doi:10.1371/journal. pone.0116735 Academic Editor: Grant Ballard, Point Blue Conservation Science, UNITED STATES Received: November 18, 2013 Accepted: December 14, 2014 Published: February 25, 2015 Copyright: This is an open access article, free of all copyright, and may be freely reproduced, distributed, transmitted, modified, built upon, or otherwise used by anyone for any lawful purpose. The work is made available under the Creative Commons CC0 public domain dedication. Funding: Funding for this research came from the United States Fish & Wildlife Service, Ducks Unlimited, and Ducks Unlimited Canada. The funders had no role in study design, data collection and analysis, decision to publish, or preparation of the manuscript. Competing Interests: The authors have declared that no competing interests exist.

Welcome message from author
This document is posted to help you gain knowledge. Please leave a comment to let me know what you think about it! Share it to your friends and learn new things together.
Transcript
RESEARCH ARTICLE
Building the Foundation for InternationalConservation Planning for Breeding Ducksacross the U.S. and Canadian BorderKevin E. Doherty1*, Jeffrey S. Evans2, JohannWalker3, James H. Devries4, DavidW. Howerter4
1 United States Fish &Wildlife Service, 134 Union Blvd, Lakewood, Colorado, United States of America, 2The Nature Conservancy, Fort Collins, CO, 80524, United States of America & Department of Zoology andPhysiology, University of Wyoming, Laramie, WY, 82071, United States of America, 3 Ducks Unlimited,Great Plains Region, 2525 River Road, Bismarck, North Dakota, United States of America, 4 Institute forWetland andWaterfowl Research, Ducks Unlimited Canada, P.O. Box 1160 Stonewall, Manitoba, Canada
AbstractWe used publically available data on duck breeding distribution and recently compiled geos-
patial data on upland habitat and environmental conditions to develop a spatially explicit
model of breeding duck populations across the entire Prairie Pothole Region (PPR). Our
spatial population models were able to identify key areas for duck conservation across the
PPR and predict between 62.1 – 79.1% (68.4% avg.) of the variation in duck counts by year
from 2002 – 2010. The median difference in observed vs. predicted duck counts at a tran-
sect segment level was 4.6 ducks. Our models are the first seamless spatially explicit mod-
els of waterfowl abundance across the entire PPR and represent an initial step toward joint
conservation planning between Prairie Pothole and Prairie Habitat Joint Ventures. Our work
demonstrates that when spatial and temporal variation for highly mobile birds is incorporat-
ed into conservation planning it will likely increase the habitat area required to support de-
fined population goals. A major goal of the current North American Waterfowl Management
Plan and subsequent action plan is the linking of harvest and habitat management. We con-
tend incorporation of spatial aspects will increase the likelihood of coherent joint harvest
and habitat management decisions. Our results show at a minimum, it is possible to pro-
duce spatially explicit waterfowl abundance models that when summed across survey strata
will produce similar strata level population estimates as the design-based Waterfowl Breed-
ing Pair and Habitat Survey (r2 = 0.977). This is important because these design-based pop-
ulation estimates are currently used to set duck harvest regulations and to set duck
population and habitat goals for the North American Waterfowl Management Plan. We hope
this effort generates discussion on the important linkages between spatial and temporal var-
iation in population size, and distribution relative to habitat quantity and quality when linking
habitat and population goals across this important region.
PLOS ONE | DOI:10.1371/journal.pone.0116735 February 25, 2015 1 / 23
OPEN ACCESS
Citation: Doherty KE, Evans JS, Walker J, DevriesJH, Howerter DW (2015) Building the Foundation forInternational Conservation Planning for BreedingDucks across the U.S. and Canadian Border. PLoSONE 10(2): e0116735. doi:10.1371/journal.pone.0116735
Academic Editor: Grant Ballard, Point BlueConservation Science, UNITED STATES
Received: November 18, 2013
Accepted: December 14, 2014
Published: February 25, 2015
Copyright: This is an open access article, free of allcopyright, and may be freely reproduced, distributed,transmitted, modified, built upon, or otherwise usedby anyone for any lawful purpose. The work is madeavailable under the Creative Commons CC0 publicdomain dedication.
Funding: Funding for this research came from theUnited States Fish & Wildlife Service, DucksUnlimited, and Ducks Unlimited Canada. The fundershad no role in study design, data collection andanalysis, decision to publish, or preparation of themanuscript.
Competing Interests: The authors have declaredthat no competing interests exist.

IntroductionLocated in the interior of North America, the Prairie Pothole Region (PPR) is a unique wet-land-grassland ecosystem [1] known for large populations of migratory birds including water-fowl [2,3], waterbirds [4,5], shorebirds [6], and grassland birds [7]. The PPR is named for themillions of depressional wetlands called “prairie potholes” dispersed throughout the landscape.The vast area of the PPR ecosystem and high density of wetland basins exceeding 40/km2 insome areas [8], makes the PPR region globally unique. Besides their critical importance tobirds, remaining wetlands and grasslands in the PPR provide vital habitat for a diverse array ofplant and animal species, including mammals [9], fishes [10], amphibians [11], and a variety ofinvertebrates [12]. This area also provides critical habitat for a number of threatened andendangered species.
Grasslands and wetlands within the PPR, especially the eastern PPR, are some of the mostaltered landscapes in the world because much of the land is privately owned, is productive ascropland, and is relatively easy to cultivate [13]. Conversion of the grasslands and wetlands forcrop production continues [14–18]. Because of its vital importance to waterfowl and ongoinglosses in both wetlands and grasslands, the North American Waterfowl Management Plan(NAWMP) identified the Prairie Pothole Region (PPR) as the continent’s top priority for wa-terfowl conservation. The Prairie Habitat Joint Venture (PHJV; Canadian PPR) and the PrairiePothole Joint Venture (PPJV; U.S. PPR) were established by NAWMP in 1987 as 2 of the origi-nal 6 joint ventures to protect and restore critical waterfowl habitats [19] in this region. ThePHJV and the PPJV are largely the same ecosystem, thus they share populations of migratoryspecies whose populations fluctuate across the border depending on habitat conditions[18].Lack of unified data layers and conservation planning tools has limited international conserva-tion planning efforts between these groups in the past.
Development and evaluation of goals is fundamental in the adaptive management of wildlifepopulations and their habitat [20]. To evaluate the effectiveness of PHJV and PPJV efforts inconserving the habitat required to support waterfowl population goals, paradigms of popula-tion and habitat management must be linked. Historically, these paradigms have operated inisolation in part because of the regional and continental scales at which they have operated.Population management has generally addressed concerns about how many, while habitatmanagement has generally concerned itself with issues of how much and where. Further, issuesregarding how often habitat conditions will be conducive to waterfowl settling have emergedwith respect to climate effects. These differences can confound management plans as well asthe evaluation of those plans’ goals. For example, population goals derived from sample theoryare largely an aspatial process generated from design-based surveys within a specific boundarysuch as a Joint Venture administrative boundary or a Bird Conservation Region [21]. Estimat-ing population sizes and understanding population trends provides metrics to monitor wildlifepopulations and alert managers to species in need of conservation attention [22], thus surveysprovide clear value. However, habitat losses [17,18], conservation planning [23,24], and ulti-mately delivery of habitat conservation programs to support bird populations [25] are inher-ently spatial processes which are conducted at finer scales than a JV or Bird ConservationRegion Boundary. This disconnect in scale must be overcome to evaluate population goalsfrom habitat management plans in light of habitat trends and local-scale habitat conservationdecisions. The simplest first step towards integrating population and habitat goals is to under-stand the biological linkages between populations and habitat across broad spatial scales usingdata which is foundational to the management of the species. Subsequent steps can then in-volve estimating the interaction of local populations, habitats, and key vital rates in eachregion.
International Conservation Planning for Ducks
PLOS ONE | DOI:10.1371/journal.pone.0116735 February 25, 2015 2 / 23

Further complicating evaluation of PPJV and PHJV habitat goals is climatic variability inboth space and time. Climatic conditions in the PPR are characterized by substantial spatialand temporal variation in precipitation [26,27]. This variability influences the number of wet-land basins containing ponded water each year (ponds), water levels within those ponds, andabundance of wetland-associated wildlife. Pond numbers and associated ecological functionsvary during wet/dry precipitation cycles. Many species of wildlife are adapted to this variableenvironment and respond to wetland conditions and precipitation-driven grass conditions bychanges in distribution and abundance [5,7]. Thus, the stability of the PPR system is largelyachieved through its vast expanse and species that have evolved mechanisms (e.g., high vagility,drought tolerance) to cope with variable conditions over space and time. Periodic drying ofwetlands maintains the productivity of prairie wetlands by accelerating nutrient cycling and al-lowing seeds of annual plants to germinate [28]. Consequently, environmental variation in thePPR drives ecosystem productivity and carrying capacity for migratory birds, but also compli-cates conservation planning because abundance and density of birds within localized land-scapes fluctuate among years.
To facilitate joint conservation planning that accounts for broad ecosystem variability andchange, and to evaluate the attainability of NAWMP population goals, the PPJV and PHJVneed common planning tools. We used Waterfowl Breeding Pair and Habitat Survey datawhich is used to estimate the breeding population of ducks (BPOP) and recently developedgeospatial data on upland habitat and environmental conditions to develop a spatially explicitmodel of breeding duck populations across the entire PPR. We had 3 main objectives for thiseffort: 1) Create a seamless spatially explicit conservation planning tool across the PPJV &PHJV which will allow us to bring international partners together to discuss coordinated ac-tions and joint identification of key areas for duck conservation, 2) Generate a simple exampleof the importance of spatial heterogeneity and temporal variability in populations to generatediscussion on importance of how many, how often, how much, and where in linking habitatand population goals at a continental scale, and, 3) Test if spatially explicit models of waterfowldistribution produce similar results to stratum-level population estimates. We felt the latterwas important because stratum-level population estimates provide the basis for waterfowl har-vest regulations and stepped-down population goals for individual Joint Ventures throughNAWMP.
Methods
Study AreaThe PPR straddles the U.S./Canada border and encompasses> 770,000 km2 (>297,000 squaremiles) including parts of 5 U.S. states: northern Montana, northern and eastern North Dakota,eastern South Dakota, western Minnesota, and north-central Iowa; and 3 Canadian provinces:southwestern Manitoba, southern Saskatchewan and southern Alberta. For this pilot projectwe restricted our analysis to that portion of the PPR that falls within the BPOP traditional sur-vey area (Fig. 1).
Waterfowl Population DataBreeding ducks have been counted along aerial transects annually since 1955. This survey is thelongest-running dataset on the status of any group of wildlife species in the world [1] and hasproduced insight into both ecology [29] and wildlife management [30]. The traditional surveycovers approximately 3.4 million km2 with transects flown throughout most of the duck breed-ing habitat in the northern United States and much of Canada [1]. Information from this sur-vey is the primary consideration when hunting regulations are established through the
International Conservation Planning for Ducks
PLOS ONE | DOI:10.1371/journal.pone.0116735 February 25, 2015 3 / 23

Fig 1. Location of the Prairie Pothole Region (PPR) of the U.S. and Canada.Ecoregions within the PPR are shown at their coarsest delineations to providecontext for the settling patterns of 5 species of dabbling ducks across the traditional Waterfowl Breeding Population and Habitat Survey (BPOP) areas in thePrairie Pothole Region during 2002–2010. These species included; blue-winged teal (Anas discors), gadwall (A. strepera), mallard (A. platyrhynchos), northernpintail (A. acuta), and northern shoveler (A. clypeata). In this pilot effort, we only modeled areas within the traditional BPOP survey area within the PPJV & PHJVboundaries. Stratum boundaries and transect centroids show the spatial distribution of the BPOP survey population data which was linked to GIS basedhabitat variables.
doi:10.1371/journal.pone.0116735.g001
International Conservation Planning for Ducks
PLOS ONE | DOI:10.1371/journal.pone.0116735 February 25, 2015 4 / 23

international regulatory process within the flyway council system. The total BPOP survey areais split into strata, which are the units at which individual duck species populations are estimat-ed by the USFWS Division of Migratory Bird Management (Fig. 1). Within strata, numeroussystematically spaced east-west transects are flown with fixed-wing aircraft at 30–45 m aboveground level and all ducks within 200 meters on both sides of transects are counted by the pilotand an aerial observer [31]. Each transect is further divided into segments that average approx-imately 29-km in length (*18 miles; Fig. 1). Aerial counts are compared to simultaneousground counts on a subset of survey segments within each strata to estimate detection probabil-ity for each stratum [31]. We modeled total pairs of ducks counted within a segment to developour spatially explicit statistical models of the abundance of breeding ducks across the PPR.Total pairs included both indicated pairs (i.e. isolated lone drakes) and pairs (both male and fe-male in close proximity). We corrected counts for detection probability by multiplying totalcounted pairs within a segment by the corresponding stratum level visibility correction factor(VCF). Only segments entirely within the PPR boundary with GIS-based habitat coverage wereincluded in our analysis. Duck counts are publicly available and were downloaded from theUSFWS Division of Migratory Bird Management Migratory Bird Data Center [32].
Our response variable was the sum of 5 species of dabbling duck pairs within each segmentwithin each year from 2002–2010. These species included; blue-winged teal (Anas discors), gad-wall (A. strepera), mallard (A. platyrhynchos), northern pintail (A. acuta), and northern shovel-er (A. clypeata). We chose these species because they are the most abundant and widelydistributed breeding duck species in the PPR. We chose to lump these species because existingwaterfowl conservation planning tools within the PPJV and PHJV use the sum of these 5 spe-cies as the primary determinant of waterfowl conservation priority areas. The abundance andwide distribution of these species across the PPR makes them suitable for modeling species-habitat relationships because we were able to sample different population densities across awide range of habitat conditions in the PPR. This minimizes the probability of encounteringnovel landscape conditions and their associated challenges in habitat modeling [33,34].
The spatial extent at which we modeled abundances (i.e. the entire PPR), and the resolutionat which we modeled population response to habitat selection (11 km2 scale) were chosen tomatch our study objectives. Our modeling efforts represent an intermediate level of habitat se-lection between the geographic range of the species in our analysis and individual home ranges[35]. This level of selection demonstrates variation in population density across broad regionalscales [35,36]. We chose this scale because our goal was to develop an ecosystem-wide modeland it closely matches regional scales at which habitat programs are delivered in the PPJV andPHJV.
Predictor VariablesWe selected predictor variables based on their demonstrated or hypothesized linkage toabundance and distribution of the study species. We calculated values of each predictor with-in the*11 km2 survey segment using publicly available geospatial data and standard tools inArcGIS software. Native pixel resolution varied amoung predictor variables (Table 1), howeverin all cases we characterized habitat at a* 11 km2 scale. We did this by up or down-samplingall rasters so they aligned with our 400 m2 sample grid. We then used a moving window tocharacterize habitat conditions at a* 11 km2 scale area around each sample grid. Predictorvariables described wetland characteristics, drought status, topography, climate, landuse-land-cover, and primary productivity of vegetation across the study area. We separated predictorsinto 2 groups: 1) predictors with established relationships to abundance and distribution ofbreeding ducks or wetlands containing ponded water, which is a strong correlate of breeding
International Conservation Planning for Ducks
PLOS ONE | DOI:10.1371/journal.pone.0116735 February 25, 2015 5 / 23

Table 1. Description of the explanatory variables used to predict the abundance of count of 5 species of dabbling ducks within a * 11 km2scale within the Prairie Pothole Region of the U.S. and Canada during 2002–2010.
Predictorgroup
Name Abbreviation Source(years)
Nativeresolution
Resampledresolution
Description Justification [references]
Established Wetland count NA NWI (1985),CanVec,DUC
Polygon 0.16 km2 number of wetlandbasins
Established positive relationshipbetween breeding duckabundance and pondabundance [3,41,42]
Wetland area NA NWI (1985),Can Vec,DUC
Polygon 0.16 km2 total area of wetlandbasins
Established positive relationshipbetween breeding duckabundance and pondabundance [3,41,42]
Ponds Pondst, t-1, t-2 BPOP(2002–2009)
11 km2 0.16 km2 year-specific numberof wetland basinscontaining pondedwater
Established positive relationshipbetween breeding duckabundance and pondabundance in the PPR [3,41,42]
NormalizedDifferenceWetness Index
NDWIt, NASAEODPMODIS(2002–2009)
1.00 km2 0.16 km2 year-specifichydrologic state ofwetland basins, soil,and vegetation
Established positive relationshipbetween pond abundance andprecipitation [12,27–29]
Palmer DroughtSeverity Index
PDSI t-1, t-2 NIDIS 30,625 km2 0.16 km2 year-specific droughtstatus
Established negativerelationship between pondabundance and drought [12,27–29]
Exploratory Topographicvariation
SRTM_CV NASASRTM
0.009 km1 0.16 km2 variation in elevation Hypothesized positiverelationship between breedingduck abundance andreproductive success andtopographic variation
Degree daysgreater than 5 C
DD5 USFS(1961–1990) [48]
1.00 km2 0.16 km2 degree days greaterthan 5 C
Hypothesized relationshipbetween breeding duckabundance and reproductivesuccess and land use mediatedby climate [18,46,47]
Annual moistureindex
AMI USFS(1961–1990) [48]
1.00 km2 0.16 km2 ratio of degree daysgreater than 5 C tomean annualprecipitation
Hypothesized relationshipbetween breeding duckabundance and reproductivesuccess, land use, and wetlandhabitat mediated by climate[18,46,47,49,50]
Summer-springprecipitationbalance
SSPB USFS(1961–1990) [48]
1.00 km2 0.16 km2 ratio of summer tospring precipitation
Hypothesized relationshipbetween breeding duckabundance and reproductivesuccess and wetland habitatmediated by climate [49,50]
Proportioncropland
Crop NLCD,AAFC
0.009 km0 0.16 km2 proportion of thelandscape composedof croplandvegetation types
Hypothesized negativerelationship between proportioncropland and breeding duckabundance and reproductivesuccess [12,47,52,53]
Proportiongrassland
Grass NLCD,AAFC
0.009 km1 0.16 km2 proportion of thelandscape composedof grasslandvegetation types
Hypothesized positiverelationship between proportiongrassland and breeding duckabundance and reproductivesuccess [12,47,52,53]
(Continued)
International Conservation Planning for Ducks
PLOS ONE | DOI:10.1371/journal.pone.0116735 February 25, 2015 6 / 23
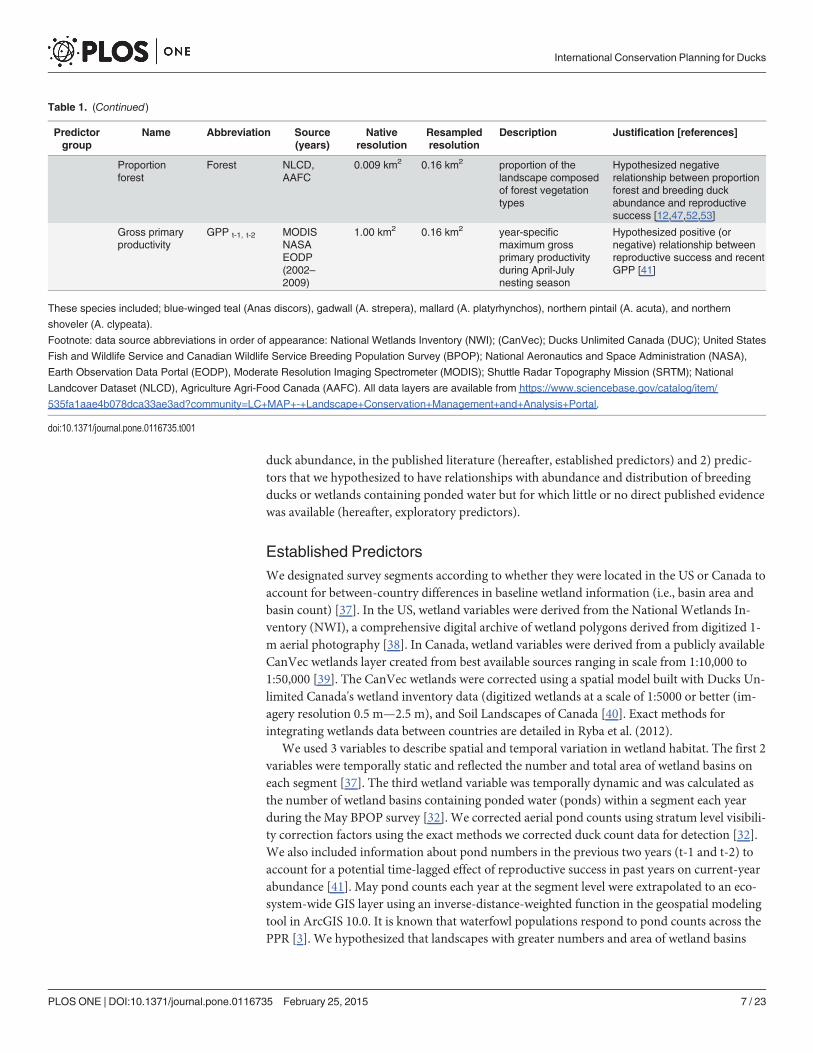
duck abundance, in the published literature (hereafter, established predictors) and 2) predic-tors that we hypothesized to have relationships with abundance and distribution of breedingducks or wetlands containing ponded water but for which little or no direct published evidencewas available (hereafter, exploratory predictors).
Established PredictorsWe designated survey segments according to whether they were located in the US or Canada toaccount for between-country differences in baseline wetland information (i.e., basin area andbasin count) [37]. In the US, wetland variables were derived from the National Wetlands In-ventory (NWI), a comprehensive digital archive of wetland polygons derived from digitized 1-m aerial photography [38]. In Canada, wetland variables were derived from a publicly availableCanVec wetlands layer created from best available sources ranging in scale from 1:10,000 to1:50,000 [39]. The CanVec wetlands were corrected using a spatial model built with Ducks Un-limited Canada's wetland inventory data (digitized wetlands at a scale of 1:5000 or better (im-agery resolution 0.5 m—2.5 m), and Soil Landscapes of Canada [40]. Exact methods forintegrating wetlands data between countries are detailed in Ryba et al. (2012).
We used 3 variables to describe spatial and temporal variation in wetland habitat. The first 2variables were temporally static and reflected the number and total area of wetland basins oneach segment [37]. The third wetland variable was temporally dynamic and was calculated asthe number of wetland basins containing ponded water (ponds) within a segment each yearduring the May BPOP survey [32]. We corrected aerial pond counts using stratum level visibili-ty correction factors using the exact methods we corrected duck count data for detection [32].We also included information about pond numbers in the previous two years (t-1 and t-2) toaccount for a potential time-lagged effect of reproductive success in past years on current-yearabundance [41]. May pond counts each year at the segment level were extrapolated to an eco-system-wide GIS layer using an inverse-distance-weighted function in the geospatial modelingtool in ArcGIS 10.0. It is known that waterfowl populations respond to pond counts across thePPR [3]. We hypothesized that landscapes with greater numbers and area of wetland basins
Table 1. (Continued)
Predictorgroup
Name Abbreviation Source(years)
Nativeresolution
Resampledresolution
Description Justification [references]
Proportionforest
Forest NLCD,AAFC
0.009 km2 0.16 km2 proportion of thelandscape composedof forest vegetationtypes
Hypothesized negativerelationship between proportionforest and breeding duckabundance and reproductivesuccess [12,47,52,53]
Gross primaryproductivity
GPP t-1, t-2 MODISNASAEODP(2002–2009)
1.00 km2 0.16 km2 year-specificmaximum grossprimary productivityduring April-Julynesting season
Hypothesized positive (ornegative) relationship betweenreproductive success and recentGPP [41]
These species included; blue-winged teal (Anas discors), gadwall (A. strepera), mallard (A. platyrhynchos), northern pintail (A. acuta), and northern
shoveler (A. clypeata).
Footnote: data source abbreviations in order of appearance: National Wetlands Inventory (NWI); (CanVec); Ducks Unlimited Canada (DUC); United States
Fish and Wildlife Service and Canadian Wildlife Service Breeding Population Survey (BPOP); National Aeronautics and Space Administration (NASA),
Earth Observation Data Portal (EODP), Moderate Resolution Imaging Spectrometer (MODIS); Shuttle Radar Topography Mission (SRTM); National
Landcover Dataset (NLCD), Agriculture Agri-Food Canada (AAFC). All data layers are available from https://www.sciencebase.gov/catalog/item/
535fa1aae4b078dca33ae3ad?community=LC+MAP+-+Landscape+Conservation+Management+and+Analysis+Portal.
doi:10.1371/journal.pone.0116735.t001
International Conservation Planning for Ducks
PLOS ONE | DOI:10.1371/journal.pone.0116735 February 25, 2015 7 / 23

would have greater overall carrying capacity for breeding ducks [42] and potentially be associ-ated with greater abundance and reproductive success during the initial years of wet periods.
We included 2 additional variables that measured moisture on the landscape because of theknown importance of wetlands to ducks. These variables could potentially capture variation induck abundance that related to potential current and time-lagged effects of wet-dry cycles onwetlands, soil, and vegetation. These variables were included as additional potential predictorsand biologically were included for the same reason as our three other wetland variables. First,we included the Normalized Difference Wetness Index (NDWI) which is a measure of surfacereflectivity and described combined surface water, soil moisture and water content of vegeta-tion. NDWI is a derivative of Moderate Resolution Imaging Spectrometer (MODIS) [43] andwas calculated as the NDWI value measured the closest to May 15th each year. Second, weused Palmer’s Drought Severity Index (PDSI), a standardized and widely accepted index ofmonthly moisture regime. We used global 2.5° (*175 km) gridded monthly PDSI data forMay [44]. We interpolated gridded values across the PPR in ArcGIS using inverse distanceweighting and estimated segment-specific PDSI values using focal mean pixel values withinsurvey segment boundaries. Because the effect of wet years may have carryover effects in subse-quent years, we included one and two year lags for PDSI (t-1, t-2).
Exploratory PredictorsWe expected topography to affect the permanence of wetland basins and land use (i.e., morepermanent basins, and more grass-based agriculture in rolling topography; more seasonalbasins, and more crop-based agriculture in flatter topography). We used Shuttle Radar Topog-raphy Mission (SRTM3 Version 2; 3 arc-second resolution*90 m) digital elevation modeldata to characterize landform within survey segment boundaries [45]. We first used SpatialAnalyst in ArcGIS 10.0 to generate a surface representing the coefficient of variation (CV) inelevations within a 41 km2 neighborhood. We subsequently estimated our landform covariate(SRTM_CV) as the focal mean of elevation CVs within survey segment boundaries.
We expected climate variables, which were spatially explicit long-term averages, to be im-portant because climate constrains land use, affects wetland dynamics, and drives ecosystemcomposition and dynamics. Rate and extent of conversion of grasslands varies across the PPR’ssub-regional climate gradients. For example, grassland losses are greater within the tall-grassecosystem [18]. Tall-grass prairies occur at the higher end of the precipitation gradient of glob-al grasslands and agricultural conversion has almost extirpated this vegetation community[46]. Demographic rates are also known to vary among climatic gradients within the PPR [47].We therefore included 3 environmental variables related to broad-scale climatic patterns for allof North America during 1961–1990 [48]. Climate variables were highly correlated, so wechose variables that were most relevant to our hypotheses and had correlations� 0.65. We in-cluded the number of degree-days > 5°C (DD5). We also included an annual moisture index(AMI) which was calculated by dividing DD5 by the mean annual precipitation. Because of theimportance of wetlands retaining water to nesting effort and brood survival [49, 50], we includ-ed the summer/spring precipitation balance (SSPB) as an index of how long the temporary andseasonal wetlands within the PPR were expected to remain wet on average [49,50].
We used 3 variables to describe landuse-landcover at the segment level: proportion of crop-land, proportion of grassland, and proportion of forest. These variables were calculated from30-m landcover products created in 2001 by Agriculture Agri Food Canada and the UnitedStates Geological Survey National Land Cover Dataset program [51]. We calculated values ofthese variables for each segment in the dataset. Values of the landuse-landcover variables didnot vary among years. We hypothesized that abundance, distribution and demographic rates
International Conservation Planning for Ducks
PLOS ONE | DOI:10.1371/journal.pone.0116735 February 25, 2015 8 / 23

of ducks would be related to landuse-landcover. For example, nest survival probability [47,52]has been shown to be positively related to the proportion of grassland in the landscape. Nestsurvival probability has also been shown to be negatively related to the proportion of croplandin the landscape [53]. These patterns could result from both bottom-up and top-down effects.For example, high-protein invertebrate food resources critical for egg formation and ducklinggrowth tend to be less abundant in wetlands surrounded by cropland [12]. As a top down ex-ample, predator communities tend to be more diverse and include an avian component inlandscapes with more forest cover, thus nest survival tends to be lower in these landscapes [53].
We included a year-specific measurement of maximum Gross Primary Productivity (GPP)on each segment during the two previous years (t-1 and t-2). GPP provided an index to theamount of vegetation growth on a given site and year [54]. GPP in previous years was associat-ed with nest success, such that populations nest success was higher with greater GPP in theprior year, but lower with greater GPP two years prior [41]. If natal philopatry is evident at thisscale, GPP may be predictor of population settling. GPP is derived fromMODIS satellite imag-ery and collected at 8-day intervals. We obtained MODIS from the National Aeronautics andSpace Administration’s Earth Observations Data Portal. GPP was calculated as the maximumGPP measurements during April-July on the 1-km2 MODIS pixel nearest the center of thetransect centroid.
Statistical MethodologyStatistical analysis was conducted in the statistical software R [55]. Data preparation was con-ducted using the rgdal [56], sp [57] and raster [58] libraries to read spatial data, assign valuesfrom spatial covariates to the point observations of our dependent variable and make spatialpredictions that can be incorporated into any GIS environment. We used the nonparametricmodel Random Forests [59] implemented in the R library randomForest [60]. Random Forestis a bootstrapped Classification and Regression Tree (CART) approach that is based on theprinciple of weak learning [61]; where a set of weak subsample models converge on a stableglobal model. This method has been shown to provide stable estimates while being robust tomany of the issues associated with spatial data (e.g., autocorrelation, nonstationarity). It alsofits complex, nonlinear relationships and accounts for high dimensional interactions [62,63].First and second order variation are addressed in the hierarchal nature in the iterative nodepartitioning making this a good model to implement when global trend and local variation[64] are expected to occur in the same model [63]. We expected both global trends in duck set-tling patterns as well as localized population clusters across the PPR based on prior modelsbuilt within the U.S. PPR [25], the Canadian PPR [24], and discussions with USFWS pilotswho fly the surveys. We followed the model selection method introduced in Murphy et al.(2010) using R code provided by those authors. Parsimony in Random Forests is important notonly for producing a more interpretable model but also for reducing overall noise, thus provid-ing a better model fit [63,65]. Nonparametric methods are becoming much more common inecological modeling, supporting inference of nonlinear and spatial dynamics [62,63,66,67].Random Forest modeling uses a bootstrap approach that tests a null distribution against the se-lected model is a robust way to test model significance in nonparametric models and has beenpreviously published [63,65]. Inference was supported by following methods presented inEvans et al. (2011), Murphy et al. (2010) and Cutler et al. (2007). Given the expected complexi-ty in variable interaction, potential latent variables, high spatial variability representing bothglobal and local effects and nonlinear relationships, we felt a non-linear model such as RandomForest was an appropriate choice.
International Conservation Planning for Ducks
PLOS ONE | DOI:10.1371/journal.pone.0116735 February 25, 2015 9 / 23

We produced year-specific models to fulfill our objective to describe temporal variation inthe spatial distribution of waterfowl. These year-specific models also allowed us to compareour estimates to BPOP estimates at a stratum level. We used our annual predictive models togenerate mean predictions and measures of variation through a two-stage modeling process[68]. Our logic is analogous to statistical methods that create habitat selection models for indi-vidual animals and then average across individuals to produce population level habitat selec-tion inference [69]. In our analyses the first stage was each year specific model and our secondstage was the averaged (or SD) abundance through time. Using two-stage processes are also arelatively simple way to allow heterogeneity in year-specific habitat selection to be incorporatedinto our spatially explicit model. This is important if it is expected that functional response re-lationships may change with variation in habitat condition through time. Two-stage processesalso minimize issues of correlations between landscape conditions at sample points throughadjacent years. Because we applied our statistical model back to each grid cell on the entirePPR landscape each year, we could readily calculate population metrics from our grid surfacessuch as mean, max, and measures of variability such as standard deviations.
Spatial Heterogeneity and VariabilityWe generated two map products highlighting the importance of spatial and temporal variabili-ty in population distributions to harvest management and conservation planning. First, we il-lustrated how variability in space is an important component in conservation planning whichcould require redundancy in habitat areas to support desired population goals because weknow spatial distribution of birds vary in the PPR. We demonstrated this by showing the spa-tial variability in waterfowl abundance each year from 2002–2010 and calculating the SD andthe maximum abundance for each grid cell. We processed duck density predictions each yearand turned predicted density values into a relative percent of the PPR population. We definedthe PPR population as the sum of all predicted duck counts from all grid cells. We then placedeach grid cell in context of the PPR population by dividing the predicted grid cell density bythe year-specific PPR population prediction. Starting with the highest density, we cumulativelysummed the number of ducks predicted until each 10% percent population threshold was met.This resulted in a defined percent of the duck population being identified in areas of the highestdensity of breeding sites through each year (Fig. 2).
Second, we compared the two closest VCF corrected total pond counts during the years2002–2010. We did this to assess if the most similar pond counts in our study would producedifferent spatial patterns across the landscape of the PPR. We did this because pond counts arethe primary habitat predictor variable used in setting waterfowl harvest regulation.
Comparison of spatially explicit model estimates versus BPOPestimatesWe rescaled our grid surface predictions to account for the different size between our responsevariable (predicted number of ducks within*11km2) and our 400m2 grid cells. We thensummed our grid surfaces to generate population estimates within strata that were fully con-tained within our study area. Within each stratum we then multiplied our estimates by 2 be-cause we modeled pairs of ducks and BPOP estimates total individual ducks. We comparedpredictions graphically and by regressing the sum of the random forest grid cell predictions asthe predictor of BPOP estimates within a stratum. Comparison of results generated from a de-sign-based estimator to results from random forest modeling serves as evaluation throughconcurrence.
International Conservation Planning for Ducks
PLOS ONE | DOI:10.1371/journal.pone.0116735 February 25, 2015 10 / 23
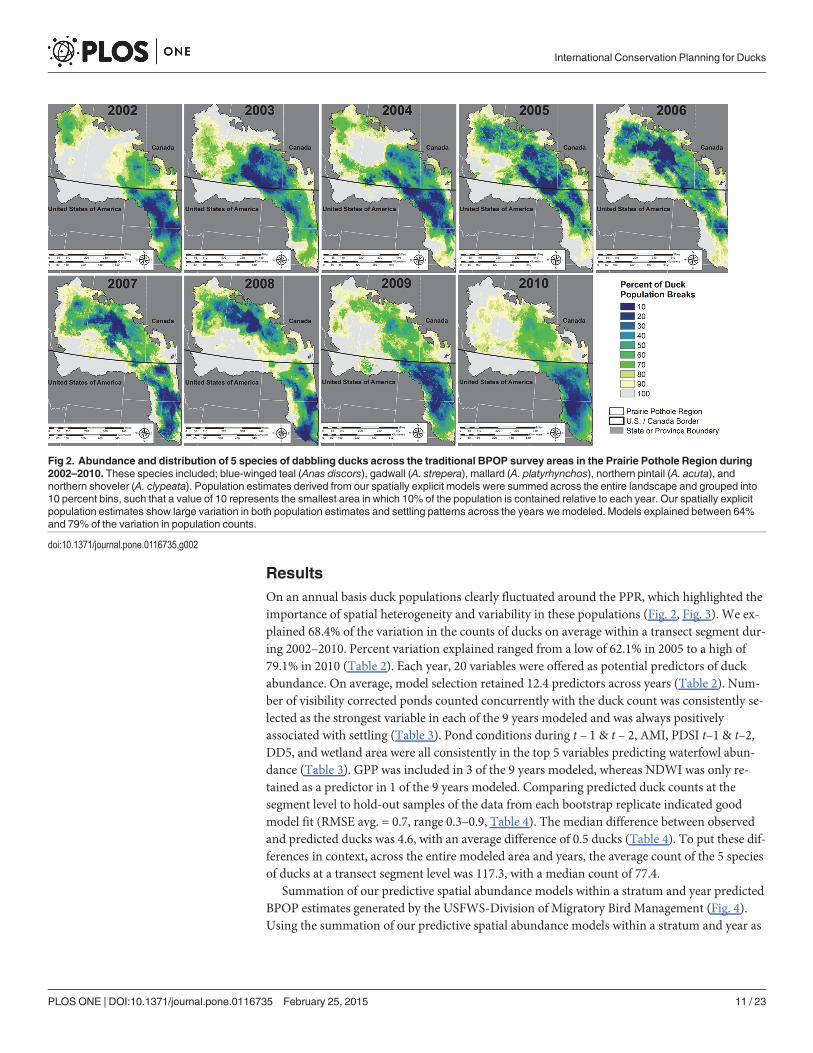
ResultsOn an annual basis duck populations clearly fluctuated around the PPR, which highlighted theimportance of spatial heterogeneity and variability in these populations (Fig. 2, Fig. 3). We ex-plained 68.4% of the variation in the counts of ducks on average within a transect segment dur-ing 2002–2010. Percent variation explained ranged from a low of 62.1% in 2005 to a high of79.1% in 2010 (Table 2). Each year, 20 variables were offered as potential predictors of duckabundance. On average, model selection retained 12.4 predictors across years (Table 2). Num-ber of visibility corrected ponds counted concurrently with the duck count was consistently se-lected as the strongest variable in each of the 9 years modeled and was always positivelyassociated with settling (Table 3). Pond conditions during t – 1 & t – 2, AMI, PDSI t–1 & t–2,DD5, and wetland area were all consistently in the top 5 variables predicting waterfowl abun-dance (Table 3). GPP was included in 3 of the 9 years modeled, whereas NDWI was only re-tained as a predictor in 1 of the 9 years modeled. Comparing predicted duck counts at thesegment level to hold-out samples of the data from each bootstrap replicate indicated goodmodel fit (RMSE avg. = 0.7, range 0.3–0.9, Table 4). The median difference between observedand predicted ducks was 4.6, with an average difference of 0.5 ducks (Table 4). To put these dif-ferences in context, across the entire modeled area and years, the average count of the 5 speciesof ducks at a transect segment level was 117.3, with a median count of 77.4.
Summation of our predictive spatial abundance models within a stratum and year predictedBPOP estimates generated by the USFWS-Division of Migratory Bird Management (Fig. 4).Using the summation of our predictive spatial abundance models within a stratum and year as
Fig 2. Abundance and distribution of 5 species of dabbling ducks across the traditional BPOP survey areas in the Prairie Pothole Region during2002–2010. These species included; blue-winged teal (Anas discors), gadwall (A. strepera), mallard (A. platyrhynchos), northern pintail (A. acuta), andnorthern shoveler (A. clypeata). Population estimates derived from our spatially explicit models were summed across the entire landscape and grouped into10 percent bins, such that a value of 10 represents the smallest area in which 10% of the population is contained relative to each year. Our spatially explicitpopulation estimates show large variation in both population estimates and settling patterns across the years we modeled. Models explained between 64%and 79% of the variation in population counts.
doi:10.1371/journal.pone.0116735.g002
International Conservation Planning for Ducks
PLOS ONE | DOI:10.1371/journal.pone.0116735 February 25, 2015 11 / 23

the only predictor variable, produced an r2 of 0.977 and a regression coefficient which indicateda lack of bias in model fit (β = 1.005). We also graphically compared strata that had the highestduck densities during 2002–2010, and results indicate our spatial models and BPOP estimatestracked each other through time (Fig. 5, Fig. 6). However, we consistently over-predicted popu-lations as estimated by BPOP methods in strata 34 & 47 (Fig. 5). Inspection of residuals in stra-ta 34 and 47 showed these strata consistently had the highest standardized residuals across the9 years we studied. Post hoc inspection of the habitat in these strata indicates they are two of
Fig 3. Abundance and distribution of 5 species of dabbling ducks across the U.S. and CanadianPrairie Pothole Region. These species included; blue-winged teal (Anas discors), gadwall (A. strepera),mallard (A. platyrhynchos), northern pintail (A. acuta), and northern shoveler (A. clypeata). Maps depict themean and standard deviation of our yearly predictions from 2002–2010. For the mean population estimate(left inset) estimates were summed across the entire landscape and grouped into 10 percent bins, such that avalue of 10 represents the smallest area in which 10% of the population is contained relative to each year.
doi:10.1371/journal.pone.0116735.g003
Table 2. Variation explained by year and the number of predictor variables selected by RandomForest model selection techniques.
Year Percent Variance Explained Number of Variables
2002 74.7% 10
2003 63.8% 16
2004 68.1% 11
2005 62.1% 16
2006 63.2% 11
2007 64.2% 11
2008 65.0% 10
2009 75.1% 16
2010 79.1% 11
Avg. 68.4% 12.4
doi:10.1371/journal.pone.0116735.t002
International Conservation Planning for Ducks
PLOS ONE | DOI:10.1371/journal.pone.0116735 February 25, 2015 12 / 23

the most intensively cropped regions within the Canadian and US PPR respectively. Across theentire U.S. and Canadian PPR we show predicted population trends tracked each other whengraphically comparing estimates generated from the two different methods. We also show thatspatially explicit models were within the 95% CI of BPOP estimates (Fig. 6) across all stratacombined.
DiscussionWewere able to identify key areas for duck conservation across the PPJV & PHJV administrativeareas using equivalent methodologies with high predictive capabilities (Tables 2 & 4, Figs. 2 & 4).Our models are the first seamless spatially explicit models of waterfowl abundance across the en-tire PPR and represent the initial step toward joint conservation planning between PPJV andPHJV.We did not explicitly define conservation thresholds within this paper, as explicitly definingconservation priority areas is inherently a partner driven process. However our waterfowl modelsdo provide the methodological insight and create a quantitative link between the PPJV and PHJVallowing these groups to set joint waterfowl population and habitat objectives. Given asynchronous
Table 3. Top 5 variables selected for each year from 2002–2010.
Year 1st Variable 2nd Variable 3rd Variable 4th Variable 5th Variable
2002 Pond t (1.00) Pond t-1 (0.77) Pond t—2 (0.63) PDSI t—2 (0.43) PDSI t-1 (0.42)
2003 Pond t (1.00) PDSI t-2 (0.35) AMI (0.34) Pond t—2 (0.33) DD5 (0.27)
2004 Pond t (1.00) Pond t-2 (0.69) Pond t-1 (0.61) PDSI t-1 (0.48) Wetland Area (0.42)
2005 Pond t (1.00) Pond t-2 (0.80) AMI (0.59) Forest (0.58) Pond t-1 (0.50)
2006 Pond t (1.00) AMI (0.67) Forest (0.42) Pond t-1 (0.39) Pond t-2 (0.34)
2007 Pond t (1.00) AMI (0.95) Pond t-1 (0.55) PDSI t-1 (0.50) Wetland Area (0.49)
2008 Pond t (1.00) AMI (0.67) PDSI t-2 (0.64) Pond t-2 (0.45) Pond t-1 (0.44)
2009 Pond t (1.00) DD5 (0.53) Wetland Area (0.46) Country (0.43) Wetland Count (0.35)
2010 Pond t (1.00) PDSI t-1 (0.60) Pond t-1 (0.49) DD5 (0.48) AMI (0.43)
Variables importance values are scaled each year so that the top variable equals 1 and the remaining variables are a proportion derived by dividing by the
top variable. They are derived from probability scaled partial plots in the RandomForest package in R. Wetland count and area are derived from GIS
based polygon layers [37]. Pond Count derived from inverse distance weighting of aerial pond counts [32].
doi:10.1371/journal.pone.0116735.t003
Table 4. Goodness of fit statistics generated from comparing model predictions versus the out of bag test data.
Year RMSE Min 1st Quartile Median Mean 3rd Quartile Max
2002 0.3 -222.0 -5.3 2.5 0.1 9.7 73.1
2003 0.8 -186.9 -8.3 4.6 0.6 14.2 90.1
2004 0.6 -112.1 -8.5 4.3 0.4 11.9 61.2
2005 0.9 -149.8 -7.0 4.3 0.8 13.1 59.7
2006 0.8 -174.0 -9.3 4.5 0.6 15.7 88.6
2007 0.8 -236.6 -10.8 5.7 0.6 18.7 88.2
2008 0.8 -198.3 -8.5 5.2 0.6 16.2 70.9
2009 0.8 -184.4 -9.7 6.2 0.7 16.7 103.8
2010 0.7 -190.3 -8.1 3.8 0.5 13.9 91.2
Avg. 0.7 -183.8 -8.4 4.6 0.5 14.4 80.7
Metrics are computed by subtracting the observed duck counts from the predicted model counts.
doi:10.1371/journal.pone.0116735.t004
International Conservation Planning for Ducks
PLOS ONE | DOI:10.1371/journal.pone.0116735 February 25, 2015 13 / 23

utilization of the U.S. and Canadian PPR by waterfowl populations during our study (Fig. 2),strong partnerships and joint planning capacity will be critical to achieving long-term goals.
While currently not incorporated into many conservation planning exercises, spatial mea-sures of variability in population abundance could be important in framing conservation plans,especially for highly mobile animals such as waterfowl. Our predictive maps of the mean andSD of duck densities in conjunction indicate large differences in spatial and temporal abun-dances of ducks within smaller sub-regions in the PPR (Fig. 3). These differences have implica-tions to both conservation planning and local-scale ecology. For example, in both countriescertain landscapes consistently attracted higher numbers of waterfowl with low variability. Pro-tection of these landscapes is important to ensure base population levels across a wide range ofprecipitation patterns. We also demonstrate wide variability in population distributions acrossthe 9 years we studied (Figs. 2 & 3). Our work also draws attention to the likely increases inhabitat area required to support defined population goals, when spatial and temporal variationare incorporated into conservation planning for highly mobile birds. This idea is consistentwith recent theoretical research which documented increases in conservation areas are neededto offset population losses induced by increased environmental variability [70].
Fig 4. Linear regression of mean year and stratum level BPOP estimates as predicted by compared random forest stratum level populationestimates from 2002–2010.Random forest estimates predicted BPOP estimates well with an r2 = 0.977 and a regression coefficient of 1.005. Plots of BPOPestimates versus random forest predictions highlight a good model fit, but also show variation for certain transect and year combinations.
doi:10.1371/journal.pone.0116735.g004
International Conservation Planning for Ducks
PLOS ONE | DOI:10.1371/journal.pone.0116735 February 25, 2015 14 / 23

Incorporation of spatially explicitly knowledge of the mean and SD of duck densities mayincrease explained variation in waterfowl population and recruitment estimates. These areimportant parameters, because both are used in waterfowl harvest management models [71].Recent work documented pulses in nest success with increases in nest success rates correspond-ing to pulses in primary productivity [41]. These pulses resulted from areas transitioning froma dry precipitation cycle to a wet precipitation cycle [27,72]. Understanding the location ofpond counts in conjunction with status of the wet/dry precipitation cycles may be important tounderstanding recruitment. For example, relationships between pond counts and duck recruit-ment in areas such as northern South Dakota with high average abundance and high variabilitymay differ from areas with lower SD estimates (Fig. 3). In areas like the north central portionof the Montana PPR, average densities generally were low across the 9 years we modeled. How-ever when wetland conditions were favorable such as 2009, duck populations increased sub-stantially (Fig. 2). Past work in this area documented higher recruitment compared to the core
Fig 5. BPOP population estimates and random forest population estimates track each other well in most population strata and in the U.S. (45) andCanada (32) strata that have the highest ducks during 2000–2010.However, strata 34 & 47 were the two strata that consistently had highest standardizedresidual< -2. Post hoc inspection showed that these are two of the most intensively cropped transects within the Canadian and USPPR respectively.
doi:10.1371/journal.pone.0116735.g005
International Conservation Planning for Ducks
PLOS ONE | DOI:10.1371/journal.pone.0116735 February 25, 2015 15 / 23

waterfowl breeding areas in the PPR [73]. If pulses in nest success with increases in nest successrates corresponding to pulses in primary productivity [41] are supported across a wide range ofstudies, it may be ecologically important in refining our understanding of the variation betweenpond counts, waterfowl breeding population estimates, and PPR-wide recruitment, all of whichare important inputs into harvest management models [71]. Within our study, we documenteda non-linear and positive association with higher Palmer Drought Severity Index Scores fromprior years in most years (S1 File). This shows a pattern of waterfowl colonizing areas transi-tioning from drier to wetter states which has been shown to increase nest success rates [41].
We did not design this study to explicitly test hypotheses, none the less, we observed corre-lations between waterfowl settling and environmental conditions which could be used to gener-ate and test additional hypotheses in the future. Not surprising, waterfowl were positivelyassociated with wetland counts within the current year, or the previous 2 years. This was con-sistent regardless of the total waterfowl population or wetlands counts across the PPR. Howev-er, the functional relationship between waterfowl abundance and wetland counts changed aswaterfowl populations increased from low to high population levels (Fig. 7). When populations
Fig 6. Comparison of design based BPOP estimates compared to population estimates generated by summing Random Forest predictions 2000–2002.We computed yearly 95% CI’s from transect and species-specific SE’s. We only compared BPOP versus Random Forest spatial methods for stratathat had almost complete overlap (strata 26–28, 30, 32–35, 38–41, 45–47). For the years we modeled, summation of random forest spatial models across alloverlapping strata predicted higher population estimates than the designed based BPOP estimates (Mean = 10.6% increase (range -1.6% [2002] to 15.3%[2007]), however estimates were within the 95% confidence intervals and population trends tracked each other.
doi:10.1371/journal.pone.0116735.g006
International Conservation Planning for Ducks
PLOS ONE | DOI:10.1371/journal.pone.0116735 February 25, 2015 16 / 23

were low, we document an almost linear relationship between waterfowl and wetlands, yet aspopulations increased the association between waterfowl and wetlands showed an asymptoticresponse (Fig. 7). At a minimum we could see two competing hypotheses for these relation-ships: 1) density dependence and 2) lagging population responses as the PPR transitioned fromwet to dry conditions. Density dependence in waterfowl has been a topic of debate with someevidence supporting this idea and landscape scales [74,75], but see [76,77] for rebuttals. Todate the mechanism which could cause continental recruitment measures to decline whenduck populations are high have not been documented within field studies [75]. A second po-tential explanation for this relationship is simply wetland conditions change faster than water-fowl populations can respond. During 2002, pond counts were the lowest since the 80’s.Conversely waterfowl populations were near all-time documented highs in 2000 [32]. The ratioof waterfowl to available wetlands should be high in 2002 which could lead to the almost linearrelationship detected in 2002. On the contrary, during 2009 duck populations were increasingfrom low population levels in 2002 [32]. The ratio of waterfowl to wetlands should be lowerthan in 2002 and could partly explain the asymptotic relationship. Explicitly designing a newexperiment or analyzing data to try and tease these hypotheses apart is beyond the scope of thispaper, but is worthy of future study.
Statistical model strength was higher than we initially expected for a pilot modeling effort,but we see areas for improvement in future analyses. Consideration of sub-segment populationdata is likely worthy and may increase predictive abilities in future analyses, especially forhabitat selection questions involving individual choices. Recent research has derived equationsallowing habitat selection models of individuals at sub-segment levels to be linked mathemati-cally with our population level models hierarchically [78]. Building species-specific waterfowlmodels could also increase the amount of variation our abundance models explain by allowingthem to tune to different life history strategies (e.g. Mallard vs. Pintails). Further, as harvest de-cisions are set on an individual species level, species-specific models will be needed to bringharvest and habitat managers together. Coordinated planning between countries was not possi-ble with prior PHJV and PPJV models because they did not span the entire PPR ecosystem.However, one clear limitation of our pilot project is the lack of incorporation of Boreal Forestwetland habitats. Wetland habitats in the Boreal forest areas are known to be important toduck populations, and should be a priority to include in future efforts. Lastly, as uncertaintiessurrounding sub-PPR scale precipitation and temperature predictions are refined and havegreater certainty [71], we feel planning for climate change will increase the importance of crossborder planning.
The stratum level is a meaningful scale at which to compare population predictions generat-ed by summing predictions of our random forest model within a stratum to BPOP estimatesgenerated from a design-based sample and sample theory [21]. This is because waterfowl popu-lations are estimated at the stratum level by the USFWS- Division of Migratory Bird Manage-ment and are then aggregated to generate species-specific population estimates. Thesepopulation numbers are then used by the North American Waterfowl Management Plan tostep down waterfowl population goals to specific joint ventures. We found high congruence be-tween BPOP estimates and our spatial population model because we had both a high R2 value(0.97) and a slope that was not different from 1. Recognizing both methods use the same inputdata, we still maintain that population estimates generated from different methodologies, butreaching similar conclusions, create stronger inference about a population estimate than a sin-gle method [79].
A major goal of the current North American Waterfowl Management Plan and subsequentaction plan is the linking of harvest and habitat management. Past work has developed an em-pirical and theoretical integration framework which could form the basis to link harvest and
International Conservation Planning for Ducks
PLOS ONE | DOI:10.1371/journal.pone.0116735 February 25, 2015 17 / 23

habitat management [71]. Recent work has derived a life-cycle metapopulation model whichalso conceptually begins linking harvest and habitat decisions for Northern Pintail [80]. Thesemodeling frameworks represent large steps forward; however they rely on yield curves whichare based on an aspatial mathematical population model [71] or a metapopulation modelwhich parameterizes transition rates between large geographic areas which are much coarserthan the scale of habitat conservation planning [80].
Fig 7. The functional response of waterfowl abundance to wetlands density varied with changing population sizes within the Prairie PotholeRegion of the U.S. and Canada during 2002–2010.Waterfowl abundance was positively associated with wetlands density regardless of time lags tested,wetland density, or overall population size within the PPR. For each panel in the figure, the x-axis is the count of wetlands (0 to 100) and the y-axis is thecount of 5 species of dabbling ducks (0 to 300) within a* 11 km2 scale. Functional responses were generated using Loess smoothing functions in R.
doi:10.1371/journal.pone.0116735.g007
International Conservation Planning for Ducks
PLOS ONE | DOI:10.1371/journal.pone.0116735 February 25, 2015 18 / 23

For migratory species like waterfowl, with the potential for distribution over a vast geo-graphic range, decisions about where to settle and breed are known to have important demo-graphic consequences at multiple scales. For example, spatial variation in reproductive successis evident at large scales within the breeding range of many North American ducks [47,81]. Atlocal scales, reproductive success varies among specific available nesting habitats [82], and be-tween cropland versus grassland-dominated landscapes [52,53]. Because waterfowl are wellknown to respond to annually varying environmental conditions [3], understanding andmodeling how this variation drives settling within the PPR is a first step in accounting for theinfluence of multi-scale habitat selection on demographic rates at population scales [83,84].
We contend spatial aspects cannot be ignored if coherent harvest and habitat managementdecisions are to be made jointly. Spatially explicit models that incorporate landscape contextinto habitat prioritization and demographic response are the foundation on which habitat pro-grams are currently delivered in the PPR. Conservation planning methods with the PPR areimportant because this area on average produces 50–75% of the primary game species ofducks, but only accounts for 10% of the waterfowl breeding habitats in North America [85].Pond counts as currently used to represent habitat condition do not sufficiently represent thelandscape context and spatial variation incorporated in PPJV and PHJV planning efforts. Forexample, we found pond counts during 2003 and 2005 were the most similar, but produced dif-ferent spatial patterns in distributions of ducks across the PPR (Fig. 2). Aerial observerscounted 31,341 and 30,769 ponds in 2003 and 2005 respectively, for a difference of 572 ponds.However, in 2003 and 2005 29% and 39% of the populations, respectively, were located in theparkland portion of the Canadian PPR. Furthermore, harvest models are based solely on Cana-dian pond counts. Because waterfowl productivity is heterogeneous across the PPR [47,52,81],our work demonstrates harvest models that overlook spatial and temporal variability in duckabundance, as well as landscape context embedded within the broad ecological gradients of thePPR, will likely lead to poorer predictions. Spatial population models used in conjunction withmathematical population models may allow better linkages and communication between har-vest and habitat managers.
We believe our work forms the basis to begin joint international conservation planningacross the entire PPR. We hope our work generates ideas on the possibility and potential oflinking paradigms held by both population and habitat biologists. Above we outlined severalideas which may lead to progress in aligning conservation planning tools across the PPR aswell as beginning to align harvest and habitat management. Our results shows at a minimum itis possible to produce spatially explicit waterfowl abundance models that produce similar stra-tum-level population estimates as design-based estimates currently used to set harvest regula-tions and NAWMP population goals for ducks. The fairly simple examples presented abovehighlight the conceivable importance of spatial heterogeneity and temporal variability in link-ages between conservation planning and harvest management. We hope this effort generatesdiscussion on the important linkages between spatial and temporal variation in populationsize, and distribution relative to habitat quantity and quality when linking habitat and popula-tion goals across this important region.
Supporting InformationS1 File. Final random forest predictive models and R code to allow interested readers to ex-plore biological predictions and functional relationships in 3-D.(DOCX)
International Conservation Planning for Ducks
PLOS ONE | DOI:10.1371/journal.pone.0116735 February 25, 2015 19 / 23

AcknowledgmentsWe would like to thank members of the Prairie Pothole and Prairie Habitat Joint VentureTechnical teams and the USFWS HAPET offices for support and constructive criticism thathelped shape this project. We would especially like to thank Chuck Loesh, Neal Niemuth, RexJohnson, Doug Johnson, and Terry Shaffer. This work would not have been possible withoutthe support or USFWS administrators Will Meeks and Casey Stemler.
Author ContributionsConceived and designed the experiments: KED JW JHD JSE DWH. Performed the experi-ments: KED. Analyzed the data: KED. Wrote the paper: KED JW JHD JSE DWH.
References1. Baldassarre GA, Bolden EG (2006) Waterfowl Ecology and Managment. Malabar, Florida: Krieger
Publishing Company.
2. Smith RI (1970) Response of Pintail Breeding Populations to Drought. The Journal of Wildlife Manage-ment 34: 943–946.
3. Johnson DH, Grier JW (1988) Determinants of Breeding Distributions of Ducks. Wildlife Monographs:3–37.
4. Peterjohn BG, Sauer JR (1997) Population Trends of Black Terns from the North American BreedingBird Survey, 1966–1996. Colonial Waterbirds 20: 566–573.
5. Niemuth ND, Solberg JW (2003) Response of Waterbirds to Number of Wetlands in the Prairie PotholeRegion of North Dakota, U.S.A. Waterbirds: The International Journal of Waterbird Biology 26: 233–238.
6. Beyersbergen GW, Niemuth ND, Norton MR (2004) Northern Prairie and ParklandWaterbird Conser-vation Plan. Prairie Pothole Joint Venture, Denver, Colorado, USA.
7. Niemuth ND, Solberg JW, Shaffer TL (2008) Influence of Moisture on Density and Distribution of Grass-land Birds in North Dakota. The Condor 110: 211–222.
8. Kantrud HA, Krapu GL, Swanson GA (1989) Prairie basin wetlands of the Dakotas: A community pro-file. U.S. Fish andWildlife Service, Biological Report 85(7.28), Washington,D.C., USA.
9. Fritzell EK (1989) Mammals in prairie wetlands. Northern Prairie Wetlands: 268–301.
10. Peterka J (1989) Fishes in northern prairie wetlands. Northern Prairie Wetlands Iowa State UniversityPress, Ames, IA, USA: 302–315.
11. Lehtinen RM, Galatowitsch SM, Tester JR (1999) Consequences of habitat loss and fragmentation forwetland amphibian assemblages. Wetlands 19: 1–12.
12. Euliss Jr NH, Wrubleski DA, Mushet DM (1999) Wetlands of the Prairie Pothole Region: invertebratespecies composition, ecology, and management. Invertebrates in freshwater wetlands of North Amer-ica: ecology and management: 471–514.
13. Hoekstra JM, Boucher TM, Ricketts TH, Roberts C (2005) Confronting a biome crisis: global disparitiesof habitat loss and protection. Ecology Letters 8: 23–29.
14. Wright CK, Wimberly MC (2013) Recent land use change in theWestern Corn Belt threatens grass-lands and wetlands. Proceedings of the National Academy of Sciences.
15. WatmoughMD, Schmoll MJ (2007) Environment Canada’s Prairie and Northern Region Habitat Moni-toring Program Phase II: Recent Habitat Trends in the Prairie Habitat Joint Venture. Edmonton, ABCanada: Environment Canada, CanadaWildlife Service.
16. Rashford BS, Walker JA, Bastian CT (2011) Economics of Grassland Conversion to Cropland in thePrairie Pothole Region. Conservation Biology 25: 276–284. doi: 10.1111/j.1523-1739.2010.01618.xPMID: 21166716
17. Rashford BS, Bastian CT, Cole JG (2011) Agricultural Land-Use Change in Prairie Canada: Implica-tions for Wetland andWaterfowl Habitat Conservation. Canadian Journal of Agricultural Economics/Revue canadienne d'agroeconomie 59: 185–205.
18. Doherty KE, Ryba AJ, Stemler CL, Niemuth ND, MeeksWA (2013) Conservation Planning in an Era ofChange: State of the U.S. Prairie Pothole Region. Wildlife Society Bulletin 37: 546–563.
19. NAWMP (2012) North AmericanWaterfowl Management Plan: United States Department of the Interi-or, Environment Canada, Environment and Natural Resources Mexico.
International Conservation Planning for Ducks
PLOS ONE | DOI:10.1371/journal.pone.0116735 February 25, 2015 20 / 23

20. Williams BK, Johnson FA, Wilkins K (1996) Uncertainty and the Adaptive Management of WaterfowlHarvests. The Journal of Wildlife Management 60: 223–232.
21. Burnham KP, Anderson DR, Laake JL (1980) Estimation of Density from Line Transect Sampling of Bi-ological Populations. Wildlife Monographs: 3–202.
22. Brennan LA, KuvleskyWP Jr. (2005) North American Grassland Birds: An Unfolding Conservation Cri-sis? The Journal of Wildlife Management 69: 1–13.
23. Prairie_Pothole_Joint_Venture (2005) Prairie Pothole Joint Venture 2005 Implementation Plan; Ringel-man JK, Forman KJ, Granfors DA, Johnson RR, Lively CA et al., editors. Denver, Colorado: PrairiePothole Joint Venture.
24. PrairieHabitatJointVenture (2008) Prairie Habitat Joint Venture Implementation Plan 2007–2012: Re-port of the Prairie Habitat Joint Venture. Environment Canada, Edmonton, AB. 34 pp. (Revised May2009).
25. Reynolds RE, Shaffer TL, Loesch CR, Cox RR (2006) The Farm Bill and Duck Production in the PrairiePothole Region: Increasing the Benefits. Wildlife Society Bulletin 34: 963–974.
26. Millett B, JohnsonWC, Guntenspergen G (2009) Climate trends of the North American prairie potholeregion 1906–2000. Climatic Change 93: 243–267.
27. Niemuth N, Wangler B, Reynolds R (2010) Spatial and Temporal Variation in Wet Area of Wetlands inthe Prairie Pothole Region of North Dakota and South Dakota. Wetlands 30: 1053–1064.
28. Murkin HR (2000) Nutrient budgets and the wet-dry cycle of prairie wetlands. In: Murkin HR, Vals Av,Clark WR, editors. Prairie wetland ecology: the contribution of the Marsh Ecology research Program:Iowa State University Press, Ames, Iowa. 413pp. pp. 99–121
29. Bethke RW, Nudds TD (1995) Effects of Climate Change and Land Use on Duck Abundance in Canadi-an Prairie-Parklands. Ecological Applications 5: 588–600.
30. Reynolds RE, Sauer JR (1991) Changes in Mallard Breeding Populations in Relation to Production andHarvest Rates. The Journal of Wildlife Management 55: 483–487.
31. Smith GW (1995) A critical review of the aerial and ground surveys of breeding waterfowl in NorthAmerica. U.S. In: Department of the Interior NBS, editor. Washington, D.C., USA.
32. USFWS-DOI (2013) Waterfowl Breeding Population and Habitat Survey. United States Fish &WildlifeService, Washington DC. https://migbirdapps.fws.gov/mbdc/databases/mas/maydb.asp?opt=1.
33. Coe PK, Johnson BK, WisdomMJ, Cook JG, Vavra M, et al. (2011) Validation of elk resource selectionmodels with spatially independent data. The Journal of Wildlife Management 75: 159–170.
34. Miller JR, Turner MG, Smithwick EAH, Dent CL, Stanley EH (2004) Spatial Extrapolation: The Scienceof Predicting Ecological Patterns and Processes. BioScience 54: 310–320.
35. Johnson DH (1980) The Comparison of Usage and Availability Measurements for Evaluating ResourcePreference. Ecology 61: 65–71.
36. Meyer CB, Thuiller W (2006) Accuracy of resource selection functions across spatial scales. Diversityand Distributions 12: 288–297.
37. Ryba A, Smith AJ, Witherly S, Walker J, Devries JH, et al. (2012) Building the Foundation for Interna-tional Conservation Planning for the Plains and Prairie Pothole Ecosystems. PPPLCC Funding comple-tion report, Bismarck ND http://wwwplainsandprairiepotholeslccorg/research-projects/.
38. USDI-FWS (2011) National Wetlands Inventory. U.S. Fish &Wildlife Service: available at http://www.fws.gov/wetlands/Data/DataDownload.html.
39. Natural_Resources_Canada (2008) CanVec 3.0. Government of Canada, Natural Resources Canada,Earth Sciences Sector, Centre for Topographic Information. Sherbrooke, Quebec, Canada.
40. Soil_Landscapes_of_Canada_Working_Group (2007) SLC 3.1.1. Government of Canada, Soil Land-scapes of CanadaWorking Group, Agriculture and Agri-Food Canada.
41. Walker J, Rotella JJ, Stephens SE, Lindberg MS, Ringelman JK, et al. (2013) Time-lagged variation inpond density and primary productivity affects duck nest survival in the Prairie Pothole Region. Ecologi-cal Applications 23: 1061–1074. PMID: 23967575
42. Zimpfer NL, RhodesWE, Silverman ED, Zimmerman GS, Richkus KD (2013) Trends in Duck BreedingPopulations, 1955–2013. Laurel, MD: U.S. Fish &Wildlife Service, Division of Migratory BirdManagement.
43. Gao B-c (1996) NDWI—A normalized difference water index for remote sensing of vegetation liquidwater from space. Remote Sensing of Environment 58: 257–266.
44. Dai A (2011) Characteristics and trends in various forms of the Palmer Drought Severity Index during1900–2008. Journal of Geophysical Research: Atmospheres 116: D12115.
International Conservation Planning for Ducks
PLOS ONE | DOI:10.1371/journal.pone.0116735 February 25, 2015 21 / 23

45. Farr TG, Rosen PA, Caro E, Crippen R, Duren R, et al. (2007) The Shuttle Radar Topography Mission.Reviews of Geophysics 45: RG2004.
46. Samson F, Knopf F (1994) Prairie Conservation in North America. BioScience 44: 418–421.
47. Reynolds RE, Shaffer TL, Renner RW, NewtonWE, Batt BDJ (2001) Impact of the Conservation Re-serve Program on Duck Recruitment in the U.S. Prairie Pothole Region. The Journal of Wildlife Man-agement 65: 765–780.
48. Rehfeldt GE, Crookston NL, Warwell MV, Evans JS (2006) Empirical Analyses of Plant‐Climate Rela-tionships for the Western United States. International Journal of Plant Sciences 167: 1123–1150.
49. Krapu GL, Pietz PJ, Brandt DA, Cox RR Jr. (2000) Factors Limiting Mallard Brood Survival in PrairiePothole Landscapes. The Journal of Wildlife Management 64: 553–561.
50. Krapu GL, Klett AT, Jorde DG (1983) The Effect of Variable SpringWater Conditions on Mallard Repro-duction. The Auk 100: 689–698.
51. Wickham JD, Stehman SV, Fry JA, Smith JH, Homer CG (2010) Thematic accuracy of the NLCD 2001land cover for the conterminous United States. Remote Sensing of Environment 114: 1286–1296.
52. Stephens SE, Rotella JJ, Lindberg MS, Taper ML, Ringelman JK (2005) Duck Nest Survival in the Mis-souri Coteau of North Dakota: Landscape effects at Multiple Spatial Scales. Ecological Applications15: 2137–2149.
53. Greenwood RJ, Sargeant AB, Johnson DH, Cowardin LM, Shaffer TL (1995) Factors Associated withDuck Nest Success in the Prairie Pothole Region of Canada. Wildlife Monographs: 3–57.
54. Running SW, Nemani RR, Heinsch FA, Zhao M, ReevesM, et al. (2004) A Continuous Satellite-DerivedMeasure of Global Terrestrial Primary Production. BioScience 54: 547–560.
55. Team RC (2012) R: A language and environment for statistical computing: R. Foundation for StatisticalComputing, Vienna, Austria. ISBN 3-900051-07-0, URL http://www.R-project.org/.
56. Bivand RS, Keitt T, Rowlingson B (2013) rgdal: Bindings for the Geospatial Data Abstraction Library. Rpackage version 08–9 http://CRANR-projectorg/package = rgdal
57. Bivand RS, Pebesma EJ, Gomez-Rubio V (2008) Applied spatial data analysis with R: Springer, NY.http://www.asdar-book.org/.
58. Hijmans RJ, Etten Jv (2013) raster: Geographic data analysis and modeling: R package version 2.1–25. http://CRAN.R-project.org/package = raster
59. Breiman L (2001) Random Forests. Machine Learning 45: 5–32.
60. Liaw A, Wiener M (2002) Classification and Regression by randomForest. R News 2: 18–22. PMID:12028823
61. Hastie T, Tibshirani R, Friedman J (2008) The Elements of Statistical Learning: Second Edition.Springer-Verlag.
62. Cutler DR, Edwards TC, Beard KH, Cutler A, Hess KT, et al. (2007) Random Forests for Classificationin Ecology. Ecology 88: 2783–2792. PMID: 18051647
63. Evans JS, Murphy MA, Holden ZA, Cushman SA (2011) Modeling species distribution and changeusing Random Forests in Predictive species and habitat modeling. In: Drew CA, Wiersman YF, Huett-mann F, editors. Landscape ecology: concepts and applications Springer, NY.
64. Cressie N (1991) Statistics for spatial data. New York: Wiley-Interscience.
65. Murphy MA, Evans JS, Storfer A (2010) Quantifying Bufo boreas connectivity in Yellowstone NationalPark with landscape genetics. Ecology 91: 252–261. PMID: 20380214
66. Olden JD, Lawler JJ, Poff NL (2008) Machine Learning Without Tears: A Primer for Ecologist. TheQuarterly Review of Biology 83: 171–193. PMID: 18605534
67. Baruch-Mordo S, Evans JS, Severson JP, Naugle DE, Maestas JD, et al. (2013) Saving sage-grousefrom the trees: A proactive solution to reducing a key threat to a candidate species. Biological Conser-vation 167: 233–241.
68. Fieberg J, Matthiopoulos J, Hebblewhite M, Boyce MS, Frair JL (2010) Correlation and studies of habi-tat selection: problem, red herring or opportunity? Philosophical Transactions of the Royal Society B:Biological Sciences 365: 2233–2244. doi: 10.1098/rstb.2010.0079 PMID: 20566500
69. Sawyer H, Nielson RM, Lindzey F, McDonald LL (2006) Winter Habitat Selection of Mule Deer beforeand during Development of a Natural Gas Field. The Journal of Wildlife Management 70: 396–403.
70. Verboom J, Schippers P, Cormont A, Sterk M, Vos C, et al. (2010) Population dynamics under increas-ing environmental variability: implications of climate change for ecological network design criteria.Landscape Ecology 25: 1289–1298.
International Conservation Planning for Ducks
PLOS ONE | DOI:10.1371/journal.pone.0116735 February 25, 2015 22 / 23

71. Anderson MG, Caswell D, Eadie J, Herkert JT, Huang M, et al. (2007) Report from the Joint TaskGroup for Clarifying North American Waterfowl Management Plan Population Objectives and their Usein Harvest Management. United State Fish &Wildlife Service, Washington DC.
72. Kahara S, Mockler R, Higgins K, Chipps S, Johnson R (2009) Spatiotemporal patterns of wetland oc-currence in the Prairie Pothole Region of eastern South Dakota. Wetlands 29: 678–689.
73. Ball IJ, Eng RL, Ball SK (1995) Population Density and Productivity of Ducks on Large Grassland Tractsin Northcentral Montana. Wildlife Society Bulletin 23: 767–773.
74. Milton WW (1979) Density and Habitat Relationships of Blue-Winged Teal Nesting in NorthwesternIowa. The Journal of Wildlife Management 43: 367–374.
75. Larivière S, Messier F (1998) Effect of Density and Nearest Neighbours on SimulatedWaterfowl Nests:Can Predators Recognize High-Density Nesting Patches? Oikos 83: 12–20.
76. Ringelman K, Eadie J, Ackerman J (2012) Density-dependent nest predation in waterfowl: the relativeimportance of nest density versus nest dispersion. Oecologia 169: 695–702. doi: 10.1007/s00442-011-2228-1 PMID: 22179311
77. Ackerman JT, Blackmer AL, Eadie JM (2004) Is predation on waterfowl nests density dependent?—Tests at three spatial scales. Oikos 107: 128–140.
78. DeCesare NJ, Hebblewhite M, Schmiegelow F, Hervieux D, McDermid GJ, et al. (2012) Transcendingscale dependence in identifying habitat with resource selection functions. Ecological Applications 22:1068–1083. PMID: 22827119
79. Johnson DH (2002) The Importance of Replication in Wildlife Research. The Journal of Wildlife Man-agement 66: 919–932.
80. Mattsson BJ, Runge MC, Devries JH, Boomer GS, Eadie JM, et al. (2012) A modeling framework for in-tegrated harvest and habitat management of North American waterfowl: Case-study of northern pintailmetapopulation dynamics. Ecological Modelling 225: 146–158.
81. Hestbeck JB (1995) Response of Northern Pintail Breeding Populations to Drought, 1961–92. TheJournal of Wildlife Management 59: 9–15.
82. Klett AT, Shaffer TL, Johnson DH (1988) Duck Nest Success in the Prairie Pothole Region. The Journalof Wildlife Management 52: 431–440.
83. Pulliam HR (1988) Sources, Sinks, and Population Regulation. The American Naturalist 132: 652–661.
84. Dunning JB, Stewart DJ, Danielson BJ, Noon BR, Root TL, et al. (1995) Spatially Explicit PopulationModels: Current Forms and Future Uses. Ecological Applications 5: 3–11.
85. Batt BDJ, Anderson MG, Anderson CD, Caswell FD (1989) The use of prairie potholes by North Ameri-can ducks. In: van der Valk A, editor. Northern prairie wetlands. Ames Iowa: Iowa State UniversityPress.
International Conservation Planning for Ducks
PLOS ONE | DOI:10.1371/journal.pone.0116735 February 25, 2015 23 / 23
Related Documents


