1 TABLE OF CONTENTS Abstract 1.0 Introduction………………………………………………………………………………….....1 1.1 Aims and Objectives……………………………………………………………………............2 2.0 Precedent Studies…………………………………………………………………………......3 2.1 Lighting Precedent Study……………………………………………………………….......7-10 2.1.1 Solar Decathlon House, Texas 2.2 Acoustic Precedent Study…………………………………………………………………11-16 2.2.1 Yildiz Technical University 2.3 Conclusion………………………………………………………………………………………17 3.0 Research Methodology……………………………………………………………………...18 3.1 Methodology of Lighting Analysis…………………………………………………………….18 3.1.1 Description of Equipment…………………………………………………………….19 3.1.2 Data Collection Method…………………………………………………………...20-21 3.1.3 Lighting Analysis Calculation…………………………………………………......22-23 3.2 Methodology of Acoustic Analysis……………………………………………………………24 3.2.1 Description of Equipment…………………………………………………………24-25 3.1.2 Data Collection Method……………………………………………………………....26 3.1.3 Acoustic Analysis Calculation………………………………………………………..27 4.0 Site Study 4.1 Introduction……………………………………………………………………………………28 4.2 Reason for Selection…………………………………………………………………………29 4.3 Measured Drawings……………………………………………………………………....30-31

Welcome message from author
This document is posted to help you gain knowledge. Please leave a comment to let me know what you think about it! Share it to your friends and learn new things together.
Transcript
1
TABLE OF CONTENTS
Abstract
1.0 Introduction………………………………………………………………………………….....1
1.1 Aims and Objectives……………………………………………………………………............2
2.0 Precedent Studies…………………………………………………………………………......3
2.1 Lighting Precedent Study……………………………………………………………….......7-10
2.1.1 Solar Decathlon House, Texas
2.2 Acoustic Precedent Study…………………………………………………………………11-16
2.2.1 Yildiz Technical University
2.3 Conclusion………………………………………………………………………………………17
3.0 Research Methodology……………………………………………………………………...18
3.1 Methodology of Lighting Analysis…………………………………………………………….18
3.1.1 Description of Equipment…………………………………………………………….19
3.1.2 Data Collection Method…………………………………………………………...20-21
3.1.3 Lighting Analysis Calculation…………………………………………………......22-23
3.2 Methodology of Acoustic Analysis……………………………………………………………24
3.2.1 Description of Equipment…………………………………………………………24-25
3.1.2 Data Collection Method……………………………………………………………....26
3.1.3 Acoustic Analysis Calculation………………………………………………………..27
4.0 Site Study
4.1 Introduction……………………………………………………………………………………28
4.2 Reason for Selection…………………………………………………………………………29
4.3 Measured Drawings……………………………………………………………………....30-31
2
4.4 Existing Lighting Sources………………………………………………………………….32
4.5 Existing Acoustic Sources…………………………………………………………………33
4.6 Existing Materials on Site……………………………………………………………….....34
4.7 Zoning of Spaces…………………………………………………………………………...35
5.0 Lighting Analysis……………………………………………………………………….....36
5.1 Lighting Lux Readings………………………………………………………………...........36
5.1.1 Daytime Lux Readings…………………………………………………………......36
5.1.2 Night time Lux Readings……………………………………………………….......37
5.1.3 Observation and Discussion……………………………………………………38-39
5.2 Lux Contour Diagram……………………………………………………………………40-41
5.3 Analysis and Calculation……………………………………………………………………42.
5.3.1 Daylight Factor Calculation…………………………………………………………..42
5.3.2 Artificial Light Calculation…………………………………………………………….43
Zone 1: Sitting Area……………………………………………………………..43-45
Zone 2: Outdoor Sitting Area………………………………………………......46-49
Zone 3: Private Gathering Area………………………………………………..50-53
Zone 4: Storage Room 1……..…………………………………………………54-57
Zone 5: Coffee Counter……..…………………………………………………..58-61
Zone 6: Male Toilet ………….………………………………………………….62-65
Zone 7: Female Toilet………………………………………………………......61-63
Zone 8: Sitting Area 2……………………………………………………….... 64-66
Zone 9: Storage Room 2………………………………………………………..67-69
5.4Analysis and Evaluation…………………………………………………………………………70
6.0 Acoustic Analysis
6.1 Noise Sources………………………………………………………………………………...71
6.1.1 External Noise Sources …………………………………………………………….71
6.1.2 Internal Noise Sources………………………………………………………….72- 74
3
6.2 Acoustic Readings…………………………………………………………………………......75
6.2.1 Peak and Non-Peak Hours Readings………………………………………………....75
6.2.2 Observation and Discussion……………………………………………………….....76
6.3 Acoustic Ray Diagram………………………………………………………………………....77
6.4 Analysis and Calculation……………………………………………………………………....78
6.4.1 Equipment Sound Pressure Level……………………………………………….78-81
6.4.2 Sound Pressure Level Calculation……………………………………………....82-86
Zone 1: Sitting Area………………………………………………………………….82
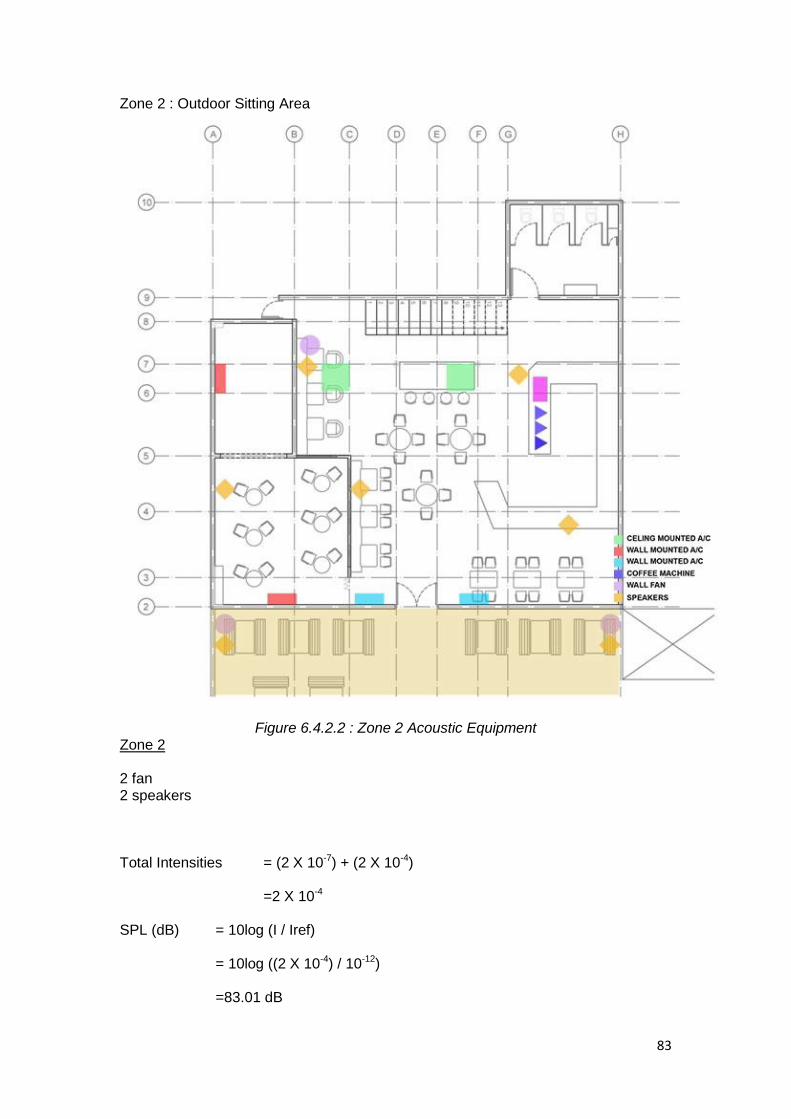
Zone 2: Outdoor Sitting Area……………………………………………………….83
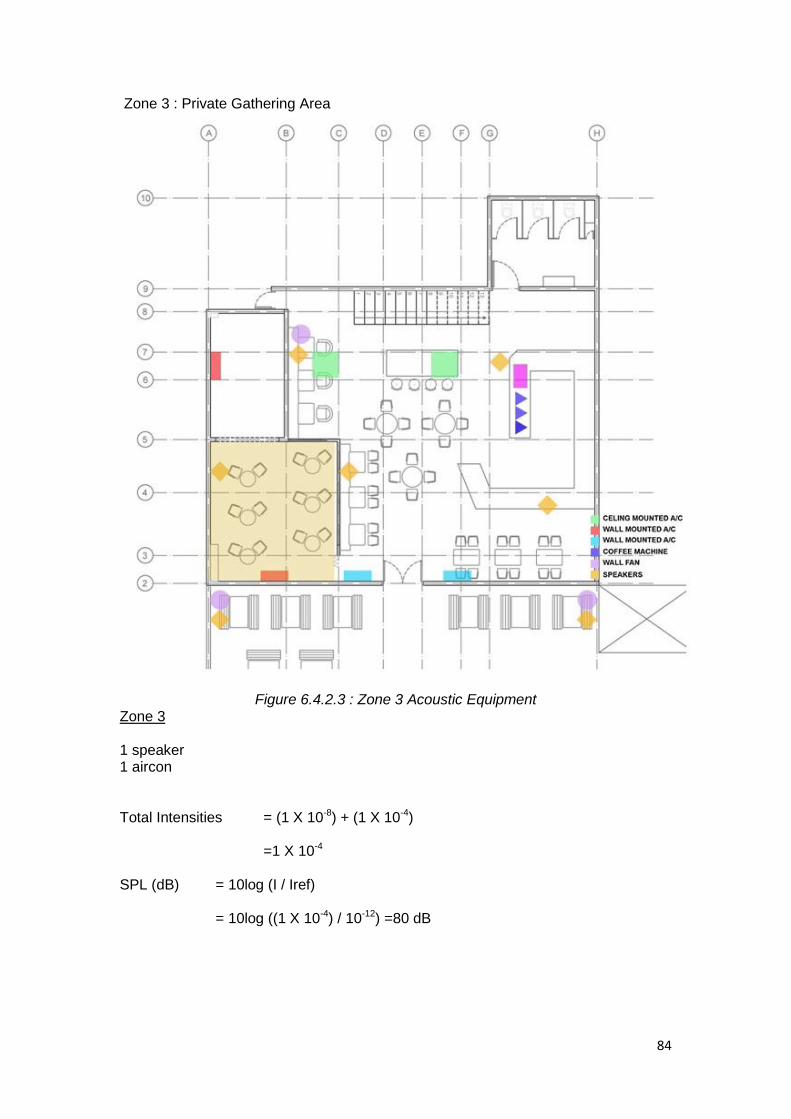
Zone 3: Private Gathering Area…………………………………………………....84.
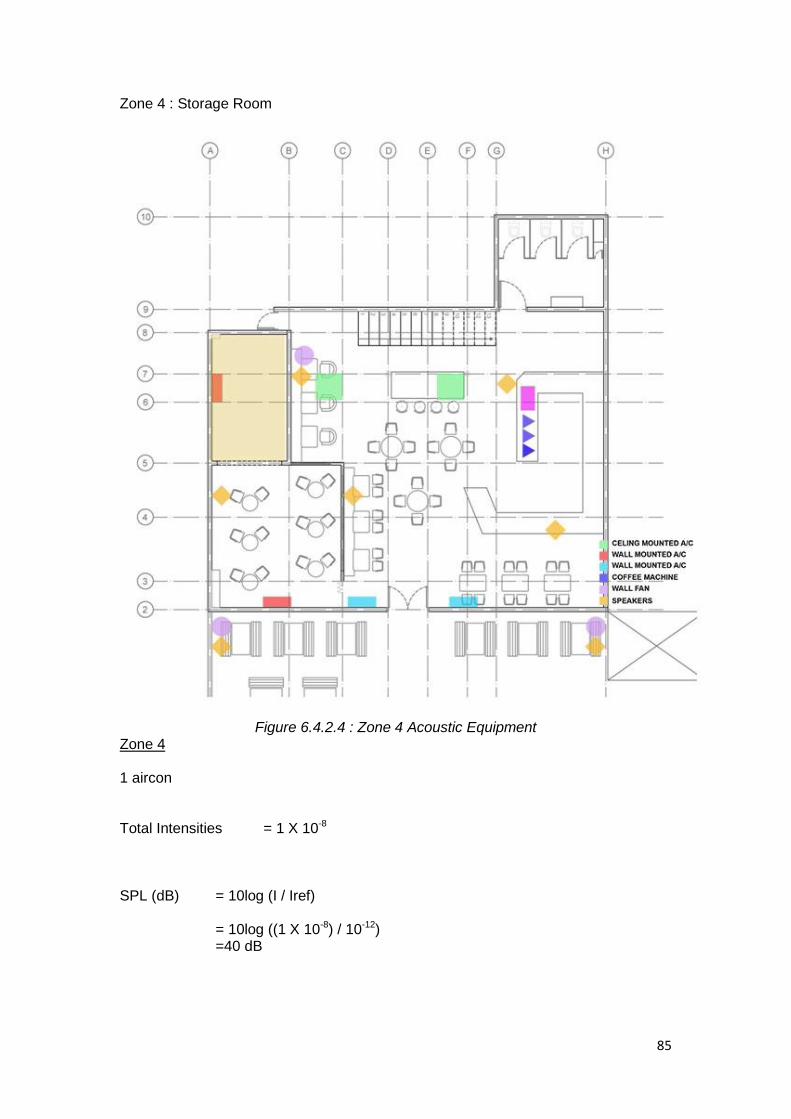
Zone 4: Storage Room 1……..……………………………………………………..85
Zone 5: Coffee Counter……..………………………………………………………86
6.4.3 Spaces Acoustic Analysis………………………………………………………...87-91
6.4.4 Reverberation Time Calculation………………………………………………....92-99
6.4.5 Sound Reduction Index Calculation…………………………………………..100-102
6.5 Analysis and Evaluation…………………………………………………………………....104
8.0 References………………………………………………………………………………105-106
9.0 Appendix………………………………………………………………………………..107- 108

4
Abstract
This report contains the details of the study conducted on the Artisan Café with regards
to the lighting and acoustical performances. The report is broken down into two main segments
Lighting and Acoustics. Included are the technical data such as formulas, equations and
calculations that estimate both luminance levels as well as noise levels for both light and
acoustic. All orthographic drawings and diagrams were made with data collected from site. The
analysis diagrams were made with Autodesk Ecotect, an analysis software.
5
1.0 INTRODUCTION
Lighting is one of the major elements when it comes to architecture design, in interior as
well as exterior architecture. The texture, colors, solid volumes and enclosed spaces can only
be appreciated and enhanced fully when they are lit imaginatively. This project exposes and
introduces student to day lighting and artificial lighting requirements in a suggested space.
Acoustic design in architecture is an element which the control of sound in spaces is to be
concerned especially for enclosed spaces. The requirements vary in relation to different
functional spaces. It is essential to preserve and enhance the desired sound and to eliminate
noise and undesired sound. This project exposes and introduces students to acoustic design
and acoustical requirements in a suggested space.
In a group of six, we chose The Artisan Café, located at Petaling Jaya as our site study. We
have conducted several visits to our site to ensure the success of our project outcome.
Measured drawings, lightings and acoustics measurements as well as photographs have been
taken while we were on site. We have also done calculations and analysis to the results of our
observations and recordings.

6
1.1 Aims and objectives
The aim and objectives of this project is as follows:
- To understand the day lighting, lighting and acoustics characteristics
- To understand the lighting and acoustic requirements in a suggested place
- To determine the characteristics and function of day lighting, artificial lighting, sound and
acoustic, within the intended space.
- To critically report and analyze the space and suggest remedies to improvise the lighting
and acoustic qualities within the space.
This project also aims to provide a better understanding on the relationship between the type of
materials that are employed in terms of building materials as well as internal furnishings and
finishes as well as their impact on acoustical and lighting conditions in the building based on the
building’s functions. Understanding the volume and area of each functional space also helps in
determining the lighting requirements based on acoustical or lighting inadequacy that is
reflected in the data collection. Acknowledging adjacent spaces is also vital to address acoustic
concerns.
In terms of lighting, specifications of luminaries, height of each type of light as well as the
existence of fenestrations will help to understand the lighting conditions within each space.
Backed up with precedent studies, drawing comparison with our site study, our precedent
studies will aid in determining the different types of lighting and acoustic.
7
2.0 PRECEDENT STUDY
2.1 Lighting Precedent Study
Solar Decathlon House, Texas Usa.
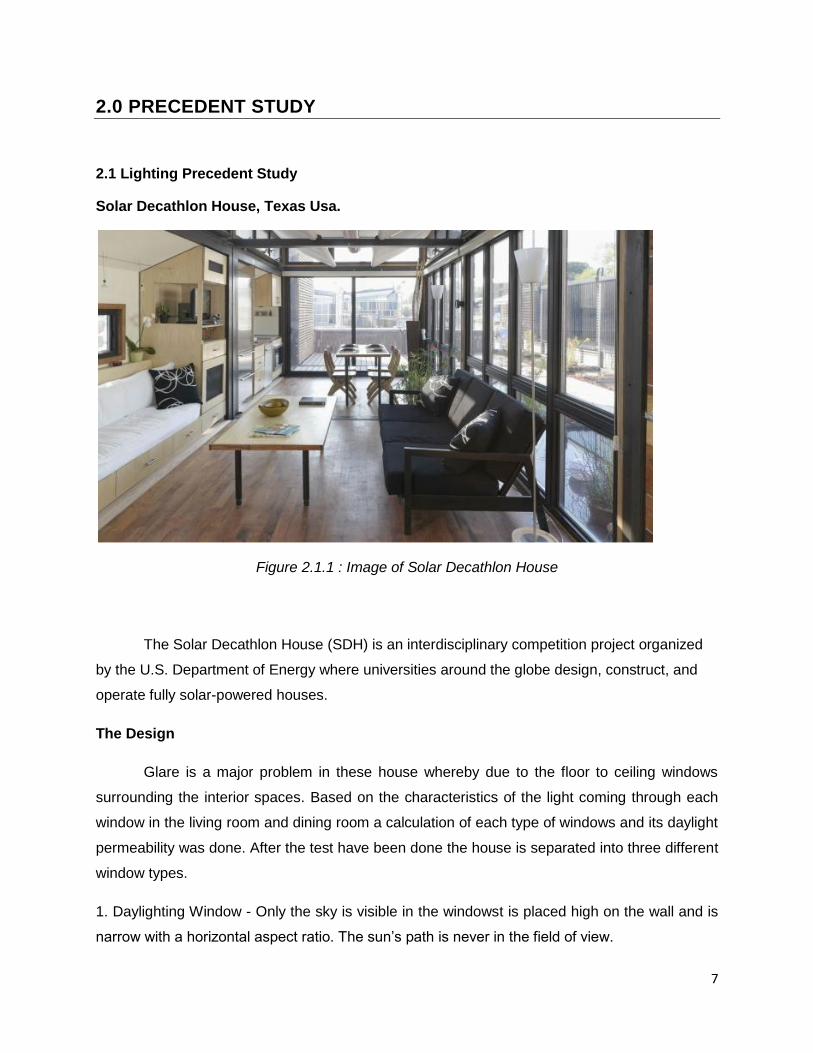
Figure 2.1.1 : Image of Solar Decathlon House
The Solar Decathlon House (SDH) is an interdisciplinary competition project organized
by the U.S. Department of Energy where universities around the globe design, construct, and
operate fully solar-powered houses.
The Design
Glare is a major problem in these house whereby due to the floor to ceiling windows
surrounding the interior spaces. Based on the characteristics of the light coming through each
window in the living room and dining room a calculation of each type of windows and its daylight
permeability was done. After the test have been done the house is separated into three different
window types.
1. Daylighting Window - Only the sky is visible in the windowst is placed high on the wall and is
narrow with a horizontal aspect ratio. The sun’s path is never in the field of view.
8
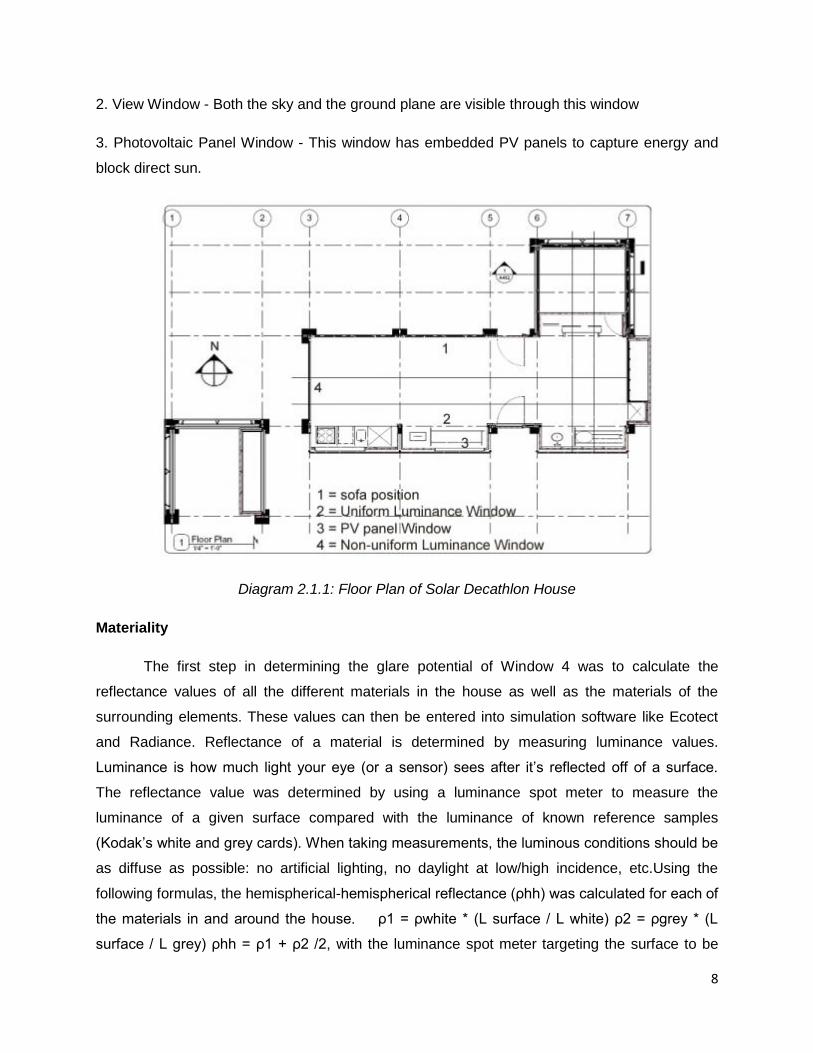
2. View Window - Both the sky and the ground plane are visible through this window
3. Photovoltaic Panel Window - This window has embedded PV panels to capture energy and
block direct sun.
Diagram 2.1.1: Floor Plan of Solar Decathlon House
Materiality
The first step in determining the glare potential of Window 4 was to calculate the
reflectance values of all the different materials in the house as well as the materials of the
surrounding elements. These values can then be entered into simulation software like Ecotect
and Radiance. Reflectance of a material is determined by measuring luminance values.
Luminance is how much light your eye (or a sensor) sees after it’s reflected off of a surface.
The reflectance value was determined by using a luminance spot meter to measure the
luminance of a given surface compared with the luminance of known reference samples
(Kodak’s white and grey cards). When taking measurements, the luminous conditions should be
as diffuse as possible: no artificial lighting, no daylight at low/high incidence, etc.Using the
following formulas, the hemispherical-hemispherical reflectance (ρhh) was calculated for each of
the materials in and around the house. ρ1 = ρwhite * (L surface / L white) ρ2 = ρgrey * (L
surface / L grey) ρhh = ρ1 + ρ2 /2, with the luminance spot meter targeting the surface to be
9
measured, the surface reflectance value was measured (L surface). That value is then
compared with the same reading taken off the white card located in the same spot (L white).
Because we know the reflectance of the card (ρwhite), we can calculate the reflectance of the
material (ρ1). The procedure is repeated using the grey card, and then the average is
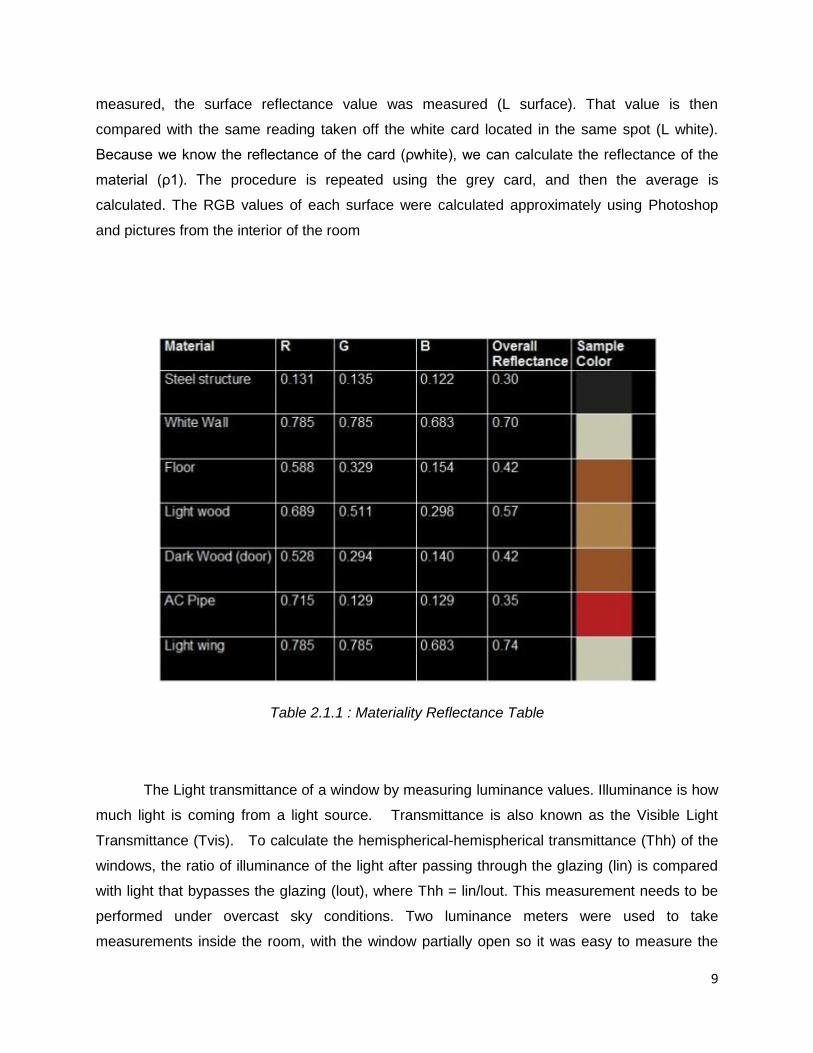
calculated. The RGB values of each surface were calculated approximately using Photoshop
and pictures from the interior of the room
Table 2.1.1 : Materiality Reflectance Table
The Light transmittance of a window by measuring luminance values. Illuminance is how
much light is coming from a light source. Transmittance is also known as the Visible Light
Transmittance (Tvis). To calculate the hemispherical-hemispherical transmittance (Thh) of the
windows, the ratio of illuminance of the light after passing through the glazing (lin) is compared
with light that bypasses the glazing (lout), where Thh = lin/lout. This measurement needs to be
performed under overcast sky conditions. Two luminance meters were used to take
measurements inside the room, with the window partially open so it was easy to measure the

10
light that had and had not passed through the glazing. In order to ensure accuracy, the
luminance meters were both calibrated and of the same brand and model. The measurements
were stopped at the same time and read simultaneously since the sky can vary its luminance
every second. Careful attention was paid not to cast any shadows over the luminance meters
Diagram 2.1.2 : Analysis Diagram
The house was then modeled in Ecotect, translating all the information captured on-site
into the model to make it as accurate as possible, including the furniture and the climatic
conditions. Within the model, camera views we set-up in the same position as on site. With the
Radiance Control Panel, the material surfaces were edited with the correct reflectance value, as
well as the correct transmittance taken on site. One challenge encountered was entering the
reflectance value of specula objects, such as the polished chrome metal refrigerator, into the 3D
model. Radiance cannot accurately represent specula materials that behave like mirrors, since
the reflectance will depend on the object being reflecting in the surface.

11
2.2 Acoustic Precedent Study
Yildiz Technical University
The auditorium hall of Yildiz Technical University (YTU University), The University took its final
name in 1992 as Yıldız Technical University located in the central campus is mainly used for
congresses, symposium, conferences and various other ceremonies. From time to time, it also
host events such as concerts. The hall was renovated in order to increase the audience
capacity and eliminate some of its disadvantages, while preserving its general architectural
characteristics.
Figure 2.2.1 : Yildiz Technical University Auditorium
Selection of Interior Surface Materials
The effects of materials with different acoustic absorption characteristics on the
acoustical environment are proportional to their surface areas. The surface materials chosen to
provide the optimum RT for the hall were also assessed with respect to their sizes. Cellular
materials for high frequency voices and vibratory panels for low frequency voices were used to
obtain a balanced frequency distribution.
The purpose of choosing the materials used are briefly explained below.
12
Floors
The audience platform was installed with 4mm thickness of felt underlying carper of
8mm thickness; upholstered chairs were used for the seating. In order to allow the sound to
reach the audience in the most efficient way, reflective materials are being used for the stage
and flooring.
Ceilings
8mm thick gypsum boards were used which covered the air conditioning installation. The
coffered ceiling was not fully covered with wooden material and was partly left as a hard
surface. In order to preserve the architectural elements of the structure itself, the height of the
audience platform has been increase Since the height of the space excluded this option from
consideration the vertical wooden panels placed around the stage were used to try to meet the
need for a reflective surface on and around the stage.
Walls
10mm thick wooden panels was considered appropriate in terms of acoustic parameters.
Some of the fiber glass-based absorbing materials was placed behind those panels in order to
maintain the balance between high and low frequency voices. Pipes and canals for the air
conditioning system were hidden by sloped panels covered with fabrics coated with gypsum,
especially at the interface of the back wall and the ceiling. The back wall of the hall was
furnished with 10 mm wooden panels, which were covered with thick fabrics in order to prevent
the generation of an echo.
13
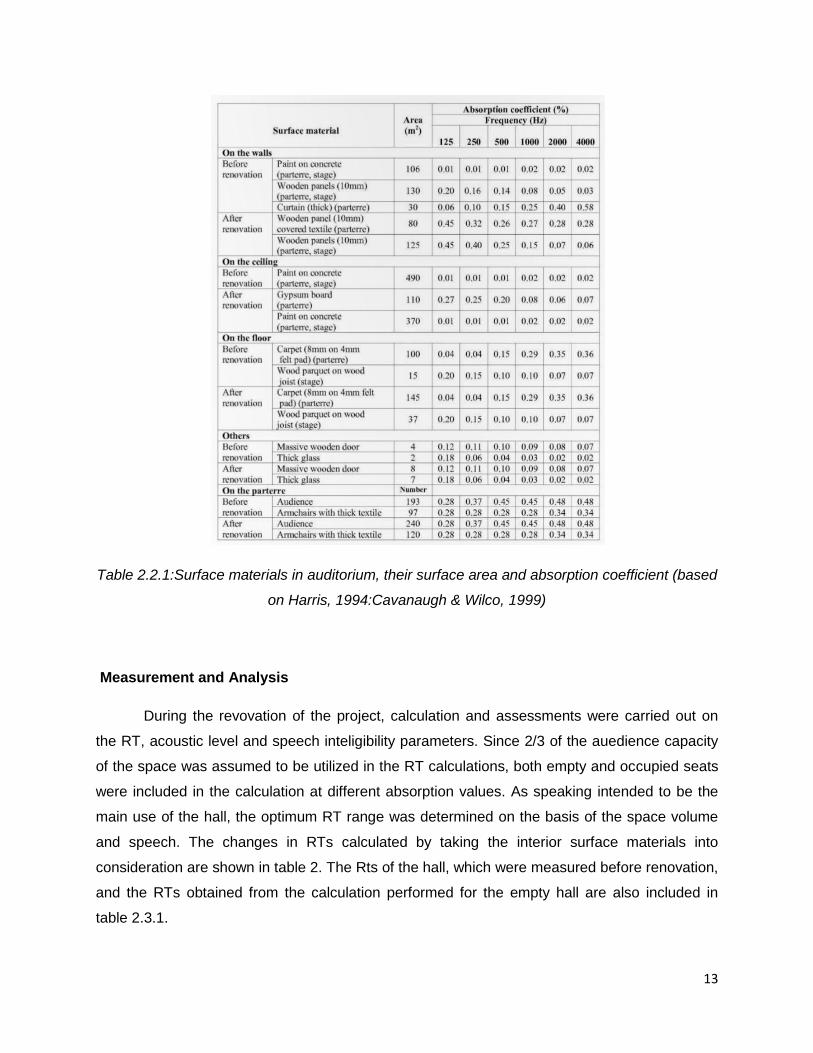
Table 2.2.1:Surface materials in auditorium, their surface area and absorption coefficient (based
on Harris, 1994:Cavanaugh & Wilco, 1999)
Measurement and Analysis
During the revovation of the project, calculation and assessments were carried out on
the RT, acoustic level and speech inteligibility parameters. Since 2/3 of the auedience capacity
of the space was assumed to be utilized in the RT calculations, both empty and occupied seats
were included in the calculation at different absorption values. As speaking intended to be the
main use of the hall, the optimum RT range was determined on the basis of the space volume
and speech. The changes in RTs calculated by taking the interior surface materials into
consideration are shown in table 2. The Rts of the hall, which were measured before renovation,
and the RTs obtained from the calculation performed for the empty hall are also included in
table 2.3.1.
14
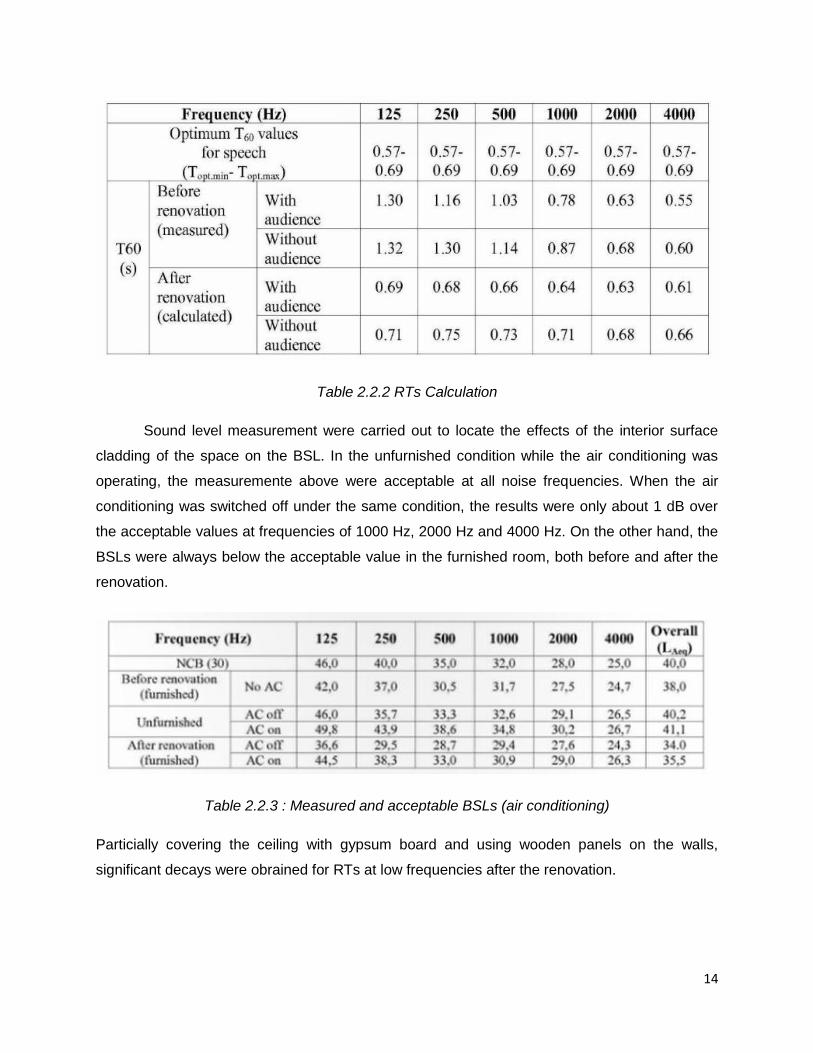
Table 2.2.2 RTs Calculation
Sound level measurement were carried out to locate the effects of the interior surface
cladding of the space on the BSL. In the unfurnished condition while the air conditioning was
operating, the measuremente above were acceptable at all noise frequencies. When the air
conditioning was switched off under the same condition, the results were only about 1 dB over
the acceptable values at frequencies of 1000 Hz, 2000 Hz and 4000 Hz. On the other hand, the
BSLs were always below the acceptable value in the furnished room, both before and after the
renovation.
Table 2.2.3 : Measured and acceptable BSLs (air conditioning)
Particially covering the ceiling with gypsum board and using wooden panels on the walls,
significant decays were obrained for RTs at low frequencies after the renovation.
15
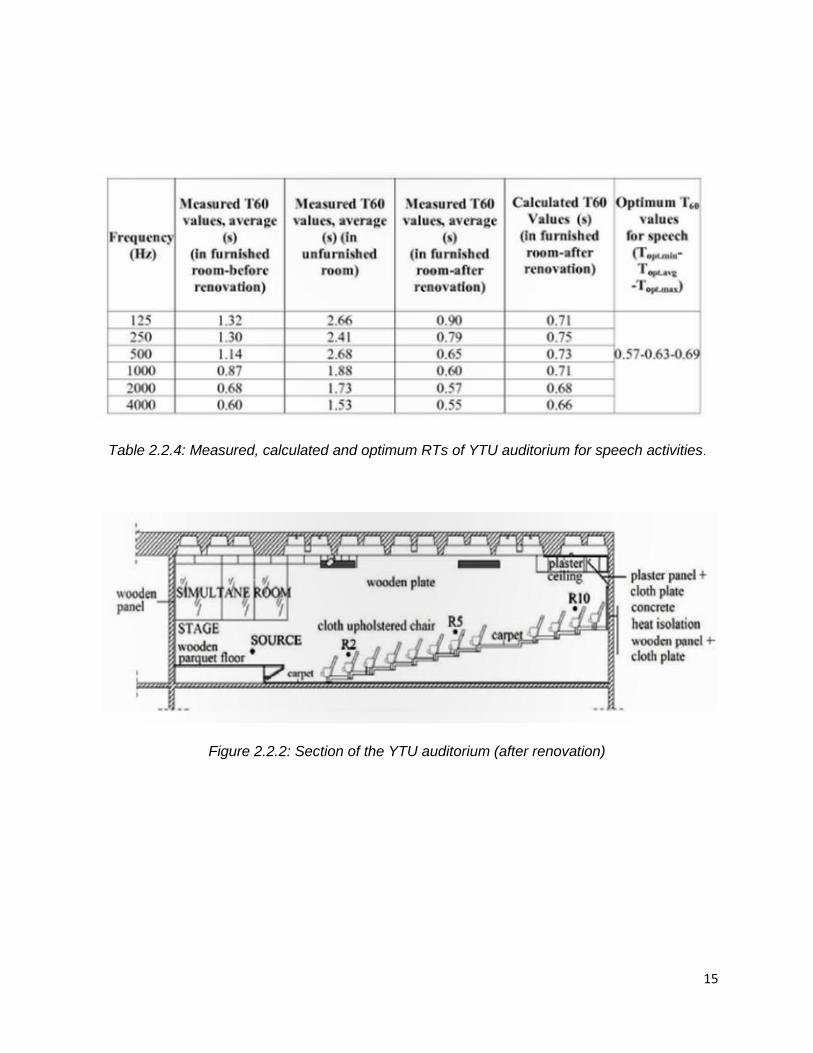
Table 2.2.4: Measured, calculated and optimum RTs of YTU auditorium for speech activities.
Figure 2.2.2: Section of the YTU auditorium (after renovation)
16
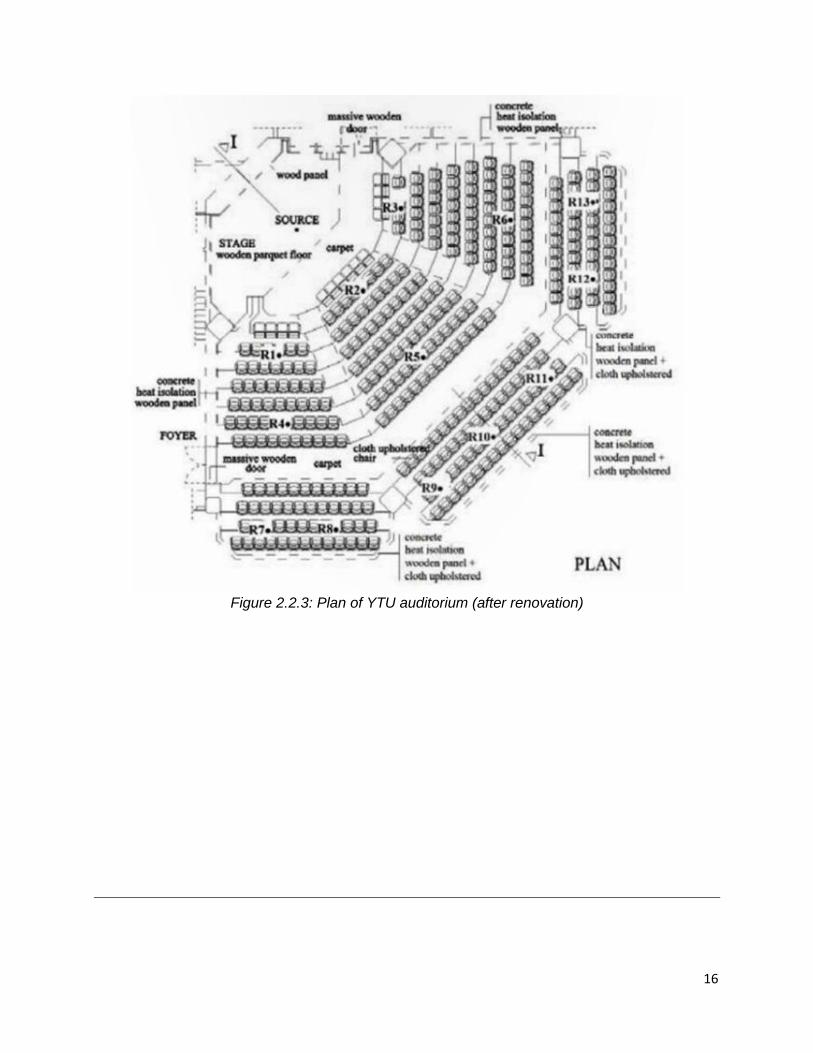
Figure 2.2.3: Plan of YTU auditorium (after renovation)
17
2.3 Conclusion of Precedent Studies
2.3.1 Solar Decathlon House, Texas
Solar Decathlon house in Texas is perceived as building flooded with natural light during
daytime. The usage of floor to ceiling windows create a vast transparency between outdoor and
indoor space, hence allowing maximum permeability of light through it. The study done
throughout the day shows a mid range result whereby there are presence of glare during an
indefinite period of time and how the reflectance value of the materials effect the results of the
analysis. The amount of glare occurrence is being determined through a software whereby
projection of thermal quantities is being brought up and analyzed. Resulting from this a data
was brought forward and the amount of glare of each windows is calculated. Overall the result
shows an amount of unacceptable glare coming from the north portion of the window whereby
glazing is present. The result is then being translated and brought up to the users of the home.
The Precedent study has gave us an insight of how glazing can enhance and deteriorate the
lighting levels of the spaces and how materiality determines the lighting levels of spaces. The
importance of daylighting levels during designing is also implemented.
2.3.2 Yildiz Technical University
The acoustical properties of the hall have a definite improvement after the renovation
being done. The change in the acoustic environment of the hall can be clearly seen due to the
use of the different surface material after the renovation. In the study being done for the
auditorium the acoustical parameters were being done through the measurements and
assessments of the qualities of the surface materials used. Results generated shows the
dynamic improvement prior to renovation. The differences in terms of measurements according
to analysis done shows that the usage of materials can drastically effect the acoustic qualities of
the space. The need for acoustical study prior to construction and build helps designers and
engineers determined a space whereby it is conducive for its usage. Overall the precedent done
for this auditorium hall has help us gain an insight to the importance of acoustical study prior to
design and build as well as the dynamic impact of material usage can change the performance
of a building.

18
3.0 RESEARCH METHODOLOGY
3.1 Methodology of Lighting Analysis
3.1.1 Measuring Device: Digital Lux Meter
Figure 3.1.1 : digital lux meter
Digital Lux Meter is a lightweight electronic device used to measure illumination. This lux meter
is provided by Taylors University to aid us in recording data for the intensity of light.
General Specifications of Model LX-101
Display 13mm (0.5’’) LCD, 3 ½ digits, Max. indication 1999
Weight 160g/0.36lb (including battery)
Dimension Main instrument: 108 x 73 x 23mm
Measurement 0 to 50,000 Lux, 3 ranges
Power Supply 006P. DC 9V battery, MN 1604 (PP3) or equivalent
Current Approx. 2.0mA (D.C)
Operating Temperature 0 to 50C (32 to 122F)
Over Input Display Indication of ‘’1’’
Zero adjustment Built in external zero adjust VR on front panel
Sensor The exclusive photo diode and colour correction filter
Standard accessories 1 instruction manual 1 sensor probe 1 carrying case, CA-04

19
Electrical Specifications of Typical Lux Meter
Range Resolution Accuracy
0-1,999 Lux 1 Lux ±(5% + 2D) 2,000-19,999 Lux 10 Lux
20,000-50,000 Lux 100 Lux
3.1.1.3 Application of Lux Meter
(a) The lux meter is switched on
(b) The lux meter is switched to a desired range (Resolution chosen : 1Lux)
(c) The sensor probe of the lux meter is held facing upwards t specific points
according
to our 2m gridded floor plan at 1m height.
(d) A reading is shown on the display screen of the lux meter
(e) The reading is recorded
(f) Steps (c), (d) and (e) are repeated by holding the lux meter at 1.5m height,
average
human eye level.
3.1.1.4 Limitation of Study
A lux meter is easy to use and handle. However, there may be some discrepancies in the
results when taking readings using a lux meter.
- Random Error
Human error has been cited as a contributing factor which might affect the readings taken by
the lux meter for instance; misreading the data shown on the lux meter. In addition, an
inconsistent holding position of the meter might/will affect the data collection.
Weather is an unpredictable cause of certain errors as well. For example, during specific data
collection time frames, the weather might change from extremely sunny to very cloudy/gloomy

20
and sunny again. Said change will greatly affect readings taken during that time. Additionally,
shadows casted on chosen area of recording will also have an impact on the Lux reading. Any
glare existent during the recordings will affect the internal lighting measurements.
Solutions: Repeat procedures and take several readings at the same height, then calculate the
average value which will be more precise.
- Systematic Error
The instrument might take a few seconds to stabilize the reading due to the sensitivity of the
sensor. Readings taken before the value stabilizes might give an inaccurate reading and
sometimes there could be a big gap between both readings of a particular position.
Solutions: Prepare a stand of respective height and leave it untouched until the measurement
stabilises before recording it.
3.1.2 Data Collection Method
Measurements are taken at two different times which is 12.00pm and 8pm, one with daylight
and the other without. In order to obtain reliable readings, the lux meter was placed at the same
height from the floor at each, 1m (waist height) and 1.5m (eye level). Each recording was done
by facing towards the similar direction, to synchronize the results. Plans with a perpendicular 2m
x 2m gridline were used as a reference guideline, whereby the intersections serve as data
recording points. In total there are ### points for lighting and acoustic data collection. Same
procedure are repeated for indoor and outdoor for both times.

21
Diagram3.1.1 : Standard height used to record Lux readings
Diagram 3.1.2 : 2m x 2m gridlines for recordings
22
3.1.3 Lighting Analysis Calculation
Lighting analysis is done by averaging the lux readings of demarcated 9zones based on
ms1525.
3.1.3.1 Daylight Factor, DF
daylight factor, DF = Einternal / Eexternalx 100
where,
Einternal = illuminance due to daylight at a point on the indoor’s working plane
Eexternal = direct sunlight
= 32,000 lx
For example, given that Einternal = 8000lx,
hence,
daylight factor, DF = Einternal / Eexternalx 100 8000/32000 x 100 = 25
3.1.3.2 Lumen Method
The Lumen Method is used to determine the number of lamps that should be installed for a
given area or room. In this case, fixtures are already installed, therefore, we are calculating the
total luminance of the space based on the number of fixtures and determine whether or not that
particular space has enough lighting fixtures.
the number of lamps is given by the formula:
N = E X A / F X UF X MF
where, N = number of lamps required
E = luminance level required (lux)
A = area at working plane height(m2)
F = average luminous flux from each lamp (lm)
UF = utilization factor, an allowance for the light distribution of the luminaire and
the room surfaces
MF = maintenance factor, an allowance for the reduced light output because of
deterioration and dirt

23
Room Index, RI, is the ratio of room plan area to half the wall area between the working and
luminaire planes:
RI= L X W / Hm x (L +W)
where, L = length of room
W = width of room
Hm = mounting height, i.e. the vertical distance between the working plane and
the luminaries
24
3.2 Methodology of Acoustics Analysis
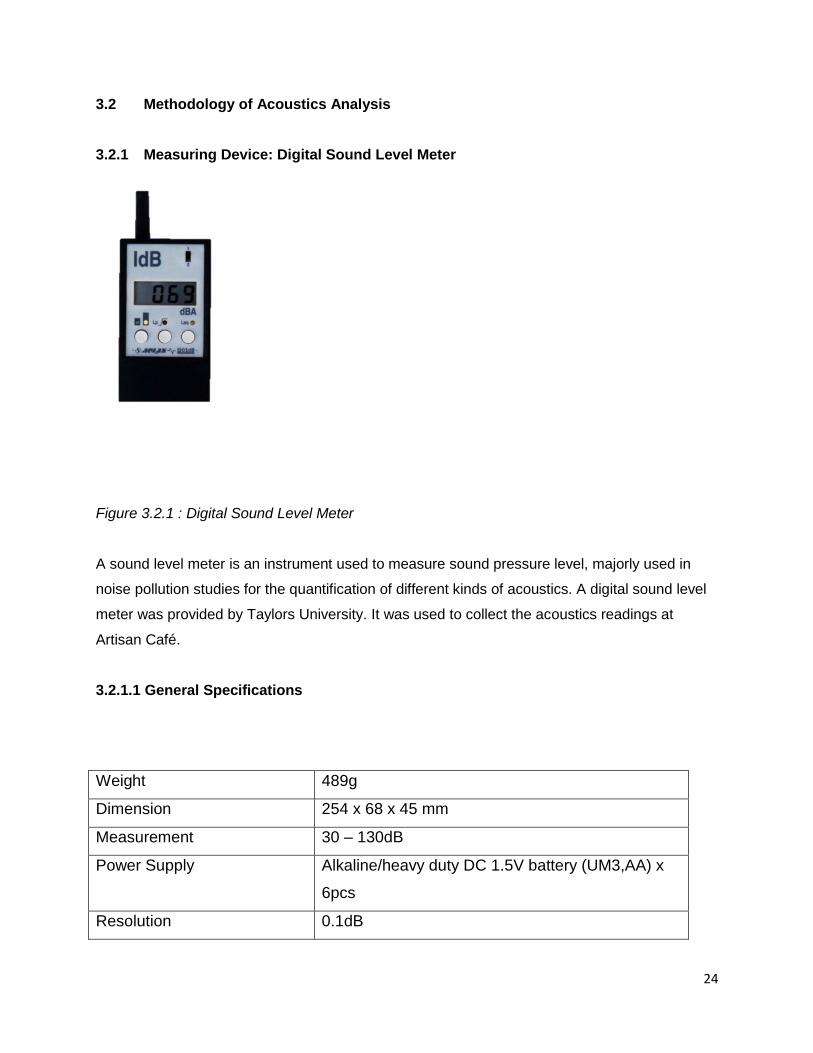
3.2.1 Measuring Device: Digital Sound Level Meter
Figure 3.2.1 : Digital Sound Level Meter
A sound level meter is an instrument used to measure sound pressure level, majorly used in
noise pollution studies for the quantification of different kinds of acoustics. A digital sound level
meter was provided by Taylors University. It was used to collect the acoustics readings at
Artisan Café.
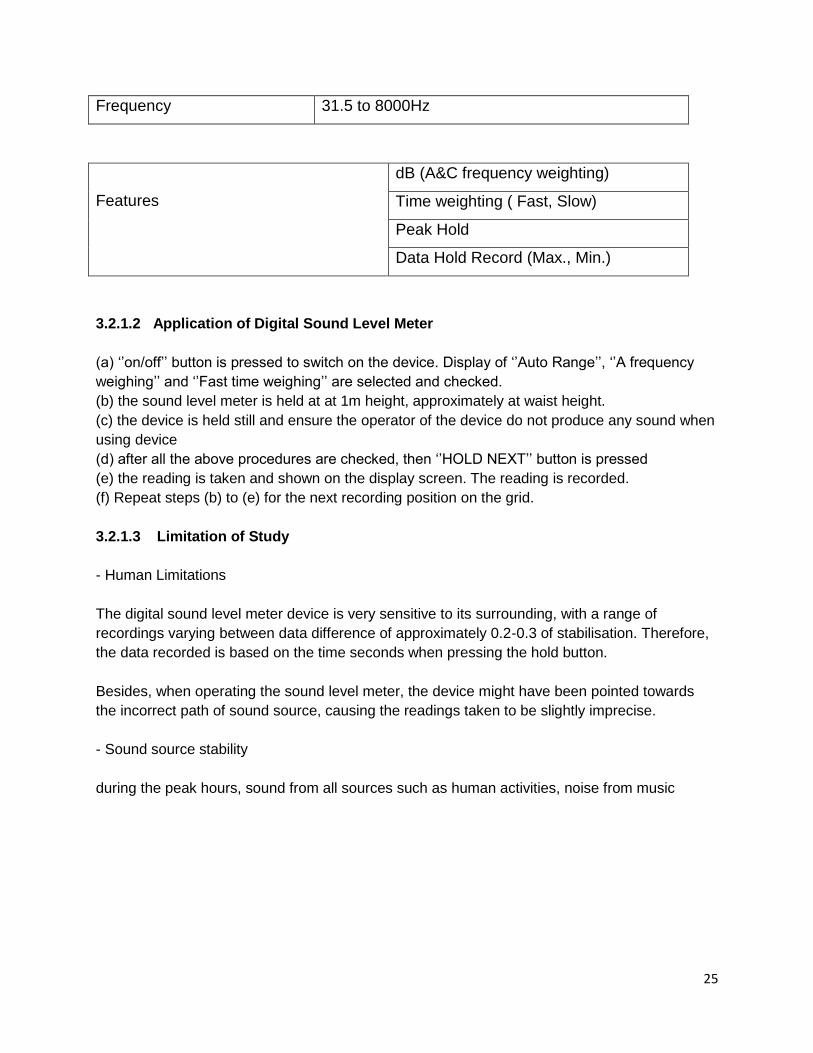
3.2.1.1 General Specifications
Weight 489g
Dimension 254 x 68 x 45 mm
Measurement 30 – 130dB
Power Supply Alkaline/heavy duty DC 1.5V battery (UM3,AA) x
6pcs
Resolution 0.1dB
25
Frequency 31.5 to 8000Hz
Features
dB (A&C frequency weighting)
Time weighting ( Fast, Slow)
Peak Hold
Data Hold Record (Max., Min.)
3.2.1.2 Application of Digital Sound Level Meter
(a) ‘’on/off’’ button is pressed to switch on the device. Display of ‘’Auto Range’’, ‘’A frequency
weighing’’ and ‘’Fast time weighing’’ are selected and checked.
(b) the sound level meter is held at at 1m height, approximately at waist height.
(c) the device is held still and ensure the operator of the device do not produce any sound when
using device
(d) after all the above procedures are checked, then ‘’HOLD NEXT’’ button is pressed
(e) the reading is taken and shown on the display screen. The reading is recorded.
(f) Repeat steps (b) to (e) for the next recording position on the grid.
3.2.1.3 Limitation of Study
- Human Limitations
The digital sound level meter device is very sensitive to its surrounding, with a range of
recordings varying between data difference of approximately 0.2-0.3 of stabilisation. Therefore,
the data recorded is based on the time seconds when pressing the hold button.
Besides, when operating the sound level meter, the device might have been pointed towards
the incorrect path of sound source, causing the readings taken to be slightly imprecise.
- Sound source stability
during the peak hours, sound from all sources such as human activities, noise from music

26
speakers and coffee machines have had a great impact to the acoustic data recorded.
During the normal hours, external sounds form surrounding site varies from time to time which
affect the data collection as well.
3.1.2 Data Collection Method
Readings are recorded at two different times, which is 12pm and 8pm, non-peak and peak
hours respectively. In order to acquire the accurate reading, the sound level meter was placed
at the same height, 1.5m from floor level at every point. The operator of the device shall not talk
and make any noise in order to guarantee reliable sound readings. Each recording was done
facing the same direction, again to synchronize the results. Plans with a perpendicular 2m x 2m
gridline were used as reference guideline where the intersection points serve as the data
recording points. The radings are then tabulated. Same procedure is repeated for both indoor
and outdoor.
Diagram 3.2.1 : consistent height of reading 1.5m
27
3.1.3 Acoustic Analysis Calculation
acoustic analysis is one by categorizing the area into two different zones. The material used,
absorption coefficient, area, volume and calculation will be explained zone by zone.
3.2.3.1 Reverberation Time, RT
RT is the primary descriptor of an acoustic environment which is used to calculate the
reverberation time of an enclosed space.
Reverberation time, RT = 0.16 x space volume / total absorption
3.2.3.2 Sound Pressure Level, SPL
SPL is the average sound level at a space.
Sound Pressure Level, SPL = 10log10 (l/lo(ref) )
where, l = sound power/intensity (watts)
lo = reference power (1 x 10-12 watts)
3.2.3.2 Sound Reduction Index, SRI
SRI is used to calculate the transmission loss of materials.
Sound Reduction Index, SRI = 10log10(1/Tav)
where, Tav = (S1 x TC1 + S2 x TC2 +…..+ Sn x TCn ) / TOTAL SURFACE AREA
Sn= surface area of material n
TCn = Transmission coefficient of material
28
4.0 SITE STUDY
4.1 Introduction
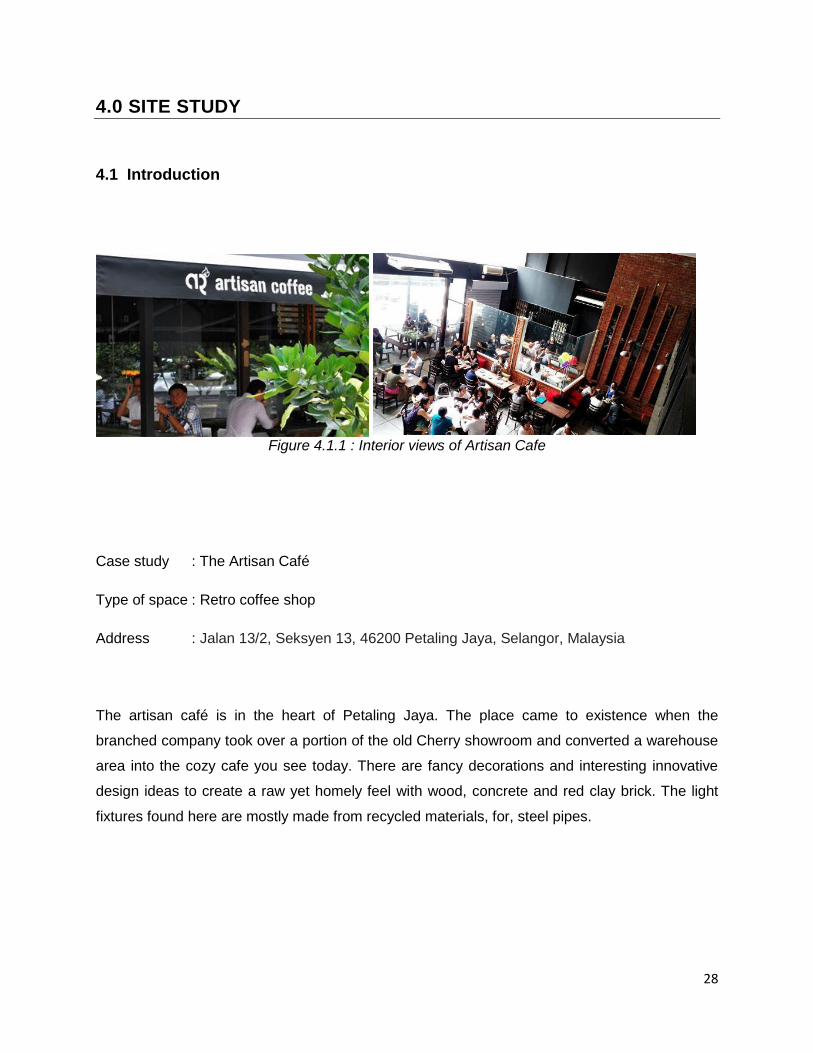
Figure 4.1.1 : Interior views of Artisan Cafe
Case study : The Artisan Café
Type of space : Retro coffee shop
Address : Jalan 13/2, Seksyen 13, 46200 Petaling Jaya, Selangor, Malaysia
The artisan café is in the heart of Petaling Jaya. The place came to existence when the
branched company took over a portion of the old Cherry showroom and converted a warehouse
area into the cozy cafe you see today. There are fancy decorations and interesting innovative
design ideas to create a raw yet homely feel with wood, concrete and red clay brick. The light
fixtures found here are mostly made from recycled materials, for, steel pipes.

29
4.2 Reason for Selection
Artisan café has various issues involving lighting and acoustic which relates to the
analysis done for this project. In terms of acoustic issues, the site context of the café is mainly
an industrial area in Petaling Jaya. This affects the café due to the noise produced in the
neighboring context whereby car showrooms and service centers are neighboring the café. The
material choice and finishes used in the café also affect the reverberation.
Lighting design in artisan café also has its own issues. Due to the café concept to
provide a relaxing and subtle environment, the café has employed a lighting design which uses
dim lights and it proves to be insufficient. Light Glaring is also an issue faced by the café itself.
The front façade of the café is enveloped by glass where direct sunlight could penetrate
through, this is counteracted with an adjustable awning installed to provide shading and improve
the glare control of the space.
Figure4.1.2: Site Context of the Cafe
30
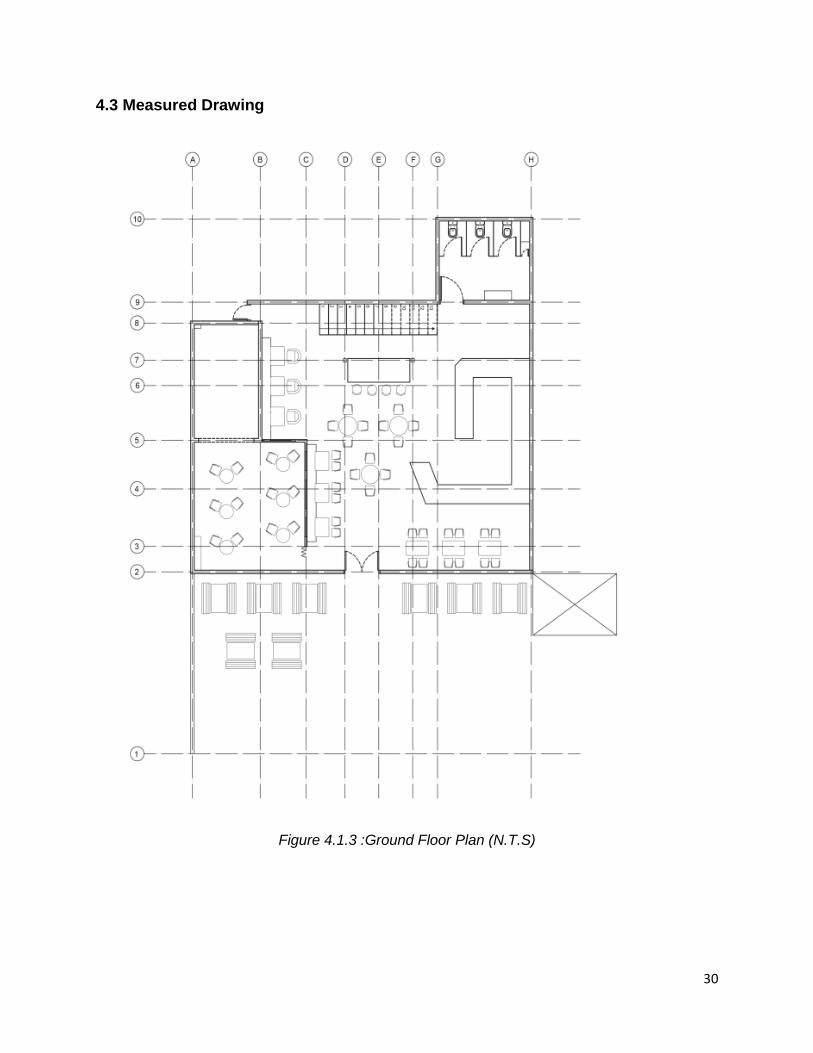
4.3 Measured Drawing
Figure 4.1.3 :Ground Floor Plan (N.T.S)

31
Figure 4.1.4 : Mezzanine Floor Plan(N.T.S)
Figure 4.1.5 : Sectional Drawing (N.T.S)
32
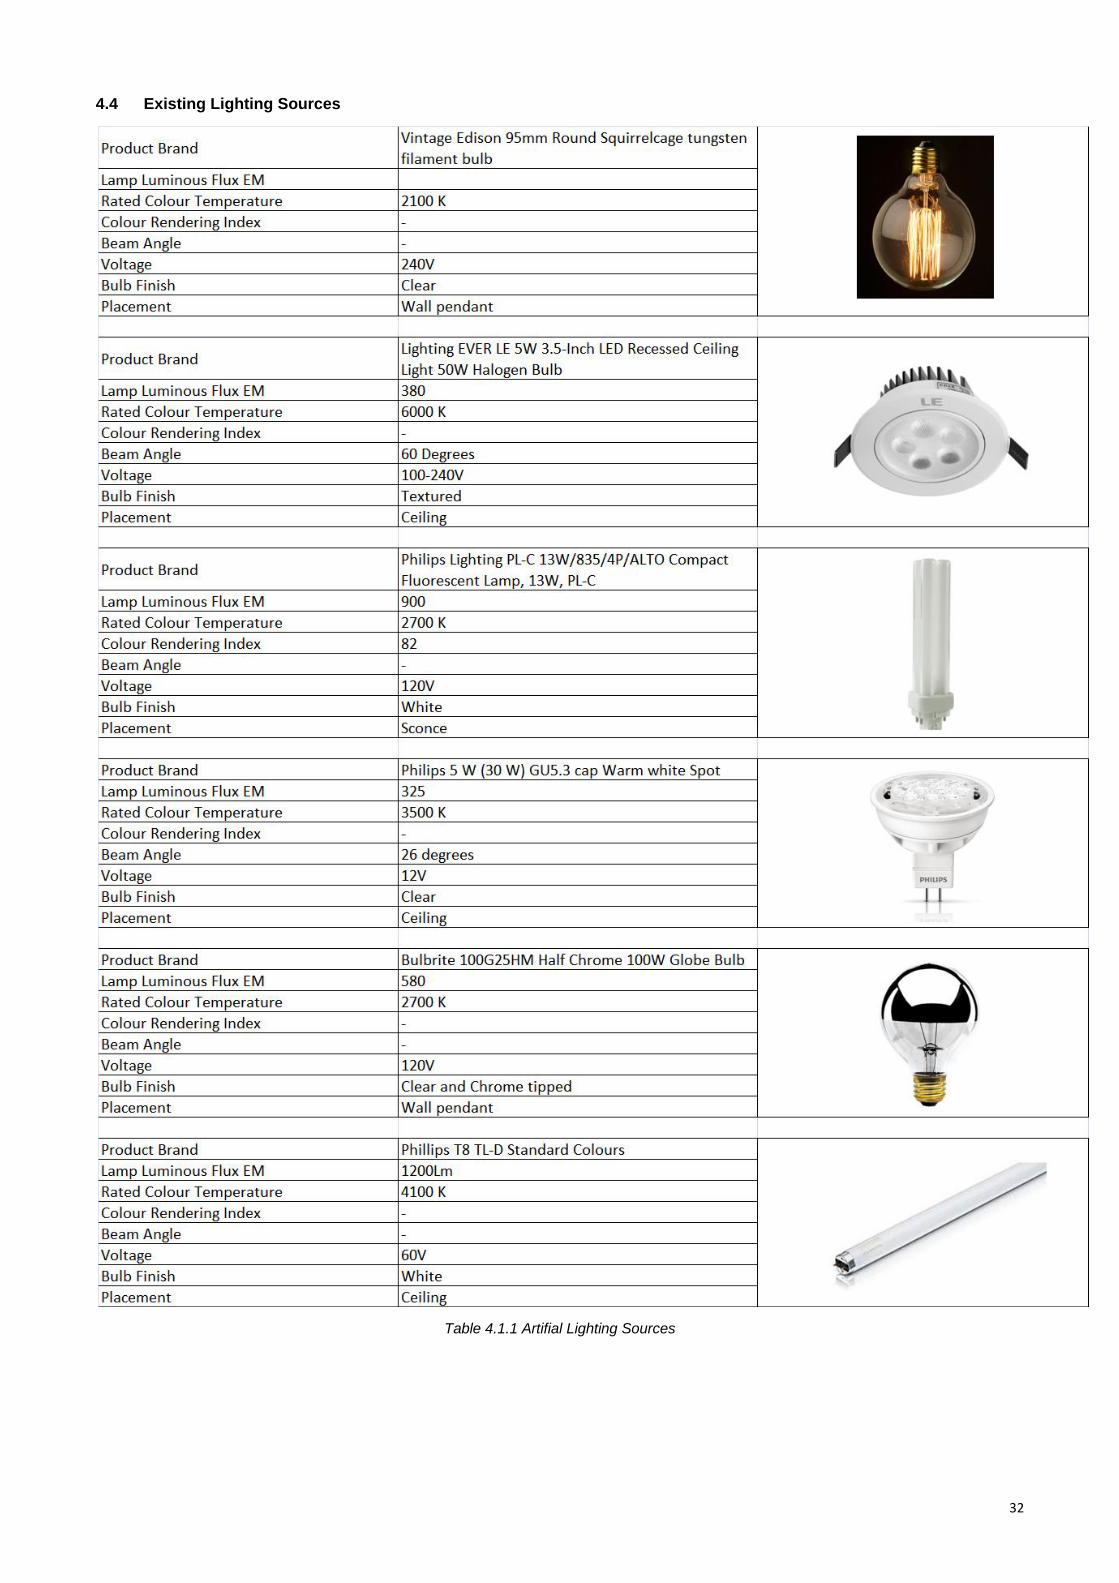
4.4 Existing Lighting Sources
Table 4.1.1 Artifial Lighting Sources

33
4.5 Existing Acoustic Sources
Table 4.1.2 Acoustic Sources
34
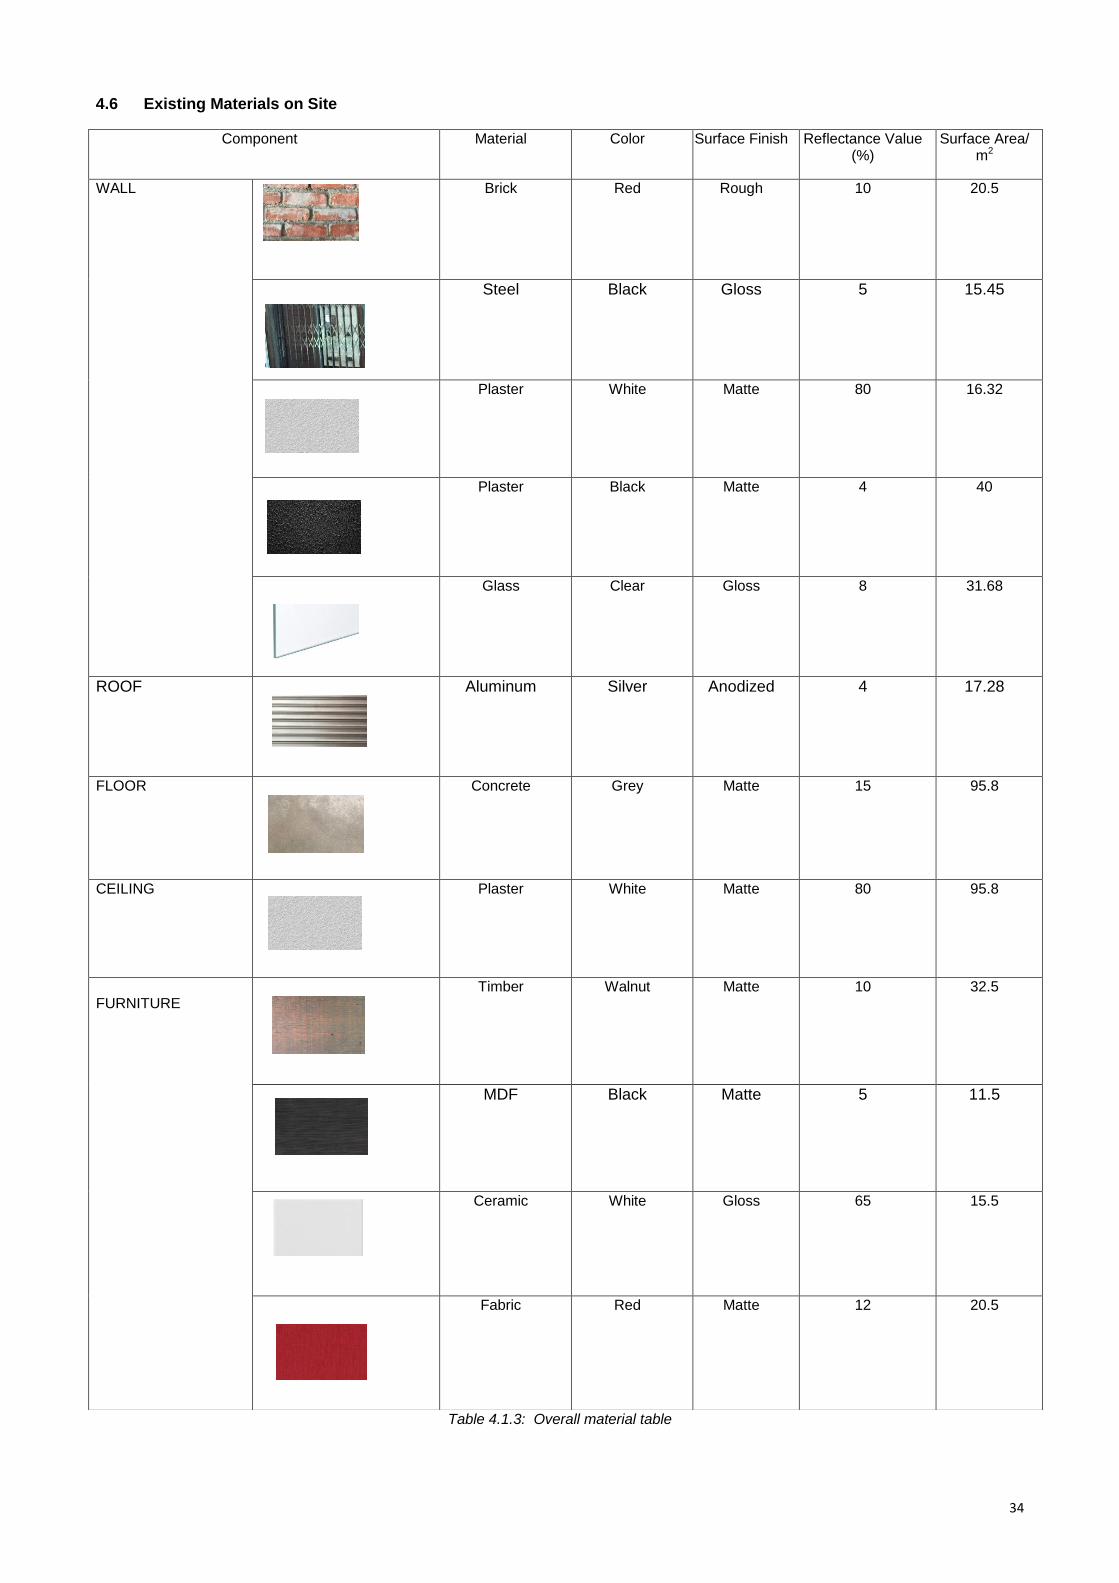
4.6 Existing Materials on Site
Table 4.1.3: Overall material table
Component Material Color Surface Finish Reflectance Value (%)
Surface Area/ m2
WALL Brick Red Rough 10 20.5
Steel Black Gloss 5 15.45
Plaster White Matte 80 16.32
Plaster Black Matte 4 40
Glass Clear Gloss 8 31.68
ROOF Aluminum Silver Anodized 4 17.28
FLOOR Concrete Grey Matte 15 95.8
CEILING Plaster White Matte 80 95.8
FURNITURE
Timber Walnut Matte 10 32.5
MDF Black Matte 5 11.5
Ceramic White Gloss 65 15.5
Fabric Red Matte 12 20.5

35
4.7 Zoning Of Spaces
Figure 4.7.1 : Ground Floor Zoning Figure 4.7.2 : Mezzanine Floor Zoning
Zone 1 : Sitting Area Zone 7 : Toilet 2
Zone 2 :Outdoor Sitting Area Zone 8 : Seating Area 2
Zone 3 :Private Gathering Area Zone 9 : Storage Room 2
Zone 4 :Storage Room
Zone 5 :Coffee Counter
Zone 6 :Toilet
36
5.0 LIGHTING ANALYSIS
5.1 Lighting Lux Readings
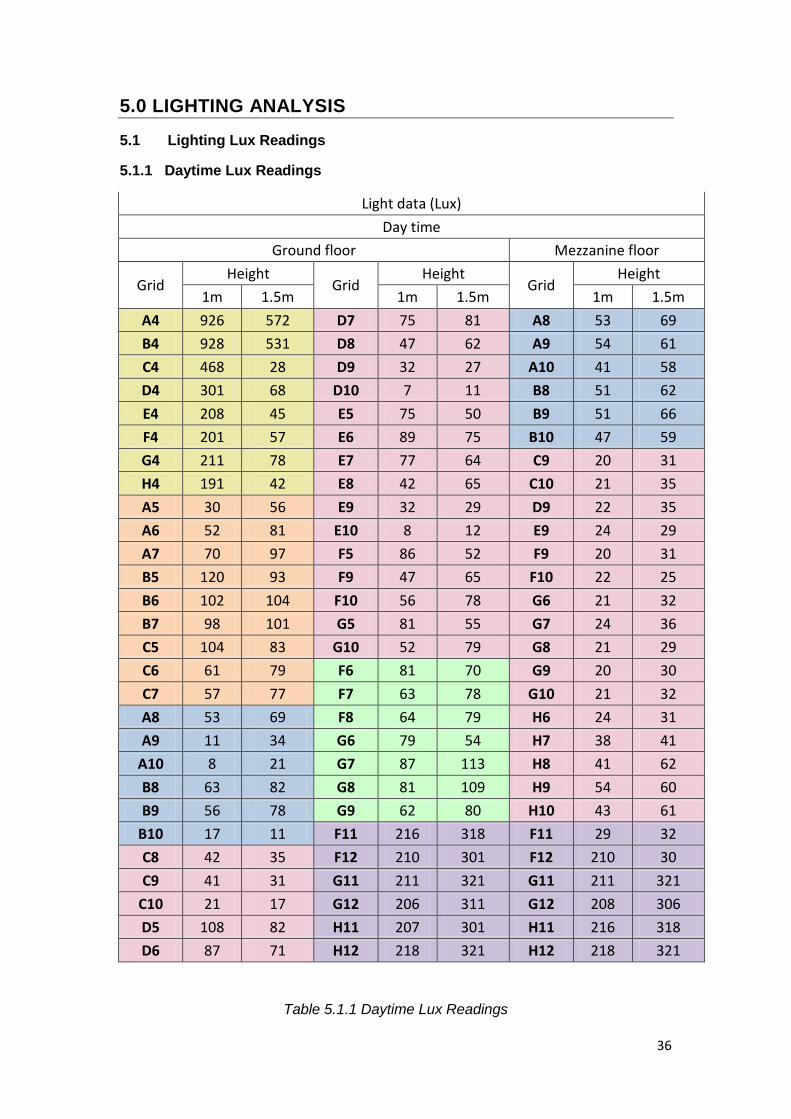
5.1.1 Daytime Lux Readings
Light data (Lux)
Day time
Ground floor Mezzanine floor
Grid Height
Grid Height
Grid Height
1m 1.5m 1m 1.5m 1m 1.5m
A4 926 572 D7 75 81 A8 53 69
B4 928 531 D8 47 62 A9 54 61
C4 468 28 D9 32 27 A10 41 58
D4 301 68 D10 7 11 B8 51 62
E4 208 45 E5 75 50 B9 51 66
F4 201 57 E6 89 75 B10 47 59
G4 211 78 E7 77 64 C9 20 31
H4 191 42 E8 42 65 C10 21 35
A5 30 56 E9 32 29 D9 22 35
A6 52 81 E10 8 12 E9 24 29
A7 70 97 F5 86 52 F9 20 31
B5 120 93 F9 47 65 F10 22 25
B6 102 104 F10 56 78 G6 21 32
B7 98 101 G5 81 55 G7 24 36
C5 104 83 G10 52 79 G8 21 29
C6 61 79 F6 81 70 G9 20 30
C7 57 77 F7 63 78 G10 21 32
A8 53 69 F8 64 79 H6 24 31
A9 11 34 G6 79 54 H7 38 41
A10 8 21 G7 87 113 H8 41 62
B8 63 82 G8 81 109 H9 54 60
B9 56 78 G9 62 80 H10 43 61
B10 17 11 F11 216 318 F11 29 32
C8 42 35 F12 210 301 F12 210 30
C9 41 31 G11 211 321 G11 211 321
C10 21 17 G12 206 311 G12 208 306
D5 108 82 H11 207 301 H11 216 318
D6 87 71 H12 218 321 H12 218 321
Table 5.1.1 Daytime Lux Readings

37
5.1.2 Nighttime Lux Readings
Lighting data (Lux)
Night time
Ground floor Mezzanine floor
Grid Height
Grid Height
Grid Height
1M 1.5M 1M 1.5M 1M 1.5M
A4 24 44 D7 14 25 A8 10 15
B4 28 42 D8 12 22 A9 12 16
C4 31 42 D9 10 22 A10 12 17
D4 32 43 D10 12 24 B8 14 19
E4 34 43 E5 14 26 B9 15 22
F4 32 44 E6 16 28 B10 14 18
G4 31 42 E7 12 20 C9 11 20
H4 30 41 E8 10 20 C10 12 21
A5 13 19 E9 11 21 D9 19 21
A6 14 20 E10 12 23 E9 20 19
A7 15 23 F5 15 27 F9 18 21
B5 12 20 F9 12 21 F10 19 20
B6 14 20 F10 10 20 G6 11 20
B7 15 23 G5 14 25 G7 12 21
C5 11 22 G10 10 20 G8 10 20
C6 12 25 H5 15 27 G9 12 22
C7 17 27 H10 11 21 G10 10 21
A8 34 60 F6 18 26 H6 11 20
A9 37 65 F7 16 23 H7 10 20
A10 35 62 F8 14 24 H8 11 21
B8 35 64 G6 20 28 H9 10 20
B9 39 67 G7 15 21 H10 10 21
B10 34 63 G8 12 22 F11 10 21
C8 27 24 G9 10 23 F12 12 23
C9 15 20 H6 19 29 G11 10 21
C10 13 21 H7 14 21 G12 11 20
D5 20 37 H8 13 21 H11 129 175
D6 18 35 H9 11 22 H12 125 170
F11 10 21
F12 12 24
G11 10 22
G12 11 21
H11 127 172
H12 128 167
Table 5.1.2 Nightime Lux Readings

38
5.1.3 Observation and Discussion
Based on the lighting data table above, the following observations were noted along
with relevant discussions.
Observation 1:
Both light data collected during the day and night are lower than the recommended
lux level by MS 1525.
Discussion 1:
This is due to the owner trying to achieve the desired ambience and environment in
the café.
Observation 2:
Light data collected at a level of 1.5m above ground level are higher than the
readings taken at a level of 1m above ground
Discussion 2:
This is due to the proximity of the lux meter to the artificial light source. At a level of
1.5m, the lux meter is close to the source, thus it receives a higher lux reading as
compared to the reading taken at a level of 1m above ground.
Observation 3:
Lux readings in the toilet areas (ZONE 6 & ZONE 7) are relatively high as compared
to other spaces.
Discussion 3:
This is due to the ample amount of light sources in the relatively small area.

39
Figure 5.1.1: Artificial Light Diagram
The figure above illustrates the lighting rays of different artificial lighting used
in Artisan Cafe. The sitting area of the cafe has a really low light level due to the low
intensity lamps used. The sitting area uses wall lighting and pendant lighting as the
source of artificial lighting. This creates a really dark environment whereby it relates
to the theme of the cafe itself. There are no presence of down light or spotlights in
the sitting area of the cafe. However, the toilets are lighted up by LED spotlights,
used to increase the brightness of the space.
Figure 5.1.2: Natural Light Diagram
The figure above indicates the source of natural lighting throughout the
interior spaces of the cafe. Due to the facade of the building being glass, natural
lighting penetration is ample throughout the space. However due to glare the cafe
fitted blinds and retractable awnings on the windows and outdoor area solve this
matter.
40
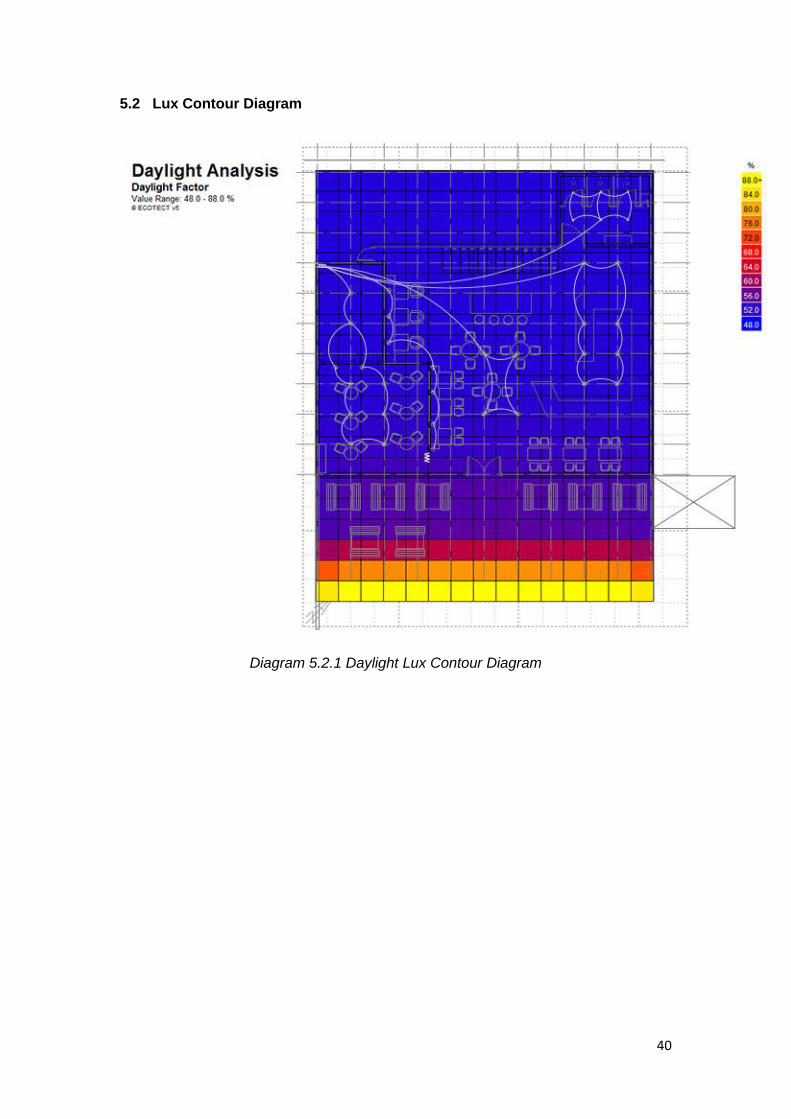
5.2 Lux Contour Diagram
Diagram 5.2.1 Daylight Lux Contour Diagram
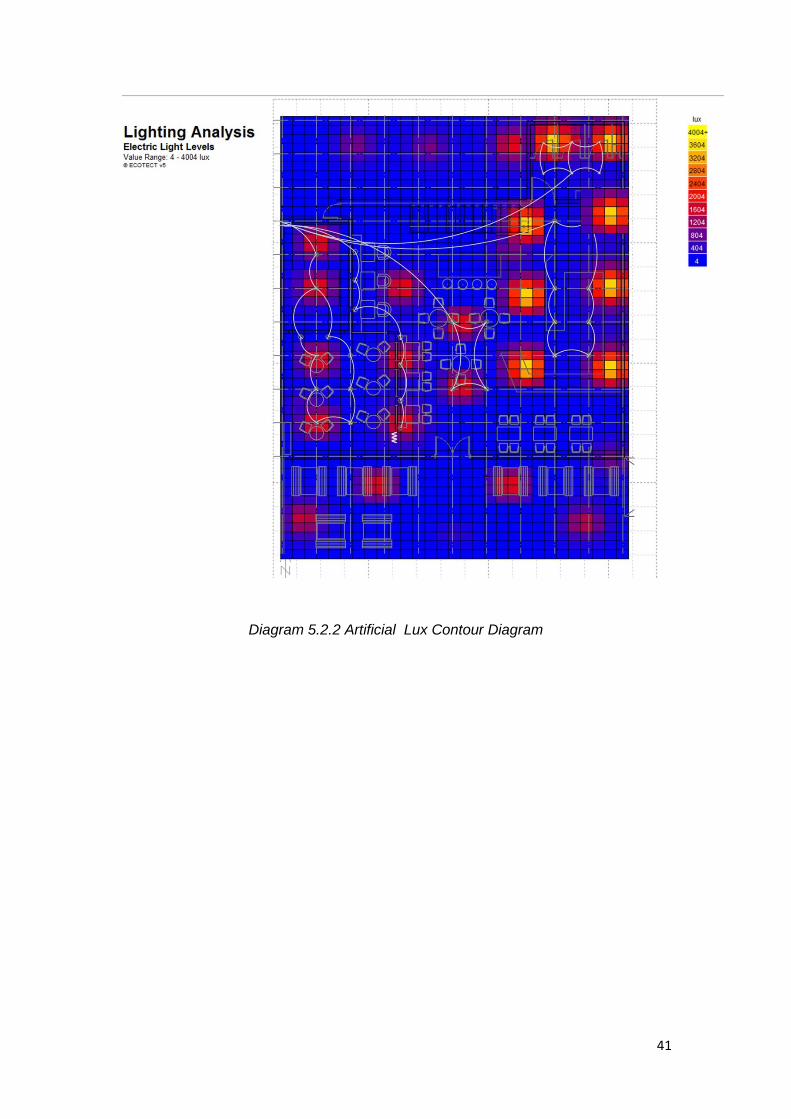
41
Diagram 5.2.2 Artificial Lux Contour Diagram

42
5.3 Analysis and Calculation
5.3.1 Daylight Factor Calculation
Time/ Date/ Sky Condition
Zone
Daylight Level in Malaysia Eo (lux)
Average Lux reading Ei (lux)
Daylight Factor, DF DF = (Ei / Eo) X 100%
11th April 2014
12.30 PM Sunny
Zone 1
32000
75.92
DF = (Ei / Eo) X 100% DF = (75.92 /
32000) X100% 0.24%
Zone 2
303.44
DF = (Ei / Eo) X 100% DF = (303.44 /
32000) X100% 0.95%
Zone 3
80.42
DF = (Ei / Eo) X 100% DF = (80.42 /
32000) X100% 0.25%
43
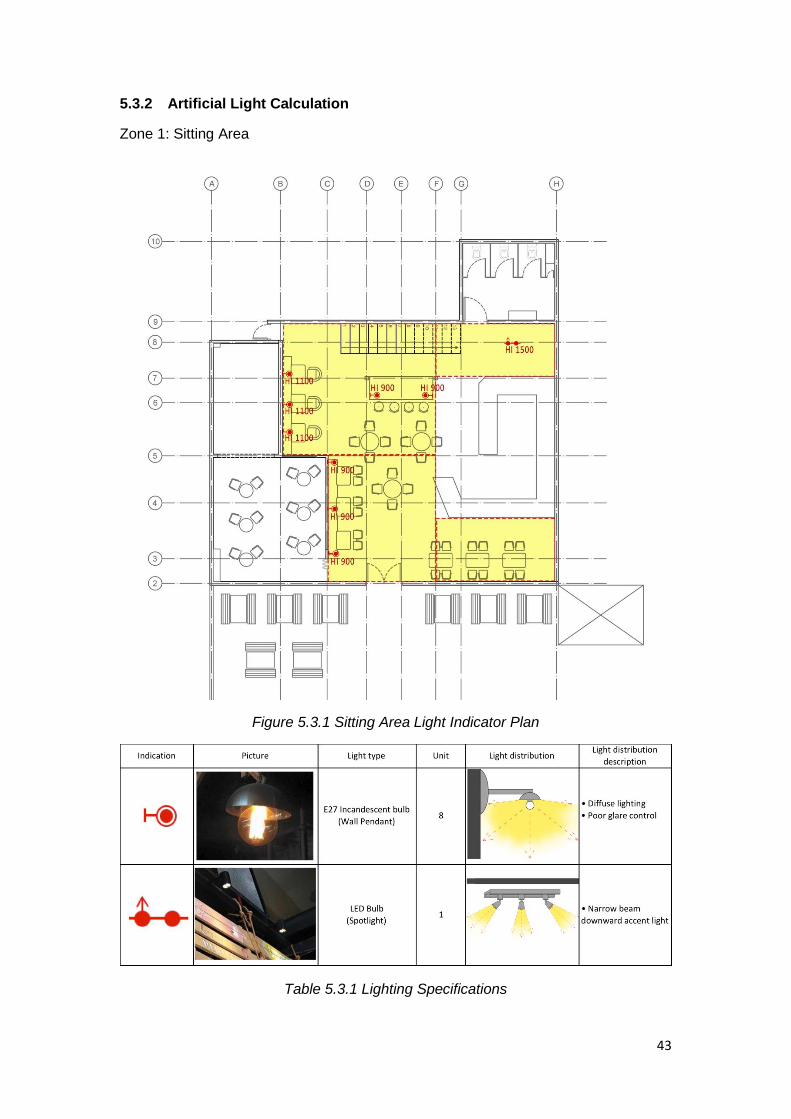
5.3.2 Artificial Light Calculation
Zone 1: Sitting Area
Figure 5.3.1 Sitting Area Light Indicator Plan
Table 5.3.1 Lighting Specifications
44
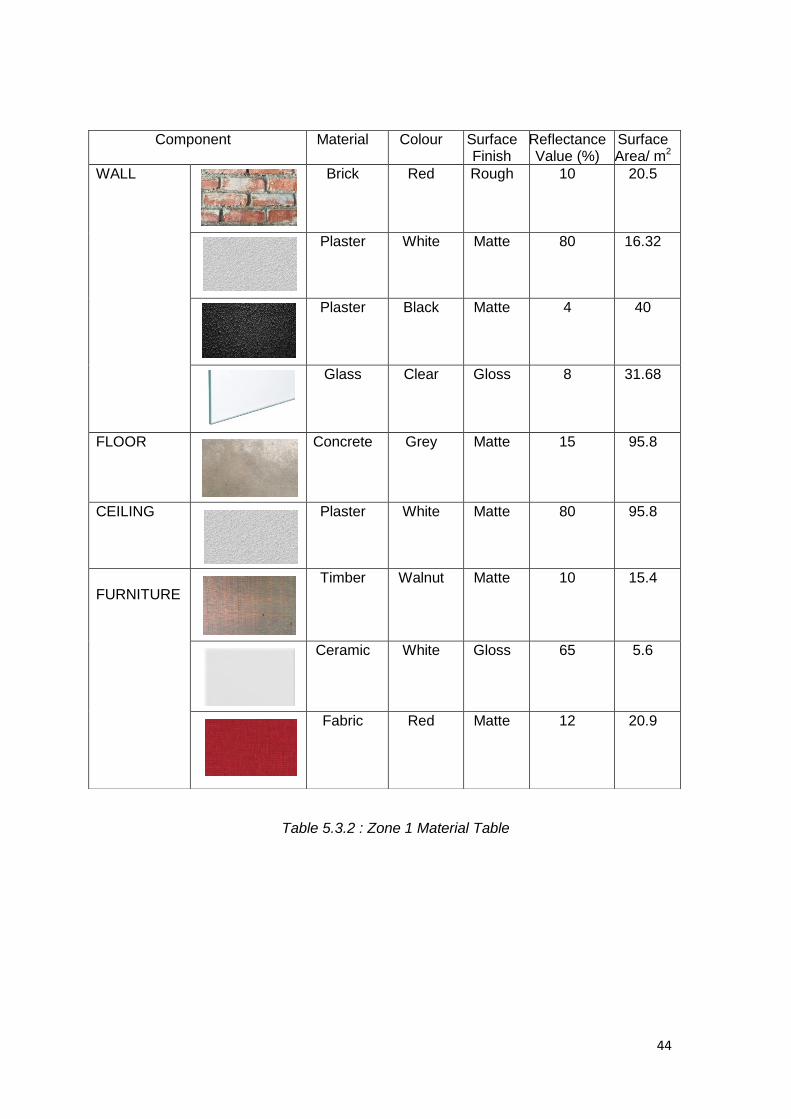
Table 5.3.2 : Zone 1 Material Table
Component Material Colour Surface Finish
Reflectance Value (%)
Surface Area/ m2
WALL
Brick Red Rough 10 20.5
Plaster White Matte 80 16.32
Plaster Black Matte 4 40
Glass Clear Gloss 8 31.68
FLOOR Concrete Grey Matte 15 95.8
CEILING Plaster White Matte 80 95.8
FURNITURE
Timber Walnut Matte 10 15.4
Ceramic White Gloss 65 5.6
Fabric Red Matte 12 20.9
45
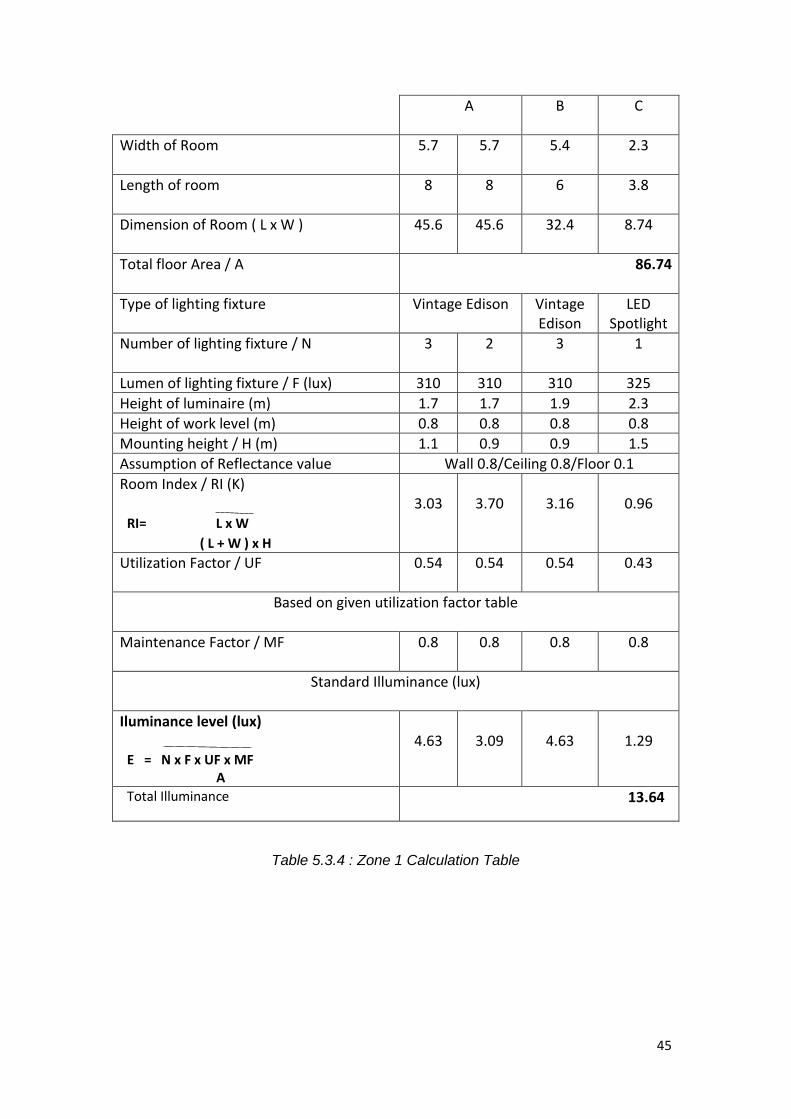
A B C
Width of Room
5.7 5.7 5.4 2.3
Length of room
8 8 6 3.8
Dimension of Room ( L x W )
45.6 45.6 32.4 8.74
Total floor Area / A
86.74
Type of lighting fixture
Vintage Edison Vintage Edison
LED Spotlight
Number of lighting fixture / N
3 2 3 1
Lumen of lighting fixture / F (lux) 310 310 310 325
Height of luminaire (m) 1.7 1.7 1.9 2.3
Height of work level (m) 0.8 0.8 0.8 0.8
Mounting height / H (m) 1.1 0.9 0.9 1.5
Assumption of Reflectance value Wall 0.8/Ceiling 0.8/Floor 0.1
Room Index / RI (K)
RI= L x W
( L + W ) x H
3.03
3.70
3.16
0.96
Utilization Factor / UF
0.54 0.54 0.54 0.43
Based on given utilization factor table
Maintenance Factor / MF
0.8 0.8 0.8 0.8
Standard Illuminance (lux)
Iluminance level (lux)
E = N x F x UF x MF
A
4.63
3.09
4.63
1.29
Total Illuminance
13.64
Table 5.3.4 : Zone 1 Calculation Table

46
Zone 2: Outdoor Sitting Area
Figure 5.3.2: Outdoor Sitting Area Light Indicator Plan
Table 5.3.4 : Lighting Specifications
47
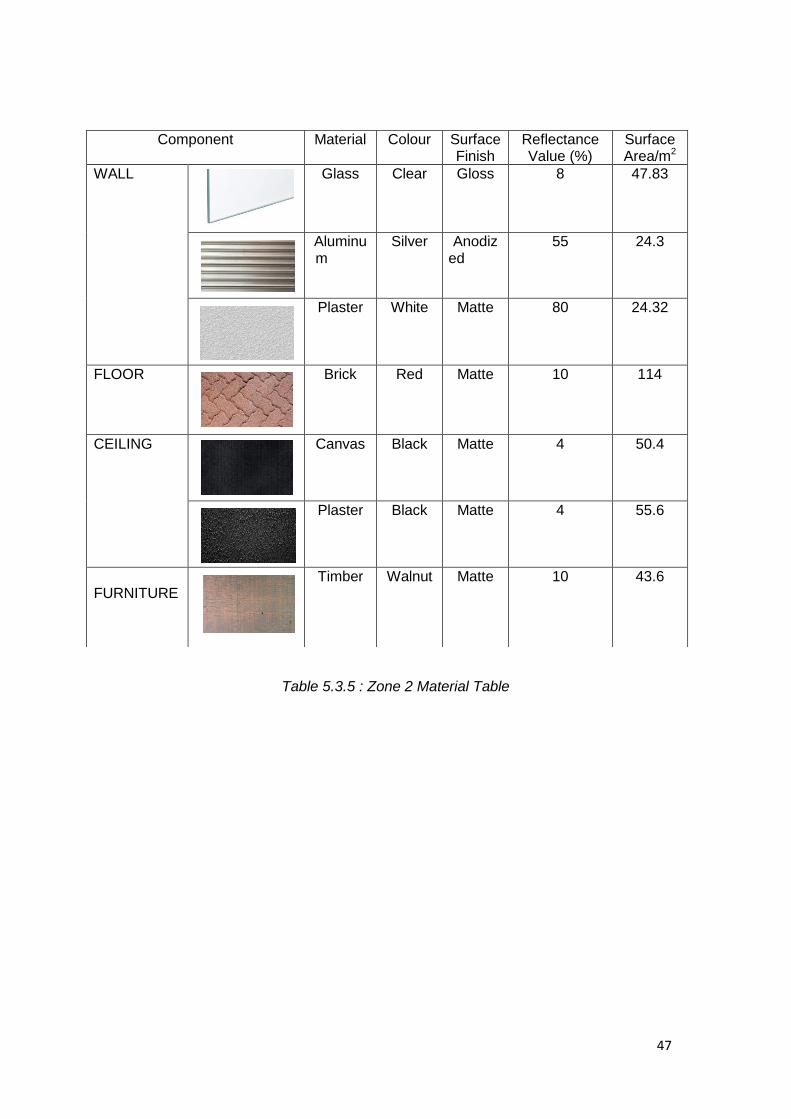
Table 5.3.5 : Zone 2 Material Table
Component Material Colour Surface Finish
Reflectance Value (%)
Surface Area/m2
WALL Glass Clear Gloss 8 47.83
Aluminum
Silver Anodized
55 24.3
Plaster White Matte 80 24.32
FLOOR Brick Red Matte 10 114
CEILING Canvas Black Matte 4 50.4
Plaster Black Matte 4 55.6
FURNITURE
Timber Walnut Matte 10 43.6
48
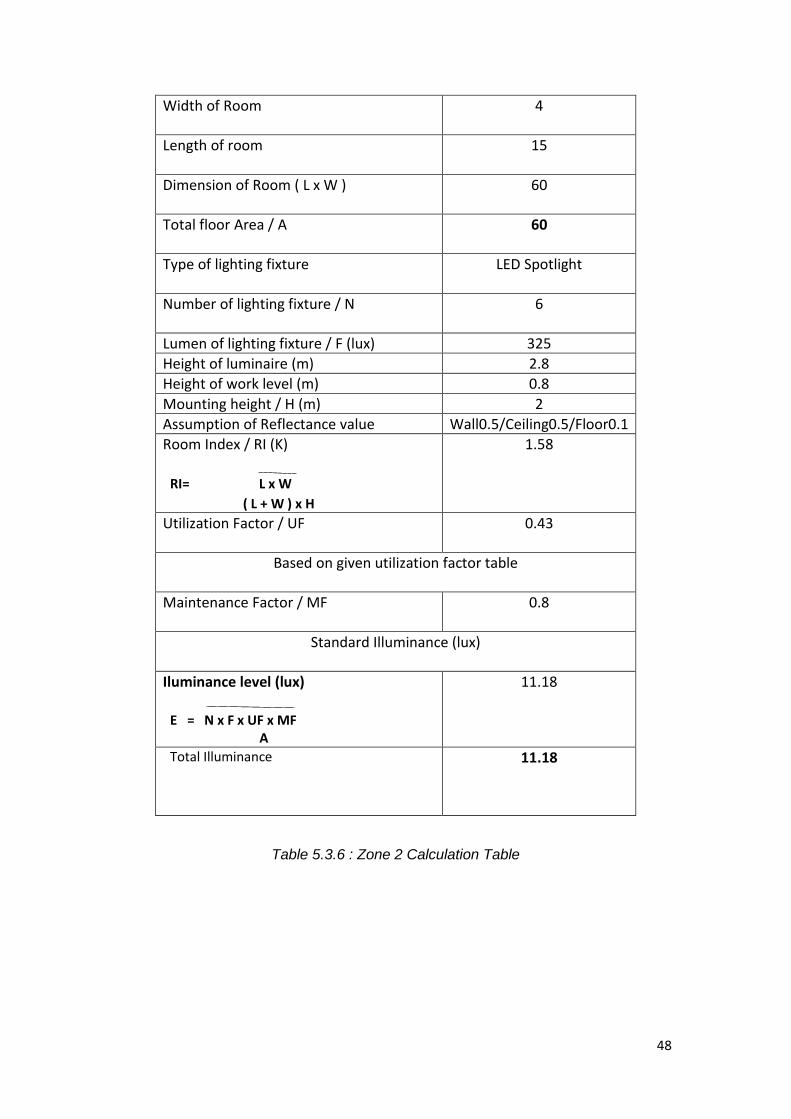
Width of Room
4
Length of room
15
Dimension of Room ( L x W )
60
Total floor Area / A
60
Type of lighting fixture
LED Spotlight
Number of lighting fixture / N
6
Lumen of lighting fixture / F (lux) 325
Height of luminaire (m) 2.8
Height of work level (m) 0.8
Mounting height / H (m) 2
Assumption of Reflectance value Wall0.5/Ceiling0.5/Floor0.1
Room Index / RI (K)
RI= L x W
( L + W ) x H
1.58
Utilization Factor / UF
0.43
Based on given utilization factor table
Maintenance Factor / MF
0.8
Standard Illuminance (lux)
Iluminance level (lux)
E = N x F x UF x MF
A
11.18
Total Illuminance
11.18
Table 5.3.6 : Zone 2 Calculation Table
49
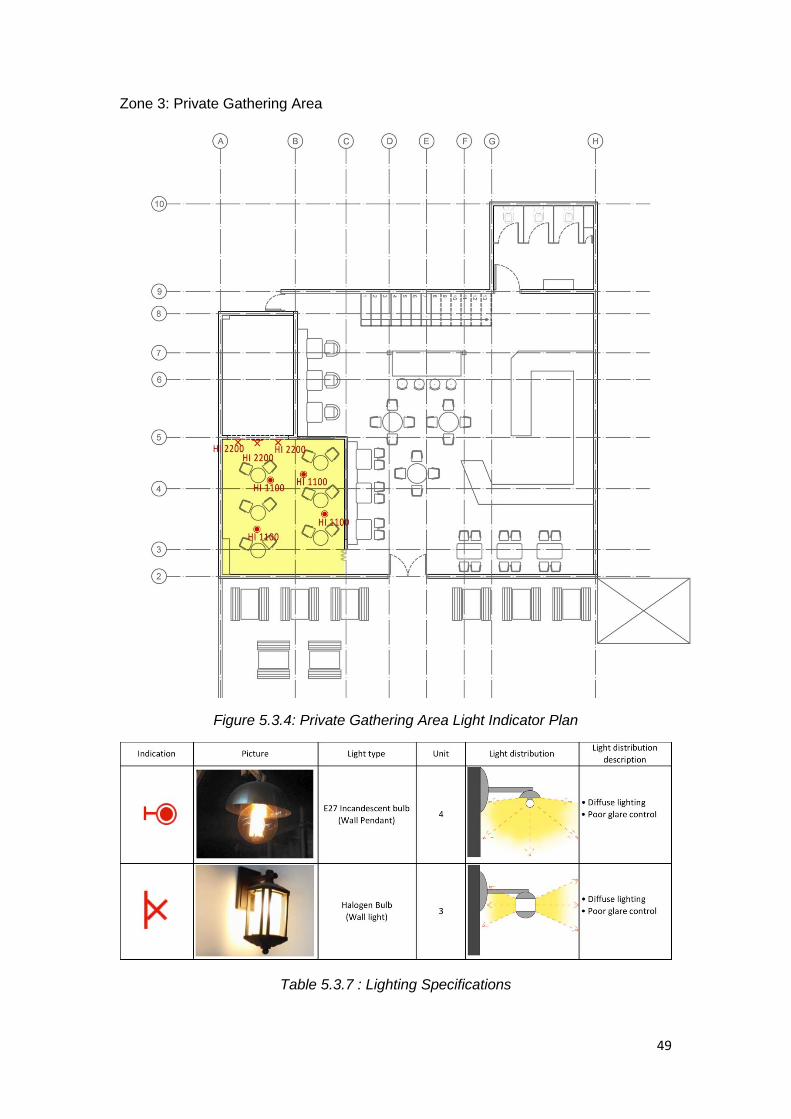
Zone 3: Private Gathering Area
Figure 5.3.4: Private Gathering Area Light Indicator Plan
Table 5.3.7 : Lighting Specifications

50
Table 5.3.8 : Zone 3 Material Table
Component Material Colour Surface
Finish
Reflectance Value
(%)
Surface Area/
m2
WALL Glass Clear Gloss 8 12.7
Aluminum Silver Anodized
55 11.6
Plaster Black Matte 4 17.28
Steel Black Gloss 5 5.43
FLOOR Concrete Grey Matte 15 26.4
CEILING Plaster Black Matte 80 26.4
FURNITURE
Timber Walnut Matte 10 22.4
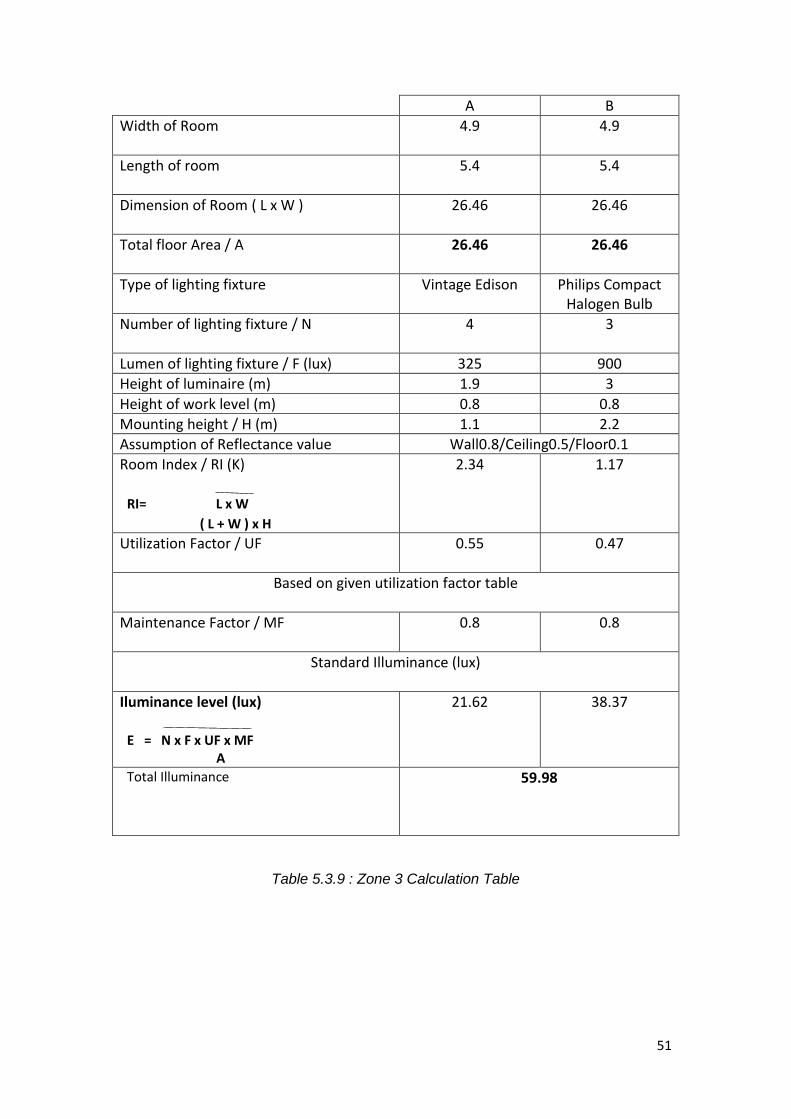
51
A B
Width of Room
4.9 4.9
Length of room
5.4 5.4
Dimension of Room ( L x W )
26.46 26.46
Total floor Area / A
26.46 26.46
Type of lighting fixture
Vintage Edison Philips Compact Halogen Bulb
Number of lighting fixture / N
4 3
Lumen of lighting fixture / F (lux) 325 900
Height of luminaire (m) 1.9 3
Height of work level (m) 0.8 0.8
Mounting height / H (m) 1.1 2.2
Assumption of Reflectance value Wall0.8/Ceiling0.5/Floor0.1
Room Index / RI (K)
RI= L x W
( L + W ) x H
2.34 1.17
Utilization Factor / UF
0.55 0.47
Based on given utilization factor table
Maintenance Factor / MF
0.8 0.8
Standard Illuminance (lux)
Iluminance level (lux)
E = N x F x UF x MF
A
21.62 38.37
Total Illuminance
59.98
Table 5.3.9 : Zone 3 Calculation Table
52
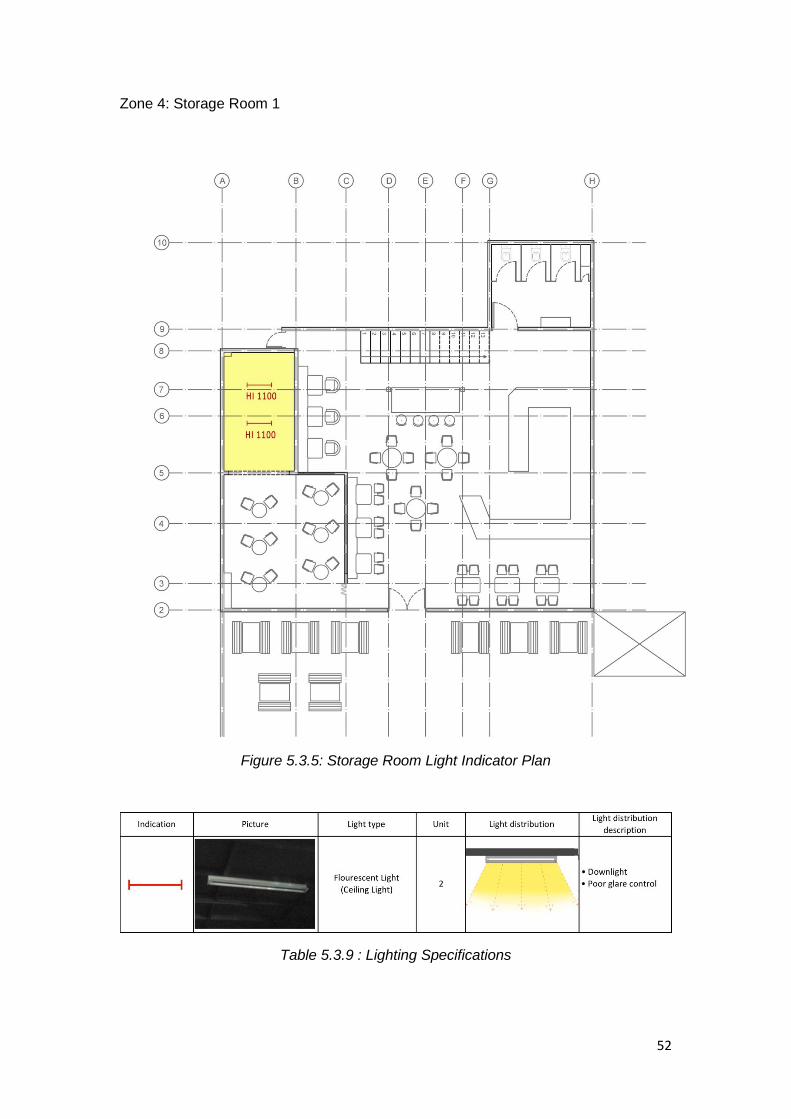
Zone 4: Storage Room 1
Figure 5.3.5: Storage Room Light Indicator Plan
Table 5.3.9 : Lighting Specifications
53
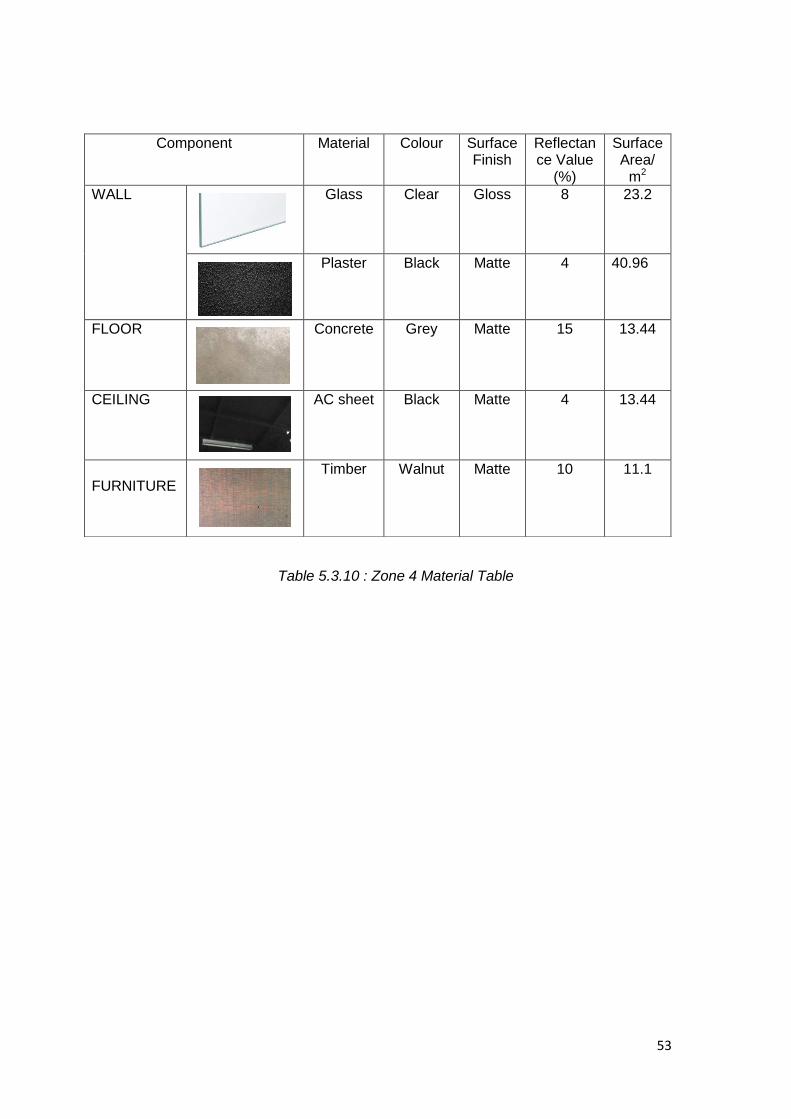
Table 5.3.10 : Zone 4 Material Table
Component Material Colour Surface Finish
Reflectance Value
(%)
Surface Area/
m2
WALL Glass Clear Gloss 8 23.2
Plaster Black Matte 4 40.96
FLOOR Concrete Grey Matte 15 13.44
CEILING AC sheet Black Matte 4 13.44
FURNITURE
Timber Walnut Matte 10 11.1
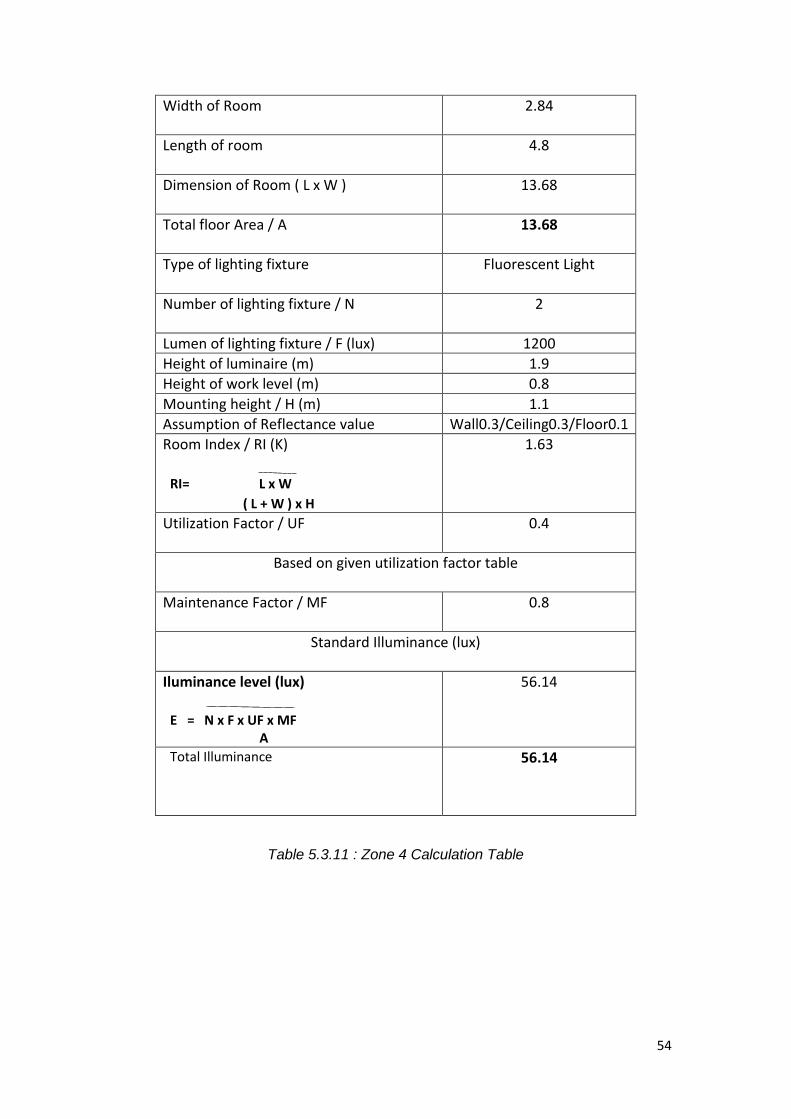
54
Width of Room
2.84
Length of room
4.8
Dimension of Room ( L x W )
13.68
Total floor Area / A
13.68
Type of lighting fixture
Fluorescent Light
Number of lighting fixture / N
2
Lumen of lighting fixture / F (lux) 1200
Height of luminaire (m) 1.9
Height of work level (m) 0.8
Mounting height / H (m) 1.1
Assumption of Reflectance value Wall0.3/Ceiling0.3/Floor0.1
Room Index / RI (K)
RI= L x W
( L + W ) x H
1.63
Utilization Factor / UF
0.4
Based on given utilization factor table
Maintenance Factor / MF
0.8
Standard Illuminance (lux)
Iluminance level (lux)
E = N x F x UF x MF
A
56.14
Total Illuminance
56.14
Table 5.3.11 : Zone 4 Calculation Table
55
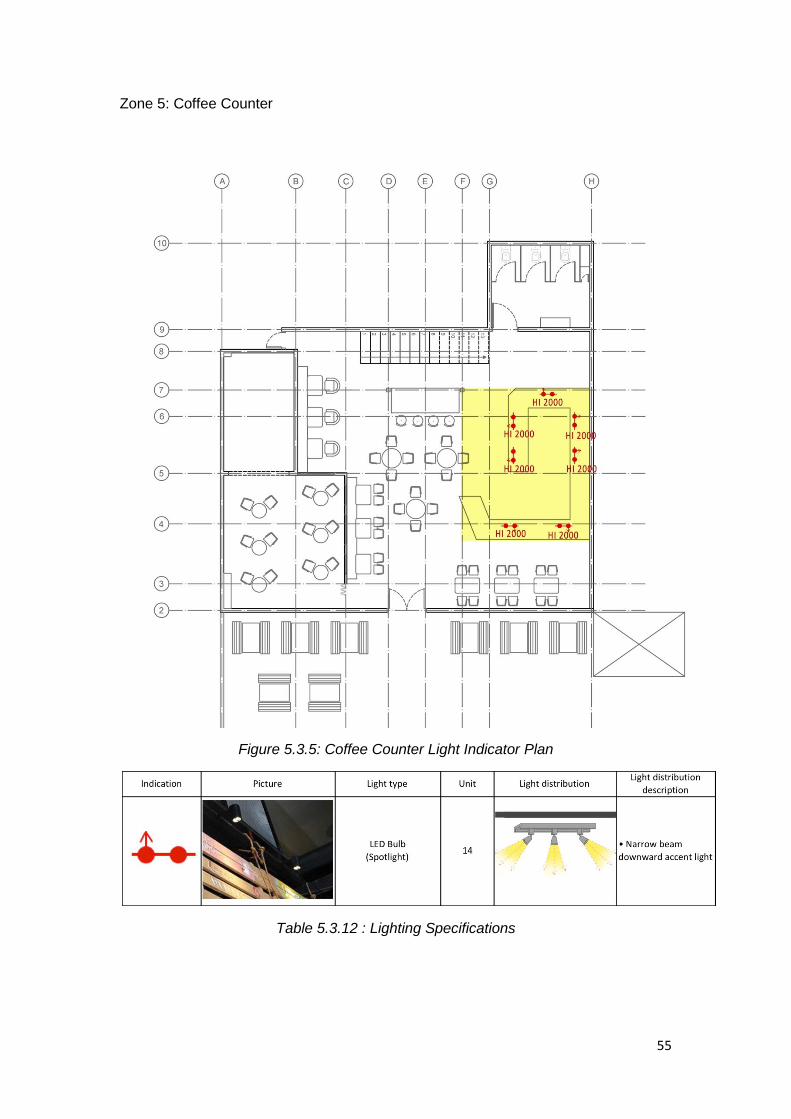
Zone 5: Coffee Counter
Figure 5.3.5: Coffee Counter Light Indicator Plan
Table 5.3.12 : Lighting Specifications
56
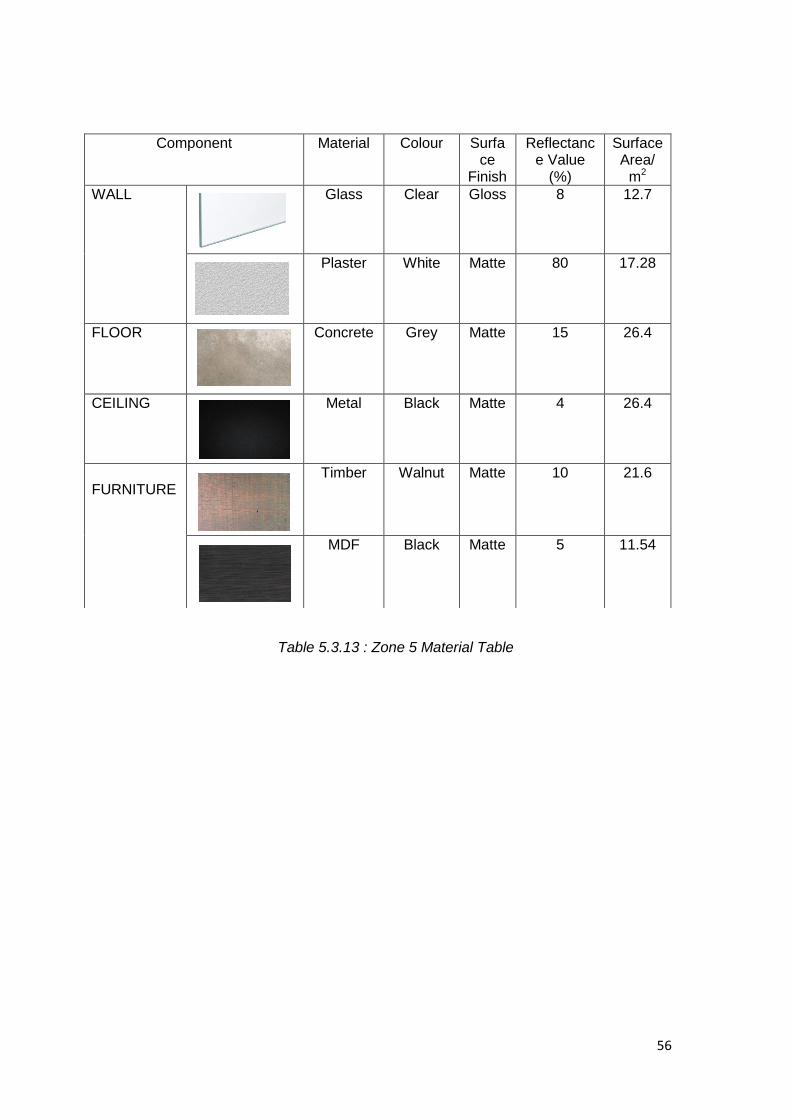
Table 5.3.13 : Zone 5 Material Table
Component Material Colour Surface
Finish
Reflectance Value
(%)
Surface Area/
m2
WALL Glass Clear Gloss 8 12.7
Plaster White Matte 80 17.28
FLOOR Concrete Grey Matte 15 26.4
CEILING Metal Black Matte 4 26.4
FURNITURE
Timber Walnut Matte 10 21.6
MDF Black Matte 5 11.54

57
Width of Room
3.8
Length of room
6.1
Dimension of Room ( L x W )
23.18
Total floor Area / A
23.18
Type of lighting fixture
LED Spotlight
Number of lighting fixture / N
14
Lumen of lighting fixture / F (lux) 325
Height of luminaire (m) 2.8
Height of work level (m) 0.8
Mounting height / H (m) 2
Assumption of Reflectance value Wall0.8/Ceiling0.3/Floor0.1
Room Index / RI (K)
RI= L x W
( L + W ) x H
1.17
Utilization Factor / UF
0.38
Based on given utilization factor table
Maintenance Factor / MF
0.8
Standard Illuminance (lux)
Iluminance level (lux)
E = N x F x UF x MF
A
59.67
Total Illuminance
59.67
Table 5.3.14 : Zone 5 Calculation Table
58
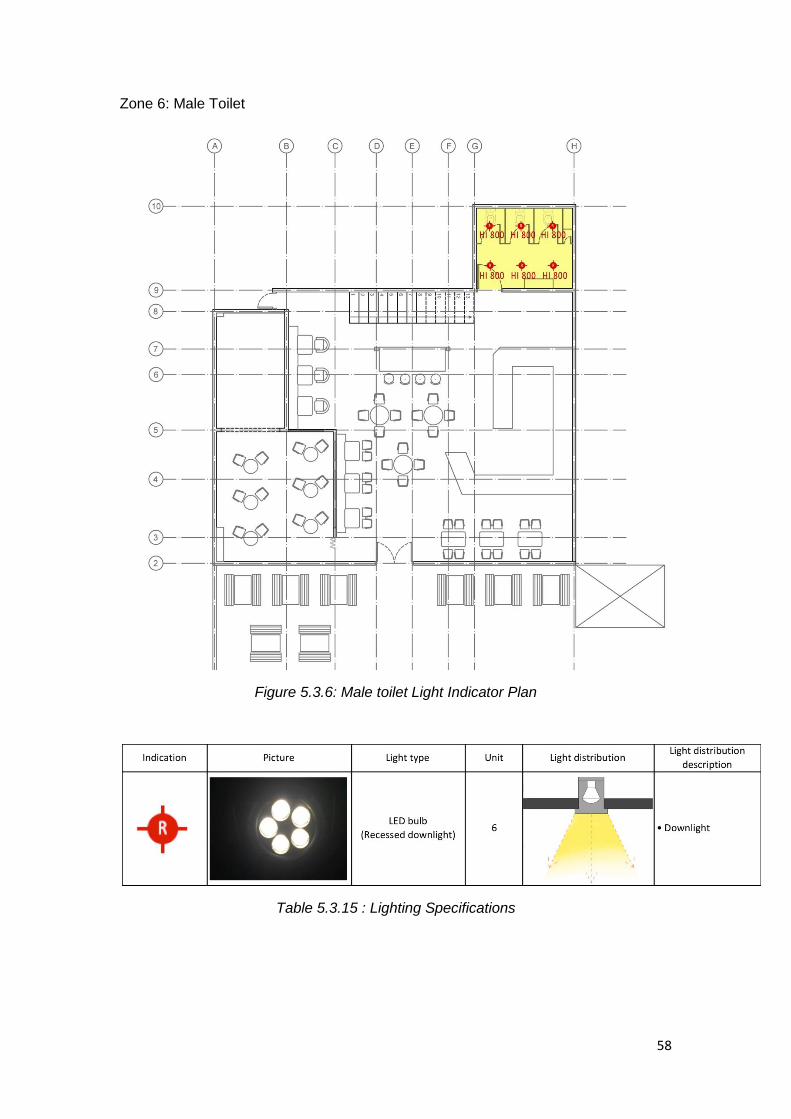
Zone 6: Male Toilet
Figure 5.3.6: Male toilet Light Indicator Plan
Table 5.3.15 : Lighting Specifications

59
Table 5.3.16 : Zone 6 Material Table
Component Material Colour Surface Finish
Reflectance Value
(%)
Surface Area/
m2
WALL
Ceramic White Gloss 65 12.8
Plaster Black Matte 4 40.64
FLOOR Concrete Grey Matte 15 13.4
CEILING AC sheet Black Matte 4 13.44
FURNITURE
Mirror Reflective
Gloss 100 21.4
Porcelain White Gloss 75 11.1

60
Width of Room
4
Length of room
3.35
Dimension of Room ( L x W )
13.4
Total floor Area / A
13.4
Type of lighting fixture
LED Bulb (Recessed)
Number of lighting fixture / N
6
Lumen of lighting fixture / F (lux) 380
Height of luminaire (m) 1.6
Height of work level (m) 0.8
Mounting height / H (m) 0.8
Assumption of Reflectance value Wall0.5/Ceiling0.3/Floor0.1
Room Index / RI (K)
RI= L x W
( L + W ) x H
2.28
Utilization Factor / UF
0.44
Based on given utilization factor table
Maintenance Factor / MF
0.8
Standard Illuminance (lux)
Iluminance level (lux)
E = N x F x UF x MF
A
59.89
Total Illuminance
59.89
Table 5.3.17 : Zone 6 Calculation Table
61
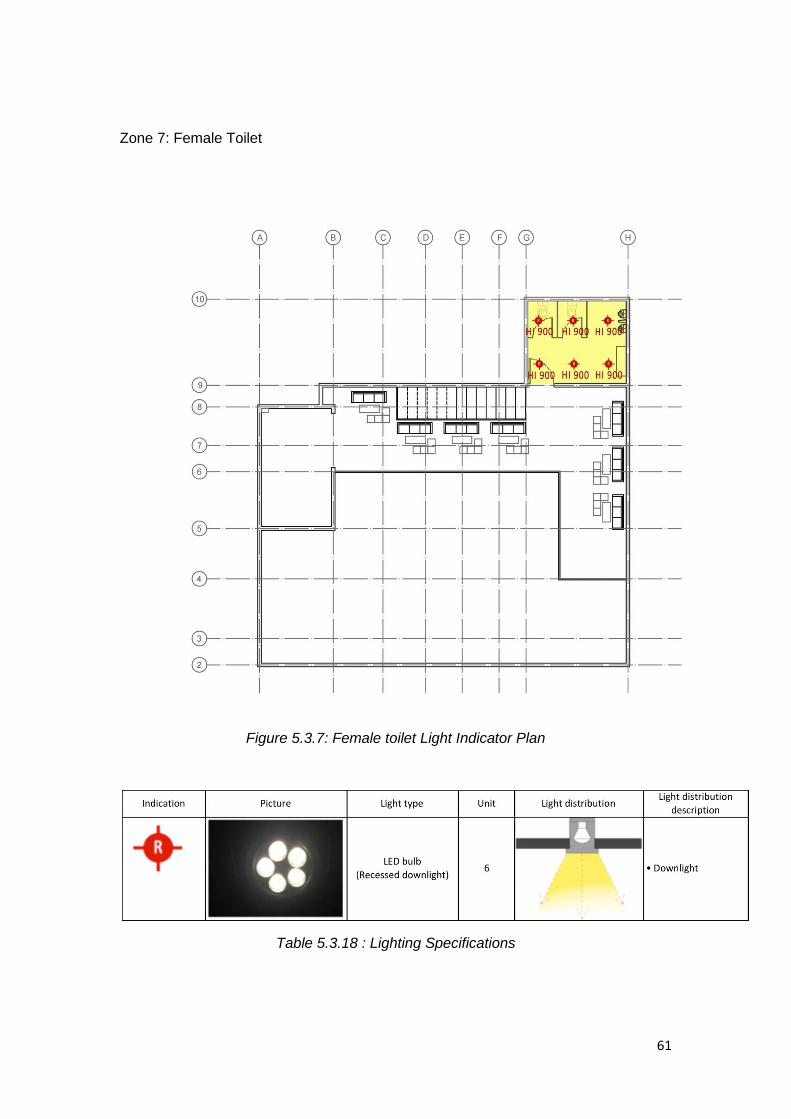
Zone 7: Female Toilet
Figure 5.3.7: Female toilet Light Indicator Plan
Table 5.3.18 : Lighting Specifications

62
Table 5.3.19 : Zone 7 Material Table
Component Material Colour Surface Finish
Reflectance Value
(%)
Surface Area/
m2
WALL
Ceramic White Gloss 65 12.8
Plaster Black Matte 4 40.64
FLOOR Concrete Grey Matte 15 13.4
CEILING AC sheet Black Matte 4 13.44
FURNITURE
Mirror Reflective
Gloss 100 13.6
Porcelain White Gloss 75 5.2

63
Width of Room
4
Length of room
3.35
Dimension of Room ( L x W )
13.4
Total floor Area / A
13.4
Type of lighting fixture
LED Bulb (Recessed)
Number of lighting fixture / N
6
Lumen of lighting fixture / F (lux) 380
Height of luminaire (m) 1.7
Height of work level (m) 0.8
Mounting height / H (m) 0.9
Assumption of Reflectance value Wall0.7/Ceiling0.5/Floor0.2
Room Index / RI (K)
RI= L x W
( L + W ) x H
2.03
Utilization Factor / UF
0.53
Based on given utilization factor table
Maintenance Factor / MF
0.8
Standard Illuminance (lux)
Iluminance level (lux)
E = N x F x UF x MF
A
72.14
Total Illuminance
72.14
Table 5.3.20 : Zone 7 Calculation Table
64
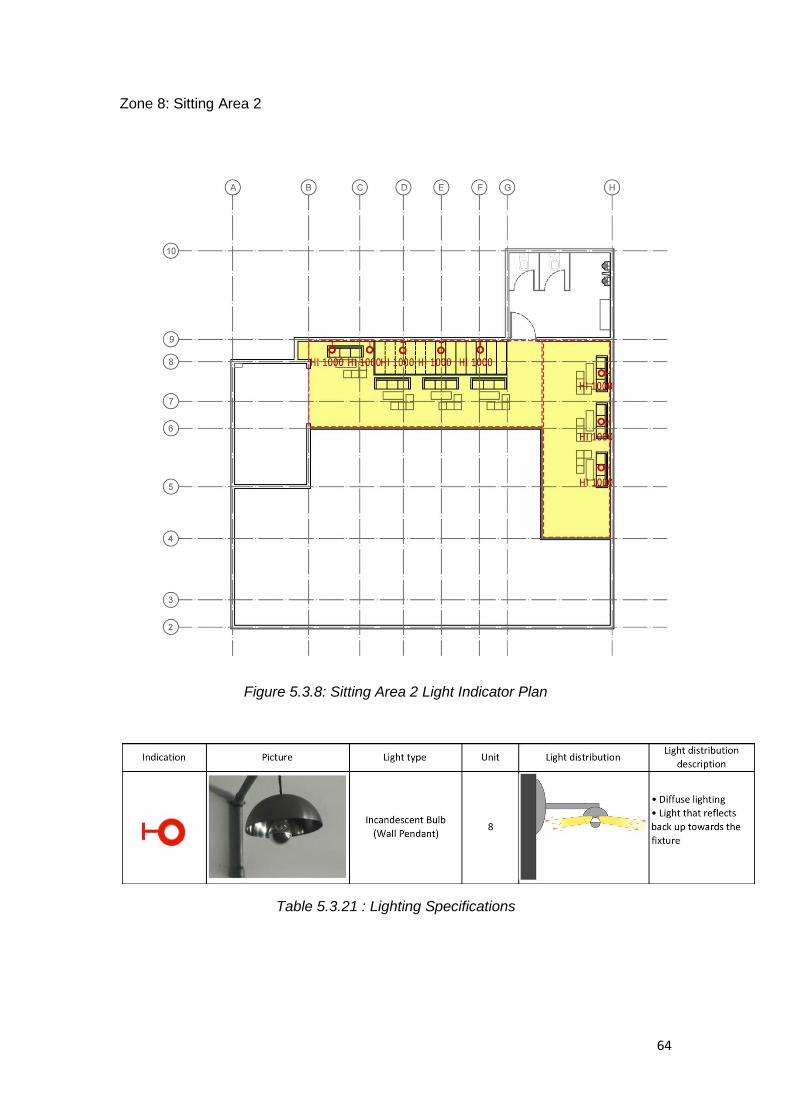
Zone 8: Sitting Area 2
Figure 5.3.8: Sitting Area 2 Light Indicator Plan
Table 5.3.21 : Lighting Specifications
65
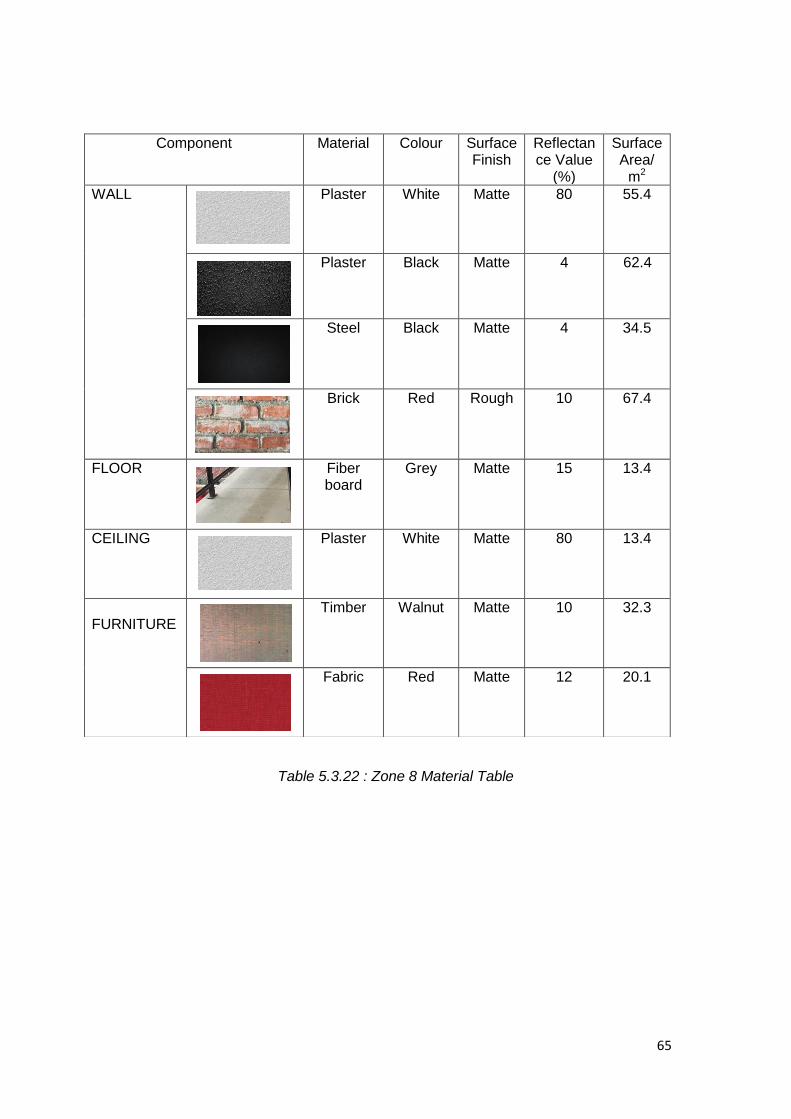
Table 5.3.22 : Zone 8 Material Table
Component Material Colour Surface Finish
Reflectance Value
(%)
Surface Area/
m2
WALL
Plaster White Matte 80 55.4
Plaster Black Matte 4 62.4
Steel Black Matte 4 34.5
Brick Red Rough 10 67.4
FLOOR Fiber board
Grey Matte 15 13.4
CEILING Plaster White Matte 80 13.4
FURNITURE
Timber Walnut Matte 10 32.3
Fabric Red Matte 12 20.1

66
A B
Width of Room
3.4 2.85
Length of room
9.15 4.8
Dimension of Room ( L x W )
31.11 213.68
Total floor Area / A
31.11 213.68
Type of lighting fixture
Bulbrite 100W Glove Bulb
Bulbrite 100W Glove Bulb
Number of lighting fixture / N
5 3
Lumen of lighting fixture / F (lux) 580 580
Height of luminaire (m) 1.8 1.8
Height of work level (m) 0.8 0.8
Mounting height / H (m) 1 1
Assumption of Reflectance value Wall0.8/Ceiling0.8/Floor0.1
Room Index / RI (K)
RI= L x W
( L + W ) x H
2.48 1.79
Utilization Factor / UF
0.53 0.5
Based on given utilization factor table
Maintenance Factor / MF
0.8 0.8
Standard Illuminance (lux)
Iluminance level (lux)
E = N x F x UF x MF
A
39.52 50.88
Total Illuminance
90.40
Table 5.3.23 : Zone 8 Calculation Table

67
Zone 9: Storage Area 2
Figure 5.3.9: Storage Room 2 Light Indicator Plan
Table 5.3.24 : Lighting Specifications

68
Table 5.3.25 : Zone 9 Material Table
Component Material Colour Surface Finish
Reflectance Value
(%)
Surface Area/
m2
WALL
Plaster White Matte 80 4.8
Plaster Black Matte 4 2.3
Steel Black Matte 4 4.5
Brick Red Rough 10 5.6
FLOOR Fiber board
Grey Matte 15 13.4
CEILING Plaster White Matte 80 13.4
FURNITURE
Timber Walnut Matte 10 7.9
Fabric Red Matte 12 3.0
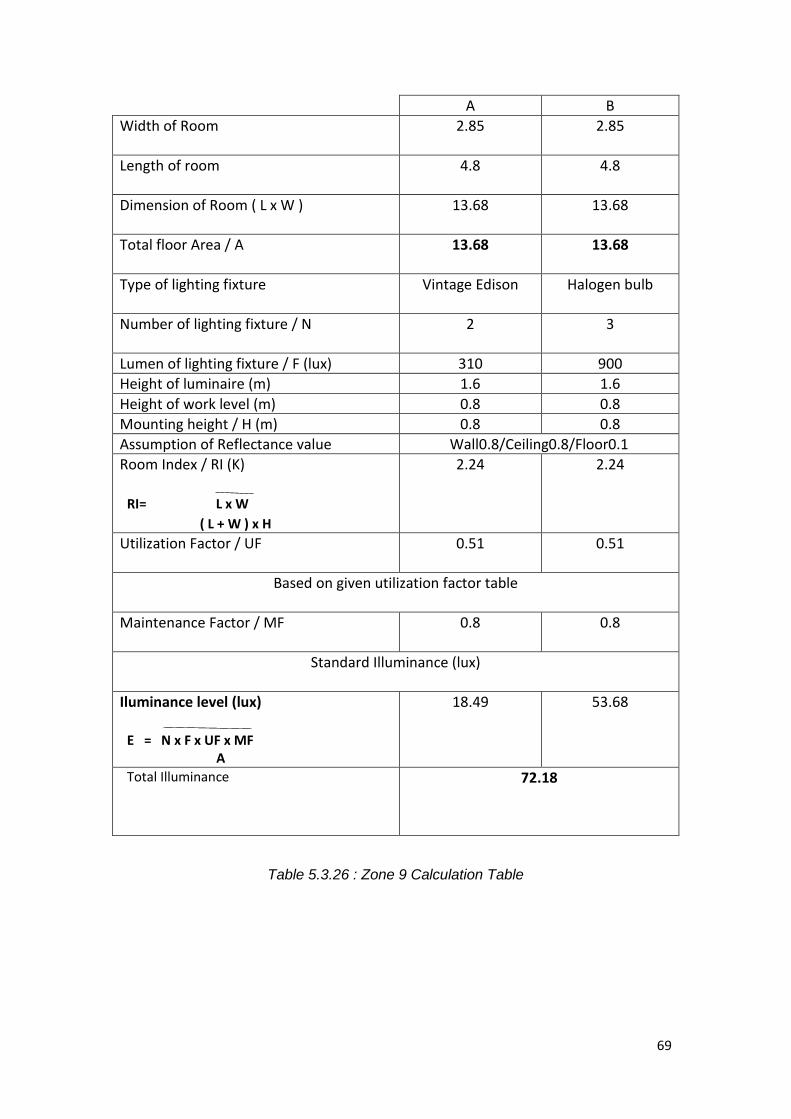
69
A B
Width of Room
2.85 2.85
Length of room
4.8 4.8
Dimension of Room ( L x W )
13.68 13.68
Total floor Area / A
13.68 13.68
Type of lighting fixture
Vintage Edison Halogen bulb
Number of lighting fixture / N
2 3
Lumen of lighting fixture / F (lux) 310 900
Height of luminaire (m) 1.6 1.6
Height of work level (m) 0.8 0.8
Mounting height / H (m) 0.8 0.8
Assumption of Reflectance value Wall0.8/Ceiling0.8/Floor0.1
Room Index / RI (K)
RI= L x W
( L + W ) x H
2.24 2.24
Utilization Factor / UF
0.51 0.51
Based on given utilization factor table
Maintenance Factor / MF
0.8 0.8
Standard Illuminance (lux)
Iluminance level (lux)
E = N x F x UF x MF
A
18.49 53.68
Total Illuminance
72.18
Table 5.3.26 : Zone 9 Calculation Table
70
5.4 Analysis and Evaluation
Lighting is important within restaurants and cafes, especially feature lighting
that creates ambience and mood. The different types of lighting fixtures found inside
the Artisan Cafe offers different illumination levels. From our observation on site,
pendant lighting is the dominant type of lighting fixture at the first floor of the café. It
is used mainly to illuminate the tables at the main and private seating area, as well
as the seating areas at the mezzanine floor. However at the coffee counter area,
track spotlights are being used instead, to illuminate the menus hanged above the
counters. Unlike pendant lighting that uniformly distributes illumination, spotlighting
only illuminates the spot at which it is directed. Spaces in which these lights are not
pointed at are usually inadequately lit up.
Based on our data collection, the space inside the café is considered to be
rather dark during the day, despite having large glass entrance. It is mainly due to
the large black canvas roof covering the outdoor seating area, and most of the
interior pendant lights are switched off during the day. Referring to the precedent
study on lighting analysis, the Solar Decathlon House utilizes daylighting and
countermeasures against glare from sunlight. This predicts the result of using
daylighting and how it affects the ambience of a space.
Most of the lux readings on our site are below the lux requirements for each
space during daytime due to the interior lights not being utilized. Even during the
nighttime with all the lights turned on, the readings are still below lux requirements.
However, it is the intention for the café to have a somewhat dim ambience to create
that cool and cozy environment in the café. Natural lighting is only available to
penetrate inside the building to the main sitting area and the private sitting area, due
to both areas are the closest to the glass walls of the entrance.
In conclusion, it may be the designer to have the café to be dimly lit to
achieve a certain character and ambience however, the requirements set by MS
1525 must be taken into consideration when it comes lighting design not only to
achieve the desired atmosphere but as well as visual comfort.

71
6.0 ACOUSTIC ANALYSIS
6.1 Noise Sources
6.1.1 External Noise Sources
Figure 6.1.1: Location of Site in relation to main road
The site is facing a trunk road Jalan 13/2. The road is moderately busy during
non-peak hours and peak hours. The main outdoor noise sources are coming from
the construction site located opposite the site and beside the site. Due to the
typology of the site being and industrial zone, factory activities is also one of the
contributors of outdoor noises. Apart from these noises vehicular noise present
nearby the construction zones also create an impact towards the cafe.
72
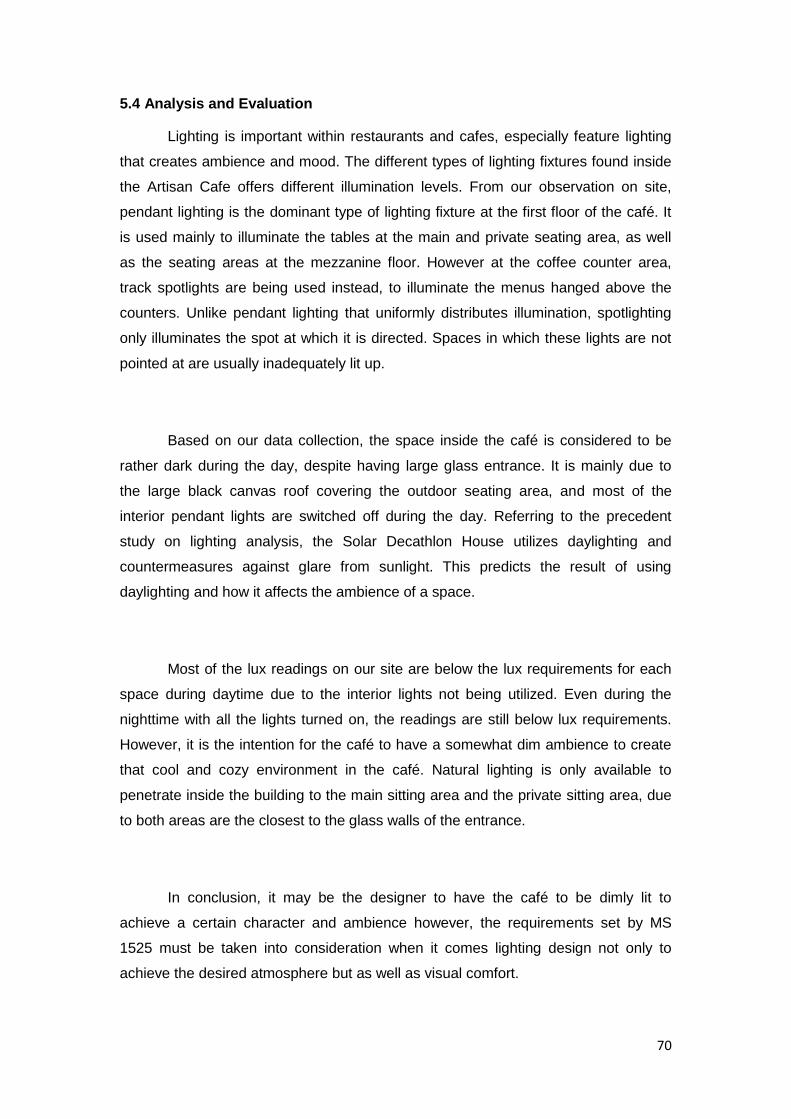
6.1.2 Internal noise sources
Air Circulators
Figure 6.1.2: Placement of Air Circulators
Air conditioners are placed in the interior space of the cafe as a form of
artificial ventilation. Fans are also present in the space to compliment the usage of
mechanical ventilation. The noise produced by these equipment has a low effect
towards the acoustic values due to the nature of the site as a cafe whereby the noise
frequency is outnumbered by the human activity. However when the cafe closes a
certain acoustical value can be captured in the space itself.
73
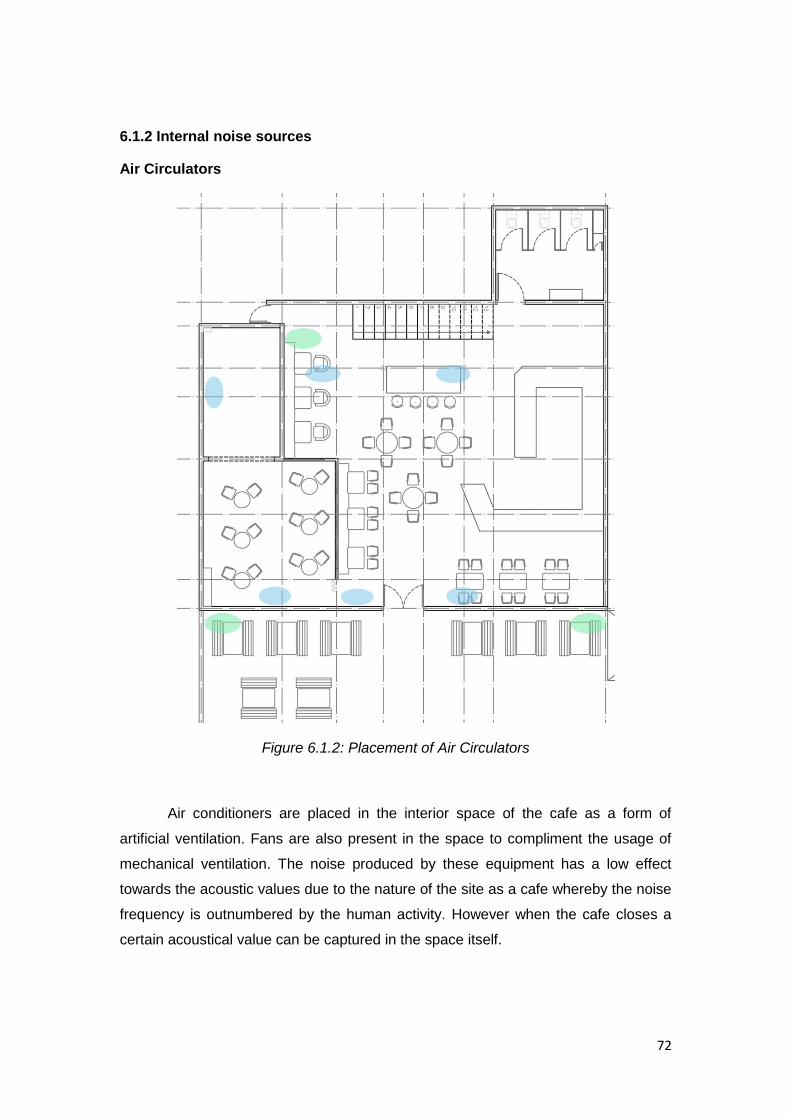
Human Activity
Figure 6.1.3: Human activity points
Concentration of human activities in the cafe varies throughout the day.
During peak hour, the amount of human activities increases therefore there is a jump
in reading. Customers having discussion and chats are the main factor. However the
sound of coffee preparation is also a major acoustic value contributor due to the
nature of the coffee machine located at Zone 5.
74
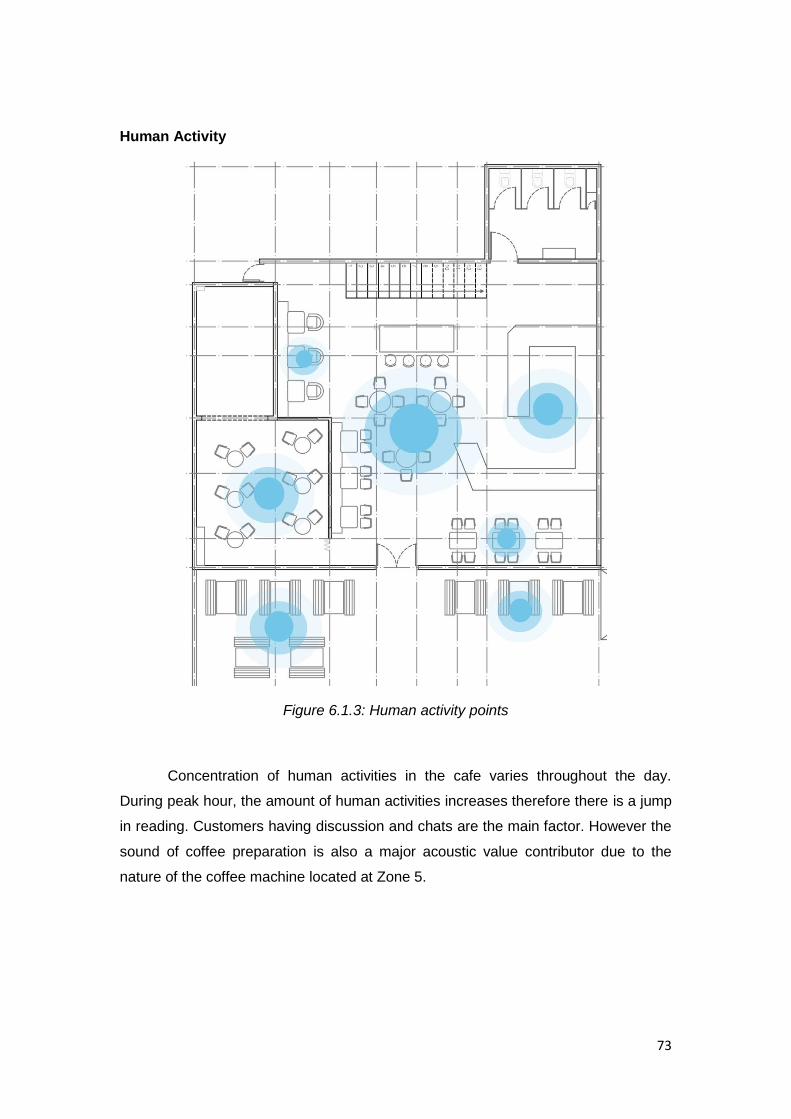
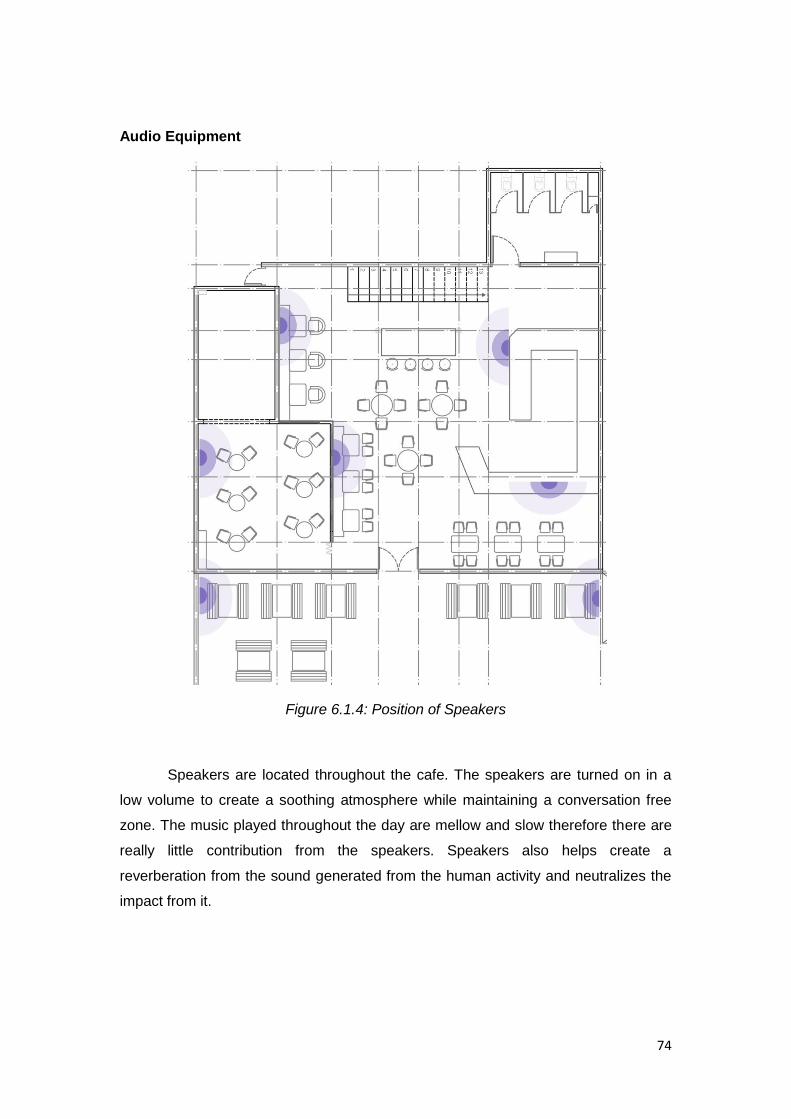
Audio Equipment
Figure 6.1.4: Position of Speakers
Speakers are located throughout the cafe. The speakers are turned on in a
low volume to create a soothing atmosphere while maintaining a conversation free
zone. The music played throughout the day are mellow and slow therefore there are
really little contribution from the speakers. Speakers also helps create a
reverberation from the sound generated from the human activity and neutralizes the
impact from it.

75
6.2 Acoustic Readings
Table 6.2.1 Peak and Non - Peak Hours Readings
Acoustic data
Day time
Ground floor Mezzanine floor
Grid Acoustic
Grid Acoustic
Grid Acoustic
Peak Non-peak Peak Non-peak Peak Non-peak
A4 79 67 D7 75 62 A8 57 31
B4 76 65 D8 73 63 A9 60 32
C4 80 63 D9 71 61 A10 58 43
D4 85 64 D10 77 68 B8 57 33
E4 86 63 E5 80 69 B9 59 32
F4 77 62 E6 73 63 B10 60 34
G4 80 64 E7 73 63 C9 75 61
H4 78 65 E8 76 65 C10 79 65
A5 77 55 E9 73 62 D9 77 63
A6 70 57 E10 80 70 E9 75 63
A7 66 43 F5 64 53 F9 77 63
B5 73 54 F9 78 65 F10 77 70
B6 72 58 F10 77 70 G6 77 66
B7 69 40 G5 63 42 G7 75 61
C5 74 55 G10 82 70 G8 74 61
C6 74 53 H5 64 49 G9 71 60
C7 73 51 H10 86 74 G10 68 58
A8 59 32 F6 70 63 H6 74 63
A9 66 34 F7 80 71 H7 74 62
A10 59 33 F8 82 70 H8 73 63
B8 57 32 G6 79 65 H9 71 60
B9 59 34 G7 85 73 H10 68 59
B10 57 32 G8 85 71 F11 66 54
C8 73 67 G9 86 71 F12 68 58
C9 74 65 H6 76 63 G11 65 53
C10 74 63 H7 84 74 G12 67 56
D5 77 60 H8 84 72 H11 68 58
D6 75 63 H9 83 75 H12 69 59
F11 66 57
F12 67 57
G11 68 56
G12 65 56
H11 65 56
H12 64 57

76
6.2 Observation and Discussion
Based on the noise level data table above, the following observations were noted
along with relevant discussions.
Observation 1:
The average noise level data collected during peak hours are higher compared to the
data collected during non-peak hours.
Discussion 1:
This is due to the larger number of occupants in the building during peak hours that
contributes to the increase of noise levels. The coffee grinders are also utilized from
time to time, which may affect the noise level.
Observation 2:
The noise reading levels during peak and non-peak in the main and private sitting
areas are averagely similar.
Discussion 2:
This is due to the areas sharing the same open space, only divided by a partition.
Observation 3:
The average reading levels during peak and non-peak hours at the coffee counter
are the highest compared to other zones.
Discussion 3:
This is due to the utilization of coffee grinders which affects the noise level readings.
77
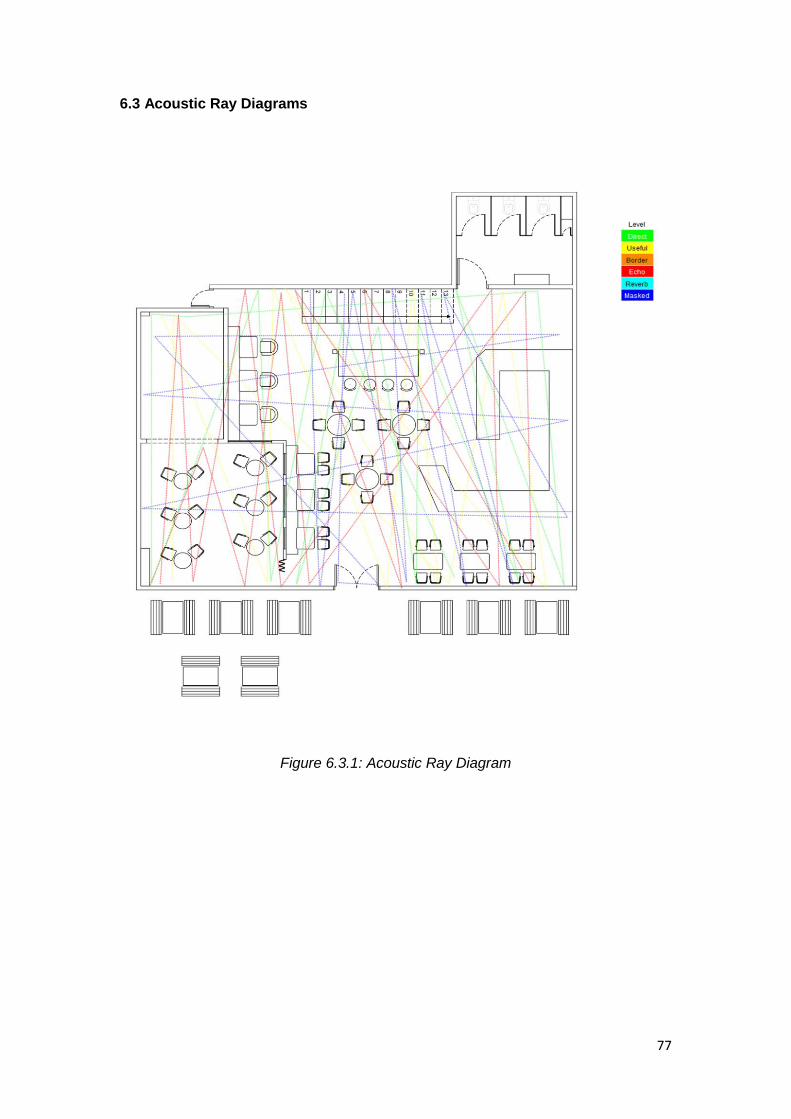
6.3 Acoustic Ray Diagrams
Figure 6.3.1: Acoustic Ray Diagram

78
6.4 Analysis and Calculation
6.4.1 Equipment Sound Pressure Level
Calculation for speakers
Sound pressure level (SPL) = 10log (I/Iref)
IhereI = sound power (watt)
Iref = reference power (10-12)
Number of speakers in Artisan coffee HQ (indoor) = 5 Number of Speakers in Artisan Coffee HQ (outdoor) = 2 One speaker produces approximately 80 dB Therefore, SPL (dB) = 10log (I / Iref) I = 10dB/10 X Iref I= 10 80/10 X 10-12
I= 108 X 10-12
I= 10-4
Total number of speakers indoor = 5 Total intensity = 5 x 10⁻⁴ Therefore, combined SPL indoor = 10log (I / Iref) = 10log (5 x 10⁻⁴ / 1 X 10-12) = 86.99 dB Therefore, combined SPL outdoor = 10log (I / Iref) = 10log (2 x 10⁻⁴ / 1 X 10-12) = 83.01 dB

79
Calculation for Air conditioner Number of Air Conditioner in Artisan Coffee HQ = 6 One Air Conditioner produces approximately 40 dB Therefore, SPL (dB) = 10log (I / Iref) I = 10dB/10 X Iref I= 10 40/10 X 10-12
I= 104 X 10-12
I= 10-8
Total number of air conditioner= 6 Total intensity = 6 x 10⁻⁸ Therefore, combined SPL = 10log (I / Iref) = 10log (6 x 10⁻⁸ / 1 X 10-12) = 47.78 dB
80
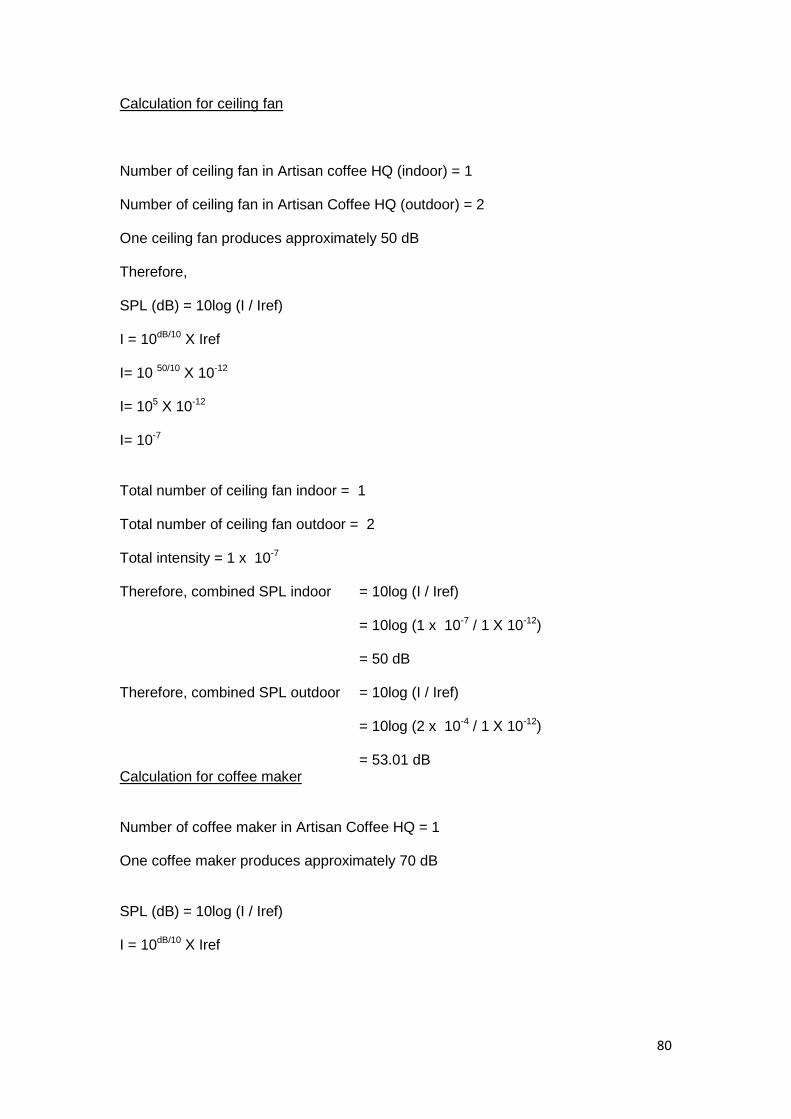
Calculation for ceiling fan Number of ceiling fan in Artisan coffee HQ (indoor) = 1 Number of ceiling fan in Artisan Coffee HQ (outdoor) = 2 One ceiling fan produces approximately 50 dB Therefore, SPL (dB) = 10log (I / Iref) I = 10dB/10 X Iref I= 10 50/10 X 10-12
I= 105 X 10-12
I= 10-7
Total number of ceiling fan indoor = 1 Total number of ceiling fan outdoor = 2 Total intensity = 1 x 10⁻⁷ Therefore, combined SPL indoor = 10log (I / Iref) = 10log (1 x 10⁻⁷ / 1 X 10-12) = 50 dB Therefore, combined SPL outdoor = 10log (I / Iref) = 10log (2 x 10⁻⁴ / 1 X 10-12) = 53.01 dB Calculation for coffee maker Number of coffee maker in Artisan Coffee HQ = 1 One coffee maker produces approximately 70 dB SPL (dB) = 10log (I / Iref) I = 10dB/10 X Iref
81
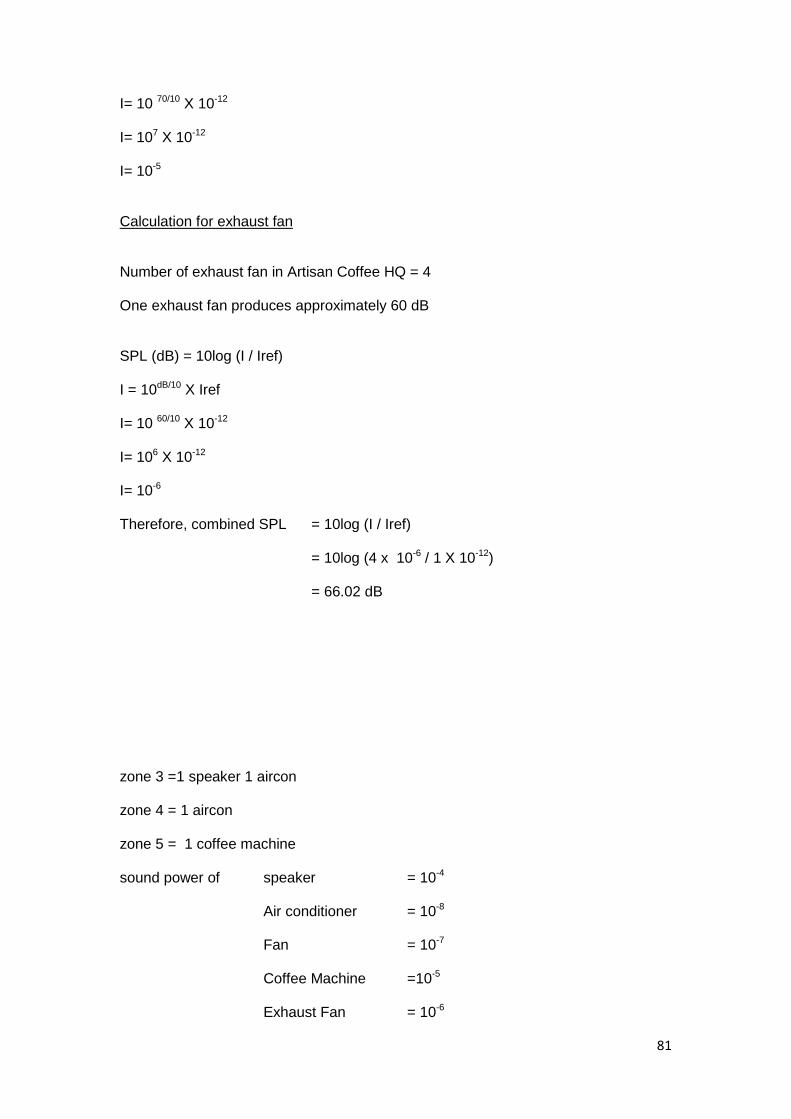
I= 10 70/10 X 10-12
I= 107 X 10-12
I= 10-5
Calculation for exhaust fan Number of exhaust fan in Artisan Coffee HQ = 4 One exhaust fan produces approximately 60 dB SPL (dB) = 10log (I / Iref) I = 10dB/10 X Iref I= 10 60/10 X 10-12
I= 106 X 10-12
I= 10-6
Therefore, combined SPL = 10log (I / Iref) = 10log (4 x 10⁻⁶ / 1 X 10-12) = 66.02 dB zone 3 =1 speaker 1 aircon zone 4 = 1 aircon zone 5 = 1 coffee machine sound power of speaker = 10-4
Air conditioner = 10-8
Fan = 10-7
Coffee Machine =10-5 Exhaust Fan = 10-6
82
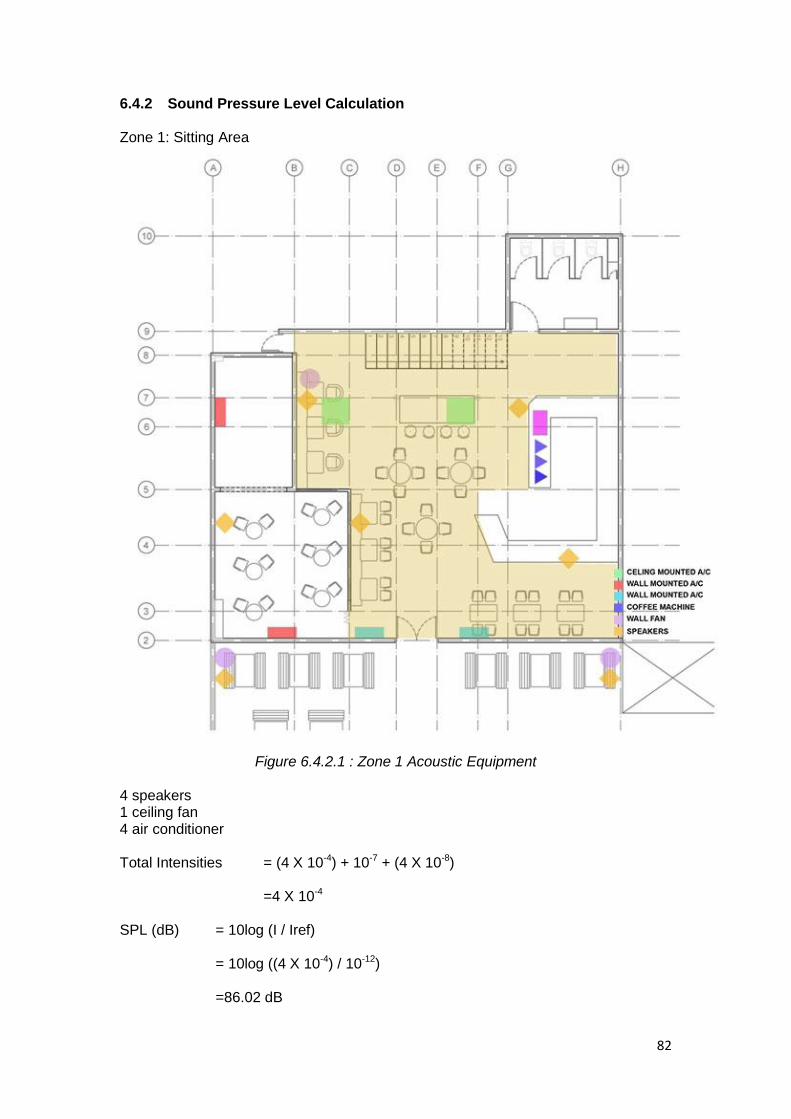
6.4.2 Sound Pressure Level Calculation Zone 1: Sitting Area
Figure 6.4.2.1 : Zone 1 Acoustic Equipment 4 speakers 1 ceiling fan 4 air conditioner Total Intensities = (4 X 10⁻⁴) + 10-7 + (4 X 10⁻⁸) =4 X 10⁻⁴
SPL (dB) = 10log (I / Iref) = 10log ((4 X 10⁻⁴) / 10-12) =86.02 dB
83
Zone 2 : Outdoor Sitting Area
Figure 6.4.2.2 : Zone 2 Acoustic Equipment Zone 2 2 fan 2 speakers Total Intensities = (2 X 10⁻⁷) + (2 X 10⁻⁴) =2 X 10⁻⁴
SPL (dB) = 10log (I / Iref) = 10log ((2 X 10⁻⁴) / 10-12) =83.01 dB
84
Zone 3 : Private Gathering Area
Figure 6.4.2.3 : Zone 3 Acoustic Equipment Zone 3 1 speaker 1 aircon Total Intensities = (1 X 10⁻⁸) + (1 X 10⁻⁴) =1 X 10⁻⁴
SPL (dB) = 10log (I / Iref) = 10log ((1 X 10⁻⁴) / 10-12) =80 dB
85
Zone 4 : Storage Room
Figure 6.4.2.4 : Zone 4 Acoustic Equipment Zone 4 1 aircon Total Intensities = 1 X 10⁻⁸
SPL (dB) = 10log (I / Iref) = 10log ((1 X 10⁻⁸) / 10-12) =40 dB

86
Zone 5 : Coffee Counter
Figure 6.4.2.5 : Zone 5 Acoustic Equipment
Zone 5 1 coffee machine Total Intensities = 1 X 10⁻⁵
SPL (dB) = 10log (I / Iref) = 10log ((1 X 10⁻⁵) / 10-12) =70 dB
87
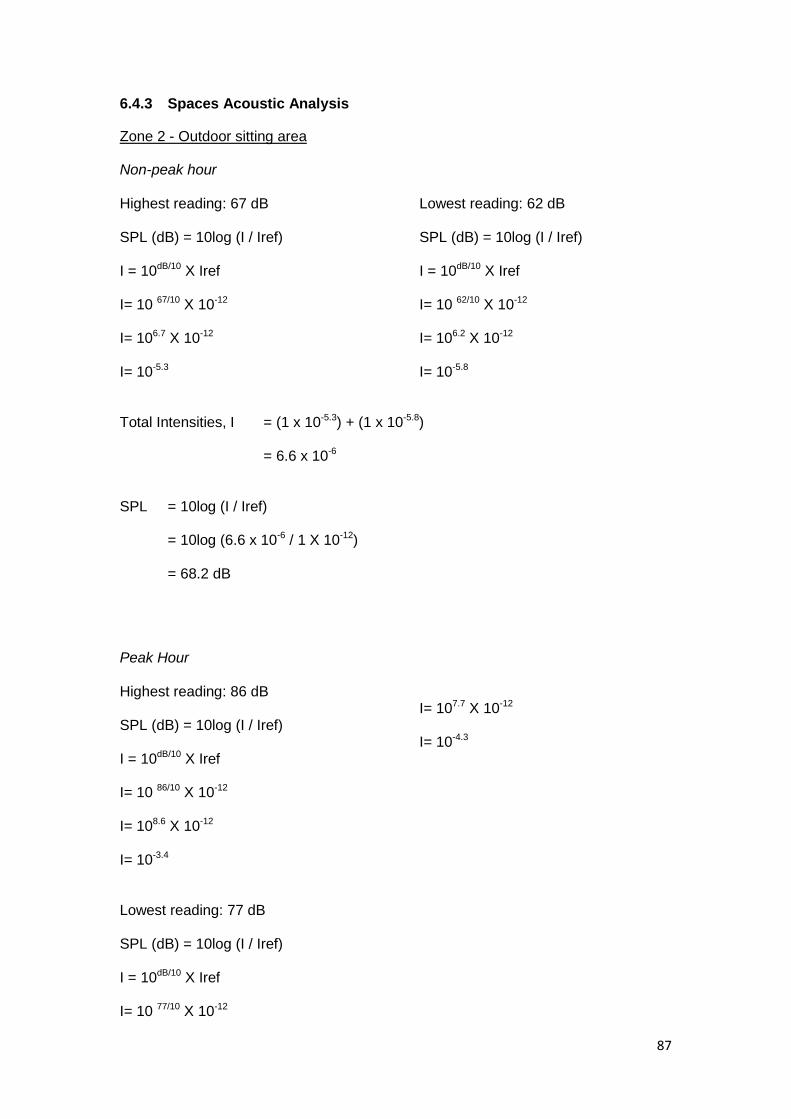
6.4.3 Spaces Acoustic Analysis
Zone 2 - Outdoor sitting area Non-peak hour Highest reading: 67 dB SPL (dB) = 10log (I / Iref) I = 10dB/10 X Iref I= 10 67/10 X 10-12
I= 106.7 X 10⁻¹²
I= 10-5.3
Lowest reading: 62 dB SPL (dB) = 10log (I / Iref) I = 10dB/10 X Iref I= 10 62/10 X 10-12
I= 106.2 X 10⁻¹²
I= 10-5.8
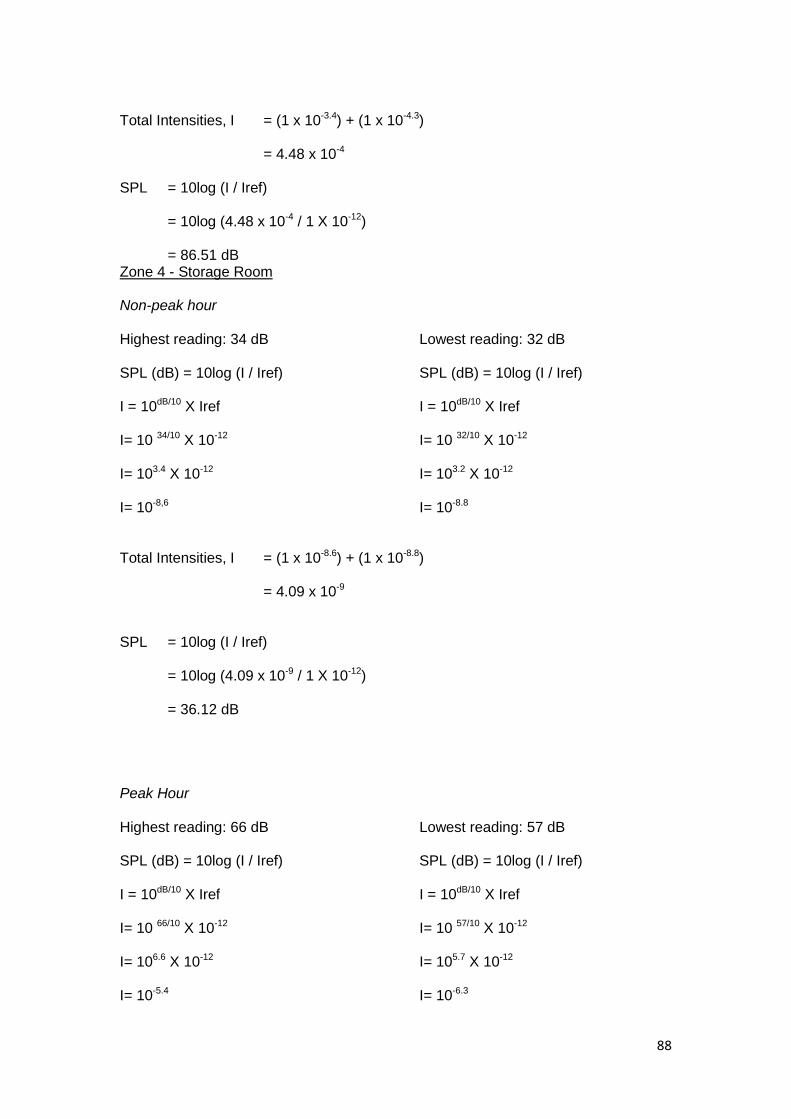
Total Intensities, I = (1 x 10-5.3) + (1 x 10-5.8) = 6.6 x 10⁻⁶
SPL = 10log (I / Iref) = 10log (6.6 x 10⁻⁶ / 1 X 10-12) = 68.2 dB Peak Hour Highest reading: 86 dB SPL (dB) = 10log (I / Iref) I = 10dB/10 X Iref I= 10 86/10 X 10-12
I= 108.6 X 10⁻¹²
I= 10-3.4
Lowest reading: 77 dB SPL (dB) = 10log (I / Iref) I = 10dB/10 X Iref I= 10 77/10 X 10-12
I= 107.7 X 10⁻¹²
I= 10-4.3
88
Total Intensities, I = (1 x 10-3.4) + (1 x 10-4.3) = 4.48 x 10⁻⁴
SPL = 10log (I / Iref) = 10log (4.48 x 10⁻⁴ / 1 X 10-12) = 86.51 dB Zone 4 - Storage Room Non-peak hour Highest reading: 34 dB SPL (dB) = 10log (I / Iref) I = 10dB/10 X Iref I= 10 34/10 X 10-12
I= 103.4 X 10⁻¹²
I= 10-8,6
Lowest reading: 32 dB SPL (dB) = 10log (I / Iref) I = 10dB/10 X Iref I= 10 32/10 X 10-12
I= 103.2 X 10⁻¹²
I= 10-8.8
Total Intensities, I = (1 x 10-8.6) + (1 x 10-8.8) = 4.09 x 10⁻⁹
SPL = 10log (I / Iref) = 10log (4.09 x 10⁻⁹ / 1 X 10-12) = 36.12 dB Peak Hour Highest reading: 66 dB SPL (dB) = 10log (I / Iref) I = 10dB/10 X Iref I= 10 66/10 X 10-12
I= 106.6 X 10⁻¹²
I= 10-5.4
Lowest reading: 57 dB SPL (dB) = 10log (I / Iref) I = 10dB/10 X Iref I= 10 57/10 X 10-12
I= 105.7 X 10⁻¹²
I= 10-6.3

89
Total Intensities, I = (1 x 10-5.4) + (1 x 10-6.3) = 4.48 x 10⁻⁶
SPL = 10log (I / Iref) = 10log (4.48 x 10⁻⁶ / 1 X 10-12) = 66.51 dB Zone 1 - Sitting Area Non-peak hour Highest reading: 74 dB SPL (dB) = 10log (I / Iref) I = 10dB/10 X Iref I= 10 74/10 X 10-12
I= 107.4 X 10⁻¹²
I= 10-5.6
Lowest reading: 42 dB SPL (dB) = 10log (I / Iref) I = 10dB/10 X Iref I= 10 42/10 X 10-12
I= 104.2 X 10⁻¹²
I= 10-7.8
Total Intensities, I = (1 x 10-5.6) + (1 x 10-7.8) = 2.53 x 10⁻⁶
SPL = 10log (I / Iref) = 10log (2.53 x 10⁻⁶ / 1 X 10-12) = 64.03 dB Peak Hour Highest reading: 86 dB SPL (dB) = 10log (I / Iref) I = 10dB/10 X Iref I= 10 86/10 X 10-12
I= 108.6 X 10⁻¹²
I= 10-3.4
Lowest reading: 64 dB SPL (dB) = 10log (I / Iref) I = 10dB/10 X Iref I= 10 64/10 X 10-12
I= 106.4 X 10⁻¹²
I= 10-5.6

90
Total Intensities, I = (1 x 10-3.4) + (1 x 10-5.6) = 4 x 10⁻⁴
SPL = 10log (I / Iref) = 10log (4 x 10⁻⁴ / 1 X 10-12) = 86.03 dB Zone 5 - Coffee Counter Non-peak hour Highest reading: 75 dB SPL (dB) = 10log (I / Iref) I = 10dB/10 X Iref I= 10 75/10 X 10-12
I= 107.5 X 10⁻¹²
I= 10-5.5
Lowest reading: 63 dB SPL (dB) = 10log (I / Iref) I = 10dB/10 X Iref I= 10 63/10 X 10-12
I= 106.3 X 10⁻¹²
I= 10-5.4
Total Intensities, I = (1 x 10-5.5) + (1 x 10-5.4) = 7.14 x 10⁻⁶
SPL = 10log (I / Iref) = 10log (7.14 x 10⁻⁶ / 1 X 10-12) = 68.54 dB Peak Hour Highest reading: 86 dB SPL (dB) = 10log (I / Iref) I = 10dB/10 X Iref I= 10 86/10 X 10-12
I= 108.6 X 10⁻¹²
I= 10-3.4
Lowest reading: 70 dB SPL (dB) = 10log (I / Iref) I = 10dB/10 X Iref I= 10 70/10 X 10-12
I= 107 X 10-12
I= 10-5
91
Total Intensities, I = (1 x 10-3.4) + (1 x 10⁻⁵) = 4.08 x 10⁻⁴
SPL = 10log (I / Iref) = 10log (4.08 x 10⁻⁴ / 1 X 10-12) = 86.11 dB
92
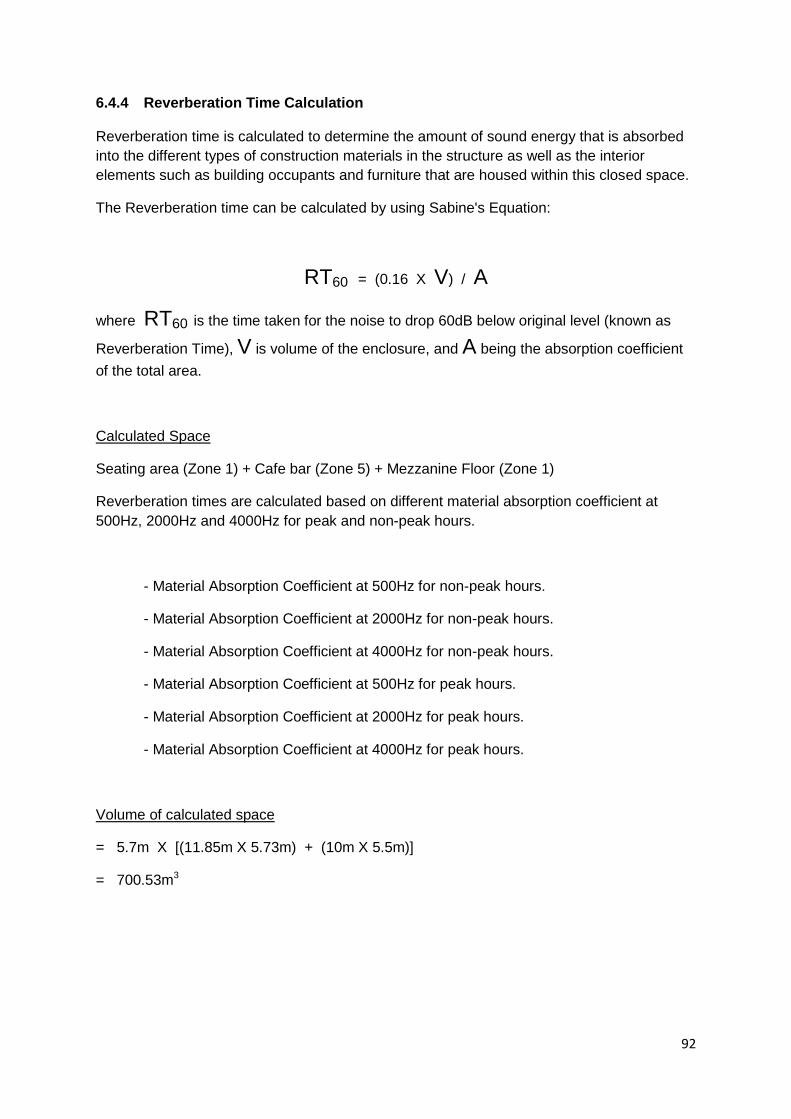
6.4.4 Reverberation Time Calculation Reverberation time is calculated to determine the amount of sound energy that is absorbed
into the different types of construction materials in the structure as well as the interior
elements such as building occupants and furniture that are housed within this closed space.
The Reverberation time can be calculated by using Sabine's Equation:
RT60 = (0.16 X V) / A
where RT60 is the time taken for the noise to drop 60dB below original level (known as
Reverberation Time), V is volume of the enclosure, and A being the absorption coefficient
of the total area.
Calculated Space
Seating area (Zone 1) + Cafe bar (Zone 5) + Mezzanine Floor (Zone 1)
Reverberation times are calculated based on different material absorption coefficient at
500Hz, 2000Hz and 4000Hz for peak and non-peak hours.
- Material Absorption Coefficient at 500Hz for non-peak hours.
- Material Absorption Coefficient at 2000Hz for non-peak hours.
- Material Absorption Coefficient at 4000Hz for non-peak hours.
- Material Absorption Coefficient at 500Hz for peak hours.
- Material Absorption Coefficient at 2000Hz for peak hours.
- Material Absorption Coefficient at 4000Hz for peak hours.
Volume of calculated space
= 5.7m X [(11.85m X 5.73m) + (10m X 5.5m)]
= 700.53m3

93
Reverberation Time at 500Hz / Non-Peak Hour
Table 6.4.4.1 : Reverberation Time at 500Hz
RT60 = (0.16 X V) / A
= (0.16 X 700.53) / 45.3507
= 2.47s
Component Material Function Area(m2) [A]/ Quantity
Absorption Coefficient
[S]
Sound Absorption
[SA]
Ceiling Plaster (Gypsum Board,
Smooth finish on lath)
Ceiling 122.29 0.06 7.3374
Steel (Painted)
Mezzanine Truss
14.84 0.44 6.5296
Wall Brick (Unglazed)
Wall 38.3 0.03 1.149
Plaster (White, Smooth finish
on brick)
Wall 16.32 0.02 0.3264
Plaster (Black,
Smooth finish on brick)
Wall 105.05 0.02 2.101
Glass (Large pane)
Fixed-Panel 52.91 0.04 2.1164
Openings Glass (Large Pane)
Pivot Door 3.52 0.04 0.1408
Timber (Plywood)
Pivot Door 4.4 0.15 0.66
Steel (Painted)
Folding Door 2.2 0.44 0.968
Floor Concrete Screed
Floor 122.29 0.015 1.83435
FiberBoard Mezzanine Floor
38.77 0.06 2.3262
Furniture Timber Table, Chair 5.87 0.15 0.8805
Timber Cupboard 5.8 0.05 0.29
Ceramic Countertop 6.54 0.01 0.0654
Concrete screed
Counter 44.43 0.015 0.66645
Fabric Sofa 7.96 0.77 6.1292
MDF Sofa 13.3 0.1 1.33
People (Non-Peak Hour)
25 0.42 10.5
Total Absorption [A] 45.3507
The reverberation time for the cafe at 500Hz
during non-peak hours is 2.47 seconds which is
adequately within the intended 1.5 – 2.5
seconds for public space that requires both
speech and music activities.

94
Reverberation Time at 2000Hz / Non-Peak Hour
Table 6.4.4.2 : Reverberation Time at 2000Hz
RT60 = (0.16 X V) / A
= (0.16 X 700.53) / 47.0248
= 2.38s
Component Material Function Area(m2) [A]/ Quantity
Absorption Coefficient
[S]
Sound Absorption
[SA]
Ceiling Plaster (Gypsum Board,
Smooth finish on lath)
Ceiling 122.29 0.04 4.8916
Steel (Painted)
Mezzanine Truss
14.84 0.54 8.0136
Wall Brick (Unglazed)
Wall 38.3 0.05 1.915
Plaster (White, Smooth finish
on brick)
Wall 16.32 0.02 0.3264
Plaster (Black,
Smooth finish on brick)
Wall 105.05 0.02 2.101
Glass (Large pane)
Fixed-Panel 52.91 0.02 1.0582
Openings Glass (Large Pane)
Pivot Door 3.52 0.02 0.0704
Timber (Plywood)
Pivot Door 4.4 0.1 0.44
Steel (Painted)
Folding Door 2.2 0.54 1.188
Floor Concrete Screed
Floor 122.29 0.02 2.4458
Fiber Board Mezzanine Floor
38.77 0.08 3.1016
Furniture Timber Table, Chair 5.87 0.18 1.0566
Timber Cupboard 5.8 0.05 0.29
Ceramic Countertop 6.54 0.02 0.1308
Concrete screed
Counter 44.43 0.02 0.8886
Fabric Sofa 7.96 0.82 6.5272
MDF Sofa 13.3 0.1 1.33
People (Non-Peak Hour)
25 0.45 11.25
Total Absorption [A] 47.0248
The reverberation time for the cafe at 2000Hz
during non-peak hours is at 2.38 seconds. This
falls within the comfortable range of the public
space which is between 1.5 – 2.5 seconds.
95
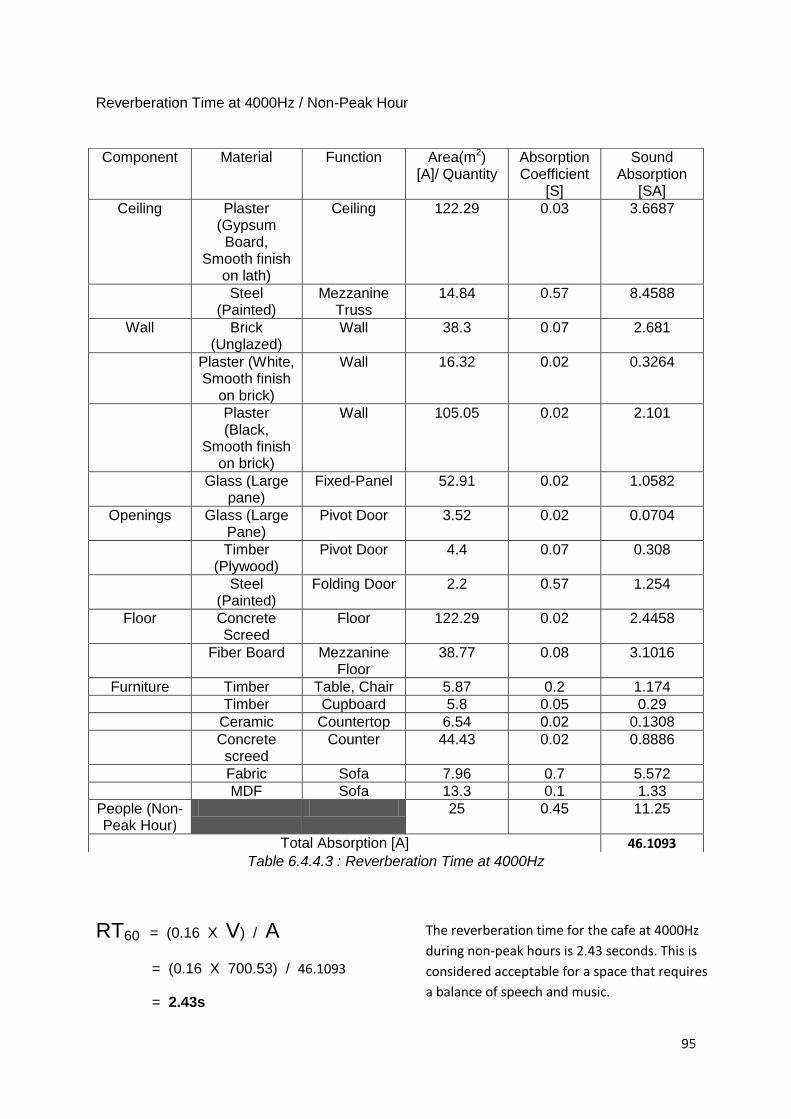
Reverberation Time at 4000Hz / Non-Peak Hour
Table 6.4.4.3 : Reverberation Time at 4000Hz
RT60 = (0.16 X V) / A
= (0.16 X 700.53) / 46.1093
= 2.43s
Component Material Function Area(m2) [A]/ Quantity
Absorption Coefficient
[S]
Sound Absorption
[SA]
Ceiling Plaster (Gypsum Board,
Smooth finish on lath)
Ceiling 122.29 0.03 3.6687
Steel (Painted)
Mezzanine Truss
14.84 0.57 8.4588
Wall Brick (Unglazed)
Wall 38.3 0.07 2.681
Plaster (White, Smooth finish
on brick)
Wall 16.32 0.02 0.3264
Plaster (Black,
Smooth finish on brick)
Wall 105.05 0.02 2.101
Glass (Large pane)
Fixed-Panel 52.91 0.02 1.0582
Openings Glass (Large Pane)
Pivot Door 3.52 0.02 0.0704
Timber (Plywood)
Pivot Door 4.4 0.07 0.308
Steel (Painted)
Folding Door 2.2 0.57 1.254
Floor Concrete Screed
Floor 122.29 0.02 2.4458
Fiber Board Mezzanine Floor
38.77 0.08 3.1016
Furniture Timber Table, Chair 5.87 0.2 1.174
Timber Cupboard 5.8 0.05 0.29
Ceramic Countertop 6.54 0.02 0.1308
Concrete screed
Counter 44.43 0.02 0.8886
Fabric Sofa 7.96 0.7 5.572
MDF Sofa 13.3 0.1 1.33
People (Non-Peak Hour)
25 0.45 11.25
Total Absorption [A] 46.1093
The reverberation time for the cafe at 4000Hz
during non-peak hours is 2.43 seconds. This is
considered acceptable for a space that requires
a balance of speech and music.

96
Reverberation Time at 500Hz / Peak Hour
Table 6.4.4.4 : Reverberation Time at 500Hz
RT60 = (0.16 X V) / A
= (0.16 X 700.53) / 66.3507
= 1.69s
Component Material Function Area(m2) [A]/ Quantity
Absorption Coefficient
[S]
Sound Absorption
[SA]
Ceiling Plaster (Gypsum Board,
Smooth finish on lath)
Ceiling 122.29 0.06 7.3374
Steel (Painted)
Mezzanine Truss
14.84 0.44 6.5296
Wall Brick (Unglazed)
Wall 38.3 0.03 1.149
Plaster (White, Smooth finish
on brick)
Wall 16.32 0.02 0.3264
Plaster (Black,
Smooth finish on brick)
Wall 105.05 0.02 2.101
Glass (Large pane)
Fixed-Panel 52.91 0.04 2.1164
Openings Glass (Large Pane)
Pivot Door 3.52 0.04 0.1408
Timber (Plywood)
Pivot Door 4.4 0.15 0.66
Steel (Painted)
Folding Door 2.2 0.44 0.968
Floor Concrete Screed
Floor 122.29 0.015 1.83435
FiberBoard Mezzanine Floor
38.77 0.06 2.3262
Furniture Timber Table, Chair 5.87 0.15 0.8805
Timber Cupboard 5.8 0.05 0.29
Ceramic Countertop 6.54 0.01 0.0654
Concrete screed
Counter 44.43 0.015 0.66645
Fabric Sofa 7.96 0.77 6.1292
MDF Sofa 13.3 0.1 1.33
People (Peak Hour)
75 0.42 31.5
Total Absorption [A] 66.3507
The reverberation time for the cafe at 500Hz
during peak hours is 1.69 seconds. This is well
within the boundary of 1.5 – 2.5 seconds and
shows that the cafe has adequate acoustic
absorption properties.

97
Reverberation Time at 2000Hz / Peak Hour
Table 6.4.4.5 : Reverberation Time at 2000Hz
RT60 = (0.16 X V) / A
= (0.16 X 700.53) / 69.5248
= 1.61s
Component Material Function Area(m2) [A]/ Quantity
Absorption Coefficient
[S]
Sound Absorption
[SA]
Ceiling Plaster (Gypsum Board,
Smooth finish on lath)
Ceiling 122.29 0.04 4.8916
Steel (Painted)
Mezzanine Truss
14.84 0.54 8.0136
Wall Brick (Unglazed)
Wall 38.3 0.05 1.915
Plaster (White, Smooth finish
on brick)
Wall 16.32 0.02 0.3264
Plaster (Black,
Smooth finish on brick)
Wall 105.05 0.02 2.101
Glass (Large pane)
Fixed-Panel 52.91 0.02 1.0582
Openings Glass (Large Pane)
Pivot Door 3.52 0.02 0.0704
Timber (Plywood)
Pivot Door 4.4 0.1 0.44
Steel (Painted)
Folding Door 2.2 0.54 1.188
Floor Concrete Screed
Floor 122.29 0.02 2.4458
Fiber Board Mezzanine Floor
38.77 0.08 3.1016
Furniture Timber Table, Chair 5.87 0.18 1.0566
Timber Cupboard 5.8 0.05 0.29
Ceramic Countertop 6.54 0.02 0.1308
Concrete screed
Counter 44.43 0.02 0.8886
Fabric Sofa 7.96 0.82 6.5272
MDF Sofa 13.3 0.1 1.33
People (Peak Hour)
75 0.45 33.75
Total Absorption [A] 69.5248
At 2000Hz. the reverberation time for the cafe
during peak hours is 1.61 seconds which
satisfies the requirement of such space to be
within 1.5 – 2.5 seconds.
98
Reverberation Time at 4000Hz / Peak Hour
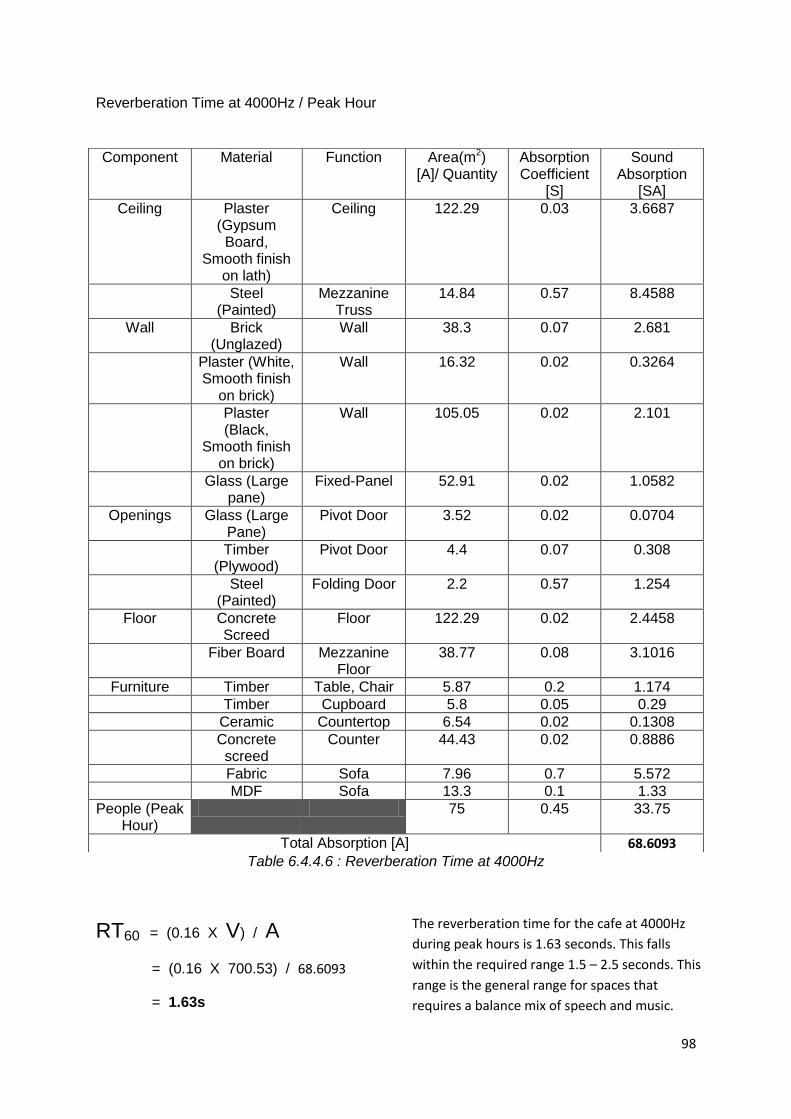
Table 6.4.4.6 : Reverberation Time at 4000Hz
RT60 = (0.16 X V) / A
= (0.16 X 700.53) / 68.6093
= 1.63s
Component Material Function Area(m2) [A]/ Quantity
Absorption Coefficient
[S]
Sound Absorption
[SA]
Ceiling Plaster (Gypsum Board,
Smooth finish on lath)
Ceiling 122.29 0.03 3.6687
Steel (Painted)
Mezzanine Truss
14.84 0.57 8.4588
Wall Brick (Unglazed)
Wall 38.3 0.07 2.681
Plaster (White, Smooth finish
on brick)
Wall 16.32 0.02 0.3264
Plaster (Black,
Smooth finish on brick)
Wall 105.05 0.02 2.101
Glass (Large pane)
Fixed-Panel 52.91 0.02 1.0582
Openings Glass (Large Pane)
Pivot Door 3.52 0.02 0.0704
Timber (Plywood)
Pivot Door 4.4 0.07 0.308
Steel (Painted)
Folding Door 2.2 0.57 1.254
Floor Concrete Screed
Floor 122.29 0.02 2.4458
Fiber Board Mezzanine Floor
38.77 0.08 3.1016
Furniture Timber Table, Chair 5.87 0.2 1.174
Timber Cupboard 5.8 0.05 0.29
Ceramic Countertop 6.54 0.02 0.1308
Concrete screed
Counter 44.43 0.02 0.8886
Fabric Sofa 7.96 0.7 5.572
MDF Sofa 13.3 0.1 1.33
People (Peak Hour)
75 0.45 33.75
Total Absorption [A] 68.6093
The reverberation time for the cafe at 4000Hz
during peak hours is 1.63 seconds. This falls
within the required range 1.5 – 2.5 seconds. This
range is the general range for spaces that
requires a balance mix of speech and music.

99
Reverberation Time Analysis and Conclusion
From the gathered data, the reverberation timing for 500Hz, 2000Hz and 4000Hz could be
acquired and there is a noticeable pattern that emerged from both peak and non-peak hours.
The reverberation time for non-peak hours are gathered at the higher end of the desired
range of 1.5 to 2.5 seconds while the reverberation time for peak hours are reduced to the
lower end of the range. The reverberation time is indirectly proportional to the amount of
occupants inside the space as people contributes significantly towards acoustic absorption
of the space and help enhance it.
The reasons why the cafe has a high reverberation time is due to the double volume of the
space which has a height of 5.7 meters. This high reverberation time is further bolstered by
the lack of acoustic absorbing materials such as concrete, which, when sound reaches the
material, get reflected more than it gets absorbed, and consequently creating a higher
reverberation time.
Even though the reverberation time is quite high for a comfort human range of 0.8 to 1.3
seconds, it is quite acceptable for a cafe that requires the balance blend between soft music
and relaxing conversation. Hence, it is safe to say that the cafe has a good acoustic
reverberation properties.

100
6.4.5 Sound Reduction Index Calculation
Sound Reduction Index
The first floor sitting area is identified as the main space to analyze the acoustic transmission from and into the area. Not only that this space incorporates the main sitting area (ZONE 1) and the coffee counter (ZONE 2), but as well as the immediate outdoor sitting area. The outdoor sitting area (ZONE 3) is established as the secondary area to record sound transmission into that particular space, in order to understand whether acoustic measures such as the selection of materials are sufficient to buffer sound between these spaces and is essential to identify the acoustic ratings of these two spaces. For main sitting area and coffee counter area:
Figure 6.4.5.1 : Zone 1 Plan
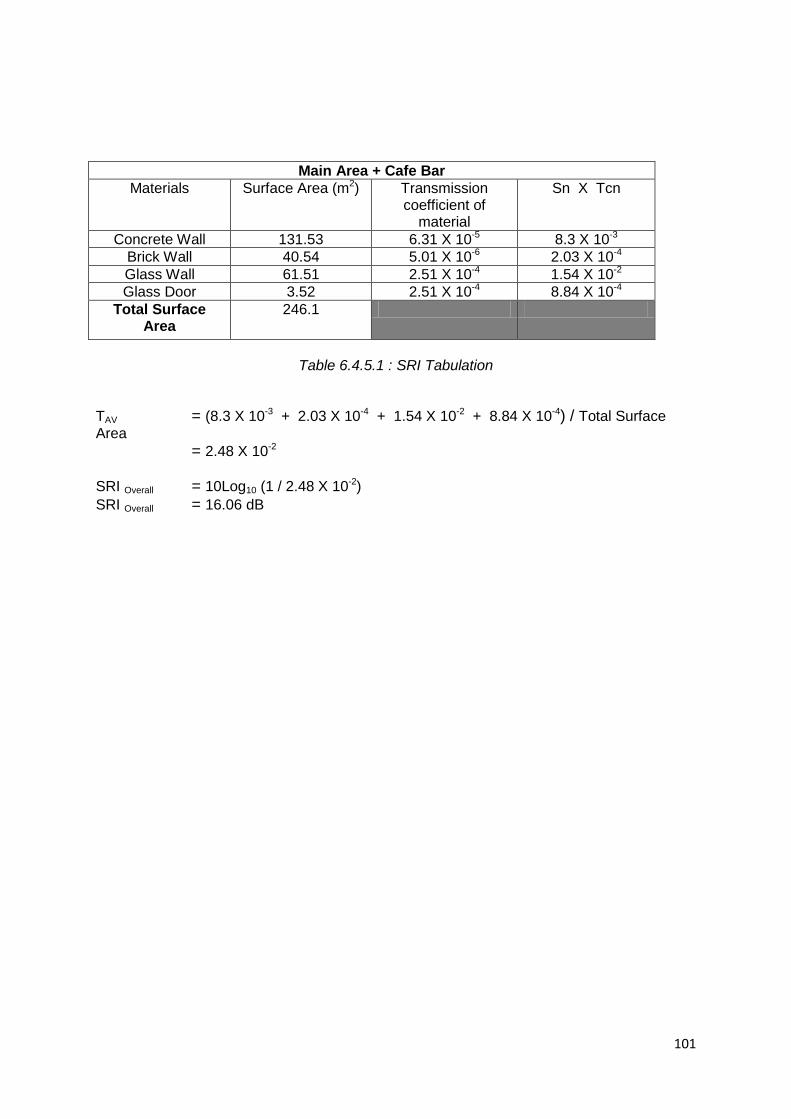
101
Main Area + Cafe Bar
Materials Surface Area (m2) Transmission coefficient of
material
Sn X Tcn
Concrete Wall 131.53 6.31 X 10⁻⁵ 8.3 X 10⁻³
Brick Wall 40.54 5.01 X 10⁻⁶ 2.03 X 10⁻⁴
Glass Wall 61.51 2.51 X 10⁻⁴ 1.54 X 10⁻²
Glass Door 3.52 2.51 X 10⁻⁴ 8.84 X 10⁻⁴
Total Surface Area
246.1
Table 6.4.5.1 : SRI Tabulation
TAV = (8.3 X 10⁻³ + 2.03 X 10⁻⁴ + 1.54 X 10⁻² + 8.84 X 10⁻⁴) / Total Surface
Area
= 2.48 X 10⁻²
SRI Overall = 10Log10 (1 / 2.48 X 10⁻²)
SRI Overall = 16.06 dB

102
For outdoor sitting area:
Figure 6.4.5.2 : Zone 2 Plan
Private Gathering Space
Materials Surface Area (m2) Transmission coefficient of
material
Sn X Tcn
Concrete Wall 30.78 6.31 X 10⁻⁵ 1.94 X 10⁻³
Brick Wall 14.7 5.01 X 10⁻⁶ 7.36 X 10⁻⁵
Glass Wall 36.82 2.51 X 10⁻⁴ 9.24 X 10⁻³
Glass Door 2.2 2.51 X 10⁻⁴ 5.52 X 10⁻⁴
Total Surface Area
84.5
Table 6.4.5.2 : SRI Tabulation
TAV = (1.94 X 10⁻³ + 7.36 X 10⁻⁵ + 9.24 X 10⁻³ + 5.52 X 10⁻⁴) / Total Surface Area = 1.4 X 10⁻⁴ SRI Overall = 10Log10 (1 / 1.4 X 10⁻⁴) SRI Overall = 38.53 dB

103
6.5 Analysis and Evaluation
Table: Sound Environments with their corresponding Sound Pressure Levels(Source:
http://trace.wisc.edu/docs/2004-About-dB/)
With reference to the table of general sound environments, the noise level readings of the
main and private sitting areas are averagely between 60-79dB, which means that the noise
levels in these areas are from normal to four times as loud as a conversation noise level. It is
considered as a typical acoustic trait, being a café with customers converse, as well as
music being played from the speakers.
The coffee counter has a relatively higher reading of 70-89dB, which is four times
louder than the sound level of a normal conversation. The high readings were contributed by
the noise level from the coffee machines and grinders that are being utilized from time to
time. The noise level of the coffee counter is also contributed by the use of speakers for
background music in the café.
Artisan Café has a typical overall noise levels that are common in other cafes and
restaurants. However, during peak hours it may be quite loud, as the more customers there
are in the café, the higher volume of music being played on the speakers will be used to
mask the conversation noises.

104
7.0 REFERENCES
1. STC Chart (n.d.).STC Ratings for Brick and Concrete Block. Retrieved from
http://www.sae.edu/reference material/pages/STC%20Chart.html
2. Paroc Group (2014). Sound Insulation. Retrieved from
http://www.paroc.com/knowhow/sound/sound-insulation
3. ThomasNet (2014).Sound Absorption Coefficients. Retrieved from
http://www.sae.edu/reference material/pages/Coeffieicnet%20Chart.html
4. Hongkong Institute of Architects.(2008). Wave Motion, Noise Control in Architecture.
5. Harris, Cyril M. Noise Control in Buildings: A Practical Guide for Architects and Engineers.
NewYork: McGraw-Hill, 1993.
6. Neufert, Ernst and Peter.Neufert Architects’ Data. Oxford: Wilet-Blackwell, 2012
7. AZO Network (2014). Sound Transmission and Insulation in Brick and Masonry
Walls.Retrieve from
http://www.azom.com/article.aspx?ArticleID=1326
8. Deru, M., Torcellini, P., Sheffer, M., & Lau, A. (2005).Analysis of the Design and Energy
Performance of the Pennsylvania Department of Environmental protection Cambria Office
Building. Doi:10.2172/15016075
9. INTERIOR LIGHTING DESIGN A STUDENT’S GUIDE. (n.d.) Retrieved from
http://www.slideshare.net/nosuhaila/interior-lighting-design-a-students-guide
105
10. Malaysia. (2007). Code of practice on energy efficiency and use of renewable energy for non-
residential buildings (first revision).Putrajaya: Department of Standard Malaysia.
11. Subtle variations: the uses of artificial and natural light in the menil collection, Houston,
texas, (n.d) Retrieved from
http://www.arch.ced.berkeley.edu/vitalsigns/bld/toolkit_studies/menil%20collection%20--
%20Subtle%20Variations.pdf
12. Technical – Photometric Data Guid. (n.d) Retrieved from
http://lightsbylinea.com/index.php?route=information%2Finformation&information_id=10
13. Robert B. (n.d) Noise Control for Buildings. Guidelines for Acoustical Problem Solving
Retrieve from
http://www.certainteed.com/resources/NoiseControl%20Brochure%203
14. Long, M. (2006). Architectural acoustics. Amsterdam: Elsevier/Academic Press.
15. Barton, C.K,.& Construction Engineering Research Laboratory. (1987). Development of LITE
graphic module for lighting analysis in the Computer-Aided Engineering and Architectural
Design System(CAEADS). Champaign, IL: US Army Corps of Engineers, Construction
Engineering Research Laboratory.
16. Calculux Indoor – Philips Lighting Singapore. (n.d) Retrieved from
http://www.lighting.philips.com/pwc_li/cn_zh/connect/tools_literature/Assets/downloads/
manual_indoor.pdfCIBSE. (2002). Code for lighting. Burlington: Elsevier.
17 Coefficient Chart. (n.d). Retrieved from
http://www.sae.edu/reference_material/pages/Coefficient%20Chart.htm
106
8.0 APPENDIX
LIST OF FIGURES
Figure 2.1.1 : Image of Solar Decathlon House
Figure 2.1.1: Floor Plan of Solar Decathlon House
Diagram 2.1.2 : Analysis Diagram
Figure 2.2.1 : Yildiz Technical University Auditorium
Figure 2.2.2: Section of the YTU auditorium (after renovation)
Figure 2.2.3: Plan of YTU auditorium (after renovation)
Figure 3.1.1 : digital lux meter
Diagram3.1.1 : Standard height used to record Lux readings
Figure 3.2.1 : Digital Sound Level Meter
Figure4.1.2: Site Context of the Cafe
Figure 4.7.1 : Ground Floor Zoning
Figure 4.7.2 : Mezzanine Floor Zoning
Diagram 5.2.1 Daylight Lux Contour Diagram
Diagram 5.2.2 Artificial Lux Contour Diagram
Figure 6.1.2: Placement of Air Circulators
Figure 6.1.3: Human activity point
Figure 6.1.4: Position of Speakers
107
LIST OF TABLES
Table 2.1.1 : Materiality Reflectance Table
Table 2.2.1:Surface materials in auditorium, their surface area and absorption coefficient
(based on Harris, 1994:Cavanaugh & Wilco, 1999)
Table 2.2.2 RTs Calculation
Table 2.2.3 : Measured and acceptable BSLs (air conditioning)
Table 2.2.4: Measured, calculated and optimum RTs of YTU auditorium for speech activities
Table 4.1.1 Artifial Lighting Sources
Table 4.1.2 Acoustic Sources
Table 5.1.1 Daytime Lux Readings
Table 5.1.2 Nightime Lux Readings
Table 6.2.1 Peak and Non - Peak Hours Readings

108
Related Documents