www.harriswilliams.com Investment banking services are provided by Harris Williams LLC, a registered broker-dealer and member of FINRA and SIPC, and Harris Williams & Co. Ltd, which is authorised and regulated by the Financial Conduct Authority. Harris Williams & Co. is a trade name under which Harris Williams LLC and Harris Williams & Co. Ltd conduct business. BUILDING PRODUCTS & MATERIALS INDUSTRY UPDATE │ APRIL 2015

Welcome message from author
This document is posted to help you gain knowledge. Please leave a comment to let me know what you think about it! Share it to your friends and learn new things together.
Transcript

www.harriswilliams.com
Investment banking services are provided by Harris Williams LLC, a registered broker-dealer and member of FINRA and SIPC, and Harris Williams & Co. Ltd, which is authorised andregulated by the Financial Conduct Authority. Harris Williams & Co. is a trade name under which Harris Williams LLC and Harris Williams & Co. Ltd conduct business.
BUILDING PRODUCTS & MATERIALS
0
INDUSTRY UPDATE │ APRIL 2015

PAGE |
www.harriswilliams.com
BUILDING PRODUCTS AND MATERIALS GROUP OVERVIEW
1
CONTENTS
WHAT WE’RE READING
ECONOMIC UPDATE
M&A MARKET TRENDS
PUBLIC MARKETS
PUBLIC COMPARABLES
M&A ACTIVITY
CONTACTS
Mike HoganManaging [email protected]
+1 (804) 915-0104
Ryan NelsonManaging [email protected]
+1 (804) 915-0121
Trey Packard
Vice President
+1 (804) 887-6016
INTRODUCTION
Harris Williams & Co. is pleased to present our Building Products & Materials IndustryUpdate for April 2015. This report provides commentary and analysis on currentcapital market trends and merger and acquisition dynamics within the globalbuilding products and materials industry.
We hope you find this edition helpful and encourage you to contact us directly ifyou would like to discuss our perspective on current industry trends and M&Aopportunities or our relevant industry experience.
BUILDING PRODUCTS AND MATERIALS
INDUSTRY UPDATE │ APRIL 2015
OUR PRACTICE
Harris Williams & Co. is a leading advisor to the building products and materialsindustry. Our significant experience covers a broad range of end markets,industries, and business models.
Construction
Materials
Building
Products
Distribution &
Services
has been acquired by
a portfolio company of
a portfolio company of
has been acquired by
a portfolio company of
has been acquired by
a subsidiary of
has been acquired by
Select Atlanta, Georgia
aggregates assets of LaFarge
SA have been acquired byhas been acquired by
a division of
has been acquired by
a portfolio company of
has been acquired by
a portfolio company of
Aggregates
Asphalt
Aluminum
Bricks
Clay
Glass
Precast Concrete / Ready Mix
Steel
Stone
Acoustical
Cabinets &
Countertops
Carpet and Flooring
Gypsum / Wallboard
Electrical Fixtures
HVAC
Lumber
Plumbing Fixtures
Roofing
Siding
Tools and Hardware
Windows & Doors
Architectural and
Engineering
Installation and
Contracting
Lumber and
Hardware
Plumbing
Roofing and Siding
Site Development
Wallboard
Construction
MaterialsBuilding Products
Distribution &
Services
has been acquired by
a portfolio company of
has been acquired by
has been acquired by
a portfolio company of
has been acquired by
a portfolio company of
has been acquired by
a portfolio company of
a division of
a portfolio company of
has been acquired by
a subsidiary of
has been acquired by
www.harriswilliams.com

PAGE |
www.harriswilliams.com
WHAT WE’RE READING
2
SAWLOG PRICES DECLINED IN MANY COUNTRIES IN 2014
BFS ANTES $1.63 BILLION FOR PROBUILD TO FORM DISTRIBUTION GIANT
AMERICA, HERE IS THE FUTURE OF YOUR HOUSING MARKET
HOLCIM-LAFARGE MERGER IS ON AGAIN
Forrest Industry Network 4/7/2015
Sawlog prices declined in many countries during 2014 and the GSPI price index in the 4Q/14 was at the lowest level intwo years, reports the Wood Resource Quarterly. For the third consecutive quarter, the GSPI price index fell inthe 4Q/2014 to the lowest level in two years, reports the Wood Resource Quarterly. The biggest price declines the pastyear have occurred in Europe, Latin America and Oceania, while prices in North America have remained stablethanks to healthy domestic demand for lumber.
Read the full article here.
Builder Online 4/13/2015
PROSALES chief editor Craig Webb has an early take on the Builders FirstSource (BFS) announcement that it willacquire ProBuild in an all-cash deal worth $1.63 billion. The acquisition creates America's biggest pro-oriented buildingmaterial supplier, a $6.1 billion giant with operations from Florida to Alaska. Just as home building companies areconsolidating to capture scale and market diversification opportunities during the early innings of recovery, thedistribution channel is now streamlining itself to simplify the flow of building materials, products, and supplies to jobsites.
Read the full article here.
Business Insider 4/13/2015
Homebuilding activity is coming back to life. On Monday, as the spring selling season kicks in, RBC Capital Marketsupgraded its forecasts for housing starts through 2017. In a note to clients, RBC's Robert Wetenhall wrote: "We areraising our forecast for housing starts in 2015, 2016 and 2017 to 1.1 MM (+10%), 1.2 MM (+9%) and 1.25 MM (+4%) ... Thisis an obvious positive for the spring selling season and leads us to believe that our preferred names (DR Horton, LennarCorporation, and PulteGroup) among the public builders can potentially meet or beat consensus estimates driven bystrong demand and solid ASP growth."
Read the full article here.
Concrete Construction 3/23/2015
A proposed $44.27 billion merger between Switzerland-based Holcim Ltd. and France's Lafarge SA, is moving forwardagain, after the two companies came to an agreement over some changes in the original terms over the stockholdershare exchange ratio and exactly who will lead the combined operation. According to the press release, Both partiesagreed on a new exchange ratio of 9 Holcim shares for 10 Lafarge shares. A new Chief Executive Officer for thecombined group, to be proposed by the Lafarge Board and accepted by the Holcim Board, will be appointed asfrom the closing of the transaction.
Read the full article here.
INDUSTRY UPDATE │ APRIL 2015
SAND DEMAND SLIPS
Aggregates Research 4/13/2015
US sand mines, including 63 in Wisconsin and six in Minnesota, are projected to ship significantly less sand to oil drillersin 2015, compared with last year, when companies like Fairmount Santrol, US Silica and Superior Silica Sands setproduction records, industry sources say. "This whole ripple effect has taken hold and it is going to continue," saidRichard Shearer, CEO of Superior Silica Sands, a Texas-based company that operates sand mines in Wisconsin. "Thereare peak cycles and trough cycles, and we have hit a trough."
Read the full article here.
BUILDING PRODUCTS AND MATERIALS

PAGE |
www.harriswilliams.com
94
96
98
100
102
104
106
108
110
(1.0%)
(0.5%)
0.0%
0.5%
1.0%
1.5%
2.0%
Q32012
Q42012
Q12013
Q22013
Q32013
Q42013
Q12014
Q22014
Q32014
Q42014
ECONOMIC UPDATE
3
INDUSTRIAL PRODUCTION INDEX
BUILDING PRODUCTS AND MATERIALS
GDP
Real GDP increased by 0.5% in the fourthquarter of 2014, and overall GDPincreased 2.4% in 2014, compared to anincrease of 2.2% for 2013
The increase in 2014 reflected positivecontributions from PCE, nonresidentialfixed investment, exports, state and localgovernment spending, private inventoryinvestment, and residential fixedinvestment
Current dollar GDP increased 3.9%, or$650.8 billion, in 2014, compared to anincrease of 3.7%, or $604.9 billion in 2013
The U.S. economy seems to be slowingtowards a medium-term trend, however, astrong dollar, jobs, wages and sentimentare expected to drive consumer spending
Industrial production increased 0.1% inFebruary after decreasing .3% in January
Manufacturing output fell for the thirdstraight month and decreased 0.2% inFebruary, while the mining index fell 2.5%
Utilities output jumped 7.3% due to thedemand for heating caused by especiallycold temperatures around the country
Capacity Utilization for the industrial sectordecreased to 78.9% in February, nearly 1.2%below its long-run (1972-2014) average
Manufacturing production is forecast togrow 3.5% in 2015, due to job gains andinvestments in natural gas infrastructure, thehousing supply chain, transportationinfrastructure, factory automation, medicalcare expansion, and increasing confidence
Seasonally AdjustedSources: Bureau of Economic Analysis
Seasonally AdjustedSources: Board of Governors of the Federal Reserve System
(Change in billions of dollars)
(Indexed to 2007)
INDUSTRY UPDATE │ APRIL 2015

PAGE |
www.harriswilliams.com
ECONOMIC UPDATE
4
PERSONAL CONSUMPTION EXPENDITURES
ECONOMIC SENTIMENT
In February, personal income increased$58.6 billion, or 0.4%, while personalconsumption expenditures (PCE)increased $11.8 billion, or 0.1%
PCE, personal interest payments, andpersonal current transfer paymentsincreased $14.2 billion in February, instark contrast to a decrease of $25.4billion in January
Proprietors’ income decreased $7.0billion in February, compared to adecrease of $11.7 billion in January afterthe holiday shopping season
The economic sentiment index measureshow consumers view prospects for theirown financial situation, how they view thenear-term general economy prospects,and their long-term view of economicprospects
The Leading Economic Index (LEI) for theU.S. improved again in February, drivenmostly by positive contributions frombuilding permits and financial components
For the six months ending February 2015,the leading economic index increased2.4% (approximately a 5% annual rate),slower than the growth of 3.7% during theprevious six months
The largest positive contributors forFebruary were the interest rate spread,stock prices, building permits, the LeadingCredit Index, consumer businessexpectations, and manufacturers’ neworders for consumer goods
BUILDING PRODUCTS AND MATERIALS
INDUSTRY UPDATE │ APRIL 2015
Indexed to 2010Sources: The Conference Board
(percentage change in 6-month rolling average)
(indexed to 2010)
Sources: The Federal Reserve Bank of St. Louis
0.00%
0.10%
0.20%
0.30%
0.40%
0.50%
0.60%
Jul-10 Jan-11 Jul-11 Jan-12 Jul-12 Jan-13 Jul-13 Jan-14 Jul-14 Jan-15
100
107
114
121
128
Jun-12 Dec-12 Jun-13 Dec-13 Jun-14 Dec-14

PAGE |
www.harriswilliams.com
ECONOMIC UPDATE
5
CONSUMER CONFIDENCE INDEX (CCI)
KEY INTEREST RATES
The Consumer Confidence Indeximproved to 101.3 in March, up from 98.8in February
The increase was driven by an improvedshort-term outlook for both incomeprospects and employment, althoughconsumers were less enthusiastic aboutbusiness conditions
Consumer confidence is currently 8.81%higher than the year-end 2014 rate, and30.71% higher than the year-end 2013rate
The 30-year mortgage rate declined inMarch 2015 to 3.77%, the lowest ratesince May 2013
The current mortgage rate is 57 basispoints lower than the rate in March 2014
It is still unclear when the Fed plans toraise rates, but it is expected sometimelater this year through practices the Fedrefers to as “policy normalization”
BUILDING PRODUCTS AND MATERIALS
INDUSTRY UPDATE │ APRIL 2015
0
20
40
60
80
100
120
Indexed to 1985Sources: The Conference Board
Seasonally AdjustedSources: Federal Reserve Bank of St. Louis
0.0%
1.0%
2.0%
3.0%
4.0%
5.0%
6.0%
7.0%
8.0%
30-Yr Mortgage Rates 10-Yr Treasury Effective Federal Funds Rate

PAGE |
www.harriswilliams.com
ECONOMIC UPDATE
6
U.S. NON-RESIDENTIAL CONSTRUCTION
U.S. HOUSING STARTS
U.S. housing starts in February were at aseasonally adjusted annual rate of897,000, 17% below the January estimateof 1,081,000, and 3% below the estimatefor February 2014
This decrease in housing starts wasattributable to major drop-offs in multi-family homes, as well as single-familyhomes, which accounts forapproximately two-thirds of the market
February’s drop in housing starts was thelargest decline since 2011, and primarilydue to plunging temperatures andsnowstorms across the country
Housing starts continue to rebound fromunprecedented lows reached in 2009,yet remain ~30% below the 50-yearaverage of 1.5 million starts per year andare still below the average cyclical low of1.0 million
Single family homes are ~37% below thehistorical average of 1.0 million, whilemulti-family starts are just 16% below theirlong-term average of 418,000
New residential construction is projectedto grow at a 22% CAGR from 2014 to 2018
BUILDING PRODUCTS AND MATERIALS
INDUSTRY UPDATE │ APRIL 2015
Sources: Census Bureau; projections are derived from census of 11 reputable sources
0
500
1,000
1,500
2,000
2,500
1960 1968 1976 1984 1992 2000 2008 2016P
Single Family Multi Family50-Year Average Average Recesion Low
(units in 000’s)2014 Housing Starts: ~30% below 50-year average
Feb. 2015 Total: 897M-o-M Δ: (17%)Y-o-Y Δ: (3%)
Non-residential construction has laggedin recovery compared to otherconstruction markets, and is stillsignificantly below historical peak levels
Non-residential construction decreasedfrom January to February by .1%, anddecreased by 1.9% from the same perioda year ago
Several sectors within non-residentialconstruction that continue to seespending increases includemanufacturing, amusement andrecreation, office, and sewage andwaste disposal
-12.0%
-8.0%
-4.0%
0.0%
4.0%
8.0%
12.0%
$450
$500
$550
$600
$650
$700
$750
Jan-06 Jan-07 Jan-08 Jan-09 Jan-10 Jan-11 Jan-12 Jan-13 Jan-14 Jan-15
Non-Residential Construction Non-Residential Construction M-o-M Change
($ in billions)
Seasonally Adjusted Annual RateSources: U.S. Department of Commerce: Census Bureau

PAGE |
www.harriswilliams.com
ECONOMIC UPDATE
7
REPAIR AND REMODELING SPEND
U.S. REMODELING MARKET INDEX
Repair and remodeling spend reachedover $155 billion in 2014, and continuesto experience significant growth ashomeowners invest in their homes
Repair and remodeling spend is lesscyclical than new construction andprovides stability to the overall market
R&R spend dropped just 10% from 2007to 2009 as consumers chose to invest inrepairs and remodels in lieu of makingsubstantial investment in new homes
Growth for 2014 – 2018 is projected at aCAGR of 4.4%
In the fourth quarter of 2014, theRemodeling Market Index (RMI) posted arecord-high result of 60, the seventhconsecutive quarter for an RMI over 50.
An RMI over 50 indicate that remodelersare reporting higher activity than theprevious quarter. The overall RMIaverages the indicators of current andfuture remodeling activity.
All four subcomponents of the RMI futureindex, bids, commitments for threemonths, job backlog, and appointmentsfor proposals saw increases over the priorperiod.
BUILDING PRODUCTS AND MATERIALS
INDUSTRY UPDATE │ APRIL 2015
Sources: McGraw Hill
40
45
50
55
60
65
Q1
2012
Q3
2012
Q1
2013
Q3
2013
Q1
2014
Q3
2014
Index values greater than 50 indicate activity higher than
the previous quarter
Sources: National Association of Home Builders
$0
$50
$100
$150
$200
2002 2004 2006 2008 2010 2012 2014 2016P 2018P
($ in billions)
2014 – 2018 CAGR: 4.4%
PAGE |
www.harriswilliams.com
0
10
20
30
40
50
60
70
Q1
2010
Q2
2010
Q3
2010
Q4
2010
Q1
2011
Q2
2011
Q3
2011
Q4
2011
Q1
2012
Q2
2012
Q3
2012
Q4
2012
Q1
2013
Q2
2013
Q3
2013
Q4
2013
Q1
2014
Q2
2014
Q3
2014
Q4
2014
Q1
2015
Nu
mb
er
of
An
no
un
ce
d M
&A
De
als
M&A MARKET TRENDS
8
MARKET OBSERVATIONS
BUILDING PRODUCTS QUARTERLY M&A ACTIVITY
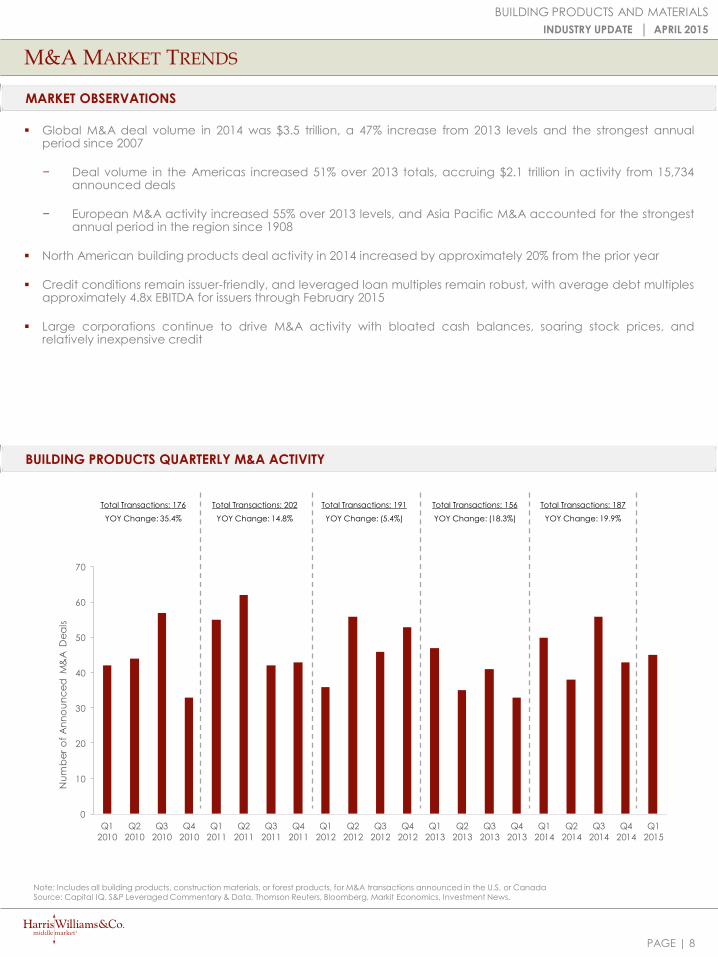
Global M&A deal volume in 2014 was $3.5 trillion, a 47% increase from 2013 levels and the strongest annualperiod since 2007
− Deal volume in the Americas increased 51% over 2013 totals, accruing $2.1 trillion in activity from 15,734announced deals
− European M&A activity increased 55% over 2013 levels, and Asia Pacific M&A accounted for the strongestannual period in the region since 1908
North American building products deal activity in 2014 increased by approximately 20% from the prior year
Credit conditions remain issuer-friendly, and leveraged loan multiples remain robust, with average debt multiplesapproximately 4.8x EBITDA for issuers through February 2015
Large corporations continue to drive M&A activity with bloated cash balances, soaring stock prices, andrelatively inexpensive credit
BUILDING PRODUCTS AND MATERIALS
INDUSTRY UPDATE │ APRIL 2015
Note: Includes all building products, construction materials, or forest products, for M&A transactions announced in the U.S. or Canada
Source: Capital IQ, S&P Leveraged Commentary & Data, Thomson Reuters, Bloomberg, Markit Economics, Investment News.
Total Transactions: 176
YOY Change: 35.4%
Total Transactions: 202
YOY Change: 14.8%
Total Transactions: 191
YOY Change: (5.4%)
Total Transactions: 156
YOY Change: (18.3%)
Total Transactions: 187
YOY Change: 19.9%
PAGE |
www.harriswilliams.com
SELECT SECTOR OVERVIEWS & TRENDS
9
AGGREGATES
ASPHALT
CEMENT AND CONCRETE
BUILDING PRODUCTS AND MATERIALS
INDUSTRY UPDATE │ APRIL 2015
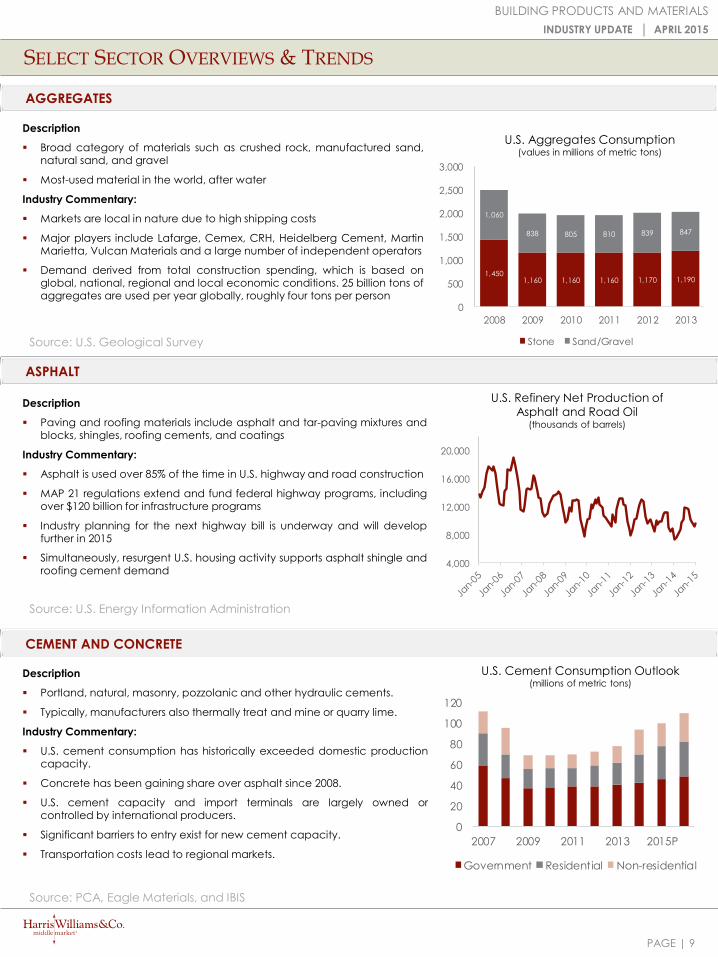
Description
Broad category of materials such as crushed rock, manufactured sand,natural sand, and gravel
Most-used material in the world, after water
Industry Commentary:
Markets are local in nature due to high shipping costs
Major players include Lafarge, Cemex, CRH, Heidelberg Cement, MartinMarietta, Vulcan Materials and a large number of independent operators
Demand derived from total construction spending, which is based onglobal, national, regional and local economic conditions. 25 billion tons ofaggregates are used per year globally, roughly four tons per person
U.S. Aggregates Consumption (values in millions of metric tons)
Description
Paving and roofing materials include asphalt and tar-paving mixtures andblocks, shingles, roofing cements, and coatings
Industry Commentary:
Asphalt is used over 85% of the time in U.S. highway and road construction
MAP 21 regulations extend and fund federal highway programs, includingover $120 billion for infrastructure programs
Industry planning for the next highway bill is underway and will developfurther in 2015
Simultaneously, resurgent U.S. housing activity supports asphalt shingle androofing cement demand
U.S. Refinery Net Production of Asphalt and Road Oil
(thousands of barrels)
Description
Portland, natural, masonry, pozzolanic and other hydraulic cements.
Typically, manufacturers also thermally treat and mine or quarry lime.
Industry Commentary:
U.S. cement consumption has historically exceeded domestic productioncapacity.
Concrete has been gaining share over asphalt since 2008.
U.S. cement capacity and import terminals are largely owned orcontrolled by international producers.
Significant barriers to entry exist for new cement capacity.
Transportation costs lead to regional markets.
U.S. Cement Consumption Outlook (millions of metric tons)
Source: U.S. Geological Survey
Source: U.S. Energy Information Administration
Source: PCA, Eagle Materials, and IBIS
1,450 1,160 1,160 1,160 1,170 1,190
1,060
838 805 810 839 847
0
500
1,000
1,500
2,000
2,500
3,000
2008 2009 2010 2011 2012 2013
Stone Sand/Gravel
4,000
8,000
12,000
16,000
20,000
0
20
40
60
80
100
120
2007 2009 2011 2013 2015P
Government Residential Non-residential
PAGE |
www.harriswilliams.com
SELECT SECTOR OVERVIEWS & TRENDS
10
LUMBER AND WOOD PRODUCTS
ROOFING
WINDOWS AND DOORS
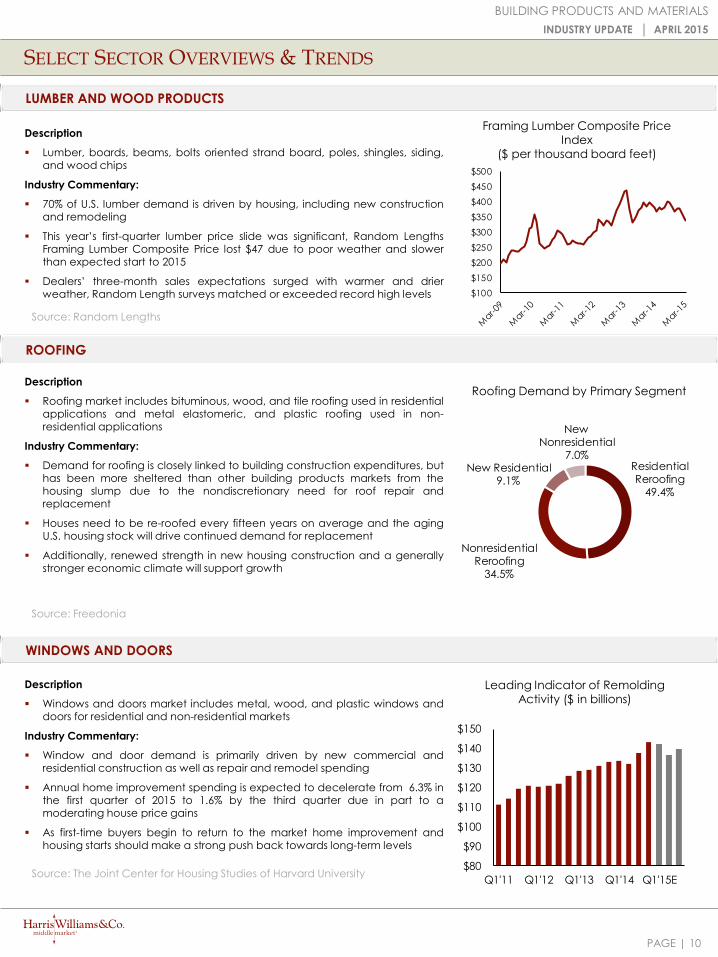
Description
Lumber, boards, beams, bolts oriented strand board, poles, shingles, siding,and wood chips
Industry Commentary:
70% of U.S. lumber demand is driven by housing, including new constructionand remodeling
This year’s first-quarter lumber price slide was significant, Random LengthsFraming Lumber Composite Price lost $47 due to poor weather and slowerthan expected start to 2015
Dealers’ three-month sales expectations surged with warmer and drierweather, Random Length surveys matched or exceeded record high levels
Framing Lumber Composite Price Index
($ per thousand board feet)
Source: Random Lengths
Description
Roofing market includes bituminous, wood, and tile roofing used in residentialapplications and metal elastomeric, and plastic roofing used in non-residential applications
Industry Commentary:
Demand for roofing is closely linked to building construction expenditures, buthas been more sheltered than other building products markets from thehousing slump due to the nondiscretionary need for roof repair andreplacement
Houses need to be re-roofed every fifteen years on average and the agingU.S. housing stock will drive continued demand for replacement
Additionally, renewed strength in new housing construction and a generallystronger economic climate will support growth
Source: Freedonia
Roofing Demand by Primary Segment
Description
Windows and doors market includes metal, wood, and plastic windows anddoors for residential and non-residential markets
Industry Commentary:
Window and door demand is primarily driven by new commercial andresidential construction as well as repair and remodel spending
Annual home improvement spending is expected to decelerate from 6.3% inthe first quarter of 2015 to 1.6% by the third quarter due in part to amoderating house price gains
As first-time buyers begin to return to the market home improvement andhousing starts should make a strong push back towards long-term levels
Leading Indicator of Remolding Activity ($ in billions)
Source: The Joint Center for Housing Studies of Harvard University
BUILDING PRODUCTS AND MATERIALS
INDUSTRY UPDATE │ APRIL 2015
$100
$150
$200
$250
$300
$350
$400
$450
$500
Residential Reroofing
49.4%
Nonresidential Reroofing
34.5%
New Residential9.1%
New Nonresidential
7.0%
$80
$90
$100
$110
$120
$130
$140
$150
Q1'11 Q1'12 Q1'13 Q1'14 Q1'15E

PAGE |
www.harriswilliams.com
SELECT SECTOR OVERVIEWS & TRENDS
11
WALLBOARD AND PLASTER
HVAC
PLUMBING FIXTURES AND FITTINGS
Description
Primarily made from gypsum, products include wallboard, plaster,plasterboard, molding, ornamental moldings, statuary, and architecturalplasterwork
Industry Commentary:
Gypsum product demand is primarily driven by new commercial andresidential construction as well as repair and remodel spending
Over the past two years, rising wallboard prices and cost-saving measureshave improved industry profit margins
New home inventories are at historically low levels and as demand for newhomes grows, builders will respond by increasing their stock
U.S. Wallboard Demand(billions of square feet)
Source: National Gypsum Forecast and Gypsum Association
Description
Residential, commercial, and industrial heating, ventilation, air-conditioning,and refrigeration equipment
Industry Commentary:
HVAC demand is primarily driven by residential and non-residentialconstruction, HVAC replacement, and weather patterns
Aging domestic buildings (75% of buildings were built before the 1980s) arefueling the demand for replacement equipment
New minimum energy efficiency standards for air conditioning andcorresponding tax credits are driving replacement demand
Number of World-Wide A/C Units(millions of units)
Source: BSRIA Market Intelligence
Description
Plumbing fixtures, bathtub and shower fixtures, and indoor pipes constitutethis segment
Industry Commentary:
Primary demand determinants are repair and remodel spending, new homeconstruction, and nonresidential improvement and repair
Domestic manufacturers are facing strong headwinds from cheap importswhich have increased from 69.9% of the market in 2008 to an estimated78.4% in 2013
Increased demand in this segment will be driven by increased repair andremodel spending
Residential Remodeling Index (RRI)
Source: Remodeling Magazine – RRI Points to Speedup in Remodeling Activity March 2015
BUILDING PRODUCTS AND MATERIALS
INDUSTRY UPDATE │ APRIL 2015
0
20
40
60
80
100
120
140
160
180
2012 2013 2014E 2015P 2016P 2017P
0
25
50
75
100
125
Annual Q1 Q2 Q3 Q4
2006 2008 2010 2012 2014
0
5
10
15
20
25
30
35
40
1990 1996 2002 2008 2014
PAGE |
www.harriswilliams.com
(60%)
(40%)
(20%)
0%
20%
40%
60%
80%
100%
120%
140%
Apr-10 Oct-10 Apr-11 Oct-11 Apr-12 Oct-12 Apr-13 Oct-13 Apr-14 Oct-14 Apr-15
Building Materials Index Building Products Index Building Products Distributors Index S&P 500 Index
PUBLIC MARKETS
BUILDING PRODUCTS AND MATERIALS
INDUSTRY UPDATE │ APRIL 2015
12
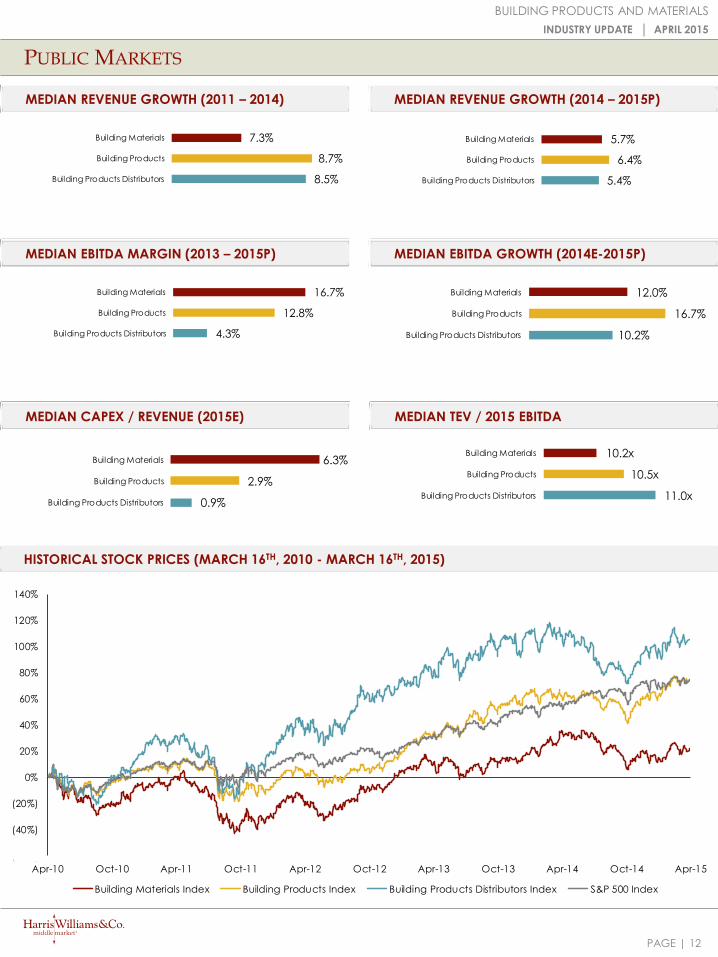
MEDIAN TEV / 2015 EBITDA
MEDIAN REVENUE GROWTH (2014 – 2015P)
MEDIAN EBITDA MARGIN (2013 – 2015P) MEDIAN EBITDA GROWTH (2014E-2015P)
MEDIAN CAPEX / REVENUE (2015E)
MEDIAN REVENUE GROWTH (2011 – 2014)
HISTORICAL STOCK PRICES (MARCH 16TH, 2010 - MARCH 16TH, 2015)
11.0x
10.5x
10.2x
Building Products Distributors
Building Products
Building Materials
8.5%
8.7%
7.3%
Building Products Distributors
Building Products
Building Materials
5.4%
6.4%
5.7%
Building Products Distributors
Building Products
Building Materials
4.3%
12.8%
16.7%
Building Products Distributors
Building Products
Building Materials
10.2%
16.7%
12.0%
Building Products Distributors
Building Products
Building Materials
0.9%
2.9%
6.3%
Building Products Distributors
Building Products
Building Materials

PAGE |
www.harriswilliams.com
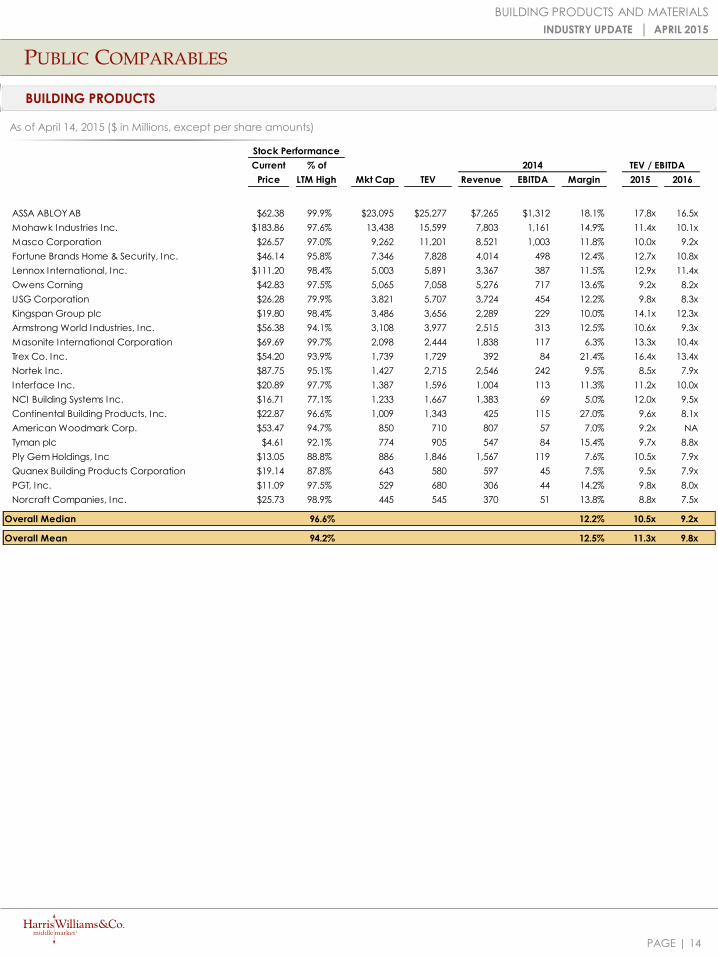
As of April 14, 2015 ($ in Millions, except per share amounts)
PUBLIC COMPARABLES
13
BUILDING MATERIALS
BUILDING PRODUCTS AND MATERIALS
INDUSTRY UPDATE │ APRIL 2015
Stock Performance
Current % of 2014 TEV / EBITDA
Price LTM High Mkt Cap TEV Revenue EBITDA Margin 2015 2016
Aggregates and Cement
Holcim Ltd. $76.37 90.1% $24,885 $37,469 $19,238 $3,755 19.5% 9.3x 8.3x
CRH plc $26.35 96.6% 21,507 24,316 22,892 1,972 8.6% 10.9x 9.2x
Lafarge S.A. $66.86 92.7% 19,242 31,224 15,546 3,139 20.2% 9.7x 8.6x
HeidelbergCement AG $80.48 99.1% 15,124 23,705 15,281 2,472 16.2% 8.7x 8.0x
CEMEX, S.A.B. de C.V. $0.98 83.9% 12,258 28,766 14,228 2,482 17.4% 9.7x 8.4x
Vulcan Materials Company $83.33 96.6% 10,979 12,844 2,994 575 19.2% 15.6x 12.3x
Martin Marietta Materials Inc. $138.11 94.5% 9,207 10,686 2,679 588 22.0% 12.3x 10.4x
Eagle Materials Inc. $85.05 80.5% 4,235 4,739 1,032 284 27.5% 10.4x 8.5x
Summit Materials, Inc. $21.06 94.3% 490 1,761 1,204 173 14.4% 9.0x 7.5x
Median 94.3% 19.2% 9.7x 8.5x
Mean 92.0% 18.3% 10.6x 9.0x
Heavy Construction Materials
CRH plc $26.35 96.6% $21,507 $24,316 $22,892 $1,972 8.6% 10.9x 9.2x
James Hardie Industries plc $12.12 99.5% 5,401 5,710 1,622 348 21.5% 13.9x 11.5x
Boral Limited $5.06 98.9% 3,960 4,641 3,643 335 9.2% 10.2x 9.1x
Headwaters Incorporated $18.66 100.0% 1,353 1,814 825 134 16.2% 11.0x 9.8x
U.S. Concrete, Inc. $33.41 93.5% 472 663 704 70 9.9% 7.6x 6.3x
Median 98.9% 20.0% 10.9x 7.7x
Mean 97.7% 13.1% 10.7x 9.2x
Lumber and Wood Products
Weyerhaeuser Co. $32.21 87.0% $16,682 $20,518 7,693 $1,722 22.4% 11.3x 10.1x
West Fraser Timber Co. Ltd. $48.75 78.1% 4,055 4,402 3,330 497 14.9% 7.4x 5.9x
Canfor Corp. $19.26 75.9% 2,584 2,893 2,891 442 15.3% 6.1x 4.6x
Louisiana-Pacific Corp. $16.14 90.9% 2,289 2,518 1,935 16 0.8% 22.8x 8.7x
Boise Cascade Company $37.15 84.6% 1,471 1,609 3,574 196 5.5% 7.4x 6.3x
Norbord, Inc. $19.94 83.2% 1,079 1,455 1,198 89 7.4% 10.6x 4.3x
Universal Forest Products Inc. $53.13 94.5% 1,061 1,160 2,660 130 4.9% 7.5x 6.9x
Median 84.6% 7.4% 7.5x 6.3x
Mean 84.9% 14.7% 8.6x 6.7x
Overall Median 93.5% 15.3% 10.2x 8.5x
Overall Mean 91.0% 14.4% 10.6x 8.3x
PAGE |
www.harriswilliams.com
PUBLIC COMPARABLES
14
BUILDING PRODUCTS
BUILDING PRODUCTS AND MATERIALS
INDUSTRY UPDATE │ APRIL 2015
Stock Performance
Current % of 2014 TEV / EBITDA
Price LTM High Mkt Cap TEV Revenue EBITDA Margin 2015 2016
ASSA ABLOY AB $62.38 99.9% $23,095 $25,277 $7,265 $1,312 18.1% 17.8x 16.5x
Mohawk Industries Inc. $183.86 97.6% 13,438 15,599 7,803 1,161 14.9% 11.4x 10.1x
Masco Corporation $26.57 97.0% 9,262 11,201 8,521 1,003 11.8% 10.0x 9.2x
Fortune Brands Home & Security, Inc. $46.14 95.8% 7,346 7,828 4,014 498 12.4% 12.7x 10.8x
Lennox International, Inc. $111.20 98.4% 5,003 5,891 3,367 387 11.5% 12.9x 11.4x
Owens Corning $42.83 97.5% 5,065 7,058 5,276 717 13.6% 9.2x 8.2x
USG Corporation $26.28 79.9% 3,821 5,707 3,724 454 12.2% 9.8x 8.3x
Kingspan Group plc $19.80 98.4% 3,486 3,656 2,289 229 10.0% 14.1x 12.3x
Armstrong World Industries, Inc. $56.38 94.1% 3,108 3,977 2,515 313 12.5% 10.6x 9.3x
Masonite International Corporation $69.69 99.7% 2,098 2,444 1,838 117 6.3% 13.3x 10.4x
Trex Co. Inc. $54.20 93.9% 1,739 1,729 392 84 21.4% 16.4x 13.4x
Nortek Inc. $87.75 95.1% 1,427 2,715 2,546 242 9.5% 8.5x 7.9x
Interface Inc. $20.89 97.7% 1,387 1,596 1,004 113 11.3% 11.2x 10.0x
NCI Building Systems Inc. $16.71 77.1% 1,233 1,667 1,383 69 5.0% 12.0x 9.5x
Continental Building Products, Inc. $22.87 96.6% 1,009 1,343 425 115 27.0% 9.6x 8.1x
American Woodmark Corp. $53.47 94.7% 850 710 807 57 7.0% 9.2x NA
Tyman plc $4.61 92.1% 774 905 547 84 15.4% 9.7x 8.8x
Ply Gem Holdings, Inc $13.05 88.8% 886 1,846 1,567 119 7.6% 10.5x 7.9x
Quanex Building Products Corporation $19.14 87.8% 643 580 597 45 7.5% 9.5x 7.9x
PGT, Inc. $11.09 97.5% 529 680 306 44 14.2% 9.8x 8.0x
Norcraft Companies, Inc. $25.73 98.9% 445 545 370 51 13.8% 8.8x 7.5x
Overall Median 96.6% 12.2% 10.5x 9.2x
Overall Mean 94.2% 12.5% 11.3x 9.8x
As of April 14, 2015 ($ in Millions, except per share amounts)

PAGE |
www.harriswilliams.com
PUBLIC COMPARABLES
15
DISTRIBUTORS
BUILDING PRODUCTS AND MATERIALS
INDUSTRY UPDATE │ APRIL 2015
Stock Performance
Current % of 2014 TEV / EBITDA
Price LTM High Mkt Cap TEV Revenue EBITDA Margin 2015 2016
Wolseley plc $60.11 96.8% $15,633 $17,476 $20,129 $1,377 6.8% 11.5x 10.3x
Beacon Roofing Supply, Inc. $31.87 84.0% 1,577 1,803 2,371 126 5.3% 11.0x 9.3x
Richelieu Hardware Ltd. $50.36 97.7% 986 981 567 67 11.9% 14.2x 13.0x
Builders FirstSource, Inc. $6.90 78.8% 678 1,044 1,604 61 3.8% 11.9x 9.0x
Stock Building Supply Holdings, Inc. $17.89 85.3% 468 560 1,296 32 2.5% 10.6x 7.6x
Hardwoods Distribution Inc. $10.37 93.1% 173 204 389 22 5.7% 8.5x 7.7x
CanWel Building Materials Group Ltd. $4.66 89.5% 134 239 656 25 3.8% 9.8x 9.1x
Bluelinx Holdings Inc. $1.09 74.1% 97 526 1,979 23 1.2% NA NA
Overall Median 87.4% 4.5% 11.0x 9.1x
Overall Mean 87.4% 5.1% 11.1x 9.4x
As of April 14, 2015 ($ in Millions, except per share amounts)

PAGE |
www.harriswilliams.com
M&A TRANSACTIONS
16
BUILDING PRODUCTS AND MATERIALS
INDUSTRY UPDATE │ APRIL 2015
Date Target Vertical Business Description Acquirer
4/7/2015 Northland Construction
Supplies Ltd.
Distribtion Northland Construction Supplies Ltd. supplies goods to concrete
construction, ceramic, and masonry industries.
National Concrete
Accessories
4/2/2015 Ferrara Brothers Building
Materials Corp.
Building Materials Ferrara Brothers Building Materials Corp. manufactures concrete. U.S. Concrete, Inc.
3/31/2015 Design Specialties, Inc. Building Products Design Specialties, Inc. manufactures glass fireplace doors. Blackthorne Partners LTD.
3/30/2015 Norcraft Companies, Inc. Building Products Norcraft Companies, Inc. manufactures kitchen and bathroom
cabinetry in the United States and Canada.
Fortune Brands Home &
Security, Inc.
3/30/2015 AFC Industries, Inc. Distribtion AFC Industries, Inc. engages in the purchase, distribution, assembly, and
packaging of fasteners and related hardware products.
Incline Equity Partners;
Incline Equity Partners I I I ,
L.P.
3/27/2015 PrimeSource Building
Products, Inc.
Distribtion PrimeSource Building Products, Inc. distributes fasteners and building
materials.
Platinum Equity, LLC
3/26/2015 Martin Fireproofing
Corporation
Building Products Martin Fireproofing Corporation manufactures, sells, and installs
specialty roof deck solutions.
Innovative Metals
Company, Inc.
3/25/2015 Pinnacle Stone & Tile LLC Building Products Pinnacle Stone & Tile LLC manufactures and installs countertops, shower
and bath surrounds, fireplaces, vanities, floor inlays, and custom projects
in Northern California.
L.A.R.K. Industries, Inc.
3/25/2015 J & B Materials, Inc. Building Materials J & B Materials, Inc. is a supplier of drywall, metal studs, plaster, pool,
and general building materials.
Gypsum Management and
Supply, Inc.
3/19/2015 Pipeline Supply, Inc. Distribtion Pipeline Supply, Inc. operates as a wholesale distributor of plumbing,
HVAC, hydronics, radiant floor heating, sewer, water, and well supplies.
Dakota Supply Group, Inc.
3/17/2015 Thermoseal Industries, LLC Building Materials Thermoseal Industries, LLC develops, produces, and sells insulating glass
units to the commercial refrigeration, oven, test laboratory, and
architectural markets.
Senneca Holdings
3/12/2015 Fry Reglet Corporation,
Axiom & Serpentina Ceiling
Systems
Building Products Axiom & Serpentina Ceiling Systems of Fry Reglet Corporation, a ceiling
systems manufacturer, was acquired by Worthington Armstrong
Venture.
Worthington Armstrong
Venture
3/9/2015 Easi-Serv Products Inc. Building Products Easi-Serv Products Inc. designs and manufactures drive-thru windows,
food conveyors, and glass patios.
Franke Foodserv ice
Systems, Inc.
3/7/2015 Mechoshade Systems, Inc. Building Products Mechoshade Systems, Inc. prov ides manual, motorized, and automated
solar-shading and room-darkening solutions.
Springs Window Fashions
LLC
3/7/2015 Mechoshade Systems, Inc. Building Products Mechoshade Systems, Inc. prov ides manual, motorized, and automated
solar-shading and room-darkening solutions.
Springs Window Fashions
LLC
3/2/2015 Lampert Yards, Inc. Distribution Lamperts is a leading building material distributor prov iding windows,
doors, roofing, siding, insulation, millwork, cabinets, and framing
materials to professional builders and consumers in their local markets.
US LBM Holdings, LLC
3/2/2015 BMI Products of Northern
California Inc.
Building Materials BMI Products of Northern California Inc. manufactures silo systems for
construction needs.
Sika AG
2/26/2015 Zero International, Inc. Building Products Zero International, Inc. designs and manufactures a range of
specialized sealing systems for doors and windows.
Schlage Lock Company
LLC
2/26/2015 Atis Group Inc. Building Products Atis Group Inc. manufactures and distributes doors and windows and
high performance energy-efficient products for the construction and
home improvement markets.
Desjardins Business Capital
régional et coopératif
2/25/2015 J. A. Jack & Sons, Inc. Building Materials J. A. Jack & Sons, Inc. mines and processes limestone. Harrison Gypsum, LLC
PAGE |
www.harriswilliams.com
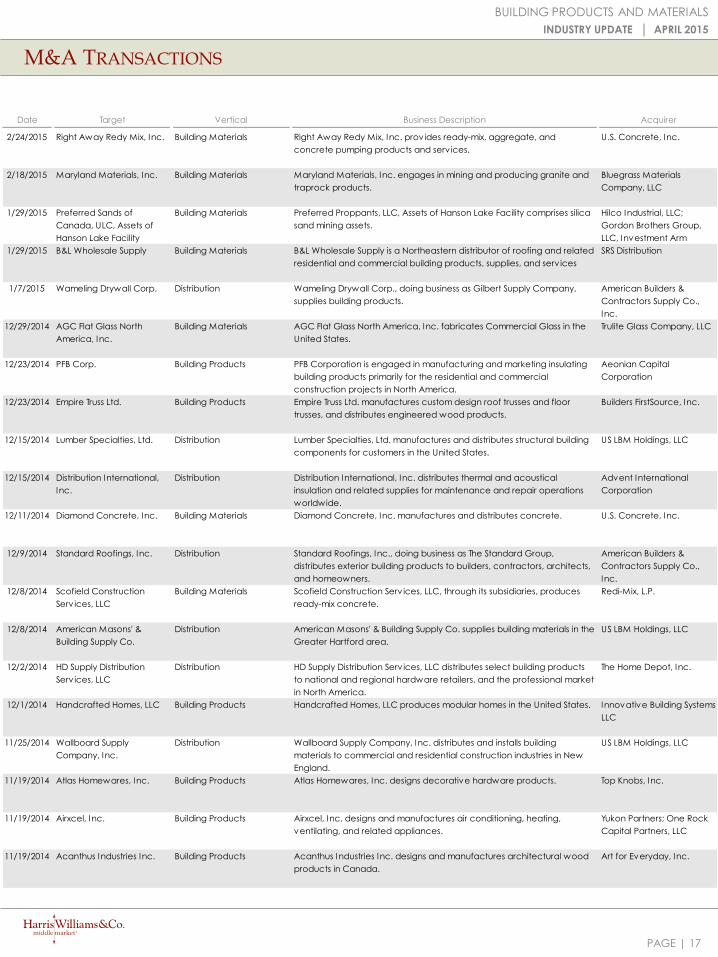
M&A TRANSACTIONS
17
BUILDING PRODUCTS AND MATERIALS
INDUSTRY UPDATE │ APRIL 2015
Date Target Vertical Business Description Acquirer
2/24/2015 Right Away Redy Mix, Inc. Building Materials Right Away Redy Mix, Inc. prov ides ready-mix, aggregate, and
concrete pumping products and serv ices.
U.S. Concrete, Inc.
2/18/2015 Maryland Materials, Inc. Building Materials Maryland Materials, Inc. engages in mining and producing granite and
traprock products.
Bluegrass Materials
Company, LLC
1/29/2015 Preferred Sands of
Canada, ULC, Assets of
Hanson Lake Facility
Building Materials Preferred Proppants, LLC, Assets of Hanson Lake Facility comprises silica
sand mining assets.
Hilco Industrial, LLC;
Gordon Brothers Group,
LLC, Investment Arm
1/29/2015 B&L Wholesale Supply Building Materials B&L Wholesale Supply is a Northeastern distributor of roofing and related
residential and commercial building products, supplies, and serv ices
SRS Distribution
1/7/2015 Wameling Drywall Corp. Distribution Wameling Drywall Corp., doing business as Gilbert Supply Company,
supplies building products.
American Builders &
Contractors Supply Co.,
Inc.
12/29/2014 AGC Flat Glass North
America, Inc.
Building Materials AGC Flat Glass North America, Inc. fabricates Commercial Glass in the
United States.
Trulite Glass Company, LLC
12/23/2014 PFB Corp. Building Products PFB Corporation is engaged in manufacturing and marketing insulating
building products primarily for the residential and commercial
construction projects in North America.
Aeonian Capital
Corporation
12/23/2014 Empire Truss Ltd. Building Products Empire Truss Ltd. manufactures custom design roof trusses and floor
trusses, and distributes engineered wood products.
Builders FirstSource, Inc.
12/15/2014 Lumber Specialties, Ltd. Distribution Lumber Specialties, Ltd. manufactures and distributes structural building
components for customers in the United States.
US LBM Holdings, LLC
12/15/2014 Distribution International,
Inc.
Distribution Distribution International, Inc. distributes thermal and acoustical
insulation and related supplies for maintenance and repair operations
worldwide.
Advent International
Corporation
12/11/2014 Diamond Concrete, Inc. Building Materials Diamond Concrete, Inc. manufactures and distributes concrete. U.S. Concrete, Inc.
12/9/2014 Standard Roofings, Inc. Distribution Standard Roofings, Inc., doing business as The Standard Group,
distributes exterior building products to builders, contractors, architects,
and homeowners.
American Builders &
Contractors Supply Co.,
Inc.
12/8/2014 Scofield Construction
Serv ices, LLC
Building Materials Scofield Construction Serv ices, LLC, through its subsidiaries, produces
ready-mix concrete.
Redi-Mix, L.P.
12/8/2014 American Masons' &
Building Supply Co.
Distribution American Masons' & Building Supply Co. supplies building materials in the
Greater Hartford area.
US LBM Holdings, LLC
12/2/2014 HD Supply Distribution
Serv ices, LLC
Distribution HD Supply Distribution Serv ices, LLC distributes select building products
to national and regional hardware retailers, and the professional market
in North America.
The Home Depot, Inc.
12/1/2014 Handcrafted Homes, LLC Building Products Handcrafted Homes, LLC produces modular homes in the United States. Innovative Building Systems
LLC
11/25/2014 Wallboard Supply
Company, Inc.
Distribution Wallboard Supply Company, Inc. distributes and installs building
materials to commercial and residential construction industries in New
England.
US LBM Holdings, LLC
11/19/2014 Atlas Homewares, Inc. Building Products Atlas Homewares, Inc. designs decorative hardware products. Top Knobs, Inc.
11/19/2014 Airxcel, Inc. Building Products Airxcel, Inc. designs and manufactures air conditioning, heating,
ventilating, and related appliances.
Yukon Partners; One Rock
Capital Partners, LLC
11/19/2014 Acanthus Industries Inc. Building Products Acanthus Industries Inc. designs and manufactures architectural wood
products in Canada.
Art for Everyday, Inc.

PAGE |
www.harriswilliams.com
M&A TRANSACTIONS
18
BUILDING PRODUCTS AND MATERIALS
INDUSTRY UPDATE │ APRIL 2015
Date Target Vertical Business Description Acquirer
11/19/2014 Acanthus Industries Inc. Building Products Acanthus Industries Inc. designs and manufactures architectural wood
products in Canada.
Art for Everyday, Inc.
11/19/2014 Texas Tempered Glass, Inc. Building Materials Texas Tempered Glass, Inc. is a glass fabricator serv ing commercial and
residential end markets in the United States and abroad.
Trulite Glass & Aluminum
Solutions, LLC
11/18/2014 Architectural Elements LLC Building Products Architectural Elements LLC manufactures and distributes doors,
windows, and hardware for residential and commercial construction in
the United States.
FP2D, LLC
11/18/2014 Brooklyn Navy Yard
Modular-Construction
Facility
Building Products Brooklyn Navy Yard Modular-Construction Facility comprises a
construction facility that constructs residential units.
Forest City Ratner
Companies, LLC
11/14/2014 Alcoa Heating & Cooling Building Products Alcoa Heating & Cooling provides installation and serv ice support for
HVAC systems, tankless gas water heaters, and home generators.
MK Russell & Abbott
11/13/2014 Peachtree Communities
Group, Inc.
Building Products Peachtree Communities, Inc. builds homes/residences in Atlanta. Century Communities, Inc.
11/11/2014 Vicwest Inc Building Products Vicwest Inc. manufactures and distributes building construction
products and steel containment products North America and
internationally.
Kingspan Group plc
11/11/2014 Southern Fastening
Systems, Inc.
Distribution Southern Fastening Systems, Inc. distributes tools and fasteners for wood
construction projects and manufacturing operations.
Carlson Systems, LLC
11/10/2014 Industrial Noise Control,
Inc.
Building Products Industrial Noise Control, Inc. manufactures and distributes industrial
noise control products and systems for applications in industrial,
commercial, architectural, and environmental markets.
United Process, Inc.
11/10/2014 CENTRIA Incorporated Building Materials CENTRIA Incorporated designs, develops, and manufactures
engineered wall, roof, and floor systems, as well as prov ides coil
coating serv ices.
Steelbuilding.com, Inc.;
NCI Group, Inc.
11/8/2014 Trussbilt LLC Building Products Trussbilt LLC. designs and manufactures security products. Coastal Plain Ventures, LLC
11/7/2014 Henkens Equipment, Inc. Building Products Henkens Equipment, Inc. is engaged in the sale of agricultural and
construction equipment.
Butler Ag Equipment
11/5/2014 Connor Sport Court
International, Inc.
Building Products Connor Sport Court International, Inc. designs and builds sports
surfacing and flooring products.
Gerflor USA, Inc.
11/4/2014 Hanson Structural Precast,
Inc.
Building Materials Hanson Structural Precast, Inc. manufactures and supplies structural and
architectural precast components.
Wells Concrete Products,
Inc.
11/3/2014 Watertown Plumbing And
Heating Supply Co., Inc.
Distribution Watertown Supply, a Div ision of F.W. Webb Company is a wholesale
distributor specializing in piping, plumbing, and heating repair parts for
commercial/industrial/institutional facilities maintenance.
F.W. Webb Company
10/31/2014 Damron Sand & Gravel,
Inc.
Building Materials Damron Sand & Gravel, Inc. manufactures and supplies sand and
gravel in Lubbock, Texas.
PB Materials Holdings, Inc.
10/27/2014 TMI, LLC Building Products TMI, LLC extrudes and manufactures flexible polyv inyl chloride (PVC)
and energy control doors.
River Associates
Investments, LLC
10/23/2014 Peterson Industries, Inc. Building Products Peterson Industries, Inc. manufactures and distributes tub enclosures,
shower enclosures and doors, mirror closet doors, and sliding glass patio
doors.
Aldora Aluminum and Glass
Products Inc.
10/21/2014 Tarragon Homes LLC Building Products Tarragon Homes LLC provides homebuilding serv ices. AVEW Holdings Inc.
10/21/2014 New York Sand & Stone,
LLC
Building Materials
Distributor
New York Sand & Stone, LLC supplies construction materials in the New
York City market.
Eastern Concrete
Materials, Inc.

PAGE |
REPRESENTATIVE BUILDING PRODUCTS TRANSACTIONS
19
BUILDING PRODUCTS AND MATERIALS
has been acquired by
a portfolio company of
has been acquired by
a portfolio company of
has been acquired by
a portfolio company of
has been acquired by
a portfolio company of
a portfolio company of
has been acquired by
a portfolio company of
has been acquired by
has been acquired by
a portfolio company of
has been acquired by
a portfolio company of
a division of
has been acquired by
has been acquired by
a division of
has been acquired by
has been acquired by
a portfolio company of
has been acquired by
a division of
a division of
has been acquired by
and a portfolio
company of
has been acquired by
a portfolio company of
a subsidiary of
has been acquired by
A Private Investor
Group
has completed a
recapitalization
with
a portfolio company of
has been acquired by
a subsidiary of
has been acquired by
a portfolio company of
Select Atlanta,
Georgia aggregates
assets of LaFarge SA
have been acquired
by
has been acquired by
a portfolio company of
has been acquired by
a portfolio company of
has been acquired by
a portfolio company of
has been acquired by
a portfolio company of
has been acquired by
a portfolio company of
has been acquired by
a portfolio company of
has been acquired by
a portfolio company of
have been acquired by
The Wichita, Kansas
aggregates, concrete,
asphalt, and paving
assets
of LaFarge SA
a division of
has been acquired by
has been acquired by
a portfolio company of
has been acquired by
a portfolio company of
has been acquired by
a portfolio company of
has been acquired by
Strategic
Industries, LLC
Private Investors
has been acquired by
a portfolio company of
has purchased
certain assets of
INDUSTRY UPDATE │ APRIL 2015

Energy & Power
IndustrialsHealthcare & Life Sciences
Transportation & Logistics
Aerospace, Defense & Government
Services
Business Services
Building Products & Materials
Technology, Media & Telecom
Specialty Distribution
Consumer
PAGE |
HARRIS WILLIAMS & CO. OFFICE LOCATIONS
UNITED STATES EUROPE
BostonTwo International Place24th FloorBoston, Massachusetts 02110Phone: +1 (617) 482-7501Fax: +1 (617) 482-7503
Cleveland1900 East 9th Street20th FloorCleveland, Ohio 44114Phone: +1 (216) 689-2400Fax: +1 (216) 689-2401
Minneapolis222 South 9th StreetSuite 3350Minneapolis, Minnesota 55402Phone: +1 (612) 359-2700Fax: +1 (612) 359-2701
Philadelphia1600 Market Street21st FloorPhiladelphia, Pennsylvania 19103Phone: +1 (267) 675-5900Fax: +1 (267) 675-5901
Richmond (U.S. Headquarters)1001 Haxall Point9th FloorRichmond, Virginia 23219Phone: +1 (804) 648-0072Fax: +1 (804) 648-0073
San Francisco575 Market Street31st FloorSan Francisco, California 94105, USAPhone: +1 (415) 288-4260Fax: +1 (415) 288-4269
FrankfurtBockenheimer Landstrasse 33-3560325 FrankfurtGermanyPhone: +49 069 3650638 00Fax: +49 069 3650638 01
London63 Brook StreetLondon W1K 4HS, EnglandPhone: +44 (0) 20 7518 8900Fax: +44 (0) 20 7526 2187
NETWORK OFFICES
Beijing
Hong Kong
Mumbai
New Delhi
Shanghai
Building Products & Materials
Harris Williams & Co. has a broad range of industry expertise, which creates powerful opportunities.Our clients benefit from our deep-sector experience, integrated industry intelligence andcollaboration across the firm, and our commitment to learning what makes them unique. For moreinformation, visit our website at www.harriswilliams.com/industries.
20
OUR FIRM
BUILDING PRODUCTS AND MATERIALS
INDUSTRY UPDATE │ APRIL 2015

PAGE |
HARRIS WILLIAMS & CO.
21
BUILDING PRODUCTS AND MATERIALS
INDUSTRY UPDATE │ APRIL 2015
Bureau of Economic Analysis
Capital IQ
Eurostat
Freedonia
Global Industry Analysts
IBIS
PNC Economic Outlook
S&P Leveraged Commentary & Data
The Wall Street Journal
Thomson Financial – SDC Database
Thomson Reuters
U.S. Census Bureau
Harris Williams & Co. (www.harriswilliams.com) is a preeminent middle market investment bank focused on the advisory needs of clients worldwide. The firm has deep industry knowledge, global transaction expertise, and an unwavering commitment to excellence. Harris Williams & Co. provides sell-side and acquisition advisory, restructuring advisory, board advisory, private placements, and capital markets advisory services.
Investment banking services are provided by Harris Williams LLC, a registered broker-dealer and member of FINRA and SIPC, and Harris Williams & Co. Ltd, which is authorised and regulated by the Financial Conduct Authority. Harris Williams & Co. is a trade name under which Harris Williams LLC and Harris Williams & Co. Ltd conduct business.
THIS REPORT MAY CONTAIN REFERENCES TO REGISTERED TRADEMARKS, SERVICE MARKS AND COPYRIGHTS OWNED BY THIRD-PARTY INFORMATION PROVIDERS. NONE OF THE THIRD-PARTY INFORMATION PROVIDERS IS ENDORSING THE OFFERING OF, AND SHALL NOT IN ANY WAY BE DEEMED AN ISSUER OR UNDERWRITER OF, THE SECURITIES, FINANCIAL INSTRUMENTS OR OTHER INVESTMENTS DISCUSSED IN THIS REPORT, AND SHALL NOT HAVE ANY LIABILITY OR RESPONSIBILITY FOR ANY STATEMENTS MADE IN THE REPORT OR FOR ANY FINANCIAL STATEMENTS, FINANCIAL PROJECTIONS OR OTHER FINANCIAL INFORMATION CONTAINED OR ATTACHED AS AN EXHIBIT TO THE REPORT. FOR MORE INFORMATION ABOUT THE MATERIALS PROVIDED BY SUCH THIRD PARTIES, PLEASE CONTACT US AT THE ABOVE ADDRESSES OR NUMBERS.
The information and views contained in this report were prepared by Harris Williams & Co. (“Harris Williams”). It is not a research report, as such term is defined by applicable law and regulations, and is provided for informational purposes only. It is not to be construed as an offer to buy or sell or a solicitation of an offer to buy or sell any financial instruments or to participate in any particular trading strategy. The information contained herein is believed by Harris Williams to be reliable, but Harris Williams makes no representation as to the accuracy or completeness of such information. Harris Williams and/or its affiliates may be market makers or specialists in, act as advisers or lenders to, have positions in and effect transactions in securities of companies mentioned herein and also may provide, may have provided, or may seek to provide investment banking services for those companies. In addition, Harris Williams and/or its affiliates or their respective officers, directors and employees may hold long or short positions in the securities, options thereon or other related financial products of companies discussed herein. Opinions, estimates and projections in this report constitute Harris Williams’ judgment and are subject to change without notice. The financial instruments discussed in this report may not be suitable for all investors, and investors must make their own investment decisions using their own independent advisors as they believe necessary and based upon their specific financial situations and investment objectives. Also, past performance is not necessarily indicative of future results. No part of this material may be copied or duplicated in any form or by any means, or redistributed, without Harris Williams’ prior written consent.
Copyright© 2015 Harris Williams & Co., all rights reserved.
DISCLOSURES
SOURCES
Related Documents


![Materials & Products SOFT PARTITION - アキレス株式 … PARTITION Materials & Products アキレスソフトパーティション[総合カタログ]2017 ※イメージ写真](https://static.cupdf.com/doc/110x72/5ae0e1cf7f8b9ab4688deb59/materials-products-soft-partition-partition-materials-products.jpg)


