LIFE CYCLE ASSESSMENT OF BUILDING MATERIALS IN HOTEL REFURBISHMENT PROJECTS: A CASE STUDY IN ANKARA A THESIS SUBMITTED TO THE GRADUATE SCHOOL OF NATURAL AND APPLIED SCIENCES OF MIDDLE EAST TECHNICAL UNIVERSITY BY AYŞEM BERRĐN ÇAKMAKLI IN PARTIAL FULFILLMENT OF THE REQUIREMENTS FOR THE DEGREE OF DOCTOR OF PHILOSOPHY IN BUILDING SCIENCE IN ARCHITECTURE JUNE 2007

building materials in hotel refurbishment project
Nov 08, 2014
a thesis submitted to the graduate school of natural and applied sciences of middle east technical university
Welcome message from author
This document is posted to help you gain knowledge. Please leave a comment to let me know what you think about it! Share it to your friends and learn new things together.
Transcript
LIFE CYCLE ASSESSMENT OF BUILDING MATERIALS IN HOTE L
REFURBISHMENT PROJECTS: A CASE STUDY IN ANKARA
A THESIS SUBMITTED TO THE GRADUATE SCHOOL OF NATURAL AND APPLIED SCIENCES
OF MIDDLE EAST TECHNICAL UNIVERSITY
BY
AYŞEM BERRĐN ÇAKMAKLI
IN PARTIAL FULFILLMENT OF THE REQUIREMENTS FOR
THE DEGREE OF DOCTOR OF PHILOSOPHY IN BUILDING SCIE NCE IN
ARCHITECTURE
JUNE 2007
ii
Approval of the Graduate School of Natural and Applied Sciences.
Prof. Dr. Canan Özgen Director
I certify that this thesis satisfies all the requirements as a thesis for the degree of Doctor of Philosophy in Building Science.
Assoc. Prof. Dr. Güven Arif Sargın
Head of Department
This is to certify that we have read this thesis and that in our opinion it is fully adequate, in scope and quality, as a thesis for the degree of Doctor of Philosophy in Building Science.
Assoc. Prof. Dr. Soofia Elias Özkan Supervisor
Examining Committee Members
Prof. Dr. Ömür Bakırer (METU, ARCH)
Assoc Prof. Dr. Soofia T. Elias Özkan (METU, ARCH)
Prof. Dr. Gülser Çelebi (GAZĐ Ünv., ARCH)
Prof. Dr. Mutbul Kayılı (GAZĐ Ünv., ARCH)
Assoc. Prof. Dr. Arda Düzgüneş (METU, ARCH)

iii
I hereby declare that all information in this docum ent has been obtained and presented in accordance with academic rules and ethical conduct. I also declare that, as required b y these rules and conduct, I have fully cited and referenced all mate rial and results that are not original to this work.
Name, Last name : Ayşem Berrin Çakmaklı
Signature :
iv
ABSTRACT
LIFE CYCLE ASSESSMENT OF BUILDING MATERIALS IN HOTE L
REFURBISHMENT PROJECTS: A CASE STUDY IN ANKARA
Çakmaklı, Ayşem Berrin
Ph.D., Department of Architecture in Building Science
Supervisor: Assoc. Prof. Dr. Soofia Tahira Elias Özkan
June 2007, 176 pages
Buildings generate millions of tons of greenhouse gases, toxic air
emissions, water pollutants and solid wastes that contribute to negative
environmental impacts. Life Cycle Assessment (LCA) is a methodology
for assessing the environmental performance of products over their life
time. However, many building products are discarded much before the
end of their service life, especially as a result of refurbishment and
renovation projects. The need for such projects is increasing because
most buildings are not designed to accommodate changes in their
functions and needs of their occupants. This is particular to commercial
buildings, especially hospitality facilities, which are unique with regard to
operational schemes and the type of services offered that are highly
resource-intensive.
In this investigation, statistical data related to refurbishment and
renovation projects in Turkey were analyzed to determine the
percentage of refurbishment projects for hotels. Bills of quantities for

v
refurbishment projects of three five-star hotels in Ankara were obtained
and evaluated with regard to the volume and type of material discarded
as a result of the renovation works. ATHENA, an LCA software, was
used to evaluate these projects according to the six environmental
impact indicators: primary energy consumption, solid waste, air pollution
index, water pollution index, global warming potential and weighted
resource use.
A system was formulated for evaluating materials according to each
indicator by calculating their “eco-scores”; the total score is considered
to be the yard-stick for comparing environmental appropriateness of
these materials. Finally, recommendations on the choice of materials
were made, with an aim to reducing material waste and harmful
emissions.
Keywords: Life Cycle Assessment, Hotel Buildings, Renovations and
Refurbishments, ATHENA software, Environmental Friendly Materials.
vi
ÖZ
ANKARA’DAK Đ BĐR ÇALIŞMA BAZ ALINARAK YEN ĐLEME
PROJELER ĐNDEKĐ BĐNA MALZEMELER ĐNĐN HAYAT
DÖNGÜLERĐNĐN DEĞERLENDĐRĐLMESĐ
Çakmaklı, Ayşem Berrin
Doktora, Mimarlık Bölümü, Yapı Bilimleri
Tez Yöneticisi: Doç. Dr. Soofia Tahira Elias Özkan
Haziran 2007, 176 sayfa
Binaların sebep olduğu milyonlarca ton sera gazı ve toksik gaz yayılımı,
su ve katı kirliliği çevre üzerinde negatif bir etki yaratmaktadır. Hayat
döngüsü değerlendirmesi ise bu noktada ortaya çıkan ve bir malzemenin
tüm hayat döngüsü içindeki çevresel etkilerini değerlendirmeyi kapsayan
bir metoddur.
Ne yazık ki, pek çok bina malzemesi kendi servis sürelerini
tamamlayamadan yenilenmektedirler. Yeni binalar inşa edilirken
fonksiyon ve kullanıcı ihtiyacı gözardı edildiği için yenileme projeleri
günden güne artmaktadır. Tüm ticari binalar arasında, konaklama
sektörü işlem şemaları ve önerdikleri servisler dolayısı ile oldukça
yüksek doğal kaynak, su ve enerji tüketimi kapasitelidir.
Bu çalışmada, Türkiye’deki otellerde uygulanan yenileme projelerinin
yüzdelerini belirlemek amacı ile yenileme projelerinin istatiksel verileri

vii
analiz edildi. Ankara’daki üç tane beş yıldızlı otelin yenileme projelerinin
hakediş malzeme listeleri elde edildi. Bu veri, yenileme projelerinin
kapsamı ve kullanılan malzemeler dikkate alınarak, hayat döngüsü
değerlendirme programlarından ATHENA programı ile altı çevresel etki
göstergelerine göre değerlendirildi. Bu göstergeler, birincil enerji
tüketimi, katı atık miktarı, hava ve su kirlilik düzeyi, küresel ısınma
potansiyeli ve doğal kaynak kullanımıdır.
Herbir çevresel etki göstergesine göre ayrı ayrı değerlendirilen
malzemeler için bir sistem formule edildi ve her malzemenin “ekolojik
puanı” hesaplandı. Malzemeler çevreye uyumlulukları ve çevre
dostlukları bakımından birbirleri ile, hesaplanan toplam eko-puanlarına
göre karşılaştırıldı. Sonuç olarak, yenileme projelerinde kullanılan
malzemelerin seçimi için bir öneri oluşturuldu, ki çevreye verilen zarar,
enerji tüketimi, katı atık miktarı, zararlı emisyonlar ve küresel ısınma
potensiyelleri azaltılabilsin.
Anahtar Kelimeler: Hayat Döngüsü Değerlendirmesi, Otel Binaları,
Yenileme ve Tadilat Projeleri, ATHENA programı, Çevreyle Dost
Malzemeler.

viii
TO MY DAUGHTER
ix
ACKNOWLEDGEMENTS
I would like to express my gratitude and special thanks to my supervisor
Assoc. Prof. Dr. Soofia Tahira Elias Özkan for her guidance, patience
and supporting suggestions throughout the study. Also to jury members
Prof. Dr. Ömür Bakirer, Prof. Dr. Gülser Çelebi, Prof. Dr. Mutbul Kayılı
and Assoc. Prof. Dr. Arda Düzgüneş for their valuable comments and
support.
I would like to thank the technical departments of the case-study hotels
for their help and guidance in obtaining data for this investigation.
I am grateful to my mother and father for their generous support and
encouragement throughout my life. Finally, I would like to thank my
husband Serdar Çakmaklı and my little precious daughter Sıla for their
endless love, support and great patience throughout this endeavor.
x
TABLE OF CONTENTS
ABSTRACT …………………………………………………………. iv
ÖZ ……………………………………………………………….…... vi
ACKNOWLEDGEMENTS …………………………………………. ix
LIST OF TABLES ………………………………………………….. xii
LIST OF FIGURES ………………………………………………… xiv
LIST OF ABBREVIATIONS ....……………………………………. xvi
COPYRIGHT NOTICES ...……………………………………...…. xvii
CHAPTER
1. INTRODUCTION .………………………………………………. 1
1.1. Argument …….…………………………………….…... 1
1.2. Objectives…….…………………………………….…... 3
1.3. Procedure…….…………………………………….…... 4
1.4. Disposition..….…………………………………….….... 4
2. SURVEY OF LITERATURE ..…………………………………. 6
2.1. Sustainable Architecture………………………….…... 6
2.2. Life Cycle Costing ……..………………………….…... 8
2.3. Life Cycle Assessment...………………………….…... 10
2.3.1. Life Cycle Inventory Databases ..……….…... 18
2.3.2. Life Cycle Assessment Tools …..……….…... 23
2.4. Service Life Prediction ...………………………….…... 31
2.5. Life Cycle Assessment of Buildings …………….…... 34
2.5.1. Life Cycle Assessment of Renovations and Refurbishments..……….…............................. 36
2.5.2. Life Cycle Assessment of Hotel Buildings...... 37
xi
3. MATERIAL AND METHOD ...…………………………………. 43
3.1. Material …………………………………………….…... 43
3.1.1. Statistical Data on Renovation and Refurbishment Projects ….............................. 43
3.1.2. Case Study Buildings ……………………....... 44
3.1.3. Bills of Quantities of Three Refurbishment Projects ………….…………………................. 48
3.1.3. LCA Software ………….…………………........ 51
3.2. Methodology……………………………………….….... 52
3.2.1. Data Compilation Process.………………....... 55
3.2.2. Simulation ………….. ……………………....... 55
3.2.3. Tests of Hypotheses . ……………………....... 59
4. RESULTS AND DISCUSSION .………………………………. 61
4.1. Discussion on Statistical Data for Refurbishment Projects ......………………………………….………....
61
4.2. Frequency of and Reasons for Hotel Refurbishment Projects ..…………………………………….………....
66
4.3. Data Generated by Software ..………………….….... 71
4.4. Hypotheses Tested …………...………………….….... 79
4.5. Analysis of Materials According to Six LCA Indicators …………...………………….…................... 83
5. CONCLUSION ………………….………………………………. 91
5.1. Hotel Refurbishment Projects .………………….….... 91
5.2. Choice of Materials for Refurbishment Projects………………………...………………….….... 94
5.3. Further Investigations .………………….…................ 100
LITERATURE CITED ………..…….………………………………. 101
BIBLIOGRAPHY ……………..…….………………………………. 107
APPENDICES ………………..…….………………………………. 110
APPENDIX A ………………………..………………….….... 110
APPENDIX B ………………………..………………….….... 117
APPENDIX C ………………………..………………….….... 167
CURRICULUM VITAE …………………………………………….. 175

xii
LIST OF TABLES
TABLE
2.1 Different sets of LCA parameters in ATHENA software for the “Wall” object ……………………………………….. 25
2.2 Examples of factors, relevant to building services plant. 32
2.3 Possible impacts and mitigation measures at the maintenance, refurbishment and demolition stage…….. 42
3.1 Derived bill of quantities for renovation works in the three five-star hotels in Ankara, Turkey ………………… 49
3.2 Air pollution index value and corresponding pollutant concentrations according to EPA ………………………... 58
3.3 Air pollution index and air quality grading regards to health ……………………………………………………….. 58
4.1 BOQ of guestroom floors of three hotels included common materials in all cases and used in the software 72
4.2 Summary measures by life cycle stages of Hotel A obtained from ATHENA software ………………………... 73
4.3 Summary measures by life cycle stages of Hotel B obtained from ATHENA software ………………………... 74
4.4 Summary measures by life cycle stages of Hotel C obtained from ATHENA software ………………………... 74
4.5 The comparisons of cases according to six indicators per m2 ………………………………………………………. 76
4.6 Paired-sample t-test results – primary energy consumption ……………………………………………….. 79
4.7 Paired-sample t-test results – solid waste ……………… 80
4.8 Paired-sample t-test results – air pollution index ………. 81
4.9 Paired-sample t-test results – water pollution index …... 81
4.10 Paired-sample t-test results – global warming potential.. 82
4.11 Paired-sample t-test results – weighted resource use … 82
4.12 The impacts of seven materials according to six indicators in three hotels …………………………………. 83
xiii
List of Tables, (continued)
4.13 The mean values of impacts of materials according to six indicators ……………………………………………….. 84
4.14 Calculated air pollution index value …..…………………. 88
5.1 Precautions versus impacts of LCA indicators…………. 96
5.2 Proposed Matrix ………..…………………………………. 98
A.1 Comparison of 5 LCA tools according to different topics 110
A.2 ATHENA products ……...…………………………………. 114
B.1 Completed or partially completed new buildings and additions by use of building ………………………….…... 117
B.2 Buildings modified for a different use after alterations and repairs by year and use of building ………………… 119
B.3 Number of qualified and unqualified municipality establishments and rooms in Turkey by types and years ………………………………………………………... 122
B.4 Number of municipality licensed accommodation establishments in Ankara ………………………………..… 124
B.5 Number of qualified and unqualified municipality licensed hotels by provinces in Turkey – 2003 ………… 125
B.6 Number of qualified and unqualified municipality licensed hotels by provinces in Turkey – 2000 ……….... 127
B.7 Data related to the different types of alterations and renovation projects approved by the Chamber of Architects in Ankara, during the 5 year period of 2000-2005…………………………………………………... 129
B.8 Total bill of quantities of three case studies ……………. 146
B.9 Electricity profile of Turkey ……………………………….. 164
B.10 Operating energy consumptions of hotels………………. 165
B.11 Air pollution profile of Turkey …………………………….. 166
C.1 An example budget list of Hotel B ……………………….. 167
C.2 The paired-sample t-test tables ………………………….. 168
C.3 The impacts of seven materials during life cycle stages according to six LCA indicators …………………. 171
xiv
LIST OF FIGURES
FIGURE
2.1 Summary of life cycle assessment procedure proposed by the Royal Society of Chemistry …..………………….. 12
2.2 The four phases of LCA ………………………………….. 13
2.3 Elements of the LCIA phase ……………………………... 16
2.4 Facility and material life cycle ……………………………. 18
2.5 Environmental interventions and economic flows……… 20
2.6 Inputs to building data store ……………………………… 21
2.7 Processes for developing a localized database ……….. 23
2.8 The relationships among the building data scheme, the project database and the external databases ………….. 27
2.9 Global warming potential values and lifetimes from IPCC ………………………………………………………... 30
2.10 Different types ends-of-life scenarios …………………… 33
2.11 Stages of building life cycle ………………………………. 35
2.12 Lifecycle of a hotel ………………………………………… 40
3.1 Typical guestroom floor plan of Hotel A ………………… 45
3.2 Typical guestroom floor plan of Hotel B ………………… 46
3.3 Typical guestroom floor plan of Hotel C ………………… 47
3.4 The methodology adapted by the author ……………….. 54
4.1 The number of completed or partially completed new buildings and additions by use of building according to years Table B.2…………………………………………….. 62
4.2 Total floor area of completed or partially completed new buildings and additions by use of building according to years Table B.2…………………………………………….. 62
4.3 Data related to the number of tourism establishments in Turkey and Ankara derived from Table B.3, B.4, B.5, B.6…………………………………………………………… 63
xv
List of Figures, (continued)
4.4 Number of buildings modified for a different use after alterations and repairs by year and use of building derived from Table B.2.……………..…………………….. 64
4.5 Data related to the different types of renovation projects approved by the Chamber of Architects in Ankara, during the 6 year period of 2000-2006, derived from Table B.7, Appendix B…………………………………….. 65
4.6 Typical standard suit of Hotel A after refurbishment …... 67
4.7 Typical standard room of Hotel A before refurbishment.. 67
4.8 Typical standard room of Hotel A after refurbishment…. 67
4.9 The faucet fittings and marble claddings in typical standard room of Hotel A before refurbishment………… 70
4.10 Typical bathroom of a standard room of Hotel A after refurbishment …………………………………………….… 70
4.11 The impacts of three hotels according to primary energy consumption and weighted resource use ……… 75
4.12 The impacts of three hotels according to WPI .………… 75
4.13 The impacts of three hotels according to solid waste, air pollution index and global warming potential………... 76
4.14 The impacts of three hotels per m2 according to primary energy consumption and weighted resource use………. 78
4.15 The impacts of three hotels per m2 according to solid waste, air pollution index and global warming potential.. 78
4.16 The impacts of three hotels per m2 according to WPI…. 78
4.17 Comparison of seven materials according to the primary energy consumption …………………………….. 85
4.18 Comparison of seven materials according to the solid waste ……………………………………………………….. 86
4.19 Comparison of seven materials according to the API.…. 87
4.20 Comparison of seven Materials according to the WPI…. 88
4.21 Comparison of seven materials according to the global warming potential …………………………………………. 89
4.22 Comparison of seven materials according to the weighted resource use…………………………………….. 90
xvi
LIST OF ABBREVIATIONS
ISO : International Standards Organization
LCA : Life Cycle Assessment
BOQ : Bill of Quantities
TURKSTAT : Turkish Agency for Statistics
LCC : Life Cycle Costing
ASTM : American Society for Testing and Materials
AIA : American Institute of Architects
IEA : International Energy Agency
SETAC : Society of Environmental Toxicology and Chemistry
LCI : Life Cycle Inventory
LCIA : Life Cycle Inventory Assessment
UNEP : The United Nations Environment Program
NREL : The National Renewable Energy Laboratory
EIE : Environmental Impact Estimator
API : Air Pollution Index
WPI : Water Pollution Index
GWP : Global Warming Potential
IPCC : International Panel on Climate Change
RSLC : Reference Service Life of Components
ESLC : Estimated Service Life of Components
USEPA : United States Environmental Protection Agency
EPA : Environmental Protection Agency
APAT : The Italian National Agency for the Protection of the Environment and for Technical Services

xvii
COPYRIGHT NOTICES
Microsoft Office licensed to METU
SPSS 11® for Windows® licensed to METU
ATHENA® EIE v 3.02 licensed to Ayşem Berrin Çakmaklı

1
CHAPTER I
1.INTRODUCTION
In this chapter are presented the argument for and the objectives of the
study, together with a precise of the procedure followed in its conduct and
the disposition of the topics within the thesis.
1.1. Argument
As the population of the world continues to expand, the need for including
quality in environmental management and extending it in time on a
sustainable basis has become vital. Buildings should benefit humans, the
community, and the environment. The term “sustainability” denotes an
approach to the design, construction and operation of buildings that
improves their relationship with their environment and their occupants.
However, most buildings of today have- and are continuing to- become
unquestionable threats to environment; as they consume significant
quantities of energy at all stages of their life time. In turn, this causes both
short- and long-term environmental and economic problems on local, as
well as global scales. According to Li (2006: 1414), the building sector,
including housing, comprises 30 to 40% of the world’s total energy
demand and approximately 44% of total material use.
Sustainable, or “green”, buildings include appropriate use of land and
landscaping, of environmentally friendly materials that have closed loops,
and require attention to the life cycle effects of their design, construction

2
and operation stages. Hence, the entire building process -from cradle to
grave or even from cradle to cradle- in its relation to the environment due
to its energy use and emission should be assessed. This assessment has
to include the whole life of the building which is why ISO Standard 14040
evolved regarding Life Cycle Assessment (LCA) of products.
Defining sustainable materials and encouraging their use with a better
integration of LCA techniques and LCA-based decision support tools are
important to improve environmental quality. When LCA methodology is
applied to a building product, it is seen that an important parameter in LCA
of buildings and building materials is the prediction of service life to make
accurate comment about the environmental impact. The objective of
service life planning according to ISO 15686-1 is: “to assure, as far as
possible, that the service life of the component will be at least as long as
its design life”. Service life planning aims at enabling designers to optimize
resource use by ensuring that the building will last for the lifespan that the
occupants determine, without incurring large unexpected expenditures. On
the other hand, it seems that there is no relationship between structural
materials and the service life of a building and that buildings are most
likely to be demolished much before useful life of their structural systems
end.
While examining the building construction data, it was seen that the
number of renovation and alteration projects has increased significantly
during the past few years for reasons other than the unsatisfactory
condition of the spaces or change in their functions. Even though certain
materials have a long life span, they are not required to live it through and
some material is discarded regardless of its good condition, usefulness or
life span such as in the case of the hospitality sector.

3
Hotels are one of commercial buildings which have the highest negative
impact on the environment. They need to follow technological
improvements and apply them to their design processes at appropriate
intervals because maintaining high standards for customers are really
significant if they are to remain competitive. Environmental management in
hotels is an important step towards achieving sustainable tourism and
contributing to sustainable development. Renovation or refurbishment in
hotels offers opportunities for promoting energy-efficient measures and
exploitation of renewable energy resources.
For this reason, there is a need to evaluate the environmental impact of
hotel refurbishment projects, and to classify the materials used for this
purpose from the point of view of environmental impact indicators. LCA is
a methodology that can be adapted to this end. It involves environmental
aspects and potential impacts throughout the life of a product, from raw
material acquisition through production, use and disposal.
1.2. Objectives
The objectives of this study were:
• To determine the volume of renovation works in Turkey, especially
in larger cities.
• To determine the volume of renovation works in the Turkish
hospitality sector.
• To determine the types and amounts of material being replaced
during hotel refurbishment projects.
• To determine the frequency of and reasons for hotel refurbishment
projects and to understand the necessity for such projects.
• To assess the environmental impacts of the materials most
commonly replaced during refurbishment projects by using a life
cycle assessment tool (ATHENA).
4
• To analyze the data statistically in order to arrive at reliable
conclusions.
1.3. Procedure
This study focused on assessing the refurbishment projects of three five-
star hotels in Ankara, in terms of their environmental impacts. At the first
stage of the study, the importance of renovation / refurbishment projects in
Turkey was assessed by examining official data available from The
Turkish Agency for Statistics (TURKSTAT), Ankara Chamber of Architects
and the Ministry of Tourism.
At the second stage, data on bills of quantities (BOQ) for renovation
projects of the three hotels and their operating energy consumption were
obtained, along with their architectural drawings. Administrative staff was
also informally interviewed to gather information on the frequency of and
reasons for these renovations. An analysis of these BOQ necessitated an
environmental impact analysis of the various materials replaced during the
refurbishment projects. These selected materials were assessed with an
LCA software called ATHENA.
At the third stage of the study, data which were generated by the LCA tool
were summarized in graphs and tables and statistically evaluated. Based
on findings, a system was proposed for comparing environmental
appropriateness of the materials used in three case projects.
1.4. Disposition
The study consists of five chapters. The first one is composed of the
argument for, the objectives of, and a general outline of the procedure of
the study. It concludes with the disposition of the thesis.
5
Chapter 2 comprises of the literature survey in which 50 published works
and 5 web sites are included covering topics of sustainable architecture,
life cycle costing, life cycle assessment, service life prediction, life cycle
inventory databases and their importance, life cycle assessment of
buildings/hotels, and the importance of renovations in the life cycle of
hotels.
Chapter 3 is composed of the survey material, which includes the
statistical data on renovation and refurbishment projects in Turkey,
information on three five-star hotels in Ankara, the grouped data derived
from the bill of quantities for guestroom floors of the three hotel
refurbishment projects; and the LCA software and methodology that
includes data compilation process, simulation procedure and statistical
tests.
Chapter 4 presents discussion on statistical data on renovation and
refurbishment projects in Turkey and the frequency of and reasons for
hotel refurbishment projects. Then data generated by the LCA software
(ATHENA), the statistical analyses of these data using paired-sample t-
test and the comparative evaluation of the three case studies and seven
common materials are given.
Finally, a matrix which is derived from this investigation and can be used
to enable designers to choose the suitable material in order to reduce
damage to the natural environment, further investigations and
recommendations are stated in Chapter 5.
6
CHAPTER 2
2.SURVEY OF LITERATURE
This literature review covers a total of 50 published sources and 5
websites. It consists of topics related to sustainable architecture, life cycle
costing, life cycle assessment, service life prediction, life cycle inventory
databases, and their importance, life cycle assessment tools, life cycle
assessment of buildings/hotels, and the importance of renovations in the
life cycle of hotels. To render the presentation of the concept of life cycle
assessment and, specifically, life cycle assessment of hotel refurbishment
projects as systematically as possible, general definitions have been given
which are supported by examples, for clarity.
2.1. Sustainable Architecture
Sustainable development is “the challenge of meeting growing human
needs for natural resources, industrial products, energy, food,
transportation shelter and effective waste management while conserving
and protecting environmental quality and the natural resource base
essential for future life“ (Bartelmus, 1994: 5). Reduced consumption of
energy in use; increased durability of buildings and components are
important factors to be considered in sustainable architecture. The world is
faced with the problem of global warming, owing to the increased levels of
greenhouse gases in the atmosphere that have raised the temperature of
the earth above its natural equilibrium level.
7
According to the Rocky Mountain Institute (2003), if sustainable design
principles were incorporated into building projects, benefits could include
resource and energy efficiency; healthy buildings and materials;
ecologically and socially sensitive land use, transportation efficiency; and
strengthened local economies and communities. Sustainable principles
were applied to buildings by using such natural resources as the sun,
wind, landforms, and natural vegetation to provide heating, cooling,
lighting, ventilation. Edwards (1998: 169) stated that the large section of
the building sector generally use natural, mostly non-renewable resources
and this leads to resource depletion, destruction of valuable landscapes,
loss of biodiversity and pollution.
Crosbie’s (1994) argument for sustainable architecture is based on the
“green building’s” multidisciplinary approach to cradle-to-cradle
understanding, which consisted of the planning phase; the design,
construction and operation phase; and the ultimate reuse or recycle
phase. He classified the main cornerstones of green building as to supply
thermal comfort, effective lighting, ventilation, high indoor air quality;
energy conservation; good waste management; water efficiency; to use
renewable energy; to be sufficient for themselves and to decrease site
clearing costs by minimizing site disruption.
According to Osso et al. (1996: 178), selecting environmentally preferable
building materials was one way to improve a building’s environmental
performance. The building materials, which use minimum energy during
their life cycle assessment and cause no problem to the environment,
should be the only choice. The authors asserted that key design issues
regarding sustainable architecture which were in confirmation with the
European Commission’s directives were:
� selecting materials with their environmental effects in mind,
� designing according to the durability of materials and components,
8
� designing for flexibility, allowing for change in building use over
time,
� allowing replacement of facades and internal partitioning without
structural disturbance,
� incorporating a methodology for dismantling buildings, reusing or
recycling building components at the end of their lifespan,
� focusing on easy maintenance of components and systems for long
life and low emissions,
� requiring contractors to use eco-friendly cleaning materials during
construction and at final clean up.
2.2. Life Cycle Costing
According to Hochschorner and Finnveden (2003), sustainable
development required methods and tools to measure and compare the
environmental impacts of human activities for the provision of goods and
services. Life Cycle Costing (LCC), and Life Cycle Assessment (LCA)
were determined as two complementary methodologies, which measure
the performances of products or systems in the units appropriate to each
emission type or effect category. The American Society for Testing and
Material (ASTM) defined the LCC method in terms of ASTM, E833: 84:
“a technique of economic evaluation that sums over a given study period the costs of initial investment (less resale value), replacements, operations,(including energy use), and maintenance and repair of an investment decision (expressed in present or annual value terms)”.
ASTM (E917: 83) formulates the following relationship for LCC on a
‘before-tax’ basis:
LCC=C+R+S+A+M+E,
where
C=investment costs,
R=capital replacement costs,
9
S=resale value of investment at end of study period,
A=annually recurring operating and repair costs (except energy costs),
M=non-recurrent operating, maintenance and repair costs; and
E=energy costs.
Costs included in LCC somewhat differed depending on the description of
the method. The American Institute of Architects had established the
following cost categories (AIA, 77):
� initial capital investment cost,
� financing costs,
� operation and maintenance costs,
� replacement costs,
� alteration and improvement costs,
� functional use costs,
� salvage costs.
On the other hand, Zhang (1999: 12) argues that there is a
comprehensive, systematic and consistent basis for applying LCC
technique in buildings and building systems. The general methodology for
LCC is to study all relevant costs associated with the building at an
appropriate time period in order to measure economic performance; these
relevant costs were:
� Initial cost,
� operation cost,
� maintenance and repair cost.
Zhang (1999: 14-15) also states that the initial cost includes construction
and project related costs which are the most critical of the costs
associated with design alternatives; the operation cost comprises of the
major cost items in this category which are energy cost and personnel
salaries required to operate the facility and maintenance; and repair cost
10
includes preventive and corrective maintenance costs, custodial care and
minor replacement costs.
According to Ehlen (1997), the point was to be aware of the common
tendency to focus only on the initial cost. It was important to assess a
given choice among alternative choices after considering all relevant
economic consequences over its life cycle.
2.3. Life Cycle Assessment
The philosophy of life cycle is the essence of ecological design which
depends on the overall impacts of a product. The general categories of the
environmental impact to be considered include resource use, human
health and environmental health. As defined by IS0 14040 (1997: iii),
“LCA is a technique for assessing the environmental aspects and potential impacts associated with a product, by:
� compiling an inventory of environmentally relevant inputs and outputs of a system.
� evaluating the potential environmental impact associated with those inputs and outputs.
� interpreting the results of the inventory and impact phases in relation to the objectives of the study.”.
According to Trusty (2003) environmental performance is generally
measured in terms of several potential effects, such as:
• fossil fuel depletion,
• other non-renewable resource use,
• water use,
• global warming potential,
• stratospheric ozone depletion,
• ground level ozone (smog) creation,
• nitrification / eutrophication of water bodies,
• acidification and acid deposition (dry and wet),
• toxic releases to air, water and land.
11
The same author points out that all of these measures are indicators of
environmental loadings that could result from the manufacture, use and
disposal of a product. The indicators did not directly address the ultimate
human or ecosystem health effects, but provide good measures of
environmental performance.
According to Paulsen (2001), LCA is a dynamic and iterative assessment
process which assesses the environmental impacts of products and
services from a cradle-to-grave perspective. The ‘cradle’ is defined as the
place where or moment when the raw materials or resources are taken
from Nature into the technical system and the ‘grave’ is defined as the
place where and/or the time when the products or used resources return
to Nature.
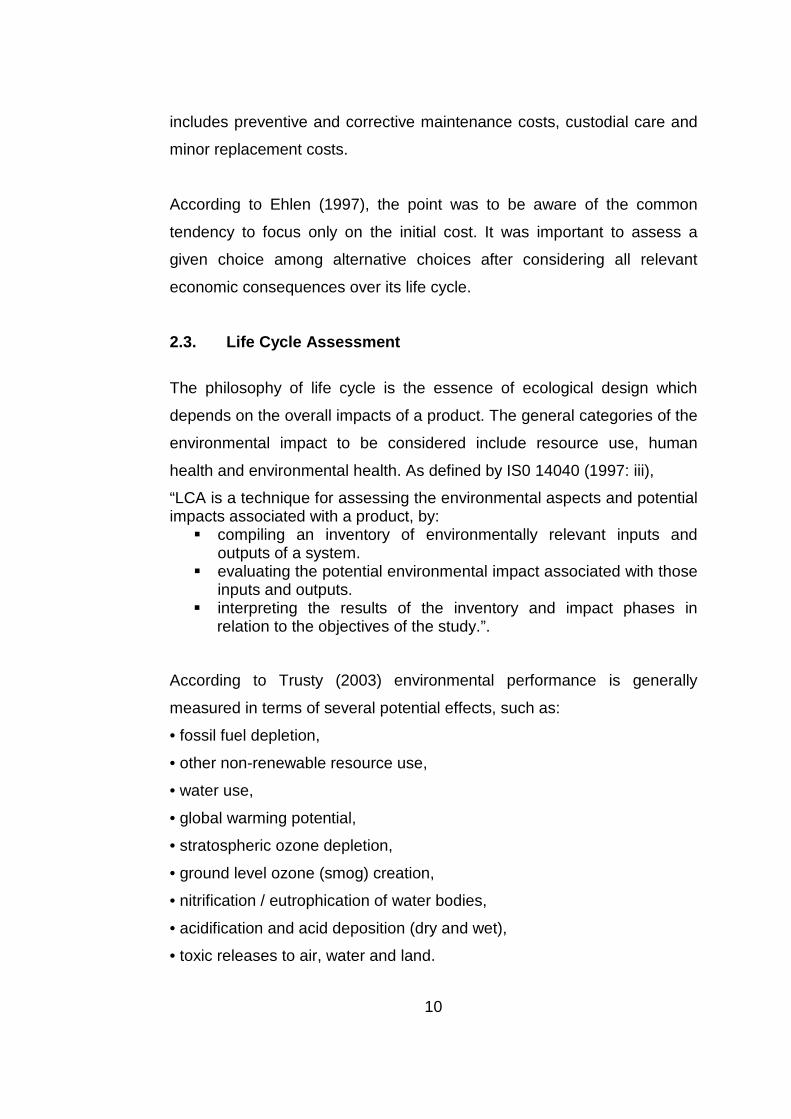
The Royal Society of Chemistry (1998: 2) defines the LCA for a product as
a summation of individual impacts from the stages listed below and
defines the procedure of LCA as shown in Figure 2.1.
� extraction of the relevant raw materials,
� refinement and conversion of these to process materials,
� manufacturing and packaging processes,
� transportation and distribution at each stage,
� operation or use during its lifetime,
� final transportation, waste treatment, and disposal at the end of its
useful life.
12
Figure 2.1. Summary of life cycle assessment procedure proposed by the
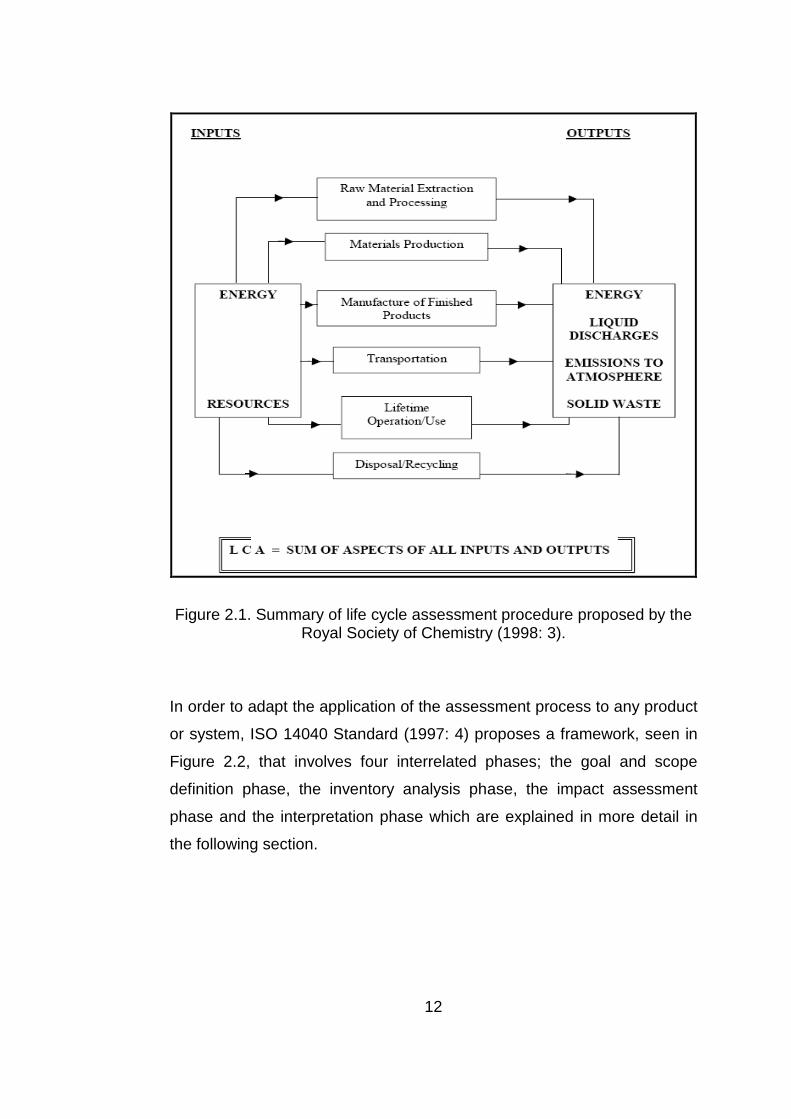
Royal Society of Chemistry (1998: 3). In order to adapt the application of the assessment process to any product
or system, ISO 14040 Standard (1997: 4) proposes a framework, seen in
Figure 2.2, that involves four interrelated phases; the goal and scope
definition phase, the inventory analysis phase, the impact assessment
phase and the interpretation phase which are explained in more detail in
the following section.
13
Figure 2.2. The four phases of LCA. (Source: ISO 14040 Standard, 1997: 4).
i. Goal and Scope Definition Phase
Paulsen (2001) determined that, the first important step of any LCA was
the definition of the goal and scope including functional units, system
boundaries, data quality requirements, and a critical review process. The
choice of elements of the physical system was dependent on the definition
of the goal and scope of the study. The overall objectives of the study
should be given in a clear and concise statement with the reasons for
carrying out the study and intended use of the results detailed. Similarly
Erlandsson, and Borg (2003) indicated that a well-defined goal was
needed to motivate the choice of the most suitable system boundaries that
identify the extent to which specific processes were included or excluded.
The methodology, data categories, and assumptions should also be
clearly stated and so that they are easily understood.
The International Energy Agency (IEA) (2001) pointed out the importance
of the scope of any study in Annex 31 and added that the scope of the
14
study should be defined in sufficient detail to enable the study to address
the stated objectives. The usefulness of a product and the actual function
of the system in a measurable and quantitative way should be identified
through its functional unit, which could be expressed by various measures.
Comparisons between systems could be made on the basis of the same
function, and quantified by the same functional unit. The performance or
service of the product could be comparable to the service or performance
of another product, not the product itself.
According to IEA (2001), the system boundaries that define and structure
the system under assessment identify the extent to which specific
processes are included or excluded. Data quality goals and methodology
should thus be clearly established and detailed, along with the justification
for the assumptions. The results of LCA are only valid for well-defined
goals and scopes; hence, it may become necessary to revise both goal
and scope during the analysis due to the lack of data or important findings
and this causes LCA to be iterative.
ii. Inventory Analysis Phase
ISO 14041 Standard (1998E) defines inventory analysis as the process of
compiling the amount of natural resources and energy taken in by the
system and the amount of wastes discharged to the environment from the
system for each functional unit. In short, this phase is concerned with data
collection and calculation procedures. The data required for an LCA study
are dependent on the goal of the study. Every activity in the process tree
is divided into unit processes, which is the smallest unit in an LCA.
According to The Society of Environmental Toxicology and Chemistry
(SETAC, 1997), during the inventory analysis, it is important to refine the
system boundaries for all stages of the product system life cycle including
inputs, processing routes, spatial and temporal considerations, in case
there is a lack of data. Inventory data is related to reference flows for each

15
unit process in order to quantify and normalize input and output to the
functional unit being investigated. Data would then be aggregated in order
to prepare an input-output table for this product or service. Process flow
charts describing the complete system, main production sequence,
ancillary materials and energy/fuel production are then formulated.
Erlandsson and Borg (2003) determined that any allocation procedures
related to inputs and outputs of the multifunctional system should be fully
detailed and explained. These procedures should reflect the physical
behavior of the system since allocation of building materials is complicated
by the large time spans encountered in the lifetime of buildings.
iii. Impact Assessment Phase
According to ISO 14042 Standard (2000: 2), the purpose of the impact
assessment phase is to examine the product system from an
environmental perspective using impact categories and category
indicators connected with LCI results to better understand their
environmental significance. This phase could be subdivided into four
steps, which are: category definition, classification, characterization as
mandatory elements and calculating the magnitude of category indicator
results relative to reference values, normalization, grouping and weighting
as optional elements, as seen in Figure 2.3.

16
Figure 2.3. Elements of the LCIA phase. (Source: ISO 14042 Standard, 2000: 3).
Paulsen (2001: 8-9) indicated that; while making an assessment, firstly the
categories and category indicators are used to provide guidance for
selecting and defining the environmental categories. Then, the
classification step is done to assign inventory input and output data to the
pre-defined impact categories. This is a qualitative step, which is based on
scientific analysis or an understanding of the relevant environmental
processes. The author points out that for each impact category, the
relative importance of the contributing substances can be modeled and
quantified; hence it is important to possess the ability to model the
categories in terms of standardized indicators for the characterization step.
The indicator chosen is used to represent the overall change or loading in
the category, therefore contributions to impact categories are expressed
using an equivalency factor. Categories are ranked according to their
relative importance to each other and numerical values are assigned to
them to represent degrees of the significance, for ease and clarity of

17
decision-making. Such weighting is especially helpful when attempting to
reduce LCA to a single score for the environmental impact and then
making overall comparisons between alternative buildings and designs.
iv. Interpretation Phase
According to ISO 14043 Standard (2000: 2), the life cycle interpretation
phase of an LCA study includes three elements;
� identification of the significant issues based on the results,
� evaluation of the underlying study,
� conclusions, recommendations and reporting.
Firstly, a sensitivity analysis is carried out to assess the reliability and
validity of results with particular respect to key assumptions made in
calculations, uncertainty or missing data and dependence on particular
data sets. The ISO 14043 Standard (2000: 5-6) recommends three
techniques using during the evaluation phase. These are:
� Completeness check: to ensure that all relevant information and
data needed for the interpretation are available and complete;
� Sensitivity check: to assess the reliability of the final results and
conclusions by determining whether they are affected by
uncertainties in the data, allocation methods or calculation of
category indicator results;
� Consistency check: to determine whether the assumptions,
methods and data are consistent with the goal and scope.
According to SETAC (1997), the whole analysis consists of discussions
regarding data quality; scope and boundary settings; and completeness
and consistency of results. If two product alternatives or systems are
compared and one alternative shows higher consumption of each material
and of each resource, an interpretation that is based purely on the LCI can
be conclusive.
18
2.3.1. Life Cycle Inventory Databases
Life cycle assessment was originally developed in 1969 for internal use by
manufacturers considering options for product development when a
certain soft drink producer wanted to determine the environmental impact
of switching from glass to plastic bottles (Ecobilan, 2003). According to
Zhang et al. (2006), LCAs of building materials are different from those for
disposable items like packaging, for two reasons: firstly, building materials
tend to have a relatively long service life; second their service life is highly
variable, as even durable products might be replaced quickly for aesthetic
or economic reasons. Estimating the useful service life of any material can
introduce a high level uncertainty in the results of any LCA study.
Malin (2002: 3) classified the main problematic areas in LCA studies of
buildings to be the quality, consistency, and availability of data on products
and processes; the methods used to compile inventories; and especially
the assumptions and systems used to translate inputs and outputs into
measures of environmental impact. The author’s description of the facility
and material life cycle is shown in Figure 2.4.
Figure 2.4. Facility and material life cycle (Source: Malin, 2002: 4).
19
Trusty (2003) argues that life cycle inventory data should come from
manufacturers, trade organizations, or from pre-existing databases. Data
from any of these sources would vary in accuracy depending on how they
were collected and compiled and how current they were. Data collection
requires many assumptions and it may be impossible at times to ensure
that the inventories of inputs and outputs are compiled consistently.
According to Ekvall (2005: 1), one of the fundamental tasks in LCA
procedures was the determination of the quantity and type of the materials
in a building. LCA methods varied but typically involve use of databases
with LCA related data for various materials and building components and
systems. At the heart of an LCA model lies the database, which is
developed and maintained through the LCI process. This process was the
critical step that tracks and records the basic resource and waste flows to
and from the environment. Ekvall (2005) further points out that key issues
in data collection includes:
� improving the efficiency and quality of data collection,
� how to facilitate LCI data exchange and presentation,
� how to assess data quality.
The LCI database contains data modules that quantify the material and
energy flows into and out of the environment for common unit processes.
A full product LCA requires the combination of several unit process LCI
data modules (http://www.athenasmi.ca/papers/down_papers/, last access
19.05.2007).
According to the ISO Standard 14042 (2000: 2), it is not the inputs and
outputs that are the issue, but the environmental impacts of these flows.
First of all, LCI of a product or process has to be analyzed from the point
20
of view of environmental issues. This process, known as life-cycle impact
assessment (LCIA), “aims to examine the product system from an
environmental perspective using impact categories and category
indicators connected with the LCI results”. Guinee (2002: 479) showed the
inputs and outputs of environmental interventions and economic flows in
Figure 2.5, while assessing a unit process or a product system.
Figure 2.5. Environmental interventions and economic flows.
(Source: Guinee 2002: 479).
According to UNEP-SETAC (2003: 9), the different types of environmental
impacts are organized by LCA practitioners into a series of impact
categories, such as global warming, ozone depletion, ecosystem toxicity,
acidification, diminished human health, resource depletion; and so on.
Whereas, Malin (2002) indicates that the LCA methods used to translate
inventories into potential impacts. Impacts such as global warming and
ozone depletion are estimated based on internationally established
methods that convert emissions of a wide range of gases to a cumulative
impact measurable on a single scale. However, an impact category like
21
ecosystem toxicity is much more complex to quantify, and therefore the
methodology used for impact assessment is less consistent.
According to Paulsen (2001), it was important to add specific
manufacturing and use-phase data to construct more complete LCAs,
based on knowledge of specific products and their applications. Specific
end-of-life data for products that represent recycling or other final
disposition of product systems should be added in order to assess the full
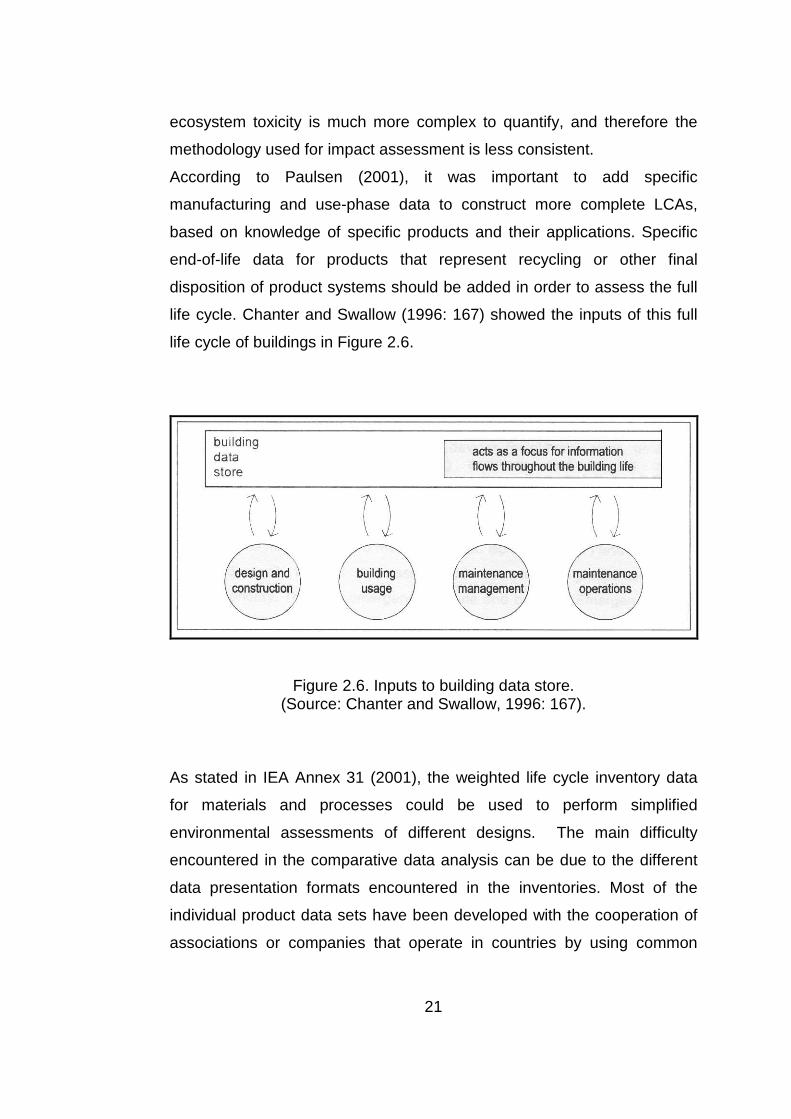
life cycle. Chanter and Swallow (1996: 167) showed the inputs of this full
life cycle of buildings in Figure 2.6.
Figure 2.6. Inputs to building data store. (Source: Chanter and Swallow, 1996: 167).
As stated in IEA Annex 31 (2001), the weighted life cycle inventory data
for materials and processes could be used to perform simplified
environmental assessments of different designs. The main difficulty
encountered in the comparative data analysis can be due to the different
data presentation formats encountered in the inventories. Most of the
individual product data sets have been developed with the cooperation of
associations or companies that operate in countries by using common

22
technologies. The quality of life cycle data and the easy access to the
databases are prerequisites to establish LCA as a reliable tool for
environmental assessment.
The Importance of National Life Cycle Inventory Databases
Trusty (2003) pointed out that, the development of reliable LCI data
typically required considerable expert time inputs and expense. LCAs are
generally considered to be too expensive and time consuming because of
the lack of widely available, critically reviewed, comprehensive LCI
databases. Although there are a few LCI databases available in the
market, access to the information contained in them is generally restricted
or protected by copyright agreements, or the data are not verifiable. Public
availability of the LCI data would make LCAs easier to perform.
According to NREL (2003: 1-2), proprietary LCI databases should be
taken as the source for LCI model data by making appropriate
adjustments to the process models. Ultimately, a national database can
then be established to serve the needs of the potential data users; such a
database should have the following criteria:
� Consistency with ISO standards and U.S. guidelines for LCA;
� meet specific transparency criteria;
� uniform treatment of all materials and products;
� regional differentiation that properly reflects critical regional
variations within and across industry sectors; and
� full accessibility in a format(s) designed to maximize use.
ARUP Group (2004) insists that input data should reflect the impacts due
to consumption of resources and environmental emissions of all functional
units. Localization of the data is essential in order to obtain LCA results
that are relevant to the geographical region concerned. This localized
process is presented in Figure 2.7 below.

23
Figure 2.7. Processes for developing a localized database.
(Source: ARUP, 2004: 7).
2.3.2. Life Cycle Assessment Tools
According to Trinius (1999), the need for environmentally related
information has been increasing with the rising interest and demand from
policy makers to achieve a sustainable society; hence interest in
environmental assessments of the built environment is also rising.
Consequently, many tools for the assessment of the built environment,
focusing on energy use in buildings, the sick building syndrome, indoor
climate, building materials containing hazardous substances etc., have
been devised.
Reijnders and Roekel (1999) divides environmental assessment tools into
two classes: qualitative tools based on scores and criteria, and
quantitative tools using a physical life-cycle approach with quantitative
input and output data related to flows of matter and energy. Qualitative
methods are based on assigning a score to each investigated parameter,
resulting in one or several overall scores of a building. On the other hand,
quantitative approaches are based on a combination of calculation and

24
evaluation methods. In this process, databases are used to manage
information on quantities involved in calculation methods, while base
values and specific benchmarks are used for evaluation of the results.
Examples of popular qualitative tools are LEED BREAM, GBTool, and
EcoProfile; and those of quantitative tools can be listed as ATHENA,
BEES, BEAT 2000, and EcoEffect. In this investigation, ATHENA has
been used to assess the case study.
Trusty (2000: 18-19) classifies LCA tools into 3 levels according to the
level of outputs e.g.:
Level 1 Tools such as BEES, SimaPro and TEAM assesses the materials
individually. Hence, it can be valuable for building databases and for
making comparisons and choices but can not be used to make whole
building design decisions.
Level 2 Tools focuses on a specific area of concern, such as life cycle
costs, life cycle environmental effects, lighting, or operating energy, and a
few combine more than one of these areas. These tools are considered to
be building decision support tools, using bases compatible with formal
ISO, ASTM, ASHRAE, or national standards and guidelines. Examples of
level 2 tools are: ATHENA, EcoQuantum, Envest, DOE2, and E10 .These
were consistently data-oriented and objective, and hold on.
Level 3 Tools provided a very broad coverage of environmental,
economic, social, and other issues relevant to sustainability. This
classification is also accepted as qualitative method of whole building
assessment frameworks or systems, such as LEED (US), BREEAM
(Canada/UK), GBTool (International), EcoEffect (Sweden). Level 3 tools
used a mix of objective and subjective data that depend on Level 2 tools
for the objective data.
25
A comparison of the above mentioned tools is presented in Table A.1
(Appendix A). Of these ATHENA Environmental Impact Estimator (EIE), is
an LCA software developed by ATHENA Sustainable Materials Institute in
Canada for life cycle assessment of buildings. Existing LCI provides the
assembly-specific and site-specific data that is needed for the integrated
simulation environment for an LCA analysis. The site-specificity of the data
is defined through basic project inputs such as the city location; while the
assembly-specificity of the data is derived from the bill of materials of any
building project (http://www.athenasmi.ca/, last access 19.05.2007).
As Trusty (2000) points out design teams can use ATHENA® directly to
carry out assessments of the structural systems, foundations and
envelope systems of a building. The expected life of a component can be
input as expected life of the structure and the operating energy conversion
calculator module can be used to enter the building’s annual operating
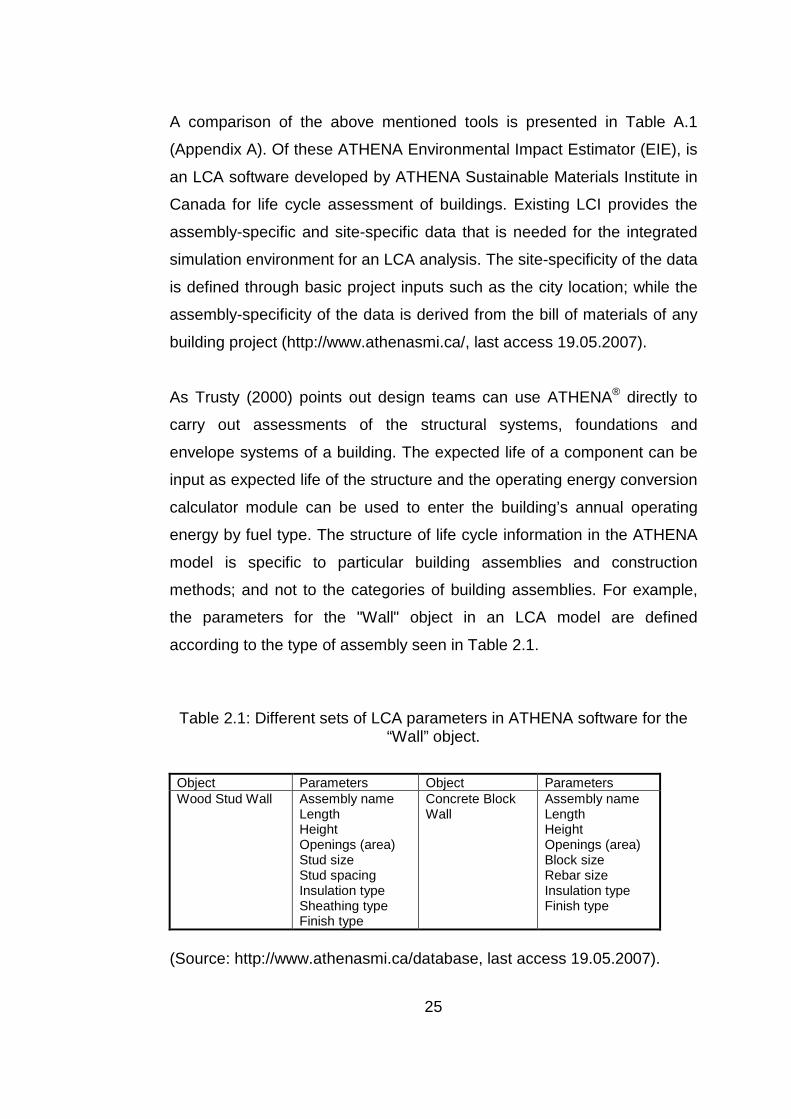
energy by fuel type. The structure of life cycle information in the ATHENA
model is specific to particular building assemblies and construction
methods; and not to the categories of building assemblies. For example,
the parameters for the "Wall" object in an LCA model are defined
according to the type of assembly seen in Table 2.1.
Table 2.1: Different sets of LCA parameters in ATHENA software for the
“Wall” object.
Object Parameters Object Parameters Wood Stud Wall Assembly name
Length Height Openings (area) Stud size Stud spacing Insulation type Sheathing type Finish type
Concrete Block Wall
Assembly name Length Height Openings (area) Block size Rebar size Insulation type Finish type
(Source: http://www.athenasmi.ca/database, last access 19.05.2007).

26
ATHENA is focused on the level of whole buildings, or complete building
assemblies. It had approximately 25 “Assembly Types” which are
combination of elements / components in the “Assembly Groups” (Beams
and Columns, Extra Basic Materials, Floors and Roofs, Foundations,
Walls). The data used in this software are designed to make the LCA task
as easy as possible for architects and engineers who need answers about
the environmental implications of their decisions. The building elements
are further divided into 2 kinds of products: structural and envelope
products seen in Table A.2 (Appendix A) (http://www.nrcan.gc.ca/es/etb,
last access 08.06.2006).
According to IEA-BCS (1999), in order to assess any building with
ATHENA, each individual building assembly is added as a new building
object to the building data schema, without breaking the existing schema;
thus redefinition of existing building objects is not required.
Pal et al. (2001) indicated that it is difficult to abstract or fit into common
structural frameworks of building data modeling so the definitions of new
building objects which were stored in external databases were used to
create alternative options. These databases can be dynamic and
continuously updated by manufacturers of building components and
systems, and/or by services and organizations. External databases can be
used to select options for building components and systems during the
development of the project database. The relationships among the
building data scheme, the project database and the external databases
can be seen in Figure 2.8.
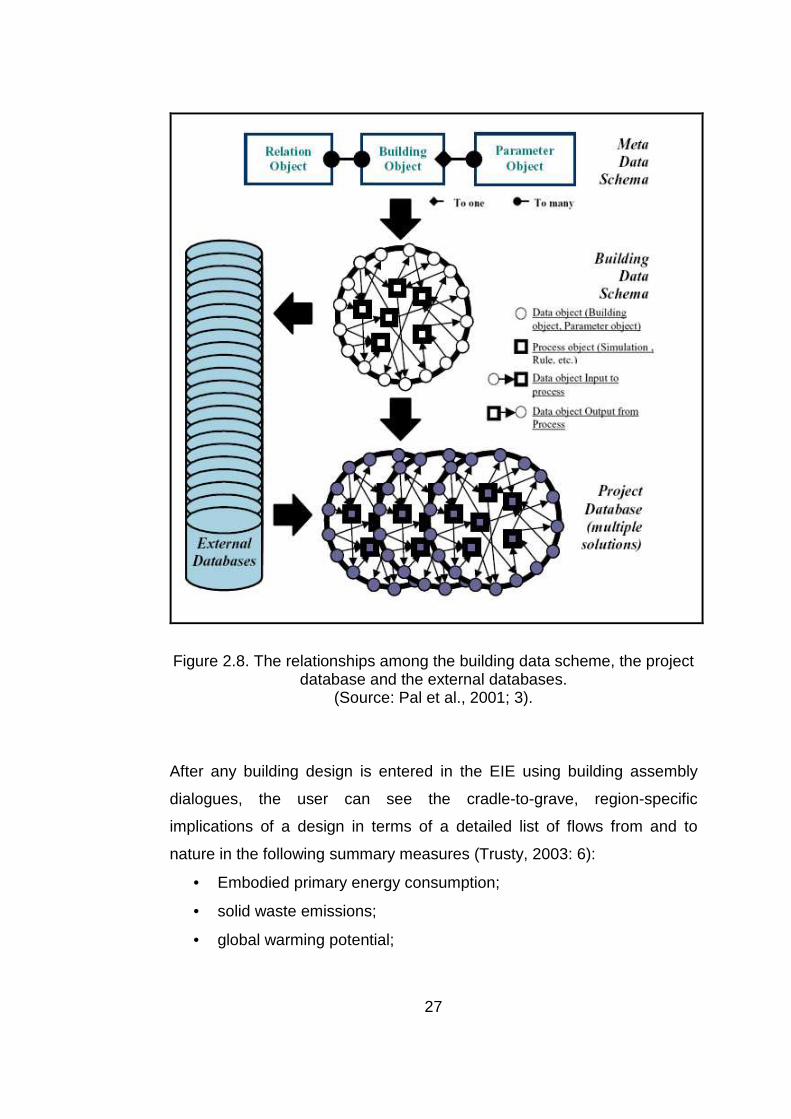
27
Figure 2.8. The relationships among the building data scheme, the project database and the external databases.
(Source: Pal et al., 2001; 3).
After any building design is entered in the EIE using building assembly
dialogues, the user can see the cradle-to-grave, region-specific
implications of a design in terms of a detailed list of flows from and to
nature in the following summary measures (Trusty, 2003: 6):
• Embodied primary energy consumption;
• solid waste emissions;
• global warming potential;

28
• pollutants to air;
• pollutants to water; and
• natural resource use.
These summary measures are obtained from four different life stages
which are manufacturing, construction, operations and maintenance and
building end of life. Manufacturing stage included resource extraction,
resource transportation and manufacturing of specific materials, products
or building components. The construction stage includes
product/component transportation from the point of manufacture to the
building site and on-site construction activities. The operation and
maintenance stage comprised of life cycle maintenance and replacement
activities associated with the structure and envelope components. The last
stage, end of life, simulated demolition energy and final disposition of the
materials incorporated in a building at the end of building's life
(http://www.athenasmi.ca/, last access 19.05.2007).
Definitions of the six indicators as formulated by Norris (2002) are given in
the following paragraphs.
i. Embodied primary energy consumption includes all energy, direct
and indirect, used to transform or transport raw materials into products
and buildings, including inherent energy contained in raw or feedstock
materials that were also used as common energy sources. The energy
types are determined to be electricity, hydraulic energy, LPG, diesel fuel,
natural gas, wood, coal, heavy fuel oil and feedstock fuels. This indicator
is measured in mega-joules.
ii. Solid waste is composed of recovered matter resulting from the
production and delivery (packaging) process which were bark/wood waste
(WFiber), concrete solid waste (CSW), blast furnace slag ( BFS), blast
furnace dust (BOF), steel waste. It is measured in kilograms.

29
iii. Air pollution index (API) displays the emissions to air for each air
emission type by life cycle stage inclusive of structural and envelope
effects as well as annual operating energy. It captures the pollution or
human health effects of groups of substances emitted at various life cycle
stages. Air emission types are composed of carbon monoxide (CO),
sulphur oxides (SOx), nitrogen oxides (NOx), nitrous oxides (N2O),
particulates and fumes, volatile organic compounds (VOC), methane
(CH4), phenols, acid gases, non-methane hydrocarbons (NMH), hydrogen
chloride (HCl), and metals. Air pollution is measured in grams.
iv. Water pollution index (WPI) displays the emissions to water and can
comprise of biochemical oxygen demand (BOD), suspended solids
(SusSol), dissolved solids (DisSol), polynuclear aromatic hydrocarbons
(PAH), chemical oxygen demand (COD), non-ferrous metals (NFM),
cyanide (Cyn), phenols, phosphates, ammonium, halogenated organics
(HO), chlorides (Cl), aluminum (Al), oil and grease, sulphates, sulphides,
nitrates, dissolved organic compounds, phosphorus, acids, iron and heavy
metals. It is measured in milligrams.
v. Global warming potential (GWP) is used to translate the level of
emissions of various gases into a common measure. Carbon dioxide is
considered to be the common reference standard for global warming or
greenhouse gas effects. All other greenhouse gases are referred to as
having a "CO2 equivalence effect" which is simply a multiple of the
greenhouse potential (heat trapping capability) of carbon dioxide. GWP is
measured in kilograms, while a substance's GWP depends on the time
span over which the potential is calculated. A gas which is quickly
removed from the atmosphere might initially have a large effect but for
longer time periods it becomes less important due to dissipation. 100-year
time horizon figures determined by the International Panel on Climate
30
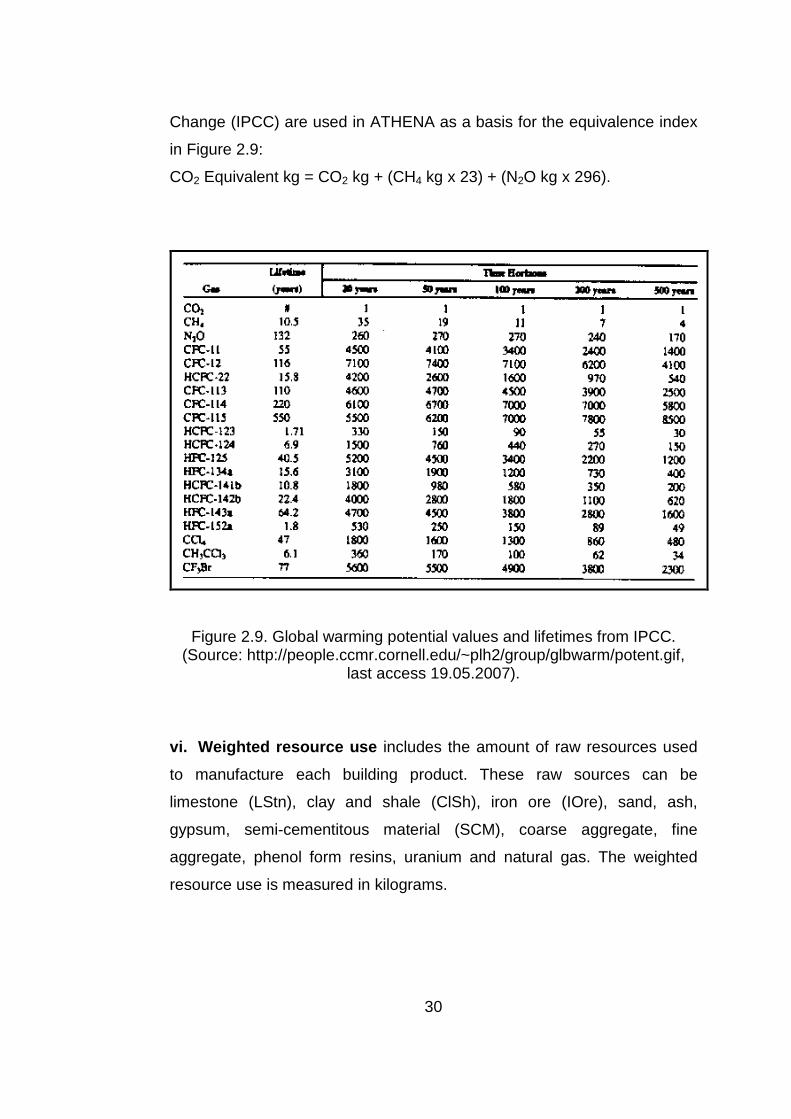
Change (IPCC) are used in ATHENA as a basis for the equivalence index
in Figure 2.9:
CO2 Equivalent kg = CO2 kg + (CH4 kg x 23) + (N2O kg x 296).
Figure 2.9. Global warming potential values and lifetimes from IPCC. (Source: http://people.ccmr.cornell.edu/~plh2/group/glbwarm/potent.gif,
last access 19.05.2007).
vi. Weighted resource use includes the amount of raw resources used
to manufacture each building product. These raw sources can be
limestone (LStn), clay and shale (ClSh), iron ore (IOre), sand, ash,
gypsum, semi-cementitous material (SCM), coarse aggregate, fine
aggregate, phenol form resins, uranium and natural gas. The weighted
resource use is measured in kilograms.
31
2.4. Service Life Prediction
Nunen et al. (2004: 1) indicated that LCA models are utilized according to
a predefined linear-life-cycle that is known as technical service life, and is
typically given in terms of raw material extraction, manufacturing, on-site
construction, operation including maintenance and end-of-life scenarios.
Making changes to buildings or rebuilding or replacements are often not
taken into account.
The concept of Reference Service Life of Component (RSLC) was firstly
introduced in ISO 15686-1 (2000), and is defined as the “service life that a
building or parts of a building would be expected or predicted to have in a
certain set of reference in-use conditions”. The objective of service life
planning is to provide reasonable assurance that the estimated service life
of a new building on a specific site, with planned maintenance, would be at
least as long as it is designed for. A designer involved in the service life
planning of a building or other constructed object is faced with the problem
of estimating the service life of each components. The reliable input about
how many replacements need to take place, and consequently the total
quantity of materials used throughout the overall service life of the building
becomes important.
Saville and Moss (2002) insists on that even if certain service life data
were available; these could rarely be used directly, because the project
specific in-use conditions, to which the components would be subjected,
were usually different from those for which the service life data were valid.
In ISO 15686-1 (2000), the “Factor Method” is described as a means for
addressing this problem. This method is used to modify a RSLC to obtain
an estimated service life of the components (ESLC) of a design object, by
taking account of the difference between the project-specific and the
reference conditions. This is carried out by adjusting the RSLC by a

32
function of a number of factors, each being from a particular factor class
and reflecting a difference between the two sets of in-use conditions in the
factor class. These factors are described in Table 2.2 below. In its simplest
form, the function is the product of the factors, as summarized below:
ESLC = RSLC * factor A* factor B * factor C * factor D * factor E * factor F * factor G
where:
A = Material / Component factor,
B = Design factor,
C = Workmanship factor,
D = Internal environment factor,
E = External environment factor,
F = In-use factor,
G = Maintenance factor.
Table 2.2: Examples of factors, relevant to building services plant.
Factor Class Examples
A Quality of components Manufacture, storage, transport, materials, protective coatings.
B Design / detailing Incorporation into the building, detailing, system design, interfaces.
C Installation / workmanship Site management, standard of workmanship, climatic conditions during installation
D Indoor environment Aggressiveness of environment, ventilation, condensation.
E Outdoor environment Location of building, micro and macro environment, sheltering, pollution levels, weathering factors.
F In-use conditions Commissioning, hours/frequency of use, mechanical impact, category of users, wear, tear.
G Maintenance Quality and frequency of inspection and maintenance, accessibility for maintenance.
(Source: Saville and Moss; 2002: 4).

33
According to ISO 15686-1 (2000), there are three kinds of end-of-life
scenarios in the building sector; namely: technical, economical, and
functional end-of-life. The reference service life of components is the
technical service life; which ends when the component can no longer
sustain its performance. The economical end-of-life occurs when another
component can be substituted with lesser costs; while the functional end-
of- life occurs, when the component fails to meet the demand of people. In
other words, the user decides that the service life of the product is over.
Figure 2.10. Different types ends-of-life scenarios. (Source: Nunen et al., 2004: 5).
Nunen et al. (2004) mention that; if functional and economical criteria are
included in the prediction of service life, “Trend” and “Related” factors
should also be added while calculating the ESLC. The “Trend” factor
34
accounts for the sensitivity to fashion trends which can decrease the
functional service life of any component due to the changing fashions.
Additionally, the “Related” factor includes two aspects: the accessibility of
a product to be replaced in combination with the replacement of
components. For example, more replacements can be made if it is
possible to do so with much more ease. The replacement of a complete
building part, like fenestration, was easier than only any component, frame
without glass.
2.5. Life Cycle Assessment of Buildings
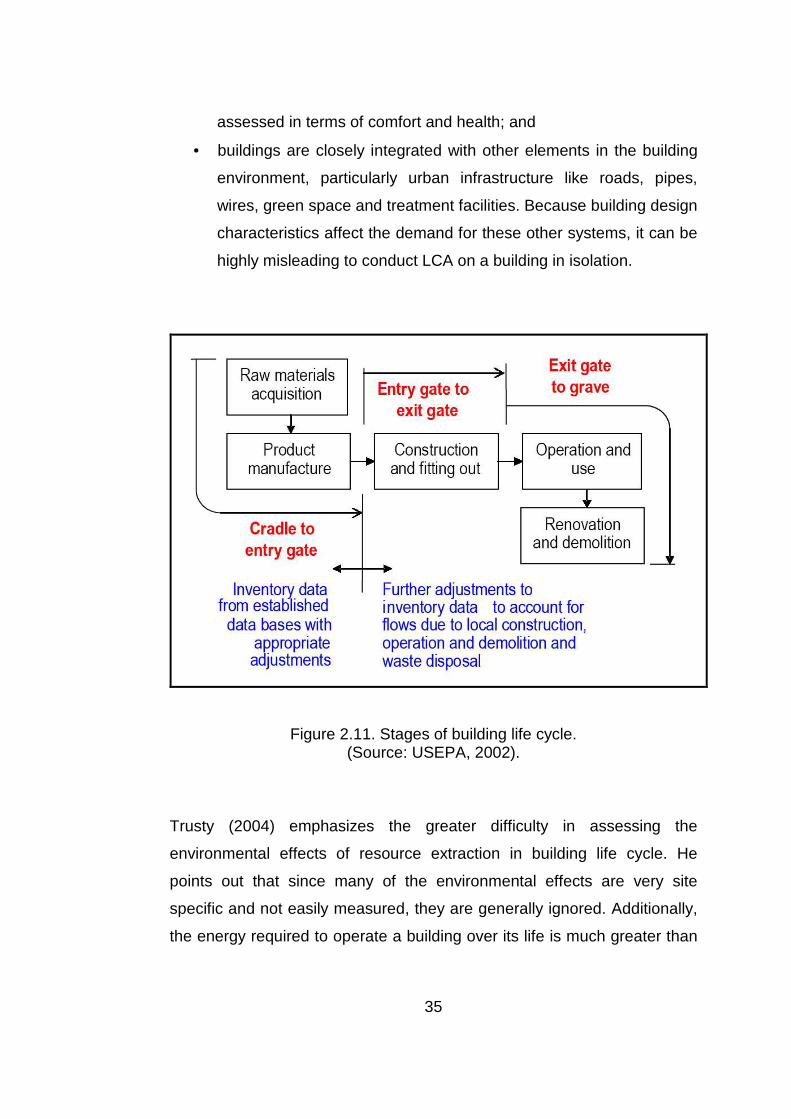
According to IEA Annex 31 (2001: 3-4), LCA methods could be directly
applied to the building sector but buildings have many characteristics that
can complicate the application of standard LCA methods. Buildings are
difficult to assess, because:
• The long and unknown life expectancy of a building can cause
imprecision. For example, predictions of environmental loadings
can not be precise because of the changing of the energy sources
or the energy efficiency;
• buildings are site specific and many of the impacts are local;
• buildings and their components are heterogeneous in their
composition, the associated product manufacturing processes can
vary greatly from one site to another;
• the building life cycle includes specific phases such as resource
extraction, construction, use and demolition (Figure 2.11). In the
use phase, the behavior of the users and of the services operators
or facilities managers have a significant influence on energy
consumption;
• a building is highly multi-functional, which makes it difficult to
choose an appropriate functional unit;
• a building creates an indoor living environment, that can be
35
assessed in terms of comfort and health; and
• buildings are closely integrated with other elements in the building
environment, particularly urban infrastructure like roads, pipes,
wires, green space and treatment facilities. Because building design
characteristics affect the demand for these other systems, it can be
highly misleading to conduct LCA on a building in isolation.
Figure 2.11. Stages of building life cycle. (Source: USEPA, 2002).
Trusty (2004) emphasizes the greater difficulty in assessing the
environmental effects of resource extraction in building life cycle. He
points out that since many of the environmental effects are very site
specific and not easily measured, they are generally ignored. Additionally,
the energy required to operate a building over its life is much greater than

36
the energy attributed to the products used in its construction. However,
other embodied effects such as toxic releases to water during the resource
extraction and manufacturing stages are greater than during building
operations.
2.5.1. Life Cycle Assessment of Renovations and Ref urbishments
Erlandsson and Levin (2005: 1460) states that, according to linear building
perspective, buildings are constructed and utilized for the intended
purpose for a defined period and finally demolished. On the other hand,
according to the building service life cycle perspective, the service life
cycle accounts for all activities that have to be performed so that all
materials in necessary amounts and qualities is available as required for
the specified service. The service then accounts for all activities related to
the predicted service life.
O’Connor (2004) determined that the service life approach allowed the
analysis of renovation and refurbishment works. Knowledge of the
probable residual life span of a building element can often be decisive for
whether it should be replaced or not. Although most building and
construction materials are expected to have service lives of several
decades, no set method is available for making reliable predictions of their
service lives. The author asserts that, the remaining life span of building
elements is an important piece of information for financially and
ecologically coherent renovation/refurbishment decisions. However, to
determine it correctly, it is necessary to take into account the current
deterioration state of the element. The remaining life span of building
elements is not only used as a decision criterion in
renovation/refurbishment scenarios but also in life cycle energy or
ecological assessments.

37
Nunen et al. (2004: 5) pointed out some irregularities that can cause
problems when performing service life calculations in the building sector,
such as:
• Premature replacement (replacing products before it is a technical
necessity);
• sequential use (replacement of (identical) products within the
overall service life of building);
• subdivision of environmental burden (regarding environmental
burden as a linear process, instead of dividing it in different
phases).
According to Flourentzou (2000), a model which could simulate the
probable development in the deterioration of all building elements can be
used to determine their probable date of replacement. Knowledge of this
development for all building elements will make it possible to assess the
global development in maintenance and refurbishment costs for the entire
building.
2.5.2. Life Cycle Assessment of Hotel Buildings
According to Dascalaki and Balaras (2004), hotels, accommodation
facilities, are unique with regard to operational schemes, the type of
services offered, as well as the resulting patterns of natural resource
consumption. Many of the services to hotel guests are highly resource
intensive, whether it concerned energy, water or raw materials. As a
consequence, hotels are characterized to have the highest negative
impact on the environment, of all commercial buildings, with the exception
of hospitals. The authors suggest that this impact can be countered by
making hotels more environmentally friendly by constructing them with
environmentally sensitive materials, which are less toxic, more durable
and stronger, made of recycled materials, or environmentally certified.
38
Such material should also have low embodied energy and be produced
and available locally, in order to avoid transport-related impacts. According
to authors, an environmentally responsible design generates a number of
benefits including considerably lower resource consumption and
operational costs, as well as improved comfort and productivity for the
occupants. Consequently, the corporate image is also improved, thereby
attracting new customers, as people came to prefer the “green”
alternative. Hotels designed according to sustainability principles are
considered to be as “sustainable hotels”.
According to Bohdanowicz (2003), the operational stage of a hotel life-
cycle is substantial, both from an economic and environmental
perspective. This phase defines the purpose of the hotel and typically lasts
for 25 to 50 years. However, with proper maintenance, regular
refurbishment and renovation the lifespan of a hotel building can be
significantly extended. Some of the currently operating hotels are located
in buildings erected centuries ago (e.g., European palace and castle
hotels).
The Carbon Trust (2005) states that the operation of a hotel is the most
resource intensive stage of the entire life-cycle. Hotels utilize large
quantities of energy, water and various consumable materials in providing
services and comfort to their guests. Furthermore, the efficiency of many
end-users in a hotel is very low, resulting in a relatively large impact, as
compared to other types of similar sized buildings. The Italian National
Agency for the Protection of the Environment and for Technical Services
(APAT, 2002) has estimated that 75% of all impacts exerted by hotel
facilities on the environment are associated with the extensive use of
resources. This has resulted in increased pressure on local utility systems
(power and water supply), sometimes leading to shortages experienced by
locals. It also contributed to the depletion of resources.

39
Bohdanowicz (2004) indicated that hotels generated large quantities of
waste and sewage, thus increasing pressure on local sewer systems and
plants, as well as landfills. Hotels are also responsible for the release of
various air pollutants, excessive use of electricity, deterioration of local air
quality, acid rain and global warming. Many of the goods purchased have
environmental effects associated with their manufacture, transportation,
use and disposal. Furthermore, a number of substances and products
used at hotel facilities are exceedingly environmentally harmful.
Chlorofluorocarbons (CFCs) still used in refrigeration and air conditioning
systems contribute to ozone depletion, and various detergents, often
released without proper treatment, contributed to eutrophication of surface
water.
According to Stipanuk and Roffman (1992: 420), a hotel is constructed to
meet the needs of a growing community and it can become the dominant
force in the market for a number of years, enjoying higher occupancies
and rates than its competitors. However, there are four phases in the
lifecycle of a hotel; during the first phase when the property is new, it is
more popular and shows a strong performance; in the second phase due
to new competition the occupancy and average daily revenue declined
over time; the market changes make occupants demand new and different
services and so during the third phase the hotel faces functional
obsolescence; finally decision has to be made to either dispose of it or
rehabilitate it to respond to current needs in the fourth phase. In Figure
2.12, these four phases are presented graphically.

40
Figure 2.12. Lifecycle of a hotel. (Source: Stipanuk and Roffman, 1992: 421).
Stipanuk and Roffman (1992: 421) classified renovations in three
categories:
• Minor renovation (6 year cycle): the scope of a minor renovation is to replace or renew the non-durable furnishings and finishes within a space without changing the space’s use or physical layout such as replacing carpets, wall coverings, drapery, and bedspreads; minor painting; and touching up the furniture.
• Major renovation (12 to 15 year cycle): the scope of a major renovation is to replace or renew all furnishings and finishes within a space, and may include extensive modifications to the use and physical layout of the space itself like replacement of all furniture, bedding, lighting, replacing floor finishing and artwork.
• Restoration (25 to 50 year cycle): the scope of a restoration is to completely gut a space and replace systems that are technically and functionally obsolete, while restoring furnishing and systems that can still be used, given current needs of the facility such as interior demolition of entire guestroom floors to reconfigure the mix of rooms and placement of bathrooms.
According to The Carbon Trust (2005), regular maintenance is crucial to
ensure the proper performance of a building and its system, as well as the
safety of the occupants. Refurbishment involves the generation of large
quantities of waste, and poses a risk involving the emission of various air
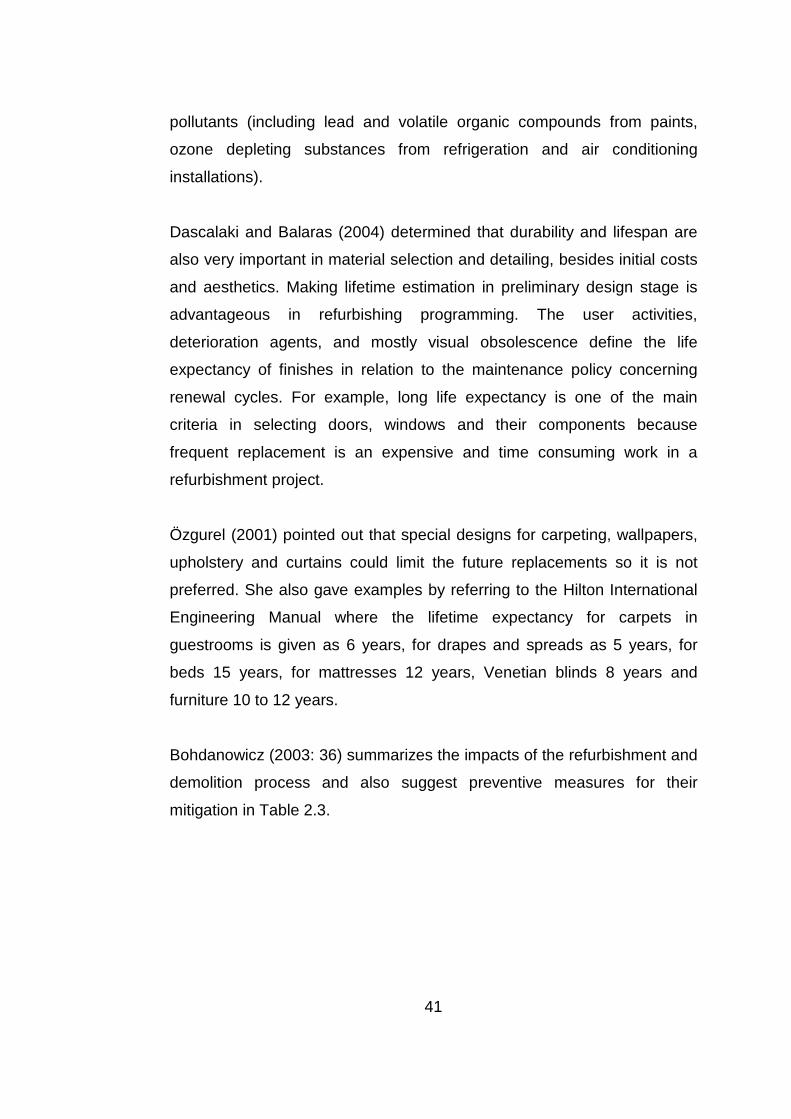
41
pollutants (including lead and volatile organic compounds from paints,
ozone depleting substances from refrigeration and air conditioning
installations).
Dascalaki and Balaras (2004) determined that durability and lifespan are
also very important in material selection and detailing, besides initial costs
and aesthetics. Making lifetime estimation in preliminary design stage is
advantageous in refurbishing programming. The user activities,
deterioration agents, and mostly visual obsolescence define the life
expectancy of finishes in relation to the maintenance policy concerning
renewal cycles. For example, long life expectancy is one of the main
criteria in selecting doors, windows and their components because
frequent replacement is an expensive and time consuming work in a
refurbishment project.
Özgurel (2001) pointed out that special designs for carpeting, wallpapers,
upholstery and curtains could limit the future replacements so it is not
preferred. She also gave examples by referring to the Hilton International
Engineering Manual where the lifetime expectancy for carpets in
guestrooms is given as 6 years, for drapes and spreads as 5 years, for
beds 15 years, for mattresses 12 years, Venetian blinds 8 years and
furniture 10 to 12 years.
Bohdanowicz (2003: 36) summarizes the impacts of the refurbishment and
demolition process and also suggest preventive measures for their
mitigation in Table 2.3.
42
Table 2.3: Possible impacts and mitigation measures at the maintenance, refurbishment and demolition stage.
Action Impact Mitigation
Refurbishment
Excessive use of resources (energy, water, materials) and associated emissions and wastes.
Consideration of resource saving measures, incorporation of controls and bioclimatic design.
Demolition of the building.
Release of dust, asbestos, emissions from lead- and organic-based paints.
Proper study of the materials used in the construction of the building. In case of possible asbestos presence skilled experts should perform the demolition and removal of asbestos.
Need for waste landfilling. Considerations for possible reuse or recycling of building materials, otherwise proper landfilling.
Reduced safety of the on-site workers and locals.
Skilled personnel aware of possible dangers. Prevention of unauthorized individuals accessing the construction site (fences, signs).
Vehicular traffic and heavy equipment operation.
Excessive use of resources (energy) and associated emissions (impaired air quality). Increased noise levels.
Good quality equipment. Limitation of engines idling. Specific working hours (e.g., 8am to 6pm on weekdays and 10am to 4pm on weekends)
Reduced safety of the on-site workers and locals.
Skilled personnel aware of possible dangers. Prevention of unauthorized individuals accessing the construction site (fences and signs).
Construction, finishing and furnishing
Decreased safety and well being of occupants due to low quality materials, equipment and furnishings, as well as construction team. Possible moisture in building structure resulting in mould growth, and impaired indoor air quality.
Construction materials and equipment should be chosen based on their life-time costs and good quality, not only initial costs (good quality products will last longer and require less maintenance in the future). Prevention of moisture inside the building materials (covering the building during construction).
(Source: Bohdanowicz, 2003: 36).

43
CHAPTER 3
3.MATERIAL AND METHOD
This chapter includes details on two aspects of the study: the research
material and methodology. The first covers four subsections; the statistical
data on renovation and refurbishment projects in Turkey; information on
three five-star hotels in Ankara; the grouped data derived from the bill of
quantities for guestroom floors of the three hotel refurbishment projects;
and the LCA software. The methodology is comprised of data compilation
process, simulation procedure and statistical tests.
3.1. Material
This study was carried out on renovation projects in Turkey; specifically,
hotel refurbishment projects in Ankara. In order to fulfill the objectives of
this study, information and data were collected from various sources,
which are explained in detail under Section 3.1.1. Also details about case
study buildings, their refurbishment works and software are given in the
following sections.
3.1.1. Statistical Data on Renovation and Refurbish ment Projects
In order to determine the volume of renovation works in Turkey, especially
in larger cities, the following data were obtained.
• The number of completed or partially completed new buildings and
additions by use of buildings according to years (Table B.1,
44
Appendix B).
• Total floor area of completed or partially completed new buildings
and additions by use of building according to years (Table B.1,
Appendix B).
• Number of buildings modified for a different use after alterations
and repairs by years and use of building (Table B.2, Appendix B).
In order to verify the volume of renovation works in the Turkish hospitality
sector, the following data were obtained:
• Data related to the number of tourism establishments in Turkey and
Ankara (Table B.3, B.4, B.5, B.6, Appendix B).
• Data related to the different types of alterations and renovation
projects approved by the Chamber of Architects in Ankara, during
the 6 year period from 2000 to 2006 (Table B.7, Appendix B).
In order to find out the types and amounts of material being replaced
during hotel refurbishment projects the BOQ of three five-star hotels were
obtained. Raw data is given in Table B.8 (Appendix B), while the derived
data is presented in Section 3.1.3.
3.1.2. Case Study Buildings
Data pertaining to refurbishment / renovation projects of the three subject
hotels in Ankara was compiled in 2005 and photographs of the refurbished
rooms were taken in 2007. Two of these hotels belong to chains of
international repute while one is a local hotel of historical importance.
Although major renovations included such public areas as the lobby,
conference and meeting rooms, ballroom, restaurants etc., only data for
guestrooms were analyzed in this study, as the design decisions for one
room is repeated many times over. The three subject hotels are described
in more detail in the following sections.

45
Hotel A belongs to an international chain which operates 2,700 hotels in
70 countries. Its construction was completed in 1986. Guestroom floors
are located on the upper 16 levels. The hotel consists of 323 standard
rooms, 26 suits and one royal suit, one entire floor with extended-stay
apartments, 51 executive rooms and other leisure and business facilities.
The architectural layout of a typical guestroom floor is presented in Figure
3.1 below.
Figure 3.1. Typical guestroom floor plan of Hotel A.
The construction of Hotel B, which is one of the 730 hotels operated by its
chain in 80 countries, was finished in 1991. This hotel has 24 floors. It
consists of 280 standard rooms, 11 smart rooms, 8 executive suits, 5
smart suits, 2 ambassadorial suits and one royal suit. The major
refurbishment in the guestrooms took place in 2002 in order to meet
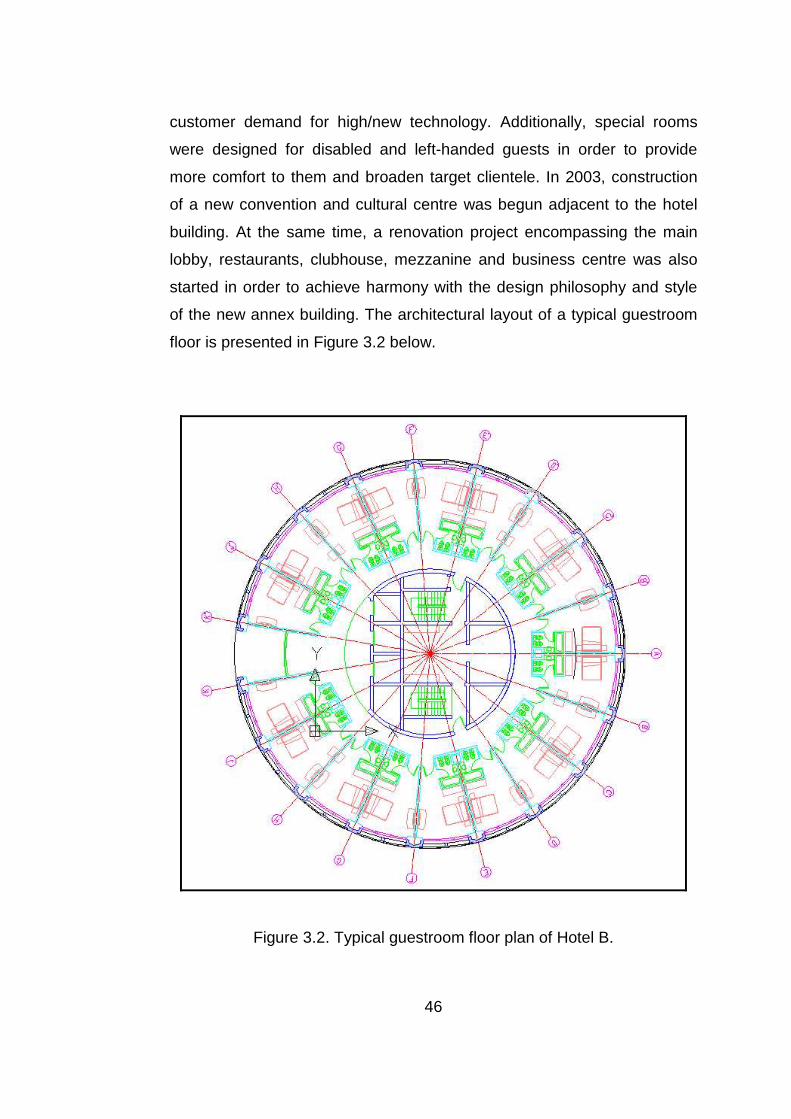
46
customer demand for high/new technology. Additionally, special rooms
were designed for disabled and left-handed guests in order to provide
more comfort to them and broaden target clientele. In 2003, construction
of a new convention and cultural centre was begun adjacent to the hotel
building. At the same time, a renovation project encompassing the main
lobby, restaurants, clubhouse, mezzanine and business centre was also
started in order to achieve harmony with the design philosophy and style
of the new annex building. The architectural layout of a typical guestroom
floor is presented in Figure 3.2 below.
Figure 3.2. Typical guestroom floor plan of Hotel B.
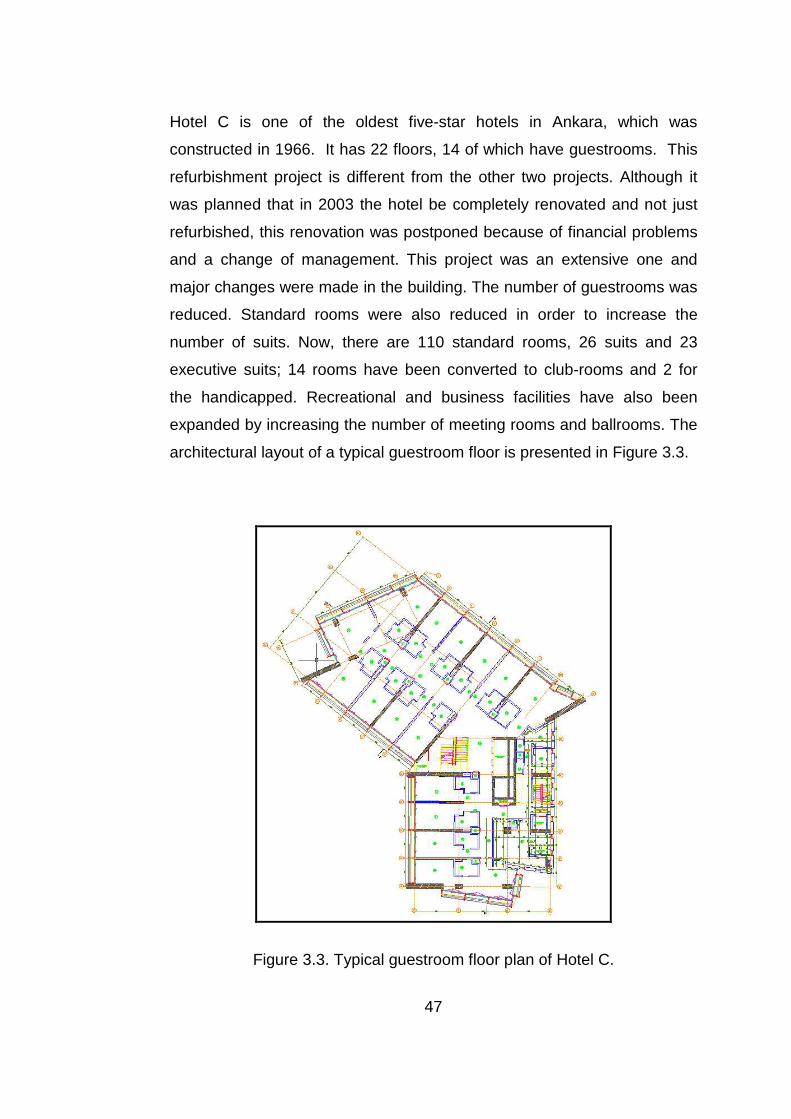
47
Hotel C is one of the oldest five-star hotels in Ankara, which was
constructed in 1966. It has 22 floors, 14 of which have guestrooms. This
refurbishment project is different from the other two projects. Although it
was planned that in 2003 the hotel be completely renovated and not just
refurbished, this renovation was postponed because of financial problems
and a change of management. This project was an extensive one and
major changes were made in the building. The number of guestrooms was
reduced. Standard rooms were also reduced in order to increase the
number of suits. Now, there are 110 standard rooms, 26 suits and 23
executive suits; 14 rooms have been converted to club-rooms and 2 for
the handicapped. Recreational and business facilities have also been
expanded by increasing the number of meeting rooms and ballrooms. The
architectural layout of a typical guestroom floor is presented in Figure 3.3.
Figure 3.3. Typical guestroom floor plan of Hotel C.
48
3.1.3. Bills of Quantities of Three Refurbishment P rojects
The grouped data for the renovation of the three hotels was gathered from
the BOQs of Hotels A, B and C. As mentioned earlier, data for only the
guestrooms and corridors on the guestroom floors has been analyzed.
More variety and amount of material was used in Hotel C as a result of the
volume of the refurbishment.
Most significant were the materials used for finishing the surfaces, such as
vinyl wall coverings, carpets and suspended ceilings. Additionally
bathroom fittings and fixtures as well as doors (with frames) have been
replaced in all the hotels. The walls were covered with embossed vinyl
wallpaper, which was replaced with new wallpaper to the tune of 20,000
square meters in Hotel A, 12,500 square meters in Hotel B and 15,000
square meters in Hotel C; most of this washable textile backed wallpaper
was imported. The number of doors replaced with new ones was also
significant; the number of new doors in Hotels A, B, and C were 720, 387,
and 490 respectively.
In Table 3.1 below, the description of renovation works are given in the
first column. These works are divided according to assembly groups such
as: demolition works, floor and ceiling finishing works, skirting and wall
finishing works, doors, windows, furniture and fixtures. The unit of wall,
floor and ceiling finishing works is square meter; doors, windows, furniture
and fixtures are listed in set. Quantities of refurbishment projects of three
subject hotels for settled works are presented separately as Hotel A, Hotel
B, and Hotel C. The quantities of some works were not determined in the
bill of materials of subject hotels; therefore it is presented as “not
quantified” in Table 3.1.
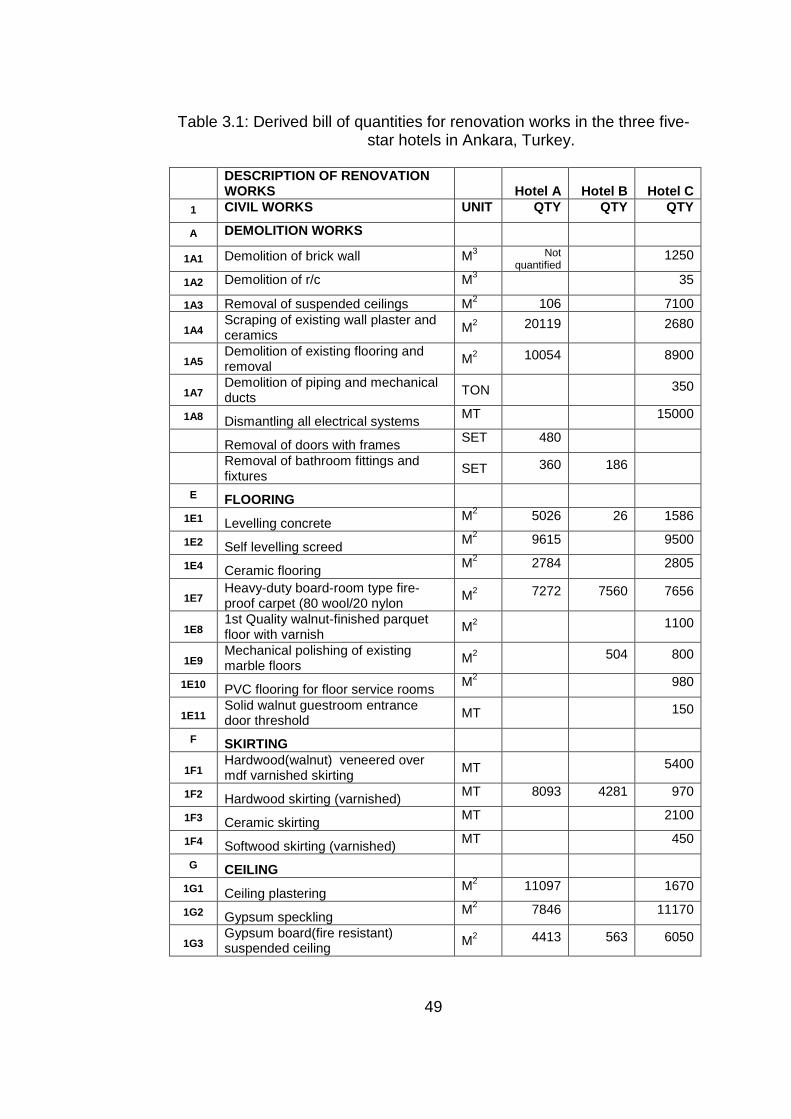
49
Table 3.1: Derived bill of quantities for renovation works in the three five-star hotels in Ankara, Turkey.
DESCRIPTION OF RENOVATION WORKS Hotel A Hotel B Hotel C
1 CIVIL WORKS UNIT QTY QTY QTY
A DEMOLITION WORKS
1A1 Demolition of brick wall M3 Not quantified
1250
1A2 Demolition of r/c M3 35
1A3 Removal of suspended ceilings M2 106 7100
1A4 Scraping of existing wall plaster and ceramics
M2 20119 2680
1A5 Demolition of existing flooring and removal
M2 10054 8900
1A7 Demolition of piping and mechanical ducts
TON 350
1A8 Dismantling all electrical systems MT 15000
Removal of doors with frames SET 480
Removal of bathroom fittings and fixtures
SET 360 186
E FLOORING
1E1 Levelling concrete M2 5026 26 1586
1E2 Self levelling screed M2 9615 9500
1E4 Ceramic flooring M2 2784 2805
1E7 Heavy-duty board-room type fire-proof carpet (80 wool/20 nylon
M2 7272 7560 7656
1E8 1st Quality walnut-finished parquet floor with varnish
M2 1100
1E9 Mechanical polishing of existing marble floors
M2 504 800
1E10 PVC flooring for floor service rooms M2 980
1E11 Solid walnut guestroom entrance door threshold MT 150
F SKIRTING
1F1 Hardwood(walnut) veneered over mdf varnished skirting
MT 5400
1F2 Hardwood skirting (varnished) MT 8093 4281 970
1F3 Ceramic skirting MT 2100
1F4 Softwood skirting (varnished) MT 450
G CEILING
1G1 Ceiling plastering M2 11097 1670
1G2 Gypsum speckling M2 7846 11170
1G3 Gypsum board(fire resistant) suspended ceiling M2 4413 563 6050
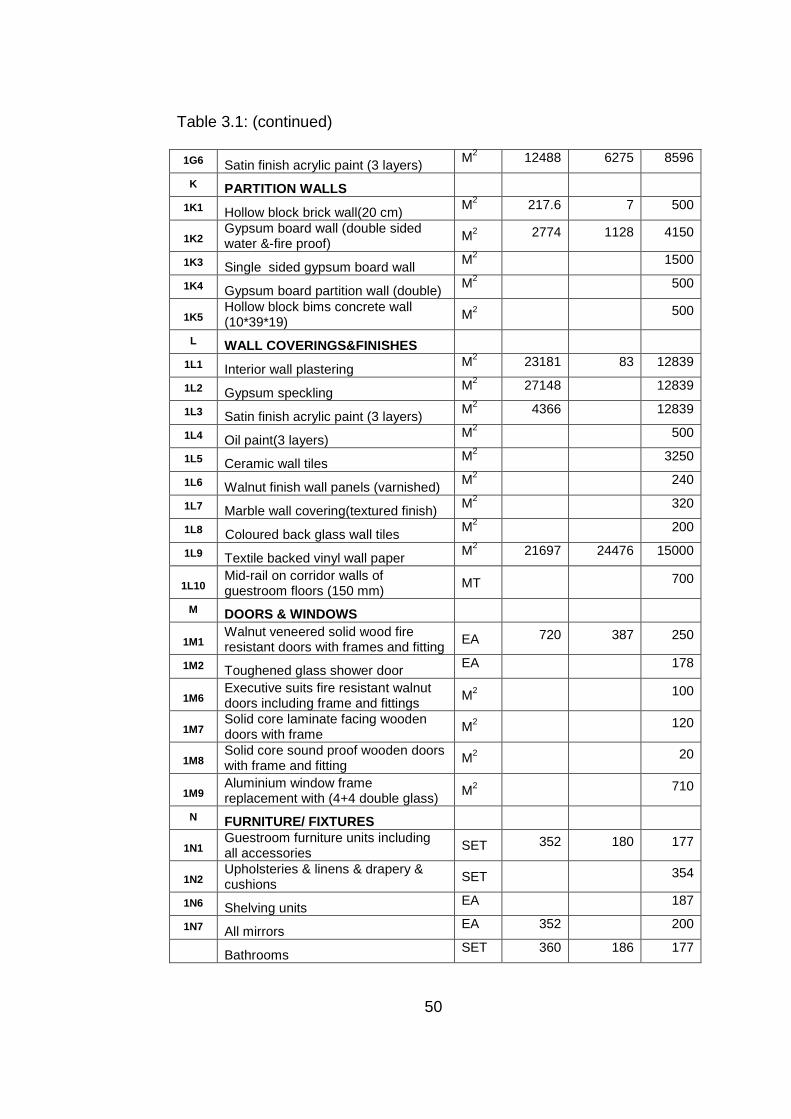
50
Table 3.1: (continued)
1G6 Satin finish acrylic paint (3 layers) M2 12488 6275 8596
K PARTITION WALLS
1K1 Hollow block brick wall(20 cm) M2 217.6 7 500
1K2 Gypsum board wall (double sided water &-fire proof)
M2 2774 1128 4150
1K3 Single sided gypsum board wall M2 1500
1K4 Gypsum board partition wall (double) M2 500
1K5 Hollow block bims concrete wall (10*39*19)
M2 500
L WALL COVERINGS&FINISHES
1L1 Interior wall plastering M2 23181 83 12839
1L2 Gypsum speckling M2 27148 12839
1L3 Satin finish acrylic paint (3 layers) M2 4366 12839
1L4 Oil paint(3 layers) M2 500
1L5 Ceramic wall tiles M2 3250
1L6 Walnut finish wall panels (varnished) M2 240
1L7 Marble wall covering(textured finish) M2 320
1L8 Coloured back glass wall tiles M2 200
1L9 Textile backed vinyl wall paper M2 21697 24476 15000
1L10 Mid-rail on corridor walls of guestroom floors (150 mm)
MT 700
M DOORS & WINDOWS
1M1 Walnut veneered solid wood fire resistant doors with frames and fitting
EA 720 387 250
1M2 Toughened glass shower door EA 178
1M6 Executive suits fire resistant walnut doors including frame and fittings
M2 100
1M7 Solid core laminate facing wooden doors with frame
M2 120
1M8 Solid core sound proof wooden doors with frame and fitting
M2 20
1M9 Aluminium window frame replacement with (4+4 double glass)
M2 710
N FURNITURE/ FIXTURES
1N1 Guestroom furniture units including all accessories
SET 352 180 177
1N2 Upholsteries & linens & drapery & cushions
SET 354
1N6 Shelving units EA 187
1N7 All mirrors EA 352 200
Bathrooms SET 360 186 177
51
3.1.4. LCA Software
To assess the environmental impacts of the materials most commonly
replaced during refurbishment projects, a life-cycle assessment software
called ATHENA® was used, which is produced by the Athena Sustainable
Materials Institute in Canada.
ATHENA® separately assesses and compares conceptual design options
for structural systems and envelope alternatives. Some general
information about the project is entered into the software, such as:
location, gross floor area, building type, and operating energy
consumption. The SI (metric) unit designation is the default unit measure
for entering assembly information, while inputs for the model can be
specified in either imperial or (SI) metric. However, the model's internal
calculations and final results are computed in metric units. The Add
Assembly menu is used to define foundations, additional walls, floors/roofs
and column and beam assemblies to complete a three-dimensional
building space. Extra basic materials may also be added to augment any
particular assembly selection.
This tool also has an operating energy conversion calculator module which
allows software users to enter their building’s annual operating energy by
fuel type; the EIE software calculates both the pre-combustion and direct
combustion emissions associated with that fuel use. These emissions can
be compared to those embodied in the materials making up the building.
ATHENA® uses European databases which include materials that are
commonly being manufactured with western technology. However, in this
program the properties of the material in the database can not be changed
or added by the users. In order to assess materials which are not found in
its database, the author had to contact the ATHENA Institute to seek

52
guidance with regards to a best match from the database for the material
in question.
3.2. Methodology
Statistical data on building types, renovation and refurbishment projects in
Turkey and specifically that on hotels were obtained from TURKSTAT and
Ministry of Tourism, in order to present the volume of the refurbishment
works and to assess the importance of renovation/refurbishment projects
in Turkey. Statistics on renovation/refurbishment projects in Ankara were
obtained from the Ankara Chamber of Architects as the municipalities in
Ankara did not have this kind of database. These data were used to
analyze the volume of these works in Ankara between 2000 and 2006.
After comparing them, it was found that approximately 53% of hotels were
refurbished in Ankara in 6 years.
Generally speaking, initiating a refurbishment project mainly depends on
the financial situation of the building owners/management. On the other
hand, refurbishment is an obligatory requirement for the success of the
hospitality sector. However, in contrast to touristic cities where financial
concerns are of prime importance; hotels in a capital city, especially those
belonging to an international chain, are seen as a prestige symbol. Also
there is a stipulation for all hotels belonging to a particular international
chain to refurbish between definite intervals determined in the
agreements. From this point of view, Ankara was chosen as the location;
hotels were chosen as the building type whose service life does not
depend on its physical condition; and five-star hotels that belong to
international chain were chosen as the hotel type for which the
refurbishment is inevitable.

53
In accordance with the concerns mentioned above, three five-star hotels in
Ankara, belonging to international chains were chosen as case studies for
this investigation. The architectural design projects, the BOQ for the
renovation/refurbishment projects and data on their operating-energy
consumption were obtained from the management of these hotels and
photographs of refurbished rooms were taken in March 2007.
Furthermore, the management was also interviewed informally to gather
information on the frequency of and reasons for these renovations.
The contents of the refurbishment projects and the stages in their life cycle
were assessed with the LCA tool, ATHENA. The inventory analysis was
made according to their bill of quantities for renovation projects. From their
bill of quantities, data related to refurbishments of only the guestrooms are
obtained since refurbishments in other common spaces were different for
each of these hotels. (Some of them are more extensive than the others).
The waste produced during renovations and its recycling capacity should
also be considered. However, this stage was generally ignored and only a
few parts were reused or recycled.
The methodology adapted for this investigation is summarized in Figure
3.4. In order to fulfill the objectives of methodology of this investigation,
the bill of materials of refurbishment works of three subject hotels are
compiled and its process is stated in Section 3.2.1. The simulation of
refurbishment works is given in Section 3.2.2. Also included are the
simulation procedure, the phases of this LCA study and interpretations of
six environmental impact indicators according to international standards.
Finally, the hypotheses were formulated according to data generated from
software and listed in Section 3.2.3.
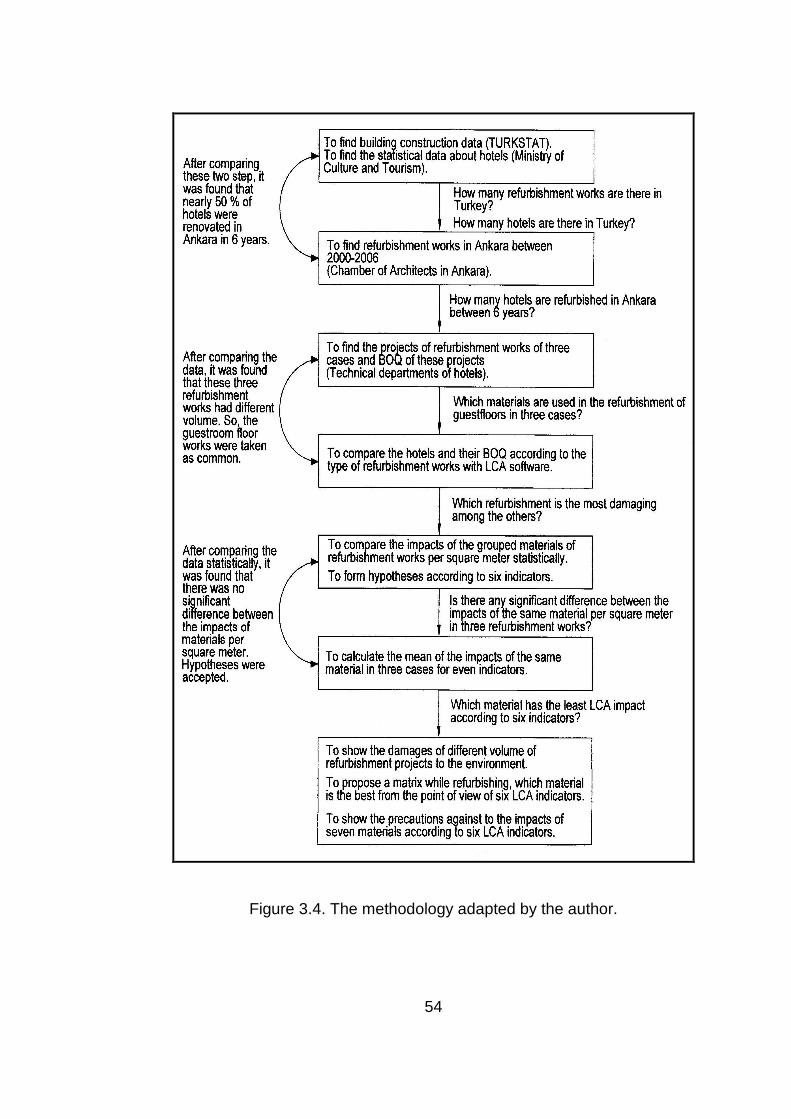
54
Figure 3.4. The methodology adapted by the author.

55
3.2.1. Data Compilation Process
First of all, the bill of materials of refurbishment projects of hotel buildings
are confidential files so the author is very grateful to the technical
management of these hotels. Data pertaining to refurbishment/renovation
projects of the three abovementioned five star hotels in Ankara was
gathered in 2005.
After grouping these data, they were classified as guestroom floors and
general spaces. In these data, there are structural materials and also the
finishing materials. In the computer program, the structural materials can
be assessed but fixtures like bathtubs, closets and beds can not be
assessed. Data for only guestrooms and corridors on the guestroom floors
has been analyzed and only those materials that were used in the
refurbishment projects of all the three hotels were chosen for the analyses.
These common materials were levelling concrete, brick, stucco, gypsum
board, wallpaper, hardwood (skirting) and paint.
It should be noted that in Hotel C the rooms were converted to suits and
more changes in the designs were made compared to Hotels A and B;
therefore, the variety and amount of material were more than the other two
hotels, seen in Table 3.1.
3.2.2. Simulation
This study consists of three different refurbishment projects. The hotels
are assessed one by one and then they are compared with each other.
The assessment procedure for Hotel A is explained as an example.
According to the phases of an LCA study, the first phase is goal and scope
definition as mentioned before. In scope, this case study estimates the life
cycle environmental impacts of material manufacturing, maintenance,
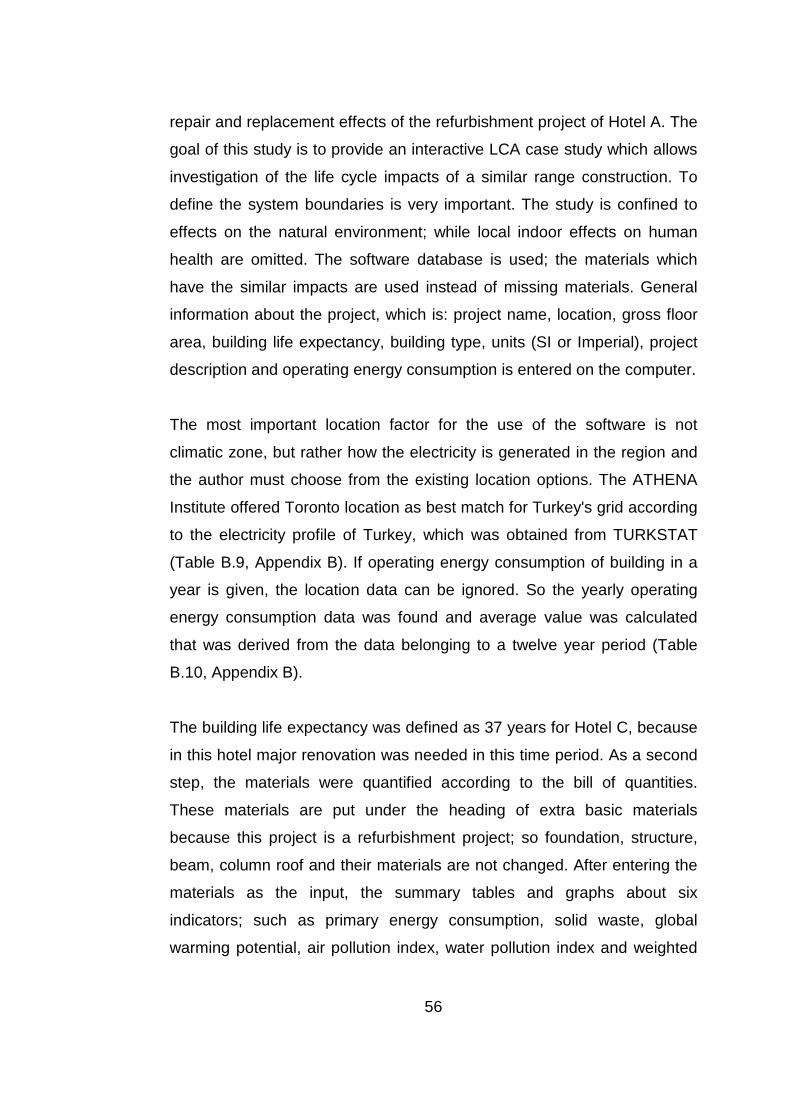
56
repair and replacement effects of the refurbishment project of Hotel A. The
goal of this study is to provide an interactive LCA case study which allows
investigation of the life cycle impacts of a similar range construction. To
define the system boundaries is very important. The study is confined to
effects on the natural environment; while local indoor effects on human
health are omitted. The software database is used; the materials which
have the similar impacts are used instead of missing materials. General
information about the project, which is: project name, location, gross floor
area, building life expectancy, building type, units (SI or Imperial), project
description and operating energy consumption is entered on the computer.
The most important location factor for the use of the software is not
climatic zone, but rather how the electricity is generated in the region and
the author must choose from the existing location options. The ATHENA
Institute offered Toronto location as best match for Turkey's grid according
to the electricity profile of Turkey, which was obtained from TURKSTAT
(Table B.9, Appendix B). If operating energy consumption of building in a
year is given, the location data can be ignored. So the yearly operating
energy consumption data was found and average value was calculated
that was derived from the data belonging to a twelve year period (Table
B.10, Appendix B).
The building life expectancy was defined as 37 years for Hotel C, because
in this hotel major renovation was needed in this time period. As a second
step, the materials were quantified according to the bill of quantities.
These materials are put under the heading of extra basic materials
because this project is a refurbishment project; so foundation, structure,
beam, column roof and their materials are not changed. After entering the
materials as the input, the summary tables and graphs about six
indicators; such as primary energy consumption, solid waste, global
warming potential, air pollution index, water pollution index and weighted

57
resource use; are obtained as the output. Accordingly, this project can be
evaluated on the basis of these graphs and tables.
The limit conditions and specific benchmarks of these six environmental
impact indicators can not be found, and also the found values can not be
correlated with the software summary measures. So the found
international standards can be used and a comparison between all case
studies will be more illustrative to the readers.
For solid waste indicator, the limit value is generally measured in
ton/person and this limit was 1.35 ton/person in Turkey (TURKSTAT). For
water pollution, the ranges of index values could be categorized as follows
in EPA standards:
very small, 0 - 0.20 small, 0.21 - 0.40 medium, 0.41 - 0.60 high, 0.61 - 0.80 very high, 0.81 - 1.00.
However, the results of the software about water pollution could not be
correlated with these values. For air pollution index, it is developed in
easily understood ranges of values, instead of using the actual
concentrations of air pollutants, as a means for reporting the quality of air
or level of air pollution. To reflect the status of the air quality and its effects
on human health, the ranges of index values should be categorized. For
Turkey, there was not an index like this. Only the amount of special gases
such as sulphur oxide was determined seen in Table B.11, Appendix B
(TURKSTAT). But the results of this software about air pollution could not
be correlated with these values for Turkey. So the EPA standards were
used to assess the materials. The corresponding pollutant concentrations
and API value according to EPA is given in Table 3.2, and the API values
regards to the effects to human health are also given in Table 3.3.
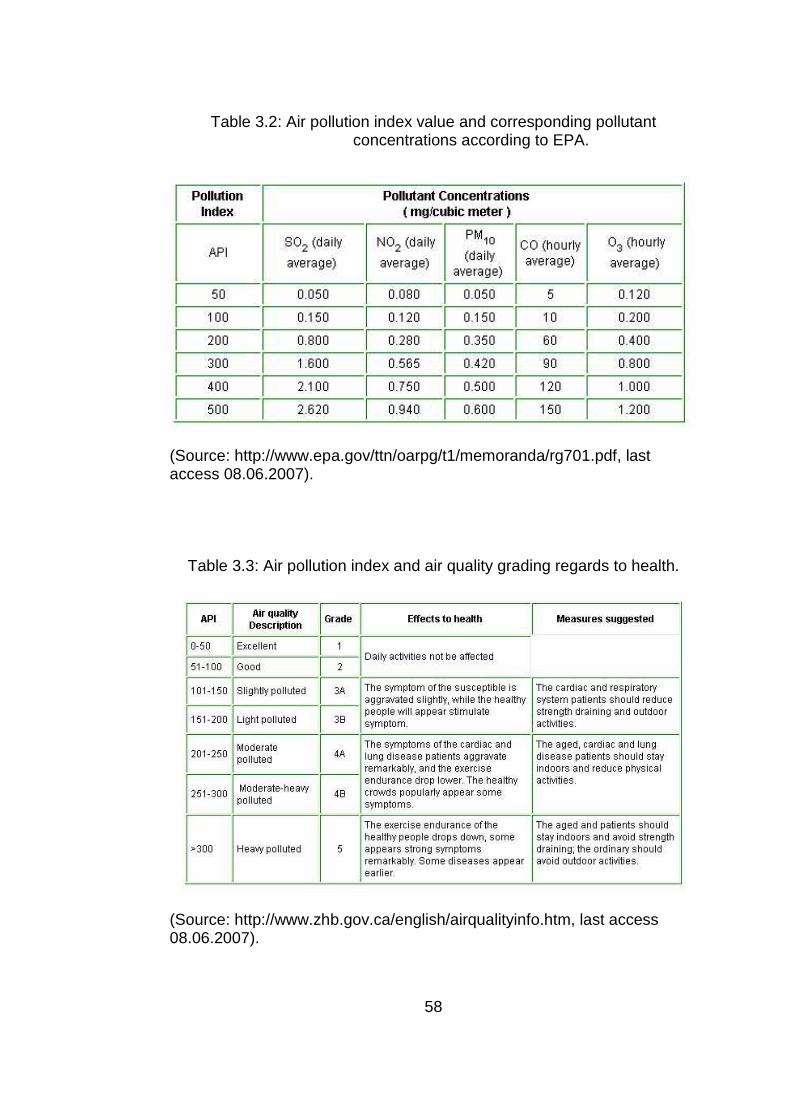
58
Table 3.2: Air pollution index value and corresponding pollutant concentrations according to EPA.
(Source: http://www.epa.gov/ttn/oarpg/t1/memoranda/rg701.pdf, last access 08.06.2007).
Table 3.3: Air pollution index and air quality grading regards to health.
(Source: http://www.zhb.gov.ca/english/airqualityinfo.htm, last access 08.06.2007).
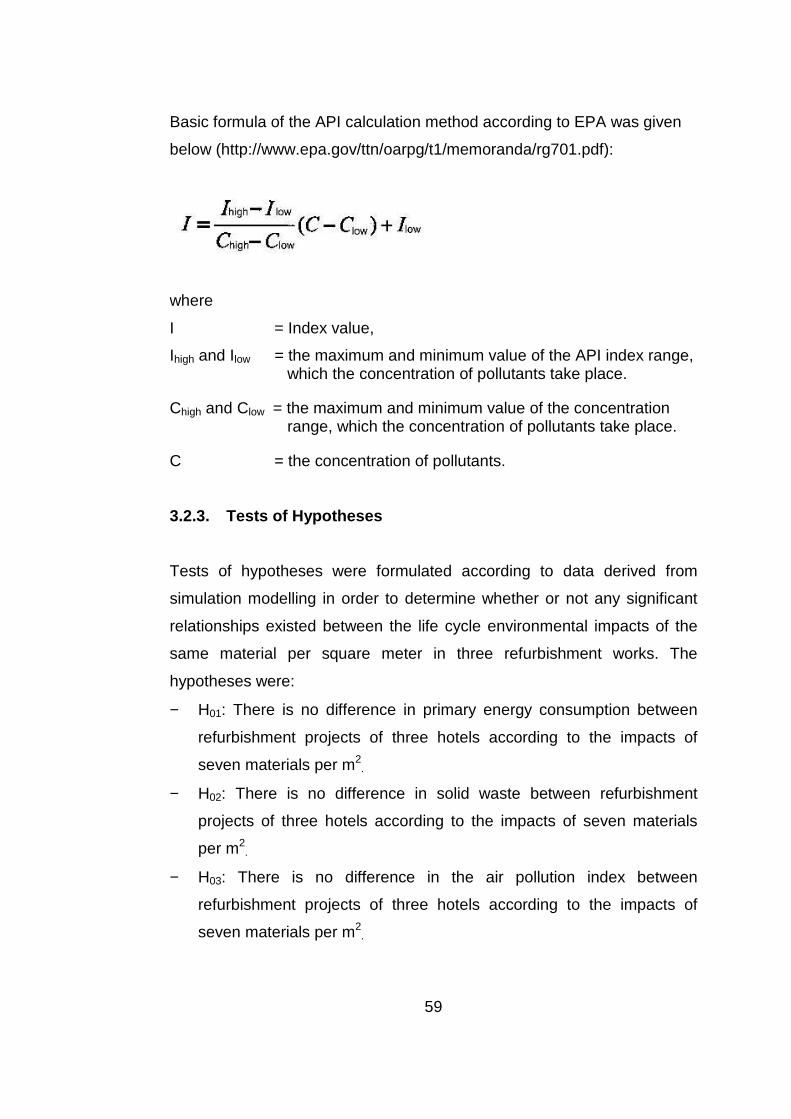
59
Basic formula of the API calculation method according to EPA was given
below (http://www.epa.gov/ttn/oarpg/t1/memoranda/rg701.pdf):
where
I = Index value,
Ihigh and Ilow = the maximum and minimum value of the API index range, which the concentration of pollutants take place.
Chigh and Clow = the maximum and minimum value of the concentration range, which the concentration of pollutants take place.
C = the concentration of pollutants.
3.2.3. Tests of Hypotheses
Tests of hypotheses were formulated according to data derived from
simulation modelling in order to determine whether or not any significant
relationships existed between the life cycle environmental impacts of the
same material per square meter in three refurbishment works. The
hypotheses were:
− H01: There is no difference in primary energy consumption between
refurbishment projects of three hotels according to the impacts of
seven materials per m2.
− H02: There is no difference in solid waste between refurbishment
projects of three hotels according to the impacts of seven materials
per m2.
− H03: There is no difference in the air pollution index between
refurbishment projects of three hotels according to the impacts of
seven materials per m2.

60
− H04: There is no difference in water pollution index between
refurbishment projects of three hotels according to the impacts of
seven materials per m2.
− H05: There is no difference in global warming potential between
refurbishment projects of three hotels according to the impacts of
seven materials per m2.
− H06: There is no difference in weighted resource use between
refurbishment projects of three hotels according to the impacts of
seven materials per m2.
The paired-sample t-test was used to analyze the refurbishment works of
subject hotels. Three pairs from three hotels were formed such as: Hotel B
- Hotel A, Hotel B - Hotel C, and Hotel A – Hotel C. 5 % level of
significance (α=0,05) was prescribed. These analyses were done using
SPSS 11® software for Windows®, wherefrom significance is established
on the basis of p-value outputs.
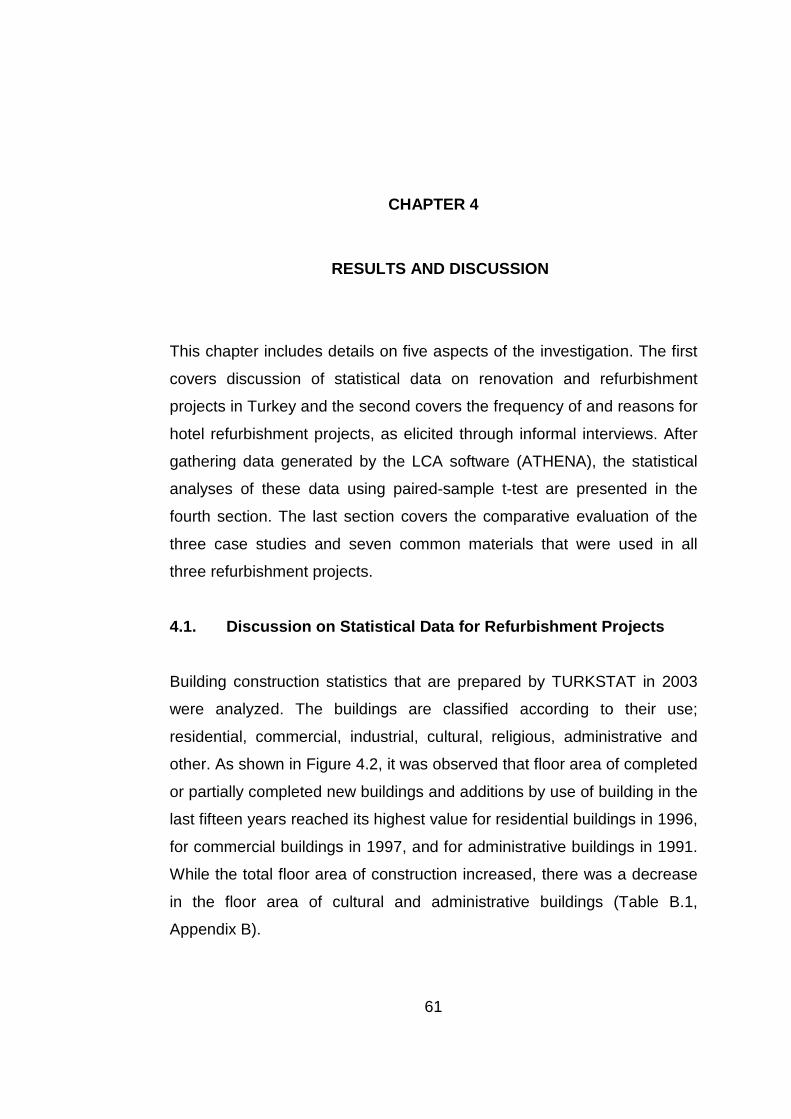
61
CHAPTER 4
4.RESULTS AND DISCUSSION
This chapter includes details on five aspects of the investigation. The first
covers discussion of statistical data on renovation and refurbishment
projects in Turkey and the second covers the frequency of and reasons for
hotel refurbishment projects, as elicited through informal interviews. After
gathering data generated by the LCA software (ATHENA), the statistical
analyses of these data using paired-sample t-test are presented in the
fourth section. The last section covers the comparative evaluation of the
three case studies and seven common materials that were used in all
three refurbishment projects.
4.1. Discussion on Statistical Data for Refurbishme nt Projects
Building construction statistics that are prepared by TURKSTAT in 2003
were analyzed. The buildings are classified according to their use;
residential, commercial, industrial, cultural, religious, administrative and
other. As shown in Figure 4.2, it was observed that floor area of completed
or partially completed new buildings and additions by use of building in the
last fifteen years reached its highest value for residential buildings in 1996,
for commercial buildings in 1997, and for administrative buildings in 1991.
While the total floor area of construction increased, there was a decrease
in the floor area of cultural and administrative buildings (Table B.1,
Appendix B).
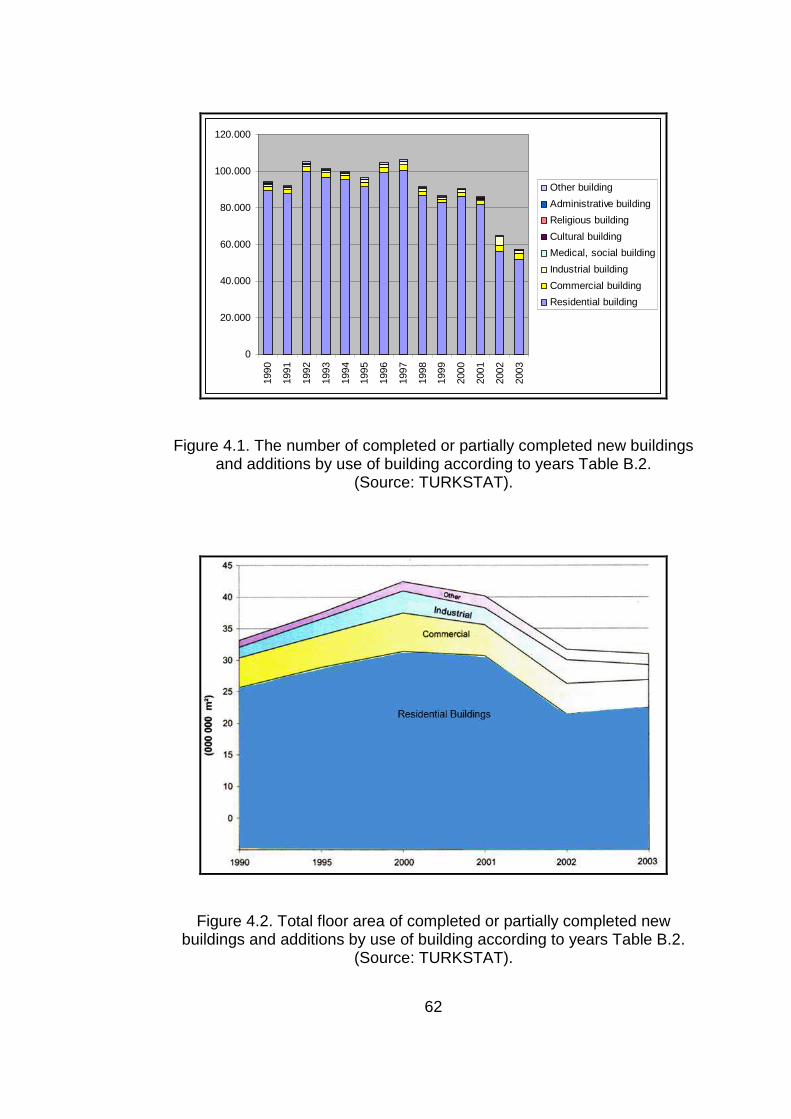
62
0
20.000
40.000
60.000
80.000
100.000
120.000
1990
1991
1992
1993
1994
1995
1996
1997
1998
1999
2000
2001
2002
2003
Other building
Administrative building
Religious building
Cultural building
Medical, social building
Industrial building
Commercial building
Residential building
Figure 4.1. The number of completed or partially completed new buildings and additions by use of building according to years Table B.2.
(Source: TURKSTAT).
Figure 4.2. Total floor area of completed or partially completed new buildings and additions by use of building according to years Table B.2.
(Source: TURKSTAT).
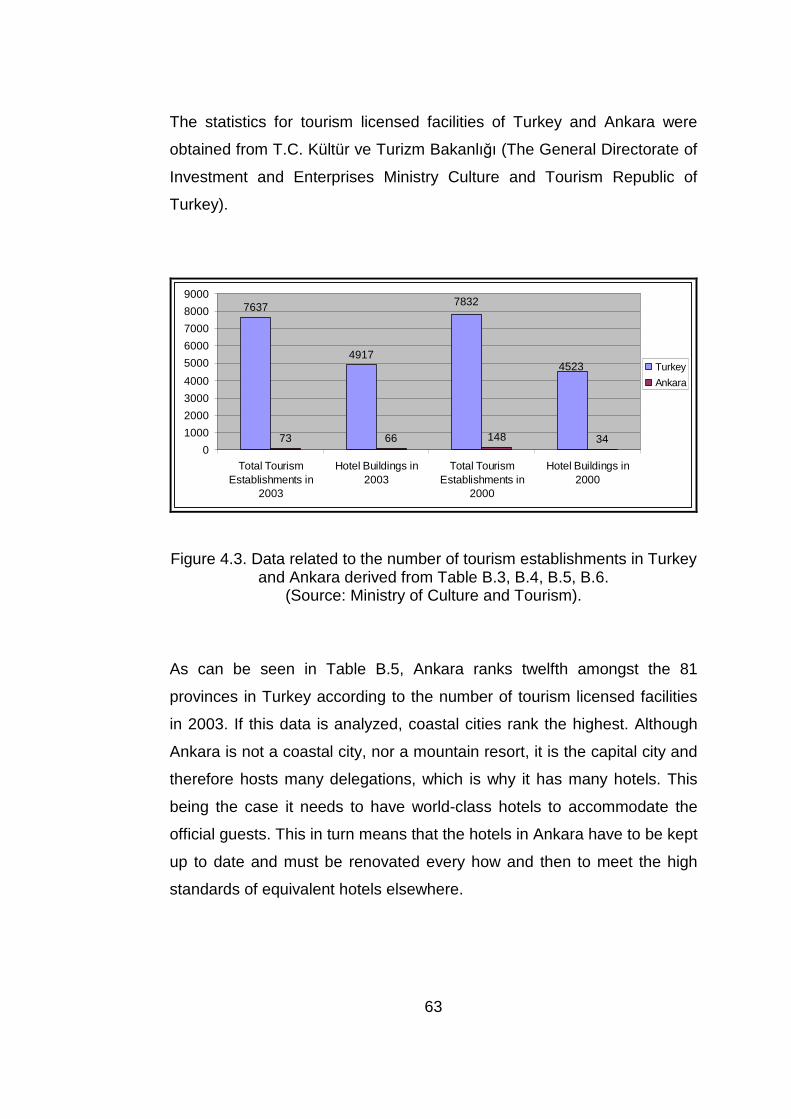
63
The statistics for tourism licensed facilities of Turkey and Ankara were
obtained from T.C. Kültür ve Turizm Bakanlığı (The General Directorate of
Investment and Enterprises Ministry Culture and Tourism Republic of
Turkey).
7637
4917
73 66 148 34
7832
4523
0
1000
2000
3000
4000
5000
6000
7000
8000
9000
Total TourismEstablishments in
2003
Hotel Buildings in2003
Total TourismEstablishments in
2000
Hotel Buildings in2000
Turkey
Ankara
Figure 4.3. Data related to the number of tourism establishments in Turkey and Ankara derived from Table B.3, B.4, B.5, B.6.
(Source: Ministry of Culture and Tourism).
As can be seen in Table B.5, Ankara ranks twelfth amongst the 81
provinces in Turkey according to the number of tourism licensed facilities
in 2003. If this data is analyzed, coastal cities rank the highest. Although
Ankara is not a coastal city, nor a mountain resort, it is the capital city and
therefore hosts many delegations, which is why it has many hotels. This
being the case it needs to have world-class hotels to accommodate the
official guests. This in turn means that the hotels in Ankara have to be kept
up to date and must be renovated every how and then to meet the high
standards of equivalent hotels elsewhere.
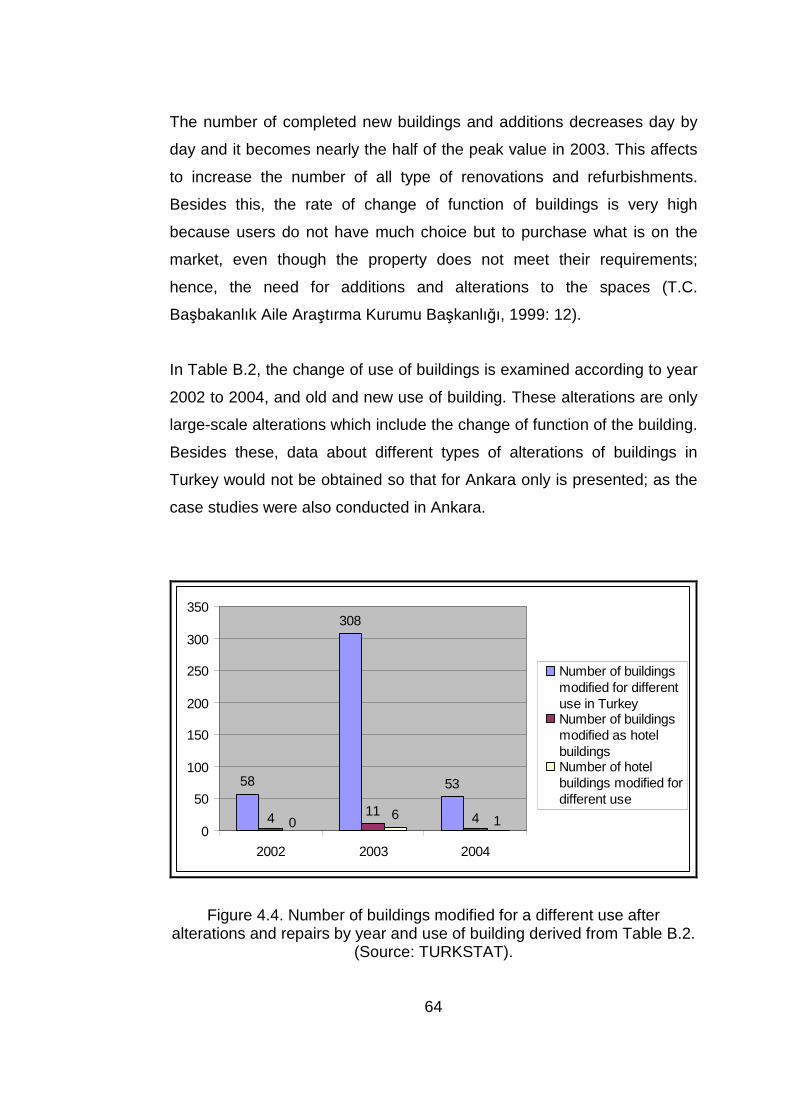
64
The number of completed new buildings and additions decreases day by
day and it becomes nearly the half of the peak value in 2003. This affects
to increase the number of all type of renovations and refurbishments.
Besides this, the rate of change of function of buildings is very high
because users do not have much choice but to purchase what is on the
market, even though the property does not meet their requirements;
hence, the need for additions and alterations to the spaces (T.C.
Başbakanlık Aile Araştırma Kurumu Başkanlığı, 1999: 12).
In Table B.2, the change of use of buildings is examined according to year
2002 to 2004, and old and new use of building. These alterations are only
large-scale alterations which include the change of function of the building.
Besides these, data about different types of alterations of buildings in
Turkey would not be obtained so that for Ankara only is presented; as the
case studies were also conducted in Ankara.
58
308
53
11 6 44 100
50
100
150
200
250
300
350
2002 2003 2004
Number of buildingsmodified for differentuse in TurkeyNumber of buildingsmodified as hotelbuildingsNumber of hotelbuildings modified fordifferent use
Figure 4.4. Number of buildings modified for a different use after
alterations and repairs by year and use of building derived from Table B.2. (Source: TURKSTAT).
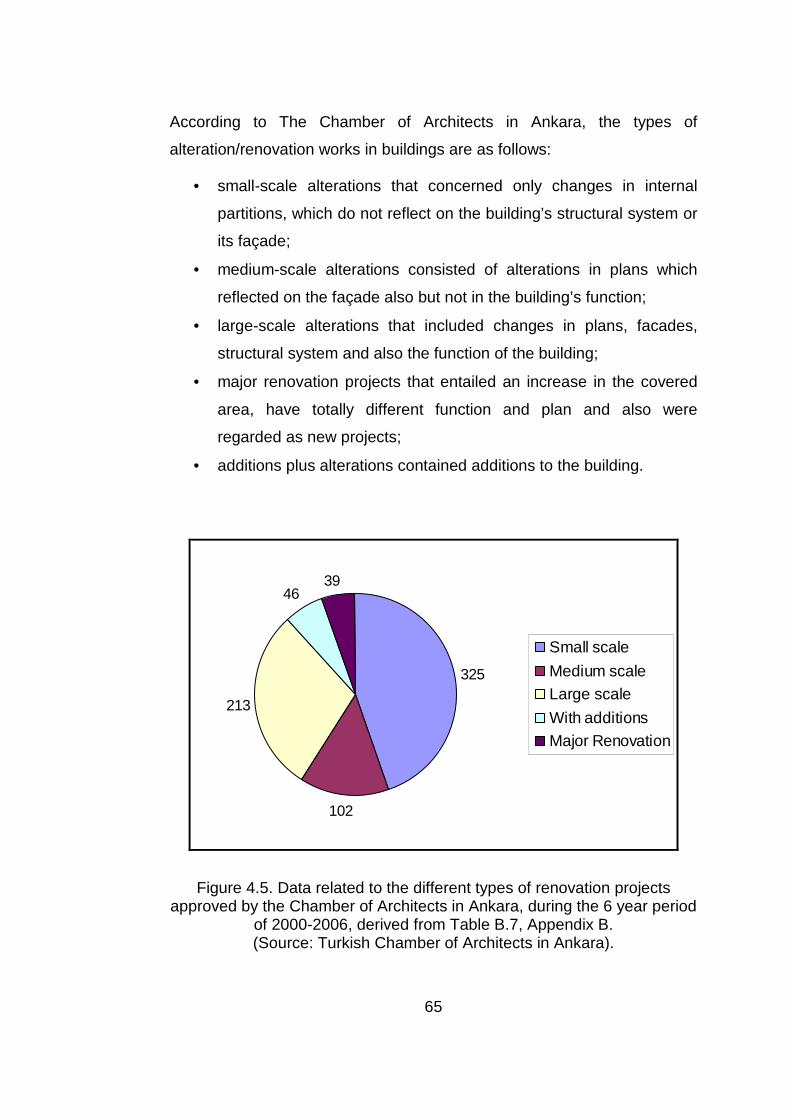
65
According to The Chamber of Architects in Ankara, the types of
alteration/renovation works in buildings are as follows:
• small-scale alterations that concerned only changes in internal
partitions, which do not reflect on the building’s structural system or
its façade;
• medium-scale alterations consisted of alterations in plans which
reflected on the façade also but not in the building’s function;
• large-scale alterations that included changes in plans, facades,
structural system and also the function of the building;
• major renovation projects that entailed an increase in the covered
area, have totally different function and plan and also were
regarded as new projects;
• additions plus alterations contained additions to the building.
325
102
213
4639
Small scale
Medium scaleLarge scale
With additionsMajor Renovation
Figure 4.5. Data related to the different types of renovation projects
approved by the Chamber of Architects in Ankara, during the 6 year period of 2000-2006, derived from Table B.7, Appendix B. (Source: Turkish Chamber of Architects in Ankara).

66
According to data taken from Ankara Chamber of Architects, 18 out of 725
projects i.e. approximately 2.5 % belong to hotels in Ankara, between
2000 and 2006. If we compare this number with the total number of hotels
in Ankara in the year 2000 (Figure 4.3), which was 34 only, the percentage
of hotels renovated in the six year period is almost 53%.
4.2. Frequency of and Reasons for Hotel Refurbishme nt Projects
Renovation of guestrooms, bathrooms and common/entertainment areas
was mostly done to keep up with new fashion dictates on style and color-
schemes. Meanwhile, major renovation of rooms took place also because
there was a need to provide extra and different facilities to the guests. For
example, to keep up with new technologies, the electrical wiring system
had to be replaced in order to provide high-speed internet connection,
data-port, satellite TV, fax machine, conference call availability
photocopy/printer machines, as well as plugs suitable for both 110 & 220
V. Rooms for left-handed guests required replacement of all fixtures;
whereas, rooms for the disabled had to be equipped with special features
and fixtures. In view of the market demand some rooms were combined to
make extra suits and some were converted into special guest rooms for
non-smokers, disabled or left-handed guests, while some were knocked
down and the space was used to build self-contained apartments for
extended stay. Apart from guestrooms, major renovation works included
the creation of theme restaurants and bars, hi-tech conference and
meeting rooms.
Informal interviews were conducted with the technical managers of hotels
and the general manager of construction company of Hotel B to determine
the frequency of and reasons for hotel refurbishment projects, and to
understand the necessity for such projects.

67
Figure 4.6. Typical standard suit of Hotel A after refurbishment.
Figure 4.7. Typical standard room of Hotel A before refurbishment. (Source: Ozgurel, 2001: 85).
Figure 4.8. Typical standard room of Hotel A after refurbishment.
68
Renovation works in hotels were undertaken mostly from the point of view
of customer satisfaction. The guests were asked to fill up a questionnaire
to assess their satisfaction. Some of the questions were posed to
determine those aspects which impressed the guests most. The aim was
also to find out whether the guests were bored with the decor or not.
Unless there was a sudden change in fashion trends, this was one of the
reasons of refurbishment.
According to Mr. Çalışkan who was the technical manager of Hotel A, their
main environmental issues were energy, waste and raw materials and
purchasing efficiency; and these issues were their main concern in their
refurbishment projects. According to their refurbishment program, the
guestroom floors of this hotel have to be refurbished every ten years and
the general spaces must be refurbished every twelve years. This is a
stipulation for all hotels belonging to this particular international chain. The
franchising and management agreement for Hotel B was similar to that. Mr
Birkan, the general manager of the construction company of Hotel B, gave
an example from Istanbul where a hotel was excluded from their
international chain because of non-compliance with the agreement
concerning refurbishment periods.
On the other hand, Mr. Birkan added that besides the agreement, the
refurbishment decision depended on their board of directors, their financial
situation and prevailing fashions. The hotels, especially in Ankara, were a
prestige symbol for the directors and being seen as up-to-date and
luxurious was more important for them than being feasible.
The budget of the hotels was planned for one-year and five-year periods.
According to Mr Birkan, 4% of the annual budget of Hotel B was assigned
to all types of refurbishments apart from the day-to-day maintenance. An
example of the budget is given in Table C.1, Appendix C. The

69
refurbishment activities are divided into hard and soft refurbishments. In
soft refurbishment, the materials such as carpets, curtains, fabrics, and
cladding were replaced and marble and wood surfaces are polished. In
hard refurbishment, replacement of the wall and floor materials; wallpaper,
gypsum boards, suspended ceilings, partition walls, bathroom walls, etc. is
undertaken. The period of soft refurbishment was generally fixed for every
3 to 4 years; while hard refurbishment was undertaken every 8 to 10
years, according to their budget.
According to Mr, Yasav, who was the technical manager of Hotel B, Hotel
B had an extension built in 2006, comprising of a convention and cultural
centre and above them the guestroom floors. Because of this, the existing
ballroom, whole lobby and the theme-restaurants and bars were
refurbished in order to have the same design theme as that of the new
annex building. Also, the guestroom floor refurbishment mostly depended
on this extension in order not to be labeled as old.
Mr. Çalışkan stated that, the refurbishment of guestroom floors of Hotel A
was started in 2002 and finished at the end of 2004. The guestroom floors
were divided into four sections. The rooms were decorated in light colors
to offer a comfortable and spacious working environment. Ash veneered
chip-board panels were disassembled and gypsum-board panels were
used for the suspended ceiling. Vinyl wallpaper on walls was renewed and
timber beading used as wall trimming. Also, the wooden pelmets were
disassembled and replaced with gypsum pelmets. There were light-
colored marble tiles and vanity basin with matching faucet fittings in the
bathroom of the guestrooms before refurbishment. Although these fittings
and fixtures were in good condition, they were replaced with darker new
marble cladding and fittings only because of the changing fashion trends;
as seen below in Figure 4.9 and Figure 4.10.
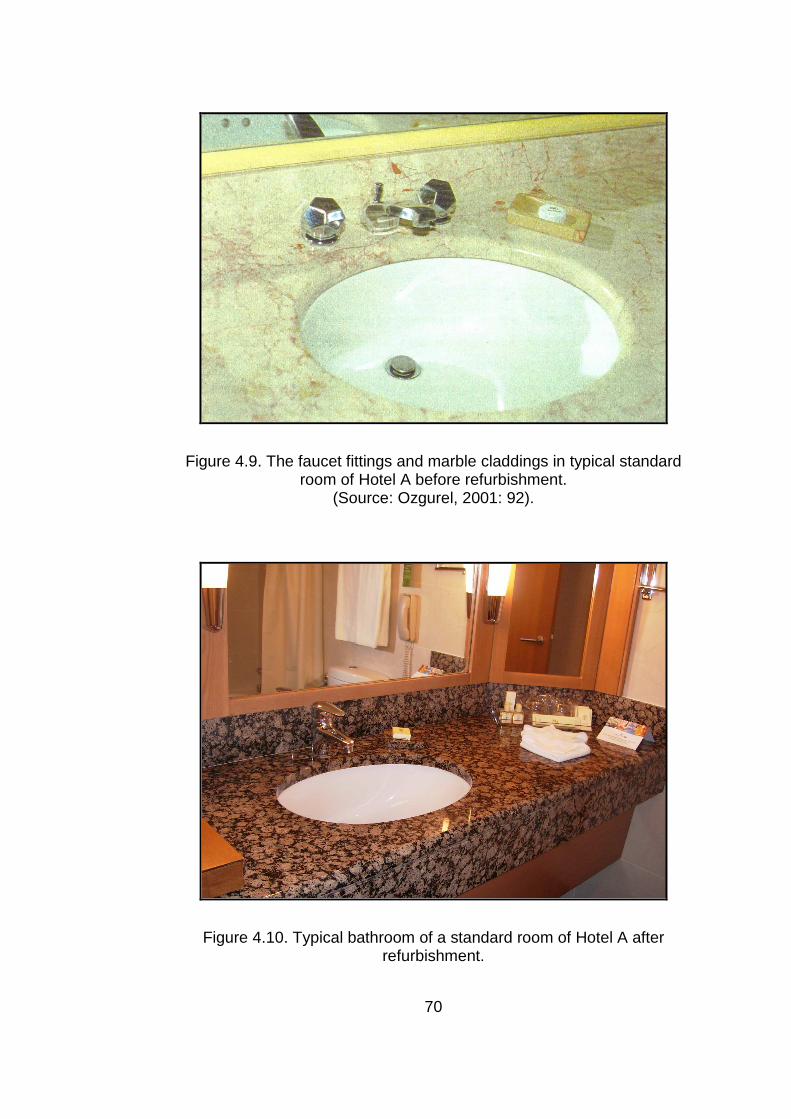
70
Figure 4.9. The faucet fittings and marble claddings in typical standard room of Hotel A before refurbishment.
(Source: Ozgurel, 2001: 92).
Figure 4.10. Typical bathroom of a standard room of Hotel A after refurbishment.

71
The technical managers of these hotels said that the furniture should be
utilized as much as possible. The management generally has agreements
with suppliers of electronic equipment and electrical parts to replace old
equipment with new ones. In Hotel A, the room furniture, such as
discarded beds, was donated to Çocuk Esirgeme Kurumu (child protection
agency) and Huzurevi (old people’s home). In this refurbishment, all the
locks were changed and electronic door locks were installed. The old locks
were sent to be used in another 3 star hotel near the airport in Ankara. In
Hotel B, the beds and room furniture were sold to their personnel by
private auction. On the other hand, the faucet fittings and marble claddings
could not be utilized so they were either scrapped or auctioned.
4.3. Data Generated By Software
After entering the BOQ of guestrooms as the input to the software, the
summary tables and graphs were obtained as the output. According to
these graphs and tables, these projects could be evaluated and
comparisons could be made between three case studies and the common
materials that were used in all case guestrooms.
As an output of this software, the projects were evaluated according to six
indicators. These were:
• Primary Energy Consumption: Absolute primary energy
consumption by fuel type for each life cycle stage as well as annual
operating energy.
• Solid Waste: Recovered matter resulting from the production and
delivery (packaging) process.
• Air Pollution Index: Inflows and outflows that contribute pollutants to
the air.
• Water Pollution Index: Inflows and outflows that contribute
pollutants to the water.
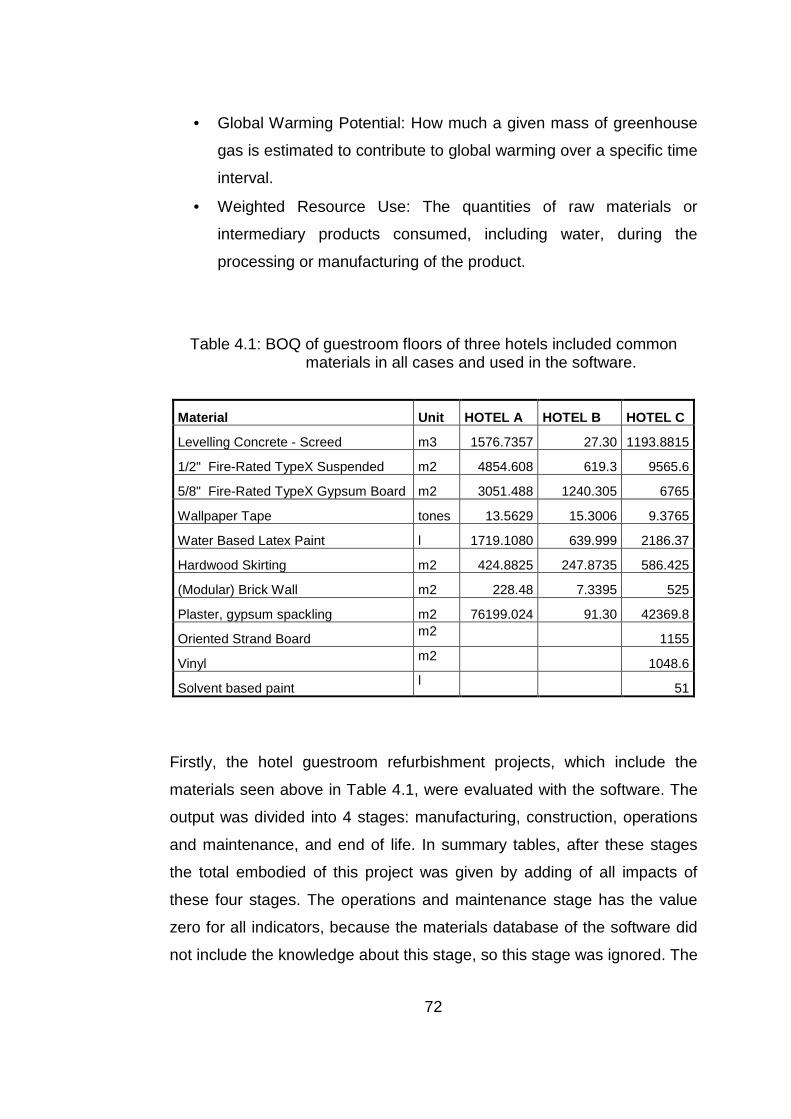
72
• Global Warming Potential: How much a given mass of greenhouse
gas is estimated to contribute to global warming over a specific time
interval.
• Weighted Resource Use: The quantities of raw materials or
intermediary products consumed, including water, during the
processing or manufacturing of the product.
Table 4.1: BOQ of guestroom floors of three hotels included common materials in all cases and used in the software.
Material Unit HOTEL A HOTEL B HOTEL C
Levelling Concrete - Screed m3 1576.7357 27.30 1193.8815
1/2" Fire-Rated TypeX Suspended m2 4854.608 619.3 9565.6
5/8" Fire-Rated TypeX Gypsum Board m2 3051.488 1240.305 6765
Wallpaper Tape tones 13.5629 15.3006 9.3765
Water Based Latex Paint l 1719.1080 639.999 2186.37
Hardwood Skirting m2 424.8825 247.8735 586.425
(Modular) Brick Wall m2 228.48 7.3395 525
Plaster, gypsum spackling m2 76199.024 91.30 42369.8
Oriented Strand Board m2
1155
Vinyl m2
1048.6
Solvent based paint l
51
Firstly, the hotel guestroom refurbishment projects, which include the
materials seen above in Table 4.1, were evaluated with the software. The
output was divided into 4 stages: manufacturing, construction, operations
and maintenance, and end of life. In summary tables, after these stages
the total embodied of this project was given by adding of all impacts of
these four stages. The operations and maintenance stage has the value
zero for all indicators, because the materials database of the software did
not include the knowledge about this stage, so this stage was ignored. The
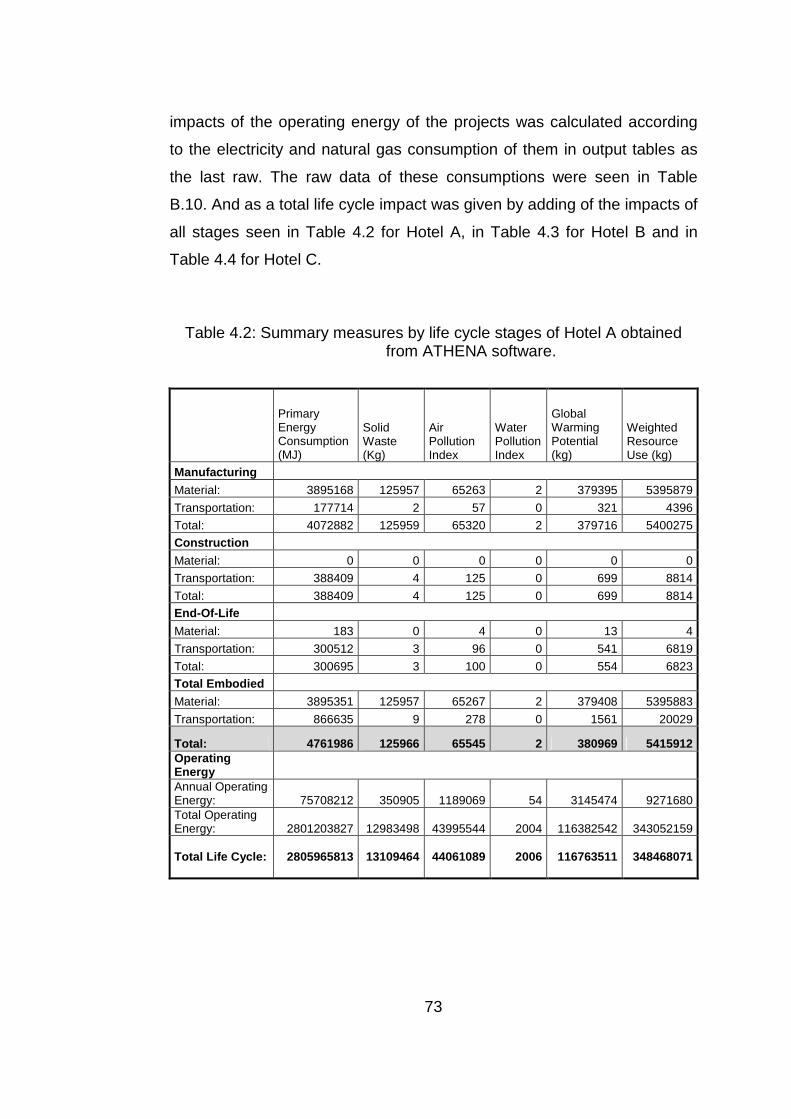
73
impacts of the operating energy of the projects was calculated according
to the electricity and natural gas consumption of them in output tables as
the last raw. The raw data of these consumptions were seen in Table
B.10. And as a total life cycle impact was given by adding of the impacts of
all stages seen in Table 4.2 for Hotel A, in Table 4.3 for Hotel B and in
Table 4.4 for Hotel C.
Table 4.2: Summary measures by life cycle stages of Hotel A obtained from ATHENA software.
Primary Energy Consumption (MJ)
Solid Waste (Kg)
Air Pollution Index
Water Pollution Index
Global Warming Potential (kg)
Weighted Resource Use (kg)
Manufacturing
Material: 3895168 125957 65263 2 379395 5395879
Transportation: 177714 2 57 0 321 4396
Total: 4072882 125959 65320 2 379716 5400275
Construction
Material: 0 0 0 0 0 0
Transportation: 388409 4 125 0 699 8814
Total: 388409 4 125 0 699 8814 End-Of-Life
Material: 183 0 4 0 13 4
Transportation: 300512 3 96 0 541 6819
Total: 300695 3 100 0 554 6823 Total Embodied
Material: 3895351 125957 65267 2 379408 5395883
Transportation: 866635 9 278 0 1561 20029
Total: 4761986 125966 65545 2 380969 5415912 Operating Energy Annual Operating Energy: 75708212 350905 1189069 54 3145474 9271680 Total Operating Energy: 2801203827 12983498 43995544 2004 116382542 343052159
Total Life Cycle: 2805965813 13109464 44061089 2006 116763511 348468071
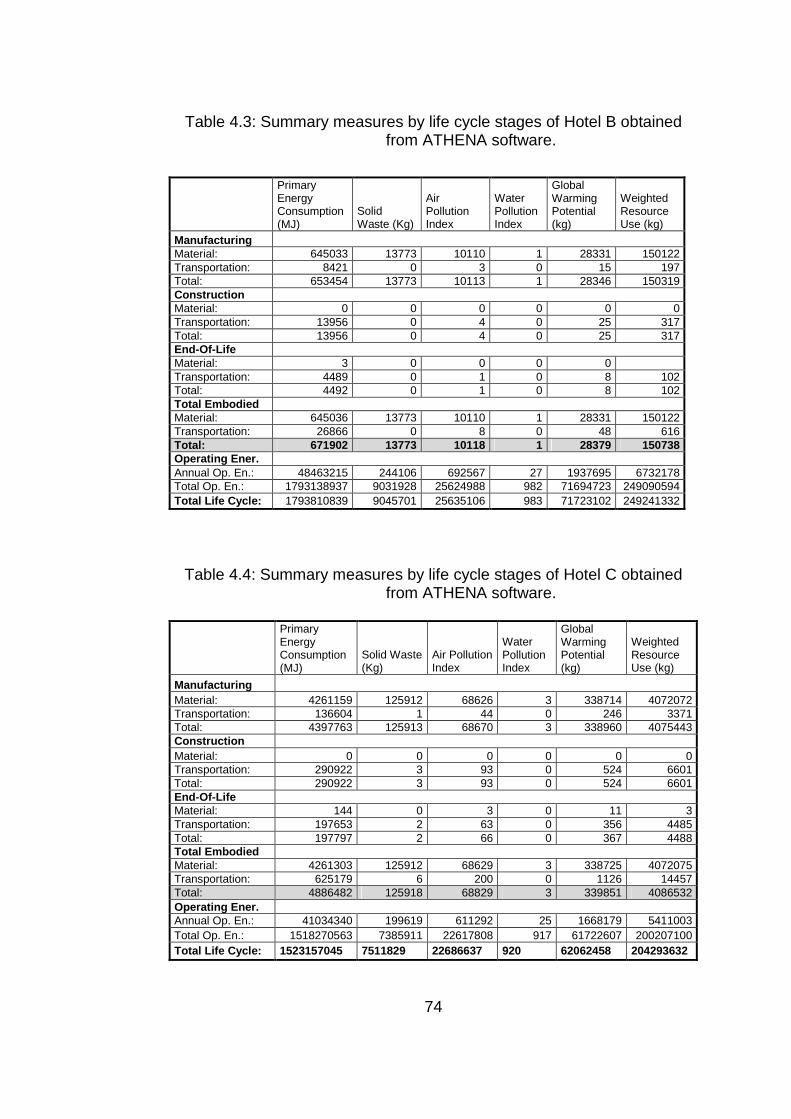
74
Table 4.3: Summary measures by life cycle stages of Hotel B obtained from ATHENA software.
Primary Energy Consumption (MJ)
Solid Waste (Kg)
Air Pollution Index
Water Pollution Index
Global Warming Potential (kg)
Weighted Resource Use (kg)
Manufacturing Material: 645033 13773 10110 1 28331 150122 Transportation: 8421 0 3 0 15 197 Total: 653454 13773 10113 1 28346 150319 Construction Material: 0 0 0 0 0 0 Transportation: 13956 0 4 0 25 317 Total: 13956 0 4 0 25 317 End-Of-Life Material: 3 0 0 0 0 Transportation: 4489 0 1 0 8 102 Total: 4492 0 1 0 8 102 Total Embodied Material: 645036 13773 10110 1 28331 150122 Transportation: 26866 0 8 0 48 616 Total: 671902 13773 10118 1 28379 150738 Operating Ener. Annual Op. En.: 48463215 244106 692567 27 1937695 6732178 Total Op. En.: 1793138937 9031928 25624988 982 71694723 249090594 Total Life Cycle: 1793810839 9045701 25635106 983 71723102 249241332
Table 4.4: Summary measures by life cycle stages of Hotel C obtained from ATHENA software.
Primary Energy Consumption (MJ)
Solid Waste (Kg)
Air Pollution Index
Water Pollution Index
Global Warming Potential (kg)
Weighted Resource Use (kg)
Manufacturing Material: 4261159 125912 68626 3 338714 4072072 Transportation: 136604 1 44 0 246 3371 Total: 4397763 125913 68670 3 338960 4075443 Construction Material: 0 0 0 0 0 0 Transportation: 290922 3 93 0 524 6601 Total: 290922 3 93 0 524 6601 End-Of-Life Material: 144 0 3 0 11 3 Transportation: 197653 2 63 0 356 4485 Total: 197797 2 66 0 367 4488 Total Embodied Material: 4261303 125912 68629 3 338725 4072075 Transportation: 625179 6 200 0 1126 14457 Total: 4886482 125918 68829 3 339851 4086532 Operating Ener. Annual Op. En.: 41034340 199619 611292 25 1668179 5411003 Total Op. En.: 1518270563 7385911 22617808 917 61722607 200207100 Total Life Cycle: 1523157045 7511829 22686637 920 6 2062458 204293632

75
The comparisons of three hotels according to the absolute values of six
indicators in total stages -excluded operating energy- were shown in
Figure 4.11, Figure 4.12, and Figure 4.13. The operating energy stages
were ignored while discussing the results in graphs because the impacts
of these stages were calculated according to only the area of the hotels.
This was not changed due to the magnitude of the project. So if only the
impacts of the refurbishment and the materials used in the refurbishments
were wanted to analyze, this stage should be ignored.
5415912
4761986
671902
150738
4086532
4886482
0
1000000
2000000
3000000
4000000
5000000
6000000
Primary Energy Consumption (MJ) Weighted Resource Use (KG)
Hotel A
Hotel B
Hotel C
Figure 4.11. The impacts of three hotels according to primary energy consumption and weighted resource use.
2
1
3
0
0,5
1
1,52
2,5
3
3,5
Water Pollution Index
Hotel A
Hotel B
Hotel C
Figure 4.12. The impacts of three hotels according to water pollution index
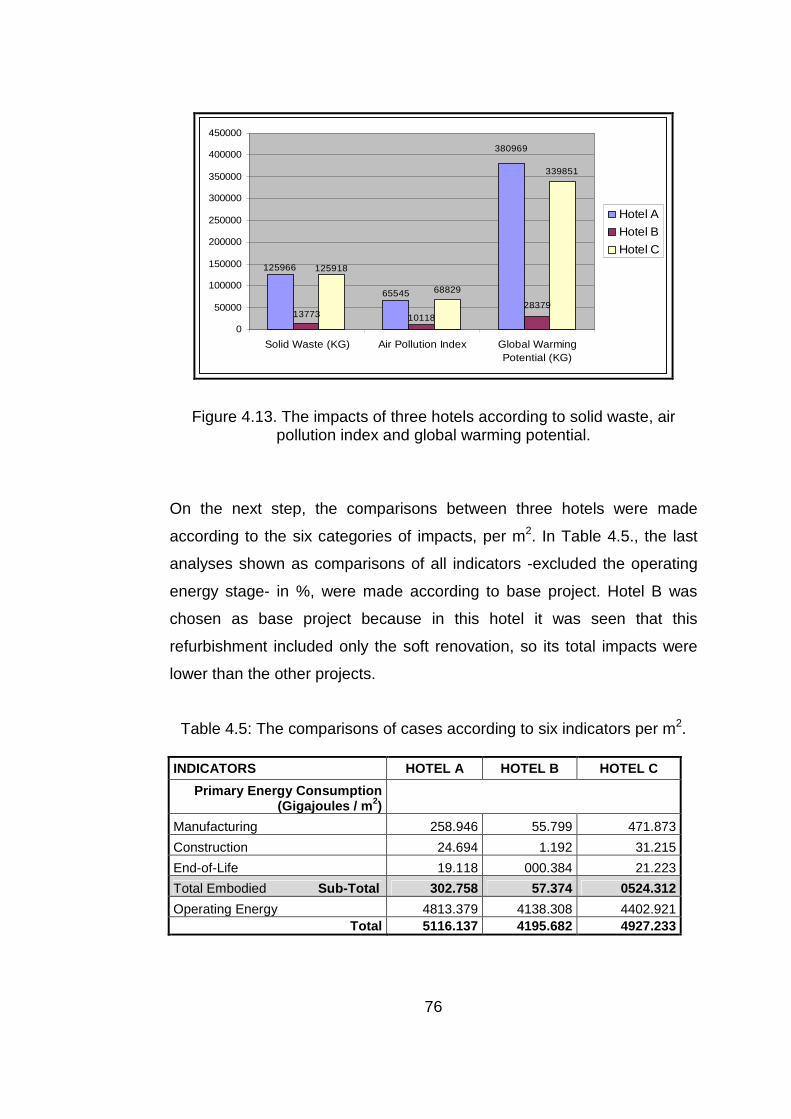
76
339851
380969
125966
65545
13773 1011828379
125918
68829
0
50000
100000
150000
200000
250000
300000
350000
400000
450000
Solid Waste (KG) Air Pollution Index Global WarmingPotential (KG)
Hotel A
Hotel B
Hotel C
Figure 4.13. The impacts of three hotels according to solid waste, air pollution index and global warming potential.
On the next step, the comparisons between three hotels were made
according to the six categories of impacts, per m2. In Table 4.5., the last
analyses shown as comparisons of all indicators -excluded the operating
energy stage- in %, were made according to base project. Hotel B was
chosen as base project because in this hotel it was seen that this
refurbishment included only the soft renovation, so its total impacts were
lower than the other projects.
Table 4.5: The comparisons of cases according to six indicators per m2. INDICATORS HOTEL A HOTEL B HOTEL C
Primary Energy Consumption (Gigajoules / m 2)
Manufacturing 258.946 55.799 471.873
Construction 24.694 1.192 31.215
End-of-Life 19.118 000.384 21.223
Total Embodied Sub-Total 302.758 57.374 0524.312
Operating Energy 4813.379 4138.308 4402.921 Total 5116.137 4195.682 4927.233
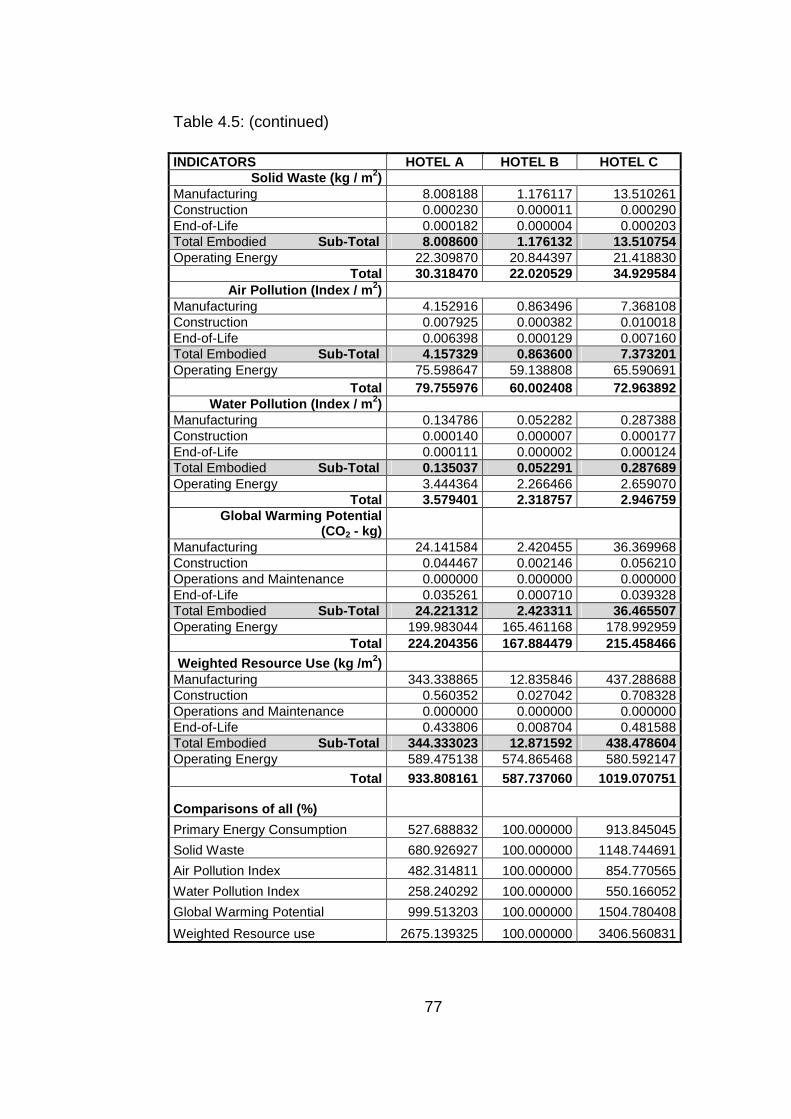
77
Table 4.5: (continued)
INDICATORS HOTEL A HOTEL B HOTEL C Solid Waste (kg / m 2)
Manufacturing 8.008188 1.176117 13.510261 Construction 0.000230 0.000011 0.000290 End-of-Life 0.000182 0.000004 0.000203 Total Embodied Sub-Total 8.008600 1.176132 13.510754 Operating Energy 22.309870 20.844397 21.418830
Total 30.318470 22.020529 34.929584 Air Pollution (Index / m 2)
Manufacturing 4.152916 0.863496 7.368108 Construction 0.007925 0.000382 0.010018 End-of-Life 0.006398 0.000129 0.007160 Total Embodied Sub-Total 4.157329 0.863600 7.373201 Operating Energy 75.598647 59.138808 65.590691
Total 79.755976 60.002408 72.963892 Water Pollution (Index / m 2)
Manufacturing 0.134786 0.052282 0.287388 Construction 0.000140 0.000007 0.000177 End-of-Life 0.000111 0.000002 0.000124 Total Embodied Sub-Total 0.135037 0.052291 0.287689 Operating Energy 3.444364 2.266466 2.659070
Total 3.579401 2.318757 2.946759 Global Warming Potential
(CO2 - kg) Manufacturing 24.141584 2.420455 36.369968 Construction 0.044467 0.002146 0.056210 Operations and Maintenance 0.000000 0.000000 0.000000 End-of-Life 0.035261 0.000710 0.039328 Total Embodied Sub-Total 24.221312 2.423311 36.465507 Operating Energy 199.983044 165.461168 178.992959
Total 224.204356 167.884479 215.458466
Weighted Resource Use (kg /m 2) Manufacturing 343.338865 12.835846 437.288688 Construction 0.560352 0.027042 0.708328 Operations and Maintenance 0.000000 0.000000 0.000000 End-of-Life 0.433806 0.008704 0.481588 Total Embodied Sub-Total 344.333023 12.871592 438.478604 Operating Energy 589.475138 574.865468 580.592147
Total 933.808161 587.737060 1019.070751
Comparisons of all (%)
Primary Energy Consumption 527.688832 100.000000 913.845045
Solid Waste 680.926927 100.000000 1148.744691
Air Pollution Index 482.314811 100.000000 854.770565
Water Pollution Index 258.240292 100.000000 550.166052
Global Warming Potential 999.513203 100.000000 1504.780408
Weighted Resource use 2675.139325 100.000000 3406.560831
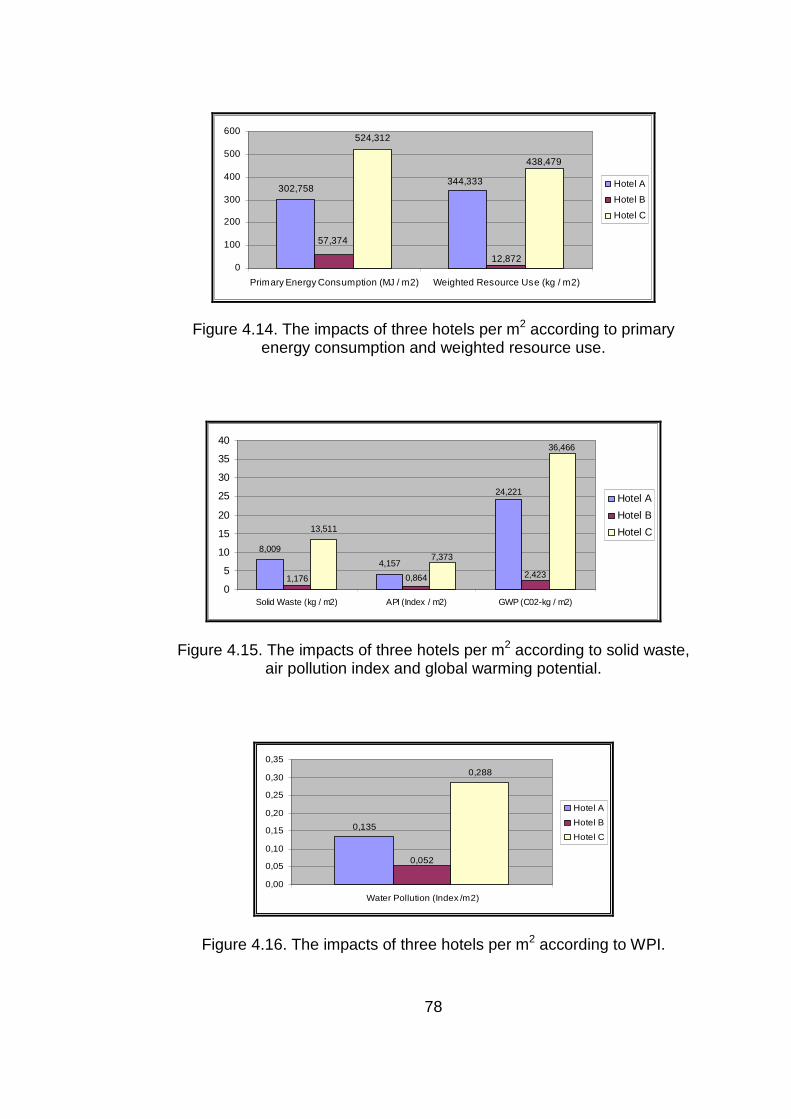
78
302,758
524,312
344,333
57,374
12,872
438,479
0
100
200
300
400
500
600
Primary Energy Consumption (MJ / m2) Weighted Resource Use (kg / m2)
Hotel A
Hotel B
Hotel C
Figure 4.14. The impacts of three hotels per m2 according to primary energy consumption and weighted resource use.
8,009
4,157
13,511
24,221
2,4230,8641,176
7,373
36,466
0
5
10
15
20
25
30
35
40
Solid Waste (kg / m2) API (Index / m2) GWP (C02-kg / m2)
Hotel A
Hotel B
Hotel C
Figure 4.15. The impacts of three hotels per m2 according to solid waste,
air pollution index and global warming potential.
0,135
0,288
0,052
0,00
0,05
0,10
0,15
0,20
0,25
0,30
0,35
Water Pollution (Index /m2)
Hotel A
Hotel B
Hotel C
Figure 4.16. The impacts of three hotels per m2 according to WPI.

79
According to the figures above, Hotel B had the minimum impacts for
every indicator and Hotel A was the second. This was the result of the
volume of the refurbishment project. If the refurbishment type changes
from soft to hard, the impacts will increase.
4.4. Hypotheses Tested
In these refurbishment projects seven common materials were used.
These seven materials wanted to analyze according to six indicators in
three hotels as a third step. While comparing these materials, the mean
values of the impacts of them in three cases were decided to use.
Because of this, the statistical analysis of the seven materials in three
hotels was made in order to find if there is any difference between the
impacts of them per m2 in three cases. The paired-sample t-test was used
to analyze. Three pairs from three hotels were formed.
H01: There is no difference in primary energy consumption between refurbishment projects of three hotels according to the impacts of seven materials per m2
.
Table 4.6: Paired-sample t-test results – primary energy consumption
Paired Samples Test
-,037155 ,073985401 ******** -,105580 ,03127008 -1,329 6 ,232
-,067684 ,096931049 ******** -,157331 ,02196184 -1,847 6 ,114
-,030529 ,039774216 ******** -,067314 ,00625559 -2,031 6 ,089
HOTEL_B - HOTEL_APair 1
HOTEL_B - HOTEL_CPair 2
HOTEL_A - HOTEL_CPair 3
Mean Std. DeviationStd. Error
Mean Lower Upper
95% ConfidenceInterval of the
Difference
Paired Differences
t df Sig. (2-tailed)
According to Table 4.6, at a prescribed 5 % level of significance (α=0,05)
in regard to the primary energy consumption; the sig. (2-tailed) value for
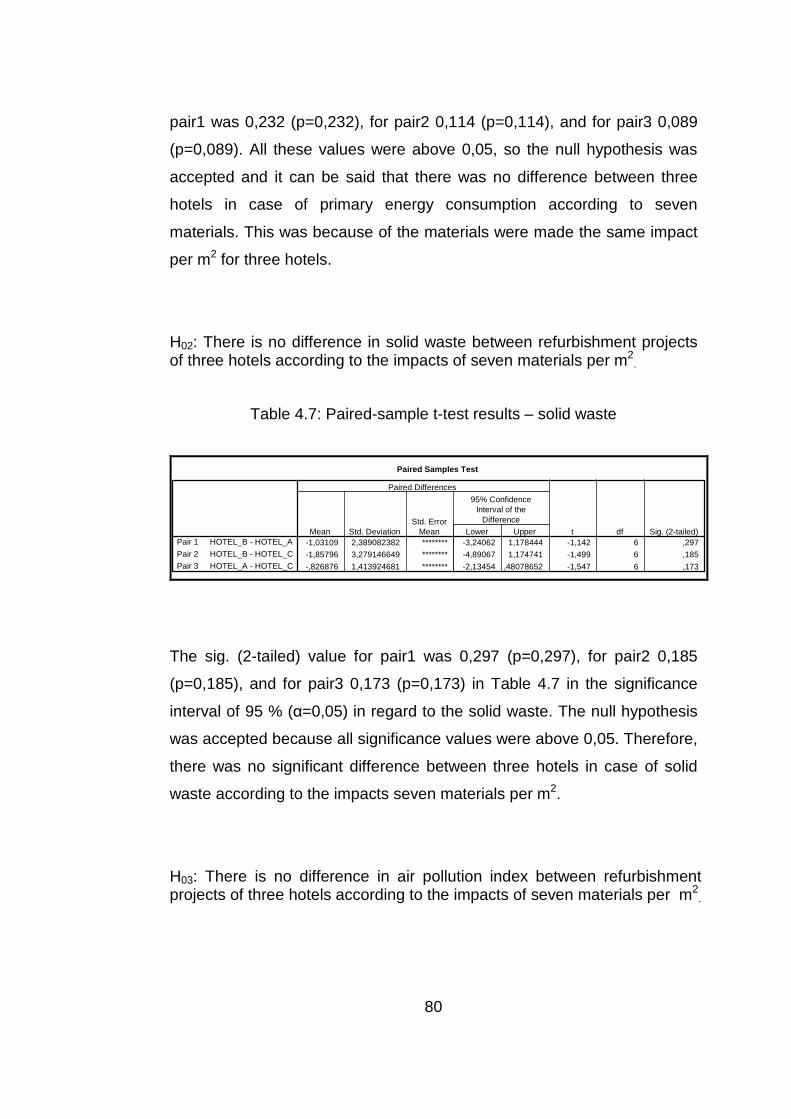
80
pair1 was 0,232 (p=0,232), for pair2 0,114 (p=0,114), and for pair3 0,089
(p=0,089). All these values were above 0,05, so the null hypothesis was
accepted and it can be said that there was no difference between three
hotels in case of primary energy consumption according to seven
materials. This was because of the materials were made the same impact
per m2 for three hotels.
H02: There is no difference in solid waste between refurbishment projects of three hotels according to the impacts of seven materials per m2
.
Table 4.7: Paired-sample t-test results – solid waste
Paired Samples Test
-1,03109 2,389082382 ******** -3,24062 1,178444 -1,142 6 ,297
-1,85796 3,279146649 ******** -4,89067 1,174741 -1,499 6 ,185
-,826876 1,413924681 ******** -2,13454 ,48078652 -1,547 6 ,173
HOTEL_B - HOTEL_APair 1
HOTEL_B - HOTEL_CPair 2
HOTEL_A - HOTEL_CPair 3
Mean Std. DeviationStd. Error
Mean Lower Upper
95% ConfidenceInterval of the
Difference
Paired Differences
t df Sig. (2-tailed)
The sig. (2-tailed) value for pair1 was 0,297 (p=0,297), for pair2 0,185
(p=0,185), and for pair3 0,173 (p=0,173) in Table 4.7 in the significance
interval of 95 % (α=0,05) in regard to the solid waste. The null hypothesis
was accepted because all significance values were above 0,05. Therefore,
there was no significant difference between three hotels in case of solid
waste according to the impacts seven materials per m2.
H03: There is no difference in air pollution index between refurbishment projects of three hotels according to the impacts of seven materials per m2
.
81
Table 4.8: Paired-sample t-test results – air pollution index
Paired Samples Test
-,498940 1,134308817 ******** -1,54800 ,55012083 -1,164 6 ,289
-,960301 1,511524733 ******** -2,35823 ,43762637 -1,681 6 ,144
-,461361 ,623025806 ******** -1,03756 ,11484177 -1,959 6 ,098
HOTEL_B - HOTEL_APair 1
HOTEL_B - HOTEL_CPair 2
HOTEL_A - HOTEL_CPair 3
Mean Std. DeviationStd. Error
Mean Lower Upper
95% ConfidenceInterval of the
Difference
Paired Differences
t df Sig. (2-tailed)
According to Table 4.8, H03 was accepted at a prescribed 5 % level of
significance (α=0,05). The sig. (2-tailed) value for pair1 was 0,289
(p=0,289), for pair2 0,144 (p=0,144), and for pair3 0,098 (p=0,098). All
these values were above 0,05, hence H03 was accepted.
H04: There is no difference in water pollution index between refurbishment projects of three hotels according to the impacts of seven materials per m2
.
Table 4.9: Paired-sample t-test Results – Water Pollution Index
Paired Samples Test
-,019656 ,043115288 ******** -,059531 ,02021871 -1,206 6 ,273
-,044033 ,066815859 ******** -,105827 ,01776136 -1,744 6 ,132
-,024377 ,038210547 ******** -,059716 ,01096215 -1,688 6 ,142
HOTEL_B - HOTEL_APair 1
HOTEL_B - HOTEL_CPair 2
HOTEL_A - HOTEL_CPair 3
Mean Std. DeviationStd. Error
Mean Lower Upper
95% ConfidenceInterval of the
Difference
Paired Differences
t df Sig. (2-tailed)
According to Table 4.9, at a prescribed 5 % level of significance (α=0,05)
in regard to the solid waste; the sig. (2-tailed) value for pair1 was 0,273
(p=0,273), for pair2 0,132 (p=0,132), and for pair3 0,142 (p=0,142). All
these values were above 0,05, so H04 was accepted. Like the other four
indicators, the impacts of the material per m2 had no significant difference
between three hotels.
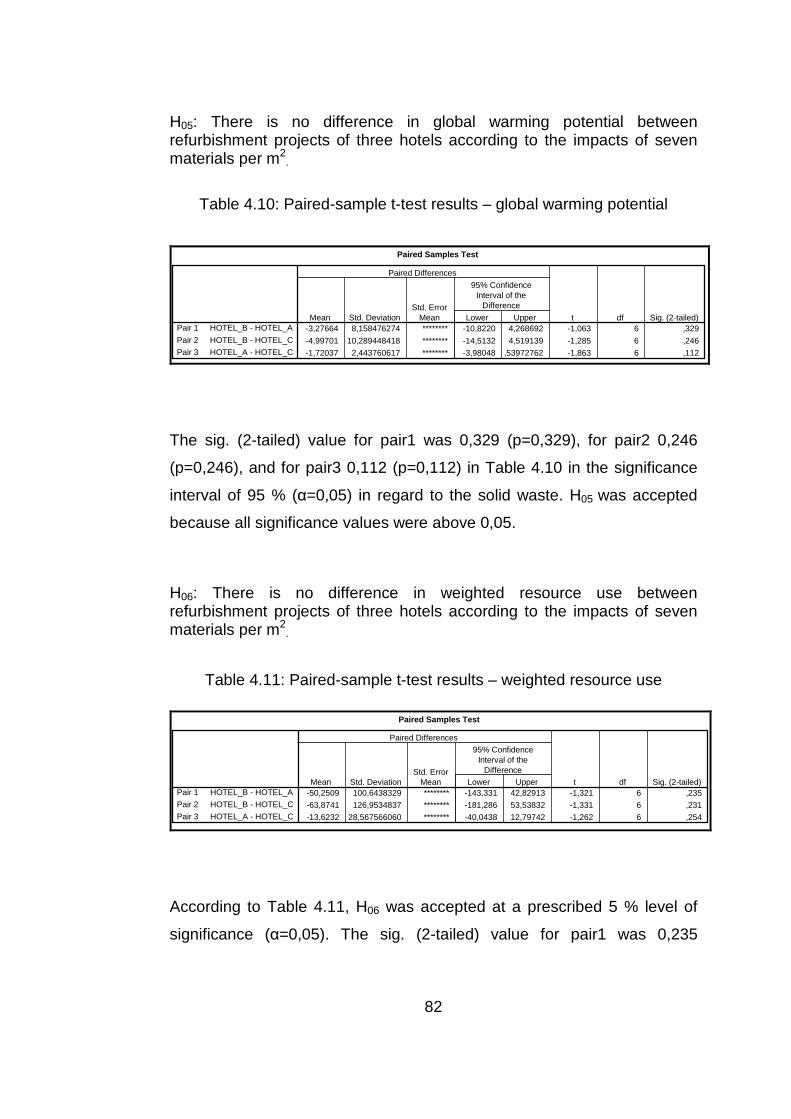
82
H05: There is no difference in global warming potential between refurbishment projects of three hotels according to the impacts of seven materials per m2
.
Table 4.10: Paired-sample t-test results – global warming potential
Paired Samples Test
-3,27664 8,158476274 ******** -10,8220 4,268692 -1,063 6 ,329
-4,99701 10,289448418 ******** -14,5132 4,519139 -1,285 6 ,246
-1,72037 2,443760617 ******** -3,98048 ,53972762 -1,863 6 ,112
HOTEL_B - HOTEL_APair 1
HOTEL_B - HOTEL_CPair 2
HOTEL_A - HOTEL_CPair 3
Mean Std. DeviationStd. Error
Mean Lower Upper
95% ConfidenceInterval of the
Difference
Paired Differences
t df Sig. (2-tailed)
The sig. (2-tailed) value for pair1 was 0,329 (p=0,329), for pair2 0,246
(p=0,246), and for pair3 0,112 (p=0,112) in Table 4.10 in the significance
interval of 95 % (α=0,05) in regard to the solid waste. H05 was accepted
because all significance values were above 0,05.
H06: There is no difference in weighted resource use between refurbishment projects of three hotels according to the impacts of seven materials per m2
.
Table 4.11: Paired-sample t-test results – weighted resource use
Paired Samples Test
-50,2509 100,6438329 ******** -143,331 42,82913 -1,321 6 ,235
-63,8741 126,9534837 ******** -181,286 53,53832 -1,331 6 ,231
-13,6232 28,567566060 ******** -40,0438 12,79742 -1,262 6 ,254
HOTEL_B - HOTEL_APair 1
HOTEL_B - HOTEL_CPair 2
HOTEL_A - HOTEL_CPair 3
Mean Std. DeviationStd. Error
Mean Lower Upper
95% ConfidenceInterval of the
Difference
Paired Differences
t df Sig. (2-tailed)
According to Table 4.11, H06 was accepted at a prescribed 5 % level of
significance (α=0,05). The sig. (2-tailed) value for pair1 was 0,235
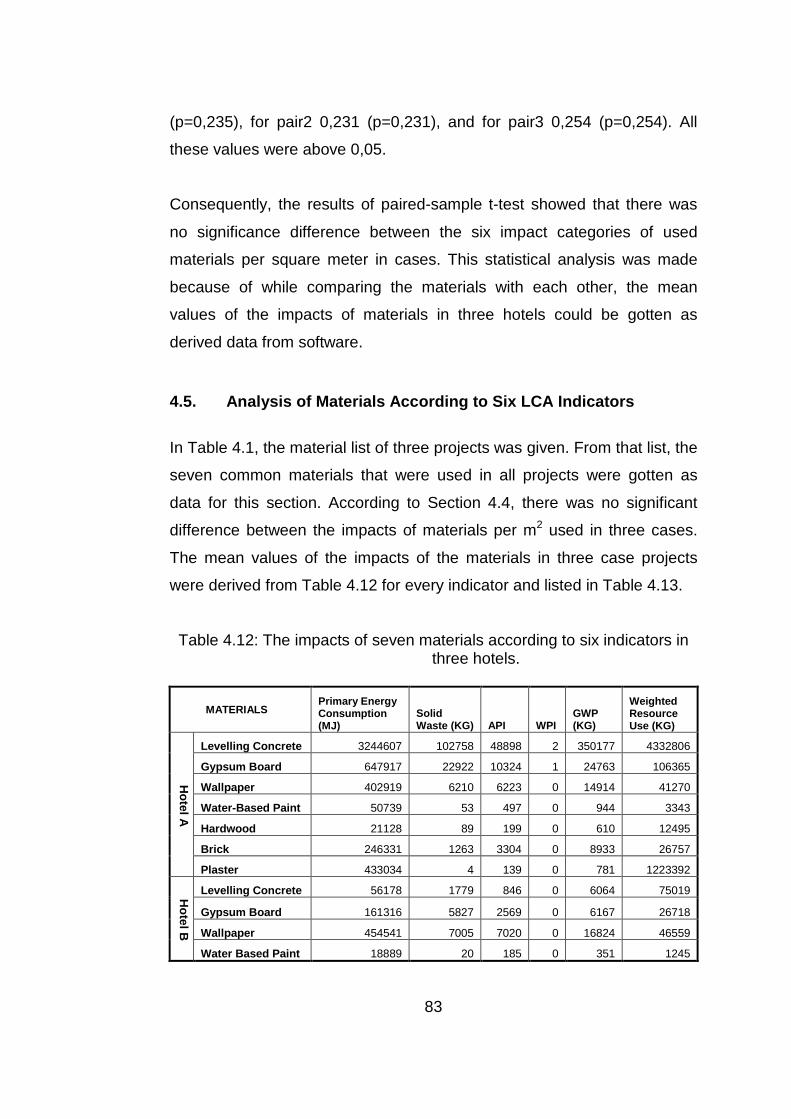
83
(p=0,235), for pair2 0,231 (p=0,231), and for pair3 0,254 (p=0,254). All
these values were above 0,05.
Consequently, the results of paired-sample t-test showed that there was
no significance difference between the six impact categories of used
materials per square meter in cases. This statistical analysis was made
because of while comparing the materials with each other, the mean
values of the impacts of materials in three hotels could be gotten as
derived data from software.
4.5. Analysis of Materials According to Six LCA Ind icators
In Table 4.1, the material list of three projects was given. From that list, the
seven common materials that were used in all projects were gotten as
data for this section. According to Section 4.4, there was no significant
difference between the impacts of materials per m2 used in three cases.
The mean values of the impacts of the materials in three case projects
were derived from Table 4.12 for every indicator and listed in Table 4.13.
Table 4.12: The impacts of seven materials according to six indicators in three hotels.
MATERIALS Primary Energy Consumption (MJ)
Solid Waste (KG) API WPI
GWP (KG)
Weighted Resource Use (KG)
Levelling Concrete 3244607 102758 48898 2 350177 4332806
Gypsum Board 647917 22922 10324 1 24763 106365
Wallpaper 402919 6210 6223 0 14914 41270
Water-Based Paint 50739 53 497 0 944 3343
Hardwood 21128 89 199 0 610 12495
Brick 246331 1263 3304 0 8933 26757
Hotel A
Plaster 433034 4 139 0 781 1223392
Levelling Concrete 56178 1779 846 0 6064 75019
Gypsum Board 161316 5827 2569 0 6167 26718
Wallpaper 454541 7005 7020 0 16824 46559
Hotel B
Water Based Paint 18889 20 185 0 351 1245
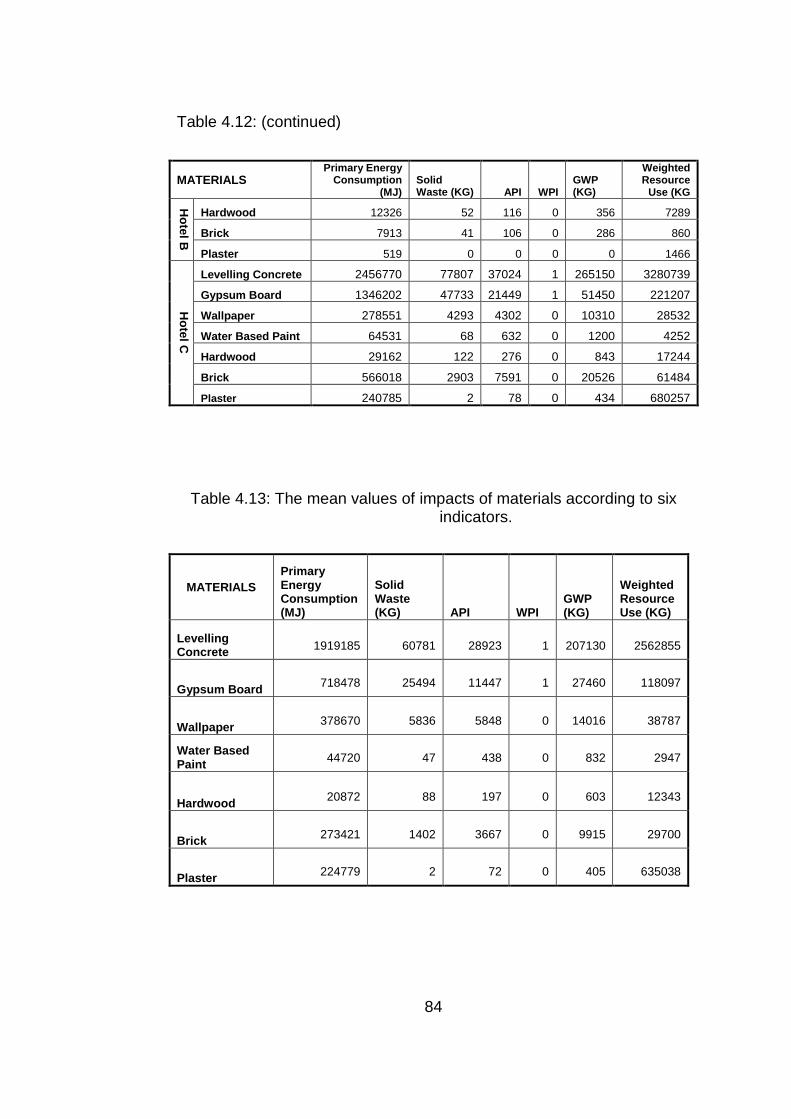
84
Table 4.12: (continued)
MATERIALS Primary Energy
Consumption (MJ)
Solid Waste (KG) API WPI
GWP (KG)
Weighted Resource
Use (KG
Hardwood 12326 52 116 0 356 7289
Brick 7913 41 106 0 286 860
Hotel B
Plaster 519 0 0 0 0 1466
Levelling Concrete 2456770 77807 37024 1 265150 3280739
Gypsum Board 1346202 47733 21449 1 51450 221207
Wallpaper 278551 4293 4302 0 10310 28532
Water Based Paint 64531 68 632 0 1200 4252
Hardwood 29162 122 276 0 843 17244
Brick 566018 2903 7591 0 20526 61484
Hotel C
Plaster 240785 2 78 0 434 680257
Table 4.13: The mean values of impacts of materials according to six indicators.
MATERIALS Primary Energy Consumption (MJ)
Solid Waste (KG) API WPI
GWP (KG)
Weighted Resource Use (KG)
Levelling Concrete 1919185 60781 28923 1 207130 2562855
Gypsum Board 718478 25494 11447 1 27460 118097
Wallpaper 378670 5836 5848 0 14016 38787
Water Based Paint 44720 47 438 0 832 2947
Hardwood 20872 88 197 0 603 12343
Brick 273421 1402 3667 0 9915 29700
Plaster 224779 2 72 0 405 635038

85
1919185
718478
44720 20872
273421224779
378670
0
500000
1000000
1500000
2000000
2500000
LevellingConcrete
GypsumBoard
Wallpaper WaterBasedPaint
Hardwood Brick Plaster
MJ
PrimaryEnergyConsumption(MJ)
Figure 4.17. Comparison of seven materials according to the primary energy consumption.
According to Figure 4.17, levelling concrete created more primary energy
consumption than the others. This consumption mostly depended on the
cement manufacture, occurred especially during the manufacturing stage.
When Table C.3 was analyzed, the total stage primary energy
consumption of the other materials was less than the consumption of
leveling concrete in the manufacturing stage. Therefore alternative energy
sources and processes should be found during manufacturing cement.
While the energy consumption of gypsum board was nearly the half of
leveling concrete, the consumption of wallpaper was almost nearly the half
of gypsum board. Hardwood had the minimum value among the others, so
it should be chosen in order to decrease energy consumption.

86
60781
47 88 1402 2
5836
25494
0
10000
20000
30000
40000
50000
60000
70000
LevellingConcrete
GypsumBoard
Wallpaper WaterBasedPaint
Hardwood Brick Plaster
KG
Solid Waste(KG)
Figure 4.18. Comparison of seven materials according to the solid waste.
According to Figure 4.18, levelling concrete also created more solid waste
than the others. This indicator was nearly arranged in order like the
primary energy consumption. The leveling concrete had the most solid
waste like the first indicator but the last one was plaster not hardwood.
The limit value for solid waste was generally measured in ton/person and
this limit was 1.35 ton/person. In this example if the number of population
was gotten as 500 according to the number of guestrooms, only the
amount of the solid waste of leveling concrete was 0,12152 ton/person
which was reasonably high. In order to decrease the amount of solid
waste, the recycling and reuse strategies should be applied to the
refurbishment projects.
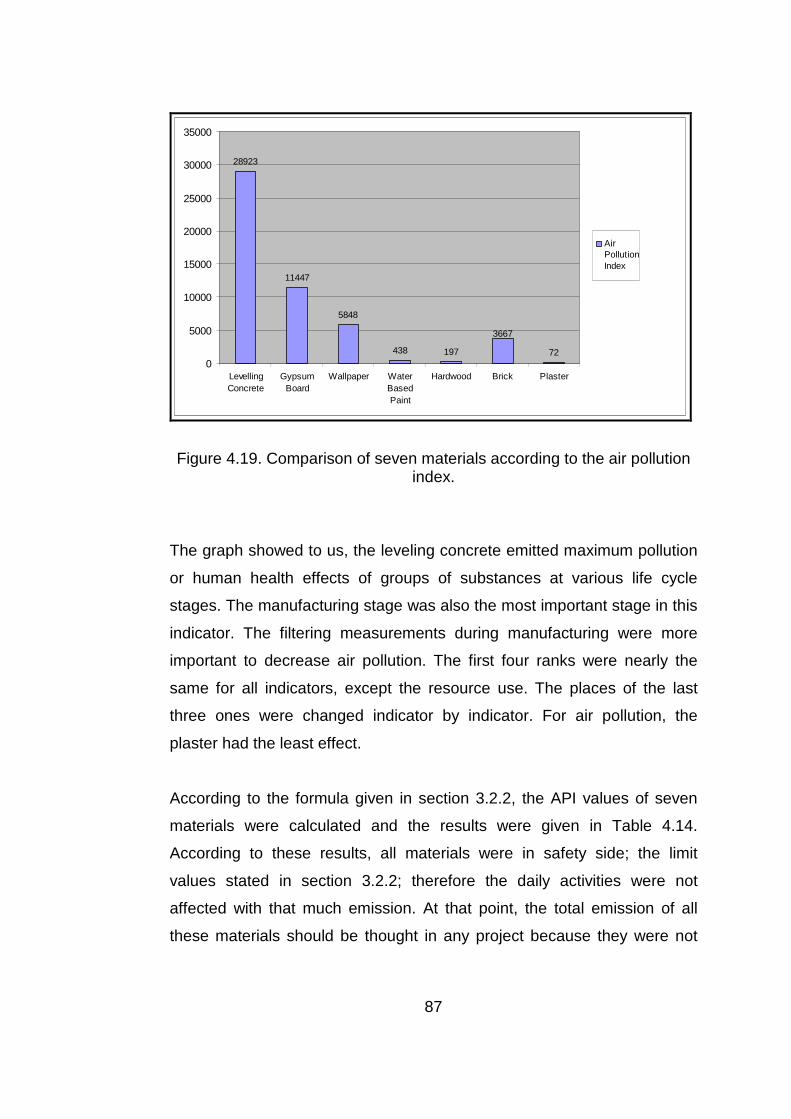
87
28923
11447
5848
438 197 72
3667
0
5000
10000
15000
20000
25000
30000
35000
LevellingConcrete
GypsumBoard
Wallpaper WaterBasedPaint
Hardwood Brick Plaster
AirPollutionIndex
Figure 4.19. Comparison of seven materials according to the air pollution index.
The graph showed to us, the leveling concrete emitted maximum pollution
or human health effects of groups of substances at various life cycle
stages. The manufacturing stage was also the most important stage in this
indicator. The filtering measurements during manufacturing were more
important to decrease air pollution. The first four ranks were nearly the
same for all indicators, except the resource use. The places of the last
three ones were changed indicator by indicator. For air pollution, the
plaster had the least effect.
According to the formula given in section 3.2.2, the API values of seven
materials were calculated and the results were given in Table 4.14.
According to these results, all materials were in safety side; the limit
values stated in section 3.2.2; therefore the daily activities were not
affected with that much emission. At that point, the total emission of all
these materials should be thought in any project because they were not
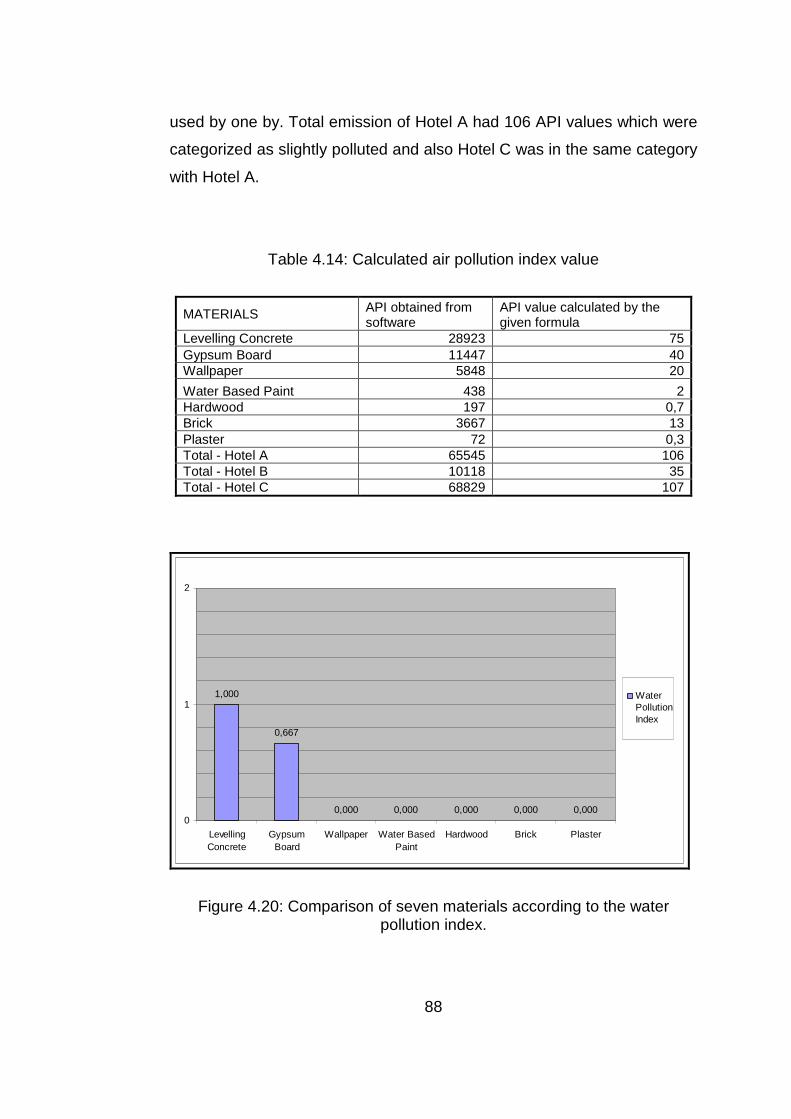
88
used by one by. Total emission of Hotel A had 106 API values which were
categorized as slightly polluted and also Hotel C was in the same category
with Hotel A.
Table 4.14: Calculated air pollution index value
MATERIALS API obtained from software
API value calculated by the given formula
Levelling Concrete 28923 75 Gypsum Board 11447 40 Wallpaper 5848 20
Water Based Paint 438 2 Hardwood 197 0,7 Brick 3667 13 Plaster 72 0,3 Total - Hotel A 65545 106 Total - Hotel B 10118 35 Total - Hotel C 68829 107
1,000
0,667
0,000 0,000 0,000 0,000 0,0000
1
2
LevellingConcrete
GypsumBoard
Wallpaper Water BasedPaint
Hardwood Brick Plaster
WaterPollutionIndex
Figure 4.20: Comparison of seven materials according to the water
pollution index.
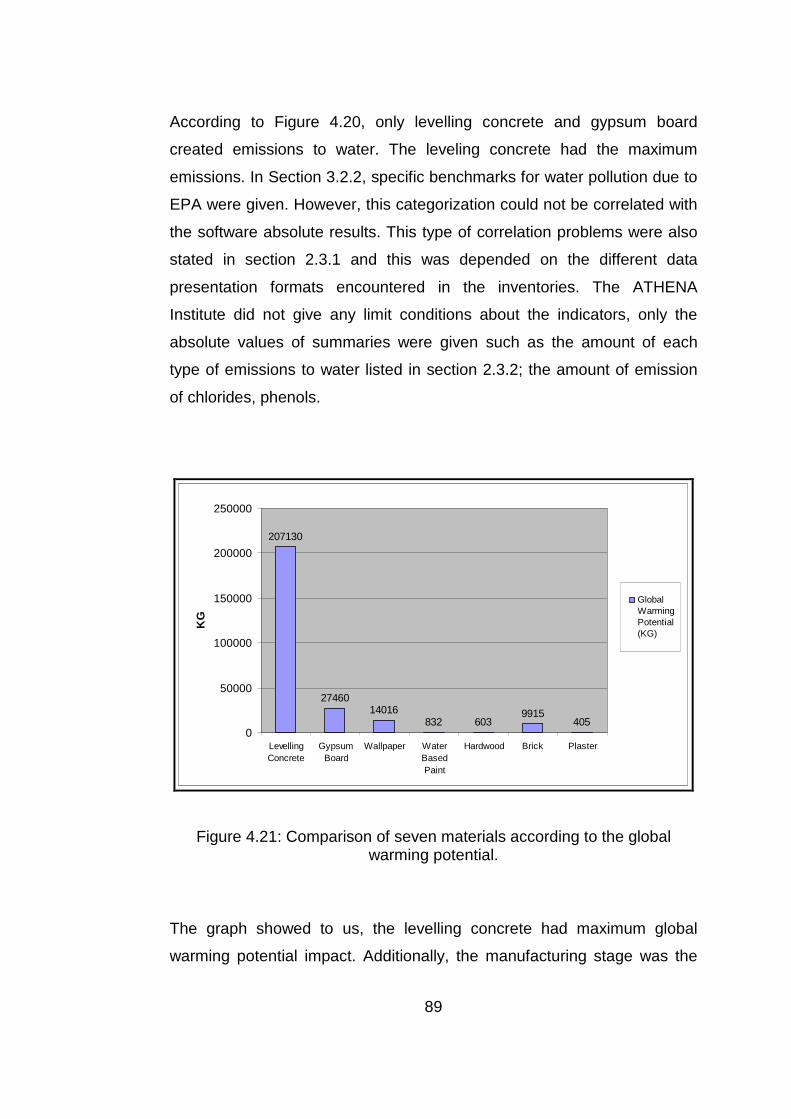
89
According to Figure 4.20, only levelling concrete and gypsum board
created emissions to water. The leveling concrete had the maximum
emissions. In Section 3.2.2, specific benchmarks for water pollution due to
EPA were given. However, this categorization could not be correlated with
the software absolute results. This type of correlation problems were also
stated in section 2.3.1 and this was depended on the different data
presentation formats encountered in the inventories. The ATHENA
Institute did not give any limit conditions about the indicators, only the
absolute values of summaries were given such as the amount of each
type of emissions to water listed in section 2.3.2; the amount of emission
of chlorides, phenols.
207130
2746014016
832 6039915
4050
50000
100000
150000
200000
250000
LevellingConcrete
GypsumBoard
Wallpaper WaterBasedPaint
Hardwood Brick Plaster
KG
GlobalWarmingPotential(KG)
Figure 4.21: Comparison of seven materials according to the global
warming potential.
The graph showed to us, the levelling concrete had maximum global
warming potential impact. Additionally, the manufacturing stage was the
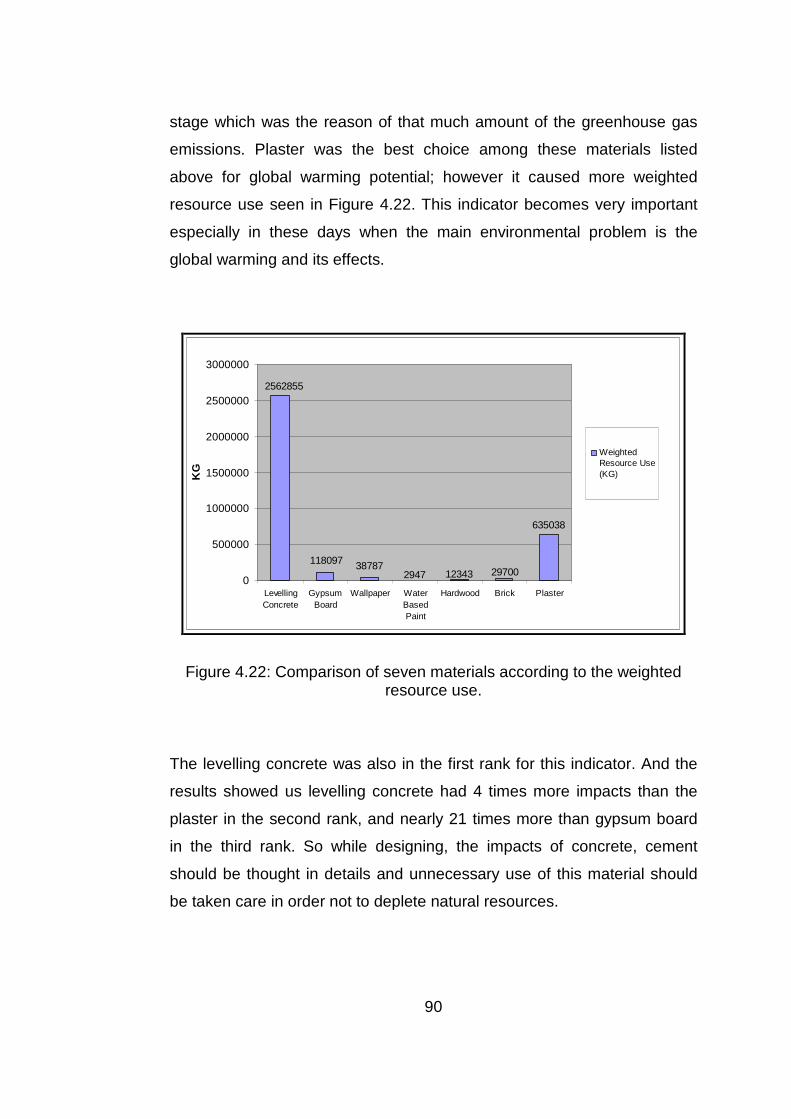
90
stage which was the reason of that much amount of the greenhouse gas
emissions. Plaster was the best choice among these materials listed
above for global warming potential; however it caused more weighted
resource use seen in Figure 4.22. This indicator becomes very important
especially in these days when the main environmental problem is the
global warming and its effects.
635038
2947 1234338787
29700
2562855
118097
0
500000
1000000
1500000
2000000
2500000
3000000
LevellingConcrete
GypsumBoard
Wallpaper WaterBasedPaint
Hardwood Brick Plaster
KG
WeightedResource Use(KG)
Figure 4.22: Comparison of seven materials according to the weighted
resource use.
The levelling concrete was also in the first rank for this indicator. And the
results showed us levelling concrete had 4 times more impacts than the
plaster in the second rank, and nearly 21 times more than gypsum board
in the third rank. So while designing, the impacts of concrete, cement
should be thought in details and unnecessary use of this material should
be taken care in order not to deplete natural resources.
91
CHAPTER 5
5.CONCLUSION
After generating LCA data for the three refurbishment projects with the
help of the software the results were interpreted. The refurbishment
materials were compared with each other according to the six LCA impact
indicators and a matrix was formed to enable designers to choose the
suitable material in order to reduce damage to the natural environment. At
the end of this study further investigations are proposed and
recommendations have been made for establishing a database.
5.1. Hotel Refurbishment Projects
Increasing awareness of the scarcity of conventional energy sources
mandates the need to take measures for energy conservation in buildings.
Moreover, the ever-growing global environmental concerns are dictating
the adoption of a “green” policy, even in the hospitality sector. Hotels rank
highest amongst building types according to the levels of energy
consumption; they interact with the environment at every stage of their life
cycle, and this influence is often negative. They are designed to provide
multi-facetted comfort and services to guests, which require the
consumption of substantial quantities of energy, water and non-durable
products.
The operational stage of a hotel life-cycle is substantial, both from an
economic and environmental perspective; especially since this stage also

92
includes refurbishment works. As a result of these works, hotels generate
large quantities of waste, thus increasing pressure on waste disposal
systems, as well as landfills. They are also responsible for the release of
various air pollutants, either directly from on-site heat and power
generation, or indirectly by the use of electricity and heat/cold produced at
power plants, thereby contributing to the deterioration of local air quality,
acid rain and global warming.
The remaining life span of building elements is an important piece of
information for financially and ecologically coherent refurbishment
decisions. In order to determine life-spans correctly, it is necessary to take
into account the current deterioration state of the element. It is also
necessary to define a yardstick to measure deterioration, so as to quantify
it. However, in hotel buildings the service life span of materials is usually
ignored because of the strategies of refurbishment, which is mostly carried
out as a result of the decision to give updated service to customers.
As mentioned earlier, refurbishment involves the generation of large
quantities of waste, and poses a risk involving the discharge of various air
pollutants (including lead and volatile organic compounds from paints, and
ozone depleting substances from refrigeration and air conditioning
installations). However, the refurbishment stage is an excellent opportunity
in making the facility more environmentally friendly by introducing many
energy and water efficiency measures, or even changing to renewable
energy sources. More environmentally benign construction materials and
furnishings can be used during refurbishments.
Within the scope of this study, the amounts of primary energy
consumption, solid waste, air pollution, water pollution, global warming
and weighted resource use indices were calculated, which were produced
by three hotel refurbishment projects. These data show the damage to

93
nature caused by these projects. The difference between the volumes of
the projects can also change the amount of damage. According to the
comparison tables and charts presented in the previous chapter, the
minimum impacts belong to Hotel B refurbishment works. For primary
energy consumption it is nearly one fifth of Hotel A and one ninth of Hotel
C. For solid waste, the rates were one sixth of Hotel A and one eleventh of
Hotel C. The air pollution produced by Hotel B refurbishment works was
one fifth of Hotel A and one eighth of Hotel C. Hotel A refurbishment
produced ten times more CO2 emission than Hotel B and Hotel C
produced fifteen times more than Hotel B. For water pollution the rate is
slightly less: one third of Hotel A and one sixth of Hotel C.
These results mostly depend on the magnitude of the refurbishment
project. The project applied to Hotel B can be considered as soft
refurbishment which includes only the replacing of carpets, curtains,
fabrics, cladding and fittings etc. as stated in Section 4.3. On the other
hand, refurbishments made in Hotel A and C can be defined as hard
refurbishments, which included replacement of wall and floor materials;
wallpaper, gypsum boards, suspended ceilings, partition walls, bathroom
walls, etc.
The results of Hotel B for the six indicators were less than the others but
the period of soft refurbishment, generally fixed for every 3 to 4 years, was
shorter than hard refurbishment undertaken every 8 to 10 years,
depending on their budget. Consequently, it can be said that the decision
for and design of refurbishment should be considered more carefully
because the impacts of Hotel B refurbishment, according to six indicators,
which is considerably high, are given every 3 to 4 years.
Although such a refurbishment decision adds considerably to the financial
burden of the hotel in addition to its negative environmental impacts, the

94
managements of these hotels pointed out that renovations are on-going in
the system in order to maintain excellence in appearance and
accommodation. Consequently, material is sometimes dumped as waste
even before it has started to deteriorate due to wear and tear, let alone
before the end of its expected lifetime.
5.2. Choice of Materials for Refurbishment Projects
The choice of materials and components has an important role in
determining energy performance. Some objectives for environmentally
sustainable design can be achieved by taking into consideration the six
LCA indicators which are: reducing energy consumption and embodied
energy by specifying products made with local materials and labor, in
addition to decreasing the transportation costs; reducing use of excessive
amount of materials; reducing indoor and outdoor air pollution which
directly affects global warming potential; reducing construction waste
production; and reducing clean water use in buildings.
Reuse represents the best and highest level of resource efficiency for the
buildings. If reusing is not possible, preferring non-renewable energy
sources should be the only choice in order to prevent scarcity of raw
materials. Designers can specify materials made from waste in preference
to virgin materials, so that negative impacts of solid waste and weighted
resource use can be reduced. Moreover, recycling is another strategy
which considers not only the sources but also by-products and waste
disposal. The increasing complexity of materials and products has made
recycling more difficult in many cases so more efficient technologies for
separating materials have to be developed.
When a pollutant such as sulfuric acid, which is accounted for in the air
pollution index indicator, combines with droplets of water in the air it can

95
cause acid rain which has serious environmental implications. It damages
plants by destroying their leaves, it poisons the soil, and it changes the
chemistry of lakes and streams. Damage due to acid rain kills trees and
harms animals, fish, and other wildlife.
Water pollution due to human activities causes adverse effects upon water
bodies such as lakes, rivers, oceans, and groundwater. Organic wastes
such as sewage impose high oxygen demands on the receiving water
leading to oxygen depletion with potentially severe impacts on the whole
eco-system.
The amount of carbon dioxide in the air is continuing to increase. This
build-up acts like a blanket and traps heat close to the surface of the earth,
thus causing global warming. Increase of even a few degrees in
temperature will affect the eco-balance through changes in the climate and
the possibility of polar ice caps melting. Chemicals released by activities,
such as construction and renovation works; affect the ozone layer which
protects the earth from harmful ultraviolet radiation from the sun. Release
of chlorofluorocarbon, one of greenhouse gases, from aerosol cans,
cooling systems and refrigerator equipment removes some of the ozone,
causing holes; to open up in this layer and allowing the radiation to reach
the earth. This ultraviolet radiation is known to cause skin cancer and has
damaging effects on plants and wildlife.
The negative environmental impacts of the six LCA indicators for building
construction works are presented in Table 5.1 below. Based on the
findings of this study some precautions have been recommended for their
mitigation; these precautions are listed for each impact separately in the
last row.

96
Table 5.1: Precautions versus impacts of LCA indicators

97
In Section 4.5, LCA of the seven materials, namely; leveling concrete,
gypsum board, textile backed wallpaper, water based paint, hardwood,
brick and plaster, which were common to all the three projects were
analyzed. Although, there were other common materials, such as: wall
and floor ceramic tiles, marble claddings and carpet; they could not be
analyzed because the database of the software does not include
information on these materials. For this reason, materials and process
selection databases of the CES V4 software, which is used in Department
of Metallurgical and Materials Engineering in METU, were consulted.
While information about C02 emission and the amount of embodied energy
could be taken from this database, it does not include information that is
required to evaluate the material (such as the impacts of indicators
according to life cycle stages, emissions to air and water) with the LCA
software ATHENA. Hence, the analyses comprised of only the seven
materials mentioned above.
The author formulated a system to evaluate building materials according
to the six LCA environmental impact indicators, by calculating their “Eco-
scores”. As shown in the proposed matrix below, the selected materials
were evaluated on the basis of the seven LCA indicators; primary energy
consumption, solid waste, air pollution index, water pollution index, global
warming potential and weighted resource use.
The evaluation was done by assigning ecological scores to each material,
ranging from 1 to 7 where 1 indicates the least damaging and 7 the most;
0 was assigned to a material, which had no known impact. Mean values
for each environmental impact indicator for the material (listed in Table
4.13) were used to calculate the related eco-scores. The largest amount of
impact of any material for each indicator was denoted as the maximum
eco-score of 7 and the least amount was denoted as 1; the intermediary
range was divided into 5 equal grades. Hence, the total eco-score for any
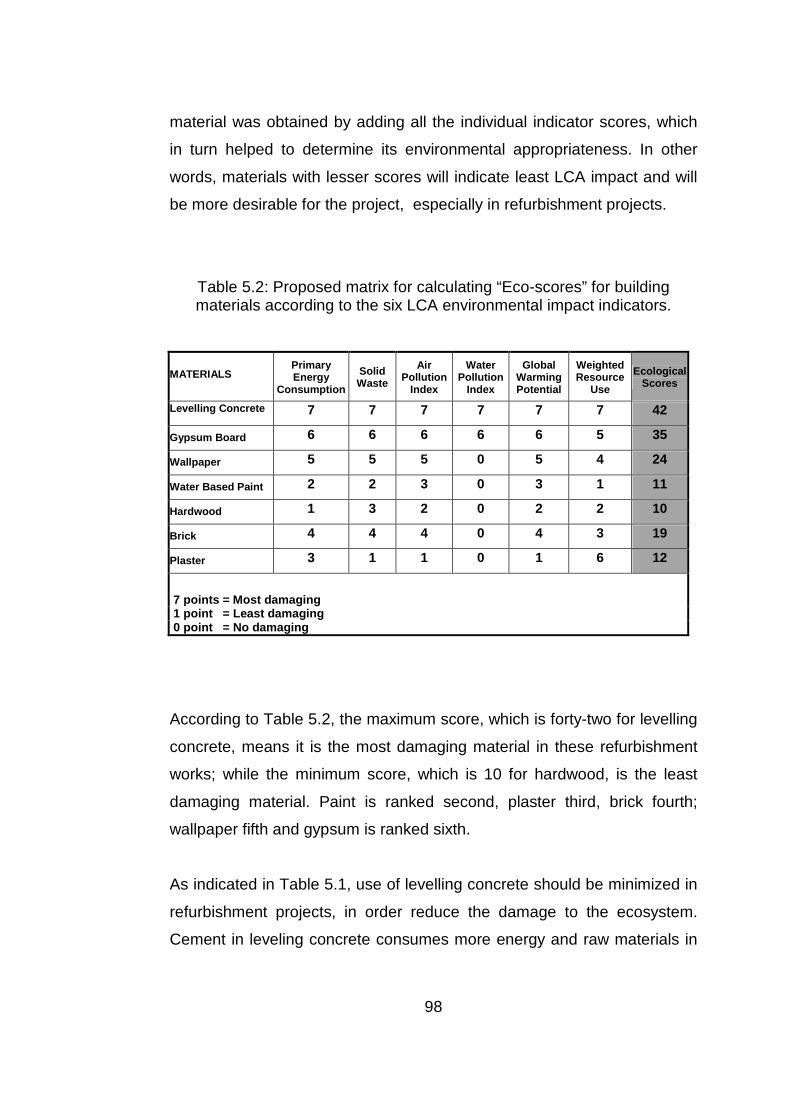
98
material was obtained by adding all the individual indicator scores, which
in turn helped to determine its environmental appropriateness. In other
words, materials with lesser scores will indicate least LCA impact and will
be more desirable for the project, especially in refurbishment projects.
Table 5.2: Proposed matrix for calculating “Eco-scores” for building materials according to the six LCA environmental impact indicators.
MATERIALS Primary Energy
Consumption
Solid Waste
Air Pollution
Index
Water Pollution
Index
Global Warming Potential
Weighted Resource
Use
Ecological Scores
Levelling Concrete 7 7 7 7 7 7 42
Gypsum Board 6 6 6 6 6 5 35
Wallpaper 5 5 5 0 5 4 24
Water Based Paint 2 2 3 0 3 1 11
Hardwood 1 3 2 0 2 2 10
Brick 4 4 4 0 4 3 19
Plaster 3 1 1 0 1 6 12
7 points = Most damaging 1 point = Least damaging 0 point = No damaging
According to Table 5.2, the maximum score, which is forty-two for levelling
concrete, means it is the most damaging material in these refurbishment
works; while the minimum score, which is 10 for hardwood, is the least
damaging material. Paint is ranked second, plaster third, brick fourth;
wallpaper fifth and gypsum is ranked sixth.
As indicated in Table 5.1, use of levelling concrete should be minimized in
refurbishment projects, in order reduce the damage to the ecosystem.
Cement in leveling concrete consumes more energy and raw materials in

99
the manufacturing phase due to high temperature in the kiln where it is
produced. The cement industry should use industrial by-products as raw
materials to mitigate its environmental impact, including aluminum ore
refuse, blast-furnace slag, or fly ash. The kilns must be strictly controlled
not to cause smoke emissions and atmospheric pollution. Mineral
admixtures, called pozzolana, are finely ground mineral substances to
form compounds with cement-like properties. Industrial by-products
produce the most readily available pozzolana, including fly ash, ground
blast furnace slag and silica fume. Use of these materials increases the
strength of concrete while reducing the amount of cement required and
recycling industrial waste.
Usage of gypsum board should also be reconsidered and alternatives
should be evaluated carefully. For these two materials, i.e. gypsum and
concrete, the recycling, reducing and reusing strategies are most
significant. Hardwood has the minimum ecological score so wood should
be preferred while refurbishing. However, dangers of deforestation should
not be ignored and regeneration of eco-balance can be assured through
re-plantation in forests.
As mentioned earlier, Hotel A had 4500 square meters of wooden
suspended ceiling replaced by gypsum board false ceilings, which are not
as durable as wood. Even the wooden pelmets were replaced with
gypsum ones. From these examples it can be seen that sometimes good
quality and durable materials are replaced with those of poorer quality and
strength, which also have worse impacts on nature. Additionally, these
materials and components, which are replaced in bulk just after a few
years, are incorporated into the structure with permanent joints, anchors
and glues. Since the hotel maintenance and renovation guideline dictate a
shorter useful life than their expected life, it would be prudent to use
replaceable material and components with de-mountable joints.
100
Since furniture is changed after every 8 to 10 years, it is advisable not to
use fixed furniture or parts thereof, such as wall mounted headboards or
night stands. It would also be more economical and healthy if floors were
covered with wooden parquet or marble tiles depending on the climatic
region, and rugs were used instead of wall to wall carpeting, which attracts
dust and stains easily. These rugs can be washed or replaced at
considerably lesser costs.
5.3. Further Investigations
LCA methodologies used so far have been developed for individual
products only, whereas ATHENA is a software that has been developed
specifically for evaluating whole buildings. On the other hand this software
does not include database for all types of material, which is limiting to the
assessment process. It is therefore essential to add information regarding
more types of materials with varied specifications. Moreover, since
benchmarking is not available, assessments are made on a comparative
basis.
While assessing the hotels and materials in this study, the limit values for
the impact indicators could not be found; therefore, international standards
were used instead. The limit conditions for all indicators and air and water
pollution index tables correlated with the software generated results can
be prepared in order to make the assessment according to the local index
values. Ecological scores similar to the ones formulated by the author and
proposed in this dissertation can be determined and tabulated for other
materials also, in order to assess whole buildings.
101
6.LITERATURE CITED
AIA (American Institute of Architects). 1977. Life Cycle Cost Analysis: A Guide for Architects, Washington D.C.
APAT. 2002. Tourist Accommodation EU Eco-Label Award Scheme, Final
Report, 16 October 2002. Italian National Agency For the Protection of The Environment and for Technical Services, http://europa.eu.int/comm/environment/ecolabel/pdf/tourism/ finalreport_1102.pdf. 03.04.2007 (last access).
ARUP. 2004. “Developing Life Cycle Assessment Tool for Buildings in
Hong Kong”, http://www.arup.com/_assets/_download/download298.pdf. 19.05.2007 (last access).
ASTM E833 – E917 (The American Society for Testing and Materials).
1990. Measuring Life Cycle Cost of Building and Building Systems, (p. 83-84), Philadelphia.
ATHENA Sustainable Materials Institute. 2001. Materials / Products
Definition; in Working Paper No:3, 2 pages, http://www.athenasmi.ca/papers/down_papers/. 19.05.2007 (last access).
ATHENA Sustainable Materials Institute. Software and Databases,
http://www.athenasmi.ca/database/.19.05.2007 (last access). BARTELMUS, P. 1994. Environment, Growth and Development: The
Concepts and Strategies of Sustainability, Routledge Press, London. BOHDANOWICZ, P. 2003. A Study of Environmental Impacts,
Environmental Awareness and Pro-Ecological Initiatives in the Hotels Industry- Licentiate Thesis, Department of Energy Technology, Royal Institute of Technology, Stockholm.

102
BOHDANOWICZ, P., B. Simanic, I. Martinac. 2004. Environmental Education at Scandic Hotels- Approach and Results; in: Regional CEntarl and Eastern European Conference on Sustainable Building (SB04), October 27-29, Warszawa, Poland.
CANMET Energy and Technology Center. 2003. Canadian Natural
Resources, http://www.nrcan.gc.ca/es/etb/index_e.html. 19.05.2007 (last access).
CHANTER, B. & P. Surallow. 1996. Building Maintenance Management,
UK: Blackwell Science. CROSBIE, M. 1994. Green Architecture: A Guide to Sustainable Design,
Rockport Publishers, Rockport Massachusetts. DASCALAKI, E., C. Balaras. 2004. XENIOS- A Methodology for Assessing
Refurbishment Scenarios and the Potential of Application of RES and RUE in Hotels; in: Energy and Buildings (p. 1091-1105, v. 36), Elsevier Ltd.
ECOBILAN. 2003. Life Cycle Assessment History,
http://www.ecobilan.com/uk_lca02.php. 19.05.2007 (last access). EDWARDS, B. 1998. Sustainable Architecture: European Directives and
Building Design, Architectural Press, Oxford. EHLEN, M., 1997. Life Cycle Costs of New Construction Materials; in:
Journal of Infrastructure Systems, (p. 129-133, December 1997), American Society of Civil Engineers Publications, U.S.
EKVALL, T. 2005. SETAC Summaries, in: Journal of Cleaner Production,
8 pages, Elsevier Ltd. ERLANDSSON, M., M. Borg. 2003. Generic LCA – Methodology
Applicable for Buildings, Constructions and Operation Services – Today Practice and Development Needs; in: Building and Environment (p. 919-938, v. 38), Pergamon Ltd.
103
ERLANDSSON, M., P. Levin. 2005. Environmental Assessment of Rebuilding and Possible Performance Improvements Effect on a National Scale; in: Building and Environment (p. 1453-1465, v. 39), Elsevier Ltd.
FLOURENTZOU, F., E. Brandt, C. Wetzel. 2000. MEDIC — A Method for
Predicting Residual Service Life and Refurbishment Investment Budgets; in: Energy and Buildings (p. 167-170, v. 31), Elsevier Ltd.
GUINEE, J. 2002. Handbook on Life Cycle Assessment: Operational
Guide to the ISO Standards, Kluwer Academic Publishers, London. HOCHSCHORNER, E., G. Finnveden. 2003. Use of Life Cycle
Assessment Methodology in the Acquisition Process of Defense Material, Swedish Defense Research Agency, Stockholm.
HOUSTON, P. 1996. A Global Warmer Primer,
http://people.ccmr.cornell.edu/~plh2/group/glblwarm/potent.gif. 19.05.2007 (last access).
IEA IEA-BCS Annex 31. 2001. LCA Methods for Buildings, in: Energy-
Related Environmental Impact of Buildings, November 2001. ISO International Standard 14040. 1997E. Environmental management –
Life Cycle Assessment – Principles and framework, International Organization for Standardization (ISO), Geneva.
ISO International Standard 14041. 1998E. Environmental management –
Life cycle assessment – Goal and scope definition and Inventory analysis, International Organization for Standardization (ISO), Geneva.
ISO International Standard 14042. 2000E. Environmental management –
Life cycle assessment – Life cycle impact assessment, International Organization for Standardization (ISO), Geneva.
104
ISO International Standard 14043. 2000E. Environmental management – Life cycle assessment – Life cycle interpretation, International Organization for Standardization (ISO), Geneva.
ISO/DIS International Standard 15686-1. 2000. Buildings & Constructed
Assets – Service Life Planning, Part 1: General Principles, International Organization for Standardization (ISO), Geneva.
LI, Z. 2006. A New Life Cycle Impact Assessment Approach for Buildings;
in: Building and Environment, (p. 1414-1422, v. 41), Elsevier Ltd. MALIN, N. 2002. Life Cycle Assessment for Buildings: Seeking the Holy
Grail; in: Environmental Building News, March 2002. Ministry of Culture and Tourism, General Directorate of Investment and
Enterprises Ministry Culture and Tourism Republic of Turkey, Statistics of Tourism Licensed Facilities 2005, Ankara.
MINTZ, D. 2006. Guideline for Reporting of Daily Air Quality – Air Quality
Index (AQI), U.S. Environmental Protection Agency, North Carolina, http://www.epa.gov/ttn/oarpg/t1/memoranda/rg701.pdf. 05.05.2007 (last access).
National Environmental Monitoring Center, Technological Rules
Concerned “Ambient Air Quality Daily Report”, http://zhb.gov.cn/english/airqualityinfo.htm. 10.05.2007 (last access).
NORRIS, G., P. Notten. 2002. Current Availability of LCI Databases in the
World, (12 pages) , http://www.sylvatica.com/unepsumm.htm. 19.05.2007 (last access).
NUNEN, N., A. Hendriks, P. Erkelens. 2004. Service Life as Main Aspect
in Environmental Assessment; in: CIB World Building Congress 2004, Toronto, Canada.
105
O’CONNOR, J. 2004. Survey on Actual Service Lives for North American Buildings; in: The Wood-frame Housing Durability and Disaster Issues Conference, Las Vegas, October 2004.
OSSO, A., T. Walsh & D. Gottfried, D. 1996. Sustainable Building Technical Manual, Public Technology Inc., New York.
ÖZGUREL, N. 2001. Maintenance considerations in the building design
process: Hotel guestroom design for maintainability. Unpublished MS Thesis, Department of Architecture, METU, Ankara.
PAL V., K. Papamichael, N. Bourassa, & J. Loffeld J. 2001. Incorporating
LCA Tools in Integrated Simulation Environments; in: Seventh International IBPSA Conference Building Simulation, 8 pages, August 2001, Rio de Janerio.
PAULSEN, J. 2001. Life Cycle Assessment for Building Products – The
Significance of the Usage Phase, PhD Thesis in Kungliga Tekniska Högskolan, Stockholm.
REIJNDERS, L., A. Roekel. 1999. Comprehensiveness and Adequacy of Tools for the Environmental Improvement of Buildings; in Journal of Cleaner Production, (p. 221–225, v.7), Pergamon Ltd. Rocky Mountain Institute. 1998. Green Development: Integrating Ecology
and Real Estate, John Wiley & Sons, Inc., New York. SAVILLE, A., G. Moss. 2000. Design for Life – Meeting the Industry’s
Needs for Robust Data on the Whole Life Performance of Building Services Plant, Building Performance Group Project, 2000.
SETAC - Europe Case-Studies Working Group. 1997. Evaluation and
Reporting Guidelines for Life Cycle Assessment Case Studies, April 1997.
STIPANUK, D., H. Roffman. 1992. Hospitality facilities management and
design. The Educational Institute of the American Hotel and Motel Association.

106
T.C. Başbakanlık Aile Araştırma Kurumu Başkanlığı, 1999. Türk Ailesinin Yaşadığı Mekanlara / Konutlara Đlişkin Eğilimler, Volume 1, Ankara.
The Carbon Trust. 2005. Energy Efficient Refurbishment of Hotels and
Guesthouses – A Guide for Proprietors and Managers, Good Practice Guide 205, 16 pages, 04.03.2007 (last access), http://www.thecarbontrust.co.uk/energyCMS/CarbonTrust/.
The Royal Society of Chemistry, 1998. Environment, Health and Safety
Committee Note on “Life Cycle Assessment”, 5 pages, http://www.rsc.org/images/lcad97_tcm18-12710_tcm18-37764.pdf. 08.06.2007(last access).
TRINIUS, W. 1999. Environmental Assessment in Building and
Construction: Goal and Scope Definition as Key to Methodology Choices, PhD Thesis in Kungliga Tekniska Högskolan, Stockholm.
TRUSTY, W. 2000. Introducing An Assessment Tool Classification
System; in: Advanced Building Newsletter, (p. 18-19), July 2000. TRUSTY, W. 2004. Life Cycle Assessment, Databases and Sustainable
Building; in: The Latin-American Conference on Sustainable Building, 9 pages, July 2004, Sao Paolo.
TRUSTY, W. J. Meil, 2003. Integrating LCA Tools in Green Building
Rating Systems; in: USGBC Green Building International Conference, November 2003.
TURKSTAT (Turkish Agency for Statistics), 2003. Building Construction
Statistics 2003, Ankara. ZHANG, Ke, 1999. Life Cycle Costing for Office Buildings in Canada,
Degree of Master of Applied Science, (p. 12-15) Concordia University, Department of Building, Civil and Environmental Engineering, Canada.
ZHANG, Z., W. Xing, X. Yang, Y. Zhu, 2006. BEPAS - A Life Cycle Building Environmental Performance Assessment Model; in: Building and Environment (p. 669–675, v. 41), Elsevier Ltd.
107
BIBLIOGRAPHY
ANDERSON, J., N. Howard. 2000. The Green Guide to Housing Specification, BRE Publications, London.
ATHENA Sustainable Materials Institute and Franklin Associates. 2003.
U.S. LCI Database Project – Phase I Final Report. National Renewable Energy Laboratory, Colorado.
BOHDANOWICZ, P. 2003. Environmental Awareness in the Hotels
Industry- Questionnaire Analysis. Sustainable Building Systems Group, Royal Institute of Technology, Sweden.
CHEVALIER, J. & S. Cuenot. 2004. From LCA to EPD in Construction: A
Strategic Point of View; in: Proceedings of CIB World Building Congress 2004, Toronto, Canada.
FRISCHKNECHT, R. 2005. The Ecoinvent Database: Overview and
Methodological Framework; in: International Journal of LCA, p. 3-9, v. 10).
HED, G. 2003. Service Life Planning Carried Out In a Building Project; in:
International Journal of Low Energy and Sustainable Buildings, (p. 1-24, v. 3), June 2003.
JÖNSSON, A., A. Tillman, T. Svensson. 1996. Life Cycle Assessment of
Flooring Materials: Case Study; in: Building and Environment (p. 245-255, v. 32 No:3), Pergamon Ltd.
JOSA, A., A. Aguado, A. Heino, E. Byars, & A. Cardim. 2004. Comparative
Analysis of Available Life Cycle Inventories of Cement in the EU; in: Cement and Concrete Research, (p. 1313-1320, Volume 34), Pergamon Ltd.
108
KIBERT C., J. Languell & P. Shahriari. 2002. High Performance Green Buildings, http://web.dcp.ufl.edu/ckibert/ASCEBook/index.htm. 19.05.2007 (last access).
LIPPIATT, B., A. Boyles. 2001. Using BEES to Select Cost-Effective
Green Products; in: International Journal of LCA 6 (2), (p.76-80, v.6). LÜTZKENDORF, T., D. Lorenz. 2004. The Possible Use of LCC and LCA
for Commercial Property Valuations – Putting a Value on ‘Green’ Buildings; in: CIB World Building Congress 2004, Toronto, Canada.
PEUPORTIER, B. 2001. Assessment and Design of a Renovation Project
Using Life Cycle Analysis and GB Tool; in: Energy and Buildings, (p.443-450, v. 33), May 2001.
REBITZER, G., T. Ekvall, R. Frischknecht, D. Hunkeler, G. Norris, T.
Rydberg, W. Schmidt, S. Suh, B. Weidema, D. Pennington. 2004. Life Cycle Assessment: Part 1: Framework, Goal and Scope Definition, Inventory Analysis, and Applications; in: Environment and International (p. 701-720, v. 30), Elsevier Science Ltd.
RYDH, C., M. Sun. 2005. Life Cycle Inventory Data for Materials Grouped
According to Environmental and Material Properties; in: Journal of Cleaner Production, (p. 1258-1268, v. 13), Elsevier Ltd.
SCHEUER, C., G. Keoleian. 2002. Evaluation of LEEDTM Using Life Cycle
Assessment Methods, U.S. Department Of Commerce. SCHMID, P. 1999. The Life Cycle of Building: A Contribution for
Sustainable Development by a Methodological Approach in Building Construction in the Light of Global an Local Needs, http://www.iris.ba.cnr.it/sksb/PAPERS/Key02.htm. 02.02.2007 (last access).
SETAC North America Streamlined LCA Workgroup. 1999. Streamlined
Life-Cycle Assessment: A Final Report, July 1999.
109
SORENSEN, B. 2000. Renewable Energy: The Origin of Renewable Energy Flows, Academic Press, London.
TRUSTY, W. 2000. Let's Talk Data; in Athena SMI Newsletter (p. 18-19, v.
1), December 2000. TRUSTY, W. and Meil, J.K. 2002, Building as Products: Issues and
Challenges for LCA; in LCA, International Conference on LCA Tools for Sustainability, Virginia.
TUKKER, A. 2000. Life Cycle Assessment as a Tool in Environmental
Impact Assessment; in: Environmental Impact Assessment Review (p. 435-456, v. 20), Elsevier Ltd.
WU, X., Z. Zhang, Y. Chen. 2004. Study of the Environmental Impacts
Based on the Green Tax – Applied to Several Types of Building Materials; in: Building and Environment (p. 227-237, v. 40), Elsevier Ltd.
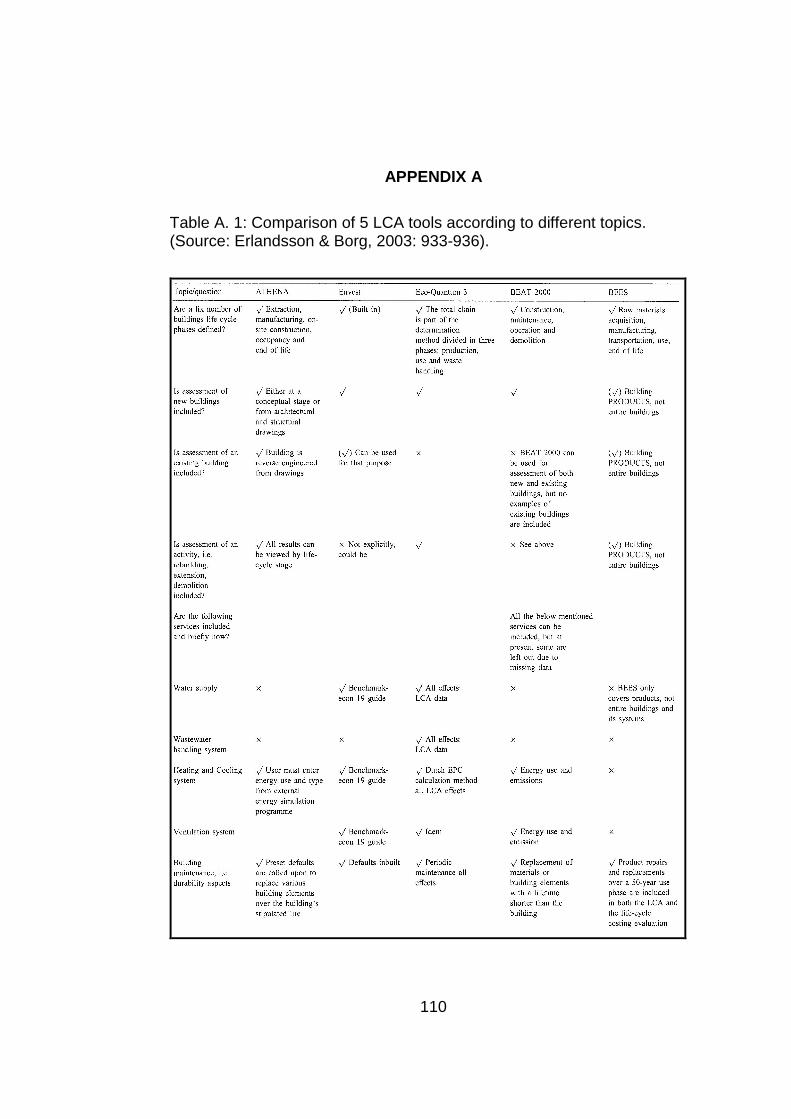
110
APPENDIX A
Table A. 1: Comparison of 5 LCA tools according to different topics. (Source: Erlandsson & Borg, 2003: 933-936).

111
Table A.1: (continued)
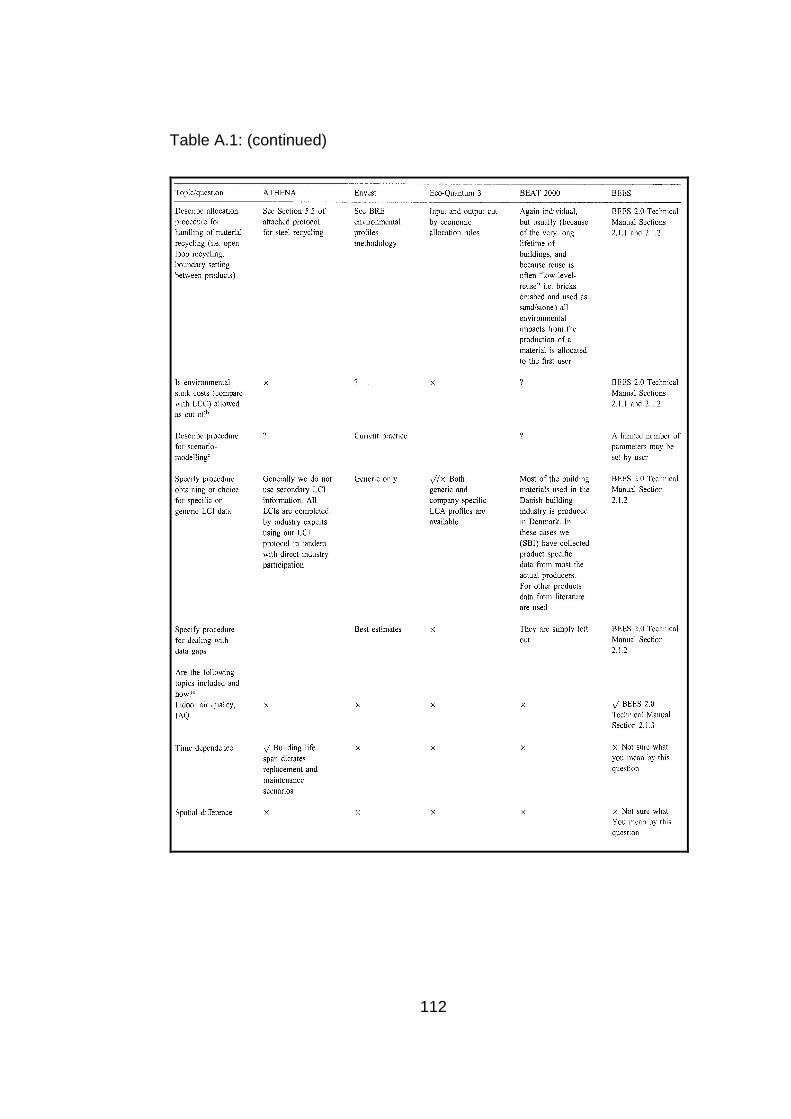
112
Table A.1: (continued)
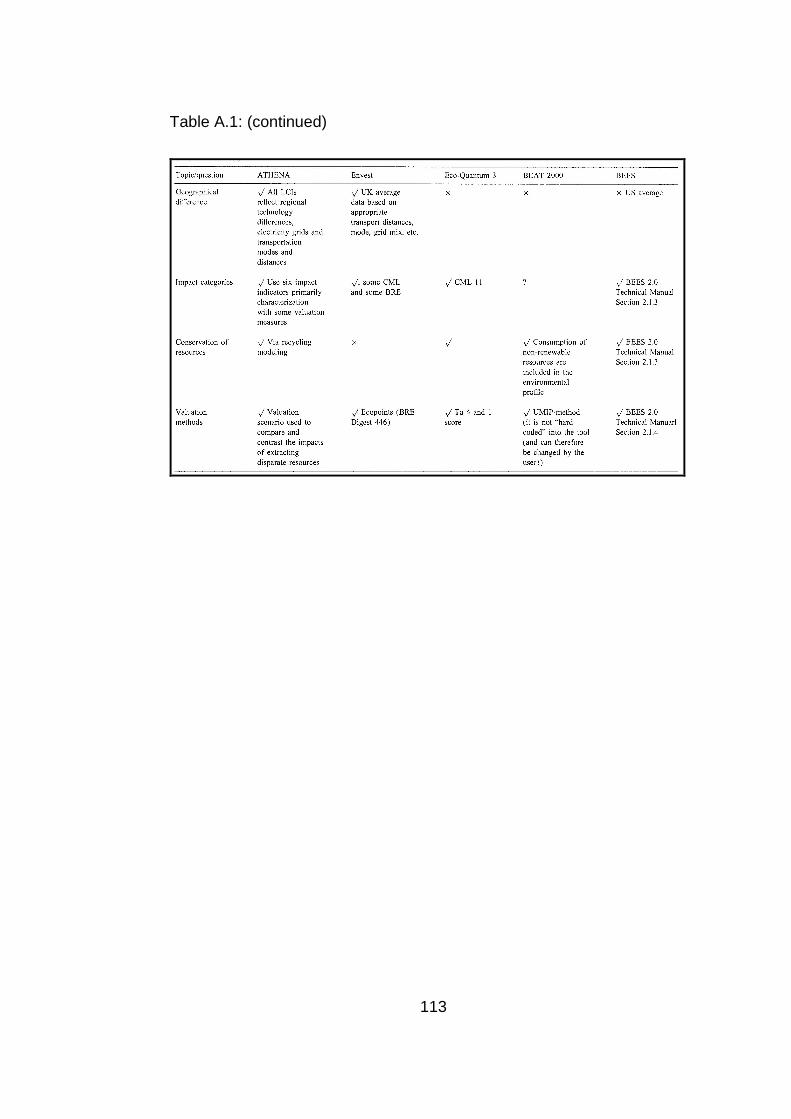
113
Table A.1: (continued)

114
Table A. 2: ATHENA Products. (Source: http://www.athenasmi.ca/database/, last access 19.05.2007).
Structural Products
Wood Products
16 products available in various length, thickness, and load carrying designations. Some available in a number of combinations for both Canada and the United States. Data initially developed in 1993; softwood lumber database updated in 1999. US data developed between 2000 and 2002. • Softwood Lumber (Green & KD) • Plywood • Oriented Strand Board (OSB) • Glulam • Laminated Veneer Lumber (LVL) • Parallel Strand Lumber PSL • Wood I - Joists • Lumber or LVL flange • Plywood or OSB web • Light Frame Trusses • Pitched Roof • Parallel Chord Truss • Composite wood/steel trusses • Lumber flange(s) and steel tubing web
Steel Products
17 products available in various length, thickness (ga.), and load carrying designations produced in virgin (integrated), electric-arc (mini-mill) and in combination integrated and mini-mills. Data initially developed in the period 1992-1995. Data updated 2002 for both Canada and the United States. • Galvanized C-studs and tracks • Galvanized C-joists • Wire Mesh • Ladder Wire • Fasteners • screws • nails • nuts and bolts • Open Web Joists • Rebar and Rod • Light sections • Hollow Structural Steel • Tubing and bracing • Hot rolled sheet
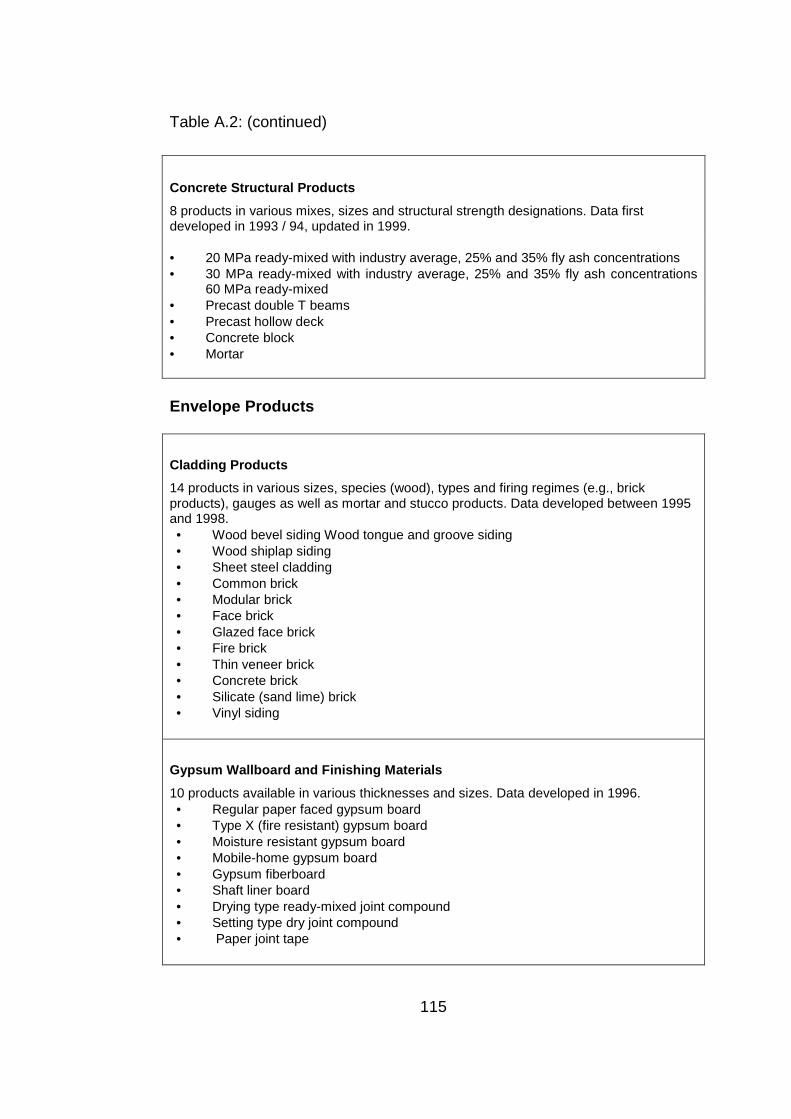
115
Table A.2: (continued)
Concrete Structural Products
8 products in various mixes, sizes and structural strength designations. Data first developed in 1993 / 94, updated in 1999. • 20 MPa ready-mixed with industry average, 25% and 35% fly ash concentrations • 30 MPa ready-mixed with industry average, 25% and 35% fly ash concentrations
60 MPa ready-mixed • Precast double T beams • Precast hollow deck • Concrete block • Mortar
Envelope Products
Cladding Products
14 products in various sizes, species (wood), types and firing regimes (e.g., brick products), gauges as well as mortar and stucco products. Data developed between 1995 and 1998.
• Wood bevel siding Wood tongue and groove siding • Wood shiplap siding • Sheet steel cladding • Common brick • Modular brick • Face brick • Glazed face brick • Fire brick • Thin veneer brick • Concrete brick • Silicate (sand lime) brick • Vinyl siding
Gypsum Wallboard and Finishing Materials
10 products available in various thicknesses and sizes. Data developed in 1996. • Regular paper faced gypsum board • Type X (fire resistant) gypsum board • Moisture resistant gypsum board • Mobile-home gypsum board • Gypsum fiberboard • Shaft liner board • Drying type ready-mixed joint compound • Setting type dry joint compound • Paper joint tape

116
Table A.2: (continued) Insulation and Vapor Barriers 7 products in various densities and thicknesses (R-values). First developed in 1998 and verified, expanded and updated in 1999. • Rockwool(mineral) batt • Fiberglass Batt • Cellulose • Polystyrene Rigid • expanded (XPS) • extruded (EPS) • Polisocyanurate foam board • Polyethylene vapor barrier
Residential Roofing
• #15 and #30 building paper (felt) • Organic (paper) and fiberglass based asphalt shingles of various durability
weights • Clay tiles - various weights and shapes • Concrete tiles - various weights and shapes Commercial Roofing
• Type III & IV fiberglass underlayment felt metal roofing • Asphalt Built-up roofing • Modified Bitumen (2-ply) roofing • EPDM & PVC single-ply roofing membranes
Windows & Glazed Curtain Wall
4 double pane sealed glazing unit types using 4 different frame materials in various combinations and dimensions plus a curtain wall application with viewable and opaque glazing as well as spandrel panel. Data first developed in 1998 and verified, expanded and updated in 1999. Double Glazed Systems • Standard • Tin-coated glass • Tin coated glass, argon filled Silver-coated glass, argon filled Window Frame Materials • Wood • PVC • PVC clad wood • Aluminum Paint Finishes • 3 paint types developed in 1998. • Latex acrylic (water-based) • Oil alkyd (solvent-based) • Oil alkyd varnish (solvent-based)

117
APPENDIX B Table B. 1: Coted New Buildings and Additions by Use
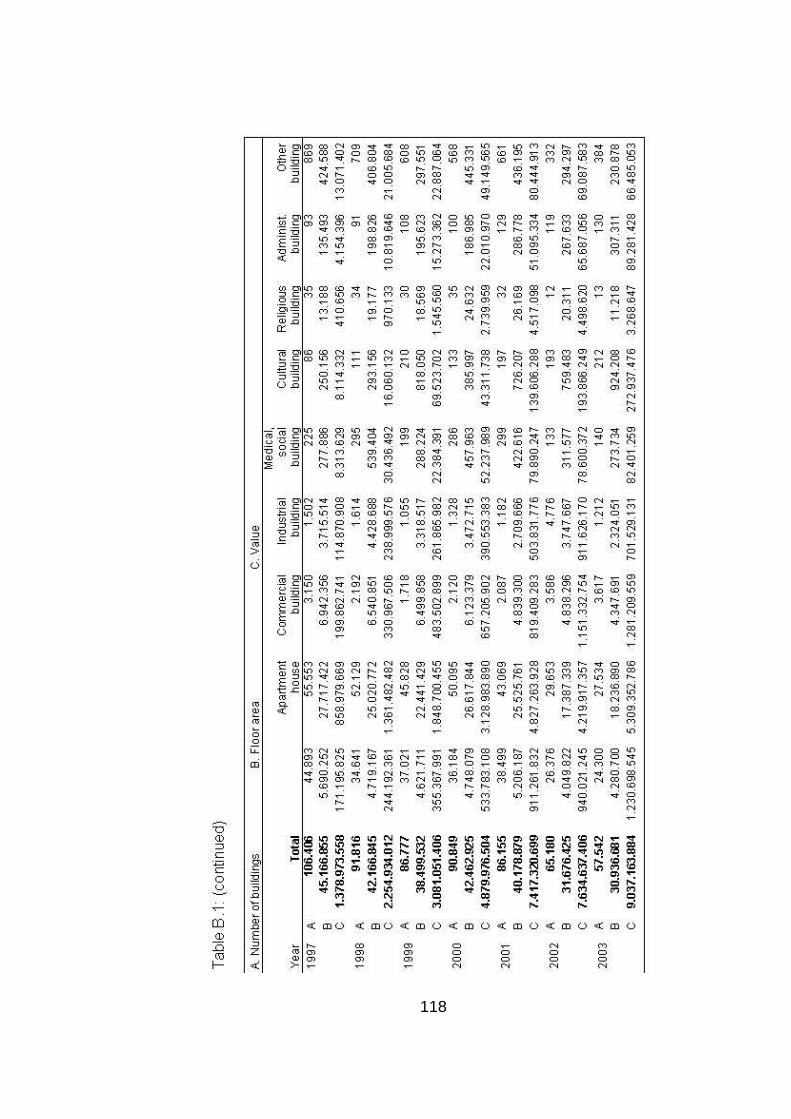
118
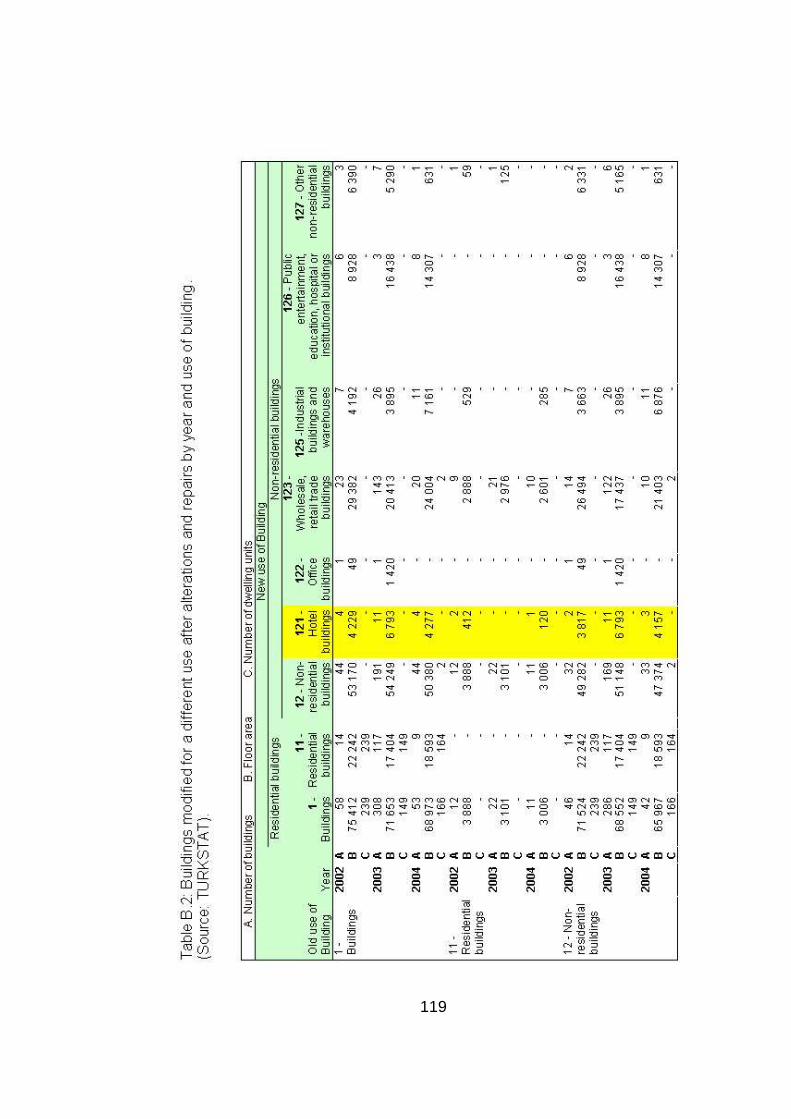
119
Table B. 2: Buildings Modified for A Different Use after Alterations and Repairs By year and Use of Building.
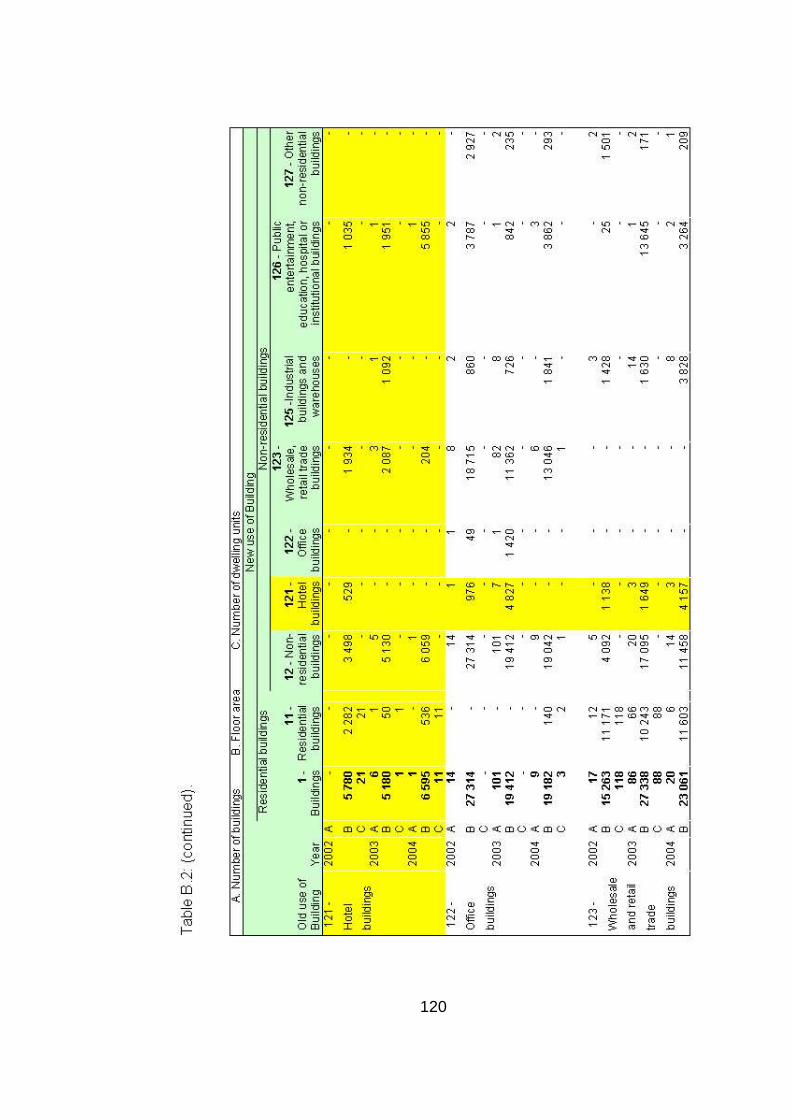
120
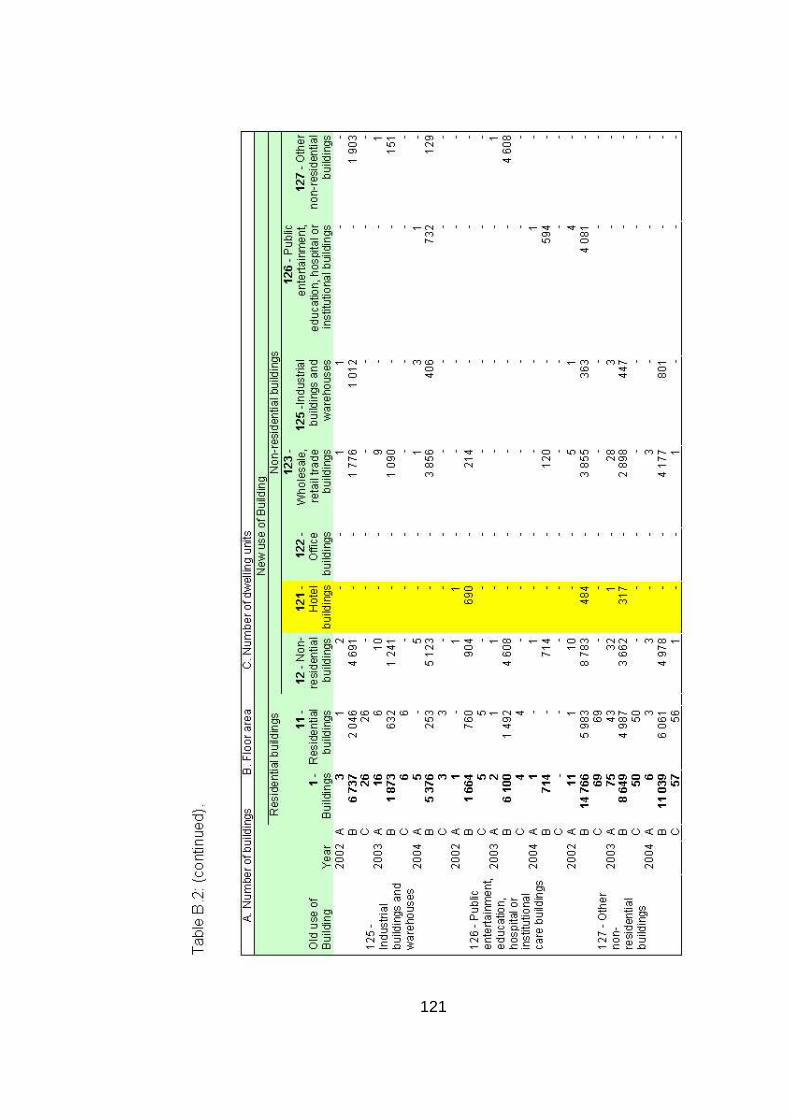
121
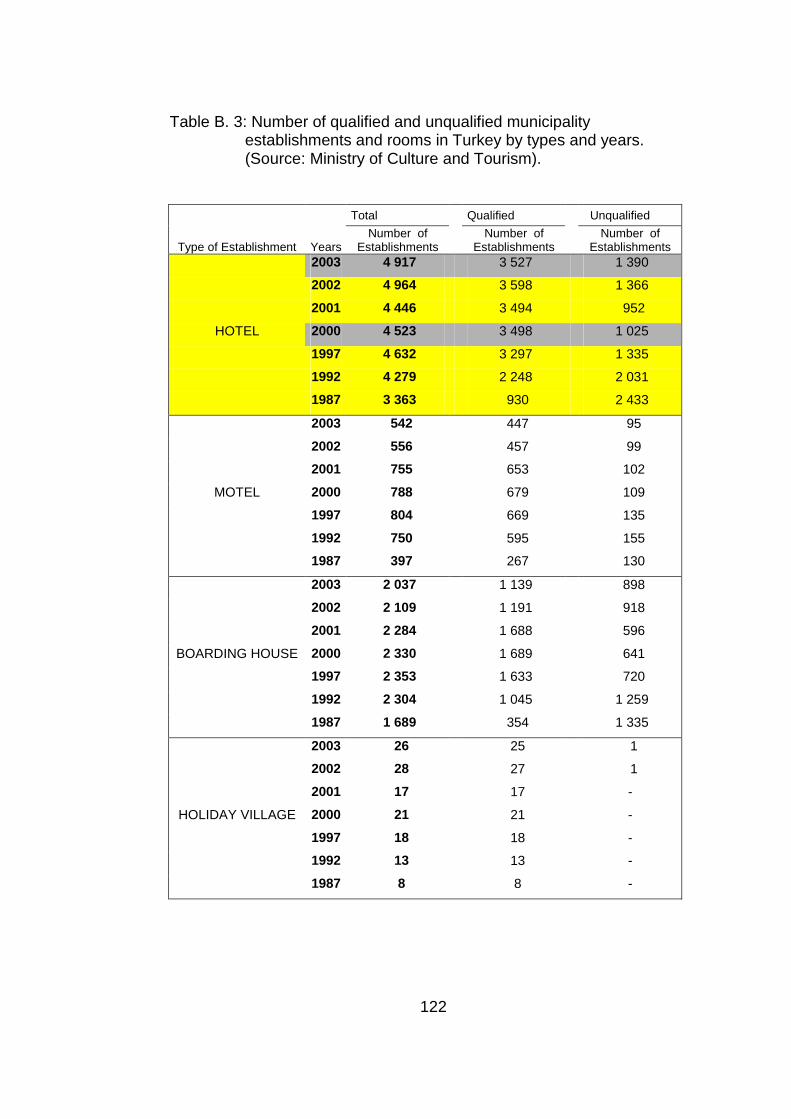
122
Table B. 3: Number of qualified and unqualified municipality establishments and rooms in Turkey by types and years. (Source: Ministry of Culture and Tourism).
Total Qualified Unqualified
Type of Establishment Years Number of
Establishments Number of
Establishments Number of
Establishments 2003 4 917 3 527 1 390
2002 4 964 3 598 1 366
2001 4 446 3 494 952
HOTEL 2000 4 523 3 498 1 025
1997 4 632 3 297 1 335
1992 4 279 2 248 2 031
1987 3 363 930 2 433
2003 542 447 95
2002 556 457 99
2001 755 653 102
MOTEL 2000 788 679 109
1997 804 669 135
1992 750 595 155
1987 397 267 130
2003 2 037 1 139 898
2002 2 109 1 191 918
2001 2 284 1 688 596
BOARDING HOUSE 2000 2 330 1 689 641
1997 2 353 1 633 720
1992 2 304 1 045 1 259
1987 1 689 354 1 335
2003 26 25 1
2002 28 27 1
2001 17 17 -
HOLIDAY VILLAGE 2000 21 21 -
1997 18 18 -
1992 13 13 -
1987 8 8 -
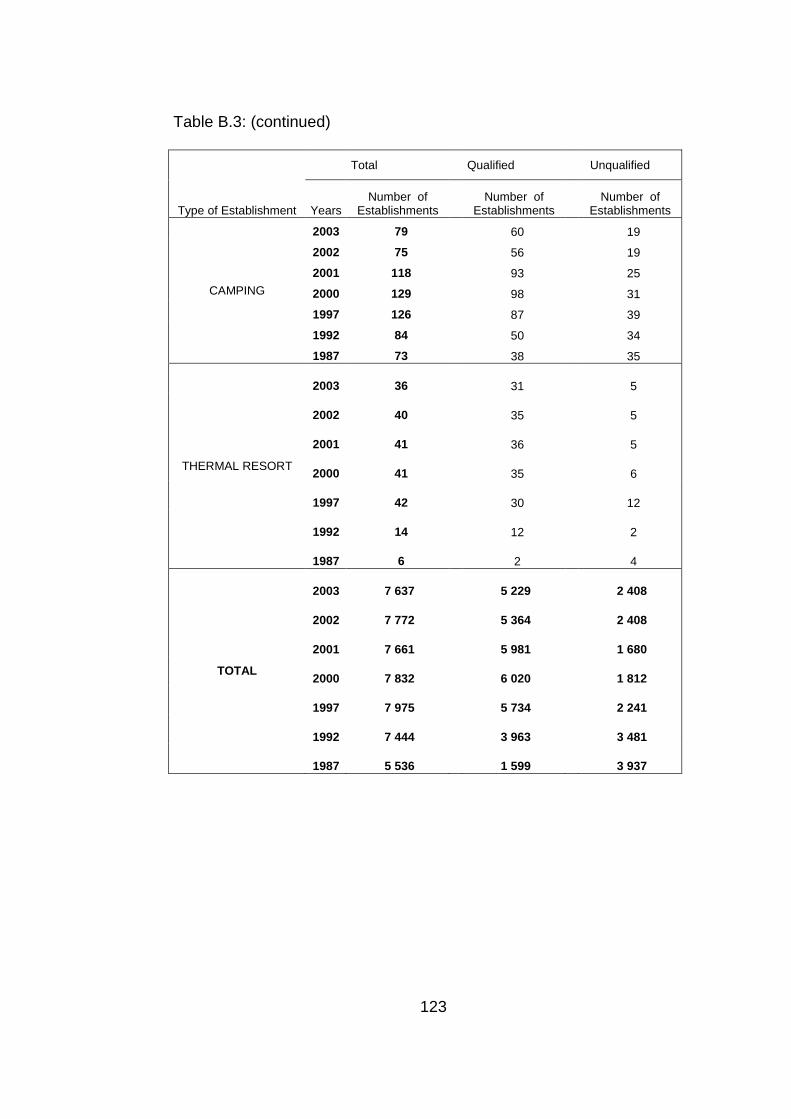
123
Table B.3: (continued)
Total Qualified Unqualified
Type of Establishment Years Number of
Establishments Number of
Establishments Number of
Establishments
2003 79 60 19 2002 75 56 19 2001 118 93 25
CAMPING 2000 129 98 31
1997 126 87 39 1992 84 50 34 1987 73 38 35
2003 36 31 5
2002 40 35 5
2001 41 36 5
THERMAL RESORT 2000 41 35 6
1997 42 30 12
1992 14 12 2
1987 6 2 4
2003 7 637 5 229 2 408
2002 7 772 5 364 2 408
2001 7 661 5 981 1 680
TOTAL 2000 7 832 6 020 1 812
1997 7 975 5 734 2 241
1992 7 444 3 963 3 481
1987 5 536 1 599 3 937
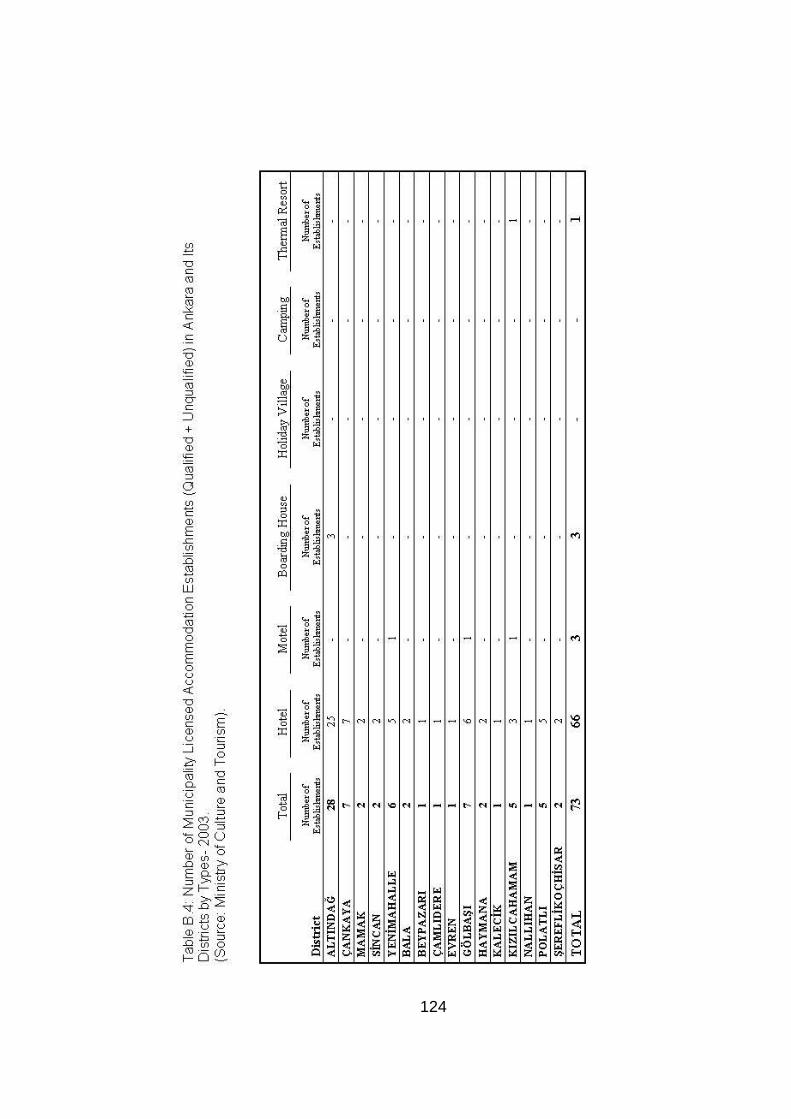
124
Table B. 4: Number of Municipality Licensed Accommodation Establishments in Ankara.
125
Table B. 5: Number of qualified and unqualified municipality licensed hotels by provinces in Turkey – 2003.
(Source: Ministry of Culture and Tourism).
Qualified Unqualified Total
Number of Number of Number of Rank Provinces Establishments Establishments Establishments
1 ANTALYA 652 287 939 2 MUĞLA 577 58 635 3 ĐSTANBUL 294 113 407 4 AYDIN 376 22 398 5 ĐZMĐR 141 90 231 6 BALIKES ĐR 103 27 130 7 BURSA 71 47 118 8 MERSĐN 65 50 115 9 TRABZON 57 52 109
10 ÇANAKKALE 48 41 89 11 ARTVĐN 28 41 69 12 ANKARA 36 30 66 13 KONYA 30 36 66 14 NEVŞEHĐR 49 4 53 15 RĐZE 45 8 53 16 ERZURUM 47 5 52 17 DENĐZLĐ 29 22 51 18 MANĐSA 28 20 48 19 GAZĐANTEP 18 28 46 20 SAMSUN 37 9 46 21 AFYON 31 14 45 22 ADANA 24 17 41 23 DĐYARBAKIR 37 4 41 24 K.MARAŞ 27 12 39 25 KOCAEL Đ 13 25 38 26 SĐVAS 17 18 35 27 TEKĐRDAĞ 28 7 35 28 YALOVA 18 17 35 29 ISPARTA 25 8 33 30 SAKARYA 13 20 33 31 HATAY 25 5 30 32 ORDU 15 15 30 33 KAYSER Đ 18 11 29 34 ERZĐNCAN 16 11 27 35 KASTAMONU 15 12 27 36 ARDAHAN 20 6 26 37 TOKAT 15 10 25 38 KARABÜK 20 5 25 39 AMASYA 16 8 24 40 DÜZCE 14 10 24
126
Table B.5: (continued)
Qualified Unqualified Total Number of Number of Number of
Rank Provinces Establishments Establishments Establishments 41 AĞRI 13 10 23 42 KÜTAHYA 19 4 23 43 SĐNOP 13 10 23 44 VAN 15 8 23 45 YOZGAT 13 10 23 46 ZONGULDAK 17 6 23 47 EDĐRNE 15 7 22 48 KARS 10 12 22 49 MALATYA 11 10 21 50 BARTIN 18 3 21 51 BOLU 15 5 20 52 KIRKLAREL Đ 16 4 20 53 ÇORUM 17 2 19 54 IĞDIR 10 9 19 55 ELAZIĞ 5 12 17 56 ŞANLIURFA 14 3 17 57 BURDUR 16 - 16 58 UŞAK 10 6 16 59 GĐRESUN 9 6 15 60 ŞIRNAK 11 4 15 61 BĐLECĐK 9 5 14 62 BĐTLĐS 7 4 11 63 ÇANKIRI 11 - 11 64 TUNCELĐ 8 3 11 65 ESKĐŞEHĐR 10 - 10 66 AKSARAY 6 4 10 67 NĐĞDE 6 3 9 68 ADIYAMAN 5 3 8 69 GÜMÜŞHANE 6 2 8 70 KIRŞEHĐR 8 - 8 71 HAKKAR Đ 5 2 7 72 MARDĐN 3 4 7 73 SĐĐRT 7 - 7 74 MUŞ 5 1 6 75 KARAMAN 5 1 6 76 KIRIKKALE 4 2 6 77 OSMANĐYE 6 - 6 78 BĐNGÖL 4 - 4 79 BAYBURT 3 - 3 80 BATMAN 2 - 2 81 KĐLĐS 2 - 2
TOTAL 3 527 1 390 4 917
127
Table B. 6: Number of qualified and unqualified municipality licensed hotels by provinces in Turkey – 2000.
(Source: Ministry of Culture and Tourism).
Qualified Unqualified Total
Number of Number of Number of Provinces Establishments Establishments Establishments 1 MUĞLA 145 1217 1362 2 ANTALYA 154 952 1106 3 AYDIN 54 561 615 4 ĐZMĐR 259 257 516 5 ĐSTANBUL 85 384 469 6 BALIKES ĐR 106 341 447 7 MERSĐN 31 200 231 8 DENĐZLĐ 42 165 207 9 ÇANAKKALE 55 96 151 10 ANKARA 34 114 148 11 BURSA 46 97 143 12 TRABZON 34 101 135 13 NEVŞEHĐR 45 89 134 14 KONYA 42 54 96 15 ERZURUM 31 64 95 16 TEKĐRDAĞ 26 58 84 17 YALOVA 12 71 83 18 ARTVĐN 18 61 79 19 RĐZE 21 55 76 20 K.MARAŞ 22 48 70 21 HATAY 32 37 69 22 ADANA 18 45 63 23 MANĐSA 30 31 61 24 SAKARYA 3 54 57 25 ISPARTA 18 37 55 26 KASTAMONU 30 24 54 27 SĐVAS 24 30 54 28 AFYON 19 34 53 29 SAMSUN 13 39 52 30 DĐYARBAKIR 6 43 49 31 KOCAEL Đ 4 40 44 32 ORDU 23 20 43 33 SĐNOP 18 25 43 34 KÜTAHYA 17 2 37 35 GAZĐANTEP 8 28 36 36 ERZĐNCAN 8 24 32 37 ÇORUM 10 21 31 38 ZONGULDAK 13 18 31 39 BARTIN 14 16 30 40 BOLU 5 25 30

128
Table B.6: (continued)
Qualified Unqualified Total
Number of Number of Number of Provinces Establishments Establishments Establishments
41 DÜZCE 4 26 30 42 EDĐRNE 17 12 29 43 KAYSER Đ 8 21 29 44 AMASYA 13 15 28 45 KARABÜK 9 19 28 46 TOKAT 14 14 28 47 KIRKLAREL Đ 12 15 27 48 MALATYA 10 17 27 49 VAN 4 21 25 50 AKSARAY 11 12 23 51 ELAZIĞ 5 18 23 52 IĞDIR 7 16 23 53 ŞANLIURFA 15 8 23 54 ARDAHAN 3 18 21 55 AĞRI 2 18 20 56 GĐRESUN 11 9 20 57 UŞAK 8 12 20 58 KARS 8 9 17 59 YOZGAT 11 6 17 60 ADIYAMAN 10 6 16 61 BĐTLĐS 6 10 16 62 BĐLECĐK 7 8 15 63 BURDUR 7 7 14 64 ÇANKIRI 6 8 14 65 TUNCELĐ 4 10 14 66 BĐNGÖL 9 4 13 67 ESKĐŞEHĐR 13 0 13 68 ŞIRNAK 4 7 11 69 MARDĐN 3 7 10 70 SĐĐRT 3 6 9 71 KIRŞEHĐR 7 1 8 72 NĐĞDE 4 4 8 73 KARAMAN 4 3 7 74 GÜMÜŞHANE 4 2 6 75 MUŞ 3 3 6 76 BAYBURT 3 2 5 77 KIRIKKALE 3 2 5 78 OSMANĐYE 5 0 5 79 BATMAN 2 2 4 80 HAKKAR Đ 3 1 4 81 KĐLĐS 2 1 3
TOTAL 1859 5958 7835
129
Table B. 7: Data related to the different types of alterations and renovation projects approved by the Chamber of Architects in Ankara, during the 5 year period of 2000-2005.
NAME SURNAME PROJECT TYPE PROJECT FIELD PROJECT
DATE
FAĐK AHMET ŞENEL ORTA TADĐLAT KONUT 15-Feb-00
HACI BEKĐR ÜNÜVAR TADĐLAT DUKKAN 23-Dec-00
CELAL ÇAMLIBEL TADĐLAT IS MERK. 9-Jan-01
MEHMET FUAT KARAOĞLU TADĐLAT KONUT 10-May-01
NURĐ OSMAN YURDAKUL TADĐLAT DÜKKAN+KONUT 4-Jun-01
NURĐ OSMAN YURDAKUL TADĐLAT OTEL 15-Jun-01
MEHMET FUAT KARAOĞLU ĐLAVE + TADĐLAT KONUT 3-Aug-01
REFĐK ERDOĞAN TADĐLAT KONUT 25-Oct-01
NURĐ OSMAN YURDAKUL ĐLAVE + TADĐLAT EĞĐTĐM YAPILARI 10-Jun-02
AYDOĞAN ÜNSÜN TADĐLAT KONUT 2-Oct-02
A.ĐMRAN KARAMAN TADĐLAT KONUT 4-Oct-02
BASĐT TADĐLAT KONUT 10-Oct-02
M.ALĐ YAPICIOĞLU ĐLAVE + TADĐLAT 15-Oct-02
AYDOĞAN ÜNSÜN TADĐLAT KONUT 17-Oct-02
NURĐ OSMAN YURDAKUL ĐLAVE + TADĐLAT BURO 18-Oct-02
SEVĐM NOYAN TADĐLAT KONUT 18-Oct-02
CELAL ÇAMLIBEL TADĐLAT ATOLYE 24-Oct-02
HALDUN ERTEKĐN TADĐLAT KONUT 8-Nov-02
ALĐ RAGIP BULUÇ TADĐLAT KONUT 14-Nov-02
MUSTAFA ÜMĐT KALELĐOĞLU TADĐLAT DÜKKAN+KONUT 27-Nov-02
AYDOĞAN ÜNSÜN TADĐLAT KONUT 29-Nov-02
AYDOĞAN ÜNSÜN TADĐLAT KONUT 29-Nov-02
ADEM KOÇ TADĐLAT KONUT 9-Dec-02
HACI BEKĐR ÜNÜVAR TADĐLAT KONUT 9-Dec-02
AYDOĞAN ÜNSÜN TADĐLAT 11-Dec-02
HACI BEKĐR ÜNÜVAR TADĐLAT IS MERK. 11-Dec-02
HACI BEKĐR ÜNÜVAR TADĐLAT ÇARŞI 24-Dec-02
HACI BEKĐR ÜNÜVAR TADĐLAT BURO 24-Dec-02
AYŞE GÜLDER TAŞÇIOĞLU TADĐLAT KONUT 26-Dec-02
ALTAN ERSOY TADĐLAT OTEL 30-Dec-02
ATĐLLA ŞENGONCA TADĐLAT KONUT 30-Dec-02
AYDOĞAN ÜNSÜN TADĐLAT KONUT 31-Dec-02
AYDOĞAN ÜNSÜN TADĐLAT KONUT 31-Dec-02
ZĐYA TANALI TADĐLAT 6-Jan-03
B.HALDUN ERDOĞAN TADĐLAT TĐC.MALĐ END.TAR.YP. 13-Jan-03
METĐN TAMER TADĐLAT ISYERI+KONUT 13-Jan-03
EMĐN ALPER GÜNER TADĐLAT KONUT 21-Jan-03
METĐN AYGÜN TADĐLAT OTEL 21-Jan-03
METĐN TAMER TADĐLAT KONUT 27-Jan-03
M.CEMAL ÖZER TADĐLAT KONUT 3-Feb-03
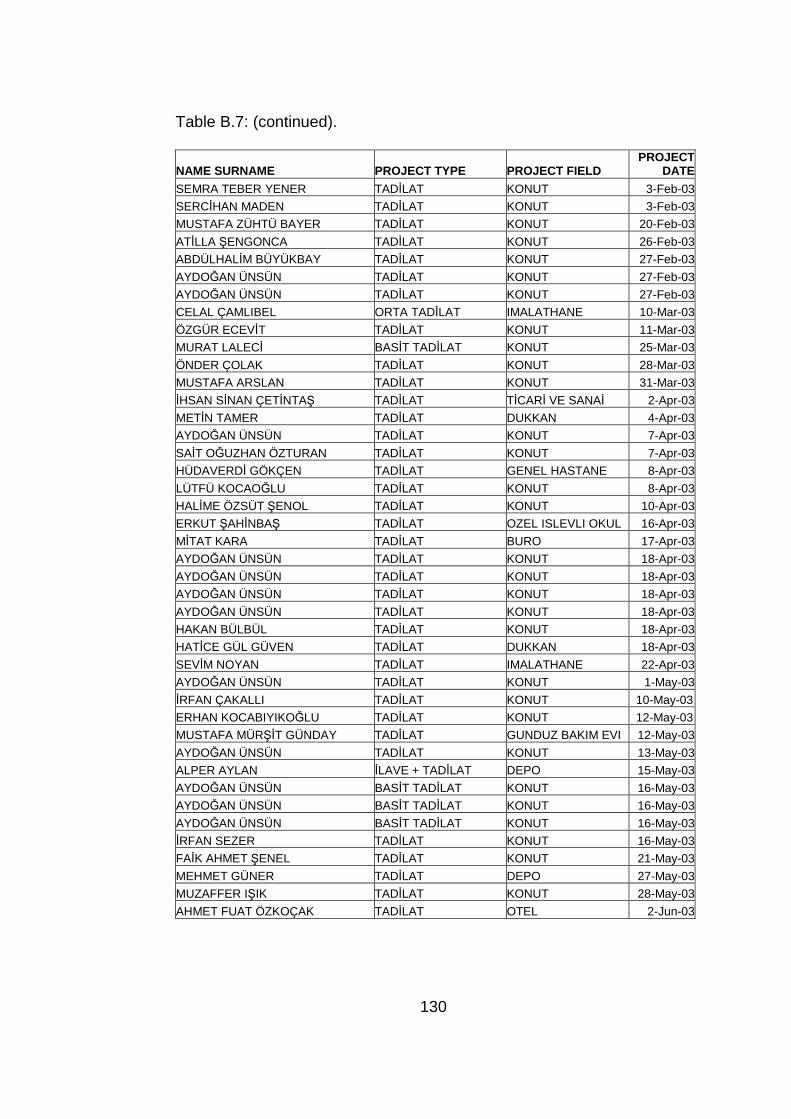
130
Table B.7: (continued).
NAME SURNAME PROJECT TYPE PROJECT FIELD PROJECT
DATE
SEMRA TEBER YENER TADĐLAT KONUT 3-Feb-03
SERCĐHAN MADEN TADĐLAT KONUT 3-Feb-03
MUSTAFA ZÜHTÜ BAYER TADĐLAT KONUT 20-Feb-03
ATĐLLA ŞENGONCA TADĐLAT KONUT 26-Feb-03
ABDÜLHALĐM BÜYÜKBAY TADĐLAT KONUT 27-Feb-03
AYDOĞAN ÜNSÜN TADĐLAT KONUT 27-Feb-03
AYDOĞAN ÜNSÜN TADĐLAT KONUT 27-Feb-03
CELAL ÇAMLIBEL ORTA TADĐLAT IMALATHANE 10-Mar-03
ÖZGÜR ECEVĐT TADĐLAT KONUT 11-Mar-03
MURAT LALECĐ BASĐT TADĐLAT KONUT 25-Mar-03
ÖNDER ÇOLAK TADĐLAT KONUT 28-Mar-03
MUSTAFA ARSLAN TADĐLAT KONUT 31-Mar-03
ĐHSAN SĐNAN ÇETĐNTAŞ TADĐLAT TĐCARĐ VE SANAĐ 2-Apr-03
METĐN TAMER TADĐLAT DUKKAN 4-Apr-03
AYDOĞAN ÜNSÜN TADĐLAT KONUT 7-Apr-03
SAĐT OĞUZHAN ÖZTURAN TADĐLAT KONUT 7-Apr-03
HÜDAVERDĐ GÖKÇEN TADĐLAT GENEL HASTANE 8-Apr-03
LÜTFÜ KOCAOĞLU TADĐLAT KONUT 8-Apr-03
HALĐME ÖZSÜT ŞENOL TADĐLAT KONUT 10-Apr-03
ERKUT ŞAHĐNBAŞ TADĐLAT OZEL ISLEVLI OKUL 16-Apr-03
MĐTAT KARA TADĐLAT BURO 17-Apr-03
AYDOĞAN ÜNSÜN TADĐLAT KONUT 18-Apr-03
AYDOĞAN ÜNSÜN TADĐLAT KONUT 18-Apr-03
AYDOĞAN ÜNSÜN TADĐLAT KONUT 18-Apr-03
AYDOĞAN ÜNSÜN TADĐLAT KONUT 18-Apr-03
HAKAN BÜLBÜL TADĐLAT KONUT 18-Apr-03
HATĐCE GÜL GÜVEN TADĐLAT DUKKAN 18-Apr-03
SEVĐM NOYAN TADĐLAT IMALATHANE 22-Apr-03
AYDOĞAN ÜNSÜN TADĐLAT KONUT 1-May-03
ĐRFAN ÇAKALLI TADĐLAT KONUT 10-May-03
ERHAN KOCABIYIKOĞLU TADĐLAT KONUT 12-May-03
MUSTAFA MÜRŞĐT GÜNDAY TADĐLAT GUNDUZ BAKIM EVI 12-May-03
AYDOĞAN ÜNSÜN TADĐLAT KONUT 13-May-03
ALPER AYLAN ĐLAVE + TADĐLAT DEPO 15-May-03
AYDOĞAN ÜNSÜN BASĐT TADĐLAT KONUT 16-May-03
AYDOĞAN ÜNSÜN BASĐT TADĐLAT KONUT 16-May-03
AYDOĞAN ÜNSÜN BASĐT TADĐLAT KONUT 16-May-03
ĐRFAN SEZER TADĐLAT KONUT 16-May-03
FAĐK AHMET ŞENEL TADĐLAT KONUT 21-May-03
MEHMET GÜNER TADĐLAT DEPO 27-May-03
MUZAFFER IŞIK TADĐLAT KONUT 28-May-03
AHMET FUAT ÖZKOÇAK TADĐLAT OTEL 2-Jun-03
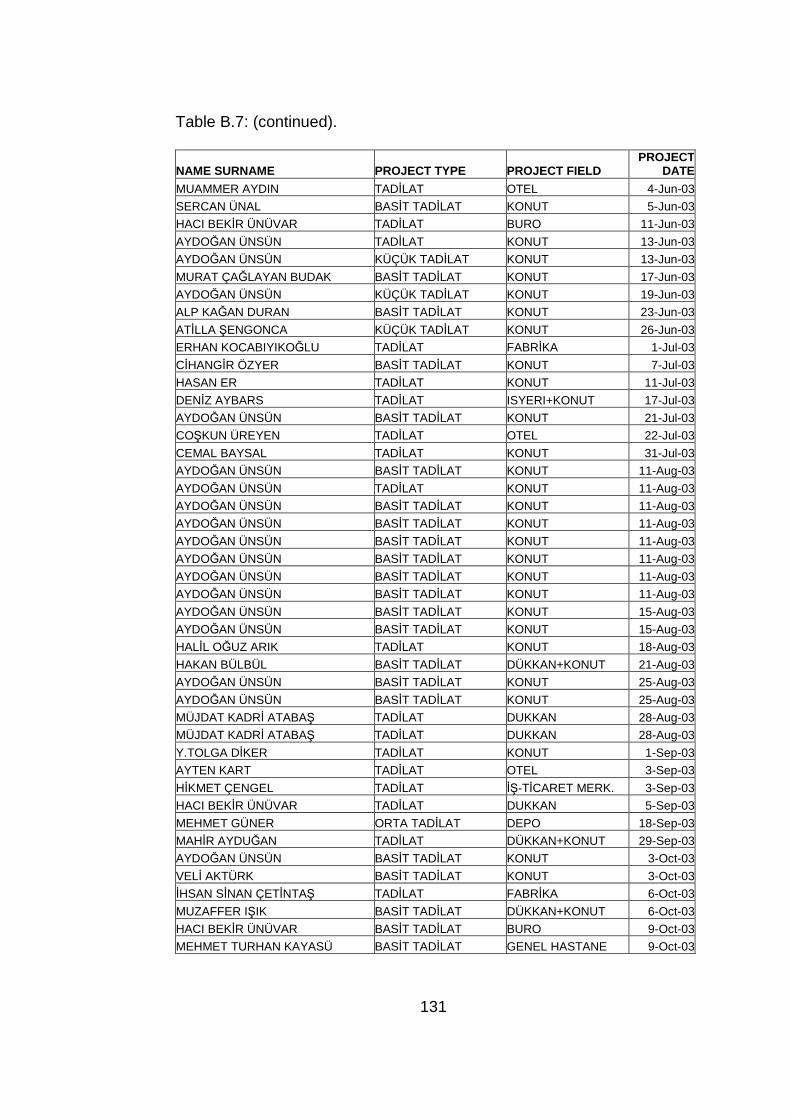
131
Table B.7: (continued).
NAME SURNAME PROJECT TYPE PROJECT FIELD PROJECT
DATE
MUAMMER AYDIN TADĐLAT OTEL 4-Jun-03
SERCAN ÜNAL BASĐT TADĐLAT KONUT 5-Jun-03
HACI BEKĐR ÜNÜVAR TADĐLAT BURO 11-Jun-03
AYDOĞAN ÜNSÜN TADĐLAT KONUT 13-Jun-03
AYDOĞAN ÜNSÜN KÜÇÜK TADĐLAT KONUT 13-Jun-03
MURAT ÇAĞLAYAN BUDAK BASĐT TADĐLAT KONUT 17-Jun-03
AYDOĞAN ÜNSÜN KÜÇÜK TADĐLAT KONUT 19-Jun-03
ALP KAĞAN DURAN BASĐT TADĐLAT KONUT 23-Jun-03
ATĐLLA ŞENGONCA KÜÇÜK TADĐLAT KONUT 26-Jun-03
ERHAN KOCABIYIKOĞLU TADĐLAT FABRĐKA 1-Jul-03
CĐHANGĐR ÖZYER BASĐT TADĐLAT KONUT 7-Jul-03
HASAN ER TADĐLAT KONUT 11-Jul-03
DENĐZ AYBARS TADĐLAT ISYERI+KONUT 17-Jul-03
AYDOĞAN ÜNSÜN BASĐT TADĐLAT KONUT 21-Jul-03
COŞKUN ÜREYEN TADĐLAT OTEL 22-Jul-03
CEMAL BAYSAL TADĐLAT KONUT 31-Jul-03
AYDOĞAN ÜNSÜN BASĐT TADĐLAT KONUT 11-Aug-03
AYDOĞAN ÜNSÜN TADĐLAT KONUT 11-Aug-03
AYDOĞAN ÜNSÜN BASĐT TADĐLAT KONUT 11-Aug-03
AYDOĞAN ÜNSÜN BASĐT TADĐLAT KONUT 11-Aug-03
AYDOĞAN ÜNSÜN BASĐT TADĐLAT KONUT 11-Aug-03
AYDOĞAN ÜNSÜN BASĐT TADĐLAT KONUT 11-Aug-03
AYDOĞAN ÜNSÜN BASĐT TADĐLAT KONUT 11-Aug-03
AYDOĞAN ÜNSÜN BASĐT TADĐLAT KONUT 11-Aug-03
AYDOĞAN ÜNSÜN BASĐT TADĐLAT KONUT 15-Aug-03
AYDOĞAN ÜNSÜN BASĐT TADĐLAT KONUT 15-Aug-03
HALĐL OĞUZ ARIK TADĐLAT KONUT 18-Aug-03
HAKAN BÜLBÜL BASĐT TADĐLAT DÜKKAN+KONUT 21-Aug-03
AYDOĞAN ÜNSÜN BASĐT TADĐLAT KONUT 25-Aug-03
AYDOĞAN ÜNSÜN BASĐT TADĐLAT KONUT 25-Aug-03
MÜJDAT KADRĐ ATABAŞ TADĐLAT DUKKAN 28-Aug-03
MÜJDAT KADRĐ ATABAŞ TADĐLAT DUKKAN 28-Aug-03
Y.TOLGA DĐKER TADĐLAT KONUT 1-Sep-03
AYTEN KART TADĐLAT OTEL 3-Sep-03
HĐKMET ÇENGEL TADĐLAT ĐŞ-TĐCARET MERK. 3-Sep-03
HACI BEKĐR ÜNÜVAR TADĐLAT DUKKAN 5-Sep-03
MEHMET GÜNER ORTA TADĐLAT DEPO 18-Sep-03
MAHĐR AYDUĞAN TADĐLAT DÜKKAN+KONUT 29-Sep-03
AYDOĞAN ÜNSÜN BASĐT TADĐLAT KONUT 3-Oct-03
VELĐ AKTÜRK BASĐT TADĐLAT KONUT 3-Oct-03
ĐHSAN SĐNAN ÇETĐNTAŞ TADĐLAT FABRĐKA 6-Oct-03
MUZAFFER IŞIK BASĐT TADĐLAT DÜKKAN+KONUT 6-Oct-03
HACI BEKĐR ÜNÜVAR BASĐT TADĐLAT BURO 9-Oct-03
MEHMET TURHAN KAYASÜ BASĐT TADĐLAT GENEL HASTANE 9-Oct-03
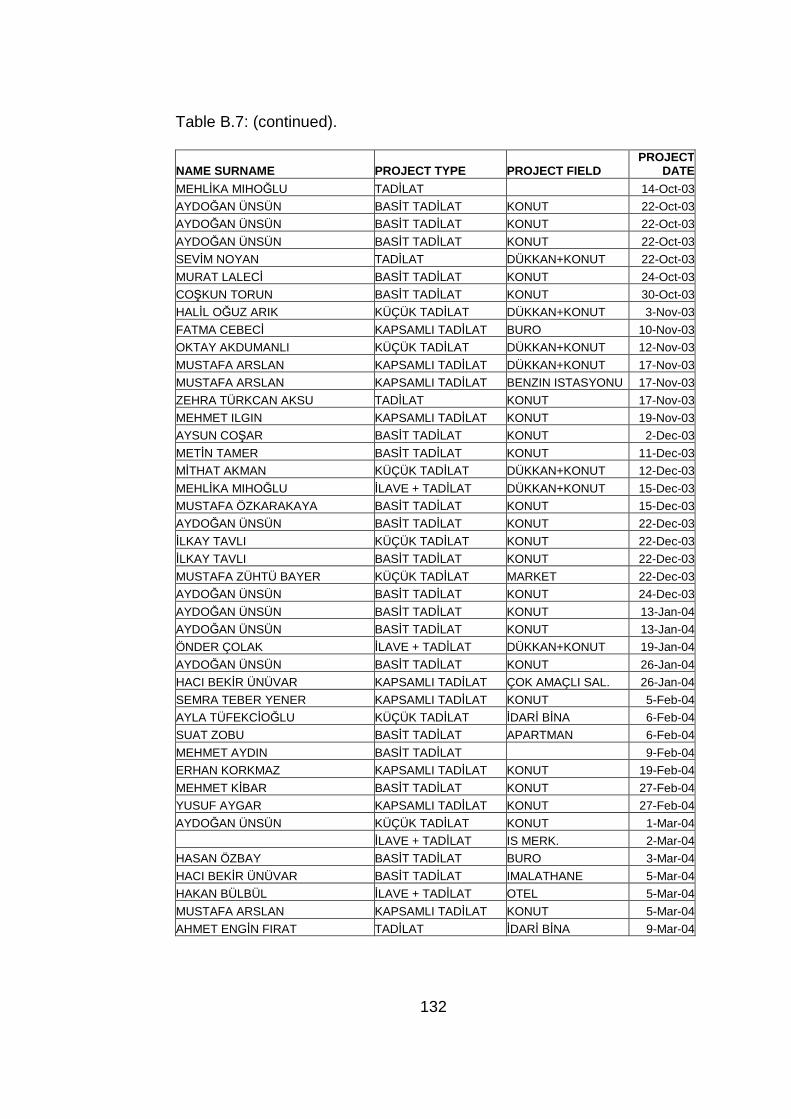
132
Table B.7: (continued).
NAME SURNAME PROJECT TYPE PROJECT FIELD PROJECT
DATE
MEHLĐKA MIHOĞLU TADĐLAT 14-Oct-03
AYDOĞAN ÜNSÜN BASĐT TADĐLAT KONUT 22-Oct-03
AYDOĞAN ÜNSÜN BASĐT TADĐLAT KONUT 22-Oct-03
AYDOĞAN ÜNSÜN BASĐT TADĐLAT KONUT 22-Oct-03
SEVĐM NOYAN TADĐLAT DÜKKAN+KONUT 22-Oct-03
MURAT LALECĐ BASĐT TADĐLAT KONUT 24-Oct-03
COŞKUN TORUN BASĐT TADĐLAT KONUT 30-Oct-03
HALĐL OĞUZ ARIK KÜÇÜK TADĐLAT DÜKKAN+KONUT 3-Nov-03
FATMA CEBECĐ KAPSAMLI TADĐLAT BURO 10-Nov-03
OKTAY AKDUMANLI KÜÇÜK TADĐLAT DÜKKAN+KONUT 12-Nov-03
MUSTAFA ARSLAN KAPSAMLI TADĐLAT DÜKKAN+KONUT 17-Nov-03
MUSTAFA ARSLAN KAPSAMLI TADĐLAT BENZIN ISTASYONU 17-Nov-03
ZEHRA TÜRKCAN AKSU TADĐLAT KONUT 17-Nov-03
MEHMET ILGIN KAPSAMLI TADĐLAT KONUT 19-Nov-03
AYSUN COŞAR BASĐT TADĐLAT KONUT 2-Dec-03
METĐN TAMER BASĐT TADĐLAT KONUT 11-Dec-03
MĐTHAT AKMAN KÜÇÜK TADĐLAT DÜKKAN+KONUT 12-Dec-03
MEHLĐKA MIHOĞLU ĐLAVE + TADĐLAT DÜKKAN+KONUT 15-Dec-03
MUSTAFA ÖZKARAKAYA BASĐT TADĐLAT KONUT 15-Dec-03
AYDOĞAN ÜNSÜN BASĐT TADĐLAT KONUT 22-Dec-03
ĐLKAY TAVLI KÜÇÜK TADĐLAT KONUT 22-Dec-03
ĐLKAY TAVLI BASĐT TADĐLAT KONUT 22-Dec-03
MUSTAFA ZÜHTÜ BAYER KÜÇÜK TADĐLAT MARKET 22-Dec-03
AYDOĞAN ÜNSÜN BASĐT TADĐLAT KONUT 24-Dec-03
AYDOĞAN ÜNSÜN BASĐT TADĐLAT KONUT 13-Jan-04
AYDOĞAN ÜNSÜN BASĐT TADĐLAT KONUT 13-Jan-04
ÖNDER ÇOLAK ĐLAVE + TADĐLAT DÜKKAN+KONUT 19-Jan-04
AYDOĞAN ÜNSÜN BASĐT TADĐLAT KONUT 26-Jan-04
HACI BEKĐR ÜNÜVAR KAPSAMLI TADĐLAT ÇOK AMAÇLI SAL. 26-Jan-04
SEMRA TEBER YENER KAPSAMLI TADĐLAT KONUT 5-Feb-04
AYLA TÜFEKCĐOĞLU KÜÇÜK TADĐLAT ĐDARĐ BĐNA 6-Feb-04
SUAT ZOBU BASĐT TADĐLAT APARTMAN 6-Feb-04
MEHMET AYDIN BASĐT TADĐLAT 9-Feb-04
ERHAN KORKMAZ KAPSAMLI TADĐLAT KONUT 19-Feb-04
MEHMET KĐBAR BASĐT TADĐLAT KONUT 27-Feb-04
YUSUF AYGAR KAPSAMLI TADĐLAT KONUT 27-Feb-04
AYDOĞAN ÜNSÜN KÜÇÜK TADĐLAT KONUT 1-Mar-04
ĐLAVE + TADĐLAT IS MERK. 2-Mar-04
HASAN ÖZBAY BASĐT TADĐLAT BURO 3-Mar-04
HACI BEKĐR ÜNÜVAR BASĐT TADĐLAT IMALATHANE 5-Mar-04
HAKAN BÜLBÜL ĐLAVE + TADĐLAT OTEL 5-Mar-04
MUSTAFA ARSLAN KAPSAMLI TADĐLAT KONUT 5-Mar-04
AHMET ENGĐN FIRAT TADĐLAT ĐDARĐ BĐNA 9-Mar-04

133
Table B.7: (continued).
NAME SURNAME PROJECT TYPE PROJECT FIELD PROJECT
DATE
ĐRFAN ÇAKALLI BASĐT TADĐLAT KONUT 10-Mar-04
AYDOĞAN ÜNSÜN KÜÇÜK TADĐLAT KONUT 12-Mar-04
MURAT LALECĐ ĐLAVE + TADĐLAT KONUT 12-Mar-04
MURAT LALECĐ KÜÇÜK TADĐLAT KONUT 12-Mar-04
MURAT LALECĐ KÜÇÜK TADĐLAT KONUT 12-Mar-04
ABDULLAH EMRE ÖZĐKĐNCĐ BASĐT TADĐLAT KONUT 19-Mar-04
MEHMET ALTUNTAŞ ĐLAVE + TADĐLAT HASTANE 19-Mar-04
A.CAN ERSAN KÜÇÜK TADĐLAT BENZIN ISTASYONU 22-Mar-04
AYDOĞAN ÜNSÜN KÜÇÜK TADĐLAT KONUT 22-Mar-04
AYDOĞAN ÜNSÜN KÜÇÜK TADĐLAT KONUT 22-Mar-04
AYKUT SONOL TOLGAY BASĐT TADĐLAT BURO 22-Mar-04
RÜSTEM CANTÜRK KÜÇÜK TADĐLAT KONUT 22-Mar-04
HASAN AKYÜZ KÜÇÜK TADĐLAT DÜKKAN+KONUT 23-Mar-04
AHMET HALĐS TURGAY ĐLAVE + TADĐLAT DUKKAN 24-Mar-04
FATMA CEBECĐ BASĐT TADĐLAT BURO 24-Mar-04
TURGUT YURT ORTA TADĐLAT KONUT 24-Mar-04
HASAN ER ĐLAVE + TADĐLAT KONUT 26-Mar-04
MUSTAFA ŞAHĐN ORTA TADĐLAT ISYERI+KONUT 26-Mar-04
SAĐT OĞUZHAN ÖZTURAN BASĐT TADĐLAT KONUT 26-Mar-04
BÜLENT BĐROĞLU ĐLAVE + TADĐLAT KONUT 29-Mar-04
AHMET ENDER EROL KAPSAMLI TADĐLAT LOKANTA 5-Apr-04
ĐHSAN BĐGE KAPSAMLI TADĐLAT DUKKAN 6-Apr-04
AYDOĞAN ÜNSÜN BASĐT TADĐLAT KONUT 13-Apr-04
YUSUF AYGAR BASĐT TADĐLAT DÜKKAN+KONUT 19-Apr-04
ALĐŞAN BAYRAKDAR BASĐT TADĐLAT IMALATHANE 20-Apr-04
ALĐŞAN BAYRAKDAR BASĐT TADĐLAT IMALATHANE 20-Apr-04
AYDOĞAN ÜNSÜN BASĐT TADĐLAT KONUT 26-Apr-04
AYDOĞAN ÜNSÜN BASĐT TADĐLAT KONUT 26-Apr-04
AYDOĞAN ÜNSÜN BASĐT TADĐLAT KONUT 26-Apr-04
BÜLENT BĐROĞLU KÜÇÜK TADĐLAT ISYERI+KONUT 26-Apr-04
MURAT ÇAĞLAYAN BUDAK KAPSAMLI TADĐLAT SHOWROOM 26-Apr-04
ALP KAĞAN DURAN BASĐT TADĐLAT DUKKAN 28-Apr-04
MEHLĐKA MIHOĞLU BASĐT TADĐLAT KONUT 28-Apr-04
AYDOĞAN ÜNSÜN BASĐT TADĐLAT KONUT 29-Apr-04
ÖMER FARUK SUMMAK BASĐT TADĐLAT APARTMAN 29-Apr-04
FAĐK AHMET ŞENEL BASĐT TADĐLAT IS HANI 30-Apr-04
FAĐK AHMET ŞENEL TADĐLAT IS HANI 30-Apr-04
AYDOĞAN ÜNSÜN KÜÇÜK TADĐLAT KONUT 7-May-04
AYDOĞAN ÜNSÜN KÜÇÜK TADĐLAT KONUT 7-May-04
AYDOĞAN ÜNSÜN KÜÇÜK TADĐLAT KONUT 7-May-04
M.ALĐ YAPICIOĞLU KAPSAMLI TADĐLAT KONUT 10-May-04
HADĐ EMĐROĞLU BASĐT TADĐLAT IS MERK. 14-May-04
AYDOĞAN ÜNSÜN KÜÇÜK TADĐLAT KONUT 20-May-04
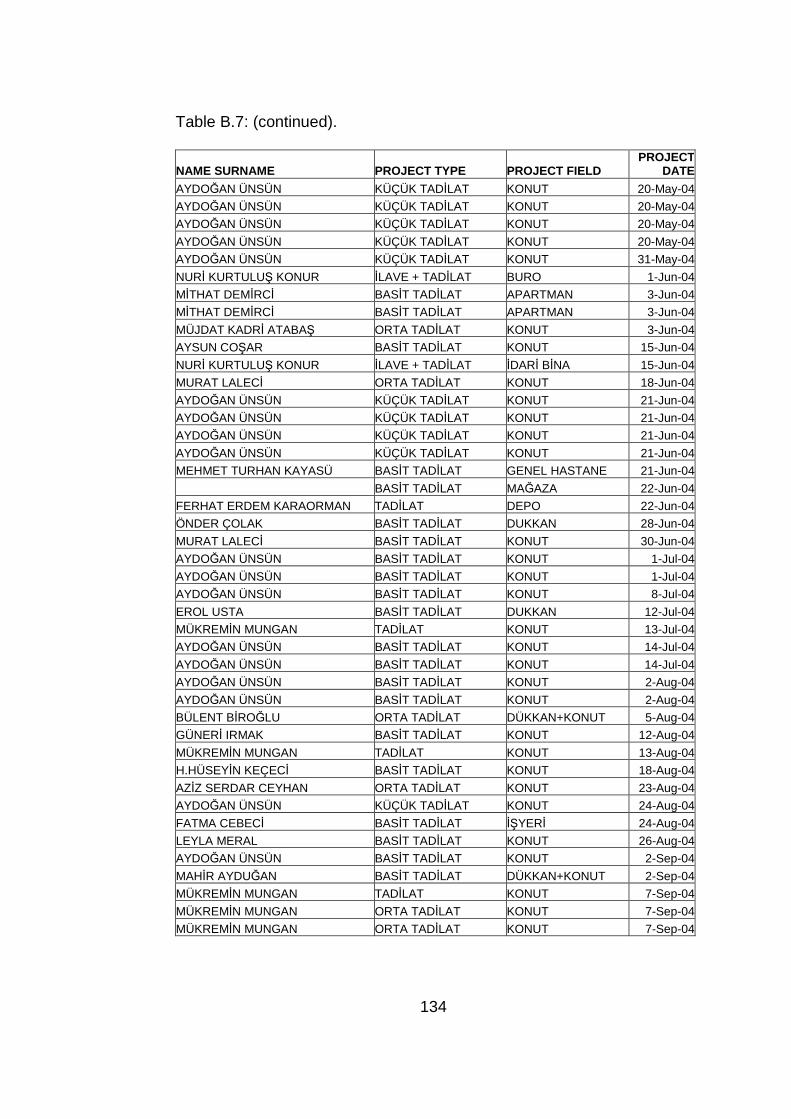
134
Table B.7: (continued).
NAME SURNAME PROJECT TYPE PROJECT FIELD PROJECT
DATE
AYDOĞAN ÜNSÜN KÜÇÜK TADĐLAT KONUT 20-May-04
AYDOĞAN ÜNSÜN KÜÇÜK TADĐLAT KONUT 20-May-04
AYDOĞAN ÜNSÜN KÜÇÜK TADĐLAT KONUT 20-May-04
AYDOĞAN ÜNSÜN KÜÇÜK TADĐLAT KONUT 20-May-04
AYDOĞAN ÜNSÜN KÜÇÜK TADĐLAT KONUT 31-May-04
NURĐ KURTULUŞ KONUR ĐLAVE + TADĐLAT BURO 1-Jun-04
MĐTHAT DEMĐRCĐ BASĐT TADĐLAT APARTMAN 3-Jun-04
MĐTHAT DEMĐRCĐ BASĐT TADĐLAT APARTMAN 3-Jun-04
MÜJDAT KADRĐ ATABAŞ ORTA TADĐLAT KONUT 3-Jun-04
AYSUN COŞAR BASĐT TADĐLAT KONUT 15-Jun-04
NURĐ KURTULUŞ KONUR ĐLAVE + TADĐLAT ĐDARĐ BĐNA 15-Jun-04
MURAT LALECĐ ORTA TADĐLAT KONUT 18-Jun-04
AYDOĞAN ÜNSÜN KÜÇÜK TADĐLAT KONUT 21-Jun-04
AYDOĞAN ÜNSÜN KÜÇÜK TADĐLAT KONUT 21-Jun-04
AYDOĞAN ÜNSÜN KÜÇÜK TADĐLAT KONUT 21-Jun-04
AYDOĞAN ÜNSÜN KÜÇÜK TADĐLAT KONUT 21-Jun-04
MEHMET TURHAN KAYASÜ BASĐT TADĐLAT GENEL HASTANE 21-Jun-04
BASĐT TADĐLAT MAĞAZA 22-Jun-04
FERHAT ERDEM KARAORMAN TADĐLAT DEPO 22-Jun-04
ÖNDER ÇOLAK BASĐT TADĐLAT DUKKAN 28-Jun-04
MURAT LALECĐ BASĐT TADĐLAT KONUT 30-Jun-04
AYDOĞAN ÜNSÜN BASĐT TADĐLAT KONUT 1-Jul-04
AYDOĞAN ÜNSÜN BASĐT TADĐLAT KONUT 1-Jul-04
AYDOĞAN ÜNSÜN BASĐT TADĐLAT KONUT 8-Jul-04
EROL USTA BASĐT TADĐLAT DUKKAN 12-Jul-04
MÜKREMĐN MUNGAN TADĐLAT KONUT 13-Jul-04
AYDOĞAN ÜNSÜN BASĐT TADĐLAT KONUT 14-Jul-04
AYDOĞAN ÜNSÜN BASĐT TADĐLAT KONUT 14-Jul-04
AYDOĞAN ÜNSÜN BASĐT TADĐLAT KONUT 2-Aug-04
AYDOĞAN ÜNSÜN BASĐT TADĐLAT KONUT 2-Aug-04
BÜLENT BĐROĞLU ORTA TADĐLAT DÜKKAN+KONUT 5-Aug-04
GÜNERĐ IRMAK BASĐT TADĐLAT KONUT 12-Aug-04
MÜKREMĐN MUNGAN TADĐLAT KONUT 13-Aug-04
H.HÜSEYĐN KEÇECĐ BASĐT TADĐLAT KONUT 18-Aug-04
AZĐZ SERDAR CEYHAN ORTA TADĐLAT KONUT 23-Aug-04
AYDOĞAN ÜNSÜN KÜÇÜK TADĐLAT KONUT 24-Aug-04
FATMA CEBECĐ BASĐT TADĐLAT ĐŞYERĐ 24-Aug-04
LEYLA MERAL BASĐT TADĐLAT KONUT 26-Aug-04
AYDOĞAN ÜNSÜN BASĐT TADĐLAT KONUT 2-Sep-04
MAHĐR AYDUĞAN BASĐT TADĐLAT DÜKKAN+KONUT 2-Sep-04
MÜKREMĐN MUNGAN TADĐLAT KONUT 7-Sep-04
MÜKREMĐN MUNGAN ORTA TADĐLAT KONUT 7-Sep-04
MÜKREMĐN MUNGAN ORTA TADĐLAT KONUT 7-Sep-04
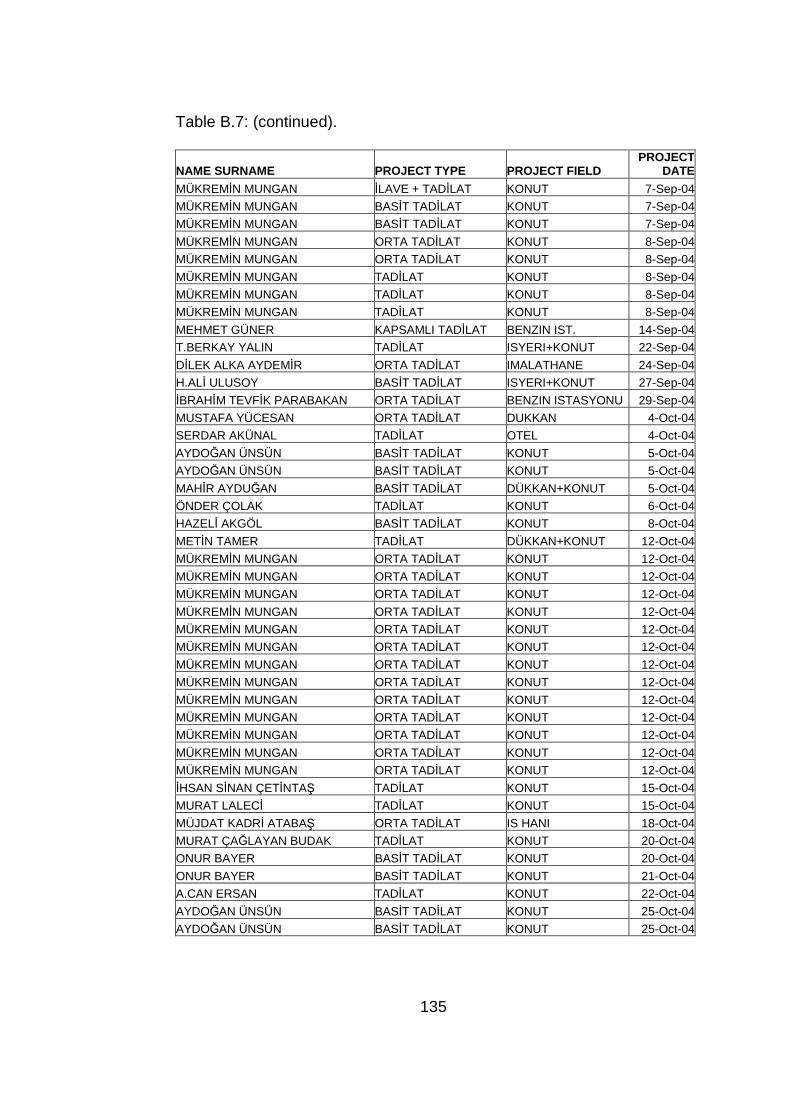
135
Table B.7: (continued).
NAME SURNAME PROJECT TYPE PROJECT FIELD PROJECT
DATE
MÜKREMĐN MUNGAN ĐLAVE + TADĐLAT KONUT 7-Sep-04
MÜKREMĐN MUNGAN BASĐT TADĐLAT KONUT 7-Sep-04
MÜKREMĐN MUNGAN BASĐT TADĐLAT KONUT 7-Sep-04
MÜKREMĐN MUNGAN ORTA TADĐLAT KONUT 8-Sep-04
MÜKREMĐN MUNGAN ORTA TADĐLAT KONUT 8-Sep-04
MÜKREMĐN MUNGAN TADĐLAT KONUT 8-Sep-04
MÜKREMĐN MUNGAN TADĐLAT KONUT 8-Sep-04
MÜKREMĐN MUNGAN TADĐLAT KONUT 8-Sep-04
MEHMET GÜNER KAPSAMLI TADĐLAT BENZIN IST. 14-Sep-04
T.BERKAY YALIN TADĐLAT ISYERI+KONUT 22-Sep-04
DĐLEK ALKA AYDEMĐR ORTA TADĐLAT IMALATHANE 24-Sep-04
H.ALĐ ULUSOY BASĐT TADĐLAT ISYERI+KONUT 27-Sep-04
ĐBRAHĐM TEVFĐK PARABAKAN ORTA TADĐLAT BENZIN ISTASYONU 29-Sep-04
MUSTAFA YÜCESAN ORTA TADĐLAT DUKKAN 4-Oct-04
SERDAR AKÜNAL TADĐLAT OTEL 4-Oct-04
AYDOĞAN ÜNSÜN BASĐT TADĐLAT KONUT 5-Oct-04
AYDOĞAN ÜNSÜN BASĐT TADĐLAT KONUT 5-Oct-04
MAHĐR AYDUĞAN BASĐT TADĐLAT DÜKKAN+KONUT 5-Oct-04
ÖNDER ÇOLAK TADĐLAT KONUT 6-Oct-04
HAZELĐ AKGÖL BASĐT TADĐLAT KONUT 8-Oct-04
METĐN TAMER TADĐLAT DÜKKAN+KONUT 12-Oct-04
MÜKREMĐN MUNGAN ORTA TADĐLAT KONUT 12-Oct-04
MÜKREMĐN MUNGAN ORTA TADĐLAT KONUT 12-Oct-04
MÜKREMĐN MUNGAN ORTA TADĐLAT KONUT 12-Oct-04
MÜKREMĐN MUNGAN ORTA TADĐLAT KONUT 12-Oct-04
MÜKREMĐN MUNGAN ORTA TADĐLAT KONUT 12-Oct-04
MÜKREMĐN MUNGAN ORTA TADĐLAT KONUT 12-Oct-04
MÜKREMĐN MUNGAN ORTA TADĐLAT KONUT 12-Oct-04
MÜKREMĐN MUNGAN ORTA TADĐLAT KONUT 12-Oct-04
MÜKREMĐN MUNGAN ORTA TADĐLAT KONUT 12-Oct-04
MÜKREMĐN MUNGAN ORTA TADĐLAT KONUT 12-Oct-04
MÜKREMĐN MUNGAN ORTA TADĐLAT KONUT 12-Oct-04
MÜKREMĐN MUNGAN ORTA TADĐLAT KONUT 12-Oct-04
MÜKREMĐN MUNGAN ORTA TADĐLAT KONUT 12-Oct-04
ĐHSAN SĐNAN ÇETĐNTAŞ TADĐLAT KONUT 15-Oct-04
MURAT LALECĐ TADĐLAT KONUT 15-Oct-04
MÜJDAT KADRĐ ATABAŞ ORTA TADĐLAT IS HANI 18-Oct-04
MURAT ÇAĞLAYAN BUDAK TADĐLAT KONUT 20-Oct-04
ONUR BAYER BASĐT TADĐLAT KONUT 20-Oct-04
ONUR BAYER BASĐT TADĐLAT KONUT 21-Oct-04
A.CAN ERSAN TADĐLAT KONUT 22-Oct-04
AYDOĞAN ÜNSÜN BASĐT TADĐLAT KONUT 25-Oct-04
AYDOĞAN ÜNSÜN BASĐT TADĐLAT KONUT 25-Oct-04
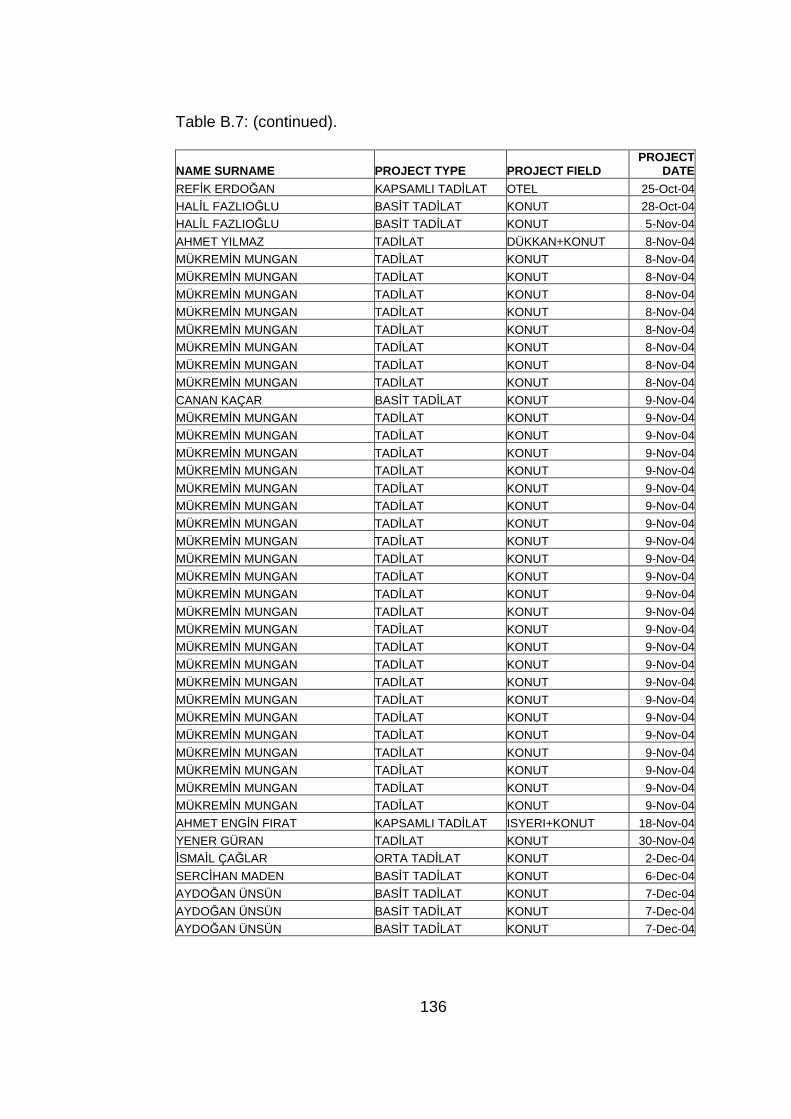
136
Table B.7: (continued).
NAME SURNAME PROJECT TYPE PROJECT FIELD PROJECT
DATE
REFĐK ERDOĞAN KAPSAMLI TADĐLAT OTEL 25-Oct-04
HALĐL FAZLIOĞLU BASĐT TADĐLAT KONUT 28-Oct-04
HALĐL FAZLIOĞLU BASĐT TADĐLAT KONUT 5-Nov-04
AHMET YILMAZ TADĐLAT DÜKKAN+KONUT 8-Nov-04
MÜKREMĐN MUNGAN TADĐLAT KONUT 8-Nov-04
MÜKREMĐN MUNGAN TADĐLAT KONUT 8-Nov-04
MÜKREMĐN MUNGAN TADĐLAT KONUT 8-Nov-04
MÜKREMĐN MUNGAN TADĐLAT KONUT 8-Nov-04
MÜKREMĐN MUNGAN TADĐLAT KONUT 8-Nov-04
MÜKREMĐN MUNGAN TADĐLAT KONUT 8-Nov-04
MÜKREMĐN MUNGAN TADĐLAT KONUT 8-Nov-04
MÜKREMĐN MUNGAN TADĐLAT KONUT 8-Nov-04
CANAN KAÇAR BASĐT TADĐLAT KONUT 9-Nov-04
MÜKREMĐN MUNGAN TADĐLAT KONUT 9-Nov-04
MÜKREMĐN MUNGAN TADĐLAT KONUT 9-Nov-04
MÜKREMĐN MUNGAN TADĐLAT KONUT 9-Nov-04
MÜKREMĐN MUNGAN TADĐLAT KONUT 9-Nov-04
MÜKREMĐN MUNGAN TADĐLAT KONUT 9-Nov-04
MÜKREMĐN MUNGAN TADĐLAT KONUT 9-Nov-04
MÜKREMĐN MUNGAN TADĐLAT KONUT 9-Nov-04
MÜKREMĐN MUNGAN TADĐLAT KONUT 9-Nov-04
MÜKREMĐN MUNGAN TADĐLAT KONUT 9-Nov-04
MÜKREMĐN MUNGAN TADĐLAT KONUT 9-Nov-04
MÜKREMĐN MUNGAN TADĐLAT KONUT 9-Nov-04
MÜKREMĐN MUNGAN TADĐLAT KONUT 9-Nov-04
MÜKREMĐN MUNGAN TADĐLAT KONUT 9-Nov-04
MÜKREMĐN MUNGAN TADĐLAT KONUT 9-Nov-04
MÜKREMĐN MUNGAN TADĐLAT KONUT 9-Nov-04
MÜKREMĐN MUNGAN TADĐLAT KONUT 9-Nov-04
MÜKREMĐN MUNGAN TADĐLAT KONUT 9-Nov-04
MÜKREMĐN MUNGAN TADĐLAT KONUT 9-Nov-04
MÜKREMĐN MUNGAN TADĐLAT KONUT 9-Nov-04
MÜKREMĐN MUNGAN TADĐLAT KONUT 9-Nov-04
MÜKREMĐN MUNGAN TADĐLAT KONUT 9-Nov-04
MÜKREMĐN MUNGAN TADĐLAT KONUT 9-Nov-04
MÜKREMĐN MUNGAN TADĐLAT KONUT 9-Nov-04
AHMET ENGĐN FIRAT KAPSAMLI TADĐLAT ISYERI+KONUT 18-Nov-04
YENER GÜRAN TADĐLAT KONUT 30-Nov-04
ĐSMAĐL ÇAĞLAR ORTA TADĐLAT KONUT 2-Dec-04
SERCĐHAN MADEN BASĐT TADĐLAT KONUT 6-Dec-04
AYDOĞAN ÜNSÜN BASĐT TADĐLAT KONUT 7-Dec-04
AYDOĞAN ÜNSÜN BASĐT TADĐLAT KONUT 7-Dec-04
AYDOĞAN ÜNSÜN BASĐT TADĐLAT KONUT 7-Dec-04
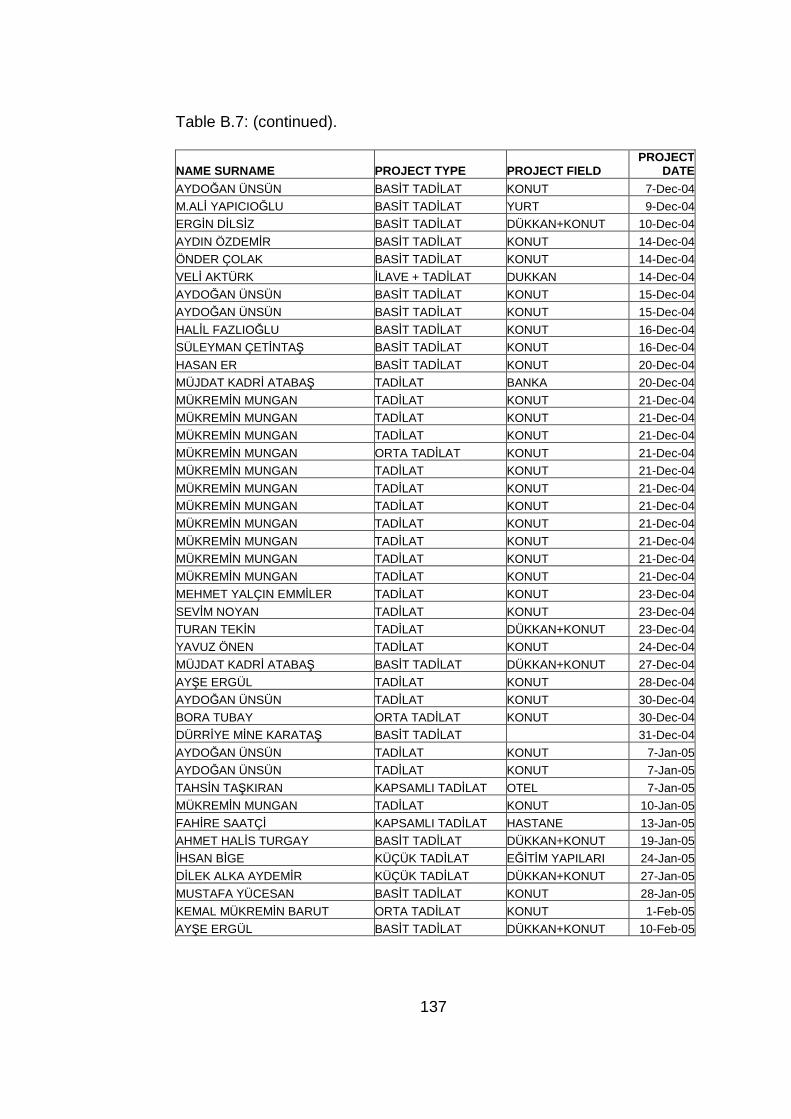
137
Table B.7: (continued).
NAME SURNAME PROJECT TYPE PROJECT FIELD PROJECT
DATE
AYDOĞAN ÜNSÜN BASĐT TADĐLAT KONUT 7-Dec-04
M.ALĐ YAPICIOĞLU BASĐT TADĐLAT YURT 9-Dec-04
ERGĐN DĐLSĐZ BASĐT TADĐLAT DÜKKAN+KONUT 10-Dec-04
AYDIN ÖZDEMĐR BASĐT TADĐLAT KONUT 14-Dec-04
ÖNDER ÇOLAK BASĐT TADĐLAT KONUT 14-Dec-04
VELĐ AKTÜRK ĐLAVE + TADĐLAT DUKKAN 14-Dec-04
AYDOĞAN ÜNSÜN BASĐT TADĐLAT KONUT 15-Dec-04
AYDOĞAN ÜNSÜN BASĐT TADĐLAT KONUT 15-Dec-04
HALĐL FAZLIOĞLU BASĐT TADĐLAT KONUT 16-Dec-04
SÜLEYMAN ÇETĐNTAŞ BASĐT TADĐLAT KONUT 16-Dec-04
HASAN ER BASĐT TADĐLAT KONUT 20-Dec-04
MÜJDAT KADRĐ ATABAŞ TADĐLAT BANKA 20-Dec-04
MÜKREMĐN MUNGAN TADĐLAT KONUT 21-Dec-04
MÜKREMĐN MUNGAN TADĐLAT KONUT 21-Dec-04
MÜKREMĐN MUNGAN TADĐLAT KONUT 21-Dec-04
MÜKREMĐN MUNGAN ORTA TADĐLAT KONUT 21-Dec-04
MÜKREMĐN MUNGAN TADĐLAT KONUT 21-Dec-04
MÜKREMĐN MUNGAN TADĐLAT KONUT 21-Dec-04
MÜKREMĐN MUNGAN TADĐLAT KONUT 21-Dec-04
MÜKREMĐN MUNGAN TADĐLAT KONUT 21-Dec-04
MÜKREMĐN MUNGAN TADĐLAT KONUT 21-Dec-04
MÜKREMĐN MUNGAN TADĐLAT KONUT 21-Dec-04
MÜKREMĐN MUNGAN TADĐLAT KONUT 21-Dec-04
MEHMET YALÇIN EMMĐLER TADĐLAT KONUT 23-Dec-04
SEVĐM NOYAN TADĐLAT KONUT 23-Dec-04
TURAN TEKĐN TADĐLAT DÜKKAN+KONUT 23-Dec-04
YAVUZ ÖNEN TADĐLAT KONUT 24-Dec-04
MÜJDAT KADRĐ ATABAŞ BASĐT TADĐLAT DÜKKAN+KONUT 27-Dec-04
AYŞE ERGÜL TADĐLAT KONUT 28-Dec-04
AYDOĞAN ÜNSÜN TADĐLAT KONUT 30-Dec-04
BORA TUBAY ORTA TADĐLAT KONUT 30-Dec-04
DÜRRĐYE MĐNE KARATAŞ BASĐT TADĐLAT 31-Dec-04
AYDOĞAN ÜNSÜN TADĐLAT KONUT 7-Jan-05
AYDOĞAN ÜNSÜN TADĐLAT KONUT 7-Jan-05
TAHSĐN TAŞKIRAN KAPSAMLI TADĐLAT OTEL 7-Jan-05
MÜKREMĐN MUNGAN TADĐLAT KONUT 10-Jan-05
FAHĐRE SAATÇĐ KAPSAMLI TADĐLAT HASTANE 13-Jan-05
AHMET HALĐS TURGAY BASĐT TADĐLAT DÜKKAN+KONUT 19-Jan-05
ĐHSAN BĐGE KÜÇÜK TADĐLAT EĞĐTĐM YAPILARI 24-Jan-05
DĐLEK ALKA AYDEMĐR KÜÇÜK TADĐLAT DÜKKAN+KONUT 27-Jan-05
MUSTAFA YÜCESAN BASĐT TADĐLAT KONUT 28-Jan-05
KEMAL MÜKREMĐN BARUT ORTA TADĐLAT KONUT 1-Feb-05
AYŞE ERGÜL BASĐT TADĐLAT DÜKKAN+KONUT 10-Feb-05
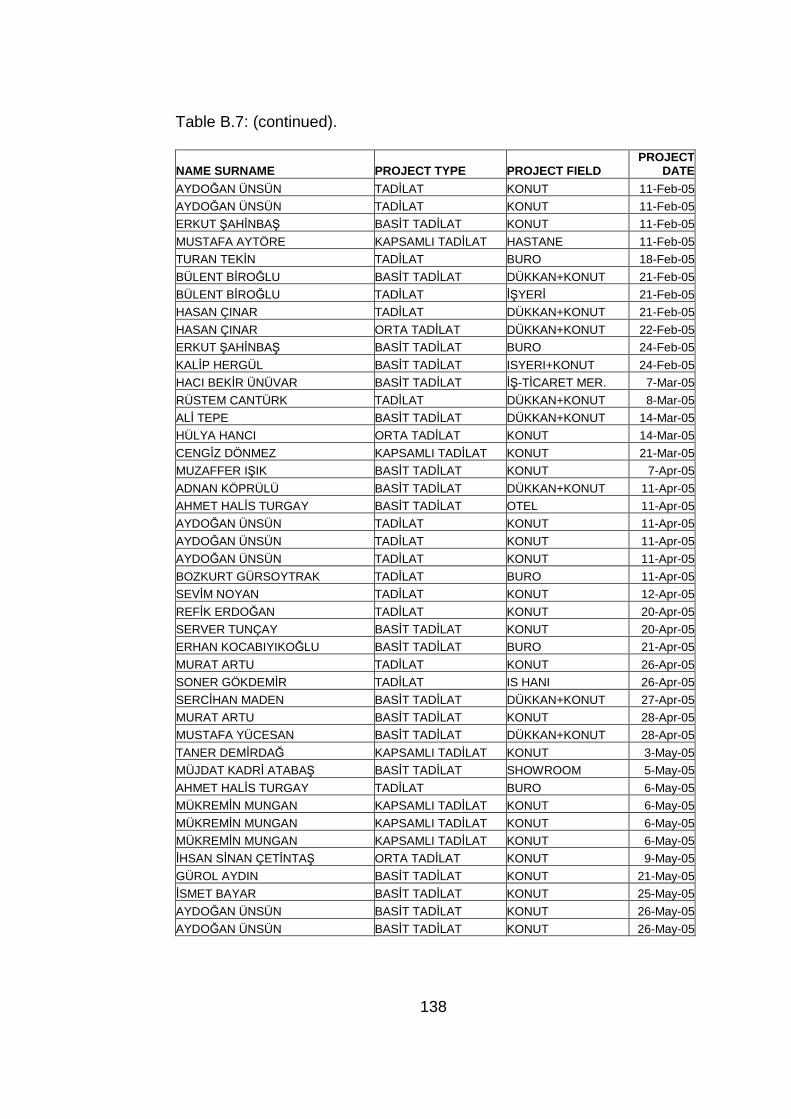
138
Table B.7: (continued).
NAME SURNAME PROJECT TYPE PROJECT FIELD PROJECT
DATE
AYDOĞAN ÜNSÜN TADĐLAT KONUT 11-Feb-05
AYDOĞAN ÜNSÜN TADĐLAT KONUT 11-Feb-05
ERKUT ŞAHĐNBAŞ BASĐT TADĐLAT KONUT 11-Feb-05
MUSTAFA AYTÖRE KAPSAMLI TADĐLAT HASTANE 11-Feb-05
TURAN TEKĐN TADĐLAT BURO 18-Feb-05
BÜLENT BĐROĞLU BASĐT TADĐLAT DÜKKAN+KONUT 21-Feb-05
BÜLENT BĐROĞLU TADĐLAT ĐŞYERĐ 21-Feb-05
HASAN ÇINAR TADĐLAT DÜKKAN+KONUT 21-Feb-05
HASAN ÇINAR ORTA TADĐLAT DÜKKAN+KONUT 22-Feb-05
ERKUT ŞAHĐNBAŞ BASĐT TADĐLAT BURO 24-Feb-05
KALĐP HERGÜL BASĐT TADĐLAT ISYERI+KONUT 24-Feb-05
HACI BEKĐR ÜNÜVAR BASĐT TADĐLAT ĐŞ-TĐCARET MER. 7-Mar-05
RÜSTEM CANTÜRK TADĐLAT DÜKKAN+KONUT 8-Mar-05
ALĐ TEPE BASĐT TADĐLAT DÜKKAN+KONUT 14-Mar-05
HÜLYA HANCI ORTA TADĐLAT KONUT 14-Mar-05
CENGĐZ DÖNMEZ KAPSAMLI TADĐLAT KONUT 21-Mar-05
MUZAFFER IŞIK BASĐT TADĐLAT KONUT 7-Apr-05
ADNAN KÖPRÜLÜ BASĐT TADĐLAT DÜKKAN+KONUT 11-Apr-05
AHMET HALĐS TURGAY BASĐT TADĐLAT OTEL 11-Apr-05
AYDOĞAN ÜNSÜN TADĐLAT KONUT 11-Apr-05
AYDOĞAN ÜNSÜN TADĐLAT KONUT 11-Apr-05
AYDOĞAN ÜNSÜN TADĐLAT KONUT 11-Apr-05
BOZKURT GÜRSOYTRAK TADĐLAT BURO 11-Apr-05
SEVĐM NOYAN TADĐLAT KONUT 12-Apr-05
REFĐK ERDOĞAN TADĐLAT KONUT 20-Apr-05
SERVER TUNÇAY BASĐT TADĐLAT KONUT 20-Apr-05
ERHAN KOCABIYIKOĞLU BASĐT TADĐLAT BURO 21-Apr-05
MURAT ARTU TADĐLAT KONUT 26-Apr-05
SONER GÖKDEMĐR TADĐLAT IS HANI 26-Apr-05
SERCĐHAN MADEN BASĐT TADĐLAT DÜKKAN+KONUT 27-Apr-05
MURAT ARTU BASĐT TADĐLAT KONUT 28-Apr-05
MUSTAFA YÜCESAN BASĐT TADĐLAT DÜKKAN+KONUT 28-Apr-05
TANER DEMĐRDAĞ KAPSAMLI TADĐLAT KONUT 3-May-05
MÜJDAT KADRĐ ATABAŞ BASĐT TADĐLAT SHOWROOM 5-May-05
AHMET HALĐS TURGAY TADĐLAT BURO 6-May-05
MÜKREMĐN MUNGAN KAPSAMLI TADĐLAT KONUT 6-May-05
MÜKREMĐN MUNGAN KAPSAMLI TADĐLAT KONUT 6-May-05
MÜKREMĐN MUNGAN KAPSAMLI TADĐLAT KONUT 6-May-05
ĐHSAN SĐNAN ÇETĐNTAŞ ORTA TADĐLAT KONUT 9-May-05
GÜROL AYDIN BASĐT TADĐLAT KONUT 21-May-05
ĐSMET BAYAR BASĐT TADĐLAT KONUT 25-May-05
AYDOĞAN ÜNSÜN BASĐT TADĐLAT KONUT 26-May-05
AYDOĞAN ÜNSÜN BASĐT TADĐLAT KONUT 26-May-05
139
Table B.7: (continued).
NAME SURNAME PROJECT TYPE PROJECT FIELD PROJECT
DATE
KEMAL MÜKREMĐN BARUT KÜÇÜK TADĐLAT OTEL 27-May-05
BURHAN ÖZÇELĐK BASĐT TADĐLAT KONUT 30-May-05
AYDOĞAN ÜNSÜN BASĐT TADĐLAT KONUT 1-Jun-05
AYDOĞAN ÜNSÜN BASĐT TADĐLAT KONUT 1-Jun-05
AYDOĞAN ÜNSÜN BASĐT TADĐLAT KONUT 1-Jun-05
FATMA CEBECĐ KAPSAMLI TADĐLAT DÜKKAN+KONUT 1-Jun-05
HACER AYRANCIOĞLU YETĐŞ BASĐT TADĐLAT KONUT 1-Jun-05
HACER AYRANCIOĞLU YETĐŞ BASĐT TADĐLAT IS MERK. 1-Jun-05
HÜDAVERDĐ GÖKÇEN KAPSAMLI TADĐLAT KONUT 1-Jun-05
AYDOĞAN ÜNSÜN BASĐT TADĐLAT KONUT 3-Jun-05
YĐĞĐT GÜLÖKSÜZ BASĐT TADĐLAT KONUT 3-Jun-05
FAĐK AHMET ŞENEL BASĐT TADĐLAT DÜKKAN+KONUT 6-Jun-05
SEVĐM NOYAN BASĐT TADĐLAT KONUT 7-Jun-05
MUZAFFER IŞIK KAPSAMLI TADĐLAT ĐŞYERĐ 9-Jun-05
RASĐM ÖZVEREN BASĐT TADĐLAT KONUT 14-Jun-05
ORHAN GÖNÜLAL BASĐT TADĐLAT KONUT 16-Jun-05
YENER GÜRAN BASĐT TADĐLAT LOKANTA 16-Jun-05
YENER GÜRAN BASĐT TADĐLAT KONUT 16-Jun-05
HATĐCE GÜL GÜVEN KAPSAMLI TADĐLAT DÜKKAN+KONUT 17-Jun-05
MEHMET GÜNER KAPSAMLI TADĐLAT KONUT 17-Jun-05
CĐHANGĐR ÖZYER KAPSAMLI TADĐLAT DÜKKAN+KONUT 20-Jun-05
ESER ÖNAL BASĐT TADĐLAT DÜKKAN+KONUT 4-Jul-05
DANYAL TEVFĐK ÇĐPER BASĐT TADĐLAT DÜKKAN+KONUT 6-Jul-05
FATMA CEBECĐ BASĐT TADĐLAT APARTMAN 6-Jul-05
AYDOĞAN ÜNSÜN BASĐT TADĐLAT KONUT 15-Jul-05
AYDOĞAN ÜNSÜN BASĐT TADĐLAT KONUT 15-Jul-05
AYDOĞAN ÜNSÜN BASĐT TADĐLAT KONUT 18-Jul-05
MELTEM MIZRAK KAPSAMLI TADĐLAT LOKANTA 21-Jul-05
AYDOĞAN ÜNSÜN BASĐT TADĐLAT KONUT 26-Jul-05
AYDOĞAN ÜNSÜN BASĐT TADĐLAT KONUT 26-Jul-05
AYDOĞAN ÜNSÜN BASĐT TADĐLAT KONUT 27-Jul-05
ADNAN CEYHUN YAVUZ ORTA TADĐLAT KONUT 29-Jul-05
TEOMAN TANJU ZENCĐRCĐ BASĐT TADĐLAT DÜKKAN+KONUT 2-Aug-05
TEOMAN TANJU ZENCĐRCĐ BASĐT TADĐLAT DÜKKAN+KONUT 2-Aug-05
AYDOĞAN ÜNSÜN BASĐT TADĐLAT KONUT 3-Aug-05
NAMĐ HATIRLI TADĐLAT KONUT 4-Aug-05
BÜLENT BĐROĞLU ORTA TADĐLAT OTEL 9-Aug-05
CANAN KAÇAR BASĐT TADĐLAT KONUT 10-Aug-05
CANAN KAÇAR BASĐT TADĐLAT KONUT 11-Aug-05
AHMET AKIN ORTA TADĐLAT KONUT 12-Aug-05
AHMET FUAT ÖZKOÇAK TADĐLAT ISYERI+KONUT 16-Aug-05
ARZU BAŞAL TADĐLAT DÜKKAN+KONUT 19-Aug-05
HAKAN BÜLBÜL BASĐT TADĐLAT DÜKKAN+KONUT 23-Aug-05
140
Table B.7: (continued).
NAME SURNAME PROJECT TYPE PROJECT FIELD PROJECT
DATE
YÜKSEL BEŞBAŞ ORTA TADĐLAT LOKANTA 23-Aug-05
YÜKSEL BEŞBAŞ ORTA TADĐLAT KONUT 23-Aug-05
YÜKSEL BEŞBAŞ ORTA TADĐLAT KONUT 23-Aug-05
YÜKSEL BEŞBAŞ ORTA TADĐLAT KONUT 23-Aug-05
HACI BEKĐR ÜNÜVAR BASĐT TADĐLAT KONUT 24-Aug-05
HAKAN BÜLBÜL ORTA TADĐLAT KONUT 26-Aug-05
ÖNDER ÇOLAK ORTA TADĐLAT KONUT 26-Aug-05
CANAN KAÇAR BASĐT TADĐLAT KONUT 29-Aug-05
CANAN KAÇAR TADĐLAT KONUT 29-Aug-05
MUZAFFER IŞIK TADĐLAT KONUT 31-Aug-05
TURAN TEKĐN KAPSAMLI TADĐLAT DÜKKAN+KONUT 01-Sep-05
NAMĐ HATIRLI BASĐT TADĐLAT KONUT 05-Sep-05
TEOMAN TANJU ZENCĐRCĐ BASĐT TADĐLAT KONUT 05-Sep-05
AYDOĞAN ÜNSÜN BASĐT TADĐLAT KONUT 06-Sep-05
AYDOĞAN ÜNSÜN BASĐT TADĐLAT KONUT 06-Sep-05
ÖMER FARUK SUMMAK ORTA TADĐLAT KONUT 08-Sep-05
HALE EREN BAŞAL ORTA TADĐLAT IS MERK. 09-Sep-05
ĐHSAN BĐGE BASĐT TADĐLAT DÜKKAN+KONUT 13-Sep-05
MUZAFFER IŞIK TADĐLAT KONUT 14-Sep-05
CANAN KAÇAR BASĐT TADĐLAT KONUT 16-Sep-05
DÜRRĐYE MĐNE KARATAŞ BASĐT TADĐLAT KONUT 22-Sep-05
ORTA TADĐLAT KONUT 22-Sep-05
AHMET SĐNAN KINIKOĞLU TADĐLAT 26-Sep-05
AHMET SĐNAN KINIKOĞLU TADĐLAT 26-Sep-05
AHMET SĐNAN KINIKOĞLU TADĐLAT 26-Sep-05
AHMET SĐNAN KINIKOĞLU TADĐLAT 26-Sep-05
ÜNAL KARA BASĐT TADĐLAT 29-Sep-05
TURAN TEKĐN BASĐT TADĐLAT KONUT 04-Oct-05
HACI BEKĐR ÜNÜVAR BASĐT TADĐLAT 04-Oct-05
AYDOĞAN ÜNSÜN BASĐT TADĐLAT KONUT 06-Oct-05
SÜLEYMAN ÇETĐNTAŞ ORTA TADĐLAT KONUT 06-Oct-05
ALĐ TEPE BASĐT TADĐLAT KONUT 06-Oct-05
CANAN KAÇAR BASĐT TADĐLAT KONUT 10-Oct-05
CANAN KAÇAR BASĐT TADĐLAT KONUT 10-Oct-05
CANAN KAÇAR BASĐT TADĐLAT KONUT 10-Oct-05
CANAN KAÇAR BASĐT TADĐLAT KONUT 10-Oct-05
CANAN KAÇAR BASĐT TADĐLAT KONUT 10-Oct-05
MĐTHAT DEMĐRCĐ BASĐT TADĐLAT KONUT 12-Oct-05
AYDOĞAN ÜNSÜN BASĐT TADĐLAT KONUT 20-Oct-05
AZĐZE MANAP BASĐT TADĐLAT KONUT 20-Oct-05
TURAN TEKĐN BASĐT TADĐLAT KONUT 25-Oct-05
MUAMMER KOÇ TADĐLAT KONUT 08-Nov-05
HĐKMET ÇENGEL BASĐT TADĐLAT ĐŞ MERKEZĐ 11-Nov-05
141
Table B.7: (continued).
NAME SURNAME PROJECT TYPE PROJECT FIELD PROJECT
DATE
AYDOĞAN ÜNSÜN BASĐT TADĐLAT KONUT 11-Nov-05
TURAN TEKĐN TADĐLAT TĐCARĐ VE SANAĐ 14-Nov-05
HALĐL FAZLIOĞLU TADĐLAT KONUT 14-Nov-05
HALĐL FAZLIOĞLU BASĐT TADĐLAT KONUT 14-Nov-05
ÖZGÜR TOP ORTA TADĐLAT IS MERK. 16-Nov-05
HAKAN BÜLBÜL TADĐLAT KONUT 17-Nov-05
HAKAN BÜLBÜL BASĐT TADĐLAT KONUT 17-Nov-05
HACI BEKĐR ÜNÜVAR BASĐT TADĐLAT ĐŞYERĐ 18-Nov-05
AYŞE ERGÜL BASĐT TADĐLAT 21-Nov-05
ALĐ TEPE BASĐT TADĐLAT DÜKKAN+KONUT 22-Nov-05
TÜMAY KORUCUOĞLU BASĐT TADĐLAT KONUT 23-Nov-05
AYDOĞAN ÜNSÜN BASĐT TADĐLAT KONUT 23-Nov-05
AYDOĞAN ÜNSÜN BASĐT TADĐLAT KONUT 23-Nov-05
MEHMET KĐBAR TADĐLAT KONUT 23-Nov-05
MELTEM MIZRAK TADĐLAT DUKKAN 23-Nov-05
ALĐ OSMAN ÖZTÜRK TADĐLAT KONUT 01-Dec-05
SÜLEYMAN ÇETĐNTAŞ ORTA TADĐLAT KONUT 01-Dec-05
AYDOĞAN ÜNSÜN BASĐT TADĐLAT KONUT 02-Dec-05
AYDOĞAN ÜNSÜN BASĐT TADĐLAT KONUT 02-Dec-05
ÖNDER ÇOLAK TADĐLAT KONUT 05-Dec-05
ĐLKNUR ÇOPUR ÇAĞLAR ORTA TADĐLAT APARTMAN 09-Dec-05
ĐLYAS DOĞAN TADĐLAT KONUT 12-Dec-05
ARZU BAŞAL TADĐLAT KONUT 13-Dec-05
HATĐCE GÜL GÜVEN ORTA TADĐLAT KONUT 13-Dec-05
AYDOĞAN ÜNSÜN BASĐT TADĐLAT KONUT 13-Dec-05
SEVĐM NOYAN BASĐT TADĐLAT KONUT 13-Dec-05
ESER ÖNAL BASĐT TADĐLAT KONUT 14-Dec-05
ÖNDER ÇOLAK BASĐT TADĐLAT KONUT 15-Dec-05
AYDOĞAN ÜNSÜN BASĐT TADĐLAT KONUT 15-Dec-05
BURHAN ÖZÇELĐK ORTA TADĐLAT K.SAN. SIT. 19-Dec-05
HATĐCE GÜL GÜVEN ORTA TADĐLAT KONUT 20-Dec-05
ALPER AYLAN ORTA TADĐLAT KONUT 20-Dec-05
ERHAN KORKMAZ TADĐLAT KONUT 20-Dec-05
AYDOĞAN ÜNSÜN BASĐT TADĐLAT KONUT 22-Dec-05
AYDOĞAN ÜNSÜN BASĐT TADĐLAT KONUT 22-Dec-05
CĐHANGĐR ÖZYER BASĐT TADĐLAT KONUT 26-Dec-05
RÜSTEM CANTÜRK BASĐT TADĐLAT DÜKKAN+KONUT 26-Dec-05
RÜSTEM CANTÜRK BASĐT TADĐLAT DÜKKAN+KONUT 26-Dec-05
MĐTHAT AKMAN BASĐT TADĐLAT DÜKKAN+KONUT 28-Dec-05
AYDOĞAN ÜNSÜN BASĐT TADĐLAT KONUT 30-Dec-05
ÖMER FARUK SUMMAK TADĐLAT KONUT 05-Jan-06
ERHAN KORKMAZ BASĐT TADĐLAT DÜKKAN+KONUT 06-Jan-06
BEKĐR CĐNCĐOĞLU BASĐT TADĐLAT DÜKKAN+KONUT 16-Jan-06
142
Table B.7: (continued).
NAME SURNAME PROJECT TYPE PROJECT FIELD PROJECT
DATE
HACI BEKĐR ÜNÜVAR BASĐT TADĐLAT DUKKAN 18-Jan-06
CĐHANGĐR ÖZYER BASĐT TADĐLAT KONUT 26-Jan-06
TEOMAN TANJU ZENCĐRCĐ BASĐT TADĐLAT KONUT 26-Jan-06HACI BEKĐR ÜNÜVAR TADĐLAT IMALATHANE 27-Jan-06
MUAMMER KOÇ BASĐT TADĐLAT KONUT 27-Jan-06
MURAT ÇAĞLAYAN BUDAK TADĐLAT KONUT 31-Jan-06
AYDOĞAN ÜNSÜN BASĐT TADĐLAT KONUT 01-Feb-06
AYDOĞAN ÜNSÜN BASĐT TADĐLAT KONUT 01-Feb-06
AYDOĞAN ÜNSÜN BASĐT TADĐLAT KONUT 01-Feb-06
TURGUT YURT BASĐT TADĐLAT IS MERK. 02-Feb-06
AYDOĞAN ÜNSÜN BASĐT TADĐLAT KONUT 07-Feb-06
AHMET SĐNAN KINIKOĞLU BASĐT TADĐLAT ĐŞYERĐ 09-Feb-06
MAHMUT NEDĐM DĐKMEN BASĐT TADĐLAT KÜLTÜR MERK. 09-Feb-06
YÜKSEL ODABAŞI BASĐT TADĐLAT DÜKKAN+KONUT 10-Feb-06
AHMET AKIN ORTA TADĐLAT KONUT 10-Feb-06
AYDOĞAN ÜNSÜN BASĐT TADĐLAT 14-Feb-06
AYDOĞAN ÜNSÜN BASĐT TADĐLAT KONUT 14-Feb-06
SÜLEYMAN ÇETĐNTAŞ TADĐLAT ISYERI+KONUT 14-Feb-06
ĐSMET BAYAR TADĐLAT KONUT 15-Feb-06
VELĐ AKTÜRK TADĐLAT KONUT 17-Feb-06
H.ALĐ ULUSOY ORTA TADĐLAT APARTMAN 20-Feb-06
H.ALĐ ULUSOY ORTA TADĐLAT APARTMAN 20-Feb-06
AYDOĞAN ÜNSÜN BASĐT TADĐLAT KONUT 24-Feb-06
FATĐH AÇIKALIN TADĐLAT KONUT 27-Feb-06
ÜNAL AKPINAR KAPSAMLI TADĐLAT SAĞLIK VE SOS. HĐZ. 28-Feb-06
AYDOĞAN ÜNSÜN BASĐT TADĐLAT KONUT 28-Feb-06
ŞÜKRÜ DĐKĐCĐ TADĐLAT KONUT 01-Mar-06
AYDOĞAN ÜNSÜN BASĐT TADĐLAT KONUT 01-Mar-06
AYŞE BOZYEL BASĐT TADĐLAT DÜKKAN+KONUT 03-Mar-06
HACI MEHMET TEZEL BASĐT TADĐLAT KONUT 04-Mar-06
AYDOĞAN ÜNSÜN BASĐT TADĐLAT 04-Mar-06
AYDOĞAN ÜNSÜN BASĐT TADĐLAT KONUT 07-Mar-06
ÜNAL AKPINAR KAPSAMLI TADĐLAT SAĞLIK VE SOS. HĐZ. 09-Mar-06
AYDOĞAN ÜNSÜN BASĐT TADĐLAT KONUT 23-Mar-06
CĐHANGĐR ÖZYER KAPSAMLI TADĐLAT DÜKKAN+KONUT 04-Apr-06
ALĐ RAGIP BULUÇ BASĐT TADĐLAT IS MERK. 05-Apr-06
HACI BEKĐR ÜNÜVAR BASĐT TADĐLAT ĐŞYERĐ 07-Apr-06
HACI BEKĐR ÜNÜVAR BASĐT TADĐLAT BENZIN ISTASYONU 07-Apr-06
HACI BEKĐR ÜNÜVAR BASĐT TADĐLAT BURO 07-Apr-06
ORTA TADĐLAT KONUT 10-Apr-06
MURAT ÇAĞLAYAN BUDAK BASĐT TADĐLAT KONUT 10-Apr-06
MUZAFFER IŞIK ORTA TADĐLAT KONUT 10-Apr-06

143
Table B.7: (continued).
NAME SURNAME PROJECT TYPE PROJECT FIELD PROJECT
DATE
MEHMET GÜNER ORTA TADĐLAT FABRĐKA 10-Apr-06
ERDAL ALTUN ORTA TADĐLAT BENZIN ISTASYONU 10-Apr-06
AYDOĞAN ÜNSÜN BASĐT TADĐLAT KONUT 12-Apr-06
AYŞE ERGÜL BASĐT TADĐLAT ĐŞ VE TĐCARET MERKEZ 13-Apr-06
ÖZGÜR YAKIN ORTA TADĐLAT K.SAN. SIT. 13-Apr-06
HALĐL FAZLIOĞLU BASĐT TADĐLAT DÜKKAN+KONUT 13-Apr-06
ÖZKAN ÖZGÜR TADĐLAT DUKKAN 20-Apr-06
MUZAFFER IŞIK ORTA TADĐLAT DÜKKAN+KONUT 25-Apr-06
AYDOĞAN ÜNSÜN BASĐT TADĐLAT KONUT 26-Apr-06
OSMAN SADIKOĞLU BASĐT TADĐLAT KONUT 28-Apr-06
TADĐLAT KONUT 28-Apr-06
ERCĐHAN KORKMAZ TADĐLAT KONUT 03-May-06
HAKAN BÜLBÜL TADĐLAT KONUT 05-May-06
MEHMET HĐKMET BOZKURT ORTA TADĐLAT KONUT 08-May-06
MĐTHAT AKMAN BASĐT TADĐLAT DÜKKAN+KONUT 12-May-06
HAKAN BÜLBÜL ORTA TADĐLAT MAĞAZA 17-May-06
AYDOĞAN ÜNSÜN BASĐT TADĐLAT KONUT 17-May-06
SÜLEYMAN ÇETĐNTAŞ BASĐT TADĐLAT KONUT 24-May-06
AYDOĞAN ÜNSÜN BASĐT TADĐLAT KONUT 24-May-06
DĐLEK ALKA AYDEMĐR ORTA TADĐLAT KONUT 26-May-06
AHMET FUAT ÖZKOÇAK ORTA TADĐLAT KONUT 26-May-06
AYDOĞAN ÜNSÜN BASĐT TADĐLAT KONUT 31-May-06
AYDOĞAN ÜNSÜN BASĐT TADĐLAT KONUT 31-May-06
ERCÜMENT YAĞMUR BASĐT TADĐLAT KONUT 31-May-06
ŞÜKRÜ DĐKĐCĐ BASĐT TADĐLAT KONUT 01-Jun-06
SONER GÖKDEMĐR ORTA TADĐLAT KONUT 06-Jun-06
MUSTAFA ÜMĐT KALELĐOĞLU ORTA TADĐLAT KONUT 07-Jun-06
ALĐ OSMAN ÖZTÜRK ĐLAVE + TADĐLAT ĐŞ MERKEZĐ 13-Jun-06
METĐN BOZBOĞA ORTA TADĐLAT KONUT 14-Jun-06
SEFA GÖRGÜN ĐLAVE + TADĐLAT BURO 16-Jun-06
MUZAFFER IŞIK ORTA TADĐLAT KONUT 19-Jun-06
MUZAFFER IŞIK ORTA TADĐLAT ĐŞ VE TĐCARET MERKEZĐ 19-Jun-06
AYDOĞAN ÜNSÜN BASĐT TADĐLAT KONUT 20-Jun-06
GÜNERĐ IRMAK ORTA TADĐLAT KONUT 21-Jun-06
GÜNERĐ IRMAK ORTA TADĐLAT KONUT 21-Jun-06
DĐLEK ALKA AYDEMĐR ORTA TADĐLAT DÜKKAN+KONUT 22-Jun-06
TURAN TEKĐN BASĐT TADĐLAT KONUT 22-Jun-06
TURAN TEKĐN ORTA TADĐLAT KONUT 22-Jun-06
SALĐH KOÇAK ORTA TADĐLAT KONUT 27-Jun-06
YENER GÜRAN BASĐT TADĐLAT KONUT 29-Jun-06
HALĐME ÖZSÜT ŞENOL ORTA TADĐLAT KONUT 29-Jun-06
144
Table B.7: (continued).
NAME SURNAME PROJECT TYPE PROJECT FIELD PROJECT
DATE
AYDOĞAN ÜNSÜN BASĐT TADĐLAT KONUT 30-Jun-06
AYDOĞAN ÜNSÜN BASĐT TADĐLAT KONUT 30-Jun-06
TURAN TEKĐN ORTA TADĐLAT DÜKKAN+KONUT 30-Jun-06
MEHMET HĐKMET BOZKURT ORTA TADĐLAT KONUT 06-Jul-06
MEHMET HĐKMET BOZKURT ORTA TADĐLAT KONUT 06-Jul-06
MEHMET HĐKMET BOZKURT ORTA TADĐLAT KONUT 06-Jul-06
MEHMET HĐKMET BOZKURT ORTA TADĐLAT KONUT 06-Jul-06
MEHMET HĐKMET BOZKURT ORTA TADĐLAT KONUT 06-Jul-06
MEHMET HĐKMET BOZKURT ORTA TADĐLAT KONUT 06-Jul-06
AYDOĞAN ÜNSÜN BASĐT TADĐLAT KONUT 06-Jul-06
AYDOĞAN ÜNSÜN BASĐT TADĐLAT KONUT 07-Jul-06
ALĐ OSMAN ÖZTÜRK ORTA TADĐLAT BURO+MAĞAZA 10-Jul-06
HASAN KILIÇ ORTA TADĐLAT KONUT 10-Jul-06
CELAL ÇAMLIBEL BASĐT TADĐLAT ĐMALATHANE 11-Jul-06
ŞERĐFE MERĐÇ BASĐT TADĐLAT KONUT 11-Jul-06
B.HALDUN ERDOĞAN BASĐT TADĐLAT BENZĐN ĐSTASYONU 12-Jul-06
ERCÜMENT YAĞMUR BASĐT TADĐLAT DÜKKAN+KONUT 14-Jul-06
MUZAFFER IŞIK ĐLAVE + TADĐLAT ĐŞYERĐ 20-Jul-06
MUZAFFER IŞIK ĐLAVE + TADĐLAT ĐŞYERĐ 20-Jul-06
TEOMAN TANJU ZENCĐRCĐ ĐLAVE + TADĐLAT KONUT 21-Jul-06
MUZAFFER IŞIK ĐLAVE + TADĐLAT KONUT 21-Jul-06
AYDOĞAN ÜNSÜN BASĐT TADĐLAT KONUT 24-Jul-06
ĐHSAN BĐGE ĐLAVE + TADĐLAT BÜRO 26-Jul-06
HASAN ÇEVĐK ĐLAVE + TADĐLAT KONUT 27-Jul-06
ÖMER FARUK SUMMAK BASĐT TADĐLAT DÜKKAN+KONUT 31-Jul-06
REFĐK ERDOĞAN BASĐT TADĐLAT BENZĐN ĐSTASYONU 31-Jul-06
AYDOĞAN ÜNSÜN BASĐT TADĐLAT KONUT 01-Aug-06
AYDOĞAN ÜNSÜN BASĐT TADĐLAT KONUT 01-Aug-06
BOZKURT GÜRSOYTRAK BASĐT TADĐLAT KONUT 02-Aug-06
HALĐL FAZLIOĞLU BASĐT TADĐLAT KONUT+DÜKKAN 03-Aug-06
HĐKMET ÇENGEL ORTA TADĐLAT DÜKKAN+KONUT 03-Aug-06
HÜSNÜ CEYHAN BASĐT TADĐLAT OTEL 07-Aug-06
ESER ÖNAL TADĐLAT KONUT 09-Aug-06
FAĐK AHMET ŞENEL ĐLAVE + TADĐLAT KONUT 10-Aug-06
HASAN AKYÜZ ĐLAVE + TADĐLAT KONUT 11-Aug-06
METĐN BOZBOĞA ĐLAVE + TADĐLAT DÜKKAN+KONUT 11-Aug-06
AYDOĞAN ÜNSÜN BASĐT TADĐLAT KONUT 16-Aug-06
HAKAN BÜLBÜL ĐLAVE + TADĐLAT KONUT 16-Aug-06
AYDOĞAN ÜNSÜN BASĐT TADĐLAT KONUT 16-Aug-06
HAKAN BÜLBÜL ORTA TADĐLAT DÜKKAN+KONUT 17-Aug-06
GÜRKAN DEMĐRCĐ BASĐT TADĐLAT KONUT 18-Aug-06
TÜLĐN ÇETĐN ĐLAVE + TADĐLAT KONUT 22-Aug-06
145
Table B.7: (continued).
NAME SURNAME PROJECT TYPE PROJECT FIELD PROJECT
DATE
MURAT ARTU ĐLAVE + TADĐLAT KONUT 23-Aug-06
HALĐL OĞUZ ARIK ĐLAVE + TADĐLAT KONUT 24-Aug-06
BOZKURT GÜRSOYTRAK TADĐLAT BURO 25-Aug-06
AHMET FUAT ÖZKOÇAK ĐLAVE + TADĐLAT KONUT 29-Aug-06
SERCĐHAN MADEN ĐLAVE + TADĐLAT DÜKKAN+KONUT 01-Sep-06
SERCĐHAN MADEN ORTA TADĐLAT DÜKKAN+KONUT 01-Sep-06
BÜLENT BĐROĞLU ĐLAVE + TADĐLAT OTEL 04-Sep-06
ORTA TADĐLAT ALIŞVERĐŞ KOMPLEKSĐ 07-Sep-06
ESER ÖNAL ĐLAVE + TADĐLAT DÜKKAN+KONUT 08-Sep-06
AYDOĞAN ÜNSÜN BASĐT TADĐLAT KONUT 19-Sep-06
ÖZLEN ÇAĞIL ĐLAVE + TADĐLAT DÜKKAN+KONUT 21-Sep-06
AZĐZ SERDAR CEYHAN KAPSAMLI TADĐLAT KONUT 22-Sep-06AHMET NECATĐ KÜÇÜKKÖMÜRLER TADĐLAT DÜKKAN+KONUT 29-Sep-06
KAAN ÖZER KAPSAMLI TADĐLAT BURO 05-Oct-06
AYDOĞAN ÜNSÜN BASĐT TADĐLAT KONUT 09-Oct-06
HAKAN BÜLBÜL ĐLAVE + TADĐLAT KONUT 12-Oct-06
ERCÜMENT YAĞMUR ĐLAVE + TADĐLAT KONUT 13-Oct-06
AHMET HALĐS TURGAY BASĐT TADĐLAT KONUT 16-Oct-06
ALĐ TEPE ĐLAVE + TADĐLAT KONUT 18-Oct-06
HĐKMET ÇENGEL BASĐT TADĐLAT DÜKKAN+KONUT 19-Oct-06
ORTA TADĐLAT KONUT 01-Nov-06
ŞAKĐR MERAKĐ ĐLAVE + TADĐLAT KRES 02-Nov-06
HALĐL FAZLIOĞLU TADĐLAT KONUT 02-Nov-06
AYDOĞAN ÜNSÜN BASĐT TADĐLAT KONUT 03-Nov-06
HALĐL FAZLIOĞLU ĐLAVE + TADĐLAT DÜKKAN+KONUT 07-Nov-06
HACI CANATAN BASĐT TADĐLAT KONUT 07-Nov-06
FATMA CEBECĐ KAPSAMLI TADĐLAT APART OTEL 13-Nov-06
AYDOĞAN ÜNSÜN BASĐT TADĐLAT KONUT 13-Nov-06
ÖZLEN ÇAĞIL TADĐLAT DÜKKAN+KONUT 15-Nov-06
TÜLAY ASLAN ORTA TADĐLAT ĐŞYERĐ 15-Nov-06
SAĐT OĞUZHAN ÖZTURAN ĐLAVE + TADĐLAT KONUT 20-Nov-06
ĐSA PARLAK ORTA TADĐLAT KONUT 22-Nov-06
MEMET YILMAZ HELVACIOĞLU BASĐT TADĐLAT APARTMAN 28-Nov-06
CĐHANGĐR ÖZYER ORTA TADĐLAT DÜKKAN+KONUT 28-Nov-06
ĐSMET BAYAR BASĐT TADĐLAT KONUT 29-Nov-06
NURĐ OSMAN YURDAKUL ĐLAVE + TADĐLAT ĐŞYERĐ 30-Nov-06
GÜRKAN DEMĐRCĐ KAPSAMLI TADĐLAT DÜKKAN+KONUT 30-Nov-06
ĐSMET BAYAR BASĐT TADĐLAT KONUT 30-Nov-06
ALĐ TEPE BASĐT TADĐLAT KONUT 07-Dec-06
HAYRĐYE KORHAN BASĐT TADĐLAT ĐŞMERKEZĐ 07-Dec-06
ALTAN ERSOY ORTA TADĐLAT OTEL 08-Dec-06
BOZKURT GÜRSOYTRAK ORTA TADĐLAT SHOWROOM;BURO;LOKANTA 12-Dec-06

146
Table B. 8: Total bill of quantities of three case studies. (Source: The technical departments of three hotels).
Table B.8. 1: Bill of quantities of Hotel A. POZ AÇIKLAMA BĐRĐM TOPLAM A. A.1. ODA SÖKÜM ĐŞLERĐ A.1.1 ODA GĐRĐŞ KAPI VE KASA SÖKÜMÜ adet 352,00 A.1.2 CONNECTING KAPI VE KASA SÖKÜMÜ adet 16,00 A.1.3 SIUTE ARA KAPI VE KASA SÖKÜMÜ adet 16,00 A.1.4 GARDROP SÖKÜMÜ adet - A.1.5 YATAK BAŞI SÖKÜMÜ adet 416,00 A.1.6 KORNĐŞ PERDE KAFESĐ PERDELĐK SÖKÜMÜ adet 336,00 A.1.7 SÜPÜRGELĐK SÖKÜMÜ mt 6.139,20 A.1.8 HALI 0 KEÇE SÖKÜMÜ m2 7.272,00 A.1.9 TAVAN AHŞAP ÇITA SÖKÜMÜ mt 6.753,60 A.1.10 AHŞAP ASMA TAVAN SÖKÜMÜ m2 - A.1.11 TUĞLA DUVAR YIKILMASI m2 - A.1.12 DUVAR KAĞIDI SÖKÜLMESĐ m2 13.651,20 A.2. ODA ĐMALATLAR A.2.1. ŞAP YAPILMASI m2 2.992,00 A.2.2. SELF0LEVELLING YAPILMASI m2 7.580,32 A.2.3. FEB0CLEAR SÜRÜLMESĐ m2 7.580,32 A.2.4. TAVAN ALÇI SIVA YAPILMASI m2 7.278,56 A.2.5. ALÇIPAN ASMATAVAN ĐMALATI m2 1.088,00 A.2.6. TAVAN SATEN SIVA YAPILMASI m2 7.182,56 A.2.7. ALIN ALÇIPAN ĐMALATI m2 121,12 A.2.8. ALÇIPAN PELMET ĐMALATI m2 2.652,96 A.2.9. HAZIR KARTONPĐYER VE MONTAJI mt 5.827,68 A.2.10. TAVAN BOYA YAPILMASI m2 8.006,24
A.2.11. DUVAR ALÇI SIVA YAPILMASI m2 17.641,92
A.2.12. DUVARKAĞIDI ÖNCESĐ MACUN0SATEN0ASTAR YAPILMASI m2 17.005,76
A.2.13. DUVARKAĞIDI KAPLAMA (MALZEME HARĐÇ) m2 15.506,08 A.2.14. DUVAR BOYA YAPILMASI m2 - A.2.15. MENFEZ ĐMALATI VE MONTAJI (LĐNEER) ad 336,00 A.2.16. TUĞLA DUVAR ÖRME ĐŞĐ m2 - A.2.17. ĐKĐ KAT ALÇIPAN DUVAR YAPILMASI m2 - A.2.18 ODA GĐRĐŞ KAPI SAÇ KASA ĐMALAT0MONTAJ ad 352,00 A.2.19. BANYO KAPI SAÇ KASA ĐMALAT0MONTAJ ad 336,00
A.2.20. CONNECTING KAPI SAÇ KASA ĐMALAT0MONTAJ
ad 16,00
A.2.21. SUIT ARA KAPI SAÇ KASA ĐMALAT0MONTAJ ad 16,00 A.2.22. SAÇ KAPI KASA BOYA YAPILMASI ad 800,00
147
Table B.8.1: (continued).
POZ AÇIKLAMA BĐRĐM TOPLAM B. B.1. BANYO SÖKÜM ĐŞLERĐ B.1.1 BANYO KAPI VE KASA SÖKÜMÜ ad -
B.1.2. BANYO AYNA ÇERÇEVE MDF ARKALIK IŞIKLIK SÖKÜMÜ
ad 336,00
B.1.3. ALÇIPAN DUVAR YIKIM ĐŞLERĐ m2 - B.1.4. TUĞLA DUVAR YIKIM ĐŞĐ m2 - B.1.5. DUVAR KAĞIDI SÖKÜMÜ m2 1.656,64 B.1.6. BANYO ALÇI ASMA TAVAN SÖKÜMÜ m2 105,92 B.1.7. KÜVET SÖKÜMÜ ad 320,00 B.1.8. LAVABO SÖKÜMÜ ad 336,00 B.1.9. KLOZET SÖKÜMÜ ad - B.1.10. BANYO PERDE SÖKÜMÜ ad 320,00 B.1.11. LAVABO TEZGAH SÖKÜMÜ ad 336,00 B.1.12. ANKASTRE BANYO BATARYASI SÖKÜMÜ ad 320,00
B.1.13. LAVABO BATARYA VE ARAMUSLUK SÖKÜMÜ
ad 336,00
B.1.14. TAHARET MUSLUĞU SÖKÜMÜ ad 336,00 B.1.15. MAKYAJ AYNASI SÖKÜMÜ ad 320,00 B.1.16. SAÇ KURUTMA MAKĐNASI SÖKÜMÜ ad - B.1.17. HAVLU ÇUBUĞU SÖKÜMÜ ad 336,00 B.1.18. TUVALET KAĞITLIĞI SÖKÜMÜ ad 672,00 B.1.19 HAVLU RAFI SÖKÜMÜ ad 320,00 B.2. BANYO ĐMALATLAR
B.2.1 GRANĐT TEZGAH ĐMALAT0MONTAJ (BALTIC BROWN)
ad -
B.2.2 GRANĐT TEZGAH ALTI KARKAS VE PROFĐL ad 336,00 B.2.3 MERMER DERZ ARASI DOLGU0TADĐLAT oda - B.2.4 MEVCUT BANYO DÖŞEME MERMER CĐLA m2 - B.2.5 MEVCUT BANYO DUVAR MERMER CĐLA m2 - B.2.6 BANYO KAPI GRANĐT EŞĐK ĐMALAT0MONTAJ ad - B.2.7 ALÇIPAN ASMATAVAN ĐMALATI m2 1.424,00 B.2.8 TAVAN SATEN SIVA YAPILMASI m2 1.424,00 B.2.9 TAVAN BOYA YAPILMASI m2 1.424,00 B.2.10 DUVAR BOYA YAPILMASI m2 -
B.2.11 DUVAR ALÇI SIVA YAPILMASI (KAZIMA0YOKLAMA DAHĐL)
m2 -
B.2.12 DUVARKAĞIDI ÖNCESĐ MACUN0SATEN0ASTAR YAPILMASI
m2 -
B.2.13 DUVARKAĞIDI KAPLAMA (MALZEME HARĐÇ) m2 -
B.2.14 ALÇIPAN MÜDAHALE KAPAĞI ĐMALAT VE MONTAJI
ad -
B.2.15 ĐKĐ KAT ALÇIPAN DUVAR ÖRME ĐŞĐ m2 - B.2.16 TUĞLA DUVAR ÖRME ĐŞĐ m2 217,60 B.2.17 SĐLĐKON ÇEKĐLMESĐ (RENKLĐ VEYA ŞEFFAF) mt 2.662,08

148
Table B.8.1: (continued).
POZ AÇIKLAMA BĐRĐM TOPLAM
B.2.18 KÜVET MONTAJI (MALZEME HARĐÇ) ad - B.2.19 LAVABO MONTAJI (MALZEME HARĐÇ) ad - B.2.20 KLOZET MONTAJI (MALZEME HARĐÇ) ad - B.2.21 BANYO PERDE MONTAJI (MALZEME HARĐÇ) ad 336,00
B.2.22 LAVABO TEZGAH MONTAJI (MALZEME HARĐÇ)
ad -
B.2.23 ANKASTRE BANYO BATARYASI MONTAJI (MALZEME HARĐÇ)
ad -
B.2.24 LAVABO BATARYA VE ARA MUSLUK MONTAJI (MALZ.HARĐÇ)
ad -
B.2.25 TAHARET MUSLUĞU MONTAJI (MALZEME HARĐÇ) ad -
B.2.26 MAKYAJ AYNASI MONTAJI (MALZEME HARĐÇ)
ad 320,00
B.2.27 SAÇ KURUTMA MAKĐNASI MONTAJI (MALZEME HARĐÇ)
ad -
B.2.28 HAVLU ÇUBUĞU MONTAJI (MALZEME HARĐÇ)
ad 336,00
B.2.29 TUVALET KAĞITLIĞI MONTAJI (MALZEME HARĐÇ)
ad 336,00
B.2.30 YEDEK TUVALET KAĞITLIĞI MONTAJI (MALZEME HARĐÇ) ad 336,00
B.2.31 HAVLU RAFI MONTAJI (MALZEME HARĐÇ) ad 320,00
B.2.32 KAPI ARKASI ASKI MONTAJI (MALZEME HARĐÇ)
ad -
B.2.33 TUTAMAKLI SABUNLUK MONTAJI (MALZEME HARĐÇ)
ad 320,00
B.2.34 ÇAMAŞIR ĐPĐ MONTAJI (MALZEME HARĐÇ) ad - C. C.1. KORĐDOR SÖKÜM ĐŞLERĐ C.1.1 ALÇIPAN ASMA TAVAN SÖKÜMÜ m2 - C.1.2 DUVAR AHŞAP PANEL SÖKÜMÜ m2 1.028,96 C.1.3 DUVAR AYNA SÖKÜMÜ m2 363,20 C.1.4 DUVAR KAĞIDI SÖKÜMÜ m2 3.420,16 C.1.5 ŞAFT KAPAK SÖKÜMÜ ad 16,00 C.1.6 SÜPÜRGELĐK SÖKÜMÜ mt 1.953,28 C.1.7 HALI KEÇE SÖKÜMÜ m2 - C.1.8 YANGIN MERDĐVENĐ KAPI VE KASA SÖKÜMÜ ad 48,00 C.1.9 BUZ ODASI KAPI VE KASA SÖKÜMÜ ad 16,00 C.1.10 ALÇIPAN DUVAR YIKIM ĐŞLERĐ m2 148,64 C.1.11 TUĞLA DUVAR YIKIM ĐŞLERĐ m2 - C.1.12 SERVĐS HOLÜ KAPI VE KASA SÖKÜMÜ ad 32,00 C.1.13 SERVĐS HOLÜ WC KLOZET SÖKÜMÜ ad -
C.1.14 SERVĐS HOLÜ DUVAR DÖŞEME SERAMĐK SÖKÜMÜ
m2 2.784,32
149
Table B.8.1: (continued).
POZ AÇIKLAMA BĐRĐM TOPLAM C.2. KORĐDOR ĐMALATLAR C.2.1 ŞAP YAPILMASI m2 - C.2.2 SELF0LEVELLING YAPILMASI m2 2.034,40 C.2.3 FEB0CLEAR SÜRÜLMESĐ m2 2.034,40 C.2.4 DUVAR ALÇI SIVA YAPILMASI m2 5.139,68
C.2.5 DUVARKAĞIDI ÖNCESĐ MACUN0SATEN0ASTAR YAPILMASI
m2 4.518,56
C.2.6 DUVARKAĞIDI KAPLAMA (MALZEME HARĐÇ) m2 4.534,56 C.2.7 DUVAR SATEN SIVA YAPILMASI m2 - C.2.8 DUVAR BOYA YAPILMASI m2 - C.2.9 ALÇIPAN ASMATAVAN ĐMALATI m2 1.901,28 C.2.10 TAVAN SATEN SIVA YAPILMASI m2 2.034,40 C.2.11 TAVAN BOYA YAPILMASI m2 2.034,40
C.2.12 SERVĐS HOLÜ KAPISI METAL TEKMELĐK VE MONTAJI
ad 64,00
C.2.13 YANGIN KAÇIŞ YÖNLENDĐRME LEVHASI VE MONTAJI
ad 48,00
C.2.14 ASANSÖR YÖNLENDĐRME LEVHASI VE MONTAJI ad 32,00
C.2.15 SERVĐS HOLÜ KAPI SAÇ KASA (ĐM+MONTAJ) ad 32,00 C.2.16 YANGIN MERDĐVEN KAPISI SAÇ KASA ad 48,00 C.2.17 BUZ MAKĐNA ODA KAPISI SAÇ KASA (ĐM+MO) ad 16,00 C.2.18 SAÇ KAPI KASA BOYA YAPILMASI ad 96,00 C.2.19 YANGIN MERDĐVEB KAPISI ĐMALAT0MONTAJ ad 16,00 C.2.20 SAÇ KAPI BOYA YAPILMASI ad 16,00 C.2.21 YANGIN DOLABI ĐMALAT VE MONTAJI ad 32,00 C.2.22 ŞAFT KAPAKLARI ALÇIPAN DARALTMA ad - C.2.23 HAZIR KARTONPĐYER VE MONTAJI mt - C.2.24 TUĞLA DUVAR ÖRME ĐŞĐ m2 - C.2.25 MENFEZ ĐMALATI VE MONTAJI ad 144,00 C.2.26 ANEMOSTAD ĐMALATI VE MONTAJI ad - C.2.27 SERVĐS HOLÜ TAVAN SATEN SIVA m2 456,32 C.2.28 SERVĐS HOLÜ TAVAN BOYA YAPILMASI m2 456,32 C.2.29 SERVĐS HOLÜ DUVAR SERAMĐK ĐMALATI m2 - C.2.30 SERVĐS HOLÜ DÖŞEME SERAMĐK ĐMALATI m2 - C.2.31 SERVĐS HOLÜ DUVAR ALÇI SIVA YAPILMASI m2 1.252,48 C.2.32 SERVĐS HOLÜ+MĐNĐBAR DEPO DUVAR BOYA m2 1.252,48
C.2.33 SERVĐS HOLÜ+MĐNĐBAR DEPO DÖŞEME VĐNĐL KAPL. (LAYSAN)
m2 -
C.2.34 SERVĐS HOLÜ WC KLOZET MONTAJI ad - C.2.35 YANGIN MERDĐVEN DUVAR ALÇI SIVA YAP. m2 1.457,12 C.2.36 YANGIN MERDĐVEN DUVAR BOYA m2 1.457,12 C.2.37 YANGIN MERDĐVEN TAVAN ALÇI SIVA m2 567,20 C.2.38 YANGIN MERDĐVEN TAVAN BOYA m2 567,20
C.2.39 YANGIN MERDĐVENĐ KORKULUK ZIMPARA+MACUN+BOYA
mt 403,20
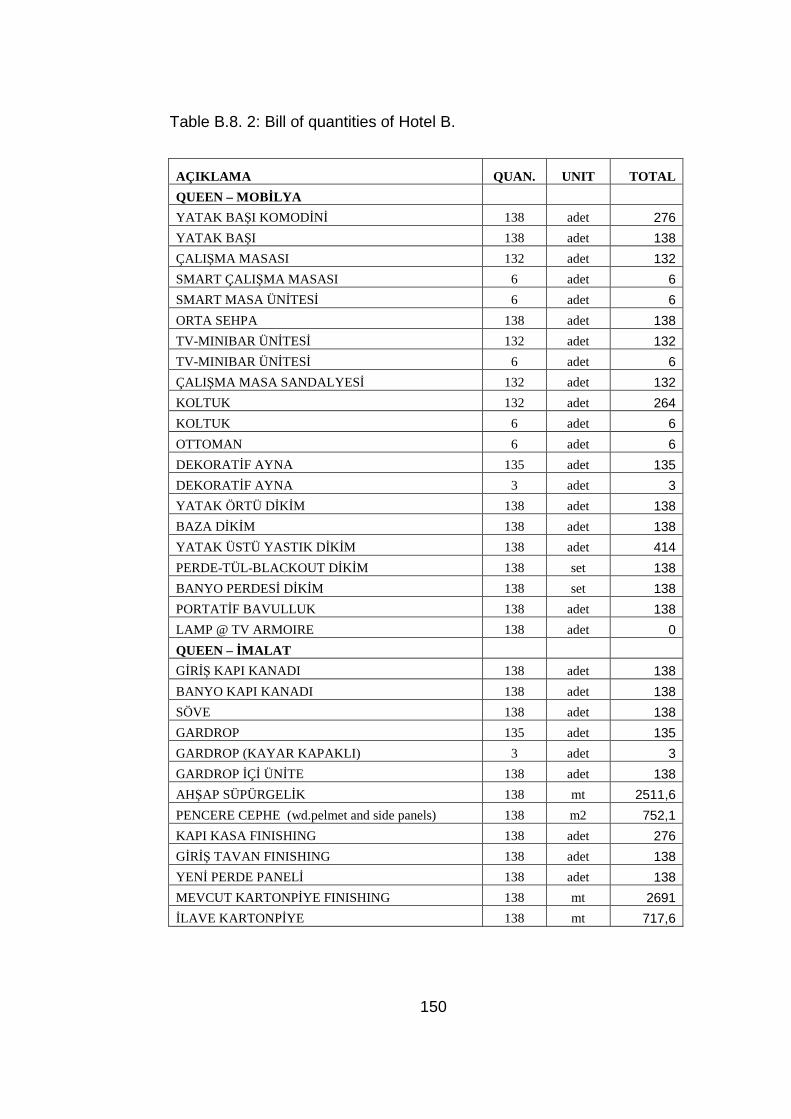
150
Table B.8. 2: Bill of quantities of Hotel B.
AÇIKLAMA QUAN. UNIT TOTAL
QUEEN – MOBĐLYA
YATAK BA ŞI KOMODĐNĐ 138 adet 276
YATAK BA ŞI 138 adet 138
ÇALIŞMA MASASI 132 adet 132
SMART ÇALIŞMA MASASI 6 adet 6
SMART MASA ÜNĐTESĐ 6 adet 6
ORTA SEHPA 138 adet 138
TV-MINIBAR ÜN ĐTESĐ 132 adet 132
TV-MINIBAR ÜN ĐTESĐ 6 adet 6
ÇALIŞMA MASA SANDALYESĐ 132 adet 132
KOLTUK 132 adet 264
KOLTUK 6 adet 6
OTTOMAN 6 adet 6
DEKORATĐF AYNA 135 adet 135
DEKORATĐF AYNA 3 adet 3
YATAK ÖRTÜ DĐKĐM 138 adet 138
BAZA DĐKĐM 138 adet 138
YATAK ÜSTÜ YASTIK D ĐKĐM 138 adet 414
PERDE-TÜL-BLACKOUT DĐKĐM 138 set 138
BANYO PERDESĐ DĐKĐM 138 set 138
PORTATĐF BAVULLUK 138 adet 138
LAMP @ TV ARMOIRE 138 adet 0
QUEEN – ĐMALAT
GĐRĐŞ KAPI KANADI 138 adet 138
BANYO KAPI KANADI 138 adet 138
SÖVE 138 adet 138
GARDROP 135 adet 135
GARDROP (KAYAR KAPAKLI) 3 adet 3
GARDROP ĐÇĐ ÜNĐTE 138 adet 138
AHŞAP SÜPÜRGELĐK 138 mt 2511,6
PENCERE CEPHE (wd.pelmet and side panels) 138 m2 752,1
KAPI KASA FINISHING 138 adet 276
GĐRĐŞ TAVAN FINISHING 138 adet 138
YENĐ PERDE PANELĐ 138 adet 138
MEVCUT KARTONPĐYE FINISHING 138 mt 2691
ĐLAVE KARTONPĐYE 138 mt 717,6
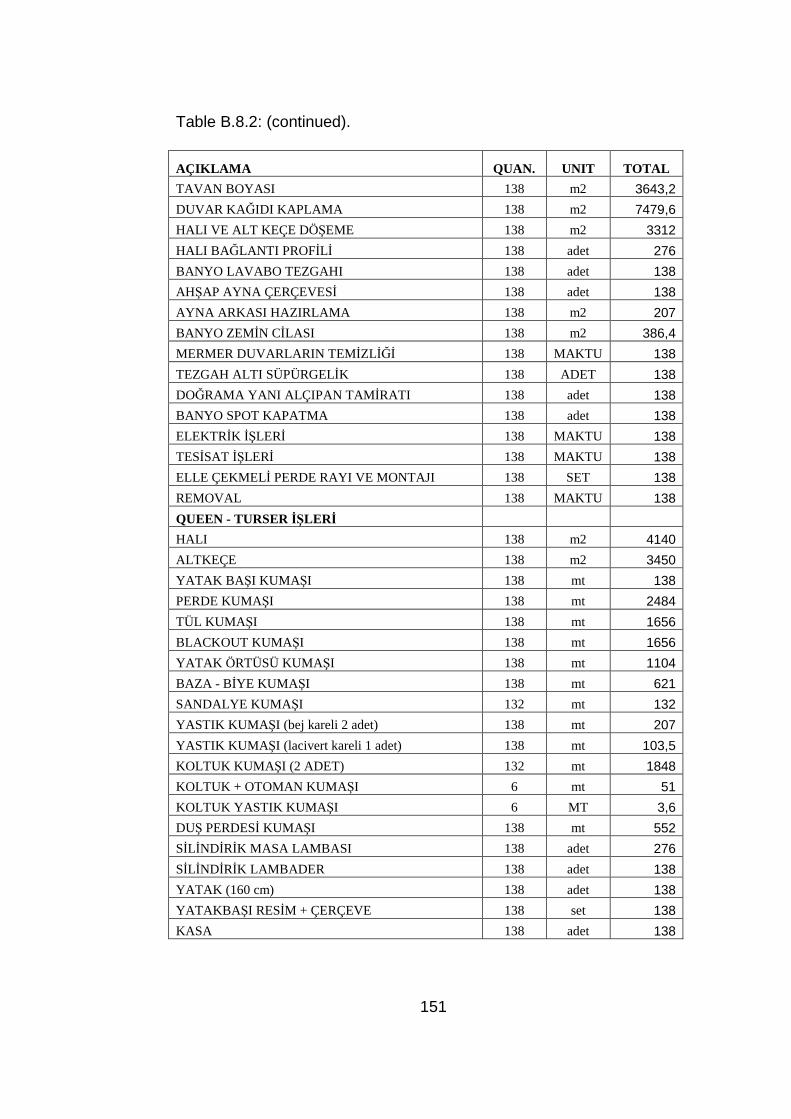
151
Table B.8.2: (continued).
AÇIKLAMA QUAN. UNIT TOTAL
TAVAN BOYASI 138 m2 3643,2
DUVAR KAĞIDI KAPLAMA 138 m2 7479,6
HALI VE ALT KEÇE DÖŞEME 138 m2 3312
HALI BAĞLANTI PROFĐLĐ 138 adet 276
BANYO LAVABO TEZGAHI 138 adet 138
AHŞAP AYNA ÇERÇEVESĐ 138 adet 138
AYNA ARKASI HAZIRLAMA 138 m2 207
BANYO ZEMĐN CĐLASI 138 m2 386,4
MERMER DUVARLARIN TEMĐZLĐĞĐ 138 MAKTU 138
TEZGAH ALTI SÜPÜRGELĐK 138 ADET 138
DOĞRAMA YANI ALÇIPAN TAM ĐRATI 138 adet 138
BANYO SPOT KAPATMA 138 adet 138
ELEKTRĐK ĐŞLERĐ 138 MAKTU 138
TESĐSAT ĐŞLERĐ 138 MAKTU 138
ELLE ÇEKMELĐ PERDE RAYI VE MONTAJI 138 SET 138
REMOVAL 138 MAKTU 138
QUEEN - TURSER ĐŞLERĐ
HALI 138 m2 4140
ALTKEÇE 138 m2 3450
YATAK BA ŞI KUMA ŞI 138 mt 138
PERDE KUMAŞI 138 mt 2484
TÜL KUMA ŞI 138 mt 1656
BLACKOUT KUMA ŞI 138 mt 1656
YATAK ÖRTÜSÜ KUMAŞI 138 mt 1104
BAZA - BĐYE KUMAŞI 138 mt 621
SANDALYE KUMA ŞI 132 mt 132
YASTIK KUMA ŞI (bej kareli 2 adet) 138 mt 207
YASTIK KUMA ŞI (lacivert kareli 1 adet) 138 mt 103,5
KOLTUK KUMA ŞI (2 ADET) 132 mt 1848
KOLTUK + OTOMAN KUMA ŞI 6 mt 51
KOLTUK YASTIK KUMA ŞI 6 MT 3,6
DUŞ PERDESĐ KUMAŞI 138 mt 552
SĐLĐNDĐRĐK MASA LAMBASI 138 adet 276
SĐLĐNDĐRĐK LAMBADER 138 adet 138
YATAK (160 cm) 138 adet 138
YATAKBA ŞI RESĐM + ÇERÇEVE 138 set 138
KASA 138 adet 138

152
Table B.8.2: (continued).
AÇIKLAMA QUAN. UNIT TOTAL
SAÇ KURUTMA MAK ĐNASI 138 adet 138
TRAŞ AYNASI 138 adet 138
ÇALIŞMA MASA LAMBASI 138 adet 138
ODA DUVAR KAĞIDI 138 m2 5658
BANYO DUVAR KAĞIDI 138 m2 1794
LAVABO ARMATÜR 138 takım 138
ELEKTRĐK PRĐZ+ENERGY SAVER+VB. 138 MAKTU 138
DOWNLIGHT 138 adet 414
TWIN - MOB ĐLYA
YATAK BA ŞI KOMODĐNĐ 42 adet 42
YATAK BA ŞI 42 adet 84
ÇALIŞMA MASASI 42 adet 42
ORTA SEHPA 42 adet 42
TV-MINIBAR ÜN ĐTESĐ 42 adet 42
ÇALIŞMA MASA SANDALYESĐ 42 adet 42
KOLTUK 42 adet 42
OTTOMAN 42 adet 42
DEKORATĐF AYNA 42 adet 42
YATAK ÖRTÜ DĐKĐM 42 adet 84
BAZA DĐKĐM 42 adet 84
YATAK ÜSTÜ YASTIK D ĐKĐM 42 adet 84
PERDE-TÜL-BLACKOUT DĐKĐM 42 SET 42
BANYO PERDESĐ DĐKĐM 42 SET 42
PORTATĐF BAVULLUK 42 adet 42
LAMP @ TV ARMOIRE 42 adet 0
TWIN - ĐMALAT
GĐRĐŞ KAPI KANADI 42 adet 42
BANYO KAPI KANADI 42 adet 42
BAĞLANTI KAPI KANADI 8 adet 16
SÖVE 42 adet 42
GARDROP (nişsiz) 42 adet 42
GARDROP ĐÇĐ ÜNĐTE 42 adet 42
AHŞAP SÜPÜRGELĐK 34 mt 618,8
AHŞAP SÜPÜRGELĐK 8 mt 138
PENCERE CEPHE (wd.pelmet and side panels) 42 m2 229,2
KAPI KASA FINISHING 34 adet 68
KAPI KASA FINISHING 8 adet 24
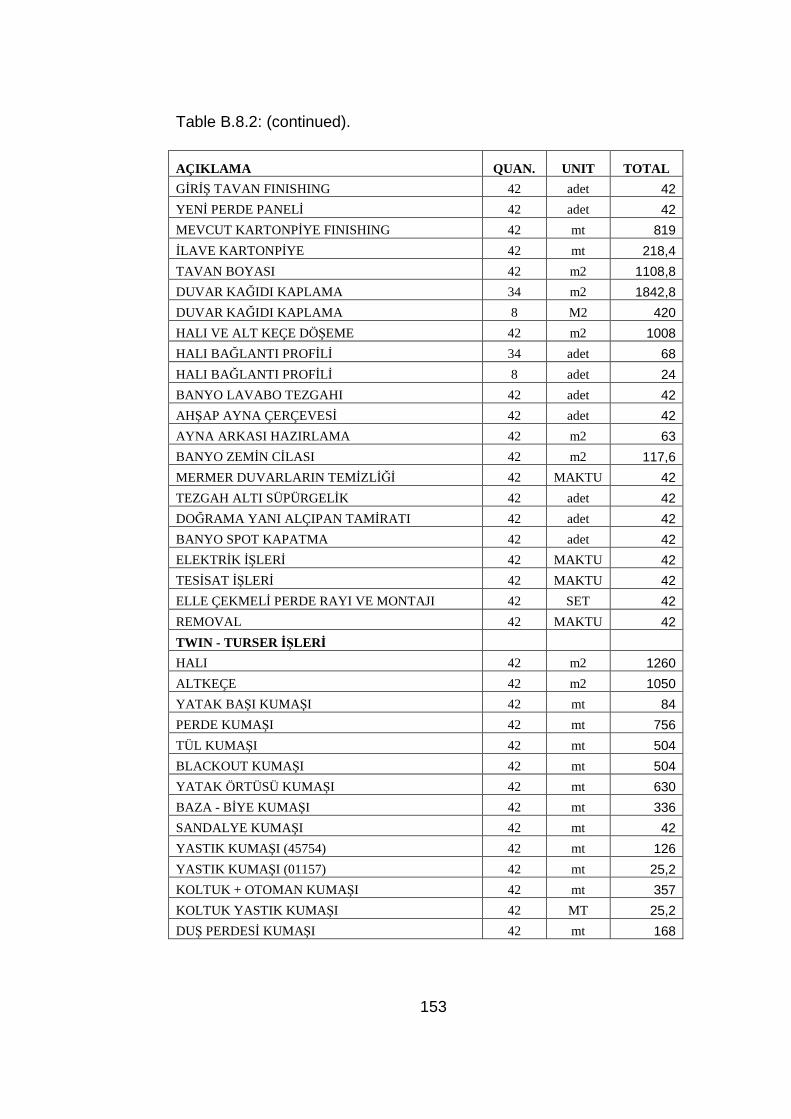
153
Table B.8.2: (continued).
AÇIKLAMA QUAN. UNIT TOTAL
GĐRĐŞ TAVAN FINISHING 42 adet 42
YENĐ PERDE PANELĐ 42 adet 42
MEVCUT KARTONPĐYE FINISHING 42 mt 819
ĐLAVE KARTONPĐYE 42 mt 218,4
TAVAN BOYASI 42 m2 1108,8
DUVAR KAĞIDI KAPLAMA 34 m2 1842,8
DUVAR KAĞIDI KAPLAMA 8 M2 420
HALI VE ALT KEÇE DÖŞEME 42 m2 1008
HALI BAĞLANTI PROFĐLĐ 34 adet 68
HALI BAĞLANTI PROFĐLĐ 8 adet 24
BANYO LAVABO TEZGAHI 42 adet 42
AHŞAP AYNA ÇERÇEVESĐ 42 adet 42
AYNA ARKASI HAZIRLAMA 42 m2 63
BANYO ZEMĐN CĐLASI 42 m2 117,6
MERMER DUVARLARIN TEMĐZLĐĞĐ 42 MAKTU 42
TEZGAH ALTI SÜPÜRGELĐK 42 adet 42
DOĞRAMA YANI ALÇIPAN TAM ĐRATI 42 adet 42
BANYO SPOT KAPATMA 42 adet 42
ELEKTRĐK ĐŞLERĐ 42 MAKTU 42
TESĐSAT ĐŞLERĐ 42 MAKTU 42
ELLE ÇEKMELĐ PERDE RAYI VE MONTAJI 42 SET 42
REMOVAL 42 MAKTU 42
TWIN - TURSER ĐŞLERĐ
HALI 42 m2 1260
ALTKEÇE 42 m2 1050
YATAK BA ŞI KUMA ŞI 42 mt 84
PERDE KUMAŞI 42 mt 756
TÜL KUMA ŞI 42 mt 504
BLACKOUT KUMA ŞI 42 mt 504
YATAK ÖRTÜSÜ KUMAŞI 42 mt 630
BAZA - BĐYE KUMAŞI 42 mt 336
SANDALYE KUMA ŞI 42 mt 42
YASTIK KUMA ŞI (45754) 42 mt 126
YASTIK KUMA ŞI (01157) 42 mt 25,2
KOLTUK + OTOMAN KUMA ŞI 42 mt 357
KOLTUK YASTIK KUMA ŞI 42 MT 25,2
DUŞ PERDESĐ KUMAŞI 42 mt 168
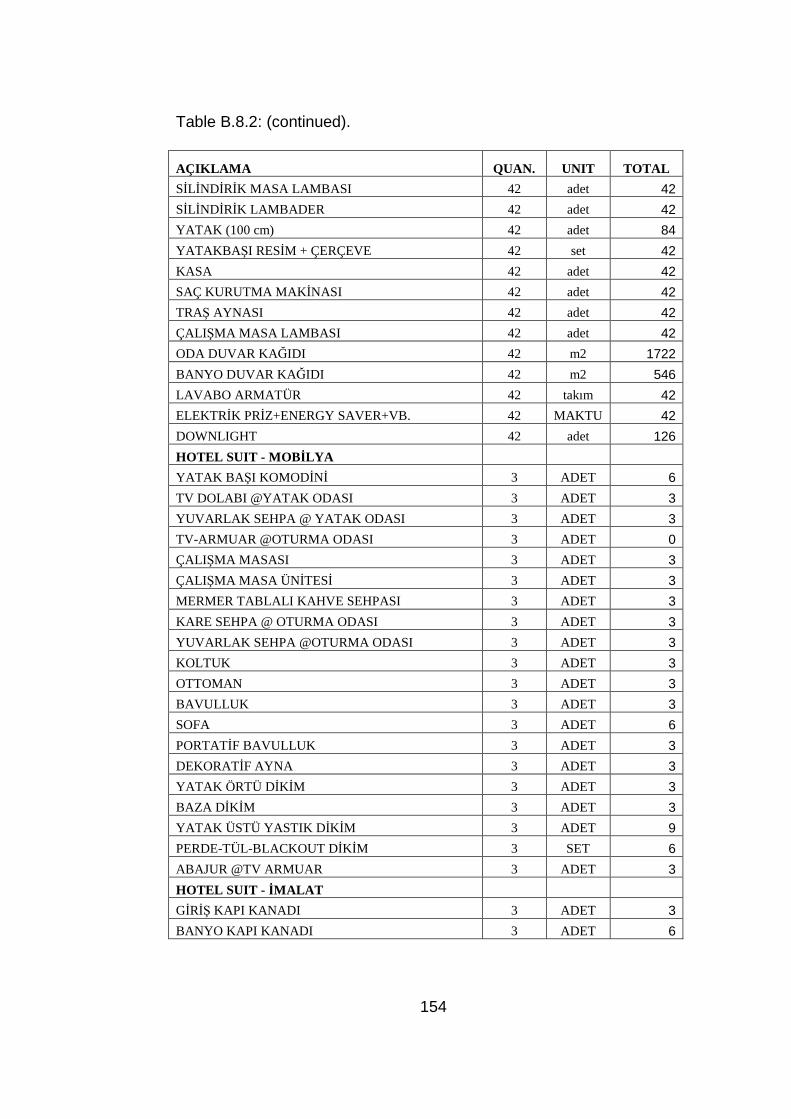
154
Table B.8.2: (continued).
AÇIKLAMA QUAN. UNIT TOTAL
SĐLĐNDĐRĐK MASA LAMBASI 42 adet 42
SĐLĐNDĐRĐK LAMBADER 42 adet 42
YATAK (100 cm) 42 adet 84
YATAKBA ŞI RESĐM + ÇERÇEVE 42 set 42
KASA 42 adet 42
SAÇ KURUTMA MAK ĐNASI 42 adet 42
TRAŞ AYNASI 42 adet 42
ÇALIŞMA MASA LAMBASI 42 adet 42
ODA DUVAR KAĞIDI 42 m2 1722
BANYO DUVAR KAĞIDI 42 m2 546
LAVABO ARMATÜR 42 takım 42
ELEKTRĐK PRĐZ+ENERGY SAVER+VB. 42 MAKTU 42
DOWNLIGHT 42 adet 126
HOTEL SUIT - MOB ĐLYA
YATAK BA ŞI KOMODĐNĐ 3 ADET 6
TV DOLABI @YATAK ODASI 3 ADET 3
YUVARLAK SEHPA @ YATAK ODASI 3 ADET 3
TV-ARMUAR @OTURMA ODASI 3 ADET 0
ÇALIŞMA MASASI 3 ADET 3
ÇALIŞMA MASA ÜN ĐTESĐ 3 ADET 3
MERMER TABLALI KAHVE SEHPASI 3 ADET 3
KARE SEHPA @ OTURMA ODASI 3 ADET 3
YUVARLAK SEHPA @OTURMA ODASI 3 ADET 3
KOLTUK 3 ADET 3
OTTOMAN 3 ADET 3
BAVULLUK 3 ADET 3
SOFA 3 ADET 6
PORTATĐF BAVULLUK 3 ADET 3
DEKORATĐF AYNA 3 ADET 3
YATAK ÖRTÜ DĐKĐM 3 ADET 3
BAZA DĐKĐM 3 ADET 3
YATAK ÜSTÜ YASTIK D ĐKĐM 3 ADET 9
PERDE-TÜL-BLACKOUT DĐKĐM 3 SET 6
ABAJUR @TV ARMUAR 3 ADET 3
HOTEL SUIT - ĐMALAT
GĐRĐŞ KAPI KANADI 3 ADET 3
BANYO KAPI KANADI 3 ADET 6
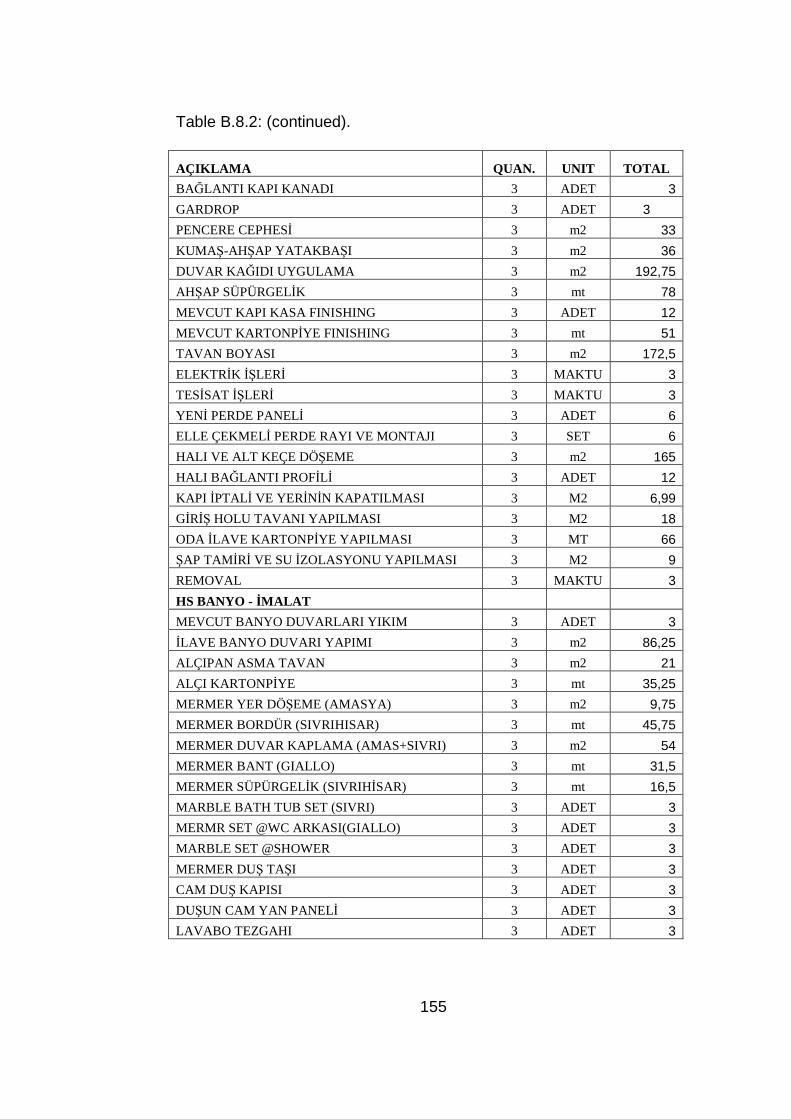
155
Table B.8.2: (continued).
AÇIKLAMA QUAN. UNIT TOTAL
BAĞLANTI KAPI KANADI 3 ADET 3
GARDROP 3 ADET 3
PENCERE CEPHESĐ 3 m2 33
KUMAŞ-AHŞAP YATAKBA ŞI 3 m2 36
DUVAR KAĞIDI UYGULAMA 3 m2 192,75
AHŞAP SÜPÜRGELĐK 3 mt 78
MEVCUT KAPI KASA FINISHING 3 ADET 12
MEVCUT KARTONPĐYE FINISHING 3 mt 51
TAVAN BOYASI 3 m2 172,5
ELEKTRĐK ĐŞLERĐ 3 MAKTU 3
TESĐSAT ĐŞLERĐ 3 MAKTU 3
YENĐ PERDE PANELĐ 3 ADET 6
ELLE ÇEKMELĐ PERDE RAYI VE MONTAJI 3 SET 6
HALI VE ALT KEÇE DÖŞEME 3 m2 165
HALI BAĞLANTI PROFĐLĐ 3 ADET 12
KAPI ĐPTALĐ VE YERĐNĐN KAPATILMASI 3 M2 6,99
GĐRĐŞ HOLU TAVANI YAPILMASI 3 M2 18
ODA ĐLAVE KARTONPĐYE YAPILMASI 3 MT 66
ŞAP TAMĐRĐ VE SU ĐZOLASYONU YAPILMASI 3 M2 9
REMOVAL 3 MAKTU 3
HS BANYO - ĐMALAT
MEVCUT BANYO DUVARLARI YIKIM 3 ADET 3
ĐLAVE BANYO DUVARI YAPIMI 3 m2 86,25
ALÇIPAN ASMA TAVAN 3 m2 21
ALÇI KARTONPĐYE 3 mt 35,25
MERMER YER DÖŞEME (AMASYA) 3 m2 9,75
MERMER BORDÜR (SIVRIHISAR) 3 mt 45,75
MERMER DUVAR KAPLAMA (AMAS+SIVRI) 3 m2 54
MERMER BANT (GIALLO) 3 mt 31,5
MERMER SÜPÜRGELĐK (SIVRIHĐSAR) 3 mt 16,5
MARBLE BATH TUB SET (SIVRI) 3 ADET 3
MERMR SET @WC ARKASI(GIALLO) 3 ADET 3
MARBLE SET @SHOWER 3 ADET 3
MERMER DUŞ TAŞI 3 ADET 3
CAM DUŞ KAPISI 3 ADET 3
DUŞUN CAM YAN PANELĐ 3 ADET 3
LAVABO TEZGAHI 3 ADET 3
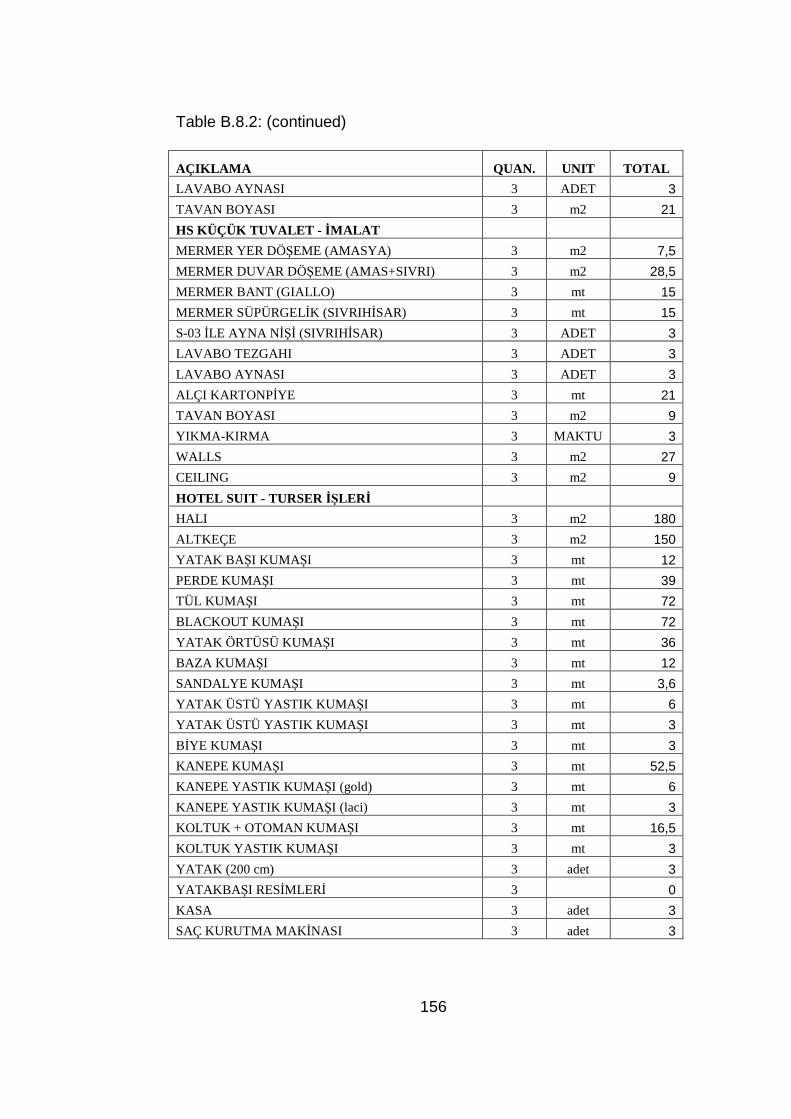
156
Table B.8.2: (continued)
AÇIKLAMA QUAN. UNIT TOTAL
LAVABO AYNASI 3 ADET 3
TAVAN BOYASI 3 m2 21
HS KÜÇÜK TUVALET - ĐMALAT
MERMER YER DÖŞEME (AMASYA) 3 m2 7,5
MERMER DUVAR DÖŞEME (AMAS+SIVRI) 3 m2 28,5
MERMER BANT (GIALLO) 3 mt 15
MERMER SÜPÜRGELĐK (SIVRIHĐSAR) 3 mt 15
S-03 ĐLE AYNA N ĐŞĐ (SIVRIHĐSAR) 3 ADET 3
LAVABO TEZGAHI 3 ADET 3
LAVABO AYNASI 3 ADET 3
ALÇI KARTONPĐYE 3 mt 21
TAVAN BOYASI 3 m2 9
YIKMA-KIRMA 3 MAKTU 3
WALLS 3 m2 27
CEILING 3 m2 9
HOTEL SUIT - TURSER ĐŞLER Đ
HALI 3 m2 180
ALTKEÇE 3 m2 150
YATAK BA ŞI KUMA ŞI 3 mt 12
PERDE KUMAŞI 3 mt 39
TÜL KUMA ŞI 3 mt 72
BLACKOUT KUMA ŞI 3 mt 72
YATAK ÖRTÜSÜ KUMAŞI 3 mt 36
BAZA KUMA ŞI 3 mt 12
SANDALYE KUMA ŞI 3 mt 3,6
YATAK ÜSTÜ YASTIK KUMA ŞI 3 mt 6
YATAK ÜSTÜ YASTIK KUMA ŞI 3 mt 3
BĐYE KUMAŞI 3 mt 3
KANEPE KUMAŞI 3 mt 52,5
KANEPE YASTIK KUMAŞI (gold) 3 mt 6
KANEPE YASTIK KUMAŞI (laci) 3 mt 3
KOLTUK + OTOMAN KUMA ŞI 3 mt 16,5
KOLTUK YASTIK KUMA ŞI 3 mt 3
YATAK (200 cm) 3 adet 3
YATAKBA ŞI RESĐMLERĐ 3 0
KASA 3 adet 3
SAÇ KURUTMA MAK ĐNASI 3 adet 3

157
Table B.8.2: (continued)
AÇIKLAMA QUAN. UNIT TOTAL
TRAŞ AYNASI 3 adet 3
PANTALON PRESĐ 3 adet 3
ÇALIŞMA MASA LAMBASI 3 adet 3
ABAJUR @ YATAK BAŞI 3 ADET 6
AYAKLI LAMBA 3 ADET 3
ABAJUR @KARE SEHPA 3 ADET 6
DUVAR APLĐĞĐ @ OTURMA ODASI 3 ADET 6
ODA DUVAR KAĞIDI 3 m2 210
LAVABO ARMATÜR 3 takım 3
ELEKTRĐK PRĐZ+ENERGY SAVER+VB. 3 maktuen 3
SEALED DOWNLIGHT 3 adet 9
KORĐDOR - MOBĐLYA
KONSOL 11 ADET 0
SEHPA 11 ADET 0
KOLTUK 11 ADET 0
TORCHIERE 11 ADET 0
PERDE-TÜL DĐKĐM 11 SET 0
KORĐDOR - ĐMALAT
PERDE-TÜL DĐKĐM 11 SET 11
HALI VE ALT KEÇE DÖŞEME 11 M2 1210
PERDE RAYI VE MONTAJI 11 SET 11
DUVAR KAĞIDI KAPLAMA 11 M2 2090
MEVCUT SÜPÜRGELĐK FINISHING 11 MT 935
MEVCUT KARTONPĐYE FINISHING 11 MT 1595
TAVAN BOYASI 11 M2 1320
MEVCUT KAPI TAM ĐR-BOYAMA 11 ADET 55
AKSES KAPILARI FINISHING 11 ADET 22
AHŞAP LAMBRĐ 11 M2 22
ELEKTRĐK ĐŞLERĐ 11 MAKTU 0
KORĐDOR - TURSER ĐŞLERĐ
HALI 11 M2 1980
ALTKEÇE 11 M2 1188,88
KOLTUK KUMA ŞI (2 KOLTUK) 11 MT 66
PERDE KUMAŞI 11 MT 176
TÜL KUMA ŞI 11 MT 99
DUVAR KAĞIDI 11 M2 2520,804
ARTWORK 11 0
ACCESSORIES 11 0

158
Table B.8. 3: Bill of quantities of Hotel C.
MILLENIUM HOTEL ANKARA ESTIMATED COST BREAKDOWN
TASKS
DESCRIPTION UNIT QTY
1 CIVIL WORKS
A DEMOLITION WORKS
1A1 DEMOLITION OF BRICK WALL M3 1250
1A2 DEMOLITION OF R/C M3 35
1A3 REMOVAL OF SUSPENDED CEILINGS M2 7100
1A4 SCRAPING OF EXISTING WALL PLASTER AND CERAMICS M2 2680
1A5 DEMOLITION OF EXISTING FLOORING AND REMOVAL M2 8900
1A6 REMOVAL OF DECORATIVE ELEMENTS IN LOWER FLOORS M2 415
1A7 DEMOLITION OF PIPING AND MECHANICAL DUCTS TON 350
1A8 DISMANTLING ALL ELECTRICAL SYSTEMS MT 15000
1A9 TRANSPORTATION OF DISMANTLED AND DEMOLISHED MAT. LS
DEMOLITION OF STEEL MEZZANINE FLOOR TON 4.5
B EARTH WORKS
1B1 EXCAVATION ( GENERAL ) M3 250
1B2 DITCH EXCAVATION M3 1590
1B3 TOP SOIL EXCAVATION BY HAND M3 50
1B4 REMOVAL OF EXCAVATED EARTH M3 450
1B5 TOP SOIL REFILL M3 1590
1B6 ASPHALT REPAIR MT 20
C INFRASTRUCTURE
1C1 LEAN CONCRETE( 300 KG/M3) M3 250
1C2 READY MIX CONCRETE ( B 225 ) M3 500
1C3 LAYING GRAVEL ON BASE M3 80
1C4 REINFORCEMENT STEEL TON 5
1C5 BASEMENT WALLS WATER INSULATION( PVC JEOMEN BRANE 2 mm) M2 1050
1C6 BASEMENT FLOOR WATER INSULATION M2 770
1C7 Ф 15 PVC DRAINAGE INSTALLATION MT 450
D ROOFING
1D1 LEVELLING CONCRETE M2 1800
1D2 SELF LEVELLING SCREED M2 2805
1D3 PVC BASED JEOMEMBERANE WATER INSULATION 2 mm 2805
1D4 ROOF HEAT INSULATION WITH EXTRUDED POLYSTYRENE M2 2805
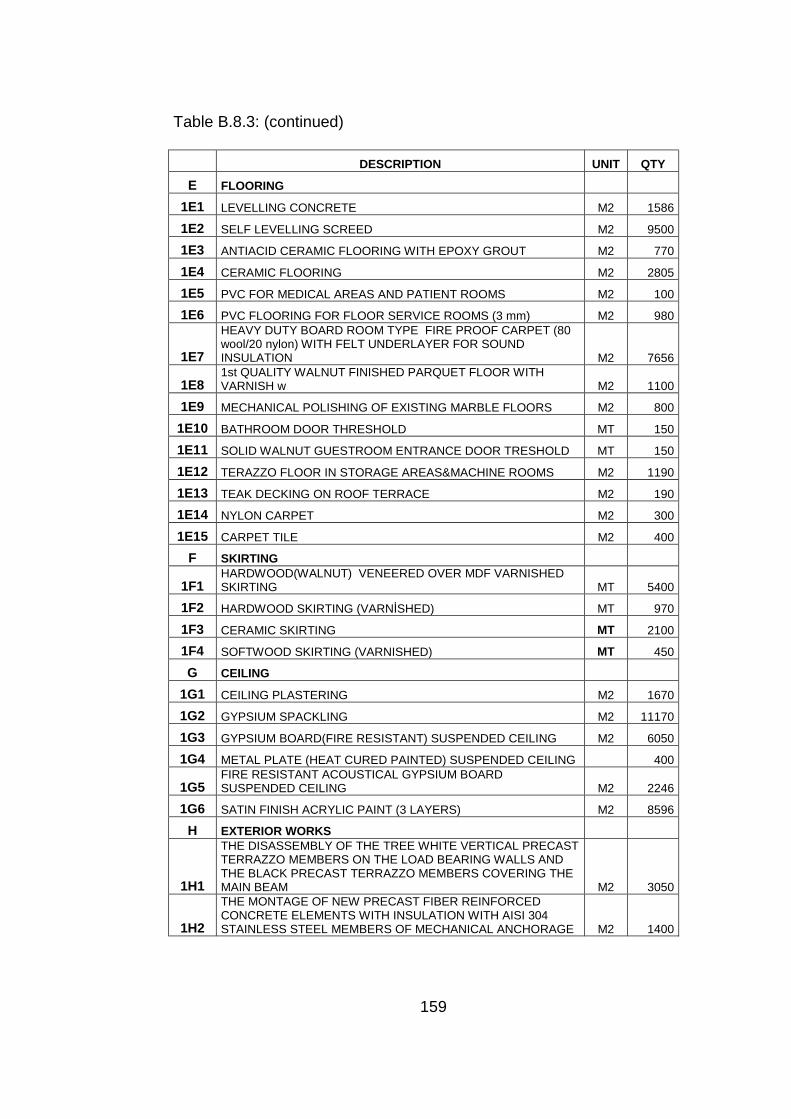
159
Table B.8.3: (continued)
DESCRIPTION UNIT QTY
E FLOORING
1E1 LEVELLING CONCRETE M2 1586
1E2 SELF LEVELLING SCREED M2 9500
1E3 ANTIACID CERAMIC FLOORING WITH EPOXY GROUT M2 770
1E4 CERAMIC FLOORING M2 2805
1E5 PVC FOR MEDICAL AREAS AND PATIENT ROOMS M2 100
1E6 PVC FLOORING FOR FLOOR SERVICE ROOMS (3 mm) M2 980
1E7
HEAVY DUTY BOARD ROOM TYPE FIRE PROOF CARPET (80 wool/20 nylon) WITH FELT UNDERLAYER FOR SOUND INSULATION M2 7656
1E8 1st QUALITY WALNUT FINISHED PARQUET FLOOR WITH VARNISH w M2 1100
1E9 MECHANICAL POLISHING OF EXISTING MARBLE FLOORS M2 800
1E10 BATHROOM DOOR THRESHOLD MT 150
1E11 SOLID WALNUT GUESTROOM ENTRANCE DOOR TRESHOLD MT 150
1E12 TERAZZO FLOOR IN STORAGE AREAS&MACHINE ROOMS M2 1190
1E13 TEAK DECKING ON ROOF TERRACE M2 190
1E14 NYLON CARPET M2 300
1E15 CARPET TILE M2 400
F SKIRTING
1F1 HARDWOOD(WALNUT) VENEERED OVER MDF VARNISHED SKIRTING MT 5400
1F2 HARDWOOD SKIRTING (VARNĐSHED) MT 970
1F3 CERAMIC SKIRTING MT 2100
1F4 SOFTWOOD SKIRTING (VARNISHED) MT 450
G CEILING
1G1 CEILING PLASTERING M2 1670
1G2 GYPSIUM SPACKLING M2 11170
1G3 GYPSIUM BOARD(FIRE RESISTANT) SUSPENDED CEILING M2 6050
1G4 METAL PLATE (HEAT CURED PAINTED) SUSPENDED CEILING 400
1G5 FIRE RESISTANT ACOUSTICAL GYPSIUM BOARD SUSPENDED CEILING M2 2246
1G6 SATIN FINISH ACRYLIC PAINT (3 LAYERS) M2 8596
H EXTERIOR WORKS
1H1
THE DISASSEMBLY OF THE TREE WHITE VERTICAL PRECAST TERRAZZO MEMBERS ON THE LOAD BEARING WALLS AND THE BLACK PRECAST TERRAZZO MEMBERS COVERING THE MAIN BEAM M2 3050
1H2
THE MONTAGE OF NEW PRECAST FIBER REINFORCED CONCRETE ELEMENTS WITH INSULATION WITH AISI 304 STAINLESS STEEL MEMBERS OF MECHANICAL ANCHORAGE M2 1400
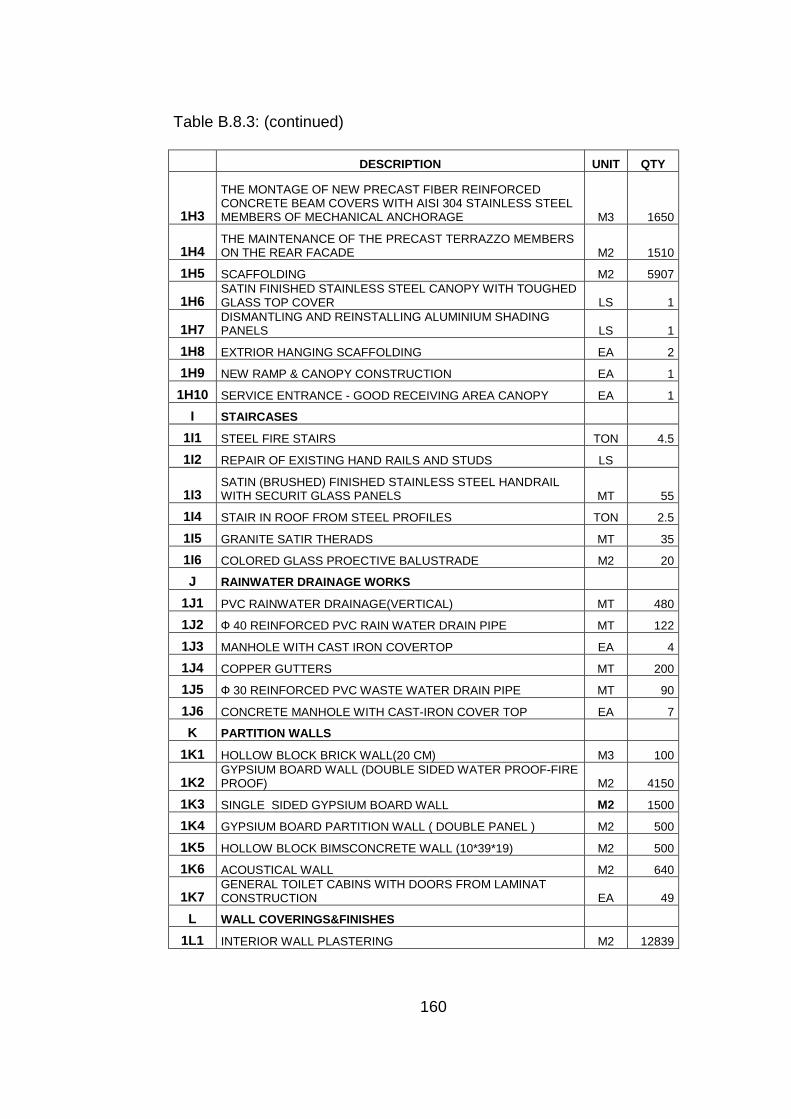
160
Table B.8.3: (continued)
DESCRIPTION UNIT QTY
1H3
THE MONTAGE OF NEW PRECAST FIBER REINFORCED CONCRETE BEAM COVERS WITH AISI 304 STAINLESS STEEL MEMBERS OF MECHANICAL ANCHORAGE M3 1650
1H4 THE MAINTENANCE OF THE PRECAST TERRAZZO MEMBERS ON THE REAR FACADE M2 1510
1H5 SCAFFOLDING M2 5907
1H6 SATIN FINISHED STAINLESS STEEL CANOPY WITH TOUGHED GLASS TOP COVER LS 1
1H7 DISMANTLING AND REINSTALLING ALUMINIUM SHADING PANELS LS 1
1H8 EXTRIOR HANGING SCAFFOLDING EA 2
1H9 NEW RAMP & CANOPY CONSTRUCTION EA 1
1H10 SERVICE ENTRANCE - GOOD RECEIVING AREA CANOPY EA 1
I STAIRCASES
1I1 STEEL FIRE STAIRS TON 4.5
1I2 REPAIR OF EXISTING HAND RAILS AND STUDS LS
1I3 SATIN (BRUSHED) FINISHED STAINLESS STEEL HANDRAIL WITH SECURIT GLASS PANELS MT 55
1I4 STAIR IN ROOF FROM STEEL PROFILES TON 2.5
1I5 GRANITE SATIR THERADS MT 35
1I6 COLORED GLASS PROECTIVE BALUSTRADE M2 20
J RAINWATER DRAINAGE WORKS
1J1 PVC RAINWATER DRAINAGE(VERTICAL) MT 480
1J2 Ф 40 REINFORCED PVC RAIN WATER DRAIN PIPE MT 122
1J3 MANHOLE WITH CAST IRON COVERTOP EA 4
1J4 COPPER GUTTERS MT 200
1J5 Ф 30 REINFORCED PVC WASTE WATER DRAIN PIPE MT 90
1J6 CONCRETE MANHOLE WITH CAST-IRON COVER TOP EA 7
K PARTITION WALLS
1K1 HOLLOW BLOCK BRICK WALL(20 CM) M3 100
1K2 GYPSIUM BOARD WALL (DOUBLE SIDED WATER PROOF-FIRE PROOF) M2 4150
1K3 SINGLE SIDED GYPSIUM BOARD WALL M2 1500
1K4 GYPSIUM BOARD PARTITION WALL ( DOUBLE PANEL ) M2 500
1K5 HOLLOW BLOCK BIMSCONCRETE WALL (10*39*19) M2 500
1K6 ACOUSTICAL WALL M2 640
1K7 GENERAL TOILET CABINS WITH DOORS FROM LAMINAT CONSTRUCTION EA 49
L WALL COVERINGS&FINISHES
1L1 INTERIOR WALL PLASTERING M2 12839
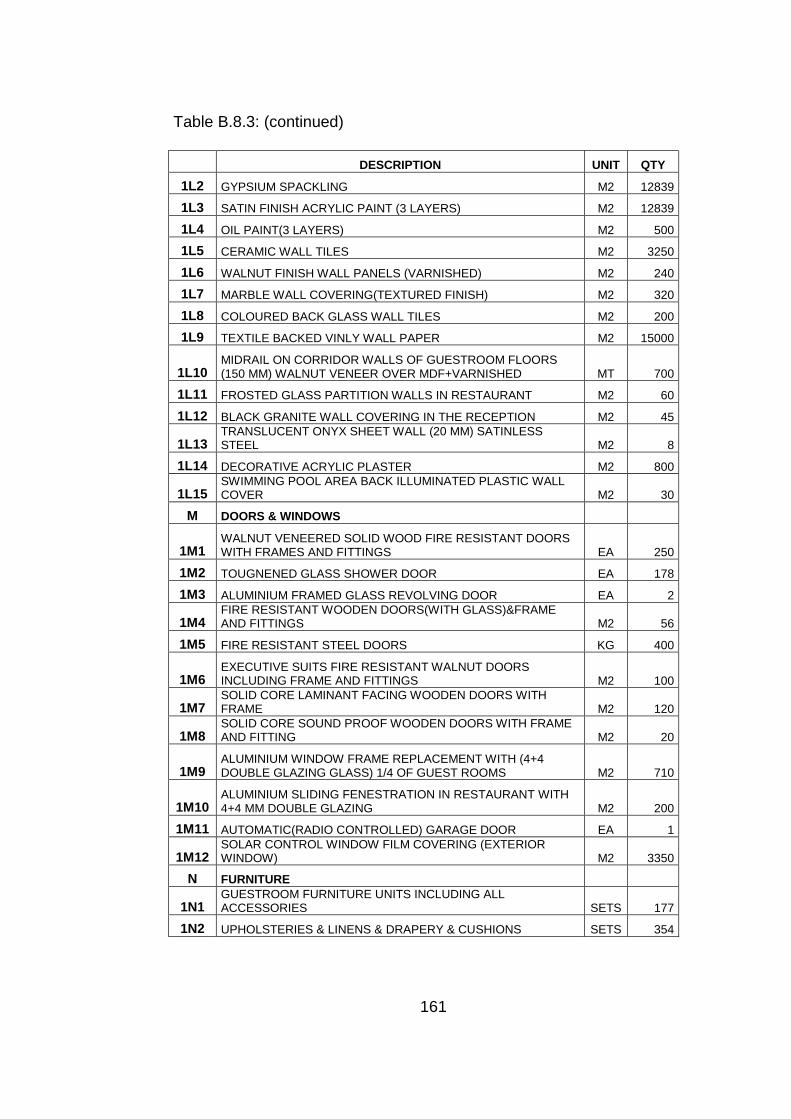
161
Table B.8.3: (continued)
DESCRIPTION UNIT QTY
1L2 GYPSIUM SPACKLING M2 12839
1L3 SATIN FINISH ACRYLIC PAINT (3 LAYERS) M2 12839
1L4 OIL PAINT(3 LAYERS) M2 500
1L5 CERAMIC WALL TILES M2 3250
1L6 WALNUT FINISH WALL PANELS (VARNISHED) M2 240
1L7 MARBLE WALL COVERING(TEXTURED FINISH) M2 320
1L8 COLOURED BACK GLASS WALL TILES M2 200
1L9 TEXTILE BACKED VINLY WALL PAPER M2 15000
1L10 MIDRAIL ON CORRIDOR WALLS OF GUESTROOM FLOORS (150 MM) WALNUT VENEER OVER MDF+VARNISHED MT 700
1L11 FROSTED GLASS PARTITION WALLS IN RESTAURANT M2 60
1L12 BLACK GRANITE WALL COVERING IN THE RECEPTION M2 45
1L13 TRANSLUCENT ONYX SHEET WALL (20 MM) SATINLESS STEEL M2 8
1L14 DECORATIVE ACRYLIC PLASTER M2 800
1L15 SWIMMING POOL AREA BACK ILLUMINATED PLASTIC WALL COVER M2 30
M DOORS & WINDOWS
1M1 WALNUT VENEERED SOLID WOOD FIRE RESISTANT DOORS WITH FRAMES AND FITTINGS EA 250
1M2 TOUGNENED GLASS SHOWER DOOR EA 178
1M3 ALUMINIUM FRAMED GLASS REVOLVING DOOR EA 2
1M4 FIRE RESISTANT WOODEN DOORS(WITH GLASS)&FRAME AND FITTINGS M2 56
1M5 FIRE RESISTANT STEEL DOORS KG 400
1M6 EXECUTIVE SUITS FIRE RESISTANT WALNUT DOORS INCLUDING FRAME AND FITTINGS M2 100
1M7 SOLID CORE LAMINANT FACING WOODEN DOORS WITH FRAME M2 120
1M8 SOLID CORE SOUND PROOF WOODEN DOORS WITH FRAME AND FITTING M2 20
1M9 ALUMINIUM WINDOW FRAME REPLACEMENT WITH (4+4 DOUBLE GLAZING GLASS) 1/4 OF GUEST ROOMS M2 710
1M10 ALUMINIUM SLIDING FENESTRATION IN RESTAURANT WITH 4+4 MM DOUBLE GLAZING M2 200
1M11 AUTOMATIC(RADIO CONTROLLED) GARAGE DOOR EA 1
1M12 SOLAR CONTROL WINDOW FILM COVERING (EXTERIOR WINDOW) M2 3350
N FURNITURE
1N1 GUESTROOM FURNITURE UNITS INCLUDING ALL ACCESSORIES SETS 177
1N2 UPHOLSTERIES & LINENS & DRAPERY & CUSHIONS SETS 354
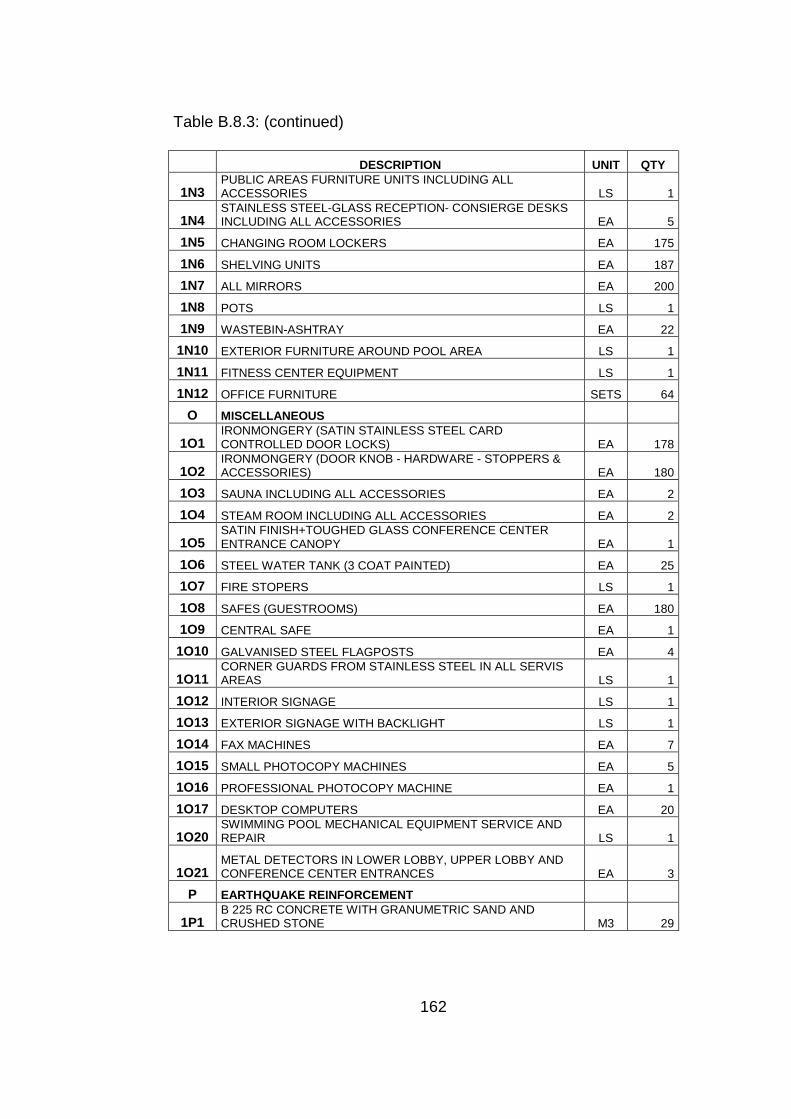
162
Table B.8.3: (continued)
DESCRIPTION UNIT QTY
1N3 PUBLIC AREAS FURNITURE UNITS INCLUDING ALL ACCESSORIES LS 1
1N4 STAINLESS STEEL-GLASS RECEPTION- CONSIERGE DESKS INCLUDING ALL ACCESSORIES EA 5
1N5 CHANGING ROOM LOCKERS EA 175
1N6 SHELVING UNITS EA 187
1N7 ALL MIRRORS EA 200
1N8 POTS LS 1
1N9 WASTEBIN-ASHTRAY EA 22
1N10 EXTERIOR FURNITURE AROUND POOL AREA LS 1
1N11 FITNESS CENTER EQUIPMENT LS 1
1N12 OFFICE FURNITURE SETS 64
O MISCELLANEOUS
1O1 IRONMONGERY (SATIN STAINLESS STEEL CARD CONTROLLED DOOR LOCKS) EA 178
1O2 IRONMONGERY (DOOR KNOB - HARDWARE - STOPPERS & ACCESSORIES) EA 180
1O3 SAUNA INCLUDING ALL ACCESSORIES EA 2
1O4 STEAM ROOM INCLUDING ALL ACCESSORIES EA 2
1O5 SATIN FINISH+TOUGHED GLASS CONFERENCE CENTER ENTRANCE CANOPY EA 1
1O6 STEEL WATER TANK (3 COAT PAINTED) EA 25
1O7 FIRE STOPERS LS 1
1O8 SAFES (GUESTROOMS) EA 180
1O9 CENTRAL SAFE EA 1
1O10 GALVANISED STEEL FLAGPOSTS EA 4
1O11 CORNER GUARDS FROM STAINLESS STEEL IN ALL SERVIS AREAS LS 1
1O12 INTERIOR SIGNAGE LS 1
1O13 EXTERIOR SIGNAGE WITH BACKLIGHT LS 1
1O14 FAX MACHINES EA 7
1O15 SMALL PHOTOCOPY MACHINES EA 5
1O16 PROFESSIONAL PHOTOCOPY MACHINE EA 1
1O17 DESKTOP COMPUTERS EA 20
1O20 SWIMMING POOL MECHANICAL EQUIPMENT SERVICE AND REPAIR LS 1
1O21 METAL DETECTORS IN LOWER LOBBY, UPPER LOBBY AND CONFERENCE CENTER ENTRANCES EA 3
P EARTHQUAKE REINFORCEMENT
1P1 B 225 RC CONCRETE WITH GRANUMETRIC SAND AND CRUSHED STONE M3 29

163
Table B.8.3: (continued)
DESCRIPTION UNIT QTY
1P2 POURING OF CONCRETE WITH PUMP M3 29
1P3 STEEL MESH ENVELOPE OVER OLD COLUMN FOR ADHERENCE Kg 500
1P4 CONCRETE FORMWORK WITH TONGUE&GROVE JOINTS AND FINE FINISHED SURFACE M2 216
1P5 Ф 8-12 MM REINFORCING BAR TON 2.46
1P6 Ф 14-18 MM REINFORCING BAR TON 7.055
1P7 SCRAPING THE EXISTING PLASTER M2 216
1P8 SCRAPING FLOOR CONCRETE AROUND THE COLUMN AND CORNERS M2 216
1P9 CLEANING THE COLUMN SURFACE WITH AIR COMPRESSOR M2 216
1P10
CARBONFIBER SIKA CARBODUR ENVELOPE WRAPPED AROUND COLUMN WITH FIXING TYPE AND SIKADUR 30 ADHESIVE M2 115
1P11 SCAFFOLDING AROUND THE COLUMN TO SUPPORT THE BEAMS AND FLOORSLAB M3 1000
1P12
EPOXY RESIN GROUT APPLIED TO CARCKS AND THE ENDS OF REINFORCEMENT BARS AND AROUND THE OLD COLUMN SURFACES Kg 450
TO PROVIDE FOR CONTINGENCIES FOR TEN YEARS PERIOD
1 For ceramic tiles for walls and floors 7% For each specific type
2 For telecommunication apparatus 2%
3 For drapery 2%
4 For carpets 5% For each
class
5 For magnetic door locks 5%
6 For window hardware 5%
7 For paint material 10% For each type and color
8 For wallpaper 2% For each
type
9 For parquet flooring 2% For each
type
10 For textile (Table cloth) 5% For each
type
11 For lighting fixtures 10% For each
fixture
12 For bathroom fixtures 5% For each
fixture
13 For furnishings 5% For each
loose furniture

164
Table B. 9: Electricity profile of Turkey.
ELEKTR ĐK ÜRETĐM VE DAĞITIMI 2006 III. DÖNEM (Temmuz – A ğustos – Eylül) Sayı:204 21 Aralık 2006 10:00 Elektrik enerjisi üretimi 2006 yılı III. döneminde, bir önceki yılın aynı dönemine göre % 9,21 artarak 46.360,4 GWh olarak gerçekleşmiştir. Elektrik enerjisi üretimi 2006 yılı III. döneminde bir önceki döneme göre % 10,95 artmıştır. Üretilen elektriğin 2005 yılı III. döneminde; 32.394,5 GWh'ı termik, 10.043,0 GWh'ı hidrolik ve 11,9 GWh’ı da rüzgar enerjisi iken, 2006 yılı III.döneminde ise; 36.059,7 GWh'ı termik, 10.254,5 GWh'ı hidrolik ve 46,2 GWh’ı da rüzgar enerjisi olarak gerçekleşmiştir. 2006 yılı III. döneminde, 2005 yılı III. dönemine göre termik elektrik enerjisi üretiminde %11,31, hidroelektrik enerjisi üretiminde ise %2,11 oranında üretim artışı görülmüştür. 2006 Yılı III. döneminde elektrik enerjisinin % 49,64’ü Elektrik Üretim A.Ş. (EÜAŞ) ve EÜAŞ'a bağlı ortaklıklar, % 41,66‘sı üretim şirketleri, %8,70’i otoprodüktörler tarafından gerçekleştirilmiştir. Elektrik üretimi bir önceki yılın aynı dönemine göre EÜAŞ ve EÜAŞ’a bağlı ortaklıklarda %8,78, üretim şirketlerinde %12,71 artmış, otoprodüktörlerde ise %2,99 oranında azalmıştır. Brüt elektrik enerjisi üretiminin, enerji kaynaklarına göre 2005 yılı III. döneminde %46,84'ü doğal gaz, %23,66'sı su, %18,20'si linyit, 2006 yılı III. döneminde ise %46,74'ü doğal gaz, %22,12’si su, %18,05’i linyit ile çalışan santrallerden sağlanmıştır. Bir önceki yılın aynı dönemine göre elektrik üretimi, doğal gaz santrallerinde %9, linyit santrallerinde %8,29 oranında artmıştır. Elektrik tüketimi, 2006 yılı III. döneminde bir önceki yılın aynı dönemine göre %11,62 artarak 34.306 GWh olarak gerçekleşmiştir. Elektrik enerjisinin %41,23'ü sanayide, %23,81'i meskenlerde, %15,85’i ticarethanelerde, %4,14’ü tarımsal sulamada, %3,52’si resmi dairelerde, %2,06’sı sokak aydınlatmasında, %1,81’i şantiyelerde ve %7,58’i ise diğer ve doğrudan satışlar olarak tüketilmiştir. 2006 Yılı III. döneminde, 2005 yılı III. dönemine göre elektrik dağıtım şirketlerinin elektrik satış gelirleri cari fiyatlarla %15,72 oranında artmıştır.

165
Table B. 10: Operating energy consumptions of hotels. (Source: Technical departments of hotels).
Table B.10.1: Operating energy consumption of Hotel A by years.
Year Natural Gas Consumption
(m3)
Eletricity Consumption
(KWh)
Water Consumption
(m3) 1989 5.828.209 1990 5.285.160 1991 4.984.752 1992 5.147.070 1993 4.938.750 1994 454.623 4.934.790 82.706 1995 523.688 5.005.290 84.975
1996 586.779 5.020.230 88.723 1997 622.218 5.029.410 91.704 1998 643.848 5.145.576 81.898 1999 636.288 4.655.834 74.783 2000 664.498 4.632.279 75.760 2001 612.967 4.331.341 60.083 2002 675.167 4.462.333 65.679 2003 648.180 4.909.046 61.621 2004 660.344 4.783.144 71.099 2005 619.666 4.983.540 67.475
Average Annual Consumption:
612.356 4.824.401 75.542
Table B.10.2: Operating energy consumption of Hotel B for 2006.
Months Natural Gas Consumption
(m3)
Eletricity Consumption
(KWh)
Water Consumption
(m3) January 2963 493185 80526
February 3346 497494 83061 March 4200 494266 61077
April 5203 528928 38461 May 4847 594827 35434
June 5863 782335 31331 July 8806 826988 33688
August 656 926762 27771 September 5919 721124 29184
October 3982 531827 33620 November 3928 524015 62763 December 3529 530134 68747
Annual Consumption: 53242 7451885 585663
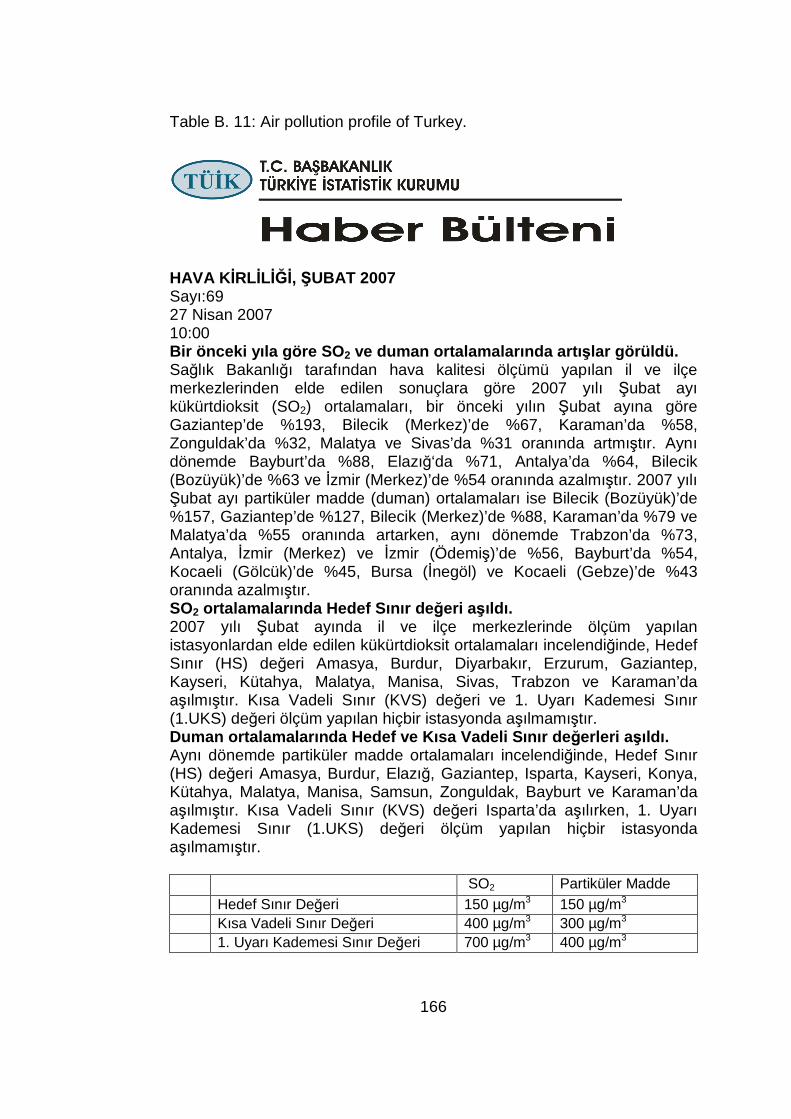
166
Table B. 11: Air pollution profile of Turkey.
HAVA K ĐRLĐLĐĞĐ, ŞUBAT 2007 Sayı:69 27 Nisan 2007 10:00 Bir önceki yıla göre SO 2 ve duman ortalamalarında artı şlar görüldü. Sağlık Bakanlığı tarafından hava kalitesi ölçümü yapılan il ve ilçe merkezlerinden elde edilen sonuçlara göre 2007 yılı Şubat ayı kükürtdioksit (SO2) ortalamaları, bir önceki yılın Şubat ayına göre Gaziantep’de %193, Bilecik (Merkez)’de %67, Karaman’da %58, Zonguldak’da %32, Malatya ve Sivas’da %31 oranında artmıştır. Aynı dönemde Bayburt’da %88, Elazığ‘da %71, Antalya’da %64, Bilecik (Bozüyük)’de %63 ve Đzmir (Merkez)’de %54 oranında azalmıştır. 2007 yılı Şubat ayı partiküler madde (duman) ortalamaları ise Bilecik (Bozüyük)’de %157, Gaziantep’de %127, Bilecik (Merkez)’de %88, Karaman’da %79 ve Malatya’da %55 oranında artarken, aynı dönemde Trabzon’da %73, Antalya, Đzmir (Merkez) ve Đzmir (Ödemiş)’de %56, Bayburt’da %54, Kocaeli (Gölcük)’de %45, Bursa (Đnegöl) ve Kocaeli (Gebze)’de %43 oranında azalmıştır. SO2 ortalamalarında Hedef Sınır de ğeri aşıldı. 2007 yılı Şubat ayında il ve ilçe merkezlerinde ölçüm yapılan istasyonlardan elde edilen kükürtdioksit ortalamaları incelendiğinde, Hedef Sınır (HS) değeri Amasya, Burdur, Diyarbakır, Erzurum, Gaziantep, Kayseri, Kütahya, Malatya, Manisa, Sivas, Trabzon ve Karaman’da aşılmıştır. Kısa Vadeli Sınır (KVS) değeri ve 1. Uyarı Kademesi Sınır (1.UKS) değeri ölçüm yapılan hiçbir istasyonda aşılmamıştır. Duman ortalamalarında Hedef ve Kısa Vadeli Sınır de ğerleri a şıldı. Aynı dönemde partiküler madde ortalamaları incelendiğinde, Hedef Sınır (HS) değeri Amasya, Burdur, Elazığ, Gaziantep, Isparta, Kayseri, Konya, Kütahya, Malatya, Manisa, Samsun, Zonguldak, Bayburt ve Karaman’da aşılmıştır. Kısa Vadeli Sınır (KVS) değeri Isparta’da aşılırken, 1. Uyarı Kademesi Sınır (1.UKS) değeri ölçüm yapılan hiçbir istasyonda aşılmamıştır. SO2 Partiküler Madde
Hedef Sınır Değeri 150 µg/m3 150 µg/m3 Kısa Vadeli Sınır Değeri 400 µg/m3 300 µg/m3 1. Uyarı Kademesi Sınır Değeri 700 µg/m3 400 µg/m3
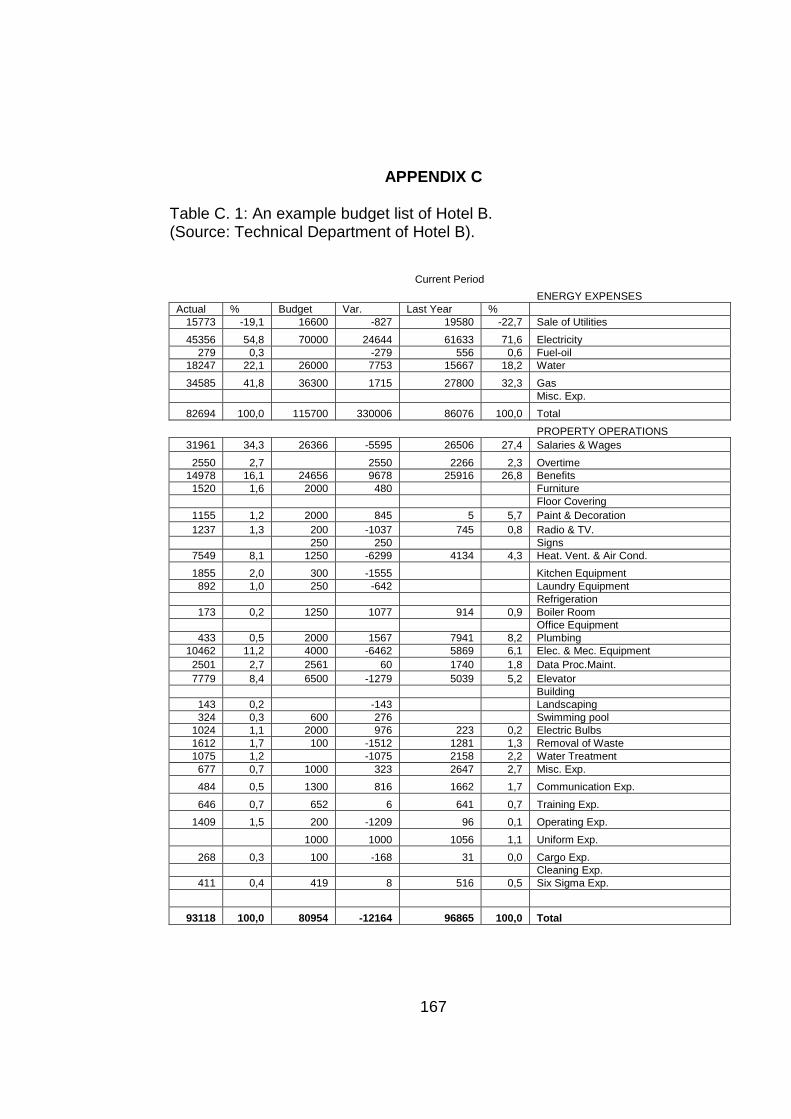
167
APPENDIX C Table C. 1: An example budget list of Hotel B. (Source: Technical Department of Hotel B).
Current Period
ENERGY EXPENSES Actual % Budget Var. Last Year %
15773 -19,1 16600 -827 19580 -22,7 Sale of Utilities
45356 54,8 70000 24644 61633 71,6 Electricity 279 0,3 -279 556 0,6 Fuel-oil
18247 22,1 26000 7753 15667 18,2 Water
34585 41,8 36300 1715 27800 32,3 Gas Misc. Exp.
82694 100,0 115700 330006 86076 100,0 Total
PROPERTY OPERATIONS 31961 34,3 26366 -5595 26506 27,4 Salaries & Wages
2550 2,7 2550 2266 2,3 Overtime 14978 16,1 24656 9678 25916 26,8 Benefits 1520 1,6 2000 480 Furniture
Floor Covering 1155 1,2 2000 845 5 5,7 Paint & Decoration 1237 1,3 200 -1037 745 0,8 Radio & TV.
250 250 Signs 7549 8,1 1250 -6299 4134 4,3 Heat. Vent. & Air Cond.
1855 2,0 300 -1555 Kitchen Equipment 892 1,0 250 -642 Laundry Equipment
Refrigeration 173 0,2 1250 1077 914 0,9 Boiler Room
Office Equipment 433 0,5 2000 1567 7941 8,2 Plumbing
10462 11,2 4000 -6462 5869 6,1 Elec. & Mec. Equipment 2501 2,7 2561 60 1740 1,8 Data Proc.Maint. 7779 8,4 6500 -1279 5039 5,2 Elevator
Building 143 0,2 -143 Landscaping 324 0,3 600 276 Swimming pool
1024 1,1 2000 976 223 0,2 Electric Bulbs 1612 1,7 100 -1512 1281 1,3 Removal of Waste 1075 1,2 -1075 2158 2,2 Water Treatment 677 0,7 1000 323 2647 2,7 Misc. Exp.
484 0,5 1300 816 1662 1,7 Communication Exp.
646 0,7 652 6 641 0,7 Training Exp.
1409 1,5 200 -1209 96 0,1 Operating Exp.
1000 1000 1056 1,1 Uniform Exp.
268 0,3 100 -168 31 0,0 Cargo Exp. Cleaning Exp.
411 0,4 419 8 516 0,5 Six Sigma Exp.
93118 100,0 80954 -12164 96865 100,0 Total
168
Table C. 2: The paired-sample t-test tables.
Table C.2. 1: Paired-sample t-test – primary energy consumption
Paired Samples Statistics
,00868171 7 ,014117677 ********
,04583671 7 ,072128832 ********
,00868171 7 ,014117677 ********
,07636614 7 ,095601641 ********
,04583671 7 ,072128832 ********
,07636614 7 ,095601641 ********
HOTEL_B
HOTEL_A
Pair1
HOTEL_B
HOTEL_C
Pair2
HOTEL_A
HOTEL_C
Pair3
Mean N Std. DeviationStd. Error
Mean
Paired Samples Correlations
7 -,035 ,940
7 -,021 ,964
7 ,925 ,003
HOTEL_B & HOTEL_APair 1
HOTEL_B & HOTEL_CPair 2
HOTEL_A & HOTEL_CPair 3
N Correlation Sig.
Table C.2. 2: Paired-sample t-test – solid waste
Paired Samples Statistics
,17961243 7 ,259079185 ********
1,210701 7 2,405120221 ********
,17961243 7 ,259079185 ********
2,037577 7 3,346088660 ********
1,210701 7 2,405120221 ********
2,037577 7 3,346088660 ********
HOTEL_B
HOTEL_A
Pair1
HOTEL_B
HOTEL_C
Pair2
HOTEL_A
HOTEL_C
Pair3
Mean N Std. DeviationStd. Error
Mean
Paired Samples Correlations
7 ,116 ,805
7 ,295 ,521
7 ,931 ,002
HOTEL_B & HOTEL_APair 1
HOTEL_B & HOTEL_CPair 2
HOTEL_A & HOTEL_CPair 3
N Correlation Sig.
169
Table C.2. 3: Paired-sample t-test – air pollution index
Paired Samples Statistics
,13224086 7 ,220062660 ********
,63118071 7 1,116234869 ********
,13224086 7 ,220062660 ********
1,092542 7 1,502638136 ********
,63118071 7 1,116234869 ********
1,092542 7 1,502638136 ********
HOTEL_B
HOTEL_A
Pair1
HOTEL_B
HOTEL_C
Pair2
HOTEL_A
HOTEL_C
Pair3
Mean N Std. DeviationStd. Error
Mean
Paired Samples Correlations
7 ,016 ,973
7 ,033 ,944
7 ,929 ,002
HOTEL_B & HOTEL_APair 1
HOTEL_B & HOTEL_CPair 2
HOTEL_A & HOTEL_CPair 3
N Correlation Sig.
Table C.2. 4: Paired-sample t-test – water pollution index
Paired Samples Statistics
,00811443 7 ,014511885 ********
,02777071 7 ,041944442 ********
,00811443 7 ,014511885 ********
,05214743 7 ,066975546 ********
,02777071 7 ,041944442 ********
,05214743 7 ,066975546 ********
HOTEL_B
HOTEL_A
Pair1
HOTEL_B
HOTEL_C
Pair2
HOTEL_A
HOTEL_C
Pair3
Mean N Std. DeviationStd. Error
Mean
Paired Samples Correlations
7 ,091 ,846
7 ,119 ,799
7 ,852 ,015
HOTEL_B & HOTEL_APair 1
HOTEL_B & HOTEL_CPair 2
HOTEL_A & HOTEL_CPair 3
N Correlation Sig.
170
Table C.2. 5: Paired-sample t-test – global warming potential
Paired Samples Statistics
,36657300 7 ,527770405 ********
3,643213 7 8,230690916 ********
,36657300 7 ,527770405 ********
5,363587 7 10,365103857 ********
3,643213 7 8,230690916 ********
5,363587 7 10,365103857 ********
HOTEL_B
HOTEL_A
Pair1
HOTEL_B
HOTEL_C
Pair2
HOTEL_A
HOTEL_C
Pair3
Mean N Std. DeviationStd. Error
Mean
Paired Samples Correlations
7 ,168 ,718
7 ,168 ,718
7 ,992 ,000
HOTEL_B & HOTEL_APair 1
HOTEL_B & HOTEL_CPair 2
HOTEL_A & HOTEL_CPair 3
N Correlation Sig.
Table C.2. 6: Paired-sample t-test – weighted resource use Paired Samples Statistics
1,941474 7 2,452265062 ********
52,19237 7 102,4061927 ********
1,941474 7 2,452265062 ********
65,81554 7 128,8037514 ********
52,19237 7 102,4061927 ********
65,81554 7 128,8037514 ********
HOTEL_B
HOTEL_A
Pair1
HOTEL_B
HOTEL_C
Pair2
HOTEL_A
HOTEL_C
Pair3
Mean N Std. DeviationStd. Error
Mean
Paired Samples Correlations
7 ,724 ,066
7 ,759 ,048
7 ,995 ,000
HOTEL_B & HOTEL_APair 1
HOTEL_B & HOTEL_CPair 2
HOTEL_A & HOTEL_CPair 3
N Correlation Sig.
171
Table C. 3: The impacts of seven materials during life cycle stages according to six LCA indicators.
Primary Energy Consumption Solid Waste API WPI
Global Warming Potential
Weighted Resource Use
Manufacturing 2938312 102755 48796 2 349612 4325856
Construction 218645 2 70 0 394 4961
End-Of-Life 87650 1 32 0 171 1989
Total Embodied Sub-Total 3244607 102758 48898 2 350177 4332806
Operating Energy: 2801203827 12983498 43995544 2004 116382542 343052159
HO
TE
L A
Total Life Cycle: 2804448434 13086256 44044442 2006 116732719 347384965
Manufacturing 50875 1779 845 0 6054 74899
Construction 3786 0 1 0 7 86
End-Of-Life 1517 0 0 0 3 34
Total Embodied Sub-Total 56178 1779 846 0 6064 75019
Operating Energy: 1793138937 9031928 25624988 982 71694723 249090594
HO
TE
L B
Total Life Cycle: 1793195115 9033707 25625834 982 71700787 249165613
Manufacturing 2224848 77804 36947 1 264722 3275476
Construction 165555 2 53 0 298 3757
End-Of-Life 66367 1 24 0 130 1506
Total Embodied Sub-Total 2456770 77807 37024 1 265150 3280739
Operating Energy: 1518270563 7385911 22617808 917 61722607 200207100
LEV
ELL
ING
CO
NC
RE
TE
HO
TE
L C
Total Life Cycle: 1520727333 7463718 22654832 918 61987757 203487839
Manufacturing 627510 22922 10317 1 24726 105902
Construction 14427 0 5 0 26 327
End-Of-Life 5980 0 2 0 11 136
Total Embodied Sub-Total 647917 22922 10324 1 24763 106365
Operating Energy: 2801203827 12983498 43995544 2004 116382542 343052159
HO
TE
L A
Total Life Cycle: 2801851744 13006420 44005868 2005 116407305 343158524
Manufacturing 156170 5827 2568 0 6157 26601
Construction 3638 0 1 0 7 83
End-Of-Life 1508 0 0 0 3 34
Total Embodied Sub-Total 161316 5827 2569 0 6167 26718
Operating Energy: 1793138937 9031928 25624988 982 71694723 249090594
HO
TE
L B
Total Life Cycle: 1793300253 9037755 25627557 982 71700890 249117312
Manufacturing 1303743 47733 21435 1 51374 220244
Construction 30017 0 10 0 54 681
End-Of-Life 12442 0 4 0 22 282
Total Embodied Sub-Total 1346202 47733 21449 1 51450 221207
Operating Energy: 1518270563 7385911 22617808 917 61722607 200207100
GY
PS
UM
BO
AR
D
HO
TE
L C
Total Life Cycle: 1519616765 7433644 22639257 918 61774057 200428307
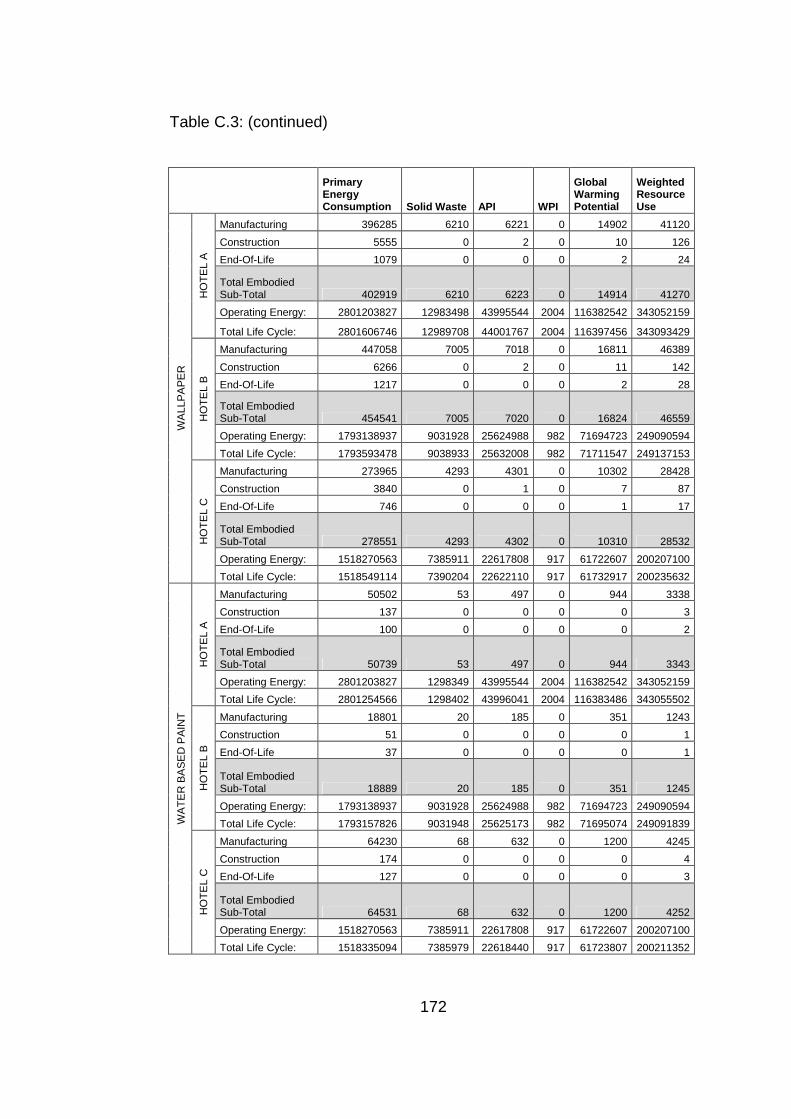
172
Table C.3: (continued)
Primary Energy Consumption Solid Waste API WPI
Global Warming Potential
Weighted Resource Use
Manufacturing 396285 6210 6221 0 14902 41120
Construction 5555 0 2 0 10 126
End-Of-Life 1079 0 0 0 2 24
Total Embodied Sub-Total 402919 6210 6223 0 14914 41270
Operating Energy: 2801203827 12983498 43995544 2004 116382542 343052159
HO
TE
L A
Total Life Cycle: 2801606746 12989708 44001767 2004 116397456 343093429
Manufacturing 447058 7005 7018 0 16811 46389
Construction 6266 0 2 0 11 142
End-Of-Life 1217 0 0 0 2 28
Total Embodied Sub-Total 454541 7005 7020 0 16824 46559
Operating Energy: 1793138937 9031928 25624988 982 71694723 249090594
HO
TE
L B
Total Life Cycle: 1793593478 9038933 25632008 982 71711547 249137153
Manufacturing 273965 4293 4301 0 10302 28428
Construction 3840 0 1 0 7 87
End-Of-Life 746 0 0 0 1 17
Total Embodied Sub-Total 278551 4293 4302 0 10310 28532
Operating Energy: 1518270563 7385911 22617808 917 61722607 200207100
WA
LLP
AP
ER
HO
TE
L C
Total Life Cycle: 1518549114 7390204 22622110 917 61732917 200235632
Manufacturing 50502 53 497 0 944 3338
Construction 137 0 0 0 0 3
End-Of-Life 100 0 0 0 0 2
Total Embodied Sub-Total 50739 53 497 0 944 3343
Operating Energy: 2801203827 1298349 43995544 2004 116382542 343052159
HO
TE
L A
Total Life Cycle: 2801254566 1298402 43996041 2004 116383486 343055502
Manufacturing 18801 20 185 0 351 1243
Construction 51 0 0 0 0 1
End-Of-Life 37 0 0 0 0 1
Total Embodied Sub-Total 18889 20 185 0 351 1245
Operating Energy: 1793138937 9031928 25624988 982 71694723 249090594
HO
TE
L B
Total Life Cycle: 1793157826 9031948 25625173 982 71695074 249091839
Manufacturing 64230 68 632 0 1200 4245
Construction 174 0 0 0 0 4
End-Of-Life 127 0 0 0 0 3
Total Embodied Sub-Total 64531 68 632 0 1200 4252
Operating Energy: 1518270563 7385911 22617808 917 61722607 200207100
WA
TE
R B
AS
ED
PA
INT
HO
TE
L C
Total Life Cycle: 1518335094 7385979 22618440 917 61723807 200211352
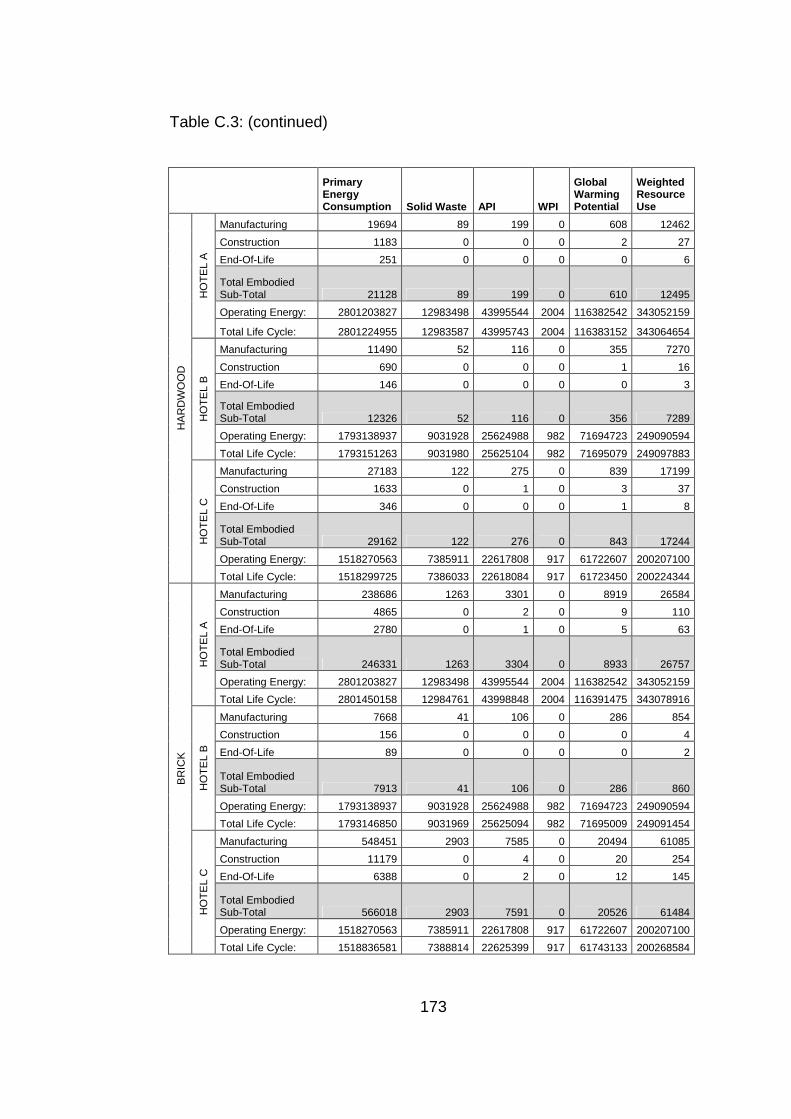
173
Table C.3: (continued)
Primary Energy Consumption Solid Waste API WPI
Global Warming Potential
Weighted Resource Use
Manufacturing 19694 89 199 0 608 12462
Construction 1183 0 0 0 2 27
End-Of-Life 251 0 0 0 0 6
Total Embodied Sub-Total 21128 89 199 0 610 12495
Operating Energy: 2801203827 12983498 43995544 2004 116382542 343052159
HO
TE
L A
Total Life Cycle: 2801224955 12983587 43995743 2004 116383152 343064654
Manufacturing 11490 52 116 0 355 7270
Construction 690 0 0 0 1 16
End-Of-Life 146 0 0 0 0 3
Total Embodied Sub-Total 12326 52 116 0 356 7289
Operating Energy: 1793138937 9031928 25624988 982 71694723 249090594
HO
TE
L B
Total Life Cycle: 1793151263 9031980 25625104 982 71695079 249097883
Manufacturing 27183 122 275 0 839 17199
Construction 1633 0 1 0 3 37
End-Of-Life 346 0 0 0 1 8
Total Embodied Sub-Total 29162 122 276 0 843 17244
Operating Energy: 1518270563 7385911 22617808 917 61722607 200207100
HA
RD
WO
OD
HO
TE
L C
Total Life Cycle: 1518299725 7386033 22618084 917 61723450 200224344
Manufacturing 238686 1263 3301 0 8919 26584
Construction 4865 0 2 0 9 110
End-Of-Life 2780 0 1 0 5 63
Total Embodied Sub-Total 246331 1263 3304 0 8933 26757
Operating Energy: 2801203827 12983498 43995544 2004 116382542 343052159
HO
TE
L A
Total Life Cycle: 2801450158 12984761 43998848 2004 116391475 343078916
Manufacturing 7668 41 106 0 286 854
Construction 156 0 0 0 0 4
End-Of-Life 89 0 0 0 0 2
Total Embodied Sub-Total 7913 41 106 0 286 860
Operating Energy: 1793138937 9031928 25624988 982 71694723 249090594
HO
TE
L B
Total Life Cycle: 1793146850 9031969 25625094 982 71695009 249091454
Manufacturing 548451 2903 7585 0 20494 61085
Construction 11179 0 4 0 20 254
End-Of-Life 6388 0 2 0 12 145
Total Embodied Sub-Total 566018 2903 7591 0 20526 61484
Operating Energy: 1518270563 7385911 22617808 917 61722607 200207100
BR
ICK
HO
TE
L C
Total Life Cycle: 1518836581 7388814 22625399 917 61743133 200268584

174
Table C.3: (continued)
Primary Energy Consumption Solid Waste API WPI
Global Warming Potential
Weighted Resource Use
Manufacturing 33098 0 11 0 60 1214317
Construction 171401 2 55 0 309 3889
End-Of-Life 228535 2 73 0 412 5186
Total Embodied Sub-Total 433034 4 139 0 781 1223392
Operating Energy: 2801203827 12983498 43995544 2004 116382542 343052159
HO
TE
L A
Total Life Cycle: 2801636861 12983502 43995683 2004 116383323 344275551
Manufacturing 40 0 0 0 0 1455
Construction 205 0 0 0 0 5
End-Of-Life 274 0 0 0 0 6
Total Embodied Sub-Total 519 0 0 0 0 1466
Operating Energy: 1793138937 9031928 25624988 982 71694723 249090594
HO
TE
L B
Total Life Cycle: 1793139456 9031928 25624988 982 71694723 249092060
Manufacturing 18404 0 6 0 33 675210
Construction 95306 1 31 0 172 2163
End-Of-Life 127075 1 41 0 229 2884
Total Embodied Sub-Total 240785 2 78 0 434 680257
Operating Energy: 1518270563 7385911 22617808 917 61722607 200207100
PLA
ST
ER
HO
TE
L C
Total Life Cycle: 1518511348 7385913 22617886 917 61723041 200887357
175
CURRICULUM VITAE
PERSONEL INFORMATION
Surname, Name : Çakmaklı (Zeytun), Ayşem Berrin Nationality : Turkish (TC) Date of Birth : 05.11.1974 Place of Birth : Konya Marital Status : Married email : [email protected]
EDUCATION
Expected date of Comp., June. 2007 PhD., METU, Faculty of Architecture Department of Architecture, Ankara. GPA: 3.89
June 2003 CISCO Networking Academy CCNA Certificate, METU SEM, Ankara.
June 2000 MS, METU, Faculty of Architecture Department of Architecture, Ankara. GPA: 3.68
June 1997 BS, METU, Faculty of Architecture Department of Architecture, Ankara. GPA: 2.74
June 1992 High School, Meram Anadolu Lisesi, Konya. GPA: 9.01
WORK EXPERIENCE
Dec. 1997 – July 2005 METU Faculty of Architecture, Research Assistant as a Computer Coordinator of Faculty of Architecture. 2000 – 2005.
1998 - 2001 Fall and Spring Semesters Research Assistant in “ARCH 488 Solar Control and Utilization in Architecture”.
1998 - 2005 Fall Semesters Research Assistant in “ARCH 281 Environmental Design I”
1998 - 2005 Spring Semesters Research Assistant in “ARCH 282 Environmental Design II
1998 - 2005 Fall and Spring Semesters Research Assistant in “ARCH 461 Computer Literacy in Architecture”
176
October 2005 - present Başkent University GSTMF, Department of Interior Architecture and Environmental Design, Instructor.
2005 - 2007 Fall Semesters IMB 111- Computer Aided Drawing I IMB 220 – Physical Environmental Control I IMB 313 - Physical Environmental Control II
2005 - 2007 Spring Semesters IMB 112- Computer Aided Drawing II MUH 122- Technical Drawing ARCH 282- Environmental Design I (as Part-time Instructor)
FOREIGN LANGUAGES
Advanced English, Intermediate German
CONFERENCES
Sept. 1999 Presenting a paper named as “Sürdürülebilir ve Ekolojik Yüzey Malzemeleri ” in “Mimari Biçimlendirmede Yüzey Sempozyumu” that was organized by Gazi University Faculty of Engineering and Architecture Department of Architecture and Chamber of Architecture in Ankara.
Oct. 2002 – Sept. 2003
Taking task in organizing committee of ““CIB W62 2003 29 th International Symposium on Water Supply and Drainag e for Buildings” at September 11-12, 2003 in Ankara .
18-20 January 2006
Presenting a paper named as “Hotel Renovation Projects and LCC in “CIB W107 International Symposium on Construction in Developing Economies: New Issues an d Challenges” that was organized by CIB in Santiago, CHILE.
23-25 March 2006
Presenting a paper named as “Designing Living Spaces In Contemporary Architecture” in “18th International Building and Life Congress” that was organized by Bursa Chamber of Architects in Bursa.
Related Documents