Lean and clean building manufacturing excellence in the UK

Welcome message from author
This document is posted to help you gain knowledge. Please leave a comment to let me know what you think about it! Share it to your friends and learn new things together.
Transcript

Lean and clean building manufacturing excellence in the UK
1
Improving resource efficiency is a futureproof route to higher productivity for manufacturing
Improving the performance of manufacturing is crucial to rebalancing the UK economy north to south. Manufacturing is 15-20 per cent of the economy of lagging regions. Although this includes some top performing companies, there is also a long tail of low productivity manufacturers that struggle to provide good jobs and wages.
Rising input costs, investors’ concern over resource risks and businesses using environmental innovation for competitive edge, are all factors elevating resource efficiency from an operational to a strategic issue for UK firms.
The best manufacturers are improving their energy efficiency by 50 per cent over ten years, whilst the rest only achieve 10-15 per cent. This gap will not be closed by businesses on their own. Faulty signals on current and future costs, and a lack of strategic insight on resource issues, means opportunities are not being realised.
A government supported manufacturing upgrade programme, which helps businesses to identify and capitalise on resource efficiency opportunities, is needed to spread best practice and stimulate investment and innovation.

Raising manufacturing productivity will rebalance the economy

3
Manufacturing employment is concentrated in low productivity sectors
There is a huge difference between the productivity of different regions, firms and sectors. Some sectors, like pharma and electronics, are amongst the highest performers in the UK, but the majority of manufacturing jobs are in relatively low productivity sectors which are less able to support good jobs and higher wages.
0.0 0.2 0.4 0.6 0.8 1.0 1.2 1.4 1.6 1.8 Metal products
Other
Wood, paper and printing
Electrical
Rubber and plastic products
Food and drink
Machinery
Chemical products
Transport
Computers and electronics
Pharmaceuticals
0 100 200 300 400 500Index of productivity (UK=100)
% total UK employment

4
Raising manufacturing productivity will have most benefit in lagging regions
Parts of the country with a larger manufacturing economy also have lower overall productivity. But manufacturing is not the cause of low productivity, in fact, it could be part of the solution. Raising the performance of manufacturing will have bigger benefits in lagging regions and help to close the UK’s productivity gap.
70 80 100 120 1400
2
4
6
8
10
12
14
16
18
Yorkshire andthe Humber
East Midlands
East of England
London
North East
North WestNorthern Ireland
Scotland
South EastSouth West
Wales West Midlands
Regional economic performance (productivity index, UK=100)
Man
ufac
turin
g G
VA a
s a
% o
f tot
al G
VA
90 110 130
To raise productivity, most UK regions will need to focus on manufacturing

5
Manufacturing is a significant source of carbon emissions
Industry accounts for 33 per cent of all UK emissions, 25 per cent from the direct use of oil and gas and eight per cent from electricity demand. Manufacturing is responsible for around 60 per cent of this, or a fifth of total carbon emissions. Reducing these emissions by reducing energy use and increasing resource efficiency supports manufacturing competitiveness by lowering costs and extracting more value per resource input used.
Supporting the transition to low carbon manufacturing also avoids offshoring manufacturing employment and emissions to countries with more carbon intensive production methods.
Direct CO₂emissions Employment
24%26%
16%
15%13%
4%
3%
3%
3%
4%
7%
2%
81%
UK manufacturing emissions and employment by sector
Other
Paper
Plastics
Chemicals
Mineral
Refining
Basic metals
6
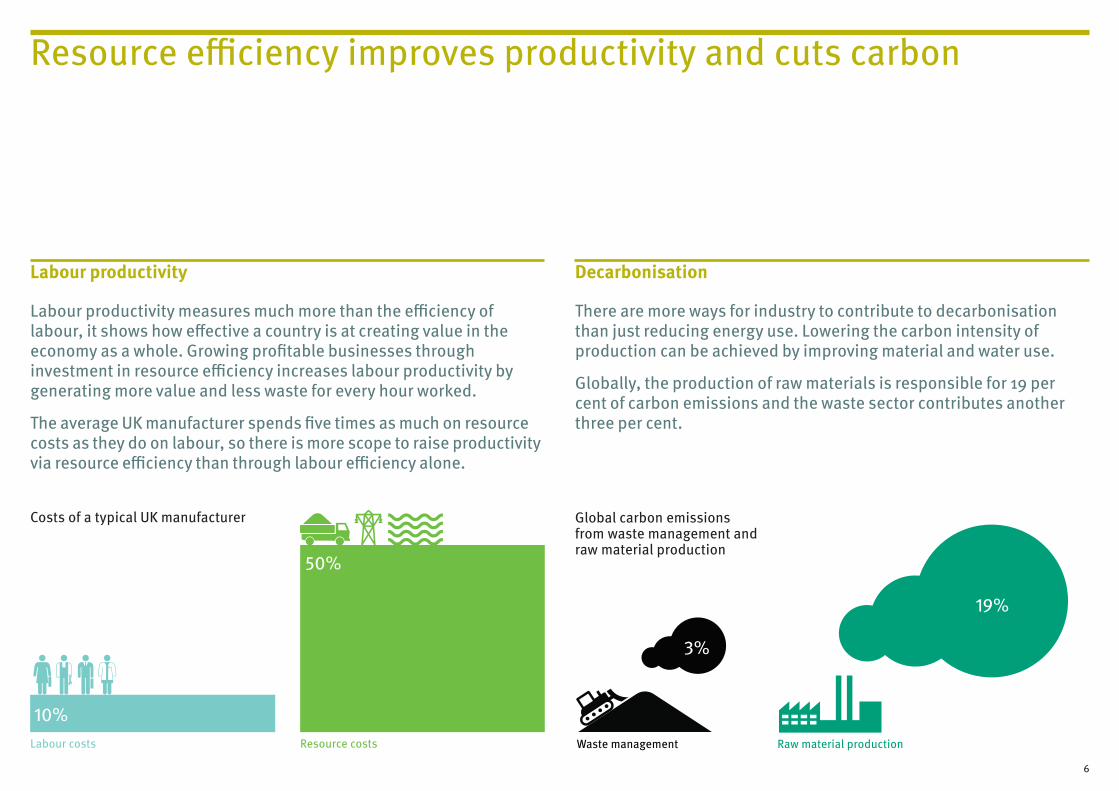
Labour productivity
Labour productivity measures much more than the efficiency of labour, it shows how effective a country is at creating value in the economy as a whole. Growing profitable businesses through investment in resource efficiency increases labour productivity by generating more value and less waste for every hour worked.
The average UK manufacturer spends five times as much on resource costs as they do on labour, so there is more scope to raise productivity via resource efficiency than through labour efficiency alone.
Decarbonisation
There are more ways for industry to contribute to decarbonisation than just reducing energy use. Lowering the carbon intensity of production can be achieved by improving material and water use.
Globally, the production of raw materials is responsible for 19 per cent of carbon emissions and the waste sector contributes another three per cent.
Resource efficiency improves productivity and cuts carbon
Waste management Raw material production
Global carbon emissions from waste management and raw material production
3%
19%
10%
50%
Labour costs Resource costs
Costs of a typical UK manufacturer

Investors have woken up to rising resource risks

8
Material prices are volatile and rising over the long term. In the past 15 years manufacturers have experienced a 75 per cent increase in input prices, in contrast to manufacturing wage costs, which have only risen by eight per cent.
A rising oil price affects manufacturers everywhere, but the recent fall in sterling means the UK is particularly exposed. In 2016, when input prices rose by 18 per cent, the biggest cost increases were for crude oil and imported metals.
Non-labour input costs are rising rapidly for UK producers
Manufacturing labour and material prices
40
60
80
100
120
140
2017201620152014201320122011201020092008200720062005200420032002
Materials
Labour
Index (base year 2010 = 100)
Pric
e in
dex
Other imported materials
Imported chemicals
Imported food materials
Home food materials
Imported metals
Crude oil
56%
33%
24%
12% 10% 9%
Rise in input prices, March 2016 to March 2017

9
A growing number of businesses are asking their suppliers to disclose their climate change and water related risks. The Carbon Disclosure Project (CDP) has seen a 24 fold increase in interest from investors in these risks between 2003 and 2016. Resource scarcity risks
Four in five institutional investors would reconsider or rule out investment if made aware of resource scarcity risks.
Supply chain risks
Nine out of ten investors would reconsider or rule out investment where risks in the supply chain have not been addressed.
Resource risk is a growing concern for investors

10
Across the whole economy, the fastest growing companies are those that actively manage their environmental impact. Companies which have decoupled their growth from their greenhouse gas emissions have seen revenue growth of 29 per cent over a five year period while other companies saw declining revenues.
Stoxx, a low carbon index, shows that companies tackling their emissions have outperformed global benchmark stocks by six per cent over the past four years
In 2016, 48 per cent of the Fortune 500 and 63 per cent of the Fortune 100 set targets to improve their energy efficiency and environmental footprint. As a result, 190 of these companies achieved $3.7 billion in savings in 2016.
Competitive pressures are increasing
Fortune 500 Fortune 100Fortune 200-100
Percentage of US companies setting environmental targets
2013 2016 2013 20162013 2016
48%
60%63%
54%57%
43%
Company revenue change over five years
Companies that have grown without increasing emissions
29%

11
As the pressure to decarbonise increases, it will be necessary to redesign products, processes and business models to improve resource and energy productivity and stay competitive. The UK’s leading manufacturing sectors have seen limited low carbon
innovation. The UK aerospace, engine, turbine and motor vehicle sectors could lose their comparative advantage to Germany, Japan and other countries which are investing more in R&D to commercialise low carbon technologies.
The UK’s leading sectors are not adapting fast enough
Countries gaining and losing advantage by sector, compared to the global average
Low
car
bon
inno
vatio
n
Export performance
Aircraft and spacecraft
CHN
USA
JPNDEU
KOR NLD
UK
FRA
rising stars maintaining success
going nowhere losing advantage
Engines and turbines
CHNUSA
UK
FRA
DEU
KOR
JPN
NLD
Motor vehicles
NLD
KORCHN
JPN
USAFRA
DEU
UK
rising stars maintaining success
going nowhere losing advantage
rising stars maintaining success
going nowhere losing advantage
Rising stars export less and innovate more
Maintaining success export more and innovate more
Going nowhere export less and innovate less
Losing advantage export more but innovate less
Bubble size = size of the sector in each country compared to global sector

Businesses need help to raise resource productivity

13
Our analysis of industrial resource efficiency evaluations in the UK and Europe has identified three market failures which prevent businesses from capitalising on resource opportunities.
Key market failures
The failure of price signals The environmental costs of extraction, resource depletion and waste are not fully reflected in market prices. Since 2015, there has been a 23 per cent increase in the number of companies building carbon and resource pricing into their decision making but most companies do not have the information to understand where they are exposed to future resource constraints or policy shocks.
Underinvestment in information and innovation Companies often lack the ability to identify and quantify inefficiencies and vulnerabilities in their operations, so they underinvest in product or process solutions. Between 2002 and 2012, most companies achieved 10-15 per cent energy efficiency gains but, in the same time frame, some companies were able to achieve efficiencies of over 50 per cent.
A lack of strategic foresight Incumbents and small supply chain players tend to minimise disruption to operations, maintain existing product standards and focus on incremental change. Energy and resource efficiency issues, despite their significant potential to affect long term continuity and performance, rarely figure in a business’s strategic foresight and planning.
Businesses will not address these issues on their own
14
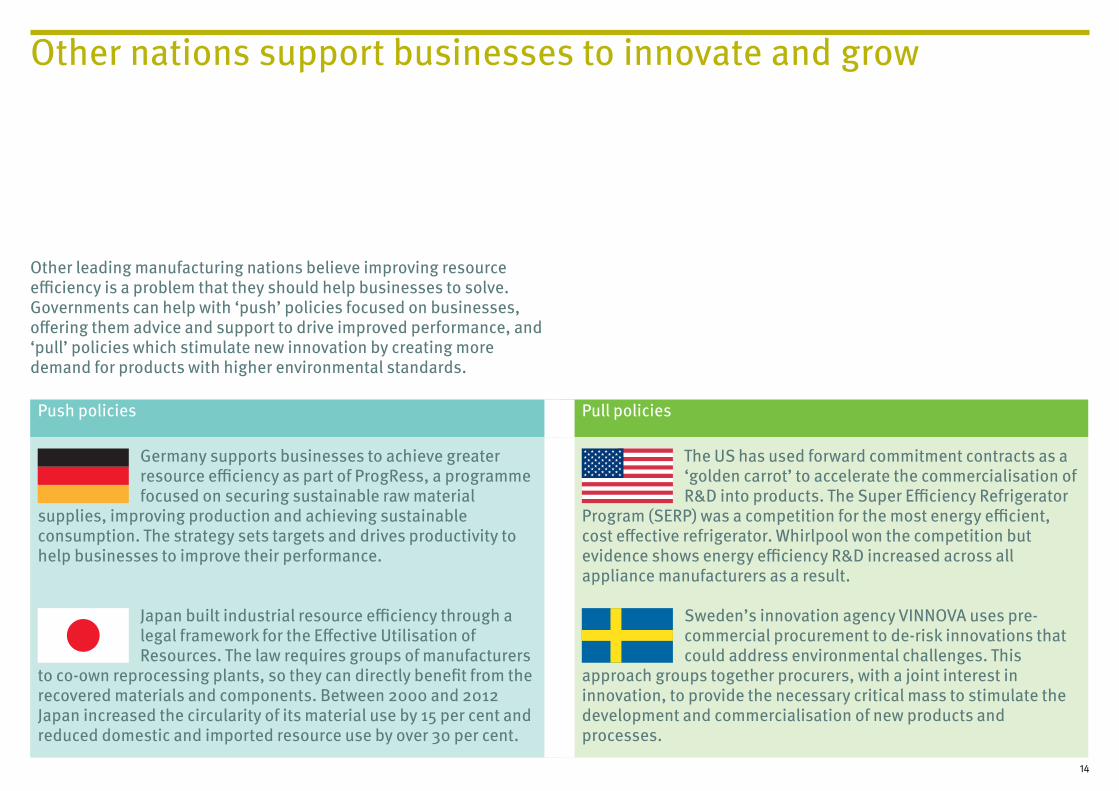
Other nations support businesses to innovate and grow
Push policies Pull policies
Germany supports businesses to achieve greater resource efficiency as part of ProgRess, a programme focused on securing sustainable raw material
supplies, improving production and achieving sustainable consumption. The strategy sets targets and drives productivity to help businesses to improve their performance.
Japan built industrial resource efficiency through a legal framework for the Effective Utilisation of Resources. The law requires groups of manufacturers
to co-own reprocessing plants, so they can directly benefit from the recovered materials and components. Between 2000 and 2012 Japan increased the circularity of its material use by 15 per cent and reduced domestic and imported resource use by over 30 per cent.
The US has used forward commitment contracts as a ‘golden carrot’ to accelerate the commercialisation of R&D into products. The Super Efficiency Refrigerator
Program (SERP) was a competition for the most energy efficient, cost effective refrigerator. Whirlpool won the competition but evidence shows energy efficiency R&D increased across all appliance manufacturers as a result.
Sweden’s innovation agency VINNOVA uses pre-commercial procurement to de-risk innovations that could address environmental challenges. This
approach groups together procurers, with a joint interest in innovation, to provide the necessary critical mass to stimulate the development and commercialisation of new products and processes.
Other leading manufacturing nations believe improving resource efficiency is a problem that they should help businesses to solve. Governments can help with ‘push’ policies focused on businesses, offering them advice and support to drive improved performance, and ‘pull’ policies which stimulate new innovation by creating more demand for products with higher environmental standards.

A new programme to improve UK manufacturing productivity
16
1 2 3 4 5
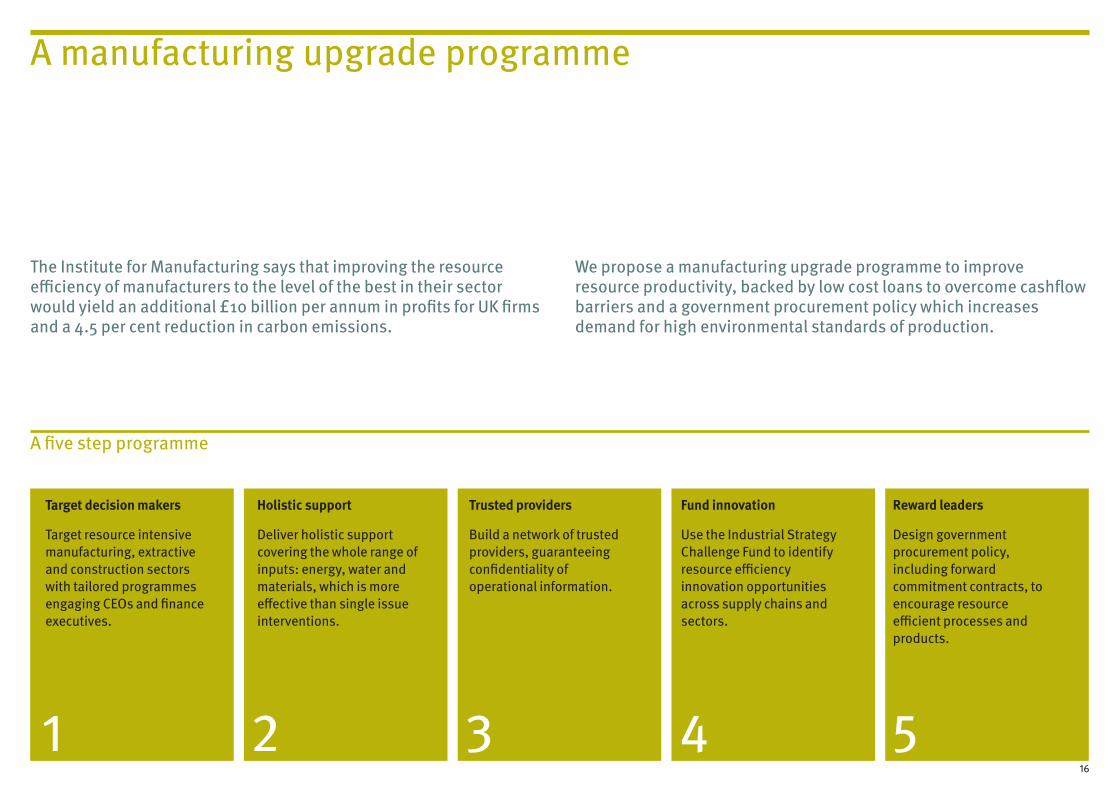
A manufacturing upgrade programme
The Institute for Manufacturing says that improving the resource efficiency of manufacturers to the level of the best in their sector would yield an additional £10 billion per annum in profits for UK firms and a 4.5 per cent reduction in carbon emissions.
We propose a manufacturing upgrade programme to improve resource productivity, backed by low cost loans to overcome cashflow barriers and a government procurement policy which increases demand for high environmental standards of production.
A five step programme
Target decision makers
Target resource intensive manufacturing, extractive and construction sectors with tailored programmes engaging CEOs and finance executives.
Holistic support
Deliver holistic support covering the whole range of inputs: energy, water and materials, which is more effective than single issue interventions.
Trusted providers
Build a network of trusted providers, guaranteeing confidentiality of operational information.
Fund innovation
Use the Industrial Strategy Challenge Fund to identify resource efficiency innovation opportunities across supply chains and sectors.
Reward leaders
Design government procurement policy, including forward commitment contracts, to encourage resource efficient processes and products.
17
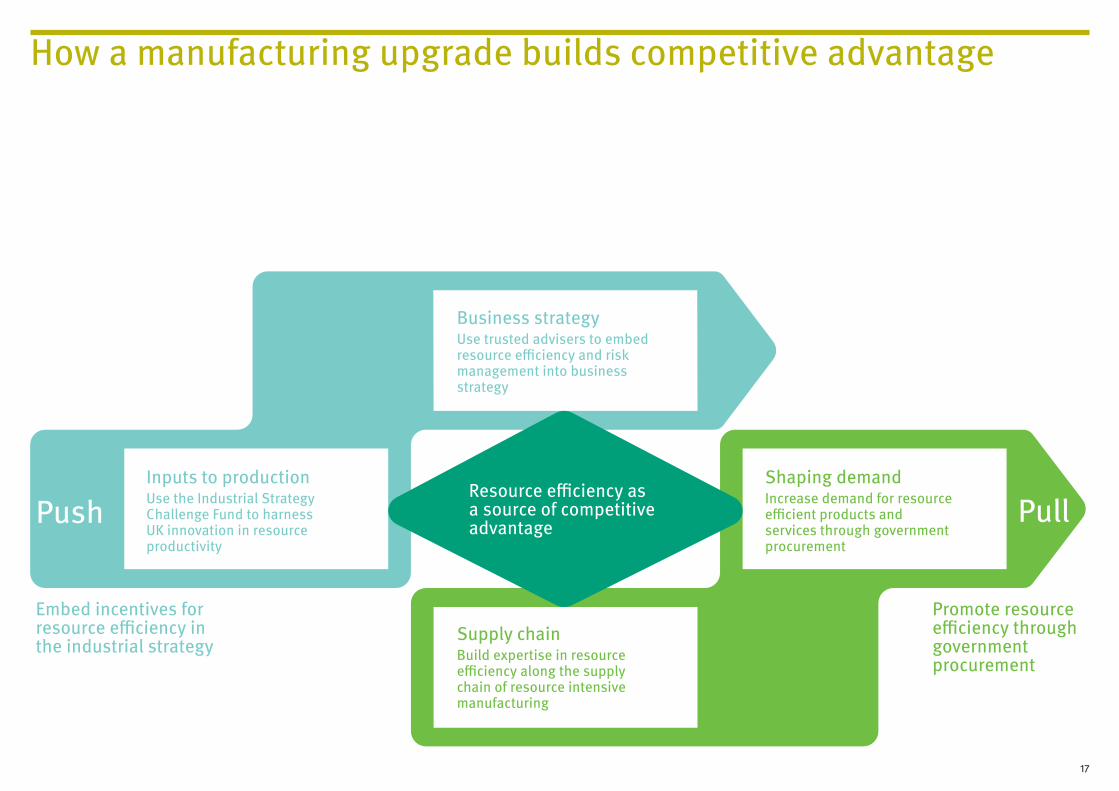
Push Pull
Embed incentives forresource efficiency in the industrial strategy
Promote resource efficiency through government procurement
Business strategyUse trusted advisers to embed resource efficiency and risk management into business strategy
Inputs to productionUse the Industrial Strategy Challenge Fund to harness UK innovation in resource productivity
Supply chainBuild expertise in resource efficiency along the supply chain of resource intensive manufacturing
Shaping demandIncrease demand for resource efficient products and services through government procurement
Resource efficiency as a source of competitive advantage
How a manufacturing upgrade builds competitive advantage

18
Endnotes
Page 3Green Alliance analysis of manufacturing productivity and employment is based on the following: ONS, UK national accounts blue book, ‘industrial analyses’, 2012 data; and ONS, Business register and employment survey (BRES), ‘UK employment statistics’, 2012 data.
Page 4 ONS, Regional and subregional productivity, ‘Regional GVA per hour worked indices’, 2015 dataONS, Regional Accounts via Nomis, Regional gross value added by industry, ‘Manufacturing gross value added’, 2015 data
Page 5Committee on Climate Change (CCC), 2017, Meeting carbon budgets: closing the policy gap, Report to Parliament, ‘Industry direct emissions and proportion generated by manufacturing’, p 91. This report also highlights that industrial carbon emissions are required to fall by 20 per cent between 2016 and 2030 to meet the carbon budget. CCC, 2013, Fourth carbon budget review technical report: sectoral analysis of the cost-effective path to the 2050 target, ‘Industrial electricity demand in 2012’, p 81CCC, 2017, Energy prices and bills report, ‘UK manufacturing emissions and employment by sector 2014’, Figure 3.2, p 94
Page 6Manufacturing Commission, 2015, Industrial evolution: making British manufacturing sustainable, p 24Enkvist et al, 2015, cited in A Behrens, 2016, What is the link between climate policy and the circular economy?
Page 8ONS, 2017, Material prices from UK producer price inflation and Labour prices from UK unit wage costs, 2002-2017
Page 9Carbon Disclosure Project (CDP), 2016, CDP climate change report, United Kingdom edition, p 34CDP, 2017, Catching up with the leaders: accelerating corporate water stewardship in Europe, CDP European Water Report 2017
EY, 2015, Tomorrow’s investment rules 2.0, p 16
Page 10CDP, 2016, Out of the starting blocks: tracking progress on corporate climate action, Figure 7, p 9CDP, 2016, CDP climate change report 2016, Nordic edition, p 21CDP et al, 2017, Power forward 3.0, Table 1, p 12
Page 11M Carvalho and S Fankhauser, 2017, UK export opportunities in a low carbon economy, Figure 2
Page 13Green Alliance analysis of industrial resource efficiency evaluations in the UK and Europe, which include: G Lavery et al, July 2013, The next manufacturing revolution: non-labour resource productivity and its potential for UK manufacturing; Centre for Resource Efficiency in Germany (VDI-ZRE), 2015, Status quo der Ressourceneffizienz im Mittelstand Befragung von Unternehmensentscheidern im verarbeitenden Gewerbe; Department of Energy and Climate Change (DECC), 2014, Research to assess the barriers and drivers to energy efficiency in small and medium sized enterprises; V Rizos et al, 2016, Implementation of circular economy business models by small and medium-sized enterprises (SMEs): barriers and enablers, Sustainability, 8 (11). Statistical sources: CDP, 2016, Embedding a carbon price into business strategy, p 4G Lavery et al, July 2013, The next manufacturing revolution: non-labour resource productivity and its potential for UK manufacturing
Page 14Japanese Ministry of Economy, Trade and Industry, 2016, Current activities and future direction related to RE and CE in Japan Federal Ministry for the Environment, Nature Conservation, Building and Nuclear Safety, 2016, German Resource Efficiency Programme II European Environment Agency, 2016, More from less – material resource efficiency in Europe, EEA report On US SERPS: J L Sweeney, 2016, Energy efficiency: building a clean, secure economy, Hoover Institution PressEuropean Commission, 2012, CORDIS: ‘Pre-commercial procurement (PCP) related initiatives in Sweden’
Page 16G Lavery et al, July 2013, The next manufacturing revolution: non-labour resource productivity and its potential for UK manufacturing
Green Alliance analysis of: industrial resource efficiency evaluations in the UK and Europe, see p 13 references and: M Hirschnitz-Garbers et al, 2015, A framework for member states to support business in improving its resource efficiency; What Works Centre for Local Economic Growth, 2016, Evidence review – business advice; A Smith-Gillespie and H Chang, 2016, Supply chain transformation and resource efficiency
Page 17 Green Alliance adaptation of Michael Porter’s ‘Determinants of National Competitive Advantage’, 1990
Lean and clean: building manufacturing excellence in the UK
Green Alliance Green Alliance is a charity and independent think tank, focused on ambitious leadership for the environment. With a track record of over 35 years, Green Alliance has worked with the most influential leaders from the NGO, business, and political communities. Our work generates new thinking and dialogue, and has increased political action and support for environmental solutions in the UK.
Authors Angela Francis and Caterina Brandmayr
AcknowledgementsWith thanks to Martin Hirschnitz-Garbers, Steve Evans, Paul Ekins, Joanne Wade, Samantha Nicholson, Joost van Barneveld and Ton Bastein for their advice and insights.
Green Alliance11 Belgrave Road, London, SW1V 1RB020 7233 [email protected]: greenallianceblog.org.uktwitter: @GreenAllianceUK
The Green Alliance Trust is a registered charity 1045395 and company limited by guarantee (England and Wales) 3037633, registered at the above address
Published by Green Alliance, October 2017
Designed by Howdy
ISBN: 978-1-909980-80-8
© Green Alliance, 2017
Green Alliance’s work is licensed under a Creative Commons Attribution-Noncommercial-No derivative works 3.0 unported licence. This does not replace copyright but gives certain rights without having to ask Green Alliance for permission.
Under this licence, our work may be shared freely. This provides the freedom to copy, distribute and transmit this work on to others, provided Green Alliance is credited as the author and text is unaltered. This work must not be resold or used for commercial purposes. These conditions can be waived under certain circumstances with the written permission of Green Alliance. For more information about this licence go to http://creativecommons.org/licenses/by-nc-nd/3.0/
Related Documents


