Building Highly-Coordinated Visualizations in Improvise Chris Weaver * Computer Science Department University of Wisconsin–Madison ABSTRACT Improvise is a fully-implemented system in which users build and browse multiview visualizations interactively using a sim- ple shared-object coordination mechanism coupled with a flexible, expression-based visual abstraction language. By coupling visual abstraction with coordination, users gain precise control over how navigation and selection in a visualization affects the appearance of data in individual views. As a result, it is practical to build vi- sualizations with more views and richer coordination in Improvise than in other visualization systems. Building and browsing activi- ties are integrated in a single, live user interface that lets users alter visualizations quickly and incrementally during data exploration. CR Categories: D.2.2 [Software Engineering]: Design Tools and Techniques—User Interfaces; H.2.3 [Information Systems]: Database Management—Languages; H.5.2 [Information Systems]: Information Interfaces and Presentation—User Interfaces Keywords: coordinated queries, coordination, exploratory visual- ization, multiple views, visual abstraction language 1 I NTRODUCTION Visualization systems have matured into full-featured development environments that enable users to build visualizations with multiple coordinated views rapidly. In these systems, users coordinate views either by using a small set of pre-defined coordinations or by writ- ing scripts. The choice between these two approaches is a tradeoff between simplicity and flexibility. Improvise is an environment for building and browsing visual- izations of relational data. Like other visualization systems, Impro- vise enables users to load data, create views, specify visual abstrac- tions, and establish coordinations interactively. Unlike other sys- tems, Improvise provides a rich visual abstraction language that can be coupled with a shared-object coordination mechanism, thereby increasing the expressive power of both. The primary goal of Improvise is to enhance data exploration by offering users fine-grain control over the appearance of visualized data while preserving their ability to work quickly and easily. Im- provise combines a simple, direct coordination mechanism called live properties with a more powerful, indirect coordination mecha- nism called coordinated queries. The combination is a significant improvement over existing coordination approaches because it en- ables users to define complex interactive dependencies between the appearance and behavior of views. Live properties coordinates views using a symmetric update and notification mechanism to link views and other controls through shared objects. Controls interpret the shared objects as basic for- matting information (colors, fonts, etc.), limits to abstract spatial extent (ranges, angles, etc.), data, and data querying operations * e-mail: [email protected] (projections, filters, etc.) Visual abstractions are created by pro- jecting and filtering data using expressions that can themselves be defined in terms of shared objects. By editing the expressions used by views to project and filter data, users are able to customize the visual and spatial abstractions that specify what data to draw, how to draw it, and where to draw it in a visualization. Improvise is written in Java. Visualizations are saved to and loaded from disk as serialized XML documents. Improvise and the documents it produces are platform-independent. This paper proceeds as follows. Section 2 reviews coordination approaches in several visualization systems similar to Improvise. Section 3 describes live properties and coordinated queries. Sec- tion 4 describes construction of visual abstractions and coordina- tions in two Improvise visualizations. Section 5 concludes. 2 RELATED SYSTEMS Improvise is similar to DEVise [12], Snap-Together Visualiza- tion [15], and other visualization systems based on the relational data model. These systems follow a recent trend toward interac- tive construction approaches that employ simple combinations of well-known coordination and view types. Although building small visualizations in these systems is very easy, the number of views and the degree of coordination that can be practically incorporated during data exploration is limited. LinkWinds [10] uses non-view controls to append clauses to queries for filtering purposes. The ability to reference shared objects in coordinated queries has a similar flavor. Whereas LinkWinds has a “track” mode in which mouse drags continuously update coordinated views, views in Improvise are always tightly coupled over all coordinations, including all coordinated queries. Given an input table, IVEE [2] automatically selects appropri- ate controls (such as range sliders or checkboxes) for each data attribute. Users can create one or more views (scatterplots, geo- graphic maps, or cluster views) and specify projections that map at- tributes into view parameters. The conjunction of slider selections is used to filter the contents of all views (as well as the contents of the sliders themselves). In Improvise, views can be filtered in- dependently using filter expressions that depend on navigation or selection in any combination of sliders or views. Tioga-2 [23] uses a data flow model to support advanced navi- gation features such as tunneling (wormhole-like hyperlinks), view cloning, and nested views. DataSplash [17] adds end-user visual- ization construction in the form of tuple painting and a zoom layer manager for editing how tuples appear at different levels of mag- nification. VIQING [16] is an extension of DataSplash that allows users to express queries by conjoining views into the visual equiv- alent of projections, selections, and joins. The elements of Impro- vise visualizations are declarative rather than procedural; users can generate nested views and semantic zoom, but approaches like tun- neling and layer management have to be built into views as fixed features that allow little or no customization by the user. Polaris [21] automatically generates multiscale visualizations and the queries needed to draw them using a formal specification language. Zooming in Polaris is conceptually equivalent to travers- ing an edge of a zoom graph [20] in which each node corresponds

Welcome message from author
This document is posted to help you gain knowledge. Please leave a comment to let me know what you think about it! Share it to your friends and learn new things together.
Transcript

Building Highly-Coordinated Visualizations in Improvise
Chris Weaver∗
Computer Science DepartmentUniversity of Wisconsin–Madison
ABSTRACT
Improvise is a fully-implemented system in which users buildand browse multiview visualizations interactively using a sim-ple shared-object coordination mechanism coupled with a flexible,expression-based visual abstraction language. By coupling visualabstraction with coordination, users gain precise control over hownavigation and selection in a visualization affects the appearanceof data in individual views. As a result, it is practical to build vi-sualizations with more views and richer coordination in Improvisethan in other visualization systems. Building and browsing activi-ties are integrated in a single, live user interface that lets users altervisualizations quickly and incrementally during data exploration.
CR Categories: D.2.2 [Software Engineering]: Design Toolsand Techniques—User Interfaces; H.2.3 [Information Systems]:Database Management—Languages; H.5.2 [Information Systems]:Information Interfaces and Presentation—User Interfaces
Keywords: coordinated queries, coordination, exploratory visual-ization, multiple views, visual abstraction language
1 INTRODUCTION
Visualization systems have matured into full-featured developmentenvironments that enable users to build visualizations with multiplecoordinated views rapidly. In these systems, users coordinate viewseither by using a small set of pre-defined coordinations or by writ-ing scripts. The choice between these two approaches is a tradeoffbetween simplicity and flexibility.
Improvise is an environment for building and browsing visual-izations of relational data. Like other visualization systems, Impro-vise enables users to load data, create views, specify visual abstrac-tions, and establish coordinations interactively. Unlike other sys-tems, Improvise provides a rich visual abstraction language that canbe coupled with a shared-object coordination mechanism, therebyincreasing the expressive power of both.
The primary goal of Improvise is to enhance data exploration byoffering users fine-grain control over the appearance of visualizeddata while preserving their ability to work quickly and easily. Im-provise combines a simple, direct coordination mechanism calledlive properties with a more powerful, indirect coordination mecha-nism called coordinated queries. The combination is a significantimprovement over existing coordination approaches because it en-ables users to define complex interactive dependencies between theappearance and behavior of views.
Live properties coordinates views using a symmetric update andnotification mechanism to link views and other controls throughshared objects. Controls interpret the shared objects as basic for-matting information (colors, fonts, etc.), limits to abstract spatialextent (ranges, angles, etc.), data, and data querying operations
∗e-mail: [email protected]
(projections, filters, etc.) Visual abstractions are created by pro-jecting and filtering data using expressions that can themselves bedefined in terms of shared objects. By editing the expressions usedby views to project and filter data, users are able to customize thevisual and spatial abstractions that specify what data to draw, howto draw it, and where to draw it in a visualization.
Improvise is written in Java. Visualizations are saved to andloaded from disk as serialized XML documents. Improvise and thedocuments it produces are platform-independent.
This paper proceeds as follows. Section 2 reviews coordinationapproaches in several visualization systems similar to Improvise.Section 3 describes live properties and coordinated queries. Sec-tion 4 describes construction of visual abstractions and coordina-tions in two Improvise visualizations. Section 5 concludes.
2 RELATED SYSTEMS
Improvise is similar to DEVise [12], Snap-Together Visualiza-tion [15], and other visualization systems based on the relationaldata model. These systems follow a recent trend toward interac-tive construction approaches that employ simple combinations ofwell-known coordination and view types. Although building smallvisualizations in these systems is very easy, the number of viewsand the degree of coordination that can be practically incorporatedduring data exploration is limited.
LinkWinds [10] uses non-view controls to append clauses toqueries for filtering purposes. The ability to reference sharedobjects in coordinated queries has a similar flavor. WhereasLinkWinds has a “track” mode in which mouse drags continuouslyupdate coordinated views, views in Improvise are always tightlycoupled over all coordinations, including all coordinated queries.
Given an input table, IVEE [2] automatically selects appropri-ate controls (such as range sliders or checkboxes) for each dataattribute. Users can create one or more views (scatterplots, geo-graphic maps, or cluster views) and specify projections that map at-tributes into view parameters. The conjunction of slider selectionsis used to filter the contents of all views (as well as the contentsof the sliders themselves). In Improvise, views can be filtered in-dependently using filter expressions that depend on navigation orselection in any combination of sliders or views.
Tioga-2 [23] uses a data flow model to support advanced navi-gation features such as tunneling (wormhole-like hyperlinks), viewcloning, and nested views. DataSplash [17] adds end-user visual-ization construction in the form of tuple painting and a zoom layermanager for editing how tuples appear at different levels of mag-nification. VIQING [16] is an extension of DataSplash that allowsusers to express queries by conjoining views into the visual equiv-alent of projections, selections, and joins. The elements of Impro-vise visualizations are declarative rather than procedural; users cangenerate nested views and semantic zoom, but approaches like tun-neling and layer management have to be built into views as fixedfeatures that allow little or no customization by the user.
Polaris [21] automatically generates multiscale visualizationsand the queries needed to draw them using a formal specificationlanguage. Zooming in Polaris is conceptually equivalent to travers-ing an edge of a zoom graph [20] in which each node corresponds

to a particular visual representation in a data cube. Nodes are drawnin a graphical notation that describes the visual query at that pointin the graph. Because Improvise users build coordinated queriesusing custom-defined expressions, complex or unusual visual rep-resentations are possible, but simple or common ones cannot bemanipulated as quickly or as easily as in Polaris.
In the coordination model prototyped in CViews [5], explicit co-ordination objects in a coordination space manage visual parame-ters and access data using a dataflow model to define a particulartype of coordination, such as brushing. Views connect to coordina-tion objects through translation functions. The equivalent space inImprovise consists of coordinated query graphs that connect viewsthrough navigational parameters, selections, data, and expressions.In this space, coordinations exist implicitly as recognizable patternsof interactive dependence between views, rather than as explicit ob-jects. Translation (spatial transformation, rendering, and so on) isan inherent function of views and is not user-customizable.
Snap-Together Visualization uses a relational data model that co-ordinates views using primary key actions. When two views are co-ordinated, invoking an action in one view causes the other view toperform its corresponding action. Actions are extensible and in-clude loading (of a relation), selection (of tuples), and scrolling(over a list of tuples). Coordinated queries create similar interactivedependencies between views, but allow fine-grain user customiza-tion of dependencies between visual encodings as well as data.
DEVise uses a relational data model to coordinate multiple viewsof large datasets. Users can create, destroy, coordinate, and specifythe contents of views interactively. Its only view—the scatterplot—and few coordination types—cursor, visual link, record link, andset link—are quite powerful. However, reproducing common vi-sualization constructions in DEVise frequently involves convolutedchains of linked scatterplots (many of which are undesirable arti-facts that must be intentionally hidden offscreen). Coordinationgraphs of DEVise visualizations reveal that all four coordinationtypes can be reproduced by treating the X and Y ranges of scatter-plots as shared objects or as dynamic parameters in simple queryexpressions. This discovery motivated the design of live propertiesand coordinated queries in Improvise.
3 IMPROVISE
This section presents the two major parts of the architecture and im-plementation of user-definable coordination in Improvise. The first,live properties, is a direct coordination mechanism that uses a sim-ple shared object model to create interactive dependencies betweenviews. The second, coordinated queries, is an indirect coordinationmechanism in which the data and visual encodings that determineeach view’s appearance are calculated from user-definable expres-sions that can depend on interaction in other views.
3.1 Live Properties
Live properties is a user interface architecture for directly coor-dinating controls—including views, sliders, and other widgets—through shared objects called variables. Each control defines oneor more live properties, each of which can bind to at most one vari-able. Live properties may be either active (access and modify vari-ables) or passive (access only). Changes to variables are propagatedto controls via their live properties, as shown in figure 1.
Live properties serve two purposes. First, they are value slotsthat a control uses to determine its appearance and behavior. Forinstance, a scatterplot has two range properties that specify whichregion of the cartesian plane to show, and a color property that spec-ifies the color used to fill its background. Second, live propertiesact as ports through which controls communicate with each otheras a result of interaction. Variables and live properties are strongly
typed, and binding is type-matched. Each live property also has adefault value which is used by the control when the live property isnot bound to any variable.
Live properties may be thought of as an instance of the Model-View-Controller architecture [11] with many small models. Simi-larly, the Abstraction-Link-View paradigm (ALV) [8] employs anencapsulated communications mechanism between views and datato link views shared by one or more users. However, live propertiesis not a constraint model (as in ThingLab [4]). By implementingcontrols so as to change their live properties only in response touser interaction, potential cycles and deadlocks are avoided.
Athena MUSE [9] defines integer values in bounded rangesas global parameters on views (“multidimensional information”)and uses bidirectional equality constraints to link parameters toview attributes through reversible linear functions (“declarativeconstraints”). Variables are like these parameters, but are neitherbounded nor limited to integers. Bindings between variables andlive properties are like declarative constraints limited to the identityfunction.
3.2 Coordinated Queries
Coordinated queries is a visual abstraction language based on therelational database model. An expression is a tree of operators thatcalculates the value of an output field using the fields of a inputrecord. Expressions make up query operations that views use tovisually encode data records into graphical attributes (as in [13]):
• Filters use a single expression to calculate a boolean value foreach input record. Views draw records for which this value istrue.
• Projections use one or more expressions to calculate succes-sive fields of an output record for each input record. Viewsdraw records using graphical information (such as positionand color) contained in the fields of the output record. Thisinformation is often encapsulated in view-specific glyphs.
Projections and filters are constructed in a tree-based expressioneditor (figure 2). The user builds each expression top-down, bychoosing an operator for each position in the tree. Subexpressionsare automatically appended whenever the chosen operator takes ar-guments. Editing this way takes a little getting used to, but has theadvantage of being syntactically constrained. Editing is live; thevisualization reflects changes immediately.
Expressions are composed of eight different kinds of operators.Function operators perform a variety of duties including objectconstruction, type casting, member access, arithmetic, and statis-tics. Value operators evaluate to a user-edited value of a particulartype. Attribute operators evaluate to the value of an input recordfield. In addition to these three basic kinds of operators, aggregateoperators allow the calculation of simple aggregates on tables, con-stant operators provide easy access to frequently used fixed values
Figure 1: Direct coordination. (1) A control modifies the value ofone of its (active) live properties in response to interaction. (2) Thelive property assigns the new value to its bound variable. (3) Thevariable sends a change notification to all live properties bound to it.(4) The live properties notify their respective parent controls of thechange. The controls update themselves appropriately.

Figure 2: The lexicon editor, showing a projection that generates rectangle scatterplot glyphs. Users can select individual operators in anexpression for modification (A), or copy-and-paste/drag-and-drop entire subexpressions. Cloning whole objects (B) allows users to experimentwith variations of expressions quickly and reversibly. Large libraries can be built up for reuse or rapid switching during data exploration.
(e.g. pi), and conversion operators perform common numeric con-versions between units (e.g. feet to meters). Index operators pro-vide indexed data lookups, by mapping a primary key value of anattribute to a foreign key value of an attribute in a different dataset.
Indirect coordinations are created using variable operators.Whenever an expression is evaluated, variable operators take on thecurrent value of their corresponding variable. When a control de-pends directly on a variable that contains a projection or filter, it alsodepends indirectly on any variables referenced by the expressionsof the projection or filter. Through variable operators, expressionscan depend not only on the navigation and selection parameters of avisualization, but also on its projections, filters, and datasets. Thismulti-stage dependence is used for aggregation, grouping, index-ing, nested views, and other kinds of queries. Figure 3 shows howinteraction propagates through one level of dependence in an indi-rect coordination. A shortcoming of the current implementation isthat it does not detect or handle cycles in coordinated query graphs.
Figure 3: Indirect coordination. (1) An upstream object propagatesa value change to a variable. (2) The variable notifies all lexical val-ues that contain expressions which reference the variable. (3) Eachexpression notifies variables to which it is assigned as a value. (4)The variable sends a change notification to all downstream objects.Upstream and downstream objects can be live properties (as in fig-ure 1), or other lexical values.
Each Improvise visualization stores schemas, data, and query op-erations in a central respository called the lexicon. To access theseobjects, views define live properties that bind to variables of the de-sired lexical type. The user assigns the value of a lexical variableby choosing from available objects of the same type in the lexicon.To specify the visual abstraction of a view, the user binds lexicalvariables to the view’s data, projection, and filter properties.
4 BUILDING COORDINATED QUERIES
The combination of live properties and coordinated queries en-ables Improvise users to build highly-coordinated visualizationswith complex visual encodings. This section describes how a va-riety of well-known coordination types are reproduced in the con-struction of two typical Improvise visualizations, shown in figures 4and 11. Proceeding from navigation coordinations through selec-tion coordinations to semantic zooming, each coordination is intro-duced in terms of related research. Figures 5-10 and 12-16 capturethe corresponding coordinated query graphs used in Improvise tohelp users visualize coordination structure as they work.
Sliders and other controls are often useful for manipulating in-dividual parameters of a visualization. In Dynamic Queries [1],non-spatial data attributes can be manipulated using range sliders.LinkWinds provides controls that can be coordinated with viewsfor dynamic filtering. Users browse Improvise visualizations byinteracting with views and non-data controls such as checkboxes,textfields, and sliders. Improvise axis controls are independent ofscatterplots, but perform the usual roles of marking, labeling, andhandling interaction in one dimension. Figure 5 shows how hori-zontal and vertical axes can be coordinated with a scatterplot.
Figure 5: Coordination graph for a scatterplot with axis controls (seefigure 4A). Panning or zooming in the T (or X) axis changes the valueof the T (or X) range variable, which causes the plot to translate orstretch horizontally (or vertically). Manipulating the plot changesboth variables, causing both axes to update appropriately.
Views can also be coordinated with each other. Synchronizedscrolling is a common form of coordination in which two views

Figure 4: Visualization of a simulated ion trajectory in a cubic ion trap. (A) Axis controls label a plot and provide a way to change X and timeindependently. (B) Horizontal synchronized scrolling coordinates three time series plots showing the X, Y, and Z positions of ions over time.(C) A scatterplot matrix shows the trajectory as seen from three orthogonal sides of the ion trap. (D) An overview uses a portal (circled) toselect the extent of a detail view. (E) A perceptual slider enables users to select a visible range of time using a color gradient instead of numericvalues. (F) The names of the available trajectory datasets are accompanied by nested views that project each trajectory into a 3-D view.
are constrained to show the same data items or the same regionof a coordinate space. For instance, scatterplots in DEVise can becoordinated with visual links to show the same range of X and/orY. In Snap-Together Visualization, synchronous scrolling betweenlists of items is achieved by coordinating their scroll actions.
Plots can be coordinated with each other in the same way thatthey coordinate with axis controls: through their range properties.Figure 6 shows three plots in which scrolling is synchronized hor-izontally. This is done by binding the same range variable to theX range property of all three views. The flexibility of property-variable binding makes it simple to construct numerous variationsof synchronized scrolling, including two-dimensional (sharing Xand Y ranges), horizontal (sharing only the X range), vertical (shar-ing only the Y), and crossed (one view shows XY, the other YX).
Scatterplot matrices [3] show an N-dimensional space as astairstep arrangement of 2-D scatterplots. Synchronized scrollingin this case is complicated by the need to invert the coordinates ofsome plots in order to produce the expected navigation behavior.Figure 7 shows how inverting the coordinates of a plot is a simplematter of swapping the range variables bound to its live properties.(Building plot matrices is straightforward but tedious; Improviseprovides shortcuts for creating common multiview constructions.)
Coordination using the overview+detail [19] technique differsfrom synchronized scrolling in that the entire area shown in a detailview is synchronized with a subarea of an overview. Cursors in
Figure 6: Three scatterplots with synchronized horizontal scrollingbut independent vertical scrolling (see figure 4B). All three plotsupdate in unison whenever the value of T changes.
DEVise are an example of this technique in which a selection box ina scatterplot has the same X and Y ranges as some other scatterplot.
In Improvise, portals (not to be confused with portals in DataS-plash) are draggable controls for selecting a rectangular region.(Portals can also draw data, acting as lenses above the plots thatcontain them.) Figure 8 shows how the X and Y ranges of a detailplot are coordinated with the ranges of a portal inside an overviewplot. This construction can be chained to create multiple levels ofdetail (as in [18]). Omitting the two X (or two Y) range variablesproduces vertical (or horizontal) versions of overview+detail.
Another use of one-dimensional portals is in a perceptual sliders,
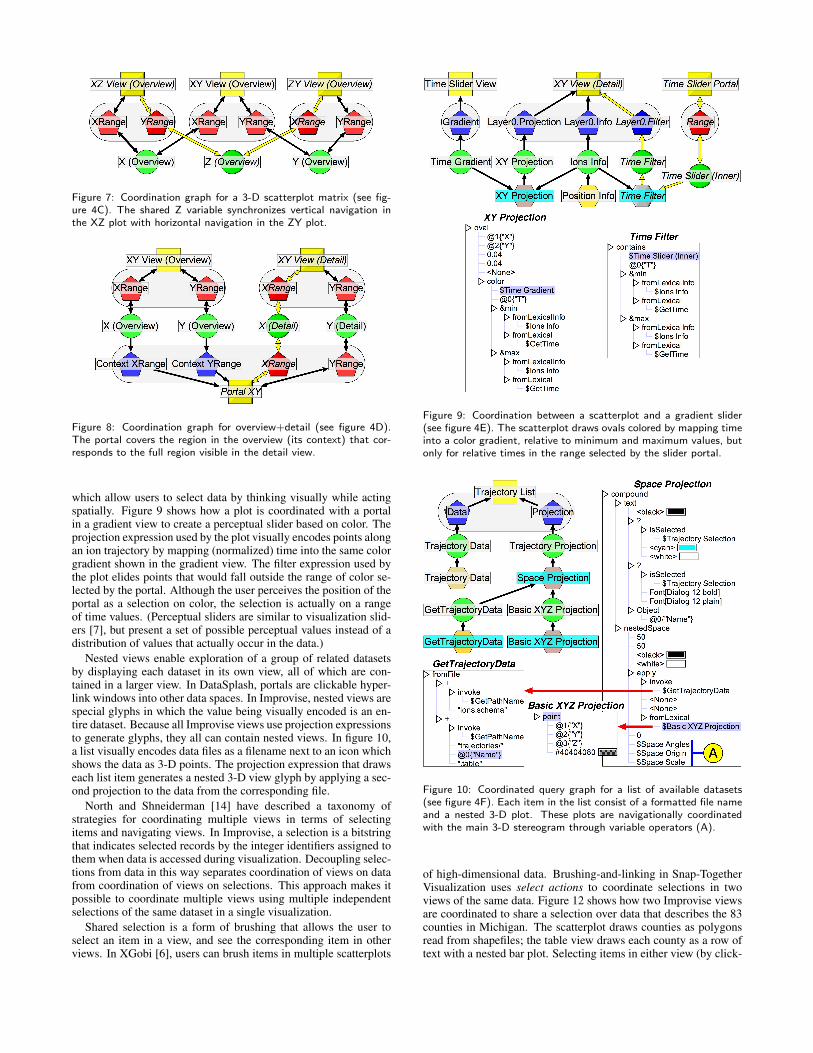
Figure 7: Coordination graph for a 3-D scatterplot matrix (see fig-ure 4C). The shared Z variable synchronizes vertical navigation inthe XZ plot with horizontal navigation in the ZY plot.
Figure 8: Coordination graph for overview+detail (see figure 4D).The portal covers the region in the overview (its context) that cor-responds to the full region visible in the detail view.
which allow users to select data by thinking visually while actingspatially. Figure 9 shows how a plot is coordinated with a portalin a gradient view to create a perceptual slider based on color. Theprojection expression used by the plot visually encodes points alongan ion trajectory by mapping (normalized) time into the same colorgradient shown in the gradient view. The filter expression used bythe plot elides points that would fall outside the range of color se-lected by the portal. Although the user perceives the position of theportal as a selection on color, the selection is actually on a rangeof time values. (Perceptual sliders are similar to visualization slid-ers [7], but present a set of possible perceptual values instead of adistribution of values that actually occur in the data.)
Nested views enable exploration of a group of related datasetsby displaying each dataset in its own view, all of which are con-tained in a larger view. In DataSplash, portals are clickable hyper-link windows into other data spaces. In Improvise, nested views arespecial glyphs in which the value being visually encoded is an en-tire dataset. Because all Improvise views use projection expressionsto generate glyphs, they all can contain nested views. In figure 10,a list visually encodes data files as a filename next to an icon whichshows the data as 3-D points. The projection expression that drawseach list item generates a nested 3-D view glyph by applying a sec-ond projection to the data from the corresponding file.
North and Shneiderman [14] have described a taxonomy ofstrategies for coordinating multiple views in terms of selectingitems and navigating views. In Improvise, a selection is a bitstringthat indicates selected records by the integer identifiers assigned tothem when data is accessed during visualization. Decoupling selec-tions from data in this way separates coordination of views on datafrom coordination of views on selections. This approach makes itpossible to coordinate multiple views using multiple independentselections of the same dataset in a single visualization.
Shared selection is a form of brushing that allows the user toselect an item in a view, and see the corresponding item in otherviews. In XGobi [6], users can brush items in multiple scatterplots
Figure 9: Coordination between a scatterplot and a gradient slider(see figure 4E). The scatterplot draws ovals colored by mapping timeinto a color gradient, relative to minimum and maximum values, butonly for relative times in the range selected by the slider portal.
Figure 10: Coordinated query graph for a list of available datasets(see figure 4F). Each item in the list consist of a formatted file nameand a nested 3-D plot. These plots are navigationally coordinatedwith the main 3-D stereogram through variable operators (A).
of high-dimensional data. Brushing-and-linking in Snap-TogetherVisualization uses select actions to coordinate selections in twoviews of the same data. Figure 12 shows how two Improvise viewsare coordinated to share a selection over data that describes the 83counties in Michigan. The scatterplot draws counties as polygonsread from shapefiles; the table view draws each county as a row oftext with a nested bar plot. Selecting items in either view (by click-

Figure 11: Visualization of election results in Michigan from 1998 to 2002. (A) Shared selection of counties between a table view and a map.(B) Selecting a race causes the election results for that race to be loaded (from a file) and shown throughout the visualization. (C) A pie chartuses a filter to compare results for selected candidates only. (D) A scatterplot highlights selected counties with gray bars. (E) A four-layerscatterplot colors counties by winning candidate party. (F) Semantic zoom labels counties with nested bar plots at sufficient zoom.
Figure 12: Coordination graph for shared selection between a tableview and a scatterplot (see figure 11A). Selection of items in eitherview causes both views to redraw their shared data.
ing shapes or rows) changes the selection variable, causing bothviews to redraw with the selected items highlighted.
Users often want to select from multiple related datasets (or sub-sets of one large dataset) in a single visualization, such as duringanalysis of a sequence of experiments. Selecting a dataset in oneview to show in another view is a form of drill-down. For instance,Snap-Together Visualization supports drill-down by coordinating aselect action in one view with a load action in another view.
Selection-dependent loading of data in Improvise is performedusing an expression that is defined in terms of (1) data that lists thenames of (or otherwise identifies) loadable datasets, and (2) a se-lection on that data. In figure 13, the election results for each officeare stored in separate files. The expression constructs the name ofa file to load using the name of the selected office. Whenever theuser selects an office, the visualization loads data from the corre-sponding file. Using expressions, the user can specify a file, URL,or database as the source of data to visualize.
Selection-dependent filtering is an asymmetric version of sharedselection in which the filtered view differentiates between selected
Figure 13: Coordinated query graph for selection-dependent loadingof data (see figure 11B). An index on the races dataset maps therecord identifier of the first selected race into a filename. The “Re-sults” view displays an info (an expression that calculates a dataset)that reads data from the corresponding file of voting results.
and unselected items by not drawing unselected items instead ofhighlighting selected ones. DEVise uses this technique in the formof record links that cause a “destination” view to render only thosetuples that are visible in a “source” view.
Whereas selection-dependent filtering determines the visibilityof items, selection-dependent projection determines the appearance

Figure 14: Views can be indirectly coordinated through filters orprojections that depend on selection variables (see figure 11C, 11D).The filter expression states that “for each candidate, draw it only if itis selected.” The projection expression states that “for each county,draw a rectangle if it is selected, a triangle otherwise.” The heightof each rectangle is an aggregate of the dataset created by groupingthe overall election results by the corresponding county.
of items. Most visualization systems can coordinate two views soas to highlight the items in one view that correspond with itemsselected in the other view. Highlighting is usually a fixed functionof the type of view, typically implemented as a special backgroundcolor. In XGobi, points and lines in scatterplots can be brushedusing glyphs as well as color.
By using expression-based projections to determine the entirevisual encoding of items in views, highlighting in Improvise is auser-customizable visual differentiation of selected and unselecteditems. Highlighting of items can therefore appear as a special back-ground color, reverse video, a special font, or just about any varia-tion on color or other visual attributes the user can dream up. Cus-tomizable highlighting can also be used to avoid conflict with nor-mal visual encoding of items. In figure 14, the “Candidate Shares”pie chart shows vote shares for candidates selected in the “Candi-dates” table view. Although both views display the same data, thefiltered view elides unselected candidates using an expression de-fined in terms of the selection. The result is a kind of multi-itemdetails-on-demand that allows comparison of details for selectedsubsets of items. The “Votes v. County” scatterplot highlightscounties based on whether they are selected in the “Counties” tableview. Although the filter and projection expressions in this exampledepend on independent selections (one of candidates, one of coun-ties), it is easy to extend them to depend on conjunctions or disjunc-tions of selections. The effect would be similar to additive encodingof selection highlighting in interactive externalizations [22].
Figure 15: Coordinated query graph for a four layer plot (see fig-ure 11E). The top three layers draw different projections of the samedata. All four layers invoke user-defined expressions (not shown) toload county shapefiles for drawing.
Layered plots (such as piles in DEVise) enable users to visualizemultiple datasets using different visual encodings in a single plot. Acommon use of layering is to visualize a single dataset using a layerto highlight selected items in a lower layer. In Improvise, scatter-plots have multiple layers each defined by its own data, projection,and filter properties. Figure 15 shows how a four layer scatterplotdraws a map using four different projections of two data sets. Thebottom layer draws all counties. The top three layers fill, high-light, and label only the counties which are involved in the selectedelection. Drawing labels in the highest layer keeps them from be-ing obscured by shapes in underlying layers. The combination oflayering and compound glyphs provides extensive control over thez-order of items drawn in plots.
Semantic zoom is a form of details on demand that lets the usersee different amounts of detail in a view by zooming in and out.For instance, the layer manager in DataSplash allows the user toselect the amount of detail by changing a view’s “altitude”. Theview draws data using the visual encodings visible at the chosenaltitude. Semantic zoom in Improvise uses expressions that calcu-late glyphs as a function of a plot’s own X and Y ranges. Figure 16shows how the county map plot depends on two ranges both directlyand indirectly. Although this example demonstrates synchronizedzoom between plot layers, the expressions could be edited to makethe layers change detail at different zoom levels. One-dimensionalzooming and multiple levels of detail are also straightforward.
5 CONCLUSION
In Improvise, users interactively build and browse multiview vi-sualizations using a simple shared-object coordination mechanismcoupled with a flexible, expression-oriented visual abstraction lan-guage. Improvise is a fully-implemented, self-contained Java ap-plication that has been used to create complex visualizations ofelection results, particle trajectories, network loads, county maps,music collections, the chemical elements, and even the dynamiccoordination structure of its own visualizations during construction
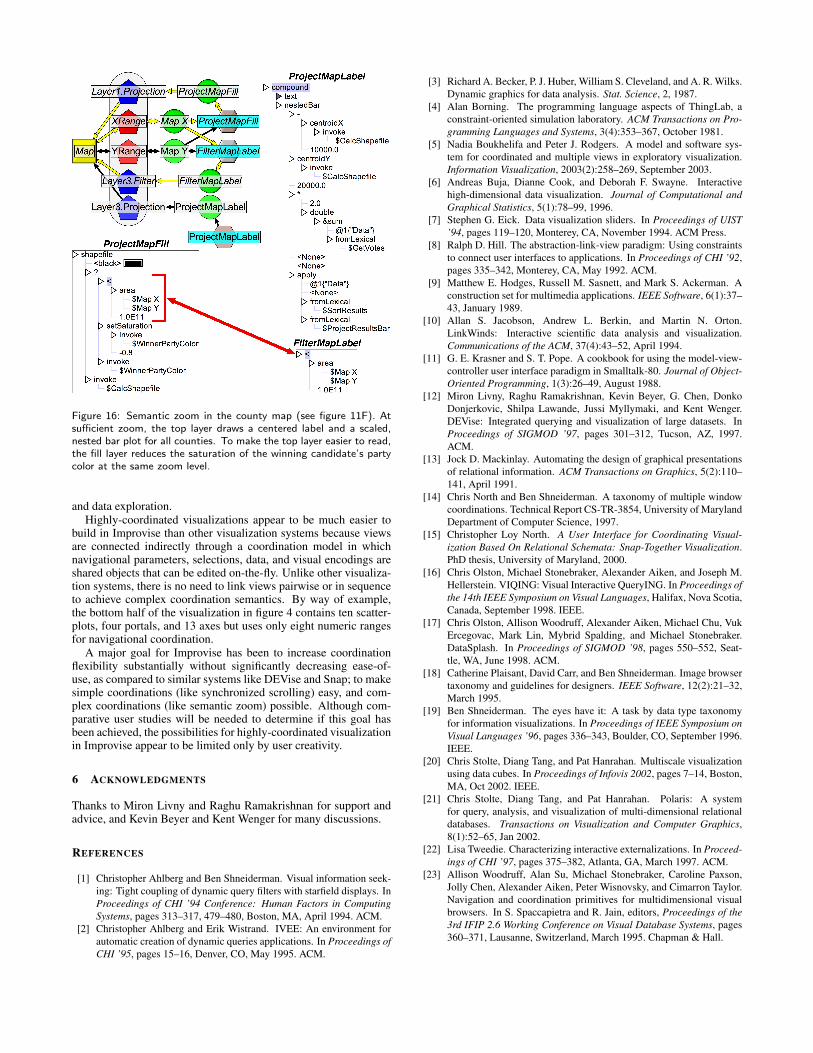
Figure 16: Semantic zoom in the county map (see figure 11F). Atsufficient zoom, the top layer draws a centered label and a scaled,nested bar plot for all counties. To make the top layer easier to read,the fill layer reduces the saturation of the winning candidate’s partycolor at the same zoom level.
and data exploration.
Highly-coordinated visualizations appear to be much easier tobuild in Improvise than other visualization systems because viewsare connected indirectly through a coordination model in whichnavigational parameters, selections, data, and visual encodings areshared objects that can be edited on-the-fly. Unlike other visualiza-tion systems, there is no need to link views pairwise or in sequenceto achieve complex coordination semantics. By way of example,the bottom half of the visualization in figure 4 contains ten scatter-plots, four portals, and 13 axes but uses only eight numeric rangesfor navigational coordination.
A major goal for Improvise has been to increase coordinationflexibility substantially without significantly decreasing ease-of-use, as compared to similar systems like DEVise and Snap; to makesimple coordinations (like synchronized scrolling) easy, and com-plex coordinations (like semantic zoom) possible. Although com-parative user studies will be needed to determine if this goal hasbeen achieved, the possibilities for highly-coordinated visualizationin Improvise appear to be limited only by user creativity.
6 ACKNOWLEDGMENTS
Thanks to Miron Livny and Raghu Ramakrishnan for support andadvice, and Kevin Beyer and Kent Wenger for many discussions.
REFERENCES
[1] Christopher Ahlberg and Ben Shneiderman. Visual information seek-
ing: Tight coupling of dynamic query filters with starfield displays. In
Proceedings of CHI ’94 Conference: Human Factors in Computing
Systems, pages 313–317, 479–480, Boston, MA, April 1994. ACM.
[2] Christopher Ahlberg and Erik Wistrand. IVEE: An environment for
automatic creation of dynamic queries applications. In Proceedings of
CHI ’95, pages 15–16, Denver, CO, May 1995. ACM.
[3] Richard A. Becker, P. J. Huber, William S. Cleveland, and A. R. Wilks.
Dynamic graphics for data analysis. Stat. Science, 2, 1987.
[4] Alan Borning. The programming language aspects of ThingLab, a
constraint-oriented simulation laboratory. ACM Transactions on Pro-
gramming Languages and Systems, 3(4):353–367, October 1981.
[5] Nadia Boukhelifa and Peter J. Rodgers. A model and software sys-
tem for coordinated and multiple views in exploratory visualization.
Information Visualization, 2003(2):258–269, September 2003.
[6] Andreas Buja, Dianne Cook, and Deborah F. Swayne. Interactive
high-dimensional data visualization. Journal of Computational and
Graphical Statistics, 5(1):78–99, 1996.
[7] Stephen G. Eick. Data visualization sliders. In Proceedings of UIST
’94, pages 119–120, Monterey, CA, November 1994. ACM Press.
[8] Ralph D. Hill. The abstraction-link-view paradigm: Using constraints
to connect user interfaces to applications. In Proceedings of CHI ’92,
pages 335–342, Monterey, CA, May 1992. ACM.
[9] Matthew E. Hodges, Russell M. Sasnett, and Mark S. Ackerman. A
construction set for multimedia applications. IEEE Software, 6(1):37–
43, January 1989.
[10] Allan S. Jacobson, Andrew L. Berkin, and Martin N. Orton.
LinkWinds: Interactive scientific data analysis and visualization.
Communications of the ACM, 37(4):43–52, April 1994.
[11] G. E. Krasner and S. T. Pope. A cookbook for using the model-view-
controller user interface paradigm in Smalltalk-80. Journal of Object-
Oriented Programming, 1(3):26–49, August 1988.
[12] Miron Livny, Raghu Ramakrishnan, Kevin Beyer, G. Chen, Donko
Donjerkovic, Shilpa Lawande, Jussi Myllymaki, and Kent Wenger.
DEVise: Integrated querying and visualization of large datasets. In
Proceedings of SIGMOD ’97, pages 301–312, Tucson, AZ, 1997.
ACM.
[13] Jock D. Mackinlay. Automating the design of graphical presentations
of relational information. ACM Transactions on Graphics, 5(2):110–
141, April 1991.
[14] Chris North and Ben Shneiderman. A taxonomy of multiple window
coordinations. Technical Report CS-TR-3854, University of Maryland
Department of Computer Science, 1997.
[15] Christopher Loy North. A User Interface for Coordinating Visual-
ization Based On Relational Schemata: Snap-Together Visualization.
PhD thesis, University of Maryland, 2000.
[16] Chris Olston, Michael Stonebraker, Alexander Aiken, and Joseph M.
Hellerstein. VIQING: Visual Interactive QueryING. In Proceedings of
the 14th IEEE Symposium on Visual Languages, Halifax, Nova Scotia,
Canada, September 1998. IEEE.
[17] Chris Olston, Allison Woodruff, Alexander Aiken, Michael Chu, Vuk
Ercegovac, Mark Lin, Mybrid Spalding, and Michael Stonebraker.
DataSplash. In Proceedings of SIGMOD ’98, pages 550–552, Seat-
tle, WA, June 1998. ACM.
[18] Catherine Plaisant, David Carr, and Ben Shneiderman. Image browser
taxonomy and guidelines for designers. IEEE Software, 12(2):21–32,
March 1995.
[19] Ben Shneiderman. The eyes have it: A task by data type taxonomy
for information visualizations. In Proceedings of IEEE Symposium on
Visual Languages ’96, pages 336–343, Boulder, CO, September 1996.
IEEE.
[20] Chris Stolte, Diang Tang, and Pat Hanrahan. Multiscale visualization
using data cubes. In Proceedings of Infovis 2002, pages 7–14, Boston,
MA, Oct 2002. IEEE.
[21] Chris Stolte, Diang Tang, and Pat Hanrahan. Polaris: A system
for query, analysis, and visualization of multi-dimensional relational
databases. Transactions on Visualization and Computer Graphics,
8(1):52–65, Jan 2002.
[22] Lisa Tweedie. Characterizing interactive externalizations. In Proceed-
ings of CHI ’97, pages 375–382, Atlanta, GA, March 1997. ACM.
[23] Allison Woodruff, Alan Su, Michael Stonebraker, Caroline Paxson,
Jolly Chen, Alexander Aiken, Peter Wisnovsky, and Cimarron Taylor.
Navigation and coordination primitives for multidimensional visual
browsers. In S. Spaccapietra and R. Jain, editors, Proceedings of the
3rd IFIP 2.6 Working Conference on Visual Database Systems, pages
360–371, Lausanne, Switzerland, March 1995. Chapman & Hall.
Related Documents