cba This is a chapter from the book System Design, Modeling, and Simulation using Ptolemy II This work is licensed under the Creative Commons Attribution-ShareAlike 3.0 Unported License. To view a copy of this license, visit: http://creativecommons.org/licenses/by-sa/3.0/, or send a letter to Creative Commons, 444 Castro Street, Suite 900, Mountain View, California, 94041, USA. Permissions beyond the scope of this license may be available at: http://ptolemy.org/books/Systems. First Edition, Version 1.0 Please cite this book as: Claudius Ptolemaeus, Editor, System Design, Modeling, and Simulation using Ptolemy II, Ptolemy.org, 2014. http://ptolemy.org/books/Systems.

Welcome message from author
This document is posted to help you gain knowledge. Please leave a comment to let me know what you think about it! Share it to your friends and learn new things together.
Transcript
cba
This is a chapter from the book
System Design, Modeling, and Simulation using Ptolemy II
This work is licensed under the Creative Commons Attribution-ShareAlike 3.0 UnportedLicense. To view a copy of this license, visit:
http://creativecommons.org/licenses/by-sa/3.0/,
or send a letter to Creative Commons, 444 Castro Street, Suite 900, Mountain View,California, 94041, USA. Permissions beyond the scope of this license may be availableat:
http://ptolemy.org/books/Systems.
First Edition, Version 1.0
Please cite this book as:
Claudius Ptolemaeus, Editor,System Design, Modeling, and Simulation using Ptolemy II, Ptolemy.org, 2014.
http://ptolemy.org/books/Systems.

2Building Graphical Models
Christopher Brooks, Edward A. Lee, Stephen Neuendorffer, and John Reekie
Contents2.1 Getting Started . . . . . . . . . . . . . . . . . . . . . . . . . . . . . 39
2.1.1 Executing a Pre-Built Signal Processing Example . . . . . . . 392.1.2 Creating and Running a Model . . . . . . . . . . . . . . . . . 452.1.3 Making Connections . . . . . . . . . . . . . . . . . . . . . . 47Sidebar: Sources Library . . . . . . . . . . . . . . . . . . . . . . . . 48Sidebar: Sinks Library . . . . . . . . . . . . . . . . . . . . . . . . . 49
2.2 Tokens and Data Types . . . . . . . . . . . . . . . . . . . . . . . . 52Sidebar: Math Library . . . . . . . . . . . . . . . . . . . . . . . . . 57Sidebar: Math Library (Continued) . . . . . . . . . . . . . . . . . . 58
2.3 Hierarchy and Composite Actors . . . . . . . . . . . . . . . . . . . 592.3.1 Adding Ports to a Composite Actor . . . . . . . . . . . . . . 602.3.2 Setting the Types of Ports . . . . . . . . . . . . . . . . . . . 622.3.3 Multiports, Busses, and Hierarchy . . . . . . . . . . . . . . . 64
2.4 Annotations and Parameterization . . . . . . . . . . . . . . . . . . 652.4.1 Parameters in Hierarchical Models . . . . . . . . . . . . . . . 652.4.2 Decorative Elements . . . . . . . . . . . . . . . . . . . . . . 682.4.3 Creating Custom Icons . . . . . . . . . . . . . . . . . . . . . 68
2.5 Navigating Larger Models . . . . . . . . . . . . . . . . . . . . . . 682.6 Classes and Inheritance . . . . . . . . . . . . . . . . . . . . . . . . 71
2.6.1 Overriding Parameter Values in Instances . . . . . . . . . . . 75
38

2. BUILDING GRAPHICAL MODELS
2.6.2 Subclasses and Inheritance . . . . . . . . . . . . . . . . . . . 762.6.3 Sharing Classes Across Models . . . . . . . . . . . . . . . . 77
2.7 Higher-Order Components . . . . . . . . . . . . . . . . . . . . . . 792.7.1 MultiInstance Composite . . . . . . . . . . . . . . . . . . . . 812.7.2 IterateOverArray . . . . . . . . . . . . . . . . . . . . . . . . 842.7.3 Lifecycle Management Actors . . . . . . . . . . . . . . . . . 86Sidebar: Array Construction and Deconstruction Actors . . . . . . . 86
2.8 Summary . . . . . . . . . . . . . . . . . . . . . . . . . . . . . . . . 87Sidebar: Array Manipulation Actors . . . . . . . . . . . . . . . . . . 88Sidebar: Mobile Code . . . . . . . . . . . . . . . . . . . . . . . . . . 89
This chapter provides a tutorial on constructing Ptolemy II simulation models using Vergil,the Ptolemy graphical user interface (GUI). Figure 2.1 shows a simple Ptolemy II modelin Vergil. This model is shown in the graph editor, one of several possible entry mecha-nisms available in Ptolemy II. It is also possible, for example, to define models in Java orXML.
2.1 Getting Started
Executing the examples in this chapter requires installation of Ptolemy II1. Once it isinstalled, you will need to invoke Vergil, which will display the initial welcome windowshown in Figure 2.2. The “Tour of Ptolemy II” link takes you to the page shown in Figure2.3.
2.1.1 Executing a Pre-Built Signal Processing Example
On the “Tour of Ptolemy II” page, the first example listed under “Basic Modeling Capa-bilities” (Spectrum), is the model shown in Figure 2.1. This model creates a sinusoidalsignal, multiplies it by a sinusoidal carrier, adds noise, and then estimates the power spec-trum. This model can be executed using the run button in the toolbar (the blue triangle
1See http://ptolemy.org/ptolemyII/ptIIlatest for the latest release, and http://chess.eecs.berkeley.edu/ptexternal/ for access to the ongoing development version. Alter-natively, most of the figures in this book have an online version of the model that you can browse usingany web browser. More interestingly, if you are reading this book on a Java-capable machine, you canalso follow a link that uses Java Web Start to launch Vergil without any explicit installation step. Youcan browse, edit, and execute models, and also save them to local disk. For information on Web Start, seehttp://en.wikipedia.org/wiki/Java_Web_Start.
Ptolemaeus, System Design 39
2.1. GETTING STARTED
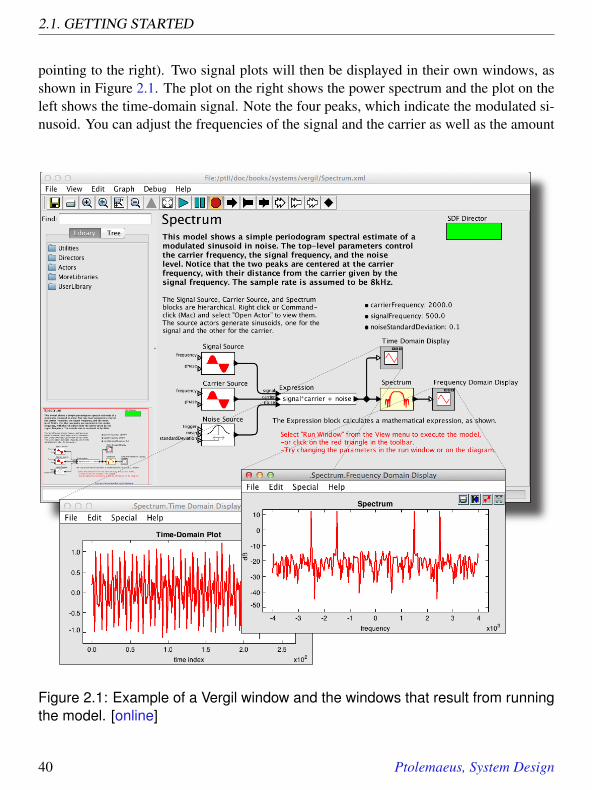
pointing to the right). Two signal plots will then be displayed in their own windows, asshown in Figure 2.1. The plot on the right shows the power spectrum and the plot on theleft shows the time-domain signal. Note the four peaks, which indicate the modulated si-nusoid. You can adjust the frequencies of the signal and the carrier as well as the amount
Figure 2.1: Example of a Vergil window and the windows that result from runningthe model. [online]
40 Ptolemaeus, System Design

2. BUILDING GRAPHICAL MODELS
Figure 2.2: Initial welcome window.
of noise by double clicking on those parameters in the block diagram in Figure 2.1 nearthe upper right of the window.
The icon (the graphical block) for the Expression actor displays the expression that willbe calculated:
signal*carrier + noise
The identifiers in this expression, signal, carrier, and noise, refer to the inputports. The Expression actor is flexible; it can have any number of input ports (which canhave arbitrary names) and it uses a rich expression language to specify the value of theoutput as a function of the inputs. It can also specify parameters for the model in whichthe expression is contained. (The expression language is described in Chapter 13.)
Right clicking and selecting [Documentation→Get Documentation] displays docu-mentation for that actor. Figure 2.4 shows the documentation for the Expression actor.
Three of the actors in Figure 2.1 are composite actors, meaning that their implementationis itself a Ptolemy II model. You can invoke the Open Actor context menu2 to reveal the
2A context menu is a menu that is specific to the object under the cursor. It is obtained by right clickingthe mouse (or control clicking, if the mouse does not have a right button) while the cursor is over the icon.
Ptolemaeus, System Design 41

2.1. GETTING STARTED
Figure 2.3: The tour of Ptolemy II page.
Signal Source implementation, as shown in Figure 2.5. This block diagram shows howthe sinusoidal signal is generated.
42 Ptolemaeus, System Design

2. BUILDING GRAPHICAL MODELS
Figure 2.4: Viewing documentation for actors.
Ptolemaeus, System Design 43

2.1. GETTING STARTED
Figure 2.5: Invoke Open Actor on composite actors to reveal their implementa-tion.
44 Ptolemaeus, System Design

2. BUILDING GRAPHICAL MODELS
2.1.2 Creating and Running a Model
Create a new model by selecting [File→New→Graph Editor] in the menu bar. Youshould see something like the window shown in Figure 2.6. The left-hand side of the pageshows a library of components that can be dragged into the model-building area. Performthe steps outlined below to create a simple model.
• Open the Actors library and then Sources. Find the Const actor under Sources→GenericSourcesand drag an instance into the model-building area.• Open Sinks→GenericSinks and drag a Display actor onto the page (see boxes on
pages 48 and 49).
library of components
navigation area
model-building area
Figure 2.6: An empty Vergil Graph Editor.
Ptolemaeus, System Design 45

2.1. GETTING STARTED
• Drag a connection from the output port on the right of the Const actor to the input portof the Display actor.• Open the Directors library and drag the SDF Director onto the page. The director
controls various aspects of the model’s functionality, such as (for example) how manyiterations the model will execute (which is, by default, just one iteration).
Now you should have something that looks like Figure 2.7. In this model, the Constactor will create a string and the Display actor will display that string. Set the string vari-able to “Hello World” by double or right clicking on the Const actor icon and selecting[Customize→Configure], which will display the dialog box shown in Figure 2.8. En-
Figure 2.7: The Hello World example. [online]
46 Ptolemaeus, System Design

2. BUILDING GRAPHICAL MODELS
Figure 2.8: The Const parameter editor.
ter the string "Hello World" (with the quotation marks) for the value parameter andclick the Commit button. (The quotation marks ensure that the expression will be inter-preted as a string.) If you run this model, a display window will show the text “HelloWorld.”
You may wish to save your model using the File menu. File names for Ptolemy II modelsshould end in “.xml” or “.moml” so that Vergil will properly process the file the next timeit is opened.
2.1.3 Making Connections
The model constructed above contains two actors and one connection between them. Ifyou move either actor (by clicking and dragging), the connection will be re-routed auto-matically. We can now explore how to create and manipulate more complicated connec-tions.
First, create a model in a new graph editor that includes an SDF Director, a Ramp actor(found in the Sources→SequenceSources library), a Display actor, and a Sequence-Plotter actor (found in the Sinks→SequenceSinks library), as shown in Figure 2.9.
Suppose we wish to route the output of the Ramp actor to both the Display and the Se-quencePlotter. In this case, we need an explicit relation in the diagram. A relation is a
Ptolemaeus, System Design 47

2.1. GETTING STARTED
Sidebar: Sources Library
The three Actors→Sources libraries contain sources of signals.
• Const produces a value (or expression) set by a parameter (see Chapter 13).• StringConst produces strings and may reference other parameters (see Section
13.2.3).• Subscriber outputs data received from a Publisher (described in the Sinks Library
sidebar on page 49).• SubscriptionAggregator combines data from multiple Publishers using a specified
operation (currently addition or multiplication).• CurrentTime, CurrentMicrostep, DiscreteClock, and PoissonClock are timed
sources described in Chapter 7.• TriggeredSinewave and Sinewave produce sinusoidal outputs based on either the
current time or a specific sample rate, respectively.• InteractiveShell outputs the value entered in a shell window opened during execu-
tion.• Interpolator and Pulse both generate waveforms, one by interpolating between val-
ues, and the other by zero-filling between values.• Ramp produces a steadily increasing or decreasing output sequence.• Sequence produces an arbitrary sequence of values, possibly periodic.• SketchedSource produces a sequence specified interactively with the mouse.
48 Ptolemaeus, System Design

2. BUILDING GRAPHICAL MODELS
Sidebar: Sinks Library
Actors in the Actors→Sinks library serve as destinations for signals. Most areplotters, described in Chapter 17. The few that are not are contained in theSinks→GenericSinks library, and shown below. All of these sinks accept any datatype at their inputs.
• Discard discards all inputs. In most domains, leaving an output disconnected has thesame effect (the Rendezvous domain is an exception).• Display displays the values of inputs in a text window that opens when the model is
executed.• MonitorValue displays its inputs in the Vergil icon that displays the model.• Publisher establishes named connections to instances of Subscriber and Subscrip-
tionAggregator (described in the Sources sidebar on page 48).• Recorder stores the values of inputs internally; custom Java code is then needed to
access those values.• SetVariable sets the value of a variable or parameter defined in the model. Since
this variable may be read by another actor that has no connection to the SetVariableactor, SetVariable may introduce nondeterminism into a model. That is, the resultsof executing the model may depend on arbitrary scheduling decisions that determinewhether SetVariable executes before actors that read the affected variable. To mitigatethis risk, SetVariable has a parameter called delayed that by default is set to true.When it is true, the affected variable will only be set at the end of the current iterationof the director. For most directors (but notably, not for PN or Rendezvous), this settingwill ensure deterministic behavior. The SetVariable actor has an output port thatcan be used to ensure that other specified actors are executed only after SetVariableexecutes. This approach can also eliminate nondeterminacy, even if delayed is set tofalse.
Ptolemaeus, System Design 49

2.1. GETTING STARTED
Figure 2.9: Three unconnected actors in a model.
Figure 2.10: Dragging a connection to an existing one will create a three-wayconnection by creating an explicit relation.
50 Ptolemaeus, System Design

2. BUILDING GRAPHICAL MODELS
Click here to create a relation,or control-click (Windows) orcommand-click (Mac) onthe background.
Figure 2.11: A relation can also be created by clicking on the black diamond inthe toolbar.
splitter that enables connecting more than two ports; it is represented in the diagram by ablack diamond, as shown in Figure 2.11. It can be created in several ways:
• Drag the endpoint of a link into the middle of an existing line, as shown in Figure 2.10.• Control-click3 on the background. A relation will appear.• Click on the button in the toolbar with the black diamond on it, as shown in Figure
2.11.
Note that if you simply click and drag on the relation, the relation is selected and moved,which does not result in a connection. To make a connection, hold the control key whileclicking and dragging on the relation.
In the model shown in Figure 2.11, the relation is used to broadcast the output from asingle port to a number of places. The single port still has only one connection — aconnection to the relation.
Even with the simple diagrams we have created so far, it can become tedious to arrange theicons and control the routing of wires between ports and relations. Fortunately, PtolemyII includes a sophisticated automated layout tool, which you can find in the [Graph→
3On a Macintosh, use command-click. (This substitution applies throughout the book.)
Ptolemaeus, System Design 51

2.2. TOKENS AND DATA TYPES
Automatic Layout] menu command (or invoke using Control-T). This tool was con-tributed by Sponemann et al. (2009). Occasionally, however, you may still need to man-ually adjust the layout. To specifically control the routing of connections, you can usemultiple relations along a connection and independently control the position of each one.Multiple relations used in a single connection are called a relation group. In a relationgroup, there is no significance to the order in which relations are linked.
Ptolemy II supports two types of ports, which are indicated by filled and unfilled triangles.Filled triangles designate single-input (or single-output) ports, while unfilled triangles al-low multiple inputs (or outputs). For example, the output port of the Ramp actor is a singleport, while the input port of the Display and SequencePlotter actors are multiports. Inmultiports, each connection is treated as a separate channel.
Choose another signal source from the library and add it to the model. Connect this ad-ditional source to the SequencePlotter or to the Display, thus implementing a multiportinput to those blocks. Not all data type inputs will be accepted, however; the Sequence-Plotter, for example, can only accept inputs of type double or types that can be losslesslyconverted to double, such as int. In the next section, we discuss data types and their usein Ptolemy II models.
2.2 Tokens and Data Types
In the example of Figure 2.7, the Const actor creates a sequence of values on its outputport. Each value in the sequence is called a token. A token is created by one actor, sentthrough an output port, and received by one or more destination actors, each of whichretrieves the token through an input port. In this case, the Display actor will receive thetokens produced by the Const actor and display them in a window. A token is simply aunit of data, such as a string or numerical value, that is communicated between two actorsvia ports.
The tokens produced by the Const actor can have any value that can be expressed in thePtolemy II expression language (see Chapter 13). Try setting the value to 1 (the integerwith value one), or 1.0 (the floating-point number with value one), or {1.0} (a single-entry array containing 1.0), or {value=1,name="one"} (a record with two elements:an integer named “value” and a string named “name”), or even [1,0;0,1] (the two-by-two identity matrix). These are all valid expressions that can be used in the Constactor.
52 Ptolemaeus, System Design

2. BUILDING GRAPHICAL MODELS
Figure 2.12: Another example, used to explore data types. [online]
The Const actor is able to produce data with different types, and the Display actor is ableto display data with different types. Most actors in the actor library are polymorphicactors, meaning that they can operate on or produce data with multiple types, thoughtheir specific processing behavior may be different for different types. Multiplying ma-trices, for example, is not the same operation as multiplying integers, but both can beaccomplished using the MultiplyDivide actor in the Math library. Ptolemy II includes asophisticated type system that allows actors to process different data types efficiently andsafely. The type system was created by Xiong (2002) and is described in Chapter 14.
To explore data types further, create the model in Figure 2.12, using the SDF Director.The Ramp actor is listed under the Sources→SequenceSources sublibrary, and theAddSubtract actor is listed under the Math library (see box on page 57). Set the valueparameter of the Const to be 0 and the iterations parameter of the director to 5. Runningthe model will result in the display of five consecutive numbers starting at 0 and ending at4, as shown in the figure. These values are produced by subtracting the constant output ofthe Const actor from the current value of the Ramp. Experiment with changing the valueof the Const actor and see how it changes the five numbers at the output.
Now change the value of the Const actor back to "Hello World". When you executethe model, you should see an exception window, as shown in Figure 2.13. This error iscaused by attempting to subtract a string value from an integer value. This error is onekind of type error.
Ptolemaeus, System Design 53

2.2. TOKENS AND DATA TYPES
The actor that caused the exception is highlighted, and the name of the actor is shown inthe exception. In Ptolemy II models, all objects have a dotted name. The dots separateelements in the hierarchy. Thus, “.helloWorldSubtractError.AddSubtract” is an objectnamed “AddSubtract” contained by a object named “.helloWorldAddSubtractError”. (Themodel was saved as a file called helloWorldAddSubtract.xml.)
Exceptions can be a very useful debugging tool, particularly when developing componentsin Java. To illustrate how to use them, click on the Display Stack Trace button in theexception window of Figure 2.13. You should see a stack trace like that shown in Figure2.13. This window displays the execution sequence that resulted in the exception. Forexample, if you scroll towards the bottom, text similar to the following will be displayed:
at ptolemy.data.StringToken._subtract(StringToken.java:359)
This line indicates that the exception occurred within the subtract method of the classptolemy.data.StringToken, at line 359 of the source file StringToken.java. Since PtolemyII is distributed with source code (and most installation mechanisms support installationof the source), this can be very useful information. For type errors, you probably do notneed to see the stack trace, but if you have extended the system with your own Java codeor you encounter a subtle error that you do not understand, then looking at the stack tracecan be very illuminating.
To find the file StringToken.java referred to above, find the Ptolemy II installation direc-tory. If that directory is $PTII, then the location of this file is given by the full classname, but with the periods replaced by slashes; in this case, it is at
$PTII/ptolemy/data/StringToken.java
The slashes will be backslashes under Windows.
Let’s try a small change to the model to eliminate the exception. Disconnect the Constactor from the lower port of the AddSubtract actor and connect it instead to the upperport, as shown in Figure 2.14. You can do this by selecting the connection, deleting it(using the delete key), and adding a new connection–or by selecting it and dragging oneof its endpoints to the new location. Notice that the upper port is an unfilled triangle; thisindicates that you can make more than one connection to it. Now when you run the modelyou should see a sequence of string values starting with “0Hello World”, as shown in
54 Ptolemaeus, System Design

2. BUILDING GRAPHICAL MODELS
Figure 2.13: An example that triggers an exception when you attempt to executeit. Strings cannot be subtracted from integers. Examining the stack trace for suchexceptions can sometimes be useful for debugging your model, particularly if itincludes custom actors. [online]
Ptolemaeus, System Design 55

2.2. TOKENS AND DATA TYPES
Figure 2.14: Addition of a string to an integer. [online]
the figure. Following Java conventions, strings can be added (using concatenation), butthey cannot be subtracted.
All the connections to a multiport must have the same type. In this case, the multiport hasa sequence of integers coming in (from the Ramp) and a sequence of strings (from theConst). The Ramp integers are automatically converted to strings and concatenated with“Hello World” to generate the output sequence.
As illustrated by the above example, Ptolemy II automatically performs type conversionswhen required by the actor, if possible. As a rough guideline, Ptolemy II will performautomatic type conversions when there is no loss of information. An int can be convertedto a string, for example, but not vice versa. An int can be converted to a double, but notvice versa. An int can be converted to a long, but not vice versa. The details are explainedin Chapter 14, but it is usually not necessary to remember the conversion rules. Typically,the data type conversions and resulting computations will perform as would be expected.
To further explore data types, try modifying the Ramp so that its parameters have differenttypes. For example, try making init and step strings.
56 Ptolemaeus, System Design

2. BUILDING GRAPHICAL MODELS
Sidebar: Math Library
Actors in the Actors→Math library perform mathematical operations, and are shownbelow (except the most versatile, Expression, explained in Chapter 13).
These are mostly self explanatory:• AbsoluteValue computes the absolute value of the input.• AddSubtract adds tokens at the plus inputs, and subtracts tokens at the minus inputs.• Accumulator outputs the sum of all tokens that have arrived.• Average outputs the average of all tokens that have arrived.• Counter counts up or down when inputs are received on the two input ports.• Differential outputs the difference between the current input and the previous one.• DotProduct computes the inner product of two array or matrix inputs.• Limiter limits the value of the input to a specified range of values.• LookupTable performs a lookup into a table provided as an array.(Continued on page 58.)
Ptolemaeus, System Design 57
2.2. TOKENS AND DATA TYPES
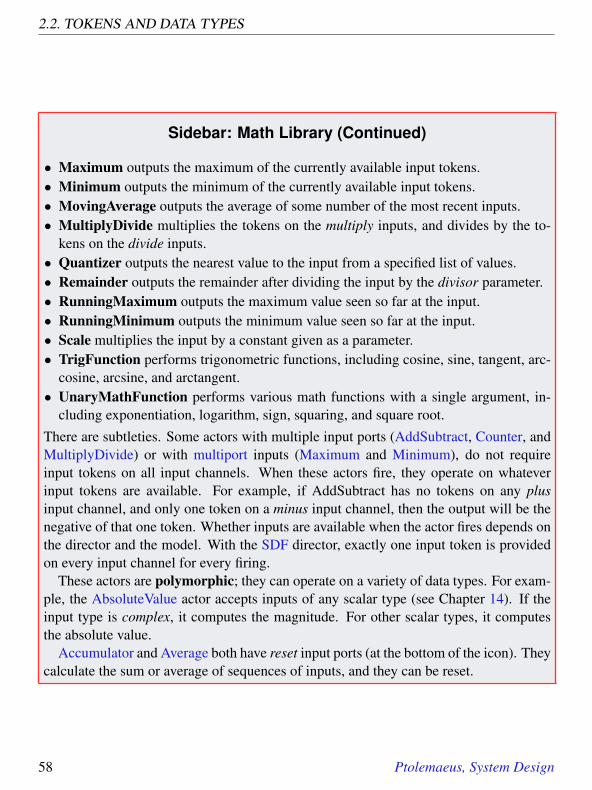
Sidebar: Math Library (Continued)
• Maximum outputs the maximum of the currently available input tokens.• Minimum outputs the minimum of the currently available input tokens.• MovingAverage outputs the average of some number of the most recent inputs.• MultiplyDivide multiplies the tokens on the multiply inputs, and divides by the to-
kens on the divide inputs.• Quantizer outputs the nearest value to the input from a specified list of values.• Remainder outputs the remainder after dividing the input by the divisor parameter.• RunningMaximum outputs the maximum value seen so far at the input.• RunningMinimum outputs the minimum value seen so far at the input.• Scale multiplies the input by a constant given as a parameter.• TrigFunction performs trigonometric functions, including cosine, sine, tangent, arc-
cosine, arcsine, and arctangent.• UnaryMathFunction performs various math functions with a single argument, in-
cluding exponentiation, logarithm, sign, squaring, and square root.There are subtleties. Some actors with multiple input ports (AddSubtract, Counter, andMultiplyDivide) or with multiport inputs (Maximum and Minimum), do not requireinput tokens on all input channels. When these actors fire, they operate on whateverinput tokens are available. For example, if AddSubtract has no tokens on any plusinput channel, and only one token on a minus input channel, then the output will be thenegative of that one token. Whether inputs are available when the actor fires depends onthe director and the model. With the SDF director, exactly one input token is providedon every input channel for every firing.
These actors are polymorphic; they can operate on a variety of data types. For exam-ple, the AbsoluteValue actor accepts inputs of any scalar type (see Chapter 14). If theinput type is complex, it computes the magnitude. For other scalar types, it computesthe absolute value.
Accumulator and Average both have reset input ports (at the bottom of the icon). Theycalculate the sum or average of sequences of inputs, and they can be reset.
58 Ptolemaeus, System Design
2. BUILDING GRAPHICAL MODELS
2.3 Hierarchy and Composite Actors
Ptolemy II supports (and encourages) hierarchical models. These are models that containcomponents that are themselves models. These components are called composite actors.
Consider the typical signal processing problem of recovering a signal from a noisy chan-nel. Using Ptolemy II, we will create a composite actor modeling a communication chan-nel that adds noise, and then use that actor within a larger model.
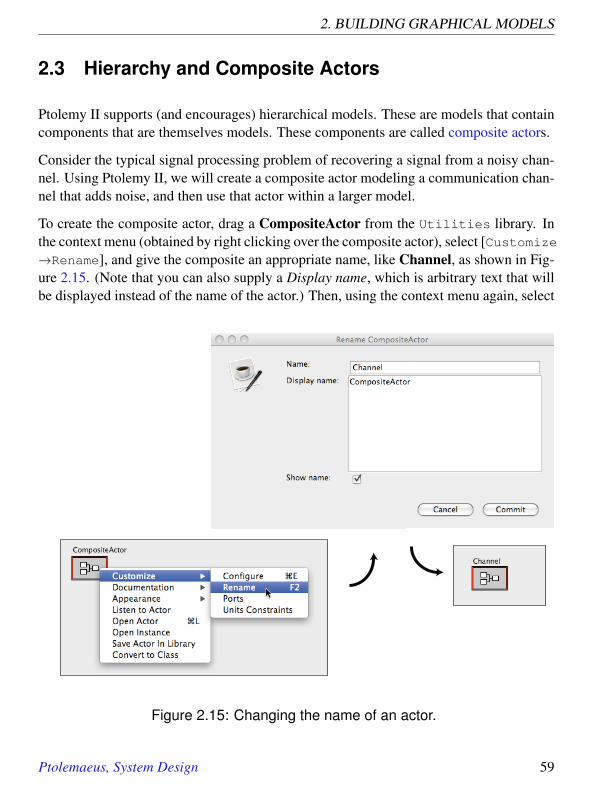
To create the composite actor, drag a CompositeActor from the Utilities library. Inthe context menu (obtained by right clicking over the composite actor), select [Customize→Rename], and give the composite an appropriate name, like Channel, as shown in Fig-ure 2.15. (Note that you can also supply a Display name, which is arbitrary text that willbe displayed instead of the name of the actor.) Then, using the context menu again, select
Figure 2.15: Changing the name of an actor.
Ptolemaeus, System Design 59
2.3. HIERARCHY AND COMPOSITE ACTORS
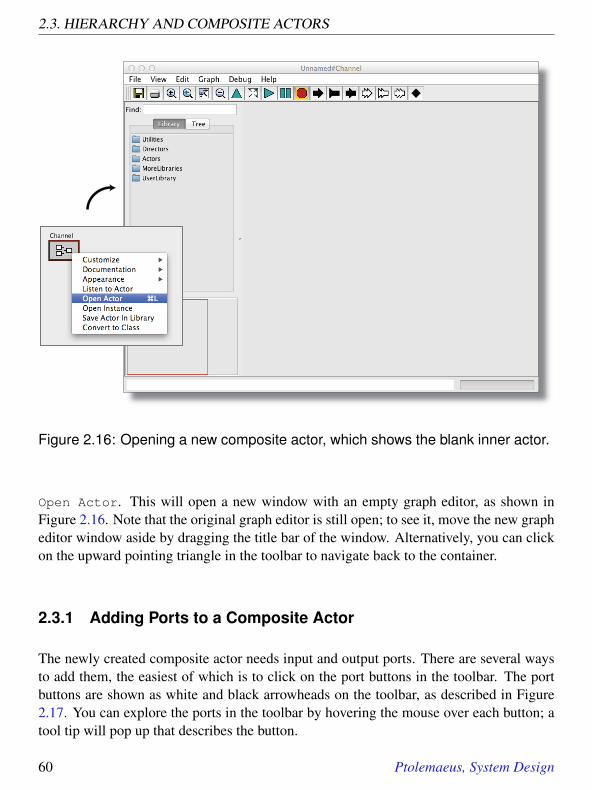
Figure 2.16: Opening a new composite actor, which shows the blank inner actor.
Open Actor. This will open a new window with an empty graph editor, as shown inFigure 2.16. Note that the original graph editor is still open; to see it, move the new grapheditor window aside by dragging the title bar of the window. Alternatively, you can clickon the upward pointing triangle in the toolbar to navigate back to the container.
2.3.1 Adding Ports to a Composite Actor
The newly created composite actor needs input and output ports. There are several waysto add them, the easiest of which is to click on the port buttons in the toolbar. The portbuttons are shown as white and black arrowheads on the toolbar, as described in Figure2.17. You can explore the ports in the toolbar by hovering the mouse over each button; atool tip will pop up that describes the button.
60 Ptolemaeus, System Design
2. BUILDING GRAPHICAL MODELS
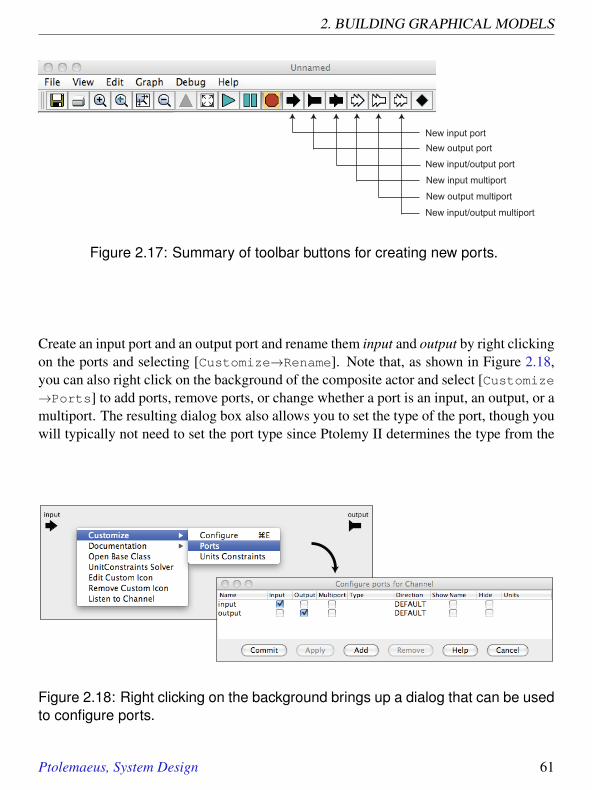
New input portNew output port
New input/output port
New input multiport
New output multiport
New input/output multiport
Figure 2.17: Summary of toolbar buttons for creating new ports.
Create an input port and an output port and rename them input and output by right clickingon the ports and selecting [Customize→Rename]. Note that, as shown in Figure 2.18,you can also right click on the background of the composite actor and select [Customize→Ports] to add ports, remove ports, or change whether a port is an input, an output, or amultiport. The resulting dialog box also allows you to set the type of the port, though youwill typically not need to set the port type since Ptolemy II determines the type from the
Figure 2.18: Right clicking on the background brings up a dialog that can be usedto configure ports.
Ptolemaeus, System Design 61

2.3. HIERARCHY AND COMPOSITE ACTORS
Figure 2.19: A simple channel model defined as a composite actor.
port’s connections. You can also specify the direction of a port4 and whether the name ofthe port is shown outside the icon (by default it is not), or even whether the port is shownat all.
Using these ports, create the diagram shown in Figure 2.195. The Gaussian actor, which isin the Random library, creates values from a Gaussian distributed random variable. If youthen navigate back to the container, you should be able to easily create the model shownin Figure 2.20. The Sinewave actor is listed under Sources→SequenceSources, andthe SequencePlotter actor under Sinks→SequenceSinks. The Sinewave actor is alsoa composite actor (try opening the actor). If you execute this model (you will probablywant to set the iterations parameter of the director to something reasonable, like 100), youshould see a plot similar to the one in Figure 2.20.
2.3.2 Setting the Types of Ports
In the above example, it was not necessary to define the port types. Their types wereinferred from the connections and constants in the model, as explained in Chapter 14.Occasionally, however, you will need to set the types of the ports. Notice in Figure 2.18that there is a column in the dialog box that enables the port type to be specified. Tospecify that a port has type boolean, for example, you could enter boolean. This willonly have an effect, however, if the port is contained by an opaque composite actor (onethat has its own director). In the model you have built, the Channel composite actor istransparent, and setting the types of its ports will have no effect. Transparent composite
4The direction of a port is defined by where it appears on the icon for the actor. By default, input portsappear on the left, output ports on the right, and ports that are both inputs and outputs appear on the bottomof the icon.
5Hint: to create a connection starting on one of the external ports, hold down the control key whendragging, or on a Macintosh, the command key.
62 Ptolemaeus, System Design

2. BUILDING GRAPHICAL MODELS
2x10
-2-1
0
1
2
3
0.0 0.2 0.4 0.6 0.8 1.0
SequencePlotter
Figure 2.20: A simple signal processing example that adds noise to a sinusoidalsignal. [online]
actors are merely a notational convenience, and the ports of the composite play no role inthe execution of the model.
Commonly used types include complex, double, fixedpoint, float, general, int, long, ma-trix, object, scalar, short, string, unknown, unsignedByte, xmlToken, arrayType(int), ar-rayType(int, 5), [double] and {x=double, y=double}. A detailed description of typesappears in Chapter 14.
In the Ptolemy II expression language, square braces are used for matrices, and curlybraces are used for arrays. An array is an ordered list of tokens of arbitrary type. APtolemy II matrix is a one- or two-dimensional structure containing numeric types. Tospecify a double matrix port type, for example, you would use the following expression:
[double]
This expression creates a 1 x 1 matrix containing a double (the value of which is irrelevanthere). It serves as a prototype to specify a double matrix type. Similarly, we can specifyan array of complex numbers as
{complex}
Ptolemaeus, System Design 63

2.3. HIERARCHY AND COMPOSITE ACTORS
A record has an arbitrary number of data elements, each of which has a name and a value,where the value can be of any type. To specify a record containing a string called “name”and an integer called “address” you would use the following expression to specify thetype:
{name=string, address=int}
Details about arrays, matrices, and records are given in Chapter 13.
2.3.3 Multiports, Busses, and Hierarchy
As explained above in Section 2.1.3, a multiport handles multiple independent channels.In a similar manner, a relation can handle multiple independent channels. A relationhas a width parameter, which by default is set to Auto, meaning that the width is inferredfrom the context. If the width is not unity, it will be displayed as shown in Figure 2.21
Figure 2.21: Relations can have a width greater than one, meaning that theycarry more than one channel. The width of the relation inside the composite inthis figure is inferred to be three. [online]
64 Ptolemaeus, System Design

2. BUILDING GRAPHICAL MODELS
as a number adjacent to a slash through a relation. Such a connection is called a bus,because it carries multiple signals. If in the example in Figure 2.21 you set the width ofthe relation inside the composite to 2, then only two of the three channels will be usedinside the composite.
In most circumstances, the width of a relation is inferred from the usage (Rodiers andLickly, 2010), but occasionally it is useful to set it explicitly. You can also explicitlyconstruct a bus using the BusAssembler actor, or split one apart using a BusDisassembleractor, both found in the FlowControl→Aggregators library.
2.4 Annotations and Parameterization
In this section, we will enhance the model in Figure 2.20 in several ways. We will addparameters, insert decorative and documentary annotations, and customize the actor icons.
2.4.1 Parameters in Hierarchical Models
First, notice from Figure 2.20 that the noise overwhelms the sinusoid, making it barelyvisible. A useful modification to this channel model would be to add a parameter thatsets the level of the noise. To make this change, open the channel model by right clickingon it and selecting Open Actor. In the channel model, add a parameter by dragging onein from the sublibrary Utilities→Parameters, as shown in Figure 2.22. Right clickon the parameter to rename it to noisePower. (To use a parameter in expressions, itsname cannot have spaces.) Right click (or double click) on the parameter to change itsdefault value to 0.1.
This parameter can now be used to set the amount of noise. The Gaussian actor hasa parameter called standardDeviation. Since the noise power is equal to the variance,not the standard deviation, change the standardDeviation parameter so that its value issqrt(noisePower), as shown in Figure 2.23. (See Chapter 13 for details on the ex-pression language.)
To observe the effect of the parameter, return to the top-level model and edit the pa-rameters of the Channel actor (by either double clicking or right clicking and selecting[Customize→Configure]). Change the noisePower from the default 0.1 to 0.01. Runthe model. You should now get a relatively clean sinusoid like that shown in Figure 2.24.
Ptolemaeus, System Design 65

2.4. ANNOTATIONS AND PARAMETERIZATION
Figure 2.22: Adding a parameter to the Channel model. [online]
66 Ptolemaeus, System Design

2. BUILDING GRAPHICAL MODELS
Figure 2.23: The standard deviation of the Gaussian actor is set to the squareroot of the noise power.
2x10
-1.0
-0.5
0.0
0.5
1.0
0.0 0.2 0.4 0.6 0.8 1.0
SequencePlotter
Figure 2.24: The output of the simple signal processing model in Figure 2.20 withnoise power = 0.01. [online]
You can also add parameters to a composite actor by clicking on the “Add” button inthe edit parameters dialog for the Channel composite. This dialog is accessed by doubleclicking on the Channel icon, by right clicking and selecting [Customize→Configure],or by right clicking on the background inside the composite and selecting [Customize→Configure]. A key point to note here is that parameters that are added this way willnot be visible in the diagram, so this mechanism should be used sparingly and only whenthere is a good reason to hide parameters from someone browsing the model.
Finally, note that it is possible to create an object called a port parameter or parameterport that is both a parameter and a port. The frequency and phase objects in Figure 2.5are port parameters. They can be accessed in an expression like any other parameter, butwhen an input arrives at the parameter port during execution, the value of the parameter
Ptolemaeus, System Design 67
2.5. NAVIGATING LARGER MODELS
gets updated. To create a port parameter object in a model, simply drag one in from theUtilities→Parameters library and assign it a name.
2.4.2 Decorative Elements
The model can also be enhanced with a variety of decorative elements — that is, ele-ments that affect its appearance but not its functionality. Such elements can improve thereadability and aesthetics of a model. For example, try dragging an Annotation from theUtilities→Decorative sublibrary, and creating a title for the diagram. Such annota-tions are highly recommended; they correspond to comments in programs and can greatlyimprove readability. Other decorative elements (such as geometric shapes) can be draggedinto the diagram from the same library.
2.4.3 Creating Custom Icons
Vergil provides an icon editor to enable users to create custom actor icons. To create acustom icon, right click on the standard icon and select [Appearance→Edit Custom
Icon], as shown in Figure 2.25. The box in the middle of the icon editor displays the sizeof the default icon, for reference. Try creating an icon like the one shown in Figure 2.26.Hint: The fill color of the rectangle is set to none and the fill color of the trapezoid is firstset using the color selector, then modified to have an alpha (transparency) of 0.5. Finally,since the icon itself has the actor name in it, the [Customize→Rename] dialog is used todeselect show name.
2.5 Navigating Larger Models
Some models are too large to view on one screen. There are four toolbar buttons, shownin Figure 2.27, that permit zooming in and out. The “Zoom reset” button restores thezoom factor to its original value, and “Zoom fit” calculates the zoom factor so that theentire model is visible in the editor window.
It is also possible to pan over a model. Consider the window shown in Figure 2.28. Here,we have zoomed in so that icons are larger than the default. The pan window at the lowerleft shows the entire model, with a red box indicating the visible portion of the model. Byclicking and dragging in the pan window, it is easy to navigate the entire model.
68 Ptolemaeus, System Design

2. BUILDING GRAPHICAL MODELS
Figure 2.25: Custom icon editor for the Channel actor.
Ptolemaeus, System Design 69

2.5. NAVIGATING LARGER MODELS
Figure 2.26: Custom icon for the Channel actor. [online]
Zoom inZoom reset
Zoom fit
Zoom out
Open parent (if any)
Full screen
Figure 2.27: Summary of toolbar buttons for zooming and fitting.
70 Ptolemaeus, System Design

2. BUILDING GRAPHICAL MODELS
Box that can be movedaround to view di�erentareas of the model
Pan area
Figure 2.28: The pan window at the lower left has a red box representing thevisible area of the model in the main editor window. This red box can be movedaround to view different parts of the model.
2.6 Classes and Inheritance
Ptolemy II includes the ability to define actor-oriented classes (Lee et al., 2009a). Theseclasses can then be used to create instances and subclasses, both of which use the conceptof class inheritance. A class provides a general definition (or template) for an actor. Aninstance is a single, specific occurrence of that class, and a subclass is derived from theclass — it includes the same structure, but may have some modifications. This approachimproves design modularity, as illustrated in the example below.
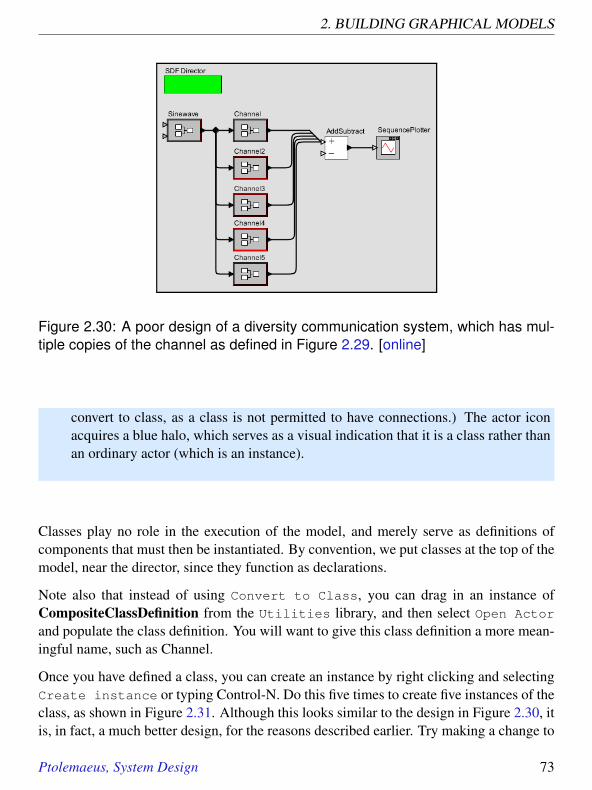
Example 2.1: Consider the model that was developed in Section 2.3, shown forreference in Figure 2.29. Suppose that we wish to create multiple instances ofthe channel, as shown in Figure 2.30. In that figure, the sinewave signal passesthrough five distinct channels (note the use of a black-diamond relation betweenthe sine wave and the channels to broadcast the same signal to each of the five
Ptolemaeus, System Design 71

2.6. CLASSES AND INHERITANCE
channels). The outputs of the channels are added together and plotted. The result isa significantly cleaner sine wave than the one that results from one channel alone.(In communication systems, this technique is known as a diversity system, wheremultiple copies of a channel, each with independent noise, are used to achieve morereliable communications.)
Although it is functional, this is a poor design, for two reasons. First, the number ofchannels is hardwired into the diagram. (We will address that problem in the nextsection.) Second, each of the channels is a copy of the composite actor in Figure2.29. Therefore, if the channel design needs to be changed, all five copies must bechanged. This approach results in models that are difficult to maintain or scale.
A more subtle advantage to using classes and instances is that the XML file repre-sentation of the model will be smaller, since the design of the class is given onlyonce rather than multiple times.
A better solution would be to define a Channel class, and use instances of thatclass to implement the diversity system. To implement this change, begin withthe design in Figure 2.29, and remove the connections to the channel, as shown inFigure 2.31. Then right click and select Convert to Class. (Note that if youfail to first remove the connections, you will get an error message when you try to
Figure 2.29: Hierarchical model that we will modify to use classes.
72 Ptolemaeus, System Design
2. BUILDING GRAPHICAL MODELS
Figure 2.30: A poor design of a diversity communication system, which has mul-tiple copies of the channel as defined in Figure 2.29. [online]
convert to class, as a class is not permitted to have connections.) The actor iconacquires a blue halo, which serves as a visual indication that it is a class rather thanan ordinary actor (which is an instance).
Classes play no role in the execution of the model, and merely serve as definitions ofcomponents that must then be instantiated. By convention, we put classes at the top of themodel, near the director, since they function as declarations.
Note also that instead of using Convert to Class, you can drag in an instance ofCompositeClassDefinition from the Utilities library, and then select Open Actor
and populate the class definition. You will want to give this class definition a more mean-ingful name, such as Channel.
Once you have defined a class, you can create an instance by right clicking and selectingCreate instance or typing Control-N. Do this five times to create five instances of theclass, as shown in Figure 2.31. Although this looks similar to the design in Figure 2.30, itis, in fact, a much better design, for the reasons described earlier. Try making a change to
Ptolemaeus, System Design 73

2.6. CLASSES AND INHERITANCE
Model with multiple instancesof the same class.
Model after instanceis created from class.
Model after class ismoved to the top.
Model after channel is converted to class.
Model with connections removed.
Figure 2.31: Creating and using a Channel class. [online]
74 Ptolemaeus, System Design
2. BUILDING GRAPHICAL MODELS
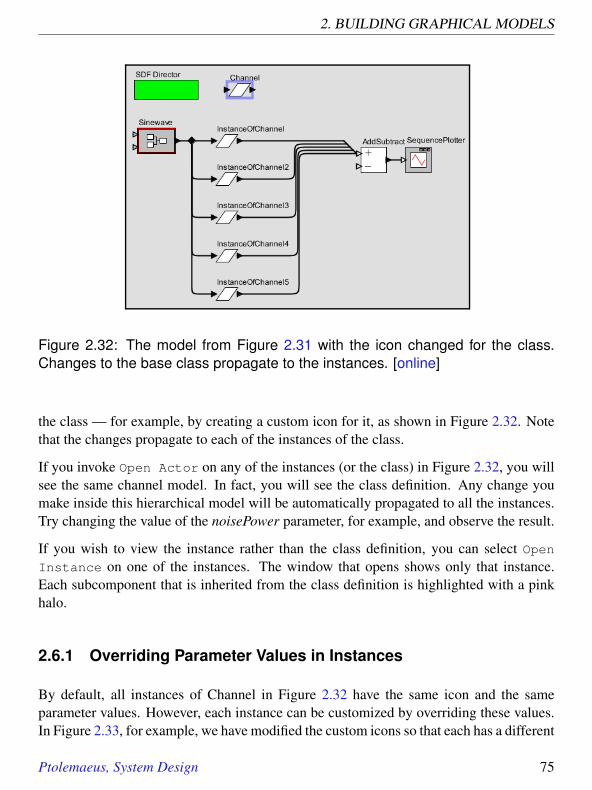
Figure 2.32: The model from Figure 2.31 with the icon changed for the class.Changes to the base class propagate to the instances. [online]
the class — for example, by creating a custom icon for it, as shown in Figure 2.32. Notethat the changes propagate to each of the instances of the class.
If you invoke Open Actor on any of the instances (or the class) in Figure 2.32, you willsee the same channel model. In fact, you will see the class definition. Any change youmake inside this hierarchical model will be automatically propagated to all the instances.Try changing the value of the noisePower parameter, for example, and observe the result.
If you wish to view the instance rather than the class definition, you can select OpenInstance on one of the instances. The window that opens shows only that instance.Each subcomponent that is inherited from the class definition is highlighted with a pinkhalo.
2.6.1 Overriding Parameter Values in Instances
By default, all instances of Channel in Figure 2.32 have the same icon and the sameparameter values. However, each instance can be customized by overriding these values.In Figure 2.33, for example, we have modified the custom icons so that each has a different
Ptolemaeus, System Design 75

2.6. CLASSES AND INHERITANCE
base class propagate to the instances.
Figure 2.33: The model from Figure 2.32 with the icons of the instances changedto override parameter values in the class. [online]
color, and the fifth one has an extra graphical element. These changes are made by rightclicking on the icon of the instance and selecting Edit Custom Icon. If you updateclass parameters that are overridden in an instance, then an update to the class will haveno effect on the instance. It only has an effect on instances that have not been overridden.
2.6.2 Subclasses and Inheritance
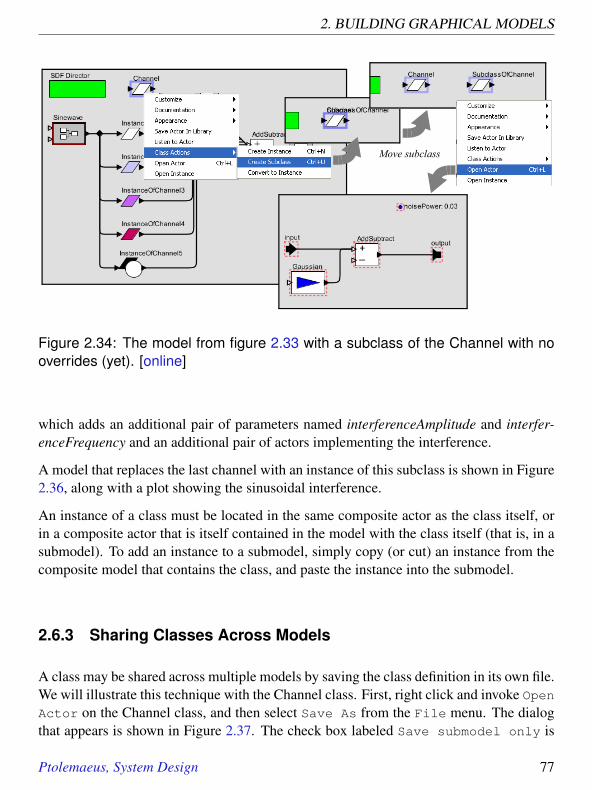
Suppose now that we wish to modify some of the channels to add interference, in theform of another sine wave. A good way to do this is to create a subclass of the Channelclass, as shown in Figure 2.34. A subclass is created by right clicking on the class iconand selecting Create Subclass. The resulting icon for the subclass appears on top ofthe icon for the class, and can be moved aside.
The subclass contains all of the elements of the class, but with the icons now surroundedby a pink halo. These elements are inherited and cannot be removed from the subclass(attempting to do so will generate an error message). You can, however, change theirparameter values and add additional elements. Consider the design shown in Figure 2.35,
76 Ptolemaeus, System Design
2. BUILDING GRAPHICAL MODELS
Move subclass
Figure 2.34: The model from figure 2.33 with a subclass of the Channel with nooverrides (yet). [online]
which adds an additional pair of parameters named interferenceAmplitude and interfer-enceFrequency and an additional pair of actors implementing the interference.
A model that replaces the last channel with an instance of this subclass is shown in Figure2.36, along with a plot showing the sinusoidal interference.
An instance of a class must be located in the same composite actor as the class itself, orin a composite actor that is itself contained in the model with the class itself (that is, in asubmodel). To add an instance to a submodel, simply copy (or cut) an instance from thecomposite model that contains the class, and paste the instance into the submodel.
2.6.3 Sharing Classes Across Models
A class may be shared across multiple models by saving the class definition in its own file.We will illustrate this technique with the Channel class. First, right click and invoke OpenActor on the Channel class, and then select Save As from the File menu. The dialogthat appears is shown in Figure 2.37. The check box labeled Save submodel only is
Ptolemaeus, System Design 77

2.6. CLASSES AND INHERITANCE
Figure 2.35: The subclass from Figure 2.34 with overrides that add sinusoidalinterference. [online]
Figure 2.36: A model using the subclass from Figure 2.35 and a plot of an exe-cution. [online]
78 Ptolemaeus, System Design

2. BUILDING GRAPHICAL MODELS
by default unchecked. If left unchecked, the entire model will be saved.6 In our case, wewish to save the Channel submodel only, so we must check the box.
It is important to save the class definition in a location that will be found by the model. Ingeneral, Ptolemy II searches for class definitions relative to the classpath, which is givenby an environment variable called CLASSPATH. In principle, you can set this environ-ment variable to include any directory that you would like to have searched. In practice,however, changing the CLASSPATH variable may cause problems with other programs,so we recommend that you store the file in a directory within the Ptolemy II installationdirectory or within a directory called “.ptolemyII” in your home directory.7 In either case,Ptolemy will find class files stored in those directories.
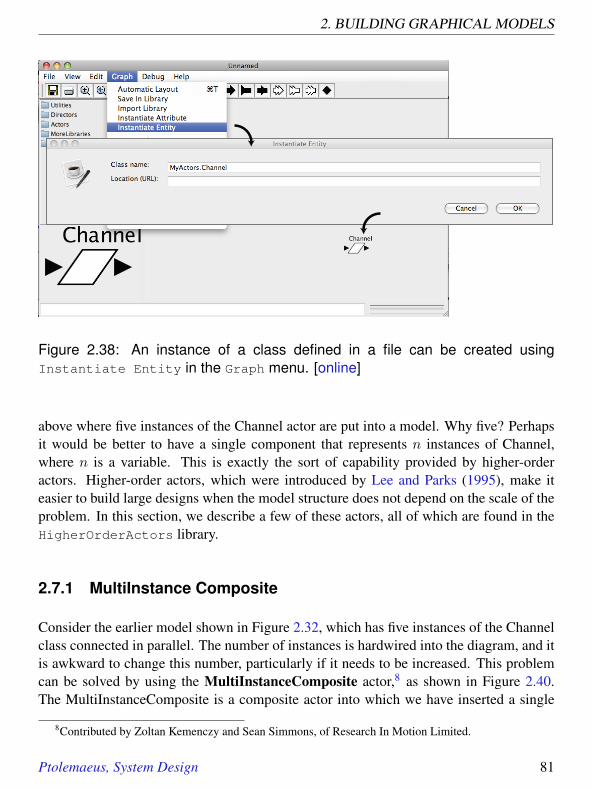
Let’s assume you save the Channel class to a file called Channel.xml in the directory$PTII/myActors, where $PTII is the location of the Ptolemy II installation. Thisclass definition can now be used in any model, as follows. Open the model and selectInstantiate Entity in the Graph menu, as shown in Figure 2.38. Enter the fullyqualified class name relative to the $PTII entry in the classpath, which in this case is“myActors.Channel”.
Once you have an instance of the Channel class that is defined in its own file, you canadd it to the UserLibrary that appears in the library browser on the left side of Vergilwindows, as shown in Figure 2.39. Right click on the instance and select Save Actor
in Library. As shown in the figure, this causes another window to open and displaythe user library. The user library is itself a Ptolemy II model stored in an XML file. Whenyou save the library model the class instance becomes available in the UserLibrary forany Vergil window (for the same user). Note that saving the class definition itself (vs. aninstance of the class) in the user library does not have the same result. In that case, theuser library would provide a new class definition rather than an instance of the class.
2.7 Higher-Order Components
Ptolemy II includes a number of higher-order components. These are actors that operateon the structure of the model rather than on input data. Consider the several examples
6On some platforms, a separate dialog will appear with the Save submodel only check box.7If you don’t know where Ptolemy II is installed on your system, you can invoke [File→New→
Expression Evaluator] and type PTII followed by Enter. Or, in a Graph editor, select [View→JVM Properties] and look for the ptolemy.ptII.dir property.
Ptolemaeus, System Design 79

2.7. HIGHER-ORDER COMPONENTS
Check here tosave theChannel classto a file
Figure 2.37: A class can be saved in a separate file to then be shared amongmultiple models. On some platforms, a separate dialog will appear with the Save
submodel only check box, as shown. On others, the check box will be integratedinto a single dialog. [online]
80 Ptolemaeus, System Design
2. BUILDING GRAPHICAL MODELS
Figure 2.38: An instance of a class defined in a file can be created usingInstantiate Entity in the Graph menu. [online]
above where five instances of the Channel actor are put into a model. Why five? Perhapsit would be better to have a single component that represents n instances of Channel,where n is a variable. This is exactly the sort of capability provided by higher-orderactors. Higher-order actors, which were introduced by Lee and Parks (1995), make iteasier to build large designs when the model structure does not depend on the scale of theproblem. In this section, we describe a few of these actors, all of which are found in theHigherOrderActors library.
2.7.1 MultiInstance Composite
Consider the earlier model shown in Figure 2.32, which has five instances of the Channelclass connected in parallel. The number of instances is hardwired into the diagram, and itis awkward to change this number, particularly if it needs to be increased. This problemcan be solved by using the MultiInstanceComposite actor,8 as shown in Figure 2.40.The MultiInstanceComposite is a composite actor into which we have inserted a single
8Contributed by Zoltan Kemenczy and Sean Simmons, of Research In Motion Limited.
Ptolemaeus, System Design 81

2.7. HIGHER-ORDER COMPONENTS
Figure 2.39: Instances of a class that are defined in their own files can be madeavailable in the UserLibrary.
82 Ptolemaeus, System Design

2. BUILDING GRAPHICAL MODELS
Figure 2.40: A model that is equivalent to that of Figure 2.32, but using a Mul-tiInstanceComposite, which permits the number of instances of the channel tochange by simply changing one parameter value. [online]
instance of the Channel (by creating an instance of the Channel, then copying and pastingit into the composite). MultiInstanceComposite is required to be opaque (meaning thatit contains a director). It functions within the model as a single actor, but internally it isrealized as a multiplicity of actors operating in parallel.
The MultiInstanceComposite actor has three parameters, nInstances, instance, and show-Clones, as shown in Figure 2.41. The first of these specifies the number of instances tocreate. At run time, this actor replicates itself this number of times, connecting the in-puts and outputs to the same sources and destinations as the first (prototype) instance.In Figure 2.40, notice that the input of the MultiInstanceComposite is connected to a re-lation (the black diamond), and the output is connected directly to a multiport input ofthe AddSubtract actor. As a consequence, the multiple instances will be connected in amanner similar to Figure 2.32, where the same input value is broadcast to all instances,but distinct output values are supplied to the AddSubtract actor.
The model created using multi-instances is better than the original version because thenumber of instances can be changed with a single parameter. Each instance can be cus-tomized as needed by expressing its parameter values in terms of the instance parameterof the MultiInstanceComposite. Try, for example, making the noisePower parameter of
Ptolemaeus, System Design 83

2.7. HIGHER-ORDER COMPONENTS
Figure 2.41: The first parameter of the MultiInstanceComposite specifies thenumber of instances. The second parameter is available to the model builder toidentify individual instances. The third parameter controls whether the instancesare rendered on the screen (when the model is run).
the InstanceOfChannel actor in Figure 2.40 depend on instance. For example, set it toinstance * 0.1 and then set nInstances to 1. You will see a clean sine wave whenyou run the model, because the one instance has number zero, so there will be no noisefor that instance.
2.7.2 IterateOverArray
The implementation of the Channel class, which is shown in Figure 2.37, does not haveany state, meaning that an invocation of the Channel model does not depend on datacalculated in a previous invocation. As a consequence, it is not necessary to use n dis-tinct instances of the Channel class to realize a diversity communication system; a singleinstance could be invoked n times on n copies of the data. This approach can be accom-plished by using the IterateOverArray higher-order actor.
The IterateOverArray actor can be used in a manner similar to the MultiInstanceCompos-ite in the previous section. That is, we can populate it with an instance of the Channelclass, similar to Figure 2.40. The IterateOverArray actor also requires a director insidethe model.
Example 2.2: Consider the example in Figure 2.42. In this case, the top-level model uses an array with multiple copies of the channel input rather thanusing a relation to broadcast the input to multiple instances of the channel.
84 Ptolemaeus, System Design

2. BUILDING GRAPHICAL MODELS
This is accomplished using a combination of the Repeat actor (found in theFlowControl→SequenceControl sublibrary) and the SequenceToArray actor(see box on page 86). The Repeat actor has a parameter, numberOfTimes, which inFigure 2.42 is set equal to the diversity parameter. The SequenceToArray actor hasa parameter arrayLength that has also been set to be equal to diversity (this param-eter can also be set via the arrayLength port, which is filled in gray to indicate thatit is both a parameter and a port). The output is sent to an ArrayAverage actor (seebox on page 88).
The execution of the model in Figure 2.42 is similar to that of the earlier version,except that the scale of the output is different, reflecting the fact that the output isan average rather than a sum.
The IterateOverArray actor simply executes whatever actor it contains repeatedly on eachelement of an input array. The actor that it contains can be, as shown in Figure 2.42,an opaque composite actor. Interestingly, however, it can also be an atomic actor. To
Figure 2.42: The IterateOverArray actor can be used to accomplish the samediversity channel model as in Figure 2.40, but without creating multiple instancesof the channel model. This approach is possible because the channel model hasno state. [online]
Ptolemaeus, System Design 85

2.7. HIGHER-ORDER COMPONENTS
use an atomic actor with IterateOverArray, simply drag and drop the atomic actor ontoan instance of IterateOverArray. It will then execute that atomic actor on each elementof the input array, and produce as output the array of the results. This mechanism isillustrated in Figure 2.43. When an actor is dragged from the library and moved overthe IterateOverArray actor, the icon acquires a white halo. The halo indicates that if theactor is dropped, it will be dropped into the actor under the cursor, rather than onto themodel containing that actor. The actor you drop onto the IterateOverArray will becomethe actor that is executed for each element of the input array. In order for this to work withthe Channel actor we defined above, however, we need to convert the Channel actor intoan opaque actor by inserting a director, because IterateOverArray can only apply opaqueactors to array elements.
2.7.3 Lifecycle Management Actors
A few actors in HigherOrderActors invoke the execution of a full Ptolemy II model.These actors generally associate ports (created by the user or actor) with parameters of themodel. They can be used, for example, to create models that repeatedly run other mod-
Sidebar: Array Construction and Deconstruction Actors
The following actors construct and take apart arrays:
• ArrayToElements outputs the elements of an array on channels of the output port.• ElementsToArray constructs an array from elements on channels of the input port.• ArrayToSequence outputs the elements of an array sequentially on the output port.• SequenceToArray constructs an array from a sequence of elements on the input port.• StringToUnsignedByteArray constructs an array from a string.• UnsignedByteArrayToString constructs a string from an array.• ArrayToMatrix constructs a matrix from an array.• MatrixToArray constructs an array from a matrix.In addition, many polymorphic actors, such as AddSubtract, also operate on arrays.
86 Ptolemaeus, System Design

2. BUILDING GRAPHICAL MODELS
Figure 2.43: The IterateOverArray actor supports dropping an actor onto it. Ittransforms to mimic the icon of the actor you dropped onto it, as shown. Here weare using the Channel class, saved to the UserLibrary as shown in Figure 2.39.
els with varying parameter values. These include RunCompositeActor, which executesthe model that it contains. The ModelReference actor executes a model that is definedelsewhere in its own file or URL. The VisualModelReference actor opens a Vergil viewof a model when it executes that model. Additional details can be found in the actordocumentation and in the Vergil tour demonstrations.
2.8 Summary
This chapter has introduced Vergil, the visual interface to Ptolemy II, which supportsgraphical construction of models. Along the way, this chapter has introduced a numberof capabilities of the underlying Ptolemy II system. Subsequent chapters will focus onproperties of the various directors that are available. The appendices then focus on genericarchitecture and capabilities that span models of computation.
Ptolemaeus, System Design 87

2.8. SUMMARY
Sidebar: Array Manipulation Actors
The following actors operate on arrays:
• ArrayAccumulate appends input arrays, growing the output array.• ArrayAppend appends input arrays provided on channels of a multiport.• ArrayAverage averages the elements of an array.• ArrayContains determines whether an array contains a specified element.• ArrayElement extracts an element from an array.• ArrayElementAsMatrix extracts an element using matrix-like indexing.• ArrayExtract extracts a subarray.• ArrayLength outputs the length of the input array.• ArrayLevelCrossing finds an element that crosses a threshold.• ArrayMaximum finds the largest element of an array.• ArrayMinimum finds the smallest element of an array.• ArrayPeakSearch finds peak values in an array.• ArrayRemoveElement removes instances of a specified element.• ArraySort sorts an array.• ArraySum sums the elements of an array.• ArrayUpdate outputs a new array like the input array, but with an element replaced.In addition, many polymorphic actors, such as AddSubtract, also operate on arrays.
88 Ptolemaeus, System Design

2. BUILDING GRAPHICAL MODELS
Sidebar: Mobile Code
A pair of actors in Ptolemy II support mobile models, where the data sent from oneactor to another is a model to be executed rather than data on which a model operates.The ApplyFunction actor accepts a function in the expression language (see Chapter13) at one input port and applies that function to data that arrives at other input ports(which you must create). The MobileModel actor accepts a MoML description of aPtolemy II model at an input port and then executes that model, streaming data from theother input port through it.
A use of the ApplyFunction actor is shown in Figure 2.44. In that model, two func-tions are provided to the ApplyFunction in an alternating fashion, one that computes x2
and the other that computes 2x. These two functions are provided by two instances ofthe Const actor, found in the Sources→GenericSources sublibrary. The functionsare interleaved by the Commutator actor, from the FlowControl→Aggregators sub-library.
Ptolemaeus, System Design 89

2.8. SUMMARY
0.0
0.2
0.4
0.6
0.8
1.0x10³
0 1 2 3 4 5 6 7 8 9 10
x^2 and 2^x, alternating
Figure 2.44: The ApplyFunction actor accepts a function definition at one portand applies it to data that arrives at the other port. [online]
90 Ptolemaeus, System Design
Related Documents


