Indonesia Infrastructure: Buy cement, transport Building blocks in place: positioning for multi-year growth in infra spending Robust macro story, coupled with fiscal budget deployment, to propel infrastructure spending and unlock pent-up growth. Government targeting to pass land acquisition law by 3Q11, enhancing investor-friendly stance. Positive leading indicators, with demand for cement and bulk cement up sharply in 1Q11. Supportive macro news and possibility of credit rating upgrade. Initiating on six toll road operators and cement, steel and construction companies. Forecasting 3-yr EBITDA CAGR of 16%. Key analysis in this anchor report includes: • Cement benefits most through multiplier effect. Bullish on toll roads, with new land law clearing way for development. Neutral on steel and construction on rising commodity prices and import competition. • BUY Semen Gresik (SMGR IJ - cement), Jasa Marga (JSMR IJ - transport) and Semen Cibinong (SMCB IJ - cement). NEUTRAL on Indocement (INTP IJ - cement), Krakatau Steel (KRAS IJ - steel) and Wijaya Karya (WIKA IJ - construction). EQUITY RESEARCH ANCHOR REPORT See Appendix A-1 for analyst certification and important disclosures. Analysts employed by non-US affiliates are not registered or qualified as research analysts with FINRA in the US. May 2, 2011 Research analysts Indonesia Basic Materials Wilianto Ie - PTNI [email protected] +62 21 2991 3341 Andy Lesmana - PTNI [email protected] +62 21 2991 3344

Welcome message from author
This document is posted to help you gain knowledge. Please leave a comment to let me know what you think about it! Share it to your friends and learn new things together.
Transcript
Indonesia Infrastructure: Buy cement, transport
Building blocks in place: positioning for multi-year growth in infra spending
Robust macro story, coupled with fiscal budget deployment, to propel infrastructure spending and unlock pent-up growth.
Government targeting to pass land acquisition law by 3Q11, enhancing investor-friendly stance. Positive leading indicators, with demand for cement and bulk cement up sharply in 1Q11.
Supportive macro news and possibility of credit rating upgrade.
Initiating on six toll road operators and cement, steel and construction companies. Forecasting 3-yr EBITDA CAGR of 16%.
Key analysis in this anchor report includes:
• Cement benefits most through multiplier effect. Bullish on toll roads, with new land law clearing way for development. Neutral on steel and construction on rising commodity prices and import competition.
• BUY Semen Gresik (SMGR IJ - cement), Jasa Marga (JSMR IJ - transport) and Semen Cibinong (SMCB IJ - cement). NEUTRAL on Indocement (INTP IJ - cement), Krakatau Steel (KRAS IJ - steel) and Wijaya Karya (WIKA IJ - construction).
EQUITY RESEARCH
AN
CH
OR
RE
PO
RT
See Appendix A-1 for analyst certification and important disclosures. Analysts employed by non-US affiliates are not registered or qualified as research analysts with FINRA in the US.
May 2, 2011
Research analysts
Indonesia Basic Materials
Wilianto Ie - PTNI [email protected] +62 21 2991 3341
Andy Lesmana - PTNI [email protected] +62 21 2991 3344

Rating: See report end for details of Nomura’s rating system.
Indonesia Infrastructure
Basic Materials
EQUITY RESEARCH
Buy cement, transport
Building blocks in place: positioning for multi-year growth in infra spending
May 2, 2011
Action: Bullish on Indonesia infrastructure sector Indonesia's infrastructure development looks set to accelerate as the government gears up spending (the Ministry of Public Works budget is up 60% y-y and capital spending is up 43% y-y in 2011) and policies remain favourable for investors (eg, land acquisition bill and funding support). Leading indicators confirm a pickup in infra spending, with demand up 8% y-y for cement and 23% y-y for bulk cement in 1Q11.
Catalysts: Legislation of land law and macro-related newsflow Issue of the much-expected land acquisition law will be key to driving the infrastructure sector, in our view. Government and parliament target to pass the bill by 3Q11. Meanwhile, positive newsflow on the country's macroeconomy, including a possible credit rating upgrade to investment grade, should help to fuel further interest in the sector.
Sectors favoured: cement and transport We initiate coverage of the sector with Semen Gresik (largest cement player, with 20% y-y capacity expansion in 2012) and Jasa Marga (main toll road company, key beneficiary of land acquisition law) as our top picks. We also like Holcim (third-largest cement player, strong in bulk cement) and are NEUTRAL on Indocement (cement), Krakatau Steel (steel) and Wijaya Karya (construction).
Valuation We forecast three-year revenue and EBITDA CAGRs of 16% to 2013, driven by volume expansion. We value the infrastructure-related stocks using DCF methodology to capture three-year growth prospects.
Risks Higher production costs as a result of rising prices of commodities (iron ore, steel) and energy (mainly coal) are a key risk to the sector. The political environment, fiscal position, and external factors affecting the macro environment are also risks to the general sector.
Fig. 1: Summary of recommendations and valuations
Source: Nomura estimates
Anchor themes
Indonesia's economy looks set to take on a new growth trajectory. The robust macro story, coupled with fiscal budget deployment, should help propel investment spending in infrastructure, further unlocking growth potential.
Nomura vs consensus
Nomura's earnings forecasts for the aggregate sector are on average below consensus by 3-6% on EBITDA and 7% on net earnings.
Research analysts
Indonesia Basic Materials
Wilianto Ie - PTNI [email protected] +62 21 2991 3341
Andy Lesmana - PTNI [email protected] +62 21 2991 3344
Tgt Price % up /
Stocks Rec. (Rp/shr) downside PE 11F PE 12F EV / EBITDA 11F EV / EBITDA 12F
Gresik (SMGR IJ) Buy 11,700 23.8% 14.5 12.8 9.9 7.8
Holcim (SMCB IJ) Buy 2,700 18.7% 18 16.6 8 7.5
Indocement (INTP IJ) Neutral 17,200 0.6% 18 17.5 11.1 10.3
Jasa Marga (JSMR IJ) Buy 4,100 24.2% 11.5 9.2 10.7 9.9
Krakatau (KRAS IJ) Neutral 1,340 14.5% 12.6 9.5 9.5 7.6
Wijaya (WIKA IJ) Neutral 780 14.7% 11.7 11.8 5.2 5
Valuation at target price
See Appendix A-1 for analyst certification and important disclosures. Analysts employed by non US affiliates are not registered or qualified as research analysts with FINRA in the US.

Nomura | AEJ Indonesia Infrastructure May 2, 2011
2
Contents
3 Bullish on Indonesia infrastructure sector
4 Companies in brief
4 Why now?
5 Robust macroeconomic story
8 Nomura’s view on Indonesia’s macro outlook
9 Increasing government spending raises prospect of more infrastructure spending realisation
11 Investor-friendly regulatory framework
13 Risks
14 Cement: Bullish
14 Action: BUY Gresik and Holcim; NEUTRAL on Indocement
20 Company comparison
21 Transport: Bullish
21 Action: BUY Jasa Marga
23 Steel and construction: Neutral
26 Steel industry outlook
30 Semen Gresik
39 Indocement Tunggal Perkasa
47 Holcim Indonesia
55 Jasa Marga
63 Krakatau Steel
71 Wijaya Karya
78 Appendix A-1
Nomura | AEJ Indonesia Infrastructure May 2, 2011
3
Bullish on Indonesia infrastructure sector The robust macro outlook, increasing government spending and investor-friendly policies stand to boost infrastructure-related investment spending.
We initiate coverage of the Indonesian infrastructure sector with a Bullish view. Our view is primarily driven by the government’s strong push for infrastructure spending, and Indonesia’s conducive macroeconomic environment which we believe will help investment and infrastructure projects to take off. Toll road operators and cement, steel and construction companies are likely to be the key beneficiaries of the increase in infrastructure spending. We expect these companies to see business volume and profitability expand on average at a CAGR of 16% over the next three years. However, we expect rising production costs as a result of increasing commodity prices to remain as key business risks. We recommend BUY ratings for Semen Gresik (cement), Jasa Marga (transport) and Holcim (cement). We are NEUTRAL on Indocement (cement), Krakatau Steel (steel) and Wijaya Karya (construction).
We are generally Bullish on the cement sector, which we believe will be the key beneficiary of infrastructure development. In our view, the infrastructure spending will not only drive demand, but will also have a multiplier effect on the economy. Armed with strong cashflows, the companies in the sector also offer attractive dividend yields.
We are Bullish on the transport (toll road) sector, as we believe the new land acquisition law will help to remove key bottlenecks and thus accelerate development of toll roads, allowing inter-toll road connectivity and higher traffic volumes.
We are Neutral on the steel and construction sectors, despite the potential for rising steel demand as a result of infra development and climbing steel prices. Rising commodity prices, particularly iron ore, and import competition are key concerns. Specific to Krakatau Steel, we like the growth profile that new capacity expansion brings and potential margins improvement resulting from raw material and operating cost efficiency, but would rather wait until near realisation and execution risks abate.
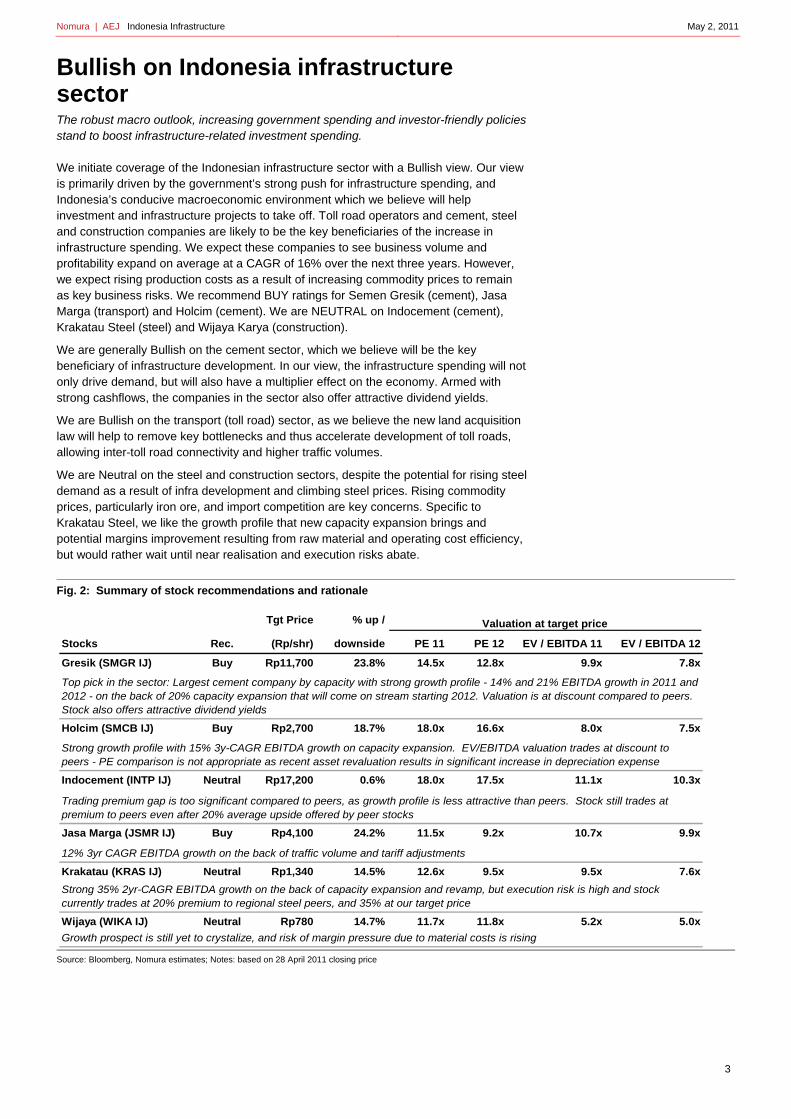
Fig. 2: Summary of stock recommendations and rationale
Source: Bloomberg, Nomura estimates; Notes: based on 28 April 2011 closing price
Tgt Price % up /
Stocks Rec. (Rp/shr) downside PE 11 PE 12 EV / EBITDA 11 EV / EBITDA 12
Gresik (SMGR IJ) Buy Rp11,700 23.8% 14.5x 12.8x 9.9x 7.8x
Holcim (SMCB IJ) Buy Rp2,700 18.7% 18.0x 16.6x 8.0x 7.5x
Indocement (INTP IJ) Neutral Rp17,200 0.6% 18.0x 17.5x 11.1x 10.3x
Jasa Marga (JSMR IJ) Buy Rp4,100 24.2% 11.5x 9.2x 10.7x 9.9x
Krakatau (KRAS IJ) Neutral Rp1,340 14.5% 12.6x 9.5x 9.5x 7.6x
Wijaya (WIKA IJ) Neutral Rp780 14.7% 11.7x 11.8x 5.2x 5.0x
Valuation at target price
Top pick in the sector: Largest cement company by capacity with strong growth profile - 14% and 21% EBITDA growth in 2011 and 2012 - on the back of 20% capacity expansion that will come on stream starting 2012. Valuation is at discount compared to peers. Stock also offers attractive dividend yields
Strong growth profile with 15% 3y-CAGR EBITDA growth on capacity expansion. EV/EBITDA valuation trades at discount to peers - PE comparison is not appropriate as recent asset revaluation results in significant increase in depreciation expense
Growth prospect is still yet to crystalize, and risk of margin pressure due to material costs is rising
Trading premium gap is too significant compared to peers, as growth profile is less attractive than peers. Stock still trades at premium to peers even after 20% average upside offered by peer stocks
12% 3yr CAGR EBITDA growth on the back of traffic volume and tariff adjustments
Strong 35% 2yr-CAGR EBITDA growth on the back of capacity expansion and revamp, but execution risk is high and stock currently trades at 20% premium to regional steel peers, and 35% at our target price
Nomura | AEJ Indonesia Infrastructure May 2, 2011
4
Companies in brief
Semen Gresik (SMGR IJ, BUY) We believe Semen Gresik has the best market exposure across Indonesia, attributable to its spread of production capacity (West Sumatra, East Java and Sulawesi). As the largest cement producer in Indonesia, with 20mn tonnes capacity, Gresik has been losing market share over the past few years due to capacity constraints. However, with its planned new capacity, Gresik should start to regain market share.
Holcim Indonesia (SMCB IJ, BUY) Holcim Indonesia has a strong position in the bulk cement market, which we see as the key demand driver when infrastructure projects kick in. Holcim has a total domestic capacity of 8.7mn tonnes, of which only 62% is allocated for the domestic market (higher prices, higher profits), leaving enough capacity to fill in/benefit from strong growth in infrastructure demand (exports have lower prices and lower profitability).
Indocement (INTP IJ, NEUTRAL) Similar to Gresik, Indocement also has nationwide exposure in the areas of potential growth, and the company will also undertake capacity expansion in the next 2-3 years. However, the magnitude of the planned expansion is less than that at Gresik and Holcim, making its growth profile less attractive compared to its peers, while valuation remains rich. Thus, we initiate coverage with a NEUTRAL position on the stock.
Jasa Marga (JSMR IJ, BUY) Jasa Marga is the main toll road operator in Indonesia, operating more than 70% of the toll roads (by length) and more than 80% of the toll road traffic (source: Jasa Marga). We believe it will be the main beneficiary of the upcoming new land acquisition law, which should help to accelerate ongoing toll road development, increase toll road connectivity and hence boost traffic volumes.
Krakatau Steel (KRAS IJ, NEUTRAL) Krakatau Steel is the largest integrated steel producer in Indonesia, and the company is revamping and expanding its production capacity. It plans to increase its production capacity from 2.8mn tpa currently to 4.25mn tpa by 2014. The company is adding blasting furnace production capacity that is more cost efficient than the current production facility (EAF-based) and this should help to reduce production costs by 5%.
Additional production capacity of 3mn tpa is also being developed under a joint venture with POSCO, whereby Krakatau will eventually have 45% equity interest. We expect the government to grant tax incentives in the form of a tax holiday and Krakatau to record Rp1.5tn of extraordinary gains from land sales to the JV.
Wijaya Karya (WIKA IJ, NEUTRAL) With market cap of less than US$500mn, Wijaya Karya is the largest and most liquid construction company listed on the Indonesia Stock Exchange. We expect the company to benefit from rising construction spending, particularly from construction spending promoted by the government.
Why now?
Admittedly, progress on infrastructure development in Indonesia has lagged expectations since the government launched the infrastructure development programme in 2005. Up until now, we believe it has relied heavily on private funding and has lacked the necessary regulatory framework required to attract investor interest and raise the feasibility of infrastructure projects. The country has also suffered from a number of external factors (2004 tsunami, 2005 fuel crisis and 2008 global credit crunch).
Notwithstanding, Indonesia has seen some minor progress in infrastructure development, adding some 135km of toll road length since 2005.
Moreover, we believe conditions have changed since 2005:

Nomura | AEJ Indonesia Infrastructure May 2, 2011
5
• Significantly improved macro story: economic growth has accelerated from 5.5% in 2005 to 6% in 2010; the credit rating has improved three notches from B+ in 2005 to BB+ in 2010 (S&P); and the long-term US-dollar government bond yield has declined from an average 12.5% in 2005 to a range of 7.5-8% in 2011.
• Stronger fiscal position: the revenue budget has more than doubled from Rp495tn or US$50bn in 2005 to Rp1,100tn or US$120bn in 2011, allowing the government to increase fund allocation for infrastructure spending.
• Sufficient regulatory framework in place: the regulatory framework now includes a bill on toll tariff increases and the establishment of a toll road authority.
In addition, government efforts to encourage state-owned companies to take part in driving infrastructure spending have been well received.
The incentives driving government efforts to boost infrastructure development are strong:
• Infrastructure development is a key ingredient for Indonesia to achieve its target 7% annual economic growth by 2014, when the next elections take place.
• Indonesia will host the Asia Pacific Economic Conference in Bali in 2013.
• Indonesia will host the SEA Games in Palembang, South Sumatera in 4Q11.
Fig. 3: Infrastructure progress despite challenges Some 135km of toll roads have been added since 2005
Source: Jasa Marga
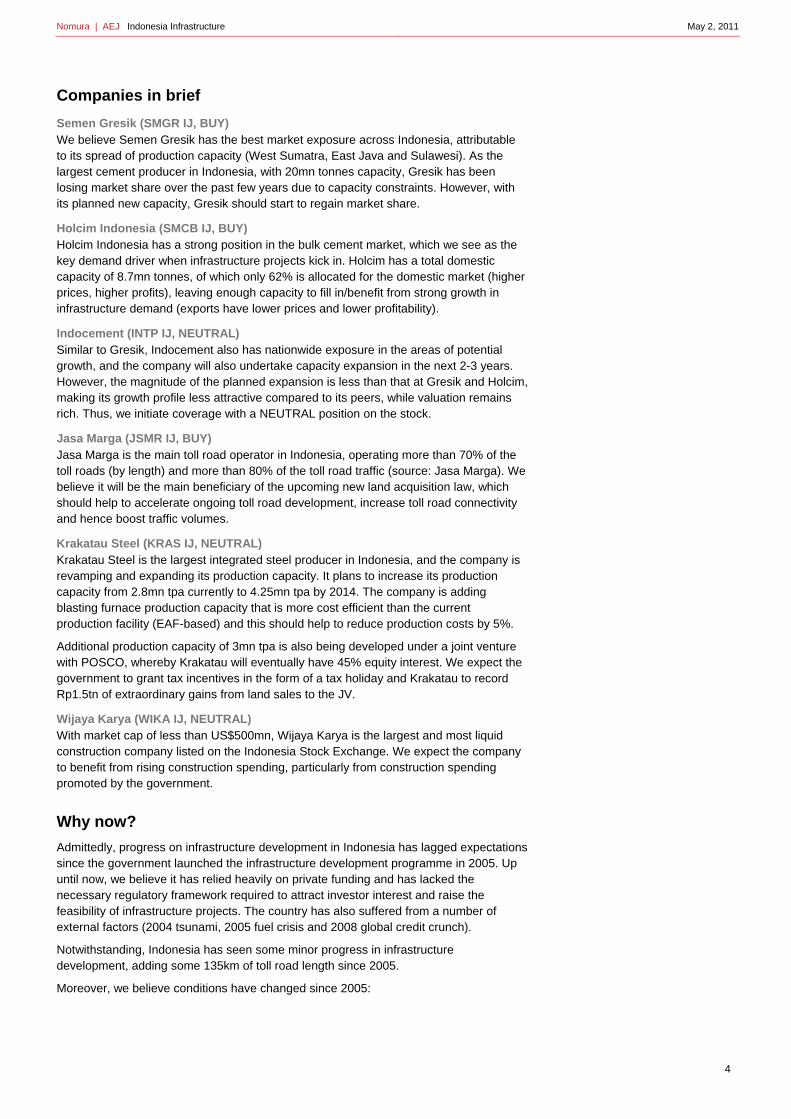
Robust macroeconomic story
Central to our thesis of accelerating infrastructure spending is continued robust macroeconomic conditions in Indonesia. Economic growth has steadily picked up from an average of 5% pa in the first half of past decade to 6% in the past five years to 2010, and we expect the momentum to continue this year with the possibility of breaking the 7% mark. Subdued inflation, supported by stable and improving exchange rates, has resulted in a low interest rate environment.
400
500
600
700
800
1990
1991
1992
1993
1994
1995
1996
1997
1998
1999
2000
2001
2002
2003
2004
2005
2006
2007
2008
2009
2010
(km)
Nomura | AEJ Indonesia Infrastructure May 2, 2011
6
Fig. 4: Economic growth steadily improving... Growth rate has picked up from 5% to the 6% range
Source: Bloomberg
Fig. 5: …supported by subdued inflation and forex rates Low interest rate environment on subdued inflation and improving exchange rates
Source: Bloomberg
One notch to investment-grade credit rating Indonesia has been rewarded for its economic progress with continued improvement in its credit rating. S&P was the last rating agency to upgrade Indonesia to BB+, leaving Indonesia with just one notch to climb to achieve an investment-grade rating from all three major rating agencies (S&P, Moody's and Fitch).
The implications of such an upgrade, in our view, would be significant. Although many had expected this to be long due for Indonesia, we believe the potential snowball effect from an investment-grade rating remains underestimated. Not only would it potentially help to further reduce Indonesia's credit and funding costs (and hence raise the commercial feasibility of infrastructure investments), but more importantly, we believe it would lift investment confidence in the country.
Fig. 6: Improving credit rating Just one notch away from an investment-grade rating
Source: Bloomberg
Note: S&P ratings: 25=AAA; 24=AA+; 23=AA; 22=AA-; 21=A+; 20=A; 19=A-; 18=BBB+; 17=BBB; 16=BBB-; 15=BB+;14=BB;13=BB-'12=B+;11=B;10=B-;9=CCC+;8=CCC;7=CCC-;6=CC+;5=CC;4=CC-;3=C+;2=C;1=C-;0=SD Moody's ratings: 25=Aaa; 24=Aa1; 23=Aa2; 22=Aa3; 21=A1; 20=A2; 19=A3; 18=Baa1; 17=Baa2; 16=Baa3; 15=Ba1; 14=Ba2; 13=Ba3; 12=B1; 11=B2; 10=B3; 9=Caa1;8=Caa2;7=Caa3;6=Ca1;5=Ca2;4=Ca3;3=C1;2=C2;1=C3; Fitch ratings: 25=AAA; 24=AA+; 23=AA; 22=AA-; 21=A+; 20=A; 19=A-; 18=BBB+; 17=BBB; 16=BBB-; 15=BB+; 14=BB; 13=BB-; 12=B+; 11=B; 10=B-; 9=CCC+; 8=CCC; 7=CCC-; 6=CC+; 5=CC; 4=CC-; 3=C+; 2=C; 1=C-;
Rising direct investment creating potential infrastructure demand Direct investment spending in Indonesia, both by domestic and foreign investors, has risen over the past five years, and we expect it to continue to grow. We believe that some of the major multi-national names investing and expanding capacity in Indonesia include PNG, Merk, POSCO and several automakers. We believe that Indonesia’s
0
1
2
3
4
5
6
7
820
00
2001
2002
2003
2004
2005
2006
2007
2008
2009
2010
2011
F
2012
F
0
2,000
4,000
6,000
8,000
10,000
12,000
0
2
4
6
8
10
12
14
16
18
2000
2001
2002
2003
2004
2005
2006
2007
2008
2009
2010
2011
F
2012
F
Inflation (% - LHS)Exchange rates (Rp/USD - RHS)
02468
10121416182022
Dec
-92
Dec
-93
Dec
-94
Dec
-95
Dec
-96
Dec
-97
Dec
-98
Dec
-99
Dec
-00
Dec
-01
Dec
-02
Dec
-03
Dec
-04
Dec
-05
Dec
-06
Dec
-07
Dec
-08
Dec
-09
Dec
-10
S&P
Moodys
Fitch
Investment grade
Nomura | AEJ Indonesia Infrastructure May 2, 2011
7
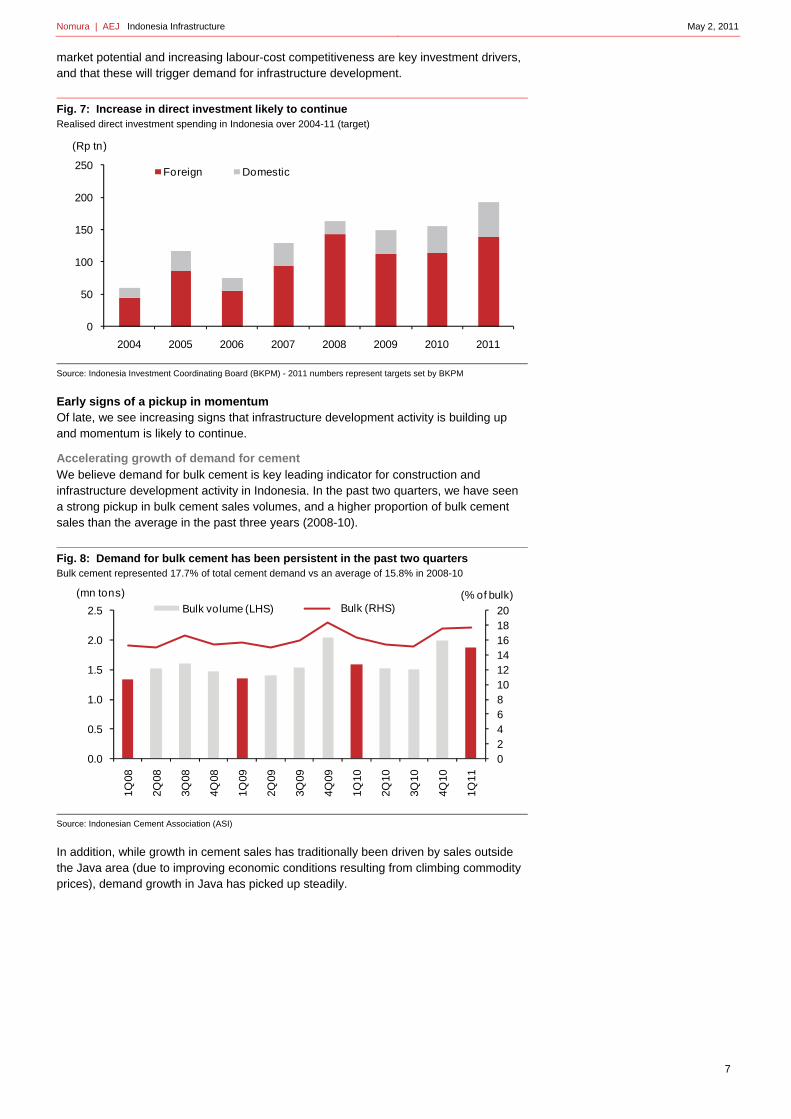
market potential and increasing labour-cost competitiveness are key investment drivers, and that these will trigger demand for infrastructure development.
Fig. 7: Increase in direct investment likely to continue Realised direct investment spending in Indonesia over 2004-11 (target)
Source: Indonesia Investment Coordinating Board (BKPM) - 2011 numbers represent targets set by BKPM
Early signs of a pickup in momentum Of late, we see increasing signs that infrastructure development activity is building up and momentum is likely to continue.
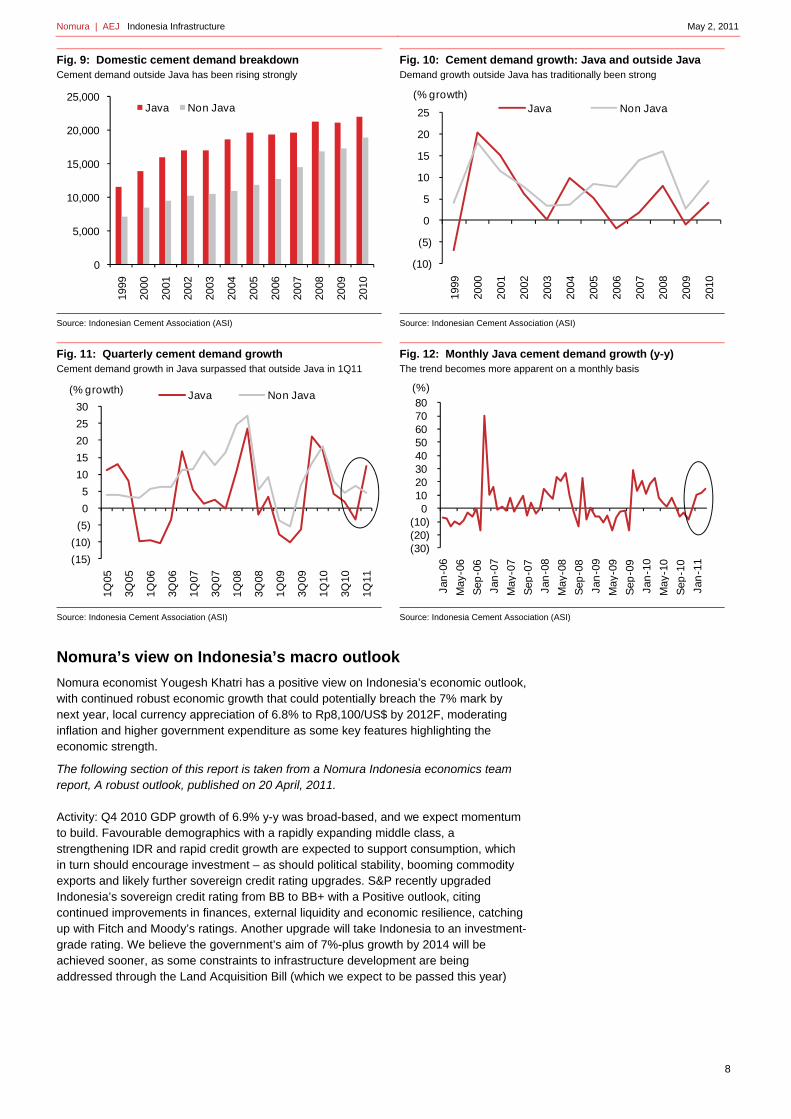
Accelerating growth of demand for cement We believe demand for bulk cement is key leading indicator for construction and infrastructure development activity in Indonesia. In the past two quarters, we have seen a strong pickup in bulk cement sales volumes, and a higher proportion of bulk cement sales than the average in the past three years (2008-10).
Fig. 8: Demand for bulk cement has been persistent in the past two quarters Bulk cement represented 17.7% of total cement demand vs an average of 15.8% in 2008-10
Source: Indonesian Cement Association (ASI)
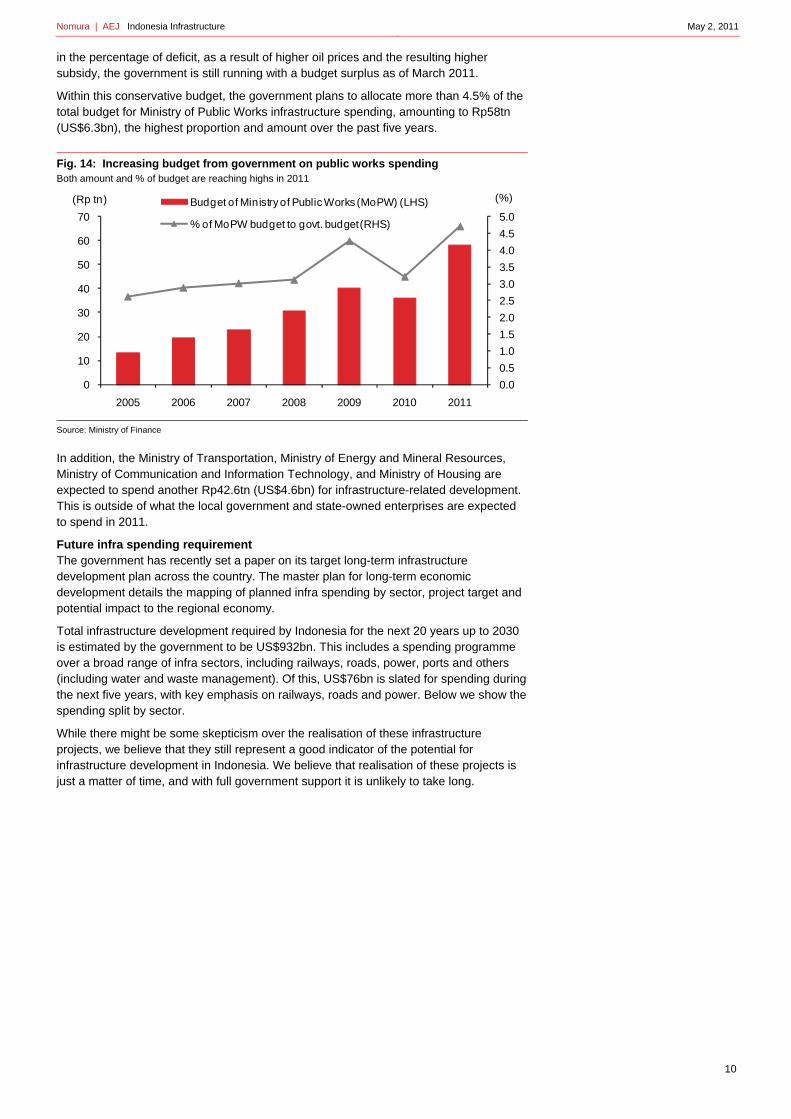
In addition, while growth in cement sales has traditionally been driven by sales outside the Java area (due to improving economic conditions resulting from climbing commodity prices), demand growth in Java has picked up steadily.
0
50
100
150
200
250
2004 2005 2006 2007 2008 2009 2010 2011
(Rp tn)
Foreign Domestic
02468101214161820
0.0
0.5
1.0
1.5
2.0
2.5
1Q08
2Q08
3Q08
4Q08
1Q09
2Q09
3Q09
4Q09
1Q10
2Q10
3Q10
4Q10
1Q11
(% of bulk)(mn tons)
Bulk volume (LHS) Series2Bulk (RHS)
Nomura | AEJ Indonesia Infrastructure May 2, 2011
8
Fig. 9: Domestic cement demand breakdown Cement demand outside Java has been rising strongly
Source: Indonesian Cement Association (ASI)
Fig. 10: Cement demand growth: Java and outside Java Demand growth outside Java has traditionally been strong
Source: Indonesian Cement Association (ASI)
Fig. 11: Quarterly cement demand growth Cement demand growth in Java surpassed that outside Java in 1Q11
Source: Indonesia Cement Association (ASI)
Fig. 12: Monthly Java cement demand growth (y-y) The trend becomes more apparent on a monthly basis
Source: Indonesia Cement Association (ASI)
Nomura’s view on Indonesia’s macro outlook
Nomura economist Yougesh Khatri has a positive view on Indonesia’s economic outlook, with continued robust economic growth that could potentially breach the 7% mark by next year, local currency appreciation of 6.8% to Rp8,100/US$ by 2012F, moderating inflation and higher government expenditure as some key features highlighting the economic strength.
The following section of this report is taken from a Nomura Indonesia economics team report, A robust outlook, published on 20 April, 2011.
Activity: Q4 2010 GDP growth of 6.9% y-y was broad-based, and we expect momentum to build. Favourable demographics with a rapidly expanding middle class, a strengthening IDR and rapid credit growth are expected to support consumption, which in turn should encourage investment – as should political stability, booming commodity exports and likely further sovereign credit rating upgrades. S&P recently upgraded Indonesia’s sovereign credit rating from BB to BB+ with a Positive outlook, citing continued improvements in finances, external liquidity and economic resilience, catching up with Fitch and Moody’s ratings. Another upgrade will take Indonesia to an investment-grade rating. We believe the government’s aim of 7%-plus growth by 2014 will be achieved sooner, as some constraints to infrastructure development are being addressed through the Land Acquisition Bill (which we expect to be passed this year)
0
5,000
10,000
15,000
20,000
25,000
1999
2000
2001
2002
2003
2004
2005
2006
2007
2008
2009
2010
Java Non Java
(10)
(5)
0
5
10
15
20
25
1999
2000
2001
2002
2003
2004
2005
2006
2007
2008
2009
2010
Java Non Java(% growth)
(15)
(10)
(5)
0
5
10
15
20
25
30
1Q05
3Q05
1Q06
3Q06
1Q07
3Q07
1Q08
3Q08
1Q09
3Q09
1Q10
3Q10
1Q11
Java Non Java(% growth)
(30)(20)(10)
0 10 20 30 40 50 60 70 80
Jan
-06
May
-06
Sep
-06
Jan
-07
May
-07
Se p
-07
Jan
-08
May
-08
Sep
-08
Jan
-09
May
-09
Se p
-09
Jan
-10
May
-10
Sep
-10
Jan
-11
(%)

Nomura | AEJ Indonesia Infrastructure May 2, 2011
9
and a planned step-up in public infrastructure investment. Stronger import growth and higher “income” outflows are expected to eventually lead to a current account deficit.
Inflation and monetary policy: Lower food prices brought down headline CPI inflation further in March to 6.7% y-y, from 6.8% y-y. Government deferral of the fuel subsidy measure pushes out the associated inflation impact. Bank Indonesia (BI) remained on hold in April as expected, but its policy statement remained hawkish – reaffirming the tightening bias and highlighting inflationary pressures from commodity prices and domestic demand. The IDR gains were flagged as part of BI’s policy to curb imported inflation. We expect one 25bp hike in each quarter this year, taking the policy rate to 7.50% by year-end. The path will depend critically on inflation and external developments. We also believe another reserve requirement rise on IDR deposits is possible (a second RR hike on FX deposits from 5% to 8% is scheduled for June). We expect capital inflows to trigger further non-market-based measures, such as the recently announced extension of the one-month holding period on SBI to six months, effective 13 May.
Fiscal policy: There is likely to be a fiscal tailwind this year with increases in infrastructure spending – the 2011 deficit target is 1.8% of GDP versus the 2010 outturn of 0.6% of GDP – together with government plans to raise expenditure realisation rates. The deferral of the plan to ban private cars from buying subsidised fuel from mid-2011 will add to already rising fuel-subsidy costs. The Ministry of Finance will likely propose a revised budget in mid-2011 with new macro assumptions including for oil prices (currently USD80/bbl) and the exchange rate.
Risks: Renewed global financial turmoil is a key external risk. Progress with infrastructure development and budgeted expenditure disbursements are key upside/downside risks to the outlook. International oil prices sustained at current or higher levels could trigger further administered fuel price increases and a stepped increase in inflation. The problems in Japan may affect Indonesia via trade, portfolio/direct investment flows, tourism and development aid.
Fig. 13: Summary of Indonesia key macroeconomic data and forecasts
Source: Nomura estimates
Increasing government spending raises prospect of more infrastructure spending realisation
We also believe that the infrastructure sector will benefit from higher government spending on infrastructure development. A strong fiscal position would allow the central government to budget more for infrastructure.
Indonesia’s current outstanding public debt sits at only 20% to GDP, and despite higher budget allocation for infrastructure spending, the current year estimates are running at a conservative budget deficit of 1.8% to GDP. Although the market already expects a rise
Nomura | AEJ Indonesia Infrastructure May 2, 2011
10
in the percentage of deficit, as a result of higher oil prices and the resulting higher subsidy, the government is still running with a budget surplus as of March 2011.
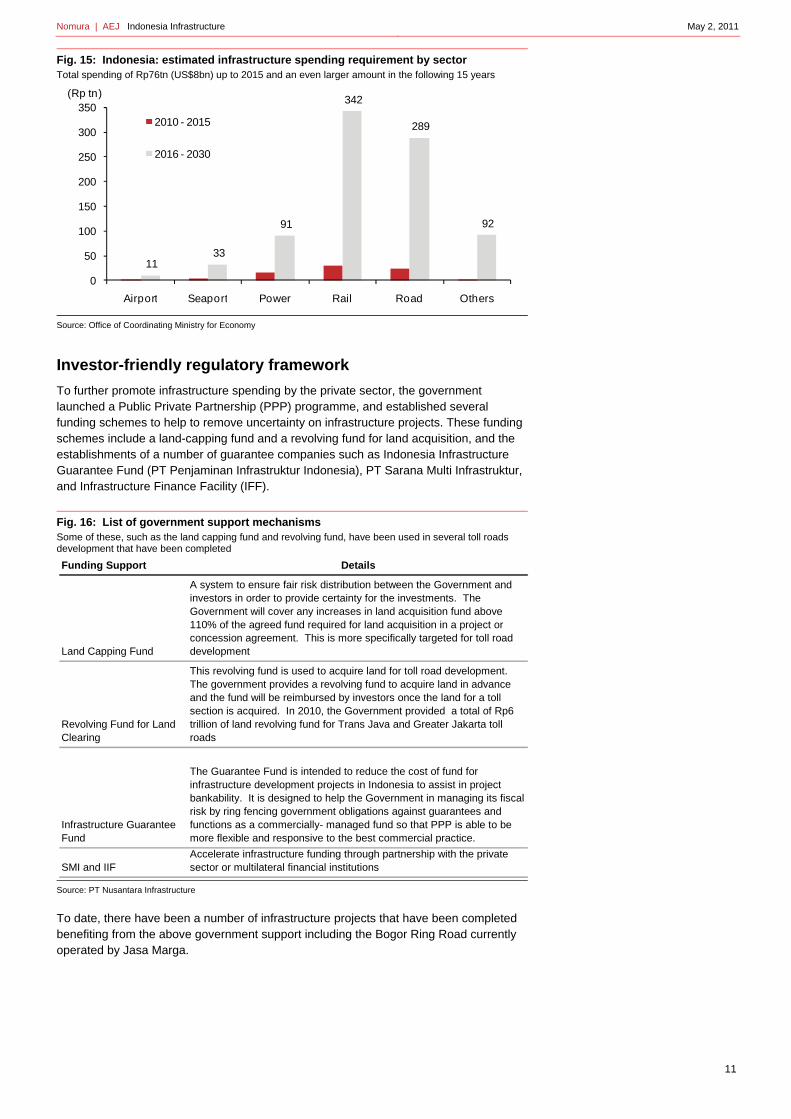
Within this conservative budget, the government plans to allocate more than 4.5% of the total budget for Ministry of Public Works infrastructure spending, amounting to Rp58tn (US$6.3bn), the highest proportion and amount over the past five years.
Fig. 14: Increasing budget from government on public works spending Both amount and % of budget are reaching highs in 2011
Source: Ministry of Finance
In addition, the Ministry of Transportation, Ministry of Energy and Mineral Resources, Ministry of Communication and Information Technology, and Ministry of Housing are expected to spend another Rp42.6tn (US$4.6bn) for infrastructure-related development. This is outside of what the local government and state-owned enterprises are expected to spend in 2011.
Future infra spending requirement The government has recently set a paper on its target long-term infrastructure development plan across the country. The master plan for long-term economic development details the mapping of planned infra spending by sector, project target and potential impact to the regional economy.
Total infrastructure development required by Indonesia for the next 20 years up to 2030 is estimated by the government to be US$932bn. This includes a spending programme over a broad range of infra sectors, including railways, roads, power, ports and others (including water and waste management). Of this, US$76bn is slated for spending during the next five years, with key emphasis on railways, roads and power. Below we show the spending split by sector.
While there might be some skepticism over the realisation of these infrastructure projects, we believe that they still represent a good indicator of the potential for infrastructure development in Indonesia. We believe that realisation of these projects is just a matter of time, and with full government support it is unlikely to take long.
0.0
0.5
1.0
1.5
2.0
2.5
3.0
3.5
4.0
4.5
5.0
0
10
20
30
40
50
60
70
2005 2006 2007 2008 2009 2010 2011
Budget of Ministry of Public Works (MoPW) (LHS)
% of MoPW budget to govt. budget (RHS)
(Rp tn) (%)
Nomura | AEJ Indonesia Infrastructure May 2, 2011
11
Fig. 15: Indonesia: estimated infrastructure spending requirement by sector Total spending of Rp76tn (US$8bn) up to 2015 and an even larger amount in the following 15 years
Source: Office of Coordinating Ministry for Economy
Investor-friendly regulatory framework
To further promote infrastructure spending by the private sector, the government launched a Public Private Partnership (PPP) programme, and established several funding schemes to help to remove uncertainty on infrastructure projects. These funding schemes include a land-capping fund and a revolving fund for land acquisition, and the establishments of a number of guarantee companies such as Indonesia Infrastructure Guarantee Fund (PT Penjaminan Infrastruktur Indonesia), PT Sarana Multi Infrastruktur, and Infrastructure Finance Facility (IFF).
Fig. 16: List of government support mechanisms Some of these, such as the land capping fund and revolving fund, have been used in several toll roads development that have been completed
Source: PT Nusantara Infrastructure
To date, there have been a number of infrastructure projects that have been completed benefiting from the above government support including the Bogor Ring Road currently operated by Jasa Marga.
11 33
91
342
289
92
0
50
100
150
200
250
300
350
Airport Seaport Power Rail Road Others
(Rp tn)
2010 - 2015
2016 - 2030
Funding Support Details
Land Capping Fund
A system to ensure fair risk distribution between the Government and investors in order to provide certainty for the investments. The Government will cover any increases in land acquisition fund above 110% of the agreed fund required for land acquisition in a project or concession agreement. This is more specifically targeted for toll road development
Revolving Fund for Land Clearing
This revolving fund is used to acquire land for toll road development. The government provides a revolving fund to acquire land in advance and the fund will be reimbursed by investors once the land for a toll section is acquired. In 2010, the Government provided a total of Rp6 trillion of land revolving fund for Trans Java and Greater Jakarta toll roads
Infrastructure Guarantee Fund
The Guarantee Fund is intended to reduce the cost of fund for infrastructure development projects in Indonesia to assist in project bankability. It is designed to help the Government in managing its fiscal risk by ring fencing government obligations against guarantees and functions as a commercially- managed fund so that PPP is able to be more flexible and responsive to the best commercial practice.
SMI and IIFAccelerate infrastructure funding through partnership with the private sector or multilateral financial institutions

Nomura | AEJ Indonesia Infrastructure May 2, 2011
12
Fig. 17: Overall public private partnership scheme Given a limited budget and a significant infrastructure spending requirement, the government is pushing for a public private partnership scheme
Source: PT Nusantara Infrastructure
Last stumbling block -- Land Acquisition Bill The Land Acquisition Bill to be passed by the parliament by the middle of this year will be important in driving infrastructure spending. With all the commercial funding support mechanisms well in place, the much-expected Land Acquisition Bill will be the last remaining stumbling block for infrastructure development to take off in a major way, in our view. It will help to provide a legal base for the government to enforce land acquisition for infrastructure development. We expect that the law will be passed by parliament scheduled in July or the early part of 3Q11.
Fig. 18: Scheduled parliament meetings and work program for Land Acquisition Bill Current target is to pass the land acquisition law at the plenary session meeting to be held in July 2011
Source: Parliament website
Activities / Progress
- Internal meeting – selection of head of Special Committee (Pansus)
- Establish work plan and work mechanics
- Meeting with government represented by relevant ministries (explanation by the Government)
- Meeting with Land Authority (BPN) and Ministry of Public Works
- Meeting with National Committee for Human Rights
- Meeting with technical experts, including experts of traditional law (hukum adat)
- Meeting with toll road authority (BPJT)
- Regional visits to Aceh, West Sumatera, Bali, Central Kalimantan and Papua
- Summary of meetings and visits
- Presentation to parliament members on summary of meetings and visits
- Compilation of issue inventory lists (Daftar Inventaris Masalah – DIM)
- Compile list of issues from parliament members by office of parliament secretary
- Delivers list of issues to the Government by office of secretary
- Meeting with Government to discuss list of issues
- Establish Working Committee
- Parliament overseas visits
- Working Committee internal meeting and meeting with Government
- Working Committee meeting continues
- Establish Drafting Team
- Meetings of Drafting Team
- Establish Synchronization Team
- Meetings of Synchronization Team of the draft Land Acquisition Law
- Reports by Drafting Team and Synchronization Team to Working Committee
- Report Meeting of Working Committee to the Parliament
- Plenary Session Meeting to Legislate the new Land Acquisition Law (July 15)
July
Timeline
February
March
April
May
June

Nomura | AEJ Indonesia Infrastructure May 2, 2011
13
Once the bill is passed, some additional implementing regulation will need to be issued for the law to become fully effective. However, given the strong support that we have seen so far for this law to be passed, we do not expect the issue of the implementing regulation to be prolonged.
However, in our view, the key caveat to successful implementation of the land acquisition bill will be the coordination amongst the various government institutions to implement the regulations.
Key features in the new land acquisition bill are:
• Land title/rights within public infrastructure corridor will automatically be cancelled.
• Public infrastructure includes: road, airport, seaport, power plant, power transmission grid, flood canal, and other infrastructure projects deemed important by the President of the Republic Indonesia.
• Compensation to landowners will be decided through appraisal by an independent committee that includes third-party appraisers, local governments, representatives of the local community and the Ministry of Public Works.
• Landowners that disagree with the compensation price can appeal to the courts and the court will have to decide within 30 days with no further appeal allowed. Regardless, the land title/rights will be cancelled immediately and the infrastructure projects can proceed.
The proposed land acquisition bill is being socialised to the people and has so far seen very little push-back from law makers and NGOs. The key issue raised is only the inclusion of the statement “... and other infrastructure projects deemed important by the President”, as this is seen as giving too much flexibility to the President.
Risks
Key risks to our thesis and view on infrastructure spending include Indonesia's macro conditions (lower growth, higher inflation and higher interest rates that will reduce return on infrastructure investment and hence investors' appetite in infrastructure), and government budget strains (either as a result of lower revenue collection, or higher spending in other sectors such as subsidies). Political factors could also be a risk, but we view it as very minimal.

Nomura | AEJ Indonesia Infrastructure May 2, 2011
14
Cement: Bullish We see the cement sector as the key beneficiary of Indonesia’s infrastructure story. Its use in a wide range building development should see the sector benefit from infrastructure spending itself, as well as the multiplier effect it brings for the economy.
Action: BUY Gresik and Holcim; NEUTRAL on Indocement
We initiate coverage of the Indonesian cement sector with BUY ratings on Semen Gresik (SMGR IJ) and Holcim Indonesia (SMCB IJ), and a NEUTRAL rating on Indocement (INTP IJ).
Investment thesis Our key investment thesis on the sector is volume growth driven by capacity expansion over the next five years and near-term selling price increase.
Volume growth on capacity expansion of 23% over next three years We expect the three listed cement companies to increase their capacity by a combined 23% from the current capacity of 46m tonnes to slightly more than 57mn tonnes.
Semen Gresik has the most aggressive expansion plan, which aims to increase capacity by almost 20% from the current level of 20mn tpa to 25mn tpa in 2012, with commercial operation to start in the early part of the year.
Holcim Indonesia is currently constructing its plant expansion in East Java that will see its operating capacity increase by 20% from the current 9mn tpa to 11mn tpa in 2013.
Some near-term price increase, albeit minimal We expect the cement companies to increase selling prices by about 5% this year after no price adjustments in 2010. Investigations of cartels last year by the anti-monopoly body were cited by cement companies as the main reason they did not adjust selling prices to reflect higher costs. We believe that the investigation issue has been resolved and the overhang has been removed such that there now appears to be some room for the cement players to catch-up with rising costs and adjust selling prices accordingly. While there is no assurance that there will be no more investigations, we view the possibility as minimal given cement price increases are likely to be rather limited in the next three years (+5% this year and +2.5% in the next two years).
Dividend play Rising profitability and improving cashflows have allowed some cement companies to restructure their balance sheets, pay off debt and start to distribute dividends (Indocement, Holcim), while the financially stronger ones have consistently paid dividends at attractive payout ratios. Gresik has maintained a payout ratio of 45-50% for the past two years, while Indocement’s payout ratio stood at 30%. Holcim was the last company to restructure its balance sheet and started to pay out dividends this year at a 20% payout ratio.
Despite capex requirements for capacity expansion, we believe cement companies will continue to see strong operating cashflows, allowing them leverage to finance capex and remain as dividend plays.
Risks
Rising production costs Rising production costs have been cited by cement companies as the key operating risk this year, primarily those related to energy and coal in particular. In general, energy represents 50% of a cement company’s production costs and the majority of this is made up of coal.
Although some efficiency measures have been taken by replacing production facilities that allow lower-rank coal, and most coal supply contracts were secured at the end of last year, a further rise in coal prices could jeopardise profitability as some coal supply remains exposed to spot prices. We have assumed spot prices for coal of US$95/tonne for 5,000-5,500kcal quality, which is a 30% discount to the average seaborne thermal coal price of US$140/tonne (6,700kcal quality) assumed by our coal analysts.

Nomura | AEJ Indonesia Infrastructure May 2, 2011
15
Meanwhile, some cement companies that have secured their coal requirements through contract supply at prices below US$80, suggesting that the impact of coal price volatility may be rather limited and manageable.
Company recommendations
Semen Gresik (SMGR IJ, BUY) We believe Semen Gresik has the best market exposure across Indonesia, attributable to its spread of production capacity (West Sumatra, East Java and Sulawesi). As the largest cement producer in Indonesia with 20mn tonnes capacity, Gresik has been losing market share in the past few years due to capacity constraints. However, with its planned new capacity, Gresik should start to regain market share.
Holcim Indonesia (SMCB IJ, BUY) Holcim Indonesia has a strong position in the bulk cement market, which we see as the key demand driver when infrastructure projects kick in. Holcim has a total domestic capacity of 8.7mn tonnes, of which only 62% is allocated for the domestic market (higher prices, higher profits), leaving enough capacity to fill in/benefit from strong growth in infrastructure demand (exports have lower prices and lower profitability).
Indocement (INTP IJ, NEUTRAL) Similar to Gresik, Indocement also has nationwide exposure in the areas of potential growth, and the company will also undertake capacity expansion in the next 2-3 years. However, the magnitude of the planned expansion is less than that at Gresik and Holcim, making its growth profile less attractive compared to its peers, while valuation remains rich. Thus we initiate coverage with a NEUTRAL position on the stock.
Fig. 19: Cement: domestic demand trend
Source: Indonesian Cement Association (ASI), company data
0
2
4
6
8
10
12
1Q04
2Q04
3Q04
4Q04
1Q05
2Q05
3Q05
4Q05
1Q06
2Q06
3Q06
4Q06
1Q07
2Q07
3Q07
4Q07
1Q08
2Q08
3Q08
4Q08
1Q09
2Q09
3Q09
4Q09
1Q10
2Q10
3Q10
4Q10
1Q11
(mn tons) Domestic cement demand has been rising steadily at 8% pa over the past six years …

Nomura | AEJ Indonesia Infrastructure May 2, 2011
16
Fig. 20: Cement: industry capacity and utilisation rate trends
Source: Indonesian Cement Association (ASI), company data
Fig. 21: Cement: key players’ market share in domestic market
Source: Indonesian Cement Association (ASI), company data
Fig. 22: Cement: expected future capacity expansion to meet demand
Source: Company data, Nomura estimates
60
65
70
75
80
85
90
95
100
0
10
20
30
40
50
601Q
042Q
043Q
044Q
041Q
052Q
053Q
054Q
051Q
062Q
063Q
064Q
061Q
072Q
073Q
074Q
071Q
082Q
083Q
084Q
081Q
092Q
093Q
094Q
091Q
102Q
103Q
104Q
101Q
11
Capacity (LHS) Utilization (RHS)(mn tpa) (%)
9
10
11
12
13
14
15
16
17
18
15
20
25
30
35
40
45
50
55
60
2004 2005 2006 2007 2008 2009 2010 2011
SGG (LHS) INTP (LHS)
SMCB (RHS) Others (RHS)
(%)(%)
0
5
10
15
20
25
30
2004 2005 2006 2007 2008 2009 2010 2011 2012 2013 2014 2015
Semen Gresik Group Indocement
Holcim Indonesia Others
… driving industry capacity utilisation to a peak, despite additional capacity coming on stream
Players that have lagged in increasing capacity are losing market share
Additional capacity coming on-stream will continue, mainly by the Big 3

Nomura | AEJ Indonesia Infrastructure May 2, 2011
17
Fig. 23: Estimated cement industry capacity and sales
Source: Indonesia Cement Association (ASI)
Our thesis of rising domestic demand for cement hinges upon a continued robust macro-economic situation in Indonesia. We would expect that the additional capacity will be absorbed by domestic demand growth (which is already growing strongly and cannibalizing export sales due to lack of capacity).
Annual domestic cement demand growth rate averaged at 7.5% over the past 10 years (6.2% 10-year CAGR), with the economy growing at an average of 5.2% between 2000 and 2010. Even during the global financial crisis in 2008-09, with Indonesia registering growth of only 4.5% in 2009, domestic cement demand continued to grow, albeit at a marginal 1%. But this is after the industry saw growth of 11.4% and 6.6% in 2008 and 2007, respectively. We assume average annual cement demand growth of 7.5% on the assumption that the economy will grow by an average 7% pa from 2012.
In the event of a major slowdown in the economy that results in an abrupt decline in cement growth, say to 1% in the next three years (with reference to the recent global crisis), we would expect utilisation to fall to 68%, a situation that we had back in 2000, even with all the capacity expansion still coming in.
In our view, the risk of such a dire economic situation is low, and we believe that cement will be relatively resilient. We already assume conservative price increases in the next three years of only 5% in 2011 and 2.5% in 2012 and 2013, compared to an average 10% price increase in the past 10 years in light of upcoming capacity addition.
Fig. 24: Bulk cement contribution to total sales volume
Source: Indonesian Cement Association
Million tons 2005 2006 2007 2008 2009 2010 2011F 2012F 2013F 2014F 2015F
Industry capacity 44.85 45.45 45.45 47.75 48.55 52.30 54.30 59.30 63.90 68.40 68.40
Domestic demand 31.48 32.06 34.18 38.09 38.35 40.82 43.84 47.19 50.81 54.72 58.54
Export sales 6.71 7.27 7.80 4.93 3.93 2.88 2.31 1.85 1.50 1.50 1.50
Total cement sales 38.19 39.32 41.98 43.02 42.28 43.70 46.15 49.04 52.31 56.22 60.04
Domestic demand to capacity 70.2% 70.5% 75.2% 79.8% 79.0% 78.1% 80.7% 79.6% 79.5% 80.0% 85.6%
Total Sales to capacity 85.1% 86.5% 92.4% 90.1% 87.1% 83.6% 85.0% 82.7% 81.9% 82.2% 87.8%
Domestic demand growth 6.4% 1.8% 6.6% 11.4% 0.7% 6.4% 7.4% 7.6% 7.7% 7.7% 7.0%
GDP growth 5.7% 5.5% 6.3% 6.1% 4.5% 6.1% 6.5% 7.0% 7.0% 6.8% 6.9%
10
12
14
16
18
20
22
24
26
28
30
1Q08
2Q08
3Q08
4Q08
1Q09
2Q09
3Q09
4Q09
1Q10
2Q10
3Q10
4Q10
1Q11
SGG INTP SMCB Others
(%) Bulk cement sales on the rise, resulting in a higher proportion of bulk cement sales
Nomura | AEJ Indonesia Infrastructure May 2, 2011
18
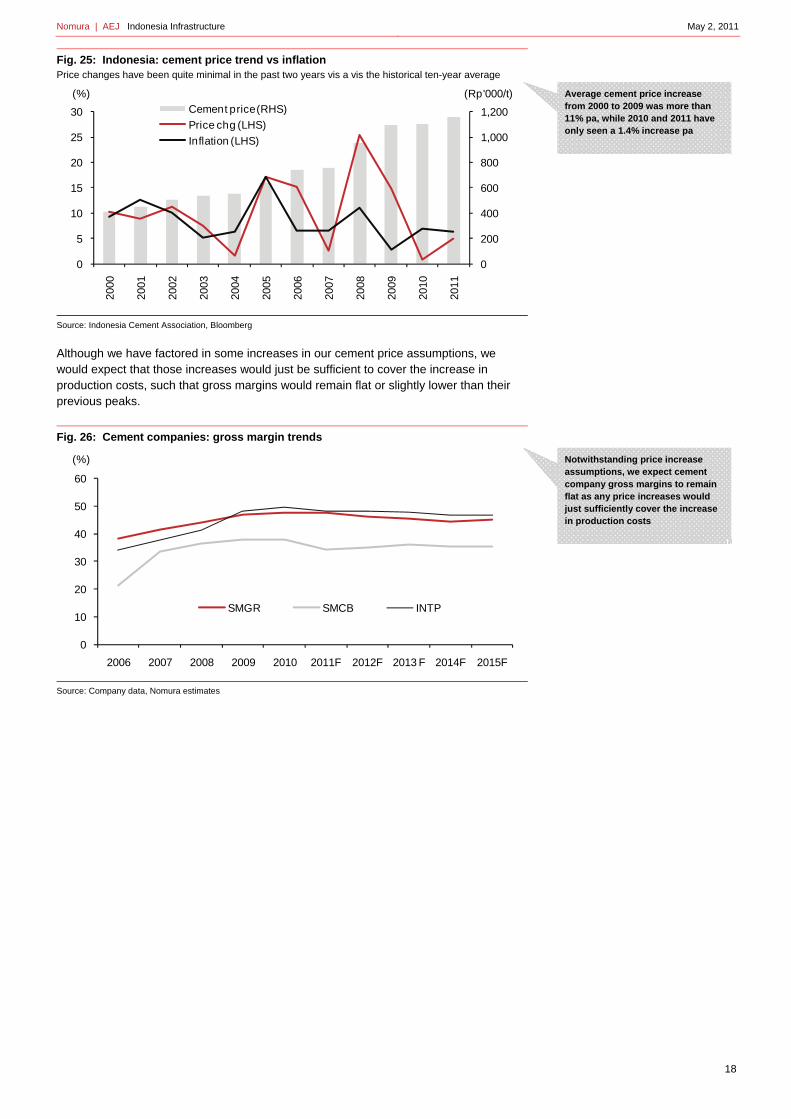
Fig. 25: Indonesia: cement price trend vs inflation Price changes have been quite minimal in the past two years vis a vis the historical ten-year average
Source: Indonesia Cement Association, Bloomberg
Although we have factored in some increases in our cement price assumptions, we would expect that those increases would just be sufficient to cover the increase in production costs, such that gross margins would remain flat or slightly lower than their previous peaks.
Fig. 26: Cement companies: gross margin trends
Source: Company data, Nomura estimates
0
200
400
600
800
1,000
1,200
0
5
10
15
20
25
3020
00
2001
2002
2003
2004
2005
2006
2007
2008
2009
2010
2011
Cement price (RHS)
Price chg (LHS)
Inflation (LHS)
(%) (Rp'000/t)
0
10
20
30
40
50
60
2006 2007 2008 2009 2010 2011F 2012F 2013 F 2014F 2015F
SMGR SMCB INTP
(%)
Average cement price increase from 2000 to 2009 was more than 11% pa, while 2010 and 2011 have only seen a 1.4% increase pa
Notwithstanding price increase assumptions, we expect cement company gross margins to remain flat as any price increases would just sufficiently cover the increase in production costs

Nomura | AEJ Indonesia Infrastructure May 2, 2011
19
Fig. 27: Cement price increase was to reflect higher energy prices, primarily coal Cement prices in the past two years have yet to reflect substantially higher coal prices
Source: Indonesian Cement Association, Company data, Bloomberg
0
20
40
60
80
100
120
140
0
200
400
600
800
1,000
1,200
1,400
2000
2001
2002
2003
2004
2005
2006
2007
2008
2009
2010
2011
Cement price (LHS)
Coal price (RHS)
(Rp'000/t) (US$/t) Cement selling price is expected to play catch up with rising energy, coal prices

Nomura | AEJ Indonesia Infrastructure May 2, 2011
20
Company comparison
Fig. 28: Valuation comparison
Source: Company data, Nomura estimates
Notes: implied valuation at target price
SEMEN GRESIK
Current Share Price 9,450 Target Share Price 11,700 Upside / Downside 23.8%
SUMMARY VALUATION 2008 2009 2010 2011 2012 2013
Enterprise Value Rp bn 68,612 68,612 68,612 68,612 Equity Value Rp bn 69,037 69,037 69,037 69,037 EBITDA Rp bn 4,964 5,649 6,848 7,350 Earnings Rp bn 3,633 3,898 4,413 4,895 Capacity mm t 19.0 20.2 25.2 26.0
EV/EBITDA x 13.8 12.1 10.0 9.3 EV/Capacity US$/t 451 425 340 330 Price to Earnings x 19.0 17.7 15.6 14.1
Operating MeasuresRevenue per ton Rp'000/t 691 815 800 835 857 875
Cost per tonProduction Cash Cost Per Ton Rp'000/t 363 409 396 409 420 440 COGS per ton Rp'000/t 388 431 420 438 460 477 Total Cost per Ton Rp'000/t 499 569 550 572 592 612
EBITDA per ton Rp'000/t 219 270 277 296 309 304
INDOCEMENT
Current Share Price 17,100 Target Share Price 17,200 Upside / Downside 0.6%
SUMMARY VALUATION 2008 2009 2010 2011 2012 2013
Enterprise Value Rp bn 56,884 56,884 56,884 56,884 Equity Value Rp bn 63,111 63,111 63,111 63,111 EBITDA Rp bn 4,641 5,153 5,352 5,797 Earnings Rp bn 3,225 3,516 3,687 4,041 Capacity mm t 18.6 18.6 18.6 20.6
EV/EBITDA x 12.3 11.0 10.6 9.8 EV/Capacity US$/t 472 472 472 426 Price to Earnings x 19.6 17.9 17.1 15.6
Operating MeasuresRevenue per ton Rp '000/t 683 802 820 874 913 918
Cost per tonProduction Cash Cost Per Ton Rp '000/t 360 372 366 409 429 436 COGS per ton Rp '000/t 402 415 412 452 473 478 Total Cost per Ton Rp '000/t 511 522 524 568 597 606
EBITDA per ton Rp '000/t 213 323 342 349 361 353
HOLCIM INDONESIA
Current Share Price 2,275 Target Share Price 2,700 Upside / Downside 18.7%
SUMMARY VALUATION 2008 2009 2010 2011 2012 2013
Enterprise Value Rp bn 19,697 19,697 19,697 19,697 Equity Value Rp bn 20,618 20,618 20,618 20,618 EBITDA Rp bn 1,854 2,090 2,318 2,849 Earnings Rp bn 828 896 969 1,186 Capacity mm t 9.4 9.4 9.4 11.2
EV/EBITDA x 10.6 9.4 8.5 6.9 EV/Capacity US$/t 261 261 261 219 Price to Earnings x 24.9 23.0 21.3 17.4
Operating MeasuresRevenue per ton Rp '000/t 768 824 834 881 924 960
Cost per tonProduction Cash Cost Per Ton Rp '000/t 285 257 260 310 302 300 COGS per ton Rp '000/t 487 512 519 579 601 613 Total Cost per Ton Rp '000/t 624 630 647 711 740 752
EBITDA per ton Rp '000/t 202 255 259 270 299 313

Nomura | AEJ Indonesia Infrastructure May 2, 2011
21
Transport: Bullish Toll roads are the key focus of the government for infrastructure development, and thus the sector should benefit, in our view. We see more favourable regulations and development of more toll roads to increase connectivity (and car numbers) as key positives for the sector.
Action: BUY Jasa Marga
We initiate coverage of the transport sector (toll roads) with a BUY rating on Jasa Marga, Indonesia's main toll road operator.
Investment thesis
Land Acquisition Bill is the key catalyst We believe that the transport sector will be the main beneficiary of the new Land Acquisition Bill that will be passed by parliament this year. The benefit of being able to build more toll roads with the implementation of this law for the toll road operators and investors are threefold:
• It will allow acceleration in toll road development, adding project portfolio that will contribute traffic and cashflow (rather than just paper concessions), and potentially further re-investments in other toll roads by toll road operators.
• More toll road development will also help to unlock accelerated traffic growth potential that has been seized by capacity constraints. In the past 10 years, car sales growth hit an average 11% CAGR, while Jasa Marga's traffic volume recorded an average CAGR of 5%. We believe that the 5% CAGR is below the potential that Jasa Marga can achieve owing to the toll road capacity constraints (cars are avoiding some toll roads which are actually more jammed than normal roads), as such more toll roads should help to boost traffic growth.
• In addition, we expect that accelerating toll road development will increase toll road connections and thus lead to further traffic volume growth.
Strong growth in car sales Continued robust car sales growth will undoubtedly benefit toll road companies, provided that capacity constraints are reduced.
Risks Key risks to the toll road sector, in our view, include uncertainty over construction costs, primarily as a result of rising material costs, particularly as project development takes a few years to complete and commodity prices are volatile.
Fig. 29: Annual car sales (1997-2010) Annual car sales growth hit an average of 11% in the past 10 years, given economic growth
Source: Gaikindo, Nomura research
0
100,000
200,000
300,000
400,000
500,000
600,000
700,000
800,000
900,000
1997 1998 1999 2000 2001 2002 2003 2004 2005 2006 2007 2008 2009 2010
(Units) Car sales have grown by 11% pa over the past decade
Nomura | AEJ Indonesia Infrastructure May 2, 2011
22
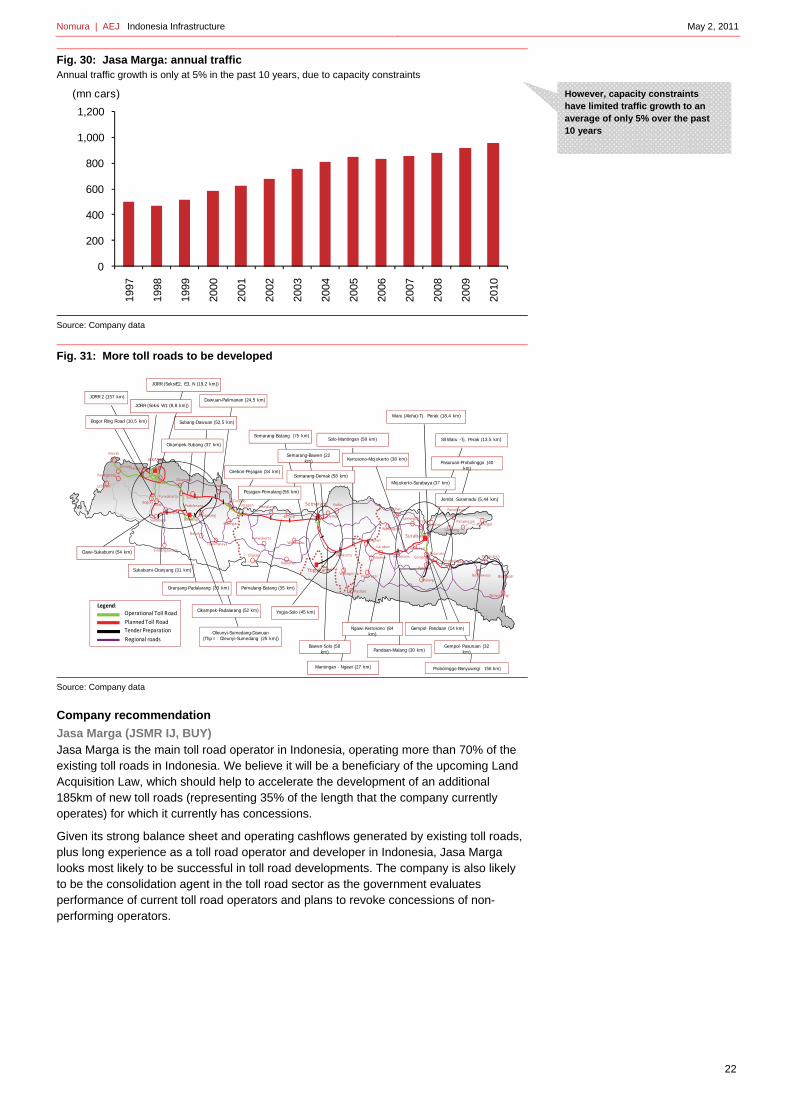
Fig. 30: Jasa Marga: annual traffic Annual traffic growth is only at 5% in the past 10 years, due to capacity constraints
Source: Company data
Fig. 31: More toll roads to be developed
Source: Company data
Company recommendation
Jasa Marga (JSMR IJ, BUY) Jasa Marga is the main toll road operator in Indonesia, operating more than 70% of the existing toll roads in Indonesia. We believe it will be a beneficiary of the upcoming Land Acquisition Law, which should help to accelerate the development of an additional 185km of new toll roads (representing 35% of the length that the company currently operates) for which it currently has concessions.
Given its strong balance sheet and operating cashflows generated by existing toll roads, plus long experience as a toll road operator and developer in Indonesia, Jasa Marga looks most likely to be successful in toll road developments. The company is also likely to be the consolidation agent in the toll road sector as the government evaluates performance of current toll road operators and plans to revoke concessions of non-performing operators.
0
200
400
600
800
1,000
1,200
1997
1998
1999
2000
2001
2002
2003
2004
2005
2006
2007
2008
2009
2010
(mn cars)
SurabayaSampang
BangkalanPamekasan
Pamekasan
Kalianget
Merak
Serang
Pandeglang
JAKARTA
Bogor
Bandung
BekasiCikampek
SumedangSukabumi
Cirebon
PemalangSemarang Kudus
Yogjakarta
Ngawi
Mojokerto
Malang
ProbolinggoPanarukan
Banyuwangi
Bondowoso Bajulmati
Gresik
Tuban
Bojonegoro
Lamongan
Caruban
Madiun Kertosono
Batang
PurwokertoWonosobo
Cilacap
Kebumen
Kuningan
Garut
Tasikmalaya
Sindangbarang
Dawuan
Subang
Pacitan
WonogiriPonorogo
Labuhan
Pejagan
Tangerang
Gempol
Gempol- Pandaan (14 km)
Probolinggo-Banyuwngi 156 km)
Gempol- Pasuruan (32 km)
Solo-Mantingan (58 km)
Kertosono-Mojokerto (38 km)
Pemalang-Batang (35 km)
Semarang-Batang (75 km)
Semarang-Bawen (22 km)
Semarang-Demak (58 km)Cirebon-Pejagan (34 km)
Pejagan-Pemalang (56 km)
Yogja-Solo (45 km)
Dawuan-Palimanan (24,5 km)
Subang-Dawuan (52,5 km)
Sukabumi-Ciranjang (31 km)
Cileunyi-Sumedang-Dawuan(Thp I : Cileunyi-Sumedang (25 km))
Cikampek-Padalarang (52 km)
Pandaan-Malang (30 km)
SS Waru -Tj. Perak (13,5 km)
Waru (Aloha)-Tj. Perak (18,4 km)
Pasuruan-Probolinggo (40 km)
Mojokerto-Surabaya (37 km)
JORR (SeksiE2, E3, N (19,2 km))
JORR 2 (157 km)
Ciawi-Sukabumi (54 km)
JORR (Seksi W1 (9,8 km))
Cikampek-Subang (37 km)
Bogor Ring Road (10,5 km)
Ciranjang-Padalarang (33 km)
Jembt. Suramadu (5,44 km)Purwakarta
Ciawi
Cianjur
Padalarang
Demak
Surakarta
Pandaan
Pasuruan
Mantingan - Ngawi (27 km)
Bawen-Solo (58 km)
Ngawi-Kertosono (84 km)
Operational Toll Road
Planned Toll Road
Regional roads
Legend:
Tender Preparation
However, capacity constraints have limited traffic growth to an average of only 5% over the past 10 years

Nomura | AEJ Indonesia Infrastructure May 2, 2011
23
Steel and construction: Neutral The steel and construction sectors are likely to see growing volumes with rising infrastructure spending and steel prices. However, increasing building material and raw material prices, coupled with import competition, have dampened sentiment.
Action: NEUTRAL on Krakatau and Wijaya We initiate coverage of the Indonesian steel and construction sectors with a NEUTRAL call on Krakatau Steel and Wijaya Karya.
Sector summary The construction sector will undoubtedly be one of the main beneficiaries of rising infrastructure spending, which should expand construction sector business volumes. Increasing government spending will particularly benefit the state-owned construction companies such as Wijaya Karya, which are the typical niche market for state construction works.
However, we believe that it may be too early to get into the sector as contract orders, particularly from the public sector, are back-end loaded and typically take longer to approve. In addition, we would also wait to see the impact of higher raw materials prices on construction margins. Contract values are typically locked in at the beginning of the contract. While contractors typically factor in some room for future raw material price increases, and contracts do provide some leeway for cost adjustments, significant increase in material costs could eventually erode margins.
Fig. 32: Historical and estimated construction spending nationwide and by government
Source: Association of Indonesian Construction Companies, Coordinating Ministry for Economy
Domestic steel demand has also been rising at an average 6.2% CAGR over the past 10 years, benefiting from economic expansion. Increasing property development activities, energy infrastructure spending and car sales are key drivers.
0
50
100
150
200
250
2008 2009 2010 2011F
(Rp tn)National Construction Spending
Government (Ministry of Public Works)

Nomura | AEJ Indonesia Infrastructure May 2, 2011
24
Fig. 33: Trend of domestic steel demand Indonesia domestic supply and imports 2000-09 (mn tonnes)
Source: Company data, CRU
However, much of the growth in demand has been driven by consumption of imported steel plates, primarily for the auto sector, which requires special types of steel and represents a niche market for imports. Import competition is also seen rising in other segments of steel markets aside from steel plates.
Fig. 34: Indonesia steel imports vs car sales Strong correlation between steel import volumes and domestic car sales
Source: Krakatau Steel, Nomura estimates
Given increasing import competition, we would prefer to wait to see if the local steel market can reap benefits from rising domestic steel demand. The threat from import competition stems not only from competitive steel products in the retail markets. Major infrastructure development funded by foreign funding, particularly bilateral cooperation and funding agreements, will experience some competition as these agreements will require use of materials from the origin country, including steel. We believe required use of local content for major infrastructure development would be beneficial for local players, and allow local players to ride the demand growth.
Our cautious stance on the steel sector is also built on concerns over the ability of the steel players to pass on higher raw materials costs (iron ore and pellets) in the face of competition from imported steel. The price-adjustment mechanism will be quite fluid. Krakatau Steel typically adjusts its steel selling price on a monthly basis. However, for steel market segments that face import competition, this sort of price adjustment could face some challenges.
0
1,000
2,000
3,000
4,000
5,000
6,000
7,000
8,000
9,000
2000 2001 2002 2003 2004 2005 2006 2007 2008 2009 2010
Domestic supply Imports
0
100
200
300
400
500
600
700
800
900
0
500
1,000
1,500
2,000
2,500
3,000
3,500
2000
2001
2002
2003
2004
2005
2006
2007
2008
2009
2010
Imports Cars
Import steel ('000 t) Car sales ('000 units)
Nomura | AEJ Indonesia Infrastructure May 2, 2011
25
Risks Key risks for the sector are rising commodity prices that will increase production and construction costs. In addition, a rising interest rate would also be a risk for the construction sector as it would raise funding costs given that higher business volumes would require additional working capital funding.
Company recommendations
Krakatau Steel (KRAS IJ, NEUTRAL) Krakatau Steel is the largest integrated steel producer in Indonesia, and the company is revamping and expanding its production capacity. It plans to increase its production capacity from 2.8mn tpa currently to 4.25mn tpa by 2014. The company is adding blasting furnace production capacity that is more cost efficient than the current production facility (EAF-based) and this should help to reduce production costs by 5%.
Additional production capacity of 3mn tpa is also being developed under a joint venture with POSCO, whereby Krakatau will eventually have 45% equity interest. We expect the government to grant tax incentives in the form of a tax holiday and Krakatau to record Rp1.5tn of extraordinary gains from land sales to the JV.
New additional production capacity will start to contribute growth for Krakatau starting in 2012. Meanwhile, raw material costs (prices of iron ore and pellets) are rising. We recommend a NEUTRAL position on Krakatau, as we are cautious on the impact of rising materials costs and will continue to monitor the progress of expansion and revitalization programmes.
The stock is currently trading at premium to its regional peers. While such a premium may be attributable to the company’s strong growth profile over the next few years, our NETURAL stance highlights the execution risk of the company’s expansion plans that actually drives such growth. In addition, Krakatau just recently went public at the end of last year, so whether such premium valuation is justified and sustainable is yet to be seen. In any case, our valuation already assigns a higher premium than the current share price, thus in order for us to take a more optimistic view on the company, we need to see more concrete progress from the company’s expansion plans before we get any full conviction.
Wijaya Karya (WIKA IJ, NEUTRAL) With market cap of less than US$500mn, Wijaya Karya is the largest and most liquid construction company listed on the Indonesia Stock Exchange. We expect the company to benefit from rising construction spending, particularly from construction spending promoted by the government.
In addition, the company is also entering into investments and partnerships with sister state-owned companies Jasa Marga and PLN (the state electricity company) in a number of infrastructure projects, with the view that these investments will:
• support the construction business;
• help provide stability in future earnings; and
• diversify away from the more volatile construction business.
A strong balance sheet with a high level of cash (20% of total assets) has allowed companies such as Wijaya Karya to leverage on their balance sheets to win projects and selectively participate in the project ownership as investments.
However, we believe that the company's financial strength will be tested as business volume increases, requiring higher working capital funding. Coupled with rising raw material prices, we would remain cautious and recommend investors to sit on the sideline to monitor progress until it is clearer that the company can translate higher business volumes into much stronger earnings. NEUTRAL.

Nomura | AEJ Indonesia Infrastructure May 2, 2011
26
Steel industry outlook
The following section on the steel industry outlook is taken from the Nomura Global mining sector report, Buy the current correction, published on 7 February, 2011, and the Nomura European steel sector report, Solid 2Q discounted; market focused on 2H - Market waiting for a 2H margin collapse; we are more optimistic on 2H11 and 2012, published on 20 April, 2011.
Overview of steel sector
We expect steel prices to moderate ... Amid signs that steel prices have peaked for the near term, the market appears to have already priced in expectations of falling steel prices in the coming weeks and months. The share prices of ArcelorMittal (MT) and Kloeckner (KCO) tend to be correlated with spot steel prices, as investor sentiment towards these two companies rises and falls with spot steel prices (even if we believe that this approach does not capture the fundamental equity stories for these two stocks). Shares of both MT and KCO are down almost 15% since their recent peaks in February 2011. Against the backdrop of potential import pressure from Chinese steelmakers, falling scrap prices and a possible easing in the restocking that has played a part in driving steel prices upward in 1Q, it appears likely that steel prices in the US and Europe will moderate. In addition, our channel checks suggest that US and European steel customers are starting to take a wait-and-see attitude toward further orders. Overall, flat-rolled demand remains stronger than long-product demand, reflecting demand strength from automotive, capital goods and energy end markets vs. construction end markets.
... but steel prices should remain supported by elevated raw material costs Raw material costs remain elevated, with spot iron ore prices having rebounded to near peak levels, following a brief respite in March. At current levels, we believe that Chinese steel mills are barely profitable, implying steel prices there may have reached a floor, and we are encouraged by modest price increases in China that have been reported in recent weeks. The current iron ore spot price is in line with our 2Q house forecast price of $185/t. We expect iron ore prices to moderate slightly in 2H, to $170/t in 3Q and $160/t in 4Q; however, in the absence of meaningful supply coming to the market and continued steel production growth, we believe that iron ore markets will remain tight through 2012, where we forecast an iron ore price of $180/t. Similarly with coking coal, our house forecast is for prices to moderate slightly in 2H11 but remain elevated through 2012. We therefore see limited scope for a precipitous decline in steel prices, as steelmakers, particularly in China, cannot afford to bear much lower steel prices. Figs. 6 and 7 show how steel prices have tracked iron ore prices, suggesting limited downside risk to steel prices if iron ore prices remain elevated and steel demand remains adequate. Both iron ore and Chinese steel prices weakened in March, but the recent rebound in iron ore prices suggests Chinese steelmakers could need to raise prices to remain profitable, reducing the spread against (and easing the pressure on) US and European steel prices.
Chinese steel prices may have reached a floor We believe that Chinese steelmakers are barely profitable at current steel price levels due to elevated raw material cost pressure, and we note the $20–25/t increase in Chinese HRC steel prices in the last month. We believe that Chinese steel prices may have reached a near-term floor and may see a slight increase from current levels. We think a spread of greater than $150/t between US/EU and Chinese steel prices generally increases the threat of rising import volumes. Therefore, the current spread of $200– 250/t is likely to attract increased imports into the US and Europe. However, we believe that demand is not strong enough in the US or Europe where one could expect a flood of imports. It is our view, therefore, that European prices could moderate slightly in the near term, but that they will essentially remain supported by stable Chinese prices.
Steel prices will not collapse, but margins will come under pressure in 2H With elevated raw material costs likely to persist through 2011, underlying demand improving and inventories reasonable, we believe that steel prices will remain broadly supported at current levels, although we expect some moderation. However, high raw
Investor sentiment is low; the market is expecting steel prices to fall
We expect iron ore and coking coal markets to remain tight and prices to remain elevated through 2011, providing some cost-push support to steel prices
We see limited scope for Chinese prices to fall much further, given razor-thin margins and continued raw material cost pressure
2H11 will be weaker than 1H 2011, but not as bad 2H10

Nomura | AEJ Indonesia Infrastructure May 2, 2011
27
material costs will continue to pressure earnings and margins into 2H11. As a result, we expect modest margin compression in 2H for European steelmakers. Because raw material costs affect steelmakers’ P&L accounts with a lag, in our view high raw material prices in 1H will weigh on earnings into 2H. We believe that a typical seasonal downtick in shipment volumes and a likely softening of steel prices, in combination with higher input costs, will translate into a weaker 2H vs. 1H; however, we expect demand and inventories to hold up better than in 2H10. Confidence surrounding a global macroeconomic recovery is higher now than it was last year, while inventory levels remain low, suggesting the extreme destocking in 2H10 is unlikely to repeat. With end markets such as automotive, capital goods and mechanical engineering continuing to grow and signs of bottoming appearing in developed world construction markets, steelmakers should enjoy the benefits of higher utilisation rates in 2H11 (vs. 2H10). The risk of Japanese component supply disruptions to the automotive industry could certainly affect steel demand; however, early indications suggest that demand for automotive steel remains strong in Europe.
Fig. 35: Global steel supply and demand dynamics
Source: Metal Bulletin, Nomura estimates
Million tons 2006 2007 2008 2009 2010 2011F 2012FCrude steel production (million tonnes)US 98.6 98.1 91.4 58.2 80.6 87.0 94.9 Other North America 33.2 34.5 33.2 24.2 31.2 34.3 35.7 North America 131.8 132.6 124.5 82.4 111.8 121.4 130.6 Brazil 30.9 33.8 33.7 26.5 32.8 36.1 39.0 Other Americas 14.4 14.5 13.6 11.3 11.0 12.1 13.1 Central & South America 45.3 48.2 47.4 37.8 43.8 48.2 52.0 EU-27 206.3 209.7 198.0 138.8 172.9 190.2 203.5 Europe-other 28.2 30.6 31.3 28.7 33.1 35.7 37.9 Russia 70.8 72.4 68.7 60.0 67.0 74.6 80.6 Other CIS 49.1 51.8 45.3 37.6 41.5 46.1 49.8 CIS 119.9 124.2 114.0 97.6 108.5 120.7 130.4 Middle East 15.4 16.0 16.0 17.7 19.6 22.0 24.1 Africa 18.8 18.8 16.7 15.2 17.5 19.6 21.6 China 422.7 489.9 500.3 573.6 626.7 685.0 739.8 India 50.8 53.1 58.4 62.8 66.8 70.8 77.9 Japan 116.2 120.2 118.7 87.5 109.6 111.9 112.8 Korea, South 48.5 51.5 53.6 48.6 58.6 62.3 68.6 Other Asia 38.0 47.2 18.4 32.4 36.2 39.8 43.0 Asia 676.2 761.9 749.5 804.9 897.9 969.8 1,042.0 Oceania 8.7 8.8 8.4 6.0 8.1 8.9 9.5
World 1,251.2 1,351.3 1,329.7 1,229.2 1,413.6 1,536.4 1,651.5 YoY change 9% 8% -2% -8% 15% 9% 7%
Million tons 2006 2007 2008 2009 2010F 2011F 2012FApparent steel consumption (million tonnes)North America 155.7 141.3 129.0 82.7 102.2 109.9 115.4 Brazil 18.5 22.1 24.0 18.5 22.8 25.1 27.3 Other Americas 17.9 19.8 20.3 15.1 18.4 20.2 21.9 Central & South America 36.4 41.9 44.3 33.6 41.2 45.3 49.2 EU-27 188.6 198.1 181.3 118.7 136.0 142.1 149.2 Europe-other 28.9 31.6 25.3 23.9 26.9 28.6 29.8 Russia 34.9 39.5 37.3 24.7 34.1 37.6 40.7 Ukraine 7.1 9.5 6.9 5.2 6.9 7.7 8.2 Other CIS 6.9 7.6 4.7 3.4 4.2 4.6 4.9 CIS 48.9 56.6 48.9 33.3 45.2 49.9 53.8 Middle East 34.9 40.3 43.1 40.6 44.5 49.0 52.9 Africa 22.9 25.1 26.2 28.7 30.6 33.7 36.4 China 361.3 408.3 425.7 542.4 574.4 606.0 654.5 India 46.1 52.1 53.0 55.3 63.6 69.0 75.9 Japan 77.3 79.6 76.4 53.2 58.7 61.9 62.2 Korea, South 50.2 55.4 58.9 45.4 50.6 54.0 59.4 Taiwan 19.8 20.2 16.7 11.3 13.2 14.5 15.5 Other Asia 55.4 55.6 69.7 50.2 56.0 61.6 65.9 Asia 610.1 671.3 700.5 757.8 816.5 867.0 933.5 Oceania 7.9 8.6 8.5 5.9 6.4 7.0 7.5
World 1,134.3 1,214.8 1,207.0 1,125.2 1,249.5 1,332.5 1,427.6 YoY change 9% 7% -1% -7% 11% 7% 7%

Nomura | AEJ Indonesia Infrastructure May 2, 2011
28
Overview of iron ore sector We believe iron ore supply is at least as tight as in 2008 when spot prices spiked to over USD200/tonne. We expect tight supply conditions to persist over the next three to five years as timelines for major new supply expansions in Brazil and Australia are subject to delays. We have further increased our medium-term estimates for iron ore price contracts from what we regard as already bullish levels. Thereafter, we see a large amount of new supply that is likely to return prices to equilibrium levels of around USD70/tonne (Australia FOB).
Under the quarterly pricing mechanism, a return to 2008 spot prices would equate to a realised price double that achieved in 2008. Vale's strategy to keep seaborne freight rates low by investing in its own fleet of bulk carriers also provides a benefit for the Australian miners without the additional capital cost.
Nomura | AEJ Indonesia Infrastructure May 2, 2011
29
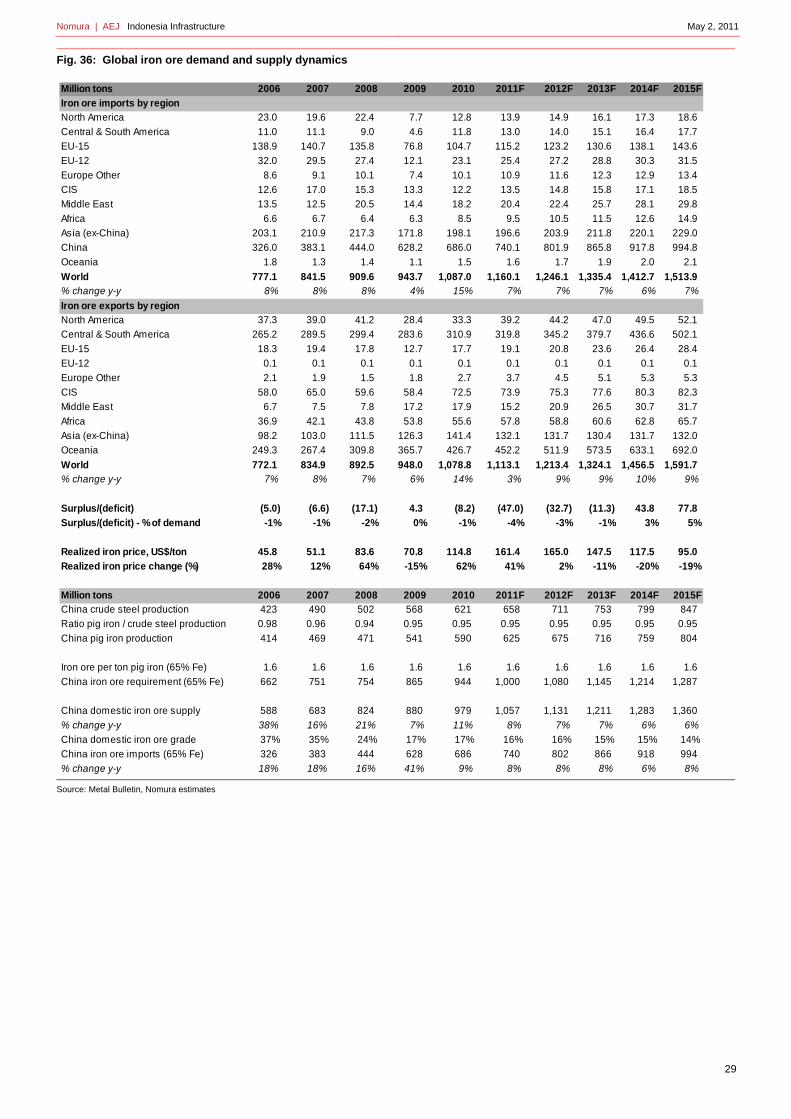
Fig. 36: Global iron ore demand and supply dynamics
Source: Metal Bulletin, Nomura estimates
Million tons 2006 2007 2008 2009 2010 2011F 2012F 2013F 2014F 2015F
Iron ore imports by regionNorth America 23.0 19.6 22.4 7.7 12.8 13.9 14.9 16.1 17.3 18.6
Central & South America 11.0 11.1 9.0 4.6 11.8 13.0 14.0 15.1 16.4 17.7
EU-15 138.9 140.7 135.8 76.8 104.7 115.2 123.2 130.6 138.1 143.6
EU-12 32.0 29.5 27.4 12.1 23.1 25.4 27.2 28.8 30.3 31.5
Europe Other 8.6 9.1 10.1 7.4 10.1 10.9 11.6 12.3 12.9 13.4
CIS 12.6 17.0 15.3 13.3 12.2 13.5 14.8 15.8 17.1 18.5
Middle East 13.5 12.5 20.5 14.4 18.2 20.4 22.4 25.7 28.1 29.8
Africa 6.6 6.7 6.4 6.3 8.5 9.5 10.5 11.5 12.6 14.9
Asia (ex-China) 203.1 210.9 217.3 171.8 198.1 196.6 203.9 211.8 220.1 229.0
China 326.0 383.1 444.0 628.2 686.0 740.1 801.9 865.8 917.8 994.8
Oceania 1.8 1.3 1.4 1.1 1.5 1.6 1.7 1.9 2.0 2.1
World 777.1 841.5 909.6 943.7 1,087.0 1,160.1 1,246.1 1,335.4 1,412.7 1,513.9% change y-y 8% 8% 8% 4% 15% 7% 7% 7% 6% 7%
Iron ore exports by regionNorth America 37.3 39.0 41.2 28.4 33.3 39.2 44.2 47.0 49.5 52.1
Central & South America 265.2 289.5 299.4 283.6 310.9 319.8 345.2 379.7 436.6 502.1
EU-15 18.3 19.4 17.8 12.7 17.7 19.1 20.8 23.6 26.4 28.4
EU-12 0.1 0.1 0.1 0.1 0.1 0.1 0.1 0.1 0.1 0.1
Europe Other 2.1 1.9 1.5 1.8 2.7 3.7 4.5 5.1 5.3 5.3
CIS 58.0 65.0 59.6 58.4 72.5 73.9 75.3 77.6 80.3 82.3
Middle East 6.7 7.5 7.8 17.2 17.9 15.2 20.9 26.5 30.7 31.7
Africa 36.9 42.1 43.8 53.8 55.6 57.8 58.8 60.6 62.8 65.7
Asia (ex-China) 98.2 103.0 111.5 126.3 141.4 132.1 131.7 130.4 131.7 132.0
Oceania 249.3 267.4 309.8 365.7 426.7 452.2 511.9 573.5 633.1 692.0
World 772.1 834.9 892.5 948.0 1,078.8 1,113.1 1,213.4 1,324.1 1,456.5 1,591.7% change y-y 7% 8% 7% 6% 14% 3% 9% 9% 10% 9%
Surplus/(deficit) (5.0) (6.6) (17.1) 4.3 (8.2) (47.0) (32.7) (11.3) 43.8 77.8
Surplus/(deficit) - % of demand -1% -1% -2% 0% -1% -4% -3% -1% 3% 5%
Realized iron price, US$/ton 45.8 51.1 83.6 70.8 114.8 161.4 165.0 147.5 117.5 95.0
Realized iron price change (%) 28% 12% 64% -15% 62% 41% 2% -11% -20% -19%
Million tons 2006 2007 2008 2009 2010 2011F 2012F 2013F 2014F 2015FChina crude steel production 423 490 502 568 621 658 711 753 799 847
Ratio pig iron / crude steel production 0.98 0.96 0.94 0.95 0.95 0.95 0.95 0.95 0.95 0.95
China pig iron production 414 469 471 541 590 625 675 716 759 804
Iron ore per ton pig iron (65% Fe) 1.6 1.6 1.6 1.6 1.6 1.6 1.6 1.6 1.6 1.6
China iron ore requirement (65% Fe) 662 751 754 865 944 1,000 1,080 1,145 1,214 1,287
China domestic iron ore supply 588 683 824 880 979 1,057 1,131 1,211 1,283 1,360
% change y-y 38% 16% 21% 7% 11% 8% 7% 7% 6% 6%
China domestic iron ore grade 37% 35% 24% 17% 17% 16% 16% 15% 15% 14%
China iron ore imports (65% Fe) 326 383 444 628 686 740 802 866 918 994
% change y-y 18% 18% 16% 41% 9% 8% 8% 8% 6% 8%

Key company data: See page 2 for company data, and detailed price/index chart. Rating: See report end for details of Nomura’s rating system.
Semen Gresik SMGR.JK SMGR IJ
CONSTRUCTION MATERIALS
EQUITY RESEARCH
Re-gaining Position
Re-gaining market share on the back of capacity expansion
May 2, 2011
Rating Starts at
Buy
Target price Starts at11,700
IDR 11,700
Closing price April 28, 2011
IDR 9,450
Potential upside +23.8%
Action: BUY on capacity expansion volume growth We initiate BUY on Gresik with a price target of IDR11,700. We expect Gresik to regain market share which it has lost due to capacity constraints. Gresik is increasing its production capacity by 20% to 25mn tpa next year, which will help maintain its status as the largest cement company in Indonesia in the next five years with a margin difference of 20% vs the second-largest player in terms of capacity volume.
Catalyst: macro newsflows, higher cement prices, and operation of new capacity We believe sustained strong economic growth will drive cement sales growth and absorb additional volume from capacity expansion. We have assumed a conservative 5% increase in cement selling prices to reflect the higher production costs of cement players, including Gresik.
Valuations For 2011 and 2012, we estimate Gresik will register 13.8% and 21.2% EBITDA growth, driven by capacity expansion that we estimate will push volume growth of 6.6% and 16.1%, respectively. We derive our price target using a DCF methodology to capture the company’s ongoing capacity expansion. Gresik’s PE and EV/EBITDA multiple valuations are the cheapest compared to its domestic peers, even at our target price valuation that implies 24% potential upside.
Risks: higher energy costs and economic downturn Energy represents 50% of Gresik’s production costs. Hence, rising energy costs, mainly coal, would adversely impact profitability and valuation.
31 Dec FY10 FY11F FY12F FY13F
Currency (IDR) Actual Old New Old New Old New
Revenue (bn) 14,344 15,955 19,011 21,135
Reported net profit (bn) 3,633 3,898 4,413 4,895
Normalised net profit (bn) 3,633 3,898 4,413 4,895
Normalised EPS 612.5 657.1 743.9 825.2
Norm. EPS growth (%) 9.2 7.3 13.2 10.9
Norm. P/E (x) 15.5 N/A 14.5 N/A 12.8 N/A 11.5
EV/EBITDA 10.7 N/A 9.9 N/A 7.8 N/A 6.8
Price/book (x) 4.7 N/A 4.0 N/A 3.4 N/A 2.9
Dividend yield (%) 3.2 N/A 3.1 N/A 3.5 N/A 3.9
ROE (%) 32.7 29.8 28.7 27.3
Net debt/equity (%) net cash net cash net cash net cash
Source: Nomura estimates
Anchor themes
Indonesia's economy is set to take on a new growth trajectory. Robust macro story, coupled with deployment of fiscal budget, should help propel investment spending in infrastructure and further unlock the full potential of growth.
Nomura vs consensus
Nomura's EBITDA estimates are 2% below consensus for 2011F and 1% above consensus for 2012F.
Research analysts
Indonesia Basic Materials
Wilianto Ie - PTNI [email protected] +62 21 2991 3341
Andy Lesmana - PTNI [email protected] +62 21 2991 3344
See Appendix A-1 for analyst certification and important disclosures. Analysts employed by non US affiliates are not registered or qualified as research analysts with FINRA in the US.
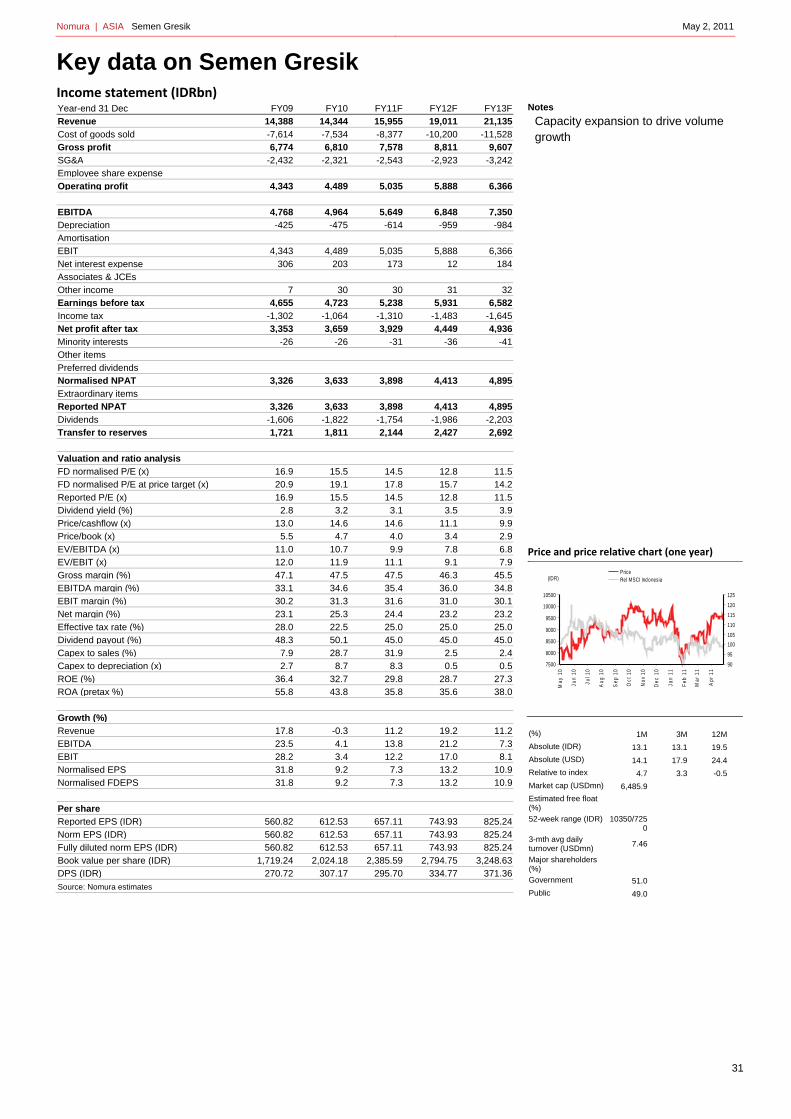
Nomura | ASIA Semen Gresik May 2, 2011
31
Key data on Semen Gresik Income statement (IDRbn) Year-end 31 Dec FY09 FY10 FY11F FY12F FY13FRevenue 14,388 14,344 15,955 19,011 21,135Cost of goods sold -7,614 -7,534 -8,377 -10,200 -11,528Gross profit 6,774 6,810 7,578 8,811 9,607SG&A -2,432 -2,321 -2,543 -2,923 -3,242Employee share expense
Operating profit 4,343 4,489 5,035 5,888 6,366
EBITDA 4,768 4,964 5,649 6,848 7,350Depreciation -425 -475 -614 -959 -984Amortisation
EBIT 4,343 4,489 5,035 5,888 6,366Net interest expense 306 203 173 12 184Associates & JCEs
Other income 7 30 30 31 32Earnings before tax 4,655 4,723 5,238 5,931 6,582Income tax -1,302 -1,064 -1,310 -1,483 -1,645Net profit after tax 3,353 3,659 3,929 4,449 4,936Minority interests -26 -26 -31 -36 -41Other items
Preferred dividends
Normalised NPAT 3,326 3,633 3,898 4,413 4,895Extraordinary items
Reported NPAT 3,326 3,633 3,898 4,413 4,895Dividends -1,606 -1,822 -1,754 -1,986 -2,203Transfer to reserves 1,721 1,811 2,144 2,427 2,692
Valuation and ratio analysis
FD normalised P/E (x) 16.9 15.5 14.5 12.8 11.5FD normalised P/E at price target (x) 20.9 19.1 17.8 15.7 14.2Reported P/E (x) 16.9 15.5 14.5 12.8 11.5Dividend yield (%) 2.8 3.2 3.1 3.5 3.9Price/cashflow (x) 13.0 14.6 14.6 11.1 9.9Price/book (x) 5.5 4.7 4.0 3.4 2.9EV/EBITDA (x) 11.0 10.7 9.9 7.8 6.8EV/EBIT (x) 12.0 11.9 11.1 9.1 7.9Gross margin (%) 47.1 47.5 47.5 46.3 45.5EBITDA margin (%) 33.1 34.6 35.4 36.0 34.8EBIT margin (%) 30.2 31.3 31.6 31.0 30.1Net margin (%) 23.1 25.3 24.4 23.2 23.2Effective tax rate (%) 28.0 22.5 25.0 25.0 25.0Dividend payout (%) 48.3 50.1 45.0 45.0 45.0Capex to sales (%) 7.9 28.7 31.9 2.5 2.4Capex to depreciation (x) 2.7 8.7 8.3 0.5 0.5ROE (%) 36.4 32.7 29.8 28.7 27.3ROA (pretax %) 55.8 43.8 35.8 35.6 38.0
Growth (%)
Revenue 17.8 -0.3 11.2 19.2 11.2EBITDA 23.5 4.1 13.8 21.2 7.3EBIT 28.2 3.4 12.2 17.0 8.1Normalised EPS 31.8 9.2 7.3 13.2 10.9Normalised FDEPS 31.8 9.2 7.3 13.2 10.9
Per share
Reported EPS (IDR) 560.82 612.53 657.11 743.93 825.24Norm EPS (IDR) 560.82 612.53 657.11 743.93 825.24Fully diluted norm EPS (IDR) 560.82 612.53 657.11 743.93 825.24Book value per share (IDR) 1,719.24 2,024.18 2,385.59 2,794.75 3,248.63DPS (IDR) 270.72 307.17 295.70 334.77 371.36Source: Nomura estimates
Notes
Capacity expansion to drive volume growth
Price and price relative chart (one year)
(%) 1M 3M 12M
Absolute (IDR) 13.1 13.1 19.5
Absolute (USD) 14.1 17.9 24.4
Relative to index 4.7 3.3 -0.5
Market cap (USDmn) 6,485.9
Estimated free float (%) 52-week range (IDR) 10350/725
0 3-mth avg daily turnover (USDmn)
7.46
Major shareholders (%) Government 51.0
Public 49.0
7500
8000
8500
9000
9500
10000
10500
90
95
100
105
110
115
120
125
May
10
Jun
10
Jul 1
0
Aug
10
Sep
10
Oct
10
Nov
10
Dec
10
Jan
11
Feb
11
Mar
11
Apr
11
PriceRel MSCI Indonesia(IDR)

Nomura | ASIA Semen Gresik May 2, 2011
32
Cashflow (IDRbn) Year-end 31 Dec FY09 FY10 FY11F FY12F FY13FEBITDA 4,768 4,964 5,649 6,848 7,350Change in working capital 530 -284 -673 -339 -225Other operating cashflow -964 -828 -1,106 -1,440 -1,429Cashflow from operations 4,333 3,853 3,870 5,068 5,695Capital expenditure -1,130 -4,123 -5,096 -481 -514Free cashflow 3,203 -271 -1,227 4,587 5,182Reduction in investments -1,450 1,077 282 -12 -13Net acquisitions 0 0 0 0 0Reduction in other LT assets -38 25 -2 -3 -3Addition in other LT liabilities 49 75 38 59 53Adjustments 0 0 0 0 0Cashflow after investing acts 1,764 907 -910 4,632 5,219Cash dividends -1,606 -1,822 -1,754 -1,986 -2,203Equity issue 404 0 0 0 0Debt issue -78 485 119 -23 -20Convertible debt issue
Others -7 -15 -15 -18 -21Cashflow from financial acts -1,286 -1,352 -1,650 -2,027 -2,243Net cashflow 478 -446 -2,560 2,605 2,975Beginning cash 3,757 4,235 3,789 1,229 3,834Ending cash 4,235 3,789 1,229 3,834 6,809Ending net debt -4,036 -3,103 -424 -3,052 -6,047Source: Nomura estimates
Balance sheet (IDRbn) As at 31 Dec FY09 FY10 FY11F FY12F FY13FCash & equivalents 4,235 3,789 1,229 3,834 6,809Marketable securities 1,049 113 150 150 150Accounts receivable 1,425 1,717 1,967 2,344 2,606Inventories 1,408 1,624 1,721 2,096 2,369Other current assets 91 94 146 174 193Total current assets 8,207 7,338 5,214 8,597 12,127LT investments 565 423 104 116 129Fixed assets 4,014 7,663 12,144 11,667 11,196Goodwill
Other intangible assets
Other LT assets 165 140 143 145 148Total assets 12,951 15,563 17,605 20,525 23,600Short-term debt 91 87 23 20 12Accounts payable 776 892 918 1,118 1,263Other current liabilities 1,427 1,539 1,239 1,479 1,662Total current liabilities 2,295 2,518 2,180 2,616 2,938Long-term debt 107 600 782 762 750Convertible debt
Other LT liabilities 231 306 344 403 456Total liabilities 2,633 3,423 3,306 3,781 4,143Minority interest 120 133 149 167 187Preferred stock 0 0 0 0 0Common stock 2,051 2,051 2,051 2,051 2,051Retained earnings 8,146 9,955 12,099 14,526 17,218Proposed dividends
Other equity and reserves
Total shareholders' equity 10,198 12,006 14,150 16,577 19,269Total equity & liabilities 12,951 15,563 17,605 20,525 23,600
Liquidity (x)
Current ratio 3.58 2.91 2.39 3.29 4.13Interest cover na na na na na
Leverage
Net debt/EBITDA (x) net cash net cash net cash net cash net cashNet debt/equity (%) net cash net cash net cash net cash net cash
Activity (days)
Days receivable 37.0 40.0 42.1 41.5 42.7Days inventory 73.0 73.4 72.9 68.5 70.7Days payable 37.9 40.4 39.4 36.5 37.7Cash cycle 72.1 73.0 75.6 73.5 75.7Source: Nomura estimates
Notes
Free cash flows generation is expected to be strong post completion of capacity expansion at the end of the year
Notes
We expect Gresik to remain conservative in managing its balance sheet; leverage to remain low.
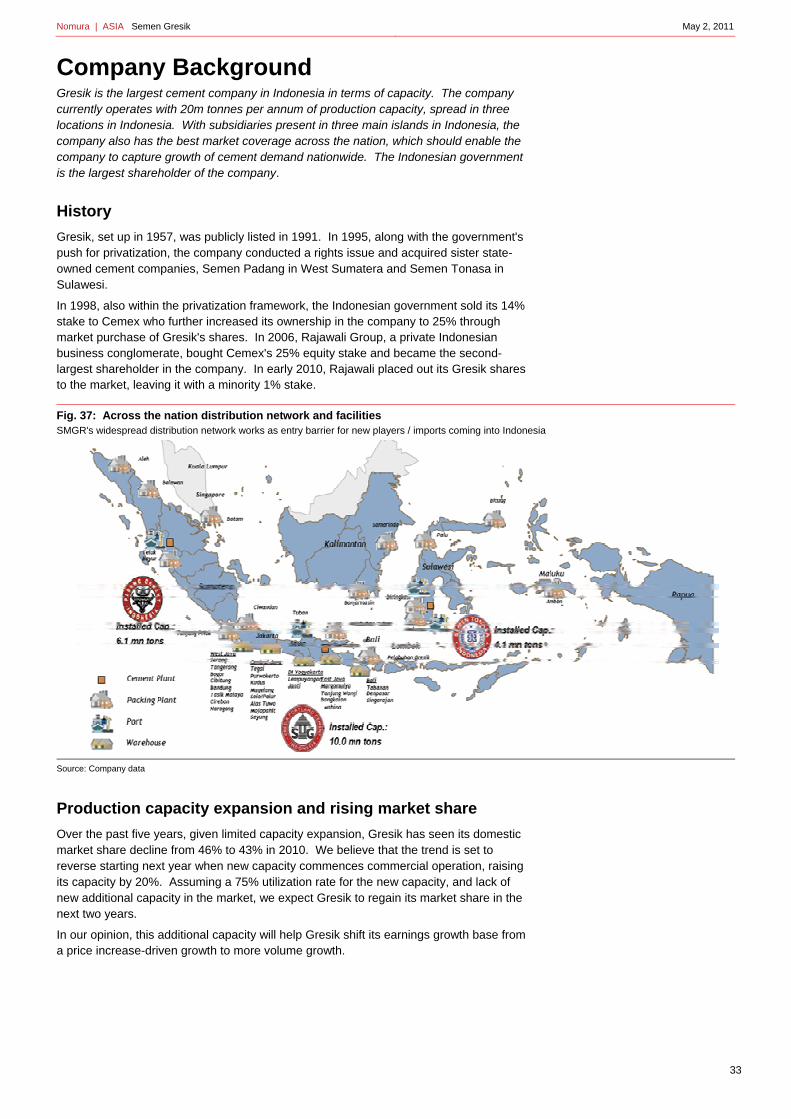
Nomura | ASIA Semen Gresik May 2, 2011
33
Company Background Gresik is the largest cement company in Indonesia in terms of capacity. The company currently operates with 20m tonnes per annum of production capacity, spread in three locations in Indonesia. With subsidiaries present in three main islands in Indonesia, the company also has the best market coverage across the nation, which should enable the company to capture growth of cement demand nationwide. The Indonesian government is the largest shareholder of the company.
History
Gresik, set up in 1957, was publicly listed in 1991. In 1995, along with the government's push for privatization, the company conducted a rights issue and acquired sister state- owned cement companies, Semen Padang in West Sumatera and Semen Tonasa in Sulawesi.
In 1998, also within the privatization framework, the Indonesian government sold its 14% stake to Cemex who further increased its ownership in the company to 25% through market purchase of Gresik's shares. In 2006, Rajawali Group, a private Indonesian business conglomerate, bought Cemex's 25% equity stake and became the second-largest shareholder in the company. In early 2010, Rajawali placed out its Gresik shares to the market, leaving it with a minority 1% stake.
Fig. 37: Across the nation distribution network and facilities SMGR's widespread distribution network works as entry barrier for new players / imports coming into Indonesia
Source: Company data
Production capacity expansion and rising market share
Over the past five years, given limited capacity expansion, Gresik has seen its domestic market share decline from 46% to 43% in 2010. We believe that the trend is set to reverse starting next year when new capacity commences commercial operation, raising its capacity by 20%. Assuming a 75% utilization rate for the new capacity, and lack of new additional capacity in the market, we expect Gresik to regain its market share in the next two years.
In our opinion, this additional capacity will help Gresik shift its earnings growth base from a price increase-driven growth to more volume growth.

Nomura | ASIA Semen Gresik May 2, 2011
34
Fig. 38: Gresik's capacity, sales volume and domestic market share Gresik has been losing market share given its limited capacity expansion
Source: Company data, Indonesia cement association (ASI), Nomura estimates
Price increases
Having kept prices unchanged last year despite rising coal prices, we expect cement companies in Indonesia to adjust their cement selling prices by a conservative 5% in 2011 and 2.5% in 2012 (vs an average of 10% over the past 10 years). A cartel investigation within the industry by an anti-monopoly body prohibited the cement companies from raising their selling prices in 2010. This price increase will reflect higher production costs, primarily coal prices.
Fig. 39: Chart of cement prices, its changes vs inflation
Source: Indonesia cement association (ASI) and Bloomberg
41
42
43
44
45
46
47
48
0
5
10
15
20
25
30
2005 2006 2007 2008 2009 2010 2011F 2012F 2013F
Capacity (LHS) Sales volume (LHS)
Market share (RHS)
(%)
0
200
400
600
800
1,000
1,200
0
5
10
15
20
25
30
2000
2001
2002
2003
2004
2005
2006
2007
2008
2009
2010
2011
Cement price (RHS)
Price chg (%)
Inflation (%)
(%) (Rp'000/t)

Nomura | ASIA Semen Gresik May 2, 2011
35
Fig. 40: Comparison of average industry cement selling price to coal prices
Source: Indonesian cement association; Bloomberg
Dividend Play
Gresik has been a strong dividend play for its investors, thanks to the government ownership that typically requires a significant amount of dividend payout from its state-owned companies. The company has an historical record of 50% dividend payout.
Operating and Financial Assumptions The benefit of having the Indonesian government as a major shareholder in a listed company is probably most apparent in Semen Gresik. Apart from having a healthy financial and cash management system (the Anti-Corruption Watch, the Supreme Audit Agency, and the Ministry of State-Owned Enterprise are three key entities that will keep an watchful eye on state-owned companies), companies that have the Indonesian government as a major shareholder also typically yield high dividend payouts (to help the government’s budget), while at the same time have management teams willing to consider strong business expansion plans that will benefit future business prospect.
Semen Gresik’s 20% expanded capacity is likely to start commencing commercial operations early next year, in our view. In 2009, the company received funding support from local banks (mainly state-owned banks, another advantage for state-owned companies, in our view), to partially fund the capex. While the ongoing capex programme will drain the company’s net cash balance this year, we believe the company is still able to pay dividends at the previous year’s rate of 45%.
Fig. 41: Gresik’s key operating data and financial assumptions
Source: Company data, Nomura estimates
We assume that Gresik would commence its commercial operation of 20% additional capacity (or 5m tpa) by early next year. We also assume an average 5% increase of selling prices in the industry in 2011F followed by some minor price adjustments of 2.5% in each of 2012F and 2013F, considering its additional capacity coming into the industry during those years. We also assume some of its production cost would increase due to
0
20
40
60
80
100
120
140
0
200
400
600
800
1,000
1,200
1,400
2000
2001
2002
2003
2004
2005
2006
2007
2008
2009
2010
2011
Cement price (LHS) Coal price (RHS)(Rp'000/t) (US$/t)
SUMMARY 2004 2005 2006 2007 2008 2009 2010 2011F 2012F 2013F 2014F 2015F 2016F 2017F 2018F 2019F 2020F
Operating Measures
Capacity m tpa 17.60 17.60 18.00 18.00 19.00 20.20 25.20 26.00 28.50 30.50 30.50 30.50 30.50 30.50 30.50 Production m tons 16.54 17.00 17.67 17.66 17.92 19.11 22.18 24.15 26.02 28.40 29.19 29.19 29.19 29.19 29.19 Utilization rate % 94.0% 96.6% 98.2% 98.1% 94.3% 94.6% 88.0% 92.9% 91.3% 93.1% 95.7% 95.7% 95.7% 95.7% 95.7%
Avg Price per ton Rp'000/t 528 565 691 815 800 835 857 875 895 953 1,013 1,077 1,145 1,216 1,293 Rp'000/bag 26 28 35 41 40 42 43 44 45 48 51 54 57 61 65 % chg 7% 22% 18% ‐2% 4% 3% 2% 2% 7% 6% 6% 6% 6% 6%
Cost per tonProduction Cash CRp'000/t 302 305 363 409 396 409 420 440 461 484 510 538 567 599 633 COGS per ton Rp'000/t 327 329 388 431 420 438 460 477 496 522 548 576 607 639 674 Total Cost per TonRp'000/t 420 424 499 569 550 572 592 612 633 661 694 731 770 812 857
EBITDA per ton Rp'000/t 135 167 219 270 277 296 309 304 301 332 361 388 418 448 481
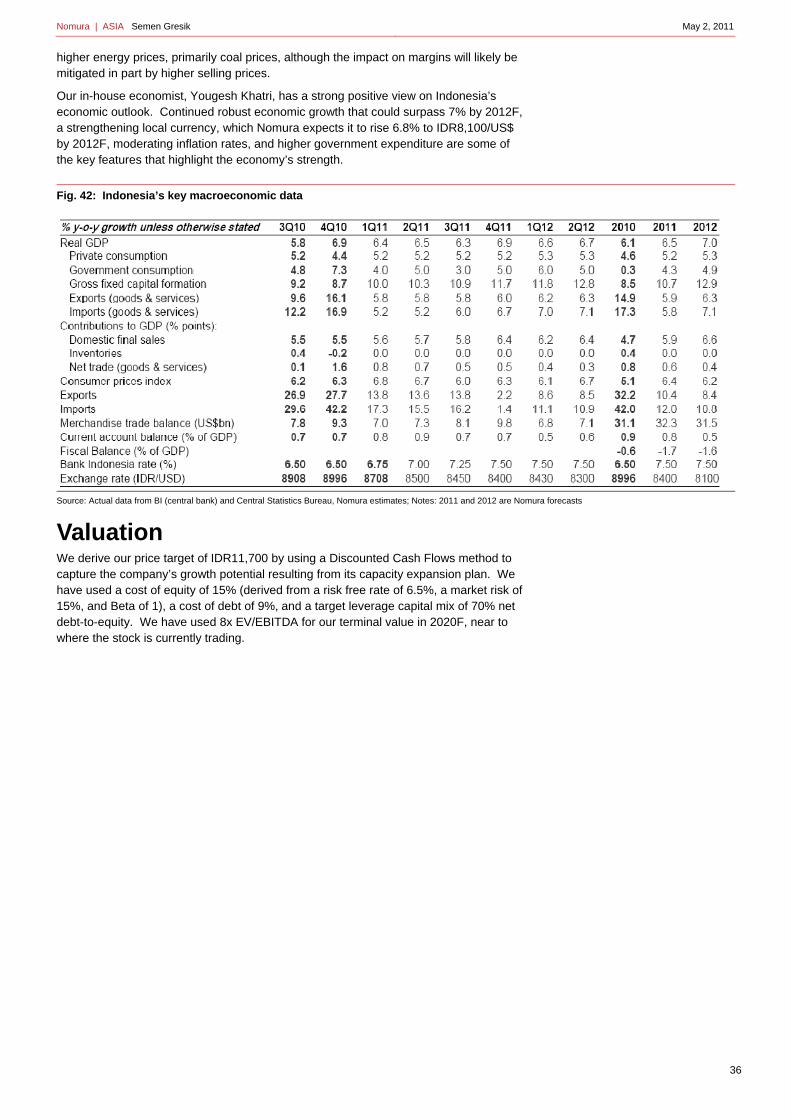
Nomura | ASIA Semen Gresik May 2, 2011
36
higher energy prices, primarily coal prices, although the impact on margins will likely be mitigated in part by higher selling prices.
Our in-house economist, Yougesh Khatri, has a strong positive view on Indonesia’s economic outlook. Continued robust economic growth that could surpass 7% by 2012F, a strengthening local currency, which Nomura expects it to rise 6.8% to IDR8,100/US$ by 2012F, moderating inflation rates, and higher government expenditure are some of the key features that highlight the economy’s strength.
Fig. 42: Indonesia’s key macroeconomic data
Source: Actual data from BI (central bank) and Central Statistics Bureau, Nomura estimates; Notes: 2011 and 2012 are Nomura forecasts
Valuation We derive our price target of IDR11,700 by using a Discounted Cash Flows method to capture the company’s growth potential resulting from its capacity expansion plan. We have used a cost of equity of 15% (derived from a risk free rate of 6.5%, a market risk of 15%, and Beta of 1), a cost of debt of 9%, and a target leverage capital mix of 70% net debt-to-equity. We have used 8x EV/EBITDA for our terminal value in 2020F, near to where the stock is currently trading.

Nomura | ASIA Semen Gresik May 2, 2011
37
Fig. 43: Gresik’s DCF Model
Source: Company data, Nomura estimates
Risks and Sensitivities
Pricing risk
We assume that cement players including Gresik would be able to increase its selling prices this year by an average of 5% after failing to make price adjustments in 2010 due to anti-monopoly investigations. The rise will primarily reflect higher energy and production costs. However, in the event that the price increase is less than our expectations or none at all, it would affect our forecasts and valuations for Gresik. A 5% cut in the selling price would result in a 16% decline in our valuation.
Production costs risks
Energy costs represent 50% of Gresik’s total production costs, with coal accounting for most of the cost. Global economic recovery has resulted in coal prices picking up since 2009 from its low. While cement companies typically secure their coal supply and prices on annual basis, some portion would remain expose to spot prices and hence volatility in general coal prices. We expect that a 5% energy / coal prices rise would result in 3.4% decline in our valuation target.
Volume risk
We forecasts Gresik’s sale volume to grow 6.6% in 2011F and 16% in 2012F to 19.1mn tonnes and 22.2mn tonnes, respectively. A 5% lower sales volume would lower our valuation by 8.5%.
Discounted Cashflows 2005 2006 2007 2008 2009 2010 2011F 2012F 2013F 2014F 2015F 2016F 2017F 2018F 2019F 2020F
Calculation of Unlevered After Tax Free Cash FlowTaxable EBIT 1,779 2,397 3,387 4,343 4,489 5,035 5,888 6,366 6,819 8,283 9,336 10,114 10,937 11,788 12,706
Taxes 25% (445) (599) (847) (1,086) (1,122) (1,259) (1,472) (1,591) (1,705) (2,071) (2,334) (2,528) (2,734) (2,947) (3,176)
After Tax Cash Flow 1,335 1,798 2,540 3,257 3,367 3,776 4,416 4,774 5,114 6,212 7,002 7,585 8,203 8,841 9,529
Add/(Less):Depreciation and Amortization 446 441 474 425 475 614 959 984 1,011 1,160 1,190 1,223 1,257 1,293 1,332 Change in Working Capital ‐ 35 (82) (242) 530 (284) (673) (339) (225) (228) (372) (245) (168) (178) (187) Capital Expenditure ‐ (189) (368) (693) (1,130) (4,123) (5,096) (481) (514) (544) (3,016) (615) (653) (695) (738)
Unlevered After Tax Free Cash Flow 1,780 2,085 2,564 2,747 3,241 (16) (394) 4,938 5,386 6,601 4,805 7,948 8,639 9,262 9,937
Discount Rate 9.8% 10.8% 11.8% Total Debt 805 Rf 6.50% Cost of Equity 15.00% # of share 5,932
Terminal EBITDA x 7.0 x 8.0 x 9.0 x Cash & Equivalent (1,379) Rm 15.00% Cost of Debt 9.00% FX 8,650 Perpetuity Rate 1.0% 2.0% 3.0% Minority Interest 149 Beta 1.00 Leverage 70.00%
Total Net Debt (425) Cost of Equity 15.0% WACC 10.80%
2005 2006 2007 2008 2009 2010 2011 2012 2013 2014 2015 2016 2017 2018 2019 2020
Unlevered After Tax Free Cash Flow 1,780 2,085 2,564 2,747 3,241 (16) (394) 4,938 5,386 6,601 4,805 7,948 8,639 9,262 9,937 Growth 17% 23% 7% 18% ‐101% 2301% ‐1352% 9% 23% ‐27% 65% 9% 7% 7%
EBITDA 14,038
NPV of 10‐Year Cash Flow NPV of Terminal Value Total Firm Value Total Equity Value Price per Share(Rp. bn) (Excl. Terminal Value) EBITDA Terminal Multiple EBITDA Terminal Multiple EBITDA Terminal Multiple EBITDA Terminal Multiple(US$ mm) 7.0 x 8.0 x 9.0 x 7.0 x 8.0 x 9.0 x 7.0 x 8.0 x 9.0 x 7.0 x 8.0 x 9.0 x
Discount Rates9.8% 30,086 38,581 44,093 49,604 68,667 74,179 79,690 69,092 74,604 80,115 11,648 12,578 13,507
3,478 4,460 5,097 5,735 7,938 8,576 9,213 7,988 8,625 9,262 1.35 1.45 1.56
10.8% 28,340 35,237 40,271 45,305 63,578 68,612 73,645 64,003 69,037 74,070 10,790 11,639 12,488
3,276 4,074 4,656 5,238 7,350 7,932 8,514 7,399 7,981 8,563 1.25 1.35 1.44 11.8% 26,722 32,209 36,811 41,412 58,931 63,532 68,133 59,356 63,957 68,559 10,007 10,783 11,558
3,089 3,724 4,256 4,787 6,813 7,345 7,877 6,862 7,394 7,926 1.16 1.25 1.34
WACCNet Debt 2011 (Rp. bn)Assumptions Equity Cost of Fund
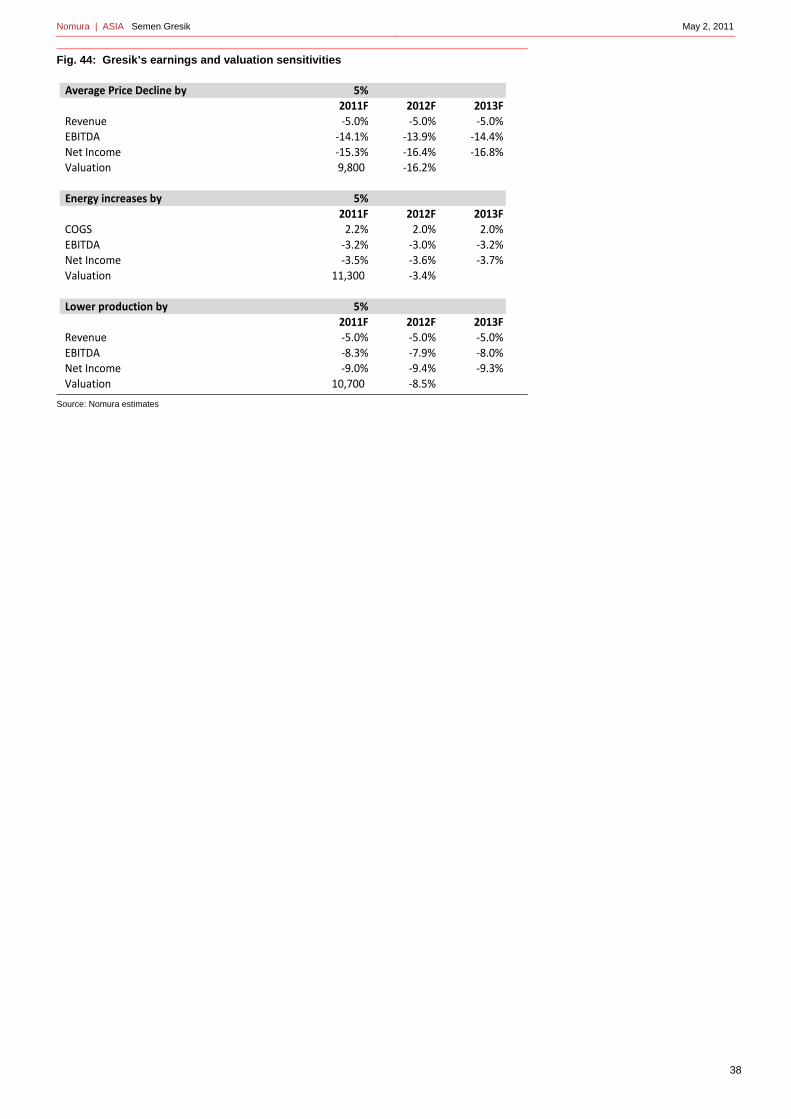
Nomura | ASIA Semen Gresik May 2, 2011
38
Fig. 44: Gresik’s earnings and valuation sensitivities
Source: Nomura estimates
Average Price Decline by 5%2011F 2012F 2013F
Revenue ‐5.0% ‐5.0% ‐5.0%EBITDA ‐14.1% ‐13.9% ‐14.4%Net Income ‐15.3% ‐16.4% ‐16.8%Valuation 9,800 ‐16.2%
Energy increases by 5%2011F 2012F 2013F
COGS 2.2% 2.0% 2.0%EBITDA ‐3.2% ‐3.0% ‐3.2%Net Income ‐3.5% ‐3.6% ‐3.7%Valuation 11,300 ‐3.4%
Lower production by 5%2011F 2012F 2013F
Revenue ‐5.0% ‐5.0% ‐5.0%EBITDA ‐8.3% ‐7.9% ‐8.0%Net Income ‐9.0% ‐9.4% ‐9.3%Valuation 10,700 ‐8.5%

Key company data: See page 2 for company data, and detailed price/index chart. Rating: See report end for details of Nomura’s rating system.
Indocement Tunggal PerkasaINTP.JK INTP IJ
CONSTRUCTION MATERIALS
EQUITY RESEARCH
Better alternative
Trading premium gap to peers is unwarranted with lower growth potential
May 2, 2011
Rating Starts at
Neutral
Target price Starts at17,200
IDR 17,200
Closing price April 28, 2011
IDR 17,100
Potential upside +0.6%
Action: NEUTRAL – valuation premium gap is unwarranted We believe that current share price of Indocement fully reflects the value of the company, and that the valuation premium gap with its closest peer, Gresik, currently is unwarranted given Gresik’s growth potential profile. We prefer Gresik over Indocement.
Catalysts: Later-stage capacity expansion In line with industry growth and its peers, Indocement is adding capacity expansion that is expected to come on stream by 2013. Capacity is expected to increase 10% from its current level of 18m tpa to 20m tpa that will be in operational in 2013. Given new capacity is only contributing at a later stage, near-term growth potential for Indocement will mainly be driven by improvement in selling price and efficiencies, in our view.
Valuation In line with other cement companies, we have derived our target price for Indocement using DCF to capture future capacity expansion. At the current share price, the company is trading at 17.5x FY12F P/E and 10.4x FY12F EV/EBITDA, which is more than a 30% premium to Gresik.
Risks – higher energy prices and selling price Key risks for Indocement in achieving its forecast numbers are higher energy prices (primarily for coal), and the inability of the company to secure higher selling price to compensate for these higher energy costs.
31 Dec FY10 FY11F FY12F FY13F
Currency (IDR) Actual Old New Old New Old New
Revenue (bn) 11,138 12,909 13,547 15,051
Reported net profit (bn) 3,225 3,516 3,687 4,041
Normalised net profit (bn) 3,225 3,516 3,687 4,041
Normalised EPS 876.0 955.2 1,001.6 1,097.8
Norm. EPS growth (%) 17.4 9.0 4.9 9.6
Norm. P/E (x) 19.6 N/A 18.0 N/A 17.2 N/A 15.7
EV/EBITDA 12.7 N/A 11.1 N/A 10.3 N/A 9.1
Price/book (x) 4.8 N/A 4.1 N/A 3.5 N/A 3.0
Dividend yield (%) 1.3 N/A 1.7 N/A 1.7 N/A 1.9
ROE (%) 27.1 24.6 21.9 20.7
Net debt/equity (%) net cash net cash net cash net cash
Source: Nomura estimates
Anchor themes
Indonesia's economy is set to take on a new growth trajectory. A robust macro story, coupled with deployment of the fiscal budget, should help propel investment spending in infrastructure to further unlock full growth potential.
Nomura vs consensus
Nomura's EBITDA estimates are 5% and 15% below consensus for 2011F and 2012F, respectively.
Research analysts
Indonesia Basic Materials
Wilianto Ie - PTNI [email protected] +62 21 2991 3341
Andy Lesmana - PTNI [email protected] +62 21 2991 3344
See Appendix A-1 for analyst certification and important disclosures. Analysts employed by non US affiliates are not registered or qualified as research analysts with FINRA in the US.

Nomura | ASIA Indocement Tunggal Perkasa May 2, 2011
Key data on Indocement Tunggal Perkasa Income statement (IDRbn) Year-end 31 Dec FY09 FY10 FY11F FY12F FY13FRevenue 10,576 11,138 12,909 13,547 15,051Cost of goods sold -5,468 -5,597 -6,671 -7,018 -7,846Gross profit 5,108 5,541 6,238 6,529 7,205SG&A -1,415 -1,521 -1,722 -1,833 -2,100Employee share expense
Operating profit 3,693 4,020 4,517 4,696 5,105
EBITDA 4,263 4,641 5,153 5,352 5,797Depreciation -569 -621 -636 -656 -692Amortisation
EBIT 3,693 4,020 4,517 4,696 5,105Net interest expense 39 167 128 178 237Associates & JCEs
Other income 64 62 44 43 46Earnings before tax 3,796 4,248 4,689 4,917 5,389Income tax -1,048 -1,024 -1,172 -1,229 -1,347Net profit after tax 2,749 3,225 3,517 3,688 4,042Minority interests -2 0 0 -1 -1Other items
Preferred dividends
Normalised NPAT 2,747 3,225 3,516 3,687 4,041Extraordinary items
Reported NPAT 2,747 3,225 3,516 3,687 4,041Dividends -552 -828 -1,055 -1,106 -1,212Transfer to reserves 2,194 2,397 2,461 2,581 2,829
Valuation and ratio analysis
FD normalised P/E (x) 23.1 19.6 18.0 17.2 15.7FD normalised P/E at price target (x) 23.1 19.6 18.0 17.2 15.7Reported P/E (x) 23.1 19.6 18.0 17.2 15.7Dividend yield (%) 0.9 1.3 1.7 1.7 1.9Price/cashflow (x) 17.7 20.3 17.9 15.7 15.1Price/book (x) 5.9 4.8 4.1 3.5 3.0EV/EBITDA (x) 14.3 12.7 11.1 10.3 9.1EV/EBIT (x) 16.5 14.7 12.6 11.7 10.3Gross margin (%) 48.3 49.7 48.3 48.2 47.9EBITDA margin (%) 40.3 41.7 39.9 39.5 38.5EBIT margin (%) 34.9 36.1 35.0 34.7 33.9Net margin (%) 26.0 29.0 27.2 27.2 26.9Effective tax rate (%) 27.6 24.1 25.0 25.0 25.0Dividend payout (%) 20.1 25.7 30.0 30.0 30.0Capex to sales (%) 7.0 4.9 5.3 7.4 6.7Capex to depreciation (x) 1.3 0.9 1.1 1.5 1.5ROE (%) 28.6 27.1 24.6 21.9 20.7ROA (pretax %) 34.9 37.7 41.1 40.6 41.9
Growth (%)
Revenue 8.1 5.3 15.9 4.9 11.1EBITDA 39.4 8.9 11.0 3.9 8.3EBIT 50.1 8.8 12.4 4.0 8.7Normalised EPS 57.4 17.4 9.0 4.9 9.6Normalised FDEPS 57.4 17.4 9.0 4.9 9.6
Per share
Reported EPS (IDR) 746.12 876.05 955.23 1,001.62 1,097.78Norm EPS (IDR) 746.12 876.05 955.23 1,001.62 1,097.78Fully diluted norm EPS (IDR) 746.12 876.05 955.23 1,001.62 1,097.78Book value per share (IDR) 2,901.40 3,552.45 4,221.11 4,922.25 5,690.69DPS (IDR) 150.00 225.00 286.57 300.49 329.33Source: Nomura estimates
Notes
Indocement’s financial position is expected to remain strong and remain in a net cash position
Price and price relative chart (one year)
(%) 1M 3M 12M
Absolute (IDR) 20.3 20.3 19.0
Absolute (USD) 21.4 25.4 23.9
Relative to index 11.9 10.5 -1.0
Market cap (USDmn) 7,287.9
Estimated free float (%) 52-week range (IDR) 19400/127
50 3-mth avg daily turnover (USDmn)
7.52
Major shareholders (%) Birchwood (Heidelberg)
0.5
Mekar Perkasa 0.1
12000
14000
16000
18000
20000
80
85
90
95
100
105
110
115
120
May
10
Jun
10
Jul 1
0
Aug
10
Sep
10
Oct
10
Nov
10
Dec
10
Jan
11
Feb
11
Mar
11
Apr
11
PriceRel MSCI Indonesia(IDR)
40
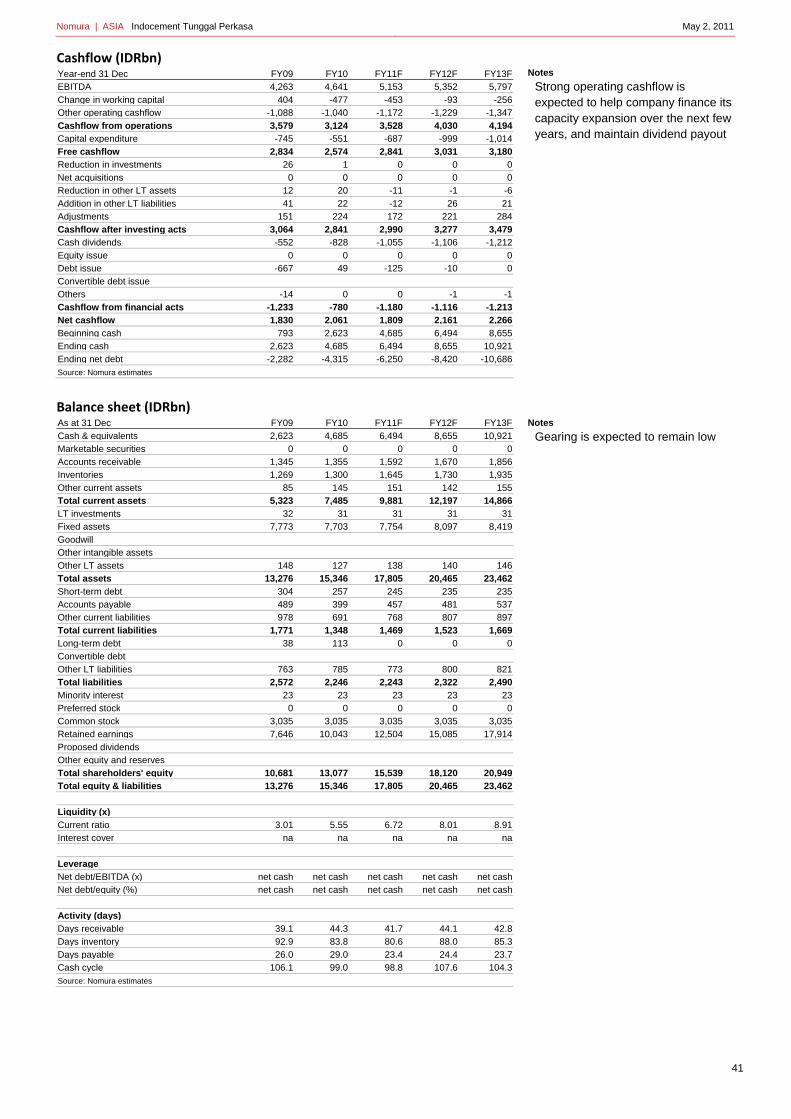
Nomura | ASIA Indocement Tunggal Perkasa May 2, 2011
Cashflow (IDRbn) Year-end 31 Dec FY09 FY10 FY11F FY12F FY13FEBITDA 4,263 4,641 5,153 5,352 5,797Change in working capital 404 -477 -453 -93 -256Other operating cashflow -1,088 -1,040 -1,172 -1,229 -1,347Cashflow from operations 3,579 3,124 3,528 4,030 4,194Capital expenditure -745 -551 -687 -999 -1,014Free cashflow 2,834 2,574 2,841 3,031 3,180Reduction in investments 26 1 0 0 0Net acquisitions 0 0 0 0 0Reduction in other LT assets 12 20 -11 -1 -6Addition in other LT liabilities 41 22 -12 26 21Adjustments 151 224 172 221 284Cashflow after investing acts 3,064 2,841 2,990 3,277 3,479Cash dividends -552 -828 -1,055 -1,106 -1,212Equity issue 0 0 0 0 0Debt issue -667 49 -125 -10 0Convertible debt issue
Others -14 0 0 -1 -1Cashflow from financial acts -1,233 -780 -1,180 -1,116 -1,213Net cashflow 1,830 2,061 1,809 2,161 2,266Beginning cash 793 2,623 4,685 6,494 8,655Ending cash 2,623 4,685 6,494 8,655 10,921Ending net debt -2,282 -4,315 -6,250 -8,420 -10,686Source: Nomura estimates
Balance sheet (IDRbn) As at 31 Dec FY09 FY10 FY11F FY12F FY13FCash & equivalents 2,623 4,685 6,494 8,655 10,921Marketable securities 0 0 0 0 0Accounts receivable 1,345 1,355 1,592 1,670 1,856Inventories 1,269 1,300 1,645 1,730 1,935Other current assets 85 145 151 142 155Total current assets 5,323 7,485 9,881 12,197 14,866LT investments 32 31 31 31 31Fixed assets 7,773 7,703 7,754 8,097 8,419Goodwill
Other intangible assets
Other LT assets 148 127 138 140 146Total assets 13,276 15,346 17,805 20,465 23,462Short-term debt 304 257 245 235 235Accounts payable 489 399 457 481 537Other current liabilities 978 691 768 807 897Total current liabilities 1,771 1,348 1,469 1,523 1,669Long-term debt 38 113 0 0 0Convertible debt
Other LT liabilities 763 785 773 800 821Total liabilities 2,572 2,246 2,243 2,322 2,490Minority interest 23 23 23 23 23Preferred stock 0 0 0 0 0Common stock 3,035 3,035 3,035 3,035 3,035Retained earnings 7,646 10,043 12,504 15,085 17,914Proposed dividends
Other equity and reserves
Total shareholders' equity 10,681 13,077 15,539 18,120 20,949Total equity & liabilities 13,276 15,346 17,805 20,465 23,462
Liquidity (x)
Current ratio 3.01 5.55 6.72 8.01 8.91Interest cover na na na na na
Leverage
Net debt/EBITDA (x) net cash net cash net cash net cash net cashNet debt/equity (%) net cash net cash net cash net cash net cash
Activity (days)
Days receivable 39.1 44.3 41.7 44.1 42.8Days inventory 92.9 83.8 80.6 88.0 85.3Days payable 26.0 29.0 23.4 24.4 23.7Cash cycle 106.1 99.0 98.8 107.6 104.3Source: Nomura estimates
Notes
Strong operating cashflow is expected to help company finance its capacity expansion over the next few years, and maintain dividend payout
Notes
Gearing is expected to remain low
41

Nomura | ASIA Indocement Tunggal Perkasa May 2, 2011
42
Company background Largest single-entity cement company in Indonesia.
Indocement is the largest single-entity cement company in Indonesia. The company operates 12 cement plants with total capacity of 18m tons per annum. The company covers the nation's cement demand from three different production locations -- the Greater Jakarta area, West Java and South Kalimantan.
History The company was established in 1985 through the amalgamation of six different companies that owned eight cement plants. Subsequent to its listing on the Indonesian stock exchange in 1989, the company has steadily expanded its capacity by adding two new plants and acquiring two other cement companies.
In 2000, Heidelberg Cement became the main shareholder of the company and further increased its stake in 2003 through an acquisition of additional shares from the government, increasing its stake to slightly more than 65%. In 2009, Heidelberg did a placement of its 14% ownership in Indocement, reducing its stake in the company to 51% while retaining majority control over the company.
Capacity expansion
Given increasing demand, the company has been steadily increasing its production capacity from 15.9m tpa in 2004, to 18.6m tpa in 2010. Further additional capacity is expected to come on stream in 2013 (20.6m tpa) and 2014 (22.6 m tpa), primarily from the Greater Jakarta and West Java plants.
Fig. 45: Distribution of Indocement production plants
Source: Company data
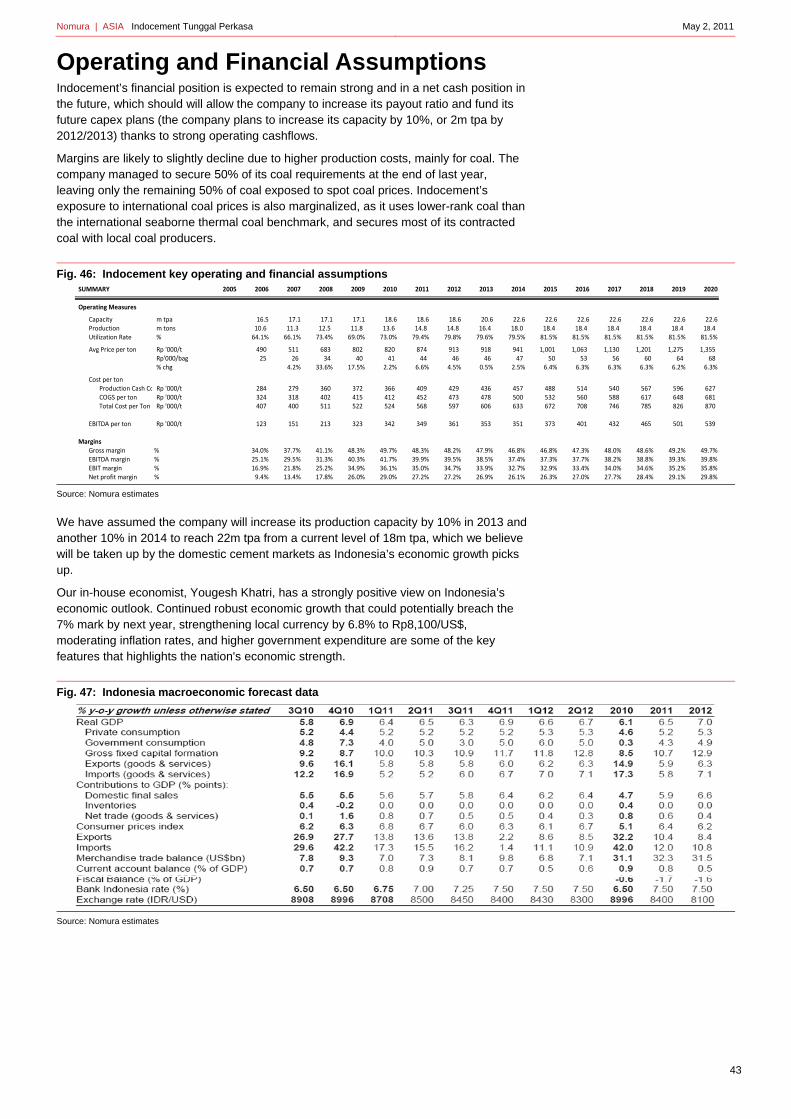
Nomura | ASIA Indocement Tunggal Perkasa May 2, 2011
43
Operating and Financial Assumptions Indocement’s financial position is expected to remain strong and in a net cash position in the future, which should will allow the company to increase its payout ratio and fund its future capex plans (the company plans to increase its capacity by 10%, or 2m tpa by 2012/2013) thanks to strong operating cashflows.
Margins are likely to slightly decline due to higher production costs, mainly for coal. The company managed to secure 50% of its coal requirements at the end of last year, leaving only the remaining 50% of coal exposed to spot coal prices. Indocement’s exposure to international coal prices is also marginalized, as it uses lower-rank coal than the international seaborne thermal coal benchmark, and secures most of its contracted coal with local coal producers.
Fig. 46: Indocement key operating and financial assumptions
Source: Nomura estimates
We have assumed the company will increase its production capacity by 10% in 2013 and another 10% in 2014 to reach 22m tpa from a current level of 18m tpa, which we believe will be taken up by the domestic cement markets as Indonesia’s economic growth picks up.
Our in-house economist, Yougesh Khatri, has a strongly positive view on Indonesia’s economic outlook. Continued robust economic growth that could potentially breach the 7% mark by next year, strengthening local currency by 6.8% to Rp8,100/US$, moderating inflation rates, and higher government expenditure are some of the key features that highlights the nation's economic strength.
Fig. 47: Indonesia macroeconomic forecast data
Source: Nomura estimates
SUMMARY 2004 2005 2006 2007 2008 2009 2010 2011 2012 2013 2014 2015 2016 2017 2018 2019 2020
Operating Measures
Capacity m tpa 16.5 17.1 17.1 17.1 18.6 18.6 18.6 20.6 22.6 22.6 22.6 22.6 22.6 22.6 22.6Production m tons 10.6 11.3 12.5 11.8 13.6 14.8 14.8 16.4 18.0 18.4 18.4 18.4 18.4 18.4 18.4 Utilization Rate % 64.1% 66.1% 73.4% 69.0% 73.0% 79.4% 79.8% 79.6% 79.5% 81.5% 81.5% 81.5% 81.5% 81.5% 81.5%
Avg Price per ton Rp '000/t 490 511 683 802 820 874 913 918 941 1,001 1,063 1,130 1,201 1,275 1,355 Rp'000/bag 25 26 34 40 41 44 46 46 47 50 53 56 60 64 68 % chg 4.2% 33.6% 17.5% 2.2% 6.6% 4.5% 0.5% 2.5% 6.4% 6.3% 6.3% 6.3% 6.2% 6.3%
Cost per tonProduction Cash Co Rp '000/t 284 279 360 372 366 409 429 436 457 488 514 540 567 596 627 COGS per ton Rp '000/t 324 318 402 415 412 452 473 478 500 532 560 588 617 648 681 Total Cost per Ton Rp '000/t 407 400 511 522 524 568 597 606 633 672 708 746 785 826 870
EBITDA per ton Rp '000/t 123 151 213 323 342 349 361 353 351 373 401 432 465 501 539
MarginsGross margin % 34.0% 37.7% 41.1% 48.3% 49.7% 48.3% 48.2% 47.9% 46.8% 46.8% 47.3% 48.0% 48.6% 49.2% 49.7%EBITDA margin % 25.1% 29.5% 31.3% 40.3% 41.7% 39.9% 39.5% 38.5% 37.4% 37.3% 37.7% 38.2% 38.8% 39.3% 39.8%EBIT margin % 16.9% 21.8% 25.2% 34.9% 36.1% 35.0% 34.7% 33.9% 32.7% 32.9% 33.4% 34.0% 34.6% 35.2% 35.8%Net profit margin % 9.4% 13.4% 17.8% 26.0% 29.0% 27.2% 27.2% 26.9% 26.1% 26.3% 27.0% 27.7% 28.4% 29.1% 29.8%

Nomura | ASIA Indocement Tunggal Perkasa May 2, 2011
44
Valuation Consistent with other cement companies, we have valued Indocement using DCF so as to reflect growth driven by the planned capacity expansion over the next three years.
We have used cost of equity of 15% (derived from a risk-free rate of 6.5%, market risk of 15%, and beta of 1), cost of debt of 9%, and target leverage capital mix of 70% net debt to equity. We have used an 8x EV/EBITDA multiple for our terminal value in 2020, which is approximately the level at which its peers are trading.
Fig. 48: Indocement DCF Model
Source: Nomura estimates
Share price multiple valuation
Indocement's share price performance has been reflecting a premium multiple valuation compared to its closest peer, Gresik. Recently, the premium gap at which Indocement has been trading has widened. On a P/E basis, the gap has increased to 30%, which we view as unwarranted. While the premium gap remains, we also believe that it will narrow as Gresik's share price factors in the company's growth potential.
Fig. 49: PE Trading multiples comparison: Market vs cement companies
Source: Bloomberg
Discounted Cashflows 2005 2006 2007 2008 2009 2010 2011 2012 2013 2014 2015 2016 2017 2018 2019 2020
Calculation of Unlevered After Tax Free Cash FlowTaxable EBIT 1,068 1,593 2,460 3,693 4,020 4,517 4,696 5,105 5,531 6,060 6,539 7,081 7,663 8,275 8,933
Taxes 25% (267) (398) (615) (923) (1,005) (1,129) (1,174) (1,276) (1,383) (1,515) (1,635) (1,770) (1,916) (2,069) (2,233)
After Tax Cash Flow 801 1,195 1,845 2,770 3,015 3,387 3,522 3,829 4,148 4,545 4,904 5,311 5,747 6,206 6,700
Add/(Less):Depreciation and Amortization 517 564 599 569 621 636 656 692 783 813 845 879 916 954 995 Change in Working Capital 15 (46) (413) 404 (477) (453) (93) (256) (323) (247) (172) (175) (187) (196) (210) Capital Expenditure ‐ (384) (485) (597) (745) (551) (687) (999) (1,014) (1,014) (562) (598) (635) (675) (718)
Unlevered After Tax Free Cash Flow 1,332 1,329 1,546 3,146 2,414 3,020 3,398 3,266 3,594 4,096 5,016 5,417 5,841 6,289 6,768
Discount Rate 9.8% 10.8% 11.8% Total Debt 245 Rf 6.50% Cost of Equity 15.00% # of shares 3,681
Terminal EBITDA x 7.0 x 8.0 x 9.0 x Cash & Equivalent (6,494) Rm 15.00% Cost of Debt 9.00% FX 8,650 Perpetuity Rate 1.0% 2.0% 3.0% Minority Interest 23 Beta 1.00 Leverage 70.00%
Total Net Debt (6,227) Cost of Equity 15.0% WACC 10.80%
2005 2006 2007 2008 2009 2010 2011 2012 2013 2014 2015 2016 2017 2018 2019 2020
Unlevered After Tax Free Cash Flow 1,332 1,329 1,546 3,146 2,414 3,020 3,398 3,266 3,594 4,096 5,016 5,417 5,841 6,289 6,768 Growth 0% 16% 104% ‐23% 25% 13% ‐4% 10% 14% 22% 8% 8% 8% 8%
EBITDA 9,929
NPV of 10‐Year Cash Flow NPV of Terminal Value Total Firm Value Total Equity Value Price per Share(Rp. bn) (Excl. Terminal Value) EBITDA Terminal Multiple EBITDA Terminal Multiple EBITDA Terminal Multiple EBITDA Terminal Multiple(US$ mm) 7.0 x 8.0 x 9.0 x 7.0 x 8.0 x 9.0 x 7.0 x 8.0 x 9.0 x 7.0 x 8.0 x 9.0 x
Discount Rates9.8% 26,501 29,962 34,242 38,522 56,463 60,743 65,024 62,690 66,970 71,250 17,030 18,192 19,355
3,064 3,464 3,959 4,453 6,528 7,022 7,517 7,247 7,742 8,237 1.97 2.10 2.24
10.8% 25,325 27,614 31,559 35,504 52,939 56,884 60,829 59,166 63,111 67,055 16,072 17,144 18,215
2,928 3,192 3,648 4,104 6,120 6,576 7,032 6,840 7,296 7,752 1.86 1.98 2.11 11.8% 24,224 25,469 29,107 32,746 49,693 53,331 56,970 55,919 59,558 63,196 15,190 16,179 17,167
2,800 2,944 3,365 3,786 5,745 6,165 6,586 6,465 6,885 7,306 1.76 1.87 1.98
Assumptions Net Debt 2011 (Rp. bn) Equity Cost of Fund WACC
0
5
10
15
20
25
30
35
40
45
Jan
-08
Mar
-08
May
-08
Jul-
08
Sep
-08
No
v-08
Jan
-09
Mar
-09
May
-09
Jul-
09
Sep
-09
No
v-09
Jan
-10
Mar
-10
May
-10
Jul-
10
Sep
-10
No
v-10
Jan
-11
Mar
-11
Market SMGR SMCB INTP
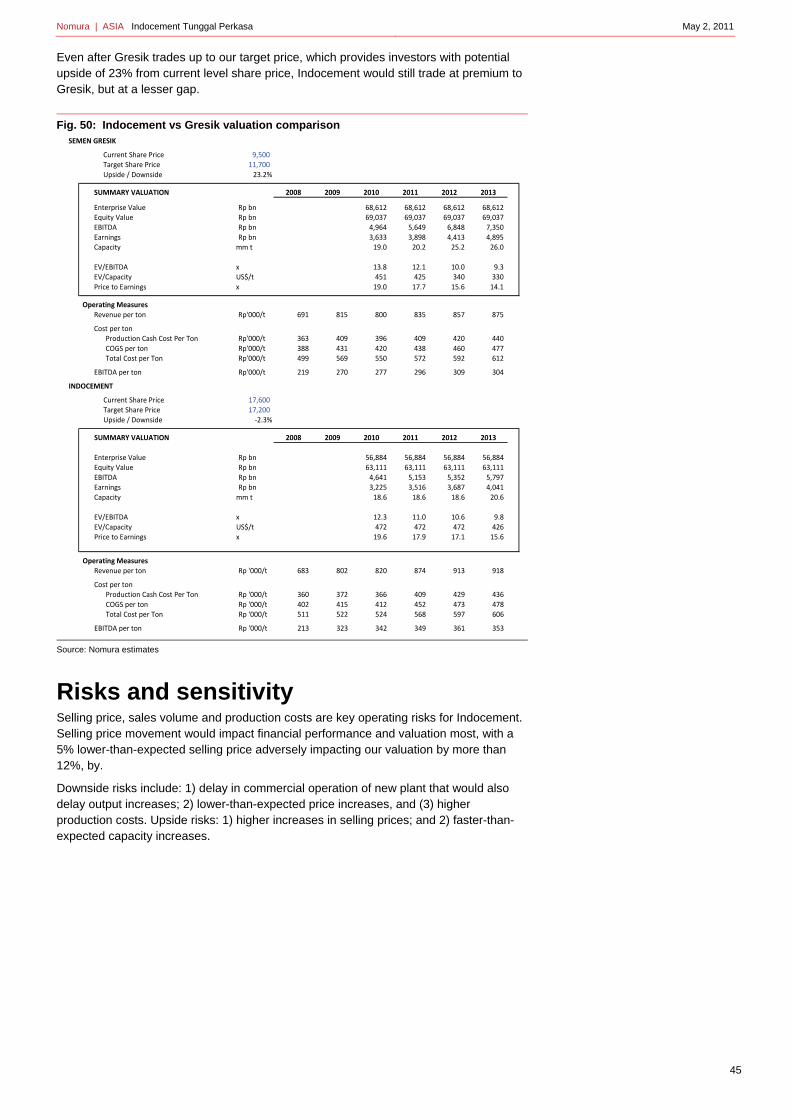
Nomura | ASIA Indocement Tunggal Perkasa May 2, 2011
45
Even after Gresik trades up to our target price, which provides investors with potential upside of 23% from current level share price, Indocement would still trade at premium to Gresik, but at a lesser gap.
Fig. 50: Indocement vs Gresik valuation comparison
Source: Nomura estimates
Risks and sensitivity Selling price, sales volume and production costs are key operating risks for Indocement. Selling price movement would impact financial performance and valuation most, with a 5% lower-than-expected selling price adversely impacting our valuation by more than 12%, by.
Downside risks include: 1) delay in commercial operation of new plant that would also delay output increases; 2) lower-than-expected price increases, and (3) higher production costs. Upside risks: 1) higher increases in selling prices; and 2) faster-than-expected capacity increases.
SEMEN GRESIK
Current Share Price 9,500 Target Share Price 11,700 Upside / Downside 23.2%
SUMMARY VALUATION 2008 2009 2010 2011 2012 2013
Enterprise Value Rp bn 68,612 68,612 68,612 68,612 Equity Value Rp bn 69,037 69,037 69,037 69,037 EBITDA Rp bn 4,964 5,649 6,848 7,350 Earnings Rp bn 3,633 3,898 4,413 4,895 Capacity mm t 19.0 20.2 25.2 26.0
EV/EBITDA x 13.8 12.1 10.0 9.3 EV/Capacity US$/t 451 425 340 330 Price to Earnings x 19.0 17.7 15.6 14.1
Operating MeasuresRevenue per ton Rp'000/t 691 815 800 835 857 875
Cost per tonProduction Cash Cost Per Ton Rp'000/t 363 409 396 409 420 440 COGS per ton Rp'000/t 388 431 420 438 460 477 Total Cost per Ton Rp'000/t 499 569 550 572 592 612
EBITDA per ton Rp'000/t 219 270 277 296 309 304
INDOCEMENT
Current Share Price 17,600 Target Share Price 17,200 Upside / Downside ‐2.3%
SUMMARY VALUATION 2008 2009 2010 2011 2012 2013
Enterprise Value Rp bn 56,884 56,884 56,884 56,884 Equity Value Rp bn 63,111 63,111 63,111 63,111 EBITDA Rp bn 4,641 5,153 5,352 5,797 Earnings Rp bn 3,225 3,516 3,687 4,041 Capacity mm t 18.6 18.6 18.6 20.6
EV/EBITDA x 12.3 11.0 10.6 9.8 EV/Capacity US$/t 472 472 472 426 Price to Earnings x 19.6 17.9 17.1 15.6
Operating MeasuresRevenue per ton Rp '000/t 683 802 820 874 913 918
Cost per tonProduction Cash Cost Per Ton Rp '000/t 360 372 366 409 429 436 COGS per ton Rp '000/t 402 415 412 452 473 478 Total Cost per Ton Rp '000/t 511 522 524 568 597 606
EBITDA per ton Rp '000/t 213 323 342 349 361 353
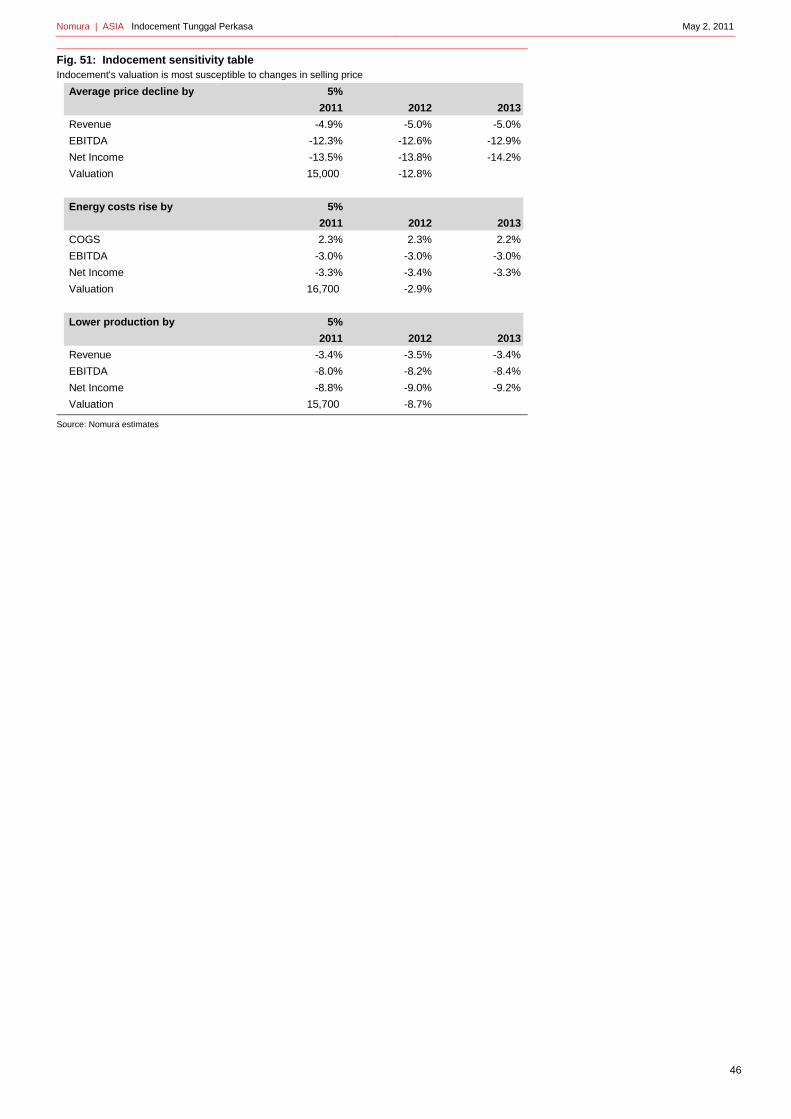
Nomura | ASIA Indocement Tunggal Perkasa May 2, 2011
46
Fig. 51: Indocement sensitivity table Indocement's valuation is most susceptible to changes in selling price
Source: Nomura estimates
Average price decline by 5%
2011 2012 2013
Revenue -4.9% -5.0% -5.0%
EBITDA -12.3% -12.6% -12.9%
Net Income -13.5% -13.8% -14.2%
Valuation 15,000 -12.8%
Energy costs rise by 5%
2011 2012 2013
COGS 2.3% 2.3% 2.2%
EBITDA -3.0% -3.0% -3.0%
Net Income -3.3% -3.4% -3.3%
Valuation 16,700 -2.9%
Lower production by 5%
2011 2012 2013
Revenue -3.4% -3.5% -3.4%
EBITDA -8.0% -8.2% -8.4%
Net Income -8.8% -9.0% -9.2%
Valuation 15,700 -8.7%
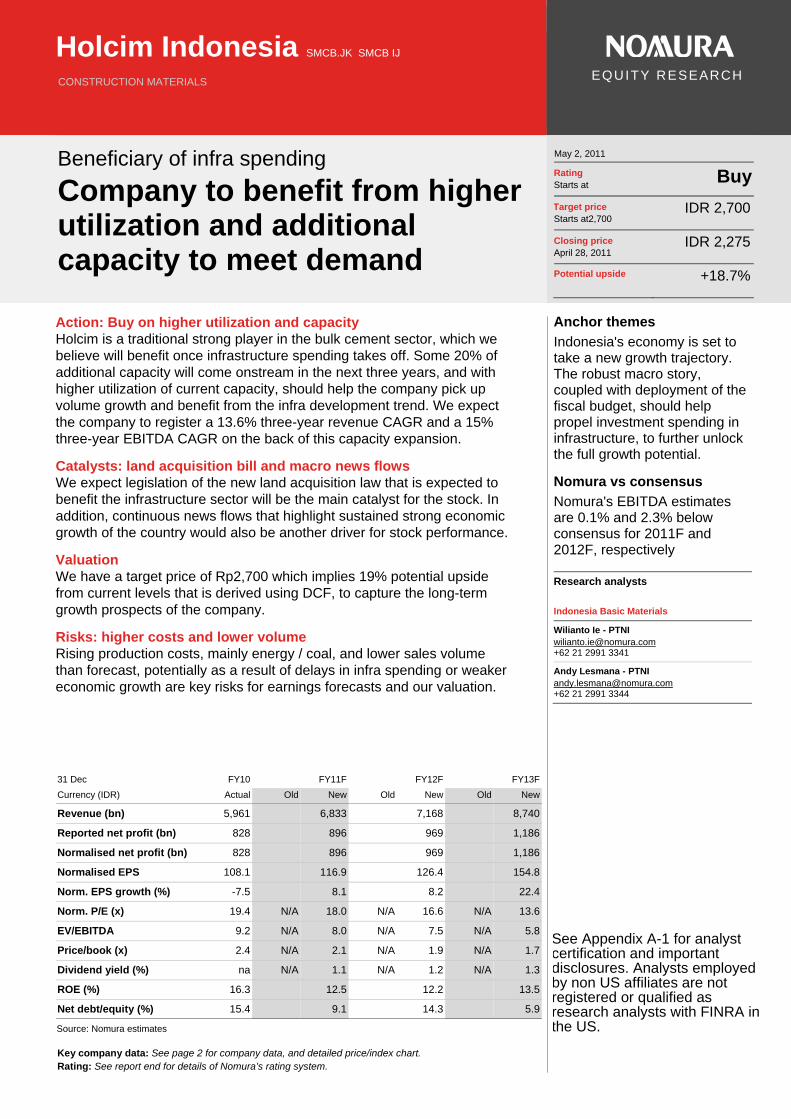
Key company data: See page 2 for company data, and detailed price/index chart. Rating: See report end for details of Nomura’s rating system.
Holcim Indonesia SMCB.JK SMCB IJ
CONSTRUCTION MATERIALS
EQUITY RESEARCH
Beneficiary of infra spending
Company to benefit from higher utilization and additional capacity to meet demand
May 2, 2011
Rating Starts at
Buy
Target price Starts at2,700
IDR 2,700
Closing price April 28, 2011
IDR 2,275
Potential upside +18.7%
Action: Buy on higher utilization and capacity Holcim is a traditional strong player in the bulk cement sector, which we believe will benefit once infrastructure spending takes off. Some 20% of additional capacity will come onstream in the next three years, and with higher utilization of current capacity, should help the company pick up volume growth and benefit from the infra development trend. We expect the company to register a 13.6% three-year revenue CAGR and a 15% three-year EBITDA CAGR on the back of this capacity expansion.
Catalysts: land acquisition bill and macro news flows We expect legislation of the new land acquisition law that is expected to benefit the infrastructure sector will be the main catalyst for the stock. In addition, continuous news flows that highlight sustained strong economic growth of the country would also be another driver for stock performance.
Valuation We have a target price of Rp2,700 which implies 19% potential upside from current levels that is derived using DCF, to capture the long-term growth prospects of the company.
Risks: higher costs and lower volume Rising production costs, mainly energy / coal, and lower sales volume than forecast, potentially as a result of delays in infra spending or weaker economic growth are key risks for earnings forecasts and our valuation.
31 Dec FY10 FY11F FY12F FY13F
Currency (IDR) Actual Old New Old New Old New
Revenue (bn) 5,961 6,833 7,168 8,740
Reported net profit (bn) 828 896 969 1,186
Normalised net profit (bn) 828 896 969 1,186
Normalised EPS 108.1 116.9 126.4 154.8
Norm. EPS growth (%) -7.5 8.1 8.2 22.4
Norm. P/E (x) 19.4 N/A 18.0 N/A 16.6 N/A 13.6
EV/EBITDA 9.2 N/A 8.0 N/A 7.5 N/A 5.8
Price/book (x) 2.4 N/A 2.1 N/A 1.9 N/A 1.7
Dividend yield (%) na N/A 1.1 N/A 1.2 N/A 1.3
ROE (%) 16.3 12.5 12.2 13.5
Net debt/equity (%) 15.4 9.1 14.3 5.9
Source: Nomura estimates
Anchor themes
Indonesia's economy is set to take a new growth trajectory. The robust macro story, coupled with deployment of the fiscal budget, should help propel investment spending in infrastructure, to further unlock the full growth potential.
Nomura vs consensus
Nomura's EBITDA estimates are 0.1% and 2.3% below consensus for 2011F and 2012F, respectively
Research analysts
Indonesia Basic Materials
Wilianto Ie - PTNI [email protected] +62 21 2991 3341
Andy Lesmana - PTNI [email protected] +62 21 2991 3344
See Appendix A-1 for analyst certification and important disclosures. Analysts employed by non US affiliates are not registered or qualified as research analysts with FINRA in the US.
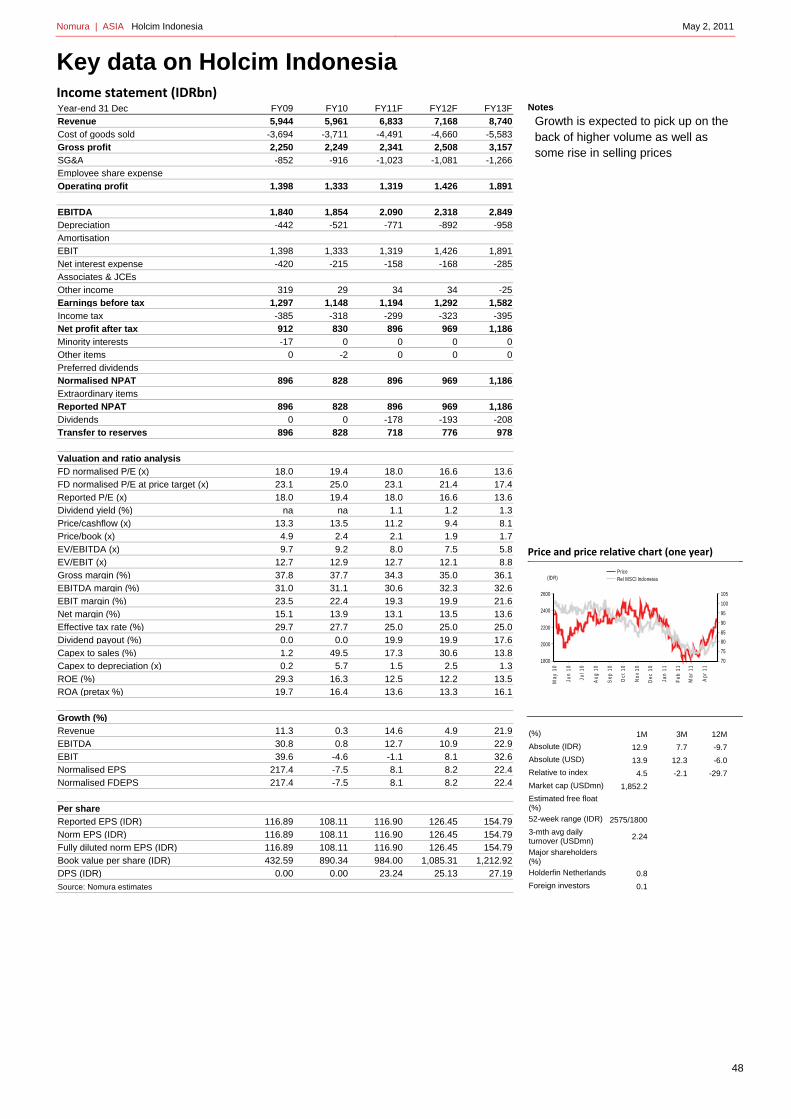
Nomura | ASIA Holcim Indonesia May 2, 2011
48
Key data on Holcim Indonesia Income statement (IDRbn) Year-end 31 Dec FY09 FY10 FY11F FY12F FY13FRevenue 5,944 5,961 6,833 7,168 8,740Cost of goods sold -3,694 -3,711 -4,491 -4,660 -5,583Gross profit 2,250 2,249 2,341 2,508 3,157SG&A -852 -916 -1,023 -1,081 -1,266Employee share expense
Operating profit 1,398 1,333 1,319 1,426 1,891
EBITDA 1,840 1,854 2,090 2,318 2,849Depreciation -442 -521 -771 -892 -958Amortisation
EBIT 1,398 1,333 1,319 1,426 1,891Net interest expense -420 -215 -158 -168 -285Associates & JCEs
Other income 319 29 34 34 -25Earnings before tax 1,297 1,148 1,194 1,292 1,582Income tax -385 -318 -299 -323 -395Net profit after tax 912 830 896 969 1,186Minority interests -17 0 0 0 0Other items 0 -2 0 0 0Preferred dividends
Normalised NPAT 896 828 896 969 1,186Extraordinary items
Reported NPAT 896 828 896 969 1,186Dividends 0 0 -178 -193 -208Transfer to reserves 896 828 718 776 978
Valuation and ratio analysis
FD normalised P/E (x) 18.0 19.4 18.0 16.6 13.6FD normalised P/E at price target (x) 23.1 25.0 23.1 21.4 17.4Reported P/E (x) 18.0 19.4 18.0 16.6 13.6Dividend yield (%) na na 1.1 1.2 1.3Price/cashflow (x) 13.3 13.5 11.2 9.4 8.1Price/book (x) 4.9 2.4 2.1 1.9 1.7EV/EBITDA (x) 9.7 9.2 8.0 7.5 5.8EV/EBIT (x) 12.7 12.9 12.7 12.1 8.8Gross margin (%) 37.8 37.7 34.3 35.0 36.1EBITDA margin (%) 31.0 31.1 30.6 32.3 32.6EBIT margin (%) 23.5 22.4 19.3 19.9 21.6Net margin (%) 15.1 13.9 13.1 13.5 13.6Effective tax rate (%) 29.7 27.7 25.0 25.0 25.0Dividend payout (%) 0.0 0.0 19.9 19.9 17.6Capex to sales (%) 1.2 49.5 17.3 30.6 13.8Capex to depreciation (x) 0.2 5.7 1.5 2.5 1.3ROE (%) 29.3 16.3 12.5 12.2 13.5ROA (pretax %) 19.7 16.4 13.6 13.3 16.1
Growth (%)
Revenue 11.3 0.3 14.6 4.9 21.9EBITDA 30.8 0.8 12.7 10.9 22.9EBIT 39.6 -4.6 -1.1 8.1 32.6Normalised EPS 217.4 -7.5 8.1 8.2 22.4Normalised FDEPS 217.4 -7.5 8.1 8.2 22.4
Per share
Reported EPS (IDR) 116.89 108.11 116.90 126.45 154.79Norm EPS (IDR) 116.89 108.11 116.90 126.45 154.79Fully diluted norm EPS (IDR) 116.89 108.11 116.90 126.45 154.79Book value per share (IDR) 432.59 890.34 984.00 1,085.31 1,212.92DPS (IDR) 0.00 0.00 23.24 25.13 27.19Source: Nomura estimates
Notes
Growth is expected to pick up on the back of higher volume as well as some rise in selling prices
Price and price relative chart (one year)
(%) 1M 3M 12M
Absolute (IDR) 12.9 7.7 -9.7
Absolute (USD) 13.9 12.3 -6.0
Relative to index 4.5 -2.1 -29.7
Market cap (USDmn) 1,852.2
Estimated free float (%) 52-week range (IDR) 2575/1800
3-mth avg daily turnover (USDmn)
2.24
Major shareholders (%) Holderfin Netherlands 0.8
Foreign investors 0.1
1800
2000
2200
2400
2600
70
75
80
85
90
95
100
105
May
10
Jun
10
Jul 1
0
Aug
10
Sep
10
Oct
10
Nov
10
Dec
10
Jan
11
Feb
11
Mar
11
Apr
11
PriceRel MSCI Indonesia(IDR)
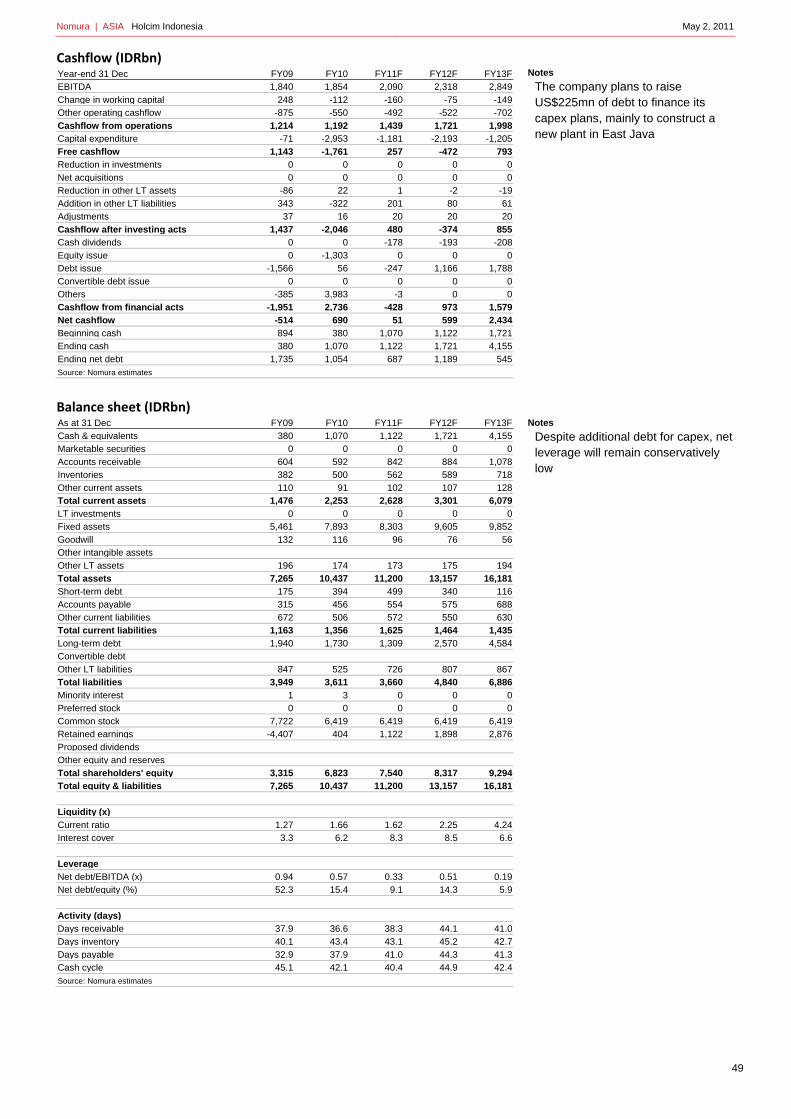
Nomura | ASIA Holcim Indonesia May 2, 2011
49
Cashflow (IDRbn) Year-end 31 Dec FY09 FY10 FY11F FY12F FY13FEBITDA 1,840 1,854 2,090 2,318 2,849Change in working capital 248 -112 -160 -75 -149Other operating cashflow -875 -550 -492 -522 -702Cashflow from operations 1,214 1,192 1,439 1,721 1,998Capital expenditure -71 -2,953 -1,181 -2,193 -1,205Free cashflow 1,143 -1,761 257 -472 793Reduction in investments 0 0 0 0 0Net acquisitions 0 0 0 0 0Reduction in other LT assets -86 22 1 -2 -19Addition in other LT liabilities 343 -322 201 80 61Adjustments 37 16 20 20 20Cashflow after investing acts 1,437 -2,046 480 -374 855Cash dividends 0 0 -178 -193 -208Equity issue 0 -1,303 0 0 0Debt issue -1,566 56 -247 1,166 1,788Convertible debt issue 0 0 0 0 0Others -385 3,983 -3 0 0Cashflow from financial acts -1,951 2,736 -428 973 1,579Net cashflow -514 690 51 599 2,434Beginning cash 894 380 1,070 1,122 1,721Ending cash 380 1,070 1,122 1,721 4,155Ending net debt 1,735 1,054 687 1,189 545Source: Nomura estimates
Balance sheet (IDRbn) As at 31 Dec FY09 FY10 FY11F FY12F FY13FCash & equivalents 380 1,070 1,122 1,721 4,155Marketable securities 0 0 0 0 0Accounts receivable 604 592 842 884 1,078Inventories 382 500 562 589 718Other current assets 110 91 102 107 128Total current assets 1,476 2,253 2,628 3,301 6,079LT investments 0 0 0 0 0Fixed assets 5,461 7,893 8,303 9,605 9,852Goodwill 132 116 96 76 56Other intangible assets
Other LT assets 196 174 173 175 194Total assets 7,265 10,437 11,200 13,157 16,181Short-term debt 175 394 499 340 116Accounts payable 315 456 554 575 688Other current liabilities 672 506 572 550 630Total current liabilities 1,163 1,356 1,625 1,464 1,435Long-term debt 1,940 1,730 1,309 2,570 4,584Convertible debt
Other LT liabilities 847 525 726 807 867Total liabilities 3,949 3,611 3,660 4,840 6,886Minority interest 1 3 0 0 0Preferred stock 0 0 0 0 0Common stock 7,722 6,419 6,419 6,419 6,419Retained earnings -4,407 404 1,122 1,898 2,876Proposed dividends
Other equity and reserves
Total shareholders' equity 3,315 6,823 7,540 8,317 9,294Total equity & liabilities 7,265 10,437 11,200 13,157 16,181
Liquidity (x)
Current ratio 1.27 1.66 1.62 2.25 4.24Interest cover 3.3 6.2 8.3 8.5 6.6
Leverage
Net debt/EBITDA (x) 0.94 0.57 0.33 0.51 0.19Net debt/equity (%) 52.3 15.4 9.1 14.3 5.9
Activity (days)
Days receivable 37.9 36.6 38.3 44.1 41.0Days inventory 40.1 43.4 43.1 45.2 42.7Days payable 32.9 37.9 41.0 44.3 41.3Cash cycle 45.1 42.1 40.4 44.9 42.4Source: Nomura estimates
Notes
The company plans to raise US$225mn of debt to finance its capex plans, mainly to construct a new plant in East Java
Notes
Despite additional debt for capex, net leverage will remain conservatively low
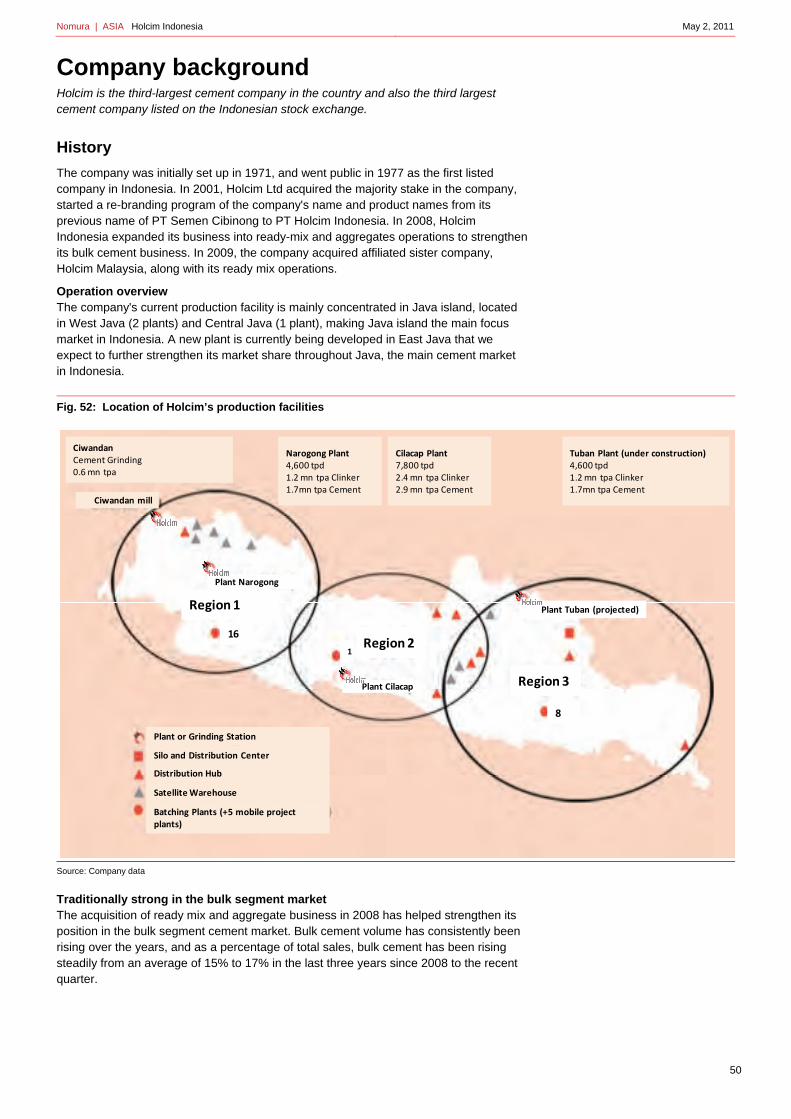
Nomura | ASIA Holcim Indonesia May 2, 2011
Company background Holcim is the third-largest cement company in the country and also the third largest cement company listed on the Indonesian stock exchange.
History
The company was initially set up in 1971, and went public in 1977 as the first listed company in Indonesia. In 2001, Holcim Ltd acquired the majority stake in the company, started a re-branding program of the company's name and product names from its previous name of PT Semen Cibinong to PT Holcim Indonesia. In 2008, Holcim Indonesia expanded its business into ready-mix and aggregates operations to strengthen its bulk cement business. In 2009, the company acquired affiliated sister company, Holcim Malaysia, along with its ready mix operations.
Operation overview The company's current production facility is mainly concentrated in Java island, located in West Java (2 plants) and Central Java (1 plant), making Java island the main focus market in Indonesia. A new plant is currently being developed in East Java that we expect to further strengthen its market share throughout Java, the main cement market in Indonesia.
Fig. 52: Location of Holcim’s production facilities
Source: Company data
Traditionally strong in the bulk segment market The acquisition of ready mix and aggregate business in 2008 has helped strengthen its position in the bulk segment cement market. Bulk cement volume has consistently been rising over the years, and as a percentage of total sales, bulk cement has been rising steadily from an average of 15% to 17% in the last three years since 2008 to the recent quarter.
Plant Narogong
Plant or Grinding Station
Silo and Distribution Center
Distribution Hub
Satellite Warehouse
Batching Plants (+5 mobile project plants)
Ciwandan mill
Region 1
Plant Cilacap
Region 2
Region 3
Plant Tuban (projected)
16
1
8
Tuban Plant (under construction)4,600 tpd1.2 mn tpa Clinker1.7mn tpa Cement
Narogong Plant4,600 tpd1.2 mn tpa Clinker1.7mn tpa Cement
CiwandanCement Grinding0.6 mn tpa
Cilacap Plant7,800 tpd2.4 mn tpa Clinker2.9 mn tpa Cement
50

Nomura | ASIA Holcim Indonesia May 2, 2011
Fig. 53: Holcim's bulk cement sales profile
Source: company
Holcim also has the highest proportion of bulk cement sales to total cement sales volume compared to other cement companies in Indonesia.
Fig. 54: Comparison of bulk cement sales amongst cement companies
Source: Indonesian Cement Association (ASI)
Holcim has also been gaining market share in recent periods, benefiting from rising cement sales outside Java and sales of the bulk cement.
Fig. 55: Gaining market share in the domestic market
Source: Indonesia Cement Association (ASI); Notes: figures for 2011 represent 1Q11 numbers.
0
2
4
6
8
10
12
14
16
18
20
0.0
0.5
1.0
1.5
2.0
2.5
1Q08
2Q08
3Q08
4Q08
1Q09
2Q09
3Q09
4Q09
1Q10
2Q10
3Q10
4Q10
1Q11
(% of bulk)(mn tons)
Bulk volume (LHS) Series2Bulk (RHS)
10
12
14
16
18
20
22
24
26
28
30
1Q08
2Q08
3Q08
4Q08
1Q09
2Q09
3Q09
4Q09
1Q10
2Q10
3Q10
4Q10
1Q11
SGG INTP SMCB Others
(%)
9
10
11
12
13
14
15
16
17
18
15
20
25
30
35
40
45
50
55
60
2004 2005 2006 2007 2008 2009 2010 2011
SGG (LHS) INTP (LHS)
SMCB (RHS) Others (RHS)
(%)(%)
51
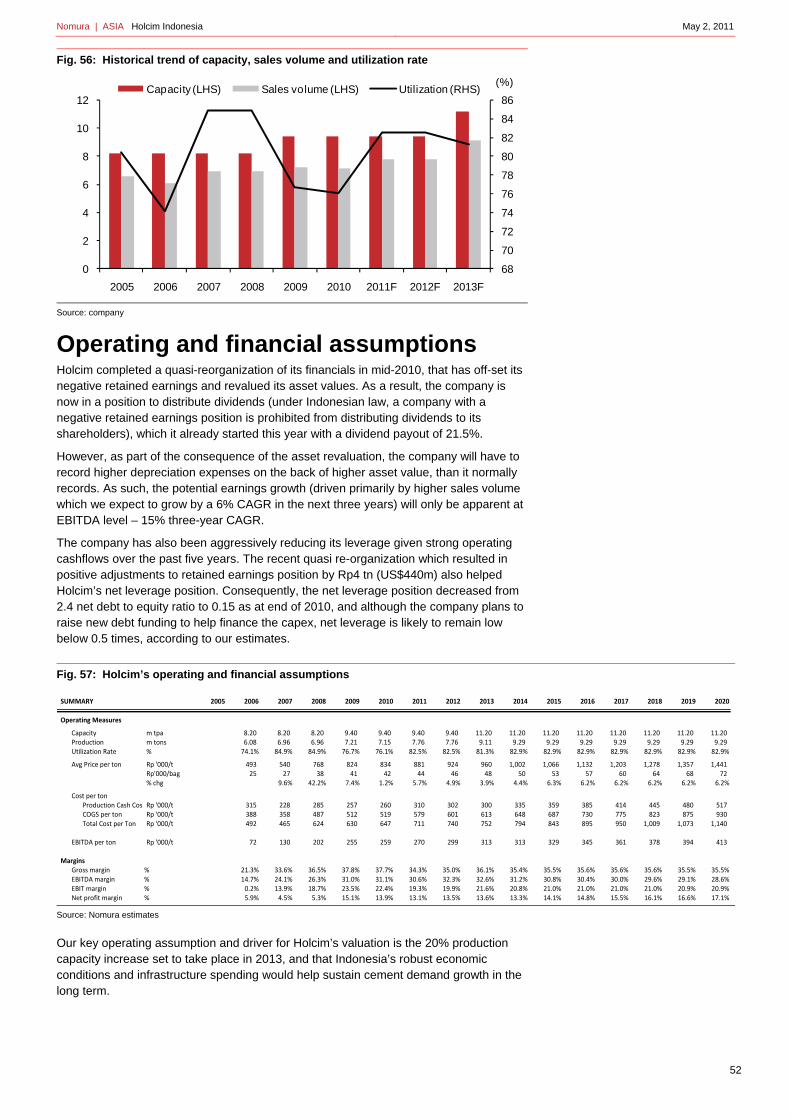
Nomura | ASIA Holcim Indonesia May 2, 2011
52
Fig. 56: Historical trend of capacity, sales volume and utilization rate
Source: company
Operating and financial assumptions Holcim completed a quasi-reorganization of its financials in mid-2010, that has off-set its negative retained earnings and revalued its asset values. As a result, the company is now in a position to distribute dividends (under Indonesian law, a company with a negative retained earnings position is prohibited from distributing dividends to its shareholders), which it already started this year with a dividend payout of 21.5%.
However, as part of the consequence of the asset revaluation, the company will have to record higher depreciation expenses on the back of higher asset value, than it normally records. As such, the potential earnings growth (driven primarily by higher sales volume which we expect to grow by a 6% CAGR in the next three years) will only be apparent at EBITDA level – 15% three-year CAGR.
The company has also been aggressively reducing its leverage given strong operating cashflows over the past five years. The recent quasi re-organization which resulted in positive adjustments to retained earnings position by Rp4 tn (US$440m) also helped Holcim’s net leverage position. Consequently, the net leverage position decreased from 2.4 net debt to equity ratio to 0.15 as at end of 2010, and although the company plans to raise new debt funding to help finance the capex, net leverage is likely to remain low below 0.5 times, according to our estimates.
Fig. 57: Holcim’s operating and financial assumptions
Source: Nomura estimates
Our key operating assumption and driver for Holcim’s valuation is the 20% production capacity increase set to take place in 2013, and that Indonesia’s robust economic conditions and infrastructure spending would help sustain cement demand growth in the long term.
68
70
72
74
76
78
80
82
84
86
0
2
4
6
8
10
12
2005 2006 2007 2008 2009 2010 2011F 2012F 2013F
Capacity (LHS) Sales volume (LHS) Utilization (RHS)(%)
SUMMARY 2004 2005 2006 2007 2008 2009 2010 2011 2012 2013 2014 2015 2016 2017 2018 2019 2020
Operating Measures
Capacity m tpa 8.20 8.20 8.20 9.40 9.40 9.40 9.40 11.20 11.20 11.20 11.20 11.20 11.20 11.20 11.20 Production m tons 6.08 6.96 6.96 7.21 7.15 7.76 7.76 9.11 9.29 9.29 9.29 9.29 9.29 9.29 9.29 Utilization Rate % 74.1% 84.9% 84.9% 76.7% 76.1% 82.5% 82.5% 81.3% 82.9% 82.9% 82.9% 82.9% 82.9% 82.9% 82.9%
Avg Price per ton Rp '000/t 493 540 768 824 834 881 924 960 1,002 1,066 1,132 1,203 1,278 1,357 1,441 Rp'000/bag 25 27 38 41 42 44 46 48 50 53 57 60 64 68 72 % chg 9.6% 42.2% 7.4% 1.2% 5.7% 4.9% 3.9% 4.4% 6.3% 6.2% 6.2% 6.2% 6.2% 6.2%
Cost per tonProduction Cash Cost Rp '000/t 315 228 285 257 260 310 302 300 335 359 385 414 445 480 517 COGS per ton Rp '000/t 388 358 487 512 519 579 601 613 648 687 730 775 823 875 930 Total Cost per Ton Rp '000/t 492 465 624 630 647 711 740 752 794 843 895 950 1,009 1,073 1,140
EBITDA per ton Rp '000/t 72 130 202 255 259 270 299 313 313 329 345 361 378 394 413
MarginsGross margin % 21.3% 33.6% 36.5% 37.8% 37.7% 34.3% 35.0% 36.1% 35.4% 35.5% 35.6% 35.6% 35.6% 35.5% 35.5%EBITDA margin % 14.7% 24.1% 26.3% 31.0% 31.1% 30.6% 32.3% 32.6% 31.2% 30.8% 30.4% 30.0% 29.6% 29.1% 28.6%EBIT margin % 0.2% 13.9% 18.7% 23.5% 22.4% 19.3% 19.9% 21.6% 20.8% 21.0% 21.0% 21.0% 21.0% 20.9% 20.9%Net profit margin % 5.9% 4.5% 5.3% 15.1% 13.9% 13.1% 13.5% 13.6% 13.3% 14.1% 14.8% 15.5% 16.1% 16.6% 17.1%
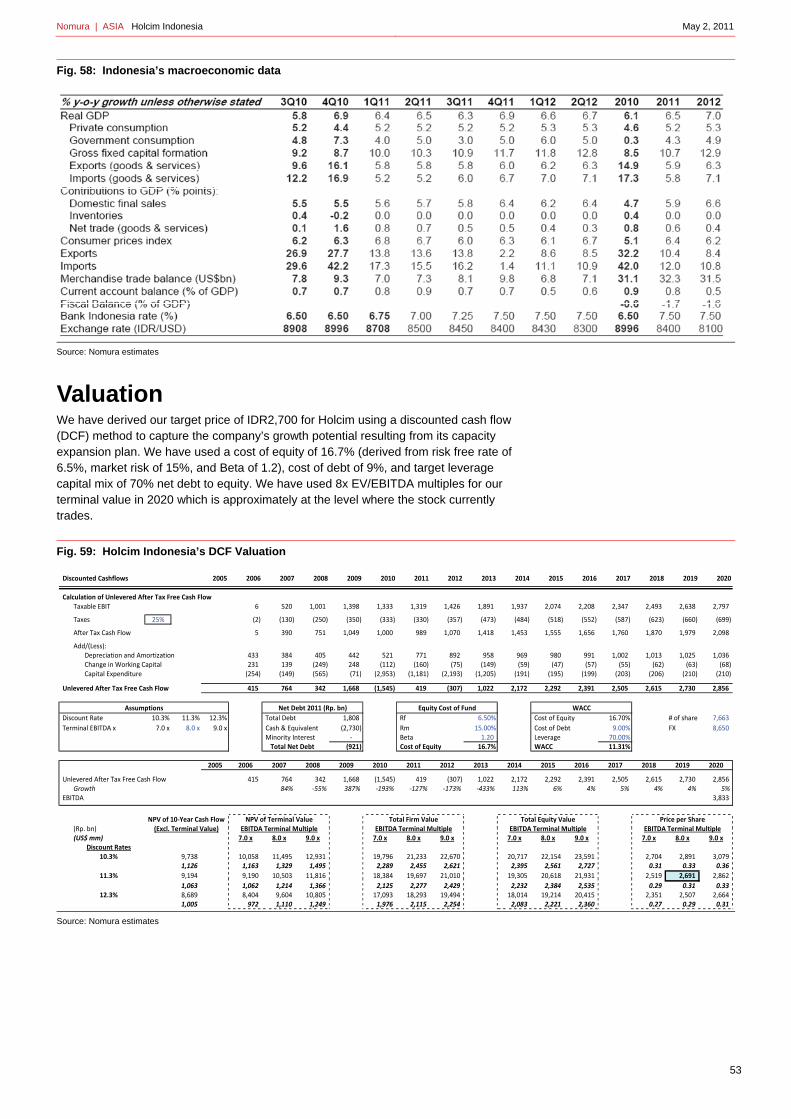
Nomura | ASIA Holcim Indonesia May 2, 2011
53
Fig. 58: Indonesia’s macroeconomic data
Source: Nomura estimates
Valuation We have derived our target price of IDR2,700 for Holcim using a discounted cash flow (DCF) method to capture the company’s growth potential resulting from its capacity expansion plan. We have used a cost of equity of 16.7% (derived from risk free rate of 6.5%, market risk of 15%, and Beta of 1.2), cost of debt of 9%, and target leverage capital mix of 70% net debt to equity. We have used 8x EV/EBITDA multiples for our terminal value in 2020 which is approximately at the level where the stock currently trades.
Fig. 59: Holcim Indonesia’s DCF Valuation
Source: Nomura estimates
Discounted Cashflows 2005 2006 2007 2008 2009 2010 2011 2012 2013 2014 2015 2016 2017 2018 2019 2020
Calculation of Unlevered After Tax Free Cash FlowTaxable EBIT 6 520 1,001 1,398 1,333 1,319 1,426 1,891 1,937 2,074 2,208 2,347 2,493 2,638 2,797
Taxes 25% (2) (130) (250) (350) (333) (330) (357) (473) (484) (518) (552) (587) (623) (660) (699)
After Tax Cash Flow 5 390 751 1,049 1,000 989 1,070 1,418 1,453 1,555 1,656 1,760 1,870 1,979 2,098
Add/(Less):Depreciation and Amortization 433 384 405 442 521 771 892 958 969 980 991 1,002 1,013 1,025 1,036 Change in Working Capital 231 139 (249) 248 (112) (160) (75) (149) (59) (47) (57) (55) (62) (63) (68) Capital Expenditure (254) (149) (565) (71) (2,953) (1,181) (2,193) (1,205) (191) (195) (199) (203) (206) (210) (210)
Unlevered After Tax Free Cash Flow 415 764 342 1,668 (1,545) 419 (307) 1,022 2,172 2,292 2,391 2,505 2,615 2,730 2,856
Discount Rate 10.3% 11.3% 12.3% Total Debt 1,808 Rf 6.50% Cost of Equity 16.70% # of shares 7,663
Terminal EBITDA x 7.0 x 8.0 x 9.0 x Cash & Equivalent (2,730) Rm 15.00% Cost of Debt 9.00% FX 8,650 Perpetuity Rate 1.0% 2.0% 3.0% Minority Interest ‐ Beta 1.20 Leverage 70.00%
Total Net Debt (921) Cost of Equity 16.7% WACC 11.31%
2005 2006 2007 2008 2009 2010 2011 2012 2013 2014 2015 2016 2017 2018 2019 2020
Unlevered After Tax Free Cash Flow 415 764 342 1,668 (1,545) 419 (307) 1,022 2,172 2,292 2,391 2,505 2,615 2,730 2,856 Growth 84% ‐55% 387% ‐193% ‐127% ‐173% ‐433% 113% 6% 4% 5% 4% 4% 5%
EBITDA 3,833
NPV of 10‐Year Cash Flow NPV of Terminal Value Total Firm Value Total Equity Value Price per Share(Rp. bn) (Excl. Terminal Value) EBITDA Terminal Multiple EBITDA Terminal Multiple EBITDA Terminal Multiple EBITDA Terminal Multiple(US$ mm) 7.0 x 8.0 x 9.0 x 7.0 x 8.0 x 9.0 x 7.0 x 8.0 x 9.0 x 7.0 x 8.0 x 9.0 x
Discount Rates10.3% 9,738 10,058 11,495 12,931 19,796 21,233 22,670 20,717 22,154 23,591 2,704 2,891 3,079
1,126 1,163 1,329 1,495 2,289 2,455 2,621 2,395 2,561 2,727 0.31 0.33 0.36
11.3% 9,194 9,190 10,503 11,816 18,384 19,697 21,010 19,305 20,618 21,931 2,519 2,691 2,862
1,063 1,062 1,214 1,366 2,125 2,277 2,429 2,232 2,384 2,535 0.29 0.31 0.33 12.3% 8,689 8,404 9,604 10,805 17,093 18,293 19,494 18,014 19,214 20,415 2,351 2,507 2,664
1,005 972 1,110 1,249 1,976 2,115 2,254 2,083 2,221 2,360 0.27 0.29 0.31
Assumptions Net Debt 2011 (Rp. bn) Equity Cost of Fund WACC

Nomura | ASIA Holcim Indonesia May 2, 2011
54
Risks and sensitivities Key risks to the operation of Holcim Indonesia are lower-than-estimated average cement selling price and cement sales volume. Risks of rising production costs resulting from higher energy costs are rather minimal given the company's policy to secure and lock in most of its coal requirements at the end of the previous year. Downside risks include: 1) delays in the commercial operation of new plant that will increase output; 2) lower-than-expected price increases, and 3) higher production costs. Upside risks: 1) higher increases in selling price; 2) accelerated infrastructure spending that will trigger more aggressive volume assumptions.
Fig. 60: Holcim Indonesia earnings and valuation sensitivity tables
Source: Nomura estimates.
Average price decline by 5.0%
2011 2012 2013
Revenue -5.0% -5.0% -5.0%
EBITDA -16.3% -15.4% -15.2%
Net Income -28.4% -28.2% -28.6%
Valuation 2200 -18.5%
Energy costs rise by 5.0%
2011 2012 2013
COGS 1.9% 1.8% 1.9%
EBITDA -4.1% -3.7% -3.7%
Net Income -4.1% -3.7% -3.7%
Valuation 2600 -3.7%
Lower production by 5.0%
2011 2012 2013
Revenue -5.0% -5.0% -5.0%
EBITDA -14.9% -14.1% -14.0%
Net Income -14.9% -14.1% -14.0%
Valuation 2300 -14.8%
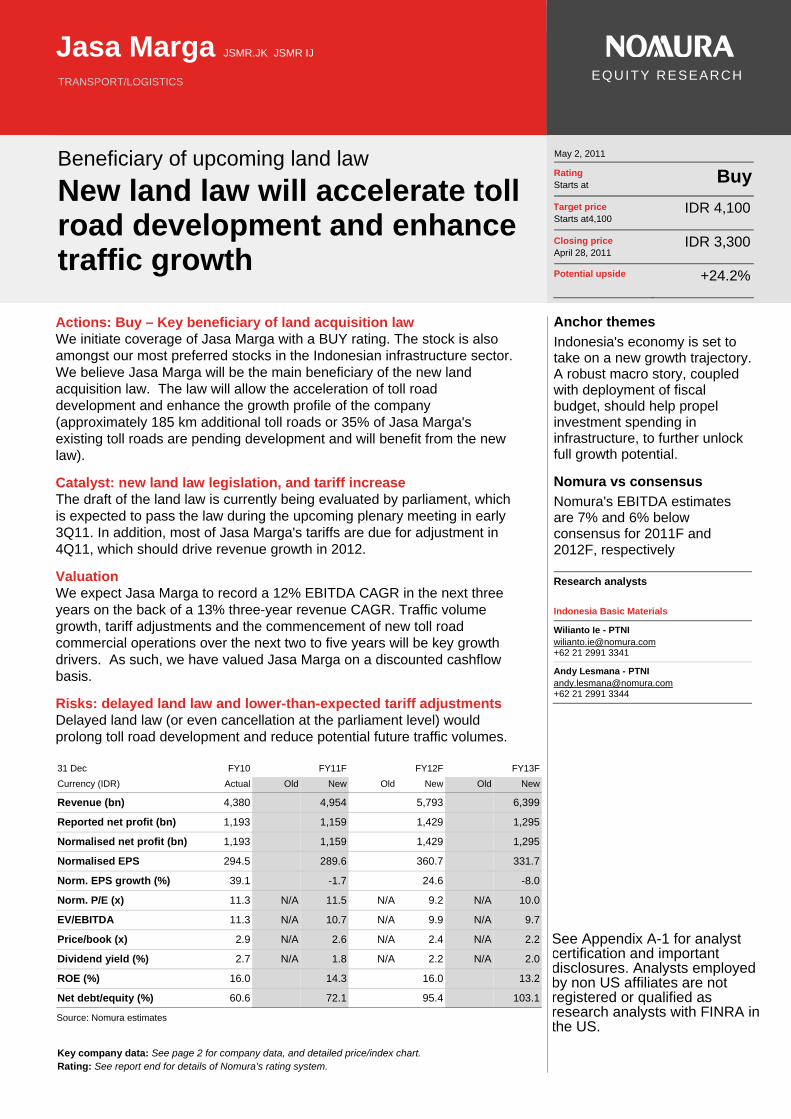
Key company data: See page 2 for company data, and detailed price/index chart. Rating: See report end for details of Nomura’s rating system.
Jasa Marga JSMR.JK JSMR IJ
TRANSPORT/LOGISTICS
EQUITY RESEARCH
Beneficiary of upcoming land law
New land law will accelerate toll road development and enhance traffic growth
May 2, 2011
Rating Starts at
Buy
Target price Starts at4,100
IDR 4,100
Closing price April 28, 2011
IDR 3,300
Potential upside +24.2%
Actions: Buy – Key beneficiary of land acquisition law We initiate coverage of Jasa Marga with a BUY rating. The stock is also amongst our most preferred stocks in the Indonesian infrastructure sector. We believe Jasa Marga will be the main beneficiary of the new land acquisition law. The law will allow the acceleration of toll road development and enhance the growth profile of the company (approximately 185 km additional toll roads or 35% of Jasa Marga's existing toll roads are pending development and will benefit from the new law).
Catalyst: new land law legislation, and tariff increase The draft of the land law is currently being evaluated by parliament, which is expected to pass the law during the upcoming plenary meeting in early 3Q11. In addition, most of Jasa Marga's tariffs are due for adjustment in 4Q11, which should drive revenue growth in 2012.
Valuation We expect Jasa Marga to record a 12% EBITDA CAGR in the next three years on the back of a 13% three-year revenue CAGR. Traffic volume growth, tariff adjustments and the commencement of new toll road commercial operations over the next two to five years will be key growth drivers. As such, we have valued Jasa Marga on a discounted cashflow basis.
Risks: delayed land law and lower-than-expected tariff adjustments Delayed land law (or even cancellation at the parliament level) would prolong toll road development and reduce potential future traffic volumes.
31 Dec FY10 FY11F FY12F FY13F
Currency (IDR) Actual Old New Old New Old New
Revenue (bn) 4,380 4,954 5,793 6,399
Reported net profit (bn) 1,193 1,159 1,429 1,295
Normalised net profit (bn) 1,193 1,159 1,429 1,295
Normalised EPS 294.5 289.6 360.7 331.7
Norm. EPS growth (%) 39.1 -1.7 24.6 -8.0
Norm. P/E (x) 11.3 N/A 11.5 N/A 9.2 N/A 10.0
EV/EBITDA 11.3 N/A 10.7 N/A 9.9 N/A 9.7
Price/book (x) 2.9 N/A 2.6 N/A 2.4 N/A 2.2
Dividend yield (%) 2.7 N/A 1.8 N/A 2.2 N/A 2.0
ROE (%) 16.0 14.3 16.0 13.2
Net debt/equity (%) 60.6 72.1 95.4 103.1
Source: Nomura estimates
Anchor themes
Indonesia's economy is set to take on a new growth trajectory. A robust macro story, coupled with deployment of fiscal budget, should help propel investment spending in infrastructure, to further unlock full growth potential.
Nomura vs consensus
Nomura's EBITDA estimates are 7% and 6% below consensus for 2011F and 2012F, respectively
Research analysts
Indonesia Basic Materials
Wilianto Ie - PTNI [email protected] +62 21 2991 3341
Andy Lesmana - PTNI [email protected] +62 21 2991 3344
See Appendix A-1 for analyst certification and important disclosures. Analysts employed by non US affiliates are not registered or qualified as research analysts with FINRA in the US.

Nomura | ASIA Jasa Marga May 2, 2011
56
Key data on Jasa Marga Income statement (IDRbn) Year-end 31 Dec FY09 FY10 FY11F FY12F FY13FRevenue 3,692 4,380 4,954 5,793 6,399Cost of goods sold -1,528 -1,646 -2,021 -2,346 -2,699Gross profit 2,164 2,734 2,933 3,447 3,700SG&A -648 -745 -839 -947 -1,106Employee share expense
Operating profit 1,516 1,989 2,094 2,501 2,594
EBITDA 1,849 2,412 2,689 3,202 3,431Depreciation -333 -423 -595 -701 -837Amortisation
EBIT 1,516 1,989 2,094 2,501 2,594Net interest expense -445 -533 -653 -720 -977Associates & JCEs
Other income 23 20 20 20 20Earnings before tax 1,094 1,476 1,462 1,801 1,637Income tax -212 -292 -292 -360 -327Net profit after tax 882 1,184 1,169 1,440 1,309Minority interests -14 9 -10 -12 -14Other items
Preferred dividends
Normalised NPAT 868 1,193 1,159 1,429 1,295Extraordinary items
Reported NPAT 868 1,193 1,159 1,429 1,295Dividends -353 -596 -406 -500 -453Transfer to reserves 515 597 753 929 842
Valuation and ratio analysis
FD normalised P/E (x) 15.7 11.3 11.5 9.2 10.0FD normalised P/E at price target (x) 19.4 13.9 14.2 11.4 12.4Reported P/E (x) 15.7 11.3 11.5 9.2 10.0Dividend yield (%) 1.6 2.7 1.8 2.2 2.0Price/cashflow (x) 13.3 8.2 7.6 5.6 6.7Price/book (x) 3.1 2.9 2.6 2.4 2.2EV/EBITDA (x) 14.1 11.3 10.7 9.9 9.7EV/EBIT (x) 17.2 13.7 13.7 12.6 12.8Gross margin (%) 58.6 62.4 59.2 59.5 57.8EBITDA margin (%) 50.1 55.1 54.3 55.3 53.6EBIT margin (%) 41.1 45.4 42.3 43.2 40.5Net margin (%) 23.5 27.2 23.4 24.7 20.2Effective tax rate (%) 19.4 19.8 20.0 20.0 20.0Dividend payout (%) 40.7 50.0 35.0 35.0 35.0Capex to sales (%) 46.9 59.8 57.7 83.3 50.4Capex to depreciation (x) 5.2 6.2 4.8 6.9 3.9ROE (%) 12.6 16.0 14.3 16.0 13.2ROA (pretax %) 12.6 14.3 12.9 12.7 11.2
Growth (%)
Revenue 10.1 18.6 13.1 16.9 10.5EBITDA 8.0 30.4 11.5 19.1 7.2EBIT 10.6 31.2 5.3 19.4 3.7Normalised EPS 103.6 39.1 -1.7 24.6 -8.0Normalised FDEPS 103.6 39.1 -1.7 24.6 -8.0
Per share
Reported EPS (IDR) 211.68 294.46 289.58 360.69 331.68Norm EPS (IDR) 211.68 294.46 289.58 360.69 331.68Fully diluted norm EPS (IDR) 211.68 294.46 289.58 360.69 331.68Book value per share (IDR) 1,060.15 1,146.36 1,262.54 1,405.72 1,536.95DPS (IDR) 52.10 88.28 60.31 74.61 67.88Source: Nomura estimates
Notes
Jasa Marga is expected to continue running negative cashflows until 2013 given the capex requirement on new toll road projects
Price and price relative chart (one year)
(%) 1M 3M 12M
Absolute (IDR) 3.1 1.5 67.1
Absolute (USD) 4.5 6.4 73.9
Relative to index -7.5 -12.5 47.0
Market cap (USDmn) 2,613.9
Estimated free float (%) 52-week range (IDR) 3900/1750
3-mth avg daily turnover (USDmn)
2.67
Major shareholders (%) Government of Indonesia
0.7
Public 0.3
1500
2000
2500
3000
3500
4000
80
100
120
140
160
May
10
Jun
10
Jul 1
0
Aug
10
Sep
10
Oct
10
Nov
10
Dec
10
Jan
11
Feb
11
Mar
11
Apr
11
PriceRel MSCI Indonesia(IDR)

Nomura | ASIA Jasa Marga May 2, 2011
57
Cashflow (IDRbn) Year-end 31 Dec FY09 FY10 FY11F FY12F FY13FEBITDA 1,849 2,412 2,689 3,202 3,431Change in working capital 127 278 277 438 -40Other operating cashflow -954 -1,057 -1,206 -1,280 -1,451Cashflow from operations 1,022 1,633 1,760 2,359 1,939Capital expenditure -1,732 -2,618 -2,860 -4,825 -3,222Free cashflow -710 -985 -1,100 -2,466 -1,283Reduction in investments 448 14 27 0 0Net acquisitions 0 0 0 0 0Reduction in other LT assets -608 77 -320 -271 -223Addition in other LT liabilities 0 41 23 66 44Adjustments 445 252 281 220 166Cashflow after investing acts -425 -601 -1,089 -2,451 -1,296Cash dividends -353 -596 -406 -500 -453Equity issue -22 -40 0 0 0Debt issue 506 1,870 502 2,035 1,302Convertible debt issue 0 0 0 0 0Others 231 65 54 91 155Cashflow from financial acts 362 1,299 150 1,627 1,004Net cashflow -63 698 -938 -824 -291Beginning cash 3,377 3,314 4,012 3,074 2,249Ending cash 3,314 4,012 3,074 2,249 1,958Ending net debt 3,514 4,686 6,126 8,986 10,579Source: Nomura estimates
Balance sheet (IDRbn) As at 31 Dec FY09 FY10 FY11F FY12F FY13FCash & equivalents 3,314 4,012 3,074 2,249 1,958Marketable securities 41 27 0 0 0Accounts receivable 0 0 0 0 0Inventories 0 0 0 0 0Other current assets 75 52 56 65 72Total current assets 3,430 4,091 3,130 2,315 2,030LT investments 116 116 116 116 116Fixed assets 11,506 13,695 15,964 20,093 22,482Goodwill 37 43 39 35 31Other intangible assets
Other LT assets 1,084 1,007 1,327 1,597 1,821Total assets 16,173 18,952 20,576 24,156 26,480Short-term debt 2,183 1,440 2,452 1,404 1,542Accounts payable 104 130 136 159 175Other current liabilities 679 908 1,183 1,607 1,557Total current liabilities 2,966 2,478 3,771 3,170 3,274Long-term debt 4,645 7,258 6,747 9,831 10,995Convertible debt
Other LT liabilities 817 858 881 947 992Total liabilities 8,428 10,594 11,400 13,948 15,261Minority interest 562 619 684 787 956Preferred stock 0 0 0 0 0Common stock 5,735 5,735 5,735 5,735 5,735Retained earnings 1,448 2,004 2,757 3,686 4,528Proposed dividends
Other equity and reserves
Total shareholders' equity 7,183 7,739 8,492 9,421 10,263Total equity & liabilities 16,173 18,952 20,576 24,156 26,480
Liquidity (x)
Current ratio 1.16 1.65 0.83 0.73 0.62Interest cover 3.4 3.7 3.2 3.5 2.7
Leverage
Net debt/EBITDA (x) 1.90 1.94 2.28 2.81 3.08Net debt/equity (%) 48.9 60.6 72.1 95.4 103.1
Activity (days)
Days receivable 0.0 0.0 0.0 0.0 0.0Days inventory 0.0 0.0 0.0 0.0 0.0Days payable 18.2 25.9 24.0 23.0 22.6Cash cycle -18.2 -25.9 -24.0 -23.0 -22.6Source: Nomura estimates
Notes
Free cashflow will remain negative given heavy capex
Notes
Net leverage will increase as a company raise new funding for new capex
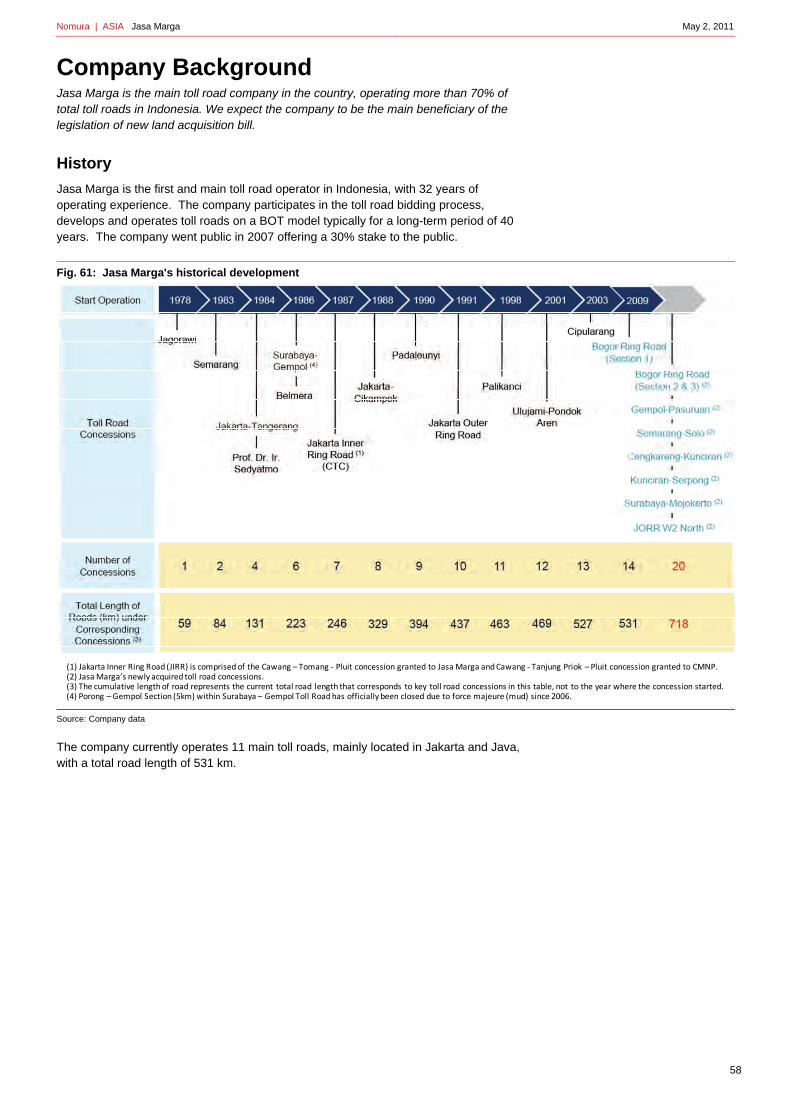
Nomura | ASIA Jasa Marga May 2, 2011
5
Company Background Jasa Marga is the main toll road company in the country, operating more than 70% of total toll roads in Indonesia. We expect the company to be the main beneficiary of the legislation of new land acquisition bill.
History
Jasa Marga is the first and main toll road operator in Indonesia, with 32 years of operating experience. The company participates in the toll road bidding process, develops and operates toll roads on a BOT model typically for a long-term period of 40 years. The company went public in 2007 offering a 30% stake to the public.
Fig. 61: Jasa Marga's historical development
Source: Company data
The company currently operates 11 main toll roads, mainly located in Jakarta and Java, with a total road length of 531 km.
(1) Jakarta Inner Ring Road (JIRR) is comprised of the Cawang – Tomang ‐ Pluit concession granted to JasaMarga and Cawang ‐ Tanjung Priok – Pluit concession granted to CMNP.(2) JasaMarga’s newly acquired toll road concessions.(3) The cumulative length of road represents the current total road length that corresponds to key toll road concessions in this table, not to the year where the concession started.(4) Porong –Gempol Section (5km) within Surabaya – Gempol Toll Road has officially been closed due to force majeure (mud) since 2006.
8

Nomura | ASIA Jasa Marga May 2, 2011
59
Fig. 62: Jasa Marga's toll network in Jakarta - heavily concentrated traffic area
Source: Company data
Being a pioneer in the toll road industry in Indonesia has allowed the company to operate some of busiest toll roads in the country, high yielding cashflows that in turn provide stable funding sources for other toll road developments. While the company operates approximately 75% of total toll roads in Indonesia, average daily traffic along Jasa Marga's toll roads represent 83% of total toll road traffic in Indonesia.
Fig. 63: Average daily traffic volume in toll roads in Indonesia
Source: Add Source Here
Beneficiary of legislation of land acquisition law
Over the past five to six years, Indonesia has seen some 135km of toll roads developed, which represents approximately a 25% increase in total toll road length since 2004, half of which was built by Jasa Marga. There is approximately another 1,400 km of toll road that was initially planned by the government to be developed during the same period of 2004-2010, but which has yet to commence construction.
Land acquisition has been the main issue for such lack of progress, as people speculate on land price increases. With this background, a new land acquisition law that will allow the government to enforce land acquisition at market value (determined by third party value appraiser) has been proposed to the parliament to be legislated as law.

Nomura | ASIA Jasa Marga May 2, 2011
With this law, it is expected that the land acquisition process will become much easier and allow the acceleration of infrastructure projects such as toll roads.
Jasa Marga with some 187km new toll road concession is expected to benefit from the law as some of these new toll roads are still in challenging land acquisition stage.
Accelerated toll road development, triggered by the land acquisition law, will likely also help accelerate traffic growth on existing toll roads. Over the past 10 years, Indonesia has witnessed an average 11% CAGR of car sales in the country. During the same period, total traffic only grew by 5%, we believe primarily due to high density and high congestion in existing toll roads. The development of more toll roads in Indonesia would help the congestion issue and allow higher traffic growth in toll roads.
Toll road sector consolidator
Given the strong balance sheet and operating cashflows generated by existing toll roads, and its long experience in being a toll road operator in Indonesia, Jasa Marga could become a strong consolidation agent in the toll road sector as the government evaluates the performance of current toll road operators and plans to revoke concessions of non-performing operators.
Fig. 64: History of car sales trend in Indonesia (cars unit) Car sales growth in Indonesia recorded an 11%CAGR in the last 10 years
Source: Gaikindo, Nomura Research
Fig. 65: Historical trend of traffic volume along Jasa Marga's toll road in the past 10 years (mn cars)
Source: Company data
0
100,000
200,000
300,000
400,000
500,000
600,000
700,000
800,000
900,000
1997 1998 1999 2000 2001 2002 2003 2004 2005 2006 2007 2008 2009 2010
(Units)
0
200
400
600
800
1,000
1,200
1997
1998
1999
2000
2001
2002
2003
2004
2005
2006
2007
2008
2009
2010
(mn cars)
60
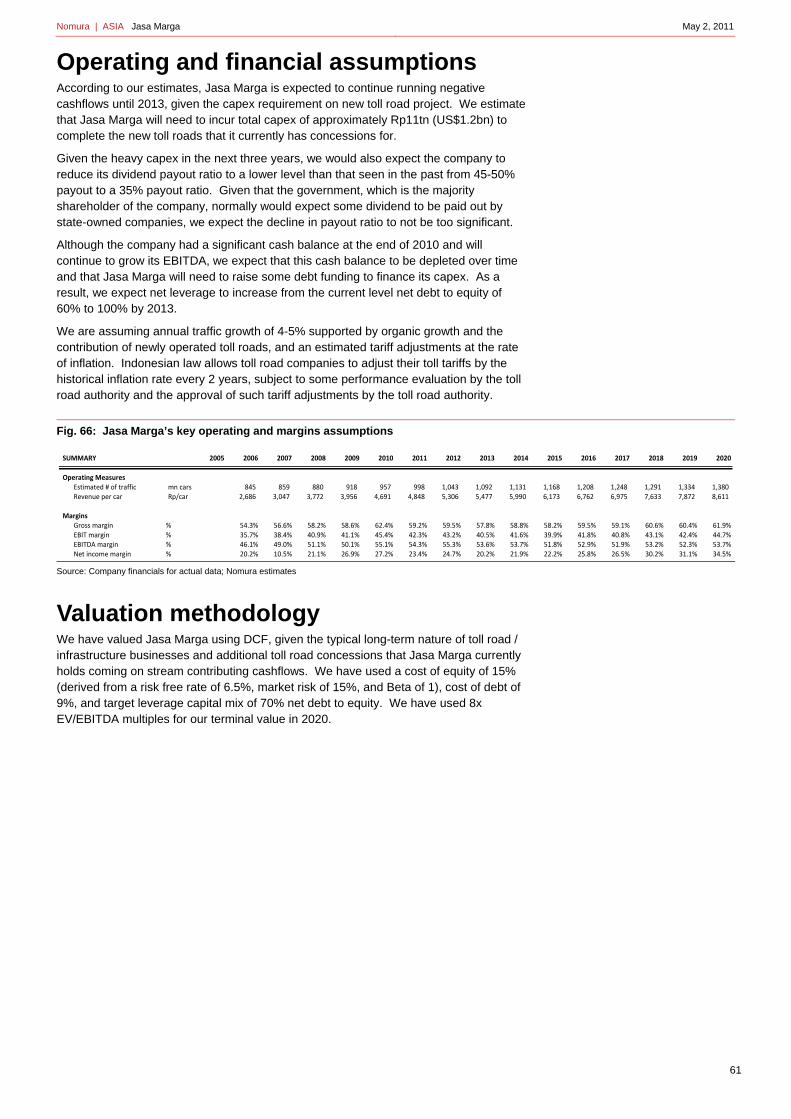
Nomura | ASIA Jasa Marga May 2, 2011
Operating and financial assumptions According to our estimates, Jasa Marga is expected to continue running negative cashflows until 2013, given the capex requirement on new toll road project. We estimate that Jasa Marga will need to incur total capex of approximately Rp11tn (US$1.2bn) to complete the new toll roads that it currently has concessions for.
Given the heavy capex in the next three years, we would also expect the company to reduce its dividend payout ratio to a lower level than that seen in the past from 45-50% payout to a 35% payout ratio. Given that the government, which is the majority shareholder of the company, normally would expect some dividend to be paid out by state-owned companies, we expect the decline in payout ratio to not be too significant.
Although the company had a significant cash balance at the end of 2010 and will continue to grow its EBITDA, we expect that this cash balance to be depleted over time and that Jasa Marga will need to raise some debt funding to finance its capex. As a result, we expect net leverage to increase from the current level net debt to equity of 60% to 100% by 2013.
We are assuming annual traffic growth of 4-5% supported by organic growth and the contribution of newly operated toll roads, and an estimated tariff adjustments at the rate of inflation. Indonesian law allows toll road companies to adjust their toll tariffs by the historical inflation rate every 2 years, subject to some performance evaluation by the toll road authority and the approval of such tariff adjustments by the toll road authority.
Fig. 66: Jasa Marga’s key operating and margins assumptions
Source: Company financials for actual data; Nomura estimates
Valuation methodology We have valued Jasa Marga using DCF, given the typical long-term nature of toll road / infrastructure businesses and additional toll road concessions that Jasa Marga currently holds coming on stream contributing cashflows. We have used a cost of equity of 15% (derived from a risk free rate of 6.5%, market risk of 15%, and Beta of 1), cost of debt of 9%, and target leverage capital mix of 70% net debt to equity. We have used 8x EV/EBITDA multiples for our terminal value in 2020.
SUMMARY 2005 2006 2007 2008 2009 2010 2011 2012 2013 2014 2015 2016 2017 2018 2019 2020
Operating MeasuresEstimated # of traffic mn cars 845 859 880 918 957 998 1,043 1,092 1,131 1,168 1,208 1,248 1,291 1,334 1,380 Revenue per car Rp/car 2,686 3,047 3,772 3,956 4,691 4,848 5,306 5,477 5,990 6,173 6,762 6,975 7,633 7,872 8,611
MarginsGross margin % 54.3% 56.6% 58.2% 58.6% 62.4% 59.2% 59.5% 57.8% 58.8% 58.2% 59.5% 59.1% 60.6% 60.4% 61.9%EBIT margin % 35.7% 38.4% 40.9% 41.1% 45.4% 42.3% 43.2% 40.5% 41.6% 39.9% 41.8% 40.8% 43.1% 42.4% 44.7%EBITDA margin % 46.1% 49.0% 51.1% 50.1% 55.1% 54.3% 55.3% 53.6% 53.7% 51.8% 52.9% 51.9% 53.2% 52.3% 53.7%Net income margin % 20.2% 10.5% 21.1% 26.9% 27.2% 23.4% 24.7% 20.2% 21.9% 22.2% 25.8% 26.5% 30.2% 31.1% 34.5%
61

Nomura | ASIA Jasa Marga May 2, 2011
62
Fig. 67: Jasa Marga’s DCF Model
Source: Nomura estimates
Risks and sensitivities Downside risks include: 1) a delay in the development of new toll roads, 2) lower-than-expected tariff adjustments; 3) higher-than-expected development costs; Upside risks include: 1) new toll road developments; 2) potentially higher traffic resulting from connectivity of newly built toll roads.
Fig. 68: Jasa Marga’s earnings and valuation sensitivities
Source: Nomura estimates
Discounted Cashflows 2005 2006 2007 2008 2009 2010 2011 2012 2013 2014 2015 2016 2017 2018 2019 2020
Calculation of Unlevered After Tax Free Cash Flow
Taxable EBIT 819 1,016 1,371 1,516 1,989 2,094 2,501 2,594 3,307 3,568 4,326 4,475 5,421 5,659 6,852
Taxes 25% (205) (254) (343) (379) (497) (524) (625) (648) (827) (892) (1,081) (1,119) (1,355) (1,415) (1,713)
After Tax Cash Flow 614 762 1,028 1,137 1,492 1,571 1,876 1,945 2,480 2,676 3,244 3,356 4,066 4,244 5,139
Add/(Less):
Depreciation and Amortization 239 280 341 333 423 595 701 837 967 1,066 1,144 1,210 1,270 1,326 1,381
Change in Working Capital ‐ 443 65 127 278 277 438 (40) (275) (212) (56) (36) 109 43 178
Capital Expenditure ‐ (767) (990) (1,732) (2,618) (2,860) (4,825) (3,222) (1,049) (646) (527) (577) (627) (677) (726)
Unlevered After Tax Free Cash Flow 853 718 444 (135) (425) (418) (1,811) (480) 2,123 2,884 3,805 3,953 4,818 4,937 5,972
Discount Rate 9.8% 10.8% 11.8% Total Debt 9,200 Rf 6.50% Cost of Equity 15.00% # of share 6,800
Terminal EBITDA x 7.0 x 8.0 x 9.0 x Cash & Equivalent (3,074) Rm 15.00% Cost of Debt 9.00% FX 8,650
Perpetuity Rate 1.0% 2.0% 3.0% Minority Interest 684 Beta 1.00 Leverage 70.00%
Total Net Debt 6,810 Cost of Equity 15.0% WACC 10.80%
2005 2006 2007 2008 2009 2010 2011 2012 2013 2014 2015 2016 2017 2018 2019 2020
Unlevered After Tax Free Cash Flow 853 718 444 (135) (425) (418) (1,811) (480) 2,123 2,884 3,805 3,953 4,818 4,937 5,972
Growth ‐16% ‐38% ‐130% 215% ‐2% 334% ‐73% ‐542% 36% 32% 4% 22% 2% 21%
EBITDA 8,234
NPV of 10‐Year Cash Flow NPV of Terminal Value Total Firm Value Total Equity Value Price per Share
(Rp. bn) (Excl. Terminal Value) EBITDA Terminal Multiple EBITDA Terminal Multiple EBITDA Terminal Multiple EBITDA Terminal Multiple
(US$ mm) 7.0 x 8.0 x 9.0 x 7.0 x 8.0 x 9.0 x 7.0 x 8.0 x 9.0 x
Discount Rates
9.8% 12,002 22,629 25,862 29,094 34,631 37,863 41,096 27,821 31,054 34,287 4,091 4,567 5,042
1,387 2,616 2,990 3,364 4,004 4,377 4,751 3,216 3,590 3,964 0.47 0.53 0.58
10.8% 11,139 20,668 23,620 26,573 31,807 34,759 37,712 24,997 27,950 30,902 3,676 4,110 4,544
1,288 2,389 2,731 3,072 3,677 4,018 4,360 2,890 3,231 3,572 0.42 0.48 0.53
11.8% 10,343 18,892 21,590 24,289 29,235 31,934 34,633 22,426 25,124 27,823 15,616 18,315 21,014
1,196 2,184 2,496 2,808 3,380 3,692 4,004 2,593 2,905 3,217 1.81 2.12 2.43
Assumptions Net Debt 2011 (Rp. bn) Equity Cost of Fund WACC
Traffic decline by 5%
2011 2012 2013
Revenue -5.0% -4.9% -4.9%
EBITDA -5.0% -5.0% -5.0%
Net Income -8.7% -8.8% -10.7%
Valuation 3,800 -7.3%
Tariff lower than expectation 5%
2011 2012 2013
Revenue -5.0% -4.9% -4.9%
EBITDA -7.6% -7.5% -7.6%
Net Income -13.7% -13.5% -16.6%
Valuation 3,600 -12.2%
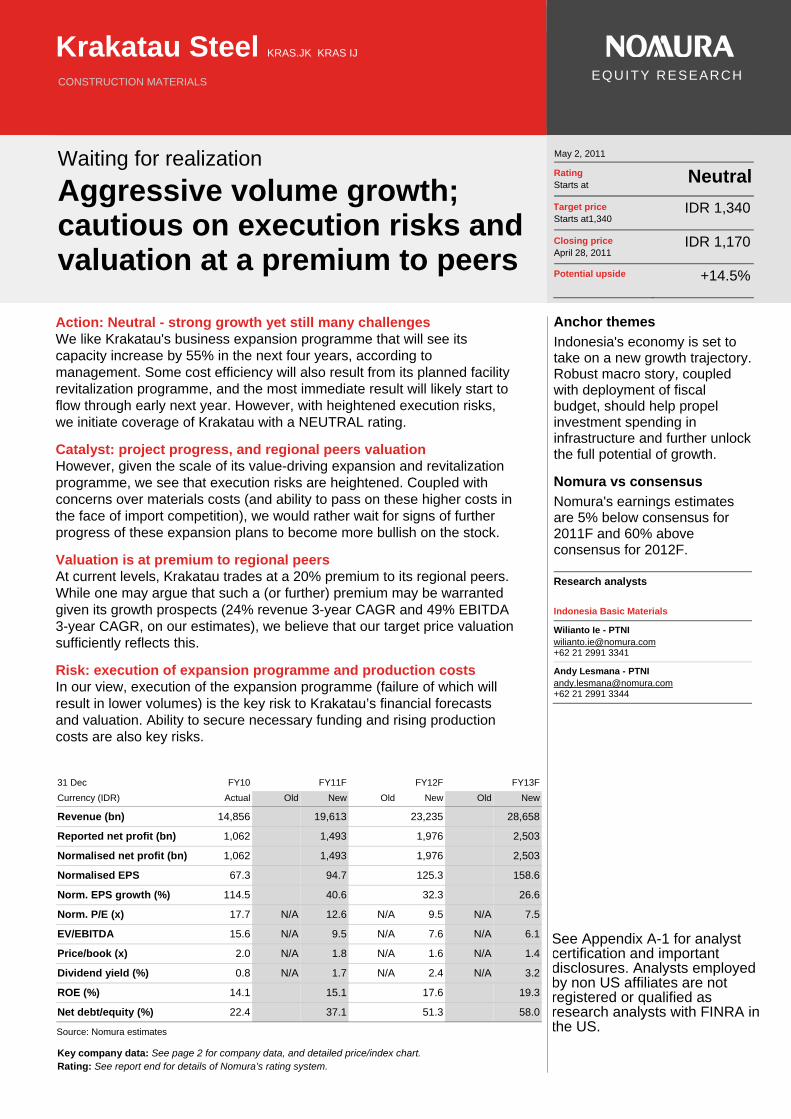
Key company data: See page 2 for company data, and detailed price/index chart. Rating: See report end for details of Nomura’s rating system.
Krakatau Steel KRAS.JK KRAS IJ
CONSTRUCTION MATERIALS
EQUITY RESEARCH
Waiting for realization
Aggressive volume growth; cautious on execution risks and valuation at a premium to peers
May 2, 2011
Rating Starts at
Neutral
Target price Starts at1,340
IDR 1,340
Closing price April 28, 2011
IDR 1,170
Potential upside +14.5%
Action: Neutral - strong growth yet still many challenges We like Krakatau's business expansion programme that will see its capacity increase by 55% in the next four years, according to management. Some cost efficiency will also result from its planned facility revitalization programme, and the most immediate result will likely start to flow through early next year. However, with heightened execution risks, we initiate coverage of Krakatau with a NEUTRAL rating.
Catalyst: project progress, and regional peers valuation However, given the scale of its value-driving expansion and revitalization programme, we see that execution risks are heightened. Coupled with concerns over materials costs (and ability to pass on these higher costs in the face of import competition), we would rather wait for signs of further progress of these expansion plans to become more bullish on the stock.
Valuation is at premium to regional peers At current levels, Krakatau trades at a 20% premium to its regional peers. While one may argue that such a (or further) premium may be warranted given its growth prospects (24% revenue 3-year CAGR and 49% EBITDA 3-year CAGR, on our estimates), we believe that our target price valuation sufficiently reflects this.
Risk: execution of expansion programme and production costs In our view, execution of the expansion programme (failure of which will result in lower volumes) is the key risk to Krakatau’s financial forecasts and valuation. Ability to secure necessary funding and rising production costs are also key risks.
31 Dec FY10 FY11F FY12F FY13F
Currency (IDR) Actual Old New Old New Old New
Revenue (bn) 14,856 19,613 23,235 28,658
Reported net profit (bn) 1,062 1,493 1,976 2,503
Normalised net profit (bn) 1,062 1,493 1,976 2,503
Normalised EPS 67.3 94.7 125.3 158.6
Norm. EPS growth (%) 114.5 40.6 32.3 26.6
Norm. P/E (x) 17.7 N/A 12.6 N/A 9.5 N/A 7.5
EV/EBITDA 15.6 N/A 9.5 N/A 7.6 N/A 6.1
Price/book (x) 2.0 N/A 1.8 N/A 1.6 N/A 1.4
Dividend yield (%) 0.8 N/A 1.7 N/A 2.4 N/A 3.2
ROE (%) 14.1 15.1 17.6 19.3
Net debt/equity (%) 22.4 37.1 51.3 58.0
Source: Nomura estimates
Anchor themes
Indonesia's economy is set to take on a new growth trajectory. Robust macro story, coupled with deployment of fiscal budget, should help propel investment spending in infrastructure and further unlock the full potential of growth.
Nomura vs consensus
Nomura's earnings estimates are 5% below consensus for 2011F and 60% above consensus for 2012F.
Research analysts
Indonesia Basic Materials
Wilianto Ie - PTNI [email protected] +62 21 2991 3341
Andy Lesmana - PTNI [email protected] +62 21 2991 3344
See Appendix A-1 for analyst certification and important disclosures. Analysts employed by non US affiliates are not registered or qualified as research analysts with FINRA in the US.
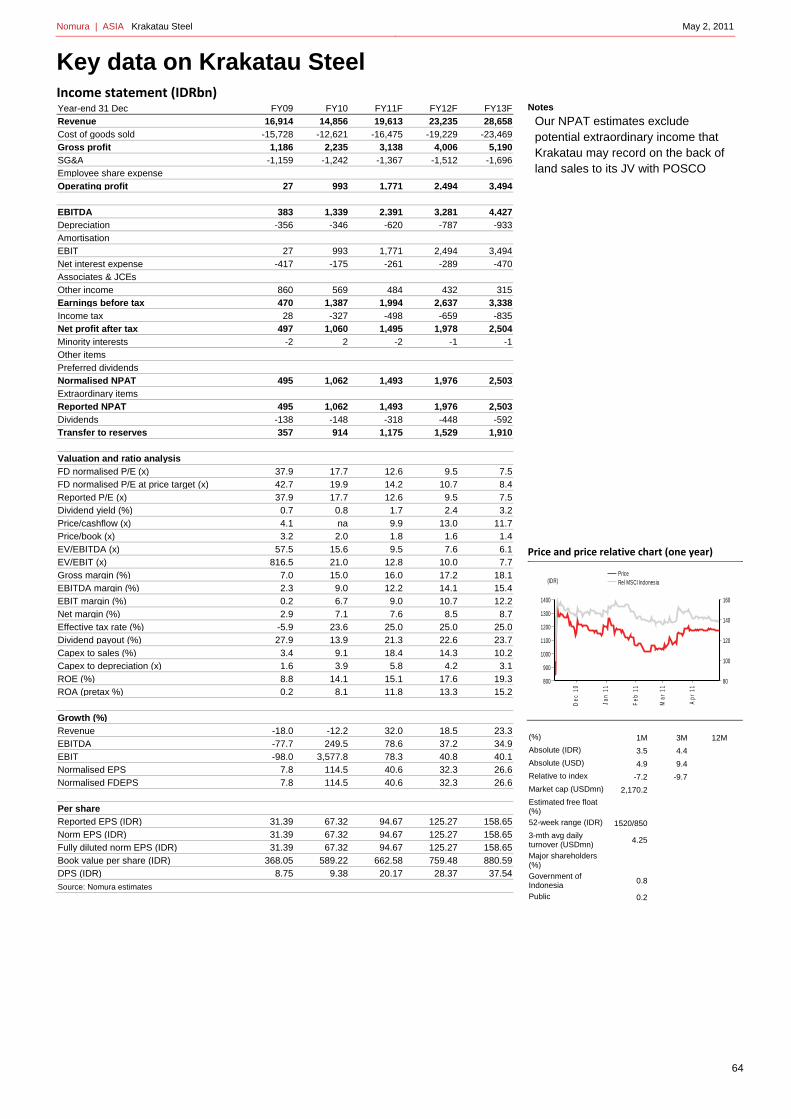
Nomura | ASIA Krakatau Steel May 2, 2011
64
Key data on Krakatau Steel Income statement (IDRbn) Year-end 31 Dec FY09 FY10 FY11F FY12F FY13FRevenue 16,914 14,856 19,613 23,235 28,658Cost of goods sold -15,728 -12,621 -16,475 -19,229 -23,469Gross profit 1,186 2,235 3,138 4,006 5,190SG&A -1,159 -1,242 -1,367 -1,512 -1,696Employee share expense
Operating profit 27 993 1,771 2,494 3,494
EBITDA 383 1,339 2,391 3,281 4,427Depreciation -356 -346 -620 -787 -933Amortisation
EBIT 27 993 1,771 2,494 3,494Net interest expense -417 -175 -261 -289 -470Associates & JCEs
Other income 860 569 484 432 315Earnings before tax 470 1,387 1,994 2,637 3,338Income tax 28 -327 -498 -659 -835Net profit after tax 497 1,060 1,495 1,978 2,504Minority interests -2 2 -2 -1 -1Other items
Preferred dividends
Normalised NPAT 495 1,062 1,493 1,976 2,503Extraordinary items
Reported NPAT 495 1,062 1,493 1,976 2,503Dividends -138 -148 -318 -448 -592Transfer to reserves 357 914 1,175 1,529 1,910
Valuation and ratio analysis
FD normalised P/E (x) 37.9 17.7 12.6 9.5 7.5FD normalised P/E at price target (x) 42.7 19.9 14.2 10.7 8.4Reported P/E (x) 37.9 17.7 12.6 9.5 7.5Dividend yield (%) 0.7 0.8 1.7 2.4 3.2Price/cashflow (x) 4.1 na 9.9 13.0 11.7Price/book (x) 3.2 2.0 1.8 1.6 1.4EV/EBITDA (x) 57.5 15.6 9.5 7.6 6.1EV/EBIT (x) 816.5 21.0 12.8 10.0 7.7Gross margin (%) 7.0 15.0 16.0 17.2 18.1EBITDA margin (%) 2.3 9.0 12.2 14.1 15.4EBIT margin (%) 0.2 6.7 9.0 10.7 12.2Net margin (%) 2.9 7.1 7.6 8.5 8.7Effective tax rate (%) -5.9 23.6 25.0 25.0 25.0Dividend payout (%) 27.9 13.9 21.3 22.6 23.7Capex to sales (%) 3.4 9.1 18.4 14.3 10.2Capex to depreciation (x) 1.6 3.9 5.8 4.2 3.1ROE (%) 8.8 14.1 15.1 17.6 19.3ROA (pretax %) 0.2 8.1 11.8 13.3 15.2
Growth (%)
Revenue -18.0 -12.2 32.0 18.5 23.3EBITDA -77.7 249.5 78.6 37.2 34.9EBIT -98.0 3,577.8 78.3 40.8 40.1Normalised EPS 7.8 114.5 40.6 32.3 26.6Normalised FDEPS 7.8 114.5 40.6 32.3 26.6
Per share
Reported EPS (IDR) 31.39 67.32 94.67 125.27 158.65Norm EPS (IDR) 31.39 67.32 94.67 125.27 158.65Fully diluted norm EPS (IDR) 31.39 67.32 94.67 125.27 158.65Book value per share (IDR) 368.05 589.22 662.58 759.48 880.59DPS (IDR) 8.75 9.38 20.17 28.37 37.54Source: Nomura estimates
Notes
Our NPAT estimates exclude potential extraordinary income that Krakatau may record on the back of land sales to its JV with POSCO
Price and price relative chart (one year)
(%) 1M 3M 12M
Absolute (IDR) 3.5 4.4
Absolute (USD) 4.9 9.4
Relative to index -7.2 -9.7
Market cap (USDmn) 2,170.2
Estimated free float (%) 52-week range (IDR) 1520/850
3-mth avg daily turnover (USDmn)
4.25
Major shareholders (%) Government of Indonesia
0.8
Public 0.2
800
900
1000
1100
1200
1300
1400
80
100
120
140
160
Dec
10
Jan
11
Feb
11
Mar
11
Apr
11
PriceRel MSCI Indonesia(IDR)

Nomura | ASIA Krakatau Steel May 2, 2011
65
Cashflow (IDRbn) Year-end 31 Dec FY09 FY10 FY11F FY12F FY13FEBITDA 383 1,339 2,391 3,281 4,427Change in working capital 3,771 -1,463 -43 -1,226 -1,829Other operating cashflow 399 -48 -454 -606 -987Cashflow from operations 4,553 -172 1,894 1,448 1,611Capital expenditure -573 -1,356 -3,618 -3,327 -2,930Free cashflow 3,980 -1,528 -1,724 -1,879 -1,319Reduction in investments -224 -135 124 0 0Net acquisitions 0 0 0 0 0Reduction in other LT assets -44 126 -35 -25 5Addition in other LT liabilities -347 90 0 0 0Adjustments 0 0 0 0 0Cashflow after investing acts 3,365 -1,447 -1,635 -1,904 -1,314Cash dividends -138 -148 -318 -448 -592Equity issue 0 5,601 0 0 0Debt issue -2,587 1,371 -111 1,970 2,030Convertible debt issue 0 0 0 0 0Others 11 -2,932 -20 -1 -1Cashflow from financial acts -2,714 3,891 -449 1,521 1,437Net cashflow 651 2,444 -2,084 -383 123Beginning cash 1,100 1,751 4,195 2,110 1,727Ending cash 1,751 4,195 2,110 1,727 1,850Ending net debt 3,273 2,085 3,880 6,143 8,053Source: Nomura estimates
Balance sheet (IDRbn) As at 31 Dec FY09 FY10 FY11F FY12F FY13FCash & equivalents 1,751 4,195 2,110 1,727 1,850Marketable securities 143 29 0 0 0Accounts receivable 1,642 1,183 1,881 2,228 2,748Inventories 4,872 6,549 6,180 7,321 9,029Other current assets 224 333 403 477 589Total current assets 8,631 12,289 10,574 11,753 14,216LT investments 158 406 311 311 311Fixed assets 3,379 4,389 7,386 9,927 11,924Goodwill
Other intangible assets
Other LT assets 628 502 537 563 557Total assets 12,796 17,586 18,808 22,554 27,008Short-term debt 4,435 5,371 5,099 4,954 4,957Accounts payable 739 902 948 1,106 1,350Other current liabilities 957 658 967 1,146 1,413Total current liabilities 6,130 6,931 7,015 7,207 7,721Long-term debt 589 909 891 2,915 4,946Convertible debt
Other LT liabilities 229 319 319 319 319Total liabilities 6,949 8,159 8,224 10,441 12,985Minority interest 41 132 132 132 132Preferred stock 0 0 0 0 0Common stock 3,303 8,904 8,904 8,904 8,904Retained earnings 2,502 391 1,548 3,077 4,987Proposed dividends
Other equity and reserves
Total shareholders' equity 5,806 9,295 10,452 11,981 13,891Total equity & liabilities 12,796 17,586 18,808 22,554 27,009
Liquidity (x)
Current ratio 1.41 1.77 1.51 1.63 1.84Interest cover 0.1 5.7 6.8 8.6 7.4
Leverage
Net debt/EBITDA (x) 8.54 1.56 1.62 1.87 1.82Net debt/equity (%) 56.4 22.4 37.1 51.3 58.0
Activity (days)
Days receivable 39.2 34.7 28.5 32.4 31.7Days inventory 151.2 165.1 141.0 128.5 127.1Days payable 18.3 23.7 20.5 19.5 19.1Cash cycle 172.2 176.1 149.0 141.3 139.7Source: Nomura estimates
Notes
Free cashflow will likely remain negative given a heavy capex programme
Notes
Despite additional debt to be incurred for the capex programme, leverage should remain manageable

Nomura | ASIA Krakatau Steel May 2, 2011
66
Company Background Krakatau is the largest steel producer in Indonesia, who we expect to benefit from rising infrastructure spending on additional capacity. However, execution risk, import competition and a higher-than-regional peers multiple valuation prohibit us from taking a stronger position on the company.
History
Krakatau is the biggest integrated steel company in Indonesia. We believe the company is well positioned to take advantage of growing steel consumption in Indonesia, which is among the world’s lowest (29 kg of steel per capita), and rising activities in the infrastructure sector, which is among the largest steel consumers. Krakatau’ plant modernization programme (over US$1bn) is very important, in our view, to enhance Krakatau's growth prospects and cost efficiency improvement.
In addition, the company has also entered into a joint venture (JV) programme with the Korean steel producer company, POSCO, to develop a new integrated steel slab and steel plate plant in Cilegon. The JV is expected by management to have 6m tpa production capacity, in which Krakatau will initially have a 30% equity stake with an option to increase it to 45% by the time of completing the first phase, slated to be in 2014 with an installed new capacity of 3mn tpa. Krakatau will be able to off-take 1m tpa of steel slab from this JV.
Fig. 69: Business structure of Krakatau
Source: Company data
Expansion plan The company recently launched a revitalization and expansion programme for its production facility that will see its capacity increase by 55% from the current production capacity of 2.75mn tonnes per annum to 4.25mn tonnes in 2014. The revitalization and expansion programmes in the next four years will comprise:
• Revitalization of existing facilities:
– Direct Reduction Plant – expanding the capacity from 1.5m tpa to 1.74m tpa
– Steel Slab Plant – expanding the capacity from 1.8m tpa to 2.1m tpa
– Hot Strip Mill – expanding the capacity from 2m tpa to 2.4m tpa
• Construction of iron making facilities in South Kalimantan, Indonesia, which will be fed by domestic iron ore with a new installed capacity of 315,000 tpa
• Construction of a new blast furnace complex at the Cilegon facilities
– New Blast Furnace Complex – new capacity of 1.2m tpa
– Expansion of Steel Slab Plant from 2.1m tpa to 2.4m tpa
• Further Hot Strip Mill Expansion – expanding the capacity from 2.1m tpa to 2.4m tpa
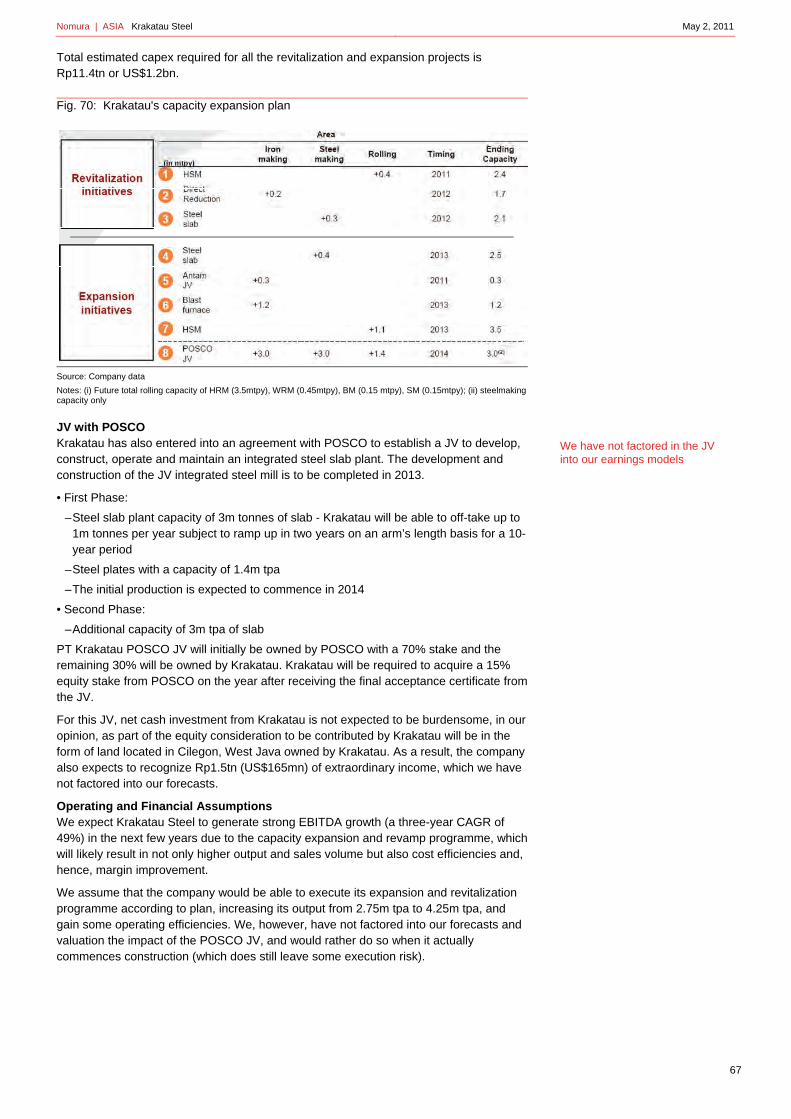
Nomura | ASIA Krakatau Steel May 2, 2011
67
Total estimated capex required for all the revitalization and expansion projects is Rp11.4tn or US$1.2bn.
Fig. 70: Krakatau's capacity expansion plan
Source: Company data
Notes: (i) Future total rolling capacity of HRM (3.5mtpy), WRM (0.45mtpy), BM (0.15 mtpy), SM (0.15mtpy); (ii) steelmakingcapacity only
JV with POSCO Krakatau has also entered into an agreement with POSCO to establish a JV to develop, construct, operate and maintain an integrated steel slab plant. The development and construction of the JV integrated steel mill is to be completed in 2013.
• First Phase:
– Steel slab plant capacity of 3m tonnes of slab - Krakatau will be able to off-take up to 1m tonnes per year subject to ramp up in two years on an arm’s length basis for a 10-year period
– Steel plates with a capacity of 1.4m tpa
– The initial production is expected to commence in 2014
• Second Phase:
– Additional capacity of 3m tpa of slab
PT Krakatau POSCO JV will initially be owned by POSCO with a 70% stake and the remaining 30% will be owned by Krakatau. Krakatau will be required to acquire a 15% equity stake from POSCO on the year after receiving the final acceptance certificate from the JV.
For this JV, net cash investment from Krakatau is not expected to be burdensome, in our opinion, as part of the equity consideration to be contributed by Krakatau will be in the form of land located in Cilegon, West Java owned by Krakatau. As a result, the company also expects to recognize Rp1.5tn (US$165mn) of extraordinary income, which we have not factored into our forecasts.
Operating and Financial Assumptions We expect Krakatau Steel to generate strong EBITDA growth (a three-year CAGR of 49%) in the next few years due to the capacity expansion and revamp programme, which will likely result in not only higher output and sales volume but also cost efficiencies and, hence, margin improvement.
We assume that the company would be able to execute its expansion and revitalization programme according to plan, increasing its output from 2.75m tpa to 4.25m tpa, and gain some operating efficiencies. We, however, have not factored into our forecasts and valuation the impact of the POSCO JV, and would rather do so when it actually commences construction (which does still leave some execution risk).
We have not factored in the JV into our earnings models

Nomura | ASIA Krakatau Steel May 2, 2011
68
Higher steel selling price would also contribute to the company's revenue and EBITDA growth, but this would partially be compensated by higher iron ore prices. Energy costs would have less of an impact on its profitability, given prices of gas (the primary source of energy) are typically locked in for long-term contracts.
Our current year earnings numbers exclude some Rp1.5tn in extraordinary gains that the company expects to record on the back of land sale to the JV. We would reflect these numbers into our forecasts when the transaction takes place, which is likely to be in mid-2011 when the JV commences its construction works for the new plant (showing concrete evidence that the projects are commencing on time).
Our model forecast assumptions of steel prices for Krakatau are derived based on HRC steel export prices from North Asia (Korea – POSCO) plus an import duty of 5-10% that the Indonesian government imposes for steel products.
Fig. 71: Krakatau’s key operating and financial assumptions
Source: Company data, Nomura estimates
Valuation We value Krakatau Steel using the DCF methodology, given the company’s growth prospects supported by its capacity expansion and revamp plan. We assume cost of equity of 18% (derived from a risk free rate of 6.5%, a market risk of 15%, and Beta of 1.35), cost of debt of 9%, and a target leverage capital mix of 70% net debt-to-equity. We use 7x EV/EBITDA for our terminal value in 2020, which reflects the multiples of similar steel companies in the region. We arrive at our target price of IDR1,340.
SUMMARY 2005 2006 2007 2008 2009 2010 2011F 2012F 2013F 2014F 2015F 2016F 2017F 2018F 2019F 2020F
Operating MeasuresProduction Capacity mm t 7.7 7.7 7.7 7.7 8.0 8.4 10.0 11.6 11.6 11.6 11.6 11.6 11.6 11.6 Utilization Rate % 78% 71% 63% 65% 68% 72% 67% 68% 73% 73% 73% 73% 73% 73%Sales Volume mm t 2.2 2.1 2.0 1.9 2.0 2.3 2.8 2.8 2.8 2.8 2.8 2.8 2.8 2.8 Avg Price per ton Rpmm/t 6.4 9.5 7.9 7.1 9.1 9.4 9.7 9.7 9.8 10.0 10.3 10.4 10.6 10.8
US$/t 698 983 758 784 1,051 1,140 1,199 1,194 1,204 1,235 1,262 1,279 1,300 1,325
Cost per ton (Steel only)Production Cash Cost Rpmm/t 5.5 8.1 7.3 6.0 7.5 7.5 7.7 7.6 7.4 7.6 7.7 7.9 8.1 8.2
US$/t 605 843 699 660 858 912 949 937 916 930 948 966 987 1,007 COGS per ton Rpmm/t 5.7 8.3 7.4 6.2 7.8 7.8 8.0 7.9 7.8 7.9 8.1 8.2 8.4 8.6
US$/t 622 860 715 678 891 951 988 977 957 972 990 1,009 1,030 1,051 EBITDA per ton Rpmm/t 0.5 0.8 0.2 0.7 1.2 1.4 1.6 1.6 1.9 2.0 2.0 2.0 2.0 2.0
US$/t 57 86 18 77 137 171 195 200 228 242 249 245 241 243

Nomura | ASIA Krakatau Steel May 2, 2011
69
Fig. 72: Krakatau DCF Valuation (IDRbn)
Source: Company data, Nomura estimates
While we could be more aggressive in assigning a target price for Krakatau, we note that the stock is already trading at premium to its regional peers. While the premium may be warranted in light of the company’s prospects, it does also face execution risk.
Fig. 73: PE and EV/EBITDA multiple valuation comparison Krakatau is trading at premium to its regional peers
Source: Nomura
Risks and sensitivities As we have mentioned earlier, we see execution of the expansion programme as a key risk to the financial forecasts and valuation of Krakatau. Failure in the smooth execution of the programme could result in lower production volumes and jeopardize the valuation and financials of Krakatau.
Rising material costs, due mainly to rising iron ore prices, are also a risk. While Krakatau Steel arguably will have some ability to pass on these rising costs to its customers, import competition may somewhat limit this ability. Our evaluation of the potential impact of such a rise in materials costs does not consider any potential rise in selling prices.
Downside risks include: 1) Inability to pass on higher production costs to higher selling prices, and 2) delays in the expansion and revamp programmes. Upside risks include: 1) higher-than-expected contribution from the POSCO projects, and 2) extraordinary gains from its land sales to the JV.
Discounted Cashflows 2005 2006 2007 2008 2009 2010 2011F 2012F 2013F 2014F 2015F 2016F 2017F 2018F 2019F 2020F
Calculation of Unlevered After Tax Free Cash FlowTaxable EBIT ‐ 793 1,360 27 993 1,771 2,494 3,494 3,552 4,201 4,500 4,637 4,533 4,449 4,465
Taxes 25% ‐ (198) (340) (7) (248) (443) (624) (873) (888) (1,050) (1,125) (1,159) (1,133) (1,112) (1,116)
After Tax Cash Flow ‐ 595 1,020 20 745 1,328 1,871 2,620 2,664 3,151 3,375 3,478 3,399 3,337 3,348
Add/(Less):Depreciation and Amortization ‐ 354 357 356 346 620 787 933 951 967 983 1,000 1,017 1,034 1,052 Change in Working Capital ‐ ‐ (3,480) 3,771 (1,463) (43) (1,226) (1,829) 75 (219) (289) (255) (191) (212) (254) Capital Expenditure ‐ ‐ (336) (573) (1,356) (3,618) (3,327) (2,930) (359) (320) (326) (332) (338) (345) (351)
Unlevered After Tax Free Cash Flow ‐ 828 (2,913) 3,647 (1,613) (1,533) (1,806) (1,208) 3,327 3,576 3,740 3,888 3,884 3,812 3,792
Discount Rate 10.7% 11.7% 12.7% Total Debt 5,990 Rf 6.50% Cost of Equity 17.98% # of share 15,775
Terminal EBITDA x 6.0 x 7.0 x 8.0 x Cash & Equivalent (2,110) Rm 15.00% Cost of Debt 9.00% FX 8,650 Perpetuity Rate 2.0% 3.0% 4.0% Minority Interest 132 Beta 1.35 Leverage 70.00%
Total Net Debt 4,012 Cost of Equity 18.0% WACC 11.69%
2005 2006 2007 2008 2009 2010 2011 2012 2013 2014 2015 2016 2017 2018 2019 2020
Unlevered After Tax Free Cash Flow ‐ 828 (2,913) 3,647 (1,613) (1,533) (1,806) (1,208) 3,327 3,576 3,740 3,888 3,884 3,812 3,792 Growth #DIV/0! ‐452% ‐225% ‐144% ‐5% 18% ‐33% ‐375% 7% 5% 4% 0% ‐2% ‐1%
EBITDA 5,516
NPV of 10‐Year Cash Flow NPV of Terminal Value Total Firm Value Total Equity Value Price per Share(Rp. bn) (Excl. Terminal Value) EBITDA Terminal Multiple EBITDA Terminal Multiple EBITDA Terminal Multiple EBITDA Terminal Multiple(US$ mm) 6.0 x 7.0 x 8.0 x 6.0 x 7.0 x 8.0 x 6.0 x 7.0 x 8.0 x
Discount Rates10.7% 11,701 13,266 15,477 17,688 24,967 27,178 29,389 20,955 23,166 25,377 1,328 1,469 1,609
1,353 1,534 1,789 2,045 2,886 3,142 3,398 2,423 2,678 2,934 0.15 0.17 0.19
11.7% 11,021 12,235 14,274 16,313 23,256 25,295 27,334 19,244 21,283 23,322 1,220 1,349 1,478
1,274 1,414 1,650 1,886 2,689 2,924 3,160 2,225 2,461 2,696 0.14 0.16 0.17 12.7% 10,387 11,291 13,173 15,055 21,678 23,560 25,442 17,666 19,548 21,430 1,120 1,239 1,358
1,201 1,305 1,523 1,740 2,506 2,724 2,941 2,042 2,260 2,477 0.13 0.14 0.16
Assumptions Net Debt 2011 (Rp. bn) Equity Cost of Fund WACC
Ticker Rating PE 11F PE 12F EV/EBITDA
11F EV/EBITDA
12F
Tata Steel TATA IN Buy 9.60 8.50 6.50 5.50
SAIL SAIL IN Buy 10.80 8.50 9.00 7.70
POSCO 005490 KS Buy 9.30 7.80 6.30 5.50
Hyundai 004020 KS Buy 9.80 8.70 9.20 7.90
Dongkuk 001230 KS Buy 11.50 n.a. 7.60 -
Average 10.20 8.38 7.72 5.32
Krakatau Steel KRAS IJ Neutral 12.60 9.50 9.50 7.60
Krakatau is trading at 12.6x PE11F and 9.5x PE12F; and 9.5x EV/EBITDA 11F and 7.6x EV/EBITDA 12F - an average of 20% premium to its regional peers

Nomura | ASIA Krakatau Steel May 2, 2011
Fig. 74: Krakatau's financial forecasts and valuation sensitivity
Source: Nomura estimates
2011F 2012F 2013FRevenue ‐4.7% ‐4.7% ‐4.7%COGS 0.0% ‐1.2% ‐0.8%EBITDA ‐37.6% ‐25.8% ‐25.6%Net Income ‐45.1% ‐32.7% ‐35.1%Valuation 810 ‐40.0%
2011F 2012F 2013FRevenue 0.0% 0.0% 0.0%COGS 2.2% 2.6% 2.8%EBITDA ‐15.4% ‐15.3% ‐14.8%Net Income ‐18.5% ‐19.6% ‐20.4%Valuation 1,080 ‐20.0%
Volume ‐ Estimated impact of lower sales volume by 5% on Krakatau's financials,
earnings and valuation
Material cots ‐ Estimated impact of higher raw material costs by 5% (reflecting
higher iron ore) on Krakatau's financials, earnings and valuation
Rising material costs, such as iron ore prices, will also have some positive implication to Krakatau's selling prices. However, we note that price adjustments could be a challenge in light of import competition
70

Key company data: See page 2 for company data, and detailed price/index chart. Rating: See report end for details of Nomura’s rating system.
Wijaya Karya WIKA.JK WIKA IJ
ENGINEERING & CONSTRUCTION
EQUITY RESEARCH
Building the nation
Benefits from higher volume, but await better momentum for entry
May 2, 2011
Rating Starts at
Neutral
Target price Starts at780
IDR 780
Closing price April 28, 2011
IDR 680
Potential upside +14.7%
Action: Neutral until better momentum We initiate coverage of Wijaya Karya with a Neutral rating. While we believe the company will benefit from infra spending, particularly that initiated by the government (benefiting from government ownership), we believe legislation of land law holds the key to greater growth momentum. Until then, the current business will be exposed to higher building material costs.
Catalyst: Legislation of land law The upcoming land law is targeted to be passed by the parliament to take effect in mid July during the plenary meeting session of parliament. The law is expected to trigger accelerated momentum for infrastructure development and hence construction works. Without this law, the business prospect of construction companies such as Wijaya Karya will remain driven by economic growth and cyclical factors.
Valuation We have used DCF to derive our target price valuation. We have adopted management's guidance for 2011 financial performance whereby the company is expected to recognise strong growth on the back of conversion of the previous year’s order book as revenue.
Risks Key risks for the business is volume (which may have positive surprise on the back of upcoming land law) and building material costs.
31 Dec FY10 FY11F FY12F FY13F
Currency (IDR) Actual Old New Old New Old New
Revenue (bn) 6,062 8,444 8,609 9,633
Reported net profit (bn) 285 355 352 370
Normalised net profit (bn) 285 355 352 370
Normalised EPS 47.5 59.1 58.6 61.7
Norm. EPS growth (%) 50.4 24.5 -0.9 5.2
Norm. P/E (x) 14.5 N/A 11.7 N/A 11.8 N/A 11.2
EV/EBITDA 6.2 N/A 5.2 N/A 5.0 N/A 4.5
Price/book (x) 2.3 N/A 2.0 N/A 1.8 N/A 1.6
Dividend yield (%) 1.4 N/A 2.1 N/A 2.6 N/A 2.5
ROE (%) 17.1 18.3 16.0 15.1
Net debt/equity (%) net cash net cash net cash net cash
Source: Nomura estimates
Anchor themes
Indonesia's economy is set to take a new growth trajectory. The robust macro story, coupled with deployment of the fiscal budget, should help propel investment spending in infrastructure, to further unlock the full growth potential
Nomura vs consensus
Nomura's net earnings estimates are 10% above consensus for 2011F and 8% below consensus for 2012F.
Research analysts
Indonesia Basic Materials
Wilianto Ie - PTNI [email protected] +62 21 2991 3341
Andy Lesmana - PTNI [email protected] +62 21 2991 3344
See Appendix A-1 for analyst certification and important disclosures. Analysts employed by non US affiliates are not registered or qualified as research analysts with FINRA in the US.

Nomura | ASIA Wijaya Karya May 2, 2011
72
Key data on Wijaya Karya Income statement (IDRbn) Year-end 31 Dec FY09 FY10 FY11F FY12F FY13FRevenue 6,614 6,062 8,444 8,609 9,633Cost of goods sold -5,968 -5,389 -7,535 -7,680 -8,638Gross profit 646 673 909 928 995SG&A -160 -196 -269 -286 -306Employee share expense
Operating profit 486 477 640 642 689
EBITDA 532 530 725 763 829Depreciation -47 -53 -85 -121 -140Amortisation
EBIT 486 477 640 642 689Net interest expense -21 19 10 -13 -14Associates & JCEs
Other income -116 -23 -19 9 17Earnings before tax 348 473 631 638 692Income tax -142 -162 -253 -258 -289Net profit after tax 207 311 378 379 403Minority interests -17 -26 -23 -28 -33Other items
Preferred dividends
Normalised NPAT 189 285 355 352 370Extraordinary items
Reported NPAT 189 285 355 352 370Dividends -50 -57 -86 -106 -106Transfer to reserves 139 228 269 245 265
Valuation and ratio analysis
FD normalised P/E (x) 21.9 14.5 11.7 11.8 11.2FD normalised P/E at price target (x) 24.7 16.4 13.2 13.3 12.6Reported P/E (x) 21.9 14.5 11.7 11.8 11.2Dividend yield (%) 1.2 1.4 2.1 2.6 2.5Price/cashflow (x) 4.3 8.2 na 8.6 9.4Price/book (x) 2.7 2.3 2.0 1.8 1.6EV/EBITDA (x) 5.8 6.2 5.2 5.0 4.5EV/EBIT (x) 6.4 6.9 5.9 6.0 5.4Gross margin (%) 9.8 11.1 10.8 10.8 10.3EBITDA margin (%) 8.0 8.7 8.6 8.9 8.6EBIT margin (%) 7.3 7.9 7.6 7.5 7.2Net margin (%) 2.9 4.7 4.2 4.1 3.8Effective tax rate (%) 40.6 34.2 40.1 40.5 41.7Dividend payout (%) 26.6 20.0 24.1 30.3 28.5Capex to sales (%) 0.6 2.1 4.9 4.2 2.1Capex to depreciation (x) 0.9 2.4 4.8 3.0 1.5ROE (%) 13.0 17.1 18.3 16.0 15.1ROA (pretax %) 10.5 10.0 11.0 9.4 9.2
Growth (%)
Revenue 0.9 -8.3 39.3 1.9 11.9EBITDA 23.1 -0.4 36.8 5.2 8.7EBIT 68.8 -1.8 34.2 0.3 7.4Normalised EPS 21.5 50.4 24.5 -0.9 5.2Normalised FDEPS 21.5 50.4 24.5 -0.9 5.2
Per share
Reported EPS (IDR) 31.57 47.49 59.14 58.63 61.67Norm EPS (IDR) 31.57 47.49 59.14 58.63 61.67Fully diluted norm EPS (IDR) 31.57 47.49 59.14 58.63 61.67Book value per share (IDR) 255.42 300.26 345.16 386.05 430.13DPS (IDR) 8.38 9.50 14.25 17.74 17.59Source: Nomura estimates
Notes
Revenue and earnings growth for 2011 is expected to post robust growth on the back of recognition of some order boon as revenue.
Price and price relative chart (one year)
(%) 1M 3M 12M
Absolute (IDR) 9.5 11.3 66.3
Absolute (USD) 11.0 16.6 73.1
Relative to index -1.1 -2.8 46.2
Market cap (USDmn) 478.7
Estimated free float (%) 52-week range (IDR) 770/310
3-mth avg daily turnover (USDmn)
0.49
Major shareholders (%) Government of Indonesia
0.7
Public 0.3
300
400
500
600
700
800
80
100
120
140
160
May
10
Jun
10
Jul 1
0
Aug
10
Sep
10
Oct
10
Nov
10
Dec
10
Jan
11
Feb
11
Mar
11
Apr
11
PriceRel MSCI Indonesia(IDR)

Nomura | ASIA Wijaya Karya May 2, 2011
73
Cashflow (IDRbn) Year-end 31 Dec FY09 FY10 FY11F FY12F FY13FEBITDA 532 530 725 763 829Change in working capital 712 134 -706 -21 -104Other operating cashflow -280 -162 -256 -260 -287Cashflow from operations 964 502 -237 482 439Capital expenditure -43 -127 -412 -359 -206Free cashflow 921 375 -649 123 234Reduction in investments -102 -28 -190 -80 -80Net acquisitions 0 0 0 0 0Reduction in other LT assets -98 -325 141 -27 -61Addition in other LT liabilities -46 -182 316 13 93Adjustments 0 0 0 0 0Cashflow after investing acts 674 -160 -382 29 185Cash dividends -50 -57 -86 -106 -106Equity issue -7 53 0 0 0Debt issue -477 206 85 33 59Convertible debt issue 0 0 0 0 0Others 19 -26 0 0 0Cashflow from financial acts -516 177 -1 -74 -47Net cashflow 158 17 -383 -45 138Beginning cash 1,051 1,210 1,227 844 800Ending cash 1,210 1,227 844 800 938Ending net debt -1,053 -864 -397 -320 -400Source: Nomura estimates
Balance sheet (IDRbn) As at 31 Dec FY09 FY10 FY11F FY12F FY13FCash & equivalents 1,210 1,227 844 800 939Marketable securities 0 0 0 0 0Accounts receivable 872 900 1,254 1,278 1,430Inventories 1,045 853 1,388 1,415 1,584Other current assets 1,835 2,141 2,429 2,476 2,771Total current assets 4,962 5,121 5,915 5,970 6,724LT investments 122 150 340 420 500Fixed assets 332 406 733 971 1,037Goodwill 10 8 8 8 8Other intangible assets
Other LT assets 274 601 460 486 548Total assets 5,701 6,286 7,456 7,855 8,816Short-term debt 157 87 122 104 113Accounts payable 1,163 1,220 1,548 1,578 1,775Other current liabilities 2,116 2,335 2,477 2,525 2,840Total current liabilities 3,436 3,642 4,147 4,208 4,728Long-term debt 0 276 326 376 426Convertible debt
Other LT liabilities 629 451 773 789 882Total liabilities 4,065 4,369 5,246 5,373 6,036Minority interest 103 115 138 166 199Preferred stock 0 0 0 0 0Common stock 1,131 1,184 1,184 1,184 1,184Retained earnings 402 618 887 1,133 1,397Proposed dividends
Other equity and reserves
Total shareholders' equity 1,533 1,802 2,071 2,317 2,581Total equity & liabilities 5,701 6,286 7,456 7,855 8,816
Liquidity (x)
Current ratio 1.44 1.41 1.43 1.42 1.42Interest cover 22.8 na na 48.7 49.7
Leverage
Net debt/EBITDA (x) net cash net cash net cash net cash net cashNet debt/equity (%) net cash net cash net cash net cash net cash
Activity (days)
Days receivable 52.7 53.3 46.5 53.8 51.3Days inventory 73.2 64.3 54.3 66.8 63.4Days payable 75.5 80.7 67.0 74.5 70.8Cash cycle 50.5 36.9 33.8 46.1 43.8Source: Nomura estimates
Notes
Profitability increases but more working capital funding and investment capex requirement results in net negative cashflows
Notes
Balance sheet remains liquid given substantial beginning cash balance

Nomura | ASIA Wijaya Karya May 2, 2011
74
Company Background We initiate coverage of Wijaya Karya, the largest listed construction company in Indonesia in terms of market cap, with a Neutral recommendation.
While we believe that the company will benefit from increasing construction works, we remain cautious on the impact of rising raw material costs to its margins. In addition, as business volume grows, working capital funding requirements will also increase, and will require strategic balance sheet management.
Business operation overview
Wijaya Karya is the largest listed state-owned construction company in Indonesia. The company would provide investors with the widest exposure to the construction sector in Indonesia. Its business portfolio is comprised of construction of a few investments in infrastructure projects that will not only benefit Wijaya Karya in terms of securing new projects but will also provide more stable source of earnings stream compared to the cyclical nature of the construction business.
Wijaya Karya has also diversified the type of construction works that contributes to its business performance ranging from civil works (general contractors), building development to sophisticated mechanical and chemical constructions such as geothermal power plants and chemical storage tanks, which typically provide higher construction margins.
Fig. 75: Wijaya Karya’s business structure
Source: Company
Given its government ownership background, we also expect that rising government spending on infrastructure would also benefit Wijaya Karya and other state owned construction companies most. The state-ownership relationship should allow the state owned construction companies to be more aggressive in bidding for government related infrastructure projects as a result of perceived lower credit risk.
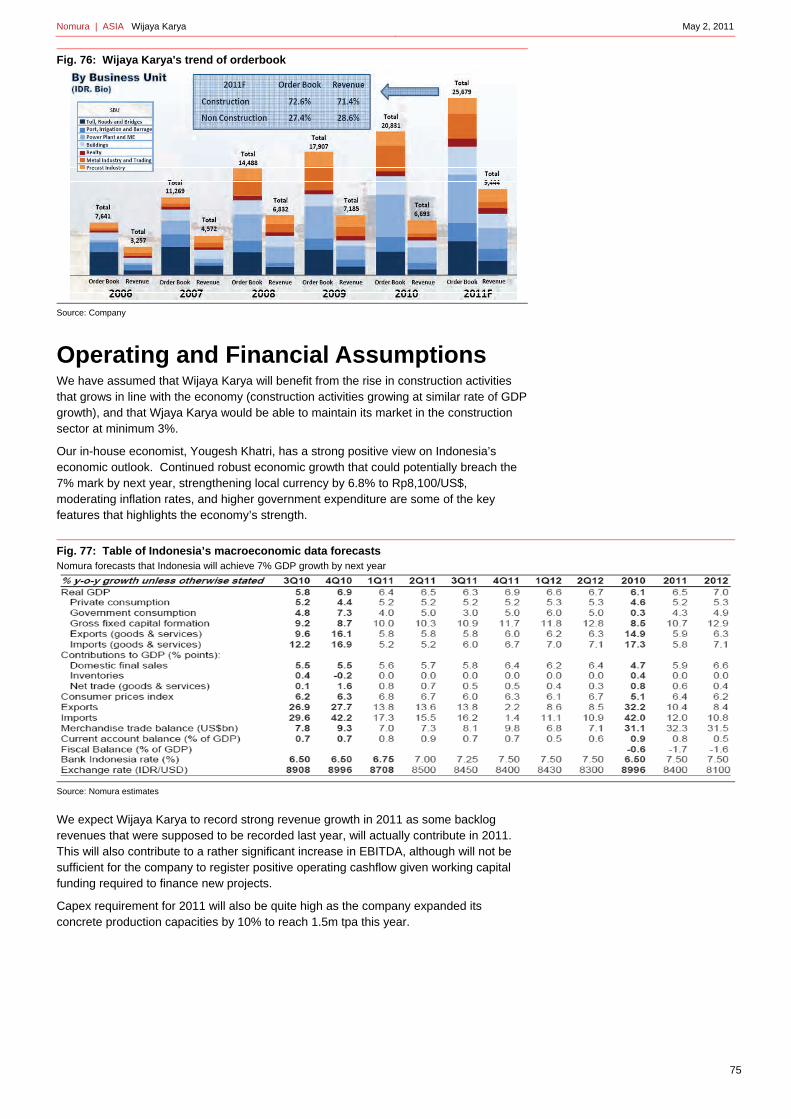
Nomura | ASIA Wijaya Karya May 2, 2011
75
Fig. 76: Wijaya Karya's trend of orderbook
Source: Company
Operating and Financial Assumptions We have assumed that Wijaya Karya will benefit from the rise in construction activities that grows in line with the economy (construction activities growing at similar rate of GDP growth), and that Wjaya Karya would be able to maintain its market in the construction sector at minimum 3%.
Our in-house economist, Yougesh Khatri, has a strong positive view on Indonesia’s economic outlook. Continued robust economic growth that could potentially breach the 7% mark by next year, strengthening local currency by 6.8% to Rp8,100/US$, moderating inflation rates, and higher government expenditure are some of the key features that highlights the economy’s strength.
Fig. 77: Table of Indonesia’s macroeconomic data forecasts Nomura forecasts that Indonesia will achieve 7% GDP growth by next year
Source: Nomura estimates
We expect Wijaya Karya to record strong revenue growth in 2011 as some backlog revenues that were supposed to be recorded last year, will actually contribute in 2011. This will also contribute to a rather significant increase in EBITDA, although will not be sufficient for the company to register positive operating cashflow given working capital funding required to finance new projects.
Capex requirement for 2011 will also be quite high as the company expanded its concrete production capacities by 10% to reach 1.5m tpa this year.

Nomura | ASIA Wijaya Karya May 2, 2011
76
Fig. 78: Summary of Wijaya Karya’s key operating assumptions and margins
Source: Companies and Nomura Estimates
Valuation We have derived target valuation for Wijaya Karya based on DCF to reflect future potential of growing infrastructure-related construction works.
We have valued Wijaya Karya using DCF using a cost of equity of 18.4% (derived from a risk free rate of 6.5%, market risk of 15%, and Beta of 1.4), cost of debt of 9%, and target leverage capital mix of 70% net debt to equity. We have used 6x EV/EBITDA multiples for our terminal value in 2020 which is approximately at the level where the stock currently trades.
Fig. 79: Wijaya Karya’s DCF Model
Source: Nomura estimates
Risks and Sensitivities Downside risks include: 1) higher building material costs that would adversely impact margins, 2) higher competition that would impact market share and hence volume; 3) higher capex requirements by investment subsidiaries. Upside risks include: 1) stronger-than-estimated construction sector growth; 2) higher-than-expected investment income from investment subsidiaries.
SUMMARY 2005 2006 2007 2008 2009 2010 2011 2012 2013 2014 2015 2016 2017 2018 2019 2020
Operating MeasuresOrder book Rp bn 7,641 11,269 14,488 17,907 20,831 25,679 25,533 29,194 33,139 37,720 42,897 48,820 55,577 63,215 71,930 Revenue realization am Rp bn 3,049 4,302 6,556 6,614 6,062 8,444 8,609 9,633 10,915 12,529 14,177 16,143 18,402 20,909 23,798 Revenue realization % % 39.9% 38.2% 45.2% 36.9% 29.1% 32.9% 33.7% 33.0% 32.9% 33.2% 33.0% 33.1% 33.1% 33.1% 33.1%
MarginsGross margin % 8.1% 8.7% 6.8% 9.8% 11.1% 10.8% 10.8% 10.3% 9.8% 9.5% 9.2% 9.2% 9.2% 9.1% 9.1%EBIT margin % 4.1% 5.6% 4.4% 7.3% 7.9% 7.6% 7.5% 7.2% 6.8% 6.7% 6.6% 6.7% 6.9% 7.0% 7.2%EBITDA margin % 4.9% 3.4% 6.6% 8.0% 8.7% 8.6% 8.9% 8.6% 8.2% 8.1% 7.9% 8.0% 8.1% 8.2% 8.3%Net profit margin % 3.1% 3.0% 2.4% 2.9% 4.7% 4.2% 4.1% 3.8% 3.5% 3.5% 3.4% 3.5% 3.6% 3.7% 3.9%
Discounted Cashflows 2005 2006 2007 2008 2009 2010 2011 2012 2013 2014 2015 2016 2017 2018 2019 2020
Calculation of Unlevered After Tax Free Cash FlowTaxable EBIT 124 240 288 486 477 640 642 689 740 840 936 1,087 1,267 1,465 1,703
Taxes 25% (30) (44) (82) (142) (162) (253) (258) (289) (327) (376) (425) (484) (552) (627) (714)
After Tax Cash Flow 94 196 206 344 315 387 384 400 412 464 510 603 715 838 989
Add/(Less):Depreciation and Amortization 26 (96) 145 47 53 85 121 140 156 173 190 208 227 246 266 Change in Working Capital (134) 137 (785) 712 134 (706) (21) (104) (122) (172) (172) (224) (259) (286) (334) Capital Expenditure (19) 109 (253) (145) (155) (602) (439) (286) (262) (268) (275) (283) (291) (299) (308)
Unlevered After Tax Free Cash Flow (33) 346 (688) 958 347 (836) 44 151 185 197 253 305 392 498 613
Discount Rate 10.8% 11.8% 12.8% Total Debt 363 Rf 6.50% Cost of Equity 18.40% # of shares 6,002
Terminal EBITDA x 5.0 x 6.0 x 7.0 x Cash & Equivalent (1,227) Rm 15.00% Cost of Debt 9.00% FX 8,650 Perpetuity Rate 5.0% 6.0% 7.0% Minority Interest 406 Beta 1.40 Leverage 70.00%
Total Net Debt (458) Cost of Equity 18.4% WACC 11.82%
2005 2006 2007 2008 2009 2010 2011 2012 2013 2014 2015 2016 2017 2018 2019 2020
Unlevered After Tax Free Cash Flow (33) 346 (688) 958 347 (836) 44 151 185 197 253 305 392 498 613 Growth ‐1147% ‐299% ‐239% ‐64% ‐341% ‐105% 241% 22% 7% 28% 20% 29% 27% 23%
EBITDA 1,969
NPV of 10‐Year Cash Flow NPV of Terminal Value Total Firm Value Total Equity Value Price per Share(Rp. bn) (Excl. Terminal Value) EBITDA Terminal Multiple EBITDA Terminal Multiple EBITDA Terminal Multiple EBITDA Terminal Multiple(US$ mm) 5.0 x 6.0 x 7.0 x 5.0 x 6.0 x 7.0 x 5.0 x 6.0 x 7.0 x
Discount Rates10.8% 508 3,488 4,193 4,897 3,996 4,700 5,405 4,454 5,158 5,863 742 860 977
59 403 485 566 462 543 625 515 596 678 0.09 0.10 0.11
11.8% 439 3,188 3,832 4,476 3,627 4,271 4,916 4,085 4,729 5,374 681 788 895
51 369 443 518 419 494 568 472 547 621 0.08 0.09 0.10 12.8% 376 2,917 3,506 4,095 3,293 3,882 4,471 3,751 4,340 4,929 625 723 821
43 337 405 473 381 449 517 434 502 570 0.07 0.08 0.09
Assumptions Net Debt 2011 (Rp. bn) Equity Cost of Fund WACC

Nomura | ASIA Wijaya Karya May 2, 2011
77
Fig. 80: Table of sensitivities of Wijaya Karya's earnings forecasts and valuation
Source: Nomura estimates
Volume lower by 5.0%
2011 2012 2013
Revenue -5% -5% -5%
EBITDA -6% -6% -6%
Net Income -8% -9% -9%
Valuation -8%
Margins lower by 5.0%
2011 2012 2013
Revenue 0.0% 0.0% 0.0%
EBITDA -6.3% -6.1% -6.0%
Net Income -12.8% -13.3% -13.8%
Valuation -11.4%

Nomura | AEJ Indonesia Infrastructure May 2, 2011
Appendix A-1
Analyst Certification
We, Wilianto Ie and Andy Lesmana, hereby certify (1) that the views expressed in this Research report accurately reflect our personal views about any or all of the subject securities or issuers referred to in this Research report, (2) no part of our compensation was, is or will be directly or indirectly related to the specific recommendations or views expressed in this Research report and (3) no part of our compensation is tied to any specific investment banking transactions performed by Nomura Securities International, Inc., Nomura International plc or any other Nomura Group company.
Issuer Specific Regulatory Disclosures Mentioned companies Issuer name Ticker Price Price date Stock rating Sector rating Disclosures Holcim Indonesia SMCB IJ 2,275 IDR 28-Apr-2011 Buy Not rated Indocement Tunggal Perkasa INTP IJ 17,100 IDR 28-Apr-2011 Neutral Not rated Jasa Marga JSMR IJ 3,300 IDR 28-Apr-2011 Buy Not rated Krakatau Steel KRAS IJ 1,170 IDR 28-Apr-2011 Neutral Not rated Semen Gresik SMGR IJ 9,450 IDR 28-Apr-2011 Buy Not rated Wijaya Karya WIKA IJ 680 IDR 28-Apr-2011 Neutral Not rated
Previous Rating Issuer name Previous Rating Date of change Holcim Indonesia Not rated 02-May-2011 Indocement Tunggal Perkasa Not rated 02-May-2011 Jasa Marga Not rated 02-May-2011 Krakatau Steel Not rated 02-May-2011 Semen Gresik Not rated 02-May-2011 Wijaya Karya Not rated 02-May-2011
Rating and target price changes
Ticker Old stock rating New stock rating Old target price New target price
Holcim Indonesia SMCB IJ Not rated Buy N/A 2,700
Indocement Tunggal Perkasa INTP IJ Not rated Neutral N/A 17,200
Jasa Marga JSMR IJ Not rated Buy N/A 4,100
Krakatau Steel KRAS IJ Not rated Neutral N/A 1,340
Semen Gresik SMGR IJ Not rated Buy N/A 11,700
Wijaya Karya WIKA IJ Not rated Neutral N/A 780
Holcim Indonesia (SMCB IJ) 2,275 (28-Apr-2011)
Chart Not Available
Valuation Methodology We have derived our target price of IDR2,700 for Holcim using a discounted cash flow (DCF) method to capture the company’s growth potential resulting from its capacity expansion plan. We have used a cost of equity of 16.7% (derived from risk free rate of 6.5%, market risk of 15%, and Beta of 1.2), cost of debt of 9%, and target leverage capital mix of 70% net debt to equity. We have used 8x EV/EBITDA multiples for our terminal value in 2020. Risks that may impede the achievement of the target price Downside risks include: 1) delays in commercial operation of new plant that will increase output; 2) lower-than-expected price increases, and 3) higher production costs. Upside risks: 1) higher increases in selling price; 2) accelerated infrastructure spending that will trigger more aggressive volume assumptions.
Indocement Tunggal Perkasa (INTP IJ) 17,100 (28-Apr-2011)
Chart Not Available
Valuation Methodology We have derived our target price of INR17,200 using DCF to capture the company’s growth potential resulting from its capacity expansion plan. We have used cost of equity of 15% (derived from risk free rate of 6.5%, market risk of 15%, and Beta of 1), cost of debt of 9%, and target leverage capital mix of 70% net debt to equity. We have used 8x EV/EBITDA multiples for our terminal value in 2020 which is approximately at the level where peers are trading at. Risks that may impede the achievement of the target price Downside risks include: (i) delay in commercial operation of new plant that will output increases; (ii) lower than expected price increases, and (iii) higher production costs. Upside risks: (i) higher increases in selling price; (ii) faster than expected capacity increases.
78

Nomura | AEJ Indonesia Infrastructure May 2, 2011
Jasa Marga (JSMR IJ) 3,300 (28-Apr-2011)
Chart Not Available
Valuation Methodology We have valued Jasa Marga using DCF, given the typical long-term nature of toll road / infrastructure businesses and additional toll road concessions that Jasa Marga currently holds coming on stream contributing cashflows. We have used a cost of equity of 15% (derived from a risk free rate of 6.5%, market risk of 15%, and Beta of 1), cost of debt of 9%, and target leverage capital mix of 70% net debt to equity. We have used 8x EV/EBITDA multiples for our terminal value in 2020. Our price target is IDR4,100. Risks that may impede the achievement of the target price Downside risks include: 1) a delay in the development of new toll roads, 2) lower-than-expected tariff adjustments; 3) higher-than-expected development costs; Upside risks include: 1) new toll road developments; 2) potentially higher traffic resulting from connectivity of newly built toll roads.
Krakatau Steel (KRAS IJ) 1,170 (28-Apr-2011)
Chart Not Available
Valuation Methodology In order to capture the impact of future capacity expansion and revamp projects, we value the company using the DCF methodology, assuming cost of equity of 18% (derived from a risk free rate of 6.5%, a market risk of 15%, and Beta of 1.35), cost of debt of 9%, and a target leverage capital mix of 70% net debt-to-equity. We use 7x EV/EBITDA for our terminal value in 2020, which reflects the multiples of similar steel companies in the region. We arrive at our target price of IDR1,340. Risks that may impede the achievement of the target price Downside risks include: 1) Inability to pass on higher production costs to higher selling prices, and 2) delays in the expansion and revamp programmes. Upside risks include: 1) higher-than-expected contribution from the POSCO projects, and 2) extraordinary gains from its land sales to the JV.
Semen Gresik (SMGR IJ) 9,450 (28-Apr-2011)
Chart Not Available
Valuation Methodology We derive our price target of IDR11,700 by using a Discounted Cash Flows method to capture the company’s growth potential resulting from its capacity expansion plan. We have used a cost of equity of 15% (derived from a risk free rate of 6.5%, a market risk of 15%, and Beta of 1), a cost of debt of 9%, and a target leverage capital mix of 70% net debt-to-equity. We use 8x EV/EBITDA for our terminal value in 2020F, near to where the stock is currently trading. Risks that may impede the achievement of the target price Downside risks include: 1) delays in commercial operations of its new plant; 2) lower-than-expected price increases; and 3) higher production costs. Upside risks: 1) selling prices come in higher than our expectations; and 2) more aggressive capacity expansion through reasonably-priced acquisitions.
Wijaya Karya (WIKA IJ) 680 (28-Apr-2011)
Chart Not Available
Valuation Methodology We have valued the company using a 10-year DCF to year 2020 using a cost of equity of 18.4% (derived from a risk free rate of 6.5%, market risk of 15%, and Beta of 1.4), cost of debt of 9%, and target leverage capital mix of 70% net debt to equity. We have used 6x EV/EBITDA multiples for our terminal value in 2020. Our price target is IDR780. Risks that may impede the achievement of the target price Downside risks include: 1) higher building material costs that would adversely impact margins, 2) higher competition that would impact market share and hence volume; 3) higher capex requirements by investment subsidiaries. Upside risks include: 1) stronger-than-estimated construction sector growth; 2) higher-than-expected investment income from investment subsidiaries.
79

Nomura | AEJ Indonesia Infrastructure May 2, 2011
Important Disclosures Conflict-of-interest disclosures Important disclosures may be accessed through the following website: http://www.nomura.com/research/pages/disclosures/disclosures.aspx . If you have difficulty with this site or you do not have a password, please contact your Nomura Securities International, Inc. salesperson (1-877-865-5752) or email [email protected] for assistance. Online availability of research and additional conflict-of-interest disclosures Nomura Japanese Equity Research is available electronically for clients in the US on NOMURA.COM, REUTERS, BLOOMBERG and THOMSON ONE ANALYTICS. For clients in Europe, Japan and elsewhere in Asia it is available on NOMURA.COM, REUTERS and BLOOMBERG. Important disclosures may be accessed through the left hand side of the Nomura Disclosure web page http://www.nomura.com/research or requested from Nomura Securities International, Inc., on 1-877-865-5752. If you have any difficulties with the website, please email [email protected] for technical assistance. The analysts responsible for preparing this report have received compensation based upon various factors including the firm's total revenues, a portion of which is generated by Investment Banking activities. Industry Specialists identified in some Nomura International plc research reports are employees within the Firm who are responsible for the sales and trading effort in the sector for which they have coverage. Industry Specialists do not contribute in any manner to the content of research reports in which their names appear. Marketing Analysts identified in some Nomura research reports are research analysts employed by Nomura International plc who are primarily responsible for marketing Nomura’s Equity Research product in the sector for which they have coverage. Marketing Analysts may also contribute to research reports in which their names appear and publish research on their sector. Distribution of ratings (US) The distribution of all ratings published by Nomura US Equity Research is as follows: 38% have been assigned a Buy rating which, for purposes of mandatory disclosures, are classified as a Buy rating; 4% of companies with this rating are investment banking clients of the Nomura Group*. 55% have been assigned a Neutral rating which, for purposes of mandatory disclosures, is classified as a Hold rating; 1% of companies with this rating are investment banking clients of the Nomura Group*. 7% have been assigned a Reduce rating which, for purposes of mandatory disclosures, are classified as a Sell rating; 0% of companies with this rating are investment banking clients of the Nomura Group*. As at 31 March 2011. *The Nomura Group as defined in the Disclaimer section at the end of this report. Distribution of ratings (Global) The distribution of all ratings published by Nomura Global Equity Research is as follows: 49% have been assigned a Buy rating which, for purposes of mandatory disclosures, are classified as a Buy rating; 37% of companies with this rating are investment banking clients of the Nomura Group*. 40% have been assigned a Neutral rating which, for purposes of mandatory disclosures, is classified as a Hold rating; 46% of companies with this rating are investment banking clients of the Nomura Group*. 11% have been assigned a Reduce rating which, for purposes of mandatory disclosures, are classified as a Sell rating; 16% of companies with this rating are investment banking clients of the Nomura Group*. As at 31 March 2011. *The Nomura Group as defined in the Disclaimer section at the end of this report.
80
Nomura | AEJ Indonesia Infrastructure May 2, 2011
Explanation of Nomura's equity research rating system in Europe, Middle East and Africa, US and Latin America for ratings published from 27 October 2008 The rating system is a relative system indicating expected performance against a specific benchmark identified for each individual stock. Analysts may also indicate absolute upside to target price defined as (fair value - current price)/current price, subject to limited management discretion. In most cases, the fair value will equal the analyst's assessment of the current intrinsic fair value of the stock using an appropriate valuation methodology such as discounted cash flow or multiple analysis, etc. STOCKS A rating of 'Buy', indicates that the analyst expects the stock to outperform the Benchmark over the next 12 months. A rating of 'Neutral', indicates that the analyst expects the stock to perform in line with the Benchmark over the next 12 months. A rating of 'Reduce', indicates that the analyst expects the stock to underperform the Benchmark over the next 12 months. A rating of 'Suspended', indicates that the rating and target price have been suspended temporarily to comply with applicable regulations and/or firm policies in certain circumstances including when Nomura is acting in an advisory capacity in a merger or strategic transaction involving the company. Benchmarks are as follows: United States/Europe: Please see valuation methodologies for explanations of relevant benchmarks for stocks (accessible through the left hand side of the Nomura Disclosure web page: http://www.nomura.com/research);Global Emerging Markets (ex-Asia): MSCI Emerging Markets ex-Asia, unless otherwise stated in the valuation methodology. SECTORS A 'Bullish' stance, indicates that the analyst expects the sector to outperform the Benchmark during the next 12 months. A 'Neutral' stance, indicates that the analyst expects the sector to perform in line with the Benchmark during the next 12 months. A 'Bearish' stance, indicates that the analyst expects the sector to underperform the Benchmark during the next 12 months. Benchmarks are as follows: United States: S&P 500; Europe: Dow Jones STOXX 600; Global Emerging Markets (ex-Asia): MSCI Emerging Markets ex-Asia. Explanation of Nomura's equity research rating system for Asian companies under coverage ex Japan published from 30 October 2008 and in Japan from 6 January 2009 STOCKS Stock recommendations are based on absolute valuation upside (downside), which is defined as (Target Price - Current Price) / Current Price, subject to limited management discretion. In most cases, the Target Price will equal the analyst's 12-month intrinsic valuation of the stock, based on an appropriate valuation methodology such as discounted cash flow, multiple analysis, etc. A 'Buy' recommendation indicates that potential upside is 15% or more. A 'Neutral' recommendation indicates that potential upside is less than 15% or downside is less than 5%. A 'Reduce' recommendation indicates that potential downside is 5% or more. A rating of 'Suspended' indicates that the rating and target price have been suspended temporarily to comply with applicable regulations and/or firm policies in certain circumstances including when Nomura is acting in an advisory capacity in a merger or strategic transaction involving the subject company. Securities and/or companies that are labelled as 'Not rated' or shown as 'No rating' are not in regular research coverage of the Nomura entity identified in the top banner. Investors should not expect continuing or additional information from Nomura relating to such securities and/or companies.
SECTORS A 'Bullish' rating means most stocks in the sector have (or the weighted average recommendation of the stocks under coverage is) a positive absolute recommendation. A 'Neutral' rating means most stocks in the sector have (or the weighted average recommendation of the stocks under coverage is) a neutral absolute recommendation. A 'Bearish' rating means most stocks in the sector have (or the weighted average recommendation of the stocks under coverage is) a negative absolute recommendation.
81
Nomura | AEJ Indonesia Infrastructure May 2, 2011
Explanation of Nomura's equity research rating system in Japan published prior to 6 January 2009 (and ratings in Europe, Middle East and Africa, US and Latin America published prior to 27 October 2008) STOCKS A rating of '1' or 'Strong buy', indicates that the analyst expects the stock to outperform the Benchmark by 15% or more over the next six months. A rating of '2' or 'Buy', indicates that the analyst expects the stock to outperform the Benchmark by 5% or more but less than 15% over the next six months. A rating of '3' or 'Neutral', indicates that the analyst expects the stock to either outperform or underperform the Benchmark by less than 5% over the next six months. A rating of '4' or 'Reduce', indicates that the analyst expects the stock to underperform the Benchmark by 5% or more but less than 15% over the next six months. A rating of '5' or 'Sell', indicates that the analyst expects the stock to underperform the Benchmark by 15% or more over the next six months. Stocks labeled 'Not rated' or shown as 'No rating' are not in Nomura's regular research coverage. Nomura might not publish additional research reports concerning this company, and it undertakes no obligation to update the analysis, estimates, projections, conclusions or other information contained herein.
SECTORS A 'Bullish' stance, indicates that the analyst expects the sector to outperform the Benchmark during the next six months. A 'Neutral' stance, indicates that the analyst expects the sector to perform in line with the Benchmark during the next six months. A 'Bearish' stance, indicates that the analyst expects the sector to underperform the Benchmark during the next six months. Benchmarks are as follows: Japan: TOPIX; United States: S&P 500, MSCI World Technology Hardware & Equipment; Europe, by sector - Hardware/Semiconductors: FTSE W Europe IT Hardware; Telecoms: FTSE W Europe Business Services; Business Services: FTSE W Europe; Auto & Components: FTSE W Europe Auto & Parts; Communications equipment: FTSE W Europe IT Hardware; Ecology Focus: Bloomberg World Energy Alternate Sources; Global Emerging Markets: MSCI Emerging Markets ex-Asia.
Explanation of Nomura's equity research rating system for Asian companies under coverage ex Japan published prior to 30 October 2008 STOCKS Stock recommendations are based on absolute valuation upside (downside), which is defined as (Fair Value - Current Price)/Current Price, subject to limited management discretion. In most cases, the Fair Value will equal the analyst's assessment of the current intrinsic fair value of the stock using an appropriate valuation methodology such as Discounted Cash Flow or Multiple analysis etc. However, if the analyst doesn't think the market will revalue the stock over the specified time horizon due to a lack of events or catalysts, then the fair value may differ from the intrinsic fair value. In most cases, therefore, our recommendation is an assessment of the difference between current market price and our estimate of current intrinsic fair value. Recommendations are set with a 6-12 month horizon unless specified otherwise. Accordingly, within this horizon, price volatility may cause the actual upside or downside based on the prevailing market price to differ from the upside or downside implied by the recommendation. A 'Strong buy' recommendation indicates that upside is more than 20%. A 'Buy' recommendation indicates that upside is between 10% and 20%. A 'Neutral' recommendation indicates that upside or downside is less than 10%. A 'Reduce' recommendation indicates that downside is between 10% and 20%. A 'Sell' recommendation indicates that downside is more than 20%.
SECTORS A 'Bullish' rating means most stocks in the sector have (or the weighted average recommendation of the stocks under coverage is) a positive absolute recommendation. A 'Neutral' rating means most stocks in the sector have (or the weighted average recommendation of the stocks under coverage is) a neutral absolute recommendation. A 'Bearish' rating means most stocks in the sector have (or the weighted average recommendation of the stocks under coverage is) a negative absolute recommendation.
82

Nomura | AEJ Indonesia Infrastructure May 2, 2011
Target Price A Target Price, if discussed, reflect in part the analyst's estimates for the company's earnings. The achievement of any target price may be impeded by general market and macroeconomic trends, and by other risks related to the company or the market, and may not occur if the company's earnings differ from estimates.
Disclaimers This publication contains material that has been prepared by the Nomura entity identified at the top or bottom of page 1 herein, if any, and/or, with the sole or joint contributions of one or more Nomura entities whose employees and their respective affiliations are specified on page 1 herein or elsewhere identified in the publication. Affiliates and subsidiaries of Nomura Holdings, Inc. (collectively, the 'Nomura Group'), include: Nomura Securities Co., Ltd. ('NSC') Tokyo, Japan; Nomura International plc ('NIplc'), United Kingdom; Nomura Securities International, Inc. ('NSI'), New York, NY; Nomura International (Hong Kong) Ltd. (‘NIHK’), Hong Kong; Nomura Financial Investment (Korea) Co., Ltd. (‘NFIK’), Korea (Information on Nomura analysts registered with the Korea Financial Investment Association ('KOFIA') can be found on the KOFIA Intranet at http://dis.kofia.or.kr ); Nomura Singapore Ltd. (‘NSL’), Singapore (Registration number 197201440E, regulated by the Monetary Authority of Singapore); Capital Nomura Securities Public Company Limited (‘CNS’), Thailand; Nomura Australia Ltd. (‘NAL’), Australia (ABN 48 003 032 513), regulated by the Australian Securities and Investment Commission ('ASIC') and holder of an Australian financial services licence number 246412; P.T. Nomura Indonesia (‘PTNI’), Indonesia; Nomura Securities Malaysia Sdn. Bhd. (‘NSM’), Malaysia; Nomura International (Hong Kong) Ltd., Taipei Branch (‘NITB’), Taiwan; Nomura Financial Advisory and Securities (India) Private Limited (‘NFASL’), Mumbai, India (Registered Address: Ceejay House, Level 11, Plot F, Shivsagar Estate, Dr. Annie Besant Road, Worli, Mumbai- 400 018, India; SEBI Registration No: BSE INB011299030, NSE INB231299034, INF231299034, INE 231299034). THIS MATERIAL IS: (I) FOR YOUR PRIVATE INFORMATION, AND WE ARE NOT SOLICITING ANY ACTION BASED UPON IT; (II) NOT TO BE CONSTRUED AS AN OFFER TO SELL OR A SOLICITATION OF AN OFFER TO BUY ANY SECURITY IN ANY JURISDICTION WHERE SUCH OFFER OR SOLICITATION WOULD BE ILLEGAL; AND (III) BASED UPON INFORMATION THAT WE CONSIDER RELIABLE. NOMURA GROUP DOES NOT WARRANT OR REPRESENT THAT THE PUBLICATION IS ACCURATE, COMPLETE, RELIABLE, FIT FOR ANY PARTICULAR PURPOSE OR MERCHANTABLE AND DOES NOT ACCEPT LIABILITY FOR ANY ACT (OR DECISION NOT TO ACT) RESULTING FROM USE OF THIS PUBLICATION AND RELATED DATA. TO THE MAXIMUM EXTENT PERMISSIBLE ALL WARRANTIES AND OTHER ASSURANCES BY NOMURA GROUP ARE HEREBY EXCLUDED AND NOMURA GROUP SHALL HAVE NO LIABILITY FOR THE USE, MISUSE, OR DISTRIBUTION OF THIS INFORMATION. Opinions expressed are current opinions as of the original publication date appearing on this material only and the information, including the opinions contained herein, are subject to change without notice. Nomura is under no duty to update this publication. If and as applicable, NSI's investment banking relationships, investment banking and non-investment banking compensation and securities ownership (identified in this report as 'Disclosures Required in the United States'), if any, are specified in disclaimers and related disclosures in this report. In addition, other members of the Nomura Group may from time to time perform investment banking or other services (including acting as advisor, manager or lender) for, or solicit investment banking or other business from, companies mentioned herein. Furthermore, the Nomura Group, and/or its officers, directors and employees, including persons, without limitation, involved in the preparation or issuance of this material may, to the extent permitted by applicable law and/or regulation, have long or short positions in, and buy or sell, the securities (including ownership by NSI, referenced above), or derivatives (including options) thereof, of companies mentioned herein, or related securities or derivatives. For financial instruments admitted to trading on an EU regulated market, Nomura Holdings Inc's affiliate or its subsidiary companies may act as market maker or liquidity provider (in accordance with the interpretation of these definitions under FSA rules in the UK) in the financial instruments of the issuer. Where the activity of liquidity provider is carried out in accordance with the definition given to it by specific laws and regulations of other EU jurisdictions, this will be separately disclosed within this report. Furthermore, the Nomura Group may buy and sell certain of the securities of companies mentioned herein, as agent for its clients. Investors should consider this report as only a single factor in making their investment decision and, as such, the report should not be viewed as identifying or suggesting all risks, direct or indirect, that may be associated with any investment decision. Please see the further disclaimers in the disclosure information on companies covered by Nomura analysts available at www.nomura.com/research under the 'Disclosure' tab. Nomura Group produces a number of different types of research product including, among others, fundamental analysis, quantitative analysis and short term trading ideas; recommendations contained in one type of research product may differ from recommendations contained in other types of research product, whether as a result of differing time horizons, methodologies or otherwise; it is possible that individual employees of Nomura may have different perspectives to this publication. NSC and other non-US members of the Nomura Group (i.e. excluding NSI), their officers, directors and employees may, to the extent it relates to non-US issuers and is permitted by applicable law, have acted upon or used this material prior to, or immediately following, its publication. Foreign-currency-denominated securities are subject to fluctuations in exchange rates that could have an adverse effect on the value or price of, or income derived from, the investment. In addition, investors in securities such as ADRs, the values of which are influenced by foreign currencies, effectively assume currency risk. The securities described herein may not have been registered under the US Securities Act of 1933, and, in such case, may not be offered or sold in the United States or to US persons unless they have been registered under such Act, or except in compliance with an exemption from the registration requirements of such Act. Unless governing law permits otherwise, you must contact a Nomura entity in your home jurisdiction if you want to use our services in effecting a transaction in the securities mentioned in this material. This publication has been approved for distribution in the United Kingdom and European Union as investment research by NIplc, which is authorized and regulated by the UK Financial Services Authority ('FSA') and is a member of the London Stock Exchange. It does not constitute a personal recommendation, as defined by the FSA, or take into account the particular investment objectives, financial situations, or needs of individual investors. It is intended only for investors who are 'eligible counterparties' or 'professional clients' as defined by the FSA, and may not, therefore, be redistributed to retail clients as defined by the FSA. This publication may be distributed in Germany via Nomura Bank (Deutschland) GmbH, which is authorized and regulated in Germany by the Federal Financial Supervisory Authority ('BaFin'). This publication has been approved by NIHK, which is regulated by the Hong Kong Securities and Futures Commission, for distribution in Hong Kong by NIHK. This publication has been approved for distribution in Australia by NAL, which is authorized and regulated in Australia by the ASIC. This publication has also been approved for distribution in Malaysia by NSM. In Singapore, this publication has been distributed by NSL. NSL accepts legal responsibility for the content of this publication, where it concerns securities, futures and foreign exchange, issued by their foreign affiliates in respect of recipients who are not accredited, expert or institutional investors as defined by the Securities and Futures Act (Chapter 289). Recipients of this publication should contact NSL in respect of matters arising from, or in connection with, this publication. Unless prohibited by the provisions of Regulation S of the U.S. Securities Act of 1933, this material is distributed in the United States, by NSI, a US-registered broker-dealer, which accepts responsibility for its contents in accordance with the provisions of Rule 15a-6, under the US Securities Exchange Act of 1934. This publication has not been approved for distribution in the Kingdom of Saudi Arabia or to clients other than 'professional clients' in the United Arab Emirates by Nomura Saudi Arabia, NIplc or any other member of the Nomura Group, as the case may be. Neither this publication nor any copy thereof may be taken or transmitted or distributed, directly or indirectly, by any person other than those authorised to do so into the Kingdom of Saudi Arabia or in the United Arab Emirates or to any person located in the Kingdom of Saudi Arabia or to clients other than 'professional clients' in the United Arab Emirates. By accepting to receive this publication, you represent that you are not located in the Kingdom of Saudi Arabia or that you are a 'professional client' in the United Arab Emirates and agree to comply with these restrictions. Any failure to comply with these restrictions may constitute a violation of the laws of the Kingdom of Saudi Arabia or the United Arab Emirates. No part of this material may be (i) copied, photocopied, or duplicated in any form, by any means; or (ii) redistributed without the prior written consent of the Nomura Group member identified in the banner on page 1 of this report. Further information on any of the securities mentioned herein may be obtained upon request. If this publication has been distributed by electronic transmission, such as e-mail, then such transmission cannot be guaranteed to be secure or error-free as information could be intercepted, corrupted, lost, destroyed, arrive late or incomplete, or contain viruses. The sender therefore does not accept liability for any errors or omissions in the contents of this publication, which may arise as a result of electronic transmission. If verification is required, please request a hard-copy version.
83

Nomura | AEJ Indonesia Infrastructure May 2, 2011
Additional information available upon request NIPlc and other Nomura Group entities manage conflicts identified through the following: their Chinese Wall, confidentiality and independence policies, maintenance of a Restricted List and a Watch List, personal account dealing rules, policies and procedures for managing conflicts of interest arising from the allocation and pricing of securities and impartial investment research and disclosure to clients via client documentation. Disclosure information is available at the Nomura Disclosure web page: http://www.nomura.com/research/pages/disclosures/disclosures.aspx
84
Nomura Asian Equity Research Group
Hong Kong Nomura International (Hong Kong) Limited 30/F Two International Finance Centre, 8 Finance Street, Central, Hong Kong Tel: +852 2536 1111 Fax: +852 2536 1820
Singapore
Nomura Singapore Limited 5 Temasek Boulevard #11-01, Suntec Tower Five, Singapore 038985, Singapore Tel: +65 6433 6288 Fax: +65 6433 6169
Taipei Nomura International (Hong Kong) Limited, Taipei Branch 17th Floor, Walsin Lihwa Xinyi Building, No.1, Songzhi Road, Taipei 11047, Taiwan, R.O.C. Tel: +886 2 2176 9999 Fax: +886 2 2176 9900
Seoul Nomura Financial Investment (Korea) Co., Ltd. 17th floor, Seoul Finance Center, 84 Taepyeongno 1-ga, Jung-gu, Seoul 100-768, Korea Tel: +82 2 3783 2000 Fax: +82 2 3783 2500
Kuala Lumpur Nomura Securities Malaysia Sdn. Bhd. Suite No 16.5, Level 16, Menara IMC, 8 Jalan Sultan Ismail, 50250 Kuala Lumpur, Malaysia Tel: +60 3 2027 6811 Fax: +60 3 2027 6888
India Nomura Financial Advisory and Securities (India) Private Limited Ceejay House, Level 11, Plot F, Shivsagar Estate, Dr. Annie Besant Road, Worli, Mumbai- 400 018, India Tel: +91 22 4037 4037 Fax: +91 22 4037 4111
Indonesia PT Nomura Indonesia Suite 209A, 9th Floor, Sentral Senayan II Building Jl. Asia Afrika No. 8, Gelora Bung Karno, Jakarta 10270, Indonesia Tel: +62 21 2991 3300 Fax: +62 21 2991 3333
Sydney Nomura Australia Ltd. Level 25, Governor Phillip Tower, 1 Farrer Place, Sydney NSW 2000 Tel: +61 2 8062 8000 Fax: +61 2 8062 8362
Tokyo Equity Research Department Financial & Economic Research Center Nomura Securities Co., Ltd. 17/F Urbannet Building, 2-2, Otemachi 2-chome Chiyoda-ku, Tokyo 100-8130, Japan Tel: +81 3 5255 1658 Fax: +81 3 5255 1747, 3272 0869
Caring for the environment: to receive only the electronic versions of our research, please contact your sales representative.
Related Documents