CONFERENCE OF EUROPEAN STATISTICIANS Expert Meeting on the Dissemination and Communication of Statistics 11-14 October 2021, Online Session 2 12 October2021 Building Big Data Communication Strategies to Non-Expert Audiences Maulana Faris (Statistics Indonesia) [email protected] Abstract Big Data is one of the solutions in gathering information about the socio-economic changes of society in the era of the COVID-19 pandemic without having to go to the field. However, the term Big Data is still not yet familiar to most of public in Indonesia. To gain people's trust in Big Data, we have to start by introducing Big Data to the society. However, introducing the term new data to the general public is not easy, especially during the pandemic. The National Statistical Office (NSO) which is responsible for building Big Data literacy in the community must have a special approach in communicating about Big Data to the community. The Big Data Team of Statistics Indonesia creates a variety of big data literacy contents that is light and easy for public to understand, such as creating podcasts, animations, videos, infographics, to comics. Every literacy content created uses interesting story telling using simple language that is commonly used in daily communication. Furthermore, the team utilizes social media as an effective communication tool to the public. This article proposes effective communication strategies by targeting non expert audiences.

Welcome message from author
This document is posted to help you gain knowledge. Please leave a comment to let me know what you think about it! Share it to your friends and learn new things together.
Transcript
CONFERENCE OF EUROPEAN STATISTICIANS Expert Meeting on the Dissemination and Communication of Statistics 11-14 October 2021, Online
Session 2 12 October2021
Building Big Data Communication Strategies to Non-Expert Audiences Maulana Faris (Statistics Indonesia) [email protected]
Abstract
Big Data is one of the solutions in gathering information about the socio-economic changes of society in the era of the COVID-19 pandemic without having to go to the field. However, the term Big Data is still not yet familiar to most of public in Indonesia. To gain people's trust in Big Data, we have to start by introducing Big Data to the society. However, introducing the term new data to the general public is not easy, especially during the pandemic. The National Statistical Office (NSO) which is responsible for building Big Data literacy in the community must have a special approach in communicating about Big Data to the community. The Big Data Team of Statistics Indonesia creates a variety of big data literacy contents that is light and easy for public to understand, such as creating podcasts, animations, videos, infographics, to comics. Every literacy content created uses interesting story telling using simple language that is commonly used in daily communication. Furthermore, the team utilizes social media as an effective communication tool to the public. This article proposes effective communication strategies by targeting non expert audiences.
CONFERENCE OF EUROPEAN STATISTICIANS
Expert Meeting on the Dissemination and Comunication of Statistics
13-15 October 2021, Online
Building Big Data Communication Strategies
to Non-Expert Audiences
Maulana Faris, Setia Pramana Statistics Indonesia; Politeknik Statistika STIS, Jakarta
[email protected]; [email protected]
Abstract: Big Data is one of the solutions in gathering information about the socio-economic changes of society in the era of the COVID-19 pandemic without having to go to the field. However, the term Big Data is still not yet familiar to most of public in Indonesia. To gain people's trust in Big Data, we have to start by introducing Big Data to the society. However, introducing the term new data to the general public is not easy, especially during the pandemic. The National Statistical Office (NSO) which is responsible for building Big Data literacy in the community must have a special approach in communicating about Big Data to the community. The Big Data Team of Statistics Indonesia creates a variety of big data literacy contents that is light and easy for public to understand, such as creating podcasts, animations, videos, infographics, to comics. Every literacy content created uses interesting story telling using simple language that is commonly used in daily communication. Furthermore, the team utilizes social media as an effective communication tool to the public. This article proposes effective communication strategies by targeting non expert audiences.
Keywords: Big Data, Literacy, Dissemination, Communication
topics: S2 broadening audiences
Introduction
It has been more than a year since the COVID-19 pandemic has plagued the world. Covid-19 brought many changes to the statistical business process. Statistical officers find it difficult to meet face-to-face with residents to collect data. Because of this, the process of collecting various data was disrupted. BPS as the national statistical office (NSO) in Indonesia is required to
innovate in the midst of limitations in producing social and economic data that will be used as the basis for policy making. One of the innovations made by BPS is the use of big data in monitoring socio-economic developments during the COVID-19 pandemic.
Doug Laney (presently with Gartner) described big data through three Vs, namely, volume, velocity, and variety. The term of volume describes to the size of data, velocity describes to the speed of incoming and outgoing data, and variety refers to the sources and types of data. Commonly, big data is a collection of large amounts of complex data that cannot be managed efficiently by the state-of-the-art data processing technologies (Philip Chen & Zhang, 2014). Various kinds of digital traces on the internet become big data that can be used to obtain information when making policies without having to go to the field. Advances in mobile devices, digital sensors, communications, computing, and storage have provided means to collect data (Bryant, Katz, & Lazowska, 2008).
In the era of big data, data can be accessed by anyone and for any purpose. The big data approach emphasizes the use of a combination of deductive and inductive approaches. the combination of the two approaches will produce a good understanding of a phenomenon. (Salahudin, 2019). The use of a deductive approach in the context of big data aims to find hypotheses and knowledge from data "born of data rather than born of theory" (Hey, Tansley, & Tolle, 2009). The inductive approach is used to explain previously outstanding theories or findings. The elaboration of this research approach illustrates the epistemology of big data.
The application and development of the use of Big Data has been carried out by the United Nations (UN). UN created The Global Working Group (GWG) on Big Data for Official Statistics in 2014. The UN GWG provides strategic vision, direction, and coordination of a global programme on Big Data for official statistics, including for indicators of the 2030 agenda for sustainable development. The UN GWG established task teams on the following topics; "Advocacy and Communication", "Linking Big Data and the Sustainable Development Goals", "Access and Partnerships", "Training, Skills and Capacity building", "Cross-cutting issues", "Mobile phone data", "Satellite imagery" and "Social media data".
Some of national statistical offices (NSO) in the world using Big Data to support official statistic. Until recently, the Australian Bureau of Statistics’ (ABS) progress in Big Data domain has been primarily review and monitoring of industry developments while contributing to external strategic and concept development activities (Siu-Ming Tam & Frederic Clarke, 2014). Office for National Statistics (ONS) in UK publishes a lot of Big Data works like using data science for the address matching service, aerial imagery, mobile phone data, analysing low electricity consumption using DECC data, using geolocated twitter traces to infer residence and mobility, and many more.
In Asia and the Pacific, BPS Indonesia has started using signalling data from mobile phones in the production of its cross-border inward tourism statistics for those cross-border areas where there is no immigration office collecting data on cross-border tourists (Pramana et al, 2017). This work was then expanded into all cross-border inward tourism to validate official statistics produced using traditional data collection methods. Various studies in the use of big data including google
mobile index data (Yoga, 2020), aviation statistics (Satria, 2020), air quality index (Yoga, 2020), marketplace (Dhiar et al, 2020), have been initiated.
Developments in data technology are not matched by public understanding of the data itself. Key trends have impacted the information market lately, spurred by technology developments, data commoditization and data services availability, and changes in information consumption modalities. But at the same time, the emergence of the ‘post truth’ world was certified by the inclusion of this term in Oxford Dictionary (Emanuele & Felica, 2017). ‘Post-truth’ is relating to or denoting circumstances in which objective facts are less influential in shaping public opinion than appeals to emotion and personal belief. According to Jousairi (2018), Indonesia and several other developing countries are still data-blind (data illiterate) and drown in authoritarian-verbal culture despite marginalized the measurable pattern of communication.
Therefore, behind updating the methodology and data that we produce, a communication strategy is needed to reach the wider community and build people's understanding of the importance of big data. Communicating statistics is a fundamental and legitimate responsibility as part of the transparency and accountability objectives of institutions engaged in official statistics and to crowd out low quality statistics and cyclical sentiment based policy strategies (Nymand & Andersen, 2017). Communicating statistics is a mandatory obligation for NSO regarding tranparency issue or data statistics access openess. Furthermore, a standard legal education does not include rigorous training in statistics or the evaluation of scientific evidence (Enos, Fowler and Havasy, 2017). Then the communication should be conducted seriously, with clear and helpful explaining principles, as the users and stakeholders of statistics are wide and diverse.
Martin C and MacDonald (2020) said that today many science communicators are using social media to share scientific information with citizens, but, as research shown, fostering conversational exchanges remains a challenge. Plowman and Wilson (2018) said that practice of public relations increasingly includes the use of social media, it is only natural that strategic communication process in form their use. Research on the social media phenomenon has demonstrated that platforms and participation have been growing rapidly. Not surprisingly, many of these social media channels are those most commonly adopted by organizations for public relations purposes (Wright & Hinson, 2015). Other studies on communication using social media have also been conducted, such as in the health sector, Fontaine (2019) said that communicating findings of health research to the public is crucial to support self-care and to inform governmental decision making. Health scientist play a growing role in science communication with the growth of digital and social media.
As a result of the massive migration of Internet-users to social channels, Nash and Steckler (2013) noted that strategic communication has been evolving to focus on more internet-based communication. This study proposes a communication strategy of big data awareness, capacity building and analysis dissemination by utilizing different internet-based communication channels, such as YouTube, and other social media.
Methodology
The lack of a proactive communication strategy may well have contributed to the steady and continuous reputational loss and trust in statistics, in its profession and in those statistical agent engaged in developing methodology and producing reliable and comparable national and international statistics, as a public good for sound and sustainable decision making. Statistician need to use their conceptual business knowledge and information gathering skills to build an user-centric communication strategy, seeking to understand user’s needs, the barriers they face and their working process (Nymand & Andersen, 2017). Communicating statistics is a mandatory obligation for NSO regarding tranparency issue or data statistics access openess. Furthermore, a standard legal education does not include rigorous training in statistics or the evaluation of scientific evidence (Enos, Fowler and Havasy, 2017). Then the communication should be conducted seriously, with clear and helpful explaining principles, as the users and stakeholders of statistics are wide and diverse.
1. Forms of Communication
The way in which statistics are presented is vital in facilitating the users’ understanding of the statistics, and in enhancing their usability: they must be presented according to the needs of the various user segments. There are sample tools available on the market to assist statisticians in this regard, such as web-based movies, interactive tables, new graphical tools (info-graphics statistics) and tools enabling the users to “slice and dice” statistics, touch-screen gadgets, and mobile technology.
1.1. Big Data Dashboard
The BPS big data team creates several big data dashboards that update in real time. The dashboard can be accessed by all BPS employees throughout Indonesia. The big data dashboard display is made simple so that it is easy to understand even by BPS employees who are not deep in big data. Big data available include Big data mobility, IDX, environment, price, marketplace, job vacancies, and many more. This dashboard helps official statistics to see socio-economic phenomena that occur from the perspective of big data..
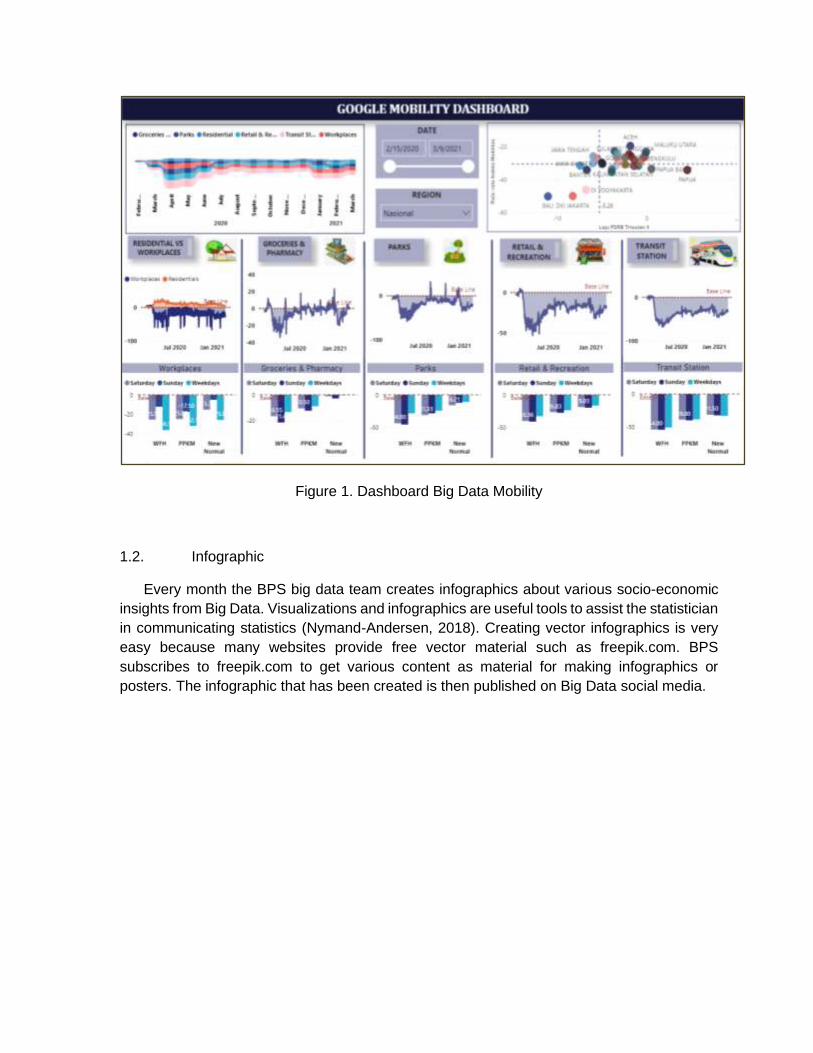
Figure 1. Dashboard Big Data Mobility
1.2. Infographic
Every month the BPS big data team creates infographics about various socio-economic insights from Big Data. Visualizations and infographics are useful tools to assist the statistician in communicating statistics (Nymand-Andersen, 2018). Creating vector infographics is very easy because many websites provide free vector material such as freepik.com. BPS subscribes to freepik.com to get various content as material for making infographics or posters. The infographic that has been created is then published on Big Data social media.
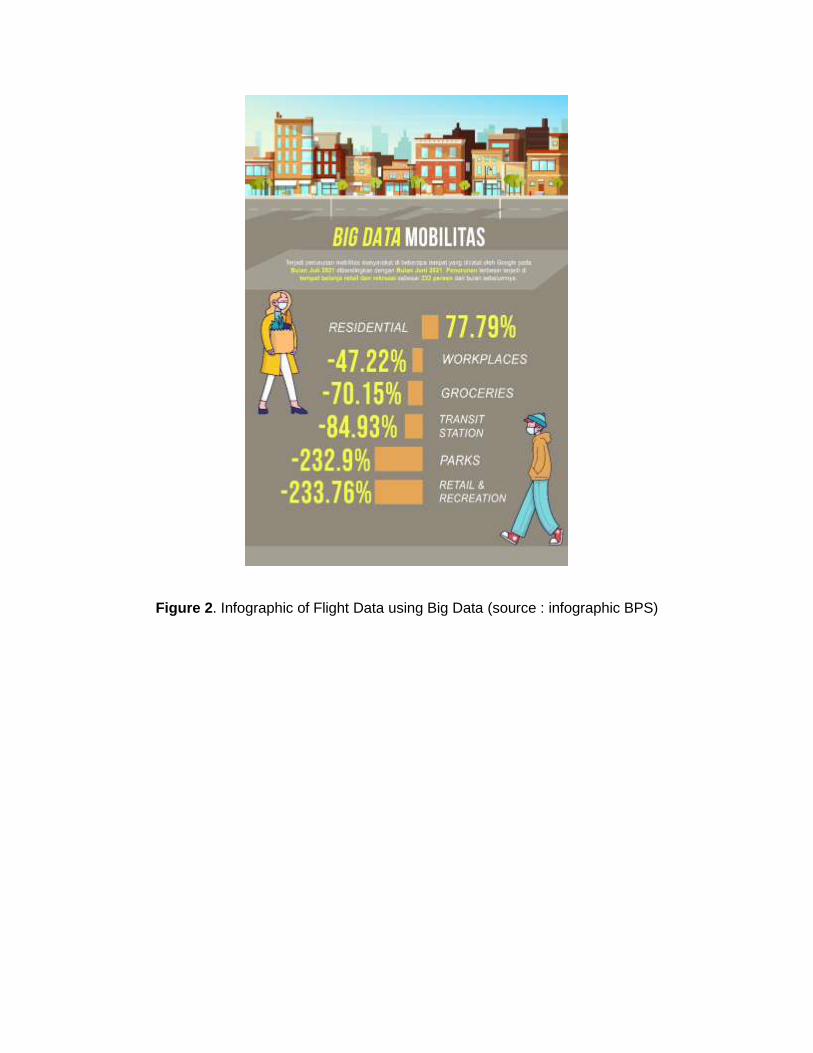
Figure 2. Infographic of Flight Data using Big Data (source : infographic BPS)
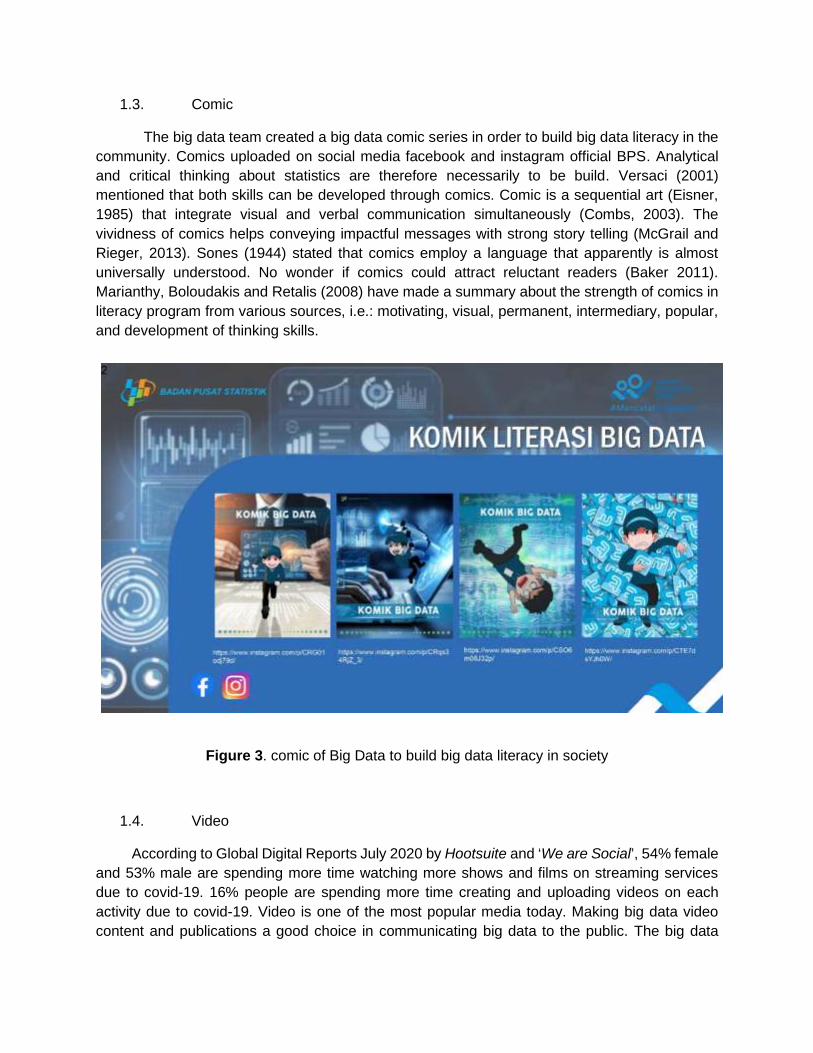
1.3. Comic
The big data team created a big data comic series in order to build big data literacy in the community. Comics uploaded on social media facebook and instagram official BPS. Analytical and critical thinking about statistics are therefore necessarily to be build. Versaci (2001) mentioned that both skills can be developed through comics. Comic is a sequential art (Eisner, 1985) that integrate visual and verbal communication simultaneously (Combs, 2003). The vividness of comics helps conveying impactful messages with strong story telling (McGrail and Rieger, 2013). Sones (1944) stated that comics employ a language that apparently is almost universally understood. No wonder if comics could attract reluctant readers (Baker 2011). Marianthy, Boloudakis and Retalis (2008) have made a summary about the strength of comics in literacy program from various sources, i.e.: motivating, visual, permanent, intermediary, popular, and development of thinking skills.
Figure 3. comic of Big Data to build big data literacy in society
1.4. Video
According to Global Digital Reports July 2020 by Hootsuite and ‘We are Social’, 54% female and 53% male are spending more time watching more shows and films on streaming services due to covid-19. 16% people are spending more time creating and uploading videos on each activity due to covid-19. Video is one of the most popular media today. Making big data video content and publications a good choice in communicating big data to the public. The big data
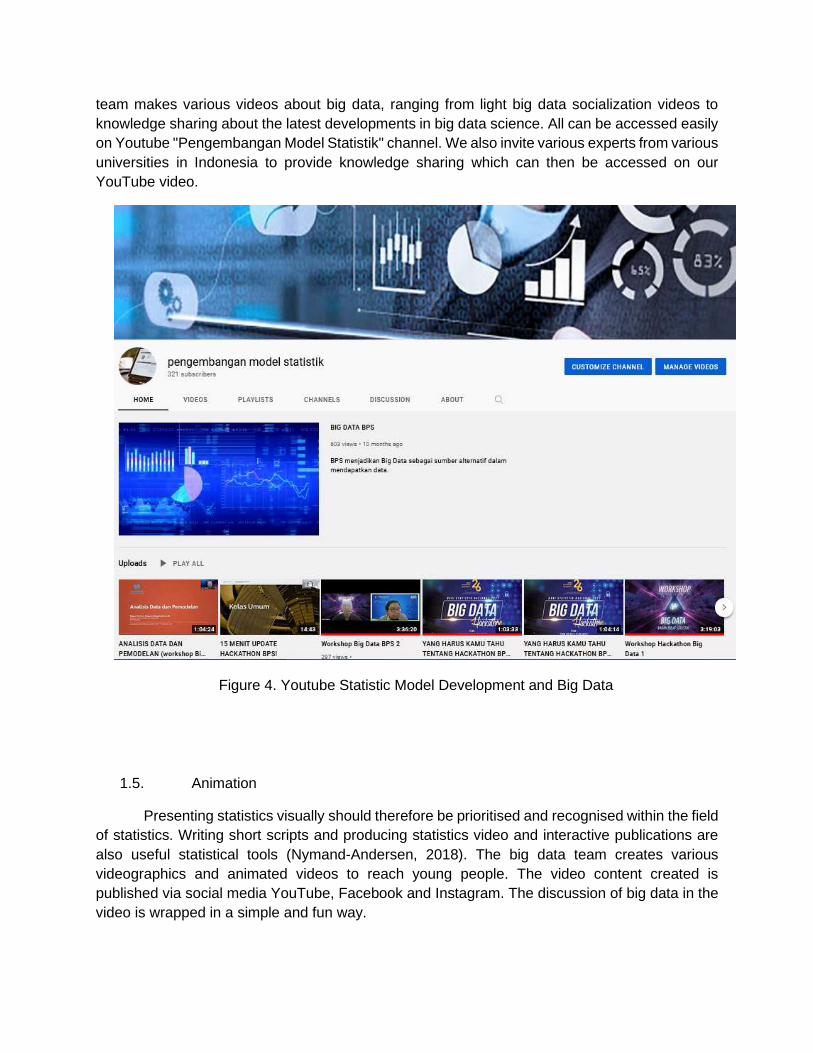
team makes various videos about big data, ranging from light big data socialization videos to knowledge sharing about the latest developments in big data science. All can be accessed easily on Youtube "Pengembangan Model Statistik" channel. We also invite various experts from various universities in Indonesia to provide knowledge sharing which can then be accessed on our YouTube video.
Figure 4. Youtube Statistic Model Development and Big Data
1.5. Animation
Presenting statistics visually should therefore be prioritised and recognised within the field of statistics. Writing short scripts and producing statistics video and interactive publications are also useful statistical tools (Nymand-Andersen, 2018). The big data team creates various videographics and animated videos to reach young people. The video content created is published via social media YouTube, Facebook and Instagram. The discussion of big data in the video is wrapped in a simple and fun way.
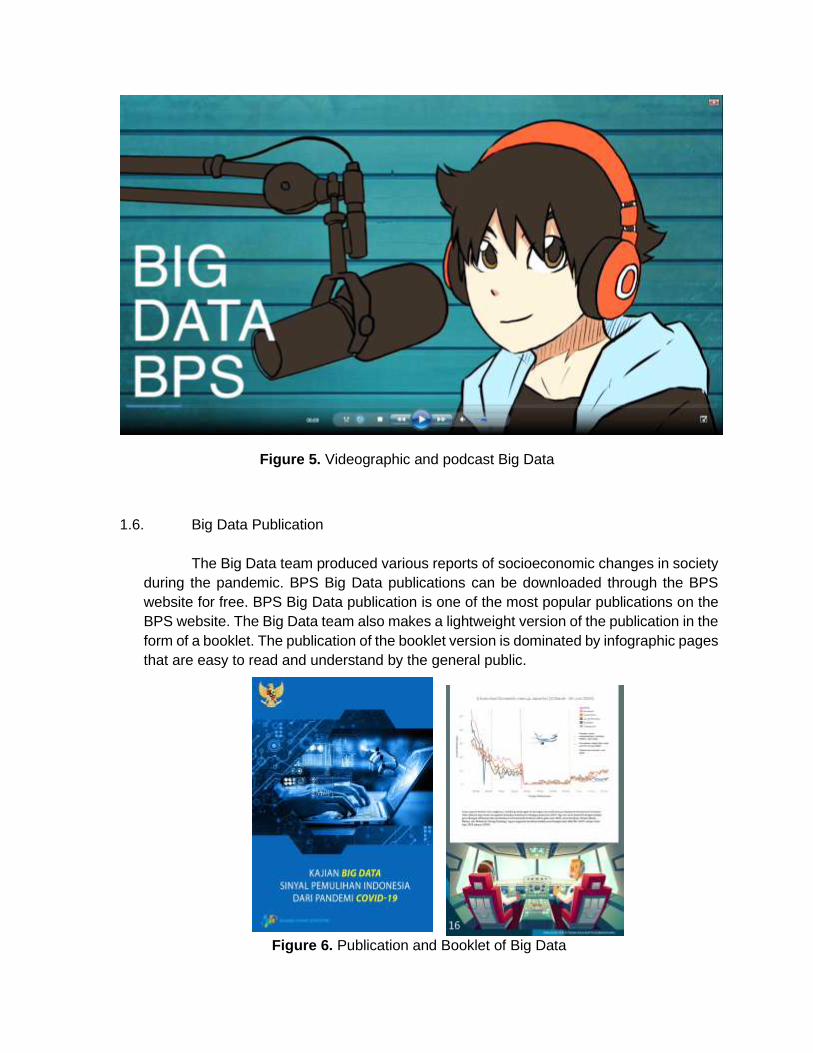
Figure 5. Videographic and podcast Big Data
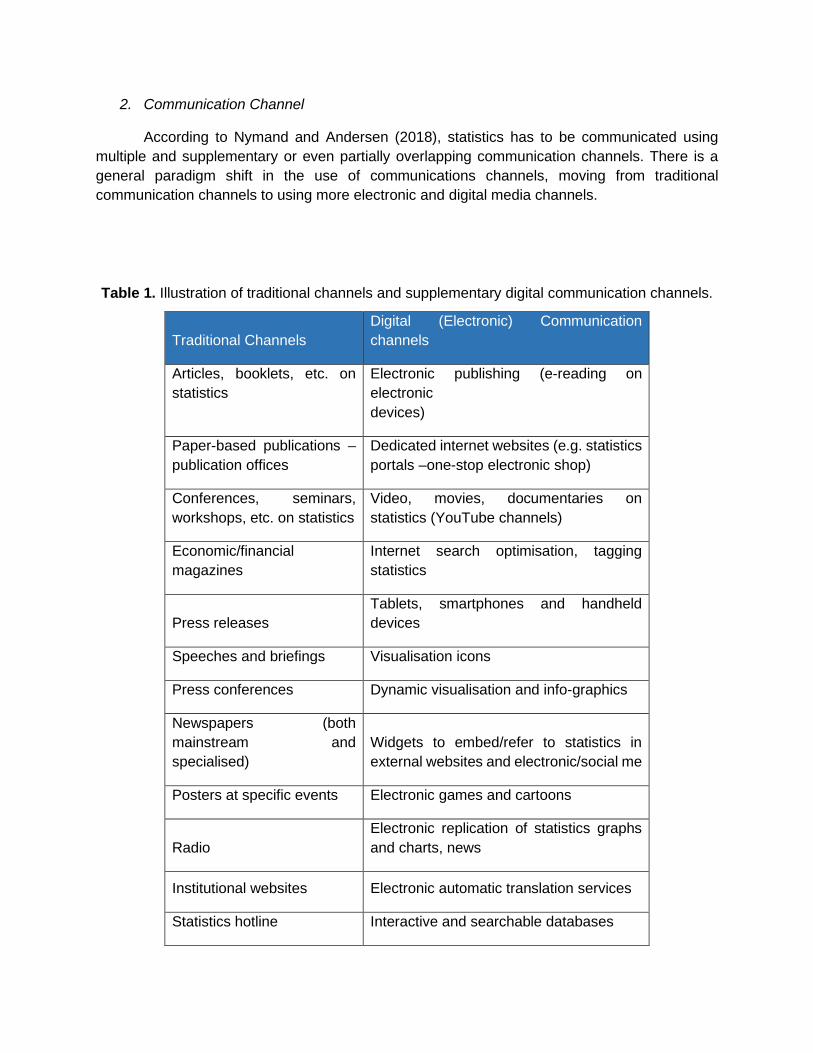
1.6. Big Data Publication The Big Data team produced various reports of socioeconomic changes in society
during the pandemic. BPS Big Data publications can be downloaded through the BPS website for free. BPS Big Data publication is one of the most popular publications on the BPS website. The Big Data team also makes a lightweight version of the publication in the form of a booklet. The publication of the booklet version is dominated by infographic pages that are easy to read and understand by the general public.
Figure 6. Publication and Booklet of Big Data
2. Communication Channel
According to Nymand and Andersen (2018), statistics has to be communicated using multiple and supplementary or even partially overlapping communication channels. There is a general paradigm shift in the use of communications channels, moving from traditional communication channels to using more electronic and digital media channels.
Table 1. Illustration of traditional channels and supplementary digital communication channels.
Traditional Channels Digital (Electronic) Communication channels
Articles, booklets, etc. on statistics
Electronic publishing (e-reading on electronic devices)
Paper-based publications –publication offices
Dedicated internet websites (e.g. statistics portals –one-stop electronic shop)
Conferences, seminars, workshops, etc. on statistics
Video, movies, documentaries on statistics (YouTube channels)
Economic/financial magazines
Internet search optimisation, tagging statistics
Press releases Tablets, smartphones and handheld devices
Speeches and briefings Visualisation icons
Press conferences Dynamic visualisation and info-graphics
Newspapers (both mainstream and specialised)
Widgets to embed/refer to statistics in external websites and electronic/social me
Posters at specific events Electronic games and cartoons
Radio Electronic replication of statistics graphs and charts, news
Institutional websites Electronic automatic translation services
Statistics hotline Interactive and searchable databases
Television news Building application programming interface (API) - Electronic Data Interchange
Regular radio programmes Webinars
Other traditional channels RSS and news feeds, direct e-mailing
Social media, of which (as examples):
· Twitter, Wikis, video-sharing websites
· Social media related to statistics
· Blogs
Based on 2020 Global Digital Report by Hoosuite and We are Social, per July 2020, active social media users in the world have reached approximately 3,8 billion users or about 49% of world population. In Indonesia itself, the active social media users per January 2020 is about 160 million users or about 59% population of Indonesia. On average, Indonesian people spend approximately 3 hours and 26 minutes for Social Media. However, amongst all social media, Youtube is the most famous social media platform with 88% access by Internet users aged 16 to 64 in Indonesia. Nowadays, social media is the most effective and efficient communication tool.
Some of the social media used in this study include Facebook, Instagram, and Youtube. Each social media has unique demographic characteristics of its users. Each type of social media has its advantages and disadvantages. Martin and MacDonald (2020) said that Instagram more readily supports the implementation of interpersonal communication strategies than Twitter, making Instagram the preferred platform for promoting conversational exchanges.
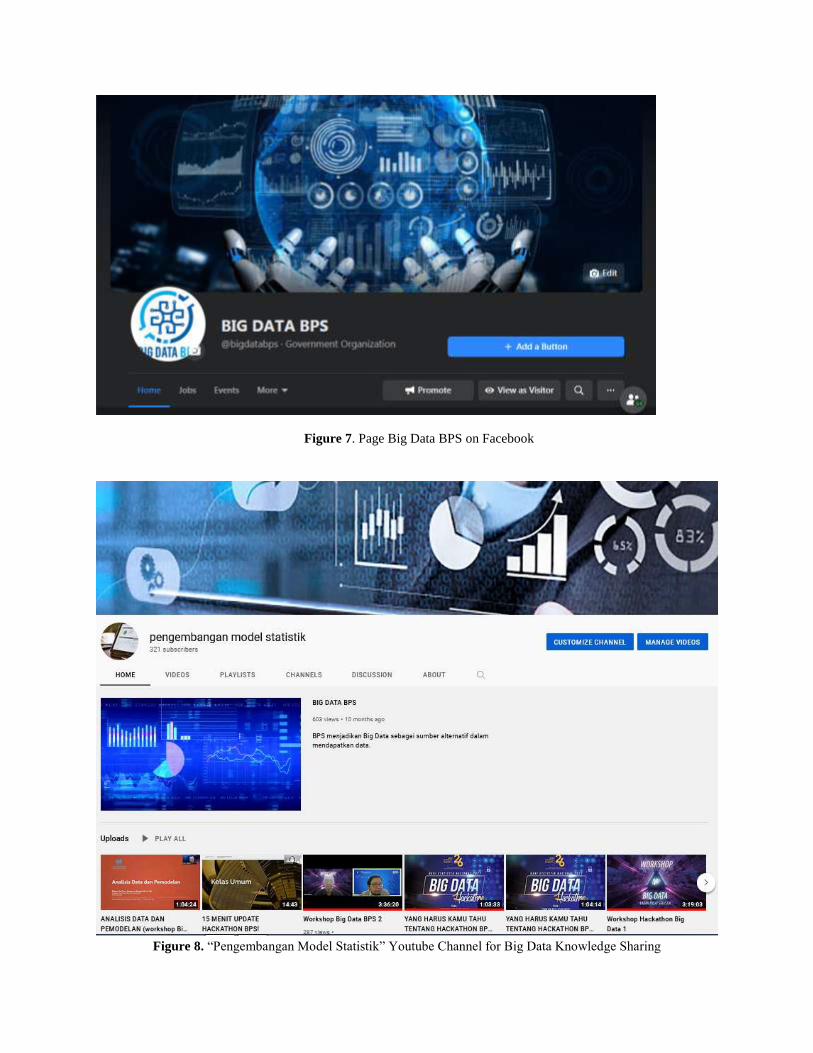
Figure 7. Page Big Data BPS on Facebook
Figure 8. “Pengembangan Model Statistik” Youtube Channel for Big Data Knowledge Sharing
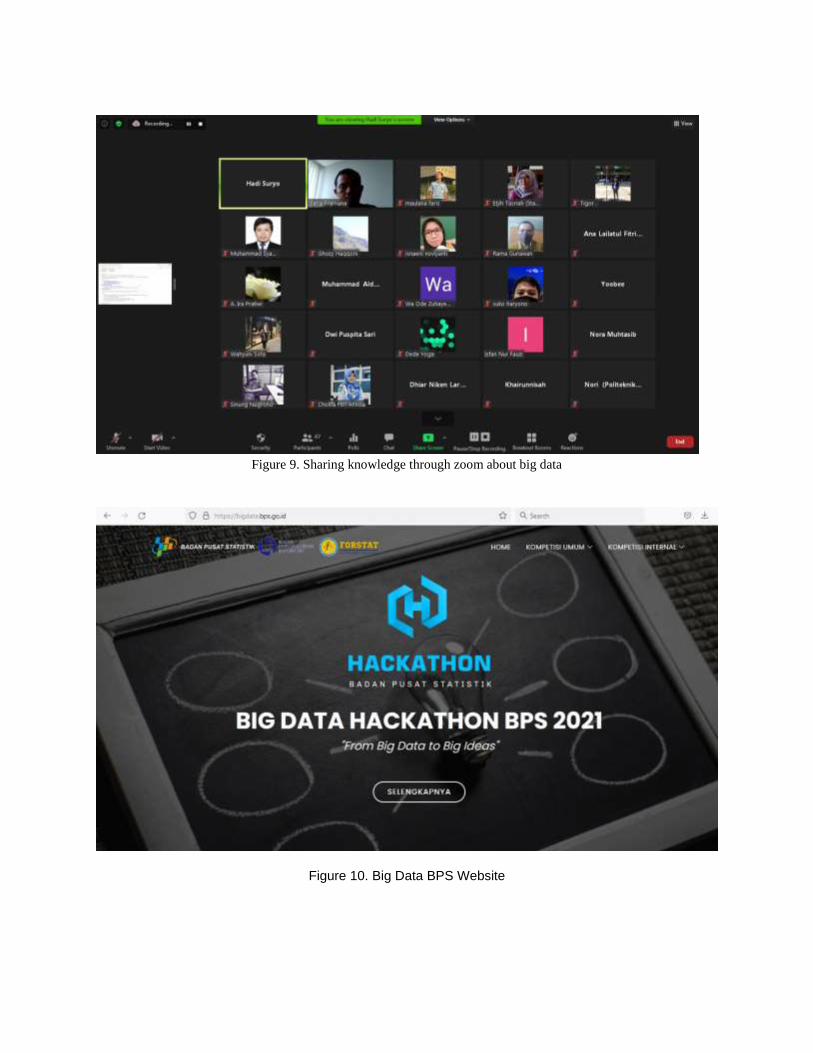
Figure 9. Sharing knowledge through zoom about big data
Figure 10. Big Data BPS Website
Result
From the various communication content that has been created and posted on social media
that has fulfilled all the main components of the statistical communication function, we can see how much people can be reached. Social Media provides statistics on the posts we made. We can see how well we communicate the big data from the posts we made. With these statistics we can evaluate how the communication we build with the community is going well or not. The statistical figures obtained will be displayed based on the type of information content created, namely comics, videographics, and booklets.
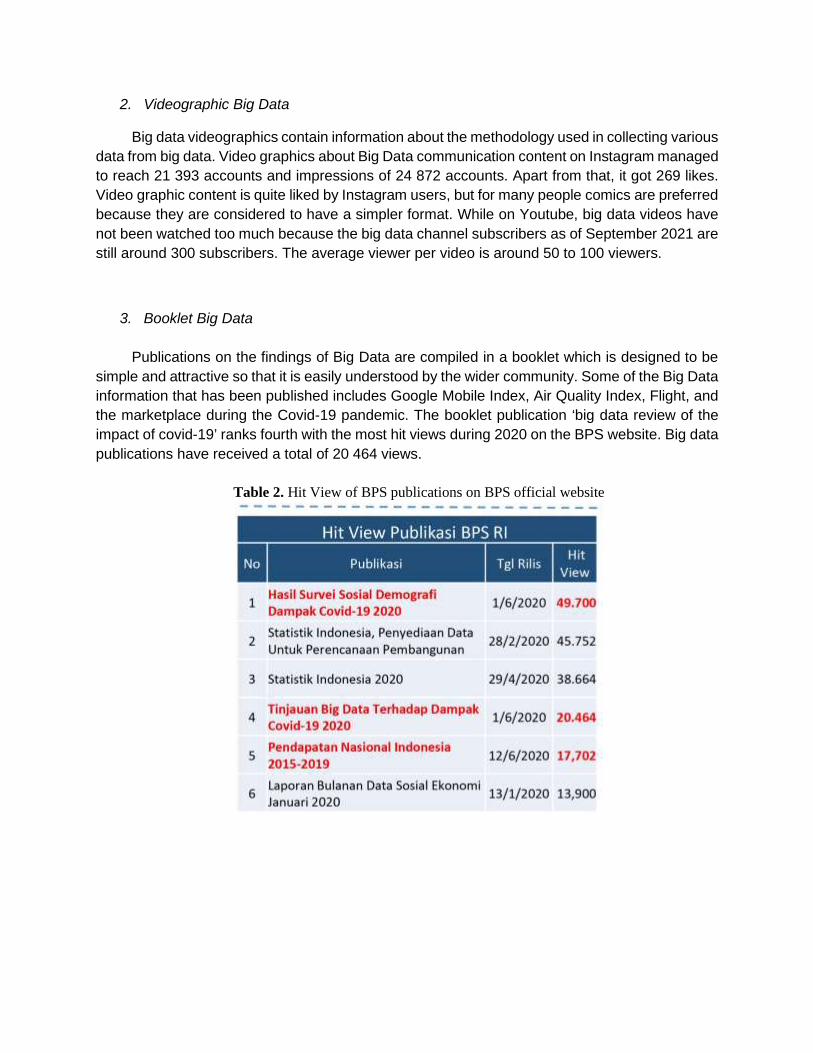
1. Comic Big Data
Figure 11. Big Data Comic in BPS Official FB Page
Figure 11 is the result of Statistics Indonesia FB fan page visitor from the first edition of big data comic after 20 days (July 9th -29th, 2021). This post managed to reach 17 495 people. This comic managed to get 368 reactions from readers and without any negative feedback. These reactions include 308 likes, 5 loves, 6 comments, and 49 shares.
2. Videographic Big Data
Big data videographics contain information about the methodology used in collecting various data from big data. Video graphics about Big Data communication content on Instagram managed to reach 21 393 accounts and impressions of 24 872 accounts. Apart from that, it got 269 likes. Video graphic content is quite liked by Instagram users, but for many people comics are preferred because they are considered to have a simpler format. While on Youtube, big data videos have not been watched too much because the big data channel subscribers as of September 2021 are still around 300 subscribers. The average viewer per video is around 50 to 100 viewers.
3. Booklet Big Data
Publications on the findings of Big Data are compiled in a booklet which is designed to be simple and attractive so that it is easily understood by the wider community. Some of the Big Data information that has been published includes Google Mobile Index, Air Quality Index, Flight, and the marketplace during the Covid-19 pandemic. The booklet publication ‘big data review of the impact of covid-19’ ranks fourth with the most hit views during 2020 on the BPS website. Big data publications have received a total of 20 464 views.
Table 2. Hit View of BPS publications on BPS official website
Discussion
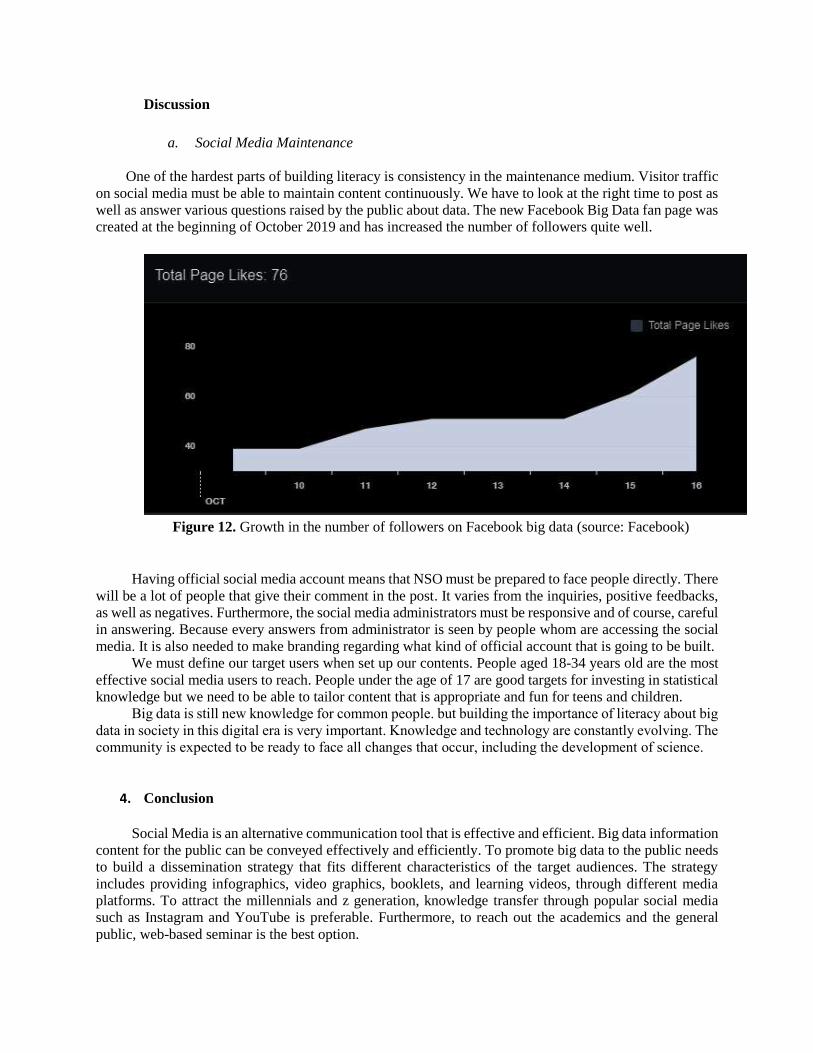
a. Social Media Maintenance
One of the hardest parts of building literacy is consistency in the maintenance medium. Visitor traffic
on social media must be able to maintain content continuously. We have to look at the right time to post as
well as answer various questions raised by the public about data. The new Facebook Big Data fan page was
created at the beginning of October 2019 and has increased the number of followers quite well.
Figure 12. Growth in the number of followers on Facebook big data (source: Facebook)
Having official social media account means that NSO must be prepared to face people directly. There
will be a lot of people that give their comment in the post. It varies from the inquiries, positive feedbacks,
as well as negatives. Furthermore, the social media administrators must be responsive and of course, careful
in answering. Because every answers from administrator is seen by people whom are accessing the social
media. It is also needed to make branding regarding what kind of official account that is going to be built.
We must define our target users when set up our contents. People aged 18-34 years old are the most
effective social media users to reach. People under the age of 17 are good targets for investing in statistical
knowledge but we need to be able to tailor content that is appropriate and fun for teens and children.
Big data is still new knowledge for common people. but building the importance of literacy about big
data in society in this digital era is very important. Knowledge and technology are constantly evolving. The
community is expected to be ready to face all changes that occur, including the development of science.
4. Conclusion
Social Media is an alternative communication tool that is effective and efficient. Big data information
content for the public can be conveyed effectively and efficiently. To promote big data to the public needs
to build a dissemination strategy that fits different characteristics of the target audiences. The strategy
includes providing infographics, video graphics, booklets, and learning videos, through different media
platforms. To attract the millennials and z generation, knowledge transfer through popular social media
such as Instagram and YouTube is preferable. Furthermore, to reach out the academics and the general
public, web-based seminar is the best option.
The next study will explore more about what types of social media content are most in demand by social
media users. By understanding this, the information we provide will reach a wider community. Big data
literacy in society will be well developed.
References
[1] Baker, A. (2011). Using Comics to Improve Literacy in English Language Learners.
[2] Baldacci, Emanuele & Pelagalli, Felicia, 2017. Communication of Statistics in Post-Truth Society:
The Good, The Bad, and The Ugly.
[3] BPS (2020). Tinjauan Big Data Terhadap Dampak Covid-19.
[4] BPS (2020). Analisis Big Data Di Tengah Masa Adaptasi Kebiasaan Baru.
[5] Bryant, R., Katz, R.H., Lazowska, E.D., 2008. Big-data computing: Creating revolutionary
breakhthrougs in commerce, science and society.
[6] Camilleri, Mark Anthony, 2018. Market Segmentation, Targeting, and Positioning.
[7] Chen, M, Mao, S., Liu, Y., 2014. Big data: A survey. Mobile Networks and Applications 19(2), 171-
209.
[8] Combs, J. (2003). Creating Comics: Visual and Verbal Thinking in the Ultimate Show and Tell.
[9] Eisner, W. (1985). Comics and Sequential Art. Tamarac, FL: Poorhouse Press.
[10] Fontaine et al. (2019). Comunicating Science in the Digital and Social Media Ecosystem: Scoping
Review and Typology of Strategies Used by Health Scientists. JMIR Public Health and
Surveillance.
[11] Hasbullah, Jousairi (31 July 2018). “Bahaya Buta Data.” Kompas [Indonesia]. Print.
[12] Hey, y Tansley, S., & Tolle, K. (2009). Fourth Paradigm Data-Intensive Scientific Discovery.
[13] Larasati, Dhiar Niken., Bustaman, Usman., Pramana, Setia. (2020). Online Marketplace Data to
Figure COVID-19 Impact on Micro and Small Retailers in Indonesia.
[14] Marianthi, V., Boloudakis, M., and Retalis, S. (2008). From Digitised Comic Books to Digital
Hypermedia Comic Books: Their Use in Education.
[15] Martin C and MacDonald BH. (2020). Using Interpersonal Communication Strategies to Encourage
Science Conversations on Social Media. PLOS ONE
[16] McGrail, E., and Alicja R. (2013). Increasing Disability Awareness through Comics Literature.
Electronic Journal for Inclusive Education Vol 3(1), Article 5.
[17] Nymand-Andersen (2017). Preparing a Statistics Communication Strategy. UNECE
[18] Panuntun SB (2020). Development of Automated Flight Data Collection System for Air
Transportation Statistics
[19] Paramartha D Y (2020). Development of Automated Environmental Data Collection System and
Environment Statistics Dashboard
[20] Plowman, K. D., & Wilson, C (2018). Strategy and Tactics in Strategic Communication: Examining
their Intersection with Social Media Use. International Journal of Strategic Communication.
[21] Pramana S, Yuniarto, B., Kurniawan, R., Yordani, R., Lee, J., Amin, I., Satyaning P.P.N. L, Riyadi.
Y., Hasyyati A.N., Indriani, R. "Big data for government policy: Potential implementations of
bigdata for official statistics in Indonesia," 2017 International Workshop on Big Data and
Information Security (IWBIS), IEEE. Jakarta, 2017, pp. 17-21.
[22] Pramana S, Bustaman U, Larasati DN, Putri ZHS, Sofa WA, Deli NF, Nurtia (2020). Kajian Big
Data sebagai Pelengkap Data dan Informasi Statistik Ekonomi. BPS.
[23] Pramana S, Bustaman U, Larasati DN, Sofa WA, Deli NF, Faris M, Rahayu Y, Fitriyani AL,
Panuntun SB, Paramartha DY, Yuniarti, Putri ZHS, Nurtia, Takdir, Mariyah S, Luqan M,
Ermawan GY, Nori, Koswara A, Sari DP, Noviyanti I, Nugroho ARS. (2020). Analisis Big Data
Di tengah Masa Adaptasi Kebiasaan Baru. BPS.
[24] Pramana S, Bustaman U, Larasati DN, Sofa WA, Deli NF, Faris M, Rahayu Y, Fitriyani AL,
Panuntun SB, Paramartha DY, Yuniarti, Putri ZHS, Nurtia, Takdir, Mariyah S, Luqan M,
Ermawan GY, Nori, Koswara A, Sari DP, Noviyanti I, Nugroho ARS. (2020). Tinjauan Big Data
Terhadap Dampak COVID-19. BPS.
[25] Pramana S, Rahayu Y, Fitriyani AL, Sofa WA, Panuntun SB, Paramartha DY, Yuniarti. (2020).
Kajian Big Data sebagai Pelengkap Data dan Informasi Statistik Sosial. BPS.
[26] Salahudin. (2019). Mengenal Big Data (BD) dan Big Data Analysis (BDA).
[27] Sones, W. W. D (1944). The Comics and Instructional Method. Journal of Educational Sociology,
Vol. 18(4), The Comics as an Educational Medium,p 232-240.
[28] Tam, Siu-Ming and Clarke, Frederic (2014). Big Data, Official Statistics and Some Initiatives by the
Australian Bureau of Statistics.
[29] Versaci, R. (2001). How Comic Books can Change the Way Our Students See Literature: One
Teacher’s Perspective. The English Journal, 91:2, pp. 61-67
[30] We Are Social and Hootsuite. (July 2020). Digital 2020 : Global Digital Overview.
[31] Wright, D.K., & Hinson, M.D. (2015). Examining social and emerging media use in public relations
practice: A Ten Year Longitudinal Analysis. Public Relations Journal, 9(2), 1-26.
Related Documents