University of Tennessee, Knoxville University of Tennessee, Knoxville TRACE: Tennessee Research and Creative TRACE: Tennessee Research and Creative Exchange Exchange Doctoral Dissertations Graduate School 12-2020 More than the sum of their parts: Building a framework for More than the sum of their parts: Building a framework for understanding host-microbe interactions in Medicago sativa understanding host-microbe interactions in Medicago sativa Katherine Mackenzie Moccia University of Tennessee, Knoxville, [email protected] Follow this and additional works at: https://trace.tennessee.edu/utk_graddiss Part of the Environmental Microbiology and Microbial Ecology Commons Recommended Citation Recommended Citation Moccia, Katherine Mackenzie, "More than the sum of their parts: Building a framework for understanding host-microbe interactions in Medicago sativa. " PhD diss., University of Tennessee, 2020. https://trace.tennessee.edu/utk_graddiss/6154 This Dissertation is brought to you for free and open access by the Graduate School at TRACE: Tennessee Research and Creative Exchange. It has been accepted for inclusion in Doctoral Dissertations by an authorized administrator of TRACE: Tennessee Research and Creative Exchange. For more information, please contact [email protected].

Welcome message from author
This document is posted to help you gain knowledge. Please leave a comment to let me know what you think about it! Share it to your friends and learn new things together.
Transcript
University of Tennessee, Knoxville University of Tennessee, Knoxville
TRACE: Tennessee Research and Creative TRACE: Tennessee Research and Creative
Exchange Exchange
Doctoral Dissertations Graduate School
12-2020
More than the sum of their parts: Building a framework for More than the sum of their parts: Building a framework for
understanding host-microbe interactions in Medicago sativa understanding host-microbe interactions in Medicago sativa
Katherine Mackenzie Moccia University of Tennessee, Knoxville, [email protected]
Follow this and additional works at: https://trace.tennessee.edu/utk_graddiss
Part of the Environmental Microbiology and Microbial Ecology Commons
Recommended Citation Recommended Citation Moccia, Katherine Mackenzie, "More than the sum of their parts: Building a framework for understanding host-microbe interactions in Medicago sativa. " PhD diss., University of Tennessee, 2020. https://trace.tennessee.edu/utk_graddiss/6154
This Dissertation is brought to you for free and open access by the Graduate School at TRACE: Tennessee Research and Creative Exchange. It has been accepted for inclusion in Doctoral Dissertations by an authorized administrator of TRACE: Tennessee Research and Creative Exchange. For more information, please contact [email protected].

To the Graduate Council:
I am submitting herewith a dissertation written by Katherine Mackenzie Moccia entitled "More
than the sum of their parts: Building a framework for understanding host-microbe interactions in
Medicago sativa." I have examined the final electronic copy of this dissertation for form and
content and recommend that it be accepted in partial fulfillment of the requirements for the
degree of Doctor of Philosophy, with a major in Microbiology.
Sarah L. Lebeis, Major Professor
We have read this dissertation and recommend its acceptance:
Heidi Goodrich-Blair, Alison Buchan, James Fordyce
Accepted for the Council:
Dixie L. Thompson
Vice Provost and Dean of the Graduate School
(Original signatures are on file with official student records.)
More than the sum of their parts:
Building a framework for understanding
host-microbe interactions in Medicago sativa
A Dissertation Presented for the
Doctorate of Philosophy
Degree
The University of Tennessee, Knoxville
Katherine Mackenzie Moccia
December 2020

ii
Copyright © 2020 Katherine Mackenzie Moccia. “More than the sum of their parts:
Building a framework for understanding host-microbe interactions in Medicago sativa”
All rights reserved.

iii
DEDICATION
This dissertation is dedicated to my parents, Kevin Moccia and Regina Gallagher, my
brother James Moccia, my uncle Jim Gallagher, and my grandmother Mary Gallagher.
The five of you have always encouraged me be who I am, and not what other people
wanted me to be. What a gift you have given me. My strength and my endurance come
from you all.
Thank you.
iv
ACKNOWLEDGEMENTS
First and foremost, I want to express my profound gratitude for my advisor Sarah
Lebeis. Sarah has taught me much of what I know about microbiology, from the best
controls to how to write method sections that people can actually follow. But what I
learned from Sarah goes far beyond the field of microbiology. Sarah has a perspective in
science that allows for abounding optimism. Although it is easy to brush it off as a
positive perspective, it comes from a much deeper place. When an experiment fails,
Sarah is unphased. She does not despair, but instead comes with the question “What did
we learn?”. This small question provides the opportunity to look beyond the present
experiment and expand out to the whole. I recently heard someone describe a PhD as one
who creates new knowledge. Sarah has taught me that failure is not an unfortunate
misstep on the way to new knowledge, it is new knowledge itself. I learned to embrace
this viewpoint from Sarah, and it continues to teach me to be a better scientist every day.
On the topic of becoming a better scientist, Michelle Larsen has played such an
integral role in forming the scientist I am today, that I am not sure I can express my
gratitude with words. As a high school student, I was nervous, quiet, and wholly unsure
of what to do in a laboratory. Michelle, along with JoAnn Tufariello, Oren Mayer, and
many other members of the William Jacobs Lab, have taught me the principals of
microbiology. Many of the lessons I learned from all of you, I have taught to my own
students. Michelle, I hope that one day I give a high school student the opportunities that
you have given me. For now, my deepest appreciation will have to suffice.

v
I thank Alison Buchan, Gary LeClair and Steve Wilhelm and anyone else who
was involved with providing me a spot in the REU. The REU program not only
demonstrated how exciting science can be, but also taught me that a scientific career can
be a part of a well-balanced life. My experience within that program gave me the
confidence to apply to graduate school. While in graduate school, Heidi Goodrich-Blair
and James Fordyce have both been incredibly helpful members of my committee and I
thank them both for their patience while I found my project and their insightful
experimental suggestions once I solidified my aims. My secret committee member,
Veronica Brown, has been exceptionally helpful in troubleshooting problems and
providing words of encouragement. Next Generation Sequencing has been a huge part of
my dissertation, and Veronica has much of what I know on this subject.
My lovely lab mates, David Grant, Bridget O’Banion and Alexandra Gates all
deserve acknowledgement. David is an excellent scientist, and an even better lab mate.
He is always available to help troubleshoot, and I have benefitted from his knowledge of
molecular biology many times. The talented Bridget O’Banion who, among other things,
has an incredibly critical mind for experimental design. She has made my first paper
better because of her suggested controls, and for that I am profoundly grateful. I have
thoroughly enjoyed discussing scientific papers and ideas Alexandra Gates, as she is able
to quickly get to the crux of a paper while understanding pitfalls. This is a highly sought-
after skill that I have benefitted from. Her analysis of scientific papers provided me with
many a citation within this dissertation. Thank you all!

vi
This dissertation would not have been possible without the wonderful
undergraduates and post-baccalaureate students who have helped me. Andrew Willems,
my first undergraduate, has been both a friend and an amazing scientist. His enthusiasm
for science is rare, and it has been a joy to work with him. Alex Demetros, another friend
and scientist, was a great help to my third research chapter, and my final years in
graduate school. I always looked forward to teaching him and hearing his thoughts about
the world. I thank my REU students, Alicia Flores, Alexi Girod, Kayla Bonilla, as well as
the other students I have had the pleasure of working with, Makaila Gray and Erin Yi, for
all of their hard work that moved many a project forward!
Lizzie Larsen and Maddy Hwee have shared in my scientific journey and both
inspired and comforted me along the way with their curiosity and determination. Emily
Stern and Bethany Zulick have patiently listened to me complain about graduate school
and wisely reminded me that it is not interminable! I thank my all friends, both new ones
formed in graduate school and ones from seemingly the beginning of time, for their
support, kindness, and love.
Finally, I want to thank my husband, Spiro Papoulis. I could write a whole other
dissertation on just how much you have helped me. For now, I will just say you have
been my biggest advocate, and my sweetest solace.
vii
ABSTRACT
This dissertation seeks to understand plant-microbe interactions in the
agriculturally relevant plant Medicago sativa from three distinct vantage points within
microbiology. Within the plant microbiome, we examine how primer usage and the
application of peptide nucleic acids impacts 16S and 18S rRNA gene sequencing. In
doing so, we design a novel peptide nucleic acid, PNA, and test its impact using multiple
primers and sequencing protocols. Once microbial sequencing methodology is
established, we generate a synthetic consortium of bacterial isolates from M. sativa leaves
and modulate nitrogen levels to better understand microbial structure. Drop out
communities, where we remove one member at a time, elucidate what community
members colonize to high levels, and how they change the microbial community when
present. Using this approach, we uncover how, and which microbes can consistently
colonize plants across nutrient conditions. Further, we examine multiple genetic
approaches to investigate potential genetic mechanisms behind plant colonization, such
as high throughput sequencing techniques such as randomly barcoded transposon
sequencing (RB-TnSeq) and traditional transposon mutagenesis. By using a variety of
approaches within biology, we elucidate plant-microbe interactions in alfalfa.
viii
TABLE OF CONTENTS
Chapter 1: Understanding plant microbe interactions in Medicago Sativa ........................ 1
Chapter Contributions: .................................................................................................... 2
Introduction: .................................................................................................................... 2
Alfalfa and its role in the United States ...................................................................... 2
Challenges and limitations within alfalfa research ..................................................... 4
One approach towards improving alfalfa research ..................................................... 7
Chapter 2- Microbiome technologies and their impact on plant microbe research .... 9
Chapter 3- Synthetic communities within plant microbiomes .................................. 13
Chapter 4- Using genetic techniques to understand microbial colonization of the
plant........................................................................................................................... 15
Overall goals of this dissertation ............................................................................... 19
Appendix……………………………………………………………………………21
Chapter 2: Optimizing techniques to improve microbiome research in M. sativa ........... 23
Chapter Contributions: .................................................................................................. 24
Abstract: ........................................................................................................................ 24
Introduction: .................................................................................................................. 25
Materials and Methods:................................................................................................. 29
Plant material collection and organization ................................................................ 29
Separation of epiphyte and endophyte material ........................................................ 30
M. sativa homogenization ......................................................................................... 32
Optimization for DNA extraction from M. sativa and 16S/ITS amplification ......... 33
Creating the Microbiome Amplification Preference Tool (MAPT) and genomic
Peptide Nucleic Acid (PNA) for M. sativa ............................................................... 34
Amplicon library preparation and sequencing .......................................................... 37
16S rRNA gene analysis for both V3-V4 and V4-V5 primers ................................. 39
Separation of 18S rRNA gene amplicon reads ......................................................... 40
Isolation of bacterial and fungal collection from M. sativa samples ........................ 41
Identification of neighboring plants .......................................................................... 42
Statistical Analysis .................................................................................................... 44
Results: .......................................................................................................................... 44
Summer 2017 and 2018 sample collections.............................................................. 44
Plant homogenization for successful DNA extraction .............................................. 45
Design of a novel PNA to prevent host 18S rRNA gene amplification.................... 46
Testing biases of PNA in silico ................................................................................. 47
Comparing 16S rRNA primer sets and connecting reads to sampling efforts .......... 49
Microbial eukaryotic members captured by 18S rRNA gene sequencing ................ 51
Connecting 18S rRNA gene to ITS amplicon sequencing and fungal isolation
representatives........................................................................................................... 51
Influence of PNAs on 18S rRNA amplicon sequencing ........................................... 53
Discussion: .................................................................................................................... 56
Acknowledgements: ...................................................................................................... 60
ix
Appendix………………………………………………………………………………61
Chapter 3: Distinguishing nutrient-dependent plant driven bacterial colonization patterns
in Alfalfa ........................................................................................................................... 94
Chapter Contributions: .................................................................................................. 95
Abstract: ........................................................................................................................ 95
Introduction: .................................................................................................................. 96
Materials and Methods:................................................................................................. 98
Isolation of plant associated microbes ...................................................................... 98
Identification of plant associated traits ..................................................................... 99
Seed information and germination .......................................................................... 100
Individual plant microbe assays of all strains ......................................................... 101
Individual 4 day, 2 week, 4 week and 6 week colonization of Pantoea sp. R4,
Williamsia sp. R60, and Arthrobacter sp. R85 ....................................................... 102
Drop out experiments .............................................................................................. 103
Library prep ............................................................................................................ 104
Analysis using QIIME2 .......................................................................................... 105
Approximating 16S rRNA gene read count for each bacterial isolate.................... 106
Plant growth promotion assays ............................................................................... 107
Statistical analysis ................................................................................................... 109
Results: ........................................................................................................................ 109
Generation of the synthetic community .................................................................. 109
Plant microbiome assembly .................................................................................... 110
Drop out community results .................................................................................... 111
Impact of nutrient concentration on isolate colonization ........................................ 112
2 week viable count synthetic communities ........................................................... 113
4 week viable count synthetic communities ........................................................... 114
Individual colonization strategies over time ........................................................... 116
Plant biomass in relation to microbial colonization strategies................................ 117
Investigations into plant growth promotion under varying nutrient conditions ..... 117
Discussion: .................................................................................................................. 121
Acknowledgements: .................................................................................................... 127
Appendix……………………………………………………………………………..128
Chapter 4: Investigating Genetic Approaches to Best Understand Pantoea sp. R4
Colonization .................................................................................................................... 155
Chapter Contributions: ................................................................................................ 156
Abstract: ...................................................................................................................... 156
Introduction: ................................................................................................................ 157
Pantoea spp. host colonization ............................................................................... 157
Why use RB-TnSeq to define Pantoea sp. R4 colonization ................................... 159
Why screen for plant associated traits .................................................................... 162
Examining carotenoid production in Pantoea spp. ................................................. 164
Materials and Methods:............................................................................................... 165
RB-TnSeq strategy .................................................................................................. 165
RB-TnSeq mating for frozen, overnight cultures ................................................... 167
x
RB-TnSeq for frozen cultures with E. coli at mid-log ............................................ 168
RB-TnSeq for unfrozen, overnight cultures............................................................ 170
RB-TnSeq DNA extraction and quantification ....................................................... 171
RB-TnSeq DNA sonication .................................................................................... 171
RB-TnSeq size selection ......................................................................................... 171
RB-TnSeq NEB Next End Prep and adaptor ligation ............................................. 172
RB-TnSeq post NEB Next size selection................................................................ 174
Transposon enrichment of adaptor ligated DNA .................................................... 174
RB-TnSeq Final cleanup and submission for sequencing ...................................... 175
Generating mariner transposon mutants ................................................................. 175
Screening carotenoid deficient mutants .................................................................. 176
Arbitrary PCR ......................................................................................................... 178
Identification of genomic location of insertion ....................................................... 179
Phenotyping carotenoid mutants ............................................................................. 180
Competition assays in alfalfa .................................................................................. 181
Drop out community experiments .......................................................................... 182
Potassium mutant colonization experiments ........................................................... 182
Statistical analysis ................................................................................................... 183
Results ......................................................................................................................... 183
RB-TnSeq results .................................................................................................... 183
Genetic screening and characterization for mutants ............................................... 186
Carotenoid mutant phenotyping assays .................................................................. 188
Carotenoid mutant colonization assays ................................................................... 189
Discussion ................................................................................................................... 192
Next steps for RB-TnSeq troubleshooting .............................................................. 192
Carotenoid mutant analysis ..................................................................................... 194
Competition assays with carotenoid mutants .......................................................... 197
Potassium mutant experiments ............................................................................... 198
Appendix…………………………………………………………………………......200
Conclusion ...................................................................................................................... 221
Optimizing techniques to improve microbiome sequencing in alfalfa ................... 222
Distinguishing nutrient-dependent plant driven bacterial colonization patterns in
alfalfa ...................................................................................................................... 224
Investigating genetic approaches to best understand Pantoea sp. R4 colonization 227
Final thoughts.......................................................................................................... 228
References ....................................................................................................................... 230
Appendix: Creating and assessing a teaching module for plant, microbe, and nutrient
interactions ...................................................................................................................... 248
Appendix Contributions: ............................................................................................. 249
Abstract: ...................................................................................................................... 249
Introduction: ................................................................................................................ 249
Overall goals of the teaching module ..................................................................... 249
Connections to 7th grade curricula in Tennessee .................................................... 250
Materials and Methods:............................................................................................... 251
xi
Lecture regarding plant, microbe, and nutrient interactions ................................... 251
Experimental design for teachers ............................................................................ 252
Materials provided for teachers .............................................................................. 253
Teaching strategies utilized ..................................................................................... 254
Post workshop survey assessments and analysis .................................................... 255
Results: ........................................................................................................................ 255
Discussion: .................................................................................................................. 257
Areas of success ...................................................................................................... 257
Ways to improve the learning module .................................................................... 258
Acknowledgements: .................................................................................................... 260
Appendix……………………………………………………………………………..261
Vita .................................................................................................................................. 267
xii
LIST OF TABLES
Table 2.1: Sample size for each type of sample………………………………………….83
Table 2.2: Amplification of DNA extracted using multiple plant weights and DNA
extraction kits………………………………………………………………………. 84
Table 2.3: Oligonucleotides used in this paper for amplicon sequencing………………. 85
Table 2.4: Oligonucleotides used in this paper for identification of fungal and bacterial
isolate collections as well as neighboring plants…………………………………... 86
Table 2.5: Identity of neighboring plants………………………………………………...87
Table 2.6: Actual sequences for neighboring plants…………………………………….. 88
Table 2.7: Sample number breakdown for 2017 sampling season……………………… 91
Table 2.8: Sample number breakdown for 2018 sampling season……………………… 92
Table 2.9: Taxonomic identification of insects recovered from the sampling site……… 93
Table 3.1: Isolate and 16S rRNA/ITS gene information………………………………. 149
Table 3.2: Oligonucleotides used in this chapter………………………………………. 151
Table 3.3: Microbe-microbe interactions on 1/10 LB nutrients……………………….. 152
Table 3.4 : List of each seed accession and plant growth media used………………… 154
Table 4.1: Primers and adaptors used in RB-TnSeq…………………………………… 215
Table 4.2: Arbitrary PCR primers used……………………………………………….. 216
Table 4.3: Mutants with differential pigmentation…………………………………….. 217
Table 4.4: Various mutants screened for plant associated phenotypes…………………218
Table 4.5: Example of Insertions in RB-TnSeq library……………………………….. 220
Table A.1: Example assessments for students that was reviewed by the participants in
question nine of the post workshop teacher survey………………………………. 265
xiii
LIST OF FIGURES
Figure 1.1: Displaying spread of M. sativa L. throughout the United States. .................. 21
Figure 1.2: Overall schematic of this dissertation. ........................................................... 22
Figure 2.1: Sampling Key for Sites for both 2017 and 2018. ........................................... 61
Figure 2.2: Example of organizational system for 2018 sampling trip............................. 62
Figure 2.3 M. sativa homogenized best after lyophilization. ............................................ 63
Figure 2.4: Generation of gPNA and regeneration of mPNA and pPNA demonstrates
efficacy of MAPT ..................................................................................................... 64
Figure 2.5: 18S rRNA gene amplification in heat-treated plants and fungal isolates with
increasing PNA concentrations. ................................................................................ 65
Figure 2.6: A comparison of land plant 18S rRNA gene reads in SILVA with gPNA k-
mer alignment. .......................................................................................................... 66
Figure 2.7: Schematic for sample processing. .................................................................. 67
Figure 2.8: Fungal sequences available in SILVA are unlikely to blocked by the gPNA.68
Figure 2.9: Small percentage of SILVA microbial eukaryotes could be blocked by the
gPNA......................................................................................................................... 69
Figure 2.10:18S rRNA gene amplicon sequencing successfully captures a wide array of
phyla across multiple kingdoms................................................................................ 70
Figure 2.11: V3-V4 primers demonstrate significantly larger diversity in M. sativa
samples when compared to V4-V5. .......................................................................... 71
Figure 2.12: Bacterial isolate collections of endophyte and epiphyte enriched M. sativa
samples. ..................................................................................................................... 72
Figure 2.13: 18S rRNA gene ASVs captured represent diverse phyla isolated from both
protists and fungal kingdoms. ................................................................................... 73
Figure 2.14: 18S rRNA gene sequencing ASVs for oomycetes, also known as
Peronosporomycetes as well as their sister group Hyphochytriomycetes. ............... 74
Figure 2.15: Fungal isolate collections of endophyte and epiphyte enriched M. sativa
have more culture matches in 18S rRNA amplicon sequencing than ITS amplicon
sequencing................................................................................................................. 75
Figure 2.16: Average read abundance across sample types does not show significant
differences with gPNA addition ................................................................................ 76
Figure 2.17: Species richness in M. sativa rarefied samples increases with gPNA
addition. .................................................................................................................... 77
Figure 2.18: Venn diagram demonstrates more diverse ASVs when gPNA is added in
rarefied samples ........................................................................................................ 78
Figure 2.19: Equal sample size does not impact ASV richness. ....................................... 79
Figure 2.20: Diversity metrics are not significantly different between neighboring plant
samples with 0, 2 and 3 PNAs. ................................................................................. 80
Figure 2.21: Plant to microbial eukaryote ratio slightly decreases with gPNA addition. . 81
Figure 2.22: Richness of endophyte and epiphyte enriched samples compared across PNA
treatments. ................................................................................................................. 82
Figure 3.1: Connecting the feral alfalfa microbiome to the synthetic community. ........ 128
xiv
Figure 3.2: All ASVs from drop out community and heat treated seedlings. ................. 129
Figure 3.3: Examining the community structure with the colonization control D.
radiodurans. ............................................................................................................ 130
Figure 3.4: Creating sequence read to viable counts ratio .............................................. 131
Figure 3.5: Whole plant colonization by individual microbes isolated from alfalfa. ..... 132
Figure 3.6: Drop out communities at varying nitrogen levels. ....................................... 133
Figure 3.7: Viable counts of total synthetic community. ................................................ 134
Figure 3.8: Average read count for each low colonizing community member in each drop
out community. ....................................................................................................... 135
Figure 3.9: Drop out community reveals differing read count based on nutrient regime
and microbial interaction. ....................................................................................... 136
Figure 3.10: Average read count of each drop out community compared...................... 137
Figure 3.11: Pantoea sp. R4 read counts do not differ between in the -R60 community
and the total community.......................................................................................... 138
Figure 3.12: Colonization of Pantoea sp. R4 changes due to plant age and nutrient regime
while Williamsia sp. R60 colonization is constant. ................................................ 139
Figure 3.13: Pantoea sp. R4 colonization of the media does not change without the plant
present under varying nitrogen. .............................................................................. 140
Figure 3.14: Synthetic community assembly at 2 and 4 weeks reveals community
succession over time. .............................................................................................. 141
Figure 3.15: Individual colonization at 4 time points for the 3 main community colonizers
at regular Yoshida conditions ................................................................................. 142
Figure 3.16: Plant biomass of individual colonization of the top 3 colonizers over time as
well as uninoculated plants. .................................................................................... 143
Figure 3.17: Seed germination does not increase significantly with Pantoea sp. R4 ..... 144
Figure 3.18: Drop out communities does not appear to promote plant growth. ............. 145
Figure 3.19: Pantoea sp. R4 and Williamsia sp. R60 after 6 weeks in ½ or regular
Yoshida does not appear to promote plant growth. ................................................ 146
Figure 3.20: Pantoea sp. R4 and Williamsia sp. R60 in autoclaved soil does not appear to
promote plant growth. ............................................................................................. 147
Figure 3.21: Pantoea sp. R4 does exhibit plant growth promotion under severe nutrient
stress conditions. ..................................................................................................... 148
Figure 4.1: Carotenoid chemical pathway for Pantoea spp. ........................................... 200
Figure 4.2: pEZ16 Schematic created using SnapGene Viewer 4.3.9. ........................... 201
Figure 4.3: Schematic outlining the steps involved in RB-TnSeq. ................................. 202
Figure 4.4: Testing sonication and size selection for RB-TnSeq reveals best methods.. 203
Figure 4.5: Bioanalyzer suggests correct size of fragment to be sequenced prior to
denaturing ............................................................................................................... 204
Figure 4.6: Results from both RB-TnSeq sequencing attempts demonstrate read quality
decreases after 100 base pairs. ................................................................................ 205
Figure 4.7: Comparison of RB-TnSeq runs reveals large read length size differences. . 206
Figure 4.8: Schematic of the crt gene cluster based on alignment from both AntiSMASH
and JGI/IMG. .......................................................................................................... 207
Figure 4.9: Schematic of genes surrounding potassium mutant insertion. ..................... 208
xv
Figure 4.10: Mutant deficient in potassium solubilization can colonize M. sativa. ....... 209
Figure 4.11: Phenotyping carotenoid mutants ................................................................ 210
Figure 4.12: Competition assays at 4 days and 4 weeks for regular and no nitrogen added
................................................................................................................................. 211
Figure 4.13: Leaf and root colonization separated 4 weeks for regular and no nitrogen
added ....................................................................................................................... 212
Figure 4.14: Synthetic community assembly at 2 Weeks and 4 weeks with mutants hhows
similar colonization to wildtype.............................................................................. 213
Figure 4.15: Members of the synthetic community with viable counts. ......................... 214
Figure A.1: Handout provided to teachers to guide them in designing an experiment to
investigate the role of plants, microbes, or nutrients. ............................................. 261
Figure A.2: Post-workshop teacher survey filled out by all participants. ....................... 263
Figure A.3: Analysis of the 6 multiple choice questions ................................................ 264

1
CHAPTER 1: UNDERSTANDING PLANT MICROBE
INTERACTIONS IN MEDICAGO SATIVA

2
Chapter Contributions:
This chapter is a version of a peer-reviewed article previously published: Moccia, K. M., and
Lebeis, S. L. 2019. Microbial Ecology: How to Fight the Establishment. Current Biology.
29:R1320–R1323.
Katherine Moccia wrote the chapter. Katherine Moccia and Dr. Sarah Lebeis revised this
chapter.
Introduction:
Alfalfa and its Role in the United States
Medicago sativa, also known as alfalfa, is a forage crop grown in numerous countries
throughout the world. In fact, alfalfa can be found on every continent (Michaud, 1988). While
most forage crops are cultivated for direct consumption, alfalfa can also be dried and fed to
livestock, used as silage, or rotated as a cover crop to improve soil health. It likely originated in
Persia (modern day Iran) before it slowly spread throughout the world (Brough et al., 1977). In
the Americas, alfalfa has a recent history as it was introduced in the Southwestern United States
during the 1800’s by Chilean, Mexican and European sources (Brough et al., 1977). The main
source for the United States was the “hardy winter” variety brought from the British Isles to Utah
in 1850 and spread across the United States by early Mormon immigrants (Figure 1.1). Despite
its relatively recent origins in the United States, alfalfa has become a highly popular crop for
cultivation.
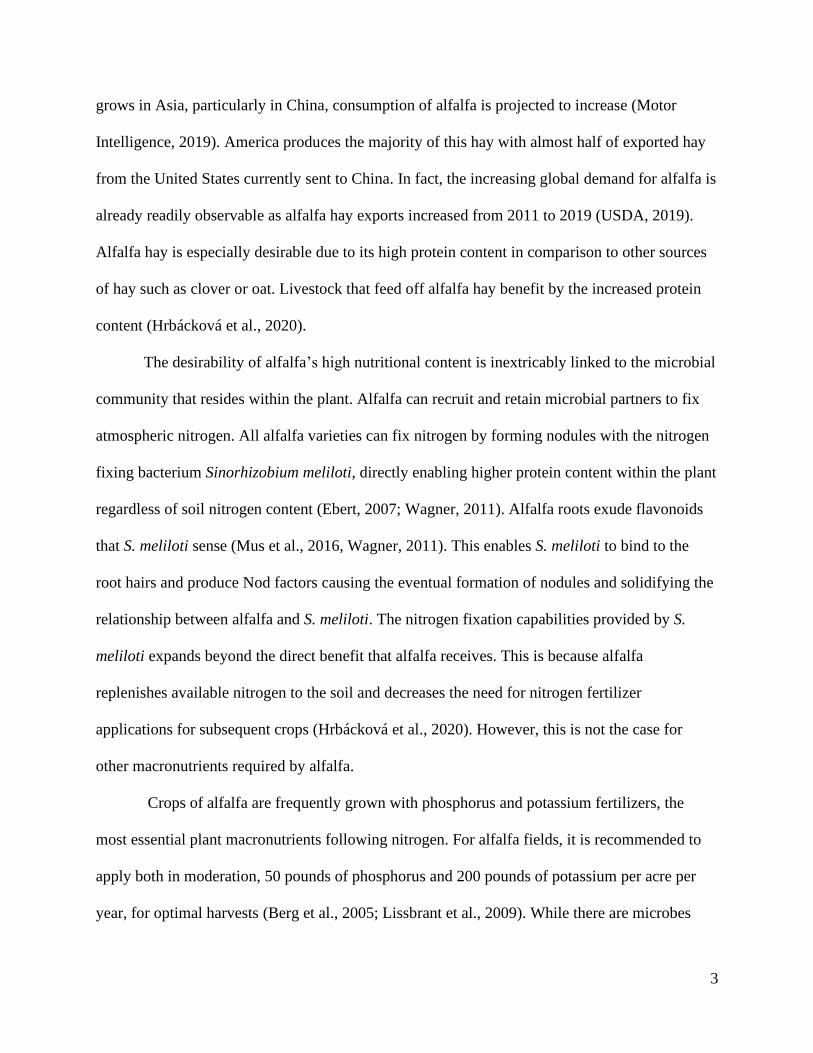
According to the Alfalfa Hay Market, 197.8 million metric tons of alfalfa hay were
consumed in 2018, with the United States as the largest producer of alfalfa hay worldwide
(Motor Intelligence, 2019). Indeed, according to National Agricultural Statistics Service, alfalfa
is the third most profitable crop in the United States, valued at 9.3 billion dollars in 2017. This
puts alfalfa over 1 billion dollars more valuable than wheat, a crop so prized it earned America
the title of “breadbasket of the world” (NASS, 2017). As demand for dairy and meat products
3
grows in Asia, particularly in China, consumption of alfalfa is projected to increase (Motor
Intelligence, 2019). America produces the majority of this hay with almost half of exported hay
from the United States currently sent to China. In fact, the increasing global demand for alfalfa is
already readily observable as alfalfa hay exports increased from 2011 to 2019 (USDA, 2019).
Alfalfa hay is especially desirable due to its high protein content in comparison to other sources
of hay such as clover or oat. Livestock that feed off alfalfa hay benefit by the increased protein
content (Hrbácková et al., 2020).
The desirability of alfalfa’s high nutritional content is inextricably linked to the microbial
community that resides within the plant. Alfalfa can recruit and retain microbial partners to fix
atmospheric nitrogen. All alfalfa varieties can fix nitrogen by forming nodules with the nitrogen
fixing bacterium Sinorhizobium meliloti, directly enabling higher protein content within the plant
regardless of soil nitrogen content (Ebert, 2007; Wagner, 2011). Alfalfa roots exude flavonoids
that S. meliloti sense (Mus et al., 2016, Wagner, 2011). This enables S. meliloti to bind to the
root hairs and produce Nod factors causing the eventual formation of nodules and solidifying the
relationship between alfalfa and S. meliloti. The nitrogen fixation capabilities provided by S.
meliloti expands beyond the direct benefit that alfalfa receives. This is because alfalfa
replenishes available nitrogen to the soil and decreases the need for nitrogen fertilizer
applications for subsequent crops (Hrbácková et al., 2020). However, this is not the case for
other macronutrients required by alfalfa.
Crops of alfalfa are frequently grown with phosphorus and potassium fertilizers, the
most essential plant macronutrients following nitrogen. For alfalfa fields, it is recommended to
apply both in moderation, 50 pounds of phosphorus and 200 pounds of potassium per acre per
year, for optimal harvests (Berg et al., 2005; Lissbrant et al., 2009). While there are microbes
4
that can access potassium and phosphorus in the soil that is frequently unavailable to plants,
these microbes, and the benefits they provide, are understudied in comparison to the research
done on nitrogen fixating organisms (Parmar and Sindhu, 2013). Microbes that can access
insoluble phosphate and potassium sources typically do so by producing organic acids such as
citric, oxalic, and malic acid (Setiawati and Mutmainnah, 2016). These organic acids can lower
the pH of the surrounding soil thereby solubilizing the rock phosphate and potassium present.
Alfalfa, along with a small number of other plants, can also themselves produce organic acids
needed to access these nutrients when the plant is under nutrient limited conditions (Lipton et al.,
1987). Investigating alfalfa and its microbial community will lead to the improved understanding
of these microbial partners. This will help to increase nutrient availability for the plant and
decrease fertilizer use, thereby improving alfalfa’s nutritional composition.
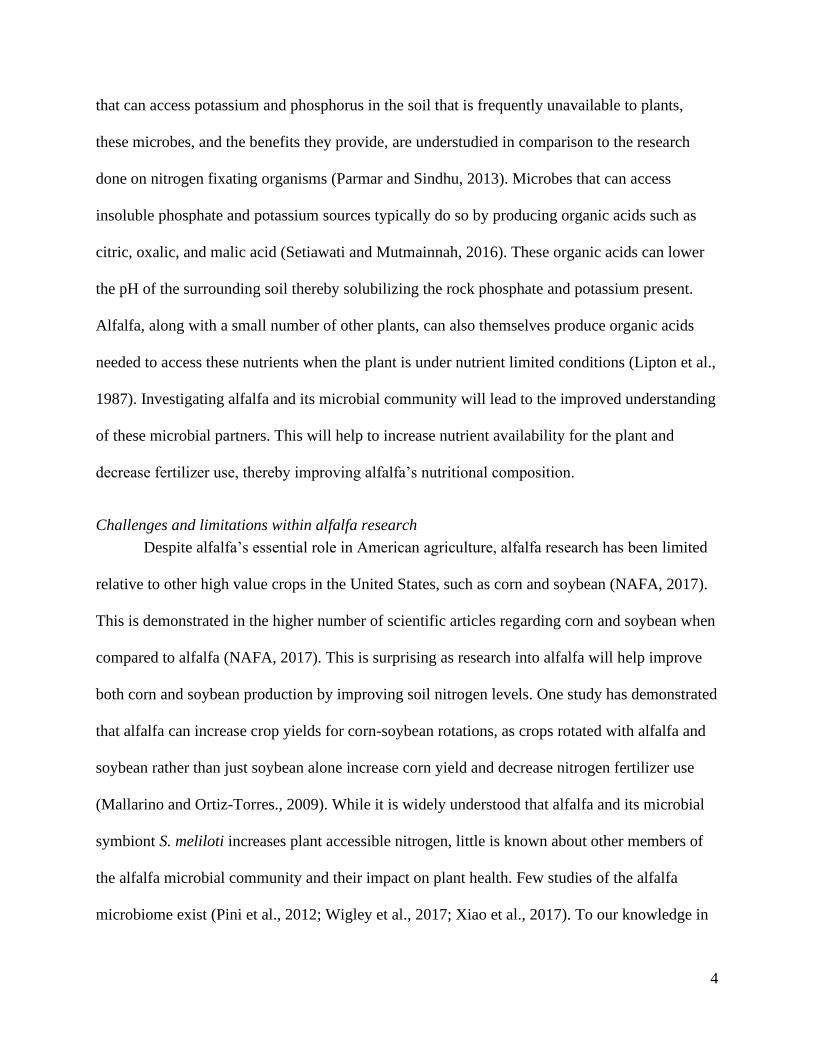
Challenges and limitations within alfalfa research
Despite alfalfa’s essential role in American agriculture, alfalfa research has been limited
relative to other high value crops in the United States, such as corn and soybean (NAFA, 2017).
This is demonstrated in the higher number of scientific articles regarding corn and soybean when
compared to alfalfa (NAFA, 2017). This is surprising as research into alfalfa will help improve
both corn and soybean production by improving soil nitrogen levels. One study has demonstrated
that alfalfa can increase crop yields for corn-soybean rotations, as crops rotated with alfalfa and
soybean rather than just soybean alone increase corn yield and decrease nitrogen fertilizer use
(Mallarino and Ortiz-Torres., 2009). While it is widely understood that alfalfa and its microbial
symbiont S. meliloti increases plant accessible nitrogen, little is known about other members of
the alfalfa microbial community and their impact on plant health. Few studies of the alfalfa
microbiome exist (Pini et al., 2012; Wigley et al., 2017; Xiao et al., 2017). To our knowledge in
5
August of 2020, none of these studies have investigated plants within the United States. One
microbiome study examined only on the nodules of the alfalfa plant, which was found to be
comprised mostly of the well-studied S. meliloti, with less than 1% of sequences aligning to
other genera (Wigley et al., 2017). Alfalfa microbiome research has been also studied indirectly
when sequencing the gut of cattle that feed off alfalfa hay (Ishaq et al., 2017; Sarnataro et al.,
2019). Thus, further research into how alfalfa interacts with its microbial community must be
performed.
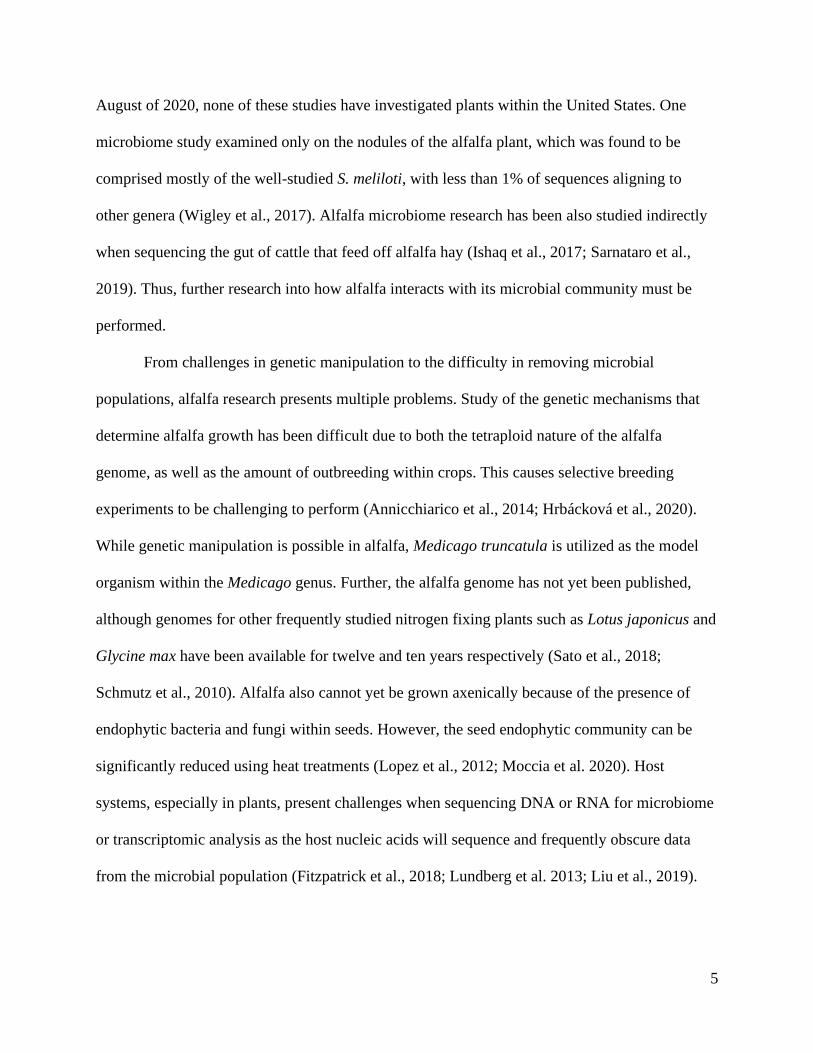
From challenges in genetic manipulation to the difficulty in removing microbial
populations, alfalfa research presents multiple problems. Study of the genetic mechanisms that
determine alfalfa growth has been difficult due to both the tetraploid nature of the alfalfa
genome, as well as the amount of outbreeding within crops. This causes selective breeding
experiments to be challenging to perform (Annicchiarico et al., 2014; Hrbácková et al., 2020).
While genetic manipulation is possible in alfalfa, Medicago truncatula is utilized as the model
organism within the Medicago genus. Further, the alfalfa genome has not yet been published,
although genomes for other frequently studied nitrogen fixing plants such as Lotus japonicus and
Glycine max have been available for twelve and ten years respectively (Sato et al., 2018;
Schmutz et al., 2010). Alfalfa also cannot yet be grown axenically because of the presence of
endophytic bacteria and fungi within seeds. However, the seed endophytic community can be
significantly reduced using heat treatments (Lopez et al., 2012; Moccia et al. 2020). Host
systems, especially in plants, present challenges when sequencing DNA or RNA for microbiome
or transcriptomic analysis as the host nucleic acids will sequence and frequently obscure data
from the microbial population (Fitzpatrick et al., 2018; Lundberg et al. 2013; Liu et al., 2019).
6
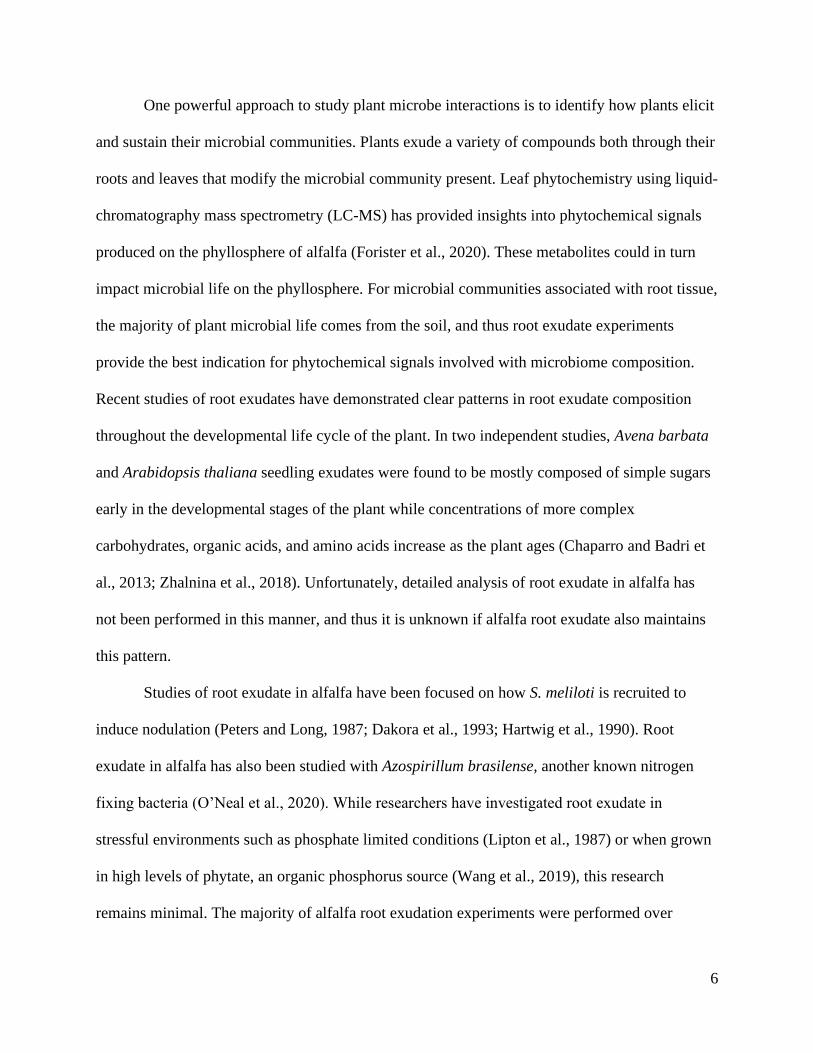
One powerful approach to study plant microbe interactions is to identify how plants elicit
and sustain their microbial communities. Plants exude a variety of compounds both through their
roots and leaves that modify the microbial community present. Leaf phytochemistry using liquid-
chromatography mass spectrometry (LC-MS) has provided insights into phytochemical signals
produced on the phyllosphere of alfalfa (Forister et al., 2020). These metabolites could in turn
impact microbial life on the phyllosphere. For microbial communities associated with root tissue,
the majority of plant microbial life comes from the soil, and thus root exudate experiments
provide the best indication for phytochemical signals involved with microbiome composition.
Recent studies of root exudates have demonstrated clear patterns in root exudate composition
throughout the developmental life cycle of the plant. In two independent studies, Avena barbata
and Arabidopsis thaliana seedling exudates were found to be mostly composed of simple sugars
early in the developmental stages of the plant while concentrations of more complex
carbohydrates, organic acids, and amino acids increase as the plant ages (Chaparro and Badri et
al., 2013; Zhalnina et al., 2018). Unfortunately, detailed analysis of root exudate in alfalfa has
not been performed in this manner, and thus it is unknown if alfalfa root exudate also maintains
this pattern.
Studies of root exudate in alfalfa have been focused on how S. meliloti is recruited to
induce nodulation (Peters and Long, 1987; Dakora et al., 1993; Hartwig et al., 1990). Root
exudate in alfalfa has also been studied with Azospirillum brasilense, another known nitrogen
fixing bacteria (O’Neal et al., 2020). While researchers have investigated root exudate in
stressful environments such as phosphate limited conditions (Lipton et al., 1987) or when grown
in high levels of phytate, an organic phosphorus source (Wang et al., 2019), this research
remains minimal. The majority of alfalfa root exudation experiments were performed over
7
twenty-five years prior and thus were not able to benefit from the current technology that allows
for in depth analysis of phytochemical signals. Further, even when metabolomics is utilized,
multiple time points to investigate how the exudate changes temporally has not yet been
performed the way it has for other plants (Chaparro and Badri et al., 2013; Zhalnina et al., 2018).
Exudation experiments present many challenges, as root exudation is difficult to harvest in soil
systems so many scientists choose to harvest root exudates in aquaponic setups instead (Dakora
et al., 1993; Wang et al., 2019). However, it is known that root exudation is different in aqueous
and soil environments (O’Banion et al., 2019). Regardless of the technique for identifying plant
phytochemical signals, more research is needed to understand how alfalfa interacts within its
microbial community.
One approach towards improving alfalfa research
Despite the challenges, multifaceted approaches to understanding plants within their
environment can significantly move plant research forward. An ambitious grant to study alfalfa
was awarded to our collaborators and is helping to narrow the gaps in alfalfa research. Within
this grant, “The evolution of novel interactions within a network of plant, insect and microbial
biodiversity”, feral alfalfa from sixty different sites across the Great Basin of the United States
have been sampled. Among the many interactions being investigated are alfalfa-microbe, alfalfa
and a frequent herbivorous insect, Lycaeides melissa, and alfalfa within its environment where
alfalfa phytochemistry is used to understand how the plant changes in different environmental
locations. The observation of L. melissa on alfalfa plants is particularly relevant, as L. melissa is
only locally adapted to alfalfa, thus enabling the ability to study biodiversity as it is currently
evolving in plants, insects, and microbes. The reasons for why L. melissa chooses alfalfa on
which to place its eggs rather than its native host, Astragalus canadensis, is not clear as
8
butterflies reared on alfalfa are smaller and less fertile when compared to those on its native host
(Forister et al., 2009; Forister et al., 2013). However, when butterflies are reared on alfalfa, they
are more likely to choose alfalfa than their former host, suggesting that there is a currently
undetected reason for choosing alfalfa. It is known that host preference for L. melissa can be
inherited, potentially indicating that there is an unidentified heritable trait that engenders egg
deposition on alfalfa (Forister et al., 2009). Knowing both the phytochemistry and the
microbiome present within the leaves of the alfalfa plant could help connect the patterns
observed between alfalfa and L. melissa, as well as increase the resolution of understanding of
alfalfa in its environment. Thus, this grant affords the opportunity to shine a light on the
constantly changing interspecies interactions spanning a micro to macro biological scale.
This grant encompasses a number of collaborators from a variety of scientific disciplines.
In doing so, the future results from this project are far beyond any dissertation or paper.
Examining the biodiversity of alfalfa with the biotic and abiotic factors that contribute during its
life will allow for an improved understanding of how alfalfa impacts and is impacted by its
environment. A small portion of this grant is presented within this dissertation, focusing on
designing a framework to understand the interactions that occur between alfalfa and its
assembled microbial community (Figure 1.2). This framework is comprised within the three
research chapters, 1) investigating and determining the best way to sequence the microbial
community in alfalfa 2) utilizing a synthetic community to reveal high plant colonizing microbes
and their interactions under nutrient stress and 3) examining genetic mechanisms that enable one
microbial community member of alfalfa to colonize. In doing so, we lay the groundwork for
future scientists to understand alfalfa and its microbial community in both field and laboratory-
9
based experiments. Further, scientists can utilize this framework to understand other novel plant
host systems.
Chapter 2- Microbiome technologies and their impact on plant microbe research
As we enter the fourth decade of sequencing technology, scientists are inundated with the
volume of data generated. Depending on the instrument, one sequencing run using Illumina
technology can generate 1 million to 1 billion reads from thousands of different organisms or
transcripts (Kozińska et al., 2019). Sequencing the microbial community in any form can paint a
broad understanding of an environment, highlighting the presence of organisms or gene
expression that previously went undetected. As each new technology emerges, from amplicon
sequencing of target genes, to RNA or genome sequencing, hopes billow that this technology
will solve the problems of its predecessor. Once heralded as a comprehensive examination of the
bacterial microbial community, 16S/18S rRNA gene sequencing metrics have fallen out of
fashion as transcriptomic sequencing became more utilized. Why sequence just the 16S rRNA
gene when transcriptomic approaches yields the variety genes that are being expressed?
Proteomic and metagenomic techniques also provide novel insights into host-microbe
interactions by identifying the proteins and genomic DNA present in the system respectfully.
However, no approach is without flaws. Transcriptomic and metagenomic experiments, while
possible in plant microbe research, are hampered by host RNA and DNA sequence
contamination and the difficulty in conserving samples at rural field sites. Further, genes
examined using transcriptomics cannot yield reliable phylogenetic information, as genes being
expressed are under selection. For this reason, plant microbiome research is still commonly
utilized to understand the microbial community.
10
Within plant microbiology, plant microbiome research has been able to elucidate clear,
repeatable patterns across a multitude of plants. The largest and most consistent result is that the
diversity of the microbial community is diminished in internal communities compare to external
communities on the surface of the plant. This pattern has been found in a variety of plants
including the model plant A. thaliana, as well as a plethora of agriculturally relevant plants,
including alfalfa, tomato, rice, and grapevine plants (Lundberg et al., 2012; Bulgarelli et al.,
2012; Xiao et al., 2017; Zarraonaindia et al., 2015; Dong et al., 2019; Yamamoto et al., 2018;
Edwards et al., 2014). Within plant microbe research, the soil is widely considered the
predominate inoculum the plant microbiome as a whole, not just the root tissue that soil directly
interacts with, as many microbes that enter the root are able to colonize the xylem and travel
throughout the plant (Vorholt et al., 2012). According a publication from the Earth Microbiome
Project, which has sequenced a broad array of environments, soil is also known to be one of the
most diverse microbial communities on the planet while the plant corpus is one of the least
(Thompson et al., 2017; Jiao et al., 2018). Understanding how we can go from sampling one of
the most diverse to one of the least diverse microbial communities on the planet in a matter of
millimeters has become a core principal of plant microbiome research.
The soil surrounding the root system of the plant, usually defined as within
approximately 5 mm of the roots, is the rhizosphere. The rhizosphere is the region in which
microorganisms can benefit and be influenced by root exudate (Hiltner, 1904). As microbes
attach to the plant and enter it, they enter the endosphere of the plant and become endophytes,
while microbes that remain on the outside of plant surfaces are known as epiphytes. Once
microbes colonize inside the plant, however, how microbes continue to survive and persist
within the plant is still understudied (de Moraes et al., 2017). Only a select few microbial
11
community members from soil or rhizosphere can colonize within the plant, usually from the
phyla Proteobacteria, Actinobacteria, Firmicutes and Bacteroidetes. Overwhelmingly,
Proteobacteria dominate the microbial community within the plant, frequently comprising over
90% of sequenced reads in microbiome analyses (Pini et al., 2012; Vorholt et al., 2012;
Zarraonaindia et al., 2015, Niu et al., 2017). Thus, as a microbe transitions from the soil
community to life inside of a plant, microbiome studies have revealed the stringency with which
plants control their internal microbial community.
Despite being able to reveal core principles that govern plant microbiology, the
sequencing of the microbial community is still actively being improved in host systems. Every
methodological aspect of sequencing can modify the resulting microbial community observed.
For example, the primers used for sequencing can transform the community members detected.
Currently, there is not a set of universal primers that satisfactorily amplifies all microorganisms.
Even when scientists focus within kingdoms, primers have been shown to overestimate the
abundance of specific taxa and underestimate others (Kovács et al., 2011; Kiss, 2012; Schoch et
al., 2012, Parada et al., 2016). Further, the environment being sequenced, whether it is within a
host or not, can also influence the community, as host DNA can represent a large portion of the
overall reads reducing the quantity and quality of the sequenced microbiome (Terahara et al.,
2011; Sakai and Ikenaga, 2013; Lundberg et al. 2014; Fitzpatrick, et al., 2018). Even PCR
reagents that block host DNA amplification, such as peptide nucleic acids or PNAs, can still
have unintentional biases against the diversity of the environment being sequenced (Jackeral et
al., 2017; Fitzpatrick, et al., 2018).
One of the most commonly used primer sets for the 16S rRNA gene was chosen by the
Earth Microbiome Project, EMP, to detect bacteria and archaea as broadly as possible in the V4-
12
V5 variable region (Gilbert et al., 2010). It should be noted that other primers that amplify other
variable regions, such as V3-V4, are also frequently used (Kilndworth et al., 2013). The EMP
chosen primers, 515F-C and 806R, have a larger bias than a modified 515F-Y when combined
with 926R (Parada et al., 2016). Comparing these two primers sets using mock communities
demonstrated that 515F-C and 806R overestimated bacterial classes such as
Gammaproteobacteria and underestimated both bacterial orders such Pelagibacterales (SAR11),
and archaeal taxa (Parada et al., 2016). Considering this realization, the EMP adopted the
modified 515F-Y primer to be more inclusive (Gilbert et al., 2014). Using 926R allows for
further benefit over 806R by enabling the sequencing of part of the 18S rRNA gene and thus
capturing fungi and other eukaryotes (Parada et al, 2016; Needham et al., 2018). Until recently,
amplicons of eukaryotes were rarely sequenced since the 18S rRNA gene region created by
515F-Y and 926R does not overlap with the standard 2 x 250 or 2 x 300 MiSeq Illumina
sequencing platforms most frequently used in microbiome research (Needham et al., 2018; Lee,
2018). Adding eukaryotes to community composition profiles, while not losing significant
information about the bacterial community or adding additional primers/sequencing costs, has
provided a more extensive view of the marine microbial community (Parada et al., 2016;
Needham et al., 2018). However, these primers need to be tested in a host associated community.
Because we plan to sequence 4,930 endophyte and epiphyte samples generated over two summer
sampling seasons, utilizing one primer set to analyze both eukaryotic and prokaryotic reads could
substantially reduce sequencing costs and improve overall microbiome results by including more
microbial community members in sequencing.
13
Chapter 3- Synthetic communities within plant microbiomes
Over the last decade, emerging sequencing technologies have been used with great
success to reveal the microbial components of diverse hosts and environments. To predictably
recreate and harness microbial communities, however, it is critical not only to identify the
players involved, but also to define the rules of community assembly. Constructing synthetic
communities of cultured representatives of the microbiota is a useful approach to test the
relevance of variables that modulate the plant microbiome (Bodenhausen et al., 2014; Bai et al.,
2015). While larger synthetic communities are predicted to capture a more robust representation
of the genetic diversity, and therefore the potential functions of a plant microbiome assembled in
nature, smaller communities are more easily manipulated to reveal the importance of each
member. For example, larger synthetic communities of 36–38 bacterial members were used to
demonstrate the role of plant-root phosphate stress response and salicylic acid production in
microbial community assembly (Castrillo et al., 2017; Lebeis et al., 2015). However, these
studies did not examine the impacts of individual strains and so the individual contributions of
each member are unknown.
Experiments investigating the individual role of each community member can be
performed by removing or adding members at different timepoints to establish each microbe’s
impact on community structure and its ability to colonize when the microbial community has
been established. An eight-member bacterial synthetic community in Zea mays roots was used to
reveal the influence of each organism on the overall bacterial community composition by
methodically removing one member at a time, a technique known as drop out experiments (Niu
et al., 2017). This approach can be quite powerful, as it was able to identify keystone species
within the 8-member community — organisms whose presence is required to preserve the
overall community structure (Cottee and Whittaker, 2012). Small synthetic communities
14
inoculated onto roots can also have large impacts on a plant’s resistance to foliar pathogens. In a
study investigating the downy mildew pathogen Hyaloperonospora arabidopsidis, three bacteria
were unable to protect the plant when inoculated separately (Berendensen et al., 2018). However,
when inoculated together the three strains were able to induce an immune response to protect the
plant from H. arabidopsidis as well as promote plant growth. Thus, studying synthetic
communities can provide insight into synergistic interactions between microbes unseen when
examining whole microbial communities or individual microbe-plant interactions.
Synthetic community experiments can also provide evidence for hypotheses generated
from phyllosphere microbiome studies that would be impossible to examine in single plant-
microbe experiments. While a large undertaking, one drop out experiment in plants with 62
synthetic community members has been performed (Carlström et al., 2019). In their experiments,
the authors omitted entire classes of Proteobacteria (for example, Alpha-, Beta-, or
Gammaproteobacteria) and allowed the rest of the community to assemble, then added the
omitted group back to the community three weeks later. They observed that once the initial
community was established, community composition was not significantly altered by later
introductions except for when removing Alphaproteobacteria. The experiments presented by
Carlström et al. support the theory that the initial colonizers of the plant microbiome continue to
persist throughout its subsequent maturation, which confirms predictions made by A. thaliana
greenhouse phyllosphere studies (Maignien et al., 2014). Although some late inoculants can
invade the microbial community, no alteration in the established community structure is
detected. Further, it was previously hypothesized that the majority of microbial interactions in
the phyllosphere are positive when within the same kingdom (Angler et al., 2014). The drop out
experiments in Carlström et al. were able to observe specific microbe–microbe interactions for
15
the invading microbes via a network analysis. When doing so approximately 75% of microbe-
microbe interactions were negative. This paints a picture of an intricate web of strain-specific
interactions, which appear to be more supported by competition than collaboration. Overall,
experiments with reduced microbial members can elucidate how plants interact with their
microbial community members and induce specific plant phenotypes.
Synthetic community drop out experiments also illustrate the predictive potential of a
microbial community, as clear patterns between the single-strain dropouts and microbe–microbe
interactions showed consistent interactions (Carlström et al. 2019). It further supports the idea
that the members of a plant microbiome act in a predictable fashion that can be harnessed, as has
been demonstrated previously using synthetic communities in A. thaliana roots (Herrera Paredes
et al., 2018). In this study, researchers were able to predict what combination of microbes would
be able to cause plant phenotypes involving phosphate, such as primary root elongation.
Expansion of this experimental approach to include other plants would provide a more complete
view of the importance of early colonization patterns, and how they shape the plant microbiome
over time. By doing so, scientists will be able to confirm further hypotheses generated from
amplicon sequencing studies and examine interactions between microbes in the host system.
Synthetic community experiments provide ample ideas for future experiments in niche
colonization of other host plants and could help with the generation of consistent and long-
lasting microbial communities in agricultural settings.
Chapter 4-Using genetic techniques to understand microbial colonization of the plant
While synthetic communities can reveal novel microbe-microbe interactions and predict
which microbes are likely high colonizing organisms, individual microbe-plant interactions yield
fruitful research as well. For example, Enterobacter cloacae was found to be a keystone species
16
within a synthetic community study, but single inoculation studies are required to understand
how this organism can modulate the microbial community (Niu et al., 2017). A primary way to
find and outline these interactions is by identifying the underlying genetic mechanisms that
govern them. These mechanisms are widely understudied. While many microbes that promote
plant growth can be purchased for large scale agricultural or personal use, the genetic factors and
mechanistic functions behind why these microbes can increase plant growth are still largely
unknown (Bardin et al., 2015). While microbial interactions with plants are classically defined as
beneficial, pathogenic, or commensal, describing an organism or genera as solely pathogenic or
beneficial can be limiting. Scientists have now found examples of organisms that often exist
along a continuum of pathogenic to beneficial, with various environmental factors pushing
microbes in one direction or the other (Walterson and Stravrinides, 2015).
Pantoea spp. are exemplars of this host-interaction spectrum with isolated strains defined
as growth promoting, pathogenic, and commensal organisms within the context of a variety of
hosts (Walterson and Stravrinides, 2015). The most widely known Pantoea species, P.
agglomerans, promotes plant growth in wheat, rice, and sugar cane (Ruppel et al., 1992; Feng et
al., 2006; Quecine et al., 2012). P. stewartii and P. ananatis both act as plant pathogens in
multiple plant species. P. ananatis can cause center rot in onions, and a variety of diseases on
corn, rice, tomato, watermelon, and Sudan grass (Walcott et al., 2002; Coutinho and Venter,
2009). P. stewartii causes Stewart’s wilt and leaf blight disease on corn as well as jackfruit-
bronzing disease (Roper, 2011; Abidin et al., 2020). P. vagans, however, is a biocontrol agent as
it has been shown to be able to control the plant disease fire blight on apple and pear trees
(Stockwell et al., 2010). What is consistent about Pantoea spp. is that they are thought of as high
colonizers, regardless of where they were isolated, or what they are colonizing (Völksch et al.
17
2009; Nadarasah and Stravrinides, 2014). While known to colonize a variety of organisms,
Pantoea spp. are most consistently isolated as plant endophytes and epiphytes (Walterson and
Stravrinides, 2015).
Understanding the genetic mechanisms that promote Pantoea spp. colonization in plants
will require multiple experimental approaches. Currently, genome wide association studies,
GWAS, are one of the main methods for identifying genes involved with plant colonization and
plant-microbe interactions (Levy et al., 2018). While useful, the results from comparative
genomic studies must be confirmed with traditional genetic approaches such as gene knockouts
or transposon mutagenesis. Generating targeted gene knockouts, while a crucial part of
microbiological research, is a time-consuming and difficult process, even in genetically tractable
model organisms (Chang et al., 2016; Fabian et al., 2020). Transposon mutagenesis, another
common method to generate mutants of interest, is also time consuming, as plant studies must
often screen thousands of mutants to find a phenotype of interest (Yu et al., 2019). However,
these traditional genetic approaches can yield fruitful research. One of the ways that a transposon
library can be screened with ease if an insertion in the gene of interest alters easily observed
colony morphology or provokes a pH mediated color change. Pigmentation in plant-associated
microbes is important for colonization. Pantoea strains that have removed essential carotenoid
genes have been shown to have decreased colonization and virulence (Bible et al., 2016;
Mohammadi et al., 2012) interactions.
Newer genetic techniques, such as randomly barcoded transposon sequencing, known as
RB-TnSeq, enables scientists to examine all potential mutants within one plant by tracking each
mutant with its unique barcode. RB-TnSeq is an improvement of TnSeq because RB-TnSeq
allows for multiple individual experiments to be performed by sequencing the individual
18
barcodes while TnSeq tracks the transposon inserts themselves. To be able to track these unique
barcodes, TnSeq must be performed prior to the use of RB-TnSeq in order to associate each
barcode with its correct transposon insertion. Thus, troubleshooting RB-TnSeq begins with
troubleshooting TnSeq. As both are transposon based, the generation of millions of transposon
mutants happens within a couple hours. Further, the screening of TnSeq mutants is also high
throughput, unlike with traditional transposon mutagenesis, because it is done through
sequencing. Despite the benefits of TnSeq, the methods for this technique are still being
developed, and thus utilizing TnSeq as the main way to study plant microbe interactions is
inherently risky. Based on a study that attempted to perform RB-TnSeq on over 100 strains, their
success rate was less than 32%, highlighting the difficulty of generating a working RB-TnSeq
mutant library (Price et al., 2018). The study focused on strains that were successful and did not
detail what caused the library generation to fail. Thus, further troubleshooting is needed into RB-
TnSeq library generation so that more libraries can be reliably produced.
To our knowledge, only one study has performed TnSeq within the Pantoea genera,
using the aforementioned plant pathogen P. stewartii (Dong et al., 2018). This research was
performed in corn, the plant most afflicted by Steward’s Wilt. The study identified genes
important for survival as well as virulence. In contrast, Pseudomonas, a genera of similar high
colonization potential in plants, that also runs the gamut from beneficial microbe to pathogen,
has had 7 different strains sequenced using TnSeq or similar transposon sequencing methods
such as InSeq (Cole et al., 2017; Mesarich et al., 2017; Helmann et al., 2018; Liu et al., 2018;
Price et al., 2018; Calero et al., 2018; Sivakumar et al., 2019). These studies have revealed that
genes involved with polysaccharide and amino acid biosynthesis and transport contribute to both
root and leaf colonization (Cole et al., 2017; Helmann et al., 2018). Further, 5 strains of S.
19
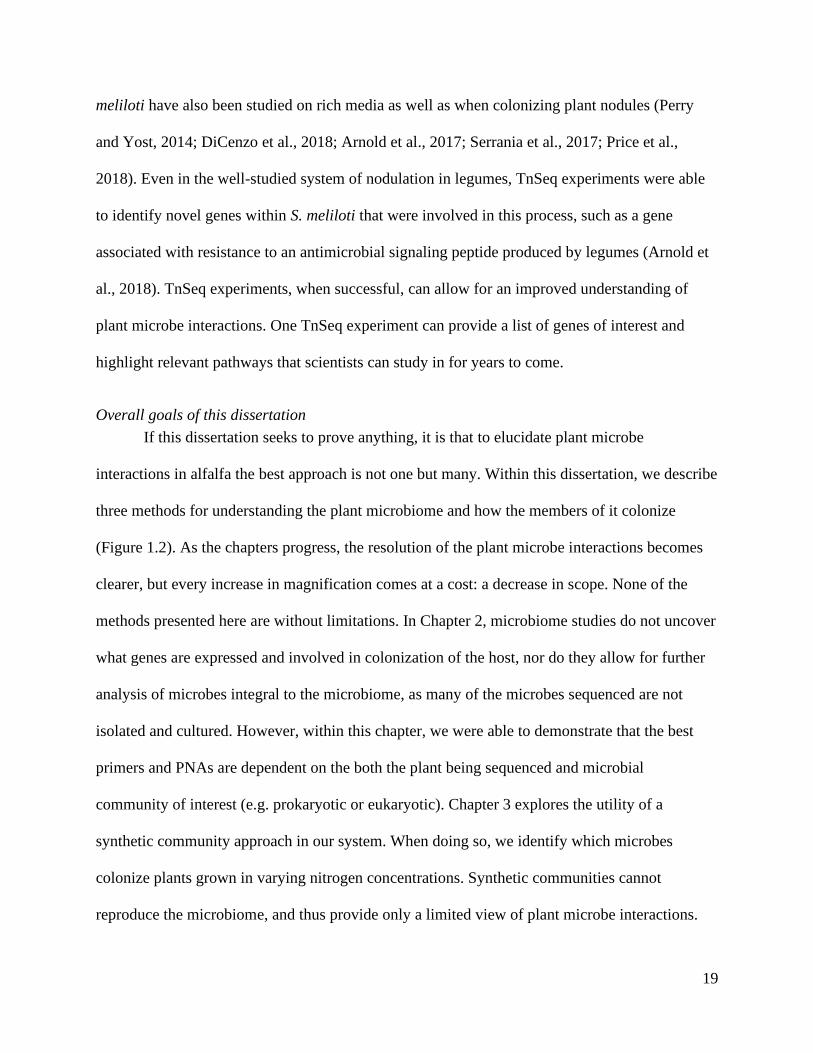
meliloti have also been studied on rich media as well as when colonizing plant nodules (Perry
and Yost, 2014; DiCenzo et al., 2018; Arnold et al., 2017; Serrania et al., 2017; Price et al.,
2018). Even in the well-studied system of nodulation in legumes, TnSeq experiments were able
to identify novel genes within S. meliloti that were involved in this process, such as a gene
associated with resistance to an antimicrobial signaling peptide produced by legumes (Arnold et
al., 2018). TnSeq experiments, when successful, can allow for an improved understanding of
plant microbe interactions. One TnSeq experiment can provide a list of genes of interest and
highlight relevant pathways that scientists can study in for years to come.
Overall goals of this dissertation
If this dissertation seeks to prove anything, it is that to elucidate plant microbe
interactions in alfalfa the best approach is not one but many. Within this dissertation, we describe
three methods for understanding the plant microbiome and how the members of it colonize
(Figure 1.2). As the chapters progress, the resolution of the plant microbe interactions becomes
clearer, but every increase in magnification comes at a cost: a decrease in scope. None of the
methods presented here are without limitations. In Chapter 2, microbiome studies do not uncover
what genes are expressed and involved in colonization of the host, nor do they allow for further
analysis of microbes integral to the microbiome, as many of the microbes sequenced are not
isolated and cultured. However, within this chapter, we were able to demonstrate that the best
primers and PNAs are dependent on the both the plant being sequenced and microbial
community of interest (e.g. prokaryotic or eukaryotic). Chapter 3 explores the utility of a
synthetic community approach in our system. When doing so, we identify which microbes
colonize plants grown in varying nitrogen concentrations. Synthetic communities cannot
reproduce the microbiome, and thus provide only a limited view of plant microbe interactions.
20
However, unlike in microbiome studies shown in Chapter 2 the synthetic community generated
was able to look at each microbe’s impact, giving a deeper understanding of how plants recruit
their microbial community. Further, studying the primers and PNAs for microbial community
composition in Chapter 2 directly influenced the sequencing methodology used in Chapter 3.
Chapter 4 contains multiple genetic approaches designed to examine genes involved with
colonization and plant microbe interactions. The microbe utilized, Pantoea sp. R4, was chosen
because it was identified to colonize to high levels within the synthetic community in Chapter 3.
While Chapter 4 limits the scope to one microbe, it is able to investigate specific genes
hypothesized to be involved in colonization. By doing so, Chapter 4 provides evidence that
carotenoid production does not impact Pantoea sp. R4 colonization. This helps to narrow the
potential reasons for why Pantoea sp. R4 colonizes so well in Chapter 2. Thus, each research
chapter helps to improve the limitations of the others, establishing a framework to understand
microbial interactions within alfalfa. We encourage future scientists utilizing the framework
provided here to study plant microbe interactions from a variety of angles, and cautiously piece
the results of those studies together for a improved view of the whole.
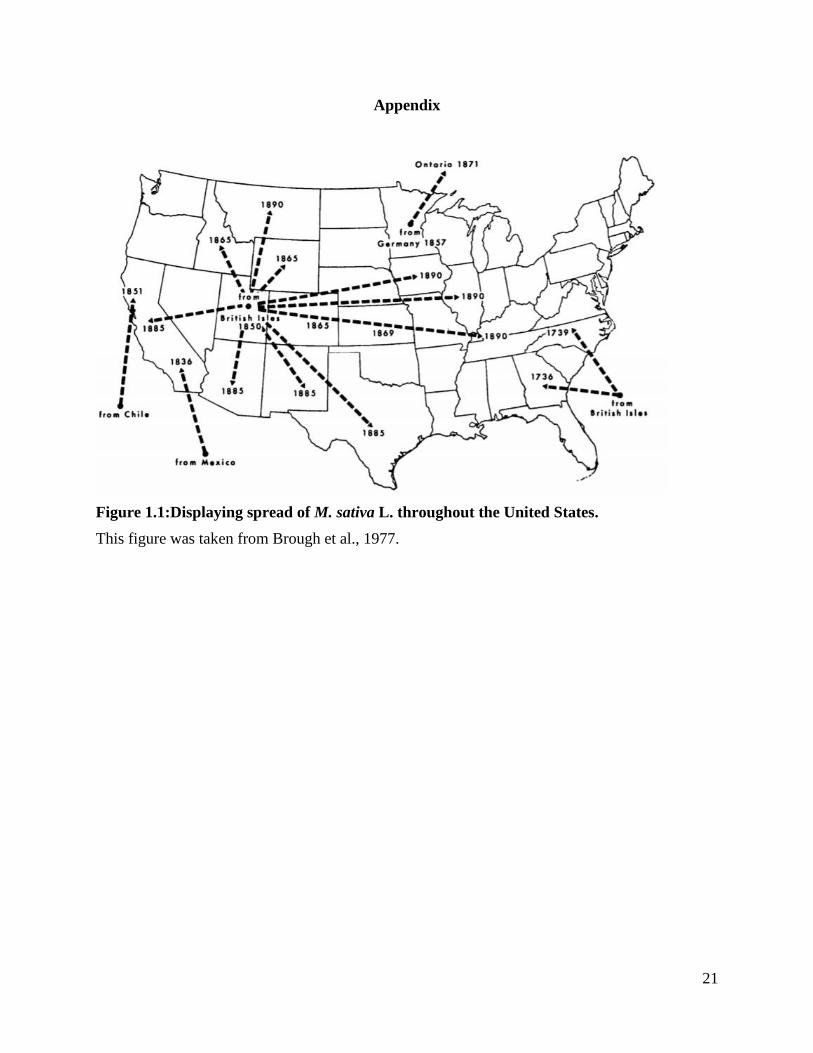
21
Appendix
Figure 1.1:Displaying spread of M. sativa L. throughout the United States.
This figure was taken from Brough et al., 1977.
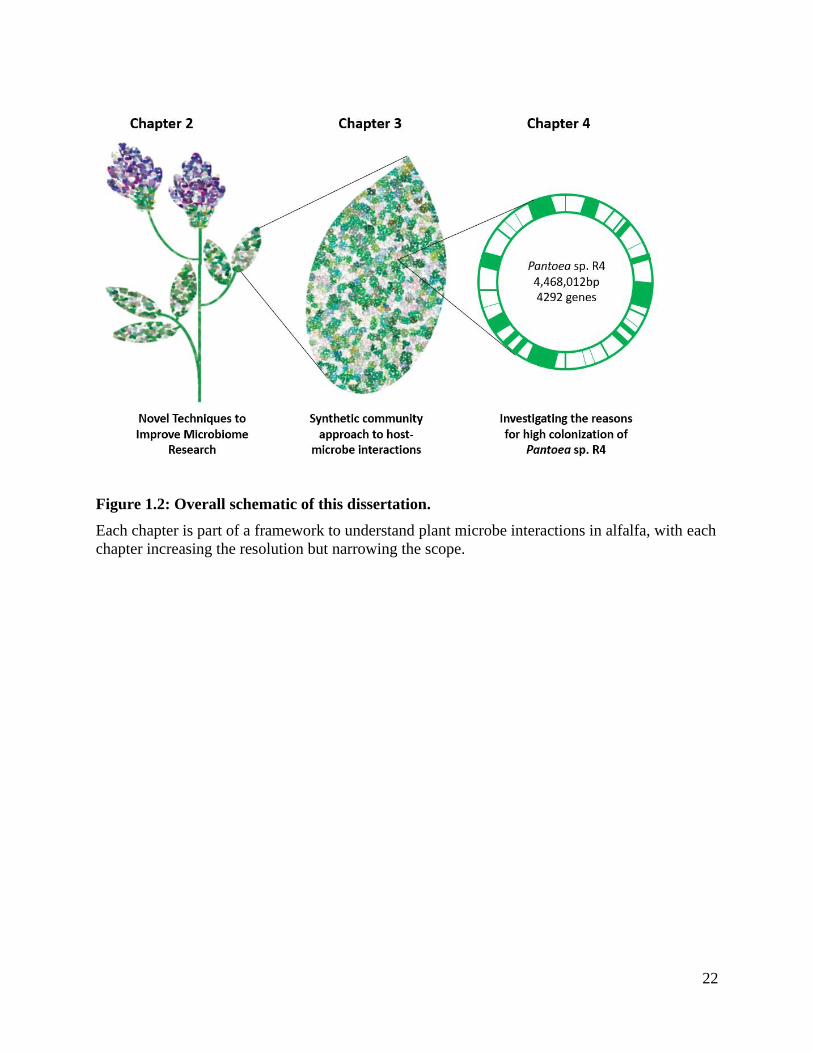
22
:
Figure 1.2: Overall schematic of this dissertation.
Each chapter is part of a framework to understand plant microbe interactions in alfalfa, with each
chapter increasing the resolution but narrowing the scope.

23
CHAPTER 2: OPTIMIZING TECHNIQUES TO
IMPROVE MICROBIOME RESEARCH IN M. SATIVA
24
Chapter Contributions:
This chapter is a version of a peer-reviewed article previously published: Moccia, K., Papoulis,
S., Willems, A., Marion, Z., Fordyce, J., and Lebeis, S. 2020. Using the Microbiome
Amplification Preference Tool (MAPT) to reveal Medicago sativa associated eukaryotic
microbes. Phytobiomes Journal. :PBIOMES-02-20-0022-R.
Katherine Moccia optimized M. sativa homogenization, DNA extraction, 16S/18S/ITS
amplification, and sample processing for 2017 and 2018. Dr. Zachary Marion performed the
2017 and 2018 field sample collection for plants and arthropods. Figure 2 was generated by
Zachary Marion, along with Drs. Matthew Forister, James Fordyce, Chris Nice, and Alex
Buerkle. Katherine Moccia, Andrew Willems, Erin Yi, and Alicia Flores performed 2017 sample
processing. Katherine Moccia and Andrew Willems performed 2018 sample processing.
Katherine Moccia and Dr. Sarah Lebeis selected primers designed the PNA experiments and
wrote the manuscript. Katherine Moccia prepared the amplicon sequencing libraries, generated
both the fungal isolate collection and bacterial isolate collection, and performed neighboring
plant identification. The gPNA was designed by Katherine Moccia, Dr. Spiridon Papoulis, and
Dr. Sarah Lebeis. Dr. Spiridon Papoulis generated and wrote the description for the Microbiome
Amplification Preference Tool (MAPT) and generated the neighboring plant phylogenetic tree.
The bioinformatic analysis of the 18S rRNA and 16S rRNA gene amplicon sequencing was
performed by Katherine Moccia and Andrew Willems. Statistical analysis was performed by
Katherine Moccia under the guidance of James Fordyce. Katherine Moccia generated the figures
and tables with help from Dr. Spiridon Papoulis.
Abstract:
While our understanding of the microbial diversity found within a given system expands
as amplicon sequencing improves, technical aspects still drastically impact which members can
be detected. Compared to prokaryotic members, the eukaryotic microorganisms associated with a
host are understudied due to their underrepresentation in ribosomal databases, lower abundance
compared to bacterial sequences, and higher ribosomal gene identity to their eukaryotic host.
Peptide nucleic acid (PNA) blockers are often designed to reduce amplification of host DNA.
Here we present a tool for PNA design called MAPT, the Microbiome Amplification Preference
Tool. We examine the effectiveness of a PNA, named gPNA, designed to block genomic
Medicago sativa DNA and compared the results with unrelated surrounding plants from the same
location. We applied mPNA and pPNA to block the majority of DNA from plant mitochondria
and plastid 16S rRNA genes, as well as the novel gPNA. Until now amplifying both eukaryotic
25
and prokaryotic reads using 515F-Y and 926R has not been applied to a host. We investigate the
efficacy of this gPNA using three approaches: 1) in silico prediction of blocking potential in
MAPT, 2) amplicon sequencing with and without the addition of PNAs, and 3) comparison with
cultured fungal representatives. When gPNA is added during amplicon library preparation, the
diversity of unique eukaryotic amplicon sequence variants (ASVs) present in M. sativa increases.
We provide a layered examination of the costs and benefits of using PNAs during sequencing.
The application of MAPT enables scientists to design PNAs specifically to enable capturing
greater diversity in their system.
Introduction:
Revealing the full microbial diversity of any environment is challenging. Although the
isolation of novel organisms is essential to the core principles of microbiology, culture-
dependent methods only provide a partial look at the overall diversity present on the planet, even
in highly culturable systems such as plants (Bai et al., 2015; Lloyd et al. 2018; Carini, 2019). At
our current pace of 600-700 newly cultured microbial species per year, some scientists estimate
it will take greater than one thousand years for all microorganisms to be cultured (Yarza et al.,
2014; Rosselló‐Móra, 2012). Culture-independent methods, such as amplicon sequencing,
introduce unintentional biases that also limit the ability to capture the true microbial diversity of
any environment through the choice of primer, DNA extraction protocol and amplicon library
preparation (Kovács et al., 2011; Terahara et al., 2011; Kiss, 2012; Schoch et al., 2012; Lundberg
et al. 2013; Sakai and Ikenaga, 2013; Parada et al., 2016; Fitzpatrick, et al., 2018; Nilsson et al.,
2019).
Definition of the eukaryotic members of microbiomes is widely performed by internally
transcribed spacer (ITS) amplification, which primarily captures fungi (Schoch et al., 2012).
26
While ITS is the commonly accepted taxonomic identification for fungi, it has documented
limitations including taxonomically distinct copies within a single genome and low phylogenetic
resolution (Kovács et al., 2011; Kiss, 2012; Schoch et al., 2012; Nilsson et al., 2008). To uncover
wider eukaryotic membership present in host microbiomes, another sequencing approach is
required. Using primers that amplify both the 16S and 18S rRNA genes, such as 515F-Y and
926R, scientists can capture both prokaryotes and eukaryotes (Parada et al, 2016; Needham et al.,
2018). However, the 18S rRNA amplicons produced by these primers are often excluded from
standard analysis because paired-end reads are usually too short to produce reads that overlap
(Needham et al., 2018). Recent bioinformatic developments now enable scientists to analyze
these reads without overlap, allowing the recovery of eukaryotic and prokaryotic reads with a
single primer set (Needham et al., 2018; Lee, 2019). The study of eukaryotic members of host-
associated microbiomes is clouded by the vast abundance of host DNA and the lack of microbial
eukaryotic representatives in sequence databases (Fitzpatrick et al., 2018; Lundberg et al. 2013;
Bai et al., 2017; Liu et al., 2019). While there are primers specific to the 18S rRNA gene (Liu et
al., 2019), the addition of eukaryotes to community composition profiles without losing
information about the bacterial community in a single amplicon library have provided a more
extensive view of marine microbial communities (Parada et al., 2016; Needham et al., 2018).
Within the context of the plant microbiome, 515F-Y and 926R have never been used to
intentionally isolate eukaryotic reads. Utilizing this primer set would allow the capture of protists
and oomycetes, which standard ITS primers were not designed to amplify (Schoch et al., 2012).
While multiple 16S rRNA gene PNAs were designed to block DNA from plant organelles, to our
knowledge no PNA has been designed to bind to the 18S rRNA gene present in the plant genome
(Lundberg et al., 2013; Fitzpatrick et al., 2018; Lefevre et al., 2020). 18S rRNA gene PNAs have
27
been introduced successfully in other hosts such as mosquitoes and shrimp (Belda et al., 2017;
Liu et al., 2019). However, it remains unclear if this approach will be successful in detecting
eukaryotic members of a plant microbiome.
The development of PNAs that bind to host DNA to block PCR amplification and thus
increase microbial sequencing reads has been used for decades (Ørum et al., 1993; von
Wintzingerode et al., 2000; Lundberg et al., 2013; Belda et al., 2017; Lefevre et al., 2020). The
most widely used PNAs were designed specifically to block amplification of plant 16S rRNA
genes within Arabidopsis thaliana mitochondria and plastids (mPNA and pPNA), although other
plants were queried for exact matches after PNA design was completed (Lundberg et al., 2013).
While mPNA and pPNA have since been used quite broadly to block DNA from organelles in
other plants, it does not inhibit all plant DNA equally, which was predicted in the initial paper
(Lundberg et al., 2013). In fact, recent studies suggest that the design and use of a PNA must be
specific to each host organism for effective plant DNA binding and subsequent blocking of
amplification (Fitzpatrick et al., 2018). While the desire for more robust PNAs is present, a
flexible and easy design tool is still required.
The Earth Microbiome Project (EMP) highlighted that host-associated microbial
communities are less diverse than their surrounding free-living microbial communities, both in
the number and abundance of each unique sequence, with the plant corpus as one of the least
diverse microbial environments (Thompson et al., 2017). Further, a study using a combined
approach of whole genome shotgun sequencing and amplicon analysis found bacterial reads to
be 90% of microbial reads within the A. thaliana microbiome, leaving eukaryotic microbes only
the remaining 10% (Regalado et al., 2020). Regions of the plant differ in host contamination
when sequencing, as aboveground green tissue is known to have higher concentrations of DNA
28
than other plant regions (Arenz et al., 2015; de Souza et al., 2016). Due to this decreased
microbial diversity and presence as well as the high abundance of host DNA, host ribosomal
gene amplification must be prevented to enable examination of the eukaryotic members of the
plant microbiome. Ideally, a PNA designed for the 18S rRNA gene would not interfere with
amplification of fungi, Peronosporomycetes (oomycetes) and Cercozoan protists, which are all
crucial members of the soil, phyllosphere, and endosphere of plants (Mcghee and Mcghee, 1979;
Di Lucca et al., 2013; Geisen, 2016; Ploch et al., 2016; Berney et al., 2017;
Jaskowska et al., 2015; de Araujo et al., 2018; Schwelm et al., 2018).
Within this chapter is the design and implementation of various methods to best study the
M. sativa plant microbiome for both prokaryotic and eukaryotic microorganisms. This includes
initial laboratory experiments required to obtain best practices for epiphyte and endophyte
separation, DNA extraction, and PCR amplification as well as the in-depth methodology for
performing high throughput sample processing for almost 5,000 plant samples. To investigate the
microbial communities within our samples, we used two main primer sets: one within the V3-V4
variable region (341F and 785R), and one within the V4-V5 variable region (515F-Y and 926R).
As the latter region allows for amplification of the eukaryotic microbial population, we designed
a PNA to block M. sativa 18S rRNA gene sequences to improve the diversity of the microbial
eukaryotes present. We present a PNA designer called the Microbiome Amplification Preference
Tool, MAPT, that allows researchers to: 1) download both the sequences desired to be blocked
as well as amplified, 2) align the DNA region amplified by selected primers, 3) find the region
with the least similarity and 4) identify which organisms are at risk for unintentional
amplification blockage. This enables researchers to design their own PNA with greater ease and
to predict which organisms might have reduced detection with the addition of PNAs during
29
amplicon library preparation. MAPT can be used with any host and environmental microbial
community with representatives present in the SILVA database or with any potential FASTA
sequences. Our novel 18S rRNA gene PNA, which we refer to as gPNA, was tested in the M.
sativa phyllosphere and was able to sequence eukaryotic members of the host-microbe system.
Materials and Methods:
Plant material collection and organization
For types of samples: feral M. sativa, feral plants within the same area as M. sativa,
known as neighboring plants, and soil were stored at 4°C and shipped on ice from locations
across the Western United States (Figure 2.1). Feral plants are defined here as plants that were
grown without human interference and cultivation. On average 30 M. sativa plants, 10
neighboring plants, and 5 soil samples in Whirl-Pak bags (Consolidated Plastics) arrived from
each site. 34 sites arrived from June 16th to September 19th in 2017 at the University of
Tennessee and 24 sites arrived to the Buerkle laboratory at the University of Wyoming in 2018.
For the 2017 samples, the number of samples, the day of arrival, the day of processing
and the approximate temperature of the samples was recorded on arrival. All samples were
processed, meaning they were separated into endophytic and epiphytic enriched material and
were ready for DNA extraction, within 2 days of arrival. On the occasion that one or more of the
45 samples were not present in the shipment, the samples missing were recorded with an X.
When a sample was lost due to potential contamination, such as the WhirlPack container being
punctured, these samples were also marked with an X and an explanation of where the
contamination occurred during the process. Sample sites were given a symbol to distinguish
them from other sites that were being processed at the same time, and to greatly reduce the
likelihood of one site becoming confused with another. Once the sample was extracted whether
the extraction was performed in an individual tube or on a 96 well plate, was recorded. When in
30
a 96 well plate, the plate number was recorded. Each plate schematic was also recorded, and
color coded by site number and sample material. When extracted individually in a tube, each
tube was placed in a freezer box with all other samples extracted from tubes for that site, with the
site number labeled on the outside of the freezer box. A master excel file containing all this
recorded information can be found within the Lebeis Lab computer under the file “Key for 2017
Sampling Trip”.
For the 2018 sample material, all samples were instead shipped to Laramie, WY to Dr.
Alex Buerkle’s lab at the University of Wyoming. Organization was the same except for the
following modifications (Figure 2.2). Each sample site had a letter attached to it, with the first
sample site as letter A and so on. For this reason, much of the material was shipped in advance of
arrival. For example, all necessary tubes were sterilized, labeled, and shipped so that on arrival
enrichments could be performed in the most time efficient matter. A master excel file containing
all this recorded information can be found within the Lebeis Lab computer under the file “Key
for 2018 Sampling Trip”.
Separation of epiphyte and endophyte material
The separation of endophyte and epiphyte samples were performed based on the methods
outlined in Shade et al., 2013, although modifications were made to process samples in a high
throughput manner. Everyday workstations were created for each of the people (1-4 people)
processing the plant material. A workstation contained: a metal or ceramic basin, scissors,
forceps, 95% ethanol in a 50 mL tube, 95% ethanol in a spray bottle, paper towels, an ice bucket
halfway filled with ice, 96 well racks labeled with the site number, 85 tubes labeled with the
number and type of sample as well as any symbol for that site, and a scale. All plant and soil
samples arrived on ice and were immediately flash frozen with liquid nitrogen prior to
31
processing to ensure low temperature throughout the separation. After flash freezing samples
were placed in an ice bucket with ice for the duration of the process. Each sample weighed to
0.25 grams and placed in an Eppendorf tube (+/- 0.01 gram). Leaves and flowers were removed
from the plant using sterile scissors and forceps. These scissors and forceps were also flame
sterilized in between each sample. Ceramic or metal basins were used to cut plant material in a
sterile manner. Between each sample, basins were wiped with a paper towel wet with ethanol.
Each basin was further sterilized between each sample site using flame sterilization. Ideally
flame sterilization of basins would be done between each sample rather than each site, but safety
and time prohibited this measure. While the plant samples were sent with all aboveground plant
material, only leaves and flowers were used for M. sativa samples. This was performed
whenever possible for neighboring plants as well, although the neighboring plants were more
variable in their shape and sometimes stem material was used to reach the 0.25 gram weight.
Once all the samples from a site had been weighed, 500 μl of 1x PBS with 0.15% Tween
20 was added to each plant sample to perform epiphyte enrichment. Samples were shaken in the
cold room or in an incubator at 4°C and 150 RPM for 20 minutes. Each Eppendorf tube was
submerged in fresh water within a bath sonicator (Branson UltraSonic Cleaner) and sonicated for
5 minutes to remove epiphytic microbial cells. The supernatant was then transferred to a new
Eppendorf tube using a pipette and on average 400-450 of the 500 μl was recovered. There is an
optional centrifugation step where epiphyte enriched samples can be spun down for 30 minutes
at 6500 and 4°C to confirm the presence of pelleted cells. 750 μl of Powerbead solution from
Qiagen kit was added to each epiphyte enriched sample as well as all soil samples. These
samples were placed in the fridge at 4°C until DNA extraction could be performed. The
remaining endophyte enriched samples were lyophilized overnight. The next day each endophyte
32
enriched sample was weighed to 0.04 grams and placed in a new 2 mL Eppendorf tube with a
flat bottom (conical tubes cannot be used as homogenized plant material is difficult to remove
from these tubes). Endophyte enriched M. sativa samples were homogenized for 1 minute or less
in Geno/Grinder 2010 (SPEX SamplePrep) with approximately 20 garnet beads per tube. After 1
minute, resulting endophyte enriched samples were pulverized to a powder. Endophyte enriched
neighboring plant samples sometimes required additional time to become homogenized and
spent up to 15 minutes in the Geno/Grinder. Once homogenized, the samples could be added to a
96 well plate for immediate DNA extraction or place at 4°C with 750 μl of Powerbead solution.
The remaining lyophilized plant material was stored at -80°C.
Because all 2018 samples were shipped to the University of Wyoming, the arrival date of
samples was unknown as all samples had been placed into a -80°C freezer until separation.
Endophyte samples were not homogenized after lyophilization as there was not Geno/Grinder
present. Powerbead solution was not added to the samples as DNA extraction was not performed
with a few days of separation. For samples sequenced replicate numbers ranged from 4-10 for all
epiphyte and endophyte enrichments for both M. sativa and neighboring plants, for a combined
total of 8-20 samples per PNA treatment (Table 2.1).
M. sativa homogenization
We tested homogenization using fresh plant material and lyophilized plant material.
Fresh plant material was weighed to 0.25 grams and place in an Eppendorf tube with
approximately 20 garnet beads. Fresh plant material was homogenized for 40 minutes in the
Geno/Grinder 2010 (SPEX SamplePrep) at an RPM of 1500 (Figure 2.3A). Plant material to be
dried was weighed to 0.25 grams when fresh in an Eppendorf tube. The cap of the tube was
punctured with heated metal forceps to make a small hole for proper lyophilization. Tubes were
33
then frozen in liquid nitrogen and placed on a FreezeZone Lyophilizer (Labconco) overnight at a
temperature of at least -25°C and 0.22 mBar, although lower temperature and pressure does not
impact the sample. After lyophilization, samples were placed in new Eppendorf tubes using
sterile forceps then homogenized the same way as the fresh material (Figure 2.3B).
Optimization for DNA extraction from M. sativa and 16S/ITS amplification
Two kits were tested for optimal DNA extraction, PowerPlant (MOBio, the same kit is
now available as the DNeasy Plant Pro Kit from Qiagen) and DNeasy PowerSoil Kit (Qiagen).
Plant material was lyophilized and homogenized prior to DNA extraction as specified above.
Plants were weighed following lyophilization to 0.01, 0.02, 0.03, 0.04 and 0.05 grams. In our
experience lyophilization reduces plant biomass by roughly 85%. Thus, 0.01 grams of
lyophilized plant material results from approximately 0.066 grams of fresh weight. Both the
PowerPlant and the DNeasy PowerSoil Kit were extracted according to their respective
protocols. Extracted DNA concentration was measured using both a Nanodrop 2000
(Thermofisher) and a PicoGreen assay. Previous laboratory experiments indicated that DNA
concentrations ≥5 ng/μl correlate with successful PCR amplification, so samples with greater
than 5 ng/μl were deemed successful. Using this threshold 30% of PowerPlant DNA extractions
were successful, while 69% of DNeasy PowerSoil extractions were successful (Table 2.2).
The extracted DNA at each weight was amplified using 16S rRNA and ITS primers to amplify
bacterial and fungal DNA, respectively. After PCR amplification, the samples were run on a 1%
agarose gel. Samples with a positive band of the correct size, ~300 base pairs for 16S and 250-
300 base pairs for ITS, were deemed successful (Table 2.2). Once homogenization, extractions
and PCR amplifications were successful, we could focus on blocking the M. sativa host DNA to
best examine microbial prokaryotes and eukaryotes.
34
Creating the Microbiome Amplification Preference Tool (MAPT) and genomic Peptide Nucleic
Acid (PNA) for M. sativa
Because we were interested in exploring both prokaryotic and eukaryotic members of the
M. sativa microbiomes, we generated a tool that would enable us to design a PNA to block
genomic 18S rRNA gene amplification. MAPT (https://github.com/SEpapoulis/MAPT) is a
python module utilizing the publicly available data in SILVA, a high quality ribosomal RNA
database (https://www.arb-silva.de), to streamline the process of PNA development. SILVA was
used as it a comprehensive database for all three domains of life, with over 9 million small
subunit rRNA sequences (Yilmaz et al., 2014). Upon initialization, SILVA FTP servers are
automatically queued for download, where users can specify if the ‘parc’, ‘ref’ or ‘nr ref99’
datasets should be queued. After download, a local database is compiled for index-based
searches using SILVA accessions, where sequence indexes are automatically organized under a
taxonomic tree for convenient and rapid taxonomic searches. Using the SILVA database is
optional, and users can alternatively specify sequences by providing their own FASTA files.
To select our PNA sequence to prevent host amplification, we performed a multiple
sequence alignment for all M. sativa 18S rRNA genes available on SILVA version 132 to
generate a consensus sequence. We aligned the M. sativa 18S rRNA gene consensus to all fungal
sequences, as well as those from Peronosporomycetes (oomycetes) and Cercozoa sequences in
the SILVA database using MAPT. We chose fungi, as well as the protists Peronosporomycetes
(oomycetes) and Cercozoa since all were found in prior sequencing efforts in plant eukaryotic
microbiome studies (Ploch et al., 2016; de Araujo et al., 2018; Schwelm et al., 2018). We note
that Peronosporomycetes were reclassified, but the term oomycetes is still commonly utilized so
we include it within this study in parentheses for clarity (Dick et al., 1999; Slater et al. 2013).
Our PNA design was based on the methodology found in Lundberg et al., 2013. We aligned the
35
primers 515F-Y and 926R to the full 18S rRNA genes to extract the expected region amplified
by our primer pair. Sequences were fragmented in silico into k-mers of 9 to 12 bases in length
and aligned to the M. sativa sequence. We measured the total number of mapped k-mers to a
specific DNA region (Figure 2.4A). Our PNA sequence is the complement of the target sequence
to allow binding as PNAs can bind parallel or antiparallel (Soomets et al., 1999). We chose the
region with the lowest identity to fungi and the two protist taxa that also satisfied custom PNA
oligo guidelines (PNA Bio). Briefly, the PNA guidelines advised that the sequence be: 1) less
than 50% overall purine bases with no purine stretches more than 6 bases, 2) less than 35%
overall guanine bases, 3) without significant complementarity to reduce the likelihood of
hairpins, and 4) shorter than 30 bases in length. Our resulting sequence, which was 12 base pairs
long, was sent to PNA Bio to be created and quality tested.
The core design to MAPT follows a similar protocol to previous PNA design strategies
with slight modifications (Lundberg et al., 2013). DNA sequences from potential community
members are cut into k-mers, or k-mer sized DNA fragments, and mapped to exact matches in
the host DNA sequence. Users can specify primers for in silico amplification of all sequences
provided before k-mers are generated and mapped. We note that the efficacy of a PNA changes
depending on the primer set used as different primers will result in different distributions of k-
mers. This prediction capability in MAPT could improve sequencing results and allows users
greater flexibility. Our in-silico amplification does not support degenerate k-mer mapping
because exact matches to primers are required to be considered for subsequent k-mer analysis.
However, any discarded sequences are reported for clarity in PNA design. To ensure that the
underlying algorithms of our module were operating as intended, we recapitulated the mPNA
and pPNA sequence selection and alignments using the Greengenes 16S rRNA dataset that was
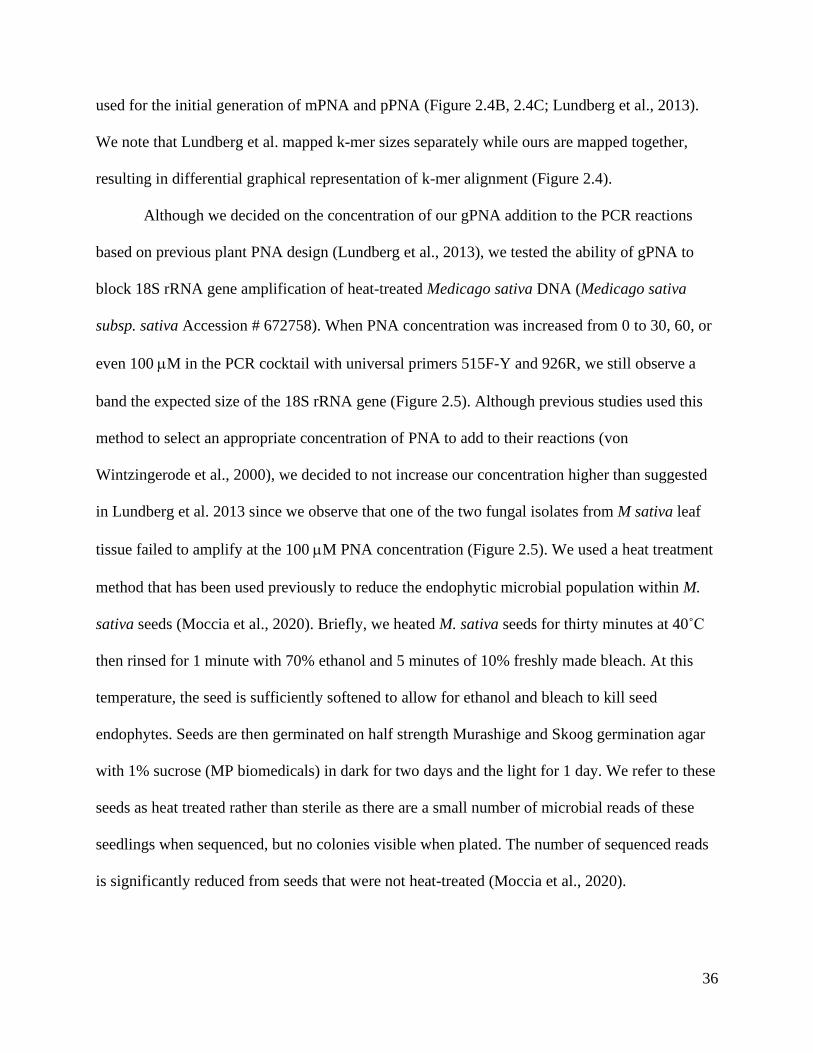
36
used for the initial generation of mPNA and pPNA (Figure 2.4B, 2.4C; Lundberg et al., 2013).
We note that Lundberg et al. mapped k-mer sizes separately while ours are mapped together,
resulting in differential graphical representation of k-mer alignment (Figure 2.4).
Although we decided on the concentration of our gPNA addition to the PCR reactions
based on previous plant PNA design (Lundberg et al., 2013), we tested the ability of gPNA to
block 18S rRNA gene amplification of heat-treated Medicago sativa DNA (Medicago sativa
subsp. sativa Accession # 672758). When PNA concentration was increased from 0 to 30, 60, or
even 100 M in the PCR cocktail with universal primers 515F-Y and 926R, we still observe a
band the expected size of the 18S rRNA gene (Figure 2.5). Although previous studies used this
method to select an appropriate concentration of PNA to add to their reactions (von
Wintzingerode et al., 2000), we decided to not increase our concentration higher than suggested
in Lundberg et al. 2013 since we observe that one of the two fungal isolates from M sativa leaf
tissue failed to amplify at the 100 M PNA concentration (Figure 2.5). We used a heat treatment
method that has been used previously to reduce the endophytic microbial population within M.
sativa seeds (Moccia et al., 2020). Briefly, we heated M. sativa seeds for thirty minutes at 40˚C
then rinsed for 1 minute with 70% ethanol and 5 minutes of 10% freshly made bleach. At this
temperature, the seed is sufficiently softened to allow for ethanol and bleach to kill seed
endophytes. Seeds are then germinated on half strength Murashige and Skoog germination agar
with 1% sucrose (MP biomedicals) in dark for two days and the light for 1 day. We refer to these
seeds as heat treated rather than sterile as there are a small number of microbial reads of these
seedlings when sequenced, but no colonies visible when plated. The number of sequenced reads
is significantly reduced from seeds that were not heat-treated (Moccia et al., 2020).
37
Amplicon library preparation and sequencing
The PCR reactions for the primer pair 515F-Y and 926R contained 2.5 µl of DNA (10
ng), 2.5 µl of 3 PNA mixture (mPNA to block the mitochondrial 16S rRNA gene, pPNA to block
the plastid 16S rRNA gene, and gPNA to block the genomic 18S rRNA gene, 30μM total), 12.5
µl of Hifi Hotstart Master Mix (KAPA Biosystems), and 5 µl of each primer (0.2μM). The
primer pair 515F-Y and 926R was used with the conditions defined in Parada et al., 2016 with an
added 10 second addition before the primer annealing step to allow PNA binding in all PCR
protocols used for sequencing. The conditions were as follows: 3 minutes at 95˚C, then 25 cycles
of 95˚C for 45 seconds, 78˚C for 10 seconds, 50˚C for 45 seconds, 68˚C for 90 seconds and a
final 68˚C for 5 minutes.
The primer pair 341F and 781R was used to amplify in according to the conditions
defined in Illumina’s 16S Metagenomic Sequencing Library Preparation only modified by the
same 20 second addition for PNA annealing as above. The conditions were as follows: 3 minutes
at 95˚C, then 30 cycles of 95˚C for 30 seconds, 78˚C for 10 seconds, 55˚C for 30 seconds, 72˚C
for 30 seconds and a final 72˚C for 5 minutes.
ITS reactions contained 2.5 µl of DNA, 2.5 µl of 3 PNA mixture (16S mPNA, 16S pPNA
and 18S gPNA), 12.5 µl of Hifi Hotstart Master Mix (KAPA Biosystems), and 0.83 µl of each of
the six forward primers, and 2.5 μl of the two reverse primers. These primers amplified the ITS2
variable region. The conditions were as follows: 3 minutes at 95˚C, then 25 cycles of 95˚C for 30
seconds, 78˚C for 10 seconds, 55˚C for 45 seconds, 72˚C for 30 seconds and a final 72˚C for 5
minutes.
For all primers, the samples with no PNA addition had sterile water added in lieu of
PNA. The samples with 2 PNAs contained 2.5 µl of the 2 PNA mixture (mPNA and pPNA) with
the same total concentration of the mPNA and pPNA as in the samples with all 3 PNAs (30 μM).
38
While the mPNA and pPNA were designed specifically for A. thaliana, both were predicted by
Lundberg et al., 2013 to block M. sativa organelle amplification. Further, we utilized mPNA and
pPNA in a previous study to minimize M. sativa contamination in our 16S rRNA gene amplicon
sequencing protocol (Moccia et al., 2020). Because we are using universal 16S rRNA primers to
capture 18S rRNA genes, we decided to add mPNA and pPNA in addition to gPNA. All
oligonucleotides used in amplicon sequencing are listed in Table 2.3.
All samples were visualized on 1% agarose gels subsequently cleaned with Agencourt
AMpure XP Beads (Beckman Coulter) according to the protocol from Illumina. 20 µl of beads
were added to each PCR sample and mixed by pipetting for 30 seconds per sample prior to a 10
minute incubation. Beads with bound DNA were placed on a magnetic stand for approximately 5
minutes until solution was clear and the supernatant was removed. Samples were washed with
80% fresh ethanol twice. 52.5 µl of 10 mM Tris HCl (Qiagen) was added to each sample. Tris
HCl was mixed by pipetting for 30 seconds per sample. Samples were vortexed at 1800 RPM,
then incubated for 5 minutes on the magnetic bead stand. 49-50 µl of cleaned DNA was pipetted
off, leaving all magnetic beads adhered to the stand.
All primers received the same index PCR reactions. Index PCR reactions contained 5 µl
of DNA, 5 µl of Nextera XT Index Forward Primer (Illumina), 5 µl of Nextera XT Index
Reverse Primer (Illumina), 25 µl of KAPA Hifi Hotstart ReadyMix (KAPA Biosystems), 10 µl
of PCR grade water, and 2.5 µl of 3 PNA mixture. For the first reaction, the 2 PNA and 0 PNA
samples alternatively contained the 2 PNA mixture and sterile water substitutions. The PCR
protocol is as follows: 95˚C for 3 minutes, then 8 cycles of 95˚C for 30 seconds, 78˚C for 10
seconds, 55˚ for 30 seconds, 72˚C for 30 seconds and a final 72˚C for 5 minutes. All samples
were again visualized on 1% agarose gels then cleaned with Agencourt AMpure XP Beads
39
(Beckman Coulter) according to the protocol above, with only the modification of 56 µl of beads
to 50 µl of PCR product and an final elution volume of 27.5 µl of Tris HCl to end the cleaning
process with 24-25 µl of DNA. All samples were quantified using a Nanodrop 2000
(Thermofisher) then pooled in sets of 8 based on nanodrop results for approximately 500 ng per
pool. Once pooled, samples were submitted to the University of Tennessee Genomics Core for
analysis a Bioanalyzer High Sensitivity Chip (Agilent Technologies). Samples using 515F-Y and
926R primer were run on the Pippin Prep (Sage Science) to remove small <80 base pair
fragments on a 1.5% agar gel with the ranges for collection set at 525-875 base pairs. ITS and
16S rRNA 341F and 785R primer samples did not require Pippin Prep as there were no small
base pair fragments visible with the bioanalyzer. Pooled samples were cleaned once more with
magnetic beads prior to sequencing with the same protocol as above. All samples were
sequenced using Version 3, 600 cycle (2 X 300) kit on the Illumina MiSeq platform. Sequences
have been submitted to the European Nucleotide Archive (ENA) at the European Molecular
Biology Laboratory (EMBL) under the title “Eukaryotic Members of the Plant Medicago
Sativa”. These sequences can be found at under the primary accession PRJEB36800.
16S rRNA gene analysis for both V3-V4 and V4-V5 primers
All samples were first visualized in the application FASTQC (Babraham Bioinformatics)
to ensure that the reads coming off the MiSeq were of high quality. Over 83% of the reads had a
median Q-score ≥ 30. After inspection with FASTQC, appropriate trimming and truncating
parameters were determined. All samples were trimmed by 10 nucleotides and truncated at 250
nucleotides in length. Once these parameters were determined all samples were processed in
QIIME2 version 2018.11 (Bolyen et al. 2018). Specifically, the samples were processed by the
DADA2 denoise-paired plugin in QIIME2 which uses the DADA2 version 1.6.0 R package
40
(Callahan et al 2016). Following generation of an amplicon sequence variant (ASV) table basic
diversity metrics were generated using QIIME2’s diversity core metrics-phylogenetic plugin.
The ASV table and diversity data were then imported into R version 3.5.2 (R Core Team 2018)
where they were further analyzed using a variety of microbiome focused R packages including
tidyverse, vegan, and qiime2R. For the V3-V4 primers, a total of 6,292,470 16S rRNA paired-
end MiSeq reads were generated from 62 samples. They had a median number of 71,664 reads
per sample. The set contained 22,074 ASVs. These values represent the reads that were
successfully able to be quality filtered, denoised, merged,
Separation of 18S rRNA gene amplicon reads
Because the 18S rRNA gene region amplified by 515F-Y and 926R is too long to overlap
on a 2 X 300 paired-end sequencing run, additional bioinformatic steps were required to recover
these reads. The protocol for separation of eukaryotic amplicon reads was from Happy Belly
Bioinformatics (Lee, 2019). Briefly, we downloaded and modified the Protist Ribosomal
Reference (PR2) database (Guillou et al., 2012). After modifying the PR2 database by formatting
the FASTQ files, we used the NCBI’s Magic-BLAST application (Boratyn et al., 2018) to create
a custom database. Following creation of the database, the 515F-Y and 926R primers were
trimmed from all samples using the BBDuk tool (JGI) and all reads that were shorter than 250
base pairs were filtered out as these were likely to be bacterial sequences. The remaining samples
were blasted using Magic-BLAST. Both forward and reverse reads were filtered with the
requirements that > 35% of the query sequence aligned within the database at > 90% identity. If
only a forward or reverse read passed the quality threshold, then it and its paired read were
discarded. We then took the original fastq.gz files and the output from the Magic-BLAST step to
split the reads of the fastq.gz files into 4 files. These files contained the forward and the reverse

41
reads for 16S and 18S rRNA gene reads. Because our recovery of 16S rRNA sequences was too
low to allow comparisons between samples, we did not further analyze it. The 18S rRNA gene
reads were processed in R using the DADA2 R package version 1.10 (Callahan et al., 2016). For
the 515F-Y and 926R primers, we captured 1,478,875 paired-end 18S rRNA gene reads in 77
total samples. There was a median of 10,748 18S rRNA gene reads per sample. There were 1,434
total 18S rRNA gene ASVs. We rarefied to 1,962 reads to perform all statistical analysis on
rarefied data sets, but as abundance varies so much for 18S rRNA genes and rarefaction is a still
debated technique, we only rarefy for statistical analysis (McMurdie and Holmes, 2014; de
Vargas et al., 2015). Figures using rarefied data sets are specified within their figure legends, but
for clarity, they are Figure 2.3, 2.11, 2.12, 2.16, 2.17, 2.18 and 2.20. Statistical estimates of
Shannon’s Diversity were measured using the R package phyloseq (McMurdie and Holmes,
2013). Richness was quantified using phyloseq as well as the R package vegetarian to calculate
Hill numbers (Hill, 1973; Jost, 2006; Jost, 2007). Because we did not observe significant
differences between epiphyte and endophyte ASV richness (Figure 2.22) or the relative
abundance of plant reads (Figure 2.16), we analyzed the endophyte and epiphyte samples
together from each PNA set, resulting in a replicate range of between 8 and 20 (Table 2.1). As
richness, also known as q=0, was the major finding with the addition of the gPNA, we use it has
the most pertinent metric for evaluating sample differences.
Isolation of bacterial and fungal collection from M. sativa samples
Plant material was collected from at the coordinates 39.5102, -119.9952 in the Great
Basin, located 0.5 miles from the original site where the M. sativa endophyte and epiphyte
samples for DNA sequencing were collected. To isolate epiphyte samples, leaf and flower
imprints were made on to the following media: Lysogeny Broth nutrients (LB), 1/10 LB
42
nutrients, 1/10 LB nutrients with 1% humic acid, 1/10 LB nutrients with 10% methanol, 1/5
dilution of King’s B, MacConkey, and PDA (potato dextrose agar). To enrich for endophytes,
leaves and flowers were surface sterilized with 10% household bleach and 0.01% Triton X-100
treatment. After 10 minutes submerged in bleach, leaves were washed with sterile distilled water.
A solution of 2.5% sodium thiosulfate for 5 minutes neutralized the bleach. M. sativa leaves and
flowers were washed twice more with sterile water. Approximately 20 sterile 0.7 mm garnet
beads (Qiagen) were added to the tubes to ensure sample homogenization on a GenoGrinder for
5 minutes at 1500 RPM (SPEX SamplePrep). Homogenized endophyte enriched samples were
plated on the same media as the epiphyte enriched samples and plates were incubated at 28˚C for
2 weeks. Individual fungal hyphae were isolated using a dissecting microscope for visualization.
Bacterial colonies were struck out and isolated. DNA from all isolates was extracted using
DNeasy Ultraclean Microbial Kit (Qiagen) and amplified with the ITS4 and ITS9 primer sets for
fungi and 27F and 1492R for bacteria (Table 2.4). Samples were cleaned with QIAquick PCR
Purification Kit (Qiagen) according to the protocol and submitted to University of Tennessee
DNA Genomics Core for Sanger Capillary Sequencing.
Identification of neighboring plants
To interpret the M. sativa results with those from their neighboring plant samples, we
attempted to classify all neighboring plants to genus level using molecular techniques. Our goal
in using neighboring plants was to determine how well the gPNA blocks general plant DNA
amplification in comparison to the M. sativa samples, which it was specifically generated to
bind. Even when PNAs are generated for a specific host, they are often applied to a variety of
genetically similar hosts, and thus we included an examination of assorted plant material along
with a phylogenetic tree comparing gPNA alignment across land plants (Fitzpatrick et al., 2018;
43
Lundberg et al., 2013, Figure 2.6). As plant scientists do not agree on one primer set for
identifying plant taxonomy, neighboring plants in the same field as feral M. sativa were
identified using three common primer sets for rbcL, ITS2, and trnH-psbA as listed in Table 2.4.
These primers are commonly used in combination with each other to identify plant sequences
(Lledo et al., 1998; Stanford et al., 2000; Fazekas et al., 2008; Hollingsworth et al., 2011; Li et
al., 2015). DNA from the endophyte enriched samples was used for plant identification PCRs.
The PCR protocol was the same for rbcL and trnH-psbA. An initial 95˚C step for 3 minutes,
followed by 34 cycles of 95˚C for 30 seconds, 57˚C for 30 seconds, 72˚C for 1 minute and a final
extension 72˚C for 5 minutes. ITS2 had the same protocol except for a 53˚C annealing
temperature. As with the fungal and bacterial isolate collections, samples were cleaned with
QIAquick PCR Purification Kit (Qiagen) according to the protocol and submitted to University
of Tennessee DNA Genomics Core for Sanger Capillary Sequencing. Neighboring plant
taxonomic identification was confirmed when at least two of the three genetic markers aligned to
the same genus or genus and species (Table 2.5, 2.6). We note that taxonomy results are based
only on the molecular tools above and have not been confirmed via additional field collections.
While the majority of the neighboring plants did not have representative 18S rRNA
sequences in SILVA, the genera Chamaenerion and Grindelia did. Alignment revealed that
Chamaenerion spp. did align completely with the gPNA suggesting it would be able to be
blocked. However, Grindelia spp. did not contain a complementary sequence to the gPNA,
suggesting that the gPNA would not block Grindelia 18S rRNA sequences. Grindelia spp. were
the most isolated neighboring plant with 3 samples identified (Table 2.6). Grindelia spp. belongs
to the family Asteraceae. All other neighboring plants also belong to the family Asteraceae
except for Chamaenerion which belongs to the family Onagraceae (Table 2.5). To visualize the
44
gPNA alignments in a phylogenetic context, all aligned Magnoliophyta (land plant) sequences
were downloaded from SILVA via MAPT (Figure 2.6). Alignment positions were masked if
30% of sequences contained a gap at a respective position. The masked multiple sequence
alignment was then used to build a tree of Magnoliophyta using Fasttree 2.1 with a generalized
time-reversable (-gtr option) (Price et al., 2010). MAPT was used to find the max gPNA k-mer in
each Magnoliophyta sequence and ete3 was used to annotate the newick tree file with the k-mer
data from MAPT (Huerta-Cepas et al., 2016). The tree was then uploaded and visualized with
iTOL (Letunic and Bork, 2019).
Statistical Analysis
A 1-way ANOVA with a post hoc Tukey's test was used to test if there were significant
differences in the variables compared in Figures 2.16, 2.17, 2.20. Figures 2.11 and 2.22 use
unpaired t-tests as each group is only compared to one other and thus an ANOVA is not
necessary. All data was statistically analyzed in Prism version 8.0 for PC (GraphPad Software,
La Jolla, California, USA, www.graphpad.com).
Results:
Summer 2017 and 2018 sample collections
We adapted previously published methods to streamline the separation of endophyte and
epiphyte plant material in order to produce high quality DNA extractions for epiphyte and
endophyte material within two days of receiving raw plant material (Figure 2.7). Our summer
2017 season resulted in the DNA extraction of 2,890 samples between June 14th and September
19th (Table 2.7). The majority of this, 2,040 samples, were divided evenly between endophyte
and epiphyte enriched material from M. sativa plants. Of the remaining samples, 680 were
neighboring plant material, again half between endophyte and epiphyte enriched samples and
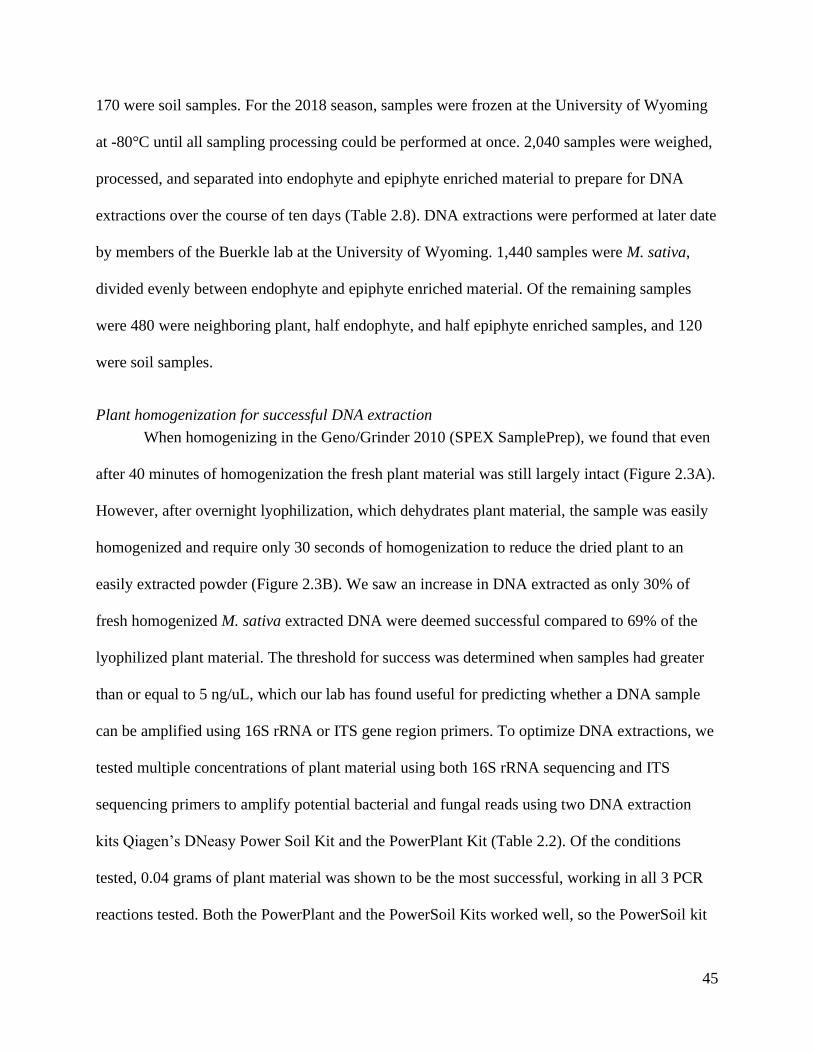
45
170 were soil samples. For the 2018 season, samples were frozen at the University of Wyoming
at -80°C until all sampling processing could be performed at once. 2,040 samples were weighed,
processed, and separated into endophyte and epiphyte enriched material to prepare for DNA
extractions over the course of ten days (Table 2.8). DNA extractions were performed at later date
by members of the Buerkle lab at the University of Wyoming. 1,440 samples were M. sativa,
divided evenly between endophyte and epiphyte enriched material. Of the remaining samples
were 480 were neighboring plant, half endophyte, and half epiphyte enriched samples, and 120
were soil samples.
Plant homogenization for successful DNA extraction
When homogenizing in the Geno/Grinder 2010 (SPEX SamplePrep), we found that even
after 40 minutes of homogenization the fresh plant material was still largely intact (Figure 2.3A).
However, after overnight lyophilization, which dehydrates plant material, the sample was easily
homogenized and require only 30 seconds of homogenization to reduce the dried plant to an
easily extracted powder (Figure 2.3B). We saw an increase in DNA extracted as only 30% of
fresh homogenized M. sativa extracted DNA were deemed successful compared to 69% of the
lyophilized plant material. The threshold for success was determined when samples had greater
than or equal to 5 ng/uL, which our lab has found useful for predicting whether a DNA sample
can be amplified using 16S rRNA or ITS gene region primers. To optimize DNA extractions, we
tested multiple concentrations of plant material using both 16S rRNA sequencing and ITS
sequencing primers to amplify potential bacterial and fungal reads using two DNA extraction
kits Qiagen’s DNeasy Power Soil Kit and the PowerPlant Kit (Table 2.2). Of the conditions
tested, 0.04 grams of plant material was shown to be the most successful, working in all 3 PCR
reactions tested. Both the PowerPlant and the PowerSoil Kits worked well, so the PowerSoil kit
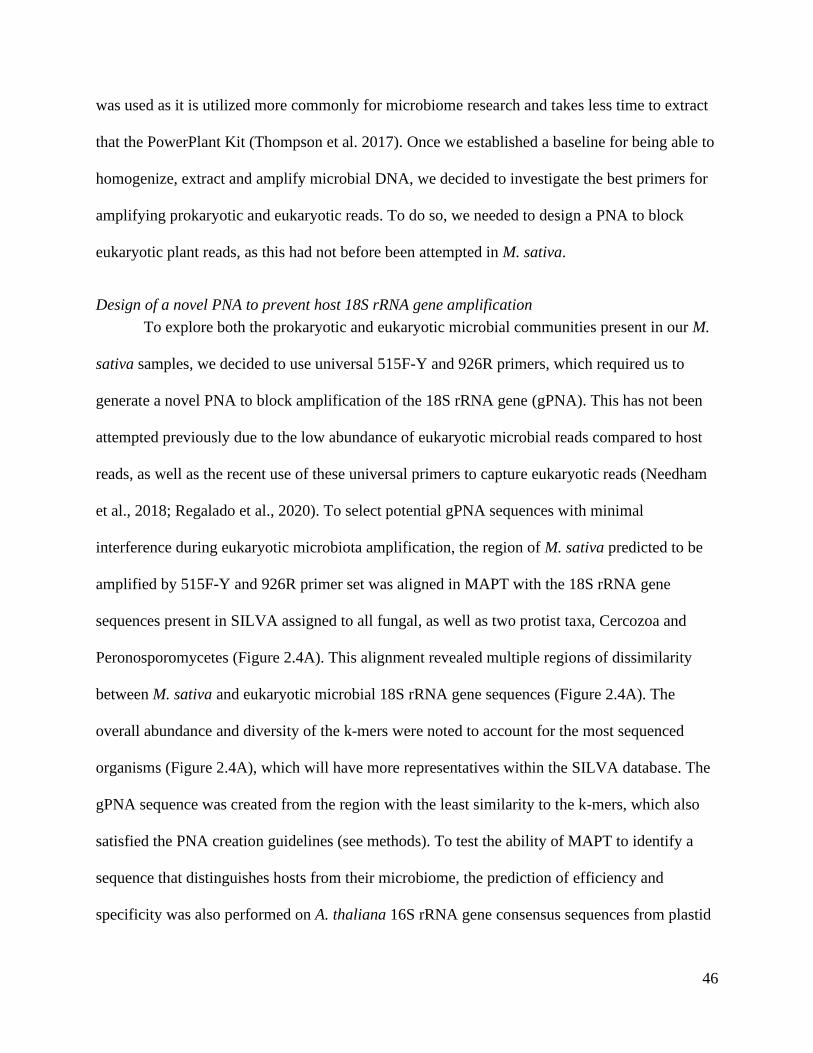
46
was used as it is utilized more commonly for microbiome research and takes less time to extract
that the PowerPlant Kit (Thompson et al. 2017). Once we established a baseline for being able to
homogenize, extract and amplify microbial DNA, we decided to investigate the best primers for
amplifying prokaryotic and eukaryotic reads. To do so, we needed to design a PNA to block
eukaryotic plant reads, as this had not before been attempted in M. sativa.
Design of a novel PNA to prevent host 18S rRNA gene amplification
To explore both the prokaryotic and eukaryotic microbial communities present in our M.
sativa samples, we decided to use universal 515F-Y and 926R primers, which required us to
generate a novel PNA to block amplification of the 18S rRNA gene (gPNA). This has not been
attempted previously due to the low abundance of eukaryotic microbial reads compared to host
reads, as well as the recent use of these universal primers to capture eukaryotic reads (Needham
et al., 2018; Regalado et al., 2020). To select potential gPNA sequences with minimal
interference during eukaryotic microbiota amplification, the region of M. sativa predicted to be
amplified by 515F-Y and 926R primer set was aligned in MAPT with the 18S rRNA gene
sequences present in SILVA assigned to all fungal, as well as two protist taxa, Cercozoa and
Peronosporomycetes (Figure 2.4A). This alignment revealed multiple regions of dissimilarity
between M. sativa and eukaryotic microbial 18S rRNA gene sequences (Figure 2.4A). The
overall abundance and diversity of the k-mers were noted to account for the most sequenced
organisms (Figure 2.4A), which will have more representatives within the SILVA database. The
gPNA sequence was created from the region with the least similarity to the k-mers, which also
satisfied the PNA creation guidelines (see methods). To test the ability of MAPT to identify a
sequence that distinguishes hosts from their microbiome, the prediction of efficiency and
specificity was also performed on A. thaliana 16S rRNA gene consensus sequences from plastid
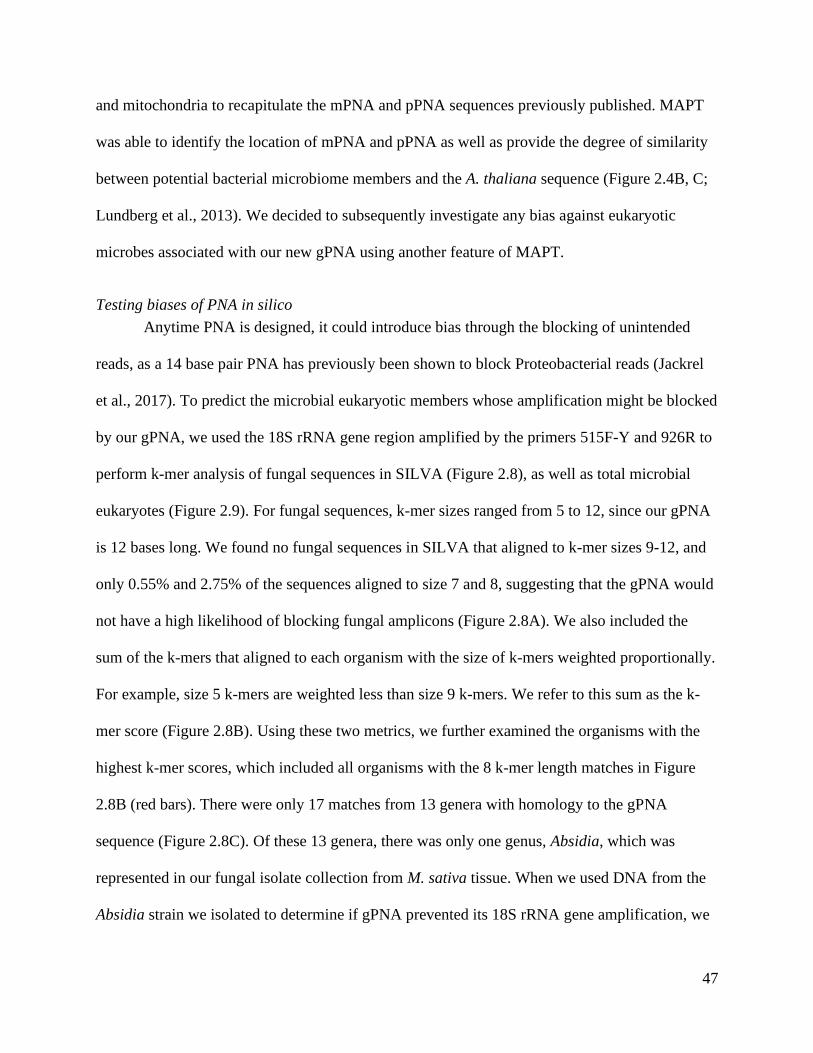
47
and mitochondria to recapitulate the mPNA and pPNA sequences previously published. MAPT
was able to identify the location of mPNA and pPNA as well as provide the degree of similarity
between potential bacterial microbiome members and the A. thaliana sequence (Figure 2.4B, C;
Lundberg et al., 2013). We decided to subsequently investigate any bias against eukaryotic
microbes associated with our new gPNA using another feature of MAPT.
Testing biases of PNA in silico
Anytime PNA is designed, it could introduce bias through the blocking of unintended
reads, as a 14 base pair PNA has previously been shown to block Proteobacterial reads (Jackrel
et al., 2017). To predict the microbial eukaryotic members whose amplification might be blocked
by our gPNA, we used the 18S rRNA gene region amplified by the primers 515F-Y and 926R to
perform k-mer analysis of fungal sequences in SILVA (Figure 2.8), as well as total microbial
eukaryotes (Figure 2.9). For fungal sequences, k-mer sizes ranged from 5 to 12, since our gPNA
is 12 bases long. We found no fungal sequences in SILVA that aligned to k-mer sizes 9-12, and
only 0.55% and 2.75% of the sequences aligned to size 7 and 8, suggesting that the gPNA would
not have a high likelihood of blocking fungal amplicons (Figure 2.8A). We also included the
sum of the k-mers that aligned to each organism with the size of k-mers weighted proportionally.
For example, size 5 k-mers are weighted less than size 9 k-mers. We refer to this sum as the k-
mer score (Figure 2.8B). Using these two metrics, we further examined the organisms with the
highest k-mer scores, which included all organisms with the 8 k-mer length matches in Figure
2.8B (red bars). There were only 17 matches from 13 genera with homology to the gPNA
sequence (Figure 2.8C). Of these 13 genera, there was only one genus, Absidia, which was
represented in our fungal isolate collection from M. sativa tissue. When we used DNA from the
Absidia strain we isolated to determine if gPNA prevented its 18S rRNA gene amplification, we
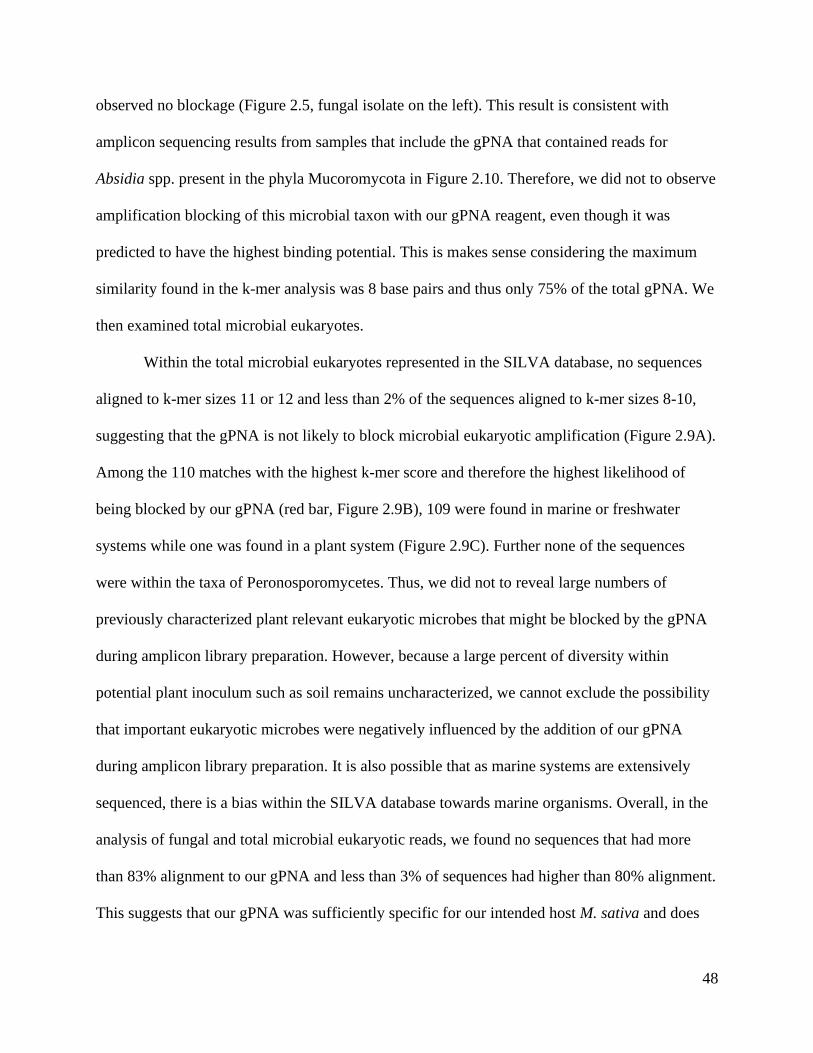
48
observed no blockage (Figure 2.5, fungal isolate on the left). This result is consistent with
amplicon sequencing results from samples that include the gPNA that contained reads for
Absidia spp. present in the phyla Mucoromycota in Figure 2.10. Therefore, we did not to observe
amplification blocking of this microbial taxon with our gPNA reagent, even though it was
predicted to have the highest binding potential. This is makes sense considering the maximum
similarity found in the k-mer analysis was 8 base pairs and thus only 75% of the total gPNA. We
then examined total microbial eukaryotes.
Within the total microbial eukaryotes represented in the SILVA database, no sequences
aligned to k-mer sizes 11 or 12 and less than 2% of the sequences aligned to k-mer sizes 8-10,
suggesting that the gPNA is not likely to block microbial eukaryotic amplification (Figure 2.9A).
Among the 110 matches with the highest k-mer score and therefore the highest likelihood of
being blocked by our gPNA (red bar, Figure 2.9B), 109 were found in marine or freshwater
systems while one was found in a plant system (Figure 2.9C). Further none of the sequences
were within the taxa of Peronosporomycetes. Thus, we did not to reveal large numbers of
previously characterized plant relevant eukaryotic microbes that might be blocked by the gPNA
during amplicon library preparation. However, because a large percent of diversity within
potential plant inoculum such as soil remains uncharacterized, we cannot exclude the possibility
that important eukaryotic microbes were negatively influenced by the addition of our gPNA
during amplicon library preparation. It is also possible that as marine systems are extensively
sequenced, there is a bias within the SILVA database towards marine organisms. Overall, in the
analysis of fungal and total microbial eukaryotic reads, we found no sequences that had more
than 83% alignment to our gPNA and less than 3% of sequences had higher than 80% alignment.
This suggests that our gPNA was sufficiently specific for our intended host M. sativa and does
49
not appear to have high similarity to microbial eukaryotes (Figure2. 8, 2.9). Further, this analysis
performed by MAPT provides researchers with a list of organisms that have a higher likelihood
of being impacted by the addition of the PNA to investigate if they are concerned about bias
against particular taxa in their amplicon sequencing.
Comparing 16S rRNA primer sets and connecting reads to sampling efforts
We compared how the microbial community captured by the standard Illumina 16S
rRNA gene primers 341F and 785R (i.e. V3-V4 region) compare to the bacterial diversity and
composition with our amplicon sequencing of the V4-V5 region (Klindworth et al, 2013; Yu et
al., 2015; Parada et al., 2016). We examined both primers sets to determine how much 16S
rRNA diversity was covered for M. sativa and neighboring plants for epiphyte and endophyte
samples. Only samples with all 3 PNAs added were examined as V3-V4 primers did not have
sufficient sample sizes for 0 and 2 PNA samples to allow for accurate comparisons.
Unfortunately, the majority of M. sativa samples had few to no 16S rRNA gene reads for the V4-
V5 primers, while the V3-V4 amplified for all samples (Figure 2.11). Because library prep for
both primers was prepared concurrently with the same reagents (including the use of the 3 PNA),
and were sequenced on the same flow cell, we concluded that the lack of 16S rRNA reads for the
V4-V5 samples were not due to any sample processing errors.
In Figure 2.11 we compare the bacterial community sequenced using V3-V4 and V4-V5
primers. While V4-V5 primers can also isolate eukaryotic reads, these reads have been removed
to compare the bacterial community directly. Within M. sativa endophyte samples, the bacterial
community diversity is significantly increased in observed ASVs as well as Shannon’s Diversity,
both measures of alpha diversity but not with Faith’s PD (Figure 2.11A, C, E). No significant
difference could be detected when compared M. sativa epiphyte samples for V3-V4 and V4-V5
50
for any metrics, although V3-V4 primers have higher averages for all 3 metrics measured (Figure
2.11A, C, E). For neighboring plant endophyte samples, the V3-V4 had significantly higher
number of observed ASVs than the V4-V5 primers (Figure 2.11B). Shannon’s diversity and
Faith’s PD did not detect significant differences, but V3-V4 had higher averages for both (Figure
2.11D, F). Finally, we failed to detect differences in neighboring plant epiphyte sample
communities (Figure 2.11B, D, F). Curiously, epiphyte diversity was lower than endophyte
diversity, which is unexpected as exterior portions of the plant are generally of higher diversity
than internal (Figure 2.11, Vorholt et al., 2012; Lebeis et al., 2012; Xiao et al., 2017;
Zarraonaindia et al., 2015; Dong et al., 2019; Yamamoto et al., 2018; Edwards et al., 2014).
Based on the significant differences seen within both the M. sativa endophyte samples and the
neighboring plant endophyte samples, we concluded that the V3-V4 primers are able to amplify
a more diverse selection of bacteria and thus the V4-V5 primers should not be used to investigate
plant endophytic bacterial reads.
While bacterial sequencing efforts were not highly successful for the V4-V5 region, we
used the samples that were successful to match with the bacterial collection we generated from
our feral M. sativa as performed with the fungal collection (Figure 2.12). We cultured 11
bacterial families using seven media: Bacillaceae, Enterobacteriaceae, Nocardiaceae,
Microbacteriaceae, Paenibacillaceae, Pseudonocardineae, Rhodobacteraceae, Staphylococcaceae,
Streptomycetaceae and Sphingomonadaceae. Of these families, 25 distinct organisms were
isolated from alfalfa endophyte enriched material and 26 isolated from alfalfa epiphyte enriched
material. Both the V3-V4 and V4-V5 primers contained all the bacterial families that were
isolated.
51
Microbial eukaryotic members captured by 18S rRNA gene sequencing
Upon amplicon sequencing with the 515F-Y and 926R primers in our plant samples, we
were able to successfully detect microbial eukaryotic reads. A total of 1,434 unique eukaryotic
ASVs were recovered from the M. sativa and neighboring plant samples. The majority of these
ASVs were microbial eukaryotes (66.8%) with the remaining ASVs divided between total plant
eukaryotic ASVs (30.1%), unclassified ASVs (2.5%), and spurious bacteria (0.6%) (Figure
2.10A). A small number of bacterial ASVs were expected as they were seen in previous use of
this pipeline (Lee, 2019). Upon examining the microbial eukaryotic ASVs, the largest portions
belonged to the phylum Cercozoa with almost a quarter of the overall ASVs (24.46%). The
fungal phylum with the most ASVs was Ascomycota with 20.58% (Figure 2.10B). Other top
phyla, from fungal, protist and animal kingdoms include Ciliophora, Chytridiomycota,
Basidiomycota and Arthropoda with each accounting for approximately 10% of ASVs (Figures
2.10B, 2.13). From our feral M. sativa plants, we collected insects to connect arthropod 18S
rRNA gene ASVs observed (Figure 2.10B, Table 2.9). When matching at rank order, three of the
four orders identified traditionally matched 18S rRNA gene sequences: Hemiptera, Hymenoptera
and Thysanoptera. All three arthropod orders sequenced known herbivorous (Eliyahu et al.,
2015; Weirauch and Schuh, 2011; Archibald et al., 2018). Our 18S rRNA sequencing also found
other plant-related eukaryotic organisms as well including, Peronosporomycetes (oomycetes) and
the closely related Hyphochytriomycetes. Most of the sequences from Peronosporomycetes were
classified at the genus level as Pythium, a prominent plant pathogen (Figure 2.14, Schwelm et
al., 2018). Thus, the 18S rRNA gene sequencing captured a wide array of eukaryotic diversity.
Connecting 18S rRNA gene to ITS amplicon sequencing and fungal isolation representatives
To compare the ASVs detected by 18S rRNA gene sequencing results to the commonly
used ITS sequencing, we used a mixture of ITS2 region primers that contained six forward and
52
two reverse primers with frameshifts in order to increase overall diversity of the amplicons
sequenced (White et al., 1999; Cregger et al., 2018). We observe that the ITS sequences
contained the two fungal phyla sequences (Ascomycota and Basidiomycota) while the 18S rRNA
gene sequencing captured these phyla plus an additional six not detected by ITS sequencing
(Figure 2.10B). Although protists were captured within the M. Sativa samples for ITS primers,
none of these ASVs were resolved to taxonomic orders below the phyla level identification,
unlike for the 18S rRNA sequencing where the phyla Cercozoa was resolved to the orders
Cercomonadidae, Glissomonadida, Imbricatea, Phytomyxea, and Thecofilosea and the phyla
Ciliophora resolved to the subphyla Intramacronucleata and Postciliodesmatophora (Figure
2.10B, 13).
We compared the families represented in our fungal culture collection with those
captured in the 18S rRNA gene and ITS amplicon sequencing results to see which primers have
more cultured representatives (Figure 2.10). Five of our eight isolated fungal families matched to
18S rRNA gene sequences present: Cladosporiaceae, Cunninghamellaceae, Incertae Sedis,
Ophiocordycipitaceae and Pleosporaceae while only Pleosporaceae was detected by ITS
sequencing (Figures 2.10B, D, 2.15). This difference is not likely due to the use of separate
primers as the ITS primers we used to identify each member of the fungal isolate collection and
to sequence the plants were both part of the same variable region, ITS2. Although Incertae Sedis
is used when the relation to other taxa is not known, the genus level of samples pertaining to the
family Incertae Sedis corresponded with fungal isolates, so it was included. Three of these five
families (i.e., Cladosporiaceae, Incertae Sedis, and Pleosporaceae) contained the most identified
ASVs within the phyla Ascomycota. 27 of the 29 fungal isolates in our culture collection belong
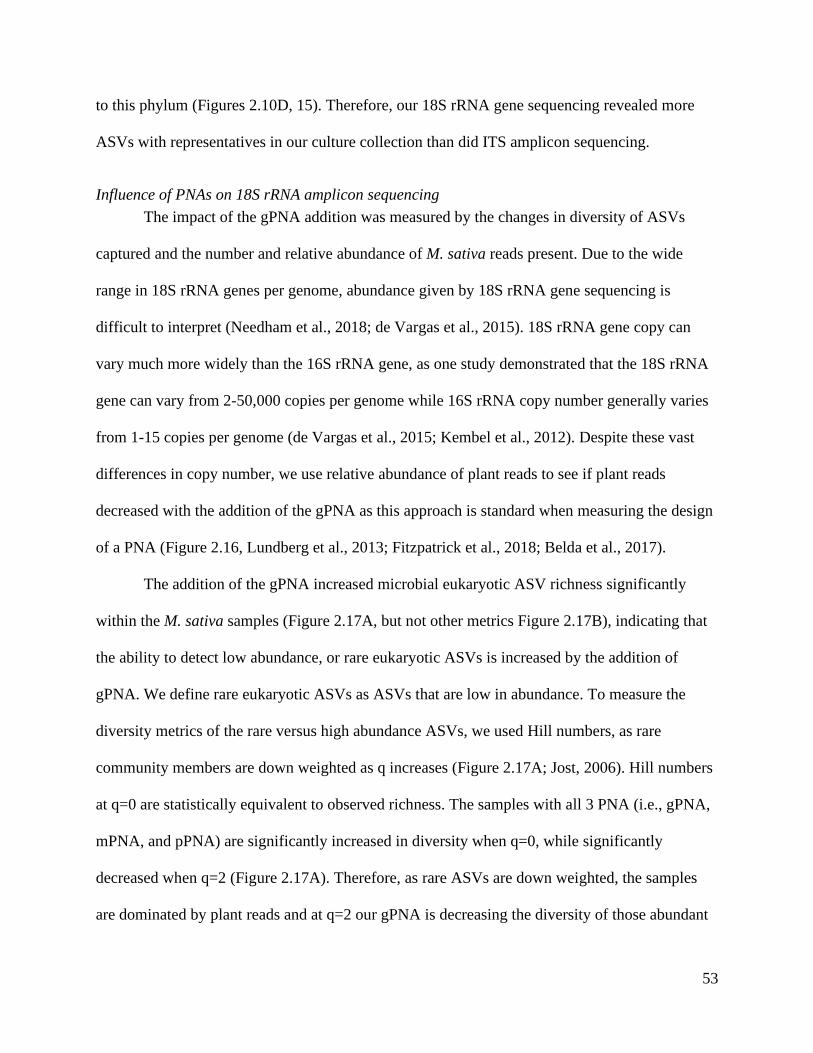
53
to this phylum (Figures 2.10D, 15). Therefore, our 18S rRNA gene sequencing revealed more
ASVs with representatives in our culture collection than did ITS amplicon sequencing.
Influence of PNAs on 18S rRNA amplicon sequencing
The impact of the gPNA addition was measured by the changes in diversity of ASVs
captured and the number and relative abundance of M. sativa reads present. Due to the wide
range in 18S rRNA genes per genome, abundance given by 18S rRNA gene sequencing is
difficult to interpret (Needham et al., 2018; de Vargas et al., 2015). 18S rRNA gene copy can
vary much more widely than the 16S rRNA gene, as one study demonstrated that the 18S rRNA
gene can vary from 2-50,000 copies per genome while 16S rRNA copy number generally varies
from 1-15 copies per genome (de Vargas et al., 2015; Kembel et al., 2012). Despite these vast
differences in copy number, we use relative abundance of plant reads to see if plant reads
decreased with the addition of the gPNA as this approach is standard when measuring the design
of a PNA (Figure 2.16, Lundberg et al., 2013; Fitzpatrick et al., 2018; Belda et al., 2017).
The addition of the gPNA increased microbial eukaryotic ASV richness significantly
within the M. sativa samples (Figure 2.17A, but not other metrics Figure 2.17B), indicating that
the ability to detect low abundance, or rare eukaryotic ASVs is increased by the addition of
gPNA. We define rare eukaryotic ASVs as ASVs that are low in abundance. To measure the
diversity metrics of the rare versus high abundance ASVs, we used Hill numbers, as rare
community members are down weighted as q increases (Figure 2.17A; Jost, 2006). Hill numbers
at q=0 are statistically equivalent to observed richness. The samples with all 3 PNA (i.e., gPNA,
mPNA, and pPNA) are significantly increased in diversity when q=0, while significantly
decreased when q=2 (Figure 2.17A). Therefore, as rare ASVs are down weighted, the samples
are dominated by plant reads and at q=2 our gPNA is decreasing the diversity of those abundant
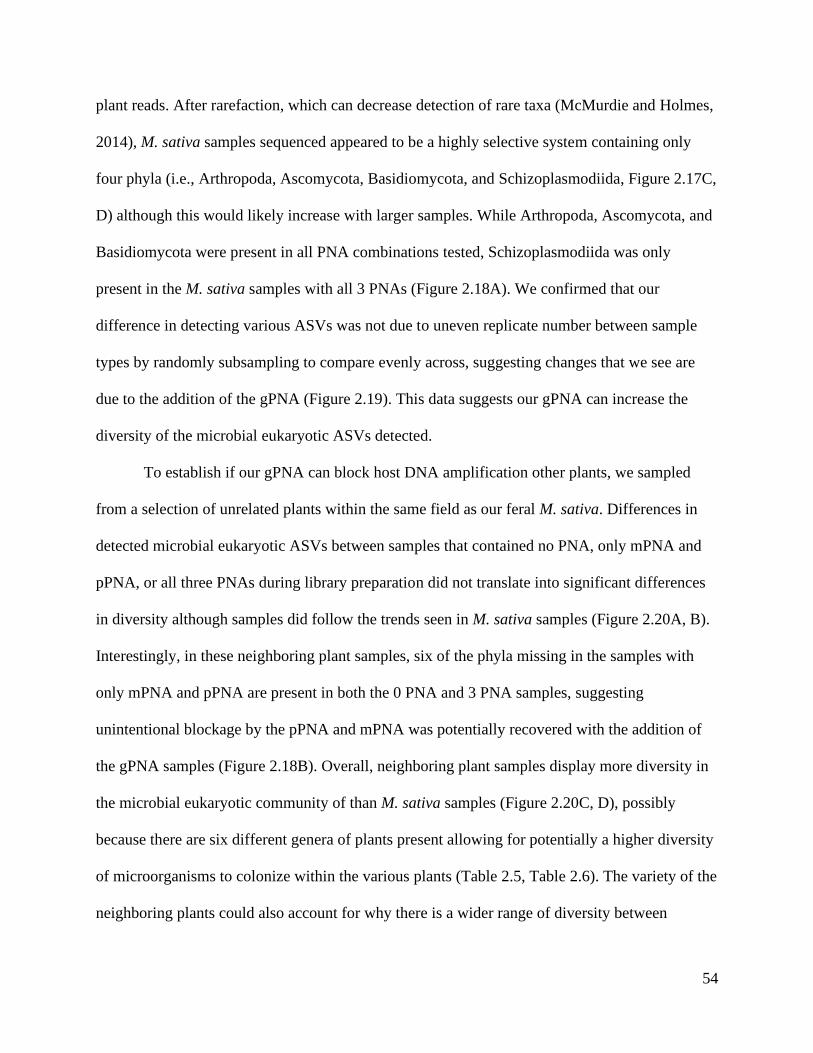
54
plant reads. After rarefaction, which can decrease detection of rare taxa (McMurdie and Holmes,
2014), M. sativa samples sequenced appeared to be a highly selective system containing only
four phyla (i.e., Arthropoda, Ascomycota, Basidiomycota, and Schizoplasmodiida, Figure 2.17C,
D) although this would likely increase with larger samples. While Arthropoda, Ascomycota, and
Basidiomycota were present in all PNA combinations tested, Schizoplasmodiida was only
present in the M. sativa samples with all 3 PNAs (Figure 2.18A). We confirmed that our
difference in detecting various ASVs was not due to uneven replicate number between sample
types by randomly subsampling to compare evenly across, suggesting changes that we see are
due to the addition of the gPNA (Figure 2.19). This data suggests our gPNA can increase the
diversity of the microbial eukaryotic ASVs detected.
To establish if our gPNA can block host DNA amplification other plants, we sampled
from a selection of unrelated plants within the same field as our feral M. sativa. Differences in
detected microbial eukaryotic ASVs between samples that contained no PNA, only mPNA and
pPNA, or all three PNAs during library preparation did not translate into significant differences
in diversity although samples did follow the trends seen in M. sativa samples (Figure 2.20A, B).
Interestingly, in these neighboring plant samples, six of the phyla missing in the samples with
only mPNA and pPNA are present in both the 0 PNA and 3 PNA samples, suggesting
unintentional blockage by the pPNA and mPNA was potentially recovered with the addition of
the gPNA samples (Figure 2.18B). Overall, neighboring plant samples display more diversity in
the microbial eukaryotic community of than M. sativa samples (Figure 2.20C, D), possibly
because there are six different genera of plants present allowing for potentially a higher diversity
of microorganisms to colonize within the various plants (Table 2.5, Table 2.6). The variety of the
neighboring plants could also account for why there is a wider range of diversity between
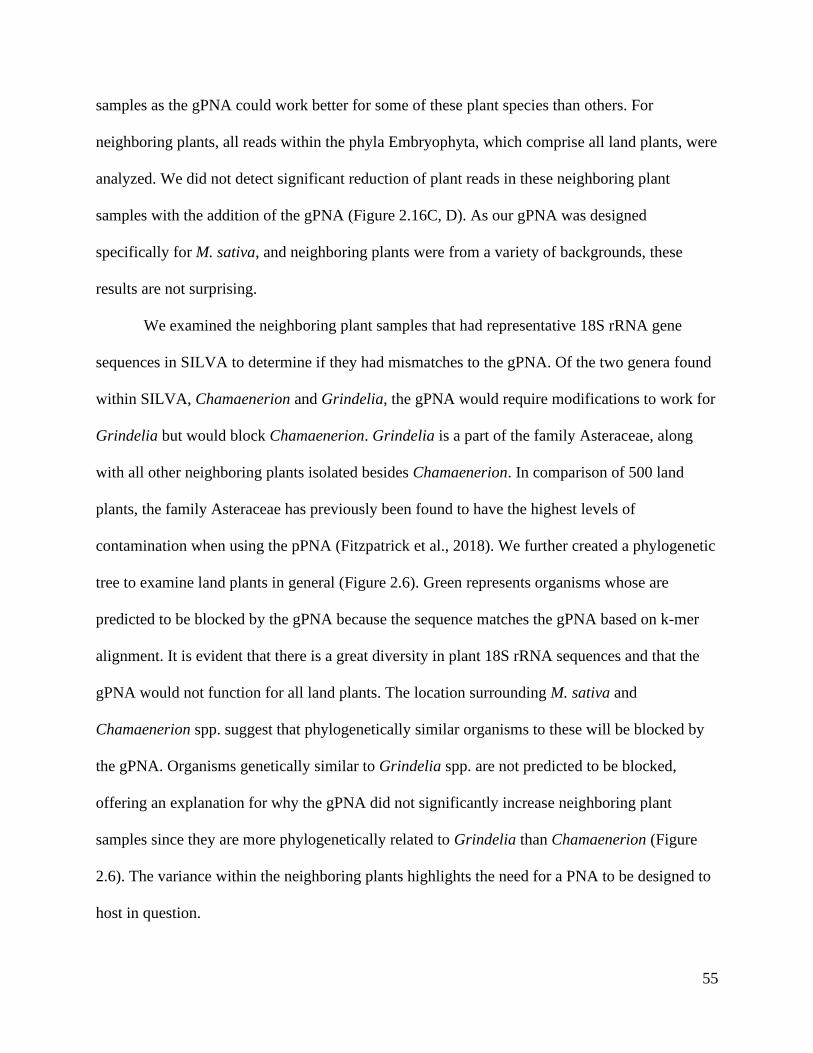
55
samples as the gPNA could work better for some of these plant species than others. For
neighboring plants, all reads within the phyla Embryophyta, which comprise all land plants, were
analyzed. We did not detect significant reduction of plant reads in these neighboring plant
samples with the addition of the gPNA (Figure 2.16C, D). As our gPNA was designed
specifically for M. sativa, and neighboring plants were from a variety of backgrounds, these
results are not surprising.
We examined the neighboring plant samples that had representative 18S rRNA gene
sequences in SILVA to determine if they had mismatches to the gPNA. Of the two genera found
within SILVA, Chamaenerion and Grindelia, the gPNA would require modifications to work for
Grindelia but would block Chamaenerion. Grindelia is a part of the family Asteraceae, along
with all other neighboring plants isolated besides Chamaenerion. In comparison of 500 land
plants, the family Asteraceae has previously been found to have the highest levels of
contamination when using the pPNA (Fitzpatrick et al., 2018). We further created a phylogenetic
tree to examine land plants in general (Figure 2.6). Green represents organisms whose are
predicted to be blocked by the gPNA because the sequence matches the gPNA based on k-mer
alignment. It is evident that there is a great diversity in plant 18S rRNA sequences and that the
gPNA would not function for all land plants. The location surrounding M. sativa and
Chamaenerion spp. suggest that phylogenetically similar organisms to these will be blocked by
the gPNA. Organisms genetically similar to Grindelia spp. are not predicted to be blocked,
offering an explanation for why the gPNA did not significantly increase neighboring plant
samples since they are more phylogenetically related to Grindelia than Chamaenerion (Figure
2.6). The variance within the neighboring plants highlights the need for a PNA to be designed to
host in question.
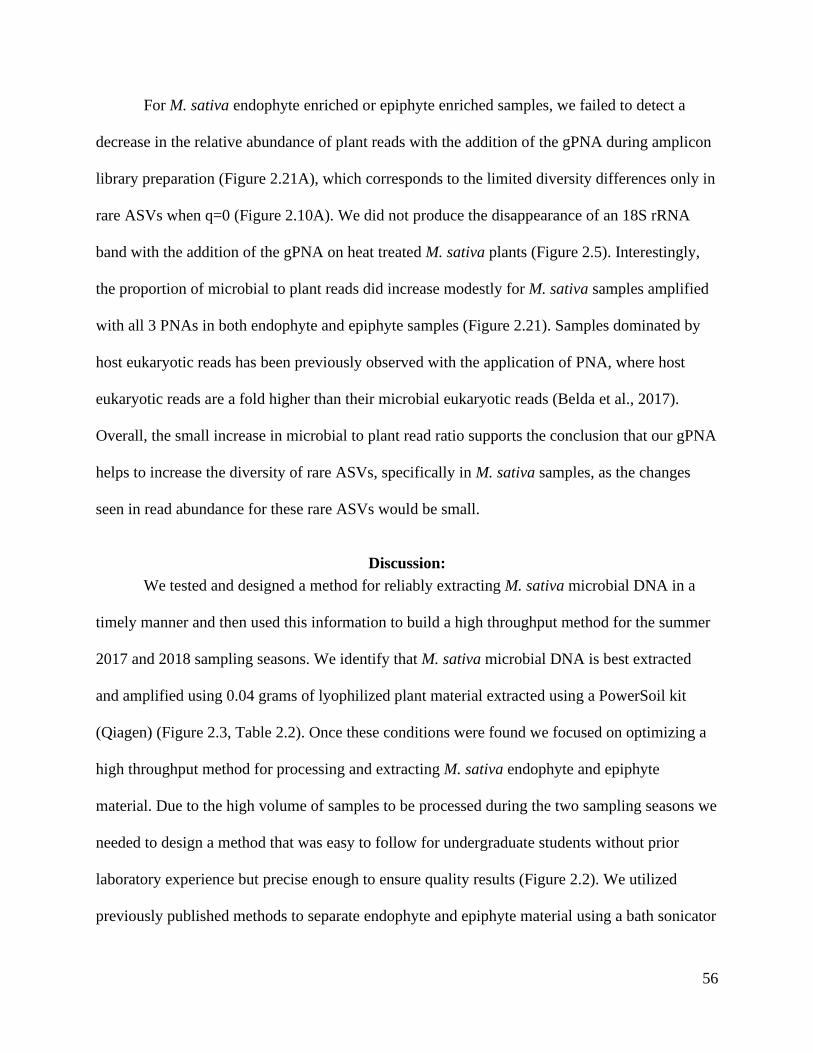
56
For M. sativa endophyte enriched or epiphyte enriched samples, we failed to detect a
decrease in the relative abundance of plant reads with the addition of the gPNA during amplicon
library preparation (Figure 2.21A), which corresponds to the limited diversity differences only in
rare ASVs when q=0 (Figure 2.10A). We did not produce the disappearance of an 18S rRNA
band with the addition of the gPNA on heat treated M. sativa plants (Figure 2.5). Interestingly,
the proportion of microbial to plant reads did increase modestly for M. sativa samples amplified
with all 3 PNAs in both endophyte and epiphyte samples (Figure 2.21). Samples dominated by
host eukaryotic reads has been previously observed with the application of PNA, where host
eukaryotic reads are a fold higher than their microbial eukaryotic reads (Belda et al., 2017).
Overall, the small increase in microbial to plant read ratio supports the conclusion that our gPNA
helps to increase the diversity of rare ASVs, specifically in M. sativa samples, as the changes
seen in read abundance for these rare ASVs would be small.
Discussion:
We tested and designed a method for reliably extracting M. sativa microbial DNA in a
timely manner and then used this information to build a high throughput method for the summer
2017 and 2018 sampling seasons. We identify that M. sativa microbial DNA is best extracted
and amplified using 0.04 grams of lyophilized plant material extracted using a PowerSoil kit
(Qiagen) (Figure 2.3, Table 2.2). Once these conditions were found we focused on optimizing a
high throughput method for processing and extracting M. sativa endophyte and epiphyte
material. Due to the high volume of samples to be processed during the two sampling seasons we
needed to design a method that was easy to follow for undergraduate students without prior
laboratory experience but precise enough to ensure quality results (Figure 2.2). We utilized
previously published methods to separate endophyte and epiphyte material using a bath sonicator
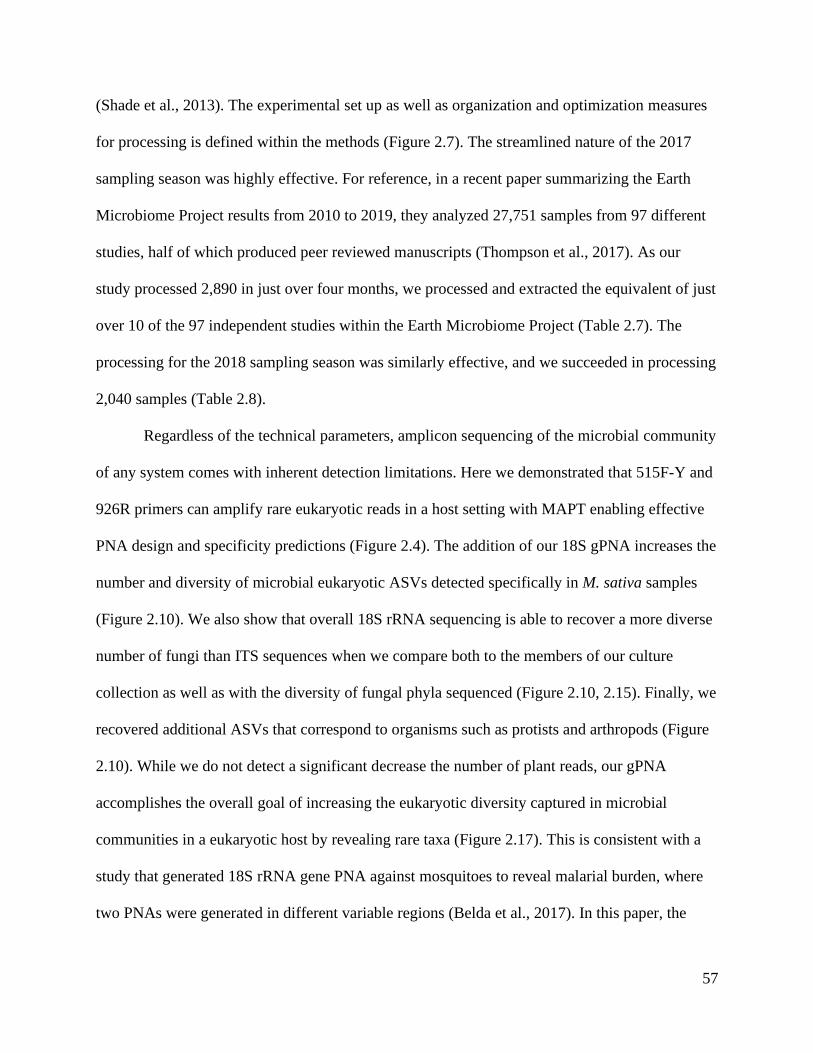
57
(Shade et al., 2013). The experimental set up as well as organization and optimization measures
for processing is defined within the methods (Figure 2.7). The streamlined nature of the 2017
sampling season was highly effective. For reference, in a recent paper summarizing the Earth
Microbiome Project results from 2010 to 2019, they analyzed 27,751 samples from 97 different
studies, half of which produced peer reviewed manuscripts (Thompson et al., 2017). As our
study processed 2,890 in just over four months, we processed and extracted the equivalent of just
over 10 of the 97 independent studies within the Earth Microbiome Project (Table 2.7). The
processing for the 2018 sampling season was similarly effective, and we succeeded in processing
2,040 samples (Table 2.8).
Regardless of the technical parameters, amplicon sequencing of the microbial community
of any system comes with inherent detection limitations. Here we demonstrated that 515F-Y and
926R primers can amplify rare eukaryotic reads in a host setting with MAPT enabling effective
PNA design and specificity predictions (Figure 2.4). The addition of our 18S gPNA increases the
number and diversity of microbial eukaryotic ASVs detected specifically in M. sativa samples
(Figure 2.10). We also show that overall 18S rRNA sequencing is able to recover a more diverse
number of fungi than ITS sequences when we compare both to the members of our culture
collection as well as with the diversity of fungal phyla sequenced (Figure 2.10, 2.15). Finally, we
recovered additional ASVs that correspond to organisms such as protists and arthropods (Figure
2.10). While we do not detect a significant decrease the number of plant reads, our gPNA
accomplishes the overall goal of increasing the eukaryotic diversity captured in microbial
communities in a eukaryotic host by revealing rare taxa (Figure 2.17). This is consistent with a
study that generated 18S rRNA gene PNA against mosquitoes to reveal malarial burden, where
two PNAs were generated in different variable regions (Belda et al., 2017). In this paper, the
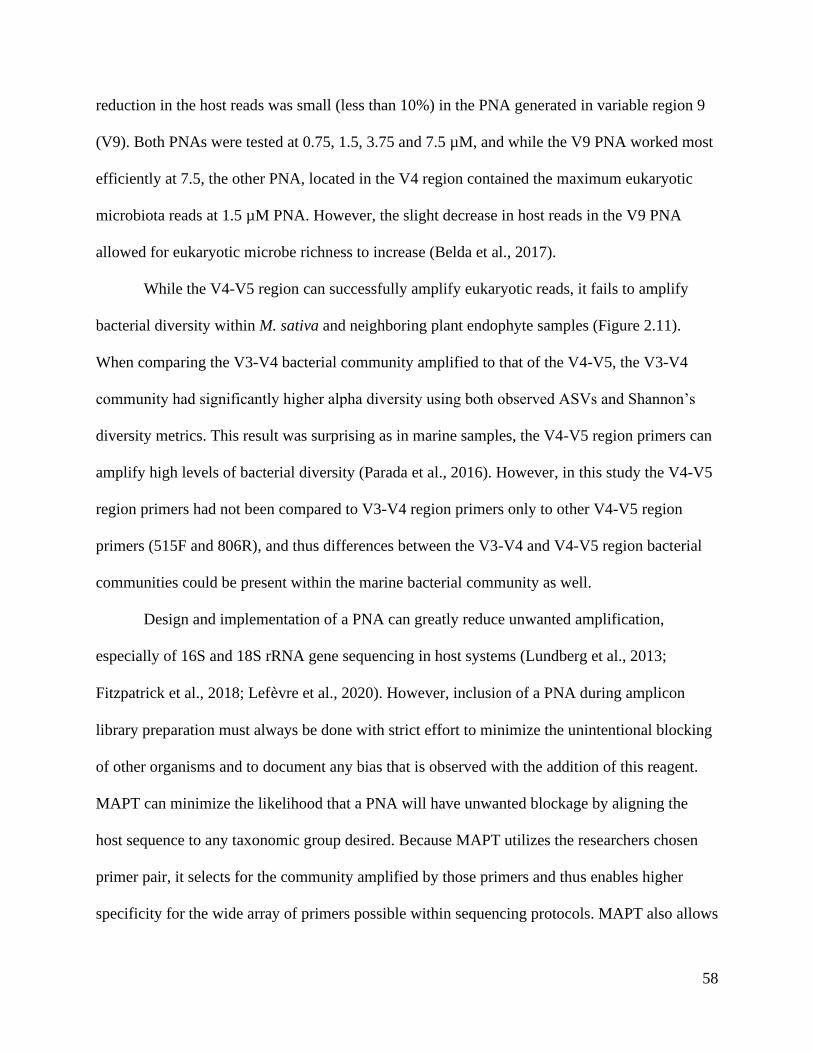
58
reduction in the host reads was small (less than 10%) in the PNA generated in variable region 9
(V9). Both PNAs were tested at 0.75, 1.5, 3.75 and 7.5 µM, and while the V9 PNA worked most
efficiently at 7.5, the other PNA, located in the V4 region contained the maximum eukaryotic
microbiota reads at 1.5 µM PNA. However, the slight decrease in host reads in the V9 PNA
allowed for eukaryotic microbe richness to increase (Belda et al., 2017).
While the V4-V5 region can successfully amplify eukaryotic reads, it fails to amplify
bacterial diversity within M. sativa and neighboring plant endophyte samples (Figure 2.11).
When comparing the V3-V4 bacterial community amplified to that of the V4-V5, the V3-V4
community had significantly higher alpha diversity using both observed ASVs and Shannon’s
diversity metrics. This result was surprising as in marine samples, the V4-V5 region primers can
amplify high levels of bacterial diversity (Parada et al., 2016). However, in this study the V4-V5
region primers had not been compared to V3-V4 region primers only to other V4-V5 region
primers (515F and 806R), and thus differences between the V3-V4 and V4-V5 region bacterial
communities could be present within the marine bacterial community as well.
Design and implementation of a PNA can greatly reduce unwanted amplification,
especially of 16S and 18S rRNA gene sequencing in host systems (Lundberg et al., 2013;
Fitzpatrick et al., 2018; Lefevre et al., 2020). However, inclusion of a PNA during amplicon
library preparation must always be done with strict effort to minimize the unintentional blocking
of other organisms and to document any bias that is observed with the addition of this reagent.
MAPT can minimize the likelihood that a PNA will have unwanted blockage by aligning the
host sequence to any taxonomic group desired. Because MAPT utilizes the researchers chosen
primer pair, it selects for the community amplified by those primers and thus enables higher
specificity for the wide array of primers possible within sequencing protocols. MAPT also allows
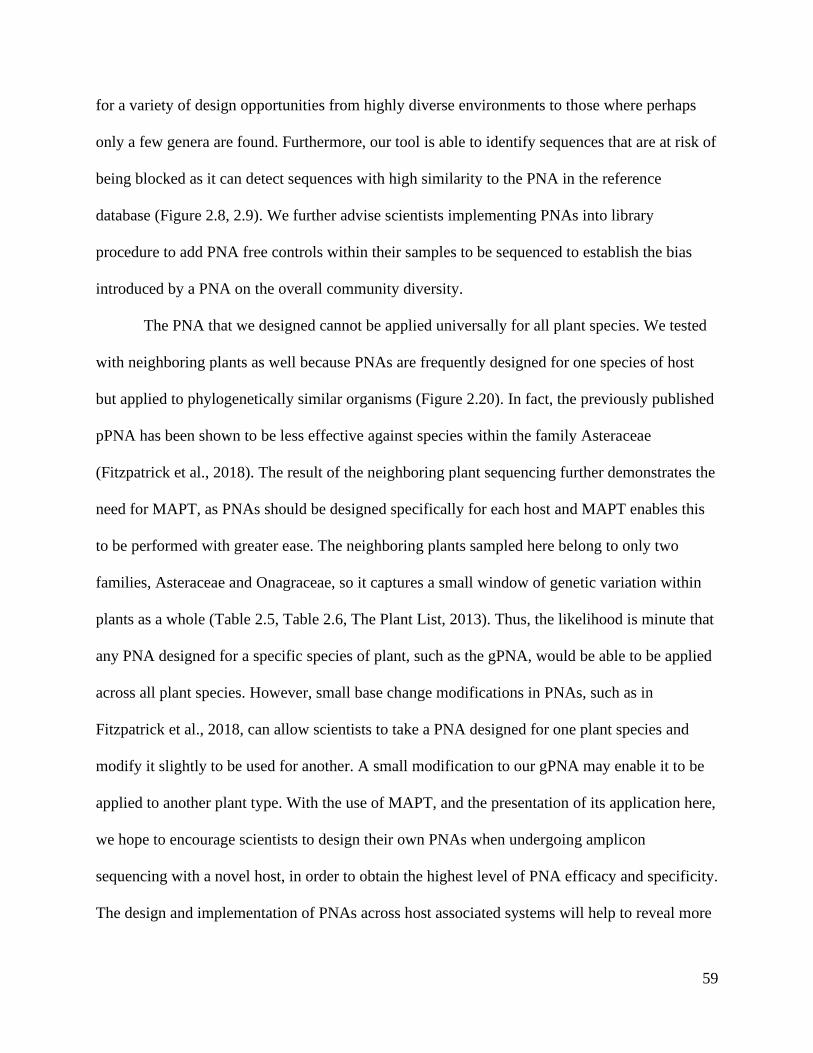
59
for a variety of design opportunities from highly diverse environments to those where perhaps
only a few genera are found. Furthermore, our tool is able to identify sequences that are at risk of
being blocked as it can detect sequences with high similarity to the PNA in the reference
database (Figure 2.8, 2.9). We further advise scientists implementing PNAs into library
procedure to add PNA free controls within their samples to be sequenced to establish the bias
introduced by a PNA on the overall community diversity.
The PNA that we designed cannot be applied universally for all plant species. We tested
with neighboring plants as well because PNAs are frequently designed for one species of host
but applied to phylogenetically similar organisms (Figure 2.20). In fact, the previously published
pPNA has been shown to be less effective against species within the family Asteraceae
(Fitzpatrick et al., 2018). The result of the neighboring plant sequencing further demonstrates the
need for MAPT, as PNAs should be designed specifically for each host and MAPT enables this
to be performed with greater ease. The neighboring plants sampled here belong to only two
families, Asteraceae and Onagraceae, so it captures a small window of genetic variation within
plants as a whole (Table 2.5, Table 2.6, The Plant List, 2013). Thus, the likelihood is minute that
any PNA designed for a specific species of plant, such as the gPNA, would be able to be applied
across all plant species. However, small base change modifications in PNAs, such as in
Fitzpatrick et al., 2018, can allow scientists to take a PNA designed for one plant species and
modify it slightly to be used for another. A small modification to our gPNA may enable it to be
applied to another plant type. With the use of MAPT, and the presentation of its application here,
we hope to encourage scientists to design their own PNAs when undergoing amplicon
sequencing with a novel host, in order to obtain the highest level of PNA efficacy and specificity.
The design and implementation of PNAs across host associated systems will help to reveal more

60
members of the microbial community otherwise left not sequenced, leading to a more accurate
depiction of the relevant and consistent members of host associated microbiomes.
Acknowledgements:
This work is supported by the National Science Foundation, Grant DEB-1638922 to Drs. Sarah
Lebeis and James Fordyce. We would like to thank Drs. Sur Herrera Paredes, Joshua Harrison,
Chris Nice, and Matthew Forister for their advice and interpretation of the results. We thank
Glen Forister for the insect identification. We thank Veronica Brown and Robert Murdoch for
their generous support with Illumina sequencing and analysis.
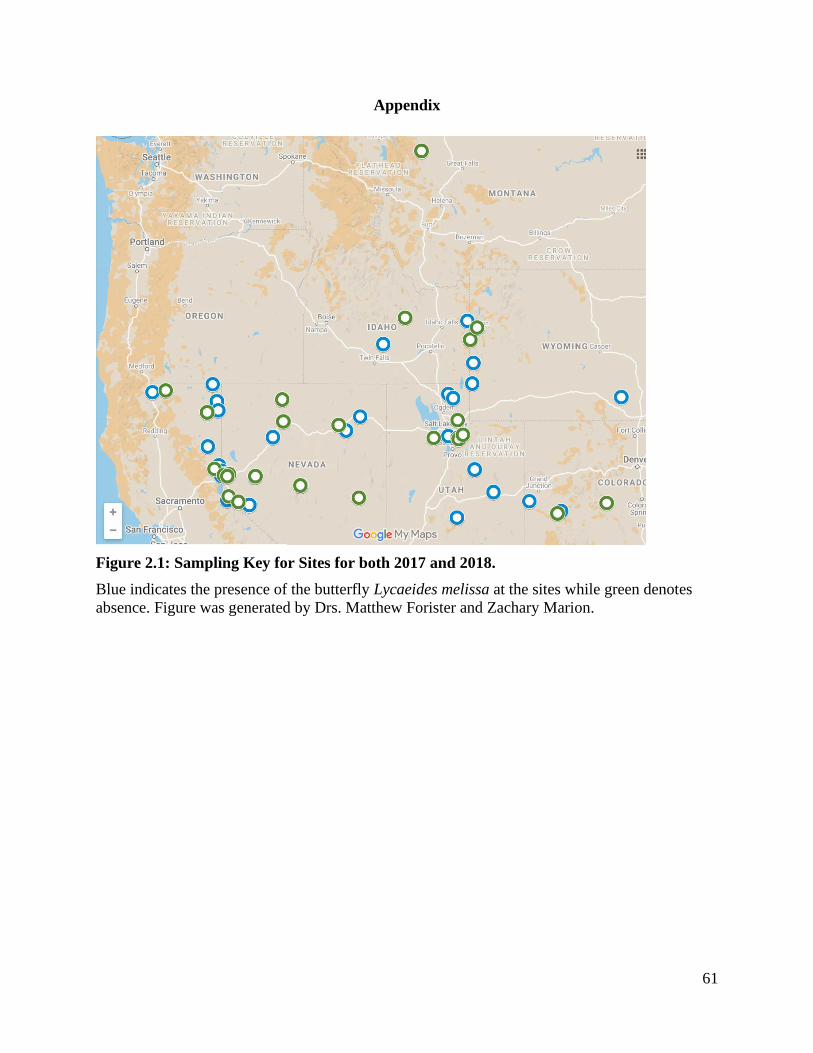
61
Appendix
Figure 2.1: Sampling Key for Sites for both 2017 and 2018.
Blue indicates the presence of the butterfly Lycaeides melissa at the sites while green denotes
absence. Figure was generated by Drs. Matthew Forister and Zachary Marion.
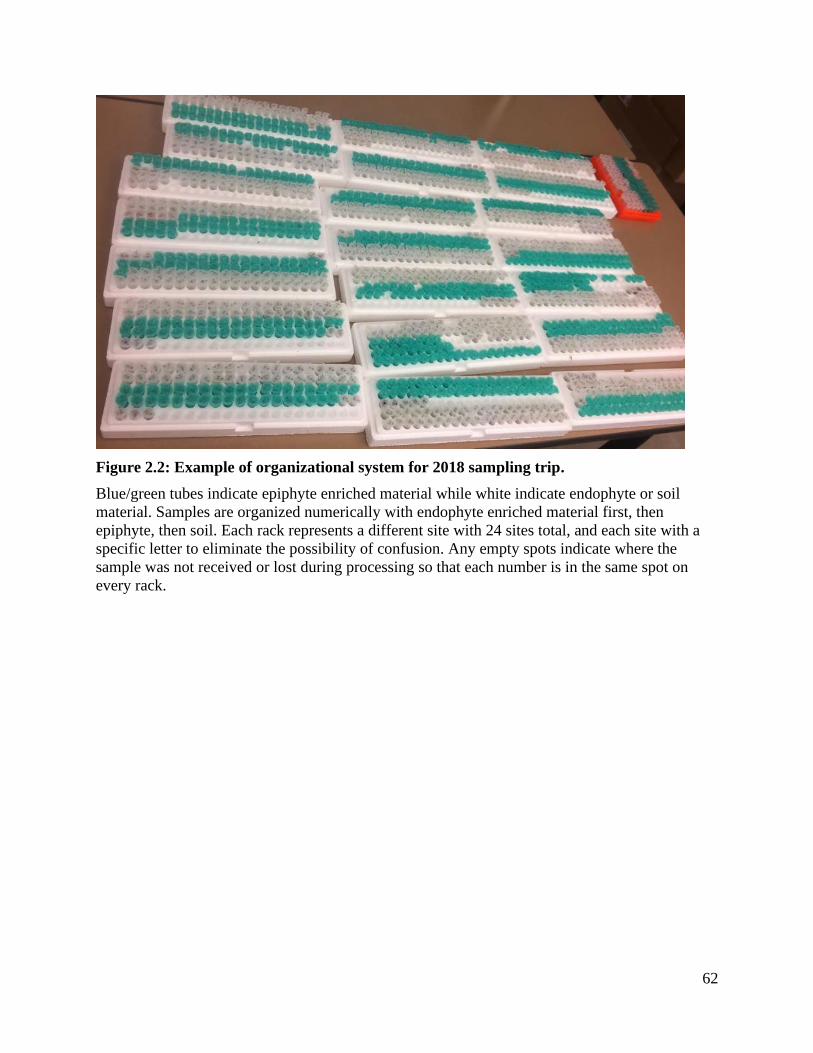
62
Figure 2.2: Example of organizational system for 2018 sampling trip.
Blue/green tubes indicate epiphyte enriched material while white indicate endophyte or soil
material. Samples are organized numerically with endophyte enriched material first, then
epiphyte, then soil. Each rack represents a different site with 24 sites total, and each site with a
specific letter to eliminate the possibility of confusion. Any empty spots indicate where the
sample was not received or lost during processing so that each number is in the same spot on
every rack.
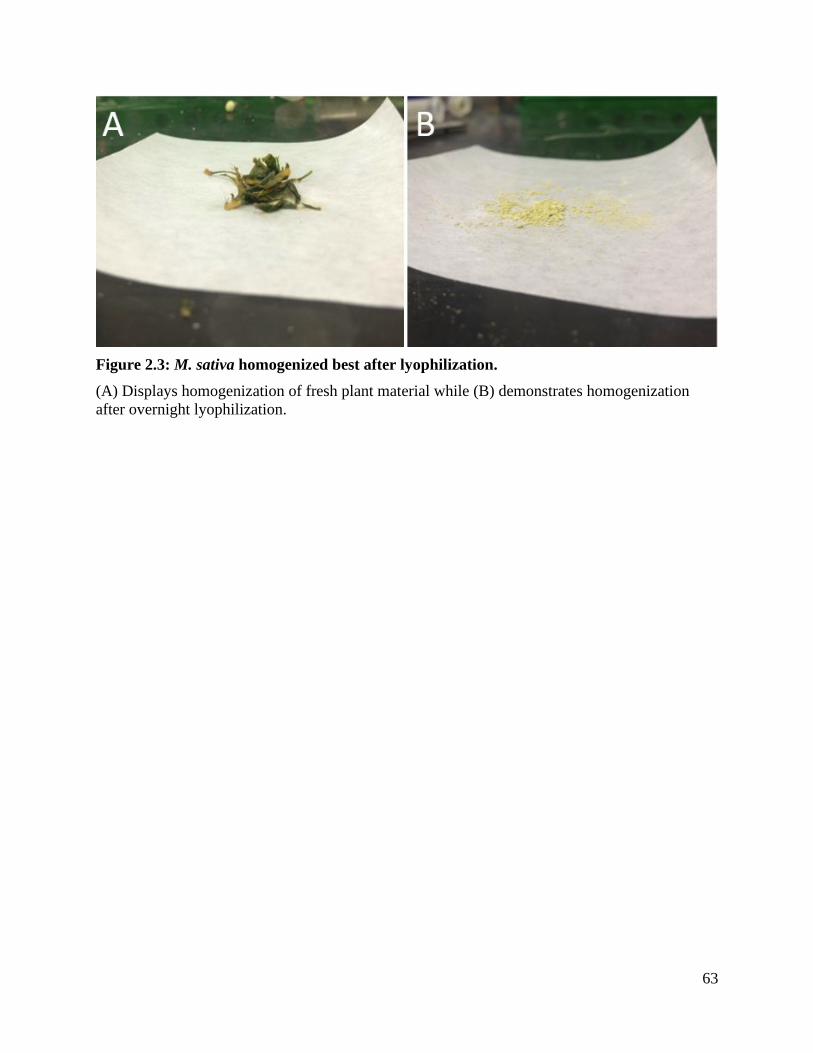
63
Figure 2.3: M. sativa homogenized best after lyophilization.
(A) Displays homogenization of fresh plant material while (B) demonstrates homogenization
after overnight lyophilization.
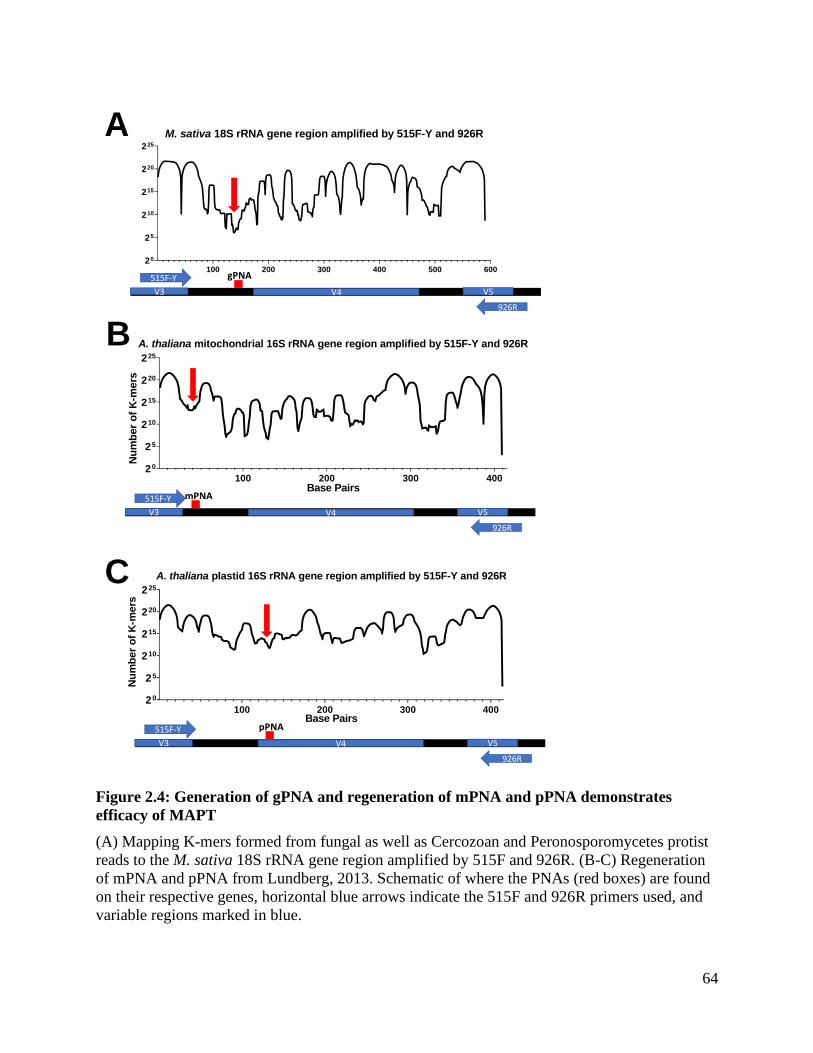
64
A
B
C
100 200 300 40020
25
210
215
220
225
A. thaliana mitochondrial 16S rRNA gene region amplified by 515F-Y and 926R
Base Pairs
Nu
mb
er
of
K-m
ers
100 200 300 40020
25
210
215
220
225
A. thaliana plastid 16S rRNA gene region amplified by 515F-Y and 926R
Base Pairs
Nu
mb
er
of
K-m
ers
515F-Y
V4 V5
gPNA
V3
926R
515F-Y
V4 V5
mPNA
V3
926R
515F-Y
V4 V5
pPNA
V3
926R
100 200 300 400 500 60020
25
210
215
220
225
M. sativa 18S rRNA gene region amplified by 515F-Y and 926R
Figure 2.4: Generation of gPNA and regeneration of mPNA and pPNA demonstrates
efficacy of MAPT
(A) Mapping K-mers formed from fungal as well as Cercozoan and Peronosporomycetes protist
reads to the M. sativa 18S rRNA gene region amplified by 515F and 926R. (B-C) Regeneration
of mPNA and pPNA from Lundberg, 2013. Schematic of where the PNAs (red boxes) are found
on their respective genes, horizontal blue arrows indicate the 515F and 926R primers used, and
variable regions marked in blue.
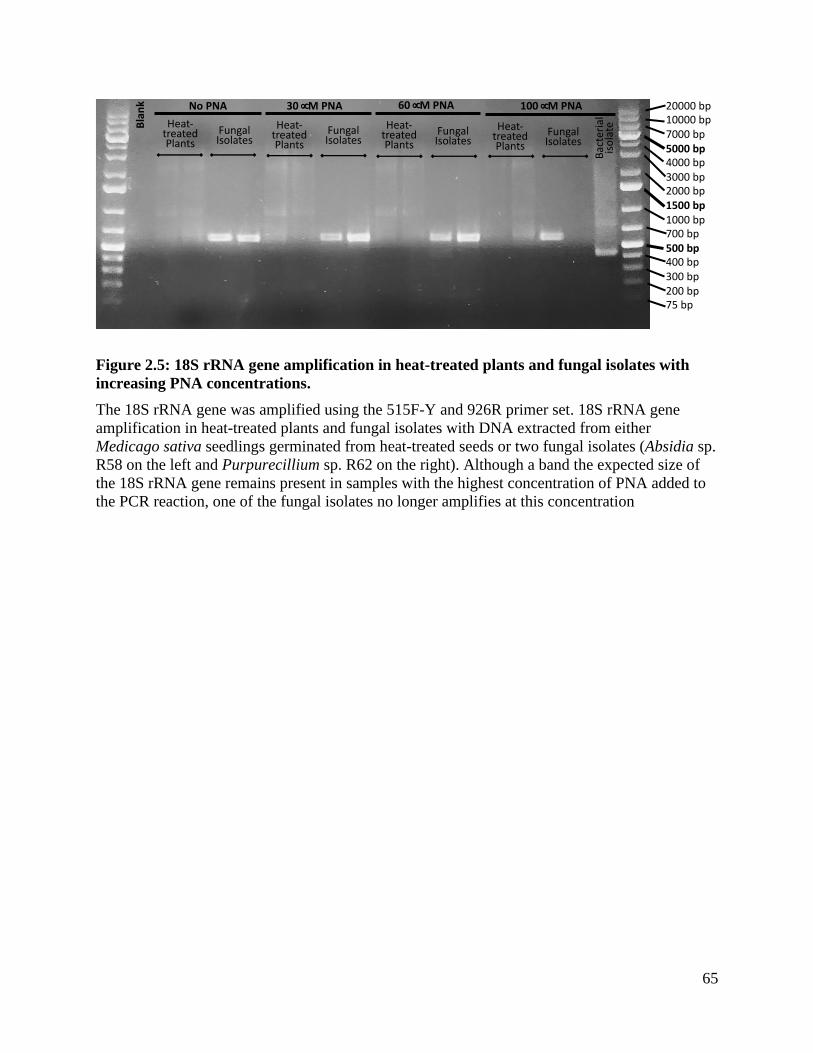
65
Figure 2.5: 18S rRNA gene amplification in heat-treated plants and fungal isolates with
increasing PNA concentrations.
The 18S rRNA gene was amplified using the 515F-Y and 926R primer set. 18S rRNA gene
amplification in heat-treated plants and fungal isolates with DNA extracted from either
Medicago sativa seedlings germinated from heat-treated seeds or two fungal isolates (Absidia sp.
R58 on the left and Purpurecillium sp. R62 on the right). Although a band the expected size of
the 18S rRNA gene remains present in samples with the highest concentration of PNA added to
the PCR reaction, one of the fungal isolates no longer amplifies at this concentration
20000 bp10000 bp7000 bp5000 bp4000 bp3000 bp2000 bp1500 bp1000 bp700 bp500 bp400 bp300 bp200 bp75 bp
Bla
nk No PNA 30 µM PNA 60 µM PNA 100 µM PNA
Heat-treatedPlants
FungalIsolates
FungalIsolates
FungalIsolates
FungalIsolates
Bac
teri
alis
ola
teHeat-treatedPlants
Heat-treatedPlants
Heat-treatedPlants
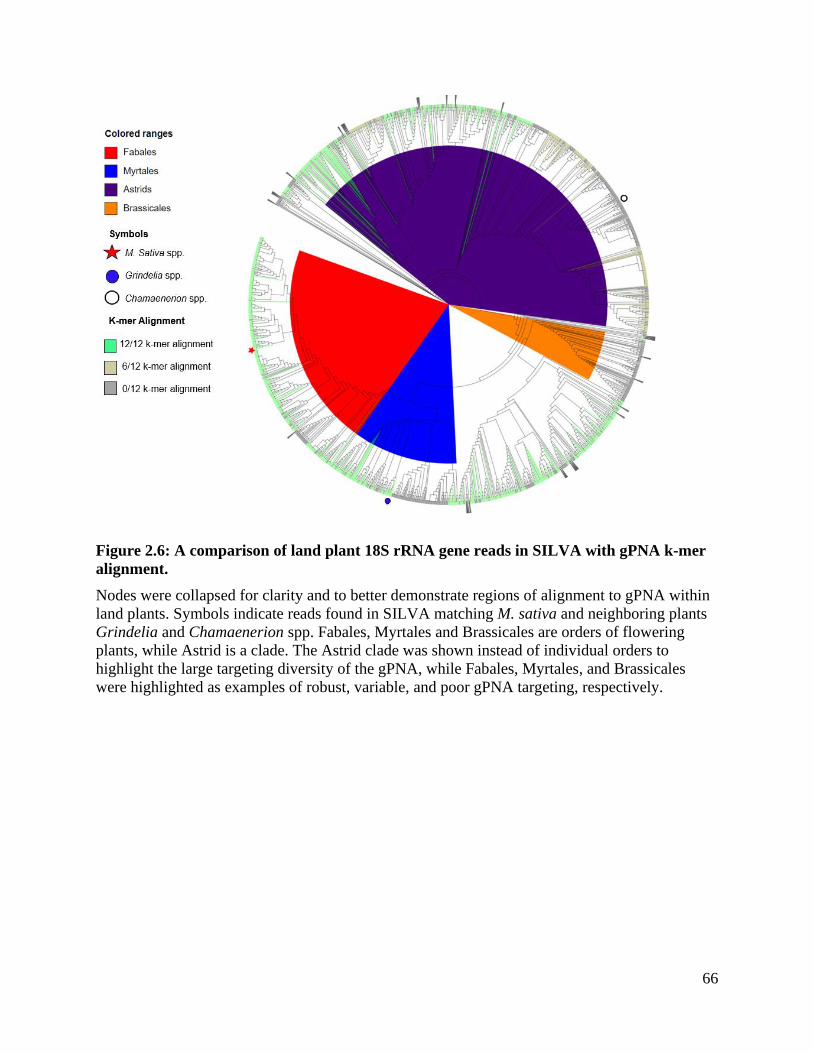
66
Figure 2.6: A comparison of land plant 18S rRNA gene reads in SILVA with gPNA k-mer
alignment.
Nodes were collapsed for clarity and to better demonstrate regions of alignment to gPNA within
land plants. Symbols indicate reads found in SILVA matching M. sativa and neighboring plants
Grindelia and Chamaenerion spp. Fabales, Myrtales and Brassicales are orders of flowering
plants, while Astrid is a clade. The Astrid clade was shown instead of individual orders to
highlight the large targeting diversity of the gPNA, while Fabales, Myrtales, and Brassicales
were highlighted as examples of robust, variable, and poor gPNA targeting, respectively.
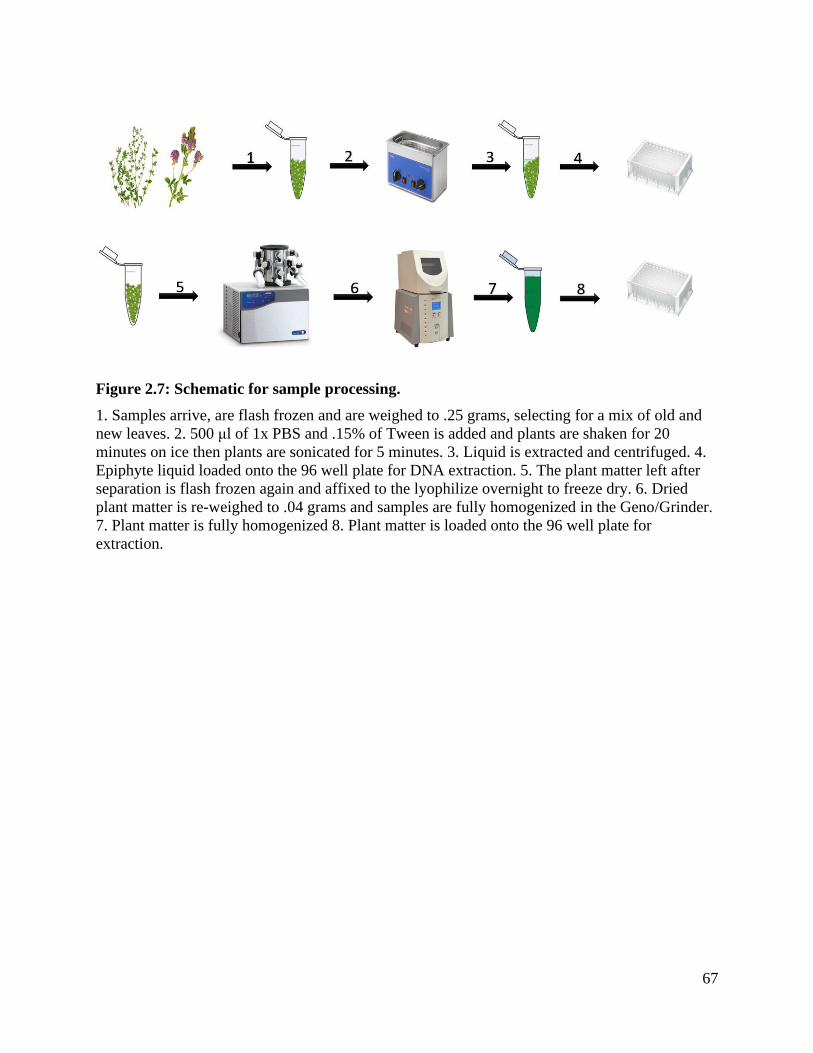
67
Figure 2.7: Schematic for sample processing.
1. Samples arrive, are flash frozen and are weighed to .25 grams, selecting for a mix of old and
new leaves. 2. 500 μl of 1x PBS and .15% of Tween is added and plants are shaken for 20
minutes on ice then plants are sonicated for 5 minutes. 3. Liquid is extracted and centrifuged. 4.
Epiphyte liquid loaded onto the 96 well plate for DNA extraction. 5. The plant matter left after
separation is flash frozen again and affixed to the lyophilize overnight to freeze dry. 6. Dried
plant matter is re-weighed to .04 grams and samples are fully homogenized in the Geno/Grinder.
7. Plant matter is fully homogenized 8. Plant matter is loaded onto the 96 well plate for
extraction.
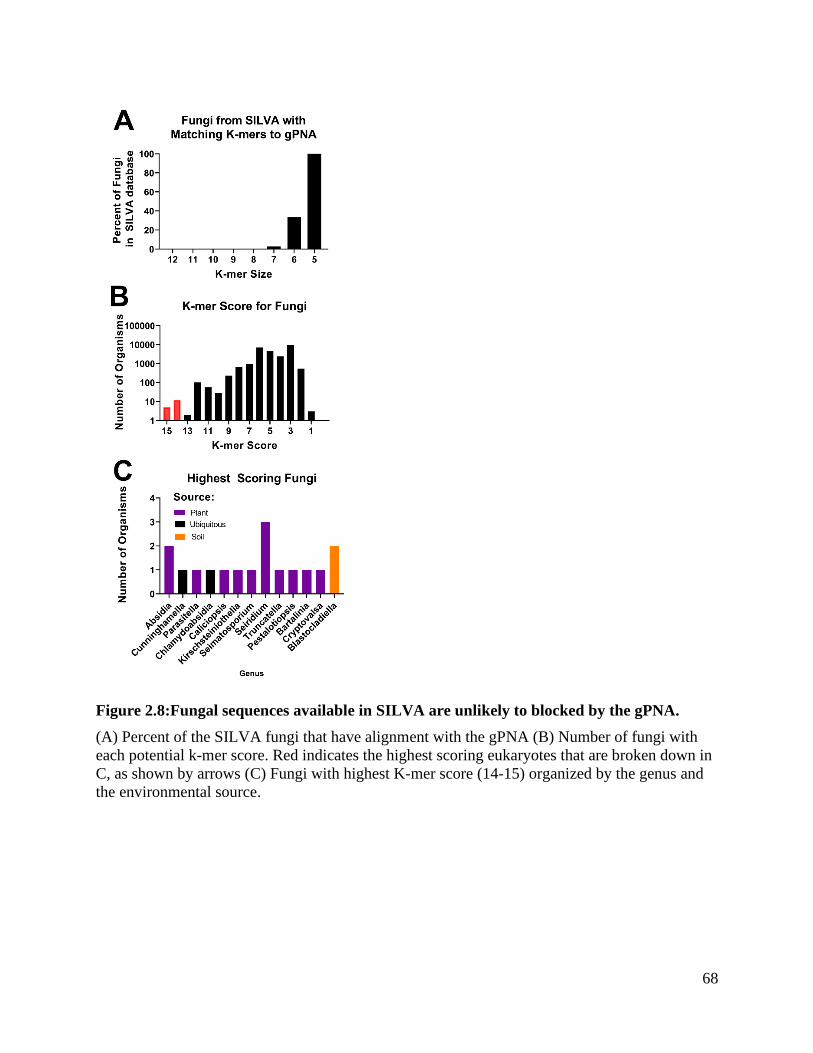
68
Figure 2.8:Fungal sequences available in SILVA are unlikely to blocked by the gPNA.
(A) Percent of the SILVA fungi that have alignment with the gPNA (B) Number of fungi with
each potential k-mer score. Red indicates the highest scoring eukaryotes that are broken down in
C, as shown by arrows (C) Fungi with highest K-mer score (14-15) organized by the genus and
the environmental source.
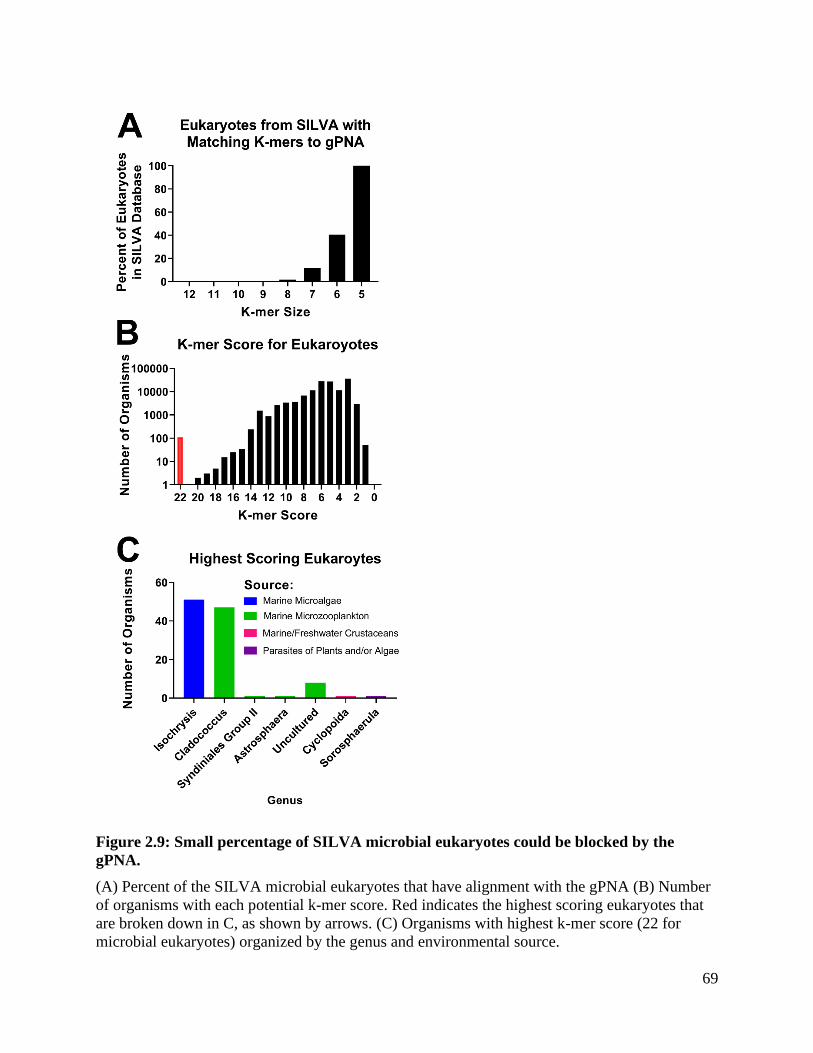
69
Figure 2.9: Small percentage of SILVA microbial eukaryotes could be blocked by the
gPNA.
(A) Percent of the SILVA microbial eukaryotes that have alignment with the gPNA (B) Number
of organisms with each potential k-mer score. Red indicates the highest scoring eukaryotes that
are broken down in C, as shown by arrows. (C) Organisms with highest k-mer score (22 for
microbial eukaryotes) organized by the genus and environmental source.
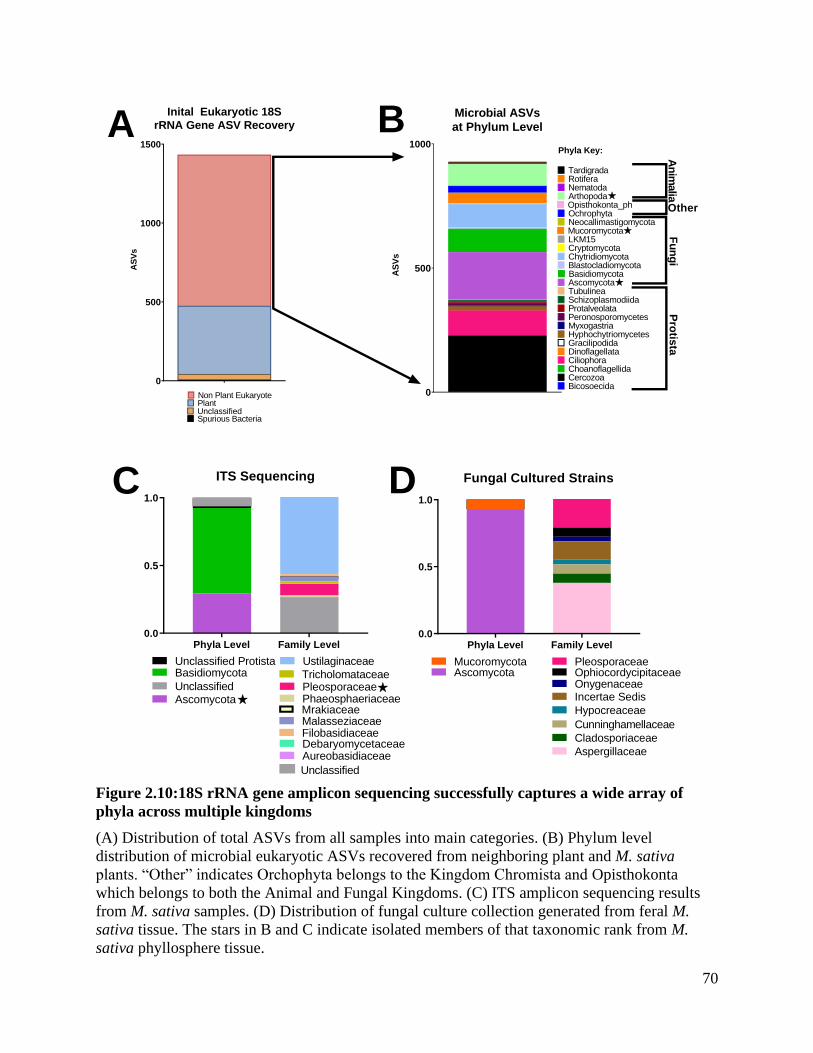
70
0
500
1000
1500
Inital Eukaryotic 18S
rRNA Gene ASV RecoveryA
SV
s
Plant
Spurious BacteriaUnclassified
Non Plant Eukaryote 0
500
1000
Microbial ASVs
at Phylum Level
AS
Vs
BicosoecidaCercozoaChoanoflagellidaCiliophoraDinoflagellataGracilipodidaHyphochytriomycetesMyxogastriaPeronosporomycetesProtalveolataSchizoplasmodiidaTubulineaAscomycotaBasidiomycotaBlastocladiomycotaChytridiomycotaCryptomycotaLKM15MucoromycotaNeocallimastigomycotaOchrophytaOpisthokonta_phArthopodaNematodaRotiferaTardigrada
Phyla Key:
A B
Phyla Level Family Level0.0
0.5
1.0
Fungal Cultured Strains
AscomycotaMucoromycota
Aspergillaceae
Cladosporiaceae
Cunninghamellaceae
Hypocreaceae
Incertae SedisOnygenaceaeOphiocordycipitaceaePleosporaceae
Phyla Level Family Level0.0
0.5
1.0
ITS Sequencing
UnclassifiedAscomycota
BasidiomycotaUnclassified Protista
Aureobasidiaceae
PhaeosphaeriaceaePleosporaceae
Debaryomycetaceae
Tricholomataceae
MalasseziaceaeMrakiaceae
Filobasidiaceae
Ustilaginaceae
Unclassified
C D
An
imalia
Fu
ng
iP
rotis
ta
Other
Figure 2.10:18S rRNA gene amplicon sequencing successfully captures a wide array of
phyla across multiple kingdoms
(A) Distribution of total ASVs from all samples into main categories. (B) Phylum level
distribution of microbial eukaryotic ASVs recovered from neighboring plant and M. sativa
plants. “Other” indicates Orchophyta belongs to the Kingdom Chromista and Opisthokonta
which belongs to both the Animal and Fungal Kingdoms. (C) ITS amplicon sequencing results
from M. sativa samples. (D) Distribution of fungal culture collection generated from feral M.
sativa tissue. The stars in B and C indicate isolated members of that taxonomic rank from M.
sativa phyllosphere tissue.
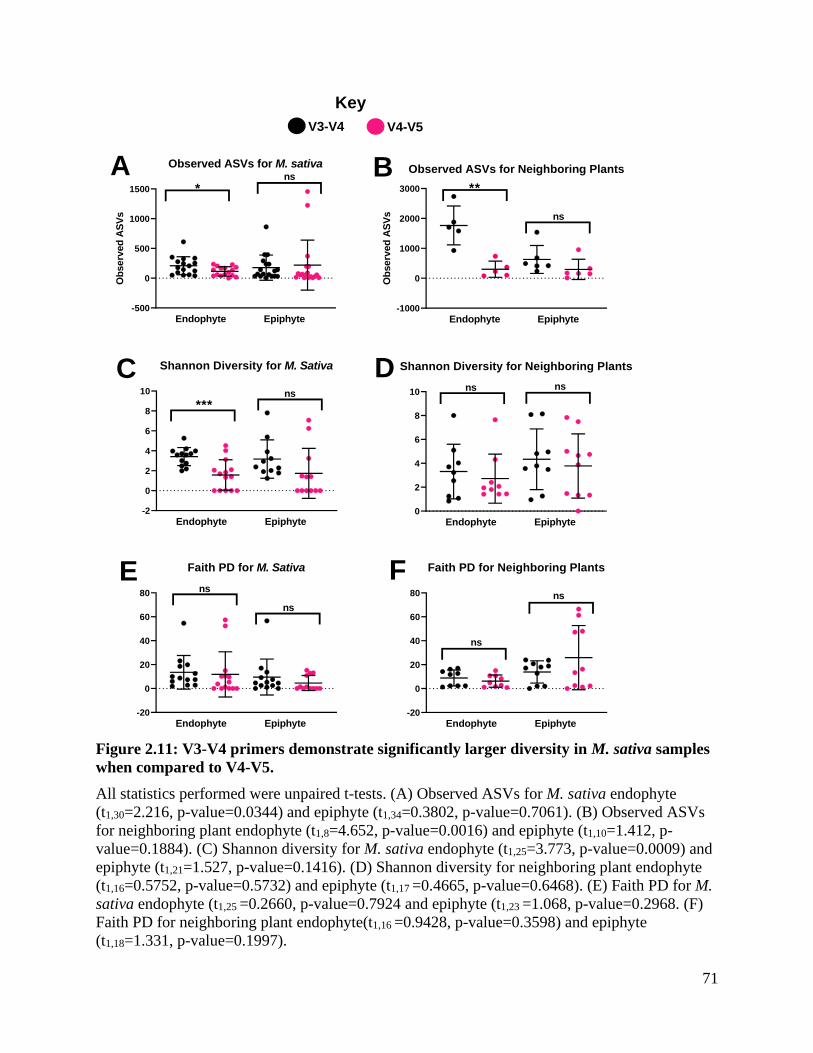
71
-500
0
500
1000
1500
Observed ASVs for M. sativa
Ob
serv
ed
AS
Vs
Endophyte Epiphyte
*ns
-1000
0
1000
2000
3000
Observed ASVs for Neighboring Plants
Ob
serv
ed
AS
Vs
Endophyte Epiphyte
**
ns
-2
0
2
4
6
8
10
Shannon Diversity for M. Sativa
***ns
Endophyte Epiphyte0
2
4
6
8
10
Shannon Diversity for Neighboring Plants
ns ns
Endophyte Epiphyte
-20
0
20
40
60
80
Faith PD for M. Sativa
Endophyte Epiphyte
ns
ns
-20
0
20
40
60
80
Faith PD for Neighboring Plants
Endophyte Epiphyte
ns
ns
A
C
E
D
B
F
Key
V3-V4 V4-V5
Figure 2.11: V3-V4 primers demonstrate significantly larger diversity in M. sativa samples
when compared to V4-V5.
All statistics performed were unpaired t-tests. (A) Observed ASVs for M. sativa endophyte
(t1,30=2.216, p-value=0.0344) and epiphyte (t1,34=0.3802, p-value=0.7061). (B) Observed ASVs
for neighboring plant endophyte (t1,8=4.652, p-value=0.0016) and epiphyte (t1,10=1.412, p-
value=0.1884). (C) Shannon diversity for M. sativa endophyte (t1,25=3.773, p-value=0.0009) and
epiphyte (t1,21=1.527, p-value=0.1416). (D) Shannon diversity for neighboring plant endophyte
(t1,16=0.5752, p-value=0.5732) and epiphyte (t1,17 =0.4665, p-value=0.6468). (E) Faith PD for M.
sativa endophyte (t1,25 =0.2660, p-value=0.7924 and epiphyte (t1,23 =1.068, p-value=0.2968. (F)
Faith PD for neighboring plant endophyte(t1,16 =0.9428, p-value=0.3598) and epiphyte
(t1,18=1.331, p-value=0.1997).
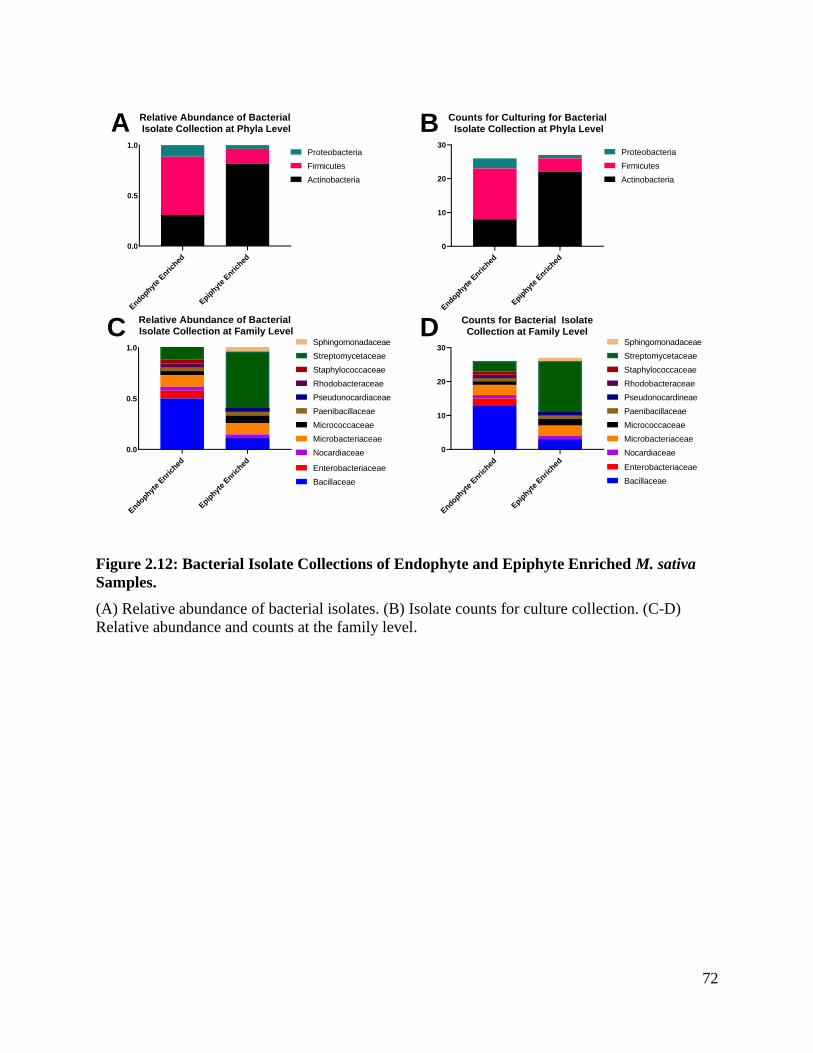
72
Figure 2.12: Bacterial Isolate Collections of Endophyte and Epiphyte Enriched M. sativa
Samples.
(A) Relative abundance of bacterial isolates. (B) Isolate counts for culture collection. (C-D)
Relative abundance and counts at the family level.
Endophyt
e Enri
ched
Epip
hyte
Enrich
ed
0
10
20
30
Counts for Culturing for Bacterial Isolate Collection at Phyla Level
Actinobacteria
Firmicutes
Proteobacteria
Endophyt
e Enri
ched
Epip
hyte
Enrich
ed
0.0
0.5
1.0
Relative Abundance of Bacterial Isolate Collection at Phyla Level
Actinobacteria
Firmicutes
Proteobacteria
Endophyt
e Enri
ched
Epip
hyte
Enrich
ed
0
10
20
30
Counts for Bacterial IsolateCollection at Family Level
Bacillaceae
Enterobacteriaceae
Nocardiaceae
Microbacteriaceae
Micrococcaceae
Paenibacillaceae
Pseudonocardineae
Rhodobacteraceae
Staphylococcaceae
Streptomycetaceae
Sphingomonadaceae
Endophyt
e Enri
ched
Epip
hyte
Enrich
ed
0.0
0.5
1.0
Relative Abundance of Bacterial Isolate Collection at Family Level
Bacillaceae
Enterobacteriaceae
Nocardiaceae
Microbacteriaceae
Micrococcaceae
Paenibacillaceae
Pseudonocardiaceae
Rhodobacteraceae
Staphylococcaceae
Streptomycetaceae
Sphingomonadaceae
A B
C D
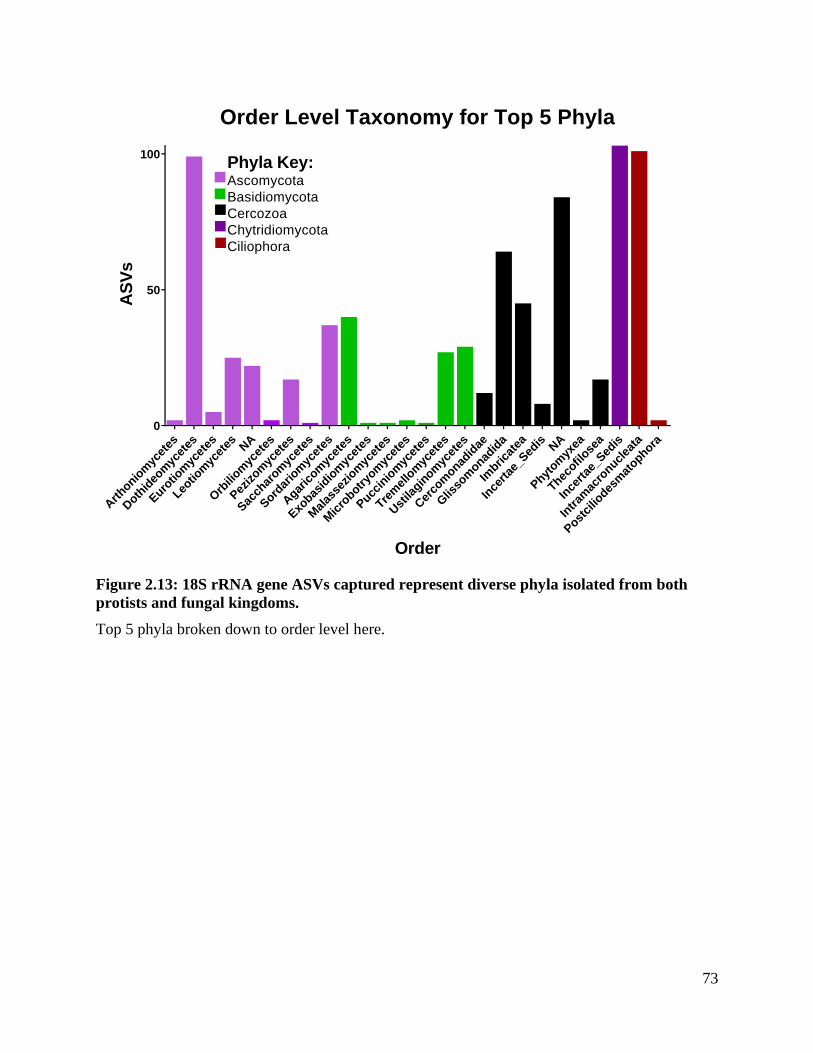
73
Arthonio
myc
etes
Doth
ideo
myc
etes
Euro
tiom
ycet
es
Leotio
myc
etes N
A
Orb
iliom
ycet
es
Pez
izom
ycet
es
Sac
char
omyc
etes
Sord
ario
myc
etes
Agar
icom
ycet
es
Exo
basid
iom
ycet
es
Mal
asse
ziom
ycet
es
Mic
robotr
yom
ycet
es
Pucc
inio
myc
etes
Trem
ello
myc
etes
Ust
ilagin
omyc
etes
Cer
com
onadid
ae
Glis
som
onadid
a
Imbric
atea
Ince
rtae
_Sed
is NA
Phyt
omyx
ea
Thecofil
osea
Ince
rtae
_Sed
is
Intram
acro
nuclea
ta
Post
cilio
desm
atophora
0
50
100
Order Level Taxonomy for Top 5 Phyla
Order
AS
Vs
Phyla Key:Ascomycota
Basidiomycota
Cercozoa
Chytridiomycota
Ciliophora
Figure 2.13: 18S rRNA gene ASVs captured represent diverse phyla isolated from both
protists and fungal kingdoms.
Top 5 phyla broken down to order level here.
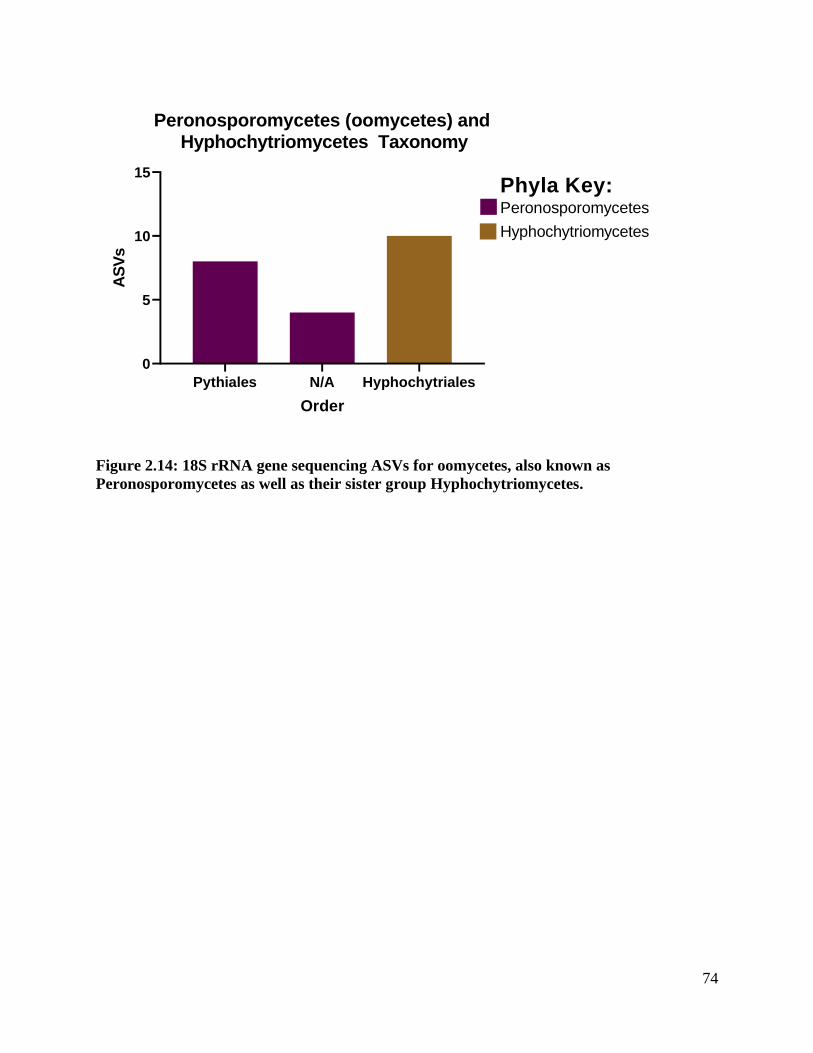
74
Pythiales N/A Hyphochytriales
0
5
10
15
Peronosporomycetes (oomycetes) and Hyphochytriomycetes Taxonomy
Order
AS
Vs
Phyla Key:Peronosporomycetes
Hyphochytriomycetes
Figure 2.14: 18S rRNA gene sequencing ASVs for oomycetes, also known as
Peronosporomycetes as well as their sister group Hyphochytriomycetes.
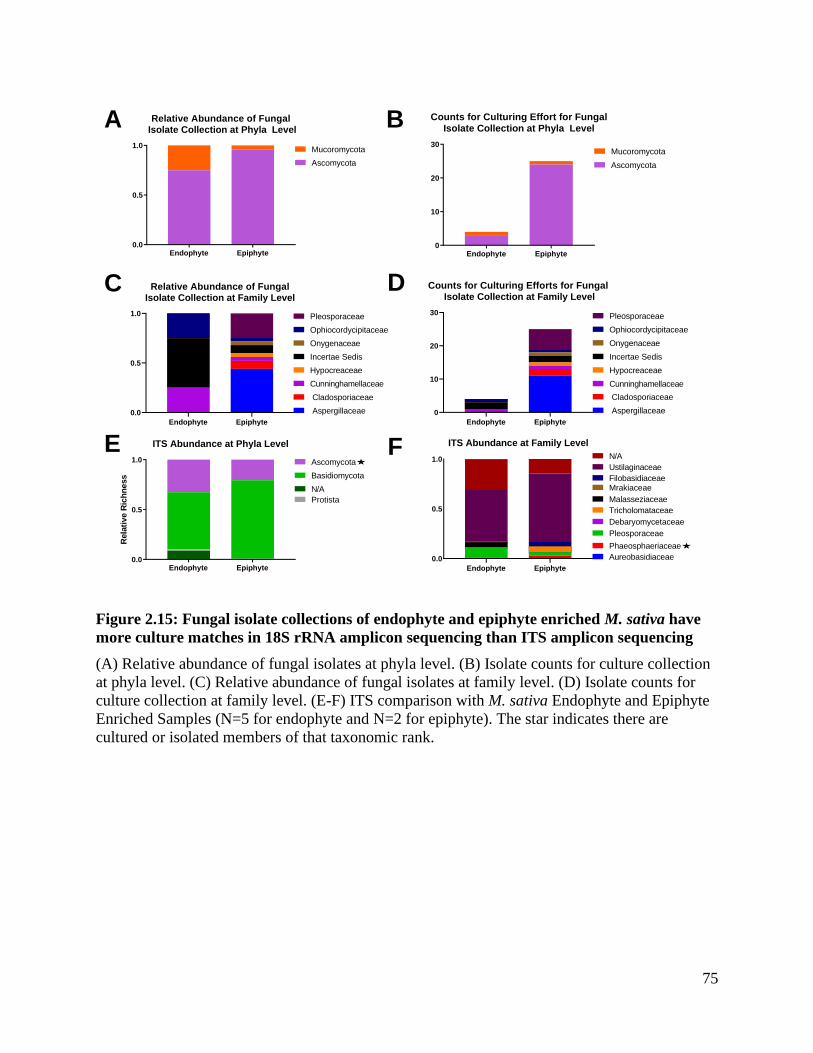
75
Endophyte Epiphyte0.0
0.5
1.0
Relative Abundance of Fungal Isolate Collection at Phyla Level
Ascomycota
Mucoromycota
Endophyte Epiphyte0
10
20
30
Counts for Culturing Effort for FungalIsolate Collection at Phyla Level
Ascomycota
Mucoromycota
A
Endophyte Epiphyte
0
10
20
30
Counts for Culturing Efforts for Fungal Isolate Collection at Family Level
Aspergillaceae
Cladosporiaceae
Cunninghamellaceae
Hypocreaceae
Incertae Sedis
Onygenaceae
Ophiocordycipitaceae
Pleosporaceae
Endophyte Epiphyte
0.0
0.5
1.0
Relative Abundance of FungalIsolate Collection at Family Level
Aspergillaceae
Cladosporiaceae
Cunninghamellaceae
Hypocreaceae
Incertae Sedis
Onygenaceae
Ophiocordycipitaceae
Pleosporaceae
Endophyte Epiphyte0.0
0.5
1.0
ITS Abundance at Phyla Level
Rela
tive R
ich
ness
N/A
Ascomycota
Basidiomycota
Protista
Endophyte Epiphyte
0.0
0.5
1.0
ITS Abundance at Family Level
Aureobasidiaceae
Phaeosphaeriaceae
Pleosporaceae
Debaryomycetaceae
Tricholomataceae
Malasseziaceae
MrakiaceaeFilobasidiaceae
Ustilaginaceae
N/A
C
E
B
D
F
Figure 2.15: Fungal isolate collections of endophyte and epiphyte enriched M. sativa have
more culture matches in 18S rRNA amplicon sequencing than ITS amplicon sequencing
(A) Relative abundance of fungal isolates at phyla level. (B) Isolate counts for culture collection
at phyla level. (C) Relative abundance of fungal isolates at family level. (D) Isolate counts for
culture collection at family level. (E-F) ITS comparison with M. sativa Endophyte and Epiphyte
Enriched Samples (N=5 for endophyte and N=2 for epiphyte). The star indicates there are
cultured or isolated members of that taxonomic rank.
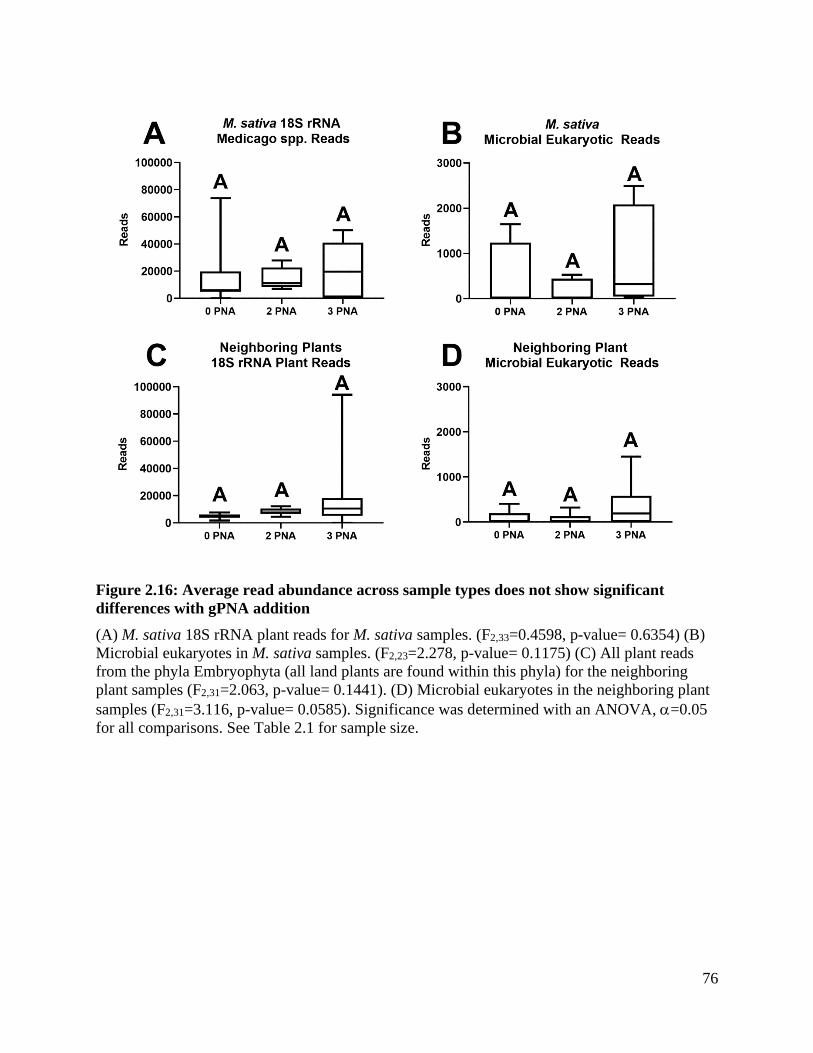
76
Figure 2.16: Average read abundance across sample types does not show significant
differences with gPNA addition
(A) M. sativa 18S rRNA plant reads for M. sativa samples. (F2,33=0.4598, p-value= 0.6354) (B)
Microbial eukaryotes in M. sativa samples. (F2,23=2.278, p-value= 0.1175) (C) All plant reads
from the phyla Embryophyta (all land plants are found within this phyla) for the neighboring
plant samples (F2,31=2.063, p-value= 0.1441). (D) Microbial eukaryotes in the neighboring plant
samples (F2,31=3.116, p-value= 0.0585). Significance was determined with an ANOVA, =0.05
for all comparisons. See Table 2.1 for sample size.
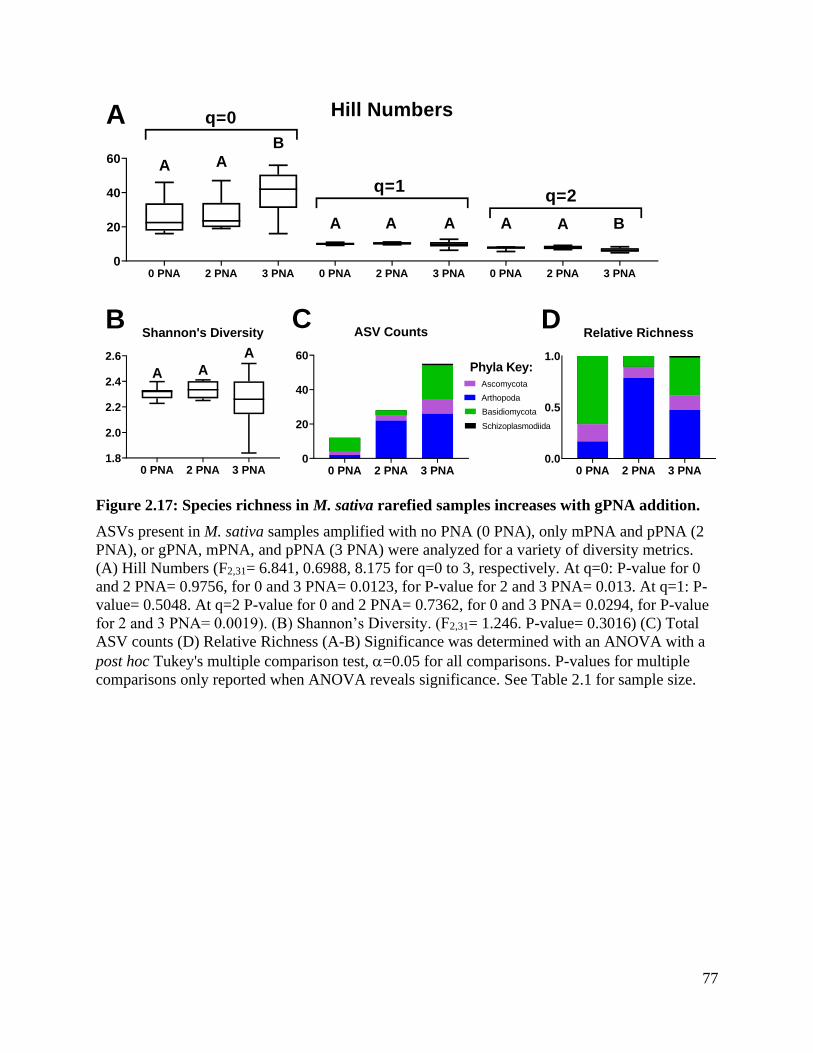
77
0 PNA 2 PNA 3 PNA1.8
2.0
2.2
2.4
2.6
Shannon's Diversity
AA
A
0 PNA 2 PNA 3 PNA0
20
40
60
ASV Counts
0 PNA 2 PNA 3 PNA0.0
0.5
1.0
Relative Richness
Arthopoda
Ascomycota
Basidiomycota
Schizoplasmodiida
A
0 PNA 2 PNA 3 PNA 0 PNA 2 PNA 3 PNA 0 PNA 2 PNA 3 PNA0
20
40
60
Hill Numbers
A A
B
A A A A A B
q=0
q=1q=2
Phyla Key:
DB C
Figure 2.17: Species richness in M. sativa rarefied samples increases with gPNA addition.
ASVs present in M. sativa samples amplified with no PNA (0 PNA), only mPNA and pPNA (2
PNA), or gPNA, mPNA, and pPNA (3 PNA) were analyzed for a variety of diversity metrics.
(A) Hill Numbers (F2,31= 6.841, 0.6988, 8.175 for q=0 to 3, respectively. At q=0: P-value for 0
and 2 PNA= 0.9756, for 0 and 3 PNA= 0.0123, for P-value for 2 and 3 PNA= 0.013. At q=1: P-
value= 0.5048. At q=2 P-value for 0 and 2 PNA= 0.7362, for 0 and 3 PNA= 0.0294, for P-value
for 2 and 3 PNA= 0.0019). (B) Shannon’s Diversity. (F2,31= 1.246. P-value= 0.3016) (C) Total
ASV counts (D) Relative Richness (A-B) Significance was determined with an ANOVA with a
post hoc Tukey's multiple comparison test, =0.05 for all comparisons. P-values for multiple
comparisons only reported when ANOVA reveals significance. See Table 2.1 for sample size.
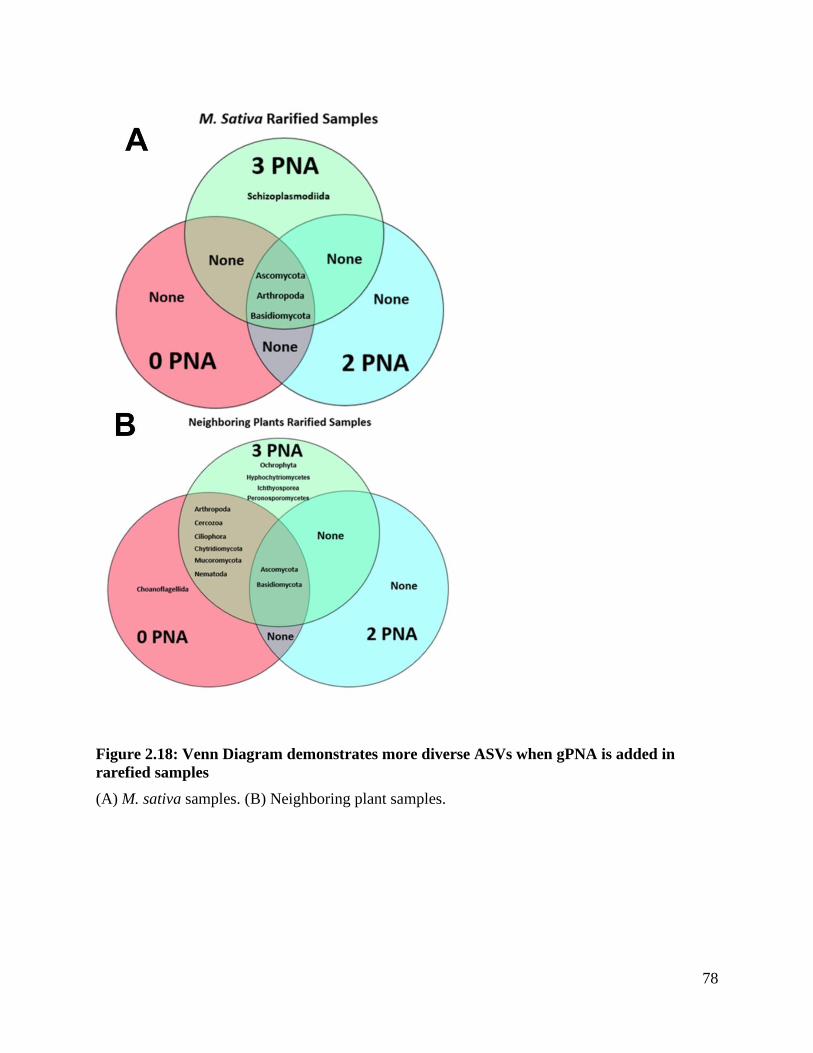
78
Figure 2.18: Venn Diagram demonstrates more diverse ASVs when gPNA is added in
rarefied samples
(A) M. sativa samples. (B) Neighboring plant samples.
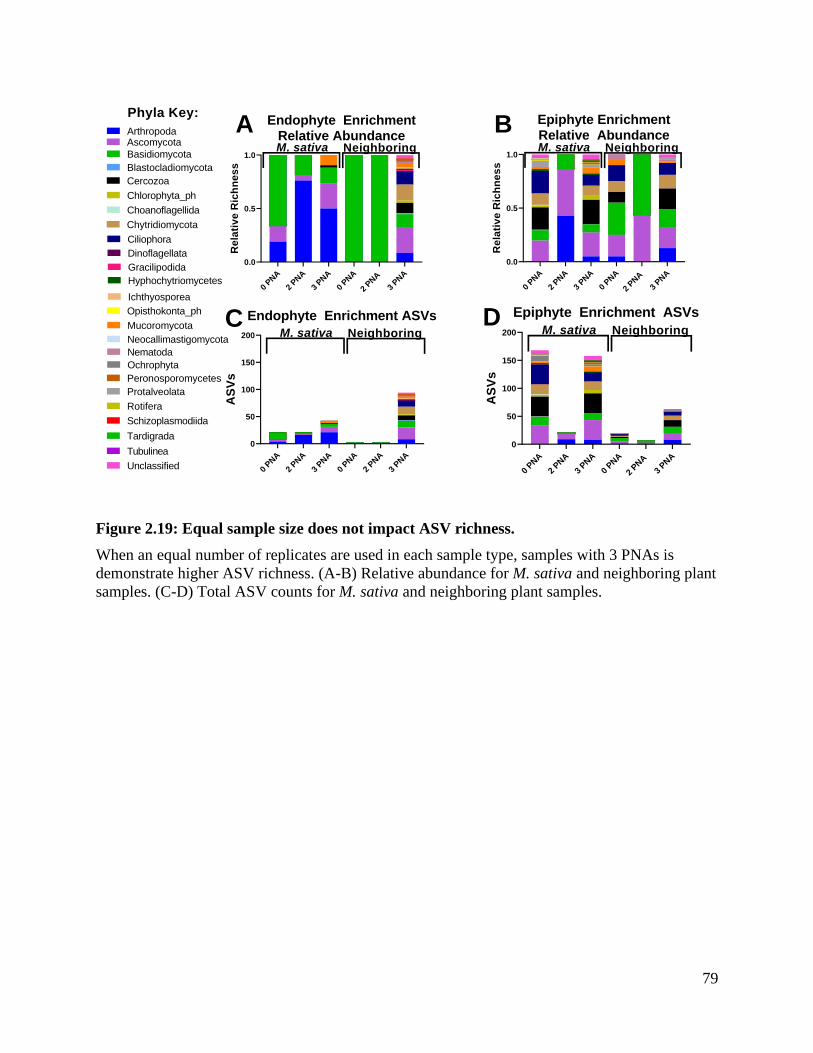
79
0 PNA
2 PNA
3 PNA
0 PNA
2 PNA
3 PNA
0
50
100
150
200
Endophyte Enrichment ASVs
AS
Vs
M. sativa Neighboring
0 PNA
2 PNA
3 PNA
0 PNA
2 PNA
3 PNA
0
50
100
150
200
Epiphyte Enrichment ASVs
AS
Vs
M. sativa Neighboring
0 PNA
2 PNA
3 PNA
0 PNA
2 PNA
3 PNA
0.0
0.5
1.0
Endophyte EnrichmentRelative Abundance
Re
lati
ve
Ric
hn
es
s
M. sativa Neighboring
0 PNA
2 PNA
3 PNA
0 PNA
2 PNA
3 PNA
0.0
0.5
1.0
Epiphyte EnrichmentRelative Abundance
Re
lati
ve
Ric
hn
es
s
M. sativa Neighboring
A B
C D
ArthropodaAscomycota
Basidiomycota
Blastocladiomycota
Cercozoa
Chlorophyta_ph
Choanoflagellida
Chytridiomycota
Ciliophora
Dinoflagellata
Gracilipodida
Hyphochytriomycetes
Ichthyosporea
Mucoromycota
Nematoda
Neocallimastigomycota
Ochrophyta
Opisthokonta_ph
Phyla Key:
Peronosporomycetes
Protalveolata
Rotifera
Schizoplasmodiida
Tardigrada
Tubulinea
Unclassified
Figure 2.19: Equal sample size does not impact ASV richness.
When an equal number of replicates are used in each sample type, samples with 3 PNAs is
demonstrate higher ASV richness. (A-B) Relative abundance for M. sativa and neighboring plant
samples. (C-D) Total ASV counts for M. sativa and neighboring plant samples.
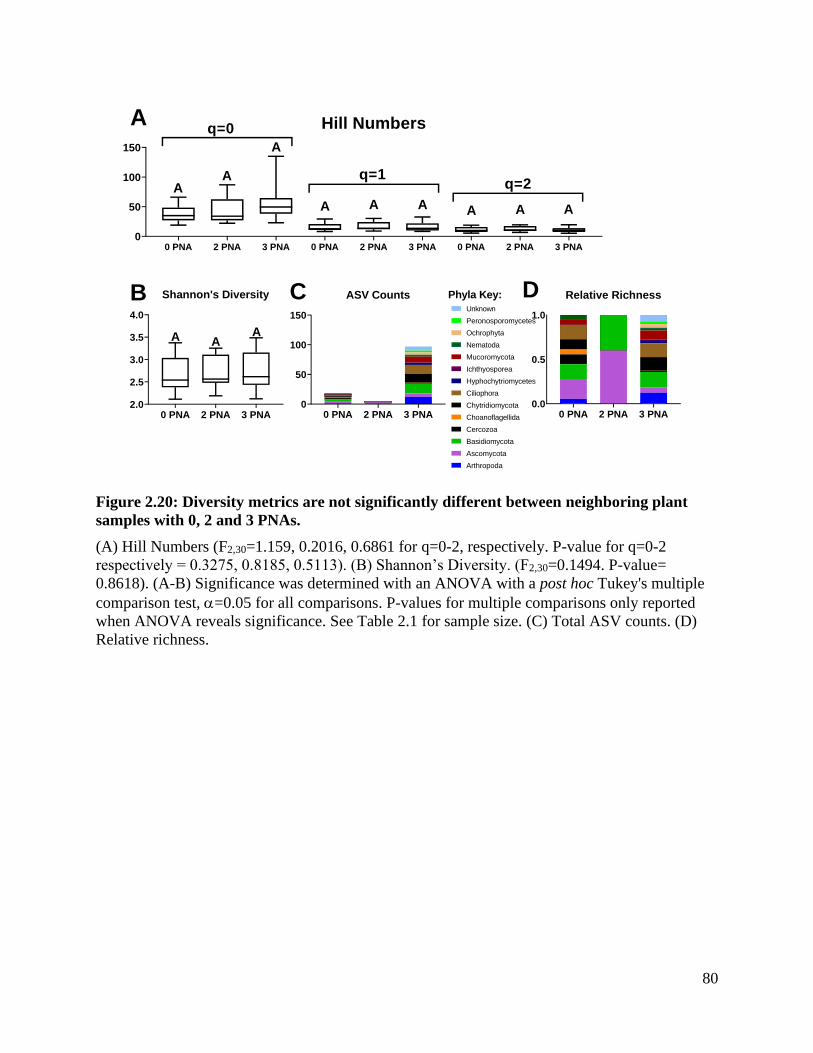
80
0 PNA 2 PNA 3 PNA2.0
2.5
3.0
3.5
4.0
Shannon's Diversity
A AA
0 PNA 2 PNA 3 PNA0
50
100
150
ASV Counts
0 PNA 2 PNA 3 PNA0.0
0.5
1.0
Relative Richness
Arthropoda
Ascomycota
Basidiomycota
Cercozoa
Choanoflagellida
Chytridiomycota
Ciliophora
Hyphochytriomycetes
Ichthyosporea
Mucoromycota
Nematoda
Ochrophyta
Peronosporomycetes
Unknown
A
B
0 PNA 2 PNA 3 PNA 0 PNA 2 PNA 3 PNA 0 PNA 2 PNA 3 PNA0
50
100
150
Hill Numbers
AA
A
q=0
A A A A A A
q=1q=2
C DPhyla Key:
Figure 2.20: Diversity metrics are not significantly different between neighboring plant
samples with 0, 2 and 3 PNAs.
(A) Hill Numbers (F2,30=1.159, 0.2016, 0.6861 for q=0-2, respectively. P-value for q=0-2
respectively = 0.3275, 0.8185, 0.5113). (B) Shannon’s Diversity. (F2,30=0.1494. P-value=
0.8618). (A-B) Significance was determined with an ANOVA with a post hoc Tukey's multiple
comparison test, =0.05 for all comparisons. P-values for multiple comparisons only reported
when ANOVA reveals significance. See Table 2.1 for sample size. (C) Total ASV counts. (D)
Relative richness.
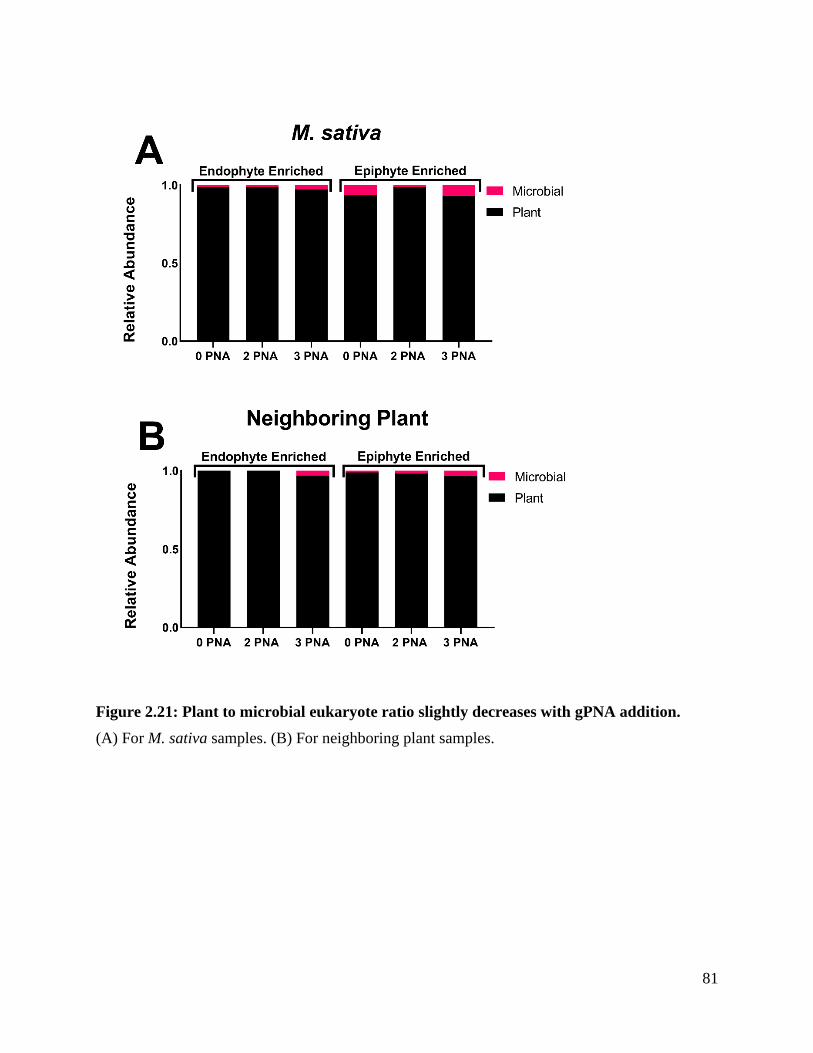
81
Figure 2.21: Plant to microbial eukaryote ratio slightly decreases with gPNA addition.
(A) For M. sativa samples. (B) For neighboring plant samples.
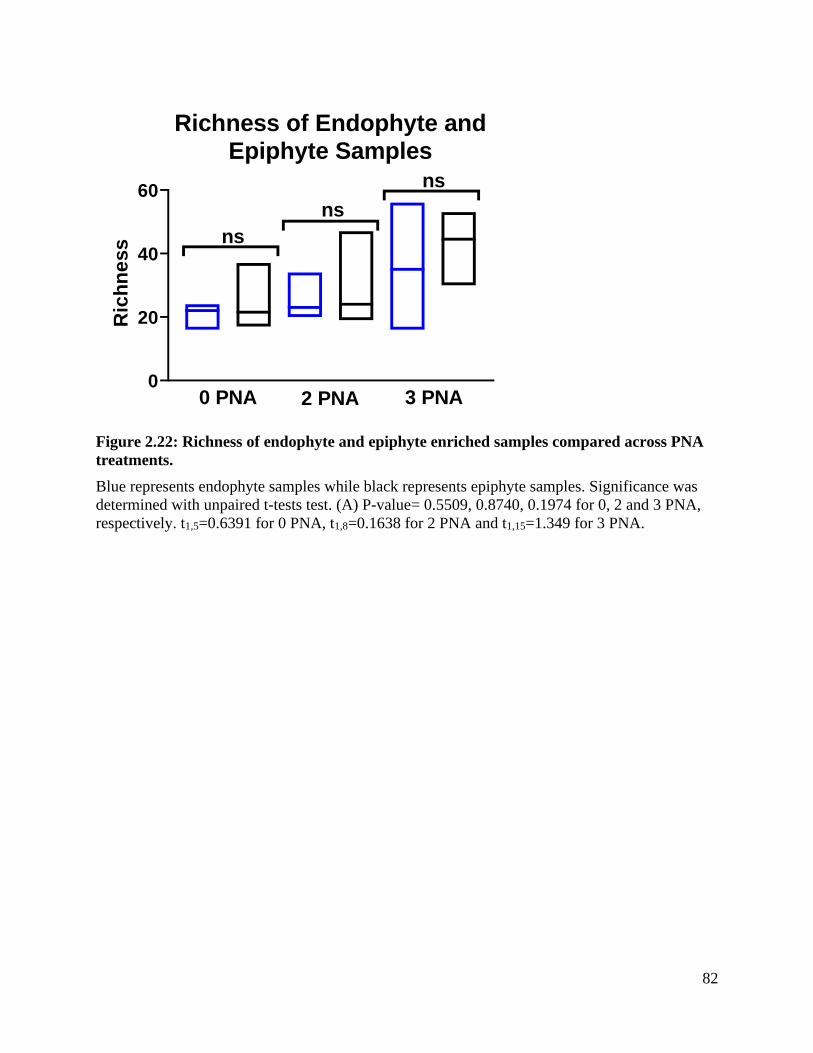
82
0
20
40
60
Richness of Endophyte andEpiphyte Samples
Ric
hn
ess ns
ns
ns
0 PNA 2 PNA 3 PNA
Figure 2.22: Richness of endophyte and epiphyte enriched samples compared across PNA
treatments.
Blue represents endophyte samples while black represents epiphyte samples. Significance was
determined with unpaired t-tests test. (A) P-value= 0.5509, 0.8740, 0.1974 for 0, 2 and 3 PNA,
respectively. t1,5=0.6391 for 0 PNA, t1,8=0.1638 for 2 PNA and t1,15=1.349 for 3 PNA.
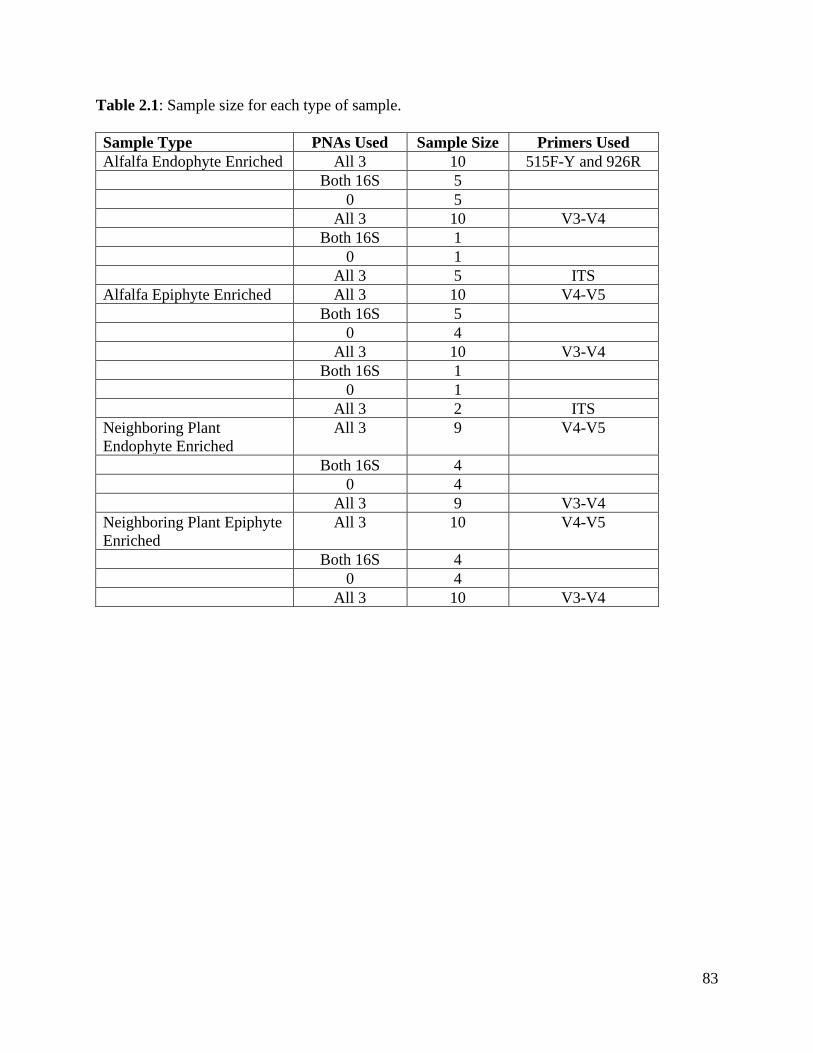
83
Table 2.1: Sample size for each type of sample.
Sample Type PNAs Used Sample Size Primers Used
Alfalfa Endophyte Enriched All 3 10 515F-Y and 926R
Both 16S 5
0 5
All 3 10 V3-V4
Both 16S 1
0 1
All 3 5 ITS
Alfalfa Epiphyte Enriched All 3 10 V4-V5
Both 16S 5
0 4
All 3 10 V3-V4
Both 16S 1
0 1
All 3 2 ITS
Neighboring Plant
Endophyte Enriched
All 3 9 V4-V5
Both 16S 4
0 4
All 3 9 V3-V4
Neighboring Plant Epiphyte
Enriched
All 3 10 V4-V5
Both 16S 4
0 4
All 3 10 V3-V4
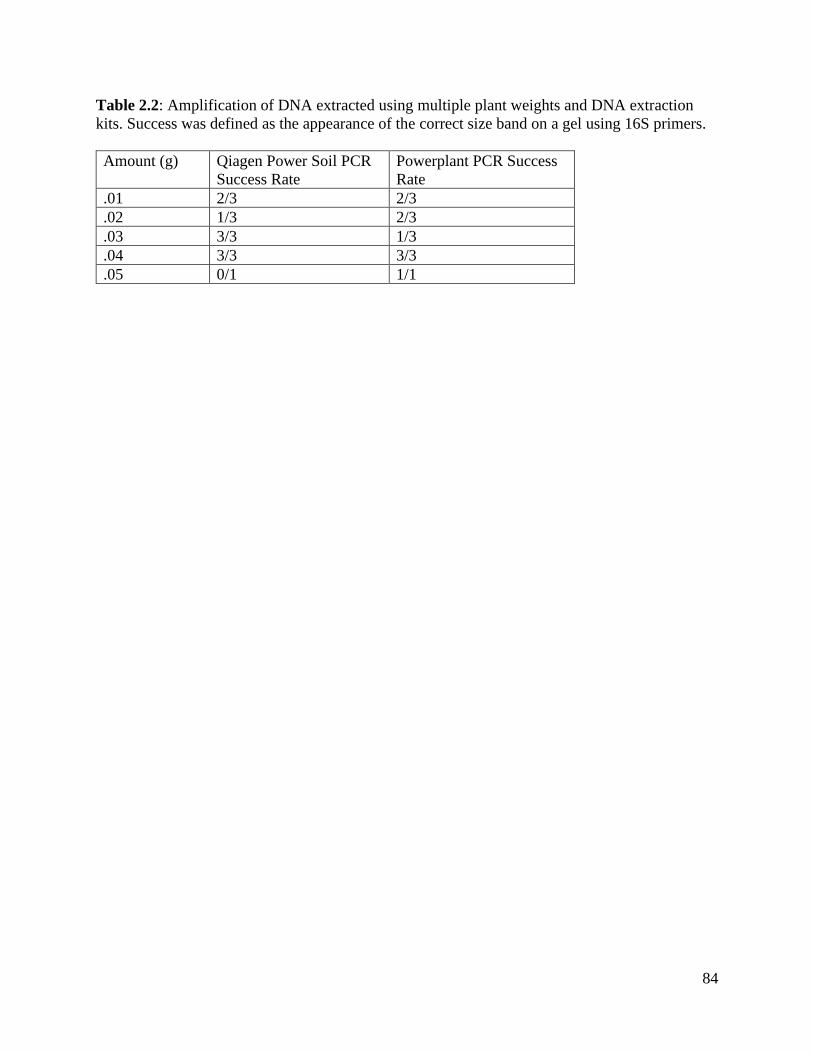
84
Table 2.2: Amplification of DNA extracted using multiple plant weights and DNA extraction
kits. Success was defined as the appearance of the correct size band on a gel using 16S primers.
Amount (g) Qiagen Power Soil PCR
Success Rate
Powerplant PCR Success
Rate
.01 2/3 2/3
.02 1/3 2/3
.03 3/3 1/3
.04 3/3 3/3
.05 0/1 1/1
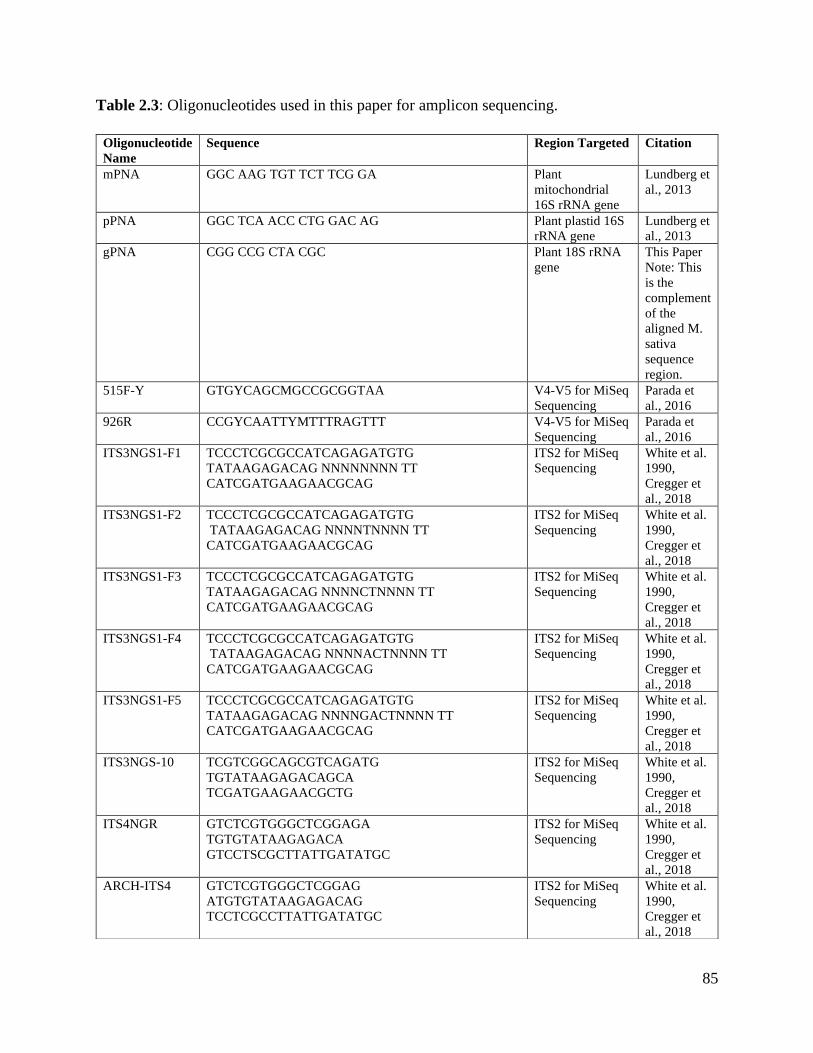
85
Table 2.3: Oligonucleotides used in this paper for amplicon sequencing.
Oligonucleotide
Name
Sequence Region Targeted Citation
mPNA GGC AAG TGT TCT TCG GA Plant
mitochondrial
16S rRNA gene
Lundberg et
al., 2013
pPNA GGC TCA ACC CTG GAC AG Plant plastid 16S
rRNA gene
Lundberg et
al., 2013
gPNA CGG CCG CTA CGC Plant 18S rRNA
gene
This Paper
Note: This
is the
complement
of the
aligned M.
sativa
sequence
region.
515F-Y GTGYCAGCMGCCGCGGTAA V4-V5 for MiSeq
Sequencing
Parada et
al., 2016
926R CCGYCAATTYMTTTRAGTTT V4-V5 for MiSeq
Sequencing
Parada et
al., 2016
ITS3NGS1-F1
TCCCTCGCGCCATCAGAGATGTG
TATAAGAGACAG NNNNNNNN TT
CATCGATGAAGAACGCAG
ITS2 for MiSeq
Sequencing
White et al.
1990,
Cregger et
al., 2018
ITS3NGS1-F2
TCCCTCGCGCCATCAGAGATGTG
TATAAGAGACAG NNNNTNNNN TT
CATCGATGAAGAACGCAG
ITS2 for MiSeq
Sequencing
White et al.
1990,
Cregger et
al., 2018
ITS3NGS1-F3
TCCCTCGCGCCATCAGAGATGTG
TATAAGAGACAG NNNNCTNNNN TT
CATCGATGAAGAACGCAG
ITS2 for MiSeq
Sequencing
White et al.
1990,
Cregger et
al., 2018
ITS3NGS1-F4
TCCCTCGCGCCATCAGAGATGTG
TATAAGAGACAG NNNNACTNNNN TT
CATCGATGAAGAACGCAG
ITS2 for MiSeq
Sequencing
White et al.
1990,
Cregger et
al., 2018
ITS3NGS1-F5
TCCCTCGCGCCATCAGAGATGTG
TATAAGAGACAG NNNNGACTNNNN TT
CATCGATGAAGAACGCAG
ITS2 for MiSeq
Sequencing
White et al.
1990,
Cregger et
al., 2018
ITS3NGS-10 TCGTCGGCAGCGTCAGATG
TGTATAAGAGACAGCA
TCGATGAAGAACGCTG
ITS2 for MiSeq
Sequencing
White et al.
1990,
Cregger et
al., 2018
ITS4NGR GTCTCGTGGGCTCGGAGA
TGTGTATAAGAGACA
GTCCTSCGCTTATTGATATGC
ITS2 for MiSeq
Sequencing
White et al.
1990,
Cregger et
al., 2018
ARCH-ITS4 GTCTCGTGGGCTCGGAG
ATGTGTATAAGAGACAG
TCCTCGCCTTATTGATATGC
ITS2 for MiSeq
Sequencing
White et al.
1990,
Cregger et
al., 2018
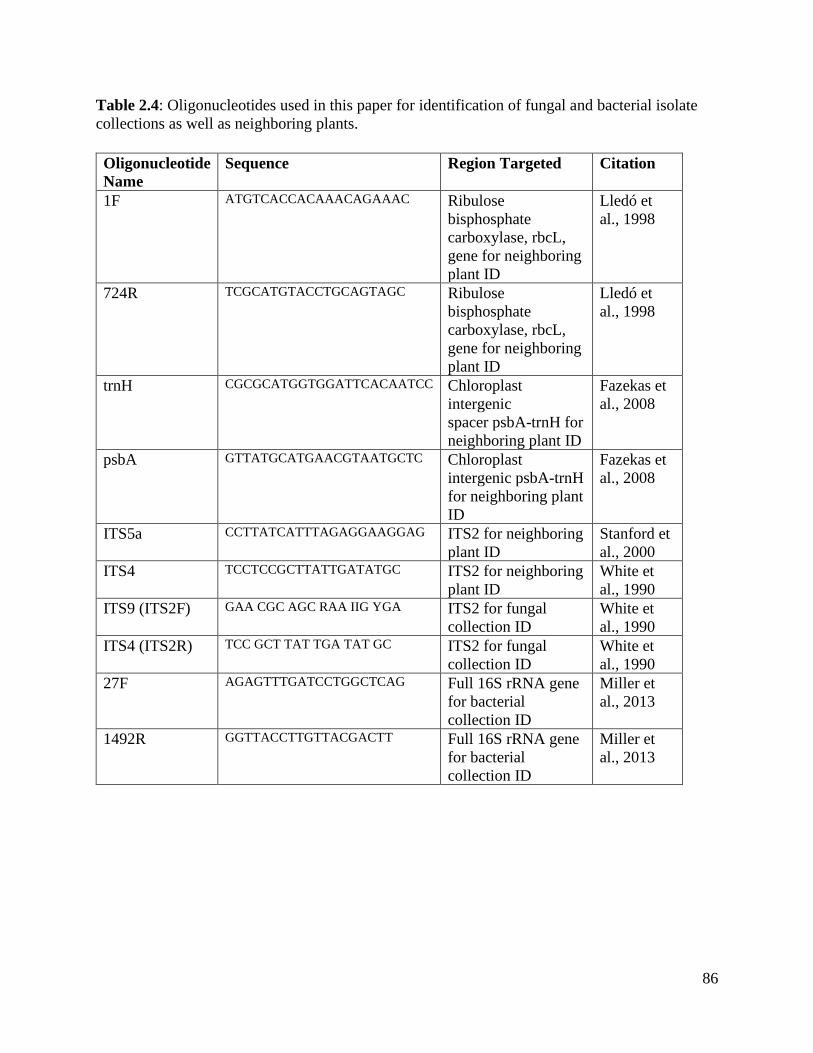
86
Table 2.4: Oligonucleotides used in this paper for identification of fungal and bacterial isolate
collections as well as neighboring plants.
Oligonucleotide
Name
Sequence Region Targeted Citation
1F ATGTCACCACAAACAGAAAC Ribulose
bisphosphate
carboxylase, rbcL,
gene for neighboring
plant ID
Lledó et
al., 1998
724R TCGCATGTACCTGCAGTAGC
Ribulose
bisphosphate
carboxylase, rbcL,
gene for neighboring
plant ID
Lledó et
al., 1998
trnH CGCGCATGGTGGATTCACAATCC Chloroplast
intergenic
spacer psbA-trnH for
neighboring plant ID
Fazekas et
al., 2008
psbA GTTATGCATGAACGTAATGCTC
Chloroplast
intergenic psbA-trnH
for neighboring plant
ID
Fazekas et
al., 2008
ITS5a CCTTATCATTTAGAGGAAGGAG ITS2 for neighboring
plant ID
Stanford et
al., 2000
ITS4 TCCTCCGCTTATTGATATGC ITS2 for neighboring
plant ID
White et
al., 1990
ITS9 (ITS2F) GAA CGC AGC RAA IIG YGA ITS2 for fungal
collection ID
White et
al., 1990
ITS4 (ITS2R) TCC GCT TAT TGA TAT GC ITS2 for fungal
collection ID
White et
al., 1990
27F AGAGTTTGATCCTGGCTCAG Full 16S rRNA gene
for bacterial
collection ID
Miller et
al., 2013
1492R GGTTACCTTGTTACGACTT Full 16S rRNA gene
for bacterial
collection ID
Miller et
al., 2013
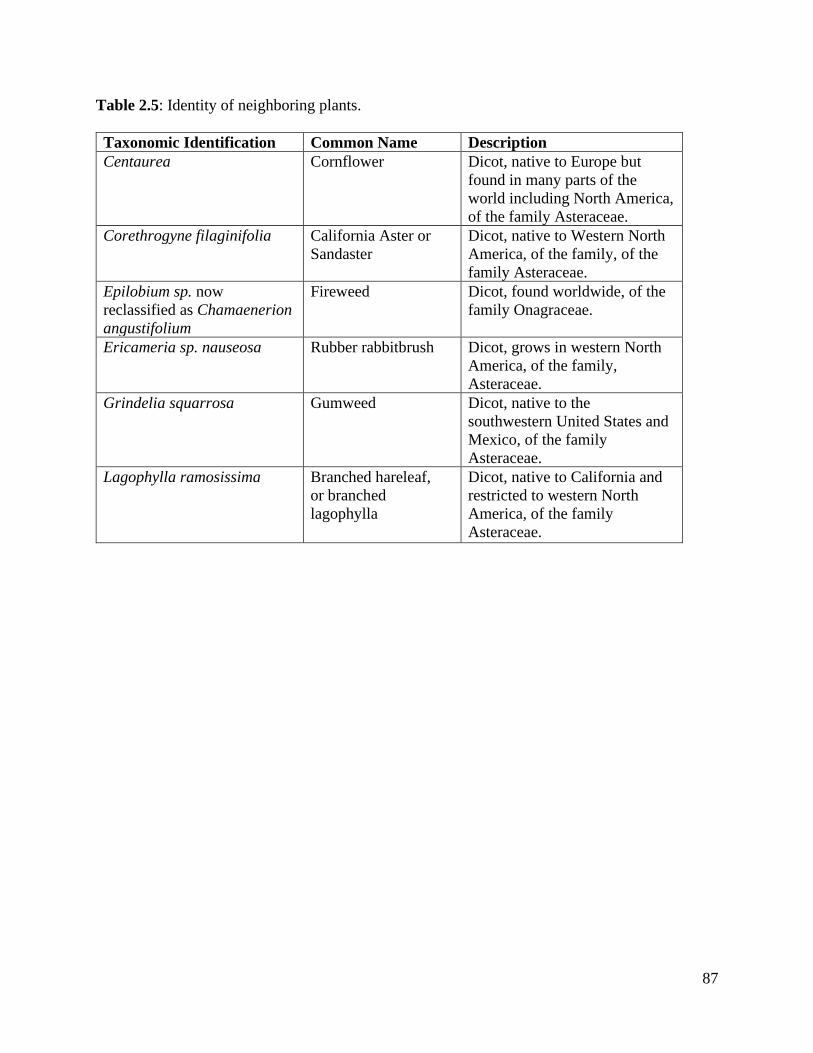
87
Table 2.5: Identity of neighboring plants.
Taxonomic Identification Common Name Description
Centaurea Cornflower Dicot, native to Europe but
found in many parts of the
world including North America,
of the family Asteraceae.
Corethrogyne filaginifolia California Aster or
Sandaster
Dicot, native to Western North
America, of the family, of the
family Asteraceae.
Epilobium sp. now
reclassified as Chamaenerion
angustifolium
Fireweed Dicot, found worldwide, of the
family Onagraceae.
Ericameria sp. nauseosa Rubber rabbitbrush Dicot, grows in western North
America, of the family,
Asteraceae.
Grindelia squarrosa Gumweed Dicot, native to the
southwestern United States and
Mexico, of the family
Asteraceae.
Lagophylla ramosissima Branched hareleaf,
or branched
lagophylla
Dicot, native to California and
restricted to western North
America, of the family
Asteraceae.
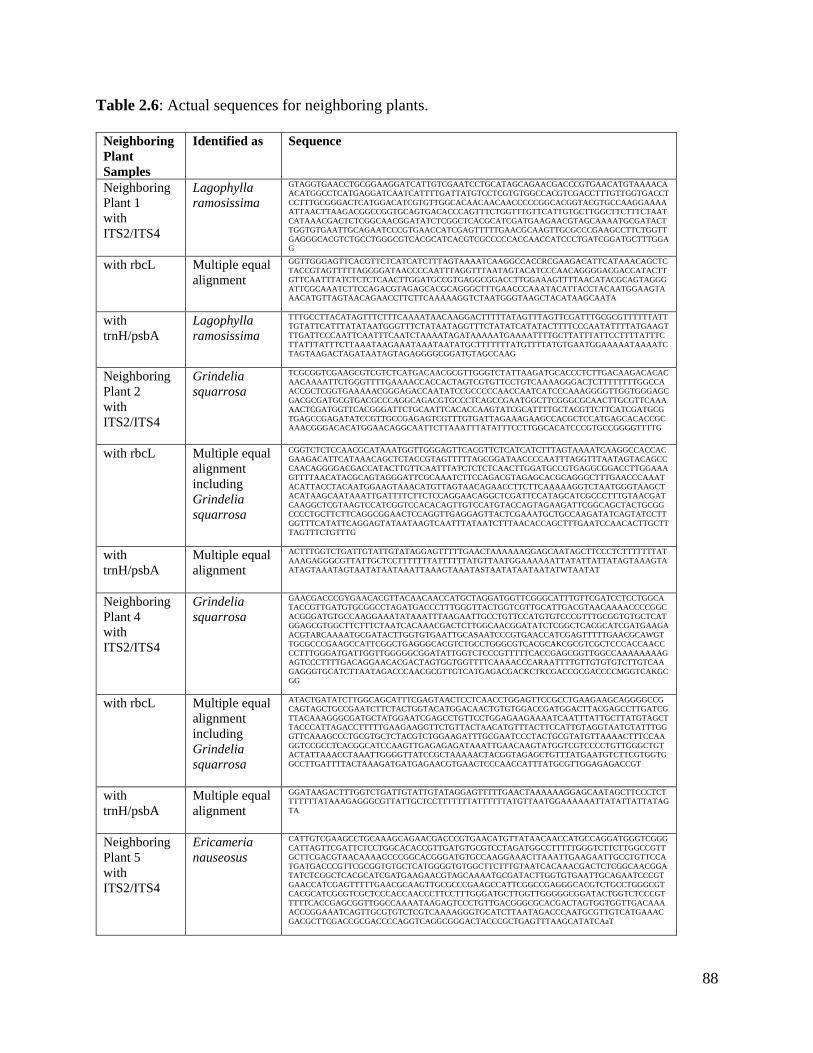
88
Table 2.6: Actual sequences for neighboring plants.
Neighboring
Plant
Samples
Identified as Sequence
Neighboring
Plant 1
with
ITS2/ITS4
Lagophylla
ramosissima
GTAGGTGAACCTGCGGAAGGATCATTGTCGAATCCTGCATAGCAGAACGACCCGTGAACATGTAAAACA
ACATGGCCTCATGAGGATCAATCATTTTGATTATGTCCTCGTGTGGCCACGTCGACCTTTGTTGGTGACCT
CCTTTGCGGGACTCATGGACATCGTGTTGGCACAACAACAACCCCCGGCACGGTACGTGCCAAGGAAAA
ATTAACTTAAGACGGCCGGTGCAGTGACACCCAGTTTCTGGTTTGTTCATTGTGCTTGGCTTCTTTCTAAT
CATAAACGACTCTCGGCAACGGATATCTCGGCTCACGCATCGATGAAGAACGTAGCAAAATGCGATACT
TGGTGTGAATTGCAGAATCCCGTGAACCATCGAGTTTTTGAACGCAAGTTGCGCCCGAAGCCTTCTGGTT
GAGGGCACGTCTGCCTGGGCGTCACGCATCACGTCGCCCCCACCAACCATCCCTGATCGGATGCTTTGGA
G
with rbcL
Multiple equal
alignment
GGTTGGGAGTTCACGTTCTCATCATCTTTAGTAAAATCAAGGCCACCRCGAAGACATTCATAAACAGCTC
TACCGTAGTTTTTAGCGGATAACCCCAATTTAGGTTTAATAGTACATCCCAACAGGGGACGACCATACTT
GTTCAATTTATCTCTCTCAACTTGGATGCCGTGAGGCGGACCTTGGAAAGTTTTAACATACGCAGTAGGG
ATTCGCAAATCTTCCAGACGTAGAGCACGCAGGGCTTTGAACCCAAATACATTACCTACAATGGAAGTA
AACATGTTAGTAACAGAACCTTCTTCAAAAAGGTCTAATGGGTAAGCTACATAAGCAATA
with
trnH/psbA
Lagophylla
ramosissima
TTTGCCTTACATAGTTTCTTTCAAAATAACAAGGACTTTTTATAGTTTAGTTCGATTTGCGCGTTTTTTATT
TGTATTCATTTATATAATGGGTTTCTATAATAGGTTTCTATATCATATACTTTTCCCAATATTTTATGAAGT
TTGATTCCCAATTCAATTTCAATCTAAAATAGATAAAAATGAAAATTTTGCTTATTTATTCCTTTTATTTC
TTATTTATTTCTTAAATAAGAAATAAATAATATGCTTTTTTTATGTTTTATGTGAATGGAAAAATAAAATC
TAGTAAGACTAGATAATAGTAGAGGGGCGGATGTAGCCAAG
Neighboring
Plant 2
with
ITS2/ITS4
Grindelia
squarrosa
TCGCGGTCGAAGCGTCGTCTCATGACAACGCGTTGGGTCTATTAAGATGCACCCTCTTGACAAGACACAC
AACAAAATTCTGGGTTTTGAAAACCACCACTAGTCGTGTTCCTGTCAAAAGGGACTCTTTTTTTTGGCCA
ACCGCTCGGTGAAAAACGGGAGACCAATATCCGCCCCCAACCAATCATCCCAAAGGGGTTGGTGGGAGC
GACGCGATGCGTGACGCCCAGGCAGACGTGCCCTCAGCCGAATGGCTTCGGGCGCAACTTGCGTTCAAA
AACTCGATGGTTCACGGGATTCTGCAATTCACACCAAGTATCGCATTTTGCTACGTTCTTCATCGATGCG
TGAGCCGAGATATCCGTTGCCGAGAGTCGTTTGTGATTAGAAAGAAGCCACGCTCCATGAGCACACCGC
AAACGGGACACATGGAACAGGCAATTCTTAAATTTATATTTCCTTGGCACATCCCGTGCCGGGGTTTTG
with rbcL
Multiple equal
alignment
including
Grindelia
squarrosa
CGGTCTCTCCAACGCATAAATGGTTGGGAGTTCACGTTCTCATCATCTTTAGTAAAATCAAGGCCACCAC
GAAGACATTCATAAACAGCTCTACCGTAGTTTTTAGCGGATAACCCCAATTTAGGTTTAATAGTACAGCC
CAACAGGGGACGACCATACTTGTTCAATTTATCTCTCTCAACTTGGATGCCGTGAGGCGGACCTTGGAAA
GTTTTAACATACGCAGTAGGGATTCGCAAATCTTCCAGACGTAGAGCACGCAGGGCTTTGAACCCAAAT
ACATTACCTACAATGGAAGTAAACATGTTAGTAACAGAACCTTCTTCAAAAAGGTCTAATGGGTAAGCT
ACATAAGCAATAAATTGATTTTCTTCTCCAGGAACAGGCTCGATTCCATAGCATCGCCCTTTGTAACGAT
CAAGGCTCGTAAGTCCATCGGTCCACACAGTTGTCCATGTACCAGTAGAAGATTCGGCAGCTACTGCGG
CCCCTGCTTCTTCAGGCGGAACTCCAGGTTGAGGAGTTACTCGAAATGCTGCCAAGATATCAGTATCCTT
GGTTTCATATTCAGGAGTATAATAAGTCAATTTATAATCTTTAACACCAGCTTTGAATCCAACACTTGCTT
TAGTTTCTGTTTG
with
trnH/psbA
Multiple equal
alignment
ACTTTGGTCTGATTGTATTGTATAGGAGTTTTTGAACTAAAAAAGGAGCAATAGCTTCCCTCTTTTTTTAT
AAAGAGGGCGTTATTGCTCCTTTTTTTATTTTTTATGTTAATGGAAAAAATTATATTATTATAGTAAAGTA
ATAGTAAATAGTAATATAATAAATTAAAGTAAATASTAATATAATAATATWTAATAT
Neighboring
Plant 4
with
ITS2/ITS4
Grindelia
squarrosa
GAACGACCCGYGAACACGTTACAACAACCATGCTAGGATGGTTCGGGCATTTGTTCGATCCTCCTGGCA
TACCGTTGATGTGCGGCCTAGATGACCCTTTGGGTTACTGGTCGTTGCATTGACGTAACAAAACCCCGGC
ACGGGATGTGCCAAGGAAATATAAATTTAAGAATTGCCTGTTCCATGTGTCCCGTTTGCGGTGTGCTCAT
GGAGCGTGGCTTCTTTCTAATCACAAACGACTCTTGGCAACGGATATCTCGGCTCACGCATCGATGAAGA
ACGTARCAAAATGCGATACTTGGTGTGAATTGCASAATCCCGTGAACCATCGAGTTTTTGAACGCAWGT
TGCGCCCGAAGCCATTCGGCTGAGGGCACGTCTGCCTGGGCGTCACGCAKCGCGTCGCTCCCACCAACC
CCTTTGGGATGATTGGTTGGGGGCGGATATTGGTCTCCCGTTTTTCACCGAGCGGTTGGCCAAAAAAAAG
AGTCCCTTTTGACAGGAACACGACTAGTGGTGGTTTTCAAAACCCARAATTTTGTTGTGTGTCTTGTCAA
GAGGGTGCATCTTAATAGACCCAACGCGTTGTCATGAGACGACKCTKCGACCGCGACCCCMGGTCAKGC
GG
with rbcL
Multiple equal
alignment
including
Grindelia
squarrosa
ATACTGATATCTTGGCAGCATTTCGAGTAACTCCTCAACCTGGAGTTCCGCCTGAAGAAGCAGGGGCCG
CAGTAGCTGCCGAATCTTCTACTGGTACATGGACAACTGTGTGGACCGATGGACTTACGAGCCTTGATCG
TTACAAAGGGCGATGCTATGGAATCGAGCCTGTTCCTGGAGAAGAAAATCAATTTATTGCTTATGTAGCT
TACCCATTAGACCTTTTTGAAGAAGGTTCTGTTACTAACATGTTTACTTCCATTGTAGGTAATGTATTTGG
GTTCAAAGCCCTGCGTGCTCTACGTCTGGAAGATTTGCGAATCCCTACTGCGTATGTTAAAACTTTCCAA
GGTCCGCCTCACGGCATCCAAGTTGAGAGAGATAAATTGAACAAGTATGGTCGTCCCCTGTTGGGCTGT
ACTATTAAACCTAAATTGGGGTTATCCGCTAAAAACTACGGTAGAGCTGTTTATGAATGTCTTCGTGGTG
GCCTTGATTTTACTAAAGATGATGAGAACGTGAACTCCCAACCATTTATGCGTTGGAGAGACCGT
with
trnH/psbA
Multiple equal
alignment
GGATAAGACTTTGGTCTGATTGTATTGTATAGGAGTTTTTGAACTAAAAAAGGAGCAATAGCTTCCCTCT
TTTTTTATAAAGAGGGCGTTATTGCTCCTTTTTTTATTTTTTATGTTAATGGAAAAAATTATATTATTATAG
TA
Neighboring
Plant 5
with
ITS2/ITS4
Ericameria
nauseosus
CATTGTCGAAGCCTGCAAAGCAGAACGACCCGTGAACATGTTATAACAACCATGCCAGGATGGGTCGGG
CATTAGTTCGATTCTCCTGGCACACCGTTGATGTGCGTCCTAGATGGCCTTTTTGGGTCTTCTTGGCCGTT
GCTTCGACGTAACAAAACCCCGGCACGGGATGTGCCAAGGAAACTTAAATTGAAGAATTGCCTGTTCCA
TGATGACCCGTTCGCGGTGTGCTCATGGGGTGTGGCTTCTTTGTAATCACAAACGACTCTCGGCAACGGA
TATCTCGGCTCACGCATCGATGAAGAACGTAGCAAAATGCGATACTTGGTGTGAATTGCAGAATCCCGT
GAACCATCGAGTTTTTGAACGCAAGTTGCGCCCGAAGCCATTCGGCCGAGGGCACGTCTGCCTGGGCGT
CACGCATCGCGTCGCTCCCACCAACCCTTCCTTTGGGATGCTTGGTTGGGGGCGGATACTGGTCTCCCGT
TTTTCACCGAGCGGTTGGCCAAAATAAGAGTCCCTGTTGACGGGCGCACGACTAGTGGTGGTTGACAAA
ACCCGGAAATCAGTTGCGTGTCTCGTCAAAAGGGTGCATCTTAATAGACCCAATGCGTTGTCATGAAAC
GACGCTTCGACCGCGACCCCAGGTCAGGCGGGACTACCCGCTGAGTTTAAGCATATCAaT
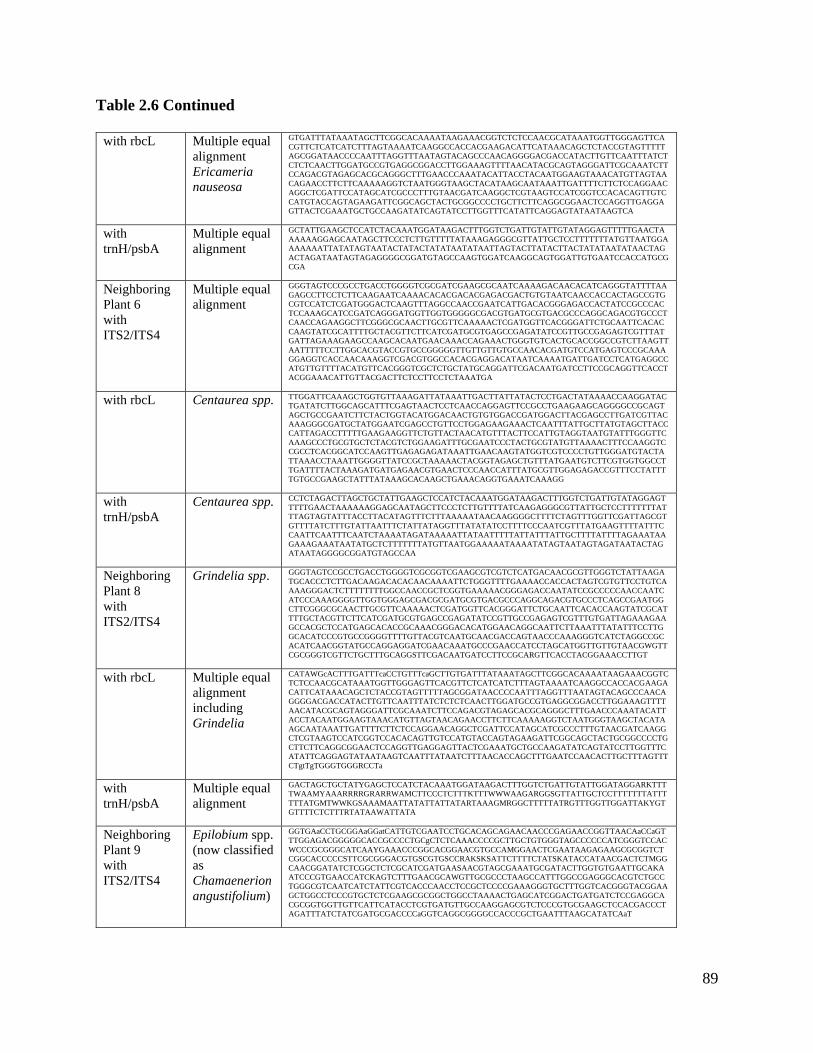
89
Table 2.6 Continued
with rbcL
Multiple equal
alignment
Ericameria
nauseosa
GTGATTTATAAATAGCTTCGGCACAAAATAAGAAACGGTCTCTCCAACGCATAAATGGTTGGGAGTTCA
CGTTCTCATCATCTTTAGTAAAATCAAGGCCACCACGAAGACATTCATAAACAGCTCTACCGTAGTTTTT
AGCGGATAACCCCAATTTAGGTTTAATAGTACAGCCCAACAGGGGACGACCATACTTGTTCAATTTATCT
CTCTCAACTTGGATGCCGTGAGGCGGACCTTGGAAAGTTTTAACATACGCAGTAGGGATTCGCAAATCTT
CCAGACGTAGAGCACGCAGGGCTTTGAACCCAAATACATTACCTACAATGGAAGTAAACATGTTAGTAA
CAGAACCTTCTTCAAAAAGGTCTAATGGGTAAGCTACATAAGCAATAAATTGATTTTCTTCTCCAGGAAC
AGGCTCGATTCCATAGCATCGCCCTTTGTAACGATCAAGGCTCGTAAGTCCATCGGTCCACACAGTTGTC
CATGTACCAGTAGAAGATTCGGCAGCTACTGCGGCCCCTGCTTCTTCAGGCGGAACTCCAGGTTGAGGA
GTTACTCGAAATGCTGCCAAGATATCAGTATCCTTGGTTTCATATTCAGGAGTATAATAAGTCA
with
trnH/psbA
Multiple equal
alignment
GCTATTGAAGCTCCATCTACAAATGGATAAGACTTTGGTCTGATTGTATTGTATAGGAGTTTTTGAACTA
AAAAAGGAGCAATAGCTTCCCTCTTGTTTTTATAAAGAGGGCGTTATTGCTCCTTTTTTTATGTTAATGGA
AAAAAATTATATAGTAATACTATACTATATAATATAATTAGTACTTATACTTACTATATAATATAACTAG
ACTAGATAATAGTAGAGGGGCGGATGTAGCCAAGTGGATCAAGGCAGTGGATTGTGAATCCACCATGCG
CGA
Neighboring
Plant 6
with
ITS2/ITS4
Multiple equal
alignment
GGGTAGTCCCGCCTGACCTGGGGTCGCGATCGAAGCGCAATCAAAAGACAACACATCAGGGTATTTTAA
GAGCCTTCCTCTTCAAGAATCAAAACACACGACACGAGACGACTGTGTAATCAACCACCACTAGCCGTG
CGTCCATCTCGATGGGACTCAAGTTTAGGCCAACCGAATCATTGACACGGGAGACCACTATCCGCCCAC
TCCAAAGCATCCGATCAGGGATGGTTGGTGGGGGCGACGTGATGCGTGACGCCCAGGCAGACGTGCCCT
CAACCAGAAGGCTTCGGGCGCAACTTGCGTTCAAAAACTCGATGGTTCACGGGATTCTGCAATTCACAC
CAAGTATCGCATTTTGCTACGTTCTTCATCGATGCGTGAGCCGAGATATCCGTTGCCGAGAGTCGTTTAT
GATTAGAAAGAAGCCAAGCACAATGAACAAACCAGAAACTGGGTGTCACTGCACCGGCCGTCTTAAGTT
AATTTTTCCTTGGCACGTACCGTGCCGGGGGTTGTTGTTGTGCCAACACGATGTCCATGAGTCCCGCAAA
GGAGGTCACCAACAAAGGTCGACGTGGCCACACGAGGACATAATCAAAATGATTGATCCTCATGAGGCC
ATGTTGTTTTACATGTTCACGGGTCGCTCTGCTATGCAGGATTCGACAATGATCCTTCCGCAGGTTCACCT
ACGGAAACATTGTTACGACTTCTCCTTCCTCTAAATGA
with rbcL
Centaurea spp.
TTGGATTCAAAGCTGGTGTTAAAGATTATAAATTGACTTATTATACTCCTGACTATAAAACCAAGGATAC
TGATATCTTGGCAGCATTTCGAGTAACTCCTCAACCAGGAGTTCCGCCTGAAGAAGCAGGGGCCGCAGT
AGCTGCCGAATCTTCTACTGGTACATGGACAACTGTGTGGACCGATGGACTTACGAGCCTTGATCGTTAC
AAAGGGCGATGCTATGGAATCGAGCCTGTTCCTGGAGAAGAAACTCAATTTATTGCTTATGTAGCTTACC
CATTAGACCTTTTTGAAGAAGGTTCTGTTACTAACATGTTTACTTCCATTGTAGGTAATGTATTTGGGTTC
AAAGCCCTGCGTGCTCTACGTCTGGAAGATTTGCGAATCCCTACTGCGTATGTTAAAACTTTCCAAGGTC
CGCCTCACGGCATCCAAGTTGAGAGAGATAAATTGAACAAGTATGGTCGTCCCCTGTTGGGATGTACTA
TTAAACCTAAATTGGGGTTATCCGCTAAAAACTACGGTAGAGCTGTTTATGAATGTCTTCGTGGTGGCCT
TGATTTTACTAAAGATGATGAGAACGTGAACTCCCAACCATTTATGCGTTGGAGAGACCGTTTCCTATTT
TGTGCCGAAGCTATTTATAAAGCACAAGCTGAAACAGGTGAAATCAAAGG
with
trnH/psbA
Centaurea spp.
CCTCTAGACTTAGCTGCTATTGAAGCTCCATCTACAAATGGATAAGACTTTGGTCTGATTGTATAGGAGT
TTTTGAACTAAAAAAGGAGCAATAGCTTCCCTCTTGTTTTATCAAGAGGGCGTTATTGCTCCTTTTTTTAT
TTAGTAGTATTTACCTTACATAGTTTCTTTAAAAATAACAAGGGGCTTTTCTAGTTTGGTTCGATTAGCGT
GTTTTATCTTTGTATTAATTTCTATTATAGGTTTATATATCCTTTTCCCAATCGTTTATGAAGTTTTATTTC
CAATTCAATTTCAATCTAAAATAGATAAAAATTATAATTTTTATTATTTATTGCTTTTATTTTAGAAATAA
GAAAGAAATAATATGCTCTTTTTTTATGTTAATGGAAAAATAAAATATAGTAATAGTAGATAATACTAG
ATAATAGGGGCGGATGTAGCCAA
Neighboring
Plant 8
with
ITS2/ITS4
Grindelia spp.
GGGTAGTCCGCCTGACCTGGGGTCGCGGTCGAAGCGTCGTCTCATGACAACGCGTTGGGTCTATTAAGA
TGCACCCTCTTGACAAGACACACAACAAAATTCTGGGTTTTGAAAACCACCACTAGTCGTGTTCCTGTCA
AAAGGGACTCTTTTTTTTGGCCAACCGCTCGGTGAAAAACGGGAGACCAATATCCGCCCCCAACCAATC
ATCCCAAAGGGGTTGGTGGGAGCGACGCGATGCGTGACGCCCAGGCAGACGTGCCCTCAGCCGAATGG
CTTCGGGCGCAACTTGCGTTCAAAAACTCGATGGTTCACGGGATTCTGCAATTCACACCAAGTATCGCAT
TTTGCTACGTTCTTCATCGATGCGTGAGCCGAGATATCCGTTGCCGAGAGTCGTTTGTGATTAGAAAGAA
GCCACGCTCCATGAGCACACCGCAAACGGGACACATGGAACAGGCAATTCTTAAATTTATATTTCCTTG
GCACATCCCGTGCCGGGGTTTTGTTACGTCAATGCAACGACCAGTAACCCAAAGGGTCATCTAGGCCGC
ACATCAACGGTATGCCAGGAGGATCGAACAAATGCCCGAACCATCCTAGCATGGTTGTTGTAACGWGTT
CGCGGGTCGTTCTGCTTTGCAGGSTTCGACAATGATCCTTCCGCARGTTCACCTACGGAAACCTTGT
with rbcL
Multiple equal
alignment
including
Grindelia
CATAWGcACTTTGATTTcaCCTGTTTcaGCTTGTGATTTATAAATAGCTTCGGCACAAAATAAGAAACGGTC
TCTCCAACGCATAAATGGTTGGGAGTTCACGTTCTCATCATCTTTAGTAAAATCAAGGCCACCACGAAGA
CATTCATAAACAGCTCTACCGTAGTTTTTAGCGGATAACCCCAATTTAGGTTTAATAGTACAGCCCAACA
GGGGACGACCATACTTGTTCAATTTATCTCTCTCAACTTGGATGCCGTGAGGCGGACCTTGGAAAGTTTT
AACATACGCAGTAGGGATTCGCAAATCTTCCAGACGTAGAGCACGCAGGGCTTTGAACCCAAATACATT
ACCTACAATGGAAGTAAACATGTTAGTAACAGAACCTTCTTCAAAAAGGTCTAATGGGTAAGCTACATA
AGCAATAAATTGATTTTCTTCTCCAGGAACAGGCTCGATTCCATAGCATCGCCCTTTGTAACGATCAAGG
CTCGTAAGTCCATCGGTCCACACAGTTGTCCATGTACCAGTAGAAGATTCGGCAGCTACTGCGGCCCCTG
CTTCTTCAGGCGGAACTCCAGGTTGAGGAGTTACTCGAAATGCTGCCAAGATATCAGTATCCTTGGTTTC
ATATTCAGGAGTATAATAAGTCAATTTATAATCTTTAACACCAGCTTTGAATCCAACACTTGCTTTAGTTT
CTgtTgTGGGTGGGRCCTa
with
trnH/psbA
Multiple equal
alignment
GACTAGCTGCTATYGAGCTCCATCTACAAATGGATAAGACTTTGGTCTGATTGTATTGGATAGGARKTTT
TWAAMYAAARRRRGRARRWAMCTTCCCTCTTTKTTTWWWAAGARGGSGTTATTGCTCCTTTTTTTATTT
TTTATGMTWWKGSAAAMAATTATATTATTATARTAAAGMRGGCTTTTTATRGTTTGGTTGGATTAKYGT
GTTTTCTCTTTRTATAAWATTATA
Neighboring
Plant 9
with
ITS2/ITS4
Epilobium spp.
(now classified
as
Chamaenerion
angustifolium)
GGTGAaCCTGCGGAaGGatCATTGTCGAATCCTGCACAGCAGAACAACCCGAGAACCGGTTAACAaCCaGT
TTGGAGACGGGGGCACCGCCCCTGCgCTCTCAAACCCCGCTTGCTGTGGGTAGCCCCCCATCGGGTCCAC
WCCCGCGGGCATCAAYGAAACCCGGCACGGAACGTGCCAMGGAACTCGAATAAGAGAAGCGCGGTCT
CGGCACCCCCSTTCGCGGGACGTGSCGTGSCCRAKSKSATTCTTTTCTATSKATACCATAACGACTCTMGG
CAACGGATATCTCGGCTCTCGCATCGATGAASAACGTAGCGAAATGCGATACTTGGTGTGAATTGCAKA
ATCCCGTGAACCATCKAGTCTTTGAACGCAWGTTGCGCCCTAAGCCATTTGGCCGAGGGCACGTCTGCC
TGGGCGTCAATCATCTATTCGTCACCCAACCTCCGCTCCCCGAAAGGGTGCTTTGGTCACGGGTACGGAA
GCTGGCCTCCCGTGCTCTCGAAGCGCGGCTGGCCTAAAACTGAGCATCGGACTGATGATCTCCGAGGCA
CGCGGTGGTTGTTCATTCATACCTCGTGATGTTGCCAAGGAGCGTCTCCCGTGCGAAGCTCCACGACCCT
AGATTTATCTATCGATGCGACCCCaGGTCAGGCGGGGCCACCCGCTGAATTTAAGCATATCAaT
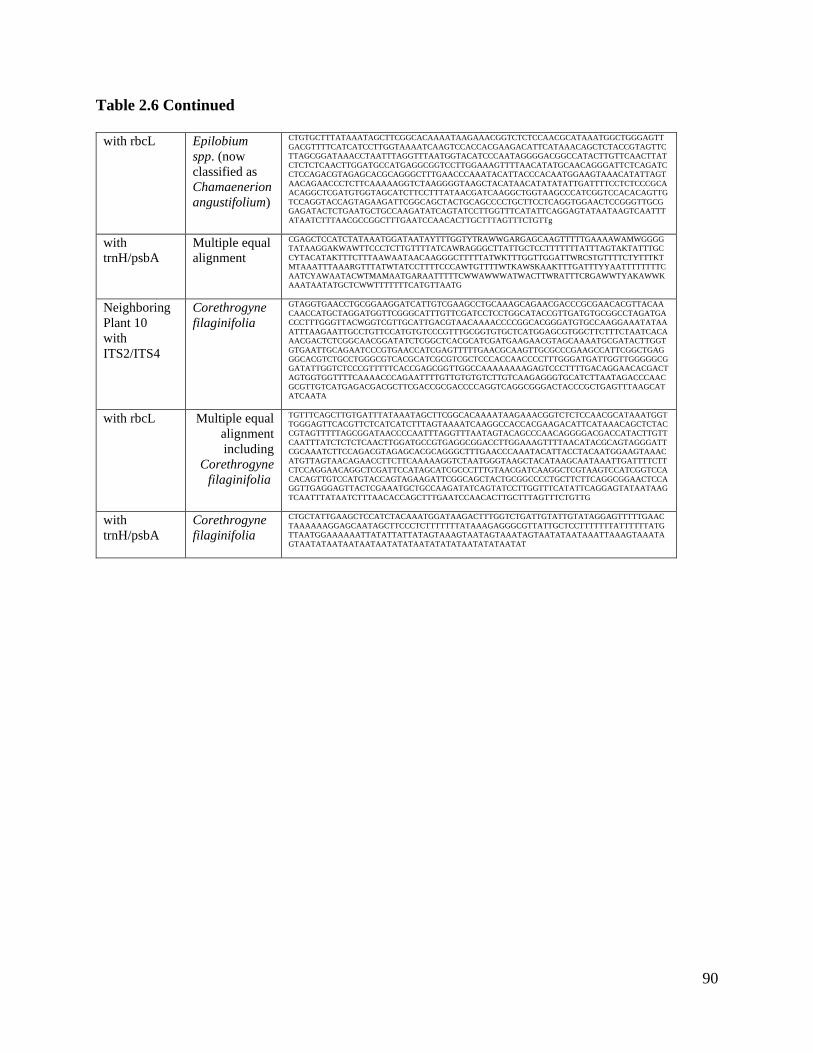
90
Table 2.6 Continued
with rbcL
Epilobium
spp. (now
classified as
Chamaenerion
angustifolium)
CTGTGCTTTATAAATAGCTTCGGCACAAAATAAGAAACGGTCTCTCCAACGCATAAATGGCTGGGAGTT
GACGTTTTCATCATCCTTGGTAAAATCAAGTCCACCACGAAGACATTCATAAACAGCTCTACCGTAGTTC
TTAGCGGATAAACCTAATTTAGGTTTAATGGTACATCCCAATAGGGGACGGCCATACTTGTTCAACTTAT
CTCTCTCAACTTGGATGCCATGAGGCGGTCCTTGGAAAGTTTTAACATATGCAACAGGGATTCTCAGATC
CTCCAGACGTAGAGCACGCAGGGCTTTGAACCCAAATACATTACCCACAATGGAAGTAAACATATTAGT
AACAGAACCCTCTTCAAAAAGGTCTAAGGGGTAAGCTACATAACATATATATTGATTTTCCTCTCCCGCA
ACAGGCTCGATGTGGTAGCATCTTCCTTTATAACGATCAAGGCTGGTAAGCCCATCGGTCCACACAGTTG
TCCAGGTACCAGTAGAAGATTCGGCAGCTACTGCAGCCCCTGCTTCCTCAGGTGGAACTCCGGGTTGCG
GAGATACTCTGAATGCTGCCAAGATATCAGTATCCTTGGTTTCATATTCAGGAGTATAATAAGTCAATTT
ATAATCTTTAACGCCGGCTTTGAATCCAACACTTGCTTTAGTTTCTGTTg
with
trnH/psbA
Multiple equal
alignment
CGAGCTCCATCTATAAATGGATAATAYTTTGGTYTRAWWGARGAGCAAGTTTTTGAAAAWAMWGGGG
TATAAGGAKWAWTTCCCTCTTGTTTTATCAWRAGGGCTTATTGCTCCTTTTTTTATTTAGTAKTATTTGC
CYTACATAKTTTCTTTAAWAATAACAAGGGCTTTTTATWKTTTGGTTGGATTWRCSTGTTTTCTYTTTKT
MTAAATTTAAARGTTTATWTATCCTTTTCCCAWTGTTTTWTKAWSKAAKTTTGATTTYYAATTTTTTTTC
AATCYAWAATACWTMAMAATGARAATTTTTCWWAWWWATWACTTWRATTTCRGAWWTYAKAWWK
AAATAATATGCTCWWTTTTTTTCATGTTAATG
Neighboring
Plant 10
with
ITS2/ITS4
Corethrogyne
filaginifolia
GTAGGTGAACCTGCGGAAGGATCATTGTCGAAGCCTGCAAAGCAGAACGACCCGCGAACACGTTACAA
CAACCATGCTAGGATGGTTCGGGCATTTGTTCGATCCTCCTGGCATACCGTTGATGTGCGGCCTAGATGA
CCCTTTGGGTTACWGGTCGTTGCATTGACGTAACAAAACCCCGGCACGGGATGTGCCAAGGAAATATAA
ATTTAAGAATTGCCTGTTCCATGTGTCCCGTTTGCGGTGTGCTCATGGAGCGTGGCTTCTTTCTAATCACA
AACGACTCTCGGCAACGGATATCTCGGCTCACGCATCGATGAAGAACGTAGCAAAATGCGATACTTGGT
GTGAATTGCAGAATCCCGTGAACCATCGAGTTTTTGAACGCAAGTTGCGCCCGAAGCCATTCGGCTGAG
GGCACGTCTGCCTGGGCGTCACGCATCGCGTCGCTCCCACCAACCCCTTTGGGATGATTGGTTGGGGGCG
GATATTGGTCTCCCGTTTTTCACCGAGCGGTTGGCCAAAAAAAAGAGTCCCTTTTGACAGGAACACGACT
AGTGGTGGTTTTCAAAACCCAGAATTTTGTTGTGTGTCTTGTCAAGAGGGTGCATCTTAATAGACCCAAC
GCGTTGTCATGAGACGACGCTTCGACCGCGACCCCAGGTCAGGCGGGACTACCCGCTGAGTTTAAGCAT
ATCAATA
with rbcL
Multiple equal
alignment
including
Corethrogyne
filaginifolia
TGTTTCAGCTTGTGATTTATAAATAGCTTCGGCACAAAATAAGAAACGGTCTCTCCAACGCATAAATGGT
TGGGAGTTCACGTTCTCATCATCTTTAGTAAAATCAAGGCCACCACGAAGACATTCATAAACAGCTCTAC
CGTAGTTTTTAGCGGATAACCCCAATTTAGGTTTAATAGTACAGCCCAACAGGGGACGACCATACTTGTT
CAATTTATCTCTCTCAACTTGGATGCCGTGAGGCGGACCTTGGAAAGTTTTAACATACGCAGTAGGGATT
CGCAAATCTTCCAGACGTAGAGCACGCAGGGCTTTGAACCCAAATACATTACCTACAATGGAAGTAAAC
ATGTTAGTAACAGAACCTTCTTCAAAAAGGTCTAATGGGTAAGCTACATAAGCAATAAATTGATTTTCTT
CTCCAGGAACAGGCTCGATTCCATAGCATCGCCCTTTGTAACGATCAAGGCTCGTAAGTCCATCGGTCCA
CACAGTTGTCCATGTACCAGTAGAAGATTCGGCAGCTACTGCGGCCCCTGCTTCTTCAGGCGGAACTCCA
GGTTGAGGAGTTACTCGAAATGCTGCCAAGATATCAGTATCCTTGGTTTCATATTCAGGAGTATAATAAG
TCAATTTATAATCTTTAACACCAGCTTTGAATCCAACACTTGCTTTAGTTTCTGTTG
with
trnH/psbA
Corethrogyne
filaginifolia
CTGCTATTGAAGCTCCATCTACAAATGGATAAGACTTTGGTCTGATTGTATTGTATAGGAGTTTTTGAAC
TAAAAAAGGAGCAATAGCTTCCCTCTTTTTTTATAAAGAGGGCGTTATTGCTCCTTTTTTTATTTTTTATG
TTAATGGAAAAAATTATATTATTATAGTAAAGTAATAGTAAATAGTAATATAATAAATTAAAGTAAATA
GTAATATAATAATAATAATATATAATATATATAATATATAATAT
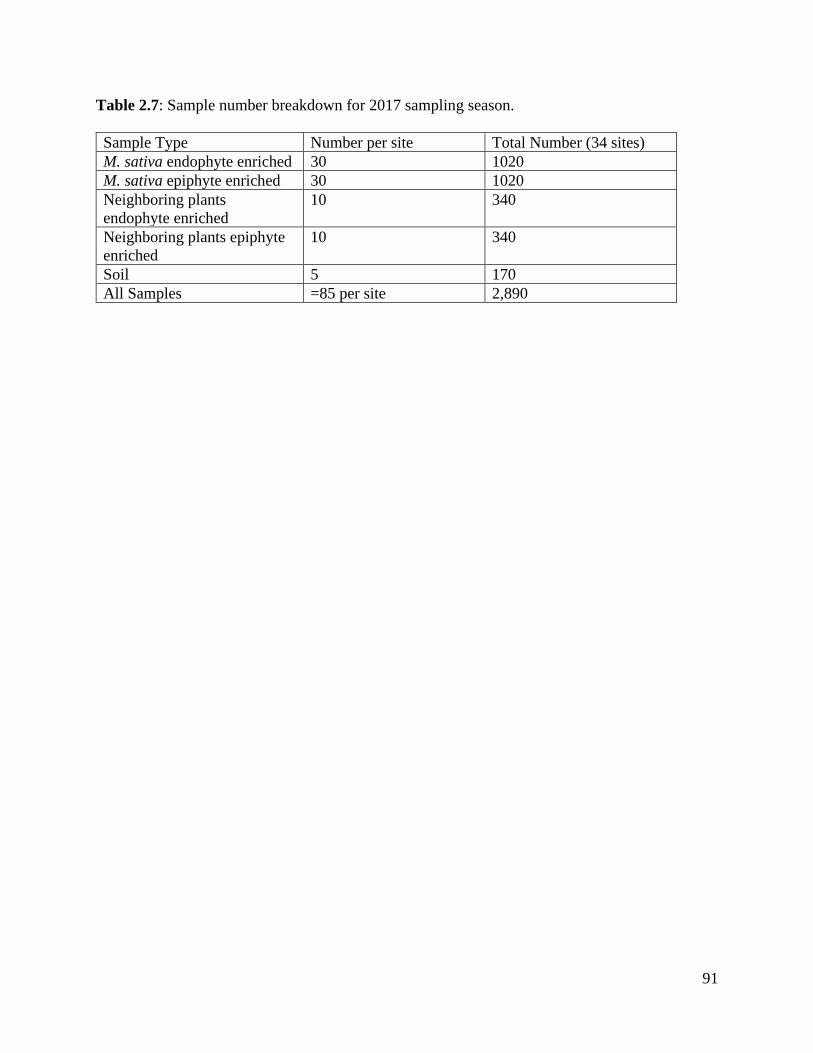
91
Table 2.7: Sample number breakdown for 2017 sampling season.
Sample Type Number per site Total Number (34 sites)
M. sativa endophyte enriched 30 1020
M. sativa epiphyte enriched 30 1020
Neighboring plants
endophyte enriched
10 340
Neighboring plants epiphyte
enriched
10 340
Soil 5 170
All Samples =85 per site 2,890
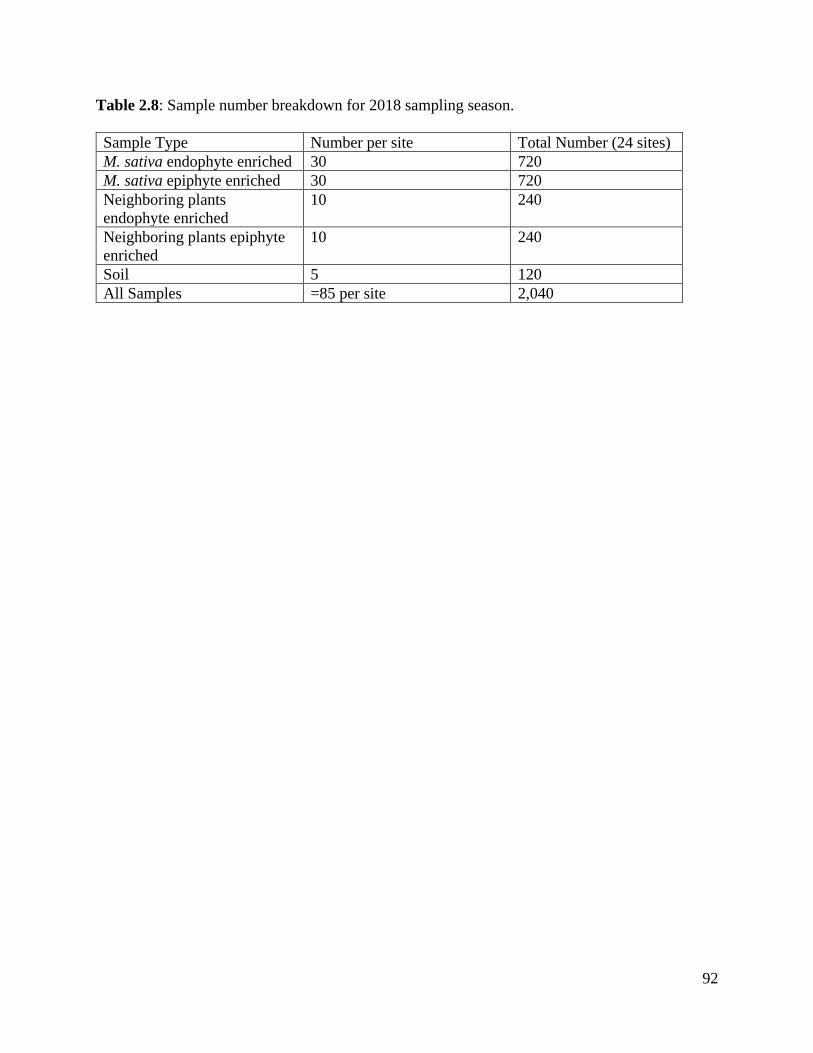
92
Table 2.8: Sample number breakdown for 2018 sampling season.
Sample Type Number per site Total Number (24 sites)
M. sativa endophyte enriched 30 720
M. sativa epiphyte enriched 30 720
Neighboring plants
endophyte enriched
10 240
Neighboring plants epiphyte
enriched
10 240
Soil 5 120
All Samples =85 per site 2,040
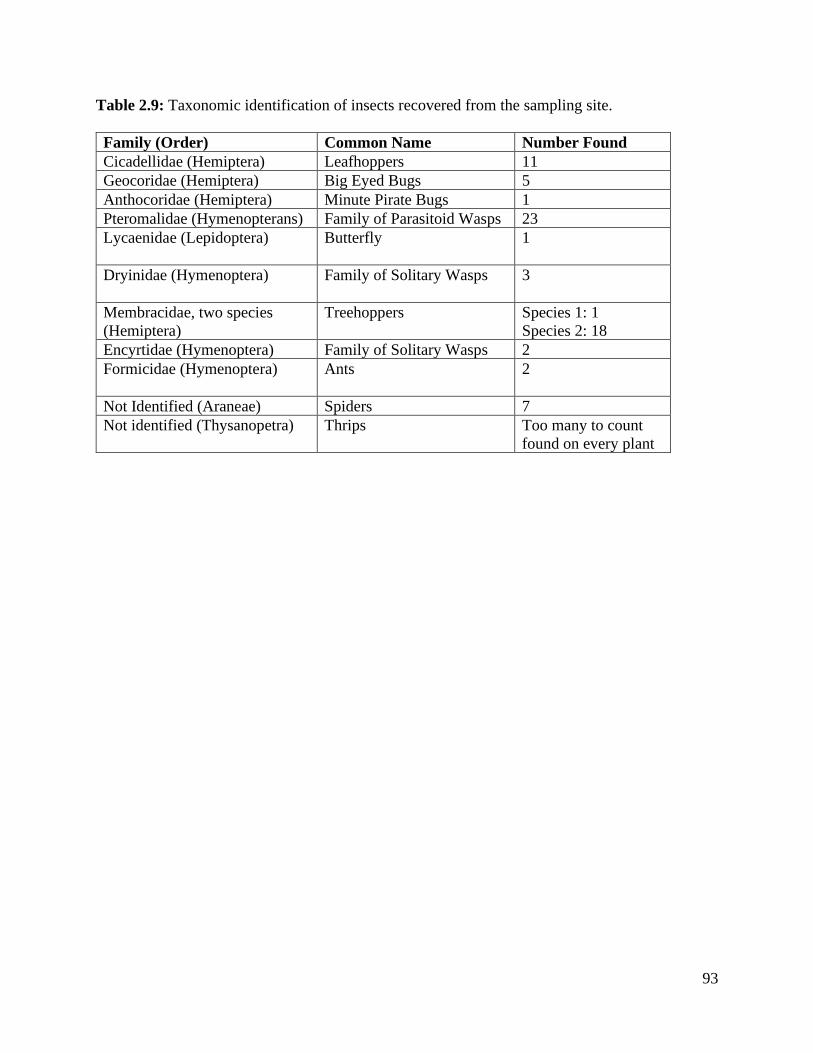
93
Table 2.9: Taxonomic identification of insects recovered from the sampling site.
Family (Order) Common Name Number Found
Cicadellidae (Hemiptera) Leafhoppers 11
Geocoridae (Hemiptera) Big Eyed Bugs 5
Anthocoridae (Hemiptera) Minute Pirate Bugs 1
Pteromalidae (Hymenopterans) Family of Parasitoid Wasps 23
Lycaenidae (Lepidoptera)
Butterfly 1
Dryinidae (Hymenoptera)
Family of Solitary Wasps 3
Membracidae, two species
(Hemiptera)
Treehoppers Species 1: 1
Species 2: 18
Encyrtidae (Hymenoptera) Family of Solitary Wasps 2
Formicidae (Hymenoptera)
Ants 2
Not Identified (Araneae) Spiders 7
Not identified (Thysanopetra) Thrips Too many to count
found on every plant

94
CHAPTER 3: DISTINGUISHING NUTRIENT-
DEPENDENT PLANT DRIVEN BACTERIAL
COLONIZATION PATTERNS IN ALFALFA
95
Chapter Contributions:
This chapter is a version of a peer-reviewed article previously published: Moccia, K., Willems,
A., Papoulis, S., Flores, A., Forister, M. L., Fordyce, J. A., et al. 2020. Distinguishing nutrient‐
dependent plant driven bacterial colonization patterns in alfalfa. Environmental Microbiology
Reports. 12:70–77.
Katherine Moccia and Dr. Sarah Lebeis designed the drop out experiments. Katherine Moccia
performed all experiments within this chapter with assistance from Alicia Flores to characterize
microbe-microbe interactions and plant associated traits. Feral alfalfa material was collected by
Drs. Matthew Foriester and James Fordyce. Andrew Willems assisted with planting and
harvesting two week drop out experiment plants for sequencing and QIIME analysis. Dr.
Spiridon Papoulis wrote script for grouping ASVs from drop out experiment to each organism.
Katherine Moccia performed statistics and generated figures. Katherine Moccia and Dr. Sarah
Lebeis analyzed and interpreted the data to form the manuscript. Katherine Moccia and Sarah
Lebeis wrote the manuscript. Katherine Moccia, Dr. Sarah Lebeis, Matthew Foriester, and James
Fordyce revised the manuscript.
Abstract:
To understand factors that influence the assembly of microbial communities, we inoculated
Medicago sativa with a series of nested bacterial synthetic communities and grew plants in
distinct nitrogen concentrations. Two isolates in our eight-member synthetic community,
Williamsia sp. R60 and Pantoea sp. R4, consistently dominate community structure across
nitrogen regimes early in plant development. While at 2 weeks Pantoea sp. R4 consistently
colonizes plants to a higher degree compared to the other six organisms across each community
and each nutrient level, Williamsia sp. R60 exhibits nutrient specific colonization differences.
Williamsia sp. R60 is more abundant in plants grown at higher nitrogen concentrations but
exhibits the opposite trend when no plant is present (i.e. colonization of the media), indicating
plant-driven influence over colonization. Further, synthetic community succession is observed
between 2 and 4 weeks post inoculation as Pantoea sp. R4 colonization decreases and
Arthrobacter sp. R85 colonization increases. Our research revealed unique, repeatable
colonization phenotypes for individual microbes during plant microbiome assembly, and
identified alterations caused by the host plant, microbes, and available nutrients.
96
Introduction:
The assembly of endophytic microbiomes in plant internal tissues from microbially
diverse surrounding inocula is a complex intersection of abiotic and biotic factors. While plant
physiology is impacted by nutritional stress, our understanding of how plant microbiome
membership and function differ with nutrient concentrations has only recently advanced for
essential plant macronutrients like phosphate (Castrillo et al., 2017). Phosphate starvation
responses influence root microbiome composition via the plant immune system (Castrillo et al.,
2017). For nitrogen, diazotrophic microbes can convert inert nitrogen gas to either ammonium or
nitrite ions and receive plant-derived carbon in exchange (Ibáñez et al., 2016). Although high
concentrations of nitrogen inhibit plant colonization of diazotrophs such as Acetobacter
diazotrophicus (Fuentes-Ramıerez et al., 1999), the impact of fertilizer on the total microbial
community composition and activities remains unclear (Yeoh et al., 2016; Berg and Koskella,
2018). In one study, varying nitrogen fertilizer treatment showed little evidence of modifying
belowground microbial community structure or the number of nif genes present (Yeoh et al.,
2016). However, another study demonstrated that the addition of nitrogen fertilizer reduced the
ability of an aboveground plant microbiome to prevent pathogen invasion (Berg and Koskella,
2018). Thus, the influence of nutrient concentration on total plant microbiome assembly is
complex and requires further investigation.
Non-vertically transmitted endophytic plant microbiomes gain access to internal plant
tissue from environmental inocula in the soil, air or water with recent evidence demonstrating
that the soil is likely the largest reservoir for all endophytes, even those that reside in the
phyllosphere (Liu et al., 2017, Hardoim et al., 2008, Turner et al., 2013; Kandel et al., 2017;
Zarronaidia et al., 2015; Bai et al., 2015; Bodenhausen et al., 2013; Bulgari et al., 2014; Knief et
al., 2010; Lymprtopoulou et al., 2016; Vorholt et al., 2012; Truyens et al., 2015). Overall,
97
Proteobacteria, Actinobacteria, Firmicutes and Bacteriodetes consistently dominate internal root
and leaf tissue of numerous plants including M. sativa (Liu et al., 2017, Lundberg et al., 2013;
Oliveira et al. 2012; Vorholt et al., 2012, Bodenhausen et al., 2014, Bodenhausen et al., 2013;
Bulgari et al., 2014; Bai et al., 2015; Pini et al., 2012). For M. sativa, large differences in
microbiome composition exist between nodules and stem/leaf tissues with 80% of operational
taxonomic units (OTUs) assigned to the family Rhizobiaceae in nodules while they represent less
than 8% in stem and leaf tissue (Pini et al., 2012).
Over fifty percent of bacterial OTUs that have been sequenced from the endophytic
microbiome of Arabidopsis thaliana leaves and roots have cultured representatives (Bai et al.,
2015), which provides the opportunity to build synthetic communities. As proxies for plant
microbiomes, synthetic communities can yield critical insights into the roles of the plant and
individual microbes on community assembly (Lebeis et al., 2015; Bodenhausen et al., 2014; Niu
et al., 2017). For example, a 38-member synthetic community revealed that salicylic acid shapes
A. thaliana’s root microbiome (Lebeis et al., 2015). Two seven-member synthetic communities
untangled plant driven influence from microbe-microbe interaction in A. thaliana leaves and Zea
mays roots (Bodenhausen et al., 2014; Niu et al., 2017). Nui et al. identified an individual
member of their synthetic community, an Enterobacter sp. isolate, as a potential keystone
species because its removal resulted in a completely altered microbial community structure (Niu
et al., 2017).
Here we develop and characterize an eight-member bacterial synthetic community from
our isolate collection from feral M. sativa leaves and flowers. We investigate the microbiome
formation after 2 weeks in plants grown under three distinct nitrogen concentrations: no addition,
intermediate level, and high level. We extend into a longer experimental format to examine
98
temporal succession. Once top colonizers have been identified within the synthetic community,
we examine their individual colonization strategies through time. While experiments vary from 4
days to 6 weeks, all time points occur early during the plant life cycle, within what is known as
the vegetative state. We demonstrate that although community assembly is consistent across
highly varied nitrogen availability at specific time points, plants can influence individual strains.
This modulation is based on nutrient availability and provides insight into how plants enrich and
deplete microbes from inoculum to build and retain a core microbiome.
Materials and Methods:
Isolation of plant associated microbes
To generate a collection of microbial isolates that were endophytic in origin, leaves and
flowers of alfalfa were harvested aseptically and placed in sterile Whirl-Pak bags (Consolidated
Plastics) from the Great Basin at the coordinates 39.5102, -120.2289. Plant tissues were stored in
a cooler in the field and then stored at -80˚C. This same sampling trip produced the wild alfalfa
sequencing results seen in Figure 3.1. Samples were surface sterilized prior to isolation of
microbes with 10% household bleach with 0.01% Triton X-100 treatment for 10 minutes, then
rinsed with sterile water. To neutralize bleach, 2.5% sodium thiosulfate was added for 5 minutes
then rinsed with sterile water twice. This surface sterilization was performed to remove the
majority of epiphytic microbial cells. Samples were homogenized with approximately 20 sterile
0.7 mm garnet beads (Qiagen) in a Geno/Grinder 2010 (SPEX SamplePrep) for 5 minutes at
1500 RPM. Homogenized plant material was plated on various solid media including Lysogeny
Broth nutrients (LB), 1/10 LB nutrients, 1/10 LB nutrients with 1% humic acid, 1/10 LB
nutrients with 10% methanol, 1/5 dilution of King’s B, and MacConkey. We picked all colonies,
bacterial and fungal, that were present on the media. The 16S rRNA gene of individual bacterial
99
colonies was amplified with the 27F and 1392R primers to assign taxonomy, while the internal
transcribed spacer (ITS) 2 region of fungi was amplified with ITS4 and ITS9 (Table 3.1, 3.2).
Identification of plant associated traits
Auxin production was performed as in Szkop et al., 2012. Briefly, all isolates were grown
shaking at 28˚C overnight in 10 mL of LB supplemented with 1% tryptophan. Samples were
spun down for 10 minutes at 1400 RPM and 1 mL of supernatant was incubated individually
with 2 mL of each Salkowski reagent for 30 minutes in the dark. 100 µL in triplicate of each was
added to clear, flat bottom-96 well plates (Costar) and absorbance at 540 nm was recorded
immediately using the Synergy 2 Plate Reader (Biotek).
Siderophore production was detected using the plate assay outlined in Lynne et al., 2011.
Strains were struck on siderophore plates and incubated for 24 hours. Siderophore production
was confirmed via a colorimetric change from blue to orange surrounding the isolate.
Ability to grow in nitrogen free media was initially classified by turbid growth in Burks liquid
medium then subsequently plated on Jensen’s medium, both incubated at 28˚C. Both were
prepared according to HiMedia Laboratories. We required turbid growth in liquid Burks medium
and subsequent colony formation on Jensen’s medium to classify a strain as able to survive in
nitrogen free media.
Pikovskayas Agar was used to detect phosphate solubilizing bacteria using calcium
phosphate as the insoluble form of phosphate. Pikovskayas Agar was prepared according to
HiMedia Laboratories. 10 µL of overnight liquid culture of each strain was spotted onto agar and
incubated at 28˚C. Solubilization was confirmed via the appearance of a halo surrounding the
strain. Depending on the strain halos appeared 1-3 days after inoculated.
100
Aleksandrow Agar was used to detect potassium solubilizing bacteria using potassium
feldspar as the insoluble form of potassium. Aleksandrow Agar was prepared according to
HiMedia Laboratories with the substitution of potassium feldspar (The Ceramic Shop) as the
potassium source as feldspars are a common potassium source in the soil (Hughes, 2010).
Approximately 100 mg of potassium feldspar was submerged in 1 L of water for three days and
stirred on a magnetic plate to remove all soluble forms of potassium present. The potassium
feldspar was then dried for 24 hours at room temperature. As with phosphate solubilization,
potassium solubilization was confirmed via the appearance of a halo surrounding the strain,
which were visible after 3 days of growth.
Bacterial isolates were grown up overnight in LB at 28˚C then 100 μl of microbial culture
was spread on 1/10th LB plates and let dry. Once dry, 10 μl of another isolate was plated directly
in the center of the plate. All microbe-microbe combinations were performed in triplicate. Plates
were incubated at 28˚C for 3 days. Antagonism was defined as a halo forming around the 10 μl
spot, which is indicative of antibiosis (Table 3.3).
Seed information and germination
Three seed accessions of Medicago cultivar were used: Medicago sativa subsp. sativa
Accession # 672755, Medicago sativa subsp. falcata Accession # 655519 and Medicago sativa
subsp. sativa Accession #672758 (Germplasm Resources Information Network, USDA). A list of
which experiments use each accession is provided in see Table 3.4. All three were chosen
because of their geographic proximity to the feral alfalfa plants from which our microbial isolate
collection was derived. Before each experiment, seeds were submerged in DI water and heated at
40˚C for thirty minutes to soften the seed coat and allow for thorough bleach and ethanol
treatment. Seeds were treated for 1 minute with 70% ethanol followed by 5 minutes with a 3%
101
household bleach solution. Seeds were then aseptically placed on Murashige and Skoog
germination agar (MP biomedicals) for two days in the dark at room temperature, then one day
in a growth chamber (Percival) set to 22˚C for 10 hours of daylight and 18˚C for 14 hours of
darkness. Homogenization for CFU counts of 4 day heat treated seedlings produced no colonies
after 7 days of growth on the same media that was used to isolate our plant associated microbes:
LB, 1/10 LB nutrients, 1/10 LB nutrients with 1% humic acid, 1/10 LB nutrients with 10%
methanol, 1/5 dilution of King’s B and MacConkey. The 16S rRNA gene sequencing of
seedlings that were heat treated demonstrated 1,650 total reads, while the inoculated plants had
an average of 10,919 reads, suggesting that in the heat treated seedlings there were a only small
amount of bacteria species left over after their heat treatment (Figure 3.2C, D). Between the
small number of reads from the heat treated seedlings and the lack of any colony growth after 14
days days on the same media that produced our isolate collection, we concluded that the
seedlings had minimal viable organisms and the majority of sequenced reads from seedlings
were likely microbes killed during the heat treatment.
Individual plant microbe assays of all strains
All bacterial strains were grown overnight in liquid LB. Each strain was centrifuged for 1
minute at 10,000 RPM and resuspended in 1X PBS at 0.1 OD600. 150 µL of each strain was
spread onto square plates (120 cm by 120 cm) with ¼ strength Murashige and Skoog
germination media (MP Biomedicals) without sucrose and 3 seedlings of alfalfa were added to
each plate. Plates were parafilmed (BEMIS) and grown vertically in a growth chamber (Percival)
in 10 hours of light at 22˚C and 14 hours of darkness at 18˚C. Plants were harvested after 4 days
in association with each strain and placed in 5 mL tubes. To remove the majority of loosely
attached epiphytic bacterial cells, plants were washed three times with sterile 1X PBS and
102
vortexed for thirty seconds in between each wash. Plants were homogenized with 2 mL of fresh
PBS and approximately 20 sterile 0.7 mm garnet beads (Qiagen) in a Geno/Grinder 2010 (SPEX
SamplePrep) for 5 minutes at 1500 RPM. Serial dilutions were performed from homogenized
plant material to determine CFU per gram plant.
Individual 4 day, 2 week, 4 week and 6 week colonization of Pantoea sp. R4, Williamsia sp. R60,
and Arthrobacter sp. R85
For individual colonization over time Medicago sativa subsp. sativa Accession # 672755
was used (Germplasm Resources Information Network, USDA). Three day old surface sterilized
seedlings were planted in the chemically defined Yoshida plant medium (Yoshida et al., 1976)
and 150 µL of 0.01 OD600 of Pantoea sp. R4, Williamsia sp. R60 or Arthrobacter sp. R85 was
inoculated directly after planting. Yoshida media was prepared as 56.8mg NH4NO2, 43.6mg
K2SO4, 73.5mg CaCl2 X2H2O, 123.2mg MgSO4 x7H2O, 0.891mg MnCl2 x4H2O, 0.0433mg
(NH4)MO7O2 x4H2O, 0.572mg H3BO3, 0.0128mg CuSO4 x5H2O, 0.0216mg ZnSO4, 4.3mg H2
PO4 x2H2O, 6.2mg FeEDTA and 2 grams of bacterial agar (VWR) in 1 L of distilled water.
Modifications of the Yoshida agar for our experiments are: “1/2 Yoshida”, which contains ½
concentrations of all nutrients in Yoshida, “no added nitrogen”, which omits NH4NO2 and
(NH4)MO7O2 x4H2O, and “high nitrogen”, which used 0.423 g of NH4NO2. High nitrogen levels
were based on ammonium nitrate fertilizer levels for fields generally rotated with alfalfa
(AgSource Laboratories, 2017). We note that no nitrogen added conditions does contain any
nitrogen provided by the plant, such as the provision of amino acids through root exudate. Plants
were grown in 10 hours of light at 22˚C and 14 hours of darkness at 18˚C for 4 days to establish
initial colonization then harvest every 2 weeks for 6 weeks. Plants were washed and
homogenized with the same protocol as the individual plant microbe experiments described
above.
103
Drop out experiments
For drop out experiments, 560 seeds of Medicago sativa subsp. sativa Accession
#672758 (Germplasm Resources Information Network, USDA) were used. Each of the eight
members of our bacterial synthetic community, as well as our low-level plant colonization
control, Deinococcus radiodurans strain TN56, were grown up in LB and diluted to 0.11 OD600.
Strains were centrifuged for 1 minute at 10,000 RPM to form a pellet then resuspended in sterile
PBS for a cumulative OD600 of 1 in 1X PBS with 60% glycerol freezer stock when all members
are added. Nine sets of freezer stocks were made, with eight sets removing one of the community
members and the ninth set with the total community present. Each freezer stock was flash frozen
in liquid nitrogen and stored at -80˚C. Before inoculating the plants, each stock was thawed fully
and diluted in 1X PBS to 0.1 OD600. Freezer stocks were intentionally not grown up in order to
keep the community members at the same ratio to one another. For each experiment, every drop
out inoculum was plated on LB to confirm even ratios of each microbe. 150 µL of each drop out
community was added to two biological sets at the root. Each set contained 10 seedlings with
each individual seedling inoculated in separate magenta jars for the following nutrient regimes:
standard Yoshida, high nitrogen, and no nitrogen added. Once inoculated, the magenta jars were
covered with gas permeable membranes (Diversified Biotech) to allow gas exchange while
avoiding introduction of other microbes to the experiment. The no plant controls were inoculated
in the same magenta jars under the same conditions as the plant samples, and approximately 2.5
mL of Yoshida agar at the site of inoculation was used for each no plant sample. To determine if
the location of inoculation altered synthetic community colonization, we also inoculated from the
leaf instead of the root. These seedlings were first planted in the Yoshida agar to avoid
unintentional root inoculation then 150 μl of total synthetic community was inoculated on the
leaf/stem surface.
104
For each experiment, the initial community was plated to record viable counts of each
community member and to ensure all community members were present. Plants were grown in
10 hours of light at 22˚C and 14 hours of darkness at 18˚C. After 2 weeks of growth the biomass,
aboveground height, and number of leaves were recorded for each plant. Plants were washed
according to the individual plant microbe experiments and flash frozen before storage at -80˚C.
Prior to DNA extraction plants were homogenized for 15 minutes at 1500 RPM in the
Geno/Grinder 2010 (SPEX SamplePrep) with approximately 20 0.7 mm sterile garnet beads
(Qiagen). DNA was extracted using DNeasy Qiagen Soil Kit (Qiagen) and stored at -80˚C. For
viable count experiments in lieu of DNA extraction, homogenized plants were serially diluted in
1 mL of PBS on LB plates and grown for up to 1 week before enumerated.
Deinococcus radiodurans is a Tennessee soil-derived isolate not expected to colonize alfalfa and
was thus added as a control for low plant colonization. As it is part of a distinct phylum from the
other synthetic community members, it also adds sequence diversity to the 16S rRNA gene
sequencing library, which improves the quality of the MiSeq run. Indeed, we only observed an
increase of D. radiodurans reads in the drop out communities in plants with no nitrogen added
compared to our total community (Figure 3.3).
Library prep
PCR reactions for library preparation contained 12.5 µL of HiFi Hotstart Master Mix
(KAPA Biosystems), 5 µL (2 μM) of primer, 2.5 µL of DNA and 2.5 µL (30 μM) of a mixture of
two Peptide Nucleic Acids (PNA) one for blocking mitochondrial plant sequences and one for
blocking plastid plant sequences (Lundberg et al., 2013). All samples were amplified with the
primers 341F and 781R (Klindworth et al., 2013). The thermocycler settings were: 3 minutes at
95˚C, with 25 cycles of 95˚C for 45 seconds, 78˚C for 10 seconds (for PNA annealing), 50˚C for
105
45 seconds, 68˚C for 90 seconds with a 5 minute final extension at 68˚C. Samples were run on a
1% agarose gel to confirm PCR success and cleaned using Agencourt AMpure XBeads
(Beckman Coulture) in a ratio of beads to product according to the protocol specified in
Illumina’s 16S Metagenomic Sequencing Library Preparation. Secondary PCR to index each
sample with unique adapters was performed after cleaning. Reactions for Index PCR consisted of
25 µL of KAPA HiFi Hotstart ReadyMix (KAPA Biosystems), 10 µL of sterile PCR grade
water, 5 µL of both Nextera XT Index Forward and Reverse primer (Nextera), 5µL of cleaned
DNA, and 2.5 µL (30 μM) of the 2 PNA mixture. The thermocycler settings were 95˚C for 3
minutes, with 8 cycles of 95˚C for 30 seconds, 78˚C for 10 seconds (for PNA annealing), 55˚C
for 30 seconds, 72˚C for 30 seconds and 5 minute final extension at 72˚C. Indexing PCR success
was visualized on 1% agarose gels and samples were cleaned again according to the same
magnetic bead based protocol from Illumina. After the final clean up, the DNA concentration of
all samples were quantified using a Nanodrop 2000 (Thermofisher) and pooled equally according
to their DNA concentration. The library was then processed at the University of Tennessee
Genomics Core. They were first run on a Bioanalyzer High Sensitivity Chip (Agilent
Technologies) to quantify concentration and confirm amplicon size then sequenced using
Version 2, 300 cycle (2 X 275) kit on the Illumina MiSeq platform.
Analysis using QIIME2
Reads were visualized in FastQC to determine per base sequence quality and both
trimming and truncation length. Average per base sequence quality was above 35 for all samples.
Reads were not trimmed due to high sequence quality and were truncated to 250 bp (FastQC),
which is the approximate length of our amplicon. MiSeq reads were imported into QIIME2 as
paired end demultiplexed samples. Once imported into QIIME2 the DADA2 denoised paired
106
plugin was used (Callahan et al., 2016). All samples were rarified to 1,493 sequences, as this was
the lowest number of reads in a sample used. Raw reads for all samples can be found at EMBL-
EBI under the project title “Nutrient-Dependent Plant Driven Colonization Patterns”, study #
PRJEB32084 and secondary accession number # ERP114715.
Approximating 16S rRNA gene read count for each bacterial isolate
Individual amplicon sequence variants, ASVs, from MiSeq were aligned to the full 16S
rRNA gene sequence of each community member. We used the synthetic community inoculum
sequenced to create a classifier by aligning these reads to the 16S rRNA genes of each of our
isolates. Alignment threshold was set to 95% since each synthetic community member was of a
different genus. Successful alignment confirmed the presence of each of our community
members and identified and grouped the ASVs for each. The scripts for this can be viewed at
github.com/SEPapoulis under the paper title name. There were ASVs that did not match to any
of the synthetic community members. They represented just over 5% of the read count of the
total sequenced reads, and the majority of these reads were either our D. radiodurans
colonization control, or our host plant, alfalfa (Figure 3.2A, B). Any samples with high numbers
of reads aligning to the drop out community member that was excluded were removed from
further analysis as they were assumed to be contaminated samples. Thresholds were created for
Bacillus sp. R1, Pantoea sp. R4, Micrococcus sp. R34, and Williamsia sp. R60 at a read count of
7, 150, 31, and 43 respectively, as there were minimal reads for these members in each of their
drop out community. These reads are suspected to be from dead seed endophytes as many of
these community members are common seed endophytes in alfalfa and about 10% of reads from
the heat treated seedlings aligned to one of the synthetic community members (Figure 3.2C, D,
Lopez et al., 2017). In an examination of all reads from the drop out community of samples that
107
did not align to either the synthetic community or the plant, Proteobacteria took up the largest
portion of the unaligned reads, about 2% of all the drop out community reads (Figure 3.2C). We
hypothesize this is why Pantoea sp. R4 requires a higher threshold than other members, as
Pantoea sp. R4 is the only member of the phylum Proteobacteria. All drop out communities
contained at least 3 or more biological replicates at each nutrient condition. The total synthetic
community inoculum was sequenced and compared to viable plant counts. Ratio of viable plate
counts of each member to sequenced reads was used to determine how accurately each synthetic
community member was represented in the experiments using sequencing (Figure 3.4).
Plant growth promotion assays
For the germination assays, both heat treated, and surface sterilized seeds were used. Heat
treatment was performed as in the aforementioned protocol under the method section from this
chapter, “Seed Information and Germination” with small modifications. Murashige and Skoog
germination agar was not used to remove any nutrients that might increase the germination rate
artificially. Surface sterilization seeds were put into Eppendorf tubes with 70% ethanol with
0.001% Triton X 100 added to cover seeds completely for one minute. Ethanol was carefully
pipetted out of the Eppendorf tubes and freshly made 10% bleach was added to completely cover
seeds for 7 minutes. To fully remove bleach, three rinses in sterile water were performed, the
first rinse for 3 minutes, and the remaining rinses for 1 minute each. All water was pipetted out
of the Eppendorf tubes and sterile forceps were used to remove the seeds. Both the heat-treated
seeds and the surface sterilized seeds were placed in sterile petri dishes with 20 mL of sterile DI
water or sterile water with a final OD of 0.01 of Pantoea sp. R4. The culture of Pantoea sp. R4
was grown in LB overnight, then washed twice and resuspended in the sterile water to remove
exogenous nutrients. Plates were parafilmed (BEMIS) and placed under the same germination
108
conditions as described above. After 3 days of germination, plants were assayed for successful
germination based on the emergence of a radicle. Size of the radical was not measure as size of
seeds germination vary widely between seedlings and thus would not be due to the presence or
absence of Pantoea sp. R4.
Biomass, height, and leaf number were assayed in a variety of experiments to measure
plant growth promotion. Here, biomass refers to the wet biomass. Biomass was measured using
pre-weighed 5 mL tubes. Although dry biomass is preferred, dry biomass cannot be recorded.
This is because plant samples must be homogenized to obtain CFU counts. For continuity
between experiments wet biomass was used for all experiments regardless of whether CFU was
taken. Height specifically refers to aboveground height, from where the plant grew above the
magenta jar media. The number of leaves counted refers to all leaves, including both initial and
false leaves.
The protocol to sterilize soil was based off previously published autoclave sterilization
techniques (Williams-Linera and Ewel, 1984). Soil that had not been fertilized was harvested
from the approximate coordinates in Eastern Tennessee (35.9511847, -83.8575348). Roughly 4
pounds worth of soil was brought to the lab and mixed thoroughly to decrease variation across
replicates. Sterile DI water was mixed with soil to moisten it for maximum steam sterilization in
the autoclave. The soil was autoclaved for an hour, then let sit for 24 hours. After 24 hours, the
soil was autoclaved again, then sterilely aliquoted into pre-sterilized magenta jars.
Approximately 30 mL of sterile DI water was added to each magenta jar, with less added when
soil absorbency was too low, to obtain well-watered soil throughout the experiment. Soil is
notoriously difficult to autoclave, and sterility checks on LB did contain CFUs, however, when
compared to unautoclaved soil, there was still a significant reduction in colonies. As Pantoea sp.
109
R4 and Williamsia sp. R60 are easily identified by their color and colonized to higher extents
than the natural soil community members that survived autoclaving they were both able to be
identified with ease.
Statistical analysis
A 1-way ANOVA with a post hoc Tukey's test was used to test if there were significant
differences in the variables compared in Figures 3.3, 3.5, 3.9, 3.10, 3.12, 3.15, 3.16, 3.19, 3.20.
Because we were testing for differences in normally distributed bacterial strain colonization data
between two treatment groups in Fig. 9F, the data was analyzed using an unpaired t-tests. A 1-
way ANOVA with no post hoc analysis was performed for Figure 3.11 as no significant
differences could be detected. Figures 3.14 and 3.21 also use unpaired t-tests as each group is
only compared to one other and thus an ANOVA is not necessary. All data was statistically
analyzed in Prism version 8.0 for PC (GraphPad Software, La Jolla, California, USA,
www.graphpad.com).
Results:
Generation of the synthetic community
To link plant nutrient availability to altered plant microbiome assembly from
environmental inocula, we created a synthetic bacterial community based on phylogenetic
representation, diversity of nutrient/plant associated traits, and lack of apparent antagonism
between members in vitro (Figure 3.5, Table 3.1, 3.3) from our collection of microbes isolated
from feral M. sativa tissue. The synthetic community was designed to include the three phyla
that dominated our wild M. sativa leaf samples and plant endophytes in general: Proteobacteria,
Actinobacteria and Firmicutes (Figure 3.1; Vorholt et al., 2012). Nutrient and plant associated
traits measured include: indole-acetic acid (IAA) production, siderophore production, phosphate
110
and potassium solubilization, and survival in nitrogen free media (Figure 3.5, Szkop et al., 2012;
Lynne et al., 2011; Li et al., 2017; Lopez et al., 2017). Because ten of twelve distinct isolates
displayed survival in media without nitrogen addition, we decided to determine the ability of
these isolates to colonize plants provided with varying nitrogen concentrations: “no added
nitrogen”, “standard Yoshida”, and “high nitrogen” (see Materials and Methods for calculation
of fertilizer levels based on crops rotated with M. sativa) (Figure 3.5). To limit overt antibiosis
between community members driving plant microbiome assembly, microbes were co-cultured in
vitro, and synthetic community members were chosen based on the absence of obvious growth
inhibition (Table 3.3). While our microbe-microbe screening does not eliminate antagonism
within the synthetic community during colonization, it does decrease its likelihood. One isolate
from each of the eight bacterial genera represented in our culture collection was selected to
reduce sequencing classification errors. We also included a Deinococcus radiodurans isolate as a
low colonization control (Figure 3.3). The resulting synthetic community therefore focuses more
closely on emergent interactions between plants and microbes during colonization.
Plant microbiome assembly
While our microbial isolates were isolated from surface-sterilized M. sativa leaves and
flowers, suggesting they are endophytes, the majority of the isolates appear to be low colonizers
of the plant 2 weeks following inoculation (Figure 3.4, 3.6).Whether roots or leaf/stem tissue of
M. sativa was inoculated with our synthetic community, only Pantoea sp. R4, Williamsia sp.
R60, and Arthrobacter sp. R85 were consistently recovered as colony forming units (CFU) from
our whole plant tissue, suggesting that tissue of inoculation does not alter post-colonization
community structure (Figure 3.7). Under all nutrient growth conditions, Pantoea sp. R4
consistently represented over 80% of the 16S rRNA gene amplicon reads sequenced in our 2
111
week old inoculated plants (Figure 3.6B). Six of eight isolates colonized at lower levels than our
low colonizing control, D. radiodurans (Figure 3.3, 3.8).
Drop out community results
To determine if microbe-microbe interactions disrupted plant microbiome assembly, each
community member was removed individually to ascertain its influence on the community
structure (Figure 3.6A). Between drop out communities, the assembled plant microbiome was
consistent, being dominated in each case by two members, Pantoea sp. R4 and Williamsia sp.
R60. When Pantoea sp. R4 was removed, the largest difference in community structure was
observed (Figure 3.6B). In the synthetic community that lacked Pantoea sp. R4 (-R4), the overall
colonization is lower, suggesting that Pantoea sp. R4 does not directly limit colonization of other
isolates when it is present, but is merely a better colonizer than the other organisms (Figure
3.6B). Arthrobacter sp. R85 colonized to low extents in sequenced datasets (Figure 3.8). We
examined this using the rarified read count of only the reads aligning synthetic community
members, excluding reads that align to the colonization control D. radiodurans (Figure 3.4) and
plant organelles (Figure 3.2). In the total community, the rarefied read count that aligned to
synthetic community members was on average 2.21 fold more than the -R4 community at each
nutrient level (Figure 3.8). Decreases in rarefied synthetic community member read count were
not observed in any other communities (Figure 3.3, 3.9, 3.10). The removal of Pantoea sp. R4
did not significantly increase the read count of other community members (Figure 3.6, 3.9),
further indicating that Pantoea sp. R4 does not directly impact the ability of other community
members to colonize the plant. Interestingly, when the second highest colonizer was removed,
creating the -R60 community, there was a failure to detect increases or decreases in community
member abundances in comparison to the total community (Figure 9C, 11). Thus, our synthetic
112
community shows no evidence of microbe-microbe interactions that affect community assembly
in M. sativa.
Impact of nutrient concentration on isolate colonization
To determine if nutrient availability modulates individual microbe colonization within M.
sativa, we grew plants inoculated with each synthetic community under variable nitrogen
concentrations. As nitrogen concentration increases, Williamsia sp. R60 displays significantly
higher colonization of M. sativa (Figure 3.9E). This pattern was consistent across all drop out
communities in plant tissue. However, Williamsia sp. R60 abundance displays the opposite
pattern in the absence of a plant, where Williamsia sp. R60 has on average 1.98 fold higher
abundance at no nitrogen added than at standard Yoshida and 2.66 fold higher at high nitrogen
concentrations (Figure 3.9E). The decrease in Williamsia sp. R60 colonization of the media with
increasing nitrogen concentrations was surprising. However colonization of media controls
displayed low colonization levels across all three nutrients despite significant higher colonization
at no nitrogen added conditions, suggesting that changes, while significant, still represent low
colonization of media. Similarly, Pantoea sp. R4 displayed divergent patterns in abundance with
and without the plant. While Pantoea sp. R4 is able to colonize to the same extent at each
nutrient condition in planta, its abundance is decreased by 1.87 fold at no nitrogen added when
compared to standard Yoshida and 1.91 fold at high nitrogen when colonizing the media in no
plant added controls (Figure 3.9D). Because of the divergent microbial abundance in the same
conditions without the plant, we suggest that differences in colonization of microbes grown in
varying nutrient concentration are plant-driven and not solely nutrient dependent.
To investigate the importance of these results to long-term colonization, Pantoea sp. R4
and Williamsia sp. R60 were the sole inocula of M. sativa plants grown for 6 weeks in standard
113
Yoshida media, ½ Yoshida, or autoclaved soil. For Pantoea sp. R4, we demonstrate that the high
level of colonization observed in our two week experiments (Figure 3.6) was not maintained in
plants that received full Yoshida medium, but was consistent in plants that received half strength
Yoshida or autoclaved soil (Figure 3.12A) although Pantoea sp. R4 can colonize this long in
medium with no plant present (Figure 3.13). For Williamsia sp. R60, we found consistent and
lower colonization than Pantoea sp. R4 (Figure 3.12). Thus, we observed the level of
colonization for Pantoea sp. R4 and Williamsia sp. R60 were nutrient and plant dependent,
suggesting plants differentially modify microbial colonization.
2 week viable count synthetic communities
In order to ensure that analyzing the synthetic community via viable counts was
comparable to that of the sequenced synthetic community we inoculated and harvested the total
synthetic community at the 2 week time point. Within the 2 week time frame, results were
consistent with previous experiments, with Pantoea sp. R4 as the main colonizer and Williamsia
sp. R60 as the second highest colonizer. Arthrobacter sp. R85 was the only other synthetic
community member colonizing across multiple plants (Figure 3.14A). All other community
members were below the limit of detection on viable counts, except for Streptomyces sp. R81,
which only was isolated from one plant. This low colonization is consistent with their low levels
of colonization within the 2 week synthetic community drop out experiments (Figure 3.8, 3.9,
3.14).
While 16S rRNA gene amplicon sequencing provides more thorough assessment of
microbial community structure than limited culture-based methods, 16S rRNA gene copy
number and primer bias can lead to misrepresentation of the community (Parada et al., 2016). To
confirm that our results were unaffected by such bias, we applied a different approach than
114
previous computational prediction tools (Angly et al., 2014, Langille et al., 2012) by pairing our
16S rRNA amplicon data with viable counts of the total synthetic community inoculum.
Correlations between 16S rRNA copy number and viable counts have been previously assessed
to establish if organisms were over or underrepresented in 16S rRNA gene amplicon sequencing
(Hammer et al., 2017). We established a ratio of the number of reads assigned to each member of
our synthetic community from the sequenced total community inoculum sample and the viable
counts in the same sequenced inoculum. If we weight our 16S rRNA genes amplicon sequencing
results using this ratio, our previous conclusions are robust (See Materials and Methods, Figure
3.4), indicating that we did not overrepresent the ability of Pantoea sp. R4 to colonize whole
alfalfa plants. The relationship between the viable count synthetic community 2 week results and
the sequenced community results suggest that the main colonizers can be accurately measured
using either 16S rRNA sequencing or viable count experiments.
There was variability between replicates at the 2 week time point viable counts. These
variations can be seen in Figure 3.14A, where there are 5 of 25 plants where Pantoea sp. R4 is
not the dominant colonizer, with Williamsia sp. R60 as the dominate colonizer in 4 of these 5,
and Arthrobacter as the dominate colonizer in one. These variances can be seen with other
synthetic community experiments and are likely part of the natural variance between plants
however it could suggest instability in the synthetic community colonization (Carlström et al.,
2019).
4 week viable count synthetic communities
We expanded our colonization past 2 weeks with the total synthetic community to
determine if Pantoea sp. R4 remains the predominant colonizer over time (Figure 3.14B). Since
Pantoea sp. R4 colonization was consistent across nutrient levels, we chose not to modulate
115
nutrient levels but rather focus solely on changes in community succession over time. We
inoculated with the same synthetic community but chose to use viable counts instead of
sequencing to measure community structure. We did this for two reasons, the first being that it
has been established all members of the synthetic community can be distinguished from one
another on an LB plate. The second reason is that the low colonizers colonized so minimally that
they did not appear to have any impact community structure in the drop out experiments at 2
weeks, and thus likely the community structure changes would be observed from the main
colonizers. This allows viable count experiments to reveal accurate changes in the community.
At 4 weeks, we observe community succession as Arthrobacter sp. R85 becomes the
main colonizer, increasing its colonization from the 2 week to the 4 week time point and shifting
the overall community structure (Figure 3.14B). While Arthrobacter sp. R85 was generally the
third highest colonizer, it had never dominated the synthetic community across any 2 week
nutrient or drop out community time points (Figure 3.6, 3.8, 3.9). We examined the total
colonization of each of the main colonizers with the synthetic community at 2 and 4 weeks to
determine how each changed over the time course. When doing so, we observed that
Arthrobacter sp. R85 increased significantly from 2 weeks to 4 weeks (Figure 3.14C, p-
value=0.0046). While Pantoea sp. R4 was no longer the highest colonizer of the synthetic
community, it did not significantly decrease its colonization. However, the average CFU per
gram of plant for Pantoea sp. R4 did decrease (Figure 3.14C). Williamsia sp. R60 also decreased
in colonization, trending towards significance (Figure 3.14C, p-value=0.0781). The only other
microbe able to be visualized was Streptomyces sp. R81, colonizing only a small extent on one
plant. As with the 2 week time point, there was also variability in the 4 week experiment. While
116
Arthrobacter sp. R85 is the main colonizer in almost 70% of the plants, Williamsia sp. R60
dominates around 16% and Pantoea sp. R4 dominates the other 12% (Figure 3.14B).
Individual colonization strategies over time
Observing Pantoea sp. R4 colonization in regular Yoshida at 4 days to 6 weeks, Pantoea
sp. R4 appears to colonize at its highest at the earliest time points. When we examine all
individual colonization experiments with Pantoea sp. R4 at constant nutrient conditions of
regular Yoshida media, we see that Pantoea sp. R4 decreases over time (Figure 3.15A). At 4
days it can colonize higher than any other microbe isolated in this study (Figure 3.1, 3.15A). At 2
weeks it remains high in individual colonization. However, Pantoea sp. R4 is not able to increase
its colonization over time, and it either stays constant, or decreases (Figure 3.15A).
The two other main colonizers appear to have distinct colonization strategies as well.
Williamsia sp. R60 or Arthrobacter sp. R85, each appear to have their own patterns in
colonization over time. On its own Arthrobacter sp. R85, displays low levels of colonization at 4
days but colonizes significantly higher over time individually (Figure 3.15). This is consistent
within the synthetic community from 2 weeks to 4 weeks as well (Figure 3.14). Williamsia sp.
R60 is a consistently high colonizer at 4 days and 2 week and stays high within the plant even at
later 6 week time points (Figure 3.15B). Again, this is similar within the synthetic community
results as Williamsia sp. R60 stays constant over time (Figure 3.14). This suggests the strategy of
colonization is different for each of the 3 main colonizers. While much is known about Pantoea
spp. colonization, and its ability to colonize throughout the plant, Williamsia and Arthrobacter
spp. have not been studied to this extent. Studying how each of these three strains colonize
within the plant might reveal more about the colonization strategies that different organisms
exhibit over time.
117
Plant biomass in relation to microbial colonization strategies
We examine biomass in the context of the colonization of the top three colonizers across
time points to place colonization within the physiological context of the plant (Figure 3.16). All
three microbes have been identified to make the phytohormone auxin, so they are able to interact
with the plant and could potentially modulate plant physiology (Figure 3.5). Within the 6 weeks
that we study plant microbe colonization, M. sativa is still within its early life stages, reaching
only the vegetative stage of the M. sativa life cycle where the aboveground plant height is less
than six inches (Lollato and Min, 2017). With Williamsia sp. R60 and Arthrobacter sp. R85 as
well as uninoculated plants, the 4 day time point is significantly different from all other time
points, while all other time points are not always significantly different from each other. This
demonstrates that the largest increase in growth happens with the 4 day and 2 week time points.
However, when inoculated with Pantoea sp. R4, M. sativa plants do not increase significantly
from 4 days to 2 weeks but rather are significantly different when comparing the 4 day with the 4
and 6 week. It is possible that the burden of the higher colonization levels with Pantoea sp. R4
causes plants to be depressed in their growth conditions initially but as Pantoea sp. R4
colonization within the plant decreases, the biomass of the plant increases. This has been shown
before in other organisms as a defense strategy (Luu and Tate, 2017). Overall, M. sativa is in a
rapid growth phase from 4 days to 2 weeks, but the rate at which the biomass increases begins to
decrease after 2 weeks.
Investigations into plant growth promotion under varying nutrient conditions
While the ability to solubilize potassium and phosphate are commonly cited as indicators
of plant growth promotion, Pantoea sp. R4 only appeared to promote plant growth under strict
nutrient conditions. To detect plant growth promotion and any subtle changes that might occur
over time or with nutrient availability, we assayed plant growth promotion at various stages from
118
the initial germination to 6 weeks. Initially we measured germination rate with and without the
addition of Pantoea sp. R4 to both heat-treated seedlings and surface sterilized seedlings in order
to investigate the impact of Pantoea sp. R4 on both a close to sterile seedling as well as a
seedling with the endophyte community preserved (Figure 3.17). Heat treated seedlings are
heated to reduce the endophytic bacterial and fungal community, and while sequencing these
seedlings have produced small amounts of sequenced reads, culturing efforts of these seedlings
do not produce any CFU counts after 14 days (Figure 3.2). Surface sterilized seeds only removed
the epiphytic community keeping the endophytic community intact. Pantoea sp. R4 did not
increase germination rate of alfalfa seeds significantly when compared to the uninoculated
control (Figure 3.17). However, the average germination rate of alfalfa seeds was higher when
Pantoea sp. R4 was added for both the heat-treated and surface sterilized seedlings (Figure 3.17).
Throughout the drop out experiments, we collected plant biomass, plant height and
number of leaves for each plant tested under the three nitrogen treatments. Again, we were
unable to detect a significant difference for any of the drop out communities, including the -R4
community (Figure 3.18). However, it is unlikely to see differences in plant growth promotion at
two week time points. Therefore, we extended the experiments to longer time points when plant
growth promotion is generally measured (Ansari et al., 2019). We further examined six week
time points with the two highest colonizers of the drop out experiments: Pantoea sp. R4 and
Williamsia sp. R60. Williamsia sp. R60 was used as bacterial colonization control to account for
any increases in plant growth that were due solely to the presence of bacteria rather than
specifically Pantoea sp. R4. Williamsia sp. R60 was chosen as it was still a high plant colonizer
but was not hypothesized to be a plant growth promoting organism as it did not exhibit
potassium or phosphate solubilization (Figure 3.5). We chose both regular nutrient and ½
119
nutrient conditions to attempt to control for plant growth promotion due to nutrient availability.
Nitrogen conditions were not chosen, as plants without nitrogen added rapidly die off after 4
weeks. We failed to detect an increase in plant biomass, height, or number of leaves when
inoculated with Pantoea sp. R4 when compared to the uninoculated controls at ½ strength
Yoshida nutrients, or standard Yoshida concentrations after 6 weeks of growth (Figure 3.19).
Williamsia sp. R60 appeared to have a negative impact on plant health under ½ strength Yoshida
conditions as these plants had significantly decreased plant biomass, height, and number of
leaves when compared to Pantoea sp. R4 or the uninoculated plants. In standard Yoshida
conditions inoculated with Williamsia sp. R60, only the number of leaves significantly decreased
(Figure 3.19C). Thus, while Pantoea sp. R4 does not promote plant growth under these
conditions, its colonization does not appear to negatively impact the plant.
While Pantoea sp. R4 was not a plant growth promoter at no nitrogen added, ½, standard
Yoshida, or high nitrogen (Figure 3.18, 3.19), all of these media contain only soluble forms of
phosphate and potassium. Given that Pantoea sp. R4 stood out as one of three isolates able to
solubilize calcium phosphate and the only isolate to solubilize potassium feldspar, we chose to
grow plants in twice autoclaved soil as per soil sterilization guidelines (Williams-Linera and
Ewel, 1984). The soil was sourced from an area in Knoxville (35°57'14.8"N 83°50'49.1"W)
without any documented fertilizer use to reduce the likelihood anthropogenic influence on
nutrient availability. Rock forms of potassium and phosphate are present in the soil, and are
insoluble to most plants (Woodruff et al., 2014). Both Pantoea sp. R4 and Williamsia sp. R60
inoculated plants as well as uninoculated plants were grown for 6 weeks (Figure 3.20). Pantoea
sp. R4 was only significantly higher in number of leaves but did not increase biomass or plant
height when compared to the uninoculated control (Figure 3.20C). Williamsia sp. R60 did
120
increase biomass and number of leaves when compared to the uninoculated. There were no
significant differences obtained in plant height for either bacterial inoculum (Figure 3.20B).
Thus, plant growth promotion was not demonstrated for Pantoea sp. R4.
Finally, we examined plant growth promotion in no nitrogen added conditions at 4
weeks. In this condition our plants exhibit more stress than at all other nutrient conditions we
have assayed, as plants begin to die after 4 weeks. Plants inoculated with Pantoea sp. R4 did
have significantly higher plant height and biomass than their uninoculated counterparts after the
4 weeks of growth (Figure 3.21). There was no evidence of nodule formation for these plants,
either inoculated or uninoculated. We did not inoculate plants with Williamsia sp. R60 at no
nitrogen added conditions as it was not able colonize well at no nitrogen conditions added based
both on viable counts and drop out community results (Figure 3.9, 3.12). Cumulatively, Pantoea
sp. R4 can promote plant growth, but it appears that growth promotion under the conditions we
have tested is limited only to severely nitrogen deplete conditions. Considering that most plant
associated traits that the synthetic community strains have been assayed for are an ability to
provide nutrients, it logically follows that plant growth promotion would only be demonstrated
during these times. However, typically screening for plant growth promotion is done in nutrient
replete conditions, and thus descriptions of Pantoea sp. R4 as a plant growth promoter should be
strictly cautioned with the specific conditions that reveal it. Further, it appears that Pantoea sp.
R4 does initially depress plant growth under regular Yoshida conditions, when comparing 4 day
to 2 week plant biomass of plants inoculated with Williamsia sp. R60, Arthrobacter sp. R85 and
uninoculated (Figure 3.16). Thus, Pantoea sp. R4 appears to have negative and positive impacts
on the plant depending on the nutritional availability within the soil and the age of the plant.
121
Discussion:
In designing a synthetic community, it is difficult to know what microbes are
representative of the microbial community. Large synthetic communities can allow for a wider
diversity of microbes, and thus increase the replicability of synthetic community findings within
natural microbial communities (Carlström et al., 2019; Lebeis et al., 2015). However, smaller
communities are more tractable and enable more in depth look at interactions between specific
microbes and their hosts (Niu et al., 2017). While our endophyte culture collection is small,
many of the members are found consistently in plant phyllosphere, root tissue and seed
endophytes (Vorholt et al., 2012, Lopez et al., 2017; Horn et al., 2016; Kaewkla and Franco,
2013; Stiefel, Zambelli, and Vorholt, 2013), as well as the 16S rRNA gene amplicon survey from
the source material for our isolate collection (Figure 3.1). In one review, three of the eight genera
represented in our synthetic community, Pantoea, Streptomyces and Arthrobacter were among
the most abundant genera detected in the phyllosphere of both legumes (e.g. clover and soybean)
and non-leguminous plants (e.g. A. thaliana and rice) (Vorholt et al., 2012). Six of the eight
genera represented in our synthetic community were previously identified as M. sativa
endophytes, and the other two, Williamsia and Oceanobacillus, were previously isolated from
the phyllosphere and root endosphere of legume and non-leguminous plants (Horn et al., 2016;
Kaewkla and Franco, 2013; Stiefel, Zambelli, and Vorholt, 2013; Yang et al., 2016). Thus, our
synthetic community is composed of M. sativa relevant bacteria.
A major finding of our synthetic community experiments is that many microbes are low
colonizers and do not appear to impact community structure when removed (Figure 3.5, 3.6, 3.8,
3.9). In an A. thaliana study of leaf, root and soil isolates, researchers determined leaf-derived
isolates were worse colonizers compared to root- and soil-derived strains when isolates from
122
different tissue origin were inoculated together (Bai et al., 2015). Although some leaf-derived
microbes colonize roots well, the majority has lower root colonization compared to root- and
soil-derived microbes (Bai et al., 2015). Our results using a community composed entirely of
aboveground tissue-derived microbes are consistent with this finding, as well as with another
study that used a community of root-derived isolates to determine one organism occupied >50%
of the assembled plant microbiome from a synthetic community (Niu et al., 2017). This
organism, an Enterobacter sp. was posited to be a keystone species, as it was able to modulate
community member growth and stabilize overall community structure (Niu et al., 2017). In both
our synthetic community and the Niu et al., 2017 study, the highest plant colonizer was from a
member of the Enterobacteriaceae family. Frequently, Proteobacteria dominate the endophytic
compartment of roots, as well as the phyllosphere, with multiple cases of only one or two
Gammaproteobacterial OTUs dominating (Gottel et al., 2011; Magnani et al., 2013;
Zarraonaindia et al., 2015; Vorholt, 2012). In our own research, we observed Proteobacteria as a
large portion of reads in our 16S rRNA gene survey in feral alfalfa leaves (Figure 3.1). While our
synthetic community results are supported by previous research, the use of nitrogen modulating,
and no plant controls expand beyond prior research.
Our 2 week drop out experiments are unique to previous studies as they use no plant
controls to examine how the host is involved in colonization across nutrients. Within our
synthetic community results we only observed microbe-microbe influence on plant colonization
at specific nitrogen concentrations. When the -R4 community was inoculated onto plants,
Williamsia sp. R60 colonized significantly more than in plants inoculated with the total
community, but only at high nitrogen concentration (Figure 3.9F). Because our high nitrogen
concentration was calculated to match fertilizer amounts to crops rotated with M. sativa, our
123
results suggest that application of fertilizer could change the ability of individual members to
colonize, even if the overall microbiome structure is not significantly altered. This sheds light on
the potentially conflicting results from previous studies as the microbiome as a whole was not
shown to not change with the addition of fertilizer (Fig. 1, 2F; Yeoh et al., 2016) but the impact
the ability of an individual organism to colonize (Fuentes-Ramıerez et al., 1999).
Pantoea spp. are known to colonize the xylem, enabling systemic colonization of the
plant, for both pathogen and commensal Pantoea strains alike (Duong et al., 2018; Ammar et al.,
2014; Ruppel et al., 1992). They are also known to be prominent seed colonizers, as they are
frequently isolated from seed endophyte communities (Lopez et al., 2018). However, while they
can colonize mature plants, they do not dominate these plants when other microbes are present
(Figure 3.1). This is supported by a recent publication that shows that Pantoea spp. were two of
the top ten main colonizers of tomato plants when the plant microbial community was passaged
every two weeks and inoculated onto new seedlings (Morella et al., 2019). This experiment used
homogenized plant material to inoculate onto new plants, re-inoculating the plants every few
days throughout the length of their 6 week experiment. Thus, the plants were constantly being
inoculated with consortia of bacteria, with Pantoea spp. as members of the consortia. Similar to
my experiments discussed above, Pantoea spp. dominates the microbial community. Their
results show the two distinct Pantoea spp. ASVs comprised approximately 70% of the total
community, even though they were less than 25% of the leaf inocula. Further, previous drop out
2 week community experiments demonstrated one main colonizer, in a phylogenetically similar
organism, dominate their synthetic community within Zea Mays at 5, 10 and 15 day time points,
with the dominant member decreasing in overall relative abundance over time (Niu et al., 2017).
If this experiment were extended, perhaps community succession as seen in Figure 3.14 would
124
be apparent. Together with the data shown in this chapter, this suggests that Pantoea spp. are
impressive early colonizers, likely able to out compete spatially by colonizing throughout the
plant quickly. However, their speedy colonization tactic does not extend beyond early
colonization, whether they are a synthetic community or on their own, as in both the synthetic
community and individually over time, Pantoea sp. R4 decreases colonization (Figure 3.14,
3.15).
Although Pantoea spp. colonize diverse host systems, colonization is not specific to the
host organism or tissue from which it was isolated (Völksch et al., 2009; Nadarasah, and
Stavrinides, 2014). The colonization abilities of Pantoea spp. are used to manage the causative
agent for fire blight, Erwinia amylovora, via niche competition (Johnson and Stockwell, 1998;
Johnson and Stockwell, 2000). One study demonstrated that P. agglomerans decreases the rate of
nodulation of the Rhizobium sp. meliotia in M. sativa by competing with R. melioti for space on
the root surface in alfalfa (Handelsman and Brill, 1985). It is possible that Pantoea sp. R4 could
also colonize the root surface and displace both the synthetic community members as well as
potential Rhizobium species. With the use of fluorescent GFP with Pantoea sp. R4 we could
observe where Pantoea sp. R4 colonizes on the plant and how it is impacted by the presence of
other synthetic community members such as Williamsia sp. R60 and Arthrobacter sp. R85. By
observing spatial colonization at multiple time points, we could determine if there is spatial
competition for colonization between organisms.
While it remains unknown why these select phyllosphere organisms colonize so
effectively while others do not. Understanding the mechanisms behind the successful
colonization of Pantoea sp. R4, Williamsia sp. R60, and Arthrobacter sp. R85 is necessary to
thoroughly characterize plant-microbe relationships during microbiome assembly. Much work
125
remains to understand why these microbes can colonize so effectively, and how that changes
over time. Most importantly, however no plant controls must be performed in order to confirm
that the increase in Arthrobacter sp. R85 is plant dependent during the 2 week and 4 week
synthetic community assembly (Figure 3.14). Once this is confirmed, examinations into genera
can elucidate reasons for high colonization and community changes over time.
While little is known about Williamsia spp. colonization in plants, Arthrobacter spp.
research does provide a hypothesis for why Arthrobacter sp. R85 is able to increase colonization
over time during our synthetic community experiments. Arthrobacter spp. are prominent
members of the phyllosphere and are popular in study for their ability to degrade a diverse array
of organic compounds (Scheublin and Leveau, 2012; Bazhanov et al., 2017). While Pantoea spp.
are similarly high colonizers and popular for study, they are not known to be high degraders of
organic compounds. In a study of root exudate in Avena barbarta over time, researchers revealed
that plant exudate contains only a small number of simple sugars such as sucrose at early time
points of 1 to 3 weeks. At later time points of 6 to 9 weeks a diverse array of more complex
sugars and amino acids are present (Zhalnina et al., 2018). As the synthetic community changes
from the 2 week to 4 week time points, it is possible that the root exudate in M. sativa could
observe a similar shift. As Arthrobacter spp. can degrade more compounds, this could explain
how Arthrobacter sp. R85 is able to increase its colonization while Pantoea sp. R4 does not. To
test this, a better understanding of the root exudate in M. sativa could elucidate changes in
nutrient availability at 2 versus 4 weeks. Using this information, Pantoea sp. R4 and
Arthrobacter sp. R85 could be screened for the ability to utilize compounds found at 2 and 4
weeks. Subsequent experiments using genetic manipulation could establish this relationship
126
directly if differential utilization of root exudate relevant compounds are revealed for Pantoea
sp. R4 and Arthrobacter sp. R85.
However, utilization of different compounds is not the only explanation as it is also
possible that the host is modulating colonization of these organisms over time. One of the
primary ways that plants modify the microbial community present is with salicylic acid (Lebeis
et al., 2015). Inoculating plants with each of the 3 colonizers at the time points studied would
allow for the measurement of salicylic acid production. As Pantoea sp. R4 colonizes highly, it
might induce more salicylic acid at an earlier time point, causing Pantoea sp. R4 to reduce
colonization over time and perhaps allowing for the microbial succession that we see from 2 to 4
weeks with Arthrobacter sp. R85 (Figure 3.14) . Salicylic acid production has been shown before
in plants as a defense strategy to reduce colonization of unwanted organisms (van Butselaar and
Van den Ackerveken, 2020). Further, in plants when salicylic acid is produced it causes a
cascade of changes in gene expression to suppress the bacterium, downregulating genes involved
in plant growth in the process. This effect is known as the growth-immunity tradeoff (van
Butselaar and Van den Ackerveken, 2020). The lack of increase that we see in Pantoea sp. R4
when comparing 4 day to 2 week biomass could then also be caused by salicylic acid production
(Figure 3.16). If Pantoea sp. R4 induces a higher amount of salicylic acid production, this would
potentially explain why plants inoculated with this strain have lower biomass at earlier time
points than plants inoculated with Williamsia sp. R60, Arthrobacter sp. R60 or uninoculated.
While numerous hypotheses and questions remain, the experiments presented in this chapter
have provided a method for designing and investigating a synthetic community to detect
differential colonization that is plant dependent when varying nutrient, temporal or microbial
presence.

127
Acknowledgements:
This material is based upon work supported by the National Science Foundation, Grant # DEB-
1638768 and DEB-1638793 to Drs. Sarah Lebeis, James Fordyce, and Matthew Forister, as well
as startup funds from the University of Tennessee given to Sarah Lebeis. We would like to thank
Drs. Alison Buchan, Heidi Goodrich-Blair and Chris Nice for their invaluable advice and
interpretation of results. We would like to thank the members of the Lebeis Lab for their support.
Finally, we profusely thank Veronica Brown for her exceptional teaching skills and expertise in
amplicon sequencing, which profoundly influenced the authors of this paper.
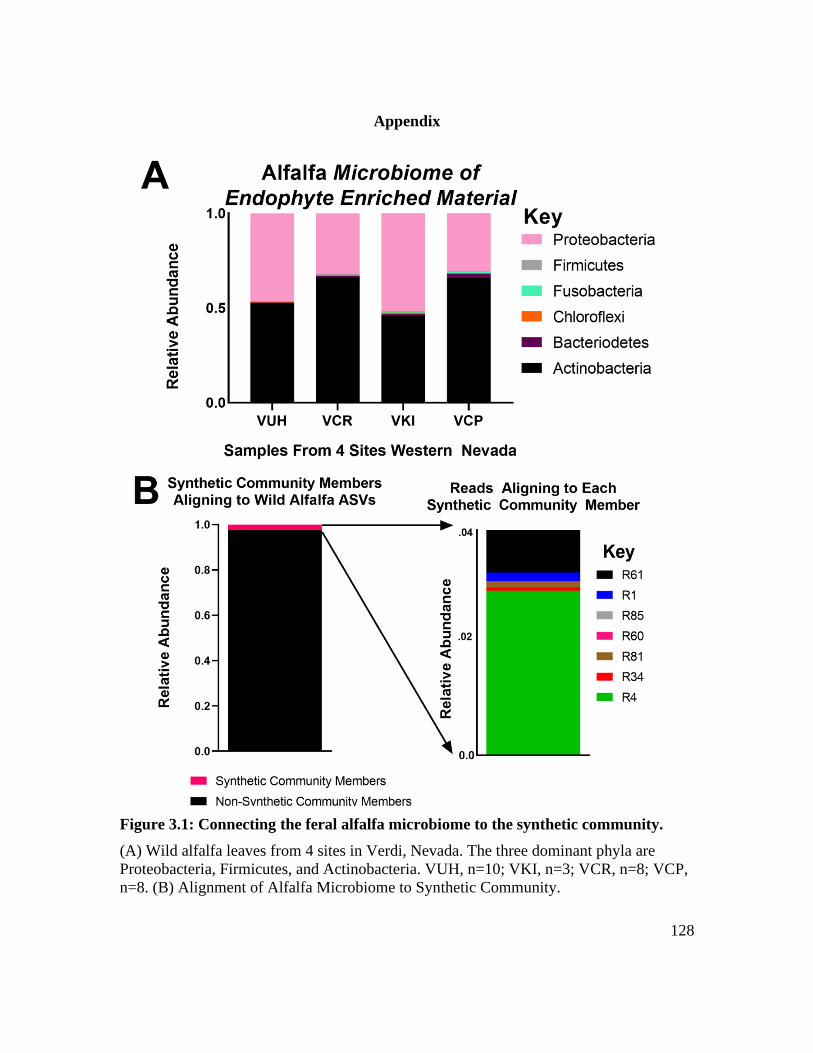
128
Appendix
Figure 3.1: Connecting the feral alfalfa microbiome to the synthetic community.
(A) Wild alfalfa leaves from 4 sites in Verdi, Nevada. The three dominant phyla are
Proteobacteria, Firmicutes, and Actinobacteria. VUH, n=10; VKI, n=3; VCR, n=8; VCP,
n=8. (B) Alignment of Alfalfa Microbiome to Synthetic Community.
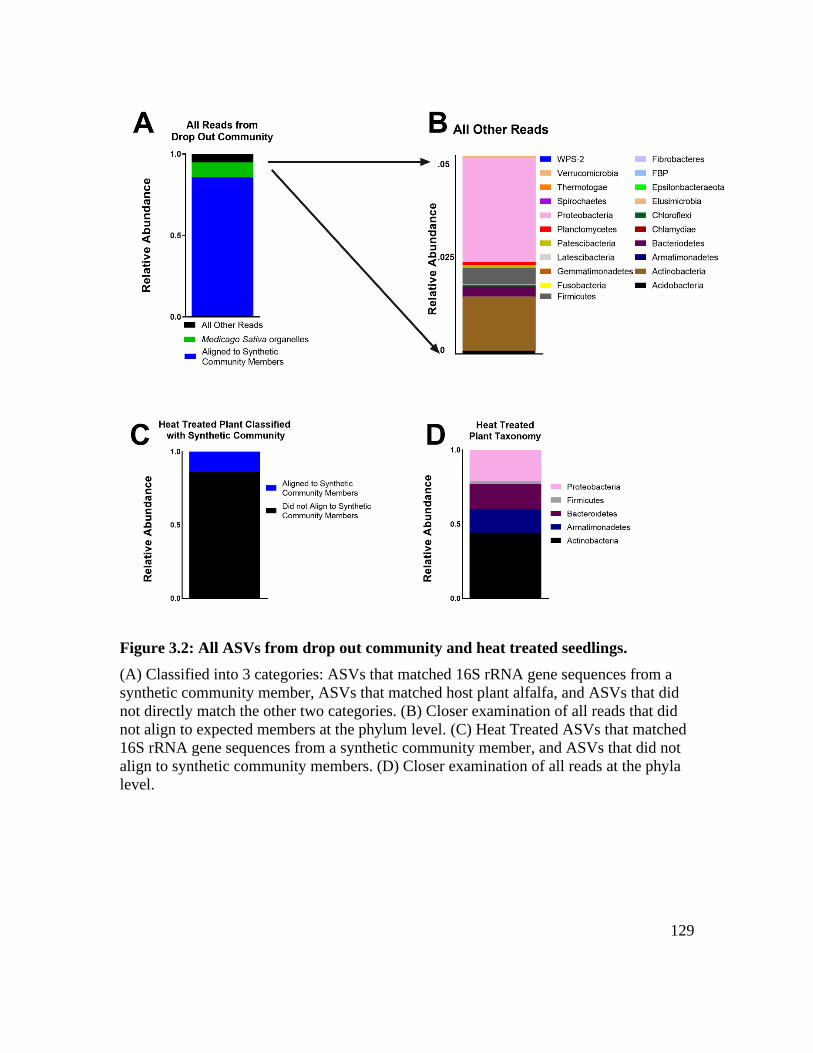
129
Figure 3.2: All ASVs from drop out community and heat treated seedlings.
(A) Classified into 3 categories: ASVs that matched 16S rRNA gene sequences from a
synthetic community member, ASVs that matched host plant alfalfa, and ASVs that did
not directly match the other two categories. (B) Closer examination of all reads that did
not align to expected members at the phylum level. (C) Heat Treated ASVs that matched
16S rRNA gene sequences from a synthetic community member, and ASVs that did not
align to synthetic community members. (D) Closer examination of all reads at the phyla
level.
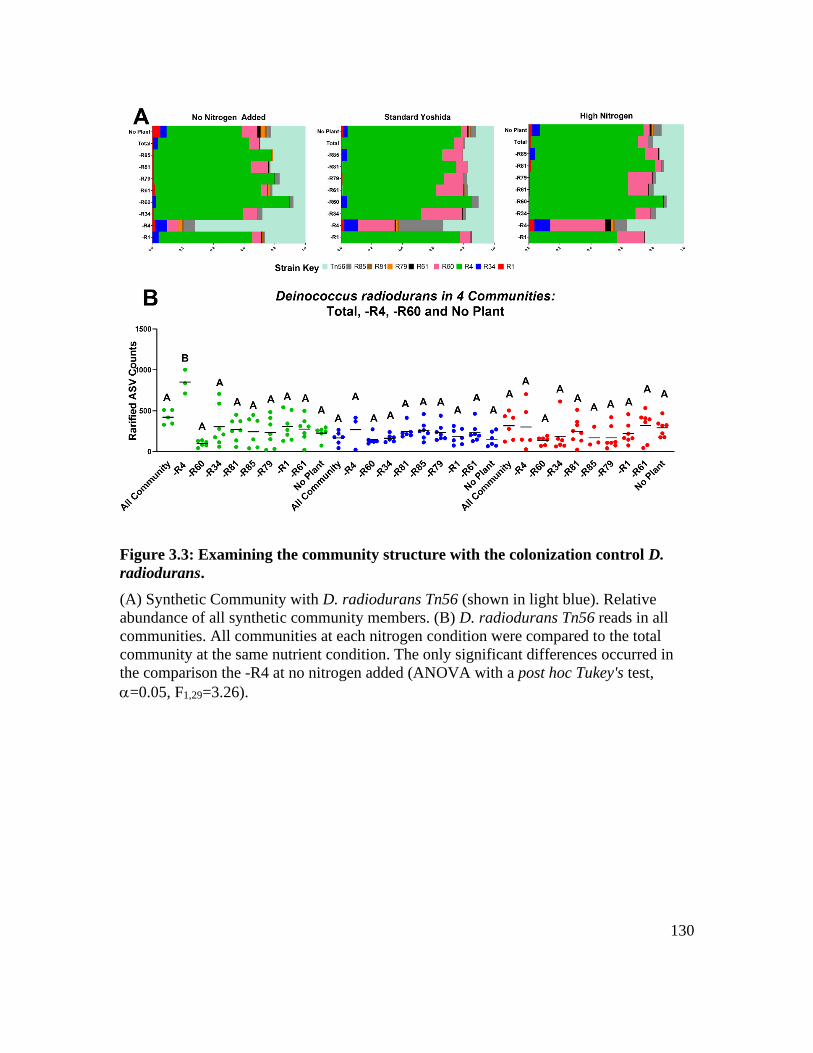
130
Figure 3.3: Examining the community structure with the colonization control D.
radiodurans.
(A) Synthetic Community with D. radiodurans Tn56 (shown in light blue). Relative
abundance of all synthetic community members. (B) D. radiodurans Tn56 reads in all
communities. All communities at each nitrogen condition were compared to the total
community at the same nutrient condition. The only significant differences occurred in
the comparison the -R4 at no nitrogen added (ANOVA with a post hoc Tukey's test,
=0.05, F1,29=3.26).
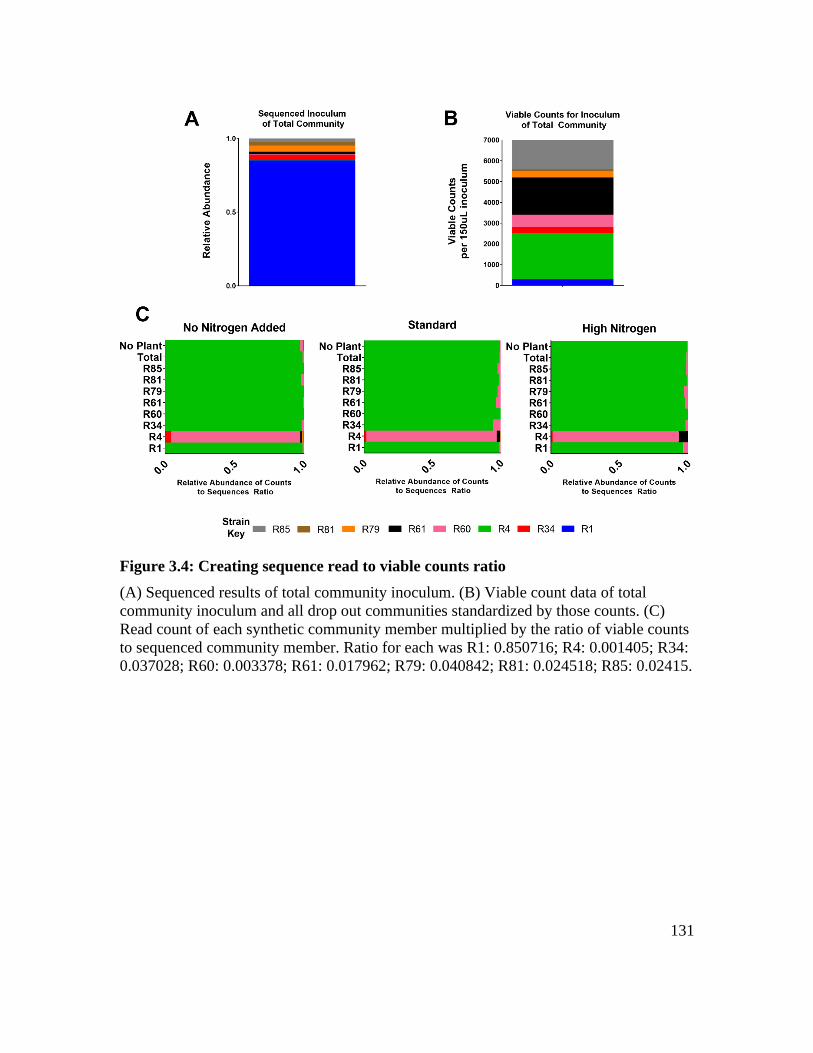
131
Figure 3.4: Creating sequence read to viable counts ratio
(A) Sequenced results of total community inoculum. (B) Viable count data of total
community inoculum and all drop out communities standardized by those counts. (C)
Read count of each synthetic community member multiplied by the ratio of viable counts
to sequenced community member. Ratio for each was R1: 0.850716; R4: 0.001405; R34:
0.037028; R60: 0.003378; R61: 0.017962; R79: 0.040842; R81: 0.024518; R85: 0.02415.
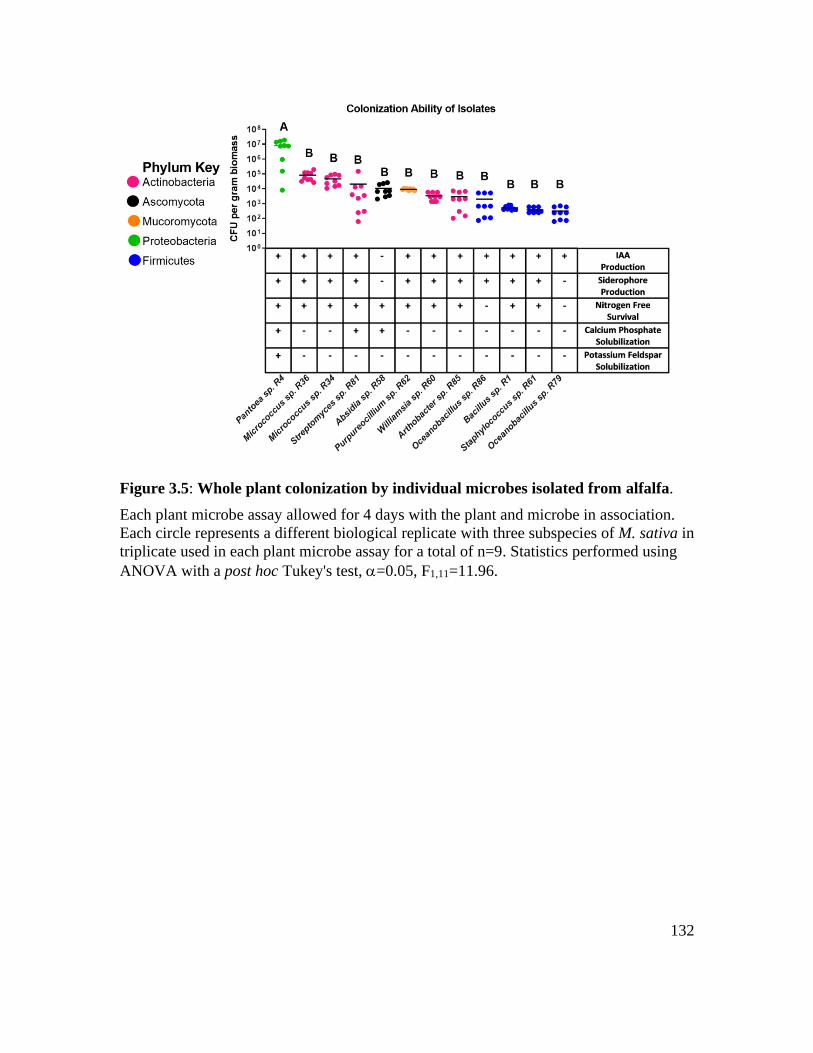
132
Figure 3.5: Whole plant colonization by individual microbes isolated from alfalfa.
Each plant microbe assay allowed for 4 days with the plant and microbe in association.
Each circle represents a different biological replicate with three subspecies of M. sativa in
triplicate used in each plant microbe assay for a total of n=9. Statistics performed using
ANOVA with a post hoc Tukey's test, =0.05, F1,11=11.96.
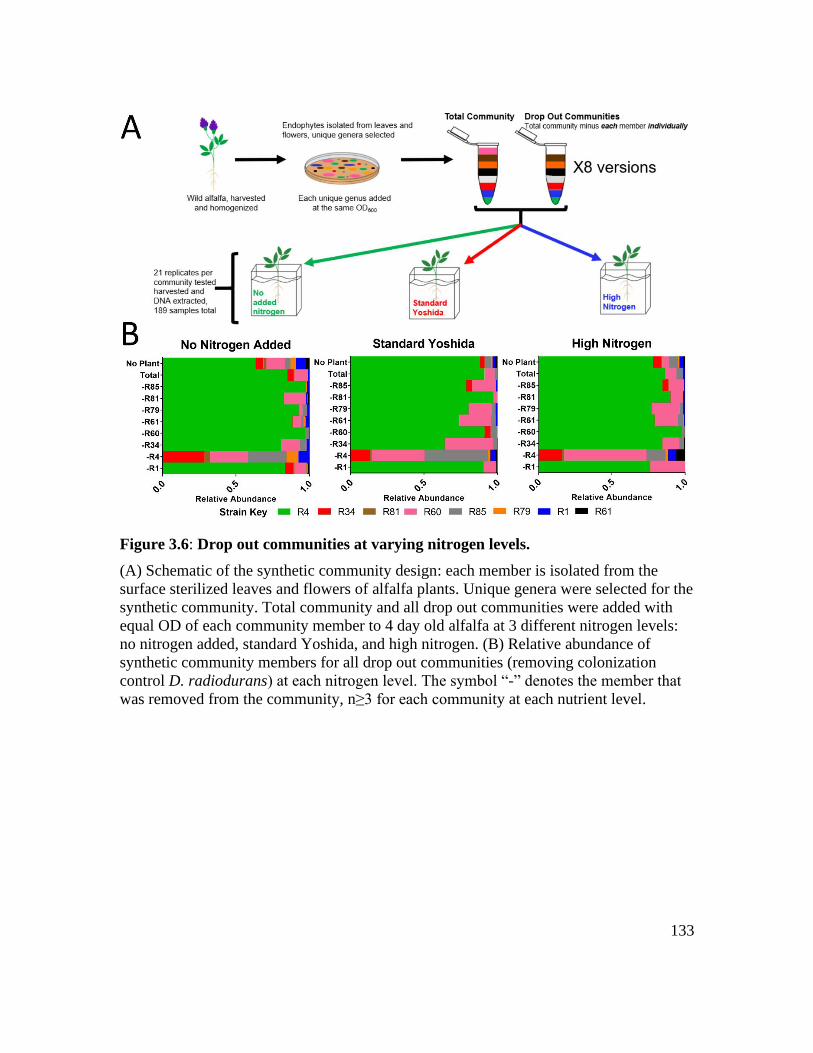
133
Figure 3.6: Drop out communities at varying nitrogen levels.
(A) Schematic of the synthetic community design: each member is isolated from the
surface sterilized leaves and flowers of alfalfa plants. Unique genera were selected for the
synthetic community. Total community and all drop out communities were added with
equal OD of each community member to 4 day old alfalfa at 3 different nitrogen levels:
no nitrogen added, standard Yoshida, and high nitrogen. (B) Relative abundance of
synthetic community members for all drop out communities (removing colonization
control D. radiodurans) at each nitrogen level. The symbol “-” denotes the member that
was removed from the community, n≥3 for each community at each nutrient level.
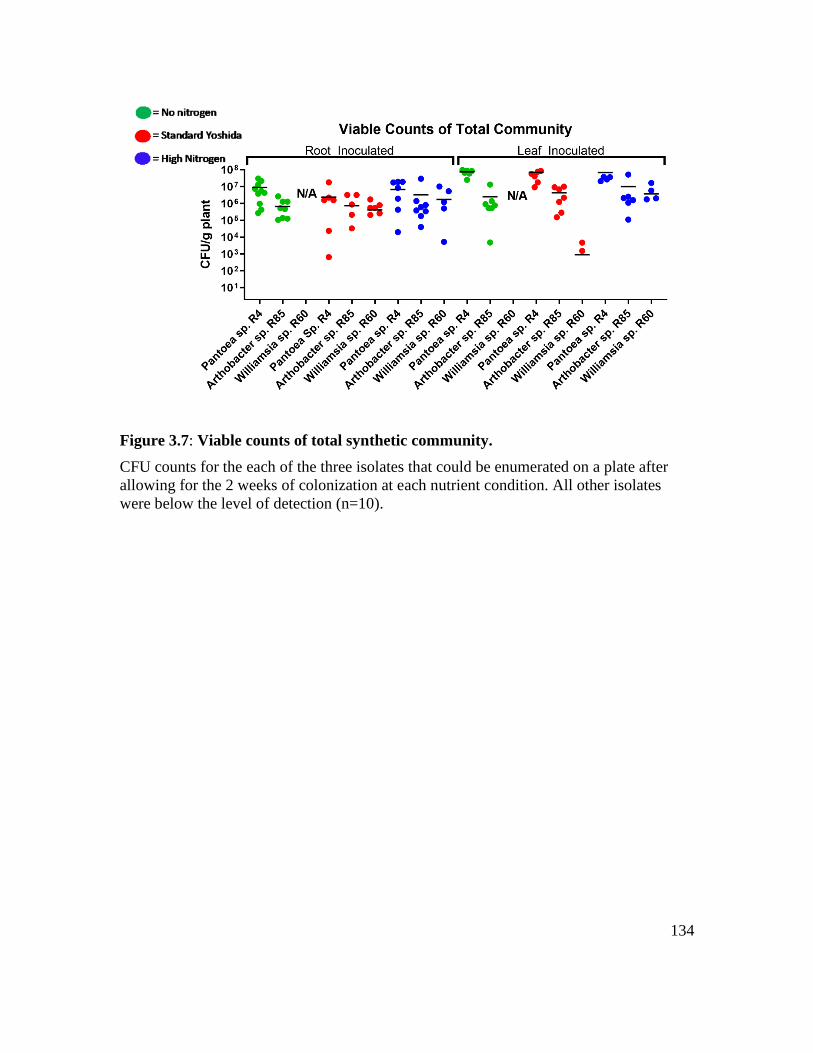
134
Figure 3.7: Viable counts of total synthetic community.
CFU counts for the each of the three isolates that could be enumerated on a plate after
allowing for the 2 weeks of colonization at each nutrient condition. All other isolates
were below the level of detection (n=10).
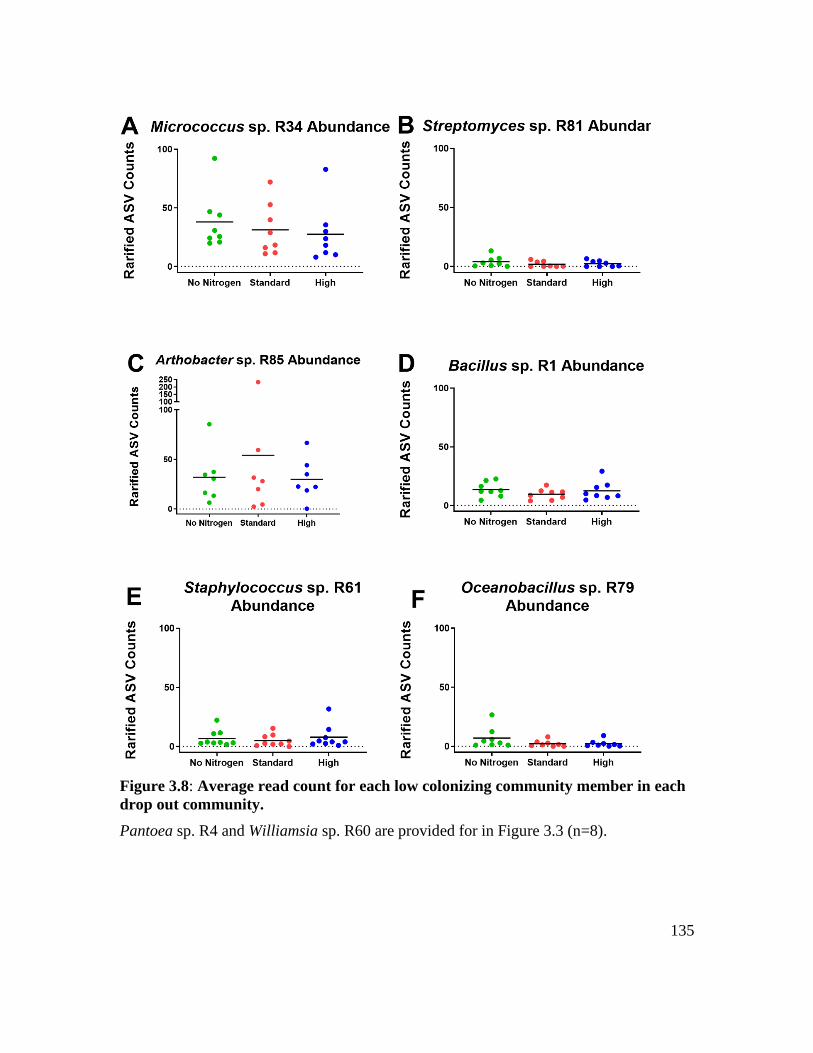
135
Figure 3.8: Average read count for each low colonizing community member in each
drop out community.
Pantoea sp. R4 and Williamsia sp. R60 are provided for in Figure 3.3 (n=8).
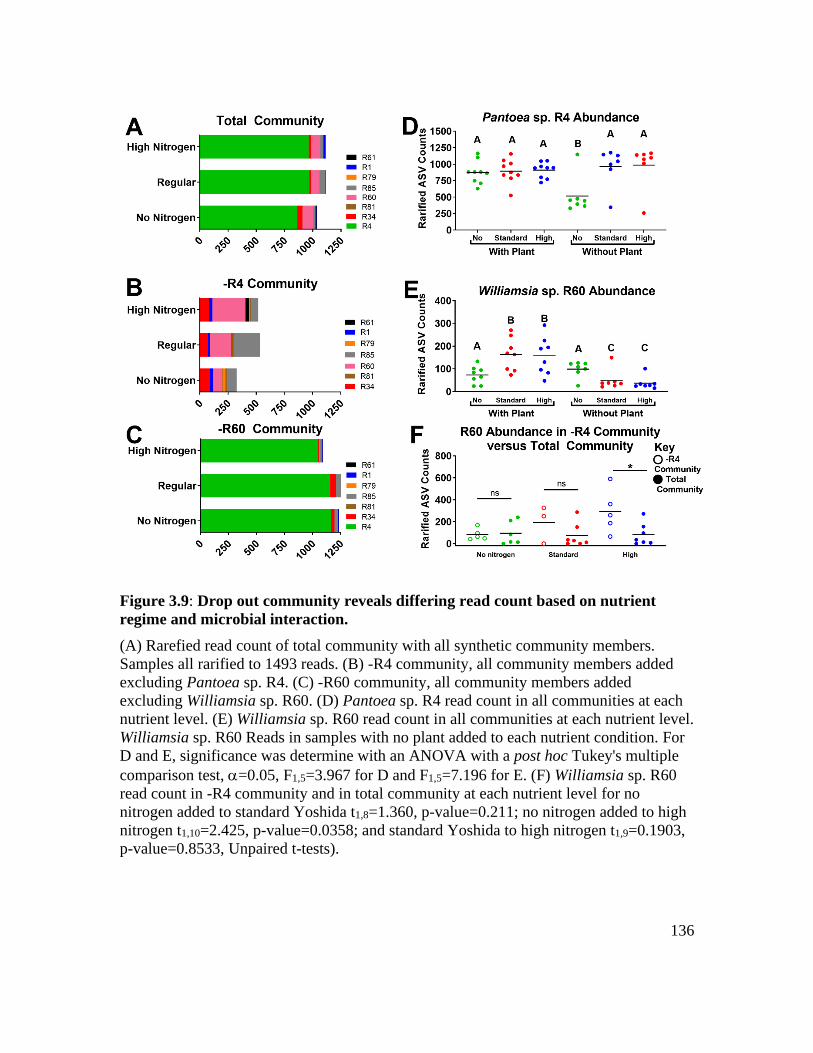
136
Figure 3.9: Drop out community reveals differing read count based on nutrient
regime and microbial interaction.
(A) Rarefied read count of total community with all synthetic community members.
Samples all rarified to 1493 reads. (B) -R4 community, all community members added
excluding Pantoea sp. R4. (C) -R60 community, all community members added
excluding Williamsia sp. R60. (D) Pantoea sp. R4 read count in all communities at each
nutrient level. (E) Williamsia sp. R60 read count in all communities at each nutrient level.
Williamsia sp. R60 Reads in samples with no plant added to each nutrient condition. For
D and E, significance was determine with an ANOVA with a post hoc Tukey's multiple
comparison test, =0.05, F1,5=3.967 for D and F1,5=7.196 for E. (F) Williamsia sp. R60
read count in -R4 community and in total community at each nutrient level for no
nitrogen added to standard Yoshida t1,8=1.360, p-value=0.211; no nitrogen added to high
nitrogen t1,10=2.425, p-value=0.0358; and standard Yoshida to high nitrogen t1,9=0.1903,
p-value=0.8533, Unpaired t-tests).
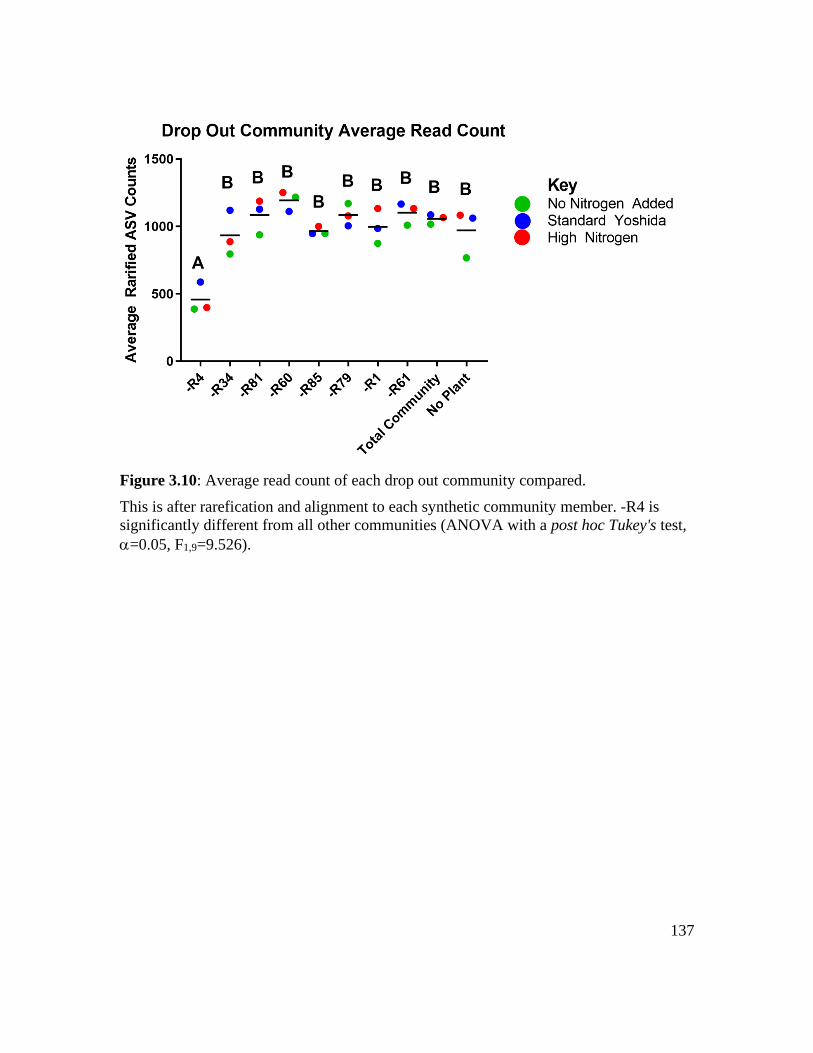
137
Figure 3.10: Average read count of each drop out community compared.
This is after rarefication and alignment to each synthetic community member. -R4 is
significantly different from all other communities (ANOVA with a post hoc Tukey's test,
=0.05, F1,9=9.526).
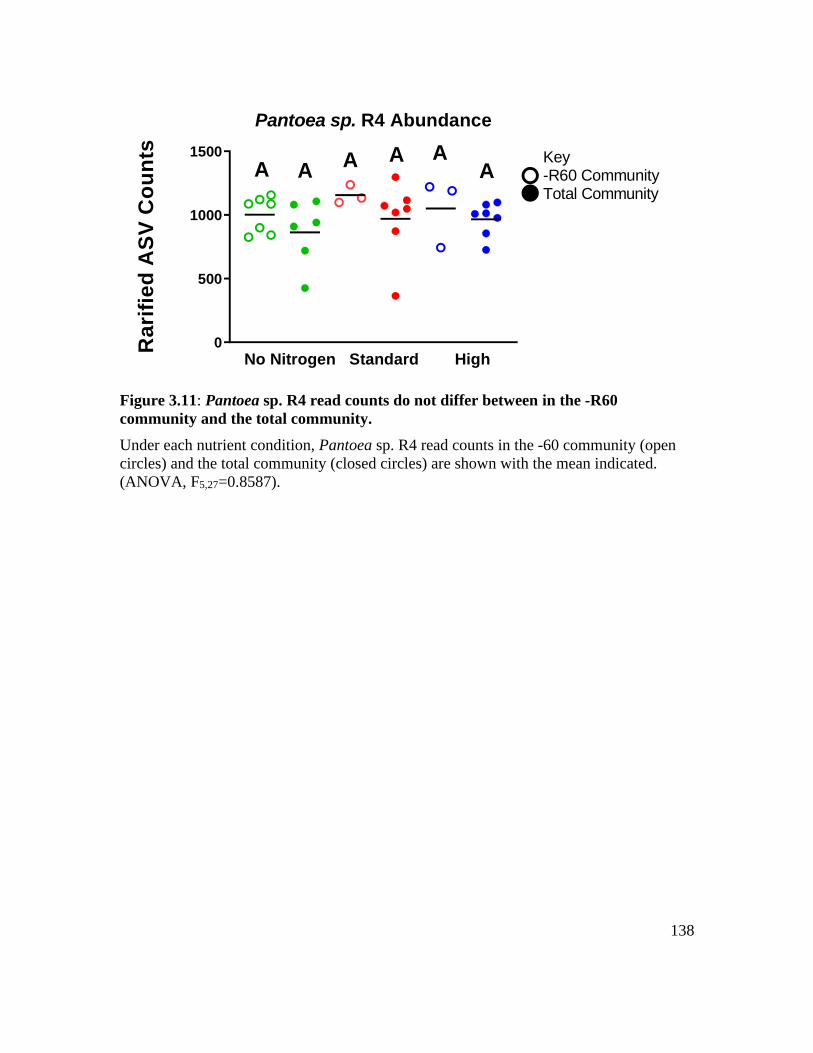
138
0
500
1000
1500
Pantoea sp. R4 Abundance
Ra
rifi
ed
AS
V C
ou
nts
No Nitrogen Standard High
Key-R60 CommunityTotal Community
A AA A A
A
Figure 3.11: Pantoea sp. R4 read counts do not differ between in the -R60
community and the total community.
Under each nutrient condition, Pantoea sp. R4 read counts in the -60 community (open
circles) and the total community (closed circles) are shown with the mean indicated.
(ANOVA, F5,27=0.8587).
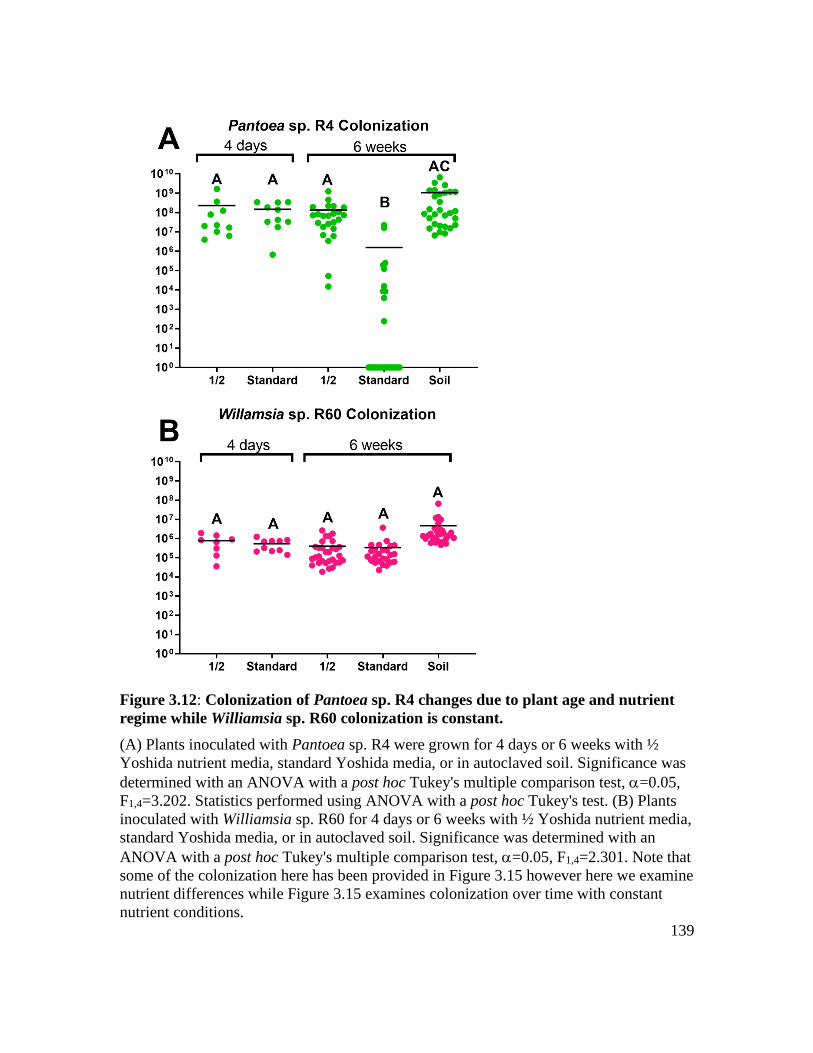
139
Figure 3.12: Colonization of Pantoea sp. R4 changes due to plant age and nutrient
regime while Williamsia sp. R60 colonization is constant.
(A) Plants inoculated with Pantoea sp. R4 were grown for 4 days or 6 weeks with ½
Yoshida nutrient media, standard Yoshida media, or in autoclaved soil. Significance was
determined with an ANOVA with a post hoc Tukey's multiple comparison test, =0.05,
F1,4=3.202. Statistics performed using ANOVA with a post hoc Tukey's test. (B) Plants
inoculated with Williamsia sp. R60 for 4 days or 6 weeks with ½ Yoshida nutrient media,
standard Yoshida media, or in autoclaved soil. Significance was determined with an
ANOVA with a post hoc Tukey's multiple comparison test, =0.05, F1,4=2.301. Note that
some of the colonization here has been provided in Figure 3.15 however here we examine
nutrient differences while Figure 3.15 examines colonization over time with constant
nutrient conditions.
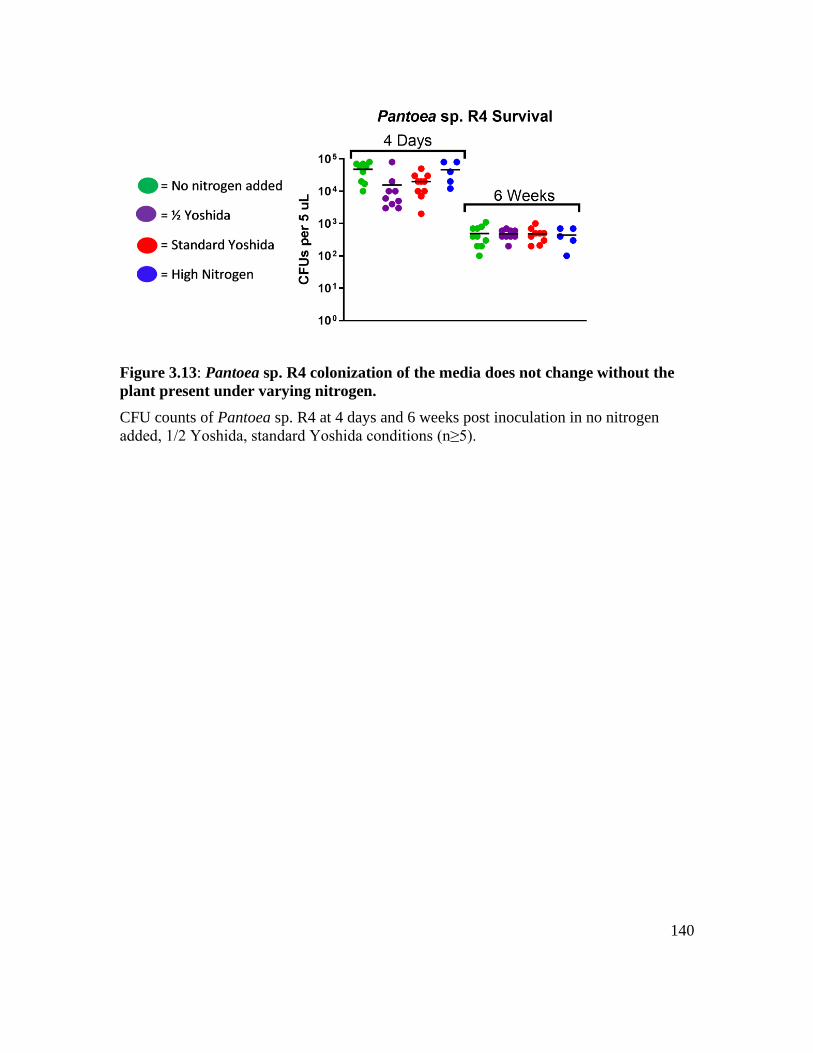
140
Figure 3.13: Pantoea sp. R4 colonization of the media does not change without the
plant present under varying nitrogen.
CFU counts of Pantoea sp. R4 at 4 days and 6 weeks post inoculation in no nitrogen
added, 1/2 Yoshida, standard Yoshida conditions (n≥5).
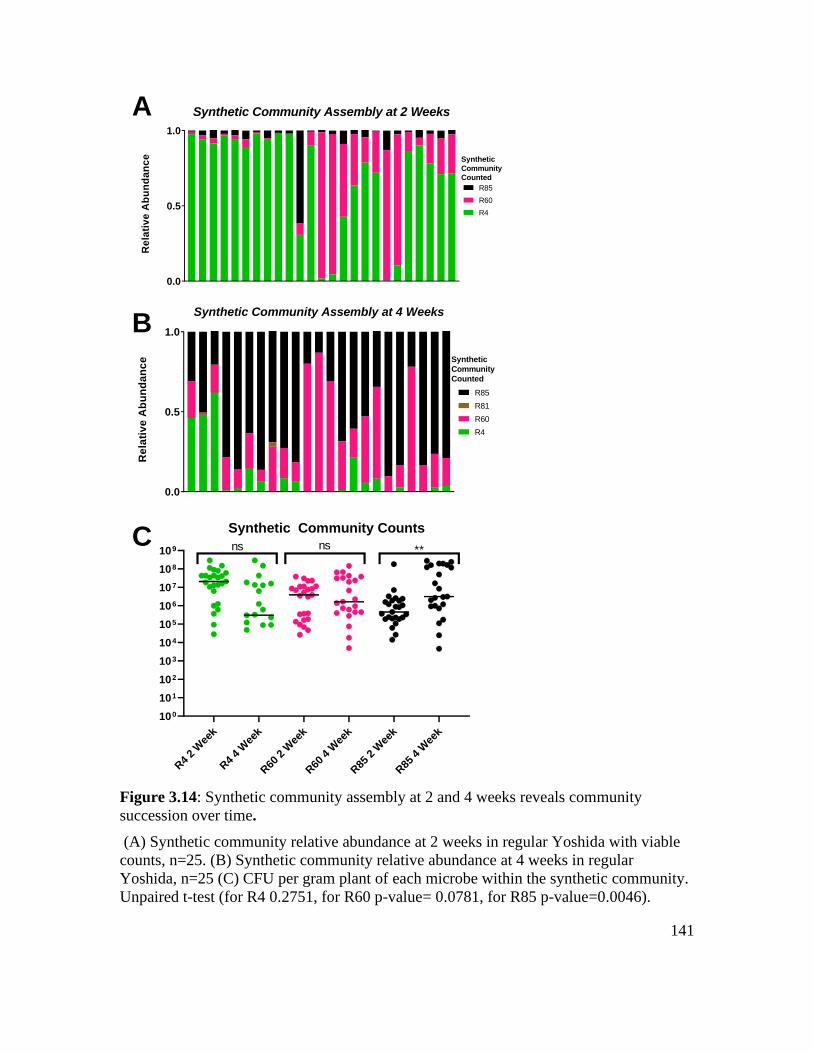
141
0.0
0.5
1.0
Synthetic Community Assembly at 2 Weeks
Re
lati
ve
Ab
un
da
nc
e
R4
R60
R85
Synthetic
Community
Counted
0.0
0.5
1.0
Synthetic Community Assembly at 4 Weeks
Re
lati
ve
Ab
un
da
nc
e
R4
R60
R81
R85
Synthetic
Community
Counted
R4
2 W
eek
R4
4 W
eek
R60
2 W
eek
R60
4 W
eek
R85
2 W
eek
R85
4 W
eek
100
101
102
103
104
105
106
107
108
109
Synthetic Community Counts
ns ns **
A
B
C
Figure 3.14: Synthetic community assembly at 2 and 4 weeks reveals community
succession over time.
(A) Synthetic community relative abundance at 2 weeks in regular Yoshida with viable
counts, n=25. (B) Synthetic community relative abundance at 4 weeks in regular
Yoshida, n=25 (C) CFU per gram plant of each microbe within the synthetic community.
Unpaired t-test (for R4 0.2751, for R60 p-value= 0.0781, for R85 p-value=0.0046).
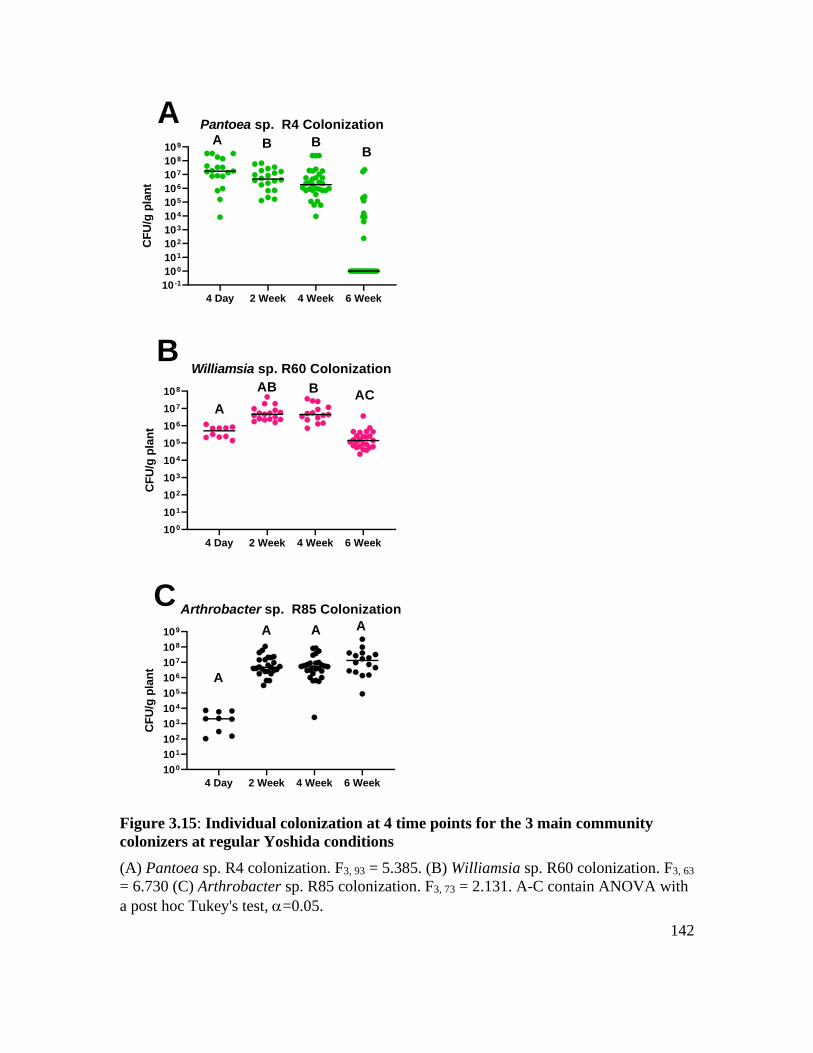
142
4 Day 2 Week 4 Week 6 Week
10 -1
100
101
102
103
104
105
106
107
108
109
Pantoea sp. R4 Colonization
CF
U/g
pla
nt
A B BB
4 Day 2 Week 4 Week 6 Week
100
101
102
103
104
105
106
107
108
Williamsia sp. R60 Colonization
CF
U/g
pla
nt
A
AB BAC
4 Day 2 Week 4 Week 6 Week
100
101
102
103
104
105
106
107
108
109
Arthrobacter sp. R85 Colonization
CF
U/g
pla
nt
A
A A A
A
B
C
Figure 3.15: Individual colonization at 4 time points for the 3 main community
colonizers at regular Yoshida conditions
(A) Pantoea sp. R4 colonization. F3, 93 = 5.385. (B) Williamsia sp. R60 colonization. F3, 63
= 6.730 (C) Arthrobacter sp. R85 colonization. F3, 73 = 2.131. A-C contain ANOVA with
a post hoc Tukey's test, =0.05.
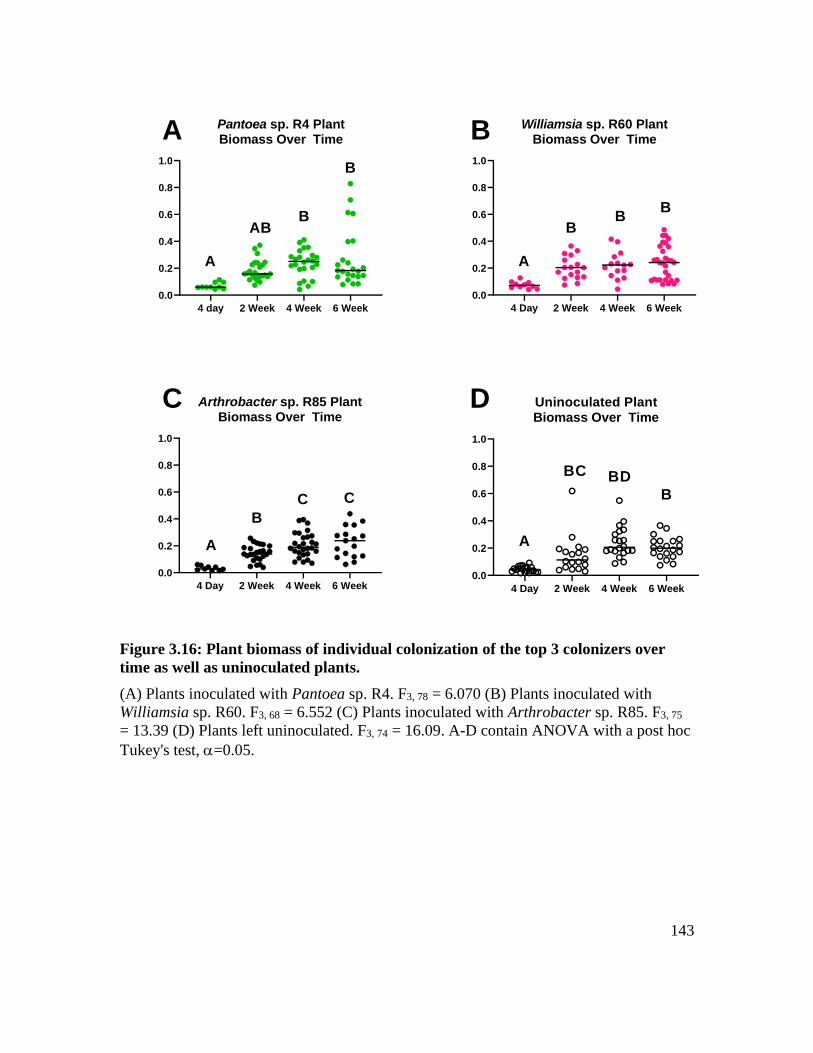
143
4 day 2 Week 4 Week 6 Week
0.0
0.2
0.4
0.6
0.8
1.0
Pantoea sp. R4 PlantBiomass Over Time
A
ABB
B
4 Day 2 Week 4 Week 6 Week
0.0
0.2
0.4
0.6
0.8
1.0
Williamsia sp. R60 PlantBiomass Over Time
A
BB
B
4 Day 2 Week 4 Week 6 Week
0.0
0.2
0.4
0.6
0.8
1.0
Arthrobacter sp. R85 PlantBiomass Over Time
A
B
C C
4 Day 2 Week 4 Week 6 Week
0.0
0.2
0.4
0.6
0.8
1.0
Uninoculated PlantBiomass Over Time
A
BC
B
BD
A
C D
B
Figure 3.16: Plant biomass of individual colonization of the top 3 colonizers over
time as well as uninoculated plants.
(A) Plants inoculated with Pantoea sp. R4. F3, 78 = 6.070 (B) Plants inoculated with
Williamsia sp. R60. F3, 68 = 6.552 (C) Plants inoculated with Arthrobacter sp. R85. F3, 75
= 13.39 (D) Plants left uninoculated. F3, 74 = 16.09. A-D contain ANOVA with a post hoc
Tukey's test, =0.05.
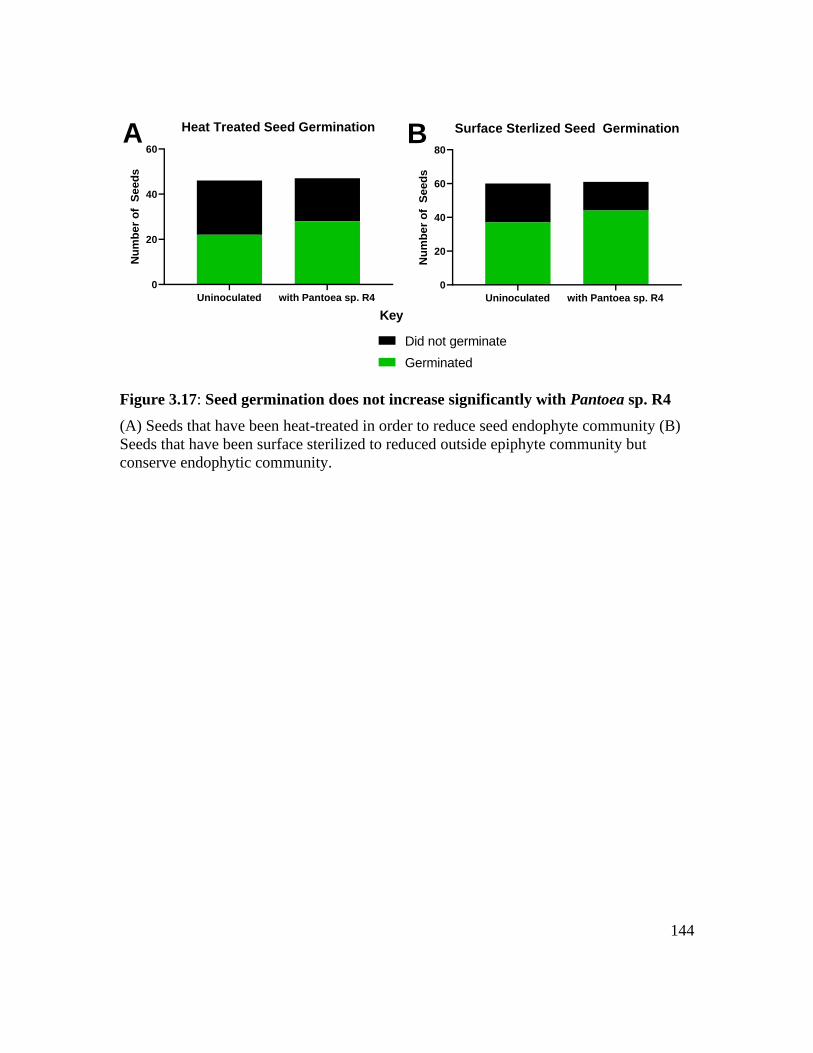
144
Uninoculated with Pantoea sp. R4
0
20
40
60
80
Surface Sterlized Seed Germination
Nu
mb
er
of
Se
ed
s
B
Uninoculated with Pantoea sp. R4
0
20
40
60
Heat Treated Seed GerminationN
um
be
r o
f S
eed
sA
Germinated
Did not germinate
Key
Figure 3.17: Seed germination does not increase significantly with Pantoea sp. R4
(A) Seeds that have been heat-treated in order to reduce seed endophyte community (B)
Seeds that have been surface sterilized to reduced outside epiphyte community but
conserve endophytic community.
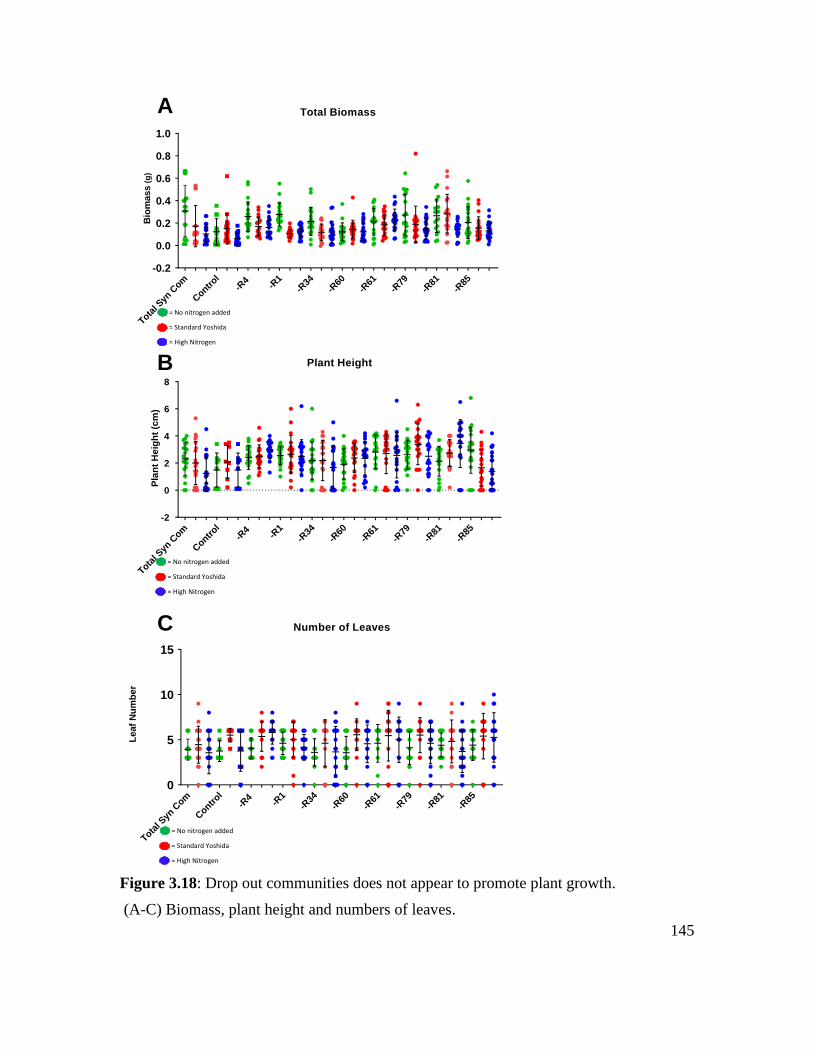
145
Total S
yn C
om
Contr
ol-R
4 -R
1-R
34-R
60-R
61-R
79-R
81-R
85-0.2
0.0
0.2
0.4
0.6
0.8
1.0
Total Biomass
Bio
mass
(g)
= No nitrogen added
= Standard Yoshida
= High Nitrogen
Total S
yn C
om
Contr
ol-R
4 -R
1-R
34-R
60-R
61-R
79-R
81-R
85
-2
0
2
4
6
8
Plant Height
Pla
nt
He
igh
t (c
m)
= No nitrogen added
= Standard Yoshida
= High Nitrogen
Total S
yn C
om
Contr
ol-R
4 -R
1-R
34-R
60-R
61-R
79-R
81-R
850
5
10
15
Number of Leaves
Leaf
Nu
mb
er
= No nitrogen added
= Standard Yoshida
= High Nitrogen
A
B
C
Figure 3.18: Drop out communities does not appear to promote plant growth.
(A-C) Biomass, plant height and numbers of leaves.
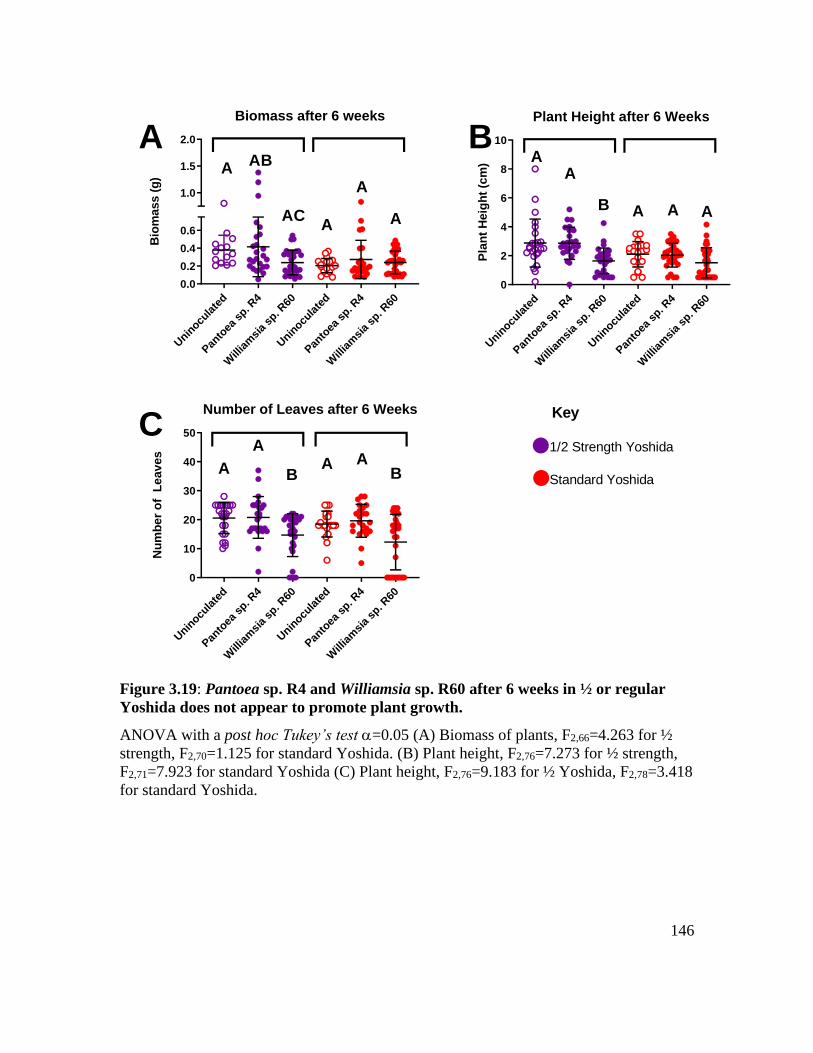
146
A B
Unin
ocula
ted
Pan
toea
sp. R
4
Will
iam
sia
sp. R
60
Unin
ocula
ted
Pan
toea
sp. R
4
Will
iam
sia
sp. R
60
0
2
4
6
8
10
Plant Height after 6 Weeks
Pla
nt
Heig
ht
(cm
)
AA
B A A A
Unin
ocula
ted
Pan
toea
sp. R
4
Will
iam
sia
sp. R
60
Unin
ocula
ted
Pan
toea
sp. R
4
Will
iam
sia
sp. R
60
0.0
0.2
0.4
0.6
1.0
1.5
2.0
Biomass after 6 weeks
Bio
mass (
g)
AAB
ACA
A
A
C Key
1/2 Strength Yoshida
Standard Yoshida
Unin
ocula
ted
Pan
toea
sp. R
4
Will
iam
sia
sp. R
60
Unin
ocula
ted
Pan
toea
sp. R
4
Will
iam
sia
sp. R
60
0
10
20
30
40
50
Number of Leaves after 6 Weeks
Nu
mb
er
of
Le
av
es
A
A
BA A
B
Figure 3.19: Pantoea sp. R4 and Williamsia sp. R60 after 6 weeks in ½ or regular
Yoshida does not appear to promote plant growth.
ANOVA with a post hoc Tukey’s test =0.05 (A) Biomass of plants, F2,66=4.263 for ½
strength, F2,70=1.125 for standard Yoshida. (B) Plant height, F2,76=7.273 for ½ strength,
F2,71=7.923 for standard Yoshida (C) Plant height, F2,76=9.183 for ½ Yoshida, F2,78=3.418
for standard Yoshida.
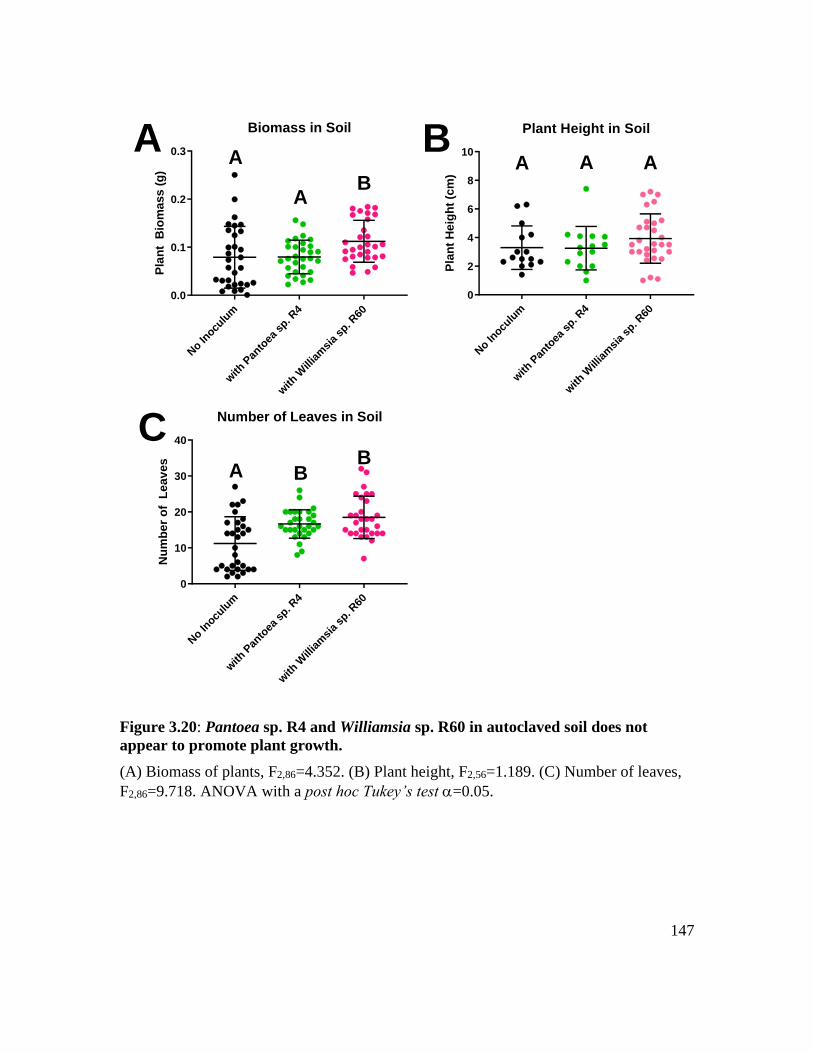
147
No In
oculu
m
with
Pan
toea
sp. R
4
with
Will
iam
sia
sp. R
60
0.0
0.1
0.2
0.3
Biomass in Soil
Pla
nt
Bio
mass
(g
)A
AB
No In
oculu
m
with
Pan
toea
sp. R
4
with
Will
iam
sia
sp. R
60
0
10
20
30
40
Number of Leaves in Soil
Nu
mb
er
of
Le
av
es
A BB
No In
oculu
m
with
Pan
toea
sp. R
4
with
Will
iam
sia
sp. R
60
0
2
4
6
8
10
Plant Height in Soil
Pla
nt
Heig
ht
(cm
)
A A AA B
C
Figure 3.20: Pantoea sp. R4 and Williamsia sp. R60 in autoclaved soil does not
appear to promote plant growth.
(A) Biomass of plants, F2,86=4.352. (B) Plant height, F2,56=1.189. (C) Number of leaves,
F2,86=9.718. ANOVA with a post hoc Tukey’s test =0.05.
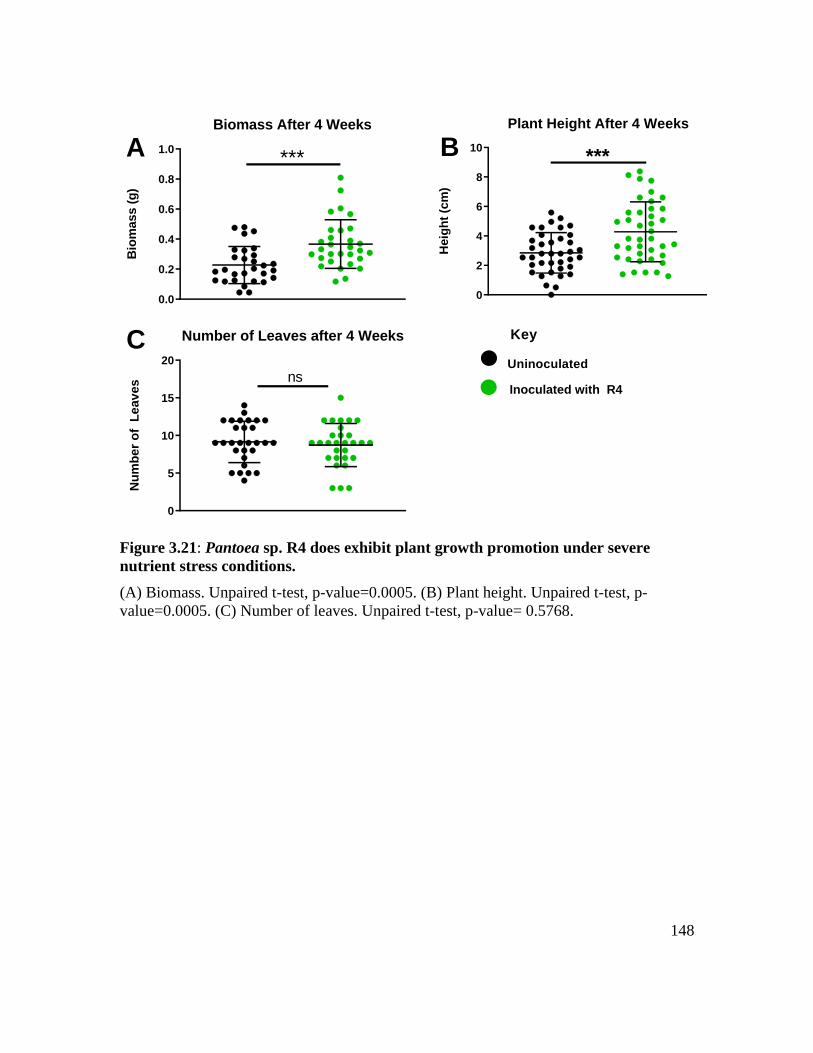
148
0.0
0.2
0.4
0.6
0.8
1.0
Biomass After 4 WeeksB
iom
ass (
g)
***
0
2
4
6
8
10
Plant Height After 4 Weeks
Heig
ht
(cm
)
***
Key
Uninoculated
Inoculated with R4
A B
0
5
10
15
20
Number of Leaves after 4 Weeks
Nu
mb
er
of
Le
av
es ns
C
Figure 3.21: Pantoea sp. R4 does exhibit plant growth promotion under severe
nutrient stress conditions.
(A) Biomass. Unpaired t-test, p-value=0.0005. (B) Plant height. Unpaired t-test, p-
value=0.0005. (C) Number of leaves. Unpaired t-test, p-value= 0.5768.
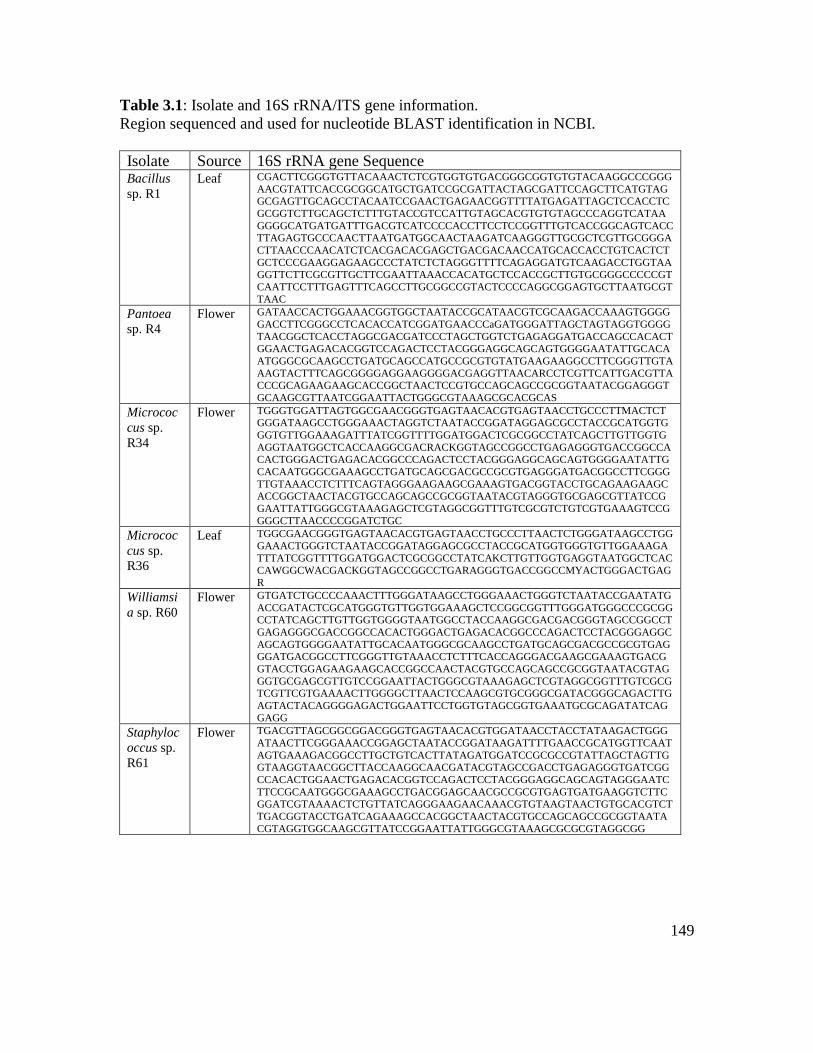
149
Table 3.1: Isolate and 16S rRNA/ITS gene information.
Region sequenced and used for nucleotide BLAST identification in NCBI.
Isolate Source 16S rRNA gene Sequence Bacillus
sp. R1
Leaf CGACTTCGGGTGTTACAAACTCTCGTGGTGTGACGGGCGGTGTGTACAAGGCCCGGG
AACGTATTCACCGCGGCATGCTGATCCGCGATTACTAGCGATTCCAGCTTCATGTAGGCGAGTTGCAGCCTACAATCCGAACTGAGAACGGTTTTATGAGATTAGCTCCACCTC
GCGGTCTTGCAGCTCTTTGTACCGTCCATTGTAGCACGTGTGTAGCCCAGGTCATAA
GGGGCATGATGATTTGACGTCATCCCCACCTTCCTCCGGTTTGTCACCGGCAGTCACCTTAGAGTGCCCAACTTAATGATGGCAACTAAGATCAAGGGTTGCGCTCGTTGCGGGA
CTTAACCCAACATCTCACGACACGAGCTGACGACAACCATGCACCACCTGTCACTCT
GCTCCCGAAGGAGAAGCCCTATCTCTAGGGTTTTCAGAGGATGTCAAGACCTGGTAAGGTTCTTCGCGTTGCTTCGAATTAAACCACATGCTCCACCGCTTGTGCGGGCCCCCGT
CAATTCCTTTGAGTTTCAGCCTTGCGGCCGTACTCCCCAGGCGGAGTGCTTAATGCGT
TAAC
Pantoea
sp. R4
Flower GATAACCACTGGAAACGGTGGCTAATACCGCATAACGTCGCAAGACCAAAGTGGGG
GACCTTCGGGCCTCACACCATCGGATGAACCCaGATGGGATTAGCTAGTAGGTGGGG
TAACGGCTCACCTAGGCGACGATCCCTAGCTGGTCTGAGAGGATGACCAGCCACACT
GGAACTGAGACACGGTCCAGACTCCTACGGGAGGCAGCAGTGGGGAATATTGCACA
ATGGGCGCAAGCCTGATGCAGCCATGCCGCGTGTATGAAGAAGGCCTTCGGGTTGTA
AAGTACTTTCAGCGGGGAGGAAGGGGACGAGGTTAACARCCTCGTTCATTGACGTTACCCGCAGAAGAAGCACCGGCTAACTCCGTGCCAGCAGCCGCGGTAATACGGAGGGT
GCAAGCGTTAATCGGAATTACTGGGCGTAAAGCGCACGCAS
Micrococ
cus sp.
R34
Flower TGGGTGGATTAGTGGCGAACGGGTGAGTAACACGTGAGTAACCTGCCCTTMACTCTGGGATAAGCCTGGGAAACTAGGTCTAATACCGGATAGGAGCGCCTACCGCATGGTG
GGTGTTGGAAAGATTTATCGGTTTTGGATGGACTCGCGGCCTATCAGCTTGTTGGTG
AGGTAATGGCTCACCAAGGCGACRACKGGTAGCCGGCCTGAGAGGGTGACCGGCCACACTGGGACTGAGACACGGCCCAGACTCCTACGGGAGGCAGCAGTGGGGAATATTG
CACAATGGGCGAAAGCCTGATGCAGCGACGCCGCGTGAGGGATGACGGCCTTCGGG
TTGTAAACCTCTTTCAGTAGGGAAGAAGCGAAAGTGACGGTACCTGCAGAAGAAGCACCGGCTAACTACGTGCCAGCAGCCGCGGTAATACGTAGGGTGCGAGCGTTATCCG
GAATTATTGGGCGTAAAGAGCTCGTAGGCGGTTTGTCGCGTCTGTCGTGAAAGTCCG
GGGCTTAACCCCGGATCTGC
Micrococ
cus sp.
R36
Leaf TGGCGAACGGGTGAGTAACACGTGAGTAACCTGCCCTTAACTCTGGGATAAGCCTGGGAAACTGGGTCTAATACCGGATAGGAGCGCCTACCGCATGGTGGGTGTTGGAAAGA
TTTATCGGTTTTGGATGGACTCGCGGCCTATCAKCTTGTTGGTGAGGTAATGGCTCAC
CAWGGCWACGACKGGTAGCCGGCCTGARAGGGTGACCGGCCMYACTGGGACTGAG
R
Williamsi
a sp. R60
Flower GTGATCTGCCCCAAACTTTGGGATAAGCCTGGGAAACTGGGTCTAATACCGAATATG
ACCGATACTCGCATGGGTGTTGGTGGAAAGCTCCGGCGGTTTGGGATGGGCCCGCGGCCTATCAGCTTGTTGGTGGGGTAATGGCCTACCAAGGCGACGACGGGTAGCCGGCCT
GAGAGGGCGACCGGCCACACTGGGACTGAGACACGGCCCAGACTCCTACGGGAGGC
AGCAGTGGGGAATATTGCACAATGGGCGCAAGCCTGATGCAGCGACGCCGCGTGAGGGATGACGGCCTTCGGGTTGTAAACCTCTTTCACCAGGGACGAAGCGAAAGTGACG
GTACCTGGAGAAGAAGCACCGGCCAACTACGTGCCAGCAGCCGCGGTAATACGTAG
GGTGCGAGCGTTGTCCGGAATTACTGGGCGTAAAGAGCTCGTAGGCGGTTTGTCGCGTCGTTCGTGAAAACTTGGGGCTTAACTCCAAGCGTGCGGGCGATACGGGCAGACTTG
AGTACTACAGGGGAGACTGGAATTCCTGGTGTAGCGGTGAAATGCGCAGATATCAG
GAGG
Staphyloc
occus sp.
R61
Flower TGACGTTAGCGGCGGACGGGTGAGTAACACGTGGATAACCTACCTATAAGACTGGG
ATAACTTCGGGAAACCGGAGCTAATACCGGATAAGATTTTGAACCGCATGGTTCAAT
AGTGAAAGACGGCCTTGCTGTCACTTATAGATGGATCCGCGCCGTATTAGCTAGTTGGTAAGGTAACGGCTTACCAAGGCAACGATACGTAGCCGACCTGAGAGGGTGATCGG
CCACACTGGAACTGAGACACGGTCCAGACTCCTACGGGAGGCAGCAGTAGGGAATC
TTCCGCAATGGGCGAAAGCCTGACGGAGCAACGCCGCGTGAGTGATGAAGGTCTTC
GGATCGTAAAACTCTGTTATCAGGGAAGAACAAACGTGTAAGTAACTGTGCACGTCT
TGACGGTACCTGATCAGAAAGCCACGGCTAACTACGTGCCAGCAGCCGCGGTAATA
CGTAGGTGGCAAGCGTTATCCGGAATTATTGGGCGTAAAGCGCGCGTAGGCGG
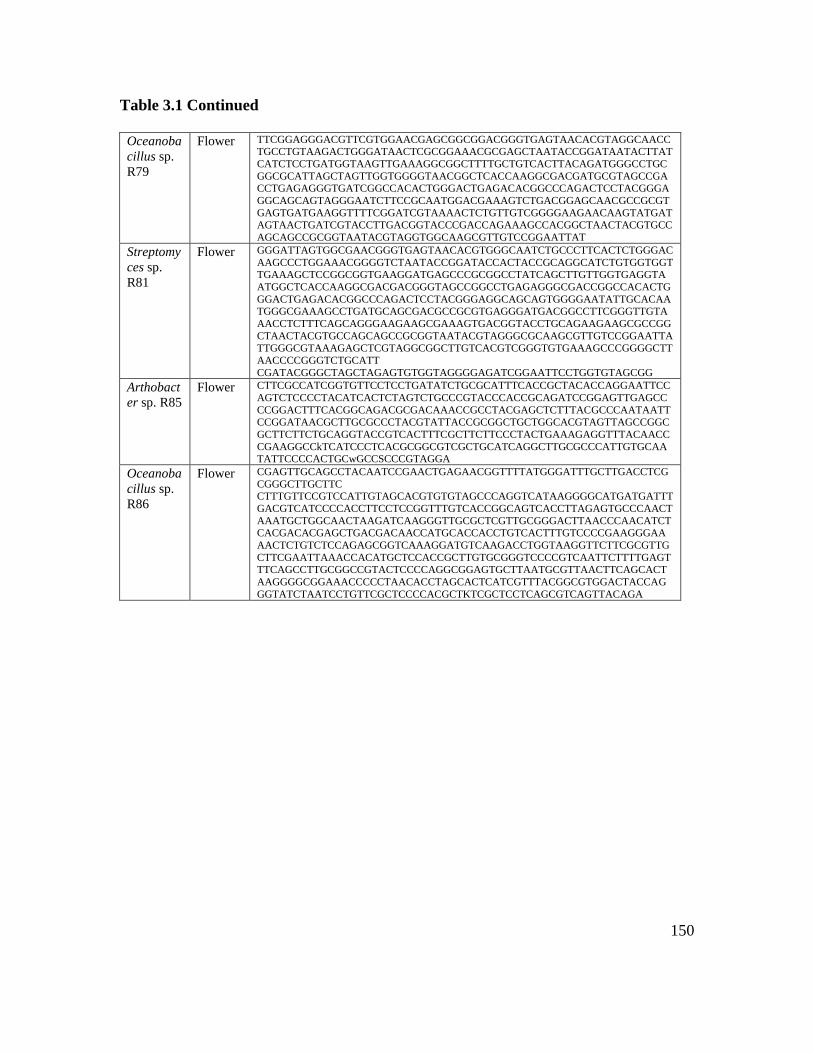
150
Table 3.1 Continued
Oceanoba
cillus sp.
R79
Flower TTCGGAGGGACGTTCGTGGAACGAGCGGCGGACGGGTGAGTAACACGTAGGCAACCTGCCTGTAAGACTGGGATAACTCGCGGAAACGCGAGCTAATACCGGATAATACTTAT
CATCTCCTGATGGTAAGTTGAAAGGCGGCTTTTGCTGTCACTTACAGATGGGCCTGC
GGCGCATTAGCTAGTTGGTGGGGTAACGGCTCACCAAGGCGACGATGCGTAGCCGACCTGAGAGGGTGATCGGCCACACTGGGACTGAGACACGGCCCAGACTCCTACGGGA
GGCAGCAGTAGGGAATCTTCCGCAATGGACGAAAGTCTGACGGAGCAACGCCGCGT
GAGTGATGAAGGTTTTCGGATCGTAAAACTCTGTTGTCGGGGAAGAACAAGTATGATAGTAACTGATCGTACCTTGACGGTACCCGACCAGAAAGCCACGGCTAACTACGTGCC
AGCAGCCGCGGTAATACGTAGGTGGCAAGCGTTGTCCGGAATTAT
Streptomy
ces sp.
R81
Flower GGGATTAGTGGCGAACGGGTGAGTAACACGTGGGCAATCTGCCCTTCACTCTGGGAC
AAGCCCTGGAAACGGGGTCTAATACCGGATACCACTACCGCAGGCATCTGTGGTGGTTGAAAGCTCCGGCGGTGAAGGATGAGCCCGCGGCCTATCAGCTTGTTGGTGAGGTA
ATGGCTCACCAAGGCGACGACGGGTAGCCGGCCTGAGAGGGCGACCGGCCACACTG
GGACTGAGACACGGCCCAGACTCCTACGGGAGGCAGCAGTGGGGAATATTGCACAATGGGCGAAAGCCTGATGCAGCGACGCCGCGTGAGGGATGACGGCCTTCGGGTTGTA
AACCTCTTTCAGCAGGGAAGAAGCGAAAGTGACGGTACCTGCAGAAGAAGCGCCGG
CTAACTACGTGCCAGCAGCCGCGGTAATACGTAGGGCGCAAGCGTTGTCCGGAATTA
TTGGGCGTAAAGAGCTCGTAGGCGGCTTGTCACGTCGGGTGTGAAAGCCCGGGGCTT
AACCCCGGGTCTGCATT
CGATACGGGCTAGCTAGAGTGTGGTAGGGGAGATCGGAATTCCTGGTGTAGCGG
Arthobact
er sp. R85
Flower CTTCGCCATCGGTGTTCCTCCTGATATCTGCGCATTTCACCGCTACACCAGGAATTCC
AGTCTCCCCTACATCACTCTAGTCTGCCCGTACCCACCGCAGATCCGGAGTTGAGCC
CCGGACTTTCACGGCAGACGCGACAAACCGCCTACGAGCTCTTTACGCCCAATAATTCCGGATAACGCTTGCGCCCTACGTATTACCGCGGCTGCTGGCACGTAGTTAGCCGGC
GCTTCTTCTGCAGGTACCGTCACTTTCGCTTCTTCCCTACTGAAAGAGGTTTACAACC
CGAAGGCCkTCATCCCTCACGCGGCGTCGCTGCATCAGGCTTGCGCCCATTGTGCAATATTCCCCACTGCwGCCSCCCGTAGGA
Oceanoba
cillus sp.
R86
Flower CGAGTTGCAGCCTACAATCCGAACTGAGAACGGTTTTATGGGATTTGCTTGACCTCG
CGGGCTTGCTTC CTTTGTTCCGTCCATTGTAGCACGTGTGTAGCCCAGGTCATAAGGGGCATGATGATTT
GACGTCATCCCCACCTTCCTCCGGTTTGTCACCGGCAGTCACCTTAGAGTGCCCAACT
AAATGCTGGCAACTAAGATCAAGGGTTGCGCTCGTTGCGGGACTTAACCCAACATCTCACGACACGAGCTGACGACAACCATGCACCACCTGTCACTTTGTCCCCGAAGGGAA
AACTCTGTCTCCAGAGCGGTCAAAGGATGTCAAGACCTGGTAAGGTTCTTCGCGTTG
CTTCGAATTAAACCACATGCTCCACCGCTTGTGCGGGTCCCCGTCAATTCTTTTGAGTTTCAGCCTTGCGGCCGTACTCCCCAGGCGGAGTGCTTAATGCGTTAACTTCAGCACT
AAGGGGCGGAAACCCCCTAACACCTAGCACTCATCGTTTACGGCGTGGACTACCAG
GGTATCTAATCCTGTTCGCTCCCCACGCTKTCGCTCCTCAGCGTCAGTTACAGA
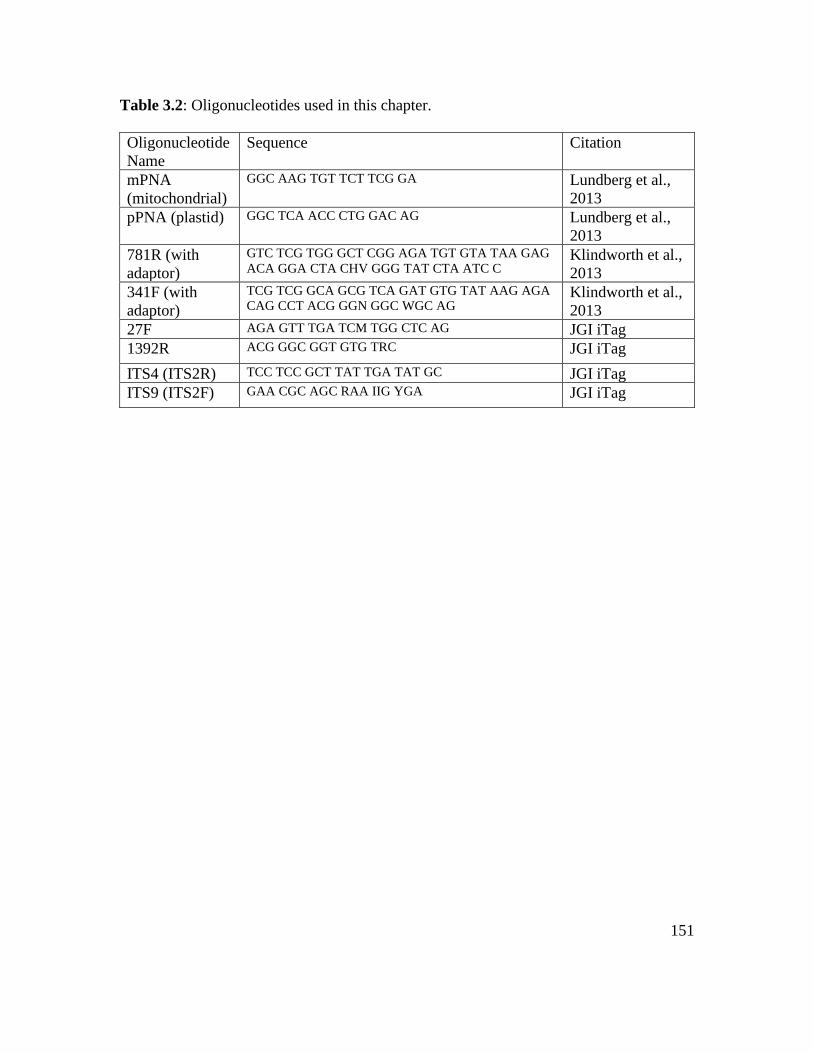
151
Table 3.2: Oligonucleotides used in this chapter.
Oligonucleotide
Name
Sequence Citation
mPNA
(mitochondrial)
GGC AAG TGT TCT TCG GA Lundberg et al.,
2013
pPNA (plastid) GGC TCA ACC CTG GAC AG Lundberg et al.,
2013
781R (with
adaptor)
GTC TCG TGG GCT CGG AGA TGT GTA TAA GAG
ACA GGA CTA CHV GGG TAT CTA ATC C Klindworth et al.,
2013
341F (with
adaptor)
TCG TCG GCA GCG TCA GAT GTG TAT AAG AGA
CAG CCT ACG GGN GGC WGC AG Klindworth et al.,
2013
27F AGA GTT TGA TCM TGG CTC AG JGI iTag
1392R ACG GGC GGT GTG TRC JGI iTag
ITS4 (ITS2R) TCC TCC GCT TAT TGA TAT GC JGI iTag
ITS9 (ITS2F) GAA CGC AGC RAA IIG YGA JGI iTag
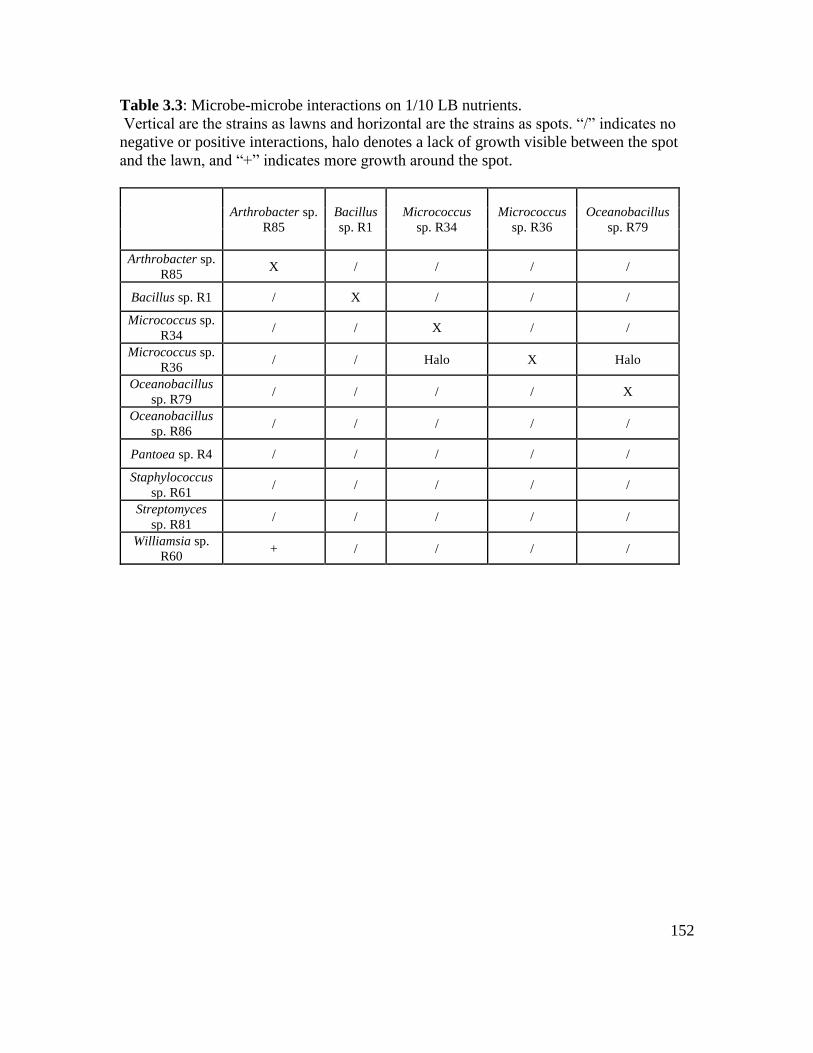
152
Table 3.3: Microbe-microbe interactions on 1/10 LB nutrients.
Vertical are the strains as lawns and horizontal are the strains as spots. “/” indicates no
negative or positive interactions, halo denotes a lack of growth visible between the spot
and the lawn, and “+” indicates more growth around the spot.
Arthrobacter sp.
R85
Bacillus
sp. R1
Micrococcus
sp. R34
Micrococcus
sp. R36
Oceanobacillus
sp. R79
Arthrobacter sp.
R85 X / / / /
Bacillus sp. R1 / X / / /
Micrococcus sp.
R34 / / X / /
Micrococcus sp.
R36 / / Halo X Halo
Oceanobacillus
sp. R79 / / / / X
Oceanobacillus
sp. R86 / / / / /
Pantoea sp. R4 / / / / /
Staphylococcus
sp. R61 / / / / /
Streptomyces
sp. R81 / / / / /
Williamsia sp.
R60 + / / / /
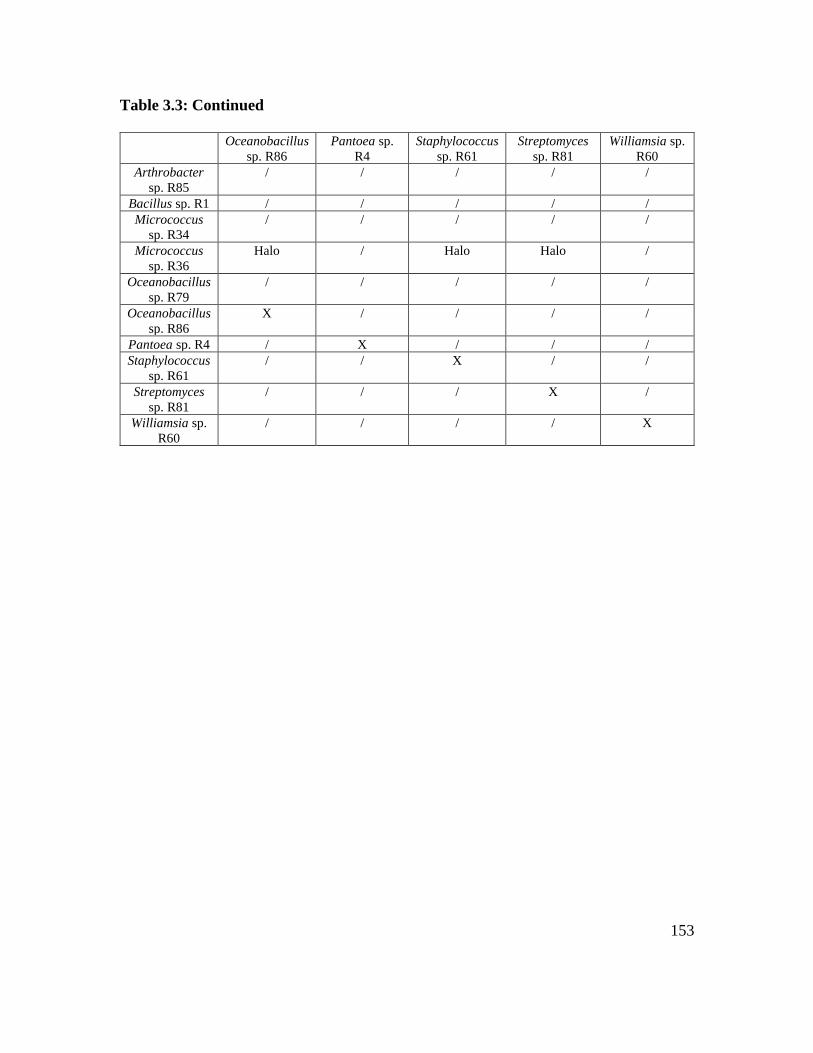
153
Table 3.3: Continued
Oceanobacillus
sp. R86
Pantoea sp.
R4
Staphylococcus
sp. R61
Streptomyces
sp. R81
Williamsia sp.
R60
Arthrobacter
sp. R85
/ / / / /
Bacillus sp. R1 / / / / /
Micrococcus
sp. R34
/ / / / /
Micrococcus
sp. R36
Halo / Halo Halo /
Oceanobacillus
sp. R79
/ / / / /
Oceanobacillus
sp. R86
X / / / /
Pantoea sp. R4 / X / / /
Staphylococcus
sp. R61
/ / X / /
Streptomyces
sp. R81
/ / / X /
Williamsia sp.
R60
/ / / / X
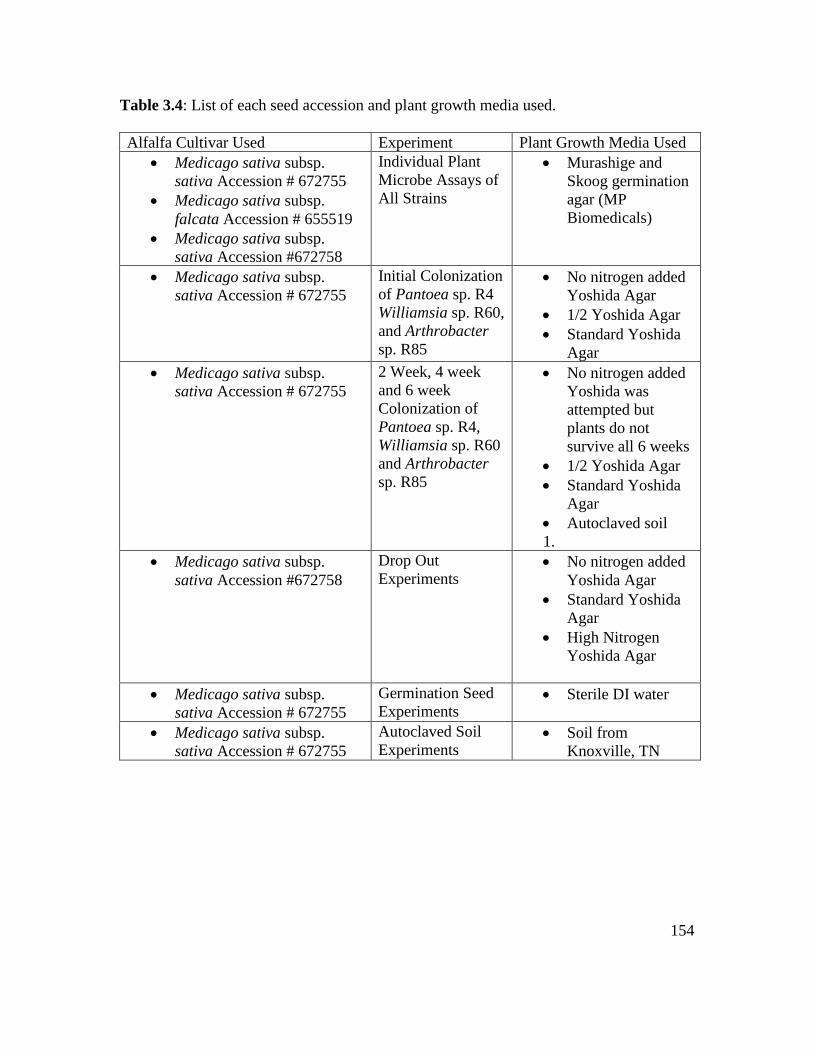
154
Table 3.4: List of each seed accession and plant growth media used.
Alfalfa Cultivar Used Experiment Plant Growth Media Used
• Medicago sativa subsp.
sativa Accession # 672755
• Medicago sativa subsp.
falcata Accession # 655519
• Medicago sativa subsp.
sativa Accession #672758
Individual Plant
Microbe Assays of
All Strains
• Murashige and
Skoog germination
agar (MP
Biomedicals)
• Medicago sativa subsp.
sativa Accession # 672755
Initial Colonization
of Pantoea sp. R4
Williamsia sp. R60,
and Arthrobacter
sp. R85
• No nitrogen added
Yoshida Agar
• 1/2 Yoshida Agar
• Standard Yoshida
Agar
• Medicago sativa subsp.
sativa Accession # 672755
2 Week, 4 week
and 6 week
Colonization of
Pantoea sp. R4,
Williamsia sp. R60
and Arthrobacter
sp. R85
• No nitrogen added
Yoshida was
attempted but
plants do not
survive all 6 weeks
• 1/2 Yoshida Agar
• Standard Yoshida
Agar
• Autoclaved soil
1.
• Medicago sativa subsp.
sativa Accession #672758
Drop Out
Experiments • No nitrogen added
Yoshida Agar
• Standard Yoshida
Agar
• High Nitrogen
Yoshida Agar
• Medicago sativa subsp.
sativa Accession # 672755
Germination Seed
Experiments • Sterile DI water
• Medicago sativa subsp.
sativa Accession # 672755
Autoclaved Soil
Experiments • Soil from
Knoxville, TN

155
CHAPTER 4: INVESTIGATING GENETIC
APPROACHES TO BEST UNDERSTAND PANTOEA
SP. R4 COLONIZATION
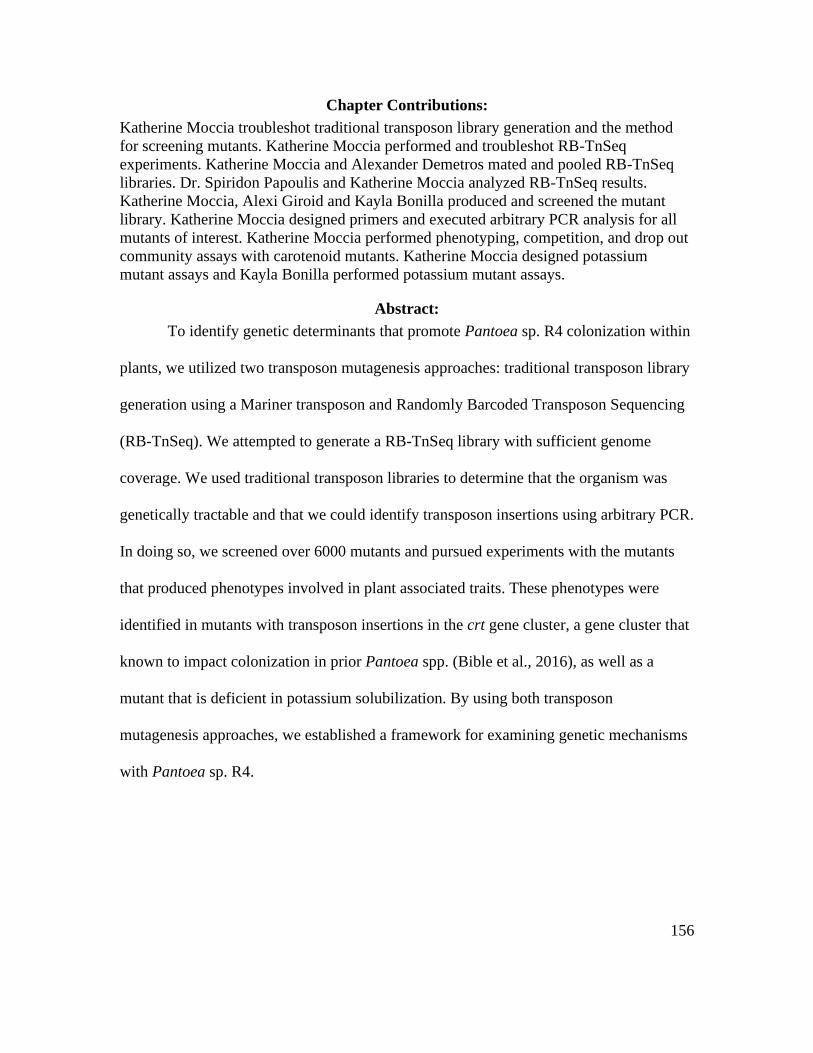
156
Chapter Contributions:
Katherine Moccia troubleshot traditional transposon library generation and the method
for screening mutants. Katherine Moccia performed and troubleshot RB-TnSeq
experiments. Katherine Moccia and Alexander Demetros mated and pooled RB-TnSeq
libraries. Dr. Spiridon Papoulis and Katherine Moccia analyzed RB-TnSeq results.
Katherine Moccia, Alexi Giroid and Kayla Bonilla produced and screened the mutant
library. Katherine Moccia designed primers and executed arbitrary PCR analysis for all
mutants of interest. Katherine Moccia performed phenotyping, competition, and drop out
community assays with carotenoid mutants. Katherine Moccia designed potassium
mutant assays and Kayla Bonilla performed potassium mutant assays.
Abstract:
To identify genetic determinants that promote Pantoea sp. R4 colonization within
plants, we utilized two transposon mutagenesis approaches: traditional transposon library
generation using a Mariner transposon and Randomly Barcoded Transposon Sequencing
(RB-TnSeq). We attempted to generate a RB-TnSeq library with sufficient genome
coverage. We used traditional transposon libraries to determine that the organism was
genetically tractable and that we could identify transposon insertions using arbitrary PCR.
In doing so, we screened over 6000 mutants and pursued experiments with the mutants
that produced phenotypes involved in plant associated traits. These phenotypes were
identified in mutants with transposon insertions in the crt gene cluster, a gene cluster that
known to impact colonization in prior Pantoea spp. (Bible et al., 2016), as well as a
mutant that is deficient in potassium solubilization. By using both transposon
mutagenesis approaches, we established a framework for examining genetic mechanisms
with Pantoea sp. R4.
157
Introduction:
Pantoea spp. host colonization
Following the result that Pantoea sp. R4 initially colonizes more than all other
synthetic community members across nutrient conditions but decreases over the course of
plant development, we decided to focus on potential genetic mechanisms that mediate
this colonization. Pantoea can be found in a variety of diverse environments including
soil, water, plants, mammals, and insects (Walterson and Stravrinides, 2015). However,
the majority of Pantoea spp. are consistently isolated inside plants, as endophytes, or
located on the outsides of plants, as epiphytes (Walterson and Stravrinides, 2015). Since
plants can be studied in large replicate sizes, plant colonization of Pantoea is a robust
way to test the colonization abilities of this genus. This would lead to a better
understanding of colonization in general.
Despite the diverse roles of Pantoea, no study has found a genetic or evolutionary
component that sorts these strains by clinical and environmental isolate origin. Although
multilocus sequencing analysis has been attempted multiple times to delineate the
differences in strains that are potentially human pathogens and those that are not, no such
genetic identification currently exists (Brady et al., 2010). Within the same family of
Pantoea, Enterobacteriaceae, Escherichia coli strains almost completely separate into
pathogenic and non-pathogenic clades from clinical and environmental isolates, which
suggests specific host adaption (Georgiades and Raoult, 2011). Given the case of P.
agglomerans, which runs the gamut from a potential human pathogen to a plant growth
promoter, it is understandable that Pantoea has not yet been grouped by host or isolate
type. In a study using over 100 Pantoea strains isolated from humans or the environment,
158
there appeared to be no pattern in which isolates could colonize fruit flies, onions, or
maize. Within the isolate collection, there were phylogenetically related isolates that had
similar growth to each other on the three hosts. However, this pattern was not consistent
across all groupings as other closely phylogenetically related strains demonstrated
variability in colonization when compared to one another on all three hosts. Further, two
Pantoea species, P. calida and P. septica were isolated from humans but colonized
significantly better in maize plants (Nadarasah and Stravrinides, 2014). A similar study
done using Pantoea strains from both plant and clinical isolates found that colonization
of soybean was the same across isolates (Völksch et al. 2009). Thus, it is widely accepted
Pantoea spp. are effective colonizers regardless of original location isolated, suggesting
that Pantoea spp. are adapted to high colonization within an array of hosts rather than
adapted to specific species or genera of organisms (Nadarasah and Stravrinides, 2014;
Völksch et al. 2009). However there is an alternative explanation for this.
One potential explanation for Pantoea spp. lack of classification by clinical or
environmental origin is that the genera is polyphyletic (Rezzonico et al., 2012). For
example, Pantoea sp. agglomerans has been classified as both Enterobacter agglomerans
and Erwinia herbicola previously. This problem has been apparent with Pantoea sp. R4
as well. Pantoea sp. R4 is classified as an Enterobacter spp. when using primers within
the 16S rRNA gene region (341F and 785R) and Pantoea when sequencing the majority
of the 16S rRNA gene (with primers 27F and 1492R). Further when sequencing the entire
genome Pantoea sp. R4 appeared to be most closely related to the novel species Erwinia
gerundensis. This genome is based on the presence of Pantoea sp. R4 within the clique
159
on the IMG/JGI database with Erwinia gerundensis using ANI scores. Taxonomic
comparisons of Erwinia gerundensis to Erwinia and Pantoea spp. revealed Erwinia
gerundensis to closely related to both Pantoea and Erwinia spp. As such, it is possible
that the distribution we are seeing is based on the current inadequate measures for
comparing organisms. While research is needed to confirm the exact genera that Pantoea
sp. R4 is a part of, we refer to it as Pantoea because identification of organisms based on
16S rRNA gene sequence is still standard practice.
Why use RB-TnSeq to define Pantoea sp. R4 colonization
To link genomic information for Pantoea spp. to colonization phenotypes,
multiple approaches can be used. Genome sequencing technology has improved at a pace
much faster than scientists have been able to test microbes experimentally. Because of
this, while the number of genomes has increased exponentially in the early 2000’s our
knowledge of gene function remains similar to what it was ten years ago. Currently, a
given gene’s function classified as unknown in an average of thirty to forty percent (Land
et al., 2015; van Opijnen and Camilli, 2013). The great disparity between what genes
have been sequenced and what is known about those genes can begin to be rectified using
recent sequencing techniques. Among the most popular are RNAseq and TnSeq. RNAseq
can identify genes that are expressed during colonization sby sequencing RNA
transcripts. Scientists can use RNAseq to compare experimental conditions and identify
genes expressed differentially. TnSeq is a method of high throughput transposon
mutagenesis, where each transposon insertion is sequenced along with a portion of the
genomic DNA surrounding it. If a gene is essential for survival in an experimental
160
condition, then an organism containing an insertion into that gene would fail to survive.
Thus, TnSeq allows scientists to identify genes that are required for survival. In a host
system, where microbial interactions are difficult to untangle from host influence, TnSeq
provides a unique solution. Unlike RNAseq, which requires the separation of host and
microbial RNA to be impactful, TnSeq is not impacted by the host. As separation of host
contaminating sequences can be challenging (Chapter 2; Moccia et al., 2020), TnSeq is
currently more desirable.
RB-TnSeq, is an improvement on TnSeq using randomly barcoded organisms to
ease in sequencing. Much of the molecular biology remains the same, as RB-TnSeq still
relies on millions of random transposon insertions inside a bacterial population to be able
to construct a wide scale fitness assay. However, the construct being used to create this
fitness assay is not the same plasmid as it is for general TnSeq. Rather in RB-TnSeq, each
plasmid has a different DNA barcode that has been cloned into it (Wetmore et al., 2015).
This eliminates the need for DNA shearing, ligation, and PCR amplification of the
transposon region as the barcode can be sequenced instead in one simple PCR step.
However, to use RB-TnSeq, each barcode must already be associated with a given
transposon insertion in a gene. Thus, traditional TnSeq must be completed one time with
10X coverage of the genome to confidently associate the barcode with its insertion.
Afterwards, RB-TnSeq can be performed instead by amplifying the barcode alone
because it can now be can be mapped to its predetermined location in the genome.
Multiple insertions can happen within an RB-TnSeq library, but they are rare because
161
most organisms cannot propagate the plasmid because it requires a pir-dependent
conditional origin of replication (Price et al., 2018).
TnSeq approaches have led to the targeted investigation of genes that produce
phenotypes of interest (de Moraes et al., 2017; Hentchel et al., 2019; Cole et al., 2017).
While TnSeq has been performed in many organisms its application to plant systems has
been limited (Fabian et al., 2020). To our knowledge there are 53 bacteria associated with
soil or plant colonization where RB-TnSeq libraries generated, with almost a quarter of
these performed in just two genera: Sinorhizobium and Pseudomonas (Fabian et al.
2020). Further, not all of these had satisfactory genomic coverage (Duong et al., 2018). In
an RB-TnSeq experiment that has been completed in plants where satisfactory coverage
of the genome was reached, 115 genes were identified to be involved in colonization of
the plant, with 38% percent of those genes having limited functional prediction (Cole et
al., 2017). The researchers investigated a variety of colonization experiments, modulating
variables such as nutrients to see how different genes impacted fitness in various
conditions. Associating detailed colonization phenotypes with specific genes allows
researchers to focus their efforts. Once identified genes of interest are, researchers can
perform experiments with individual mutants to elucidate their specific genetic function
surrounding colonization.
Establishing RB-TnSeq within Pantoea sp. R4 would determine what genes are
involved for initial colonization and persistence inside a plant. To our knowledge based
on a literature search performed in July of 2020, only one previous TnSeq experiment has
been done in a Pantoea species, Pantoea stewartii. P. stewartii differs from Pantoea sp.
162
R4 as P. stewartii is a virulent plant pathogen (Duong et al., 2018). Using RB-TnSeq, we
can identify genes involved specifically with early colonization and 6-week colonization
that are expected, such as motility and carbon related chemoreceptors for initial
colonization and de novo amino acid synthesis for 6-week colonization. As it is an
untargeted approach, we can also identify genes with unknown function.
Why screen for plant associated traits
While RB-TnSeq is a powerful approach to screen for phenotypes, traditional
transposon libraries can offer a simpler and lower risk approach. This is especially true
when phenotypes of interest can be easily observed because this enables high throughput
screening of the mutants. Within plant microbe interactions, nutrient provision by the
microbe can easily be visualize on plates. Providing nutrients for plants is one way that
microbes can promote plant growth, especially under nutrient limited conditions (Parmar
and Sindhu, 2013). The three main macronutrients for plants are, in descending order of
the amount required for survival: nitrogen, phosphate, and potassium. Nitrogen is often
the limiting factor for growth in environments, as it is a key component in essential
compounds such as amino acids. Pantoea spp. have been found to fix nitrogen in multiple
instances, although they do not induce nodule formation on alfalfa. It is hypothesized that
Pantoea spp. do not need the nodule itself to fix nitrogen as Pantoea nitrogenase genes
are able to function in aerobic conditions (Handelsman and Brill, 1985; Pinto-Thomas et
al., 2009).
Beyond nitrogen fixation, however, the ways that microbes might help plants with
the procurement of other vital nutrients is still understudied (Parmar and Sindhu, 2013).
163
For example, genetic mechanisms governing potassium and phosphate are largely are
unknown (Parmar and Sindhu, 2013). Phosphorus is frequently found in insoluble forms
in the soil and is an essential component of ATP and DNA. While phosphorus can be
provided for plants in the soil, it is usually in an insoluble form. Some plants, such as
alfalfa, produce organic acids under stressful conditions to lower the pH of the
surrounding soil and solubilize phosphate themselves while others rely on microbial
solubilization mechanisms (Lopez-Bucio et al., 2000; Li et al., 2017). One variant of
insoluble calcium phosphate occurs in nature and is used in fertilizers frequently (Lopez-
Bucio et al., 2000). Pantoea sp. R4 can solubilize calcium phosphate, the most common
phosphate tested for solubilization (Chapter 2). Potassium feldspar is a common insoluble
material in soil, with feldspars making up 41% of the earth’s crust (Anderson and
Anderson, 2010). It is estimated that 90-98% of total potassium is unavailable to the plant
in forms like potassium feldspar or mica (Etesami et al., 2017). Pantoea sp. R4 can also
solubilize potassium feldspar. Taken together, Pantoea sp. R4 potentially able to provide
a plant with its three most important macronutrients. To further investigate these nutrient
based phenotypes, we chose to look for mutants deficient in potassium and phosphate
solubilization, as well as the ability to grow on nitrogen free media.
Not only can microbes provide nutrients for plants, it is known that plants are able
to recruit beneficial microbes under conditions of nitrogen limitation as well as when
plants encounter pathogens (Dakora and Philips, 2002; Schlatter et al., 2017; Yuan et al.,
2018). The major hypothesized method for recruitment is through root exudate
(O’Banion et al., 2019). Root exudate from plants is known to contain carbon in the form
164
of sugars as well as organic acids and amino acids (Chaparro et al., 2013; Zhalnina et al.,
2018). Within plants, there exists a “Cry for Help” hypothesis which posits that when
plants are infected with a pathogen, the plant enriches for microbes that can help fight
infection (Yuan et al., 2018; Schlatter et al., 2017). When a pathogen grows in soil for
multiple generations, soil can become suppressive, meaning that it is able to limit or
completely stop the pathogen from infecting the plant (Yuan et al., 2018; Schlatter et al.,
2017). In an examination of pathogen treated root exudate versus root exudate of control
soils over six successive generations of plants, there was a significant difference in the
root exudates between the two groups, as well as a change in the microbial community
structure. Long chain organic acids and amino acids were found in higher abundance in
root exudates of pathogen treated soil, and when these were added back to the control soil
with a microbial filtrate from the soil, they produced similar pathogen suppressive results
(Yuan et al., 2018). From this, the researchers concluded that the plants were likely using
this differential root exudate profiles to recruit certain community members. If plants
recruit microbes under the threat of a pathogen or nitrogen limitation, it is possible that
this type of recruitment could be occurring under other types of nutrient stress. If this is
the case, we hypothesize that a microbe such as Pantoea sp. R4 could be recruited, as it
demonstrates multiple nutrient acquisition phenotypes that would be beneficial for the
plant.
Examining the carotenoid gene cluster in Pantoea spp.
Microbial nutrient acquisition are not the only phenotypes that are easy to screen
for using traditional transposon libraries. Changes in pigmentation are also easily visible
165
when plating mutants. Pantoea spp. typically produce yellow-pigmented colonies, with a
carotenoid gene cluster located within their chromosome or on a plasmid (Rezzonico et
al., 2016). The carotenoids generally produced by Pantoea, and the phylogenetically
related Erwinia spp., are zeaxanthin, zeaxanthin monoglucoside, and zeaxanthin
diglucoside (Sedkova et al., 2005; Figure 4.1). There are multiple gene clusters for
carotenoid pigments in Pantoea with one paper finding that among eight yellow
pigmented Pantoea isolates from various environmental sources there were three
different variations in carotenoid gene clusters existed (Sedkova et al., 2005). Previous
studies examining the importance of the carotenoid gene cluster within Pantoea spp.
during plant colonization focused of the crtB gene, as disruption of this gene is known to
produce an unpigmented mutant (Mohammadi et al., 2012; Bible et al., 2016). In Pantoea
sp. stewardii the deletion of the crtB gene appeared to decrease virulence significantly
(Mohammadi et al., 2012). The virulence score for infected plants decreased from a 4.2
out of 5 with the complement crtB/crtB+ to a 2.5 for the ΔcrtB mutant (Mohammadi et
al., 2012). In a non-pathogenic strain, Pantoea sp. YR343, a ΔcrtB mutant was deficient
in root colonization, as well as biofilm and auxin production (Bible et al., 2016). Because
of these results, investigating carotenoid production in Pantoea sp. R4 could find
differential colonization phenotypes.
Materials and Methods:
RB-TnSeq strategy
We chose to pool the RB-TnSeq mutants in sets of three to get maximize getting
the 100,000 to 300,000 mutants needed as per the guidelines of previous libraries
generated (Wetmore et al., 2015). As there are 4,292 genes within the genome, a 100,000
166
to 300,000 mutant library would provide between 23 and 69X coverage, providing above
10X coverage after an estimated loss of 50% sequenced mutants that are removed from
analysis because of insertions at the edges of coding sequences, insertions in intergenic
regions or with overuse of barcodes (Wetmore et al., 2015). 10X insertions are required
for reliable RB-TnSeq results so our mutant estimates allow for an acceptable library size
(Wetmore et al., 2015; van Opijnen et al., 2017). As RB-TnSeq is a novel sequencing
method we chose to perform three distinct mating strategies to increase the likelihood of
an effective method. While these mating strategies are not novel prior to RB-TnSeq, and
thus should all work effectively, it is possible small changes protocols could result in the
reduction of specific barcoded mutants. To account for that, each of the 3 mating
strategies contained one distinct variable that was modulated over time, so that if any
modifications results in large changes in barcoded mutants we would not have to remake
the RB-TnSeq library again. These strategies are A) frozen, where E. coli and Pantoea
are both grown up overnight, conjugated for six hours and then frozen at -80˚C until
plated B) Mid-log, where we used mid-log E. coli and overnight cultures of Pantoea, and
conjugated for six hours and then frozen at -80˚C until plated and C) unfrozen, where
overnight cultures of E. coli and Pantoea were grown then conjugated for six hours and
plated immediately without freezing. The following methods were based off the RB-
TnSeq library generation in Morin et al., 2018 and Wetmore et al., 2015. The E. coli
strain used, APA 752, was a gift from the Deutschbauer lab at University of California
Berkley.
167
RB-TnSeq mating for frozen, overnight cultures
Three 125 mL Erlenmeyer flasks with 25 mL of LB were inoculated with a single
colony of Pantoea sp. R4 for all three flasks, so that each of the three flasks were as
identical as possible. The cultures were grown overnight at 28˚C and 150 RPM. Four 125
mL Erlenmeyer flasks with 25 mL of LB were each inoculated with 500 μl of E. coli
strain APA752 with 300 μM DAP and 50 µg/mL kanamycin. DAP, diaminopimelic acid,
was used as APA752 is an auxotroph that requires DAP in order to create a functional
cell membrane. Removing DAP after the mating thus reliably removes APA752. The
cultures were grown overnight at 37˚C and 150 RPM. OD600 for each culture determined
the maximum concentration that could be used for a 1:1 mating between the two strains.
The total volume of the Pantoea flasks were divided evenly with 10-15 mL of each
APA752 culture, depending on the OD of each APA752 culture. Each APA752 culture
was resuspended to remove remaining kanamycin in 1 mL and once resuspended in 750
μl. The Pantoea cultures were resuspended once in 750 μl. Pantoea and APA752 were
mixed and vortexed gently, then spun down to be resuspended in 200 μl. The 200 μl was
then plated on nitrocellulose filters (Whatman, .45 μM) on LB plates with 300 μM DAP.
Then 100 μl was plated on each filter for a total of 8 filters for the 4 APA752 cultures.
Plates were conjugated for 6 hours at 28˚C. After conjugation, 1 mL of LB was added to
each filter and resuspended then spun down and resuspended in 750 μl. Freezer stocks of
750 μl suspension and 750 μl of 50% glycerol were made from each filter then
immediately frozen in liquid nitrogen and stored at -80˚C until plated. Serial dilution
confirmed estimates of approximately 300,000 mutants.
168
When ready to be plated, freezer stocks were thawed completely one at a time and
immediately plated on LB with 50 µg/mL kanamycin and spread with glass beads. For
each plate 75 μl was used with 20 plates per filter, and 160 plates total. Plates were stored
at 28˚C for two days. After two days, plates were divided into 3 sets and pooled
separately in 100 mL by scraping off colonies into LB with 50 µg/mL kanamycin. After
each was pooled, OD600 was measured for each of the three pools. Once measured, 3
new 100 mL LB with kanamycin cultures were made of “small”, “medium” and “large”
all diluted back to a starting OD of 0.2. “Small” had 2 mL of one of the pools. “Medium”
contained 1 mL from two of the pools, and “large” contained 667 μl from each of the 3
pools. This created three distinct pools. We hypothesized that the pools contained an
increasing number of mutants from small pool to the large pool. The pools were grown to
an OD of 1.1 at 28˚C. Once at the required OD, 1 mL freezer stocks of 500 μl glycerol
and 500 μl culture were made and immediately frozen for small, medium, and large
pools.
RB-TnSeq for frozen cultures with E. coli at mid-log
One culture of Pantoea sp. R4 grown in 25 mL in a 125 mL flask overnight at
28˚C and 150 RPM. Four cultures of E. coli strain APA752 was started from 2 freezer
stocks, for a total of 1 mL inoculated equally between the 4, 25 mL cultures in 125 mL
flasks. APA752 was grown to mid-log (OD 0.4, which took approximately 3 hours) at
37˚C and 150 RPM with 300 μM DAP and 50 µg/mL kanamycin. OD600 for each
culture determined the maximum concentration that can be used for 1:1 conjugation ratio.
The 1:1 ratio at OD of 1 was divided evenly using all of each APA752 culture. Each
169
APA752 culture was resuspended, the first time in 1 mL and a second time in 750 μl of
LB to get rid of kanamycin. The Pantoea culture was resuspended once in 750 mL.
Pantoea and APA752 were mixed and vortexed gently, then spun down to 200 μl and
plated on nitrocellulose filters (Whatman, .45 μM) on LB plates with 300 μM DAP. Then
100 μl was plated on each filter for a total of 8 filters for the 4 cultures. Plates were
conjugated for 6 hours at 28˚C. 1 mL of LB was added to each filter and resuspended in 1
mL then spun down and resuspended in 750 μl. Freezer stocks of 750 μl suspension and
750 μl of 50% glycerol were made from each filter then immediately frozen in liquid
nitrogen and stored at -80˚C until plated. Serial dilutions estimated approximately
600,000 mutants, double what we originally intended. Freezer stocks were thawed
completely one at a time and immediately plated on LB with 50 µg/mL kanamycin and
spread with glass beads. Because 600,000 mutants were created, only half of each freezer
stock was used, meaning that 750 μl of each freezer stock was diluted in 750 μl of LB.
For each plate, 75 μl was used with 20 plates per filter, and 160 plates total. Plates were
stored at 28˚C for two days. After two days, plates were divided into 3 sets and pooled
separately in 100 mL by scraping off colonies into LB with 50 µg/mL kanamycin.
Pooling procedure was identical as the one for the frozen, overnight cultures. The pools
were grown to an OD of 1.3 at 28˚C. Once at the required OD 1 mL freezer stocks of 750
μl glycerol and 750 μl culture were made and immediately frozen for small, medium, and
large.
170
RB-TnSeq for unfrozen, overnight cultures
Three cultures of Pantoea, each 25 mL in LB were inoculated and grown in 125
mL flasks overnight at 28˚C and 150 RPM. One colony was picked and inoculated into
all the three flasks. Four cultures of E. coli strain APA752 was started from 2 freezer
stocks, for a total of 1 mL inoculated equally among the 4, 25 mL cultures in 125 mL
flasks. APA752 was grown overnight at 37˚C and 150 RPM with 300 μM DAP and 50
µg/mL kanamycin. OD600 for each culture determined the maximum concentration that
could be used for 1:1 conjugation ratio. We took 1:1 at OD of 1 with the total volume
Pantoea divided evenly between each mating with approximately 14.5 mL of each
APA52 culture (depending on OD). Each APA752 culture was resuspended, the first time
in 1 mL and the second time in 750 μl of LB to get rid of residual kanamycin. The
Pantoea culture was resuspended once in 750 mL. Pantoea and APA752 were mixed and
vortexed gently, then spun down to 200 μl and plated on nitrocellulose filters (Whatman,
.45 μM) on LB plates with 300 μM DAP. 100 μl was plated on each filter for a total of 8
filters for the 4 cultures. Plates were conjugated for 6 hours at 28˚C. 1mL of LB was
added to each filter and resuspended then spun down and resuspended in 1.5 mL. Once
resuspended, 75 μl were plated directly onto LB plates with 50 µg/mL kanamycin for 20
plates per filter, and 160 plates total. The pooling procedure was identical as the one for
the frozen, overnight cultures. The pools were grown to an OD of 1.3 at 28˚C. Once
cultures were grown to the required OD, 1 mL freezer stocks of 750 μl glycerol and 750
μl culture were made and immediately frozen for the small, medium, and large pools.
171
RB-TnSeq DNA extraction and quantification
One freezer stock of each mating strategy was used to inoculate 100 mL of LB in
a 500 mL flask and grown overnight at 28˚C and 150 RPM. This created 9 flasks, for the
three main mating strategies each with the three pooled sizes. From each freezer stock,
we performed DNA extractions in triplicate for a total of 27 DNA extractions. DNA
extractions were performed per the manufacturer’s instructions (Qiagen UltraClean
Microbial Kit). DNA was quantified using Picogreen (Invitrogen) and read on the plate
reader, as well as by using a Nanodrop 2000 (Thermofisher). Picogreen was used to
calculate quantity of DNA while the Nanodrop 2000 was used to ascertain the 260/280
and 260/230 quality metrics. 2 µg of DNA was added to a total volume of 130 μl in EB
buffer (Qiagen)
RB-TnSeq DNA sonication
To fragment the DNA to approximately 200-400 base pairs. The 130 μl volume
was slowly added to Covaris microtubes (AFA fiber pre slit snap cap tubes) so that no air
bubbles were present. We confirmed fragmentation to the correct size by running a gel
post sonication. Successful sonication occurred under the conditions: PIP: 50W, Duty
Factor: 20%, Cycles per Burst: 200, and Treatment Time: 60 seconds. Per the
manufacturer’s instruction sonication fragmentation is troubleshot using treatment time,
so we modified only this variable.
RB-TnSeq size selection
Once successful sonication is confirmed, size selection is performed to remove
any smaller or larger sizes that remain. Ampure XP beads (Beckman Coulter) were left at
room temperature in the dark for 30 minutes before use. 0.56x of beads was added to the
172
130 μl sample (72.8 μl) then pipetted up and down about 30 times briefly to mix so that
the color was uniform throughout. Samples were incubated at room temperature for 5
minutes then placed on a magnetic rack until the supernatant cleared. Supernatant was
transferred to a fresh microcentrifuge tube. 0.31X of Ampure XP beads was added to the
supernatant then pipetted to mix and incubated at room temperature for 5 minutes. Once
incubated, samples were placed on the magnetic rack until the supernatant was clear.
Supernatant was removed, taking care not to remove any beads. The pelleted beads were
washed with 300 μl of freshly prepared 80% ethanol. Ethanol and beads were incubated
on the magnetic bead stand for 30 seconds then pipetted off and repeated once more.
Once the ethanol was carefully removed, beads were incubated for 10 minutes with 25 μl
of EB buffer. Then 20 μl of eluate was carefully transferred to a clean tube and stored at -
20˚C. Picogreen and nanodrop were repeated as described above. Samples contained
between 500 ng to 1 µg in 20 μl.
RB-TnSeq NEB Next End Prep and adaptor ligation
This portion is from the NEB Next Ultra II DNA Library Prep Kit (NEB, E7645
Kit), but deviates from the standard NEB protocol at multiple points as this kit is not
designed specifically for RB-TnSeq. Thus the methods utilized here were provided in
depth for clarity. First, 30 μl of 1X TE was added for a total volume of 50 μl for the
fragmented, cleaned DNA. NEB Next Ultra II End Prep Enzyme Mix and End Prep
Reaction Buffer was placed on ice. 3 μl of End Prep Enzyme Mix and 7 μl of End Prep
Reaction Buffer was added to each sample of fragmented, cleaned DNA. Each sample
was mixed 15 times with a 100 μl pipette set to 50 μl. Mixing can produce bubbles, but
173
the bubbles do not inhibit the enzymatic reaction. Samples were spun down in a
minicentrifuge then placed in thermocycler and run under the folder RB-TnSeq and the
program title NebPart 1. This program incubates samples for 30 minutes at 20˚C then 30
minutes at 65˚C. Immediately after this, adaptor ligation was performed as samples can
be stored prior to adaptor ligation but doing so will decrease recovery so we chose not to
store samples. Ultra II Ligation Master Mix, Ligation Enhancer, and double stranded y
adaptors were placed on ice. The Ultra II Ligation Master Mix was mixed by pipetting up
and down several times prior to adding to the reaction. Next, 30 μl of NEB Next Ultra II
Ligation Master Mix 30, 1 μl of NEB Next Ligation Enhancer and 0.8 μl of double
stranded Y adapters (15 µM stocks of Mod2_TS_Univ and Mod2_TruSeq) were added. It
should be noted that the Y adaptors were annealed to each other prior to use according to
the protocol define in Morin et al., 2018 and confirmed via gel size of anneal adaptors.
The NEB Next Adaptor for Illumina were not added as the double stranded Y adaptors
were added instead (Table 4.1). A 100 μl pipette was set to 80 μl then the samples were
mixed 10 times. Samples were again spun down in a microcentrifuge before being placed
in the thermocycler and run under the folder RB-TnSeq and the program title NebPart 2.
This entailed 15 minutes at 20˚C with the heated lid off per manufacturer’s instructions.
We did not add the USER enzyme supplied by NEB as it is not used for RB-TnSeq
(Morin et al., 2018). Once the thermocycler program was completed, samples were stored
overnight at -20˚C.
174
RB-TnSeq post NEB Next size selection
To remove DNA fragments of unwanted sizes, a double size selection was
performed. The desired genome fragment size is300 base pairs, with the ligation around
480 bp total. Exactly 25 μl (~0.4X) of resuspended Ampure XP beads was added to the
ligation reaction and mixed by pipetting up and down at least 10 times. Samples were
incubated for 5 minutes at room temperature then placed on the magnetic stand to bind
magnetic beads for 5 minutes. The supernatant was carefully transferred to a new tube
and 10 μl of Ampure XP beads was added to the supernatant and mixed 10 times. Then
samples were incubated for 5 minutes and placed on the magnetic stand for 5 minutes.
The supernatant was carefully removed and discarded. Samples were washed twice with
200 μl of freshly prepared 80% ethanol for 30 seconds. Samples were air dried for 5
minutes on the magnetic stand then eluted in 17 μl of 10 mM Tris-HCl. The samples
were mixed by pipetting up and down 10 times then incubated for 10 minutes at room
temperature. After 5 minutes 15 μl was transferred to a clean PCR tube for amplification.
Samples were stored at -20˚C until transposon enrichment could be performed.
Transposon enrichment of adaptor ligated DNA
To enrich for transposon fragments, a PCR was performed using all 15 μl of
Adaptor Ligated DNA Fragments, 25 μl of NEB Next Ultra II Q5 Master Mix, 5 μl of
Nspacer_barseq_pHIMAR and 5μl of P7_MOD_TS_index primers for a total volume of
50 μl. A different index primer was used for each sample to be able to identify them post
sequencing then the solution was mixed 10 times. Samples were spun down using a
microcentrifuge then placed in thermocycler. The enrichment protocol is 98˚C for 30
175
seconds with 24 cycles of 98˚C for 10 seconds, 65˚C for 75 seconds, and final extension
of 65˚C for 5 minutes. Samples and stored at -20˚C.
RB-TnSeq Final Cleanup and Submission for Sequencing
To remove residual PCR materials, we performed a final clean up without size
selection. First 45 μl (0.9X) of resuspended Ampure XP beads was added to the PCR
reaction and mixed thoroughly. Samples were incubated for 5 minutes at room
temperature then placed on the magnetic bead stand to separate the beads from the
supernatant and discard the supernatant. Then 200 μl of freshly prepared 80% ethanol
was added to the tube while on the magnetic stand and incubated for 30 seconds twice.
Beads were then air dried for 5 minutes and eluted in 33 μl of 0.1X TE. After incubating
with the beads for 10 minutes, 30 μl was transferred to a new PCR tube stored at -20˚C.
Samples were pooled together since they had distinct index primers and submitted to the
University of Tennessee Genomics Core. They were twice run on a Bioanalyzer High
Sensitivity Chip (Agilent Technologies) to quantify concentration and confirm amplicon
size, once before and once after Pippin Prep. Samples were run on the Pippin Prep (Sage
Science) to remove small <200 base pair fragments on a 1.5% agar gel. Samples were
then sequenced using Version 2, 500 cycle (2 X 250) kit on the Illumina MiSeq platform.
Generating mariner transposon mutants
E. coli strain EZ193, containing plasmid pEZ16, was a gift from the Zinser
laboratory at the University of Tennessee Microbiology Department (Figure 4.2). This
plasmid contained the mariner transposase, which inserts randomly into genomes at any
TA target site. The plasmid also contains an antibiotic gene encoding for resistance to
176
chloramphenicol. As with APA 752, the E. coli strain EZ193 is also a DAP auxotroph.
The donor strain was struck on to LB plate with 75 μl of 100 mM DAP (diaminopimelic
acid) and 30 µg/L of chloramphenicol using a glass spreader then incubated for 24 hours
in order to form a thick lawn at 37˚C. Pantoea sp. R4 was spread in the same manner on
to LB and incubated for 24 hours at 28˚C. After 24 hours, E. coli strain EZ193 was
placed on a new plate of LB with DAP and the Pantoea sp. R4 was placed on top in
approximately a 1:1 concentration using a glass spreader. The strains were then gently
mixed using the glass spreader and incubated for 24 hours at 28˚C. Controls of Pantoea
sp. R4 and E. coli alone were performed to confirm lack of chloramphenicol resistance
and bacterial contamination, respectively. After conjugation, 1.5 mL of liquid LB was
placed on the plate and mixed to resuspend the bacteria using the glass spreader.
Approximately 1 mL was recovered and serially diluted on to LB with chloramphenicol
plates to determine the level of successful conjugation. The remaining bacterial
suspension was frozen in a 60% glycerol solution until plated for mutant screening. This
conjugation protocol was repeated multiple times (>10) in order to pool for mutants.
Screening carotenoid deficient mutants
Over 6,000 mutants created from mating with E. coli strain EZ193 were screened
for carotenoid deficiency. Using the serial dilution counts from the conjugation
efficiency, an approximate 40 colonies per plate were plated to ensure that each colony
could grow independently. Plates were incubated for 1-2 weeks, and examined
periodically every two to three days. All colonies with altered pigment production when
compared to Pantoea sp. R4 standard yellow colony formation were struck out to isolate
177
each potential carotenoid mutant. Differently pigmented mutants could appear to lack
pigmentation, have alternative pigmentation colors or have an increase or decrease in
yellow pigmentation. If the abnormal pigmentation persisted when isolated, then the
carotenoid mutant was grown up in 5 mL of liquid LB with chloramphenicol overnight to
make a freezer stock and provide material for DNA extraction.
One third of the 6,000 mutants screened for carotenoid deficiency were also
screened for motility, potassium solubilization, phosphate solubilization and survival on
nitrogen free media. After mutants were plated on round plates, mutants were picked into
96 well containers with 1 mL of LB with 30 µg/L of chloramphenicol and grown
overnight at 28˚C. Mutants were plated on to square plates (120 cm by 120 cm), with 48
mutants plated per plate using a multichannel pipette set to 5 µL. Each mutant was plated
on to 5 types of media. After plating on each medium, 1 mL of 50% glycerol was added
to each well and the 96 well plates stored at -80˚C for future transposon screening. Of the
5 media used for screening, each was used to screen for a different phenotype. LB was
used to screen for any mutants with unusual physical characteristics such as non-circular
colony formation. Pikovskayas Agar and Aleksandrow Agar were used to screen for
phosphate and potassium solubilization, respectively. A positive solubilization phenotype
produces translucent halo around the colony, while the rest of the media is opaque.
Mutants that failed to form a halo were struck onto the same media again for closer
investigation of the phenotype. Jensens media was nitrogen free, and microbes that failed
to grow on Jensens media but could grow on LB were stuck out on LB and Jensens for
potential phenotype involving lack of survival in nitrogen free media. 1/10 LB with 3%
178
agar was used to screen for mutants deficient in motility. Media preparation for
Pikovskayas Agar, Aleksandrow Agar and Jensens Media is provided in Chapter 3. Any
mutants of interest were struck out 3 times to confirm the phenotype, then grown up in 5
mL of liquid LB with chloramphenicol overnight as stated above.
Arbitrary PCR
In order to identify where the insertion occurred in the mutants created from
mating with E. coli strain EZ193, the DNA of each mutant was isolated and extracted
using DNeasy UltraClean Microbial Kit (Qiagen). Once DNA was isolated, arbitrary
PCR was used to amplify the region surrounding the transposon insertion. The arbitrary
PCR protocol was based off the protocol outlined in Melnky et al., 2013 and protocol
notes provided by the Zinser and Buchan laboratories at the University of Tennessee.
Primers specific to the plasmid were generated here. Arbitrary PCR has two separate
PCR steps using different primers each time. All primers are provided in Table 4.2. The
first PCR contains a primer that binds to the end of the chloramphenicol resistance gene
that was inserted randomly into the genome by the transposase. This primer is called
Himar_Ext and was created for this project. The second primer, named Arb 6, contains a
sequence of N’s so that it will bind at random within the genome (Melnky et al., 2013).
The Arb 6 primer also contains a recognition sequence that will allow for a primer in the
second PCR to bind to it. Once the first PCR is completed, the product is cleaned and
used as the template for the second PCR. The second PCR contains a primer that is
slightly closer to the end of the randomly inserted region. This primer is Himar_Int and
was created for this project. The final primer is Arb 2 and contains the matching sequence
179
to Arb 6. Overall, the first PCR amplifies from the end of inserted region to where the
Arb 6 primer randomly binds, and the second PCR further selects for the smaller sized
pieces where the Himar_Ext and Arb 2 are close enough together to allow for sequencing
of the full amplicon but far enough that genomic location where the insertion occured can
be identified.
The PCR cocktail contained 12.5 µL of HiFi Hotstart Master Mix (KAPA
Biosystems), 2µL (10 μM) of each primer, 1 µL of DNA and 9.5 of sterile water for both
PCRs. The first PCR protocol is 95˚C for 10 minutes, with 35 cycles of 95˚C for 30
seconds, 36˚C for 30 seconds, 72˚C for 2 minutes and then a final extension of 72˚C for
10 minutes. The second protocol is 95˚C for 10 minutes, with 35 cycles of 95˚C for 30
seconds, 59˚C for 30 seconds, 72˚C for 2 minutes and then a final extension of 72˚C for
10 minutes. After performing the first PCR the entire PCR product was cleaned with
QIAquick PCR Purification Kit (Qiagen) according to the protocol. Next, 2 μl of cleaned
PCR product was used to assay DNA quality, and an average of 150 ng/μl was found per
sample. The entire PCR product from the second PCR was again cleaned with QIAquick
PCR Purification Kit (Qiagen) and these final samples had an average of 30-40 ng/μl .
Samples were submitted to University of Tennessee DNA Genomics Core for Sanger
Capillary Sequencing.
Identification of genomic location of insertion
The inverted repeat is located at the end of the insert, so we located where the
inverted repeat was in every sequenced insertion. This allowed us to find exactly where
the inserted region ended and the genomic sequence began, enabling the exact
180
identification of the insert within all the isolated mutants sequenced (Table 4.3, 4.4).
Once the inverted repeat was located, the region directly adjacent was highlighted and
aligned to the Pantoea sp. R4 genome using a nucleotide BLAST on JGI/IMG (Joint
Genome Institute/Integrate Microbial Genomics) for select genomes. JGI/IMG was used
as it can provide the exact genomic coordinates of the selected region, as well as a
schematic of the genes located in or around that region enabling ease of identification.
Once the genomic location of the insertion was identified, all insertions were screened to
determine if they fell within the middle 80% of the gene. Insertions that fell within the
first 10% of a gene could contain alternative start codons while insertions that fell within
last 10% might produce almost fully functional proteins. Any insertions that fell outside
the middle 80% were not investigated further. This is range has been used before to
identify the mutants with the most effective insertions (Opijnen et al., 2013).
Phenotyping carotenoid mutants
In addition to the other growth phenotypes screened for, these pigment mutants
were examined for auxin production and biofilm production, since these phenotypes were
previously linked to Pantoea carotenoid mutants (Bible 2016). Auxin production was
assayed as previously described in the experimental procedures in Chapter 3. Biofilm
production was measured using a modified protocol based off two procedures (O’Toole,
2011, Bible et al., 2016). An overnight culture of wildtype R4 and all mutants were
grown in LB at 28˚C. OD was measured using a spectrophotometer and samples were
diluted to 0.01 OD in LB. Both auxin and biofilm production were standardized by the
OD of the bacteria to eliminate differences due to growth rate. In triplicate, 100 μl was
181
added to a 96 well plate and left stationary at 28˚C for 72 hours. After this time, samples
were inverted gently to remove liquid, then rinsed by submerging in water twice.
Samples were stained with 125 μl of crystal violet for 10 minutes. Samples were rinsed
with water three times, then left inverted to dry for three hours or until dry. Carefully,
125 μl of glacial acetic acid was added to each well then left for 15 minutes. The
resulting liquid was transferred to a new 96 well plate and read at 550 nm.
Competition Assays in alfalfa
Competition assays between wildtype and crtB::TnMariner and wildtype and
crtY::TnMariner were performed at 2 time points (4 days and 4 weeks) and 2 nutrient
conditions (no nitrogen added and regular Yoshida). Both wildtype and mutant strains
were grown up overnight in LB and LB with chloramphenicol respectively at 28˚C.
Strains were washed twice with 1X PBS and spun down at 10,000 RPM for 1 minute to
remove LB and any contaminating antibiotic, and finally resuspended in 1X PBS. All
strains were combined in equal parts for a total OD of 0.01. Serial dilutions were
performed to confirm that there was no remaining chloramphenicol to kill susceptible
wildtype cells and that there were equal parts of both strains were present upon
inoculation of the plants. Wildtype and mutant strains were easily discernible on LB, and
serial dilutions were performed on LB with chloramphenicol to confirm that the
transposon insertions were stable throughout the duration of the experiment. Colony
counts for both mutants were consistent between the antibiotic media and the regular LB.
All colonies on the antibiotic media displayed no pigmentation or pink coloration for
182
crtB::TnMariner and crtY::TnMariner, suggesting that there was not any wildtype R4
that conferred resistance when in association with the mutants.
All plants were inoculated with 150 μl and washed and harvested according to the
procedure outlined in Chapter 3 with the exception that the 4 week time point plates were
separated into leaf and roots in order to examine differential colonization of the plant
organs. For the 4 week time point, plants were cut with sterile scissors at the base of the
stem, so that roots were separated from the stems and leaves. This was done only at the 4
week time point as 4 day plants do not have adequate root formation to separate
accurately across plants.
Drop out community experiments
Drop out communities were generated as in Chapter 3 including regenerating the
wildtype R4 drop out community, growing up each community overnight and adding
together the entire community with either crtB::TnMariner and crtY::TnMariner in lieu
of wildtype Pantoea sp. R4. Both crtB::TnMariner and crtY::TnMariner were grown in
LB and washed as described above to remove any residual chloramphenicol. Plants were
inoculated with 150 μl of the drop out communities and harvested after 4 days, 2 weeks
and 4 weeks at no nitrogen added and regular Yoshida nutrient conditions.
Potassium mutant colonization experiments
Colonization for potassium solubilization was performed with Yoshida media to
test the “Cry for help” hypothesis. Yoshida media was modified to add an insoluble
potassium source: potassium feldspar. Three conditions were used: standard Yoshida
which has soluble potassium in the form of potassium sulfate, 50/50 which contained half
183
of the potassium source as soluble potassium and half as insoluble and the third condition
which contained a fully insoluble potassium source. For 1 liter of potassium insoluble
media, 43.6 mg of potassium feldspar was used, while 50/50 used 21.8 mg of potassium
feldspar and 21.8 mg of potassium sulfate. Plants were inoculated for 4 days with either
Pantoea sp. R4 or K-::TnMariner, then harvested following the same homogenization
and plating protocol outlined in Chapter 3. No plant controls were inoculated under the
same conditions and standardized by biomass of approximately 1 mL of media harvested
to numerate colonization of the media in each nutrient condition.
Statistical analysis
A 1-way ANOVA with a post hoc Tukey's test was used to test if there were
significant differences in the variables compared in Figures 4.10 and 4.11. Figures 4.12
and 4.13 use paired t-tests as both wildtype and mutant strains colonized the sample
plants and thus a paired analysis could be used. All data was statistically analyzed in
Prism version 8.0 for PC (GraphPad Software, La Jolla, California, USA,
www.graphpad.com).
Results
RB-TnSeq results
Ultimately both attempts to sequence the RB-TnSeq mutant library and map the
insertions in the genomes were unsuccessful, but multiple steps within the protocol could
be confirmed to be working, thus allowing for the ability to troubleshoot the remaining
steps in the future (Figure 4.3). Mating between the randomly barcoded E. coli strain
APA752 and Pantoea sp. R4 was successful for all 3 mating strategies. The first, referred
184
to as the frozen mating, was where both strains were grown overnight, conjugated, and
then frozen prior to plating. The second, known as the mid-log mating, Pantoea sp. R4
was grown overnight while APA752 was grown to mid-log, conjugated, and then frozen
prior to plating. The third, known as unfrozen mating, both strains were grown overnight,
conjugated, and plated. For all three mating strategies, there were 3 pooling subsets:
small, medium, and large. For both frozen and unfrozen mating strategies, we estimate
that there were approximately 100,000 mutants in the small pool, 200,000 mutants in the
medium pool, and 300,000 mutants in the large pool. The mating using APA752 at mid-
log produced approximately 600,000 mutants, but only half of these mutants were plated
resulting in the same number of mutants pooled for each mating strategy. 100,000-
300,000 mutants are estimated to be needed for successful RB-TnSeq results (Morin et
al., 2018). When sequencing, however, we received only 710 unique insertions within the
genome. These 710 insertions are evenly distributed throughout the genome (a subset of
these can be seen in Table 4.5). Because insertions were not clustered around the origin
of replication, we do not think that our low number of mapped insertions was because the
cells were growing too quickly during conjugation. This suggests our conjugation
protocol is functioning appropriately (Wetmore et al., 2015).
Sonication was successful as the fragments were between 200-400 base pairs.
Figure 4.4A shows that sonication was able to fragment DNA to the correct size range
after 60 seconds. Figure 4.4B shows that the ratios in lane 1 and 2 which were 0.77X-
0.64X and 0.85X-0.56X appeared to work well as both were able to remove any
fragments above 500 or below 250. The size ratio chosen was 0.85X-0.56X, as higher
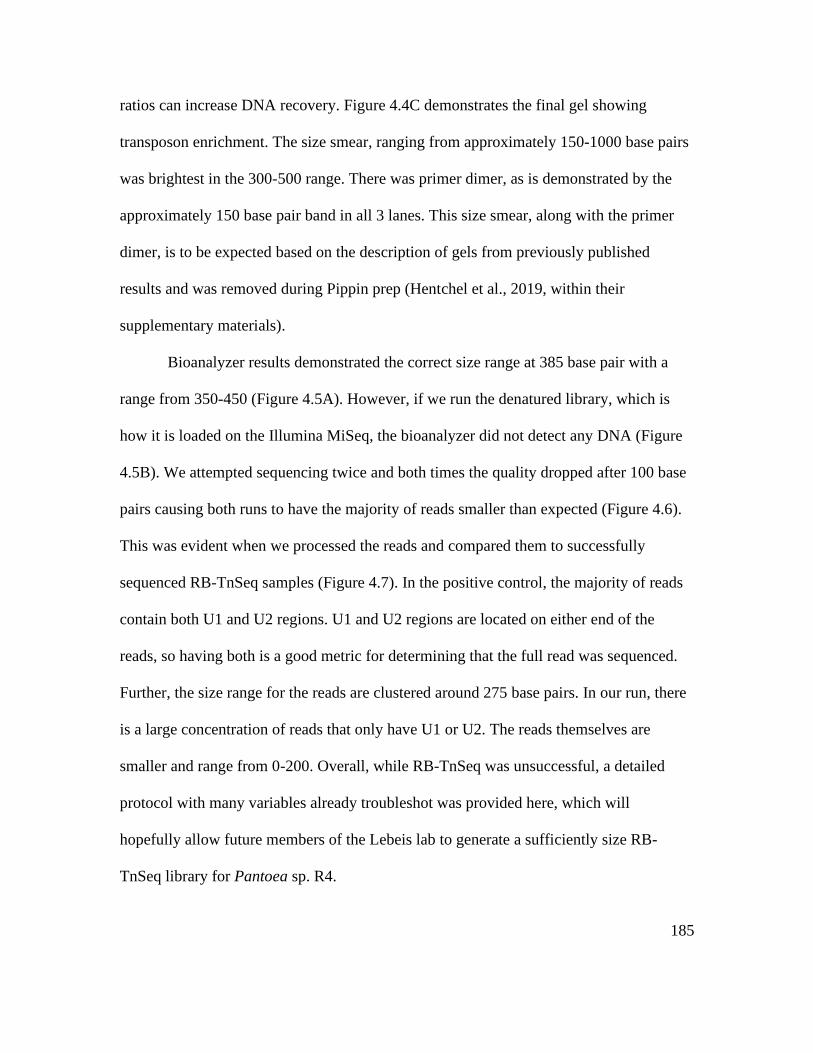
185
ratios can increase DNA recovery. Figure 4.4C demonstrates the final gel showing
transposon enrichment. The size smear, ranging from approximately 150-1000 base pairs
was brightest in the 300-500 range. There was primer dimer, as is demonstrated by the
approximately 150 base pair band in all 3 lanes. This size smear, along with the primer
dimer, is to be expected based on the description of gels from previously published
results and was removed during Pippin prep (Hentchel et al., 2019, within their
supplementary materials).
Bioanalyzer results demonstrated the correct size range at 385 base pair with a
range from 350-450 (Figure 4.5A). However, if we run the denatured library, which is
how it is loaded on the Illumina MiSeq, the bioanalyzer did not detect any DNA (Figure
4.5B). We attempted sequencing twice and both times the quality dropped after 100 base
pairs causing both runs to have the majority of reads smaller than expected (Figure 4.6).
This was evident when we processed the reads and compared them to successfully
sequenced RB-TnSeq samples (Figure 4.7). In the positive control, the majority of reads
contain both U1 and U2 regions. U1 and U2 regions are located on either end of the
reads, so having both is a good metric for determining that the full read was sequenced.
Further, the size range for the reads are clustered around 275 base pairs. In our run, there
is a large concentration of reads that only have U1 or U2. The reads themselves are
smaller and range from 0-200. Overall, while RB-TnSeq was unsuccessful, a detailed
protocol with many variables already troubleshot was provided here, which will
hopefully allow future members of the Lebeis lab to generate a sufficiently size RB-
TnSeq library for Pantoea sp. R4.
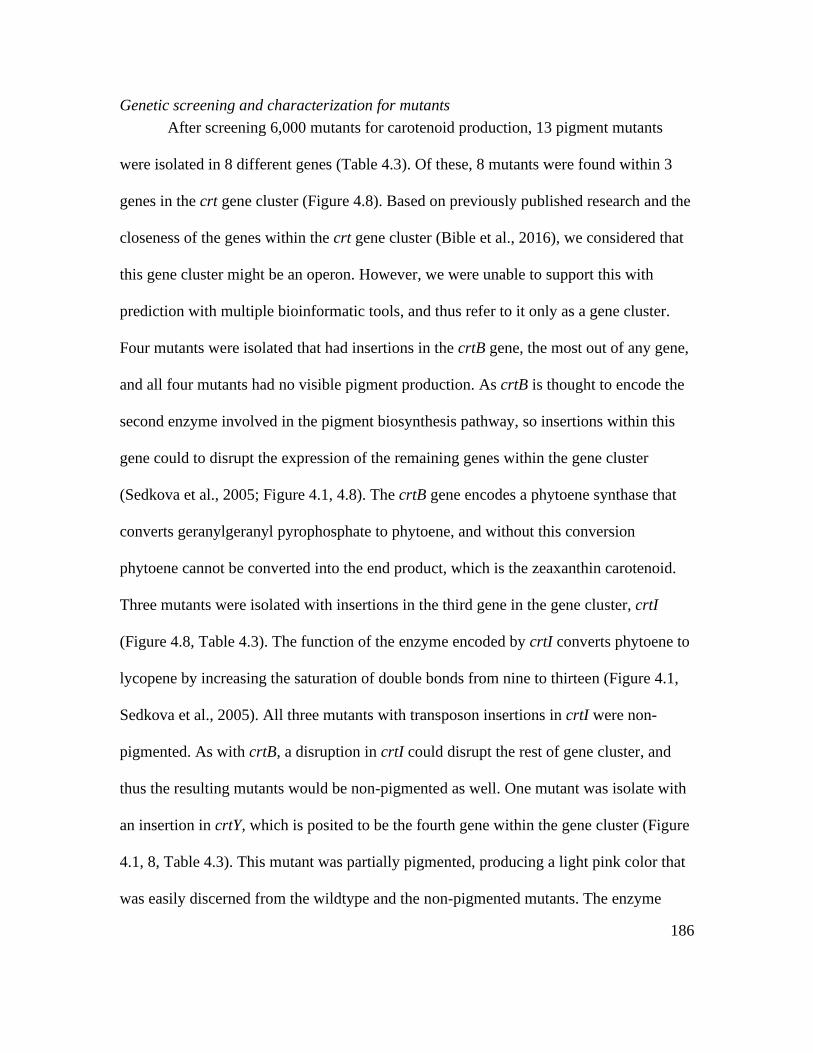
186
Genetic screening and characterization for mutants
After screening 6,000 mutants for carotenoid production, 13 pigment mutants
were isolated in 8 different genes (Table 4.3). Of these, 8 mutants were found within 3
genes in the crt gene cluster (Figure 4.8). Based on previously published research and the
closeness of the genes within the crt gene cluster (Bible et al., 2016), we considered that
this gene cluster might be an operon. However, we were unable to support this with
prediction with multiple bioinformatic tools, and thus refer to it only as a gene cluster.
Four mutants were isolated that had insertions in the crtB gene, the most out of any gene,
and all four mutants had no visible pigment production. As crtB is thought to encode the
second enzyme involved in the pigment biosynthesis pathway, so insertions within this
gene could to disrupt the expression of the remaining genes within the gene cluster
(Sedkova et al., 2005; Figure 4.1, 4.8). The crtB gene encodes a phytoene synthase that
converts geranylgeranyl pyrophosphate to phytoene, and without this conversion
phytoene cannot be converted into the end product, which is the zeaxanthin carotenoid.
Three mutants were isolated with insertions in the third gene in the gene cluster, crtI
(Figure 4.8, Table 4.3). The function of the enzyme encoded by crtI converts phytoene to
lycopene by increasing the saturation of double bonds from nine to thirteen (Figure 4.1,
Sedkova et al., 2005). All three mutants with transposon insertions in crtI were non-
pigmented. As with crtB, a disruption in crtI could disrupt the rest of gene cluster, and
thus the resulting mutants would be non-pigmented as well. One mutant was isolate with
an insertion in crtY, which is posited to be the fourth gene within the gene cluster (Figure
4.1, 8, Table 4.3). This mutant was partially pigmented, producing a light pink color that
was easily discerned from the wildtype and the non-pigmented mutants. The enzyme
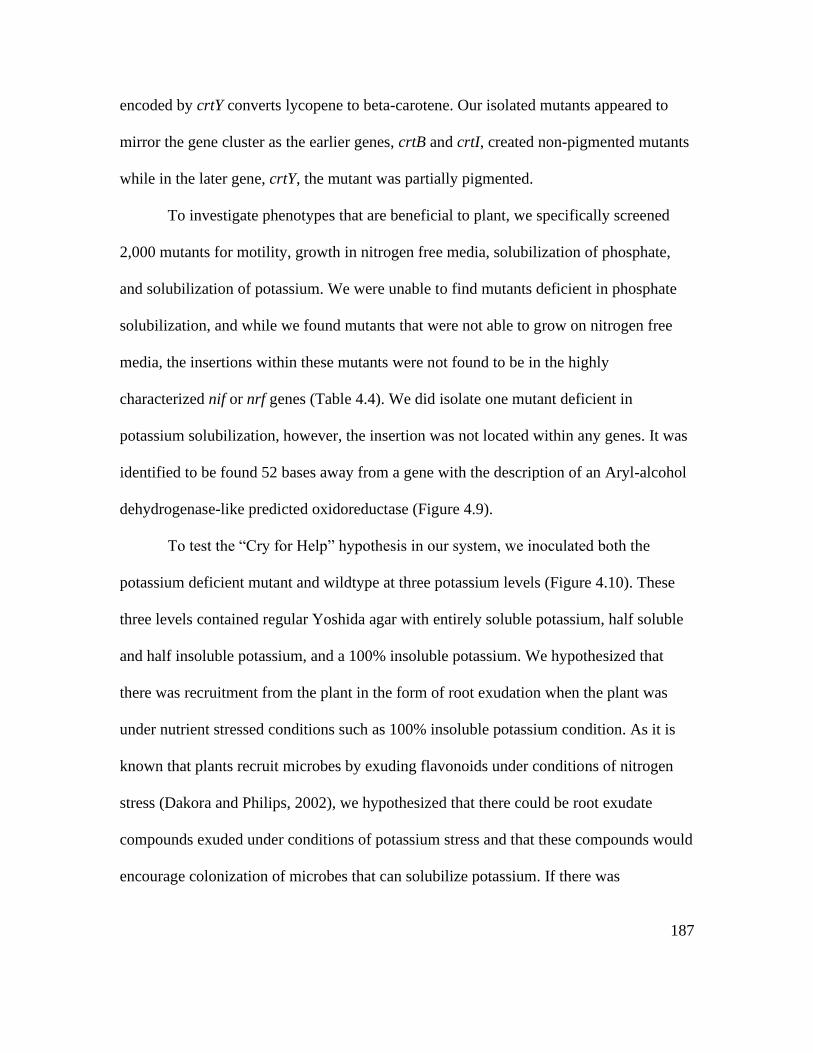
187
encoded by crtY converts lycopene to beta-carotene. Our isolated mutants appeared to
mirror the gene cluster as the earlier genes, crtB and crtI, created non-pigmented mutants
while in the later gene, crtY, the mutant was partially pigmented.
To investigate phenotypes that are beneficial to plant, we specifically screened
2,000 mutants for motility, growth in nitrogen free media, solubilization of phosphate,
and solubilization of potassium. We were unable to find mutants deficient in phosphate
solubilization, and while we found mutants that were not able to grow on nitrogen free
media, the insertions within these mutants were not found to be in the highly
characterized nif or nrf genes (Table 4.4). We did isolate one mutant deficient in
potassium solubilization, however, the insertion was not located within any genes. It was
identified to be found 52 bases away from a gene with the description of an Aryl-alcohol
dehydrogenase-like predicted oxidoreductase (Figure 4.9).
To test the “Cry for Help” hypothesis in our system, we inoculated both the
potassium deficient mutant and wildtype at three potassium levels (Figure 4.10). These
three levels contained regular Yoshida agar with entirely soluble potassium, half soluble
and half insoluble potassium, and a 100% insoluble potassium. We hypothesized that
there was recruitment from the plant in the form of root exudation when the plant was
under nutrient stressed conditions such as 100% insoluble potassium condition. As it is
known that plants recruit microbes by exuding flavonoids under conditions of nitrogen
stress (Dakora and Philips, 2002), we hypothesized that there could be root exudate
compounds exuded under conditions of potassium stress and that these compounds would
encourage colonization of microbes that can solubilize potassium. If there was
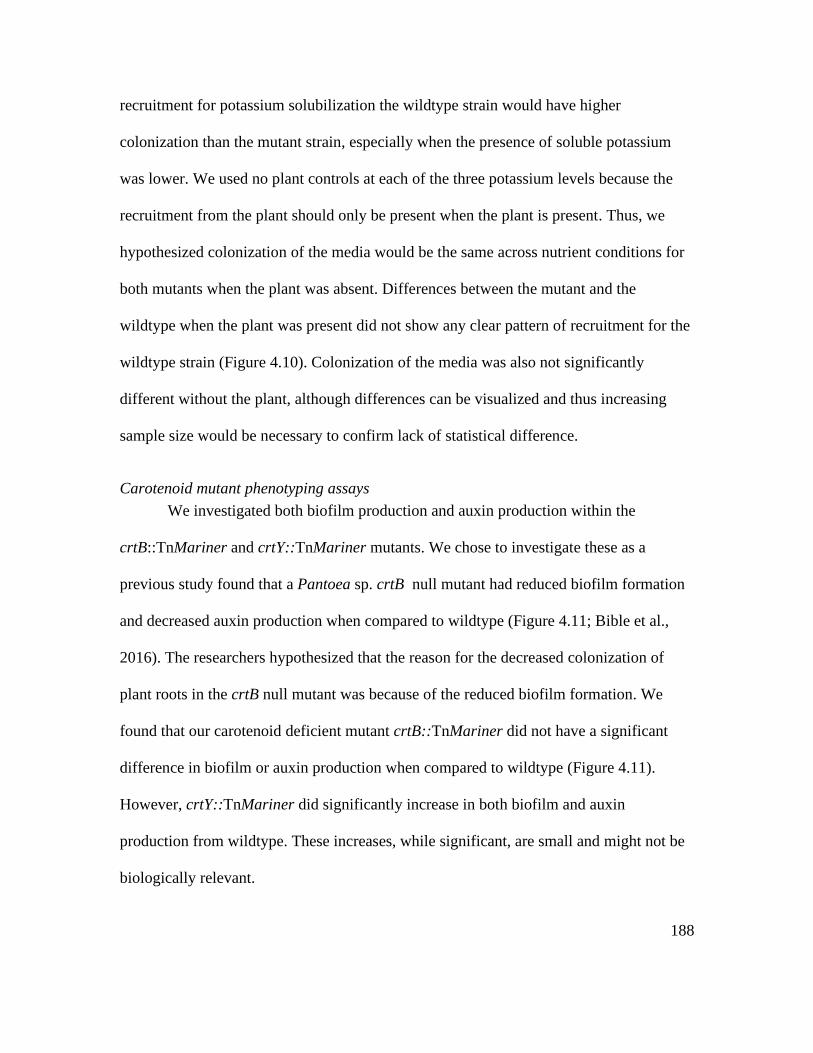
188
recruitment for potassium solubilization the wildtype strain would have higher
colonization than the mutant strain, especially when the presence of soluble potassium
was lower. We used no plant controls at each of the three potassium levels because the
recruitment from the plant should only be present when the plant is present. Thus, we
hypothesized colonization of the media would be the same across nutrient conditions for
both mutants when the plant was absent. Differences between the mutant and the
wildtype when the plant was present did not show any clear pattern of recruitment for the
wildtype strain (Figure 4.10). Colonization of the media was also not significantly
different without the plant, although differences can be visualized and thus increasing
sample size would be necessary to confirm lack of statistical difference.
Carotenoid mutant phenotyping assays
We investigated both biofilm production and auxin production within the
crtB::TnMariner and crtY::TnMariner mutants. We chose to investigate these as a
previous study found that a Pantoea sp. crtB null mutant had reduced biofilm formation
and decreased auxin production when compared to wildtype (Figure 4.11; Bible et al.,
2016). The researchers hypothesized that the reason for the decreased colonization of
plant roots in the crtB null mutant was because of the reduced biofilm formation. We
found that our carotenoid deficient mutant crtB::TnMariner did not have a significant
difference in biofilm or auxin production when compared to wildtype (Figure 4.11).
However, crtY::TnMariner did significantly increase in both biofilm and auxin
production from wildtype. These increases, while significant, are small and might not be
biologically relevant.
189
Carotenoid mutant colonization assays
Because the crtB gene is the most common gene studied when investigating the
crt gene cluster in Pantoea strains, we selected one crtB::TnMariner to further examine
how colonization changes when expression of crtB is disrupted (Bible et al., 2016;
Sedkova et al., 2005). Out of the 4 mutants isolated with insertions in the crtB pathway,
we selected the crtB::TnMariner mutant with its insertion at 186 base pairs as all 4
mutants contained insertions within the suggested range and produced consistently non-
pigmented colonies (Table 4.2). We also chose to examine the crtY insertion mutant
because pigmentation production was altered, but not entirely disrupted. This was
because the colonies from this mutant were pink and therefore distinct from both the non-
pigmented strains and the wildtype. Both strains were readily distinguishable on plates,
allowing for competition assays with wildtype. These competition assays were performed
for 4 days and 4 weeks at standard Yoshida and no nitrogen added conditions in alfalfa.
As in Chapter 3, 4 days was chosen as our initial colonization time point, prior to the
appearance of true leaves on the M. sativa plants (Moccia et al., 2020B). Plants were
grown in standard Yoshida as it most closely mimics the nutrient profile found in soil and
serves as a good comparison to the no nitrogen added Yoshida condition, which is the
most nutrient stressed condition we have observed in lab (Chapter 3). Four weeks was
chosen as the second time point as plants within no nitrogen conditions begin to die after
this point, so this is the longest possible time point where comparisons can be made
between nutrients.
In contrast to results for other Pantoea colonization experiments (Mohammadi et
al., 2012; Bible et al., 2016), an null mutant for crtB did not lead to a decrease in plant
190
colonization capabilities. In fact, there was a significant increase, although small, in
crtB::TnMariner when compared to wildtype (Figure 4.12A-B). The mean colonization
of crtB::TnMariner was higher than that of wildtype at both 4 days and 4 weeks for both
nutrient conditions, with approximate increase of between 5-9 X 10⁷ colony forming units
per gram (CFU/g) of plant. It was significantly higher at three of these four conditions,
with only regular Yoshida at 4 weeks not able to determine statistical significance but
trending in the same direction with a p-value of 0.1044 (Figure 4.12B). Alone, these
results suggest that there is a possible slight negative impact of expressing crtB in
Pantoea sp. R4 during plant colonization. However, the biology underlying transposon
insertions provides an alternative explanation for why there is a slight negative impact for
producing the carotenoid. When an transposon insertion disrupts a gene, it can impact the
expression of genes that are downstream, when this happens it is known as a polar effect.
Thus, the slight increase in colonization could be due to a polar effect rather than directly
from the gene which contains the insertion. To test this examining the expression of
every gene in the gene cluster in each mutant would shed light on whether there were
polar effects. Further, designing primers that span the whole gene cluster can help
investigate expression as well.
When competing crtY::TnMariner against wildtype, there were no statistical
colonization differences at 4 days or 4 weeks for either regular Yoshida or the no
nitrogen added condition (Figure 4.12C-D). Further, the average colonization for
crtY::TnMariner was not consistently higher than wildtype as it was between
crtB::TnMariner and wildtype. These results suggested that only the non-pigmented
191
mutants might possess a slight advantage during colonization, while the partially
pigmented crtY::TnMariner did not. It is possible that there was enough production of the
precursor, lycopene to eliminate this advantage. This further suggests that the differences
seen between wildtype and crtB::TnMariner were not due to any trace chloramphenicol
killing a small number of wildtype and causing the differences in seen in Figure 4.12A-B,
as any residual antibiotic would have been present in crtY::TnMariner washed cells as
well and would have thus produced the same impact in Figure 4.12C-D. Again, as stated
above polar effects could impact these results.
We also examined if colonization was impacted in a particular area of the plant,
as it is known that carotenoids help to protect from UV damage (Jacobs et al., 2005).
Because of this, we hypothesized that crtB::TnMariner mutant would have reduced
colonization of the leaves compared to the wildtype or crtY::TnMariner because
pigmentation protects from UV. We hypothesized that the roots would not show large
differences in colonization. It should be noted, that as Yoshida agar is translucent, roots
would be more exposed to light than if they were in the soil. However, in the competition
between wildtype and crtB::TnMariner in Figure 4.13A-B leaf colonization was
significantly higher in the no nitrogen added condition while roots colonization was
significantly higher in standard Yoshida condition. This demonstrated no clear pattern in
differential colonization of plant above- and below-ground organs across nutrient
condition. Further, crtY::TnMariner did not colonize differently than the wildtype in
roots or leaves at either nutrient condition (Figure 4.13C-D).
192
We examined the microbial synthetic community utilized in Chapter 3 to see if
crtB::TnMariner and crtY::TnMariner could produce the same synthetic community
patterns seen in at 2 weeks and 4 weeks with wildtype. In wildtype, Pantoea sp. R4 is the
main colonizer at 2 weeks, but at 4 weeks Arthrobacter sp. R85 is the main colonizer,
with Pantoea sp. R4 decreasing in colonization (Chapter 3). At 2 weeks, both
crtB::TnMariner and crtY::TnMariner establish as the main colonizer, behaving
similarly to the wildtype synthetic community (Figure 4.14). Viable counts of each
mutant and wildtype within their respective communities did not reveal a significant
difference in colonization at either 2 weeks or 4 weeks (Figure 4.15). At 4 weeks, both
mutant communities show an increased colonization of Arthrobacter sp. R85, similarly to
that of wildtype synthetic community (Figure 4.15). Williamsia sp. R60 also increased
from 2 to 4 weeks, although this result was not repeatable in the wildtype synthetic
community in Chapter 3.
Discussion
Next steps for RB-TnSeq troubleshooting
While significant troubleshooting was performed to attempt to generate an RB-
TnSeq library, we failed to sequence the library effectively. RB-TnSeq is a new method
and thus exact method details can be difficult to ascertain. In a study that attempted to
generate RB-TnSeq libraries for over 100 different bacteria, only 32 were successful
emphasizing the difficulty of generating a successful RB-TnSeq library (Price et al.,
2018). This is further confounded by the inability to test how well each step within the
procedure is functioning. Sonication and size selection were tested and applied
appropriately to select for the correct sized fragments (Figure 4.4A-B). Further
193
enrichment of the transposon appears to work based on the correct size amplified
fragment on a gel (Figure 4.4C). Similarly, prior to sequencing, the bioanalyzer estimated
the average size of the fragments to be 385 base pairs, consistent with previously
sequenced results where the average size was 380 (Morin et al., 2018). This is further
supporting evidence that sonication, size selection, and transposon enrichment worked. A
multitude of reasons for the sequencing failure have been posited, and many can be
eliminated based on the results provided above. One of the most likely reasons for
sequencing runs to fail is the sequencing of primer dimer rather than full reads. As
smaller reads bind to flow cells better, this causes primer dimers to be preferentially
sequenced and the run to decrease in quality. Facility scientists at Illumina have
suggested that the sequencing run was likely primer dimer. However, Pippin prep
removes primer dimer, as the size would be under 200 base pairs and thus primer dimer
cannot be the cause of this sequencing problem. We are confident that Pippin prep is
functioning correctly for two reasons. The first being that while cleaning with magnetic
beads allows for small amounts of small sizes of DNA to remain, Pippin Prep functions
using gel electrophoresis to pipette highly accurate size ranges, thus making the
likelihood of primer dimer remaining to be very small. Second, the bioanalyzer results
post Pippin Prep did not detect a size range that would have been evident of primer
dimer. Another possibility that was suggested is that the mating was done incorrectly so
that few mutants were produced, and these then resulted in the small number of mutants
sequenced. However, if this were the case the sequencing run would have worked
because it would have sequenced the whole region rather than only to 100 base pairs.
194
Also, to propagate the plasmid, the pir gene is needed (Price et al., 2018). We have
confirmed Pantoea sp. R4 does not have this gene, and thus should not be able to
propagate the plasmid and cause problematic multiple insertions. RB-TnSeq is designed
to remove the possibility of multiple inserts into an organism as well, so it is not likely
that incorrect insertions were the cause of this sequencing run (Wetmore et al., 2015). We
hypothesize that the denaturing step directly prior to sequencing, where the DNA is
separated into single strands, might demonstrate that we have incorrect fragments (Figure
4.5B). However, we are not sure what would have caused the fragmentation. Ultimately
the cause of RB-TnSeq run for Pantoea sp. R4 is unknown and must be troubleshot
further.
Carotenoid mutant analysis
We chose to investigate the crt gene cluster in Pantoea sp. R4 because previous
studies of Pantoea spp. have found it implicated in plant colonization (Bible et al., 2016).
Because we have screened 6,000 mutants, we have likely found mutants for the essential
genes involved with carotenoid expression (Table 4.3, Figure 4.8). However, it is
possible that pigmentation production occurs within disruption later in the gene cluster
and just we did not isolate a mutant from that gene. Since these mutants were screened
visually instead of with a chemical extraction of the carotenoid, there were likely mutants
that were missed that have produced a similarly pigmented colony to wildtype but had
slight variances in chemical composition of their carotenoid pigment. This would explain
the failure to isolate mutants containing insertions within crtX as the role of crtX is to
limit the amount of zeaxanthin byproducts rather than a direct involvement in zeaxanthin
195
production (Sedkova et al., 2005). Because the zeaxanthin carotenoid is still produced
within mutants containing insertions in crtX, these mutants would produce similar colony
pigmentation as that of wildtype. While we have found the gene idi in our carotenoid
gene cluster, is not conserved in all gene clusters and is not considered essential for
zeaxanthin production (Sedkova et al., 2005). The gene idi has been shown to be
involved in increased production of the carotenoid of E. coli through increasing the
production of the precursors IPP and DMAPP in the rate limiting step in the isoprenoid
pathway (Figure 4.1, Sedkova et al., 2005). Interestingly, while it has been shown to
increase the pigment production within E. coli, the presence of idi does not increase the
pigmentation of the Pantoea strains that contain it when compared to those that do not
(Sedkova et al., 2005). Thus, a mutant with an insertion in idi would likely not be picked
up in our visual screen either.
There were four genes outside the crt gene cluster that, when disrupted by an
insertion, resulted in non-pigmented mutants, and one which consistently generated a
light yellow mutant (Table 4.3). We investigated the function of these genes to examine
any alternative pigmentation genes, as well as find explanations for why these genes
would influence pigmentation production. One gene, octaprenyl-diphosphate synthase,
has been previously involved in the isoprenoid biosynthesis. Deletion of octaprenyl
diphosphate synthases can cause non-pigmented mutants in Corynebacterium glutamicum
(Hayashi et al., 2007; Heider et al., 2014). An insertion into a gene for malate
dehydrogenase also created a non-pigmented mutant. Malate dehydrogenases, which
generally covert malate to oxaloacetate, are involved in a variety of pathways and
196
although more studied in eukaryotes are also commonly found in prokaryotes
(Takahashi-Íñiguez et al., 2016). Within plants when malate dehydrogenase genes are
deleted, seedlings have significantly lower level of carotenoid production including beta-
carotene (Schreier et al., 2018). As beta-carotene is a precursor to zeaxanthin, it is
possible that the malate dehydrogenase gene was performing a similar function in
Pantoea sp. R4, and thus the insertion caused a reduction in carotenoid production. We
also found a non-pigmented mutant with an insertion in a fructose-1,6-bisphosphatase I
gene. Knockouts of fructose-1,6-bisphosphatase I in plants can cause a significant
reduction in carotenoid production (Rojas-González et al., 2015). Thus, many insertions
not in the carotenoid gene cluster can be explained by previous literature.
However, not all mutants with insertions not in the crt gene cluster could be
explained by previous literature on similarly characterized genes. Long-chain acyl-CoA
synthetases for example convert long chain fatty acids into various isoforms of acetyl-
CoA and exist within a variety of regulatory pathways (Grevengoed et al., 2014). A
literature search did not reveal any previous studies of insertions into these genes that
generated a non-pigmented mutant. Many of these genes can be involved in membrane
stability, and ΔcrtB mutant in the carotenoid gene cluster can change membrane stability
by increasing the amount of unsaturated fatty acids in membranes in Pantoea spp.
(Kumar et al., 2019). As there is a clear relationship between the carotenoid gene cluster
and membrane stability, it is possible that the mutant with the insertion in this gene is an
indication of a similar link in Pantoea sp. R4 between carotenoids and membrane
stability.
197
Competition assays with carotenoid mutants
Overall it appears that competition assays did not reveal large colonization
differences between the crtY::TnMariner or crtB::TnMariner mutants when compared to
wildtype across nutrient condition (regular Yoshida and no nitrogen added), time points
(4 days and 4 weeks), area of the plant (leaves and roots) or the presence of the total
synthetic community (Figure 4.12, 4.13, 4.14). Further, within drop out community
experiments, microbe-microbe interactions do not appear to be impacted by the lack of
carotenoid production or the reduction of carotenoid production in crtB::TnMariner and
crtY::TnMariner respectively (Figure 4.14, 4.15). This result is not surprising, given that
the synthetic community was specifically selected to reduce negative microbe-microbe
interactions within the plant. Further while crtY::TnMariner had increased levels of
biofilm and auxin production, while crtB::TnMariner did not (Figure 4.11). This is
inconsistent with previous examinations of carotenoid production in Pantoea spp., where
biofilm and auxin production are decreased (Bible et al., 2016).
While there are numerous ways to test colonization in these mutants, likely our
results demonstrate that there is minimal impact of the loss of carotenoid production
during plant colonization. This is not consistent with previous studies of Pantoea spp.
where research demonstrated that removal of the crtB gene reduced colonization and
virulence (Bible et al., 2016; Mohammadi et al., 2012). However, colonization
differences between the mutant and the wildtype studied in Bible et al., 2016 were small.
In a comparison of pairwise average nucleotide identity (ANI) between the strain used in
Bible et al., 2016, known as Pantoea sp. YR343 and Pantoea sp. R4, analysis revealed
that their ANI was below the threshold for genus classification. This suggests that these
198
strains are distinct enough that the differences when examining the crt gene cluster are
expected, and might explain why there was not a significant decrease in colonization in
crtB::TnMariner. Further, there are still more experiments to preform using the mutants
generated here. For example, it is possible that in high light conditions UV stress will
cause higher colonization of wildtype than mutants, and if there is further interest in the
impact of carotenoid production in Pantoea sp. R4 the mutants generated and
characterized here will allow for ease of future experiments.
Potassium mutant experiments
We isolated one mutant that is deficient in potassium solubilization. However, the
insertion is not within a gene, and the nearby gene cannot be directly linked to potassium
solubilization, so is possible that a null mutant of this gene might not produce the desired
phenotype (an organism that cannot solubilize potassium). While the insertion could be
within the 3’ UTR, it is also possible that this mutant will prove difficult to ascertain the
relationship to potassium solubilization. It could also be a random mutation in K-
:TnMariner that is causing the organism to be deficient in potassium solubilization
instead of the insertion we identified. With the current knowledge we have, we do not
have enough evidence to suggest that the transposon insertion is what caused the
phenotype. Further, we were not able to find evidence of plant recruitment when
measuring colonization of wildtype and the mutant deficient in potassium solubilization
(Figure 4.10) to demonstrate the “Cry for Help Hypothesis”. We had hypothesized that
the plant could be recruiting microbes when under potassium stress by exuding
compounds through root exudate and that these compounds would cause increased
199
colonization of microbes that could solubilize potassium. To accept this hypothesis, we
would need to have seen increased colonization of wildtype when compared to that of the
potassium mutant when plants were grown in 100% insoluble potassium, but not when
plants were grown in 100% soluble potassium. Further, this difference would only have
been observed when the plant was present, as colonization of the media should be the
same between the mutant and the wildtype. While we cannot identify conclusively if a
gene is impacted by K-::TnMariner, the mutant can still be used to further investigate
potassium solubilization and how it might impact microbial colonization of a plant.
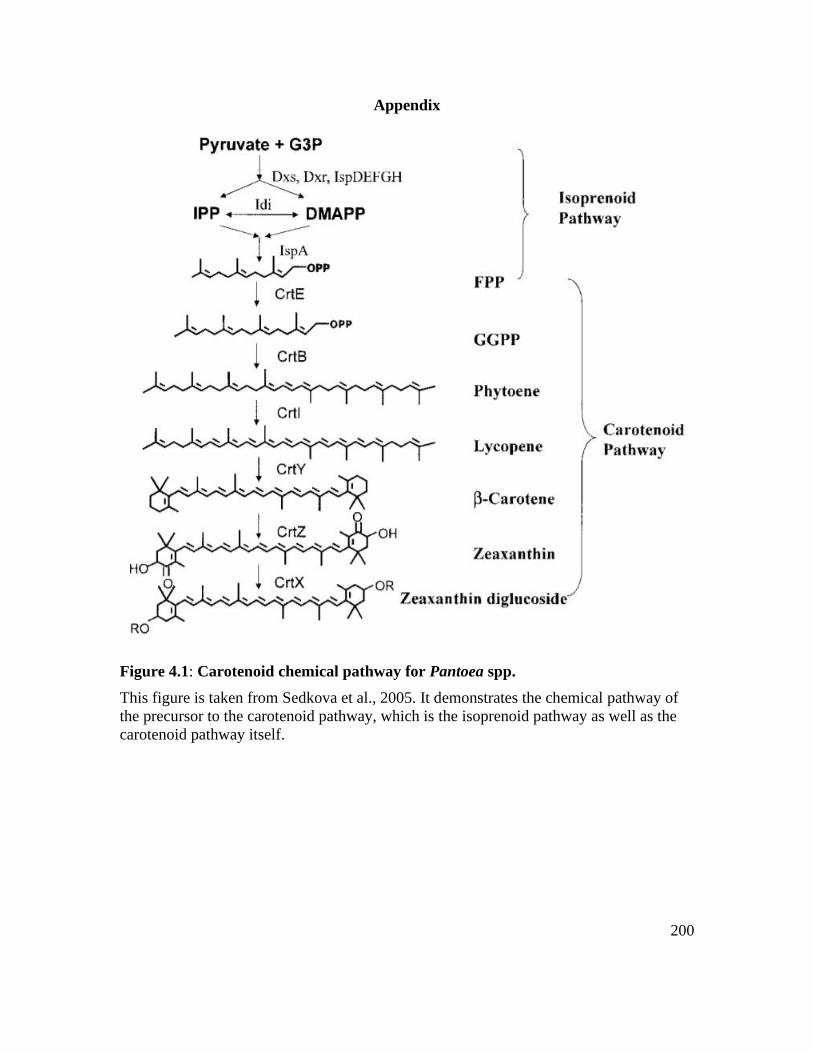
200
Appendix
Figure 4.1: Carotenoid chemical pathway for Pantoea spp.
This figure is taken from Sedkova et al., 2005. It demonstrates the chemical pathway of
the precursor to the carotenoid pathway, which is the isoprenoid pathway as well as the
carotenoid pathway itself.
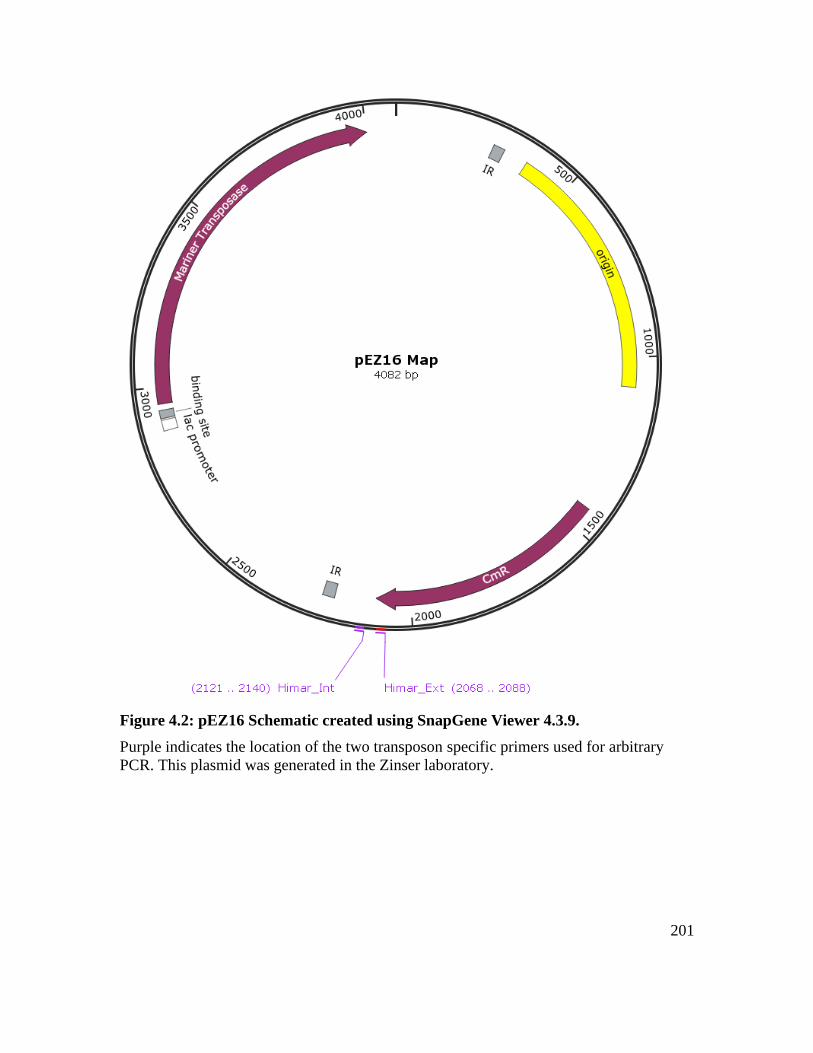
201
Figure 4.2: pEZ16 Schematic created using SnapGene Viewer 4.3.9.
Purple indicates the location of the two transposon specific primers used for arbitrary
PCR. This plasmid was generated in the Zinser laboratory.
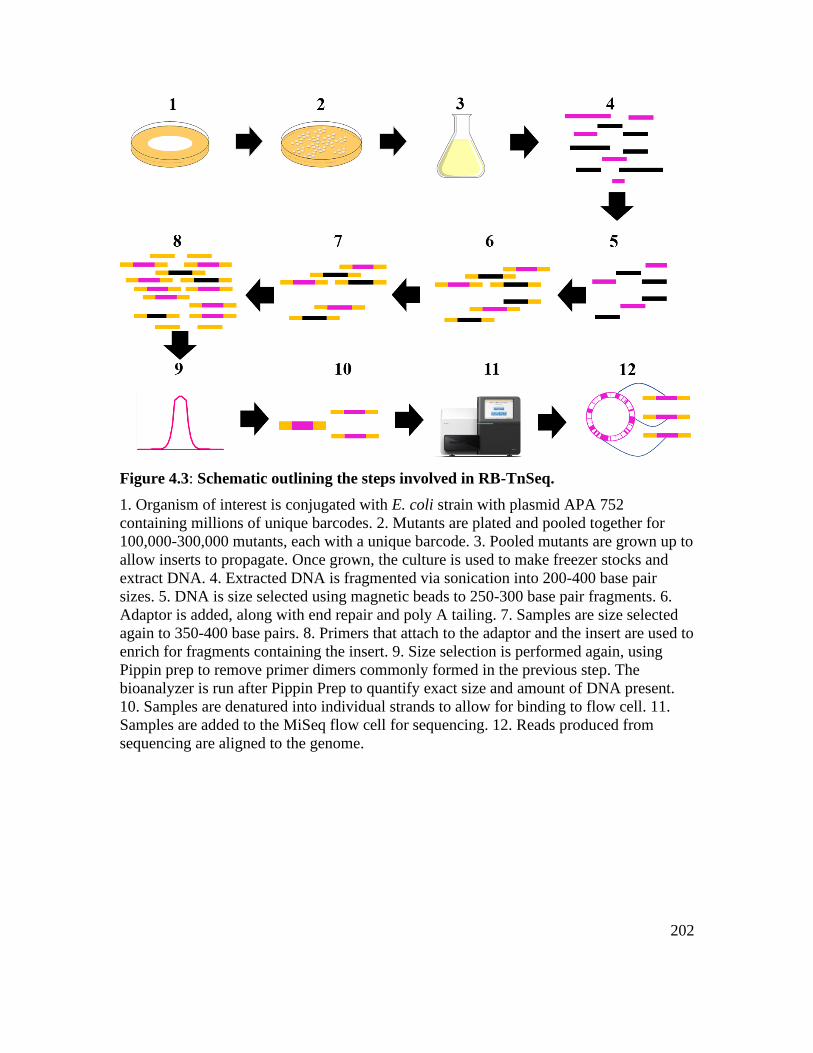
202
Figure 4.3: Schematic outlining the steps involved in RB-TnSeq.
1. Organism of interest is conjugated with E. coli strain with plasmid APA 752
containing millions of unique barcodes. 2. Mutants are plated and pooled together for
100,000-300,000 mutants, each with a unique barcode. 3. Pooled mutants are grown up to
allow inserts to propagate. Once grown, the culture is used to make freezer stocks and
extract DNA. 4. Extracted DNA is fragmented via sonication into 200-400 base pair
sizes. 5. DNA is size selected using magnetic beads to 250-300 base pair fragments. 6.
Adaptor is added, along with end repair and poly A tailing. 7. Samples are size selected
again to 350-400 base pairs. 8. Primers that attach to the adaptor and the insert are used to
enrich for fragments containing the insert. 9. Size selection is performed again, using
Pippin prep to remove primer dimers commonly formed in the previous step. The
bioanalyzer is run after Pippin Prep to quantify exact size and amount of DNA present.
10. Samples are denatured into individual strands to allow for binding to flow cell. 11.
Samples are added to the MiSeq flow cell for sequencing. 12. Reads produced from
sequencing are aligned to the genome.
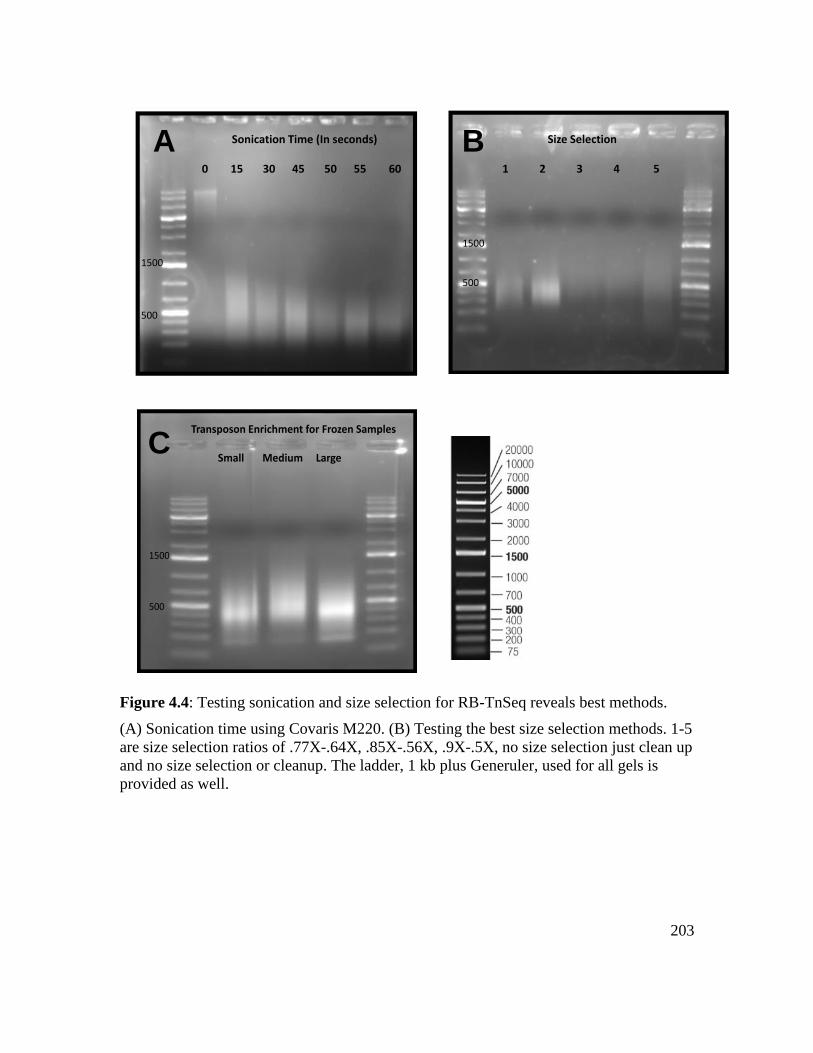
203
Sonication Time (In seconds)
0 15 30 45 50 55 60
1500
500
Size Selection
1 2 3 4 5
1500
500
Transposon Enrichment for Frozen Samples
Small Medium Large
1500
500
A B
C
Figure 4.4: Testing sonication and size selection for RB-TnSeq reveals best methods.
(A) Sonication time using Covaris M220. (B) Testing the best size selection methods. 1-5
are size selection ratios of .77X-.64X, .85X-.56X, .9X-.5X, no size selection just clean up
and no size selection or cleanup. The ladder, 1 kb plus Generuler, used for all gels is
provided as well.
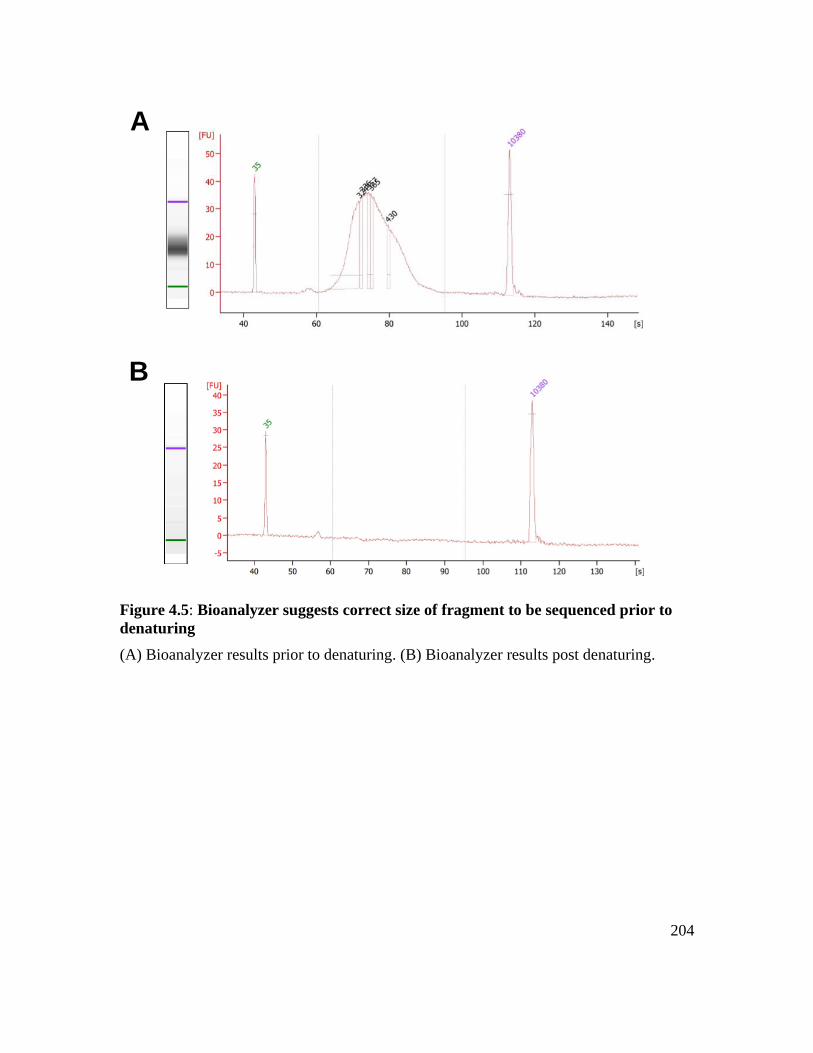
204
A
B
Figure 4.5: Bioanalyzer suggests correct size of fragment to be sequenced prior to
denaturing
(A) Bioanalyzer results prior to denaturing. (B) Bioanalyzer results post denaturing.
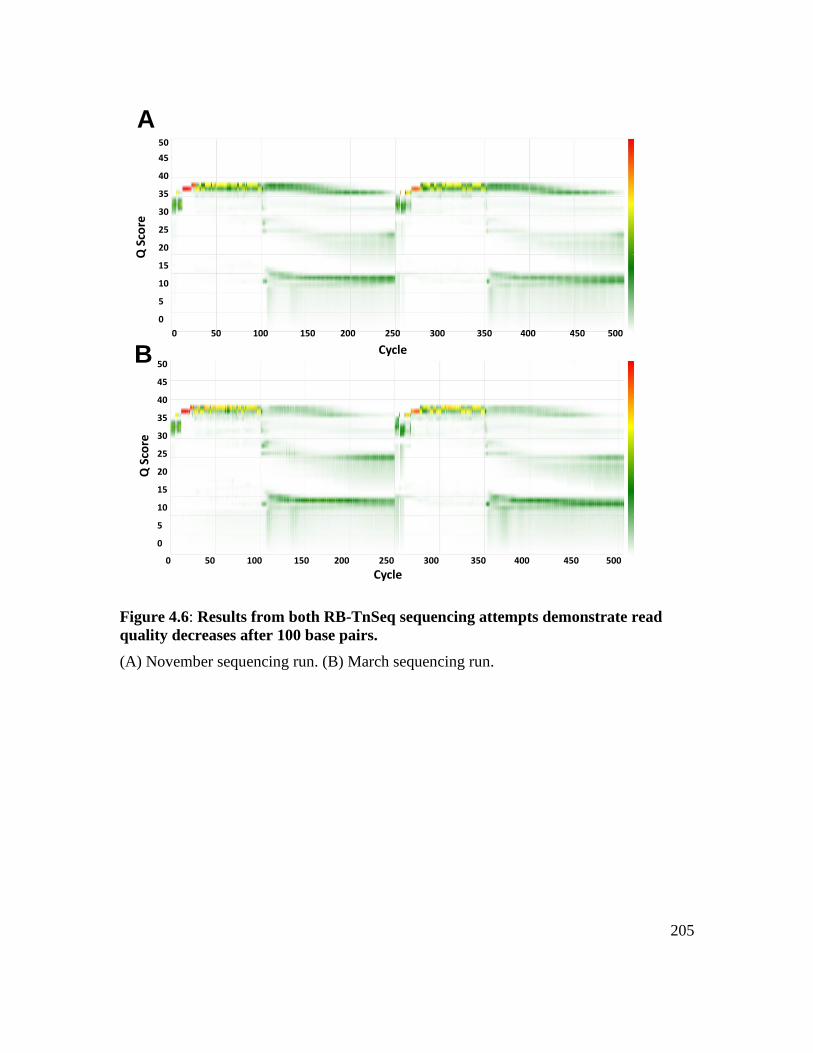
205
A
B
50
45
40
35
30
25
20
15
10
5
0
QSc
ore
0 50 100 150 200 250 300 350 400 450 500
0 50 100 150 200 250 300 350 400 450 500
50
45
40
35
30
25
20
15
10
5
0
QSc
ore
Cycle
Cycle
Figure 4.6: Results from both RB-TnSeq sequencing attempts demonstrate read
quality decreases after 100 base pairs.
(A) November sequencing run. (B) March sequencing run.
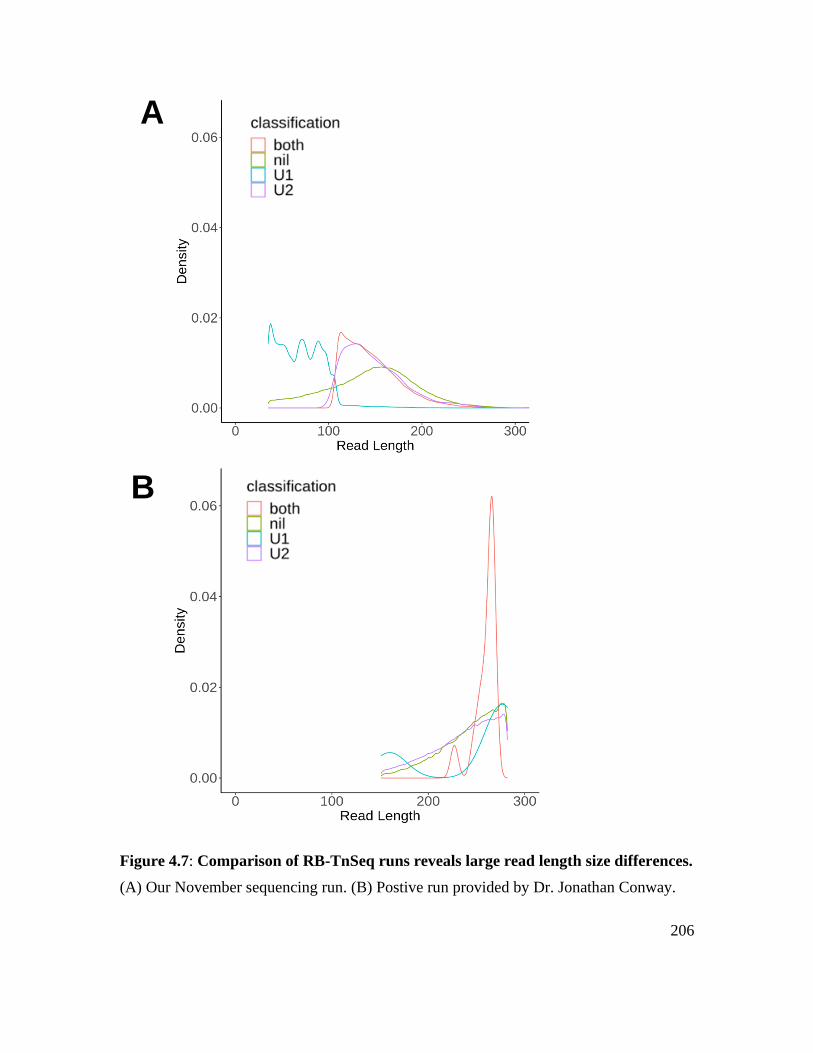
206
A
B
Figure 4.7: Comparison of RB-TnSeq runs reveals large read length size differences.
(A) Our November sequencing run. (B) Postive run provided by Dr. Jonathan Conway.
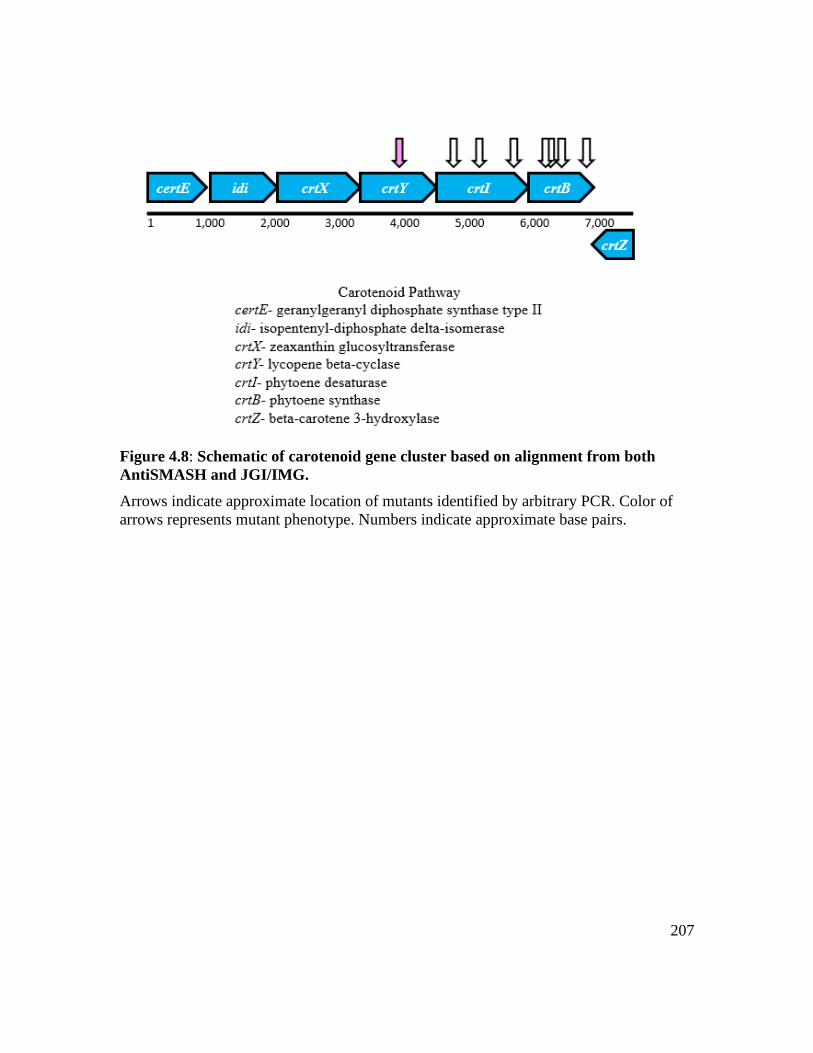
207
Figure 4.8: Schematic of carotenoid gene cluster based on alignment from both
AntiSMASH and JGI/IMG.
Arrows indicate approximate location of mutants identified by arbitrary PCR. Color of
arrows represents mutant phenotype. Numbers indicate approximate base pairs.
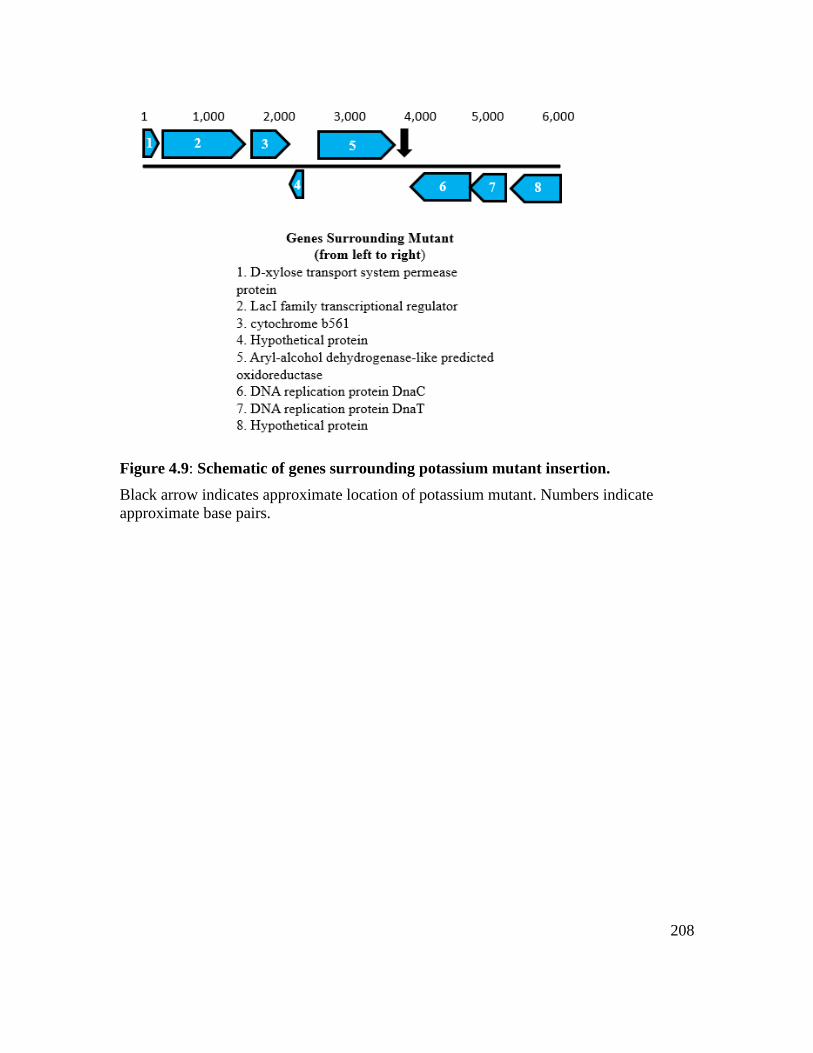
208
Figure 4.9: Schematic of genes surrounding potassium mutant insertion.
Black arrow indicates approximate location of potassium mutant. Numbers indicate
approximate base pairs.
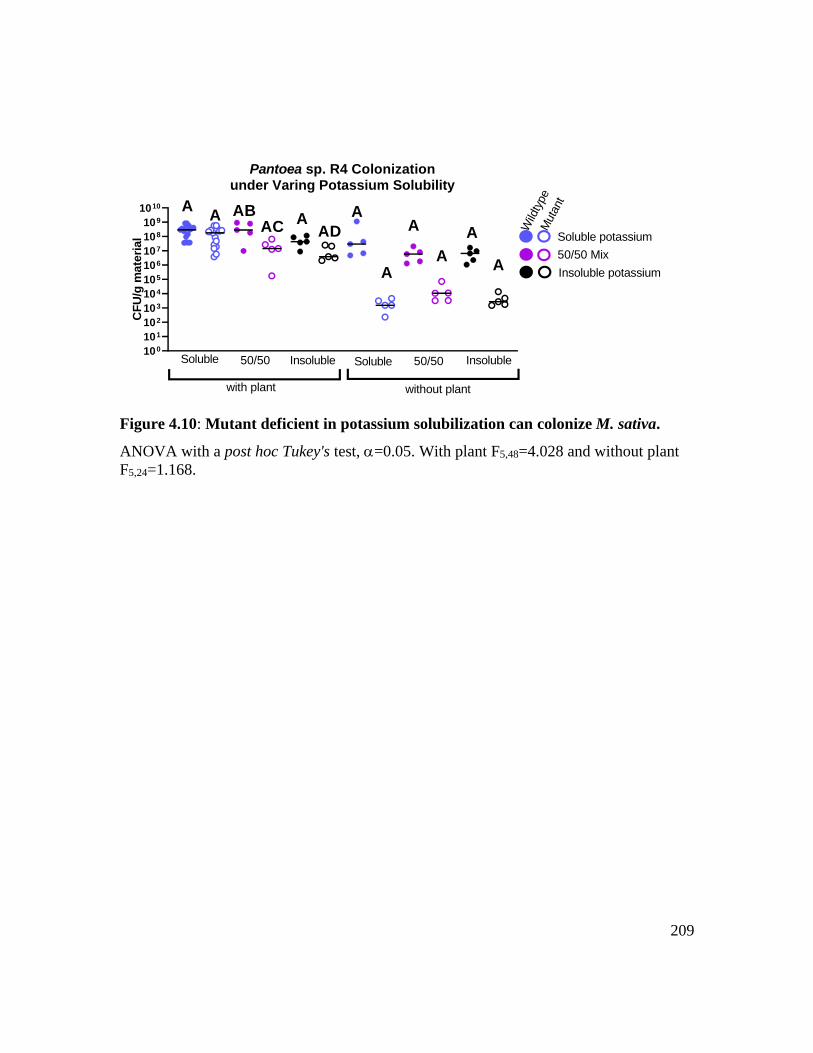
209
100
101
102
103
104
105
106
107
108
109
1010
Pantoea sp. R4 Colonizationunder Varing Potassium Solubility
CF
U/g
mate
rial
Insoluble Insoluble50/50 50/50Soluble Soluble
with plant without plant
Soluble potassium
50/50 Mix
Insoluble potassium
Wild
type
Muta
nt
A
A
A
A
A
A
AA AB
ACA
AD
Figure 4.10: Mutant deficient in potassium solubilization can colonize M. sativa.
ANOVA with a post hoc Tukey's test, =0.05. With plant F5,48=4.028 and without plant
F5,24=1.168.
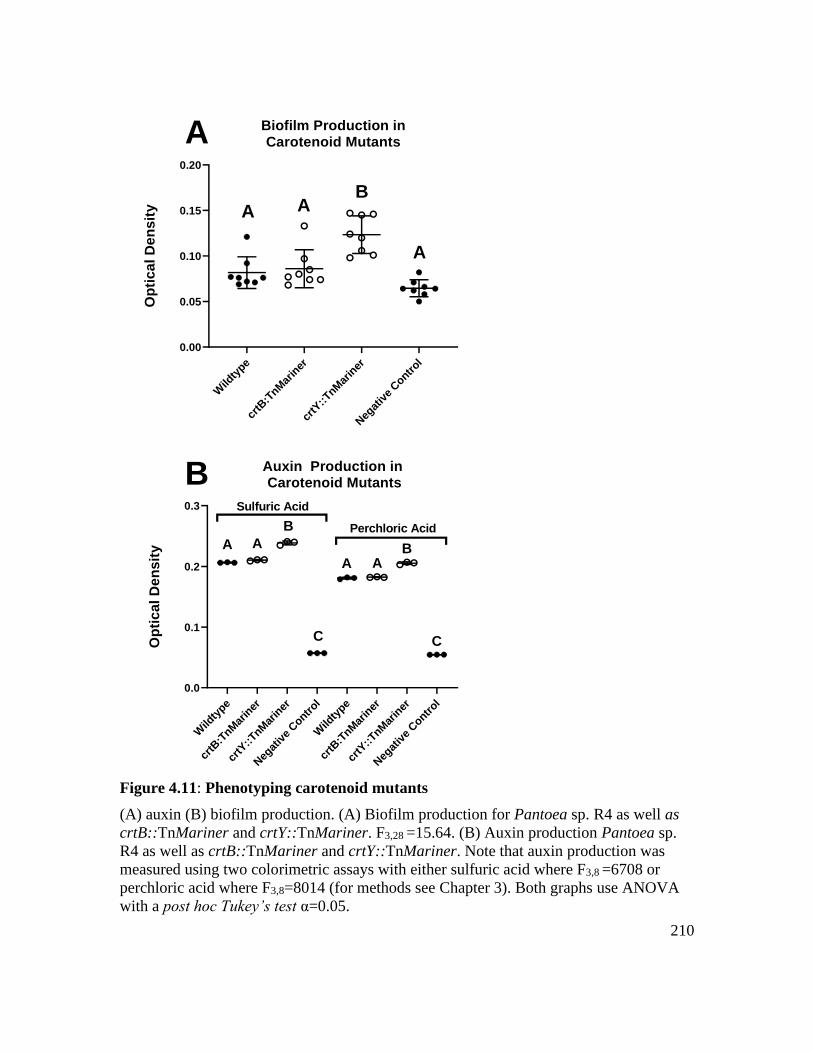
210
Wild
type
crtB
:TnM
arin
er
crtY
::TnM
arin
er
Neg
ativ
e Contr
ol
0.00
0.05
0.10
0.15
0.20
Biofilm Production inCarotenoid Mutants
Op
tic
al
De
ns
ity A A
A
B
Wild
type
crtB
:TnM
arin
er
crtY
::TnM
arin
er
Neg
ativ
e Contr
ol
Wild
type
crtB
:TnM
arin
er
crtY
::TnM
arin
er
Neg
ativ
e Contr
ol
0.0
0.1
0.2
0.3
Auxin Production in Carotenoid Mutants
Op
tic
al
De
ns
ity
Sulfuric Acid
Perchloric Acid
A A
B
C
A A
C
B
A
B
Figure 4.11: Phenotyping carotenoid mutants
(A) auxin (B) biofilm production. (A) Biofilm production for Pantoea sp. R4 as well as
crtB::TnMariner and crtY::TnMariner. F3,28 =15.64. (B) Auxin production Pantoea sp.
R4 as well as crtB::TnMariner and crtY::TnMariner. Note that auxin production was
measured using two colorimetric assays with either sulfuric acid where F3,8 =6708 or
perchloric acid where F3,8=8014 (for methods see Chapter 3). Both graphs use ANOVA
with a post hoc Tukey’s test α=0.05.
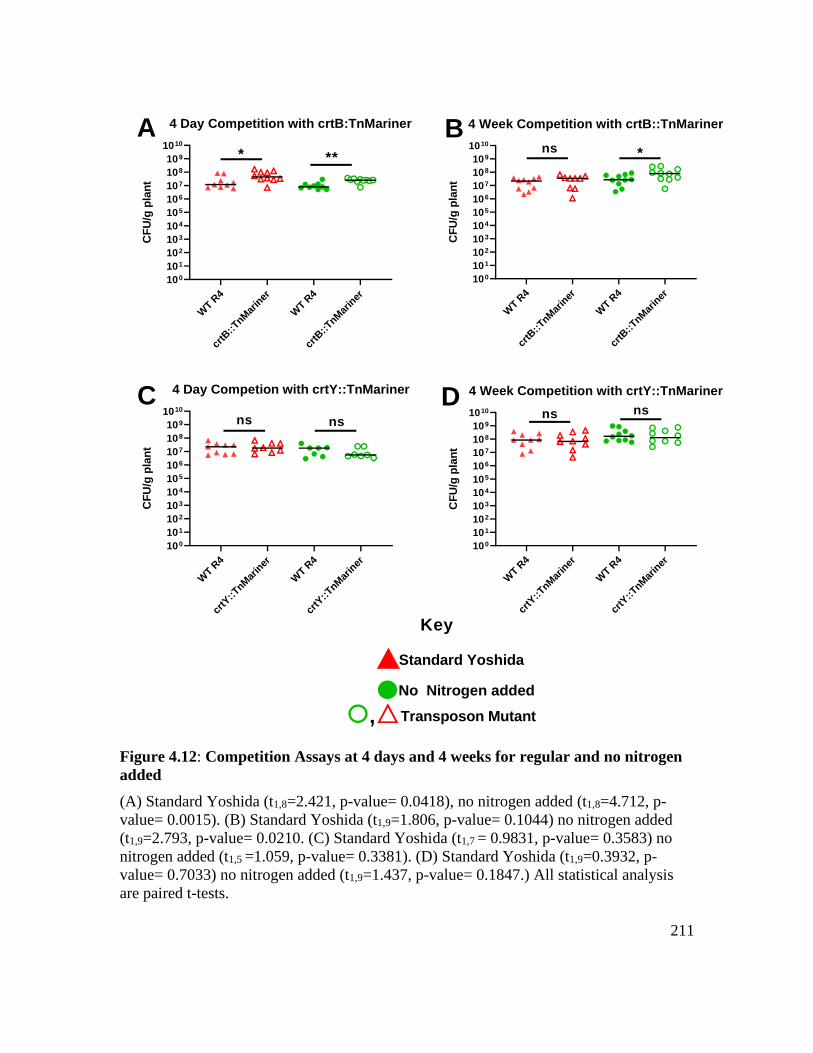
211
WT R
4
crtB
::TnM
arin
er
WT R
4
crtB
::TnM
arin
er
100
101
102
103
104
105
106
107
108
109
1010
4 Day Competition with crtB:TnMariner
CF
U/g
pla
nt
* **
WT R
4
crtY
::TnM
arin
er
WT R
4
crtY
::TnM
arin
er
100
101
102
103
104
105
106
107
108
109
1010
4 Day Competion with crtY::TnMariner
CF
U/g
pla
nt
ns ns
WT R
4
crtB
::TnM
arin
er
WT R
4
crtB
::TnM
arin
er
100
101
102
103
104
105
106
107
108
109
1010
4 Week Competition with crtB::TnMariner
CF
U/g
pla
nt
ns *
WT R
4
crtY
::TnM
arin
er
WT R
4
crtY
::TnM
arin
er
100
101
102
103
104
105
106
107
108
109
1010
4 Week Competition with crtY::TnMariner
CF
U/g
pla
nt
ns ns
A B
C D
Key
Standard Yoshida
No Nitrogen added
Transposon Mutant,
Figure 4.12: Competition Assays at 4 days and 4 weeks for regular and no nitrogen
added
(A) Standard Yoshida (t1,8=2.421, p-value= 0.0418), no nitrogen added (t1,8=4.712, p-
value= 0.0015). (B) Standard Yoshida (t1,9=1.806, p-value= 0.1044) no nitrogen added
(t1,9=2.793, p-value= 0.0210. (C) Standard Yoshida (t1,7 = 0.9831, p-value= 0.3583) no
nitrogen added (t1,5 =1.059, p-value= 0.3381). (D) Standard Yoshida (t1,9=0.3932, p-
value= 0.7033) no nitrogen added (t1,9=1.437, p-value= 0.1847.) All statistical analysis
are paired t-tests.
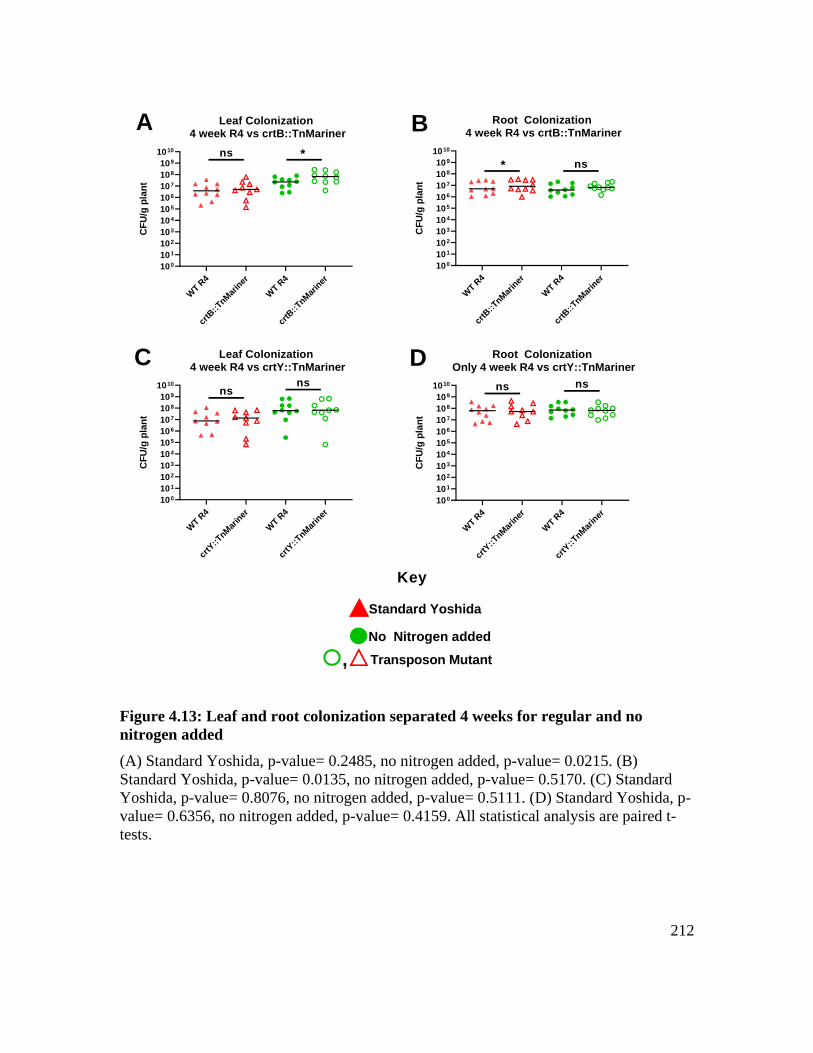
212
WT R
4
crtB
::TnM
arin
er
WT R
4
crtB
::TnM
arin
er
100
101
102
103
104
105
106
107
108
109
1010
Leaf Colonization 4 week R4 vs crtB::TnMariner
CF
U/g
pla
nt
ns *
WT R
4
crtB
::TnM
arin
er
WT R
4
crtB
::TnM
arin
er
100
101
102
103
104
105
106
107
108
109
1010
Root Colonization 4 week R4 vs crtB::TnMariner
CF
U/g
pla
nt
* ns
WT R
4
crtY
::TnM
arin
er
WT R
4
crtY
::TnM
arin
er
100
101
102
103
104
105
106
107
108
109
1010
Leaf Colonization 4 week R4 vs crtY::TnMariner
CF
U/g
pla
nt
nsns
WT R
4
crtY
::TnM
arin
er
WT R
4
crtY
::TnM
arin
er
100
101
102
103
104
105
106
107
108
109
1010
Root Colonization Only 4 week R4 vs crtY::TnMariner
CF
U/g
pla
nt
ns ns
A
C
B
D
Key
Standard Yoshida
No Nitrogen added
Transposon Mutant,
Figure 4.13: Leaf and root colonization separated 4 weeks for regular and no
nitrogen added
(A) Standard Yoshida, p-value= 0.2485, no nitrogen added, p-value= 0.0215. (B)
Standard Yoshida, p-value= 0.0135, no nitrogen added, p-value= 0.5170. (C) Standard
Yoshida, p-value= 0.8076, no nitrogen added, p-value= 0.5111. (D) Standard Yoshida, p-
value= 0.6356, no nitrogen added, p-value= 0.4159. All statistical analysis are paired t-
tests.
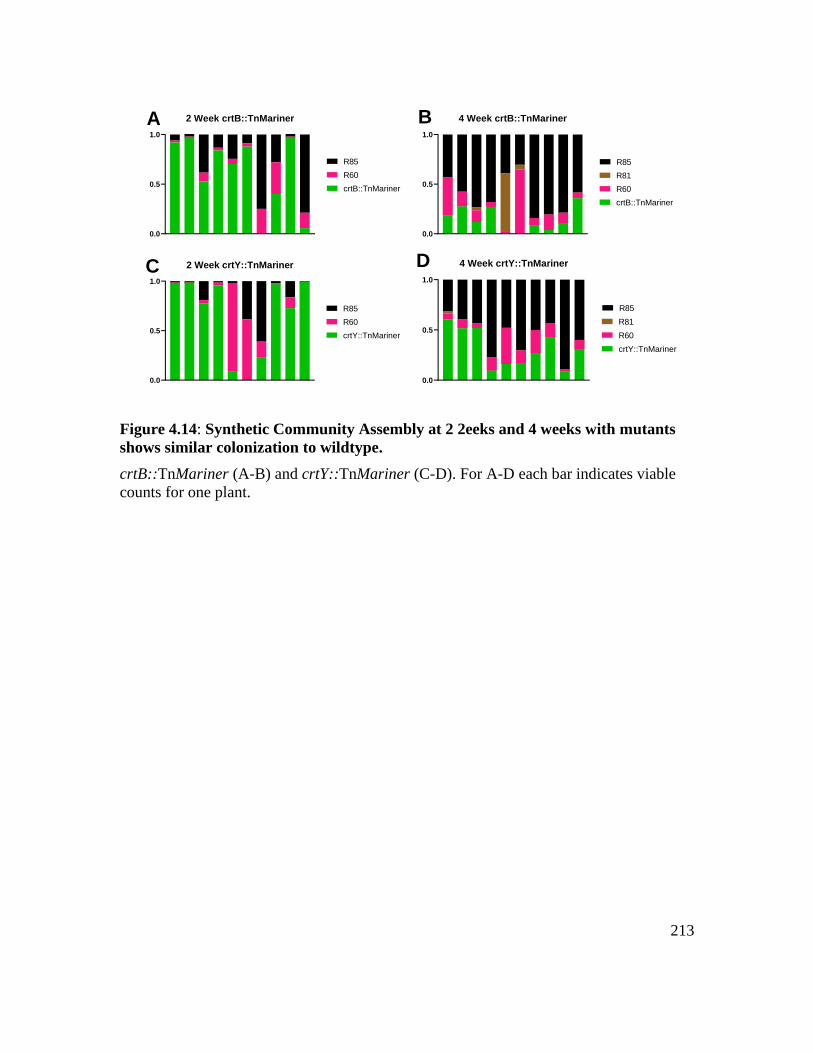
213
0.0
0.5
1.0
2 Week crtB::TnMariner
crtB::TnMariner
R60
R85
0.0
0.5
1.0
4 Week crtB::TnMariner
crtB::TnMariner
R60
R81
R85
0.0
0.5
1.0
2 Week crtY::TnMariner
crtY::TnMariner
R60
R85
0.0
0.5
1.0
4 Week crtY::TnMariner
crtY::TnMariner
R60
R81
R85
A B
C D
Figure 4.14: Synthetic Community Assembly at 2 2eeks and 4 weeks with mutants
shows similar colonization to wildtype.
crtB::TnMariner (A-B) and crtY::TnMariner (C-D). For A-D each bar indicates viable
counts for one plant.
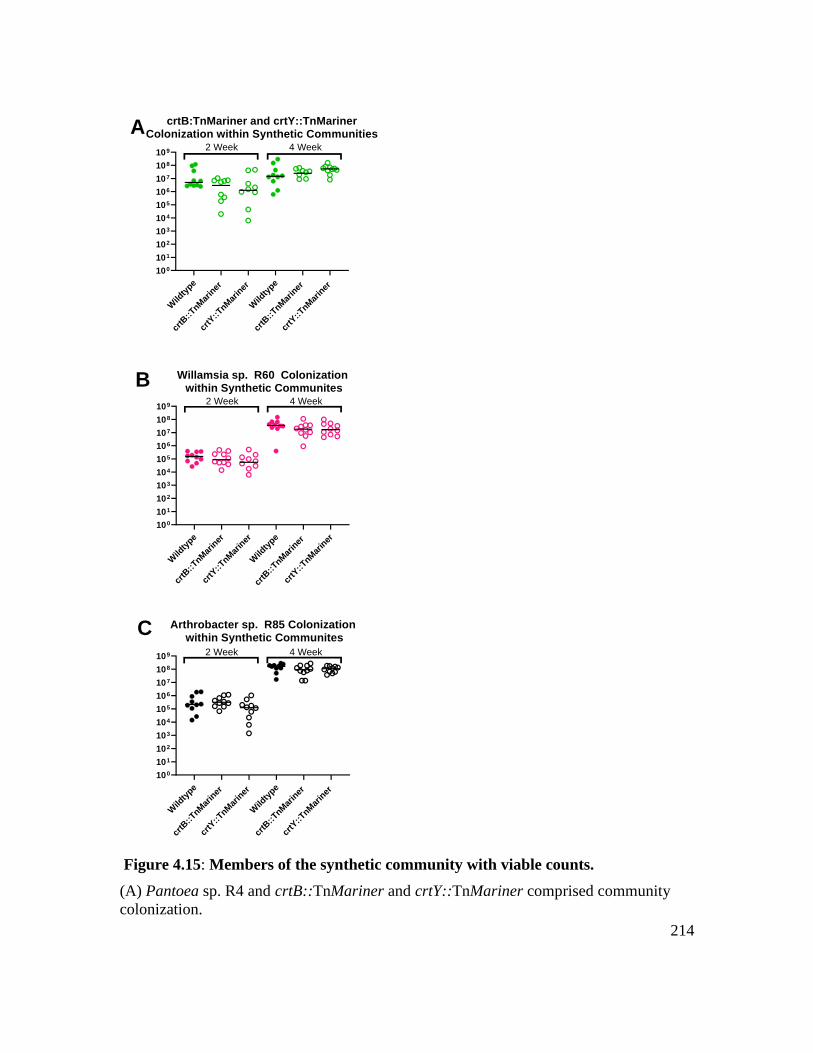
214
Wild
type
crtB
::TnM
arin
er
crtY
::TnM
arin
er
Wild
type
crtB
::TnM
arin
er
crtY
::TnM
arin
er
100
101
102
103
104
105
106
107
108
109
crtB:TnMariner and crtY::TnMarinerColonization within Synthetic Communities
2 Week 4 Week
Wild
type
crtB
::TnM
arin
er
crtY
::TnM
arin
er
Wild
type
crtB
::TnM
arin
er
crtY
::TnM
arin
er
100
101
102
103
104
105
106
107
108
109
Willamsia sp. R60 Colonization within Synthetic Communites
2 Week 4 Week
Wild
type
crtB
::TnM
arin
er
crtY
::TnM
arin
er
Wild
type
crtB
::TnM
arin
er
crtY
::TnM
arin
er
100
101
102
103
104
105
106
107
108
109
Arthrobacter sp. R85 Colonization within Synthetic Communites
2 Week 4 Week
A
B
C
Figure 4.15: Members of the synthetic community with viable counts.
(A) Pantoea sp. R4 and crtB::TnMariner and crtY::TnMariner comprised community
colonization.
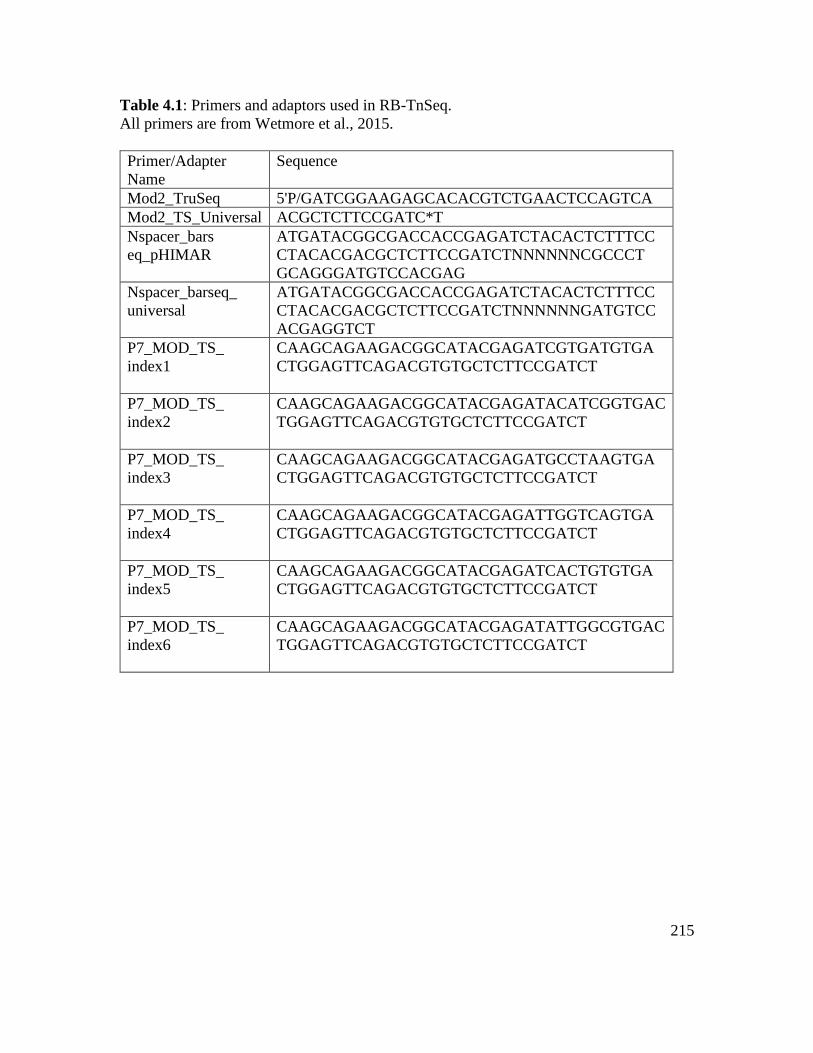
215
Table 4.1: Primers and adaptors used in RB-TnSeq.
All primers are from Wetmore et al., 2015.
Primer/Adapter
Name
Sequence
Mod2_TruSeq 5'P/GATCGGAAGAGCACACGTCTGAACTCCAGTCA
Mod2_TS_Universal ACGCTCTTCCGATC*T
Nspacer_bars
eq_pHIMAR
ATGATACGGCGACCACCGAGATCTACACTCTTTCC
CTACACGACGCTCTTCCGATCTNNNNNNCGCCCT
GCAGGGATGTCCACGAG
Nspacer_barseq_
universal
ATGATACGGCGACCACCGAGATCTACACTCTTTCC
CTACACGACGCTCTTCCGATCTNNNNNNGATGTCC
ACGAGGTCT
P7_MOD_TS_
index1
CAAGCAGAAGACGGCATACGAGATCGTGATGTGA
CTGGAGTTCAGACGTGTGCTCTTCCGATCT
P7_MOD_TS_
index2
CAAGCAGAAGACGGCATACGAGATACATCGGTGAC
TGGAGTTCAGACGTGTGCTCTTCCGATCT
P7_MOD_TS_
index3
CAAGCAGAAGACGGCATACGAGATGCCTAAGTGA
CTGGAGTTCAGACGTGTGCTCTTCCGATCT
P7_MOD_TS_
index4
CAAGCAGAAGACGGCATACGAGATTGGTCAGTGA
CTGGAGTTCAGACGTGTGCTCTTCCGATCT
P7_MOD_TS_
index5
CAAGCAGAAGACGGCATACGAGATCACTGTGTGA
CTGGAGTTCAGACGTGTGCTCTTCCGATCT
P7_MOD_TS_
index6
CAAGCAGAAGACGGCATACGAGATATTGGCGTGAC
TGGAGTTCAGACGTGTGCTCTTCCGATCT
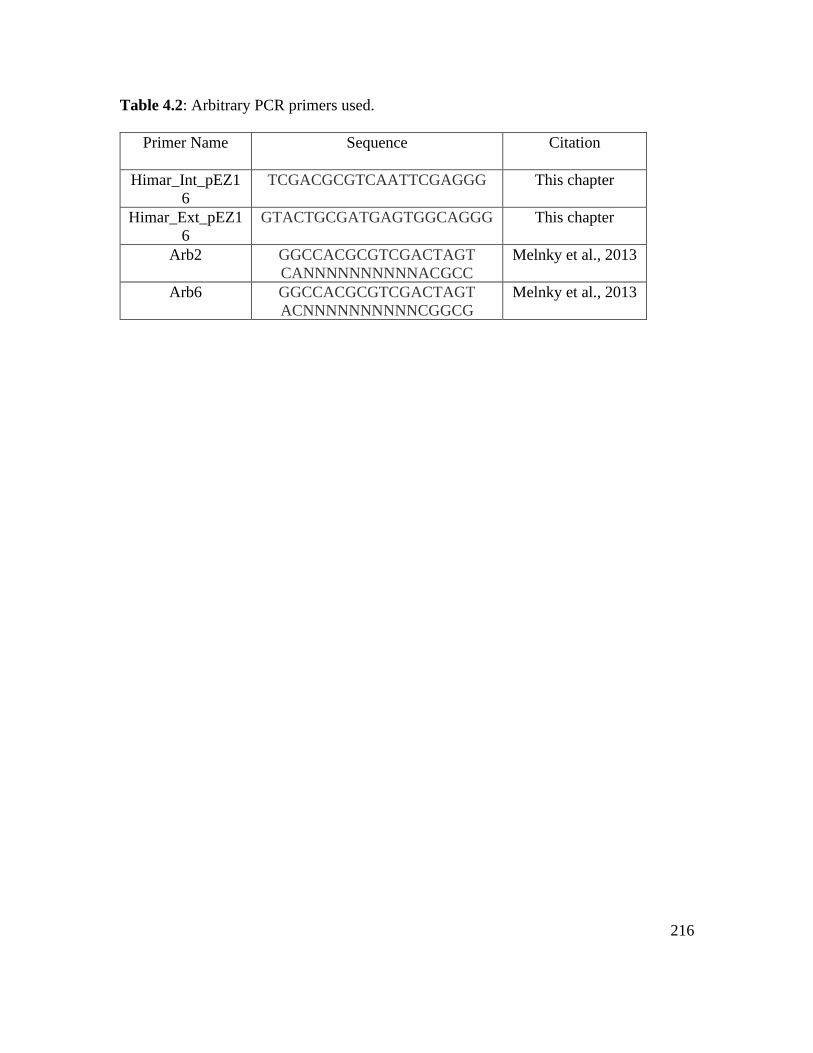
216
Table 4.2: Arbitrary PCR primers used.
Primer Name Sequence
Citation
Himar_Int_pEZ1
6
TCGACGCGTCAATTCGAGGG This chapter
Himar_Ext_pEZ1
6
GTACTGCGATGAGTGGCAGGG This chapter
Arb2 GGCCACGCGTCGACTAGT
CANNNNNNNNNNACGCC
Melnky et al., 2013
Arb6 GGCCACGCGTCGACTAGT
ACNNNNNNNNNNCGGCG
Melnky et al., 2013
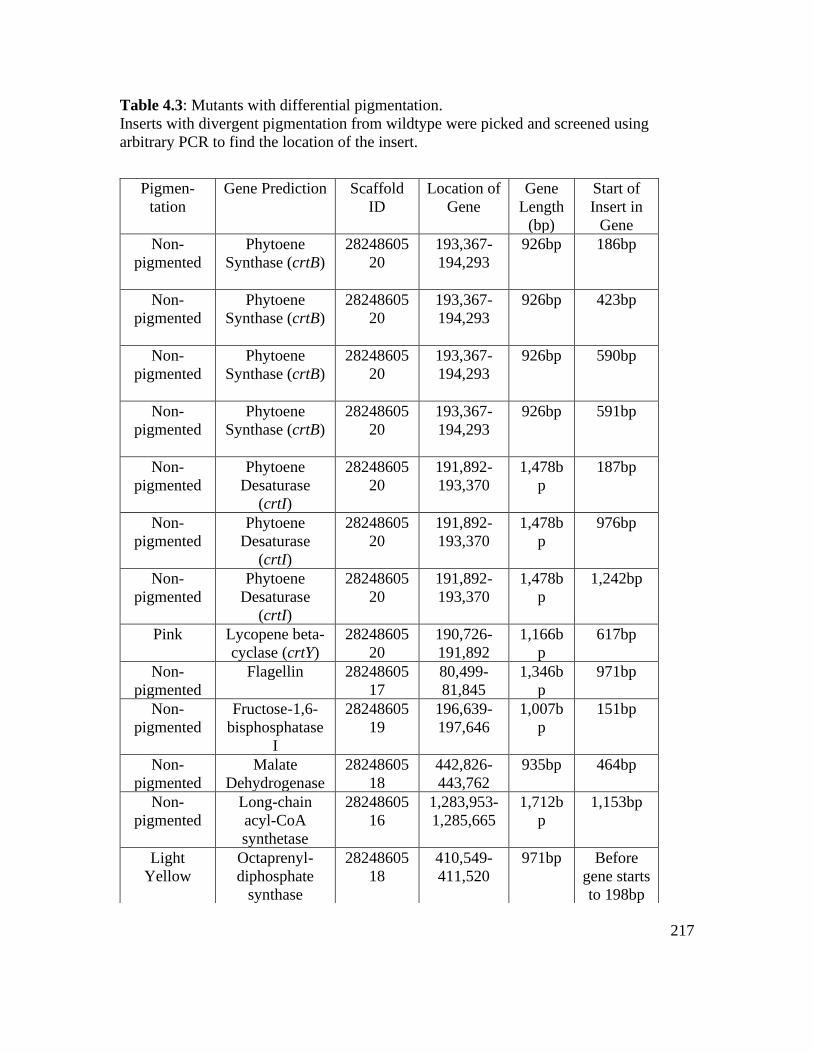
217
Table 4.3: Mutants with differential pigmentation.
Inserts with divergent pigmentation from wildtype were picked and screened using
arbitrary PCR to find the location of the insert.
Pigmen-
tation
Gene Prediction
Scaffold
ID
Location of
Gene
Gene
Length
(bp)
Start of
Insert in
Gene
Non-
pigmented
Phytoene
Synthase (crtB)
28248605
20
193,367-
194,293
926bp 186bp
Non-
pigmented
Phytoene
Synthase (crtB)
28248605
20
193,367-
194,293
926bp 423bp
Non-
pigmented
Phytoene
Synthase (crtB)
28248605
20
193,367-
194,293
926bp 590bp
Non-
pigmented
Phytoene
Synthase (crtB)
28248605
20
193,367-
194,293
926bp 591bp
Non-
pigmented
Phytoene
Desaturase
(crtI)
28248605
20
191,892-
193,370
1,478b
p
187bp
Non-
pigmented
Phytoene
Desaturase
(crtI)
28248605
20
191,892-
193,370
1,478b
p
976bp
Non-
pigmented
Phytoene
Desaturase
(crtI)
28248605
20
191,892-
193,370
1,478b
p
1,242bp
Pink Lycopene beta-
cyclase (crtY)
28248605
20
190,726-
191,892
1,166b
p
617bp
Non-
pigmented
Flagellin 28248605
17
80,499-
81,845
1,346b
p
971bp
Non-
pigmented
Fructose-1,6-
bisphosphatase
I
28248605
19
196,639-
197,646
1,007b
p
151bp
Non-
pigmented
Malate
Dehydrogenase
28248605
18
442,826-
443,762
935bp 464bp
Non-
pigmented
Long-chain
acyl-CoA
synthetase
28248605
16
1,283,953-
1,285,665
1,712b
p
1,153bp
Light
Yellow
Octaprenyl-
diphosphate
synthase
28248605
18
410,549-
411,520
971bp Before
gene starts
to 198bp
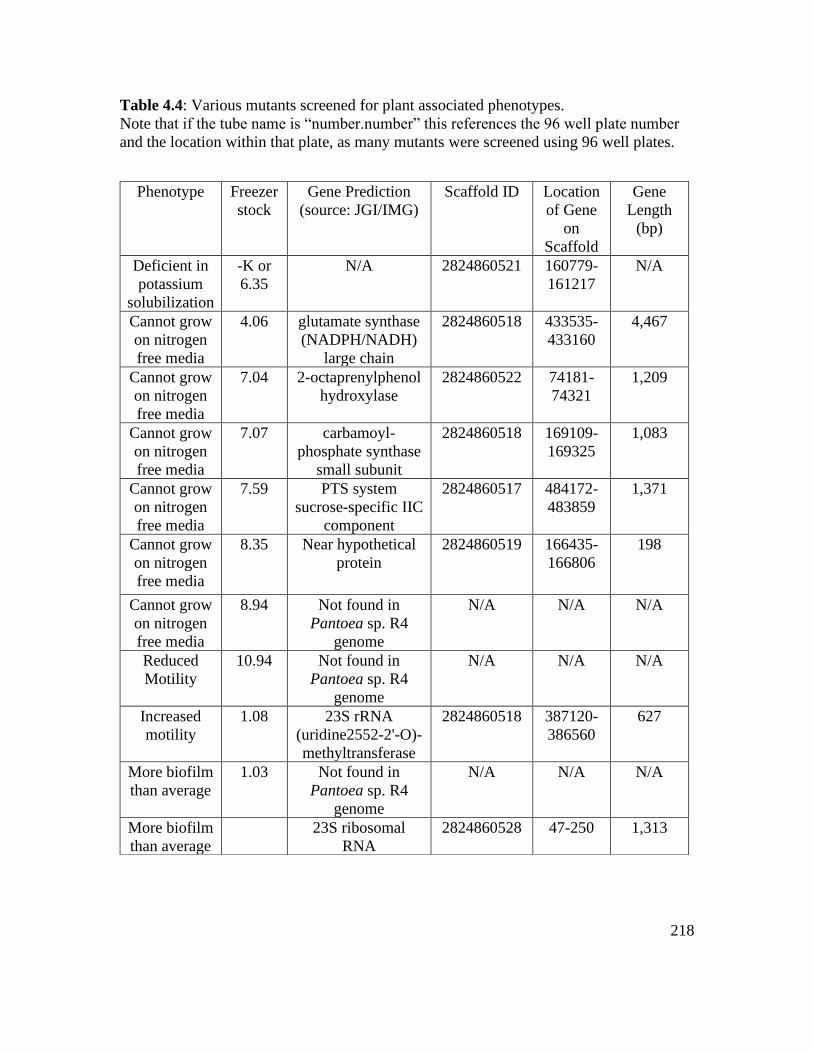
218
Table 4.4: Various mutants screened for plant associated phenotypes.
Note that if the tube name is “number.number” this references the 96 well plate number
and the location within that plate, as many mutants were screened using 96 well plates.
Phenotype Freezer
stock
Gene Prediction
(source: JGI/IMG)
Scaffold ID Location
of Gene
on
Scaffold
Gene
Length
(bp)
Deficient in
potassium
solubilization
-K or
6.35
N/A 2824860521
160779-
161217
N/A
Cannot grow
on nitrogen
free media
4.06 glutamate synthase
(NADPH/NADH)
large chain
2824860518 433535-
433160
4,467
Cannot grow
on nitrogen
free media
7.04 2-octaprenylphenol
hydroxylase
2824860522 74181-
74321
1,209
Cannot grow
on nitrogen
free media
7.07 carbamoyl-
phosphate synthase
small subunit
2824860518 169109-
169325
1,083
Cannot grow
on nitrogen
free media
7.59 PTS system
sucrose-specific IIC
component
2824860517 484172-
483859
1,371
Cannot grow
on nitrogen
free media
8.35
Near hypothetical
protein
2824860519 166435-
166806
198
Cannot grow
on nitrogen
free media
8.94 Not found in
Pantoea sp. R4
genome
N/A N/A N/A
Reduced
Motility
10.94 Not found in
Pantoea sp. R4
genome
N/A N/A N/A
Increased
motility
1.08 23S rRNA
(uridine2552-2'-O)-
methyltransferase
2824860518 387120-
386560
627
More biofilm
than average
1.03 Not found in
Pantoea sp. R4
genome
N/A N/A N/A
More biofilm
than average
23S ribosomal
RNA
2824860528 47-250 1,313
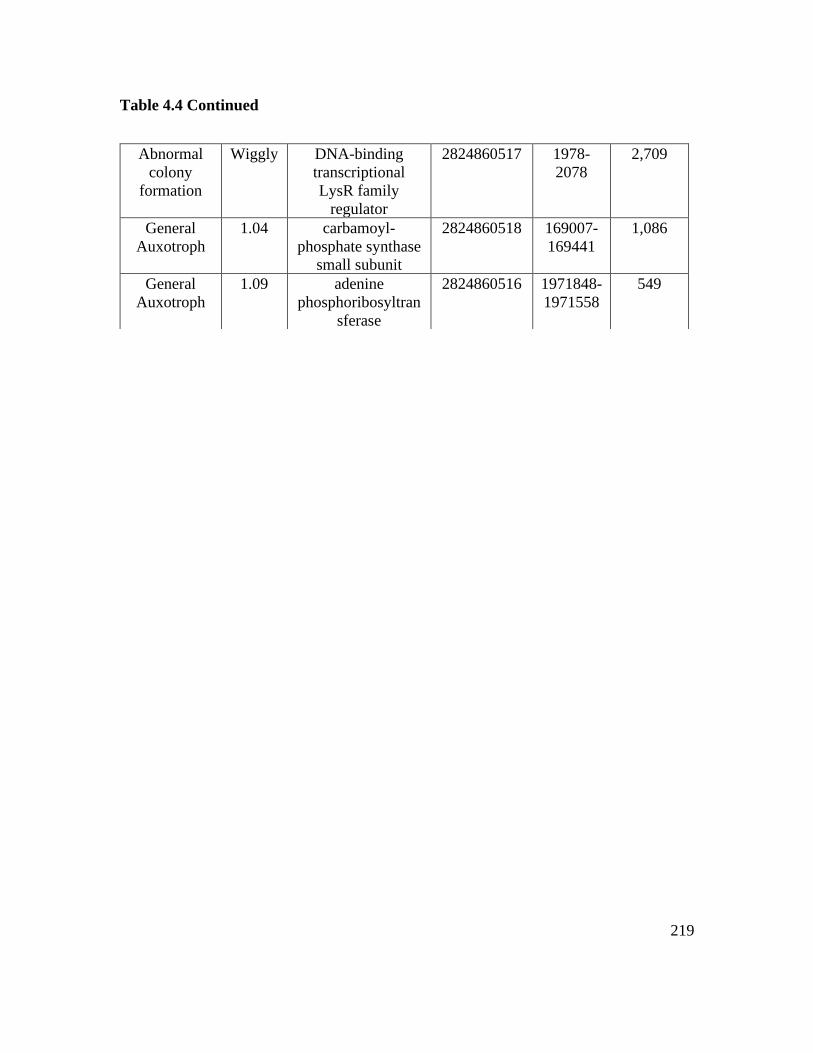
219
Table 4.4 Continued
Abnormal
colony
formation
Wiggly DNA-binding
transcriptional
LysR family
regulator
2824860517 1978-
2078
2,709
General
Auxotroph
1.04 carbamoyl-
phosphate synthase
small subunit
2824860518 169007-
169441
1,086
General
Auxotroph
1.09 adenine
phosphoribosyltran
sferase
2824860516 1971848-
1971558
549
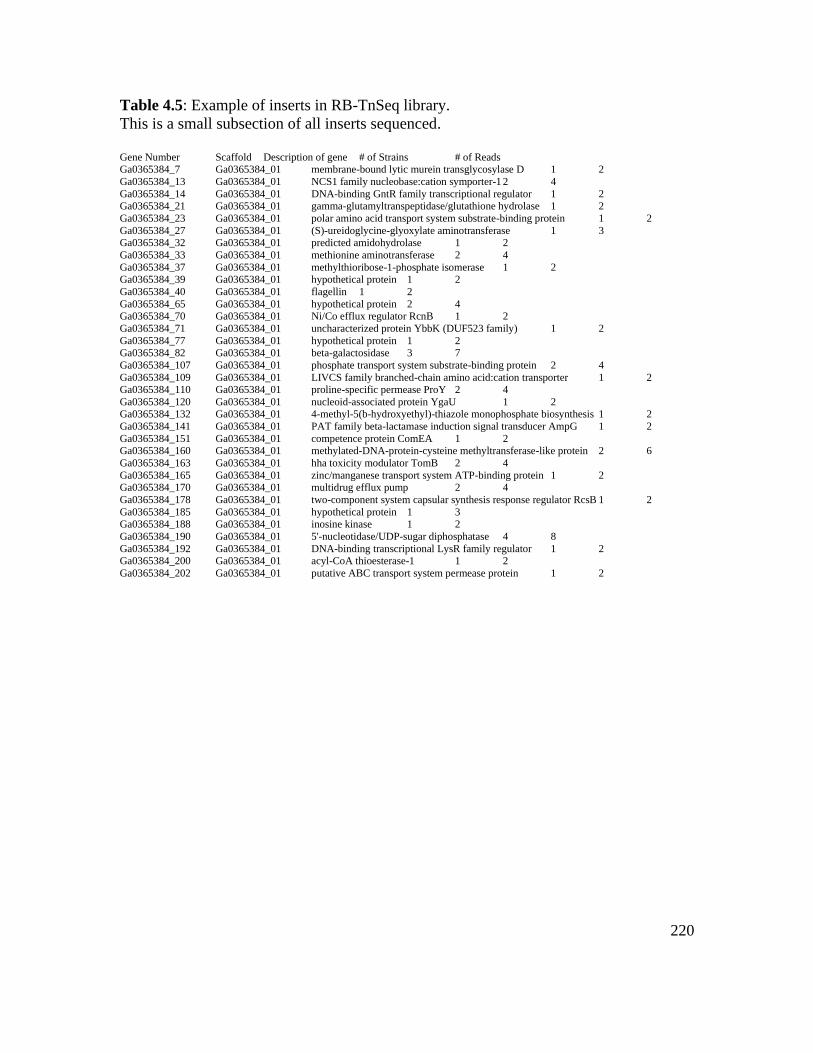
220
Table 4.5: Example of inserts in RB-TnSeq library.
This is a small subsection of all inserts sequenced.
Gene Number Scaffold Description of gene # of Strains # of Reads Ga0365384_7 Ga0365384_01 membrane-bound lytic murein transglycosylase D 1 2
Ga0365384_13 Ga0365384_01 NCS1 family nucleobase:cation symporter-1 2 4
Ga0365384_14 Ga0365384_01 DNA-binding GntR family transcriptional regulator 1 2 Ga0365384_21 Ga0365384_01 gamma-glutamyltranspeptidase/glutathione hydrolase 1 2
Ga0365384_23 Ga0365384_01 polar amino acid transport system substrate-binding protein 1 2
Ga0365384_27 Ga0365384_01 (S)-ureidoglycine-glyoxylate aminotransferase 1 3 Ga0365384_32 Ga0365384_01 predicted amidohydrolase 1 2
Ga0365384_33 Ga0365384_01 methionine aminotransferase 2 4
Ga0365384_37 Ga0365384_01 methylthioribose-1-phosphate isomerase 1 2 Ga0365384_39 Ga0365384_01 hypothetical protein 1 2
Ga0365384_40 Ga0365384_01 flagellin 1 2
Ga0365384_65 Ga0365384_01 hypothetical protein 2 4 Ga0365384_70 Ga0365384_01 Ni/Co efflux regulator RcnB 1 2
Ga0365384_71 Ga0365384_01 uncharacterized protein YbbK (DUF523 family) 1 2
Ga0365384_77 Ga0365384_01 hypothetical protein 1 2
Ga0365384_82 Ga0365384_01 beta-galactosidase 3 7
Ga0365384_107 Ga0365384_01 phosphate transport system substrate-binding protein 2 4
Ga0365384_109 Ga0365384_01 LIVCS family branched-chain amino acid:cation transporter 1 2 Ga0365384_110 Ga0365384_01 proline-specific permease ProY 2 4
Ga0365384_120 Ga0365384_01 nucleoid-associated protein YgaU 1 2 Ga0365384_132 Ga0365384_01 4-methyl-5(b-hydroxyethyl)-thiazole monophosphate biosynthesis 1 2
Ga0365384_141 Ga0365384_01 PAT family beta-lactamase induction signal transducer AmpG 1 2
Ga0365384_151 Ga0365384_01 competence protein ComEA 1 2 Ga0365384_160 Ga0365384_01 methylated-DNA-protein-cysteine methyltransferase-like protein 2 6
Ga0365384_163 Ga0365384_01 hha toxicity modulator TomB 2 4
Ga0365384_165 Ga0365384_01 zinc/manganese transport system ATP-binding protein 1 2 Ga0365384_170 Ga0365384_01 multidrug efflux pump 2 4
Ga0365384_178 Ga0365384_01 two-component system capsular synthesis response regulator RcsB 1 2
Ga0365384_185 Ga0365384_01 hypothetical protein 1 3 Ga0365384_188 Ga0365384_01 inosine kinase 1 2
Ga0365384_190 Ga0365384_01 5'-nucleotidase/UDP-sugar diphosphatase 4 8
Ga0365384_192 Ga0365384_01 DNA-binding transcriptional LysR family regulator 1 2 Ga0365384_200 Ga0365384_01 acyl-CoA thioesterase-1 1 2
Ga0365384_202 Ga0365384_01 putative ABC transport system permease protein 1 2

221
CONCLUSION
222
While alfalfa is the third most profitable plant in the United States, it is currently
receiving substantially less funding and research than other high value crops such as corn
and soybean (NAFA, 2017). Within this dissertation, I have provided a framework for
understanding plant-microbe interactions in alfalfa. Each chapter within this dissertation
allows for a better understanding of alfalfa and its microbial community from a different
vantage point.
Optimizing techniques to improve microbiome sequencing in alfalfa
As part of a grant to study thousands of alfalfa plants throughout the across the
Great Basin of the United States, we needed to optimize a high throughput sequencing
method for plants. With the help of multiple undergraduates, we converted 2,890 samples
from raw plant and soil material into extracted DNA during the summer of 2017. We
processed 2,040 samples the following year into endophyte enriched, epiphyte enriched
and soil samples ready for DNA extraction. The number of samples in the 2017 sampling
season is equivalent to just over ten of the 97 independent studies within the Earth
Microbiome Project (Thompson et al., 2017). Once the samples were processed we used
a subset of them to examine two 16S rRNA gene primer pairs: 341F with 785R and
515F-Y with 926R. These primers respectively amplify the V3-V4 and V4-V5 variable
regions of the 16S rRNA gene region. The V4-V5 primers can also amplify the same
variable region within the 18S rRNA gene (Needham et al., 2018), although this had not
yet been performed in a host system. We found that in alfalfa endophyte samples V3-V4
primers produced significantly more bacterial observed ASVs and had increased Shannon
diversity when compared to samples amplified with the V4-V5 primers. Using the V4-V5
223
primers however, we were able to sequence the 18S rRNA gene region allowing for the
sequencing of eukaryotic reads including animals, fungi, and protists. When compared to
the ITS primers that sequence primarily fungi, we found the V4-V5 primers could
sequence a larger phylogenetic breadth of fungi. Further, we designed the gPNA to block
amplification of eukaryotic host 18S DNA and demonstrated that the addition of the
gPNA was able to increase richness of eukaryotic microbes captured in V4-V5 samples.
In order to generate gPNA, we developed the Microbiome Amplicon Preference Tool,
MAPT, that enables scientists to develop their own PNAs for their host system, as well as
predict the organisms most likely to be unintentionally blocked by the PNA.
This chapter contributes to microbiome research in multiple ways. The processing
of 4,930 samples will allow collaborators replete material to investigate the microbiome
of alfalfa across the Great Basin. Using a subset of these samples, we reveal the
drawbacks to both the V3-V4 and V4-V5 regions when sequencing the alfalfa
microbiome, allowing our collaborators and other researchers to better choose their
primers based on whether they are most interested in sequencing prokaryotic or
eukaryotic organisms. We are the first to isolate eukaryotic reads using the V4-V5
primers in a host system, although it has previously been preformed in marine systems
(Needham et al., 2018). The development of MAPT and the subsequent testing using the
gPNA enables researchers to develop PNAs for their specific host without previous
bioinformatic experience. This meets the demand for host specific PNAs as it is known
that PNAs cannot be utilized across all plants with equal success (Fitzpatrick et al.,
2018).
224
Distinguishing nutrient-dependent plant driven bacterial colonization patterns in alfalfa
While microbiome studies can detect the members of the microbial community,
synthetic communities allow for scientists. By generating a synthetic community and
removing each member individually, we were able to demonstrate that bacterial isolate
colonization of alfalfa had consistent patterns. The synthetic community experiments
outlined in Chapter 2 demonstrated that most bacterial isolates from plant leaves were not
able to colonize highly within plant tissue. This pattern was consistent across varying
nitrogen levels from high nitrogen (fertilizer amounts) to no nitrogen added conditions.
Of the microbes that did colonize, Pantoea sp. R4 and Williamsia sp. R60 were the
highest two colonizers at two weeks across all conditions, while Arthrobacter sp. R85
increased its colonization significantly over time. Further, plant dependent interactions
were revealed as colonization differed across nutrient conditions for both Pantoea sp. R4
and Williamsia sp. R60. At 2 weeks, Pantoea sp. R4 consistently colonized the plant
across nutrient conditions when the plant was present. However, it colonized the media at
significantly lower levels at no nitrogen added conditions without the plant. Williamsia
sp. R60 colonized the same at no nitrogen added conditions with and without the plant.
However, it colonized higher with the plant at standard and high nitrogen conditions.
Microbial interactions that were nutrient dependent were also revealed, as Williamsia sp.
R60 colonized significantly higher in the community without Pantoea sp. R4, than in the
full synthetic community but only at high nitrogen levels. Ultimately, the drop out
community experiments identified which microbes required further study as plant,
microbe, and nutrient dependent interactions were determined.
225
More investigation is needed into how Pantoea sp. R4 can colonize to high levels
early within alfalfa’s life cycle but decreases in colonization over time. There are many
potential reasons for this change in colonization. This could be due to plant immune
system responses to Pantoea sp. R4 high colonization, such as the production of salicylic
acid. Salicylic acid responses can cause a decrease in plant biomass, which could explain
why plants inoculated with Pantoea sp. R4 have lower biomass over time (van Butselaar
and Van den Ackerveken, 2020). It is also possible that the bacterium is more suited to
metabolizing root and plant exudate materials earlier in a plant’s life cycle. Screening the
carbon compounds known to be in root exudate material and comparing the metabolites
utilized by Pantoea sp. R4 to those used by a known high colonizers at later plant life
states, such as Arthrobacter sp. R85, might offer potential compounds of interest.
Alternatively, a study of what metabolites are specifically produced in alfalfa root
exudate and tissue across multiple nutrient conditions and time points would allow for
improved understanding of why some microbes colonize the plant highly while others do
not. Further, all the plant microbe experiments performed within this chapter were
measured between 4 days and 6 weeks, which is still within the early life cycle of the
plant. Alfalfa research would benefit from longer experiments that extend into each part
of alfalfa’s life cycle.
Root or leaf exudate experiments to elucidate chemicals found throughout the
plant’s life cycle can also help to expand our current epiphyte and endophyte culture
collections. The synthetic community members described here were isolated on a variety
of media to attempt to isolate diverse organisms. However, none of the media was
226
selected based on root or leaf exudate information from alfalfa plants. If root or leaf
exudate experiments reveal a unexpected compound to be exuded from the plants at high
levels, media utilizing that compound could help to isolate microbes previously left
uncultured. Regardless of the concentration of a given compound in root or leaf exudate,
using root exudate information to inform the design media that reflects the chemical
composition of the environment of root or leaf exudate can improve the diversity and
relevancy of the organisms cultured. We encourage future scientists utilizing the epiphyte
and endophyte culture collections generated here to expand on them by performing root
or leaf exudate experiments and utilizing the results to design plant relevant media. While
a synthetic community design will always lack the microbial diversity of the plant
microbiome as a whole, using root or leaf exudate experiments can help bridge the gap
between plant microbiome and synthetic community experiments.
Despite the pitfalls of synthetic communities, drop out community analyses using
synthetic communities have been performed in multiple plants prior and have revealed a
multitude of microbial interactions (Niu et al., 2017; Carlström et al., 2019). Our
experiments add to this body of work and, to our knowledge, we are the only lab to
compare drop out communities both with and without plants, as well as when varying
nutrient levels. By using these approaches, we highlight the consistency of colonization
across nutrient conditions, another example of how synthetic communities in plants can
be used to find repeatable phenotypes. We also highlight the complexity of microbe,
plant, and nutrient interactions by unveiling how microbes impact colonization with each
other differently at various nutrient levels when in the presence or absence of a plant host.
227
Investigating genetic approaches to best understand Pantoea sp. R4 colonization
We used multiple genetic approaches to understand the genetic mechanisms
behind Pantoea sp. R4’s high colonization. We hypothesize that as we have received a
small number of mutants when performing RB-TnSeq with Pantoea sp. R4, that it is
possible to generate an suitable library size but more troubleshooting of the protocol is
required to do so. Not all microbes can be genetically modified, and as conjugation
between E. coli and Pantoea sp. R4 has been performed with high conjugation efficiency,
we think the problems we have encountered with RB-TnSeq can be overcome. We
encourage future members of the Lebeis lab to attempt to further troubleshoot the
problems encountered with sequencing. If successful, RB-TnSeq experiments in Pantoea
sp. R4 can allow for high throughput analysis of fitness. Once an appropriate size library
of 100,000-300,000 mutants can be generated, the randomly barcoded technology allows
for a simple PCR amplification of the primers rather than a regeneration of the transposon
insertions every time. The potency of being able to perform a high throughput fitness
assay with only PCR amplification and sequencing steps needed to acquire results cannot
be overstated. For example, at the time of this dissertation, seed colonization using RB-
TnSeq has not been investigated and as Pantoea spp. are frequent seed colonizers in
alfalfa, an RB-TnSeq library in Pantoea sp. R4 could be the first to identify genes
essential for seed colonization (Lopez et al., 2018). Continuing to troubleshoot RB-TnSeq
is worth the risk, as the potential results could provide a wealth of information in how
Pantoea strains colonize.
Through the generation and screening of a traditional transposon library, we have
identified genomic regions involved with potassium solubilization and carotenoid
228
production. While a mutant deficient in potassium solubilization was isolated, the insert
was not identified within a gene, and serves only to suggest potential genes of interest
nearby. We identified multiple inserts that produced non-pigmented or alternatively
pigmented phenotypes within 3 genes involved with the carotenoid production: crtB, crtI
and crtY. Our data suggests that Pantoea sp. R4 colonization does not require the
production of carotenoids. This was surprising as a role for crtB in carotenoid production
was reported previously in a Pantoea species (Bible et al., 2016). We examined plant
colonization across multiple time points and nutrient conditions using mutants in crtB and
crtY. For scientists interested in carotenoid production in Pantoea sp. R4, generating
primers of crtB, crtI and crtY genes can help identify levels of carotenoid expression.
While we have generated transposon mutants in these pathways, it should be noted that
the production of a marker-less deletion in these genes should be performed to confirm
these results. Further, the transposon library generated here can be used by students to
screen for phenotypes and subsequently identify new genes of interest.
Final thoughts
Within this dissertation we have built a framework for studying microbial
interactions in alfalfa. This framework contributes to the understanding of alfalfa-
microbe interactions within the fields of plant microbiomes, synthetic community
assembly and genetics. For every question answered here, there remain countless
questions unsolved, that offer new avenues for research for future scientists. These
avenues should not be pursued individually, but concurrently. RB-TnSeq troubleshooting,
combined with synthetic community experiments and continued examination of

229
sequencing methodologies will allow for an improved view of plant-microbe interactions.
While each chapter has limitations, together they provide a structure to untangle host
systems from their microbial communities. When designing future experiments for this
project, I encourage future scientists to be bold in their scientific endeavors. The bolder
the idea the more likely the idea is to be followed by failure, but it is crucial to remember
that failure is new knowledge in it of itself.

230
REFERENCES
231
1. Abidin, N., Ismail, S. I., Vadamalai, G., Yusof, M. T., Hakiman, M., Karam, D.
S., et al. 2020. Genetic diversity of Pantoea stewartii subspecies stewartii causing
jackfruit-bronzing disease in Malaysia ed. Rajarshi Gaur. PLoS ONE.
15:e0234350.
2. Agler, M. T., Ruhe, J., Kroll, S., Morhenn, C., Kim, S.-T., Weigel, D., et al. 2016.
Microbial Hub Taxa Link Host and Abiotic Factors to Plant Microbiome
Variation ed. Matthew K. Waldor. PLoS Biol. 14:e1002352.
3. Ammar, E.-D., Correa, V., Hogenhout, S., and Redinbaugh, M. 2014.
Immunofluorescence localization and ultrastructure of Stewart’s wilt disease
bacterium Pantoea stewartii in maize leaves and in its flea beetle vector
Chaetocnema pulicaria (Coleoptera: Chrysomelidae). J Microsc Ultrastruct. 2:28.
4. Angly, F. E., Dennis, P. G., Skarshewski, A., Vanwonterghem, I., Hugenholtz, P.,
and Tyson, G. W. 2014. CopyRighter: a rapid tool for improving the accuracy of
microbial community profiles through lineage-specific gene copy number
correction. Microbiome. 2:11.
5. Annicchiarico, P., Barrett, B., Brummer, E. C., Julier, B., and Marshall, A. H.
2015. Achievements and Challenges in Improving Temperate Perennial Forage
Legumes. Critical Reviews in Plant Sciences. 34:327–380.
6. Ansari, M., Shekari, F., Mohammadi, M. H., Juhos, K., Végvári, G., and Biró, B.
2019. Salt-tolerant plant growth-promoting bacteria enhanced salinity tolerance of
salt-tolerant alfalfa (Medicago sativa L.) cultivars at high salinity. Acta Physiol
Plant. 41:195.
7. de Araujo, A. S. F., Mendes, L. W., Lemos, L. N., Antunes, J. E. L., Beserra, J. E.
A., de Lyra, M. do C. C. P., et al. 2018. Protist species richness and soil
microbiome complexity increase towards climax vegetation in the Brazilian
Cerrado. Communications Biology.
8. Archibald, S. B., Rasnitsyn, A. P., Brothers, D. J., and Mathewes, R. W. 2018.
Modernisation of the Hymenoptera: ants, bees, wasps, and sawflies of the early
Eocene Okanagan Highlands of western North America. The Canadian
Entomologist. 150:205–257.
9. Arenz, B. E., Schlatter, D. C., Bradeen, J. M., and Kinkel, L. L. 2015. Blocking
primers reduce co-amplification of plant DNA when studying bacterial endophyte
communities. Journal of Microbiological Methods. 117:1–3.
10. Arnold, M. F. F., Shabab, M., Penterman, J., Boehme, K. L., Griffitts, J. S., and
Walker, G. C. 2017. Genome-Wide Sensitivity Analysis of the Microsymbiont
Sinorhizobium meliloti to Symbiotically Important, Defensin-Like Host Peptides
ed. Frederick M. Ausubel. mBio. 8:e01060-17, /mbio/8/4/e01060-17.atom.
11. Bai, Y., Müller, D. B., Srinivas, G., Garrido-Oter, R., Potthoff, E., Rott, M., et al.
2015. Functional overlap of the Arabidopsis leaf and root microbiota. Nature.
528:364–369.
12. Bazhanov, D. P., Yang, K., Li, H., Li, C., Li, J., Chen, X., et al. 2017.
Colonization of plant roots and enhanced atrazine degradation by a strain of
Arthrobacter ureafaciens. Appl Microbiol Biotechnol. 101:6809–6820.
232
13. Belda, E., Coulibaly, B., Fofana, A., Beavogui, A. H., Traore, S. F., Gohl, D. M.,
et al. 2017. Preferential suppression of Anopheles gambiae host sequences allows
detection of the mosquito eukaryotic microbiome. Scientific Reports. 7.
14. Berendsen, R. L., Vismans, G., Yu, K., Song, Y., de Jonge, R., Burgman, W. P.,
et al. 2018. Disease-induced assemblage of a plant-beneficial bacterial
consortium. ISME J. 12:1496–1507.
15. Berg, M., and Koskella, B. 2018. Nutrient- and Dose-Dependent Microbiome-
Mediated Protection against a Plant Pathogen. Current Biology. 28:2487-2492.e3.
16. Berg, W. K., Cunningham, S. M., Brouder, S. M., Joern, B. C., Johnson, K. D.,
Santini, J., et al. 2005. Influence of Phosphorus and Potassium on Alfalfa Yield
and Yield Components. Crop Science. 45:cropsci2005.0297.
17. Berney, C., Ciuprina, A., Bender, S., Brodie, J., Edgcomb, V., Kim, E., et al.
2017. UniEuk : Time to Speak a Common Language in Protistology! Journal of
Eukaryotic Microbiology. 64:407–411.
18. Bible, A. N., Fletcher, S. J., Pelletier, D. A., Schadt, C. W., Jawdy, S. S., Weston,
D. J., et al. 2016. A Carotenoid-Deficient Mutant in Pantoea sp. YR343, a
Bacteria Isolated from the Rhizosphere of Populus deltoides, Is Defective in Root
Colonization. Front. Microbiol. 7.
19. Bodenhausen, N., Bortfeld-Miller, M., Ackermann, M., and Vorholt, J. A. 2014.
A Synthetic Community Approach Reveals Plant Genotypes Affecting the
Phyllosphere Microbiota ed. Ute Hentschel. PLoS Genetics. 10:e1004283.
20. Bodenhausen, N., Horton, M. W., and Bergelson, J. 2013. Bacterial Communities
Associated with the Leaves and the Roots of Arabidopsis thaliana ed. A. Mark
Ibekwe. PLoS ONE. 8:e56329.
21. Boratyn, G. M., Thierry-Mieg, J., Thierry-Mieg, D., Busby, B., and Madden, T. L.
2019. Magic-BLAST, an accurate RNA-seq aligner for long and short reads.
BMC Bioinformatics. 20:405.
22. Brady, C. L., Cleenwerck, I., Venter, S. N., Engelbeen, K., De Vos, P., and
Coutinho, T. A. 2010. Emended description of the genus Pantoea, description of
four species from human clinical samples, Pantoea septica sp. nov., Pantoea
eucrina sp. nov., Pantoea brenneri sp. nov. and Pantoea conspicua sp. nov., and
transfer of Pectobacterium cypripedii (Hori 1911) Brenner et al. 1973 emend.
Hauben et al. 1998 to the genus as Pantoea cypripedii comb. nov. International
Journal of Systematic and Evolutionary Microbiology. 60:2430–2440.
23. Bringel, and Couée, I. 2015. Pivotal roles of phyllosphere microorganisms at the
interface between plant functioning and atmospheric trace gas dynamics. Front.
Microbiol. 06.
24. Brough, R. C., Robison, L. R., and Jackson, R. H. 1977. The historical diffusion
of alfalfa. Journal of Agronomic Education. 6:13–19.
25. Bulgarelli, D., Rott, M., Schlaeppi, K., Ver Loren van Themaat, E., Ahmadinejad,
N., Assenza, F., et al. 2012. Revealing structure and assembly cues for
Arabidopsis root-inhabiting bacterial microbiota. Nature. 488:91–95.
233
26. Bulgari, D., Casati, P., Quaglino, F., and Bianco, P. A. 2014. Endophytic bacterial
community of grapevine leaves influenced by sampling date and phytoplasma
infection process. BMC Microbiol. 14:198.
27. van Butselaar, T., and Van den Ackerveken, G. 2020a. Salicylic Acid Steers the
Growth–Immunity Tradeoff. Trends in Plant Science. 25:566–576.
28. Calero, P., Jensen, S. I., Bojanovič, K., Lennen, R. M., Koza, A., and Nielsen, A.
T. 2018. Genome-wide identification of tolerance mechanisms toward p -
coumaric acid in Pseudomonas putida. Biotechnol. Bioeng. 115:762–774.
29. Callahan, B. J., McMurdie, P. J., Rosen, M. J., Han, A. W., Johnson, A. J. A., and
Holmes, S. P. 2016a. DADA2: High-resolution sample inference from Illumina
amplicon data. Nature Methods. 13:581–583.
30. Carini, P. 2019. A “Cultural” Renaissance: Genomics Breathes New Life into an
Old Craft. mSystems. 4:e00092-19, /msystems/4/3/msys.00092-19.atom.
31. Carlström, C. I., Field, C. M., Bortfeld-Miller, M., Müller, B., Sunagawa, S., and
Vorholt, J. A. 2019. Synthetic microbiota reveal priority effects and keystone
strains in the Arabidopsis phyllosphere. Nat Ecol Evol. 3:1445–1454.
32. Castrillo, G., Teixeira, P. J. P. L., Paredes, S. H., Law, T. F., de Lorenzo, L.,
Feltcher, M. E., et al. 2017. Root microbiota drive direct integration of phosphate
stress and immunity. Nature. 543:513–518.
33. Chang, Y.-C., Hu, Z., Rachlin, J., Anton, B. P., Kasif, S., Roberts, R. J., et al.
2016. COMBREX-DB: an experiment centered database of protein function:
knowledge, predictions and knowledge gaps. Nucleic Acids Res. 44:D330–D335.
34. Chaparro, J. M., Badri, D. V., Bakker, M. G., Sugiyama, A., Manter, D. K., and
Vivanco, J. M. 2013. Root Exudation of Phytochemicals in Arabidopsis Follows
Specific Patterns That Are Developmentally Programmed and Correlate with Soil
Microbial Functions ed. Keqiang Wu. PLoS ONE. 8:e55731.
35. Clemmons, A., Timbrook, J., Herron, J., and Crowe, A. BioSkills Guide. Core
Competencies for Undergraduate Biology. QUBES Educational Resources.
36. Cole, B. J., Feltcher, M. E., Waters, R. J., Wetmore, K. M., Mucyn, T. S., Ryan,
E. M., et al. 2017. Genome-wide identification of bacterial plant colonization
genes ed. Xinnian Dong. PLOS Biology. 15:e2002860.
37. Costa, L. E. de O., Queiroz, M. V. de, Borges, A. C., Moraes, C. A. de, and
Araújo, E. F. de. 2012. Isolation and characterization of endophytic bacteria
isolated from the leaves of the common bean (Phaseolus vulgaris). Braz. J.
Microbiol. 43:1562–1575.
38. Cottee, H. E. W., and Whittaker, R. J. The keystone species concept: a critical
appraisal. :12.
39. Coutinho, T. A., and Venter, S. N. 2009. Pantoea ananatis : an unconventional
plant pathogen. Molecular Plant Pathology. 10:325–335.
40. Cregger, M. A., Veach, A. M., Yang, Z. K., Crouch, M. J., Vilgalys, R., Tuskan,
G. A., et al. 2018. The Populus holobiont: dissecting the effects of plant niches
and genotype on the microbiome. Microbiome. 6.
234
41. Dakora, F. D., Joseph, C. M., and Phillips, D. A. 1993. Alfalfa (Medicago sativa
1.) Root Exudates Contain lsoflavonoids in the Presence of Rhizobium meliloti’.
101:6.
42. Dakora, F. D., and Phillips, D. A. 2002. Root exudates as mediators of mineral
acquisition in low-nutrient environments. In Food Security in Nutrient-Stressed
Environments: Exploiting Plants’ Genetic Capabilities, ed. J. J. Adu-Gyamfi.
Dordrecht: Springer Netherlands, p. 201–213.
43. Deng, S., Wipf, H. M.-L., Pierroz, G., Raab, T. K., Khanna, R., and Coleman-
Derr, D. 2019. A Plant Growth-Promoting Microbial Soil Amendment
Dynamically Alters the Strawberry Root Bacterial Microbiome. Sci Rep. 9:17677.
44. Di Lucca, A. G. T., Trinidad Chipana, E. F., Talledo Albújar, M. J., Dávila
Peralta, W., Montoya Piedra, Y. C., and Arévalo Zelada, J. L. 2013. Slow wilt:
another form of Marchitez in oil palm associated with trypanosomatids in Peru.
Tropical Plant Pathology. 38:522–533.
45. diCenzo, G. C., Benedict, A. B., Fondi, M., Walker, G. C., Finan, T. M.,
Mengoni, A., et al. 2018. Robustness encoded across essential and accessory
replicons of the ecologically versatile bacterium Sinorhizobium meliloti ed. Josep
Casadesús. PLoS Genet. 14:e1007357.
46. Dick, M. W., Vick, M. C., Gibbings, J. G., Hedderson, T. A., and Lopez Lastra,
C. C. 1999. 18S rDNA for species of Leptolegnia and other Peronosporomycetes:
justification for the subclass taxa Saprolegniomycetidae and
Peronosporomycetidae and division of the Saprolegniaceae sensu lato into the
Leptolegniaceae and Saprolegniaceae. Mycological Research. 103:1119–1125.
47. Docherty-Skippen, S. M., Karrow, D., and Ahmed, G. 2020. Doing Science: Pre-
service Teachers’ Attitudes and Confidence Teaching Elementary Science and
Technology. Brock Education Journal. 29:24–34.
48. Dong, C.-J., Wang, L.-L., Li, Q., and Shang, Q.-M. 2019. Bacterial communities
in the rhizosphere, phyllosphere and endosphere of tomato plants ed. Marie-Joelle
Virolle. PLoS ONE. 14:e0223847.
49. Duong, D. A., Jensen, R. V., and Stevens, A. M. 2018a. Discovery of Pantoea
stewartii ssp. stewartii genes important for survival in corn xylem through a Tn-
Seq analysis: Pantoea stewartii genes important in planta. Molecular Plant
Pathology. 19:1929–1941.
50. Ebert, J. Alfalfa’s bioenergy appeal. . Ethanol Producer Magazine. :88–94.
51. Edwards, J., Johnson, C., Santos-Medellín, C., Lurie, E., Podishetty, N. K.,
Bhatnagar, S., et al. 2015. Structure, variation, and assembly of the root-
associated microbiomes of rice. Proc Natl Acad Sci USA. 112:E911–E920.
52. Eliyahu, D., McCall, A. C., Lauck, M., Trakhtenbrot, A., and Bronstein, J. L.
2015. Minute pollinators: the role of thrips (Thysanoptera) as pollinators of
pointleaf manzanita, Arctostaphylos pungens (Ericaceae). Journal of Pollination
Ecology. 16.
53. Etesami, H., Emami, S., and Alikhani, H. A. 2017. Potassium solubilizing
bacteria (KSB):: Mechanisms, promotion of plant growth, and future prospects
A review. J. Soil Sci. Plant Nutr. 17:897–911.
235
54. Fabian, B. K., Tetu, S. G., and Paulsen, I. T. 2020. Application of Transposon
Insertion Sequencing to Agricultural Science. Front. Plant Sci. 11:291.
55. Fazekas, A. J., Burgess, K. S., Kesanakurti, P. R., Graham, S. W., Newmaster, S.
G., Husband, B. C., et al. 2008. Multiple Multilocus DNA Barcodes from the
Plastid Genome Discriminate Plant Species Equally Well ed. Robert DeSalle.
PLoS ONE. 3:e2802.
56. Feng, Y., Shen, D., and Song, W. 2006. Rice endophyte Pantoea agglomerans
YS19 promotes host plant growth and affects allocations of host photosynthates. J
Appl Microbiol. 100:938–945.
57. Fitzpatrick, C. R., Lu-Irving, P., Copeland, J., Guttman, D. S., Wang, P. W.,
Baltrus, D. A., et al. 2018. Chloroplast sequence variation and the efficacy of
peptide nucleic acids for blocking host amplification in plant microbiome studies.
Microbiome. 6.
58. Forister, M. L., Nice, C. C., Fordyce, J. A., and Gompert, Z. 2009. Host range
evolution is not driven by the optimization of larval performance: the case of
Lycaeides melissa (Lepidoptera: Lycaenidae) and the colonization of alfalfa.
Oecologia. 160:551–561.
59. Forister, M. L., Scholl, C. F., Jahner, J. P., Wilson, J. S., Fordyce, J. A., Gompert,
Z., et al. 2013. Specificity, rank preference, and the colonization of a non-native
host plant by the Melissa blue butterfly. Oecologia. 172:177–188.
60. Forister, M. L., Yoon, S. A., Philbin, C. S., Dodson, C. D., Hart, B., Harrison, J.
G., et al. 2020. Caterpillars on a phytochemical landscape: The case of alfalfa and
the Melissa blue butterfly. Ecol Evol. 10:4362–4374.
61. Fuentes-Ramirez, L. E., Caballero-Mellado, J., Sepalva, J., and Martinez-Romero,
E. 1999. Colonization of sugarcane by Acetobacter diazotrophicus is inhibited by
high N-fertilization. FEMS Microbiology Ecology. 29:117–128.
62. Geisen, S. 2016. The bacterial-fungal energy channel concept challenged by
enormous functional versatility of soil protists. Soil Biology and Biochemistry.
102:22–25.
63. Georgiades, K., and Raoult, D. 2011. Defining Pathogenic Bacterial Species in
the Genomic Era. Frontiers in Microbiology. 1.
64. Gilbert, J. A., Jansson, J. K., and Knight, R. 2014. The Earth Microbiome project:
successes and aspirations. BMC Biology. 12.
65. Gilbert, J. A., Meyer, F., Antonopoulos, D., Balaji, P., Brown, C. Titus, Brown,
Christopher T., et al. 2010. Meeting Report: The Terabase Metagenomics
Workshop and the Vision of an Earth Microbiome Project. Standards in Genomic
Sciences. 3:243–248.
66. Gottel, N. R., Castro, H. F., Kerley, M., Yang, Z., Pelletier, D. A., Podar, M., et
al. 2011. Distinct Microbial Communities within the Endosphere and Rhizosphere
of Populus deltoides Roots across Contrasting Soil Types. Appl. Environ.
Microbiol. 77:5934–5944.
67. Grevengoed, T. J., Klett, E. L., and Coleman, R. A. 2014. Acyl-CoA Metabolism
and Partitioning. Annu. Rev. Nutr. 34:1–30.
236
68. Guillou, L., Bachar, D., Audic, S., Bass, D., Berney, C., Bittner, L., et al. 2012.
The Protist Ribosomal Reference database (PR2): a catalog of unicellular
eukaryote Small Sub-Unit rRNA sequences with curated taxonomy. Nucleic
Acids Research. 41:D597–D604.
69. Hammer, T. J., Janzen, D. H., Hallwachs, W., Jaffe, S. P., and Fierer, N. 2017.
Caterpillars lack a resident gut microbiome. Proc Natl Acad Sci USA. 114:9641–
9646.
70. Handelsman, J., and Brill, W. J. 1985. Erwinia herbicola Isolates from Alfalfa
Plants May Play a Role in Nodulation of Alfalfa by Rhizobium meliloti. 49:4.
71. Hardoim, P. R., van Overbeek, L. S., and Elsas, J. D. van. 2008. Properties of
bacterial endophytes and their proposed role in plant growth. Trends in
Microbiology. 16:463–471.
72. Hartwig, U. A., Maxwell, C. A., Joseph, C. M., and Phillips, D. A. 1990.
Chrysoeriol and Luteolin Released from Alfalfa Seeds Induce nod Genes in
Rhizobium meliloti. Plant Physiol. 92:116–122.
73. Hayashi, Y., Onaka, H., Itoh, N., Seto, H., and Dairi, T. 2007. Cloning of the
Gene Cluster Responsible for Biosynthesis of KS-505a (Longestin), a Unique
Tetraterpenoid. Bioscience, Biotechnology, and Biochemistry. 71:3072–3081.
74. Heider, S. A. E., Peters-Wendisch, P., Beekwilder, J., and Wendisch, V. F. 2014.
IdsA is the major geranylgeranyl pyrophosphate synthase involved in
carotenogenesis in Corynebacterium glutamicum. FEBS J. 281:4906–4920.
75. Helmann, T. C., Ongsarte, C. L., Lam, J., Deutschbauer, A. M., and Lindow, S. E.
2019. Genome-Wide Transposon Screen of a Pseudomonas syringae mexB
Mutant Reveals the Substrates of Efflux Transporters ed. David S. Guttman.
mBio. 10:e02614-19, /mbio/10/5/mBio.02614-19.atom.
76. Hentchel, K. L., Reyes Ruiz, L. M., Curtis, P. D., Fiebig, A., Coleman, M. L., and
Crosson, S. 2019. Genome-scale fitness profile of Caulobacter crescentus grown
in natural freshwater. ISME J. 13:523–536.
77. Herrera Paredes, S., Gao, T., Law, T. F., Finkel, O. M., Mucyn, T., Teixeira, P. J.
P. L., et al. 2018. Design of synthetic bacterial communities for predictable plant
phenotypes ed. Eric Kemen. PLoS Biol. 16:e2003962.
78. Hill, M. O. 1973. Diversity and Evenness: A Unifying Notation and Its
Consequences. Ecology. 54:427–432.
79. Hiltner, L. 1904. Ueber neuere Erfahrungen und Probleme auf dem Gebiete der
Bodenbakteriologie und unter besonderer BerUcksichtigung der Grundungung
und Brache. Arb. Deut. Landw. Gesell. :59–78.
80. Hollingsworth, P. M., Graham, S. W., and Little, D. P. 2011. Choosing and Using
a Plant DNA Barcode ed. Dirk Steinke. PLoS ONE. 6:e19254.
81. Horn, H., Keller, A., Hildebrandt, U., Kämpfer, P., Riederer, M., and Hentschel,
U. 2016. Draft genome of the Arabidopsis thaliana phyllosphere bacterium,
Williamsia sp. ARP1. Stand in Genomic Sci. 11:8.
82. Hrbáčková, M., Dvořák, P., Takáč, T., Tichá, M., Luptovčiak, I., Šamajová, O., et
al. 2020. Biotechnological Perspectives of Omics and Genetic Engineering
Methods in Alfalfa. Front. Plant Sci. 11:592.
237
83. Huerta-Cepas, J., Serra, F., and Bork, P. 2016. ETE 3: Reconstruction, Analysis,
and Visualization of Phylogenomic Data. Mol Biol Evol. 33:1635–1638.
84. Hughes, P. 2011. Research resource review: Robert S. Anderson and Suzanne P.
Anderson, Geomorphology: The Mechanics and Chemistry of Landscapes.
Cambridge: Cambridge University Press, 2010; 654 pp.: 9780521519786, £40
(pbk). Progress in Physical Geography: Earth and Environment. 35:134–135.
85. Ibáñez, F., Wall, L., and Fabra, A. 2016. Starting points in plant-bacteria
nitrogen-fixing symbioses: intercellular invasion of the roots. Journal of
Experimental Botany. :erw387.
86. Imam, J., Singh, P. K., and Shukla, P. 2016. Plant Microbe Interactions in Post
Genomic Era: Perspectives and Applications. Front. Microbiol. 7.
87. Intelligence, M. 2019. Alfalfa Hay Market- Growth, Trends and Forecast (2020 -
2025).
88. Ishaq, S. L., Lachman, M. M., Wenner, B. A., Baeza, A., Butler, M., Gates, E., et
al. 2019. Pelleted-hay alfalfa feed increases sheep wether weight gain and rumen
bacterial richness over loose-hay alfalfa feed ed. Garret Suen. PLoS ONE.
14:e0215797.
89. Jackrel, S. L., Owens, S. M., Gilbert, J. A., and Pfister, C. A. 2017. Identifying
the plant-associated microbiome across aquatic and terrestrial environments: the
effects of amplification method on taxa discovery. Molecular Ecology Resources.
17:931–942.
90. Jacobs, J. L., Carroll, T. L., and Sundin, G. W. 2005. The Role of Pigmentation,
Ultraviolet Radiation Tolerance, and Leaf Colonization Strategies in the Epiphytic
Survival of Phyllosphere Bacteria. Microb Ecol. 49:104–113.
91. Jaskowska, E., Butler, C., Preston, G., and Kelly, S. 2015. Phytomonas:
Trypanosomatids Adapted to Plant Environments ed. Chetan E. Chitnis. PLOS
Pathogens. 11:e1004484.
92. Jiao, S., Chen, W., Wang, J., Du, N., Li, Q., and Wei, G. 2018. Soil microbiomes
with distinct assemblies through vertical soil profiles drive the cycling of multiple
nutrients in reforested ecosystems. Microbiome. 6:146.
93. Johnson, K. B., and Stockwell, V. O. 1998.Management of Fire Blight: A Case
Study in Microbial Ecology. Annual Review of Phytopathology. 36:227–248.
94. Jost, L. 2006. Entropy and diversity. Oikos. 113:363–375.
95. Jost, L. 2007. Partitioning Diversity Into Independent Alpha and Beta
Components. Ecology. 88:2427–2439.
96. Kaewkla, O., and Franco, C. M. M. 2013. Rational Approaches to Improving the
Isolation of Endophytic Actinobacteria from Australian Native Trees. Microb
Ecol. 65:384–393.
97. Kandel, S., Joubert, P., and Doty, S. 2017. Bacterial Endophyte Colonization and
Distribution within Plants. Microorganisms. 5:77.
98. Kembel, S. W., Wu, M., Eisen, J. A., and Green, J. L. 2012. Incorporating 16S
Gene Copy Number Information Improves Estimates of Microbial Diversity and
Abundance ed. Christian von Mering. PLoS Comput Biol. 8:e1002743.
238
99. Kiss, L. 2012. Limits of nuclear ribosomal DNA internal transcribed spacer (ITS)
sequences as species barcodes for Fungi. Proceedings of the National Academy of
Sciences. 109:E1811–E1811.
100. Klindworth, A., Pruesse, E., Schweer, T., Peplies, J., Quast, C., Horn, M.,
et al. 2013. Evaluation of general 16S ribosomal RNA gene PCR primers for
classical and next-generation sequencing-based diversity studies. Nucleic Acids
Research. 41:e1–e1.
101. Knief, C., Ramette, A., Frances, L., Alonso-Blanco, C., and Vorholt, J. A.
2010. Site and plant species are important determinants of the Methylobacterium
community composition in the plant phyllosphere. ISME J. 4:719–728.
102. Kovács, G. M., Jankovics, T., and Kiss, L. 2011. Variation in the nrDNA
ITS sequences of some powdery mildew species: do routine molecular
identification procedures hide valuable information? European Journal of Plant
Pathology. 131:135–141.
103. Kozińska, A., Seweryn, P., and Sitkiewicz, I. 2019. A crash course in
sequencing for a microbiologist. J Appl Genetics. 60:103–111.
104. Kumar, S. V., Taylor, G., Hasim, S., Collier, C. P., Farmer, A. T.,
Campagna, S. R., et al. 2019. Loss of carotenoids from membranes of Pantoea sp.
YR343 results in altered lipid composition and changes in membrane biophysical
properties. Biochimica et Biophysica Acta (BBA) - Biomembranes. 1861:1338–
1345.
105. Land, M., Hauser, L., Jun, S.-R., Nookaew, I., Leuze, M. R., Ahn, T.-H.,
et al. 2015. Insights from 20 years of bacterial genome sequencing. Functional &
Integrative Genomics. 15:141–161.
106. Langille, M. G. I., Zaneveld, J., Caporaso, J. G., McDonald, D., Knights,
D., Reyes, J. A., et al. 2013. Predictive functional profiling of microbial
communities using 16S rRNA marker gene sequences. Nat Biotechnol. 31:814–
821.
107. Lebeis, S. L., Paredes, S. H., Lundberg, D. S., Breakfield, N., Gehring, J.,
McDonald, M., et al. 2015. Salicylic acid modulates colonization of the root
microbiome by specific bacterial taxa. Science. 349:860–864.
108. Lee, M. Happy Belly Bioinformatics: an open-source resource dedicated
to helping biologists utilize bioinformatics. Journal of Open Source Education. 4.
109. Lefèvre, E., Gardner, C. M., and Gunsch, C. K. 2020. A novel PCR-
clamping assay reducing plant host DNA amplification significantly improves
prokaryotic endo-microbiome community characterization. FEMS Microbiology
Ecology. 96:fiaa110.
110. Letunic, I., and Bork, P. 2019. Interactive Tree Of Life (iTOL) v4: recent
updates and new developments. Nucleic Acids Research. 47:W256–W259.
111. Li, S., Wang, J., Gao, N., Liu, L., and Chen, Y. 2017. The effects of
Pantoea sp. strain Y4-4 on alfalfa in the remediation of heavy-metal-contaminated
soil, and auxiliary impacts of plant residues on the remediation of saline–alkali
soils. Can. J. Microbiol. 63:278–286.
239
112. Li, X., Yang, Y., Henry, R. J., Rossetto, M., Wang, Y., and Chen, S. 2015.
Plant DNA barcoding: from gene to genome: Plant identification using DNA
barcodes. Biol Rev. 90:157–166.
113. Lipton, D. S., Blanchar, R. W., and Blevins, D. G. 1987. Citrate, Malate,
and Succinate Concentration in Exudates from P-Sufficient and P-Stressed
Medicago sativa L. Seedlings. Plant Physiol. 85:315–317.
114. Lissbrant, S., Berg, W. K., Volenec, J., Brouder, S., Joern, B.,
Cunningham, S., et al. Phosphorus and Potassium Fertilization of Alfalfa. :6.
115. Liu, C., Qi, R.-J., Jiang, J.-Z., Zhang, M.-Q., and Wang, J.-Y. 2019.
Development of a Blocking Primer to Inhibit the PCR Amplification of the 18S
rDNA Sequences of Litopenaeus vannamei and Its Efficacy in Crassostrea
hongkongensis. Frontiers in Microbiology. 10.
116. Liu, H., Carvalhais, L. C., Crawford, M., Singh, E., Dennis, P. G.,
Pieterse, C. M. J., et al. 2017. Inner Plant Values: Diversity, Colonization and
Benefits from Endophytic Bacteria. Front. Microbiol. 8:2552.
117. Liu, Z., Beskrovnaya, P., Melnyk, R. A., Hossain, S. S., Khorasani, S.,
O’Sullivan, L. R., et al. 2018. A Genome-Wide Screen Identifies Genes in
Rhizosphere- Associated Pseudomonas Required to Evade Plant Defenses. 9:17.
118. Lledo, M. D., Crespo, M. B., Cameron, K. M., Fay, M. F., and Chase, M.
W. 1998. Systematics of Plumbaginaceae Based upon Cladistic Analysis of rbcL
Sequence Data. Systematic Botany. 23:21.
119. Lloyd, K. G., Steen, A. D., Ladau, J., Yin, J., and Crosby, L. 2018.
Phylogenetically Novel Uncultured Microbial Cells Dominate Earth Microbiomes
ed. Josh D. Neufeld. mSystems. 3:e00055-18, /msystems/3/5/msys.00055-
18.atom.
120. Lollato, R. P., and Min, D. 2017. Alfalfa Growth and Development. K-
State Research and Development.
121. López, J. L., Alvarez, F., Príncipe, A., Salas, M. E., Lozano, M. J., Draghi,
W. O., et al. 2018. Isolation, taxonomic analysis, and phenotypic characterization
of bacterial endophytes present in alfalfa (Medicago sativa) seeds. Journal of
Biotechnology. 267:55–62.
122. López-Bucio, J., de la Vega, O. M., Guevara-García, A., and Herrera-
Estrella, L. 2000. Enhanced phosphorus uptake in transgenic tobacco plants that
overproduce citrate. Nature Biotechnology. 18:450–453.
123. Lundberg, D. S., Lebeis, S. L., Paredes, S. H., Yourstone, S., Gehring, J.,
Malfatti, S., et al. 2012. Defining the core Arabidopsis thaliana root microbiome.
Nature. 488:86–90.
124. Lundberg, D. S., Yourstone, S., Mieczkowski, P., Jones, C. D., and Dangl,
J. L. 2013a. Practical innovations for high-throughput amplicon sequencing.
Nature Methods. 10:999–1002.
125. Lymperopoulou, D. S., Adams, R. I., and Lindow, S. E. 2016.
Contribution of Vegetation to the Microbial Composition of Nearby Outdoor Air
ed. F. E. Löffler. Appl. Environ. Microbiol. 82:3822–3833.
240
126. Lynne, A. M., Haarmann, D., and Louden, B. C. 2011. Use of Blue Agar
CAS Assay for Siderophore Detection. Journal of Microbiology & Biology
Education. 12:51–53.
127. Magnani, G. S., Cruz, L. M., Weber, H., Bespalhok, J. C., Daros, E.,
Baura, V., et al. 2013. Culture-independent analysis of endophytic bacterial
communities associated with Brazilian sugarcane. Genet. Mol. Res. 12:4549–
4558.
128. Maignien, L., DeForce, E. A., Chafee, M. E., Eren, A. M., and Simmons,
S. L. 2014. Ecological Succession and Stochastic Variation in the Assembly of
Arabidopsis thaliana Phyllosphere Communities. mBio. 5.
129. Mallarino, A. P., and Ortiz-Torres, E. A long-term look at crop rotation
effects on corn yield and response to nitrogen fertilization. :9.
130. Mcghee, R. B., and Mcghee, A. H. 1979. Biology and Structure of
Phytomonas staheli sp. n., a Trypanosomatid Located in Sieve Tubes of Coconut
and Oil Palms. The Journal of Protozoology. 26:348–351.
131. McMurdie, P. J., and Holmes, S. 2013. phyloseq: An R Package for
Reproducible Interactive Analysis and Graphics of Microbiome Census Data ed.
Michael Watson. PLoS ONE. 8:e61217.
132. McMurdie, P. J., and Holmes, S. 2014. Waste Not, Want Not: Why
Rarefying Microbiome Data Is Inadmissible ed. Alice Carolyn McHardy. PLoS
Computational Biology. 10:e1003531.
133. Melnyk, R. A., Clark, I. C., Liao, A., and Coates, J. D. 2013. Transposon
and Deletion Mutagenesis of Genes Involved in Perchlorate Reduction in
Azospira suillum PS eds. Kenneth Nealson and Douglas G. Capone. mBio.
5:e00769-13.
134. Mesarich, C. H., Rees-George, J., Gardner, P. P., Ghomi, F. A., Gerth, M.
L., Andersen, M. T., et al. 2017. Transposon insertion libraries for the
characterization of mutants from the kiwifruit pathogen Pseudomonas syringae
pv. actinidiae ed. Mikael Skurnik. PLoS ONE. 12:e0172790.
135. Michaud, R., Lehman, W., and Rumbaugh, M. 1988. Alfalfa and Alfalfa
improvement. In World distribution and historical developments,.
136. Miller, C. S., Handley, K. M., Wrighton, K. C., Frischkorn, K. R.,
Thomas, B. C., and Banfield, J. F. 2013. Short-Read Assembly of Full-Length
16S Amplicons Reveals Bacterial Diversity in Subsurface Sediments ed. Jack
Anthony Gilbert. PLoS ONE. 8:e56018.
137. Moccia, K., Papoulis, S., Willems, A., Marion, Z., Fordyce, J., and Lebeis,
S. 2020. Using the Microbiome Amplification Preference Tool (MAPT) to reveal
Medicago sativa associated eukaryotic microbes. Phytobiomes Journal.
:PBIOMES-02-20-0022-R.
138. Moccia, K., Willems, A., Papoulis, S., Flores, A., Forister, M. L., Fordyce,
J. A., et al. 2020. Distinguishing nutrient‐dependent plant driven bacterial
colonization patterns in alfalfa. Environmental Microbiology Reports. 12:70–77.
241
139. Mohammadi, M., Burbank, L., and Roper, M. C. 2012. Biological Role of
Pigment Production for the Bacterial Phytopathogen Pantoea stewartii subsp.
stewartii. Appl. Environ. Microbiol. 78:6859–6865.
140. de Moraes, M. H., Desai, P., Porwollik, S., Canals, R., Perez, D. R., Chu,
W., et al. 2017. Salmonella Persistence in Tomatoes Requires a Distinct Set of
Metabolic Functions Identified by Transposon Insertion Sequencing ed. Harold L.
Drake. Applied and Environmental Microbiology. 83.
141. Morgan, A.-M. 2012. “Me as a Science Teacher”: Responding to a Small
Network Survey to Assist Teachers with Subject-Specific Literacy Demands in
the Middle Years of Schooling. AJTE. 37
142. Morin, M., Pierce, E. C., and Dutton, R. J. 2018. Changes in the genetic
requirements for microbial interactions with increasing community complexity.
eLife. 7:e37072.
143. Mus, F., Crook, M. B., Garcia, K., Garcia Costas, A., Geddes, B. A.,
Kouri, E. D., et al. 2016. Symbiotic Nitrogen Fixation and the Challenges to Its
Extension to Nonlegumes ed. R. M. Kelly. Appl. Environ. Microbiol. 82:3698–
3710.
144. Nadarasah, G., and Stavrinides, J. 2014. Quantitative evaluation of the
host-colonizing capabilities of the enteric bacterium Pantoea using plant and
insect hosts. Microbiology. 160:602–615.
145. NAFA. 2018. Alfalfa - 3rd Most Valuble Field Crop in the U.S. Hay and
Forage Grower.
146. NASS. 2019. Census of Agriculture, United States. U.S. Department of
Agriculture’s National Agricultural Statistics Service. 1.
147. Needham, D. M., Fichot, E. B., Wang, E., Berdjeb, L., Cram, J. A., Fichot,
C. G., et al. 2018. Dynamics and interactions of highly resolved marine plankton
via automated high-frequency sampling. The ISME Journal. 12:2417–2432.
148. Nilsson, R. H., Anslan, S., Bahram, M., Wurzbacher, C., Baldrian, P., and
Tedersoo, L. 2019. Mycobiome diversity: high-throughput sequencing and
identification of fungi. Nat Rev Microbiol. 17:95–109.
149. Nilsson, R. H., Kristiansson, E., Ryberg, M., Hallenberg, N., and Larsson,
K.-H. 2008. Intraspecific ITS Variability in the Kingdom Fungi as Expressed in
the International Sequence Databases and Its Implications for Molecular Species
Identification. Evolutionary Bioinformatics. 4:EBO.S653.
150. Niu, B., Paulson, J. N., Zheng, X., and Kolter, R. 2017. Simplified and
representative bacterial community of maize roots. Proceedings of the National
Academy of Sciences. 114:E2450–E2459.
151. O’Banion, B. S., O’Neal, L., Alexandre, G., and Lebeis, S. L. 2020.
Bridging the Gap Between Single-Strain and Community-Level Plant-Microbe
Chemical Interactions. MPMI. 33:124–134.
152. O’Neal, L., Vo, L., and Alexandre, G. 2020. Specific Root Exudate
Compounds Sensed by Dedicated Chemoreceptors Shape Azospirillum brasilense
Chemotaxis in the Rhizosphere ed. Rebecca E. Parales. Appl Environ Microbiol.
86:e01026-20, /aem/86/15/AEM.01026-20.atom.
242
153. van Opijnen, T., and Camilli, A. 2013. Transposon insertion sequencing: a
new tool for systems-level analysis of microorganisms. Nature Reviews
Microbiology. 11:435–442.
154. van Opijnen, T., Lazinski, D. W., and Camilli, A. 2017. Genome-Wide
Fitness and Genetic Interactions Determined by Tn-seq, a High-Throughput
Massively Parallel Sequencing Method for Microorganisms: Tn-seq: High-
Throughput Sequencing for Microorganisms. Current Protocols in Microbiology.
36:1E.3.1-1E.3.24.
155. Ørum, H., Nielsen, P. E., Egholm, M., Berg, R. H., Buchardt, O., and
Stanley, C. 1993. Single base pair mutation analysis by PNA directed PCR
clamping. Nucl Acids Res. 21:5332–5336.
156. O’Toole, G. A. 2011. Microtiter Dish Biofilm Formation Assay. JoVE.
:2437.
157. Parada, A. E., Needham, D. M., and Fuhrman, J. A. 2016. Every base
matters: assessing small subunit rRNA primers for marine microbiomes with
mock communities, time series and global field samples: Primers for marine
microbiome studies. Environmental Microbiology. 18:1403–1414.
158. Parmar, and Sindhu. Rhizosphere Bacteria, Potassium Solubilization,
Mica Powder, Sugars, Environmental Conditions. :8.
159. Perry, B. J., and Yost, C. K. 2014. Construction of a mariner-based
transposon vector for use in insertion sequence mutagenesis in selected members
of the Rhizobiaceae. BMC Microbiol. 14:298.
160. Peters, N. K., and Long, S. R. 1988. Alfalfa Root Exudates and
Compounds which Promote or Inhibit Induction of Rhizobium meliloti
Nodulation Genes. Plant Physiol. 88:396–400.
161. Pini, F., Frascella, A., Santopolo, L., Bazzicalupo, M., Biondi, E. G.,
Scotti, C., et al. 2012. Exploring the plant-associated bacterial communities in
Medicago sativa L. BMC Microbiol. 12:78.
162. Pinto-Tomas, A. A., Anderson, M. A., Suen, G., Stevenson, D. M., Chu,
F. S. T., Cleland, W. W., et al. 2009. Symbiotic Nitrogen Fixation in the Fungus
Gardens of Leaf-Cutter Ants. Science. 326:1120–1123.
163. Ploch, S., Rose, L. E., Bass, D., and Bonkowski, M. 2016. High Diversity
Revealed in Leaf-Associated Protists (Rhizaria: Cercozoa) of Brassicaceae.
Journal of Eukaryotic Microbiology. 63:635–641.
164. Price, M. N., Dehal, P. S., and Arkin, A. P. 2010. FastTree 2 –
Approximately Maximum-Likelihood Trees for Large Alignments ed. Art F. Y.
Poon. PLoS ONE. 5:e9490.
165. Price, M. N., Wetmore, K. M., Waters, R. J., Callaghan, M., Ray, J., Liu,
H., et al. 2018. Mutant phenotypes for thousands of bacterial genes of unknown
function. Nature. 557:503–509.
166. Quecine, M. C., Araújo, W. L., Rossetto, P. B., Ferreira, A., Tsui, S.,
Lacava, P. T., et al. 2012a. Sugarcane Growth Promotion by the Endophytic
Bacterium Pantoea agglomerans 33.1. Applied and Environmental Microbiology.
78:7511–7518.
243
167. Quecine, M. C., Araújo, W. L., Rossetto, P. B., Ferreira, A., Tsui, S.,
Lacava, P. T., et al. 2012b. Sugarcane Growth Promotion by the Endophytic
Bacterium Pantoea agglomerans 33.1. Appl. Environ. Microbiol. 78:7511–7518.
168. Regalado, J., Lundberg, D. S., Deusch, O., Kersten, S., Karasov, T.,
Poersch, K., et al. 2020a. Combining whole-genome shotgun sequencing and
rRNA gene amplicon analyses to improve detection of microbe–microbe
interaction networks in plant leaves. ISME J.
169. Rezzonico, F., Smits, T. H. M., Born, Y., Blom, J., Frey, J. E., Goesmann,
A., et al. 2016. Erwinia gerundensis sp. nov., a cosmopolitan epiphyte originally
isolated from pome fruit trees. International Journal of Systematic and
Evolutionary Microbiology. 66:1583–1592.
170. Rezzonico, F., Smits, T. H. M., and Duffy, B. 2012. Misidentification
slanders Pantoea agglomerans as a serial killer. Journal of Hospital Infection.
81:137–139.
171. Rojas-González, J. A., Soto-Súarez, M., García-Díaz, Á., Romero-Puertas,
M. C., Sandalio, L. M., Mérida, Á., et al. 2015. Disruption of both chloroplastic
and cytosolic FBPase genes results in a dwarf phenotype and important starch and
metabolite changes in Arabidopsis thaliana. Journal of Experimental Botany.
66:2673–2689.
172. Roper, M. C. 2011. Pantoea stewartii subsp. stewartii: lessons learned
from a xylem-dwelling pathogen of sweet corn: Pantoea stewartii subsp. stewartii.
Molecular Plant Pathology. 12:628–637.
173. Rosselló-Móra, R. 2012. Towards a taxonomy of Bacteria and Archaea
based on interactive and cumulative data repositories: Towards a database-centred
taxonomy. Environmental Microbiology. 14:318–334.
174. Ruben, J. A., and Bennett, A. F. 1980. Antiquity of the vertebrate pattern
of activity metabolism and its possible relation to vertebrate origins. Nature.
286:886–888.
175. Ruppel, S., Hecht-Buchholz, C., Remus, R., Ortmann, U., and Schmelzer,
R. 1992. Settlement of the diazotrophic, phytoeffective bacterial strain Pantoea
agglomerans on and within winter wheat: An investigation using ELISA and
transmission electron microscopy. Plant Soil. 145:261–273.
176. Sakai, M., and Ikenaga, M. 2013. Application of peptide nucleic acid
(PNA)-PCR clamping technique to investigate the community structures of
rhizobacteria associated with plant roots. Journal of Microbiological Methods.
92:281–288.
177. Sarnataro, C., Petri, R. M., Spanghero, M., Zebeli, Q., and Klevenhusen,
F. 2019. A nutritional and rumen ecological evaluation of the biorefinery by‐
product alfalfa silage cake supplemented with Scrophularia striata extract using
the rumen simulation technique. J. Sci. Food Agric. 99:4414–4422.
178. Sato, S., Nakamura, Y., Kaneko, T., Asamizu, E., Kato, T., Nakao, M., et
al. 2008. Genome Structure of the Legume, Lotus japonicus. DNA Research.
15:227–239.
244
179. Scheublin, T. R., and Leveau, J. H. J. 2013. Isolation of Arthrobacter
species from the phyllosphere and demonstration of their epiphytic fitness.
MicrobiologyOpen. 2:205–213.
180. Schlatter, D., Kinkel, L., Thomashow, L., Weller, D., and Paulitz, T. 2017.
Disease Suppressive Soils: New Insights from the Soil Microbiome.
Phytopathology. 107:1284–1297.
181. Schmutz, J., Cannon, S. B., Schlueter, J., Ma, J., Mitros, T., Nelson, W., et
al. 2010. Genome sequence of the palaeopolyploid soybean. Nature. 463:178–
183.
182. Schoch, C. L., Seifert, K. A., Huhndorf, S., Robert, V., Spouge, J. L.,
Levesque, C. A., et al. 2012. Nuclear ribosomal internal transcribed spacer (ITS)
region as a universal DNA barcode marker for Fungi. Proceedings of the National
Academy of Sciences. 109:6241–6246.
183. Schreier, T. B., Cléry, A., Schläfli, M., Galbier, F., Stadler, M., Demarsy,
E., et al. 2018. Plastidial NAD-Dependent Malate Dehydrogenase: A
Moonlighting Protein Involved in Early Chloroplast Development through Its
Interaction with an FtsH12-FtsHi Protease Complex. Plant Cell. 30:1745–1769.
184. Schwelm, A., Badstöber, J., Bulman, S., Desoignies, N., Etemadi, M.,
Falloon, R. E., et al. 2018. Not in your usual Top 10: protists that infect plants and
algae: Protists in plant pathology. Molecular Plant Pathology. 19:1029–1044.
185. Sedkova, N., Tao, L., Rouviere, P. E., and Cheng, Q. 2005. Diversity of
Carotenoid Synthesis Gene Clusters from Environmental Enterobacteriaceae
Strains. Applied and Environmental Microbiology. 71:8141–8146.
186. Serrania, J., Johner, T., Rupp, O., Goesmann, A., and Becker, A. 2017.
Massive parallel insertion site sequencing of an arrayed Sinorhizobium meliloti
signature-tagged mini-Tn 5 transposon mutant library. Journal of Biotechnology.
257:9–12.
187. Setiawati, T. C., and Mutmainnah, L. 2016. Solubilization of Potassium
Containing Mineral by Microorganisms From Sugarcane Rhizosphere.
Agriculture and Agricultural Science Procedia. 9:108–117.
188. Shade, A., McManus, P. S., and Handelsman, J. 2013. Unexpected
Diversity during Community Succession in the Apple Flower Microbiome ed.
Jizhong Zhou. mBio. 4.
189. Sivakumar, R., Ranjani, J., Vishnu, U. S., Jayashree, S., Lozano, G. L.,
Miles, J., et al. Evaluation of INSeq To Identify Genes Essential for Pseudomonas
aeruginosa PGPR2 Corn Root Colonization. :11.
190. Slater, B. J., McLoughlin, S., and Hilton, J. 2013. Peronosporomycetes
(Oomycota) from a Middle Permian Permineralised Peat within the Bainmedart
Coal Measures, Prince Charles Mountains, Antarctica ed. Carles Lalueza-Fox.
PLoS ONE. 8:e70707.
191. Soomets, U., Hällbrink, M., and Langel, Ü.Antisense Properties of Peptide
Nucleic Acids. :5.
245
192. de Souza, R. S. C., Okura, V. K., Armanhi, J. S. L., Jorrín, B., Lozano, N.,
da Silva, M. J., et al. 2016. Unlocking the bacterial and fungal communities
assemblages of sugarcane microbiome. Sci Rep. 6:28774.
193. Stanford, A. M., Harden, R., and Parks, C. R. 2000. Phylogeny and
biogeography of Juglans (Juglandaceae) based on matK and ITS sequence data.
American Journal of Botany. 87:872–882.
194. Steenhoudt, O., and Vanderleyden, J. 2000. Azospirillum , a free-living
nitrogen-fixing bacterium closely associated with grasses: genetic, biochemical
and ecological aspects. FEMS Microbiol Rev. 24:487–506.
195. Stiefel, P., Zambelli, T., and Vorholt, J. A. 2013. Isolation of Optically
Targeted Single Bacteria by Application of Fluidic Force Microscopy to Aerobic
Anoxygenic Phototrophs from the Phyllosphere. Applied and Environmental
Microbiology. 79:4895–4905.
196. Stockwell, V. O., Johnson, K. B., Sugar, D., and Loper, J. E. 2010.
Control of Fire Blight by Pseudomonas fluorescens A506 and Pantoea vagans C9-
1 Applied as Single Strains and Mixed Inocula. Phytopathology®. 100:1330–
1339.
197. Szkop, M., Sikora, P., and Orzechowski, S. 2012. A novel, simple, and
sensitive colorimetric method to determine aromatic amino acid aminotransferase
activity using the Salkowski reagent. Folia Microbiologica. 57:1–4.
198. Takahashi-Íñiguez, T., Aburto-Rodríguez, N., Vilchis-González, A. L.,
and Flores, M. E. 2016. Function, kinetic properties, crystallization, and
regulation of microbial malate dehydrogenase. J. Zhejiang Univ. Sci. B. 17:247–
261.
199. Terahara, T., Chow, S., Kurogi, H., Lee, S.-H., Tsukamoto, K., Mochioka,
N., et al. 2011. Efficiency of Peptide Nucleic Acid-Directed PCR Clamping and
Its Application in the Investigation of Natural Diets of the Japanese Eel
Leptocephali ed. Brett Neilan. PLoS ONE. 6:e25715.
200. The Plant List. 2013. The Plant List. Available at:
http://www.theplantlist.org/.
201. Thompson, L. R., McDOnald, D., Amir, A., Ladau, J., and Locey, K. J.
2017. A communal catalogue reveals Earth’s multiscale microbial diversity.
Nature.
202. Truyens, S., Weyens, N., Cuypers, A., and Vangronsveld, J. 2015.
Bacterial seed endophytes: genera, vertical transmission and interaction with
plants: Bacterial seed endophytes. Environmental Microbiology Reports. 7:40–50.
203. Turner, T. R., James, E. K., and Poole, P. The Plant Microbiome. Genome
Biology. 209.
204. USDA. 2019. Crop Production 2019 Summary 01/10/2020. Crop
Production. :124.
205. de Vargas, C., Audic, S., Henry, N., Decelle, J., Mahe, F., Logares, R., et
al. 2015. Eukaryotic plankton diversity in the sunlit ocean. Science.
348:1261605–1261605.
246
206. Völksch, B., Thon, S., Jacobsen, I. D., and Gube, M. 2009. Polyphasic
study of plant- and clinic-associated Pantoea agglomerans strains reveals
indistinguishable virulence potential. Infection, Genetics and Evolution. 9:1381–
1391.
207. Vorholt, J. A. 2012. Microbial life in the phyllosphere. Nature Reviews
Microbiology. 10:828–840.
208. Wagner, S. C. 2011. Biological Nitrogen Fixation. Nature Education. :10–
15.
209. Walcott, R. R., Gitaitis, R. D., Castro, A. C., Sanders, F. H., and Diaz-
Perez, J. C. 2002. Natural Infestation of Onion Seed by Pantoea ananatis , Causal
Agent of Center Rot. Plant Disease. 86:106–111.
210. Walterson, A. M., and Stavrinides, J. 2015. Pantoea: insights into a highly
versatile and diverse genus within the Enterobacteriaceae ed. Jan Roelof van der
Meer. FEMS Microbiology Reviews. 39:968–984.
211. Wang, Y., Ren, W., Li, Y., Xu, Y., Teng, Y., Christie, P., et al. 2019.
Nontargeted metabolomic analysis to unravel the impact of di (2-ethylhexyl)
phthalate stress on root exudates of alfalfa (Medicago sativa). Science of The
Total Environment. 646:212–219.
212. Weirauch, C., and Schuh, R. T. 2011. Systematics and Evolution of
Heteroptera: 25 Years of Progress. Annual Review of Entomology. 56:487–510.
213. Wetmore, K. M., Price, M. N., Waters, R. J., Lamson, J. S., He, J.,
Hoover, C. A., et al. 2015. Rapid Quantification of Mutant Fitness in Diverse
Bacteria by Sequencing Randomly Bar-Coded Transposons ed. Mary Ann Moran.
mBio.
214. White, T. J., Bruns, T., Lee, S., and Taylor, J. 1990. Amplification and
Direct Sequencing of Fungal Ribosomal RNA Genes for Phylogenetics. In PCR
Protocols: A Guide to Methods and Applications, , p. 315–322.
215. Wigley, K., Moot, D., Wakelin, S. A., Laugraud, A., Blond, C., Seth, K.,
et al. 2017. Diverse bacterial taxa inhabit root nodules of lucerne (Medicago
sativa L.) in New Zealand pastoral soils. Plant Soil. 420:253–262.
216. Williams-Linera, G., and Ewel, J. J. 1984. Effect of autoclave sterilization
of a tropical andept on seed germination and seedling growth. Plant Soil. 82:263–
268.
217. von Wintzingerode, F., Landt, O., Ehrlich, A., and Göbel, U. B. 2000.
Peptide Nucleic Acid-Mediated PCR Clamping as a Useful Supplement in the
Determination of Microbial Diversity. Appl. Environ. Microbiol. 66:549–557.
218. Woodruff, L., Cannon, W. F., Smith, D. B., and Solano, F. 2015. The
distribution of selected elements and minerals in soil of the conterminous United
States. Journal of Geochemical Exploration. 154:49–60.
219. Xiao, X., Chen, W., Zong, L., Yang, J., Jiao, S., Lin, Y., et al. 2017. Two
cultivated legume plants reveal the enrichment process of the microbiome in the
rhizocompartments. Mol Ecol. 26:1641–1651.
220. Yamamoto, K., Shiwa, Y., Ishige, T., Sakamoto, H., Tanaka, K., Uchino,
M., et al. 2018. Bacterial Diversity Associated With the Rhizosphere and
247
Endosphere of Two Halophytes: Glaux maritima and Salicornia europaea. Front.
Microbiol. 9:2878.
221. Yang, L.-L., Tang, S.-K., Chu, X., Jiang, Z., Xu, L.-H., and Zhi, X.-Y.
2016. Oceanobacillus endoradicis sp. nov., an endophytic bacterial species
isolated from the root of Paris polyphylla Smith var. yunnanensis. Antonie van
Leeuwenhoek. 109:957–964.
222. Yarza, P., Yilmaz, P., Pruesse, E., Glöckner, F. O., Ludwig, W., Schleifer,
K.-H., et al. 2014. Uniting the classification of cultured and uncultured bacteria
and archaea using 16S rRNA gene sequences. Nature Reviews Microbiology.
12:635–645.
223. Yeoh, Y. K., Paungfoo-Lonhienne, C., Dennis, P. G., Robinson, N.,
Ragan, M. A., Schmidt, S., et al. 2016. The core root microbiome of sugarcanes
cultivated under varying nitrogen fertilizer application: N fertilizer and sugarcane
root microbiota. Environmental Microbiology. 18:1338–1351.
224. Yilmaz, P., Parfrey, L. W., Yarza, P., Gerken, J., Pruesse, E., Quast, C., et
al. 2014. The SILVA and “All-species Living Tree Project (LTP)” taxonomic
frameworks. Nucl. Acids Res. 42:D643–D648.
225. Yu, K., Liu, Y., Tichelaar, R., Savant, N., Lagendijk, E., van Kuijk, S. J.
L., et al. 2019. Rhizosphere-Associated Pseudomonas Suppress Local Root
Immune Responses by Gluconic Acid-Mediated Lowering of Environmental pH.
Current Biology. 29:3913-3920.e4.
226. Yuan, J., Zhao, J., Wen, T., Zhao, M., Li, R., Goossens, P., et al. 2018.
Root exudates drive the soil-borne legacy of aboveground pathogen infection.
Microbiome.
227. Zarraonaindia, I., Owens, S. M., Weisenhorn, P., West, K., Hampton-
Marcell, J., Lax, S., et al. 2015. The Soil Microbiome Influences Grapevine-
Associated Microbiota ed. Janet K. Jansson. mBio. 6:e02527-14.
228. Zhalnina, K., Louie, K. B., Hao, Z., Mansoori, N., da Rocha, U. N., Shi,
S., et al. 2018. Dynamic root exudate chemistry and microbial substrate
preferences drive patterns in rhizosphere microbial community assembly. Nature
Microbiology. 3:470–480.

248
APPENDIX: CREATING AND ASSESSING A
TEACHING MODULE FOR PLANT, MICROBE,
AND NUTRIENT INTERACTIONS
249
Appendix Contributions:
Katherine Moccia and Sarah Lebeis designed and conducted all portions of the learning
module and assessments. Katherine Moccia designed and assembled activity kits, led the
PowerPoint lecture, and analyzed participant responses. Kelly Townsend and Anne
Martin performed follow up survey, compiled responses, and assisted in analysis.
Abstract:
A teaching module on the topic of plant, microbe and nutrient interactions was
presented to 15 elementary, middle, and high school teachers in June of 2019. The goal
was to teach experimental design by demonstrating how scientists untangle the complex
web of plant, microbe, and nutrient interactions. Participants were given a presentation on
how these threes variable interact, and then allowed to design guided experiments using
the activity kit provided. According to a mixture of multiple choice and short response
surveys regarding the module, confidence in the teaching material rose significantly.
Responses from participants indicated areas where improvement was needed. Here we
summarize the module and suggest improvements for future teaching sessions.
Introduction:
Overall goals of the teaching module
As part of the NSF Career Award “Defining colonization mechanisms and
functions of Streptomyces strains in root microbiomes”, we developed a classroom
module to provide teachers with the materials and knowledge necessary to teach students
about the importance of plant-microbe interactions. The lesson plan was geared towards
teaching 7th grade science teachers but was offered as a training to teachers of all
disciplines and grade levels. As a result, fifteen elementary, middle, and high school
teachers from a variety of disciplines participated in the module. During the lesson, there
250
were two main learning objectives. The first goal was to provide sufficient scientific
background to understand the interactions between plants, nutrients, and microbes. We
sought to contextualize these interactions for the participants in worldwide food
production, which allowed us to emphasize that each of these three variables are
necessary for the success of the others. The second goal was to teach a standard scientific
experimental design, where one variable is modified at a time, in order to improve
understanding of the scientific method in the classroom. By modulating one variable at a
time, we introduced the concepts of controls and isolation of variables in a tangible way.
Thus, the experiments performed by the teachers serve to instruct them about plant,
microbe, and nutrient interactions as well as exemplify the scientific method. Ultimately,
this helps cultivate critical thinking as scientists, a core component of successful
scientific education (Clemmons et al., 2019). By teaching the appropriate experimental
design, we hope to shine a light on the scientific method so that teachers can utilize it in
the classroom.
Connections to 7th grade curricula in Tennessee
When developing our teaching module, we focused on key components taught in
7th grade classrooms to increase the relevance of the subject matter for the participants.
We identified 3 connections to the Tennessee Academic Standards for Science for 7th
grade students within our learning module. We provided the connections during our
lesson plan so that teachers were aware of how this lesson plan could connect to various
units. From the “Life Science Unit 1: Molecules to Organisms, Structure and Process”
students are expected to explain how photosynthesis is incorporated into the cycle of
251
matter and energy transfer between organisms. We emphasized how photosynthesis not
only provides carbon for the plant, but is a key component for why microbes live in, on
or around the plant. From the “Life Science Unit 2: Ecosystems, Interactions, Energy and
Dynamics” students develop a module to understand the cycle of how matter flows from
biotic to abiotic sources. We demonstrated this with carbon through the process of plant
photosynthesis. We also demonstrate this with microbial nitrogen fixation and potassium
and phosphate solubilization. From the “Earth Science Unit 3: Earth and Human
Activity” students are encouraged to develop a scientific argument for how humans
impact the climate. We introduced this by discussing the benefits and downsides aspects
of fertilizer application such as increase in biomass of plants and harmful algal blooms
from lake eutrophication.
Materials and Methods:
Lecture regarding plant, microbe, and nutrient interactions
We started with an introductory PowerPoint slide set titled “Plants, microbes and
the nutrients that bind them”. Here, we presented the three essential macronutrients that
plants require for growth (i.e. nitrogen, phosphorus and potassium) and explained that
they are frequently added to plants as fertilizers. We discussed lake eutrophication and
harmful algal blooms to demonstrate that direct application of fertilizers can be harmful
to the environment, specifically water supplies. A brief discussion of how microbes can
provide nitrogen, phosphate, and potassium for the plant from the surrounding
environment followed. While explaining now microbes can fix nitrogen for plants, we
passed around plates of a strain of Azospirillum. Azospirillum is a well-studied genera
that can fix nitrogen (Steenhoudt and Vanderleyden, 2000). For potassium and phosphate
252
solubilization, we passed around plates of Pantoea sp. R4 plated on potassium and
phosphate solubilization media. This was especially helpful, as the solubilization of
phosphate and potassium from the insoluble forms present in the agar plates is visible.
Thus, as we explained that microbes can produce organic acids that solubilize the rock
phosphate or potassium feldspar, the teachers had a visual example. We then discussed
how microbes can benefit from plants, as microbes are provided with carbon. After
contextualizing our lesson plan and identifying the three main variables that we would be
working with, we introduced the potential experimental set ups available for the teachers
to perform. These set ups were shown in graphical format to further illustrate the
importance of controlling variables for successful experiments and to help participants
visualize what each experiment entails.
Experimental design for teachers
Within our experimental set ups, participants were asked to determine which of
the three variables they would like to observe. A handout detailing potential experimental
designs was provided (Figure A.1). When choosing which variable to modulate, the term
“constants” was introduced and defined as the components of the experiment that
remained the same. To modulate microbes, we used microwaved soil then added a readily
available microbial soil amendment called RAW Microbes (NPK Industries) that helps
with plant germination and growth. Plants grown in microwaved soil with the amendment
were compared to plants grown in microwaved soil without the amendment. When plants
were chosen as the variable to investigate, teachers could choose to grow two or more of
the following plants: basil, oregano, parsley, chives, and cilantro. Once two or more
253
plants were grown, they were planted in the same soil with the same microbial
amendment. Finally, to investigate nutrients within the soil, participants could plant in
baseball soil, which is known to be devoid of nutrients, and compare the results to plants
in microwaved soil. The same microbial components would be added to each. It should
be noted that microbial components can also be viewed as nutrients, but the amount of
the microbial material added to the plant is small and likely would not significantly
increase the nutrient profile.
Materials provided for teachers
We provided teachers with all the components needed to perform each of the
three experimental set ups for a classroom of 30 students. We refer to this as an “activity
kit”. The kit included RAW microbes, thirty 4.3’’ planting pots, plastic containers of clay
and soil, and seed packets of each of the 5 herbs. Not only did this allow for easily
organized lesson plans surrounding the teaching module, it removed any cost barrier
associated with performing this lesson module within the classroom. The only materials
teachers would have to provide were water for the plants and a space for plants to grow
(e.g. a windowsill). We also provided the PowerPoint as well as links for further
classroom resources. While we did not provide plates of potassium and phosphate
solubilizing bacteria, we provided the scans of these plates in the Powerpoint
presentation. Finally, although we provided ample material, we also included a materials
list with links to Amazon so that teachers could purchase the same materials if they chose
to do the lesson plan more than once.
254
Teaching strategies utilized
To make our teaching module as interactive as possible, we attempted to teach to
auditory, visual and hands-on teaching approaches. The auditory components were the
PowerPoint lecture and a small sample of a Radiolab episode regarding plant microbe
interactions, which we listened to at the beginning of the lecture. The visual components
were the PowerPoint slides, as well as the graphical illustrations of the potential
experimental designs (Figure A.1). The hands-on components were the examples of
nitrogen fixation and potassium and phosphate solubilizing bacteria that were passed
around during the lecture, and the experiment itself. These components were incorporated
together and rotated throughout the module so auditory, visual and hands-on components
were all present every few minutes within the lesson. Call and response was also used
during the lecture with the question “If we don’t use fertilizers, where do plant nutrients
come from?” to keep participants engaged and thinking. Participants broke into groups of
4-5 to design their experiments, allowing them to discuss and decide on the appropriate
experimental design together. At the end of the module, each group shared the
experimental set up they chose and how they planned to record their results.
When designing the experiment, we left the interpretation of the results open-
ended (Figure A.1). This freedom was purposeful, as it was meant to allow participants to
think for themselves in a scientific format. Measuring plant growth can be done through
multiple approaches such as: successful germination, plant height, biomass, and number
of leaves. As these are herbs and the microbial amendment used is approved for use in a
home garden, taste could also be utilized as a metric for comparing plants. There is not
255
one correct way to measure plant growth, and by allowing the students to make their own
choices it gives them the opportunity to take further ownership of their experiments.
Post workshop survey assessments and analysis
We assessed teachers’ confidence in teaching scientific material and the overall
success of the workshop using a survey with 6 multiple choice and 3 short response
question (Figure A.2). The confidence assessment was performed after the lesson plan
(n=15), as well as one-year post (n=7) to determine if any gains made in confidence were
preserved long term. The six multiple choice questions contained options from strongly
disagree to strongly agree. These were coded from scores of 1 to 5 to allow for
quantitative analysis (Figure A.3). To assess how well we taught the background
scientific material, and how much prior knowledge the students had, we provided an
assessment with ten multiple choice questions and asked participants if the module would
prepare students for the assessment. We created one assessment for younger, K-6th grade,
and one for older, 7th-12th, grade students (Table A.1).
Results:
When choosing the experimental design, all participants were interested in
modulating the microbial amendment, suggesting potential bias of microbiology in the
lecture component. However, engagement was consistent throughout the lesson plan and
module, suggesting enthusiasm for the subject matter and the module. Prior to the
teaching module, 60% of teachers responded on the survey that they were confident
teaching students about plant microbe interactions (Figure A.3A). After the teaching
module 100% of participants indicated confidence in teaching the material. 14 out of 15
256
participants increased their confidence score after completing the teaching module, with
the final participant indicating strongly agree both times and thus already having
maximum confidence. Almost a year after completing the workshop, 7 of 15 participants
completed a follow up survey with the same questions as those in the original survey.
Confidence in teaching the material was still significantly higher than before the
workshop (Figure A.3A). Significant differences between the one year follow up and the
immediate post survey were not detected.
The teachers review of the module itself was also positive. 100% of respondents
agreed or strongly agreed that the workshop improved their understanding and provided
new perspectives on plants, microbes, and nutrient interactions (Figure A.3B, Q3). All
respondents also agreed or strongly agreed that the workshop provided the teachers with
all materials needed to perform this workshop, and that the workshop would be useful to
help students understand this subject matter (Figure A.3B, Q4 and Q5). Finally, 93%
(14/15) of respondents indicated that they intended to use this module in their own
classroom, with the remaining respondent unsure but not against using the material
(Figure A.3B, Q6).
During the survey, participants were also asked in a short response form how the
module and the training workshop could be improved (Figure A.2). While 33% did not
indicate a need for improvement of the module, 20% felt that step by step instructions
should be required for each experiment, and 13% requested additional tools/resources.
For the training workshop, participants expressed overall satisfaction with 10 of 12
responses (83%) indicating no need for change. In the review of the assessment, 60% of

257
participants thought that the learning module would prepare students for the assessment
we provided, while 20% thought that there were modifications needed to use this lesson
with elementary age students.
Discussion:
Areas of success
When reflecting as a group, one teacher mentioned that this experimental design
was not just a way to teach about plant-microbe interactions, but more importantly an
example of how to teach experimental design. This was an exciting response, as this
response highlighted both of our key objectives. The participant also noticed the
modularity of the second objective, as teaching the scientific method would benefit
students regardless of the material involved. Teachers expressed increased confidence in
teaching plant-microbe lessons within the classroom, and this confidence was still
significantly increased a year after the lesson plan (Figure A.3A). This increase in
confidence demonstrates the effectiveness of the module. Furthermore, the low
confidence in teaching plant-microbe interactions prior to this module indicates that the
teaching material provided was novel to the participants. Confidence in scientific material
is lacking in many middle and elementary school teachers (Morgan, 2016). However,
evidence suggests that by participating in scientific activities as teachers, confidence in
scientific material rises (Docherty-Skippen et al., 2020). One study demonstrated that
regardless of what their prior scientific knowledge, the most memorable portions of
scientific instruction were the experiments themselves. These indelible moments were
shown to impact the participants confidence and interest in designing experiments for
their students (Docherty-Skippen et al., 2020). This finding could explain the results
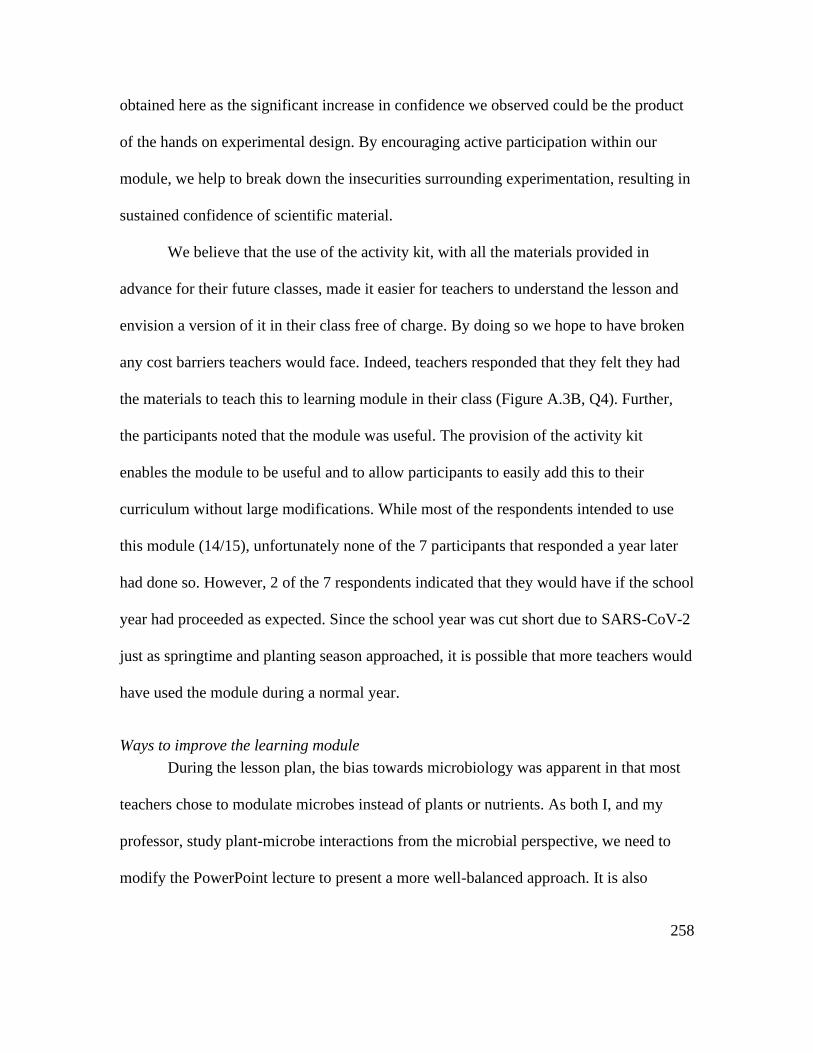
258
obtained here as the significant increase in confidence we observed could be the product
of the hands on experimental design. By encouraging active participation within our
module, we help to break down the insecurities surrounding experimentation, resulting in
sustained confidence of scientific material.
We believe that the use of the activity kit, with all the materials provided in
advance for their future classes, made it easier for teachers to understand the lesson and
envision a version of it in their class free of charge. By doing so we hope to have broken
any cost barriers teachers would face. Indeed, teachers responded that they felt they had
the materials to teach this to learning module in their class (Figure A.3B, Q4). Further,
the participants noted that the module was useful. The provision of the activity kit
enables the module to be useful and to allow participants to easily add this to their
curriculum without large modifications. While most of the respondents intended to use
this module (14/15), unfortunately none of the 7 participants that responded a year later
had done so. However, 2 of the 7 respondents indicated that they would have if the school
year had proceeded as expected. Since the school year was cut short due to SARS-CoV-2
just as springtime and planting season approached, it is possible that more teachers would
have used the module during a normal year.
Ways to improve the learning module
During the lesson plan, the bias towards microbiology was apparent in that most
teachers chose to modulate microbes instead of plants or nutrients. As both I, and my
professor, study plant-microbe interactions from the microbial perspective, we need to
modify the PowerPoint lecture to present a more well-balanced approach. It is also

259
possible that because the participants encounter plants and soil every day, but likely do
not encounter microbes with the same frequency, the microbial component added a new
perspective, and thus this contributed to the apparent bias towards microbiology. To this,
we suggest extending the lecture to include more examples of how plants and nutrients
are worthy of equal research. For example, we could include that plants themselves can
also produce low molecular weight organic acids and solubilize potassium and phosphate
without the use of microbes. Alfalfa can do this, and thus substituting alfalfa for one of
the herbs would allow participants to compare how plants grow differently when
accessing various nutrients (Li et al., 2017). Alternatively, we can also assign groups to
focus on a single variable, so that the classroom is divided evenly between each of the
three variables. This would ultimately allow for more collaboration, as groups can
converge based the variable assigned to them and then present their joint findings to the
class.
The short responses filled out by the participants indicated that step-by-step
instruction was provided in the PowerPoint but should have been provided more clearly
on the handout. This was further evident as some of the participants chose to merge
variables together, examining both different plants and different microbial amendments.
While we want to encourage the freedom to explore different experimental set ups,
modulating multiple variables per group is confusing and conflicts with the second main
objective, which was to teach the isolation of variables for proper experimental design.
Assigning groups to each variable, as suggested above, would help to solve this problem.
Further, we can improve the handout by breaking it into three distinct handouts for each

260
of the 3 variables. This would provide a handout specific to each experimental design.
Further this would reduce the information on the handout and clarify the task. To guide
students in step by step instruction, we suggest adding a series of questions to facilitate
students’ grasp of their experimental design. Choosing an experimental set up for each
group will also help to clarify instructions, as participants will not have to design the
initial experiment themselves, only how they will collect and analyze their results. We
will also extend our resources to include more material to help teachers create longer and
more in-depth lesson plans surrounding plant-microbe interactions. With the
modifications listed here, we can improve the lesson plan for future participants and
continue to increase confidence in the subject matter.
Acknowledgements:
This work was supported by the National Science Foundation, Grant #1750717 to Dr.
Sarah Lebeis. We thank Kelly Townsend and Dr. Ann Martin for acquiring follow up
surveys and compiling responses. We thank the participants of the workshop for their
enthusiastic participation and honest review of the material.
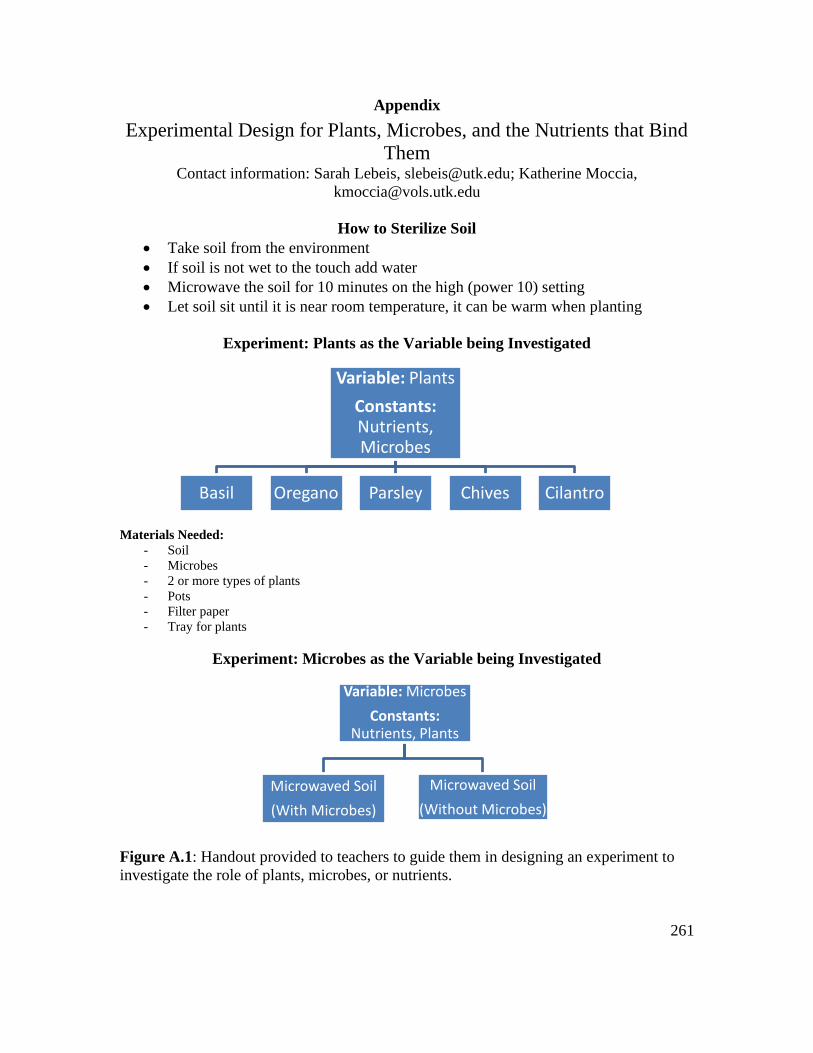
261
Appendix
Experimental Design for Plants, Microbes, and the Nutrients that Bind
Them Contact information: Sarah Lebeis, [email protected]; Katherine Moccia,
How to Sterilize Soil
• Take soil from the environment
• If soil is not wet to the touch add water
• Microwave the soil for 10 minutes on the high (power 10) setting
• Let soil sit until it is near room temperature, it can be warm when planting
Experiment: Plants as the Variable being Investigated
Materials Needed:
- Soil
- Microbes
- 2 or more types of plants
- Pots
- Filter paper
- Tray for plants
Experiment: Microbes as the Variable being Investigated
Figure A.1: Handout provided to teachers to guide them in designing an experiment to
investigate the role of plants, microbes, or nutrients.
Variable: Plants
Constants:Nutrients, Microbes
Basil Oregano Parsley Chives Cilantro
Variable: Microbes
Constants: Nutrients, Plants
Microwaved Soil
(With Microbes)
Microwaved Soil
(Without Microbes)
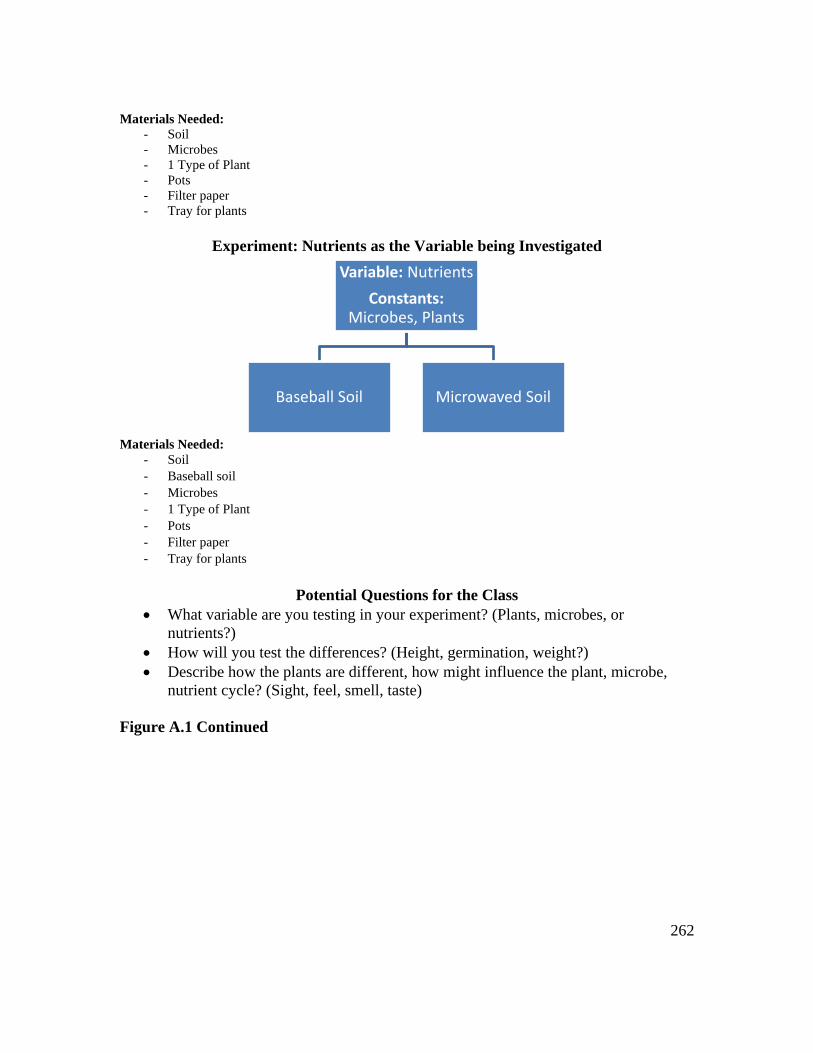
262
Materials Needed:
- Soil
- Microbes
- 1 Type of Plant
- Pots
- Filter paper
- Tray for plants
Experiment: Nutrients as the Variable being Investigated
Materials Needed:
- Soil
- Baseball soil
- Microbes
- 1 Type of Plant
- Pots
- Filter paper
- Tray for plants
Potential Questions for the Class
• What variable are you testing in your experiment? (Plants, microbes, or
nutrients?)
• How will you test the differences? (Height, germination, weight?)
• Describe how the plants are different, how might influence the plant, microbe,
nutrient cycle? (Sight, feel, smell, taste)
Figure A.1 Continued
Variable: Nutrients
Constants: Microbes, Plants
Baseball Soil Microwaved Soil

263
For each question please select which of the following best represents your position:
1. Prior to attending this workshop, I felt confident teaching my students how plants interact with
their surrounding microbes and nutrients to grow.
a. Strongly agree
b. Agree
c. Neither
d. Disagree
e. Strongly disagree
2. 2. After attending this workshop, I felt confident teaching my students how plants interact with
their surrounding microbes and nutrients to grow.
a. Strongly agree
b. Agree
c. Neither
d. Disagree
e. Strongly disagree
3. This workshop improved my understand and provided me with new perspectives on how plants
interact with their surrounding microbes and nutrients to grow.
a. Strongly agree
b. Agree
c. Neither
d. Disagree
e. Strongly disagree
4. This workshop provide me with all of the resources and materials I will need to teach my students
how plants interact with their surrounding microbes and nutrients to grow.
a. Strongly agree
b. Agree
c. Neither
d. Disagree
e. Strongly disagree
5. I believe that this module will be useful to help my students understand how plants interact with
their surrounding microbes and nutrients to grow.
a. Strongly agree
b. Agree
c. Neither
d. Disagree
e. Strongly disagree
6. I intend to use this module in my classroom.
a. Strongly agree
b. Agree
c. Neither
d. Disagree
e. Strongly disagree
7. How do you think the classroom module could be improved?
8. How do you think the training workshop could be improved?
9. Do you think the module would prepare students to answer our draft multiple-choice assessment?
Why or why not?
Figure A.2: Post-workshop teacher survey filled out by all participants.
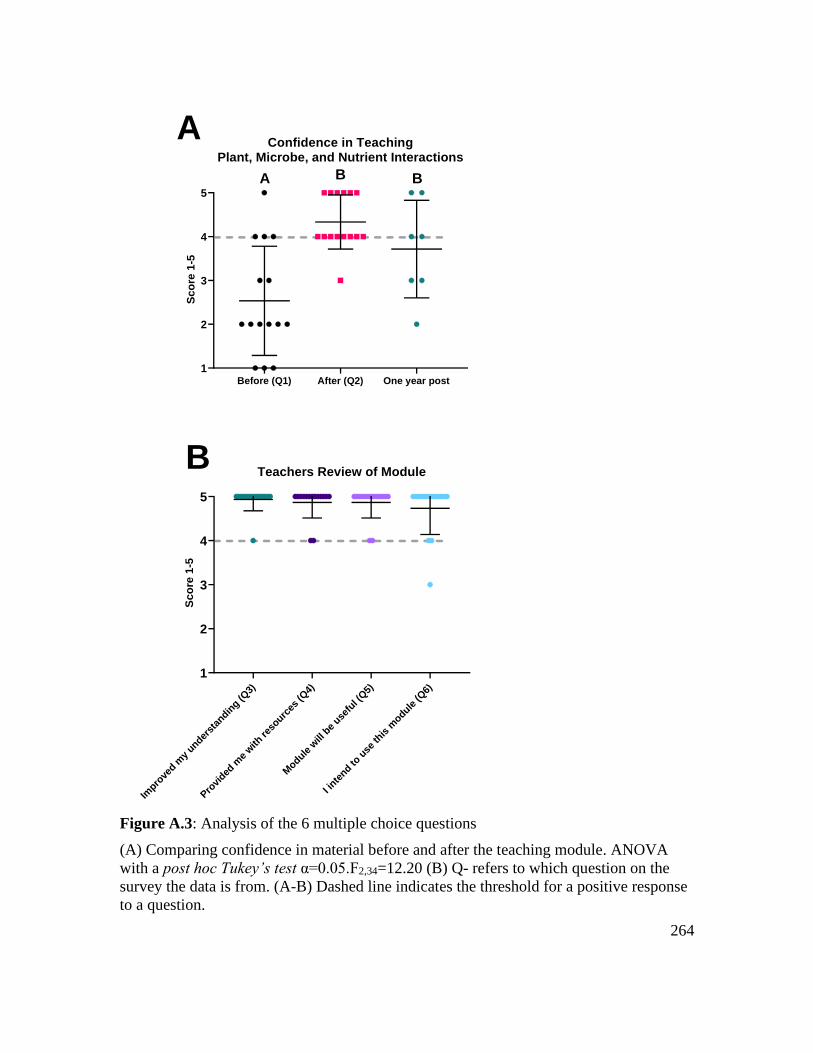
264
Impro
ved m
y under
stan
ding (Q
3)
Pro
vided
me
with
reso
urces
(Q4)
Module
will
be
usefu
l (Q5)
I inte
nd to u
se th
is m
odule (Q
6)
1
2
3
4
5
Teachers Review of Module
Sc
ore
1-5
Before (Q1) After (Q2) One year post
1
2
3
4
5
Confidence in TeachingPlant, Microbe, and Nutrient Interactions
Sc
ore
1-5
A B B
A
B
Figure A.3: Analysis of the 6 multiple choice questions
(A) Comparing confidence in material before and after the teaching module. ANOVA
with a post hoc Tukey’s test α=0.05.F2,34=12.20 (B) Q- refers to which question on the
survey the data is from. (A-B) Dashed line indicates the threshold for a positive response
to a question.
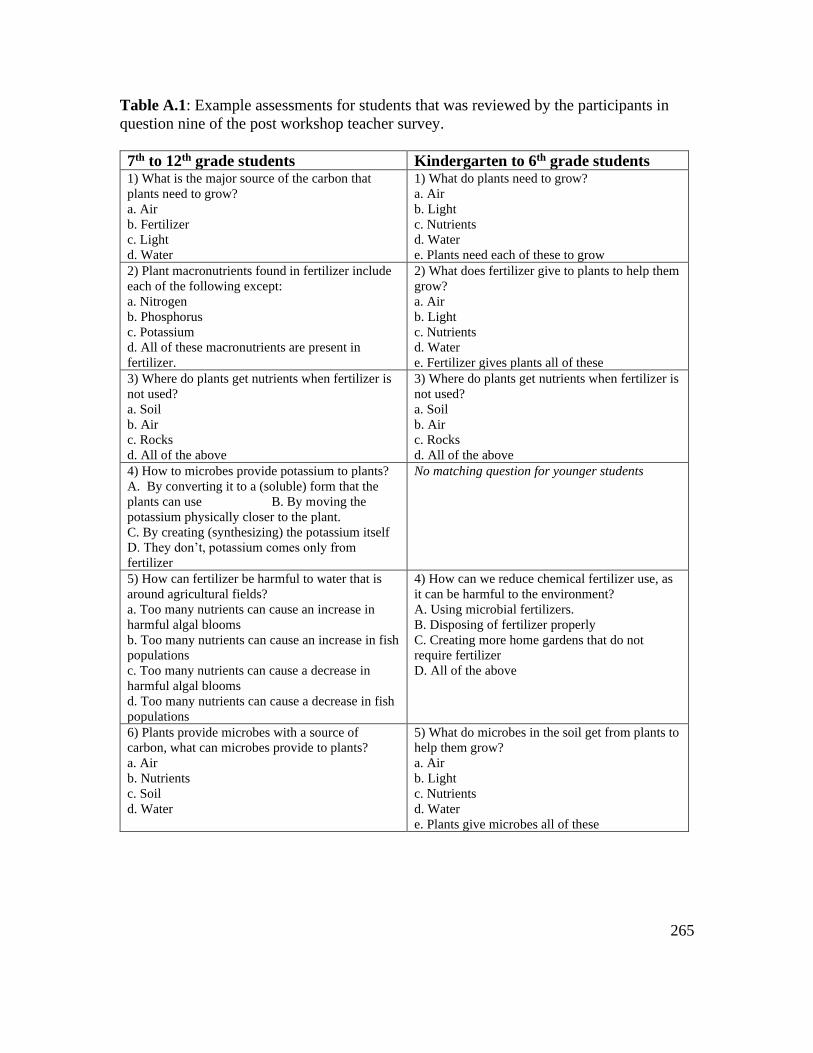
265
Table A.1: Example assessments for students that was reviewed by the participants in
question nine of the post workshop teacher survey.
7th to 12th grade students Kindergarten to 6th grade students 1) What is the major source of the carbon that
plants need to grow?
a. Air
b. Fertilizer
c. Light
d. Water
1) What do plants need to grow?
a. Air
b. Light
c. Nutrients
d. Water
e. Plants need each of these to grow 2) Plant macronutrients found in fertilizer include
each of the following except:
a. Nitrogen
b. Phosphorus
c. Potassium
d. All of these macronutrients are present in
fertilizer.
2) What does fertilizer give to plants to help them
grow?
a. Air
b. Light
c. Nutrients
d. Water
e. Fertilizer gives plants all of these 3) Where do plants get nutrients when fertilizer is
not used?
a. Soil
b. Air
c. Rocks
d. All of the above
3) Where do plants get nutrients when fertilizer is
not used?
a. Soil
b. Air
c. Rocks
d. All of the above 4) How to microbes provide potassium to plants?
A. By converting it to a (soluble) form that the
plants can use B. By moving the
potassium physically closer to the plant.
C. By creating (synthesizing) the potassium itself
D. They don’t, potassium comes only from
fertilizer
No matching question for younger students
5) How can fertilizer be harmful to water that is
around agricultural fields?
a. Too many nutrients can cause an increase in
harmful algal blooms
b. Too many nutrients can cause an increase in fish
populations
c. Too many nutrients can cause a decrease in
harmful algal blooms
d. Too many nutrients can cause a decrease in fish
populations
4) How can we reduce chemical fertilizer use, as
it can be harmful to the environment?
A. Using microbial fertilizers.
B. Disposing of fertilizer properly
C. Creating more home gardens that do not
require fertilizer
D. All of the above
6) Plants provide microbes with a source of
carbon, what can microbes provide to plants?
a. Air
b. Nutrients
c. Soil
d. Water
5) What do microbes in the soil get from plants to
help them grow?
a. Air
b. Light
c. Nutrients
d. Water
e. Plants give microbes all of these
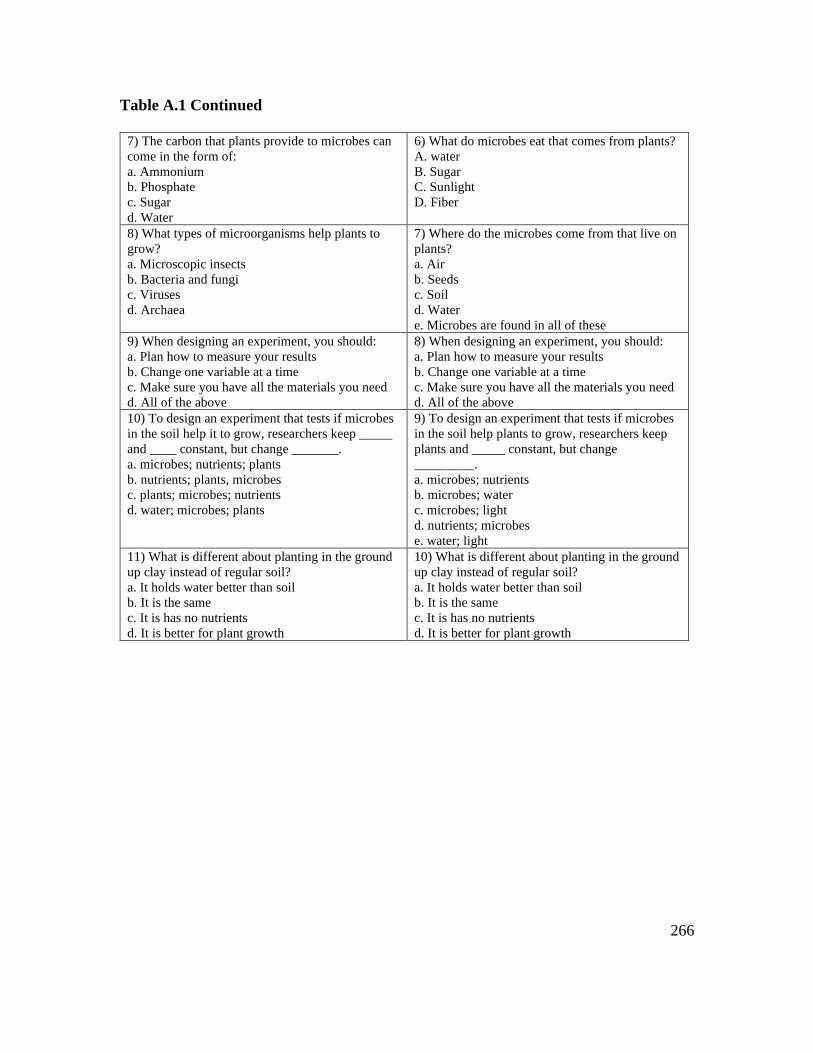
266
Table A.1 Continued
7) The carbon that plants provide to microbes can
come in the form of:
a. Ammonium
b. Phosphate
c. Sugar
d. Water
6) What do microbes eat that comes from plants?
A. water
B. Sugar
C. Sunlight
D. Fiber
8) What types of microorganisms help plants to
grow?
a. Microscopic insects
b. Bacteria and fungi
c. Viruses
d. Archaea
7) Where do the microbes come from that live on
plants?
a. Air
b. Seeds
c. Soil
d. Water
e. Microbes are found in all of these 9) When designing an experiment, you should:
a. Plan how to measure your results
b. Change one variable at a time
c. Make sure you have all the materials you need
d. All of the above
8) When designing an experiment, you should:
a. Plan how to measure your results
b. Change one variable at a time
c. Make sure you have all the materials you need
d. All of the above 10) To design an experiment that tests if microbes
in the soil help it to grow, researchers keep _____
and ____ constant, but change _______.
a. microbes; nutrients; plants
b. nutrients; plants, microbes
c. plants; microbes; nutrients
d. water; microbes; plants
9) To design an experiment that tests if microbes
in the soil help plants to grow, researchers keep
plants and _____ constant, but change
_________.
a. microbes; nutrients
b. microbes; water
c. microbes; light
d. nutrients; microbes
e. water; light 11) What is different about planting in the ground
up clay instead of regular soil?
a. It holds water better than soil
b. It is the same
c. It is has no nutrients
d. It is better for plant growth
10) What is different about planting in the ground
up clay instead of regular soil?
a. It holds water better than soil
b. It is the same
c. It is has no nutrients
d. It is better for plant growth
267
VITA
Katherine Moccia was born in NYC to two exceptionally loving parents, Regina
Gallagher, and Kevin Moccia. As a child she was frequently found observing the world
around her to the point where it took her an hour to walk one city block. Somehow her
parents and brother, James, were patient enough to indulge this curiosity throughout her
childhood. Due to an outrageous stroke of luck and generosity, Katherine was provided
with the opportunity to work with Dr. Michelle Larsen while in high school. It was with
Dr. Michelle Larsen where she first discovered the marvelous, invisible world of
microbiology, and the passion she always had for smallest members of the world around
her could be expressed. Katherine continued to volunteer under the guidance of Dr.
Michelle Larsen and the entire William Jacobs laboratory. She participated in a Phage
Phinders Program initially and gradually transitioned into a (hopefully) helpful research
assistant over the course of a few summers. These fortuitous opportunities played no
small part in her acquisition of a full scholarship to Bard College to study biology. While
in college, she was accepted into the REU program at the University of Tennessee and
had the privilege of working in Dr. Alison Buchan’s laboratory. While the summer REU
program was quite an influential experience and solidified her desire to pursue a career in
science, the REU could not compete with meeting the love of her life, a fellow REU
student named Spiro Papoulis. Today Katherine lives with that same lovely REU student,
along with a very spoiled beagle, Chewy. Chewy wanted everyone to know that she has
also finished her dissertation proving that cats designed and released SARS-CoV-2. The
485-page magnum opus (her words) is readily available on 4Paw.
Related Documents