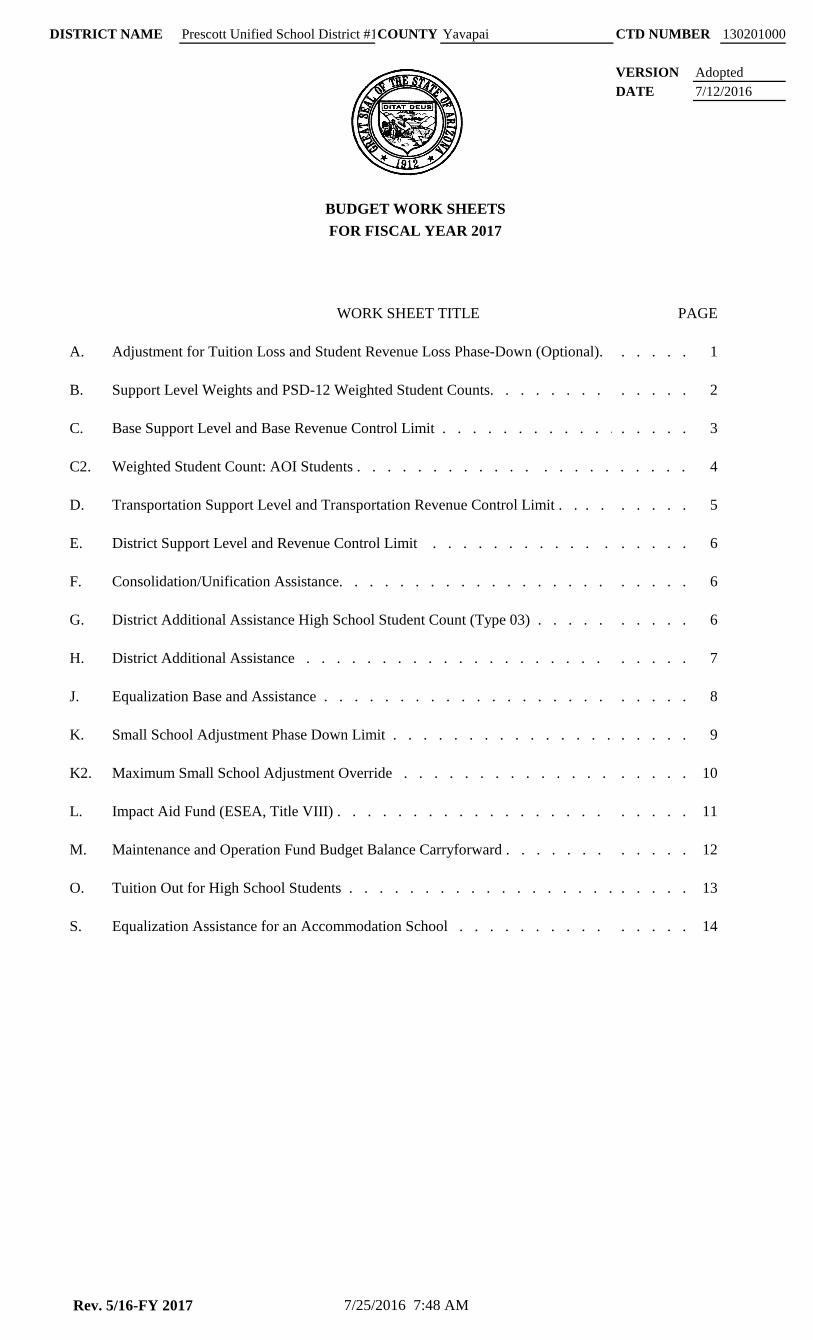
DISTRICT NAME COUNTY CTD NUMBER 130201000 VERSION DATE BUDGET WORK SHEETS FOR FISCAL YEAR 2017 WORK SHEET TITLE PAGE A. Adjustment for Tuition Loss and Student Revenue Loss Phase-Down (Optional). . . . . . 1 B. Support Level Weights and PSD-12 Weighted Student Counts. . . . . . . . . . . . . . 2 C. Base Support Level and Base Revenue Control Limit . . . . . . . . . . . . . . . . . 3 C2. Weighted Student Count: AOI Students . . . . . . . . . . . . . . . . . . . . . . 4 D. Transportation Support Level and Transportation Revenue Control Limit . . . . . . . . . 5 E. District Support Level and Revenue Control Limit . . . . . . . . . . . . . . . . . 6 F. Consolidation/Unification Assistance. . . . . . . . . . . . . . . . . . . . . . . 6 G. District Additional Assistance High School Student Count (Type 03) . . . . . . . . . . 6 H. District Additional Assistance . . . . . . . . . . . . . . . . . . . . . . . . . . 7 J. Equalization Base and Assistance . . . . . . . . . . . . . . . . . . . . . . . . 8 K. Small School Adjustment Phase Down Limit . . . . . . . . . . . . . . . . . . . . 9 K2. Maximum Small School Adjustment Override . . . . . . . . . . . . . . . . . . . 10 L. Impact Aid Fund (ESEA, Title VIII) . . . . . . . . . . . . . . . . . . . . . . . . 11 M. Maintenance and Operation Fund Budget Balance Carryforward . . . . . . . . . . . . 12 O. Tuition Out for High School Students . . . . . . . . . . . . . . . . . . . . . . . 13 S. Equalization Assistance for an Accommodation School . . . . . . . . . . . . . . . . 14 Prescott Unified School District #1 Yavapai Adopted 7/12/2016 Rev. 5/16-FY 2017 7/25/2016 7:48 AM

Welcome message from author
This document is posted to help you gain knowledge. Please leave a comment to let me know what you think about it! Share it to your friends and learn new things together.
Transcript
DISTRICT NAME COUNTY CTD NUMBER 130201000
VERSION
DATE
BUDGET WORK SHEETS
FOR FISCAL YEAR 2017
WORK SHEET TITLE PAGE
A. Adjustment for Tuition Loss and Student Revenue Loss Phase-Down (Optional). . . . . . .. . . . . 1
B. Support Level Weights and PSD-12 Weighted Student Counts. . . . . . . . . . . . . . . . . . . . . . . . . . . . . .. . . . . 2
C. Base Support Level and Base Revenue Control Limit . . . . . . . . . . . . . . . . . 3
C2. Weighted Student Count: AOI Students . . . . . . . . . . . . . . . . . . . . . . . .4
D. Transportation Support Level and Transportation Revenue Control Limit . . . . . .. . . . . 5
E. District Support Level and Revenue Control Limit . . . . . . . . . . . . . .. . . . . 6
F. Consolidation/Unification Assistance. . . . . . . . . . . . . . . . . . . . . . . . . . . . . . 6
G. District Additional Assistance High School Student Count (Type 03) . . . . . . . . .. . . . . 6
H. District Additional Assistance . . . . . . . . . . . . . . . . . . . . . . . . . . .. . . . . 7
J. Equalization Base and Assistance . . . . . . . . . . . . . . . . . . . . . . . .. . . . . 8
K. Small School Adjustment Phase Down Limit . . . . . . . . . . . . . . . . . . .. . . . . 9
K2. Maximum Small School Adjustment Override . . . . . . . . . . . . . . . . . . . 10
L. Impact Aid Fund (ESEA, Title VIII) . . . . . . . . . . . . . . . . . . . . . . .. . . . . 11
M. Maintenance and Operation Fund Budget Balance Carryforward . . . . . . . . . . .. . . . . 12
O. Tuition Out for High School Students . . . . . . . . . . . . . . . . . . .. . . . . 13
S. Equalization Assistance for an Accommodation School . . . . . . . . . . . . . . . . 14
Prescott Unified School District #1 Yavapai
Adopted
7/12/2016
Rev. 5/16-FY 2017 7/25/2016 7:48 AM
DISTRICT NAME Prescott Unified School District #1 COUNTY Yavapai CTD NUMBER 130201000
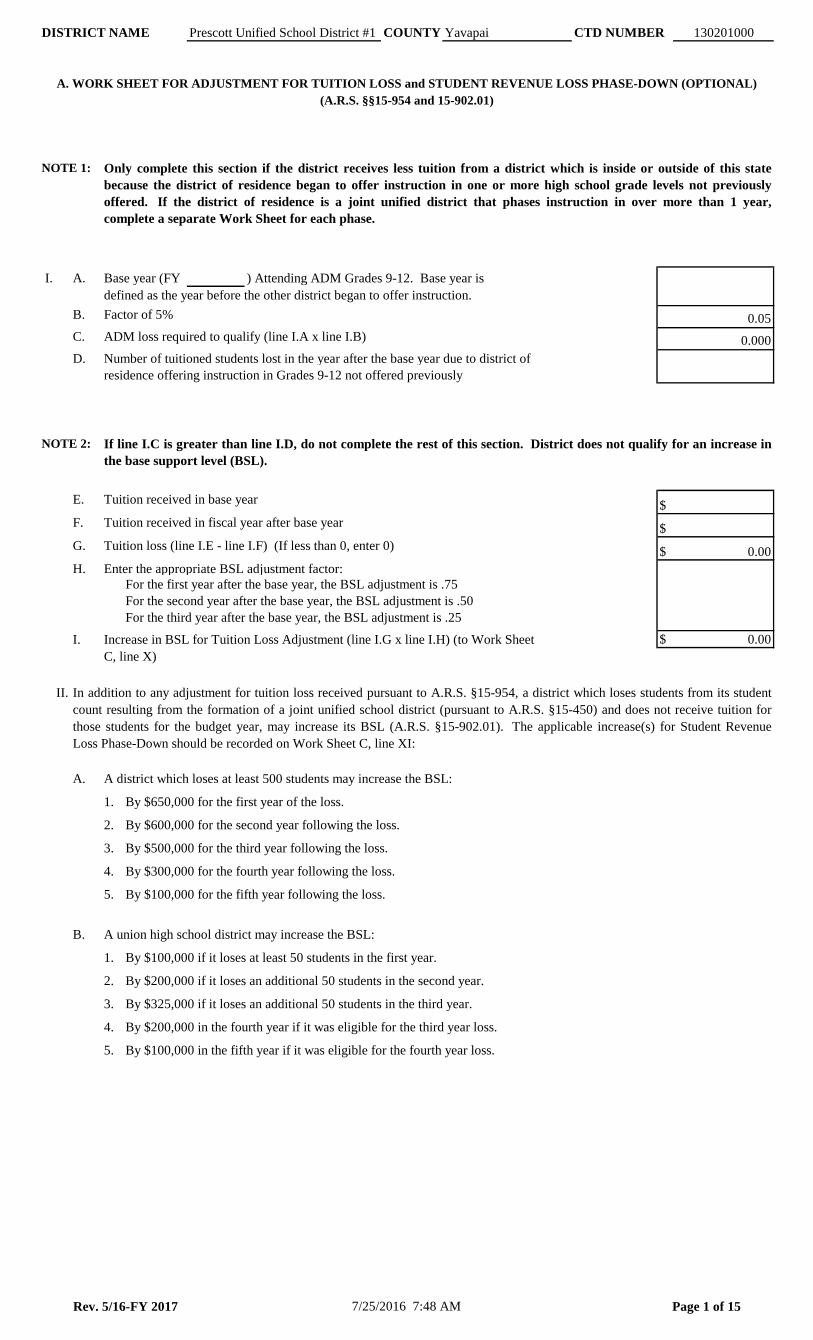
A. WORK SHEET FOR ADJUSTMENT FOR TUITION LOSS and STUDENT REVENUE LOSS PHASE-DOWN (OPTIONAL)
(A.R.S. §§15-954 and 15-902.01)
NOTE 1:
I. A. Base year (FY ) Attending ADM Grades 9-12. Base year is
defined as the year before the other district began to offer instruction.
B. Factor of 5%
C. ADM loss required to qualify (line I.A x line I.B)
D. Number of tuitioned students lost in the year after the base year due to district of
residence offering instruction in Grades 9-12 not offered previously
NOTE 2:
E. Tuition received in base year $
F. Tuition received in fiscal year after base year $
G. Tuition loss (line I.E - line I.F) (If less than 0, enter 0) $ 0.00
H. Enter the appropriate BSL adjustment factor:
For the first year after the base year, the BSL adjustment is .75
For the second year after the base year, the BSL adjustment is .50
For the third year after the base year, the BSL adjustment is .25
I. Increase in BSL for Tuition Loss Adjustment (line I.G x line I.H) (to Work Sheet $ 0.00
C, line X)
II.
A. A district which loses at least 500 students may increase the BSL:
1. By $650,000 for the first year of the loss.
2. By $600,000 for the second year following the loss.
3. By $500,000 for the third year following the loss.
4. By $300,000 for the fourth year following the loss.
5. By $100,000 for the fifth year following the loss.
B. A union high school district may increase the BSL:
1. By $100,000 if it loses at least 50 students in the first year.
2. By $200,000 if it loses an additional 50 students in the second year.
3. By $325,000 if it loses an additional 50 students in the third year.
4. By $200,000 in the fourth year if it was eligible for the third year loss.
5. By $100,000 in the fifth year if it was eligible for the fourth year loss.
Only complete this section if the district receives less tuition from a district which is inside or outside of this state
because the district of residence began to offer instruction in one or more high school grade levels not previously
offered. If the district of residence is a joint unified district that phases instruction in over more than 1 year,
complete a separate Work Sheet for each phase.
If line I.C is greater than line I.D, do not complete the rest of this section. District does not qualify for an increase in
the base support level (BSL).
In addition to any adjustment for tuition loss received pursuant to A.R.S. §15-954, a district which loses students from its student
count resulting from the formation of a joint unified school district (pursuant to A.R.S. §15-450) and does not receive tuition for
those students for the budget year, may increase its BSL (A.R.S. §15-902.01). The applicable increase(s) for Student Revenue
Loss Phase-Down should be recorded on Work Sheet C, line XI:
0.05
0.000
Rev. 5/16-FY 2017 7/25/2016 7:48 AM Page 1 of 15
DISTRICT NAME COUNTY CTD NUMBER 130201000
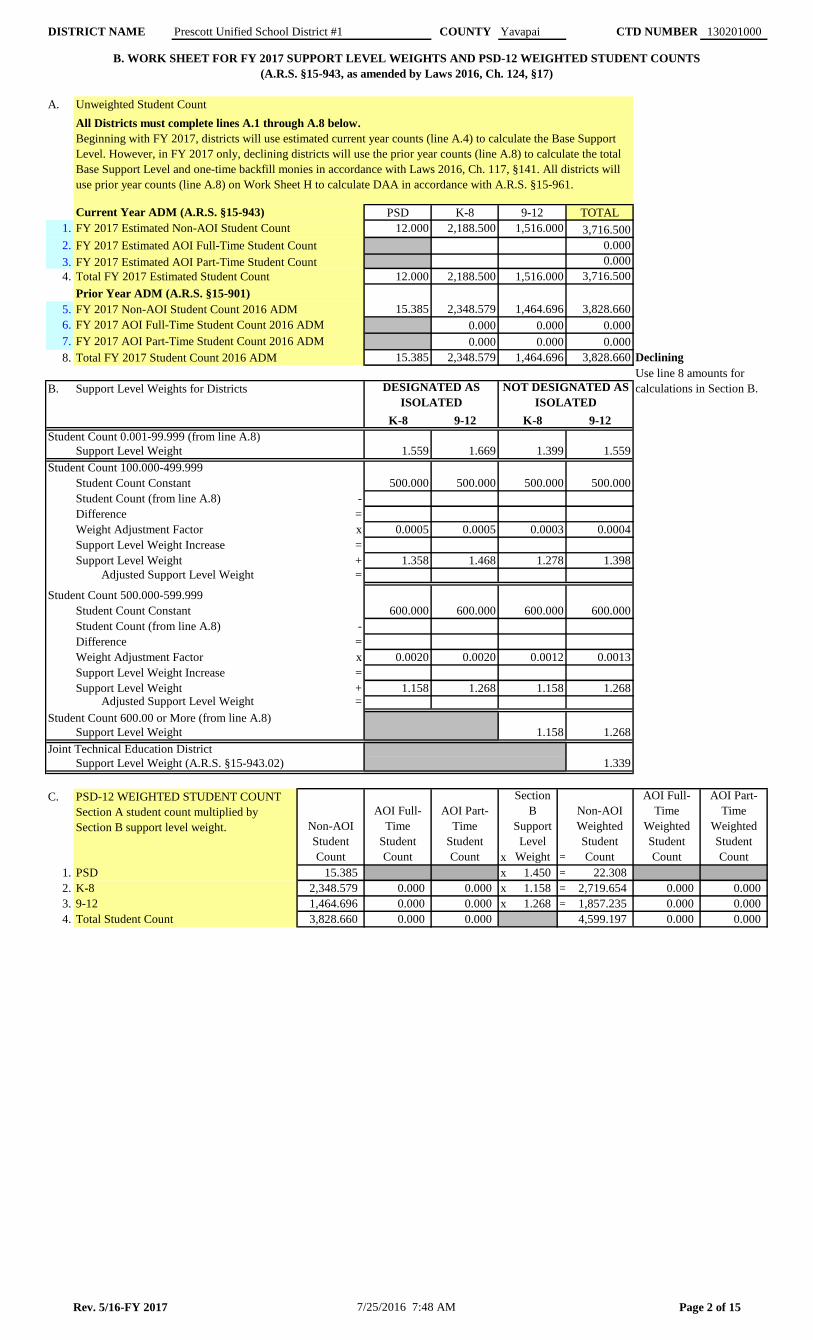
B. WORK SHEET FOR FY 2017 SUPPORT LEVEL WEIGHTS AND PSD-12 WEIGHTED STUDENT COUNTS
(A.R.S. §15-943, as amended by Laws 2016, Ch. 124, §17)
A.
Current Year ADM (A.R.S. §15-943) PSD K-8 TOTAL
1. FY 2017 Estimated Non-AOI Student Count 12.000 2,188.500 3,716.500
2. FY 2017 Estimated AOI Full-Time Student Count 0.000
3. FY 2017 Estimated AOI Part-Time Student Count 0.000
4. Total FY 2017 Estimated Student Count 12.000 2,188.500 3,716.500
Prior Year ADM (A.R.S. §15-901)
5. 15.385 2,348.579 3,828.660
6. FY 2017 AOI Full-Time Student Count 2016 ADM 0.000 0.000
7. FY 2017 AOI Part-Time Student Count 2016 ADM 0.000 0.000
8. Total FY 2017 Student Count 2016 ADM 15.385 2,348.579 3,828.660 Declining
B. Support Level Weights for Districts
K-8 9-12 9-12
Student Count 0.001-99.999 (from line A.8)
Support Level Weight 1.559 1.669 1.559
Student Count 100.000-499.999
Student Count Constant 500.000 500.000 500.000
Student Count (from line A.8) -
Difference =
Weight Adjustment Factor x 0.0005 0.0005 0.0004
Support Level Weight Increase =
Support Level Weight + 1.358 1.468 1.398
Adjusted Support Level Weight =
Student Count 500.000-599.999
Student Count Constant 600.000 600.000 600.000
Student Count (from line A.8) -
Difference =
Weight Adjustment Factor x 0.0020 0.0020 0.0013
Support Level Weight Increase =
Support Level Weight + 1.158 1.268 1.268Adjusted Support Level Weight =
Student Count 600.00 or More (from line A.8)
Support Level Weight 1.268
Joint Technical Education District
Support Level Weight (A.R.S. §15-943.02) 1.339
C.
Non-AOI
Student
Count
AOI Full-
Time
Student
Count
AOI Part-
Time
Student
Count x
Section
B
Support
Level
Weight =
Non-AOI
Weighted
Student
Count
AOI Full-
Time
Weighted
Student
Count
AOI Part-
Time
Weighted
Student
Count
1. PSD 15.385 x 1.450 = 22.308
2. K-8 2,348.579 0.000 0.000 x 1.158 = 2,719.654 0.000 0.000
3. 9-12 1,464.696 0.000 0.000 x 1.268 = 1,857.235 0.000 0.000
4. 3,828.660 0.000 0.000 4,599.197 0.000 0.000
Use line 8 amounts for
calculations in Section B.
1.399
500.000
NOT DESIGNATED AS
ISOLATED
0.000
0.000
Prescott Unified School District #1 Yavapai
0.0003
1.278
1,516.000
K-8
1,464.696
1,516.000
Total Student Count
1.158
PSD-12 WEIGHTED STUDENT COUNT
Section A student count multiplied by
Section B support level weight.
DESIGNATED AS
ISOLATED
0.0012
600.000
1.158
Unweighted Student Count
All Districts must complete lines A.1 through A.8 below.
Beginning with FY 2017, districts will use estimated current year counts (line A.4) to calculate the Base Support
Level. However, in FY 2017 only, declining districts will use the prior year counts (line A.8) to calculate the total
Base Support Level and one-time backfill monies in accordance with Laws 2016, Ch. 117, §141. All districts will
use prior year counts (line A.8) on Work Sheet H to calculate DAA in accordance with A.R.S. §15-961.
9-12
FY 2017 Non-AOI Student Count 2016 ADM 1,464.696
Rev. 5/16-FY 2017 7/25/2016 7:48 AM Page 2 of 15
DISTRICT NAME COUNTY CTD NUMBER 130201000
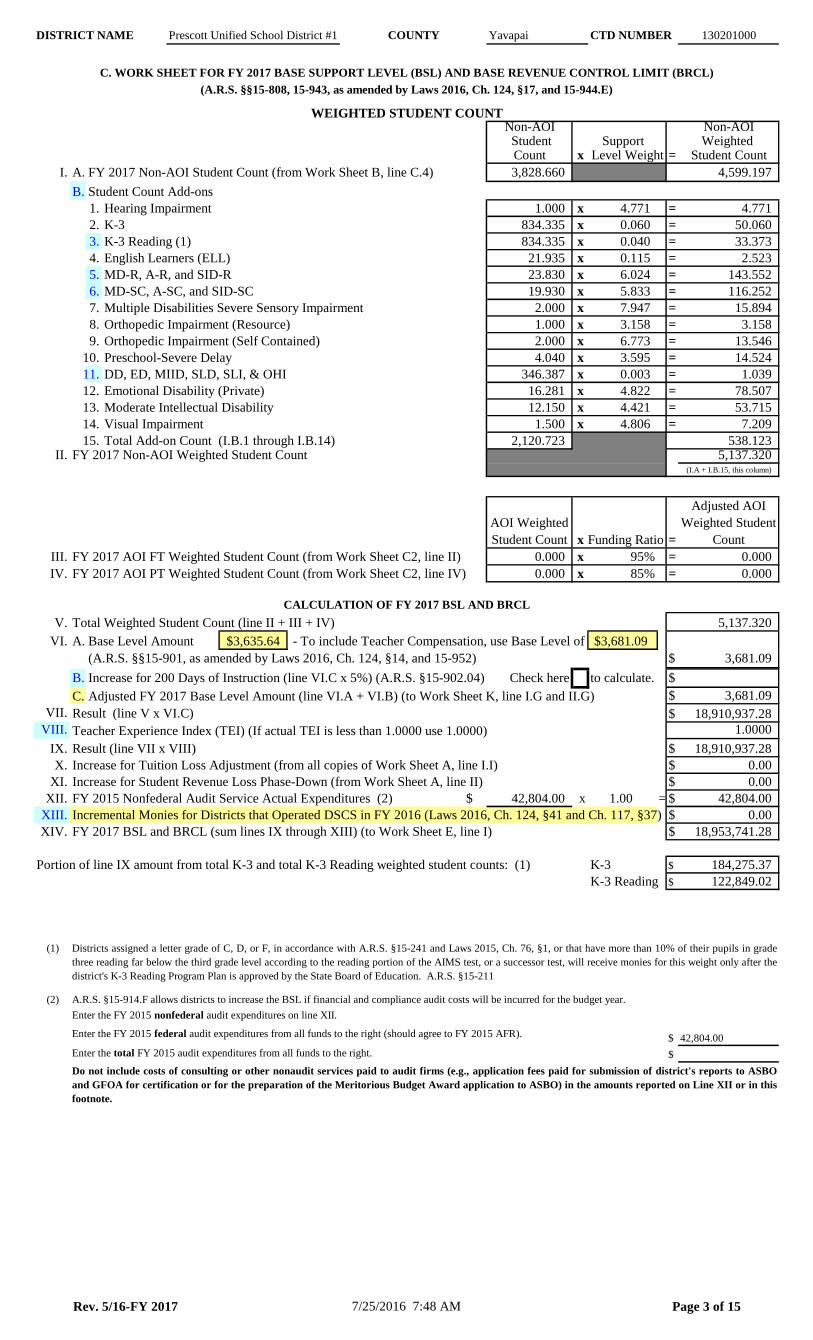
C. WORK SHEET FOR FY 2017 BASE SUPPORT LEVEL (BSL) AND BASE REVENUE CONTROL LIMIT (BRCL)
(A.R.S. §§15-808, 15-943, as amended by Laws 2016, Ch. 124, §17, and 15-944.E)
WEIGHTED STUDENT COUNTNon-AOI Non-AOI Student Support Weighted Count x Level Weight = Student Count
I. A. FY 2017 Non-AOI Student Count (from Work Sheet B, line C.4) 3,828.660 4,599.197
B. Student Count Add-ons
1. Hearing Impairment 1.000 x 4.771 = 4.771
2. K-3 834.335 x 0.060 = 50.060
3. K-3 Reading (1) 834.335 x 0.040 = 33.373
4. English Learners (ELL) 21.935 x 0.115 = 2.523
5. MD-R, A-R, and SID-R 23.830 x 6.024 = 143.552
6. MD-SC, A-SC, and SID-SC 19.930 x 5.833 = 116.252
7. Multiple Disabilities Severe Sensory Impairment 2.000 x 7.947 = 15.894
8. Orthopedic Impairment (Resource) 1.000 x 3.158 = 3.158
9. Orthopedic Impairment (Self Contained) 2.000 x 6.773 = 13.546
10. Preschool-Severe Delay 4.040 x 3.595 = 14.524
11. DD, ED, MIID, SLD, SLI, & OHI 346.387 x 0.003 = 1.039
12. Emotional Disability (Private) 16.281 x 4.822 = 78.507
13. Moderate Intellectual Disability 12.150 x 4.421 = 53.715
14. Visual Impairment 1.500 x 4.806 = 7.209
15. Total Add-on Count (I.B.1 through I.B.14) 2,120.723 538.123II. FY 2017 Non-AOI Weighted Student Count 5,137.320
(I.A + I.B.15, this column)
AOI Weighted
Student Count x =
Adjusted AOI
Weighted Student
Count
III. FY 2017 AOI FT Weighted Student Count (from Work Sheet C2, line II) 0.000 x 95% = 0.000
IV. FY 2017 AOI PT Weighted Student Count (from Work Sheet C2, line IV) 0.000 x 85% = 0.000
CALCULATION OF FY 2017 BSL AND BRCL
Total Weighted Student Count (line II + III + IV) 5,137.320
A. Base Level Amount $3,635.64 - To include Teacher Compensation, use Base Level of $3,681.09
(A.R.S. §§15-901, as amended by Laws 2016, Ch. 124, §14, and 15-952) $ 3,681.09
B. Increase for 200 Days of Instruction (line VI.C x 5%) (A.R.S. §15-902.04) Check here to calculate. $
C. Adjusted FY 2017 Base Level Amount (line VI.A + VI.B) (to Work Sheet K, line I.G and II.G) $ 3,681.09
Result (line V x VI.C) $ 18,910,937.28
Teacher Experience Index (TEI) (If actual TEI is less than 1.0000 use 1.0000) 1.0000
Result (line VII x VIII) $ 18,910,937.28
Increase for Tuition Loss Adjustment (from all copies of Work Sheet A, line I.I) $ 0.00
Increase for Student Revenue Loss Phase-Down (from Work Sheet A, line II) $ 0.00
FY 2015 Nonfederal Audit Service Actual Expenditures (2) $ 42,804.00 x 1.00 = $ 42,804.00
Incremental Monies for Districts that Operated DSCS in FY 2016 (Laws 2016, Ch. 124, §41 and Ch. 117, §37) $ 0.00
FY 2017 BSL and BRCL (sum lines IX through XIII) (to Work Sheet E, line I) $ 18,953,741.28
Portion of line IX amount from total K-3 and total K-3 Reading weighted student counts: (1) K-3 $ 184,275.37
K-3 Reading $ 122,849.02
(1)
(2) A.R.S. §15-914.F allows districts to increase the BSL if financial and compliance audit costs will be incurred for the budget year.
$ 42,804.00
Enter the total FY 2015 audit expenditures from all funds to the right. $
Prescott Unified School District #1 Yavapai
Funding Ratio
IX.
V.
VI.
Enter the FY 2015 federal audit expenditures from all funds to the right (should agree to FY 2015 AFR).
Do not include costs of consulting or other nonaudit services paid to audit firms (e.g., application fees paid for submission of district's reports to ASBO
and GFOA for certification or for the preparation of the Meritorious Budget Award application to ASBO) in the amounts reported on Line XII or in this
footnote.
XII.
VIII.
VII.
XIII.
X.
XI.
Enter the FY 2015 nonfederal audit expenditures on line XII.
Districts assigned a letter grade of C, D, or F, in accordance with A.R.S. §15-241 and Laws 2015, Ch. 76, §1, or that have more than 10% of their pupils in grade
three reading far below the third grade level according to the reading portion of the AIMS test, or a successor test, will receive monies for this weight only after the
district's K-3 Reading Program Plan is approved by the State Board of Education. A.R.S. §15-211
XIV.
Rev. 5/16-FY 2017 7/25/2016 7:48 AM Page 3 of 15
DISTRICT NAME COUNTY CTD NUMBER 130201000
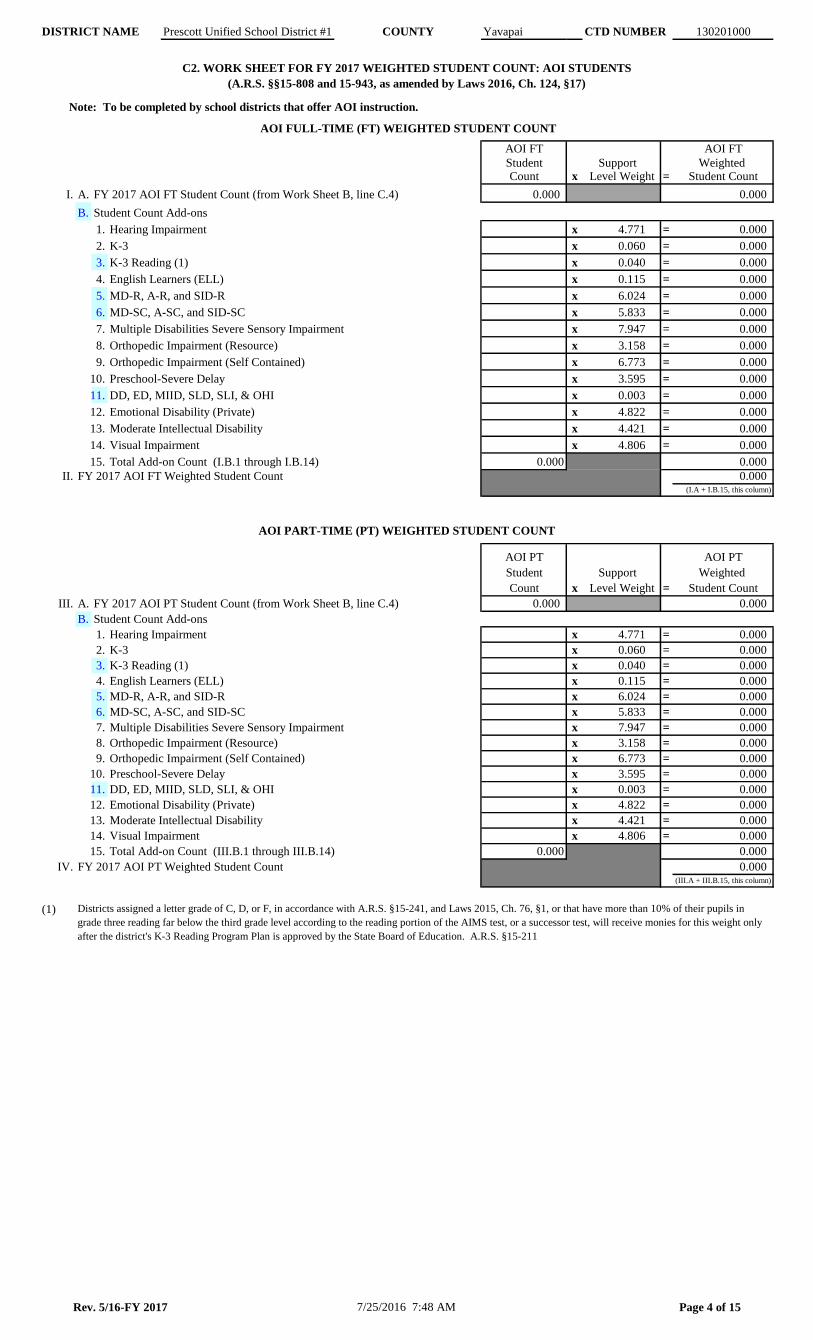
C2. WORK SHEET FOR FY 2017 WEIGHTED STUDENT COUNT: AOI STUDENTS
(A.R.S. §§15-808 and 15-943, as amended by Laws 2016, Ch. 124, §17)
Note: To be completed by school districts that offer AOI instruction.
AOI FULL-TIME (FT) WEIGHTED STUDENT COUNT
AOI FT AOI FT
Student Support Weighted Count x Level Weight = Student Count
I. A. FY 2017 AOI FT Student Count (from Work Sheet B, line C.4) 0.000 0.000
B. Student Count Add-ons
1. Hearing Impairment x 4.771 = 0.000
2. K-3 x 0.060 = 0.000
3. K-3 Reading (1) x 0.040 = 0.000
4. English Learners (ELL) x 0.115 = 0.000
5. MD-R, A-R, and SID-R x 6.024 = 0.000
6. MD-SC, A-SC, and SID-SC x 5.833 = 0.000
7. Multiple Disabilities Severe Sensory Impairment x 7.947 = 0.000
8. Orthopedic Impairment (Resource) x 3.158 = 0.000
9. Orthopedic Impairment (Self Contained) x 6.773 = 0.000
10. Preschool-Severe Delay x 3.595 = 0.000
11. DD, ED, MIID, SLD, SLI, & OHI x 0.003 = 0.000
12. Emotional Disability (Private) x 4.822 = 0.000
13. Moderate Intellectual Disability x 4.421 = 0.000
14. Visual Impairment x 4.806 = 0.000
15. Total Add-on Count (I.B.1 through I.B.14) 0.000 0.000
II. FY 2017 AOI FT Weighted Student Count 0.000(I.A + I.B.15, this column)
AOI PART-TIME (PT) WEIGHTED STUDENT COUNT
AOI PT AOI PT
Student Support Weighted
Count x Level Weight = Student Count
III. A. FY 2017 AOI PT Student Count (from Work Sheet B, line C.4) 0.000 0.000
B. Student Count Add-ons
1. Hearing Impairment x 4.771 = 0.000
2. K-3 x 0.060 = 0.000
3. K-3 Reading (1) x 0.040 = 0.000
4. English Learners (ELL) x 0.115 = 0.000
5. MD-R, A-R, and SID-R x 6.024 = 0.000
6. MD-SC, A-SC, and SID-SC x 5.833 = 0.000
7. Multiple Disabilities Severe Sensory Impairment x 7.947 = 0.000
8. Orthopedic Impairment (Resource) x 3.158 = 0.000
9. Orthopedic Impairment (Self Contained) x 6.773 = 0.000
10. Preschool-Severe Delay x 3.595 = 0.000
11. DD, ED, MIID, SLD, SLI, & OHI x 0.003 = 0.000
12. Emotional Disability (Private) x 4.822 = 0.000
13. Moderate Intellectual Disability x 4.421 = 0.000
14. Visual Impairment x 4.806 = 0.000
15. Total Add-on Count (III.B.1 through III.B.14) 0.000 0.000
IV. FY 2017 AOI PT Weighted Student Count 0.000(III.A + III.B.15, this column)
(1)
Prescott Unified School District #1 Yavapai
Districts assigned a letter grade of C, D, or F, in accordance with A.R.S. §15-241, and Laws 2015, Ch. 76, §1, or that have more than 10% of their pupils in
grade three reading far below the third grade level according to the reading portion of the AIMS test, or a successor test, will receive monies for this weight only
after the district's K-3 Reading Program Plan is approved by the State Board of Education. A.R.S. §15-211
Rev. 5/16-FY 2017 7/25/2016 7:48 AM Page 4 of 15
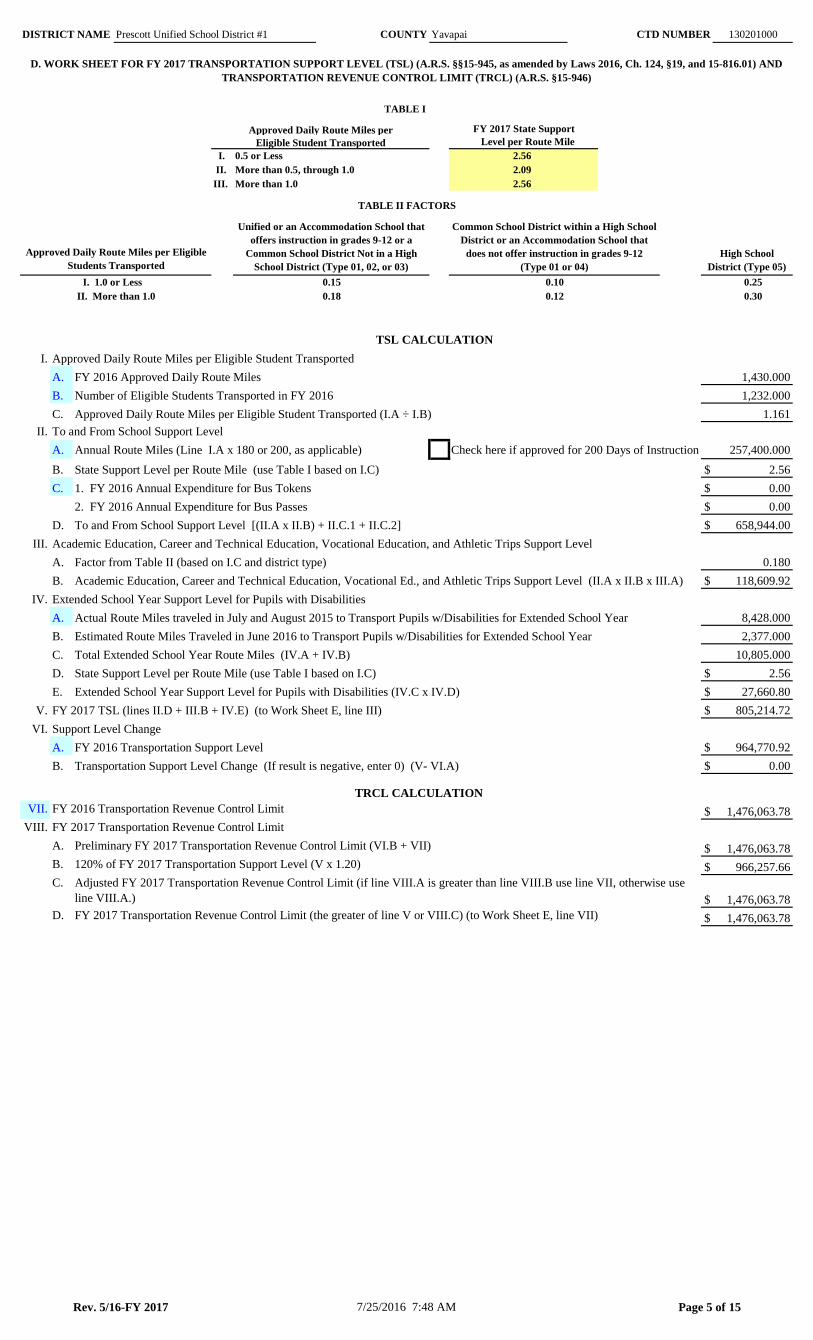
DISTRICT NAME COUNTY CTD NUMBER 130201000
TABLE I
Approved Daily Route Miles per
Eligible Student Transported
I. 0.5 or Less
II. More than 0.5, through 1.0
III. More than 1.0
TABLE II FACTORS
Approved Daily Route Miles per Eligible
Students Transported
I. 1.0 or Less 0.25
II. More than 1.0 0.30
TSL CALCULATION
I. Approved Daily Route Miles per Eligible Student Transported
A. FY 2016 Approved Daily Route Miles
B. Number of Eligible Students Transported in FY 2016
C. Approved Daily Route Miles per Eligible Student Transported (I.A ÷ I.B)
II. To and From School Support Level
A. Annual Route Miles (Line I.A x 180 or 200, as applicable) Check here if approved for 200 Days of Instruction
B. State Support Level per Route Mile (use Table I based on I.C) $ 2.56
C. 1. FY 2016 Annual Expenditure for Bus Tokens $ 0.00
2. FY 2016 Annual Expenditure for Bus Passes $ 0.00
D. To and From School Support Level [(II.A x II.B) + II.C.1 + II.C.2] $ 658,944.00
III. Academic Education, Career and Technical Education, Vocational Education, and Athletic Trips Support Level
A. Factor from Table II (based on I.C and district type) 0.180
B. Academic Education, Career and Technical Education, Vocational Ed., and Athletic Trips Support Level (II.A x II.B x III.A) $ 118,609.92
IV. Extended School Year Support Level for Pupils with Disabilities
A. Actual Route Miles traveled in July and August 2015 to Transport Pupils w/Disabilities for Extended School Year 8,428.000
B. Estimated Route Miles Traveled in June 2016 to Transport Pupils w/Disabilities for Extended School Year
C. Total Extended School Year Route Miles (IV.A + IV.B)
D. State Support Level per Route Mile (use Table I based on I.C) $ 2.56
E. Extended School Year Support Level for Pupils with Disabilities (IV.C x IV.D) $ 27,660.80
V. FY 2017 TSL (lines II.D + III.B + IV.E) (to Work Sheet E, line III) $ 805,214.72
VI. Support Level Change
A. FY 2016 Transportation Support Level $ 964,770.92
B. Transportation Support Level Change (If result is negative, enter 0) (V- VI.A) $ 0.00
TRCL CALCULATION
VII. FY 2016 Transportation Revenue Control Limit $ 1,476,063.78
VIII. FY 2017 Transportation Revenue Control Limit
A. Preliminary FY 2017 Transportation Revenue Control Limit (VI.B + VII) $ 1,476,063.78
B. 120% of FY 2017 Transportation Support Level (V x 1.20) $ 966,257.66
C.
$ 1,476,063.78
D. FY 2017 Transportation Revenue Control Limit (the greater of line V or VIII.C) (to Work Sheet E, line VII) $ 1,476,063.78
2.56
0.15
0.18
0.10
0.12
2.56
1,430.000
10,805.000
1,232.000
2,377.000
1.161
257,400.000
Adjusted FY 2017 Transportation Revenue Control Limit (if line VIII.A is greater than line VIII.B use line VII, otherwise use
line VIII.A.)
Prescott Unified School District #1
Unified or an Accommodation School that
offers instruction in grades 9-12 or a
Common School District Not in a High
School District (Type 01, 02, or 03)
Common School District within a High School
District or an Accommodation School that
does not offer instruction in grades 9-12
(Type 01 or 04)
D. WORK SHEET FOR FY 2017 TRANSPORTATION SUPPORT LEVEL (TSL) (A.R.S. §§15-945, as amended by Laws 2016, Ch. 124, §19, and 15-816.01) AND
TRANSPORTATION REVENUE CONTROL LIMIT (TRCL) (A.R.S. §15-946)
FY 2017 State Support
Level per Route Mile
Yavapai
High School
District (Type 05)
2.09
Rev. 5/16-FY 2017 7/25/2016 7:48 AM Page 5 of 15
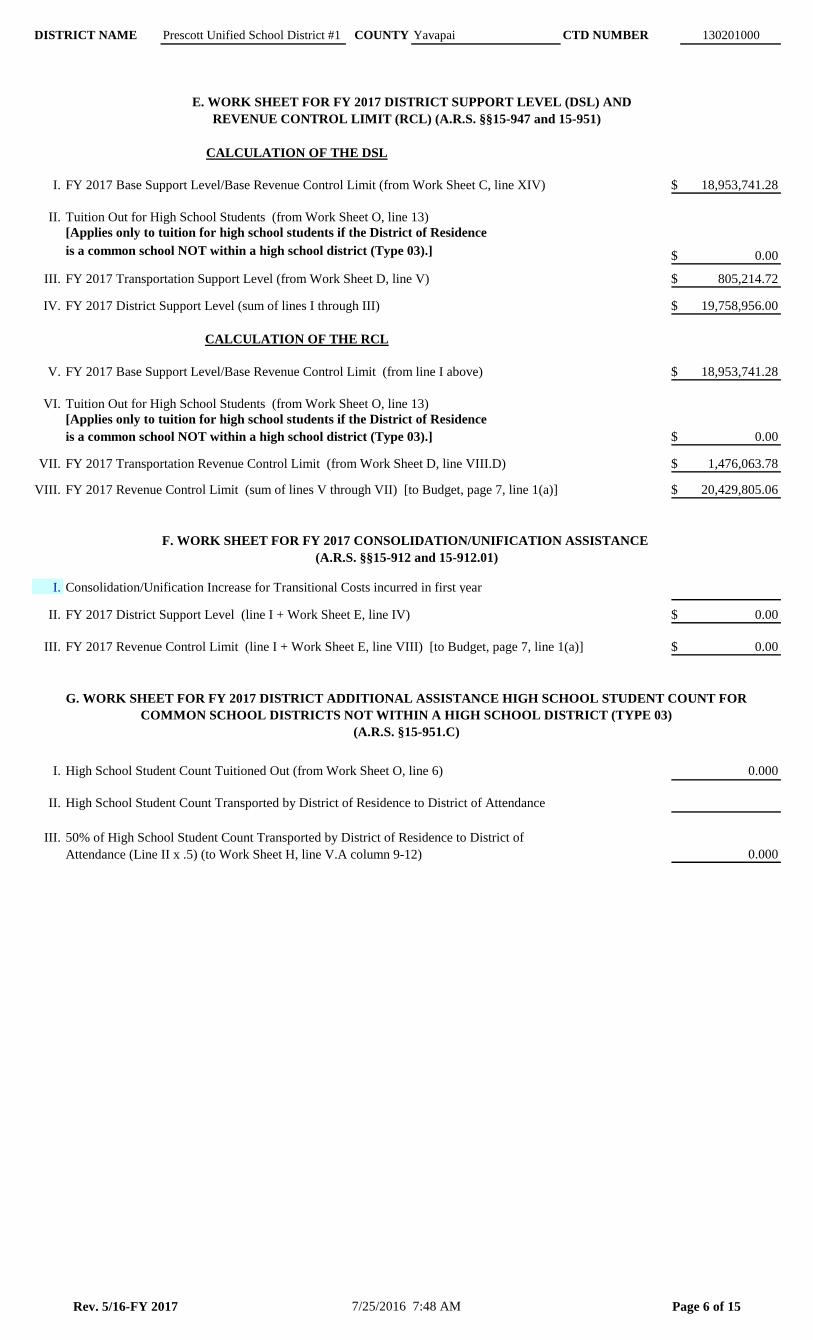
DISTRICT NAME COUNTY CTD NUMBER 130201000
E. WORK SHEET FOR FY 2017 DISTRICT SUPPORT LEVEL (DSL) AND
REVENUE CONTROL LIMIT (RCL) (A.R.S. §§15-947 and 15-951)
CALCULATION OF THE DSL
I. FY 2017 Base Support Level/Base Revenue Control Limit (from Work Sheet C, line XIV) $ 18,953,741.28
II. Tuition Out for High School Students (from Work Sheet O, line 13)
[Applies only to tuition for high school students if the District of Residence
is a common school NOT within a high school district (Type 03).] $ 0.00
III. FY 2017 Transportation Support Level (from Work Sheet D, line V) $ 805,214.72
IV. FY 2017 District Support Level (sum of lines I through III) $ 19,758,956.00
CALCULATION OF THE RCL
V. FY 2017 Base Support Level/Base Revenue Control Limit (from line I above) $ 18,953,741.28
VI. Tuition Out for High School Students (from Work Sheet O, line 13)
[Applies only to tuition for high school students if the District of Residence
is a common school NOT within a high school district (Type 03).] $ 0.00
VII. FY 2017 Transportation Revenue Control Limit (from Work Sheet D, line VIII.D) $ 1,476,063.78
VIII. FY 2017 Revenue Control Limit (sum of lines V through VII) [to Budget, page 7, line 1(a)] $ 20,429,805.06
F. WORK SHEET FOR FY 2017 CONSOLIDATION/UNIFICATION ASSISTANCE
(A.R.S. §§15-912 and 15-912.01)
I. Consolidation/Unification Increase for Transitional Costs incurred in first year
II. FY 2017 District Support Level (line I + Work Sheet E, line IV) $ 0.00
III. FY 2017 Revenue Control Limit (line I + Work Sheet E, line VIII) [to Budget, page 7, line 1(a)] $ 0.00
I. High School Student Count Tuitioned Out (from Work Sheet O, line 6)
II. High School Student Count Transported by District of Residence to District of Attendance
III. 50% of High School Student Count Transported by District of Residence to District of
Attendance (Line II x .5) (to Work Sheet H, line V.A column 9-12) 0.000
Prescott Unified School District #1 Yavapai
0.000
G. WORK SHEET FOR FY 2017 DISTRICT ADDITIONAL ASSISTANCE HIGH SCHOOL STUDENT COUNT FOR
COMMON SCHOOL DISTRICTS NOT WITHIN A HIGH SCHOOL DISTRICT (TYPE 03)
(A.R.S. §15-951.C)
Rev. 5/16-FY 2017 7/25/2016 7:48 AM Page 6 of 15
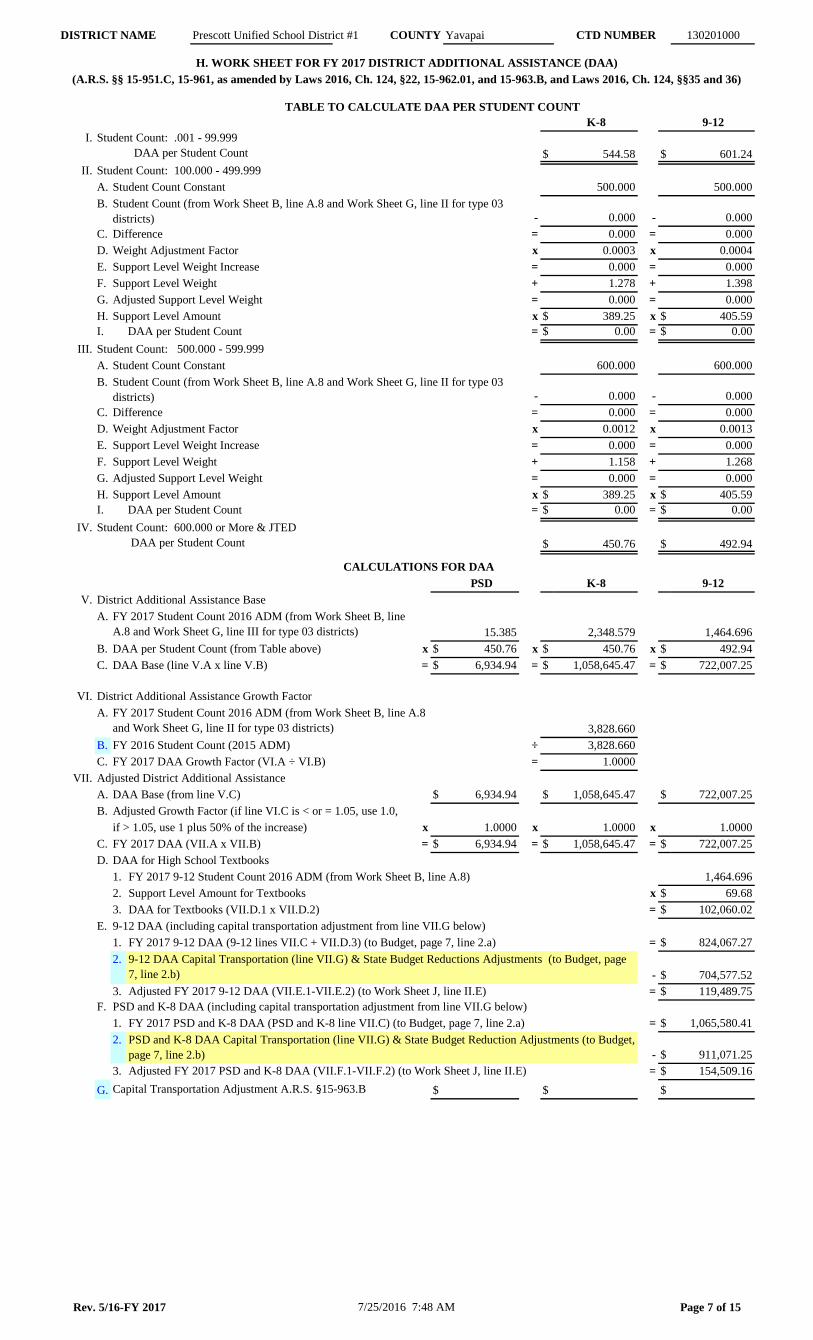
DISTRICT NAME Prescott Unified School District #1 COUNTY CTD NUMBER 130201000
TABLE TO CALCULATE DAA PER STUDENT COUNT
K-8 9-12
I. Student Count: .001 - 99.999
DAA per Student Count
II. Student Count: 100.000 - 499.999
A. Student Count Constant
B.
- -
C. Difference = =
D. Weight Adjustment Factor x x
E. Support Level Weight Increase = =
F. Support Level Weight + +
G. Adjusted Support Level Weight = =
H. Support Level Amount x $ 389.25 x $ 405.59
I. DAA per Student Count = $ 0.00 = $ 0.00
III. Student Count: 500.000 - 599.999
A. Student Count Constant
B.
- -
C. Difference = =
D. Weight Adjustment Factor x x
E. Support Level Weight Increase = =
F. Support Level Weight + +
G. Adjusted Support Level Weight = =
H. Support Level Amount x $ 389.25 x $ 405.59
I. DAA per Student Count = $ 0.00 = $ 0.00
IV. Student Count: 600.000 or More & JTED
DAA per Student Count
CALCULATIONS FOR DAA
PSD K-8 9-12
V. District Additional Assistance Base
A.
B. DAA per Student Count (from Table above) x $ 450.76 x $ 450.76 x $ 492.94
C. DAA Base (line V.A x line V.B) = $ 6,934.94 = $ 1,058,645.47 = $ 722,007.25
VI. District Additional Assistance Growth Factor
A.
B. FY 2016 Student Count (2015 ADM) ÷
C. FY 2017 DAA Growth Factor (VI.A ÷ VI.B) =
VII. Adjusted District Additional Assistance
A. DAA Base (from line V.C)
B. Adjusted Growth Factor (if line VI.C is < or = 1.05, use 1.0,
if > 1.05, use 1 plus 50% of the increase)
C. FY 2017 DAA (VII.A x VII.B) = $ 6,934.94 = $ 1,058,645.47 = $ 722,007.25
D. DAA for High School Textbooks
1. FY 2017 9-12 Student Count 2016 ADM (from Work Sheet B, line A.8)
2. Support Level Amount for Textbooks x $ 69.68
3. DAA for Textbooks (VII.D.1 x VII.D.2) = $ 102,060.02
E. 9-12 DAA (including capital transportation adjustment from line VII.G below)
1. FY 2017 9-12 DAA (9-12 lines VII.C + VII.D.3) (to Budget, page 7, line 2.a) = $ 824,067.27
2.
- $ 704,577.52
3. = $ 119,489.75
F. PSD and K-8 DAA (including capital transportation adjustment from line VII.G below)
1. FY 2017 PSD and K-8 DAA (PSD and K-8 line VII.C) (to Budget, page 7, line 2.a) = $ 1,065,580.41
2.
- $ 911,071.25
3. = $ 154,509.16
G. Capital Transportation Adjustment A.R.S. §15-963.B $ $ $
6,934.94
3,828.660
1.0000x
9-12 DAA Capital Transportation (line VII.G) & State Budget Reductions Adjustments (to Budget, page
7, line 2.b)
Adjusted FY 2017 9-12 DAA (VII.E.1-VII.E.2) (to Work Sheet J, line II.E)
x 1.0000
Student Count (from Work Sheet B, line A.8 and Work Sheet G, line II for type 03
districts)
Student Count (from Work Sheet B, line A.8 and Work Sheet G, line II for type 03
districts)
0.000
0.000
0.0012
1.268
$
1,464.696
Yavapai
500.000
544.58 601.24$
3,828.660
$
500.000
H. WORK SHEET FOR FY 2017 DISTRICT ADDITIONAL ASSISTANCE (DAA)
(A.R.S. §§ 15-951.C, 15-961, as amended by Laws 2016, Ch. 124, §22, 15-962.01, and 15-963.B, and Laws 2016, Ch. 124, §§35 and 36)
0.000
0.000
0.0000.000
1.278
0.000 0.000
1.398
0.000
0.0004
0.000
$
0.000
0.000
492.94
0.000
600.000
0.000
$
1.158
0.0003
0.000
0.000
0.0013
$ $
FY 2017 Student Count 2016 ADM (from Work Sheet B, line A.8
and Work Sheet G, line II for type 03 districts)
600.000
450.76
FY 2017 Student Count 2016 ADM (from Work Sheet B, line
A.8 and Work Sheet G, line III for type 03 districts) 15.385
1.0000
2,348.579
1,058,645.47 722,007.25
Adjusted FY 2017 PSD and K-8 DAA (VII.F.1-VII.F.2) (to Work Sheet J, line II.E)
PSD and K-8 DAA Capital Transportation (line VII.G) & State Budget Reduction Adjustments (to Budget,
page 7, line 2.b)
x
1,464.696
1.0000
Rev. 5/16-FY 2017 7/25/2016 7:48 AM Page 7 of 15

Rev. 5/16-FY 2017 7/25/2016 7:48 AM Page 7 of 15
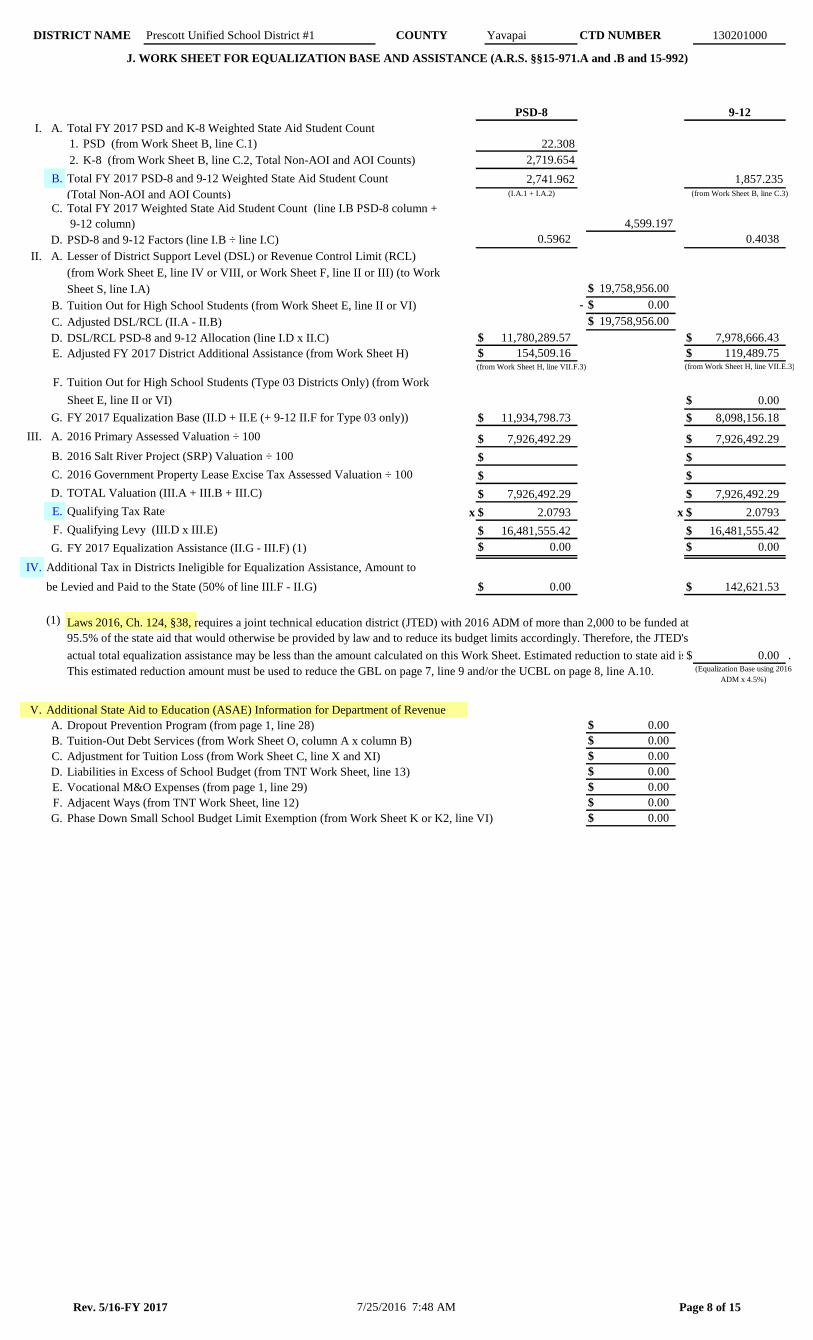
DISTRICT NAME COUNTY Yavapai CTD NUMBER 130201000
J. WORK SHEET FOR EQUALIZATION BASE AND ASSISTANCE (A.R.S. §§15-971.A and .B and 15-992)
PSD-8 9-12
I. A. Total FY 2017 PSD and K-8 Weighted State Aid Student Count
1. PSD (from Work Sheet B, line C.1)
2. K-8 (from Work Sheet B, line C.2, Total Non-AOI and AOI Counts)
B. Total FY 2017 PSD-8 and 9-12 Weighted State Aid Student Count
(Total Non-AOI and AOI Counts) (I.A.1 + I.A.2) (from Work Sheet B, line C.3)
C. Total FY 2017 Weighted State Aid Student Count (line I.B PSD-8 column +
9-12 column)
D. PSD-8 and 9-12 Factors (line I.B ÷ line I.C)
II. A. Lesser of District Support Level (DSL) or Revenue Control Limit (RCL)
(from Work Sheet E, line IV or VIII, or Work Sheet F, line II or III) (to Work
Sheet S, line I.A) $ 19,758,956.00
B. Tuition Out for High School Students (from Work Sheet E, line II or VI) - $ 0.00
C. Adjusted DSL/RCL (II.A - II.B) $ 19,758,956.00
D. DSL/RCL PSD-8 and 9-12 Allocation (line I.D x II.C) $ 11,780,289.57 $ 7,978,666.43
E. Adjusted FY 2017 District Additional Assistance (from Work Sheet H) $ 154,509.16 $ 119,489.75(from Work Sheet H, line VII.F.3) (from Work Sheet H, line VII.E.3)
F. Tuition Out for High School Students (Type 03 Districts Only) (from Work
Sheet E, line II or VI) $ 0.00
G. FY 2017 Equalization Base (II.D + II.E (+ 9-12 II.F for Type 03 only)) $ 11,934,798.73 $ 8,098,156.18
III. A. 2016 Primary Assessed Valuation ÷ 100 $ 7,926,492.29 $ 7,926,492.29
B. 2016 Salt River Project (SRP) Valuation ÷ 100 $ $
C. 2016 Government Property Lease Excise Tax Assessed Valuation ÷ 100 $ $
D. TOTAL Valuation (III.A + III.B + III.C) $ 7,926,492.29 $ 7,926,492.29
E. Qualifying Tax Rate x $ 2.0793 x $ 2.0793
F. Qualifying Levy (III.D x III.E) $ 16,481,555.42 $ 16,481,555.42
G. FY 2017 Equalization Assistance (II.G - III.F) (1) $ 0.00 $ 0.00
IV. Additional Tax in Districts Ineligible for Equalization Assistance, Amount to
be Levied and Paid to the State (50% of line III.F - II.G) $ 0.00 $ 142,621.53
(1) Laws 2016, Ch. 124, §38, requires a joint technical education district (JTED) with 2016 ADM of more than 2,000 to be funded at
95.5% of the state aid that would otherwise be provided by law and to reduce its budget limits accordingly. Therefore, the JTED's
actual total equalization assistance may be less than the amount calculated on this Work Sheet. Estimated reduction to state aid is$ 0.00 .
This estimated reduction amount must be used to reduce the GBL on page 7, line 9 and/or the UCBL on page 8, line A.10.
V. Additional State Aid to Education (ASAE) Information for Department of Revenue
A. Dropout Prevention Program (from page 1, line 28) $ 0.00
B. Tuition-Out Debt Services (from Work Sheet O, column A x column B) $ 0.00
C. Adjustment for Tuition Loss (from Work Sheet C, line X and XI) $ 0.00
D. Liabilities in Excess of School Budget (from TNT Work Sheet, line 13) $ 0.00
E. Vocational M&O Expenses (from page 1, line 29) $ 0.00
F. Adjacent Ways (from TNT Work Sheet, line 12) $ 0.00
G. Phase Down Small School Budget Limit Exemption (from Work Sheet K or K2, line VI) $ 0.00
(Equalization Base using 2016
ADM x 4.5%)
1,857.235
0.4038
4,599.197
Prescott Unified School District #1
22.308
2,719.654
2,741.962
0.5962
Rev. 5/16-FY 2017 7/25/2016 7:48 AM Page 8 of 15
DISTRICT NAME Prescott Unified School District #1 COUNTY Yavapai CTD NUMBER 130201000
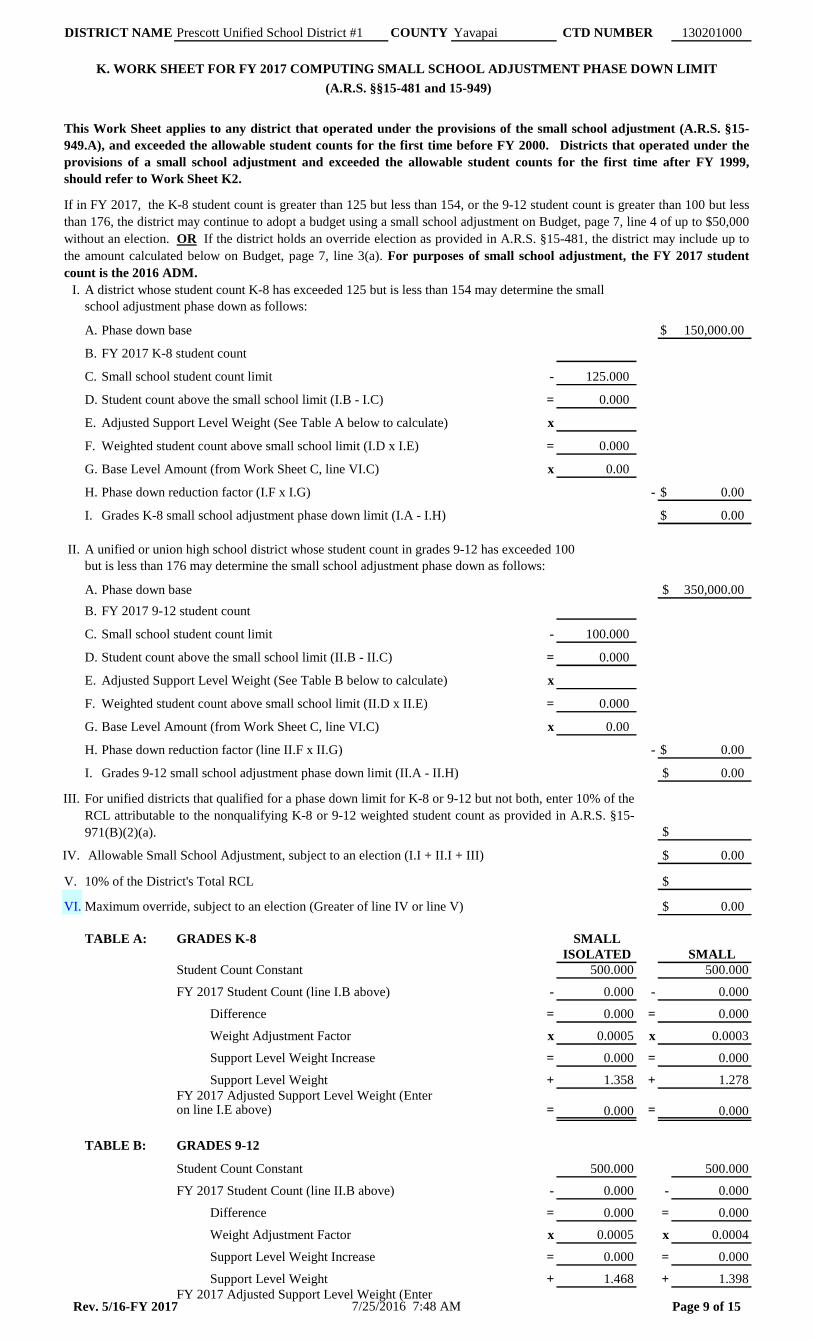
K. WORK SHEET FOR FY 2017 COMPUTING SMALL SCHOOL ADJUSTMENT PHASE DOWN LIMIT
(A.R.S. §§15-481 and 15-949)
I. A district whose student count K-8 has exceeded 125 but is less than 154 may determine the small
school adjustment phase down as follows:
A. Phase down base $ 150,000.00
B. FY 2017 K-8 student count
C. Small school student count limit - 125.000
D. Student count above the small school limit (I.B - I.C) = 0.000
E. Adjusted Support Level Weight (See Table A below to calculate) x
F. Weighted student count above small school limit (I.D x I.E) = 0.000
G. Base Level Amount (from Work Sheet C, line VI.C) x 0.00
H. Phase down reduction factor (I.F x I.G) - $ 0.00
I. Grades K-8 small school adjustment phase down limit (I.A - I.H) $ 0.00
II. A unified or union high school district whose student count in grades 9-12 has exceeded 100
but is less than 176 may determine the small school adjustment phase down as follows:
A. Phase down base $ 350,000.00
B. FY 2017 9-12 student count
C. Small school student count limit - 100.000
D. Student count above the small school limit (II.B - II.C) = 0.000
E. Adjusted Support Level Weight (See Table B below to calculate) x
F. Weighted student count above small school limit (II.D x II.E) = 0.000
G. Base Level Amount (from Work Sheet C, line VI.C) x 0.00
H. Phase down reduction factor (line II.F x II.G) - $ 0.00
I. Grades 9-12 small school adjustment phase down limit (II.A - II.H) $ 0.00
III.
$
IV. Allowable Small School Adjustment, subject to an election (I.I + II.I + III) $
V. $
VI. $ 0.00
TABLE A: GRADES K-8 SMALL
ISOLATED SMALL
Student Count Constant 500.000 500.000
FY 2017 Student Count (line I.B above) - 0.000 - 0.000
Difference = 0.000 = 0.000
Weight Adjustment Factor x 0.0005 x 0.0003
Support Level Weight Increase = 0.000 = 0.000
Support Level Weight + 1.358 + 1.278
FY 2017 Adjusted Support Level Weight (Enteron line I.E above) = =
TABLE B: GRADES 9-12
Student Count Constant 500.000 500.000
FY 2017 Student Count (line II.B above) - 0.000 - 0.000
Difference = 0.000 = 0.000
Weight Adjustment Factor x 0.0005 x 0.0004
Support Level Weight Increase = 0.000 = 0.000
Support Level Weight + 1.468 + 1.398
FY 2017 Adjusted Support Level Weight (Enter
0.000 0.000
This Work Sheet applies to any district that operated under the provisions of the small school adjustment (A.R.S. §15-
949.A), and exceeded the allowable student counts for the first time before FY 2000. Districts that operated under the
provisions of a small school adjustment and exceeded the allowable student counts for the first time after FY 1999,
should refer to Work Sheet K2.
If in FY 2017, the K-8 student count is greater than 125 but less than 154, or the 9-12 student count is greater than 100 but less
than 176, the district may continue to adopt a budget using a small school adjustment on Budget, page 7, line 4 of up to $50,000
without an election. OR If the district holds an override election as provided in A.R.S. §15-481, the district may include up to
the amount calculated below on Budget, page 7, line 3(a). For purposes of small school adjustment, the FY 2017 student
count is the 2016 ADM.
For unified districts that qualified for a phase down limit for K-8 or 9-12 but not both, enter 10% of the
RCL attributable to the nonqualifying K-8 or 9-12 weighted student count as provided in A.R.S. §15-
971(B)(2)(a).
0.000 0.000
10% of the District's Total RCL
Maximum override, subject to an election (Greater of line IV or line V)
0.00
Rev. 5/16-FY 2017 7/25/2016 7:48 AM Page 9 of 15
on line II.E above) = =0.000 0.000
Rev. 5/16-FY 2017 7/25/2016 7:48 AM Page 9 of 15
DISTRICT NAME Prescott Unified School District #1 Yavapai 130201000
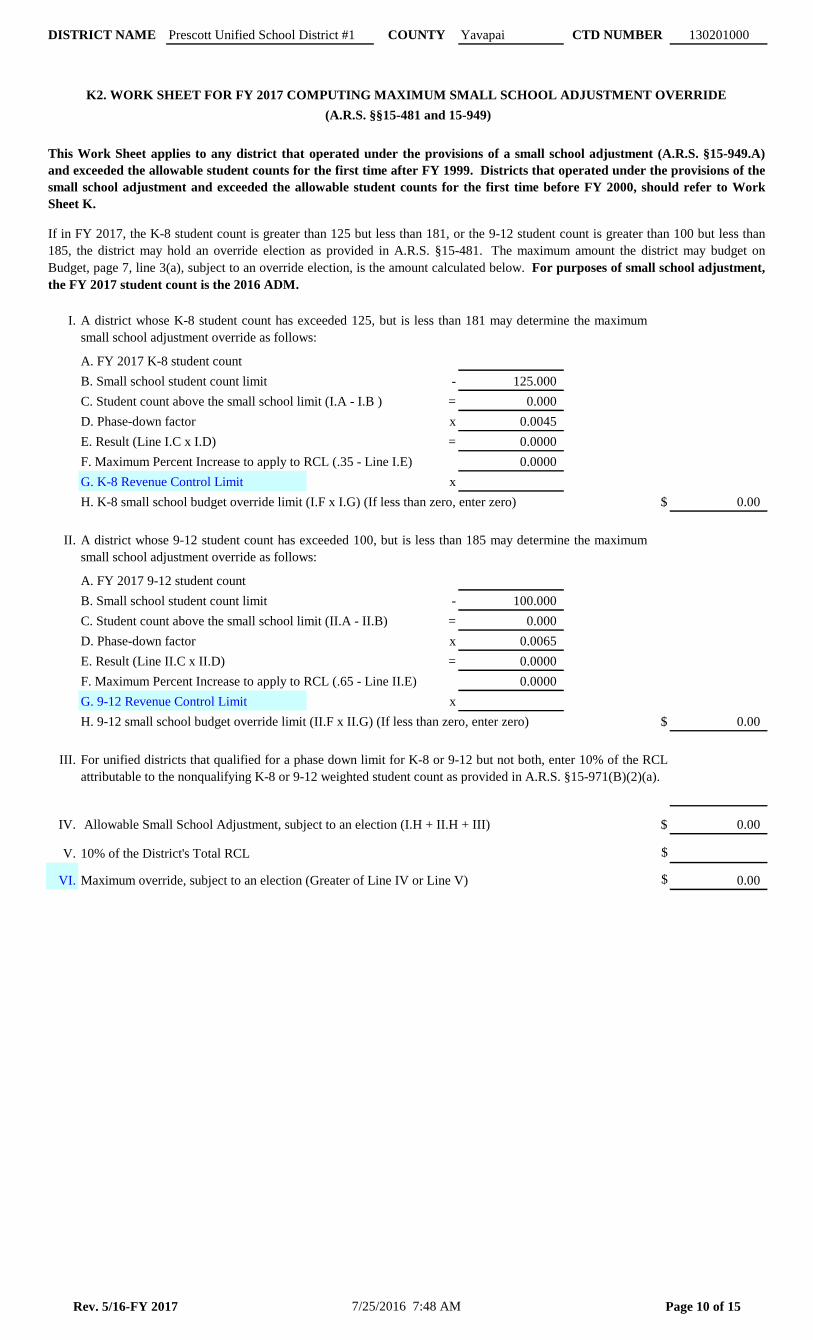
I.
A. FY 2017 K-8 student count
B. Small school student count limit - 125.000
C. Student count above the small school limit (I.A - I.B ) = 0.000
D. Phase-down factor x 0.0045
E. Result (Line I.C x I.D) = 0.0000
F. Maximum Percent Increase to apply to RCL (.35 - Line I.E) 0.0000
x
H. K-8 small school budget override limit (I.F x I.G) (If less than zero, enter zero) $ 0.00
II.
A. FY 2017 9-12 student count
B. Small school student count limit - 100.000
C. Student count above the small school limit (II.A - II.B) = 0.000
D. Phase-down factor x 0.0065
E. Result (Line II.C x II.D) = 0.0000
F. Maximum Percent Increase to apply to RCL (.65 - Line II.E) 0.0000
x
H. 9-12 small school budget override limit (II.F x II.G) (If less than zero, enter zero) $ 0.00
III.
IV. Allowable Small School Adjustment, subject to an election (I.H + II.H + III) $ 0.00
V. $
VI. $ 0.00
If in FY 2017, the K-8 student count is greater than 125 but less than 181, or the 9-12 student count is greater than 100 but less than
185, the district may hold an override election as provided in A.R.S. §15-481. The maximum amount the district may budget on
Budget, page 7, line 3(a), subject to an override election, is the amount calculated below. For purposes of small school adjustment,
the FY 2017 student count is the 2016 ADM.
This Work Sheet applies to any district that operated under the provisions of a small school adjustment (A.R.S. §15-949.A)
and exceeded the allowable student counts for the first time after FY 1999. Districts that operated under the provisions of the
small school adjustment and exceeded the allowable student counts for the first time before FY 2000, should refer to Work
Sheet K.
COUNTY CTD NUMBER
K2. WORK SHEET FOR FY 2017 COMPUTING MAXIMUM SMALL SCHOOL ADJUSTMENT OVERRIDE
(A.R.S. §§15-481 and 15-949)
A district whose 9-12 student count has exceeded 100, but is less than 185 may determine the maximum
small school adjustment override as follows:
A district whose K-8 student count has exceeded 125, but is less than 181 may determine the maximum
small school adjustment override as follows:
10% of the District's Total RCL
Maximum override, subject to an election (Greater of Line IV or Line V)
G. K-8 Revenue Control Limit
G. 9-12 Revenue Control Limit
For unified districts that qualified for a phase down limit for K-8 or 9-12 but not both, enter 10% of the RCL
attributable to the nonqualifying K-8 or 9-12 weighted student count as provided in A.R.S. §15-971(B)(2)(a).
Rev. 5/16-FY 2017 7/25/2016 7:48 AM Page 10 of 15
DISTRICT NAME Prescott Unified School District #1COUNTY Yavapai CTD NUMBER 130201000
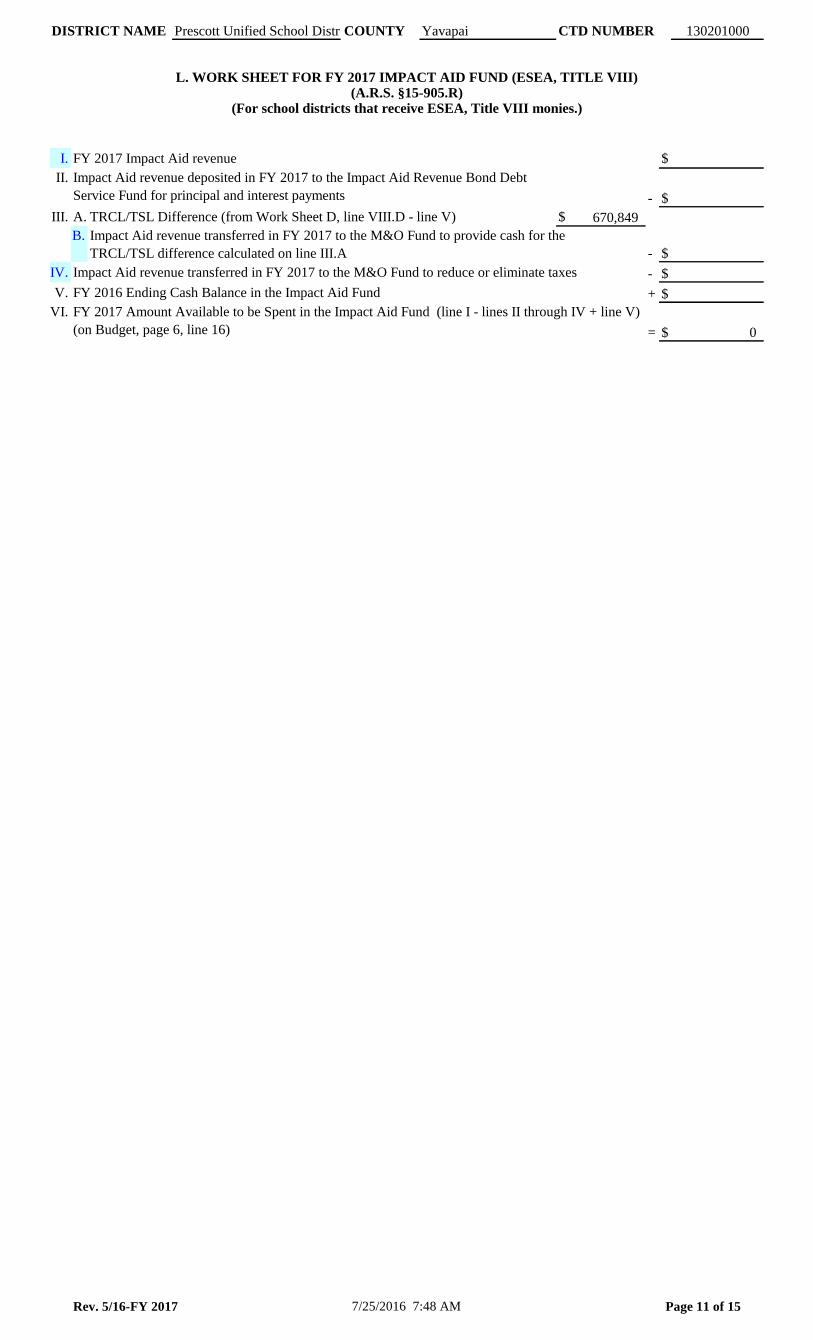
L. WORK SHEET FOR FY 2017 IMPACT AID FUND (ESEA, TITLE VIII)(A.R.S. §15-905.R)
(For school districts that receive ESEA, Title VIII monies.)
I. FY 2017 Impact Aid revenue $
II.
- $
III. A. TRCL/TSL Difference (from Work Sheet D, line VIII.D - line V) $ 670,849
B.
- $
IV. Impact Aid revenue transferred in FY 2017 to the M&O Fund to reduce or eliminate taxes - $
V. FY 2016 Ending Cash Balance in the Impact Aid Fund + $
VI.
= $ 0
Impact Aid revenue deposited in FY 2017 to the Impact Aid Revenue Bond Debt
Service Fund for principal and interest payments
Impact Aid revenue transferred in FY 2017 to the M&O Fund to provide cash for the
TRCL/TSL difference calculated on line III.A
FY 2017 Amount Available to be Spent in the Impact Aid Fund (line I - lines II through IV + line V)
(on Budget, page 6, line 16)
Rev. 5/16-FY 2017 7/25/2016 7:48 AM Page 11 of 15
DISTRICT NAME Prescott Unified School District #1COUNTY Yavapai CTD NUMBER 130201000
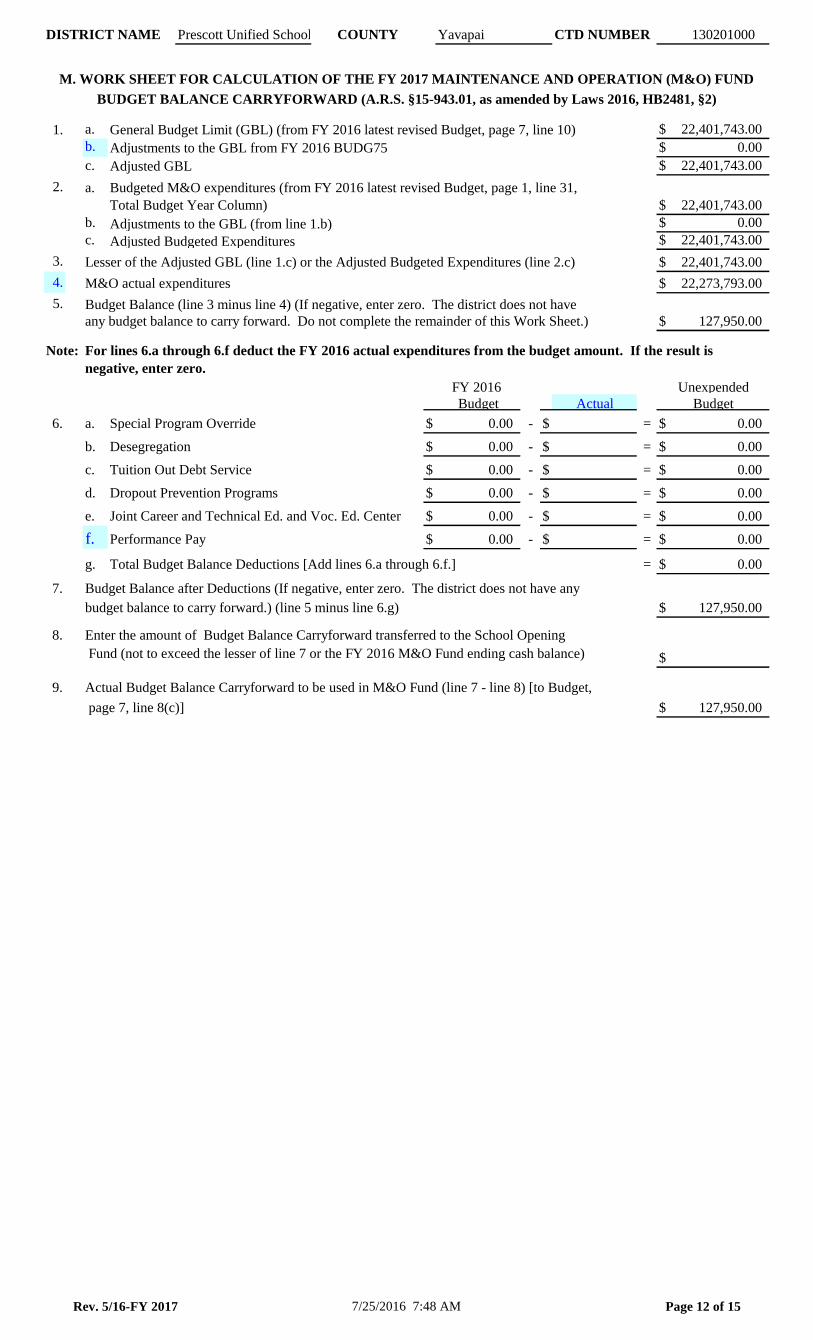
M. WORK SHEET FOR CALCULATION OF THE FY 2017 MAINTENANCE AND OPERATION (M&O) FUND
BUDGET BALANCE CARRYFORWARD (A.R.S. §15-943.01, as amended by Laws 2016, HB2481, §2)
1. a. General Budget Limit (GBL) (from FY 2016 latest revised Budget, page 7, line 10) $ 22,401,743.00
b. Adjustments to the GBL from FY 2016 BUDG75 $ 0.00
c. Adjusted GBL $ 22,401,743.00
2. a. Budgeted M&O expenditures (from FY 2016 latest revised Budget, page 1, line 31,
Total Budget Year Column) $
b. Adjustments to the GBL (from line 1.b) $ 0.00
c. Adjusted Budgeted Expenditures $ 22,401,743.00
3. Lesser of the Adjusted GBL (line 1.c) or the Adjusted Budgeted Expenditures (line 2.c) $ 22,401,743.00
4. M&O actual expenditures $ 22,273,793.00
5. Budget Balance (line 3 minus line 4) (If negative, enter zero. The district does not have
any budget balance to carry forward. Do not complete the remainder of this Work Sheet.) $
Note:
FY 2016 Unexpended
Budget Actual Budget
6. a. Special Program Override $ 0.00 - $ = $ 0.00
b. Desegregation $ 0.00 - $ = $ 0.00
c. Tuition Out Debt Service $ 0.00 - $ = $ 0.00
d. Dropout Prevention Programs $ 0.00 - $ = $ 0.00
e. Joint Career and Technical Ed. and Voc. Ed. Center $ 0.00 - $ = $ 0.00
f. Performance Pay $ 0.00 - $ = $ 0.00
g. Total Budget Balance Deductions [Add lines 6.a through 6.f.] = $ 0.00
7. Budget Balance after Deductions (If negative, enter zero. The district does not have any
budget balance to carry forward.) (line 5 minus line 6.g) $
8. Enter the amount of Budget Balance Carryforward transferred to the School Opening
Fund (not to exceed the lesser of line 7 or the FY 2016 M&O Fund ending cash balance) $
9. Actual Budget Balance Carryforward to be used in M&O Fund (line 7 - line 8) [to Budget,
page 7, line 8(c)] $
For lines 6.a through 6.f deduct the FY 2016 actual expenditures from the budget amount. If the result is
negative, enter zero.
22,401,743.00
127,950.00
127,950.00
127,950.00
Rev. 5/16-FY 2017 7/25/2016 7:48 AM Page 12 of 15
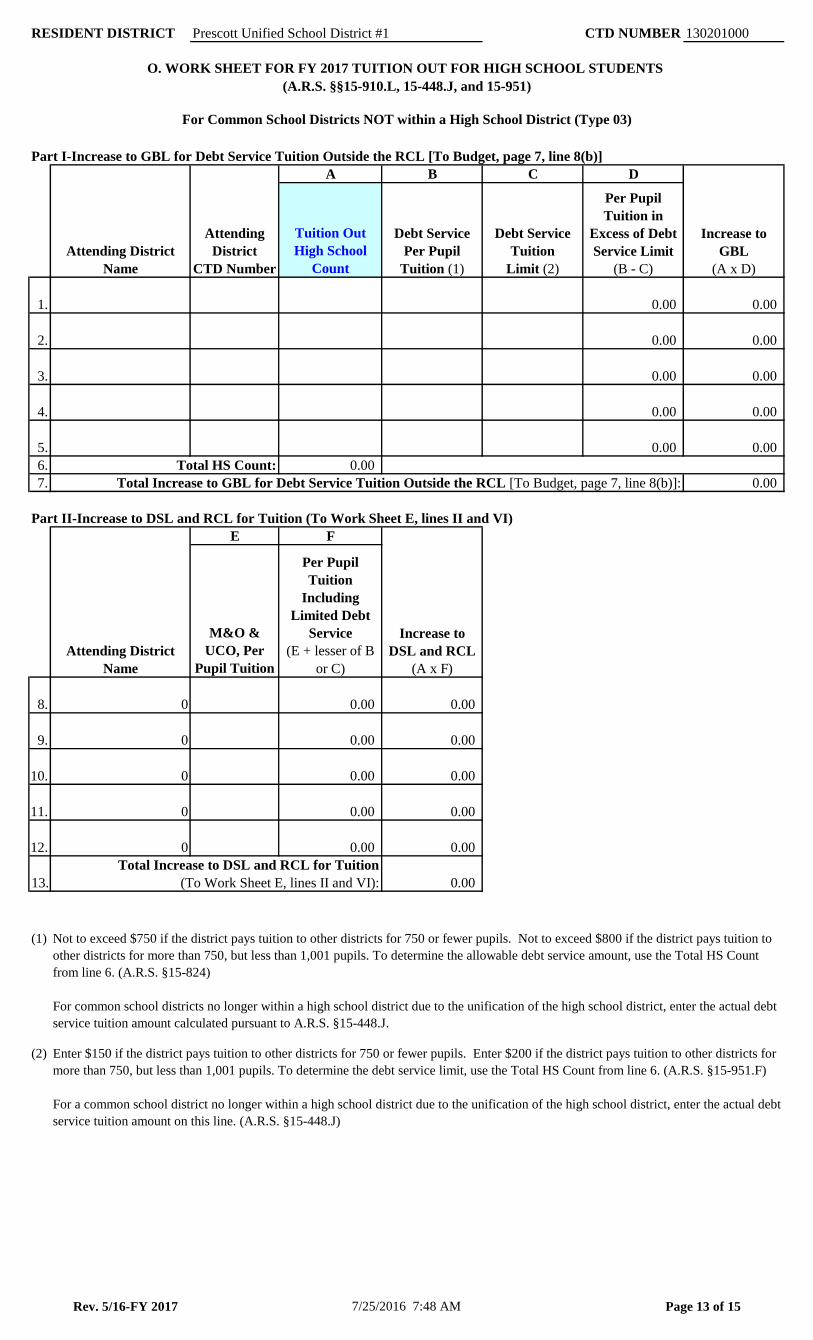
RESIDENT DISTRICT CTD NUMBER 130201000
Part I-Increase to GBL for Debt Service Tuition Outside the RCL [To Budget, page 7, line 8(b)]
A B C D
Tuition Out
High School
Count
Debt Service
Per Pupil
Tuition (1)
Debt Service
Tuition
Limit (2)
Per Pupil
Tuition in
Excess of Debt
Service Limit
(B - C)
1. 0.00 0.00
2. 0.00 0.00
3. 0.00 0.00
4. 0.00 0.00
5. 0.00 0.00
6. Total HS Count: 0.00
7. Total Increase to GBL for Debt Service Tuition Outside the RCL [To Budget, page 7, line 8(b)]: 0.00
Part II-Increase to DSL and RCL for Tuition (To Work Sheet E, lines II and VI)
E F
M&O &
UCO, Per
Pupil Tuition
Per Pupil
Tuition
Including
Limited Debt
Service
(E + lesser of B
or C)
8. 0.00 0.00
9. 0.00 0.00
10. 0.00 0.00
11. 0.00 0.00
12. 0.00 0.00
Total Increase to DSL and RCL for Tuition
(To Work Sheet E, lines II and VI):
(1)
(2)
13. 0.00
Enter $150 if the district pays tuition to other districts for 750 or fewer pupils. Enter $200 if the district pays tuition to other districts for
more than 750, but less than 1,001 pupils. To determine the debt service limit, use the Total HS Count from line 6. (A.R.S. §15-951.F)
For a common school district no longer within a high school district due to the unification of the high school district, enter the actual debt
service tuition amount on this line. (A.R.S. §15-448.J)
Not to exceed $750 if the district pays tuition to other districts for 750 or fewer pupils. Not to exceed $800 if the district pays tuition to
other districts for more than 750, but less than 1,001 pupils. To determine the allowable debt service amount, use the Total HS Count
from line 6. (A.R.S. §15-824)
For common school districts no longer within a high school district due to the unification of the high school district, enter the actual debt
service tuition amount calculated pursuant to A.R.S. §15-448.J.
Increase to
DSL and RCL
(A x F)
0
0
0
0
Attending
District
CTD Number
0
Increase to
GBL
(A x D)
Attending District
Name
Prescott Unified School District #1
O. WORK SHEET FOR FY 2017 TUITION OUT FOR HIGH SCHOOL STUDENTS
(A.R.S. §§15-910.L, 15-448.J, and 15-951)
For Common School Districts NOT within a High School District (Type 03)
Attending District
Name
Rev. 5/16-FY 2017 7/25/2016 7:48 AM Page 13 of 15
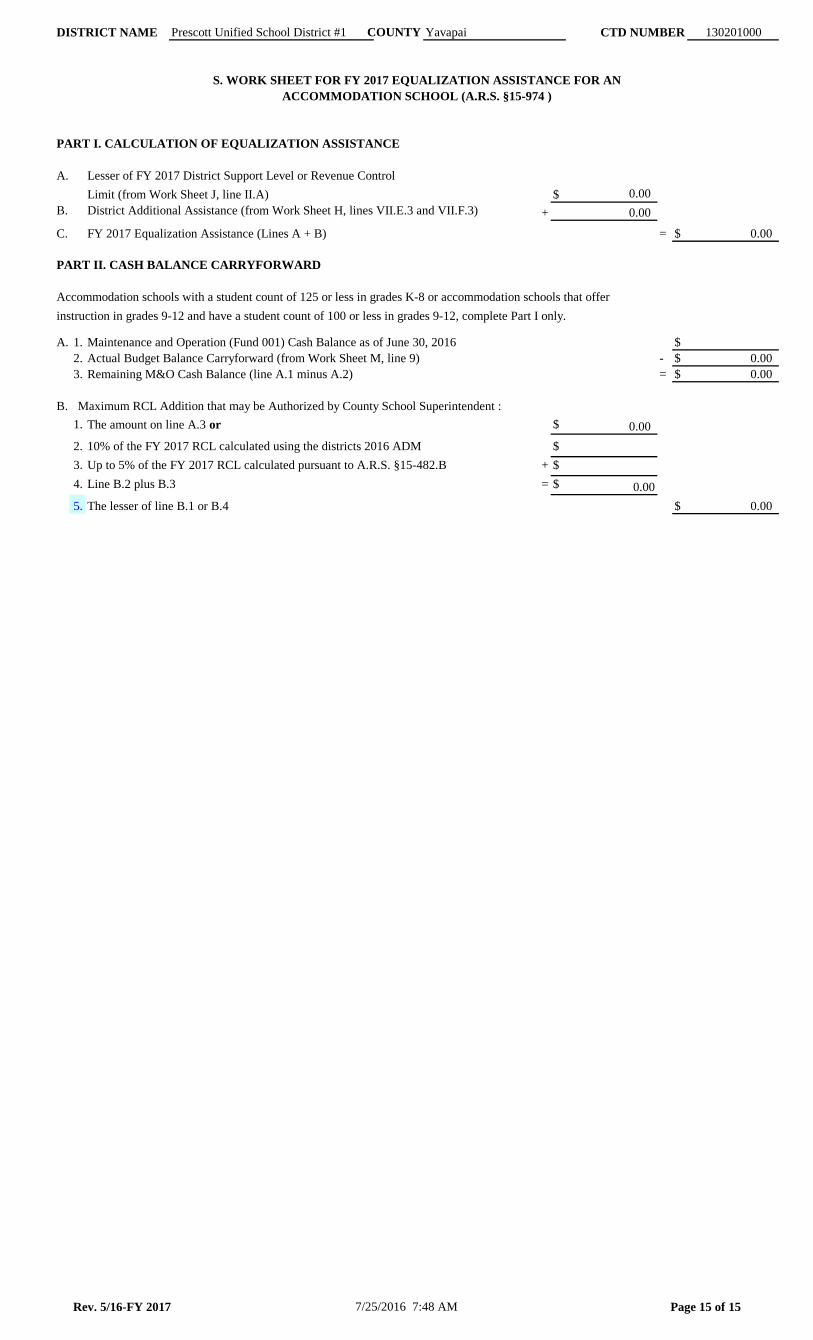
DISTRICT NAME Prescott Unified School District #1 COUNTY Yavapai CTD NUMBER 130201000
S. WORK SHEET FOR FY 2017 EQUALIZATION ASSISTANCE FOR AN
ACCOMMODATION SCHOOL (A.R.S. §15-974 )
PART I. CALCULATION OF EQUALIZATION ASSISTANCE
A. Lesser of FY 2017 District Support Level or Revenue Control
Limit (from Work Sheet J, line II.A) $
B. District Additional Assistance (from Work Sheet H, lines VII.E.3 and VII.F.3) + 0.00
C. FY 2017 Equalization Assistance (Lines A + B) = $ 0.00
PART II. CASH BALANCE CARRYFORWARD
Accommodation schools with a student count of 125 or less in grades K-8 or accommodation schools that offer
instruction in grades 9-12 and have a student count of 100 or less in grades 9-12, complete Part I only.
A. 1. Maintenance and Operation (Fund 001) Cash Balance as of June 30, 2016 $
2. Actual Budget Balance Carryforward (from Work Sheet M, line 9) - $ 0.00
3. Remaining M&O Cash Balance (line A.1 minus A.2) = $ 0.00
B. Maximum RCL Addition that may be Authorized by County School Superintendent :
1. The amount on line A.3 or $ 0.00
2. 10% of the FY 2017 RCL calculated using the districts 2016 ADM $
3. Up to 5% of the FY 2017 RCL calculated pursuant to A.R.S. §15-482.B + $
4. Line B.2 plus B.3 = $ 0.00
5. The lesser of line B.1 or B.4 $ 0.00
0.00
Rev. 5/16-FY 2017 7/25/2016 7:48 AM Page 15 of 15
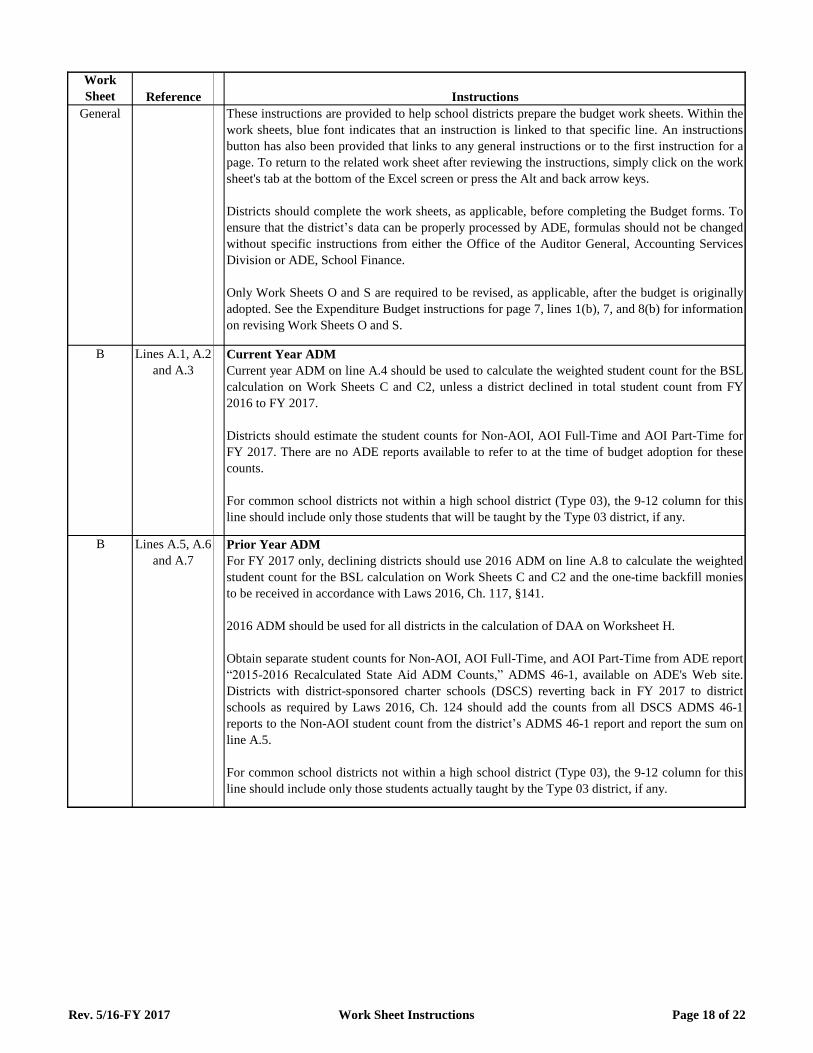
Work
Sheet Reference Instructions
General These instructions are provided to help school districts prepare the budget work sheets. Within the
work sheets, blue font indicates that an instruction is linked to that specific line. An instructions
button has also been provided that links to any general instructions or to the first instruction for a
page. To return to the related work sheet after reviewing the instructions, simply click on the work
sheet's tab at the bottom of the Excel screen or press the Alt and back arrow keys.
Districts should complete the work sheets, as applicable, before completing the Budget forms. To
ensure that the district’s data can be properly processed by ADE, formulas should not be changed
without specific instructions from either the Office of the Auditor General, Accounting Services
Division or ADE, School Finance.
Only Work Sheets O and S are required to be revised, as applicable, after the budget is originally
adopted. See the Expenditure Budget instructions for page 7, lines 1(b), 7, and 8(b) for information
on revising Work Sheets O and S.
B Lines A.1, A.2
and A.3
Current Year ADM
Current year ADM on line A.4 should be used to calculate the weighted student count for the BSL
calculation on Work Sheets C and C2, unless a district declined in total student count from FY
2016 to FY 2017.
Districts should estimate the student counts for Non-AOI, AOI Full-Time and AOI Part-Time for
FY 2017. There are no ADE reports available to refer to at the time of budget adoption for these
counts.
For common school districts not within a high school district (Type 03), the 9-12 column for this
line should include only those students that will be taught by the Type 03 district, if any.
B Lines A.5, A.6
and A.7
Prior Year ADM
For FY 2017 only, declining districts should use 2016 ADM on line A.8 to calculate the weighted
student count for the BSL calculation on Work Sheets C and C2 and the one-time backfill monies
to be received in accordance with Laws 2016, Ch. 117, §141.
2016 ADM should be used for all districts in the calculation of DAA on Worksheet H.
Obtain separate student counts for Non-AOI, AOI Full-Time, and AOI Part-Time from ADE report
“2015-2016 Recalculated State Aid ADM Counts,” ADMS 46-1, available on ADE's Web site.
Districts with district-sponsored charter schools (DSCS) reverting back in FY 2017 to district
schools as required by Laws 2016, Ch. 124 should add the counts from all DSCS ADMS 46-1
reports to the Non-AOI student count from the district’s ADMS 46-1 report and report the sum on
line A.5.
For common school districts not within a high school district (Type 03), the 9-12 column for this
line should include only those students actually taught by the Type 03 district, if any.
Rev. 5/16-FY 2017 Work Sheet Instructions Page 18 of 22
Work
Sheet Reference Instructions
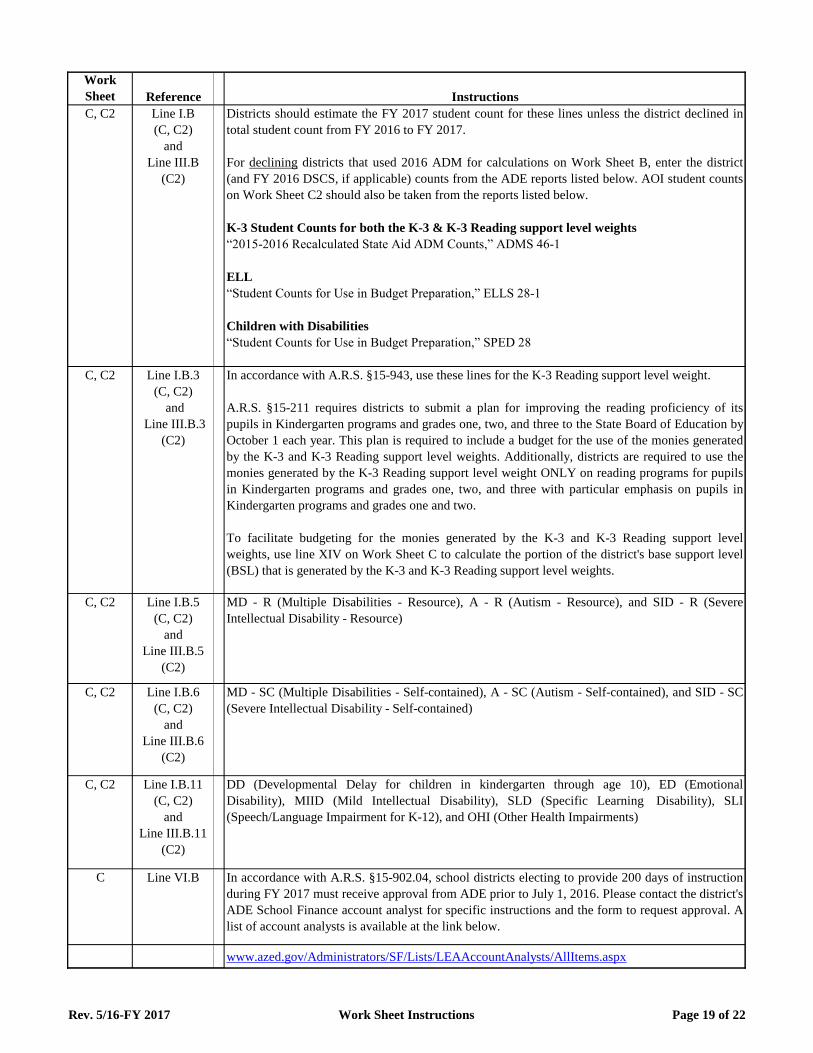
C, C2 Line I.B
(C, C2)
and
Line III.B
(C2)
Districts should estimate the FY 2017 student count for these lines unless the district declined in
total student count from FY 2016 to FY 2017.
For declining districts that used 2016 ADM for calculations on Work Sheet B, enter the district
(and FY 2016 DSCS, if applicable) counts from the ADE reports listed below. AOI student counts
on Work Sheet C2 should also be taken from the reports listed below.
K-3 Student Counts for both the K-3 & K-3 Reading support level weights
“2015-2016 Recalculated State Aid ADM Counts,” ADMS 46-1
ELL
“Student Counts for Use in Budget Preparation,” ELLS 28-1
Children with Disabilities
“Student Counts for Use in Budget Preparation,” SPED 28
C, C2 Line I.B.3
(C, C2)
and
Line III.B.3
(C2)
In accordance with A.R.S. §15-943, use these lines for the K-3 Reading support level weight.
A.R.S. §15-211 requires districts to submit a plan for improving the reading proficiency of its
pupils in Kindergarten programs and grades one, two, and three to the State Board of Education by
October 1 each year. This plan is required to include a budget for the use of the monies generated
by the K-3 and K-3 Reading support level weights. Additionally, districts are required to use the
monies generated by the K-3 Reading support level weight ONLY on reading programs for pupils
in Kindergarten programs and grades one, two, and three with particular emphasis on pupils in
Kindergarten programs and grades one and two.
To facilitate budgeting for the monies generated by the K-3 and K-3 Reading support level
weights, use line XIV on Work Sheet C to calculate the portion of the district's base support level
(BSL) that is generated by the K-3 and K-3 Reading support level weights.
C, C2 Line I.B.5
(C, C2)
and
Line III.B.5
(C2)
MD - R (Multiple Disabilities - Resource), A - R (Autism - Resource), and SID - R (Severe
Intellectual Disability - Resource)
C, C2 Line I.B.6
(C, C2)
and
Line III.B.6
(C2)
MD - SC (Multiple Disabilities - Self-contained), A - SC (Autism - Self-contained), and SID - SC
(Severe Intellectual Disability - Self-contained)
C, C2 Line I.B.11
(C, C2)
and
Line III.B.11
(C2)
DD (Developmental Delay for children in kindergarten through age 10), ED (Emotional
Disability), MIID (Mild Intellectual Disability), SLD (Specific Learning Disability), SLI
(Speech/Language Impairment for K-12), and OHI (Other Health Impairments)
C Line VI.B In accordance with A.R.S. §15-902.04, school districts electing to provide 200 days of instruction
during FY 2017 must receive approval from ADE prior to July 1, 2016. Please contact the district's
ADE School Finance account analyst for specific instructions and the form to request approval. A
list of account analysts is available at the link below.
www.azed.gov/Administrators/SF/Lists/LEAAccountAnalysts/AllItems.aspx
Rev. 5/16-FY 2017 Work Sheet Instructions Page 19 of 22
Work
Sheet Reference Instructions
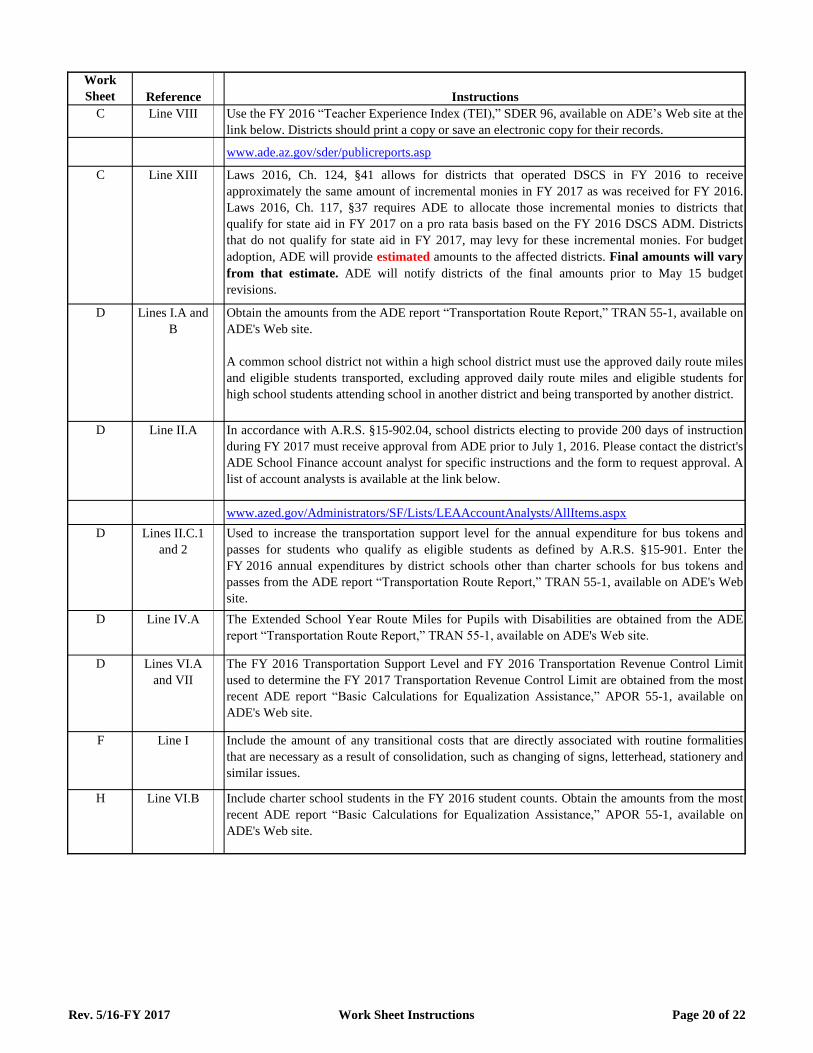
C Line VIII Use the FY 2016 “Teacher Experience Index (TEI),” SDER 96, available on ADE’s Web site at the
link below. Districts should print a copy or save an electronic copy for their records.
www.ade.az.gov/sder/publicreports.asp
C Line XIII Laws 2016, Ch. 124, §41 allows for districts that operated DSCS in FY 2016 to receive
approximately the same amount of incremental monies in FY 2017 as was received for FY 2016.
Laws 2016, Ch. 117, §37 requires ADE to allocate those incremental monies to districts that
qualify for state aid in FY 2017 on a pro rata basis based on the FY 2016 DSCS ADM. Districts
that do not qualify for state aid in FY 2017, may levy for these incremental monies. For budget
adoption, ADE will provide estimated amounts to the affected districts. Final amounts will vary
from that estimate. ADE will notify districts of the final amounts prior to May 15 budget
revisions.
D Lines I.A and
B
Obtain the amounts from the ADE report “Transportation Route Report,” TRAN 55-1, available on
ADE's Web site.
A common school district not within a high school district must use the approved daily route miles
and eligible students transported, excluding approved daily route miles and eligible students for
high school students attending school in another district and being transported by another district.
D Line II.A In accordance with A.R.S. §15-902.04, school districts electing to provide 200 days of instruction
during FY 2017 must receive approval from ADE prior to July 1, 2016. Please contact the district's
ADE School Finance account analyst for specific instructions and the form to request approval. A
list of account analysts is available at the link below.
www.azed.gov/Administrators/SF/Lists/LEAAccountAnalysts/AllItems.aspx
D Lines II.C.1
and 2
Used to increase the transportation support level for the annual expenditure for bus tokens and
passes for students who qualify as eligible students as defined by A.R.S. §15-901. Enter the
FY 2016 annual expenditures by district schools other than charter schools for bus tokens and
passes from the ADE report “Transportation Route Report,” TRAN 55-1, available on ADE's Web
site.
D Line IV.A The Extended School Year Route Miles for Pupils with Disabilities are obtained from the ADE
report “Transportation Route Report,” TRAN 55-1, available on ADE's Web site.
D Lines VI.A
and VII
The FY 2016 Transportation Support Level and FY 2016 Transportation Revenue Control Limit
used to determine the FY 2017 Transportation Revenue Control Limit are obtained from the most
recent ADE report “Basic Calculations for Equalization Assistance,” APOR 55-1, available on
ADE's Web site.
F Line I Include the amount of any transitional costs that are directly associated with routine formalities
that are necessary as a result of consolidation, such as changing of signs, letterhead, stationery and
similar issues.
H Line VI.B Include charter school students in the FY 2016 student counts. Obtain the amounts from the most
recent ADE report “Basic Calculations for Equalization Assistance,” APOR 55-1, available on
ADE's Web site.
Rev. 5/16-FY 2017 Work Sheet Instructions Page 20 of 22
Work
Sheet Reference Instructions
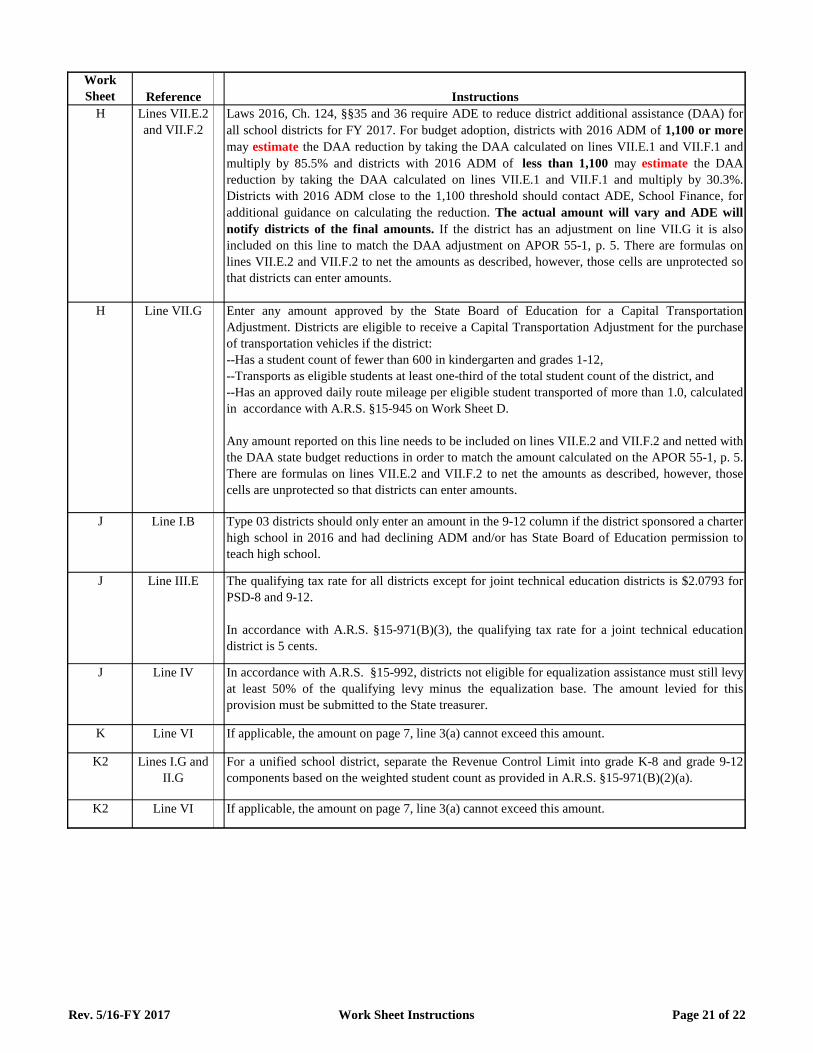
H Lines VII.E.2
and VII.F.2
Laws 2016, Ch. 124, §§35 and 36 require ADE to reduce district additional assistance (DAA) for
all school districts for FY 2017. For budget adoption, districts with 2016 ADM of 1,100 or more
may estimate the DAA reduction by taking the DAA calculated on lines VII.E.1 and VII.F.1 and
multiply by 85.5% and districts with 2016 ADM of less than 1,100 may estimate the DAA
reduction by taking the DAA calculated on lines VII.E.1 and VII.F.1 and multiply by 30.3%.
Districts with 2016 ADM close to the 1,100 threshold should contact ADE, School Finance, for
additional guidance on calculating the reduction. The actual amount will vary and ADE will
notify districts of the final amounts. If the district has an adjustment on line VII.G it is also
included on this line to match the DAA adjustment on APOR 55-1, p. 5. There are formulas on
lines VII.E.2 and VII.F.2 to net the amounts as described, however, those cells are unprotected so
that districts can enter amounts.
H Line VII.G Enter any amount approved by the State Board of Education for a Capital Transportation
Adjustment. Districts are eligible to receive a Capital Transportation Adjustment for the purchase
of transportation vehicles if the district:
--Has a student count of fewer than 600 in kindergarten and grades 1-12,
--Transports as eligible students at least one-third of the total student count of the district, and
--Has an approved daily route mileage per eligible student transported of more than 1.0, calculated
in accordance with A.R.S. §15-945 on Work Sheet D.
Any amount reported on this line needs to be included on lines VII.E.2 and VII.F.2 and netted with
the DAA state budget reductions in order to match the amount calculated on the APOR 55-1, p. 5.
There are formulas on lines VII.E.2 and VII.F.2 to net the amounts as described, however, those
cells are unprotected so that districts can enter amounts.
J Line I.B Type 03 districts should only enter an amount in the 9-12 column if the district sponsored a charter
high school in 2016 and had declining ADM and/or has State Board of Education permission to
teach high school.
J Line III.E The qualifying tax rate for all districts except for joint technical education districts is $2.0793 for
PSD-8 and 9-12.
In accordance with A.R.S. §15-971(B)(3), the qualifying tax rate for a joint technical education
district is 5 cents.
J Line IV In accordance with A.R.S. §15-992, districts not eligible for equalization assistance must still levy
at least 50% of the qualifying levy minus the equalization base. The amount levied for this
provision must be submitted to the State treasurer.
K Line VI If applicable, the amount on page 7, line 3(a) cannot exceed this amount.
K2 Lines I.G and
II.G
For a unified school district, separate the Revenue Control Limit into grade K-8 and grade 9-12
components based on the weighted student count as provided in A.R.S. §15-971(B)(2)(a).
K2 Line VI If applicable, the amount on page 7, line 3(a) cannot exceed this amount.
Rev. 5/16-FY 2017 Work Sheet Instructions Page 21 of 22
Work
Sheet Reference Instructions
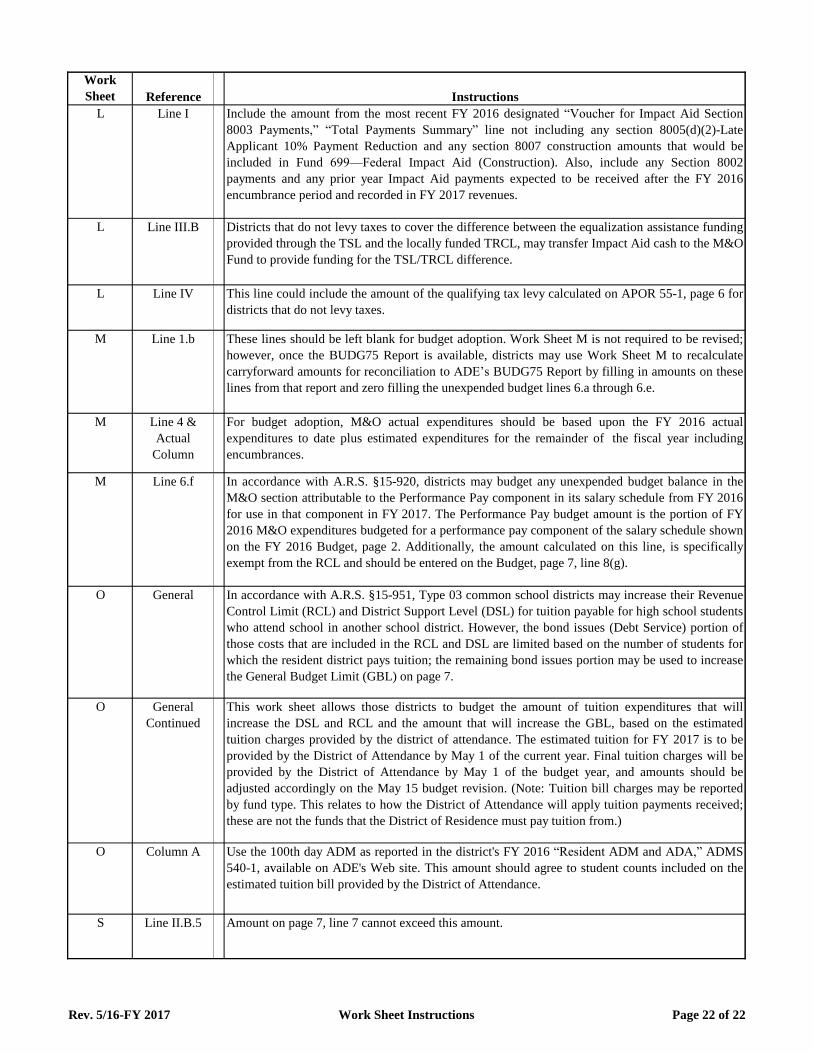
L Line I Include the amount from the most recent FY 2016 designated “Voucher for Impact Aid Section
8003 Payments,” “Total Payments Summary” line not including any section 8005(d)(2)-Late
Applicant 10% Payment Reduction and any section 8007 construction amounts that would be
included in Fund 699—Federal Impact Aid (Construction). Also, include any Section 8002
payments and any prior year Impact Aid payments expected to be received after the FY 2016
encumbrance period and recorded in FY 2017 revenues.
L Line III.B Districts that do not levy taxes to cover the difference between the equalization assistance funding
provided through the TSL and the locally funded TRCL, may transfer Impact Aid cash to the M&O
Fund to provide funding for the TSL/TRCL difference.
L Line IV This line could include the amount of the qualifying tax levy calculated on APOR 55-1, page 6 for
districts that do not levy taxes.
M Line 1.b These lines should be left blank for budget adoption. Work Sheet M is not required to be revised;
however, once the BUDG75 Report is available, districts may use Work Sheet M to recalculate
carryforward amounts for reconciliation to ADE’s BUDG75 Report by filling in amounts on these
lines from that report and zero filling the unexpended budget lines 6.a through 6.e.
M Line 4 &
Actual
Column
For budget adoption, M&O actual expenditures should be based upon the FY 2016 actual
expenditures to date plus estimated expenditures for the remainder of the fiscal year including
encumbrances.
M Line 6.f In accordance with A.R.S. §15-920, districts may budget any unexpended budget balance in the
M&O section attributable to the Performance Pay component in its salary schedule from FY 2016
for use in that component in FY 2017. The Performance Pay budget amount is the portion of FY
2016 M&O expenditures budgeted for a performance pay component of the salary schedule shown
on the FY 2016 Budget, page 2. Additionally, the amount calculated on this line, is specifically
exempt from the RCL and should be entered on the Budget, page 7, line 8(g).
O General In accordance with A.R.S. §15-951, Type 03 common school districts may increase their Revenue
Control Limit (RCL) and District Support Level (DSL) for tuition payable for high school students
who attend school in another school district. However, the bond issues (Debt Service) portion of
those costs that are included in the RCL and DSL are limited based on the number of students for
which the resident district pays tuition; the remaining bond issues portion may be used to increase
the General Budget Limit (GBL) on page 7.
O General
Continued
This work sheet allows those districts to budget the amount of tuition expenditures that will
increase the DSL and RCL and the amount that will increase the GBL, based on the estimated
tuition charges provided by the district of attendance. The estimated tuition for FY 2017 is to be
provided by the District of Attendance by May 1 of the current year. Final tuition charges will be
provided by the District of Attendance by May 1 of the budget year, and amounts should be
adjusted accordingly on the May 15 budget revision. (Note: Tuition bill charges may be reported
by fund type. This relates to how the District of Attendance will apply tuition payments received;
these are not the funds that the District of Residence must pay tuition from.)
O Column A Use the 100th day ADM as reported in the district's FY 2016 “Resident ADM and ADA,” ADMS
540-1, available on ADE's Web site. This amount should agree to student counts included on the
estimated tuition bill provided by the District of Attendance.
S Line II.B.5 Amount on page 7, line 7 cannot exceed this amount.
Rev. 5/16-FY 2017 Work Sheet Instructions Page 22 of 22
Related Documents