I Budget Management and Accountability: Evidence from Kenyan Local Authorities Nicole Bonoff * and Brigitte Zimmerman ** April 2010 Abstract: Using yearly budget data from Kenyan local governments from 2002-2007 and electoral data from 2007, we find evidence of electoral accountability in a decentralized system. After developing a theory of voting and politician behavior, we utilize OLS and probit analysis to demonstrate that voters reward fiscal management policies they prefer. We provide evidence that incumbents understand voter preferences and adjust their behavior if they anticipate running for re-election. Although we find evidence of elite capture in the system throughout the electoral cycle, this phenomenon is punished by voters. Please do not cite. Comments are welcome. Please see Appendix 1 for Some Directed Questions and Next Steps for this Paper. * Department of Political Science, University of California, San Diego. Supported by the NSF Graduate Research Fellowship Program. [email protected]. ** Department of Political Science, University of California, San Diego. [email protected]. Acknowledgements: We would like to thank Jeremy Horowitz and James Long for supplying much of the raw data and their comments. Also for their valuable comments, we also thank Samuel Popkin, Gary Jacobson, Langche Zeng, Sarah Knoesen, Rupal Mehta, Daniel Maliniak, Daniel Enemark, Merlin Brittenham, Stefan Berteau and Fred Zimmerman.

Welcome message from author
This document is posted to help you gain knowledge. Please leave a comment to let me know what you think about it! Share it to your friends and learn new things together.
Transcript
I
Budget Management and Accountability: Evidence from Kenyan Local Authorities
Nicole Bonoff* and Brigitte Zimmerman**
April 2010
Abstract: Using yearly budget data from Kenyan local governments from 2002-2007 and electoral data from 2007, we find evidence of electoral accountability in a decentralized system. After developing a theory of voting and politician behavior, we utilize OLS and probit analysis to demonstrate that voters reward fiscal management policies they prefer. We provide evidence that incumbents understand voter preferences and adjust their behavior if they anticipate running for re-election. Although we find evidence of elite capture in the system throughout the electoral cycle, this phenomenon is punished by voters.
Please do not cite. Comments are welcome. Please see Appendix 1 for Some Directed Questions and Next Steps for this Paper.
* Department of Political Science, University of California, San Diego. Supported by the NSF Graduate Research Fellowship Program. [email protected]. ** Department of Political Science, University of California, San Diego. [email protected]. Acknowledgements: We would like to thank Jeremy Horowitz and James Long for supplying much of the raw data and their comments. Also for their valuable comments, we also thank Samuel Popkin, Gary Jacobson, Langche Zeng, Sarah Knoesen, Rupal Mehta, Daniel Maliniak, Daniel Enemark, Merlin Brittenham, Stefan Berteau and Fred Zimmerman.
2
Introduction
Despite its critical conceptual role in promoting democracy, electoral accountability has been
challenging to empirically identify and isolate in electoral systems around the world (Ferejohn 1986; Fearon
1999; Powell 2000). The cycle from electoral mandate to government action to electoral reinstatement or
revocation forms the fundamental concept of accountability. Even with the cycle’s conceptual importance,
however, its mechanisms and the factors that bolster it remain unknown. Solutions to encourage electoral
accountability are diverse, particularly in the developing world, where democracy is still taking hold.
As a potential means of encouraging electoral accountability, fiscal decentralization has been
adopted throughout the developing world over the last decade. Some scholars claim that transferring fiscal
responsibility to local authorities allows proximity and familiarity to facilitate information exchange,
empowering local governments to be more responsive to the needs of citizens. Furthermore, citizens can
better hold their elected officials responsible for their fiscal behavior. However, these claims have been
tested only weakly, both cross-nationally and sub-nationally, with mixed empirical results. Some scholars
claim that local government is especially vulnerable to elite capture and corruption, negating any benefits of
low-cost information exchange and monitoring (Bardhan and Mookherjee 2000; Bardhan 2002).
Generally, the voting behavior of citizens at the local government level is not well understood.
Our aim with this paper is to gain empirical traction regarding government accountability in a
decentralized system. With five years of yearly data from the Kenyan Local Authorities along with electoral
results from the 2002 and 2007 civic elections, we find evidence of electoral accountability. Although
politicians manipulate government expenditures to extract non-public goods and tax policies that favor the
elite, we show that voters punish this type of fiscal manipulation according to their preferences regarding
government fiscal management. We demonstrate that incumbents understand voter preferences and
adjust their behavior throughout the electoral cycle accordingly if they plan on running for re-election. As
there is evidence of elite capture and manipulation of the local government budgets but also evidence of

3
voter knowledge and punishment of these behaviors, it is unclear if the outcome of this trend will result in
greater fiscal accountability in future elections or more refined strategic behavior by elected officials.
Literature Review
Fiscal Decentralization
As fiscal decentralization’s promise of market efficiency and competition between local
governments (Weingast et al. 1995; Tiebout 1956; Brennan and Buchanan 1980) has begun to receive
criticism for its infeasibility in developing countries (Rodden and Rose-Ackerman 1997), the policy has been
re-theorized in terms of government accountability. These theories generally claim that with smaller
administrative units, politicians can better discern the preferences of their constituents. Tommasi and
Weinschelbaum (1999) argue that when politicians are relatively closer to the citizens they represent (as in
the comparison between centralized and decentralized systems), they have greater information about
citizen preferences available when making policy decisions. This implies that decentralized systems have
the ability to be more responsive to constituent needs.
Citizens in decentralized systems also have more information to hold politicians accountable for
their actions and are better able to coordinate in smaller numbers, creating stronger electoral incentives
and connections (Bardhan 2002). Greater information for citizens comes from the narrow range of
responsibilities allocated to decentralized politicians, making their actions more obvious and distinguishable
(Persson and Tabellini 2000). Similarly, by giving local politicians control over local finances, they are not
forced into the legislative environment of minimum winning coalitions of centralized systems that produce
suboptimal outcomes for each individual district (Besley and Coate 2000).
In addition to the theorized positive benefits of electoral and fiscal accountability, decentralization
has been proposed as a means of reducing corruption. Fisman and Gatti (2002) find that cross-nationally,
countries with decentralized fiscal systems have lower levels of corruption. They base their findings in the
4
work of Persson and Tabellini (2000) who also claim that the narrower range of responsibilities for
decentralized politicians forces them to work harder in their jobs to achieve reelection.
However, these positive effects of decentralization in developing countries are tenuous findings; in
particular, the link between centralization and corruption appears weak. In Fisman and Gatti (2002), they
only use a national measure of corruption, which eliminates analysis of any sub-national characteristics.
Additionally, Treisman (2000) finds that countries with federal systems are more likely to have corruption
and that corruption increases with more levels of governmental authority. As coordination problems
multiply, the incentives to shirk grow, resulting in less efficient provision of public goods such as healthcare.
These problems also increase the risk of redirecting funds to semi-private goods that do not require
coordination (Treisman 2002). Shleifer and Vishny (1993) make a related point in arguing that with more
levels of government, bureaucrats will not coordinate their rent-seeking activities, leading to higher levels of
extraction and corruption.
The problems of coordination and incentives to shirk in decentralized systems have been theorized
to lead to elite capture, to which local governments are particularly susceptible. Bardhan and Mookherjee
(2000) claim that the preferences of local elites are given more weight in spending decisions, thus capturing
the public apparatus. This problem is exacerbated by the inability to redistribute across districts, given the
autonomy of local governments in developing countries (Prud’homme 1994). Bardhan (2002) hypothesizes
that the level of elite capture in local governments is the result of inequality, ethnic heterogeneity, traditional
institutions, and norms about political participation, issues that have not been empirically addressed beyond
case studies. However, Bardhan, using evidence from Indian states, claims that these negative effects of
decentralization can be mitigated with public hearings and information dissemination campaigns about
governmental competency.
Additionally, in a decentralized system, political elites can seamlessly influence the budget by
capitalizing on features of the electoral cycle. Evidence of this type of cyclical manipulation of the
5
government spending lies in the political business cycle literature. Nordhaus (1975) describes how
governing political regimes will adopt economic policies that lower inflation earlier in the electoral cycle, but
late in the electoral cycle will change to expansionary policies that reduce unemployment (and also
increase inflation) in order to garner more popular support. Moving beyond monetary policies, Plumper et
al. (2008) write that governments shift fiscal spending before elections from those projects which are more
efficient in the long-run to those that will increase popular support more immediately, calling this type of
political behavior “strategic budgeteering.” They show that this type of budget manipulation leads to clear
electoral success as well. While our project casts a more nefarious tone to this behavior in decentralized
governments due to the threat of elite capture, the intuition is the same.
Beyond corruption, the way decentralization has been practiced in the developing world has not
necessarily led to efficiency gains or greater public expenditures. As Bardhan (2000) writes, most fiscal
decentralization has occurred at the expenditure level, not the revenue level. Rather, central governments
tend to collect the majority of revenue and then disperse that money back to local governments in the form
of grants, both conditional and unconditional. Gibson and Hoffman (2007) argue that this arrangement is
detrimental to political accountability in local governments, as politicians are not reliant on citizens to fund
government operations. As a large share of the local revenue comes from transfers from the central
government, local governments are less incentivized to provide public goods.
Voting Behavior
While many of the shortcomings of decentralization appear to be the result of shirking politicians
and elite capture, the other side of the story is whether citizens observe local government actions, and if
they are able to hold politicians electorally accountable in these decentralized governments. Here, we
discuss the performance-based voting literature, in addition to the African voting literature, that alludes to
the promise of decentralized accountability.

6
There is substantial evidence that voters care about and may assess local government
performance when making their vote choices. The original conception of this type of performance is
described by Fenno (1978), who claims that American congressmen spend much of their time providing for
the needs of their constituents through a combination of rhetoric, style, and government expenditures,
fueled by the strong drive for re-election (Mayhew 1974). Much of this American research utilizes the
surveys of the National Election Studies, which find that citizens are well aware of the expenditures within
their districts, and that the most well-informed citizens claim that this information influences their
congressional vote choice. Bickers and Stein find that marginal incumbents in the United States are
awarded electorally if they bring pork legislation back to their districts (2009; 1994). Similarly, Lazarus and
Reilly (2009) find that different types of political pork advance Democrat and Republican congressional
incumbents electorally. Additionally, a comparative lack of pork can induce higher-quality challengers to
enter the race for election in these congressional districts, presumably due to the recognition that pork
advantages the incumbent (Bickers and Stein 1996). Lastly, Bickers and Stein argue that changes in local
public finances are not lost on voters, who are able to use informational heuristics, such as changes in
expected utility, to assess performance (1998).
In contrast to this body of literature, the literature on African voting behavior claims that vote choice
is driven by ethnic considerations, where voters support co-ethnics in order to avoid being governed by
non-co-ethnics or to receive personal satisfaction for affirming group solidarity (Horowitz 1985). This view
becomes more nuanced as ethnic groups are seen as targets for clientelism by politicians, who transform
public goods into semi-private goods to increase electoral support (Bates 1974; Wantchekon 2003;
Kitschelt and Wilkinson 2007).
Though ethnic voting may be economically rational, this view of voting behavior stands in contrast
with more performance-based evaluations. Much of the economic voting literature comes out of American
politics: Downs (1957) claims that vote choice is determined by prospectively looking at how the competing
7
parties compare in their policy platforms; alternatively, Fiorina (1981) finds that when the economy has
been booming, incumbents are re-elected, indicating that retrospective assessments are significant in
determining voter behavior. Some studies utilizing these economic voting models have been applied to
African politics recently. Using Afrobarometer data, Youde (2005) argues that Ghanaian voters use
prospective comparisons of experienced and potential government support when voting. Similarly,
Lindberg and Morrison (2008) find evidence of performance-based voting in Ghana. Within Kenya, Bratton
and Kimenyi (2008) and Horowitz and Long (2008) use polling and exit-polling data to demonstrate
economic voting. However, most of these papers consider politics only on the national level, where
performance assessments are about macroeconomic factors such as growth and unemployment. It is not
clear if these same performance theories hold at the district level when local government is responsible for
public goods expenditures, as is the case in decentralized systems. Given the importance of public
expenditures such as health, education, and infrastructure in improving the livelihoods of people in
developing countries, it seems reasonable that voters would assess the quality and quantity of
governmental expenditures when determining governmental performance.
In fact, anecdotal survey evidence in Africa points to citizens caring deeply about public
expenditures such as health and infrastructure. The Afrobarometer survey finds that over time in a sample
of ten African countries, 42% of respondents listed “Social Issues and Services” (i.e. health, education,
water, transportation) as the most important development problem (Bratton et al. 2005, pg. 99).
Additionally, 65% of respondents think that it is the responsibility of the government to provide schools and
health clinics (Bratton et al. 2005, pg. 109). Beyond the responsibility of the government to provide public
services, Africans also care deeply about corruption in their governments. This dislike of corruption is so
strong that the perception of corruption in the state is the most important predictor of satisfaction with
democracy (Bratton et al. 2005, pg. 278).
8
It is not a large leap to think that African voters assess local governments by their delivery of goods
and overall fiscal management, especially when local government is clearly responsible. Additionally, for
decentralization to be a functioning mechanism to ensure government accountability government
competence, these are exactly the types of issues citizens need to be evaluating. It is in this void in the
literature that we hope to make our contribution: despite documented concern over public expenditures and
the use of government funds for non-public goods, do African citizens actually use their evaluations of fiscal
performance when voting on the elected positions that most directly control them? Are candidates aware of
these evaluations and do they adjust their behavior when working towards re-election? And if not, what
does that mean for accountability in decentralized systems?
Theory of Accountability in Decentralized Systems
Voting Behavior
We begin with the premise that the ability to punish politicians for their actions depends on the
transparency of those actions to constituents. This visibility might be in the form of published reports or
more simple heuristics like changes in expected utility (Bickers and Stein 1998) that voters equate with
shifts in public expenditures and revenue.
Taking visibility as given, we assert that fiscal management is the key voting dimension in these
small governments for several reasons. First, the responsibilities of these governments are quite narrow,
limited generally to the role of budget managers. Second, given the smaller district magnitude of local
governments relative to national constituencies and assuming a spatial distribution of ethnic groups, local
governments’ constituencies are more likely to be ethnically homogenous, which limits the ability of voters
to utilize ethnic cues in the local elections. Third, as stated above, there is a great amount of survey
evidence, specifically from Africa, that details the importance voters place on responsible government
expenditures and revenue and the belief that it is the duty of the government to provide public goods and

9
services. Given these considerations, the management of the local budget appears to be a natural voting
criterion in decentralized settings. Although we do not formally assume the voting analysis is
unidimensional, we do assert it is the primary criteria and should outweigh any others.
Following this, we theorize that voters will punish poor performance on fiscal management in
decentralized systems. Given that we are talking about a developing country setting, we assume that
“poor performance” means low levels of public expenditures, high expenditures on non-service related
items and low levels of taxes on the wealthy that would redistribute income. We base these assertions on
the research regarding citizen preferences in Africa over the redistribution of public versus private goods,
as well as their general preference for equality (Bratton et al 2005). We will assume this compilation of
voter preferences over fiscal performance measures throughout the rest of our analysis.
If voters do not punish poor management, we can conclude that either the fiscal management
actions of politicians are not visible to voters or that another dimension is superseding the fiscal
management dimension when determining the vote.
Considering evidence that voters only utilize the most current information when creating heuristics
for voting (Popkin 1991) and might be short-sighted (Bartels 2005), we expect that poor management
immediately prior to an election will be punished most severely by voters than will analogous fiscal
management decisions farther back in history. That is to say, politicians that inflate semi-private and club
spending, depress public works projects, and fail to raise taxes the year before an election will suffer
electorally.
Politician Behavior
Based on our theory of voter behavior in decentralized systems and building on the literature that
appears above, we extrapolate a set of rules which governs politician behavior. Given terms spanning
multiple years, local politicians have the ability to be strategic about their actions. We assume throughout
10
this paper that politicians hold re-election as the foremost goal, an assumption based on Mayhew’s (1974)
work on the motivations of politicians. Assuming that politicians will attempt to use influence over fiscal
decisions for their own electoral benefit, we would expect that local politicians would engage in self-serving
behavior that is unpopular with voters when their actions are least visible, and the most accountable,
accepted behavior when they are under the most scrutiny. We extend this reasoning to assert that, given
the ebb-and-flow nature of public interest in an electoral cycle and our assumption about the importance of
visibility, politicians will engage in unpopular actions in the early and middle years of the term, and take
actions that appear accountable immediately before the election. This means that, for example, spending
on public works projects might be inflated just before the election. Alternatively, spending on semi-private
or club goods like office equipment, government vehicles and salaries might be suppressed before the
election to avoid the appearance of elite capture and personal gain.
A similar pattern will exist for local revenue collection. Aligning with our theory that voters prefer
redistributive, equality-promoting taxes on the wealthy, we would expect higher taxes on the wealthy right
before the election and tax breaks right after an election. Borrowing from the term “strategic budgeteering”
utilized by Plumper et al. (2008), we will call fiscal management that fits the pattern of high redistribution
prior to elections and low otherwise along with higher spending on semi-private goods in non-election years
“strategic” from the perspective of politicians; the opposite we will term “non-strategic.”
Overall, the type of strategic fiscal management we have described fits into a conception of elite
capture that is related to political patronage. Politicians need to please political elites by providing low
taxes and increased spending in the form of government salaries and office perks; but in order to be re-
elected by the general people, they need to make a show of good faith that they care about public services
and fighting corruption.
Lastly, just as voters will respond to the type of fiscal management used by politicians, our theory
predicts that politicians should make their decision to run for re-election based on the same actions. This

11
effect should appear earlier in the electoral cycle, given that politicians have to declare their intentions to
run earlier than the last fiscal year before the election. If politicians believe that voters are responding to
their actions to a certain degree, politicians that have managed the budget in a way that is favorable to
voters are more likely to run for re-election than are politicians who do otherwise (Cox 2001). Perhaps the
direction of causality is reversed and certain politicians anticipate running for re-election and adjust their
behavior accordingly. We are agnostic as to whether the middle years are weighted more toward public
spending that benefits the voters en masse or redistribution and patronage that benefits political elites, but
we assert that the middle years predict incumbent entry.
We have described a series of hypotheses about the relationship between politician behavior
regarding fiscal management and incumbent entry into the race for re-election, and the subsequent voting
response of constituents. We believe that this accurately represents the political environment of
decentralized local governments in developing countries: politicians are attempting both to maximize their
own personal gain and increase their re-election chances and average citizens are trying to hold officials
accountable for producing necessary public goods, minimizing corruption and promoting equality.
This environment should be especially accurate when the formalization of decentralized
governments is relatively new, with only a few elections in its history; if this game has been played over
many elections, one would expect few politicians to be playing sub-optimal strategies that hurt their
electoral chances, limiting any variability in the data. Thus, our theory of fiscal accountability is best tested
in environments that have experienced few elections, to ensure a variance in political strategies.
Local Government in Kenya
This study focuses on a sub-national analysis of Kenyan Local Authorities (LAs). Currently, there
are 175 LAs that are divided into four different types: county councils, municipal councils, town councils,
and city councils. Generally, county councils are rural and the other types of LAs are urban. Though they

12
differ in name, each LA has the same responsibilities regarding the management of public expenditures
and the collection of local revenues. Additionally, all LAs have a similar electoral structure: each is divided
into electoral wards primarily used for parliamentary elections; each ward is placed into the boundary of an
LA and elects a single councillor to that LA’s management board for a five-year term. These elections
occur concurrently with the national general elections, and are partisan and first-past-the-post (FPTP). In
addition to these elected officials, other leaders such as mayors and town clerks sit on the councils. Lastly,
by law, one-third of the councillors are appointed by Ministry of Local Government (MLG), with nominations
coming from political parties; however, in practice, the share of non-elected councillors in a given LA varies
from 14.3% to 95.4%.
Though local governments were not specifically addressed in 1997 Constitutional revisions, in
1998, LAs in Kenya were greatly empowered through the Local Government (Amendment) Act. This Act
clearly defined the revenue and expenditure powers of the LAs, and the Local Authorities Transfers (LATF)
Act, which provided for block grants from the central government for the LAs to use for local expenditures
at their discretion. The LATF, along with the Roads Maintenance Levy Fund (RMLF), provide the majority
of revenue for the LAs, though LAs also have the right to collect local revenues in the form of property
taxes, market fees and the sale of business licenses. The LATF is formulaic, based on 60% general
population, 34.75% relative urban population, with the remainder being performance based. The RMLF
earmarked funds for roads is not distributed according to any published formula. Average LATF and RMLF
transfers from the central government to LAs over the 2002-2007 electoral cycle appear in Figure 1.
There are requirements both for transparency and performance made by the MLG on the LAs. In
2001 the MLG introduced the Local Authority Service Delivery Action Plan (LASDAP) to help LAs better
identify and provide for community needs. This is supposed to be a participatory process in which citizens
have the opportunity to voice their concerns, in which each LA produces an individually tailored yearly
report on fiscal strategies and goals. To supplement its criteria of community involvement, the MLG
13
modernize and reform the LAs wi
encourages transparency by requiring that 60% of the LATF be distributed after submitting paperwork and
budgets to the MLF and emphasizes performance by distributing the remaining 40% of the LATF based on
performance metrics of the LASDAP, such as producing a revenue enhancement strategy. Additionally, if
any reports are late, LAs incur penalties: 15% loss of LATF for documents up to 30 days late, 40% loss for
31-60 days late, and complete loss of LATF for those materials more than 60 days late. A final attempt to
ensure fiscal accountability comes in the form of transparency to citizens: the amounts each LA received
from the central government are publicized each year in the national newspapers, and starting in 2007, LAs
are required to hold a LA Budget Day in June at which they discuss revenues and expenditures of the
previous years’ and the planned budget for the new fiscal year in a public forum. This is similar to the types
of information campaigns that Bardhan (2002) thinks might remedy the problems of elite capture.
Despite all these attempts at transparency, the Kenyan LAs have not been without criticism. In the
annual reports of the LATF, which provide much of the data for this study, the LAs are noted for incurring
penalties, over-spending, abandoning half-completed projects, lack of staff, and inability to accurately
estimate revenues.1 In 2004, members of Parliament publically claimed that LA councillors and other staff
member colluded to steal public funds.2 In 2009, the MLG Minister Musalia Mudavadi was noted as saying
that only 40 out of the 175 LAs were financially stable.3
Outside of the government, the LAs have developed a reputation as being corrupt and ineffectual.
Smoke claims that the LAs have been over-centralized in the past, leading to problems of mismanagement
and corruption from the central government (Smoke 2004). Numerous stories of scandal and corruption
have also been reported in the press over the past decade, further enhancing the negative image of local
authorities. Accordingly, in 2010, the Local Government (Amendment) Act was passed, seeking to
th more citizen participation.
1 LATF Annual Reports (2002-2007) 2 http://www.marsgroupkenya.org/multimedia/?StoryID=79378&p=State+Law+Office&page=210 (April 10, 2010) 3 http://allafrica.com/stories/200909300925.html (April 10, 2010)
14
The Kenyan LAs are the ideal environment to test hypotheses about government accountability in
decentralized systems. First, they are newly formed, which implies that the elected officials are still
learning about and responding to the needs of voters, which in turn implies there is variance across political
strategies. Second, Kenya has made attempts to make local government transparent and accountable,
which means the voters have been primed to think about the issue of accountability and the results of this
priming can be studied. Third the Kenyan LAs have very small population: The average population is
approximately 78,000 and the median population is 40,500. This implies that the commonly identified
dimension of voting in Africa – ethnicity – is likely not a voting cue in Kenyan LAs. Finally, the party system
completely reorganized between the 2002 and the 2007 elections, which implies that party ID might not be
as strong of a cue compared to its role in other countries. The Kenyan LAs provide a new decentralized
environment in which government competence has been primed in the minds of voters and other voting
cues are relatively secondary. If voters do not hold government accountable in Kenyan LAs, we assert
there are few environments where they will.
Hypotheses
Based on our theory of accountability and the specific environment of the Kenyan LAs, we have
derived testable hypotheses for this paper. One set of complementary hypotheses relates to the fiscal
management decisions of politicians:
H1a: Assuming strategic fiscal management, spending on public goods is inflated the year before an election. H1b: Assuming strategic fiscal management, spending on semi-private or club goods is depressed the year before an election. H1c: Assuming strategic fiscal management, taxes will be highest the year before the election and lowest the year after the election.
A stand-alone hypothesis relates to our theory of incumbent entry into the re-election race:
H2: Fiscal performance in the middle of the electoral cycle will influence politicians’ decisions to run for re-election.

15
Finally, a third set of complementary hypotheses relates to voter reactions to politician behavior and our
theory of time. If we fail to disprove these hypotheses in our analysis, Kenyan voters are holding Kenyan
councillors accountable:
H3a: Voters reward high levels of spending on public goods and services the year before the election. H3b: Voters reward low levels of spending on semi-private or club goods the year before the election.4 H3c: Voters reward high taxation the year before the election.
Data
Fiscal Data
The fiscal data for this paper come from two primary sources: annual LATF reports from 2002-2007
and the civic election results from 2002 and 2007.5 The annual reports, produced by the MLG, provide an
overview of and commentary on the LAs for the past year, in addition to the previous fiscal year’s (July 1 to
June 30) planned and actual revenue and expenditures and the upcoming fiscal year’s planned budget.
The report for each LA breaks out different subcategories of revenue (central government transfers and
local taxes and fees) and expenditures (recurrent, civic (personnel), and capital) from the totals.
Additionally, capital expenditures, where public and non-public capital projects reside, are itemized and
described. The five most costly expenditures by share of the capital expenditure budget are coded with
one of sixteen codes that correspond to the type of expense. These codes are: administration-related
projects, council premises and constructions, electricity projects, health projects, housing projects, markets,
equipment, vehicles, roads, education, sanitation and solid waste, slaughter slabs, sports and cultural
water and sewerage, and other projects.projects, bus parks and transport,
6 We collapsed administration-
4 Although semi-private goods may be purchased off the record, this would bias against us finding results. 5 There were many mathematical errors in the LATF reports. Any sub-totals, totals or ratios that were calculated incorrectly based on the data provided were re-calculated using the stated formulas. 6 In order to ensure consistency across the different LAs, which each produce their budgets independently, we went through every line-item of capital expenditures. This was to check for clerical errors, where the wrong code was obviously used, and unify certain expenditures that were borderline cases (such as road graders as either equipment or vehicles) across the LAs.
16
related projects, council premises and construction, equipment, and vehicles into a category we call “semi-
private” or “club” goods. With the exception of “other”, we collapsed the remaining codes into a category
we call “public services.” In addition to providing a fiscal year budget, each LA also produces a projected
budget for the next fiscal year that follows the same specifications as the actual budget.7
Quite a few general trends can be seen in budgets of local governments. In aggregate, the overall
surplus or deficit run by all the LAs varies year to year with no discernable pattern (see Figure 2). This is
not surprising given the likelihood of unexpected expenditures and fluctuations in revenue in a developing
country. Additionally, there appears to be a pattern of planned capital expenditures being much larger than
implemented ones (see Figure 3). This holds true for both expenditures we classify as public and those as
semi-private. As there are not surpluses every year in the data set, we can assume that either LA money is
being diverted to other spending needs such as salaries or payment of debts, or revenue expectations
continually fall short actual amounts collected. These patterns of expenditure are important to bear in mind
as we consider the fluctuations of expenditures with the electoral cycle in our fiscal management analysis.
Electoral Data
The electoral data, produced by the Electoral Commission of Kenya, comes from the December
27, 2002 and December 27, 2007 elections.8 In the 2002 data, the winner of each single-member civic
race is listed along with the candidate’s party, ward name, national constituency and LA. The 2007 data
has this information for every candidate running in each race along with vote totals and share, the number
When it was unclear what a project was from the description, the original code was used. As categories were later collapsed into larger categories, such as public projects, we do not feel that these recoding rules affected the analysis. 7 Some might be concerned about the accuracy of the LATF reports. However, considering the MLG reports on the failing aspects of the LAs, and that the LAs consistently and transparently describe semi-private and club expenditures on cars, computers, and trips, we feel confident that these reports are accurate and assume so throughout our analysis. 8 One might be concerned the any evidence from the 2007 elections would be suspect and inconclusive given evidence of fraud at the national level (Gibson and Long 2009). However, as the results of the civic elections and the parliamentary elections publically released in a timely manner unlike the presidential results and were unchallenged by electoral observers, is seems less likely that the civic elections were systematically tainted by fraud.
17
of registered voters and turnout statistics. By matching names in wards and LAs, we were able to identify
those candidates running in 2007 as incumbents. There were 2101 elected civic councillors in 2002
between all 175 LAs and there were 2360 elected civic councillors in 2007.9 In each 2007 race, between
two and twenty candidates entered. In 1222 of the 2007 races (51.8%), an incumbent entered. However,
only 47.5% ran on the ticket of a major party label (see Figure 4).10 Of those races with an incumbent, the
incumbent won in 422 wards; another 353 of the incumbents came in second (see Table 1 and Figure 5).
The variation in incumbent party and incumbent placement allows us to isolate the effect of fiscal
management in determining incumbent entry decisions and subsequent success in the election.
Lastly, turnout at the ward level averaged 70.31% with a standard deviation of 13.4%. Presumably
the high competitiveness of the presidential election, which took place on the same day, drove up turnout
levels.
Variable Measures
Fiscal Variables of Interest
We operationalize public and semi-private goods provision in three ways, based on different ideas
about what information voters use when they evaluate government provision: in the first model, voters
compare public and semi-private goods provision to how much money the LA received from the central
government (a publically available and well-publicized statistic); in the second, voters compare public and
semi-private goods provision to what was promised them in the budget; and in the third model, voters make
relative comparisons between different types of capital expenditures. Public and semi-private goods are
es as delineated in the previous section. Only the top five line-item categorized using the project cod 9 The results for the Nyambene County Council (LA Code = 631) were not included in the official results from the Electoral Commission. 10 We consider a party nationally prominent if it was identified with one of the top three presidential candidates in 2007. Incumbent Mwai Kibaki ran on the Party of National Unity; however, in 2002, he ran on the National Rainbow Coalition, which later split in two. Raila Odinga ran on the Orange Democratic Movement tickets, which then split and put up its own candidate, Kalonzo Musyoka.
18
expenditures for each local authority are catalogues as public or semi-private, which aligns with our
hypotheses about the importance of the visibility of fiscal management in affecting voting decisions. Lastly,
we specifically measure direct transfers of wealth to politicians in the form of salaries.
Similarly, we operationalize revenue three ways; the first compares the tax burden to total revenue
levels; the second addresses differences between planned and implemented tax collection; and the last
compares the tax burden to expenditures. It is important to note that the tax burden in Kenyan LAs falls
disproportionately on the land- or business-owning rich. We assume throughout this analysis that
supporting taxes is the equivalent of supporting redistribution, and that our revenue variables are inversely
correlated with elite capture.
Finally, we operationalize general government competence by considering the penalties incurred
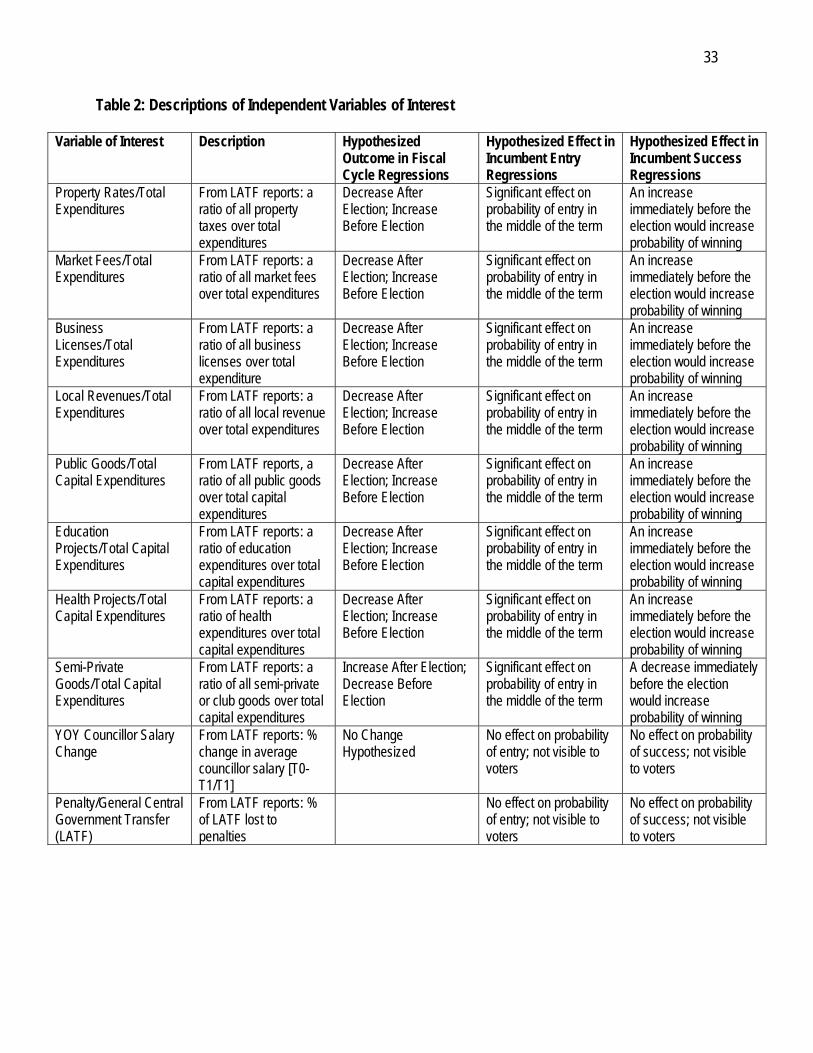
by each LA for submitting documents late to the MLG. See Table 2 for a full list and descriptions of our
variables of interest, as well as their hypothesized effect or change in our regressions.11
Relevant Covariates
In addition to these variables of interests, we also utilize numerous covariates, though for the sake
of space, we only report results on variables of interest.12 See Table 3 for a full list and descriptions of
these control variables, as well as a discussion regarding their intended use and a delineation of which
regressions include which controls
11 Most of the data is at the ward or LA level; there is no budget data available at the politician level. While this might conflate the actions of individual politicians and an LA as a whole, this is not an unusual occurrence: for example, US citizens vote for congressmen with an assessment of Congress as a whole (Fiorina 1981). Thus, it is natural for people to be forced to consider the actions of a council when deciding the fate of an individual member of that collective. However, to address this concern, we also control for the size of the council as it affects this issue of identifiability, or the ability to pinpoint responsibility for the action of a political bod on an individual. y12 The variables of interest, which come from the LATF reports, are calculated every year, while our control variables tend to be time-invariant.

19
Methods of Analysis
This paper employs three different sets of analysis. The first, which we will call “Fiscal Cycle,”
looks for patterns in revenue collection and spending related to the year in the electoral cycle. These
analyses utilize OLS with fixed effects at the provincial level and clustered standard errors at the LA level.
Each specific variable of interest was analyzed separately as the dependent variable with dummies for year
in the electoral cycle as the independent variables of interest. See Table 3 for a list of controls included in
these regressions.
The second type of analysis, “Incumbent Entered,” utilizes a marginal effects probit model with
fixed effects at the provincial level and clustered standard errors at the LA level. In these analyses, the
dependent variable is dichotomous for whether an incumbent enters a particular race, and the independent
variables are separate yearly measures of the variables of interest as well as the relevant controls (see
Table 3). These analyses are limited to fiscal years when incumbents were in office.
Similarly, our final mode of analysis, “Incumbent Success,” performs the same regression except,
with a binary dependent variable for whether an incumbent wins an entered election. These regressions
condition for incumbent entry.
We use and present fixed effects models for two reasons. First, there are only eight provinces, and
therefore we do not lose significant power by conducting fixed effects at the provincial level. Second, we
believe that the fixed effects models control for national or regional trends in budget management. The
national LA system has been continuously refining the requirements and goals of fiscal decentralization, so
it is important to control for macro national and regional trends, isolating the independent variable
fluctuations at the local level.

20
Results
Refinement of Operationalization of Fiscal Variables
The first set of results pertains to refining our fiscal variables of interest. We found that variables
benchmarking revenue and expenditures to total expenditures were significant across all regressions, while
operationalizations that benchmarked revenue and expenditures to either their budgeted equivalents or to
total revenue were not.13 This provides support for our assumption about the importance of visibility of
fiscal management decisions, as well as aligns with the general intuition that citizens care about ou
comparing both the goods and services they receive and the amount they are taxed to what they observe
the government providing. Finally, this implies that Kenyans do not care about broken budgetary promises
as measured by changes between planned and implemented projects. Although not fully developed, these
findings may indicate voters are more concerned about the ability of the politicians to adjust spending
according to changing needs, which appears realistic given the instability and uncertainty in developing
countries. Our results section presents our analysis using the narrowed operationalizations of our variables
of interest.
tput,
Fiscal Cycle Results
Our first set of results concerns our fiscal cycle analysis, that which examines fluctuations in fiscal
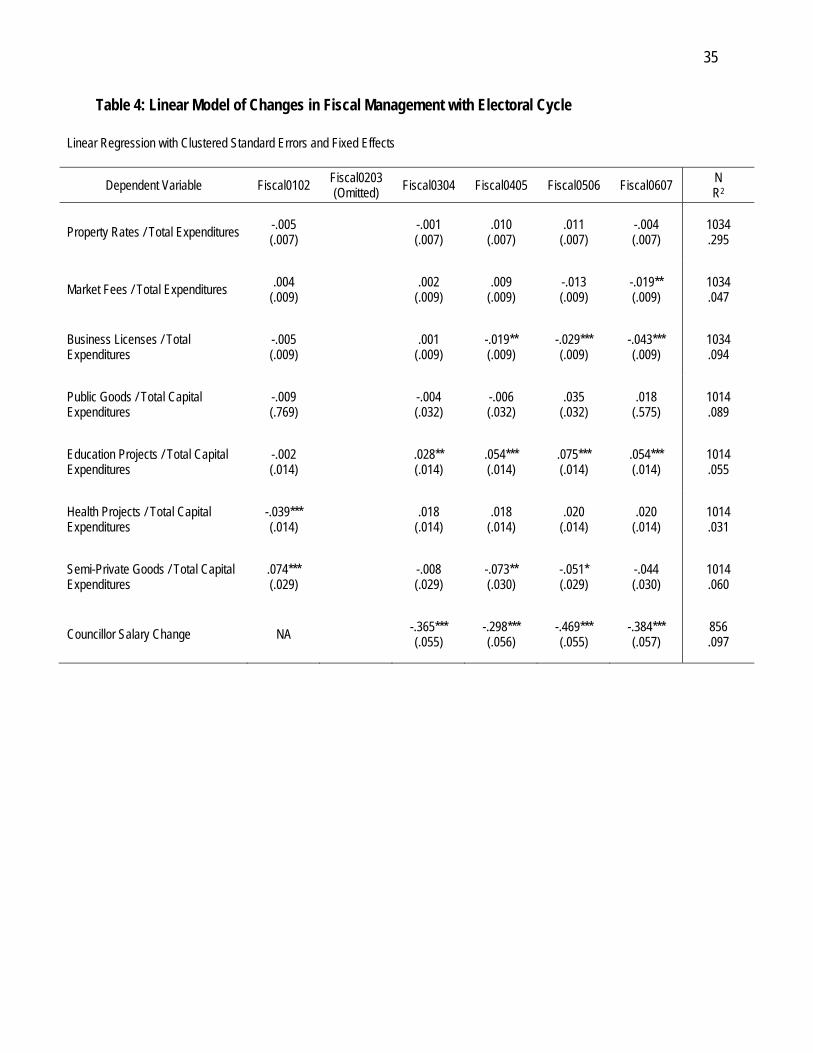
management variables over the electoral cycle. Our results do not support our hypotheses about strategic
fiscal management. The regression table appears in Table 4. To illustrate the trends we found in our
analysis more clearly, Figure 6 demonstrates the cycling of local revenues and Figure 7 demonstrates the
cycling of public and semi-private expenditures. All results are presented as marginal effects compared to
the average levels in fiscal year 2002-2003, which was the first year of the election cycle. Taxation levels
13 For the sake of brevity, the regression tables that facilitated discrimination between the three operationalizations of expenditures and revenues are not presented here. They can be provided upon request.

21
spike in the middle of the term and decrease in the two years before the election, which refutes our
hypothesis that taxes will be highest the year before the election and lowest the year after (H1c). Both
market fees and business licenses have significant declines the year before the election, and the decline of
business licenses is significant for the two years prior to the 2006-2007 fiscal year as well. This provides
evidence of elite capture and patronage immediately before the election. Since only one term’s worth of
data is analyzed, this fluctuation may also be the result of changing taxation policies across local
authorities. The possibility of a changing trend is clearly visible in the graph, although not certain. The
marginal effects on property rates (property taxes) are not significant, but the trend line associated with this
form of taxation indicates more of a clear electoral cycling effect than the others.
In contrast, expenditures fluctuate in accordance with their location in the electoral cycle: a general
trend upwards or downwards in these categories can be ruled out. However, we still find no evidence to
support our hypotheses regarding strategic fiscal management. We find that public expenditures decrease
the year before the election, whereas semi-private expenditures increase, violating H1a and H1b,
respectively.
To conclude this results section, we find evidence that the very things hypothesized to disappoint
voters - taxation that emphasizes inequality and expenditures that provide semi-private goods - are
increased the year before the election when they are visible and most salient in voters’ minds. It is unclear,
based on this one term’s analysis, whether this is because politicians are not generally behaving optimally
or whether they are unaware of how to behave strategically to maximize votes. The discussion and
conclusion sections elaborate on this distinction.
Incumbent Entry Results
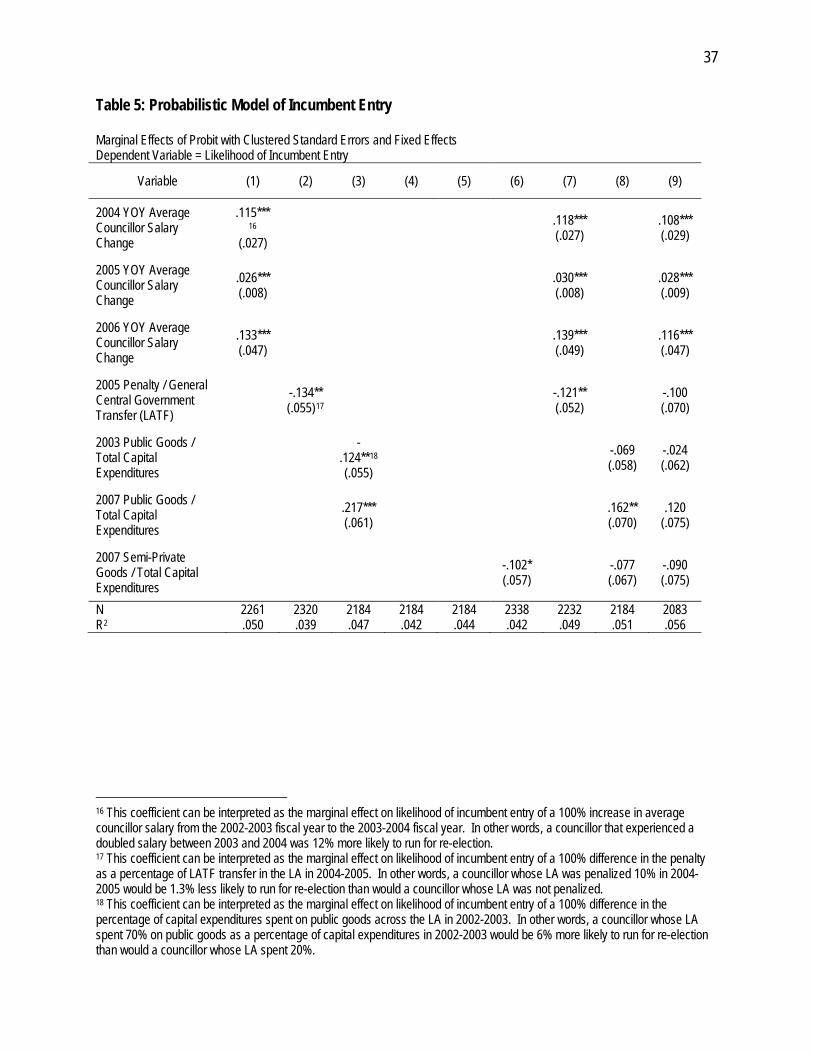
Our third results section relates to our analysis of incumbent entry. We find evidence to support
our hypothesis regarding incumbent entry in the re-election race. After considering multiple years of data

22
across the fiscal management variables of interest, the results on the years of data that are theoretically
relevant and empirically significant are presented in Table 5. Three details within our results are striking.
First, there is indeed a correlation between incumbent entry in the re-election race and the significance of
performance indicators in the middle of the term. This supports hypothesis H2, although it is once again
important to note that the direction of causality is unclear based on our analysis. It is possible that
incumbents anticipate running for re-election and take certain fiscal management actions throughout their
term. It is also possible that certain fiscal management decisions in the LA encourage or discourage
incumbents from seeking re-election. Cox (2002) supports the latter mechanism and our discussion
assumes this is the one in action. However, an elimination of the other causal explanation is not possible
and would be unwise without more analysis.
The second compelling result in this set of regressions is that none of the revenue-focused
independent variables were significant. Instead, incumbents seem to base their decision to run for re-
election on the portfolio of expenditures in their LA throughout their term. The negative coefficient on the
2002-2003 fiscal year level of public goods expenditures as a proportion of total capital expenditures
indicates that councillors catering to political elites early in their term, at the expense of the general
population, are more likely to run for re-election. However, this variable loses significance when included in
a regression with the variable capturing the 2006-2006 level of public goods expenditures, which has a
positive coefficient. This supports our theory that politicians that are particularly likely to run for re-election
would strategically provide public goods the year before the election. Similarly, the level of semi-private or
club goods expenditures two years before the election negatively correlates with the likelihood of incumbent
entry, which also supports our theory about strategic behavior.
Another expenditure-related variable that is significant is incurring a penalty for late report filing in
the middle of the term. As previously discussed, this is calculated as a percentage of LATF transfer from
the local government. The coefficient is negative, meaning that councillors whose LA incurred a penalty in

23
2004-2005 were less likely to run for re-election. If we take these penalties as a proxy for general
government competence separate from the revenue and expenditure variables of interest, this result
indicates that councillors take general competence issues seriously in addition to considering fiscal
accountability.
The most striking finding is that the strongest and most robust correlation with likelihood of
incumbent entry is the average year-over-year change in councillor salary. An increase in a councillor’s
salary implies a greater likelihood that he will run for re-election. Interpretation of this finding is challenging
in the absence of more analysis. It may be that the change in personal welfare enabled the councillors to
free resources to be utilized in the campaign, or that the average councillor salary change was approved in
certain LAs in line with an unobservable trait such as job dedication (in which case the salary change
variables are a proxy for this unobservable trait).
In general, the incumbent entry analysis supports our hypotheses about strategic behavior as well
as our hypotheses about the correlation between performance in the middle of the term and the decision of
the incumbent to run for re-election.
Incumbent Success Results
Our final set of results relates to our analysis of incumbent success in the election. These results
strongly support our hypotheses regarding voting behavior in a decentralized system, and therefore provide
compelling evidence of accountability in such a system. After considering multiple years of data across the
fiscal management variables of interest, the results on the years of data that are theoretically relevant and
empirically significant are presented in Table 6. Voters indeed punish poor fiscal management primarily the
year before the election, which supports our theory regarding time and its relationship to voting behavior.
We find evidence to support hypothesis H3c, which states that voters reward high taxation the year before
24
the election, as illustrated by the positive coefficients on 2006-2007 property rates levels and 2006-2007
market fees levels.
We also find evidence to support hypothesis H3b, which states that voters reward low levels of
spending on semi-public or club goods expenditures the year before the election, as illustrated by the
negative coefficient on the variable measuring 2007 semi-private expenditures. Finally, we find evidence to
support hypothesis H3a, which states that voters reward high levels of spending on public goods the year
before the election, as illustrated by the positive coefficient on the variables measuring 2005-2006 and
2006-2007 public, education and health expenditures.
Interestingly, the coefficient on the variable measuring public goods expenditures is not significant,
whereas the coefficient on the variable measuring semi-private goods expenditures is significant and
remains robustly significant throughout the different regressions. There are several explanations for this. It
may be that voters in Kenya are affected more negatively by elite capture and patronage than they are
benefitted by public goods provision. It may also be that the absence of public goods is not as provoking
for voters as is the obvious evidence of semi-private goods: again, visibility influences voting behavior.
Finally, we know from the descriptive statistics presented earlier that LAs experience less variance in the
level of public goods expenditures than they do in the level of private goods expenditures (the standard
deviations differ by 40%), which may mean the data do not allow for isolating the effect of fluctuations in
public goods expenditure levels. More analysis could develop theories about the discrepancy in variable
significance between public goods and semi-private goods provision.
An unexpected finding that doesn’t align with our current theory is the negative and significant
coefficients on 2006 revenue variables of property rates and market fees. Our theory relates to voter
reactions to revenue levels immediately before the election, but we are unable to explain at this phase why
voters would appreciate lower tax rates for market participants and property owners two years before the
election. As in the incumbent entry case, perhaps there is an unobserved phenomenon that caused an
25
increase in taxes to be well-received in the 2005-2006 fiscal year. It may be that the property owners and
market participants highly influential in their communities and are able to influence the vote choice of
others. Thus, positive income to these elites results in widespread electoral support.
Although we do not present the results in Table 6, it is interesting to note that average councillor
salary change and penalties faced by the local authority were not significant in determining incumbent
success. This could be because these types of expenditures are buried in the bureaucracy and not visible
to voters to the same degree as large capital expenditures.
Discussion
Our overarching finding is that we find evidence of accountability in the decentralized system of
Kenyan local authorities. Voters punish behavior they do not prefer when it occurs immediately before the
election. We find evidence that incumbents understand voter preferences and those particularly likely to
run for re-election engage in more favorable behaviors. We do not find evidence of strategic fiscal
management across councillors as a whole, instead finding evidence of elite capture at several unexpected
points in the electoral cycle. While there is evidence of elite capture and manipulation of the local
government budgets, as well as evidence of voter knowledge and punishment of these behaviors, it is
unclear if the outcome of this trend in the 2002-2007 term will be greater fiscal accountability in future terms
or more refined strategic behavior by elected officials. Assuming councillors continue to pursue re-election
in upcoming terms, they may update their knowledge about voters and adjust their behavior to incorporate
lessons learned in the 2007 election. Alternatively, they may find other ways to engage in elite capture and
patronage via actions unobservable to voters.
Lastly, it should be noted that this paper only covers one electoral cycle’s worth of data. Aberrant
years of significance on several variables indicate that some incumbents’ actions as well as their
subsequent success or failure in re-election is likely explained by exogenous and term-specific events. It is
26
electoral cycle are forgotten or un
possible that these events in the community elicited actions contrary to those expected by our theory of
accountability. These events and actions are too specific to be observed in our data. This could explain
the variables of significance and strong coefficients that do not entirely fit with our theory and the rest of our
results.
An intriguing example of this phenomenon is health expenditures in 2005-2006. The coefficient on
2005-2006 health expenditures as a percent of capital expenditures is robustly significant across
regressions; however, rather than deducing that voters particularly care about health expenditures two
years before the election, we hypothesize that something unobservable is happening in that year which
required health expenditures or an action highly correlated with health expenditures. More research would
be required on events and fluctuations in Kenya throughout the 2002-2007 term to begin to explain all of
the variation. Research that combines data from multiple electoral cycles will reduce the empirical effects
of some of these confounding events, as well as the need to explain them in evaluating our theory of
accountability.14
Conclusion
Overall, we find positive evidence of elite capture and corresponding constituent punishment.
However, these results only paint part of the picture. While citizens were willing to vote out incumbents
who oversaw spending increases on semi-private goods or tax cuts immediately before the elections, the
actions of politicians preceding the pre-election time period went unchallenged. This could be for a few
reasons. As previously stated, voters tend to incorporate the most recently available information when
making their vote choice (Popkin 1991). If this is true, it could be that the actions in the earlier years of the
derweighted in the decision-making process. Alternatively, the evidence
14 In the future, we plan to add more years of budget data two test between these hypotheses along with the possibility that we are seeing anomalous effects of the specific years in our study. Currently, we have the 2007-2008 Fiscal Year LA budgets to enter and expect the 2008-2009 data to be released in the coming months.
27
we find of voters making their vote choice based of the year before the election might be the result of the
introduction of the Kenyan LA Budget Day in June 2007. Under this scenario, the use of more public
forums to advertise the policies of the LAs gave voters more information, possibly priming them to think
about budgeting before the election.
As of now, we cannot isolate the effects of these two competing hypotheses. However, they
produce two very different views about accountability in decentralized governments. If the public budget
announcements do provide more information to citizens by increasing the visibility of political actions, one
would expect that in the future, politicians would have to spend relatively more on public services in all
years of the electoral cycle, less on semi-private and club goods, and keep taxation relatively constant and
high. If, however, voters really only have very short-term retrospection regarding public finance in their
communities, it seems that elite capture will not disappear despite performance-based voting. Instead, the
budgeting process will become more strategic and perfected by politicians who will engage in patronage
with elites and confer benefits to themselves in all years except the year before the election, when they will
then spend on public services.
As the LAs in Kenya are newly formalized, with only three elections taking place since 1998, one
could easily imagine that the politics in these communities is moving towards this equilibrium. Unlike the
previous criticism of the decentralized local governments, where there is either elite capture or
accountability to average citizens (or, functional or dysfunctional government), this outcome suggests that
accountability and elite capture can co-exist. Given the multi-year tenure of politicians and the potential
shortsightedness of voters, this arrangement can be repeated indefinitely. Only those politicians who
cannot adjust to this budgeting arrangement will be punished by voters.
Thus, while we do not know if elite capture will disappear, we feel confident that voters make
performance-based assessments of the leaders, which is a necessary step toward political accountability.
This speaks to the rationality of voters in Kenya, and elsewhere in Africa, and confirms that voting

28
dimensions other than ethnicity are active. Though decentralization as a policy in poor countries is clearly
open to criticism and an incomplete solution to development problems, in the case of Kenyan local
authorities, there are signs of political accountability and strong electoral connections related to fiscal
management and political job performance.

29
Figure 1: Average Central Government Transfers to Local Authorities15
Figure 2: Average Local Authority Surplus or Deficit
15 All monetary values adjusted for inflation using inflation rates reported by the Kenya National Bureau of Statistics, and benchmarked to 2001 values.

30
Figure 3: Average Local Authority Capital Expenditures, Planned vs. Implemented

31
Figure 4: Incumbents Endorsed by Major Party Labels
Table 1: Incumbent Placement in 2007 Civic Elections
Place in the ward election
Number of Incumbents
Percentage of Incumbents
1st 422 35% 2nd 353 29% 3rd 195 16% 4th 96 8% 5th 62 5% 6th 41 3% 7th 20 2% 8th 12 1% 9th 12 1%

32
Figure 5: Party Success in 2007 Civic Election
33
Table 2: Descriptions of Independent Variables of Interest
Variable of Interest Description Hypothesized Outcome in Fiscal Cycle Regressions
Hypothesized Effect in Incumbent Entry Regressions
Hypothesized Effect in Incumbent Success Regressions
Property Rates/Total Expenditures
From LATF reports: a ratio of all property taxes over total expenditures
Decrease After Election; Increase Before Election
Significant effect on probability of entry in the middle of the term
An increase immediately before the election would increase probability of winning
Market Fees/Total Expenditures
From LATF reports: a ratio of all market fees over total expenditures
Decrease After Election; Increase Before Election
Significant effect on probability of entry in the middle of the term
An increase immediately before the election would increase probability of winning
Business Licenses/Total Expenditures
From LATF reports: a ratio of all business licenses over total expenditure
Decrease After Election; Increase Before Election
Significant effect on probability of entry in the middle of the term
An increase immediately before the election would increase probability of winning
Local Revenues/Total Expenditures
From LATF reports: a ratio of all local revenue over total expenditures
Decrease After Election; Increase Before Election
Significant effect on probability of entry in the middle of the term
An increase immediately before the election would increase probability of winning
Public Goods/Total Capital Expenditures
From LATF reports, a ratio of all public goods over total capital expenditures
Decrease After Election; Increase Before Election
Significant effect on probability of entry in the middle of the term
An increase immediately before the election would increase probability of winning
Education Projects/Total Capital Expenditures
From LATF reports: a ratio of education expenditures over total capital expenditures
Decrease After Election; Increase Before Election
Significant effect on probability of entry in the middle of the term
An increase immediately before the election would increase probability of winning
Health Projects/Total Capital Expenditures
From LATF reports: a ratio of health expenditures over total capital expenditures
Decrease After Election; Increase Before Election
Significant effect on probability of entry in the middle of the term
An increase immediately before the election would increase probability of winning
Semi-Private Goods/Total Capital Expenditures
From LATF reports: a ratio of all semi-private or club goods over total capital expenditures
Increase After Election; Decrease Before Election
Significant effect on probability of entry in the middle of the term
A decrease immediately before the election would increase probability of winning
YOY Councillor Salary Change
From LATF reports: % change in average councillor salary [T0-T1/T1]
No Change Hypothesized
No effect on probability of entry; not visible to voters
No effect on probability of success; not visible to voters
Penalty/General Central Government Transfer (LATF)
From LATF reports: % of LATF lost to penalties
No effect on probability of entry; not visible to voters
No effect on probability of success; not visible to voters

34
Table 3: Descriptions of Control Variables
Control Variable Description and Purpose Used in Which Analyses LA Population From the number of registered voters in each LA in 2007 proxy
for population Fiscal Cycle
Ward Population From the number of registered voters in each ward in 2007 proxy for population
Incumbent Entered, Incumbent Success
Rural Dummy Created from LA council name (“county” in the LA name implies rural area) measure of rural or urban; proxy for development and access to information
Fiscal Cycle, Incumbent Entered, Incumbent Success
No. of Councillors in LA after 2002
From LATF reports measure of degree of identifiability of individual councillor’s actions
Fiscal Cycle, Incumbent Entered, Incumbent Success
Share of LA Controlled by NRC after 2002
From 2002 electoral data measure of concentration of political power in the LAs (using NRC as the dominant party)
Fiscal Cycle, Incumbent Entered, Incumbent Success
Share of Councillors Elected after 2002
From 2002 electoral data and LATF reports measure of electoral pressure on each LA
Fiscal Cycle, Incumbent Entered, Incumbent Success
Effective No. of Candidates in 2007
From 2007 electoral data measure of competitiveness of each ward election
Incumbent Entered, Incumbent Success
Wealth of LA From LATF reports: equal to total local revenues collected per capita per year proxy for wealth of the community
Fiscal Cycle
Wealth of LA in 2007
From LATF reports: equal to total local revenues collected per capita in 2007 proxy for wealth of the community right before the election
Incumbent Entered, Incumbent Success
Share of Revenue from Central Gov’t
From LATF reports measure of degree the local population is supporting government financially
Fiscal Cycle
Incumbent Party Dummies for 2007
From 2007 electoral data measures ODM, PNU, ODM – Kenya, NARC – Kenya, and National Rainbow Coalition party ID for an incumbent running for re-election
Incumbent Entered, Incumbent Success
35
Table 4: Linear Model of Changes in Fiscal Management with Electoral Cycle
Linear Regression with Clustered Standard Errors and Fixed Effects
Dependent Variable Fiscal0102 Fiscal0203 (Omitted) Fiscal0304 Fiscal0405 Fiscal0506 Fiscal0607 N
R2
Property Rates / Total Expenditures -.005 (.007) -.001
(.007) .010
(.007) .011
(.007) -.004 (.007)
1034 .295
Market Fees / Total Expenditures .004 (.009) .002
(.009) .009
(.009) -.013 (.009)
-.019** (.009)
1034 .047
Business Licenses / Total Expenditures
-.005 (.009) .001
(.009) -.019** (.009)
-.029*** (.009)
-.043*** (.009)
1034 .094
Public Goods / Total Capital Expenditures
-.009 (.769) -.004
(.032) -.006 (.032)
.035 (.032)
.018 (.575)
1014 .089
Education Projects / Total Capital Expenditures
-.002 (.014) .028**
(.014) .054*** (.014)
.075*** (.014)
.054*** (.014)
1014 .055
Health Projects / Total Capital Expenditures
-.039*** (.014) .018
(.014) .018
(.014) .020
(.014) .020
(.014) 1014 .031
Semi-Private Goods / Total Capital Expenditures
.074*** (.029) -.008
(.029) -.073** (.030)
-.051* (.029)
-.044 (.030)
1014 .060
Councillor Salary Change NA -.365*** (.055)
-.298*** (.056)
-.469*** (.055)
-.384*** (.057)
856 .097

36
Figure 6: Trends in Local Revenues over Councillor Term
Figure 7: Trends in Capital Expenditures over Councillor Term
37
Table 5: Probabilistic Model of Incumbent Entry
Marginal Effects of Probit with Clustered Standard Errors and Fixed Effects Dependent Variable = Likelihood of Incumbent Entry
Variable (1) (2) (3) (4) (5) (6) (7) (8) (9)
2004 YOY Average Councillor Salary Change
.115***16
(.027) .118***
(.027) .108*** (.029)
2005 YOY Average Councillor Salary Change
.026*** (.008) .030***
(.008) .028*** (.009)
2006 YOY Average Councillor Salary Change
.133*** (.047) .139***
(.049) .116*** (.047)
2005 Penalty / General Central Government Transfer (LATF)
-.134** (.055)17 -.121**
(.052) -.100 (.070)
2003 Public Goods / Total Capital Expenditures
-
.124**18 (.055)
-.069 (.058)
-.024 (.062)
2007 Public Goods / Total Capital Expenditures
.217*** (.061) .162**
(.070) .120
(.075)
2007 Semi-Private Goods / Total Capital Expenditures
-.102* (.057) -.077
(.067) -.090 (.075)
N 2261 2320 2184 2184 2184 2338 2232 2184 2083 R2 .050 .039 .047 .042 .044 .042 .049 .051 .056
16 This coefficient can be interpreted as the marginal effect on likelihood of incumbent entry of a 100% increase in average councillor salary from the 2002-2003 fiscal year to the 2003-2004 fiscal year. In other words, a councillor that experienced a doubled salary between 2003 and 2004 was 12% more likely to run for re-election. 17 This coefficient can be interpreted as the marginal effect on likelihood of incumbent entry of a 100% difference in the penalty as a percentage of LATF transfer in the LA in 2004-2005. In other words, a councillor whose LA was penalized 10% in 2004-2005 would be 1.3% less likely to run for re-election than would a councillor whose LA was not penalized. 18 This coefficient can be interpreted as the marginal effect on likelihood of incumbent entry of a 100% difference in the percentage of capital expenditures spent on public goods across the LA in 2002-2003. In other words, a councillor whose LA spent 70% on public goods as a percentage of capital expenditures in 2002-2003 would be 6% more likely to run for re-election than would a councillor whose LA spent 20%.

38
Table 6: Probabilistic Model of Incumbent Success, Conditional on Incumbent Entry
Marginal Effects of Probit with Clustered Standard Errors and Fixed Effects Dependent Variable = Likelihood of Incumbent Winning
Variable (1) (2) (3) (4) (5) (6) (7) (8) (9) (10) (11)
2006 Property Rates / Total Expenditures
-.732** (.288) -.751***
(.277) -.675** (.319)
2007 Property Rates / Total Expenditures
.548**19 (.271)
.568***
(.281) .570* (.322)
2006 Market Fees / Total Expenditures -1.12**
(.572) -1.06* (.558) -.629
(.631)
2007 Market Fees / Total Expenditures 1.07*
(.614) 1.12* (.585) .445
(.701)
2007 Business Licenses / Total Expenditures -.341
(.311) -.379 (.341) -.345
(.361)
2007 Local Revenues / Total Expenditures .000
(.097) -.016 (.103) .019
(.101)
2007 Public Goods / Total Capital Expenditures
.094 (.075) .002
(.087) .033
(.089)
2007 Education Projects / Total Capital Expenditures
.243* (.137) .103
(.150) .030
(.160)
2006 Health Projects / Total Capital Expenditures
.317** (.133) .265**
(.130) .307** (.149)
2007 Semi-Private Goods / Total Capital Expenditures
-
.186***20
(.065) -.149**
(.075) -.103 (.075)
N 1209 1209 1209 1209 1209 1209 1204 1209 1209 1204 1204 R2 .184 .185 .182 .182 .183 .184 .185 .184 .188 .188 .192 * = 10%, ** = 5%, *** = 1 % Significance
errors in parentheses) (standard 19 This coefficient can be interpreted as the marginal effect on likelihood of incumbent success of a 100% difference in the ratio of property rates to total expenditures in 2006-2007. In other words, a councillor whose LA experienced a ratio of property rates to total expenditures of 0.4 in 2006-2007 was 11% more likely to win than a councillor whose LA experienced a ratio of property rates to total expenditures of 0.2 in 2006-2007. For clarity, this particular change would imply the first councillor’s LA levied double the property rates as the second councillor’s LA. 20 This coefficient can be interpreted as the marginal effect on likelihood of incumbent success of a 100% difference in the percentage of capital expenditures spent on semi-private goods across the LA in 2006-2007. In other words, a councillor whose LA spent 20% on semi-private goods as a percentage of capital expenditures in 2006-2007 would be 9% more likely to win re-election than would a councillor whose LA spent 70%.

39
Appendix 1: Next Steps and Questions for WGAPE Audience
1) Statistical Methods of Analysis: a. Two-Way Clustering: We are considering doing two-way clustering since we have several
non-nested levels of data. We would appreciate talking with someone more about this method.
b. Interaction Effects: We have noticed some unexpected results in some regressions. Specifically, certain variables gain significance randomly. The trend of our results is unchanged and we believe the trend is robust. However, we suspect there are some interaction effects. We plan on dissecting this possibility further in future iterations of analysis. We are considering using MANOVA to do this, and would appreciate talking with someone more about this method.
c. Identifiability: In a future iteration of analysis, we plan on interacting the number of councillors elected in each district with our independent variables of interest. This would hopefully allow us to control for attribution, assuming that it would be harder to attribute fluctuations in fiscal management to a specific councillor in LAs with more councillors
2) Background on Kenya: Please let us know if you can contribute information to any of the following considerations.
a. History in 2001-2010: Based on some general trends in our data, we suspect that there are some unknown or unobservable trends that both affect our independent variables of interest (the revenue and/or expenditure data) at certain times and are not controlled for in our relevant covariates. We are particularly interested in events that would influence levels of government spending on health and education.
b. Party System: We are uncertain how involved the parties are in influencing and potentially funding incumbent councillors to run for re-election. We are implicitly assuming that the decision is mostly made at the local level by the councillors themselves, based on the actions of their term. This may be an incorrect assumption.
c. Ballot System in 2007: We are still researching the ballot system in the 2007 elections. A separate ballot for the local elections would limit the possibility of contamination from the national election.
d. Redistricting: Some of the wards were redistricted, some new wards were created and some of the wards were renamed between 2002 and 2007, making it impossible to discern if an incumbent had the opportunity to run and didn’t or if there was no incumbent in the ward area. In future analysis, we would like to refine our model of incumbent entry as well as also run regressions in which the unit of analysis is the LA rather than the individual candidate, and the dependent variable is the selection rate of incumbents across the LA.
e. ELF: We would like to control for differing levels of ethno-linguistic fractionalization in Kenya. We have reason to believe that the LAs are mostly ethnically homogenous, given their small population size. We would appreciate data that would help us definitively discern this.
f. Gender Control: We would like to control for the gender of incumbents in future analysis, since our overview of the data indicates that being a female incumbent results in a close to zero probability of success in the election, regardless of their fiscal management policies. However, we lack a catalog of the gender of Kenyan names.
g. Wealth or Literacy/Media Control: We would appreciate better measures than our proxies for wealth and access to information. If you have or know of this type of data at the LA or constituency level in Kenya, we would appreciate using it.
Related Documents