Key Messages: BUDGET BRIEF 2017: WASH Photo: ©UNICEF/Mozambique 1 Please note: UNICEF does not have access to e-SISTAFE (Mozambique’s integrated financial management information system); therefore, all analysis was carried out with publicly available information. The viewpoints expressed in the brief are those of the author and do not necessarily represent those of UNICEF. • In 2017, the wider Water, Sanitation, and Hygiene (WASH) Sector, including Water Resource Management, was allocated MT 10.5 billion (US$ 148.5 million), representing 3.9 percent of the State Budget. Relative to 2016 expenditure, the 2017 initial budget allocation represents a 29 percent increase, in nominal terms, and a 17 percent increase, in real terms. • Access to clean water has improved over the past decade and half, albeit, rather slowly. According to most recent data, approximately half of the population receives its water from an improved clean water source, representing an increase of 10 percentage points since 2000. Notwithstanding, this is significantly below the average of the country’s sub-Sahara African peers and is not catching up. Access rates in Mozambique are held back by low access rates in rural areas and small towns. • Access to sanitation facilities have shown little improvement. Only 20% of the population benefits from access to proper sanitation, which places Mozambique well behind its African peers. Again, the low sanitation access rates are underpinned by poor sanitation in rural areas. • External financing is responsible for 93 percent of the 2017 WASH budget. This is much higher than the 80 percent average share of external financing over the past seven years. 2017 is higher than previous years due to significant government allocations to and borrowing for the construction of the Greater Moamba Dam and rehabilitation of the Massingir Dam, respectively. • Among WASH Sector institutions, ARA South received the most financing in the 2017 WASH budget, equal to 40 percent of total resources dedicated to the sector. ARA South also registered the largest percentage increase in allocation among WASH institutions. Again, this is due to the construction and rehabilitation of the Greater Moamba and Massingir Dams falling within the jurisdiction of ARA South. • Spending in the WASH Sector is poorly targeted. The urban-dwelling, wealthiest segment of the population benefits considerably more from water and sanitation expenditure relative to the rural-dwelling, poorer segment. The result is that the urban rich report increasingly greater access and use of improved water and sanitation services compared to the rural poor. • Tracking the financing of WASH Sector is a difficult task as MOPHRH’s budget and expenditure totals for water, sanitation, and hygiene line items are not easily filtered from the infrastructure, public works, and housing activities for which it is also responsible. In order to improve such tracking, it is important to strengthen accounting under the functional classification of WASH activities and implement a programmatic classification aligned with the WASH-related objectives, programs, and sub-programs of the government’s five year plan (PQG). MOZAMBIQUE

Welcome message from author
This document is posted to help you gain knowledge. Please leave a comment to let me know what you think about it! Share it to your friends and learn new things together.
Transcript

Key Messages:
BUDGET BRIEF 2017: WASH
Photo: ©UNICEF/Mozambique
1
Please note: UNICEF does not have access to e-SISTAFE (Mozambique’s integrated financial management information system); therefore, all analysis was carried out with publicly available information. The viewpoints expressed in the brief are those of the author and do not necessarily represent those of UNICEF.
• In 2017, the wider Water, Sanitation, and Hygiene (WASH) Sector, including Water Resource Management, was allocated MT 10.5 billion (US$ 148.5 million), representing 3.9 percent of the State Budget. Relative to 2016 expenditure, the 2017 initial budget allocation represents a 29 percent increase, in nominal terms, and a 17 percent increase, in real terms.
•Access to clean water has improved over the past decade and half, albeit, rather slowly. According to most recent data, approximately half of the population receives its water from an improved clean water source, representing an increase of 10 percentage points since 2000. Notwithstanding, this is significantly below the average of the country’s sub-Sahara African peers and is not catching up. Access rates in Mozambique are held back by low access rates in rural areas and small towns.
• Access to sanitation facilities have shown little improvement. Only 20% of the population benefits from access to proper sanitation, which places Mozambique well behind its African peers. Again, the low sanitation access rates are underpinned by poor sanitation in rural areas.
• External financing is responsible for 93 percent of the 2017 WASH budget. This is much higher than the 80 percent average share of external financing over the past seven years. 2017 is higher than previous years due to significant government allocations to and borrowing for the construction of the Greater Moamba Dam and rehabilitation of the Massingir Dam, respectively.
• Among WASH Sector institutions, ARA South received the most financing in the 2017 WASH budget, equal to 40 percent of total resources dedicated to the sector. ARA South also registered the largest percentage increase in allocation among WASH institutions. Again, this is due to the construction and rehabilitation of the Greater Moamba and Massingir Dams falling within the jurisdiction of ARA South.
• Spending in the WASH Sector is poorly targeted. The urban-dwelling, wealthiest segment of the population benefits considerably more from water and sanitation expenditure relative to the rural-dwelling, poorer segment. The result is that the urban rich report increasingly greater access and use of improved water and sanitation services compared to the rural poor.
•Tracking the financing of WASH Sector is a difficult task as MOPHRH’s budget and expenditure totals for water, sanitation, and hygiene line items are not easily filtered from the infrastructure, public works, and housing activities for which it is also responsible. In order to improve such tracking, it is important to strengthen accounting under the functional classification of WASH activities and implement a programmatic classification aligned with the WASH-related objectives, programs, and sub-programs of the government’s five year plan (PQG).
MOZAMBIQUE

2
Background
The 2017 State Budget and Economic and Social Plan were approved by Parliament on December 9, 2016 and entered into force on January 1, 2017. The State Budget and Economic and Social Plan (PES, by its Portuguese acronym) were promulgated by President Felipe Nyusi on December 20, 2016, then published as Law 10/2016 and Resolution 25/2016, respectively, on December 30, 2016.
The 2017 State Budget is worth MT 272.3 billion (US$ 3.86 billion)1; this represents an increase, in both nominal and real terms, relative to the 2016 State Budget and 2016 total government spending. The projected budget deficit is 10.7 percent. In nominal terms, the 2017 State Budget embodies a 12 percent increase relative to the 2016 State Budget and a 30 percent increase relative to the executed value of the 2016 State Budget2. In real term, the 2017 budget is a 1 percent increase compared to last year’s budget and an 18 percent increase compared to last year’s expenditure.
In fact, in nominal terms, the 2017 State Budget is the largest on record; however, in real terms, it is the third largest following the 2014 revised State Budget and the 2015 State Budget3. The nominal increase observed in the 2017 State Budget reflects the planned spending increases on debt servicing, financial operations, and subsidies. These increases, in fact, are due to the country’s now greater debt burden, devaluation of its currency, and increased inflation4. This contributes to an anticipated 10.7 percent budget deficit, which the country will finance through additional borrowing5. Nevertheless, the government is implementing certain austerity measures, including: limitations on new hires outside of the education, health, and agriculture sectors; spending restrictions on gasoline, travel, and personal communication; and postponement of new investment projects not initiated in 2016 6.
The 2017 budget for priority Economic and Social Sectors (which includes the Water and Sanitation Sector) increased in both nominal and real terms and as a share of the entire State Budget. In nominal terms, the allocation to priority Economic and Social Sectors, as defined by the Government’s Five-Year Plan (PQG), increased 18 percent relative to the allocation in the 2016 revised State Budget and 43 percent relative to the executed value of the priority sectors in 2016; however, in real terms, the increases were 7 and 30 percent, respectively. The share occupied by the priority sectors (as a percentage of the State Budget) increased from a 50 percent budgeted share in 2016 to a 53 percent budgeted share in 2017; nevertheless, the 2017 share is much lower than the historical high in 2012 and 2013 when spending on priority sectors represented 62 percent of total government spending. It is important to note here that the Government of Mozambique employs a different methodology when calculating priority sector shares of budgeting and expenditure: instead of using the entire State Budget or total expenditure as the denominator in the calculation, it deducts debt servicing and financial operations from the total. The result is a reported higher share. Using the Government’s methodology, priority sectors represent 69 percent of the 2017 State Budget7.
1) This report uses the exchange rate: US$ 1 = MT 70.45 since this was the average exchange rate for 2017 at the time of publication.
2) Please note that at the time of publication, the CGE 2016 has yet to be released. For this reason, all expenditure references in the remainder of this brief, for the 2016 fiscal year, rely on the execution figures as documented in the REO IV 2016.
3) Author’s calculation based on expected 2017 inflation rate of 15.5 percent. LOE 2017, Documento da Fundamentação, page 11.
4) (i) Mozambique’s Debt-to-GDP ratio grew from 40 percent of GDP in 2012 to 73 percent of GDP in 2015 to 130 percent of GDP by the end of 2016. (ii) Inflation increased from 4 percent in 2015 to 25 percent by the end of 2016, and is expected to increase by 15.5 percent by the end of 2017. (iii) The Mozambique Metical depreciated from US$ 1 = MT 48 in January 2016 to US$ 1 = MT 71 in January 2017. Source: (i) World Bank, “Mozambique Economic Update”, December 2016. (ii) World Bank, World Development Indicators. (iii) Instituto Nacional de Estatísticas, February 2017.
5) LOE 2017. Documento da Fundamentação. Page 34.
6) MEF. Circular No.1/GAB-MEF/2017. “Administração e Execução do Orçamento do Estado para 2017”.
7) For sake of international benchmarking, this brief reports shares calculated out of the total value of the budget, but also references the government-recognized share for sake of comparison.
Photo: ©UNICEF/Mozambique

3
1. How is the WASH Sector defined?
The Water and Sanitation Sector refers to the group of public institutions mandated to supply water and sanitation services that receive autonomous budget allocations through the State Budget. WASH traditionally refers to water, sanitation, and hygiene; however, due to the difficulty of tracking hygiene-related activities in the State Budget, use of the term, for purposes of this report, predominantly denotes water and sanitation. The water component of the sector includes water supply activities and water resource management. On the other hand, the sanitation component of the sector concerns waste management and the provision of personal sanitation facilities. The organic structure of the WASH Sector, which was last modified in 2015, includes institutions operating at the central, provincial, and district levels.
At the central level, the Ministry of Public Works, Housing, and Water Resources (MOPHRH in its Portuguese acronym) governs the sector through the National Directorate of Water Supply and Sanitation (DNAAS) and the National Directorate of Water Resources Management (DNGRH). DNAAS is responsible for ensuring universal access to water and sanitation services. Separately, DNGRH is in charge of the development, conservation, and sustainable use of water resources from watersheds for various uses such as household consumption, agriculture, hydropower, etc. Other WASH institutions at the central level are: the Water Regulatory Council (CRA), which is the sector’s regulatory body; the Water Supply Investment Fund (FIPAG), which is the water supply utility responsible for supplying water to large cities and towns; and also the Water and Sanitation Infrastructure Management Agency (AIAS), which is responsible for supplying water to secondary cities/small towns and sanitation services to all urban areas including large cities.
The Provincial Directorates of Public Works, Housing, and Water Resources (DPOPHRHs), the Regional Water Resource Management Agencies (ARAs), and the District Services for Planning and Infrastructure (SDPIs) are responsible for sector administration at the sub-national level. The DPOPHRHs, at the provincial level, extend the MOPHRH-DNAAS mandate to the provinces and oversee
the implementation of MOPHRH’s water supply and rural sanitation investment programs through their Water and Sanitation Departments (DAS). The ARAs, also at the decentralized level, extend the MOPHRH-DNGRH mandate to five geographic areas as well as regulate the use of river basin waters by collecting regional hydrological information, providing water to irrigation systems, and collecting water usage fees. There are five autonomous ARAs: (i) ARA South is responsible for Maputo, Gaza, and Inhambane provinces; (ii) ARA Central is for Sofala and Manica; (iii) ARA Zambezi is for Tete and part of Zambézia; (iv) ARA North-Central is for Nampula and part of Zambézia; and (v) ARA North is for Cabo Delgado and Niassa8. The SDPIs, at the district level, have a large portfolio of activities that include overseeing projects for the building of wells, boreholes, and small water supply systems as well as the construction of latrines. In addition to SDPIs, various district-level WASH-related activities are implemented under the authority of the District Secretaries (SDs) which are not WASH-specific institutions but still play an important role in the sector. Similarly, also the Ministry of Education and Human Development and the Ministry of Health carry out sanitation & hygiene-related activities9.
8) Note: In the State Budget, the ARA South is considered a central level institution. Source: Development Finance International, WaterAid. “Financial Absorption in the Water, Sanitation, and Hygiene Sector”. Page 8.
9) This Budget Brief does not capture contributions to the WASH sector from institutions that are not specifically responsible for the wider Water and Sanitation Sector in Mozambique.
Photo: ©UNICEF/Mozambique

4
2. What is the source and methodology for calculating WASH Sector totals?
Significant disparities in WASH Sector budget and expenditure totals exist between MEF and MOPHRH sources. Neither of the sources, however, provides a perfect representation of the resources applied, and then used, in the sector. Summing either the total resources allocated to, or spent on, WASH activities is a challenging exercise since such activities are bundled together with other public works and housing activities in the published totals for
MOPHRH, DPOPHRHs, SDPIs, ARAs and SDs. Thus, in order to arrive at accurate WASH Sector totals, one must first filter out the non-WASH activities and then calculate WASH-specific, adjusted totals for each institution. Currently, WASH Sector budgeting and expenditure totals are published annually in two main sources: (i) the General State Account (CGE) compiled by the Ministry of Economy and Finance (MEF) and (ii) the WASH Sector Budget Execution Reports (WASH REOs)10 together with the Annual Evaluation Report on Water Sector Performance (RADS), both compiled by MOPHRH. The WASH Sector totals published in the CGE (specifically in Mapa I-1-1) fail to include DPOPHRH, SDPI, and SD contributions and, also, fail to filter out non-WASH activities from MOPHRH totals. On the other hand, the totals published in the WASH REO/RADS fail to comprehensively account for execution of external donor projects, specifically those on-budget, but off the single treasury account (CUT)11.
WASH Sector budget and expenditure totals have been cleaned to reflect WASH-specific activities. The budget and expenditure totals for 2009 through 2014 come from a UNICEF Mozambique commissioned public expenditure analysis of the WASH Sector, which relied on expenditure data extractions directly from the Government’s financial management information system, e-SISTAFE, and carefully filtered WASH-related activities to arrive at trustworthy totals. The budget and expenditure totals for 2015 and 2016 come from the WASH Sector REOs and the budget totals for 2017 come from the Parliament-approved Budget Law (LOE).
10) There are two versions of the WASH REOs: one is compiled by DNAAS and reports on those institutions under its mandate, and the other is compiled by DNGRH, which reports on the separate institutions under its mandate.
11) The WASH REOs are traditionally published just a couple months after the end of the fiscal year. The RADS then reproduces the expenditure totals documented in the WASH REOs. While this is good for providing timely feedback, it is not enough time to comprehensively collect information on all external investment projects implemented off-CUT. Since the CGE is published many months after the conclusion of the fiscal year, it is able to provide a fairer projection of total funds executed by donors.
WASH Sector budgeting and expenditureFIGURE 1
Source: Author’s calculations from CGE 2008-2015, REO IV 2016, LOE 2017. World Bank, World Development Indicators, “Inflation consumer prices (annual %)” for 2008-2015| IMF, World Economic Outlook for 2016-2017.
Note: * At the time of writing, the 2015 public expenditures account has yet to be finalized; in this regard, it is likely the expenditure total is larger than portrayed. ** While years 2009-2016 display expenditure figures, 2017 is initial budget allocation.
Nominal TermsReal Terms
5.9 7.8 9.1 7.1 4.5 5.6 7.6 8.5 10.55.4 7.2 6.7 7.3 7.4 7.6 9.2 11.93.0 5.1 5.5 6.5 6.9 5.5 6.4 8.1
6.6 7.8 8.2 6.2 3.8 4.6 6.1 5.6 6.36.1 7.2 6.1 6.5 6.3 6.3 7.4 7.93.4 5.1 5.0 5.7 5.8 4.5 5.1 5.4
Inflation Adjusted
Photo: ©UNICEF/Mozambique
5
Trends in the weight of the WASH Sector FIGURE 2
Source:: Author’s calculations from CGE 2009-2015; REO IV 2016; WASH REO/RADS 2016; LOE 2017; WB WDI, “GDP (current LCU)” for 2008-2015 | IMF, World Economic Outlook for 2016-2017.
Note: For 2008 through 2015, the weight is calculated based on nominal expenditure. * At the time of writing, the 2016 public expenditures account has yet to be finalized; in this regard, it is likely these shares are larger than portrayed. ** The 2017 shares are initial budget allocations and not expenditure.
3. What trends emerge from the WASH budget?
The WASH Sector was allocated MT 10.5 b (US$ 148.5 m) in the 2017 State Budget. This represents a large increase relative to the 2016 WASH budget and expenditure, both in nominal and real terms (see Figure #1). In nominal terms, the 2017 sector budget allocation increased 24 percent compared to the 2016 budget allocation, decreased 12 percent compared to 2016 revised allocation, and increased 29 percent compared to the 2016 expenditure. In real terms, the 2017 WASH sector budget represents a smaller increase of 12 percent relative to 2016 budget; it decreased 20 percent compared to 2016 revised allocation, but increased 17 percent relative to 2016 expenditure.
WASH Sector expenditure has grown rather sharply in nominal terms, but only slightly in real terms, over the past eight years (see Figure #1). While initial allocations to the sector have shown great variation over time, sector expenditure steadily increased through 2013; slightly decreased in 2014, then increased again through 2016. Between 2015 and 2016, sector expenditure increased by 27 percent in nominal terms, but by only 6 percent in real terms12. The decrease in expenditure in 2014 is predominately due to
the closure of Mozambique’s Millennium Challenge Account, which contributed large water and infrastructure spending through 2013. The large differences between initial allocation, revised allocation, and expenditure is largely representative of the difficulties encountered by MEF in tracking external donor resources, which make up, on average, of 80 percent of WASH Sector resources13.
The WASH Sector’s share of the State Budget and GDP remained nearly the same as its 2016 shares (see Figure #2). The 2017 WASH Sector budget is worth 3.9 percent of the entire State Budget, which is the same as 2016. It must be noted, however, that according to the methodology utilized by the Government in calculating social sector shares14, the WASH sector budget is equal to 5 percent of the 2017 State Budget. The sector’s share of GDP, which has been relatively stable over time at around one percent, has slightly increased in 2017.
WASH Sub-Sector weight of entire state budget
1.4% Budget
10.5 billion MT were allocated to the WASH Sector in the 2017 State Budget.
12) In 2016 there was a 6 percent inflation rate in Mozambique.
13) In short, donor resources that are on-budget, but off the single treasury account are to be tracked on a quarterly basis by MEF. However, because donors often fail to report in time for the release of the budget, these resources are not accounted for in the initial allocation, but are then recorded in the revised allocation. Then, come the end of the fiscal year, donors either fail to report expenditures on time, or do not report at all, and, thus, donor expenditure is not completely captured in expenditure reports.
14) The Government of Mozambique, instead of using the total volume of the State Budget as a denominator, calculates the percentage share utilizing the total State Budget minus debt servicing, financial operations, and subsidies. This report calculates shares out of the total State Budget as is standard practice for international benchmarking.
5.0% Budget
3.9% Budget
WASH Sub-Sector weight of entire state budget less financial operations, debt servicing, and subsidies
WASH Sub-Sector weight of GDP

6
4. Where do WASH Sector resources come from?
The WASH Sector in Mozambique is financed with both internal and external resources. Internal resources are collected through taxes, tariffs, duties, and internal credits, and have been (up to 2015) complemented by General Budget Support (GBS), which is un-earmarked development aid to the Mozambican Government from a group of development partners. Specific to the WASH Sector, internal resources are also supplemented by revenues from user fees for water consumption. External resources, on the other hand, comprise non-GBS foreign aid, donations, and external credits.
External resources allocated to the WASH sector belong to two categories: (i) “Common Fund contributions15”, which are donations from donors to the multi-donor Common Fund for WASH - PRONASAR - and (ii) “Bilateral Project Funds”, which are all other grants and credits not channeled through the Common Fund. Bilateral project funds are –in theory– coordinated between the donor and MOPHRH and applied through a variety of modalities including: (i) direct government support with government-only or joint partner-government implementation, often “On-Budget, On-CUT”;
WASH Sector internal and external resourcesFIGURE 3
Source: Author's calculations from the CGEs 2009-2015; WASH REO/RADS 2016; LOE 2017.
Note: *At the time of writing, the 2016 public expenditures account has yet to be finalized; in this regard, it is likely these totals are larger than portrayed. ** 2017 represents the initialbudget, while 2008 through 2016 represent what was spent.
15) PRONASAR resources are utilized as if they were internal resources: they are inscribed on the budget and channeled through the CUT.
Photo: ©UNICEF/Mozambique
2009 2010 2011 2012 2013 2014 2015 2016* 2017** 2009 2010 2011 2012 2013 2014 2015 2016* 2017**
Nominal terms Real terms Inflation Adjusted
Internal ResourcesExternal Resources
Internal ResourcesExternal Resources
7
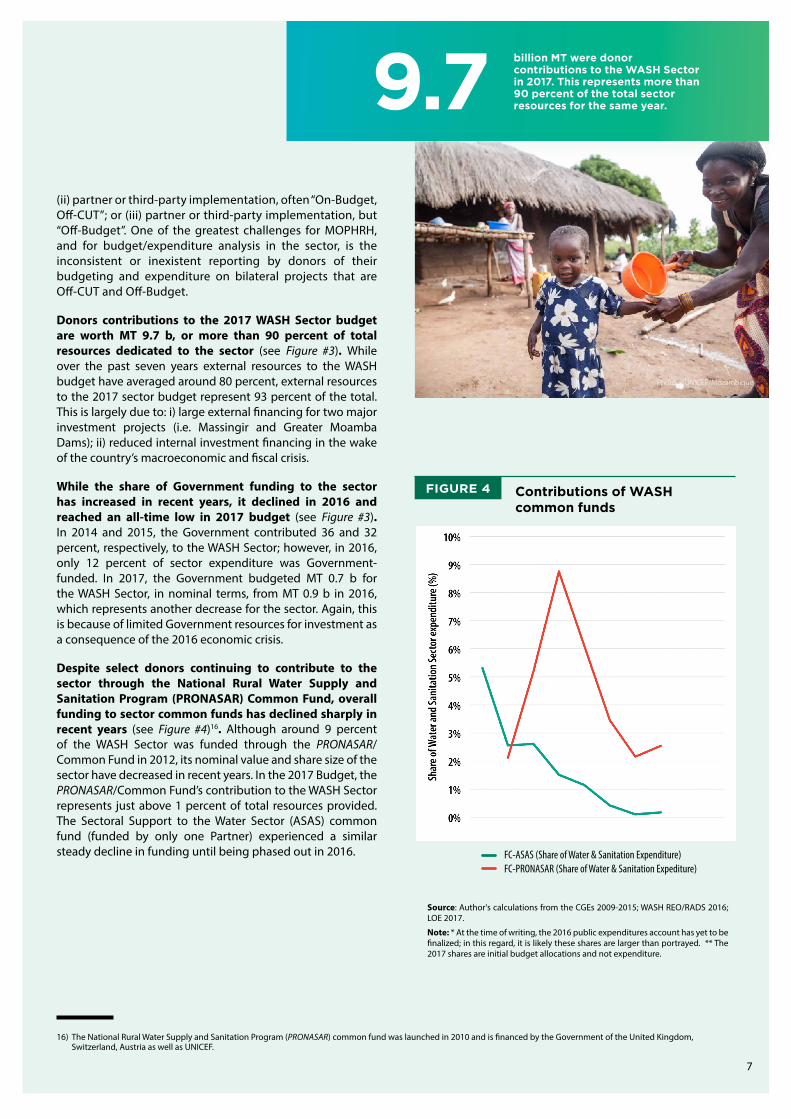
(ii) partner or third-party implementation, often “On-Budget, Off-CUT”; or (iii) partner or third-party implementation, but “Off-Budget”. One of the greatest challenges for MOPHRH, and for budget/expenditure analysis in the sector, is the inconsistent or inexistent reporting by donors of their budgeting and expenditure on bilateral projects that are Off-CUT and Off-Budget.
Donors contributions to the 2017 WASH Sector budget are worth MT 9.7 b, or more than 90 percent of total resources dedicated to the sector (see Figure #3). While over the past seven years external resources to the WASH budget have averaged around 80 percent, external resources to the 2017 sector budget represent 93 percent of the total. This is largely due to: i) large external financing for two major investment projects (i.e. Massingir and Greater Moamba Dams); ii) reduced internal investment financing in the wake of the country’s macroeconomic and fiscal crisis.
While the share of Government funding to the sector has increased in recent years, it declined in 2016 and reached an all-time low in 2017 budget (see Figure #3). In 2014 and 2015, the Government contributed 36 and 32 percent, respectively, to the WASH Sector; however, in 2016, only 12 percent of sector expenditure was Government-funded. In 2017, the Government budgeted MT 0.7 b for the WASH Sector, in nominal terms, from MT 0.9 b in 2016, which represents another decrease for the sector. Again, this is because of limited Government resources for investment as a consequence of the 2016 economic crisis.
Despite select donors continuing to contribute to the sector through the National Rural Water Supply and Sanitation Program (PRONASAR) Common Fund, overall funding to sector common funds has declined sharply in recent years (see Figure #4)16. Although around 9 percent of the WASH Sector was funded through the PRONASAR/Common Fund in 2012, its nominal value and share size of the sector have decreased in recent years. In the 2017 Budget, the PRONASAR/Common Fund’s contribution to the WASH Sector represents just above 1 percent of total resources provided. The Sectoral Support to the Water Sector (ASAS) common fund (funded by only one Partner) experienced a similar steady decline in funding until being phased out in 2016.
Contributions of WASH common funds
FIGURE 4
16) The National Rural Water Supply and Sanitation Program (PRONASAR) common fund was launched in 2010 and is financed by the Government of the United Kingdom, Switzerland, Austria as well as UNICEF.
9.7billion MT were donor contributions to the WASH Sector in 2017. This represents more than 90 percent of the total sector resources for the same year.
Photo: ©UNICEF/Mozambique
Source: Author's calculations from the CGEs 2009-2015; WASH REO/RADS 2016; LOE 2017.
Note: * At the time of writing, the 2016 public expenditures account has yet to be finalized; in this regard, it is likely these shares are larger than portrayed. ** The2017 shares are initial budget allocations and not expenditure.
2009 2010 2011 2012 2013 2014 2015 2016* 2017**
FC-ASAS (Share of Water & Sanitation Expenditure)FC-PRONASAR (Share of Water & Sanitation Expediture)
8
5. How are the WASH Sector resources spent?
The Ministry of Economy and Finance releases initial funds (dotação inicial) via the CUT to each autonomous budget-holding water and sanitation institution and subsequently updates the allocation based on budget execution rates and available resources (dotação actualizada). The institutions track spending (execução) through the e-SISTAFE, which sources quarterly budget execution reports (REOs) and the annual General State Account (CGE). The way the 2017 WASH budget will be spent can be analyzed from the following three perspectives:
5.1 Recurrent vs. Capital expenditure
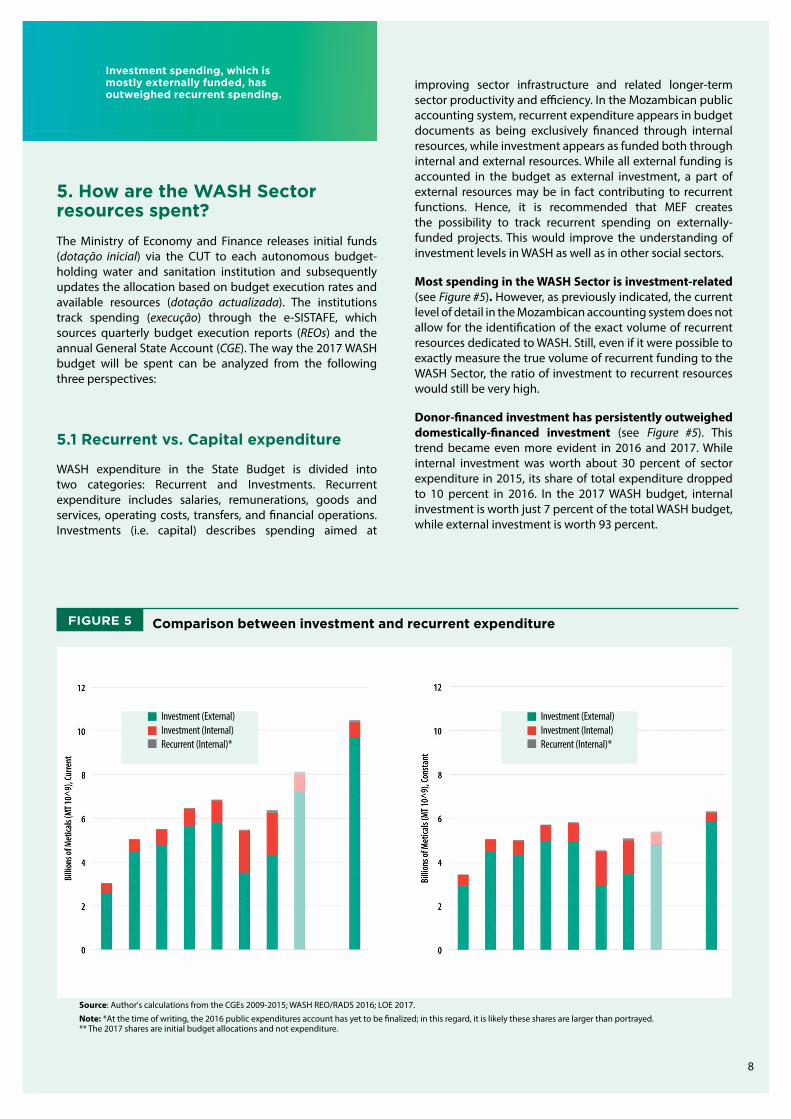
WASH expenditure in the State Budget is divided into two categories: Recurrent and Investments. Recurrent expenditure includes salaries, remunerations, goods and services, operating costs, transfers, and financial operations. Investments (i.e. capital) describes spending aimed at
Source: Author's calculations from the CGEs 2009-2015; WASH REO/RADS 2016; LOE 2017.
Note: *At the time of writing, the 2016 public expenditures account has yet to be finalized; in this regard, it is likely these shares are larger than portrayed. ** The 2017 shares are initial budget allocations and not expenditure.
improving sector infrastructure and related longer-term sector productivity and efficiency. In the Mozambican public accounting system, recurrent expenditure appears in budget documents as being exclusively financed through internal resources, while investment appears as funded both through internal and external resources. While all external funding is accounted in the budget as external investment, a part of external resources may be in fact contributing to recurrent functions. Hence, it is recommended that MEF creates the possibility to track recurrent spending on externally-funded projects. This would improve the understanding of investment levels in WASH as well as in other social sectors.
Most spending in the WASH Sector is investment-related (see Figure #5). However, as previously indicated, the current level of detail in the Mozambican accounting system does not allow for the identification of the exact volume of recurrent resources dedicated to WASH. Still, even if it were possible to exactly measure the true volume of recurrent funding to the WASH Sector, the ratio of investment to recurrent resources would still be very high.
Donor-financed investment has persistently outweighed domestically-financed investment (see Figure #5). This trend became even more evident in 2016 and 2017. While internal investment was worth about 30 percent of sector expenditure in 2015, its share of total expenditure dropped to 10 percent in 2016. In the 2017 WASH budget, internal investment is worth just 7 percent of the total WASH budget, while external investment is worth 93 percent.
Investment spending, which is mostly externally funded, has outweighed recurrent spending.
Comparison between investment and recurrent expenditureFIGURE 5
2009 2010 2011 2012 2013 2014 2015 2016* 2017** 2009 2010 2011 2012 2013 2014 2015 2016* 2017**
Nominal terms Real terms Inflation Adjusted
Investment (External)Investment (Internal)Recurrent (Internal)*
Investment (External)Investment (Internal)Recurrent (Internal)*

9
5.2 Expenditure by WASH institution
The Regional Water Administrations show the largest resource gain in 2017 WASH Sector Budget (see Figure #6). While the ARAs were allocated an average of 10 percent of sector resources between 2009 and 2016, they are budgeted to receive 40 percent of 2017 WASH budget. Of the five Regional Water Administrations, ARA South has historically registered the most spending and, in 2017, has received the
largest allocation of WASH resources (see Figure #7). In fact, ARA South, executed, on average, half a billion Meticals per year between 2009 and 2016; In 2017, ARA South is budgeted to receive about MT 4 b. Nevertheless, 95% of the ARA South budget are allocations and loans for the rehabilitation of the Massingir Dam and for the construction of the Greater Moamba Dam. Hence, when factoring out these very large investment projects, the allocations to ARA South are on par with the other ARAs.
Expenditure by WASH institutionFIGURE 6
Nominal terms Real terms Inflation Adjusted
ARA (Total)
MOPHRH - National Directorate of Water Resource Management (DNGRH)
MOPHRH - National Directorate of Water (DNAAS)
MCA*** - Water and Sanitation Project
Administration of Water and Sanitation Infrastructure (AIAS)
Council for the Regulation of the Water Supply (CRA)
Investment and Patrimony Fund for the Water Supply (FIPAG)
2009 2010 2011 2012 2013 2014 2015 2016* 2017** 2009 2010 2011 2012 2013 2014 2015 2016* 2017**
Source: Author's calculations from the CGEs 2009-2015; WASH REO/RADS 2016; LOE 2017.
Note: * At the time of writing, the 2016 public expenditures account has yet to be finalized; in this regard, it is likely these shares are larger than portrayed. ** The 2017 shares are initial budget allocations and not expenditure.
ARA expenditure by regionFIGURE 7
Nominal terms Real terms Inflation Adjusted
2009 2010 2011 2012 2013 2014 2015 2016* 2017** 2009 2010 2011 2012 2013 2014 2015 2016* 2017**
Source: Author's calculations from the CGEs 2009-2015; WASH REO/RADS 2016; LOE 2017.
Note: The ARA stands for Regional Water Administration (Administração Regional das Aguas). * At the time of writing, the 2016 public expenditures account has yet to be finalized; in this regard, it is likely these totals are larger than portrayed. ** The 2017 figures are initial budget allocations and not expenditure.
Billi
ons o
f Met
icals
(MT 1
0^9)
, Cur
rent
Billi
ons o
f Met
icals
(MT 1
0^9)
, Con
stan
t

10
5.3 Expenditure by functional classification
The WASH Sector requires better tracking of sector expenditure by functional classification (see Figure #8). While the MEF tracks three functional classifications for the WASH sector (i.e. urban water supply, rural water supply, and unspecified water supply), the MOPHRH began a six-category classification in 2014. The functional categories tracked by the MOPHRH include: urban water supply, rural water supply, urban sanitation, rural sanitation, water resources and institutional capacity. However, the functional classifier totals for the sector are still lower than the organic classification totals. This, coupled with the large share of resources that fall under the “not specified” category, suggests that the functional expenditure tracking for the WASH sector is still not comprehensive. The sector should prioritize utilizing programmatic classification linked to PQG strategic objectives, programs and sub-programs. This would allow a better understanding of how spending in the sector links with national goals.
The largest share of WASH Sector financing is dedicated to Urban Water Supply (see Figure #8). According to MEF data, expenditure for Urban Water Supply averaged 52 percent of the WASH total expenditure between 2009 and 2016. Urban Water Supply expenditure showed an increasing trend that culminated in 2016 with a 75 percent share of total sector expenditure. Nevertheless, MOPHRH data report an even larger increase in Urban Water Supply spending with an 80 percent share of the sector expenditure in 2016. Conversely, according to MEF data, expenditure for Rural Water Supply averaged 26 percent of total WASH expenditure over the past eight years, but declined to a 5 percent share, or the sector’s lowest over time, in 2016. However, it must be noted that MOPHRH’s disaggregated data reports a 17 percent Rural Water Supply share17. Both MEF and MOPHRH’s data show that Rural Sanitation receives almost nothing from the sector. While MEF does not even track allocations to Rural Sanitation, MOPHRH reports that Rural Sanitation receives less than one percent of the total sector resources.
Recur
rent
Intern
al Inv
estmen
tExt
ernal I
nvest
ment
52%
Source: Author's calculations from CGE 2009-2015, REO 2016, Water REO/RADS 2014, 2015, 2016.
Note: Two different "functional classifications": (i) MEF functional classification and (ii) MOPHRH DNAAS functional classification. There are different categories in each i.e. the former only shows water and the latter is more detailed.
Expenditure by functional classificationFIGURE 8
Nominal terms Real terms Inflation Adjusted
2009
(MEF
)
2010
(MEF
)
2011
(MEF
)
2012
(MEF
)
2013
(MEF
)
2014
(MEF
)20
15 (M
EF)
2016
(MEF
)
2014
(MOPHRH)
2015
(MOPHRH)
2016
(MOPHRH)
2009
(MEF
)
2010
(MEF
)
2011
(MEF
)
2012
(MEF
)
2013
(MEF
)
2014
(MEF
)20
15 (M
EF)
2016
(MEF
)
2014
(MOPHRH)
2015
(MOPHRH)
2016
(MOPHRH)
of the WASH total expenditure between 2009 and 2016 was dedicated to Urban Water Supply. This is the largest share of the WASH Sector resources.

6. How well has the WASH Sector executed its past budgets?
WASH Sector aggregate budget execution in 2016 was 68.4 percent, mostly due to low execution of both internal and external investment (see Figure #9). Between 2009 and 2016, the WASH Sector faced difficulties in executing its full budgets; as a whole, the sector executed, on average, 75 percent of its budget for those years. This value is lower than the average execution rate of the State Budget of 87 percent for the same years. Due to 2016 economic crisis, donors froze their contributions to the sector at the beginning of the year, and later disbursed in the third and fourth quarters. This resulted in a 71 percent execution rate of 2016 external investments. However, it is important to point out that besides tardy and incomplete disbursements, the low donor execution rate is also likely a reflection of poor donor
reporting on projects inscribed on-budget, but funded off-CUT. In the context of 2016 crisis, internal investment was also poorly executed. In fact, while between 2009 and 2016 internal investment execution rate averaged 93 percent, in 2016 it was 47 percent.
11
WASH budget executionFIGURE 9
Source: Author's calculations from the CGE 2008-2015 and REO IV 2016.
Note: Figure represents entire Education Sector (i.e. General Education and Higher Education). (*) At the time of writing, the 2016 public expenditures account has yet to be finalized; in this regard, it is possible the execution rate is slightly larger than shown.
2016*2009 2010 2011 2012 2013 2014 2015
Recur
rent
Intern
al Inv
estmen
tExt
ernal I
nvest
ment
Recur
rent
Intern
al Inv
estmen
tExt
ernal I
nvest
ment
Recur
rent
Intern
al Inv
estmen
tExt
ernal I
nvest
ment
Recur
rent
Intern
al Inv
estmen
tExt
ernal I
nvest
ment
Recur
rent
Intern
al Inv
estmen
tExt
ernal I
nvest
ment
Recur
rent
Intern
al Inv
estmen
tExt
ernal I
nvest
ment
Recur
rent
Intern
al Inv
estmen
tExt
ernal I
nvest
ment
Recur
rent
Intern
al Inv
estmen
tExt
ernal I
nvest
ment
75%is the average execution rate of WASH Sector budgets between 2009 and 2016. In 2016, the execution rate was about 68%. This was largely due to the economic and financial crisis.
Photo: ©UNICEF/Mozambique
17) These data discrepancies, again, highlight the need for improved Government capacity to track WASH spending.
2009
(MEF
)
2010
(MEF
)
2011
(MEF
)
2012
(MEF
)
2013
(MEF
)
2014
(MEF
)20
15 (M
EF)
2016
(MEF
)
2014
(MOPHRH)
2015
(MOPHRH)
2016
(MOPHRH)

7. How much is WASH Sector debt worth?
In recent years, the Government has taken on debt to supplement funding to the WASH Sector18. Between 2009 and 2016, WASH Sector’s main institutions have taken on both internally- and externally-financed debt. WASH sector debt reached its peak in 2016 both in nominal and real terms (see Figure #10). While between 2009 and 2015 the sector debt averaged MT 296 m in nominal terms and MT 279 m in real terms, 2016 debt is worth MT 6.2 b in nominal terms and MT 4.1 b in real terms. The 2016 WASH Sector debt is largely attributable to ARA South for water storage infrastructure, namely the rehabilitation of the Massingir Dam and the construction of the Greater Moamba Dam.
12
Photo: ©UNICEF/Mozambique
6.2 billion MT is 2016 Sector’s debt. This is mostly attributable to infrastructure investments in the South Regional Water Administration.
18) Sector debt consists of debt payment obligations (factura), money owed through the value-added tax (IVA), and money owed for Government subsidies (comparticipação).
Source: Author's compilation from REO/RADS 2010/2016.
WASH debtFIGURE 10
Nominal debt Real debtInflation Adjusted

8. To what extent has the WASH Sector decentralized?
WASH Sector is highly centralized, despite recent Government efforts for decentralization (see Figure #11). In 2014, MOPHRH established 14 District Units for Infrastructure Planning19 (SDPIs) as autonomous budget holding units with district level competence in the areas of public works, housing, and water and sanitation activities20. However, both internal and external resources are still highly centralized. In 2016, about 70 percent of internal expenditure and 95 percent of external expenditure was destined to the central level. The highly centralized external expenditure can be partially explained with the fact donors on-budget disbursement go to central level institutions (i.e. MOPHRH) before being decentralized internally. The Government should prioritize strengthening the capacity of DPOPHRH and SDPI to be able to implement larger investment projects with external funding.
19) In Portuguese, Secretarias Distritais & Serviço Distrital de Planeamento e Infra-Estruturas. The SDPIs are 14 districts: Ngauma, Marrupa (Niassa); Muidumbe, Chiure (Cabo Delgado); Meconta, Mogincual (Nampula); Cahora Bassa, Magoe (Tete); Barué, Tambara (Manica); Chibabava, Caia (Sofala); Massinga, Morrumbene (Inhambane).
20) LOE 2014. Documento da Fundamentação
12 13
Both internal and external spending in the WASH Sector are highly centralized.
Decentralization of WASH Sector expenditureFIGURE 11
Decentralization of Internal Expenditure Decentralization of External Expenditure
Source: Author’s compilation from the CGE 2009-2015; WASH REO/RADS 2016; LOE 2017.
Note: For MOPH and the DPOPHs, there is no recorded recurrent expenditure, only investment, since not all activities of the aforementioned are WASH related and because it is impossible to disaggregate recurrent expenditure for the specific WASH activities. * At the time of writing, the 2016 public expenditures account has yet to be finalized; in this regard, it is likely these totals are larger than portrayed. ** The 2017 figures are initial budget allocations and not expenditure.
Photo: ©UNICEF/Mozambique

14
Access to improved water sourcesFIGURE 12 A
Access to improved water sources compared to peersFIGURE 12 B
Source: World Bank, World Development Indicators, 2000-2015
Note: SSA represent the average of Sub-Saharan Africa countries; LIC represent the average of Low Income countries.
Source: World Bank, World Development Indicators, 2000-2015

14 15
9. How has the WASH Sector performed?
Only half of the population have access to improved water sources in Mozambique (see Figure #12a). Between 2000 and 2015, the share of the Mozambican population receiving water from an improved source increased from 41 percent to 51 percent. Over the past 15 years, access for rural areas increased by 10 percentage points and access for urban areas increased by 6 percentage points. However, a vast difference in shares of access still exists between rural and urban areas. In fact, while in 2015 81 percent of the urban population had access to improved water, only 37 percent of the rural population did.
Despite the increase in access to clean water Mozambique is barely keeping pace with its peers (see Figure #12b). In fact, compared to the average of Low Income countries (LIC), Mozambique provides clean water access to 15 percent less of its population. Similarly, when compared to the average of Sub-Saharan African countries (SSA), it provides access to 17 percent less.
Seven of eleven provinces demonstrated a large increase in clean water access for its inhabitants between 2008/9 and 2014/5. However, differences in access still exist across provinces (see Figure #12c). According to the 2008-2009 and 2014-2015 Household Surveys, significant access gains were made in seven provinces; of which Maputo Province demonstrated the greatest percentage point gain
and Inhambane the largest percentage increase relative to its 2008-2009 value. Despite an overall increase in access to improved clean water, it is evident that large differences still exist across provinces. For example, while Zambezia Province provides clean water access to 31 percent of its inhabitants, Maputo Province provides access to 87 percent, or more than double the share of population. Also, according to the most recent Household Survey data (2014-2015), five provinces register less than half of the population having access to clean water: Zambezia, Nampula, Niassa, Cabo Delgado, and Tete.
Access to improved water sources by provinceFIGURE 12 C
Source: National Statistics Institute (INE), 2008/9 and 2014/5 Household Surveys
50%of the population still do not have access to improved water resources in Mozambique.
Photo: ©UNICEF/Mozambique

Similarly, large discrepancies exist in the type of access to clean water (see Figure #12d). While inhabitants of Maputo Province principally receive their water from a piped water supply or well/borehole with pump, Zambezia Province inhabitants mostly receive their water from an unprotected well or river, lake, or lagoon. When looking at the whole country, the most common source of water is an unprotected well, which is an insecure water source relied on by 27 percent of the population. Following this, the most common water sources are piped water (22 percent), well/borehole with pump (19 percent), river, lake or lagoon (15 percent); public water tap (9 percent); and well without pump, unprotected spring, rain water, protected spring, and bottled water account for the remaining share.
16
27% of the population receive water from unprotected wells or unsecure water resources.
Access to improved water sources by typeFIGURE 12 D
Source: National Statistics Institute (INE), 2008/9 and 2014/5 Household Surveys
Photo: ©UNICEF/Mozambique

21) UNICEF, WHO. “Progress on Drinking Water and Sanitation”. 212 Update. Pg. 48
16 17
Access to improved sanitation facilitiesFIGURE 13 A
Source: World Bank, World Development Indicators, 2000-2015
Access to improved sanitation facilities compared to peersFIGURE 13 B
Just one fifth of Mozambicans have access to improved sanitation facilities (see Figure #13a). The share of population with access to sanitation is still very low, despite an increase from 14 percent in 2000 to 20 percent in 2015. Also, approximately 41 percent of the population practices open defecation, of which 58 percent in rural areas and 13 percent in urban areas21.
Mozambicans have worse access to improved sanitation facilities compared to populations from other countries in the same region and at the same income level (see Figure #13b). Whereas 20 percent of Mozambicans have access to improved sanitation facilities, the average access in Low Income countries and Sub-Saharan African countries is 28 and 30 percent respectively.
Source: World Bank, World Development Indicators, 2000-2015
Note: SSA represent the average of Sub-Saharan Africa countries; LIC represent the average of Low Income countries.

Relevant differences exist in access to improved sanitation facilities and in type of sanitation facilities across provinces (see Figures #13c and d). Whereas only 1-in-10 residents in Zambezia Province has access to improved facilities, 7-in-10 residents in Maputo Province do. Maputo Province and Maputo City have access rates above that of the middle-income country average. More specifically, these two areas have access rates more than twice as large as the
Access to improved sanitation facilities by typeFIGURE 13 D
18
Source: National Statistics Institute (INE), 2008/9 and 2014/5 Household Surveys
other nine provinces. On the type of sanitation facility, most of the population with access to improved sanitation facilities use improved latrines. Only a small share of the population has toilets connected to septic tanks. However, as general access improves so does the type of access. In fact, between the Household Surveys in 2008/9 and 2014/5, as access rates increased, so did the growth in toilets with septic systems.
Access to improved sanitation facilities by provinceFIGURE 13 C
Source: National Statistics Institute (INE), 2008/9 and 2014/5 Household Surveys
Zambéz
ia - 2
008/9
Zambéz
ia - 2
014/5
Cabo D
elgad
o - 20
08/9
Cabo D
elgad
o - 20
14/5
Niassa
- 200
8/9Nias
sa - 2
014/5
Nampula
- 200
8/9
Nampula
- 201
4/5Man
ica - 2
008/9
Manica
- 201
4/5Te
te - 2
008/9
Tete
- 201
4/5Inham
bane -
2008
/9
Inhamban
e - 20
14/5
Sofal
a - 20
08/9
Sofal
a - 20
14/5
Gaza -
2008
/9Gaz
a - 20
14/5
Maputo
Province
- 200
8/9
Maputo
Province
- 201
4/5Map
uto Ci
ty - 2
008/9
Maputo
City
- 201
4/5
Total
- 200
8/9To
tal - 2
014/5

Benefit incidence of public spending on Water and Sanitation by quintileFIGURE 14 A
18 19
10. To what Extent is WASH expenditure equitable?
Public expenditure in the WASH Sector benefits the wealthiest quintile of the Mozambican population more than others (see Figure #14a). Based on most recent available household data, 35 percent of public spending in the WASH Sector benefited the wealthiest sector of the population, while only 11 percent benefited the poorest segment. Hence, public spending in the sector is moderately inequitable. To improve equitable access to and usage of improved water sources and sanitation facilities, the Government needs to better target sector spending to the poorer share of the population while addressing long-term inefficiencies.
Source: Author's calculations from the CGEs 2008/9 and 2014/5 and National Statistics Institute (INE), 2008/9 and 2014/5 Household Survey.
35% of WASH Sector spending benefited the wealthiest groups of population, while only 11% benefited the poorest.
Photo: ©UNICEF/Mozambique

AIAS Water and Sanitation Infrastructure Management Agency
ARA Regional Water Resource Management Agency
ASAS Sectoral Support to the Water Sector Common Fund
b Billion CGE General State Account (Final Budget
Report) CRA Water Regulatory Council CUT Single Treasury Account DNAAS National Directorate of Water Supply
and Sanitation DNGRH National Directorate of Water
Resources Management DPOPHRH Provincial Directorates for Public
Works, Housing, and Water Resources e-SISTAFE Mozambique Integrated Financial
Management Information System FC Common Fund FIPAG Water Supply Investment Fund GBS General Budget Support GDP Gross Domestic Product
Glossary of budget terms:
Initial Allocation (Dotação Inicial): The first allocation of funds, approved by Parliament
Revised Initial Allocation (Dotação Rectificativa): A revised allocation of funds, approved by Parliament
Updated Allocation (Dotação Actualizada): The total funds that arrive at the disposal of a given WASH institution
Expenditure (Despesa Realizada): Allocated funds spent on WASH investment and recurrent costs
Budget Execution (Execução do Orçamento): Percentage of allocated funds spent out of the total allocation
Nominal/Current Values: Numbers not corrected for the effect of inflation
Real/Constant Values: Numbers corrected for inflation
Per Capita: Per person
Acronyms: LOE State Budget Law MCA Millennium Challenge Corporation m Million MoEF Ministry of Economy and Finance MOPHRH Ministry of Public Works, Housing, and
Water Resources MT Mozambican Metical (Local Currency) PES Economic and Social Plan PRONASAR National Rural Water Supply and
Sanitation Program Common Fund PQG Government Five Year Plan RADS Annual Evaluation Report on Water
Sector Performance REO State Budget Execution Report (Budget
Update Report) SD District Secretary SDPI District Services for Planning and
Infrastructure UGB Beneficiary Management Unit US$ United States Dollar (Currency) WASH Water, Sanitation, and Hygiene WB World Bank WDI World Development Indicators
Fó
20
Benefit incidence of public spending on Water and Sanitation by urban/rural dwellers
FIGURE 14 B
Likewise, Water and Sanitation expenditure is unequally distributed between rural and urban areas (see Figure #14b). Urban areas benefit from public spending on water and sanitation provisions considerably more than rural areas. The distribution of sanitation spending might be biased in favor of urban spending due to data limitations. However, given the volume of water spending to sanitation spending (water to sanitation spending ratio is about 6:1), a fairer distribution of sanitation expenditure between rural and urban areas still would not be enough to move the overall sector benefit incidence by a large margin. Therefore, it is evident that public spending in the WASH sector is unequal because of disproportionately favoring urban areas. Source: Author's calculations from the CGEs 2008/9 and 2014/5 and National
Statistics Institute (INE), 2008/9 and 2014/5 Household Survey.
Related Documents