B.1 TAXATION ANNEXES TO THE SUMMARY OF 2017 BUDGET MEASURES

Welcome message from author
This document is posted to help you gain knowledge. Please leave a comment to let me know what you think about it! Share it to your friends and learn new things together.
Transcript

B.1
TAXATION ANNEXES TO THE SUMMARY
OF 2017
BUDGET MEASURES

B.2

B.3
TAXATION ANNEXES TO THE SUMMARY
OF 2017
BUDGET MEASURES
CONTENTS
Annex A A distributional analysis of Budget 2017 Measures on a variety B.5 of household family types across a range of income levels
Annex B
Income Tax and Progressivity Issues B.25
Annex C Review of the Corporation Tax Code by an Independent Expert B.31
Annex D Help to Buy B.32

B.4

B.5
ANNEX A
A distributional analysis of Budget 2017 Measures on a variety of household
family types across a range of income levels.
Introduction
This Annex presents a range of information that illustrates the effect of the Budget
measures on different categories of income earners and household types. Distribution
tables show the impact of Budget measures for different family types – single individuals,
married couples, families with children - across a range of income levels from €12,000 to
€175,000.
The examples are based on specimen incomes from both employment and self-
employment sources, taking into account the personal, PAYE, Earned Income and Home
Carer tax credits as relevant. The examples also do not take account of additional tax reliefs
which may be available such as Mortgage Interest Relief. Variations can arise due to
rounding.
There are also tables showing the average effective tax rate for different household types
with employment and self-employment income for the years 2002 to 2017.
Information is also provided on the distribution of income earners for Income Tax purposes
on a 2016 and a post-Budget 2017 basis. This shows a breakdown of the number of income
earners: exempt from Income Tax; paying Income Tax at the standard rate; and paying
Income Tax at the higher rate.
A number of illustrative cases are also provided to demonstrate the impact of the Budget
changes across a broader range of family types and income sources.
This complements other analyses that are undertaken aimed at integrating equality and
distributional considerations into the Budget process as set out in the Economic and Fiscal
Outlook section of this document. In particular, the following Annex B provides a broader
examination of income tax and progressivity issues.

B.6
(i) Examples showing the effects of Budget changes on different categories of single and married income earners
EXAMPLE 1
Single person, no children, private sector employee taxed under PAYE
Full rate PRSI contributor
Note: Assuming that employees currently earning less than €18,556 p.a. earn all their income at the minimum wage
and will therefore benefit from an increase of 1.09% (€9.15 to €9.25 per hour) in their gross income
Gross Income Income Tax PRSI Universal Social
Charge Total Change
Change as % of Net Income
Effective Tax Rate
Existing Min. Wage
New Existing Proposed Existing Proposed Existing Proposed Per
Year Per
Week Existing Proposed
€ Increase € € € € € € € € € % %
12,000 131 12,131 0 0 0 0 0 0 131 3 1.1% 0.0% 0.0%
14,000 153 14,153 0 0 0 0 180 114 219 4 1.6% 1.3% 0.8%
18,000 197 18,197 300 339 0 0 300 215 242 5 1.4% 3.3% 3.0%
20,000 0 20,000 700 700 459 459 393 290 103 2 0.6% 7.8% 7.2%
25,000 0 25,000 1,700 1,700 1,000 1,000 668 540 128 2 0.6% 13.5% 13.0%
30,000 0 30,000 2,700 2,700 1,200 1,200 943 790 153 3 0.6% 16.1% 15.6%
35,000 0 35,000 3,940 3,940 1,400 1,400 1,218 1,040 178 3 0.6% 18.7% 18.2%
45,000 0 45,000 7,940 7,940 1,800 1,800 1,768 1,540 228 4 0.7% 25.6% 25.1%
55,000 0 55,000 11,940 11,940 2,200 2,200 2,318 2,040 278 5 0.7% 29.9% 29.4%
70,000 0 70,000 17,940 17,940 2,800 2,800 3,143 2,790 353 7 0.8% 34.1% 33.6%
100,000 0 100,000 29,940 29,940 4,000 4,000 5,542 5,189 353 7 0.6% 39.5% 39.1%
150,000 0 150,000 49,940 49,940 6,000 6,000 9,542 9,189 353 7 0.4% 43.7% 43.4%
175,000 0 175,000 59,940 59,940 7,000 7,000 11,542 11,189 353 7 0.4% 44.8% 44.6%
Variations can arise due to rounding

B.7
EXAMPLE 2
Married couple, one income, no children, private sector employee taxed under PAYE
Full rate PRSI contributor
Note: Assuming that employees currently earning less than €18,556 p.a. earn all their income at the minimum wage
and will therefore benefit from an increase of 1.09% (€9.15 to €9.25 per hour) in their gross income
Gross Income Income Tax PRSI Universal Social
Charge Total Change
Change as % of Net Income
Effective Tax Rate
Existing Min. Wage Increase
New Existing Proposed Existing Proposed Existing Proposed Per Year Per Week Existing Proposed
€ € € € € € € € € € € % %
12,000 131 12,131 0 0 0 0 0 0 131 3 1.1% 0.0% 0.0%
14,000 153 14,153 0 0 0 0 180 114 219 4 1.6% 1.3% 0.8%
18,000 197 18,197 0 0 0 0 300 215 282 5 1.6% 1.7% 1.2%
20,000 0 20,000 0 0 459 459 393 290 103 2 0.5% 4.3% 3.7%
25,000 0 25,000 50 50 1,000 1,000 668 540 128 2 0.5% 6.9% 6.4%
30,000 0 30,000 1,050 1,050 1,200 1,200 943 790 153 3 0.6% 10.6% 10.1%
35,000 0 35,000 2,050 2,050 1,400 1,400 1,218 1,040 178 3 0.6% 13.3% 12.8%
45,000 0 45,000 4,490 4,490 1,800 1,800 1,768 1,540 228 4 0.6% 17.9% 17.4%
55,000 0 55,000 8,490 8,490 2,200 2,200 2,318 2,040 278 5 0.7% 23.7% 23.1%
70,000 0 70,000 14,490 14,490 2,800 2,800 3,143 2,790 353 7 0.7% 29.2% 28.7%
100,000 0 100,000 26,490 26,490 4,000 4,000 5,542 5,189 353 7 0.6% 36.0% 35.7%
150,000 0 150,000 46,490 46,490 6,000 6,000 9,542 9,189 353 7 0.4% 41.4% 41.1%
175,000 0 175,000 56,490 56,490 7,000 7,000 11,542 11,189 353 7 0.4% 42.9% 42.7%

B.8
EXAMPLE 3 Married couple, one income, two children, private sector employee taxed under PAYE
Full rate PRSI contributor
Note: Assuming that employees currently earning less than €18,556 p.a. earn all their income at the minimum wage
and will therefore benefit from an increase of 1.09% (€9.15 to €9.25 per hour) in their gross income
Gross Income Income Tax PRSI Universal Social
Charge Total Change
Change as % of
Net Income
Effective Tax Rate
Existing Min. Wage Increase
New Existing Proposed Existing Proposed Existing Proposed Per Year Per Week
Existing Proposed
€ € € € € € € € € € € % %
12,000 131 12,131 0 0 0 0 0 0 131 3 1.1% 0.0% 0.0%
14,000 153 14,153 0 0 0 0 180 114 219 4 1.6% 1.3% 0.8%
18,000 197 18,197 0 0 0 0 300 215 282 5 1.6% 1.7% 1.2%
20,000 0 20,000 0 0 459 459 393 290 103 2 0.5% 4.3% 3.7%
25,000 0 25,000 0 0 1,000 1,000 668 540 128 2 0.5% 6.7% 6.2%
30,000 0 30,000 50 0 1,200 1,200 943 790 203 4 0.7% 7.3% 6.6%
35,000 0 35,000 1,050 950 1,400 1,400 1,218 1,040 278 5 0.9% 10.5% 9.7%
45,000 0 45,000 3,490 3,390 1,800 1,800 1,768 1,540 328 6 0.9% 15.7% 15.0%
55,000 0 55,000 7,490 7,390 2,200 2,200 2,318 2,040 378 7 0.9% 21.8% 21.1%
70,000 0 70,000 13,490 13,390 2,800 2,800 3,143 2,790 453 9 0.9% 27.8% 27.1%
100,000 0 100,000 25,490 25,390 4,000 4,000 5,542 5,189 453 9 0.7% 35.0% 34.6%
150,000 0 150,000 45,490 45,390 6,000 6,000 9,542 9,189 453 9 0.5% 40.7% 40.4%
175,000 0 175,000 55,490 55,390 7,000 7,000 11,542 11,189 453 9 0.4% 42.3% 42.0% (a) Variations can arise due to rounding (b) Total change includes Income Tax and USC changes only

B.9
EXAMPLE 4
Single person, no children, taxed under Schedule D (self-employed)
Gross Income
Income Tax PRSI Universal Social
Charge Total Change
Change as % of Net Income
Effective Tax Rate
Existing Proposed Existing Proposed Existing Proposed Per Year Per Week Existing Proposed
€ € € € € € € € € % %
12,000 200 0 500 500 0 0 200 4 1.8% 5.8% 4.2%
14,000 600 200 560 560 180 110 470 9 3.7% 9.6% 6.2%
18,000 1,400 1,000 720 720 300 210 490 9 3.1% 13.4% 10.7%
20,000 1,800 1,400 800 800 393 290 503 10 3.0% 15.0% 12.5%
25,000 2,800 2,400 1,000 1,000 668 540 528 10 2.6% 17.9% 15.8%
30,000 3,800 3,400 1,200 1,200 943 790 553 11 2.3% 19.8% 18.0%
35,000 5,040 4,640 1,400 1,400 1,218 1,040 578 11 2.1% 21.9% 20.2%
45,000 9,040 8,640 1,800 1,800 1,768 1,540 628 12 1.9% 28.0% 26.6%
55,000 13,040 12,640 2,200 2,200 2,318 2,040 678 13 1.8% 31.9% 30.7%
70,000 19,040 18,640 2,800 2,800 3,143 2,790 753 14 1.7% 35.7% 34.6%
100,000 31,040 30,640 4,000 4,000 5,542 5,189 753 14 1.3% 40.6% 39.8%
150,000 51,040 50,640 6,000 6,000 11,042 10,689 753 14 0.9% 45.4% 44.9%
175,000 61,040 60,640 7,000 7,000 13,792 13,439 753 14 0.8% 46.8% 46.3%
Variations can arise due to rounding

B.1
0
EXAMPLE 5 Married couple, one income, no children, taxed under Schedule D (self-employed)
Gross Income
Income Tax PRSI Universal Social
Charge Total Change
Change as % of Net Income
Effective Tax Rate
Existing Proposed Existing Proposed Existing Proposed Per Year Per Week Existing Proposed
€ € € € € € € € € % %
12,000 0 0 500 500 0 0 0 0 0.0% 4.2% 4.2%
14,000 0 0 560 560 180 110 70 1 0.5% 5.3% 4.8%
18,000 0 0 720 720 300 210 90 2 0.5% 5.7% 5.2%
20,000 150 0 800 800 393 290 253 5 1.4% 6.7% 5.5%
25,000 1,150 750 1,000 1,000 668 540 528 10 2.4% 11.3% 9.2%
30,000 2,150 1,750 1,200 1,200 943 790 553 11 2.1% 14.3% 12.5%
35,000 3,150 2,750 1,400 1,400 1,218 1,040 578 11 2.0% 16.5% 14.8%
45,000 5,590 5,190 1,800 1,800 1,768 1,540 628 12 1.8% 20.4% 19.0%
55,000 9,590 9,190 2,200 2,200 2,318 2,040 678 13 1.7% 25.7% 24.4%
70,000 15,590 15,190 2,800 2,800 3,143 2,790 753 14 1.6% 30.8% 29.7%
100,000 27,590 27,190 4,000 4,000 5,542 5,189 753 14 1.2% 37.1% 36.4%
150,000 47,590 47,190 6,000 6,000 11,042 10,689 753 14 0.9% 43.1% 42.6%
175,000 57,590 57,190 7,000 7,000 13,792 13,439 753 14 0.8% 44.8% 44.4% Variations can arise due to rounding

B.1
1
EXAMPLE 6
Married couple, one income, two children, taxed under Schedule D (self-employed)
Gross Income
Income Tax PRSI Universal Social
Charge Total Change
Change as % of Net Income
Effective Tax Rate
Existing Proposed Existing Proposed Existing Proposed Per Year Per Week Existing Proposed
€ € € € € € € € € % %
12,000 0 0 500 500 0 0 0 0 0.0% 4.2% 4.2%
14,000 0 0 560 560 180 110 70 1 0.4% 5.3% 4.8%
18,000 0 0 720 720 300 210 90 2 0.4% 5.7% 5.2%
20,000 0 0 800 800 393 290 103 2 0.5% 6.0% 5.5%
25,000 150 0 1,000 1,000 668 540 278 5 1.0% 7.3% 6.2%
30,000 1,150 650 1,200 1,200 943 790 653 13 2.2% 11.0% 8.8%
35,000 2,150 1,650 1,400 1,400 1,218 1,040 678 13 2.0% 13.6% 11.7%
45,000 4,590 4,090 1,800 1,800 1,768 1,540 728 14 1.8% 18.1% 16.5%
55,000 8,590 8,090 2,200 2,200 2,318 2,040 778 15 1.7% 23.8% 22.4%
70,000 14,590 14,090 2,800 2,800 3,143 2,790 853 16 1.6% 29.3% 28.1%
100,000 26,590 26,090 4,000 4,000 5,542 5,189 853 16 1.3% 36.1% 35.3%
150,000 46,590 46,090 6,000 6,000 11,042 10,689 853 16 1.0% 42.4% 41.9%
175,000 56,590 56,090 7,000 7,000 13,792 13,439 853 16 0.8% 44.2% 43.7%
Variations can arise due to rounding

B.1
2
(ii) AVERAGE EFFECTIVE TAX RATES ON ANNUAL EARNINGS IN % TERMS* FULL RATE PRSI
FULL RATE PRSI
SINGLE
Gross Income €
2002
2003
2004
2005
2006
2007
2008
2009
2009 (s)/2010
2011
2012
2013
2014
2015
2016
2017
15,000
7.7%
6.8%
5.2%
3.2%
0.0%
0.0%
0.0%
0.0%
0.0%
2.7%
2.7%
2.7%
2.7%
1.9%
1.4%
0.9%
20,000
13.8%
13.1%
11.9%
8.4%
7.1%
5.1%
4.4%
5.4%
6.4%
9.8%
9.8%
11.1%
11.1%
10.2%
7.8% 7.2%
25,000
16.2%
15.7%
14.7%
13.5%
12.5%
10.9%
8.3%
9.3%
10.3%
14.0%
14.0%
15.1%
15.1%
14.4%
13.5% 13.0%
30,000
19.3%
18.9%
18.1%
16.0%
14.7%
13.4%
12.9%
13.9%
16.9%
16.8%
16.8%
17.7%
17.7%
17.1%
16.1% 15.6%
40,000
26.4%
26.1%
25.5%
24.0%
21.9%
19.7%
18.6%
19.1%
22.1%
24.2%
24.2%
24.8%
24.8%
23.7%
22.6% 22.1%
60,000
32.4%
32.3%
32.0%
31.1%
29.8%
28.1%
27.5%
28.2%
31.7%
33.4%
33.4%
33.9%
33.9%
32.8%
31.6% 31.1%
100,000
37.1%
37.0%
36.9%
36.3%
35.6%
34.2%
33.8%
34.6%
39.2%
40.9%
40.9%
41.1%
41.1%
40.4%
39.5% 39.1%
120,000
38.3%
38.2%
38.1%
37.6%
37.0%
35.7%
35.4%
36.5%
41.1%
42.7%
42.7%
42.9%
42.9%
42.3%
41.6% 41.3%

B.1
3
FULL RATE PRSI
MARRIED/CIVIL PARTNER ONE INCOME TWO CHILDREN
Gross Income €
2002
2003
2004
2005
2006
2007
2008
2009
2009 (s)/2010
2011
2012
2013
2014
2015
2016 2017
15,000
2.2%
2.2%
2.2%
2.2%
0.0%
0.0%
0.0%
0.0%
0.0%
2.7%
2.7%
2.7%
2.7%
1.9%
1.4% 0.9%
20,000
4.7%
4.7%
4.7%
2.7%
2.7%
2.7%
2.7%
3.7%
4.7%
6.3%
6.3%
7.6%
7.6%
6.7%
4.3% 3.7%
25,000
7.1%
6.5%
5.5%
4.9%
4.9%
4.9%
2.9%
3.9%
4.9%
7.2%
7.2%
8.3%
8.3%
7.6%
6.7% 6.2%
30,000
10.2%
9.8%
9.0%
7.8%
6.7%
5.1%
5.1%
6.1%
9.1%
8.6%
8.6%
9.5%
9.5%
8.9%
7.3% 6.6%
40,000
15.7%
15.5%
14.9%
13.2%
11.5%
10.2%
9.4%
10.4%
13.4%
14.2%
14.2%
14.9%
14.9%
14.5%
12.9% 12.1%
60,000
25.3%
25.1%
24.8%
23.9%
22.5%
20.8%
19.8%
20.5%
24.0%
26.2%
26.2%
26.6%
26.6%
25.7%
24.1% 23.5%
100,000
32.8%
32.8%
32.6%
32.0%
31.2%
29.7%
29.2%
30.0%
34.6%
36.5%
36.5%
36.8%
36.8%
36.1%
35.0% 34.6%
120,000
34.7%
34.6%
34.5%
34.0%
33.3%
32.0%
31.6%
32.6%
37.2%
39.1%
39.1%
39.3%
39.3%
38.8%
37.9% 37.5%
*Average Effective Tax Rates 2001-2010: Total of Income Tax, Levies (Income and Health) and PRSI as a proportion of gross income.
Average Effective Tax Rates 2011-2015: Total of Income Tax, PRSI and Universal Social Charge as a proportion of gross income.
Calculations only account for the standard employee credit, personal income tax credit and home carer credit where relevant.
(s)Supplementary Budget 2009

B.1
4
AVERAGE EFFECTIVE TAX RATES ON ANNUAL EARNINGS IN % TERMS*
SELF EMPLOYED
SELF EMPLOYED
SINGLE
Gross Income
€
2002
2003
2004
2005
2006
2007
2008
2009
2009 (s)/2010
2011
2012
2013
2014
2015
2016 2017
15,000
12.9%
12.9%
12.9%
12.5%
12.1%
11.3%
10.8%
10.8%
10.8%
15.7%
15.7%
15.7%
15.7%
14.9%
10.7% 7.6%
20,000
17.4%
17.4%
17.4%
15.1%
14.9%
14.2%
13.9%
14.9%
15.9%
19.3%
19.3%
19.3%
19.3%
18.5%
15.0% 12.5%
25,000
18.9%
18.9%
18.9%
18.7%
18.5%
18.0%
15.7%
16.7%
17.7%
21.7%
21.7%
21.7%
21.7%
21.0%
17.9% 15.8%
30,000
21.4%
21.4%
21.4%
20.2%
19.6%
19.1%
18.9%
19.9%
22.9%
23.2%
23.2%
23.2%
23.2%
22.6%
19.8% 18.0%
40,000
27.8%
27.8%
27.8%
26.9%
25.3%
23.8%
22.8%
23.3%
26.3%
29.0%
29.0%
29.0%
29.0%
27.8%
25.3% 23.8%
60,000
34.2%
34.2%
34.2%
33.6%
32.6%
31.2%
30.6%
31.2%
34.2%
36.6%
36.6%
36.6%
36.6%
35.6%
33.4% 32.2%
100,000
39.3%
39.3%
39.3%
39.0%
38.3%
37.1%
36.7%
37.5%
41.3%
42.8%
42.8%
42.8%
42.8%
42.0%
40.6% 39.8%
120,000
40.6%
40.6%
40.6%
40.3%
39.8%
38.7%
38.4%
39.4%
43.2%
44.8%
44.8%
44.8%
44.8%
44.2%
43.0% 42.4%

B.1
5
SELF EMPLOYED
MARRIED/CIVIL PARTNER ONE INCOME TWO CHILDREN
Gross Income
€
2002
2003
2004
2005
2006
2007
2008
2009
2009 (s)/2010
2011
2012
2013
2014
2015
2016 2017
15,000
3.0%
3.0%
3.0%
3.0%
3.0%
3.0%
3.0%
3.0%
3.0%
6.7%
6.7%
6.7%
6.7%
5.9%
5.4% 4.9%
20,000
6.0%
6.0%
6.0%
3.4%
3.0%
3.0%
3.0%
4.0%
5.0%
7.6%
7.6%
7.6%
7.6%
6.7%
6.0% 5.5%
25,000
9.8%
9.8%
9.8%
9.3%
8.9%
7.8%
4.8%
5.8%
6.8%
11.8%
11.8%
11.8%
11.8%
11.1%
7.3% 6.2%
30,000
12.3%
12.3%
12.3%
11.9%
11.6%
10.7%
9.8%
10.8%
13.8%
15.0%
15.0%
15.0%
15.0%
14.4%
11.0% 8.8%
40,000
17.1%
17.1%
17.1%
16.1%
14.9%
14.3%
13.6%
14.6%
17.6%
19.0%
19.0%
19.0%
19.0%
18.6%
15.6% 13.9%
60,000
27.1%
27.1%
27.1%
26.4%
25.3%
23.8%
22.9%
23.5%
26.5%
29.4%
29.4%
29.4%
29.4%
28.5%
26.0% 24.6%
100,000
35.1%
35.1%
35.1%
34.6%
34.0%
32.7%
32.1%
32.9%
36.7%
38.4%
38.4%
38.4%
38.4%
37.8%
36.1% 35.3%
120,000
37.0%
37.0%
37.0%
36.7%
36.1%
35.0%
34.5%
35.5%
39.4%
41.2%
41.2%
41.2%
41.2%
40.6%
39.3% 38.6%
*Average Effective Tax Rates 2001-2010: Total of Income Tax, Levies (Income and Health) and PRSI as a proportion of gross income.
Average Effective Tax Rates 2011-2015: Total of Income Tax, PRSI and Universal Social Charge as a proportion of gross income.
Calculations only account for the personal income tax credit and home carer credit, where relevant.
(s)Supplementary Budget 2009

B.1
6
(iii) ESTIMATED DISTRIBUTION OF INCOME EARNERS ON THE INCOME TAX FILE FOR 2016 AND 2017
Exempt (standard rate
liability covered by credits
or age exemption limits)
Paying tax at the standard
rate* (including those
whose liability at the
higher rate is fully offset
by credits)
Higher rate liability NOT
fully offset by credits Total
2016 918,400
37.3%
1,064,900
43.3%
476,900
19.4% 2,460,200
2017 on a post budget
basis
920,700
36.6%
1,079,500
42.9%
517,100
20.5% 2,517,300
Notes:
1. Distributions for 2017 are estimates from the Revenue tax-forecasting model using actual data for the year 2014, adjusted as necessary
for income and employment trends in the interim.
2. Figures are provisional and likely to be revised
3. A jointly assessed married couple/civil partnership is treated as one tax unit.

B.17
(iv) ILLUSTRATIVE CASES
These cases deal with basic personal tax credits, the employee tax credit, earned income tax credit, the home carer credit, the age credit, the age exemption limits, the standard rate bands, PRSI and the Universal Social Charge (USC). Social welfare payments such as the State Pension and Child Benefit are included, where relevant. Additional tax reliefs such as Mortgage Interest Relief and Rent Relief are not taken into account. Some figures are rounded to the nearest euro
Example 1
Ian and Jennifer are married. Jennifer is self-employed and earns €50,000 per annum. Ian works in the tourism industry and earns €40,000 per annum. They each pay pension contributions of 4.5% of gross income. The couple will see a gain of €855 in their annual net income due to this Budget
2016 2017
€ €
Gross Income
Pension Contributions
Taxable income
Income tax liability
PRSI liability
USC liability
Total tax liability
Net Income
Annual Gain
Change as a % of net income
90,000 4,050 85,950
15,360 3,600 3,536 22,496 63,454
90,000 4,050 85,950 14,960 3,600 3,081 21,641 64,309 855 1.35%

B.18
Example 2 Seamus is single and working full time on the minimum wage. Seamus will see a gain of €208 in his annual net income due to this Budget.
2016 2017
€ €
Gross Income 18,556 18,556
Minimum wage increase 203
New gross income 18,759
Income tax liability 411 452
PRSI liability 160 202
USC liability 317 229
Total tax liability 888 883
Net Income 17,668 17,876
Annual Gain 208
Change as a % of net income 1.18%

B.19
Example 3 Páraic and Joyce are married and have three children, Aoife, Oscar and Úna, all aged under 12.
Joyce has a part-time job and earns €6,500 per annum. Páraic is employed as a chef earning €40,000
per annum.The couple will see a gain of €303 in their annual net income due to this Budget.
2016 2017
€ €
Gross Income 46,500 46,500
Income tax liability 2,050 1,950
PRSI liability 1,600 1,600
USC liability 1,493 1,290
Total tax liability 5,143 4,840 Child Benefit 5,040 5,040 Net Income 46,397 46,700
Annual Gain 303
Change as a % of net income 0.65%

B.20
Example 4
Róisín is a self-employed entrepreneur earning €60,000. Róisín will see a gain of €703 in her annual net income due to this Budget.
2016 2017
€ €
Gross Income 60,000 60,000
Income tax liability 15,040 14,640
PRSI liability 2,400 2,400
USC liability 2,593 2,290
Total tax liability 20,033 19,330
Net Income 39,967 40,670
Annual Gain 703
Change as a % of net income 1.76%

B.21
Example 5 Alan and Ray are married with two children, Annemarie aged 10 and Rory aged 8. Alan is employed in the retail sector earning €36,000. Ray works in the family home. The family will see a gain of €283 in their annual net income due to this Budget.
2016 2017
€ €
Gross Income 36,000 36,000
Income tax liability 1,250 1,150
PRSI liability 1,440 1,440 USC liability 1,273 1,090
Total tax liability 3,963 3,680
Child Benefit 3,360 3,360
Net Income 35,397 35,680
Annual Gain 283
Change as a % of net income 0.8%

B.22
Example 6 Gareth and Heather are married with three children, Georgia, Grace and Conor, who are aged 6, 8 and 10 years. Gareth is self-employed and earns €50,000. Heather works in the family home. The family will see a gain of €753 in their annual net income due to this Budget
2016 2017
€ €
Gross Income 50,000 50,000
Income tax liability 6,590 6,090
PRSI liability 2,000 2,000 USC liability 2,043 1,790
Total tax liability 10,633 9,880
Child Benefit 5,040 5,040
Net Income 44,407 45,160
Annual Gain 753
Change as a % of net income 1.7%
B.23
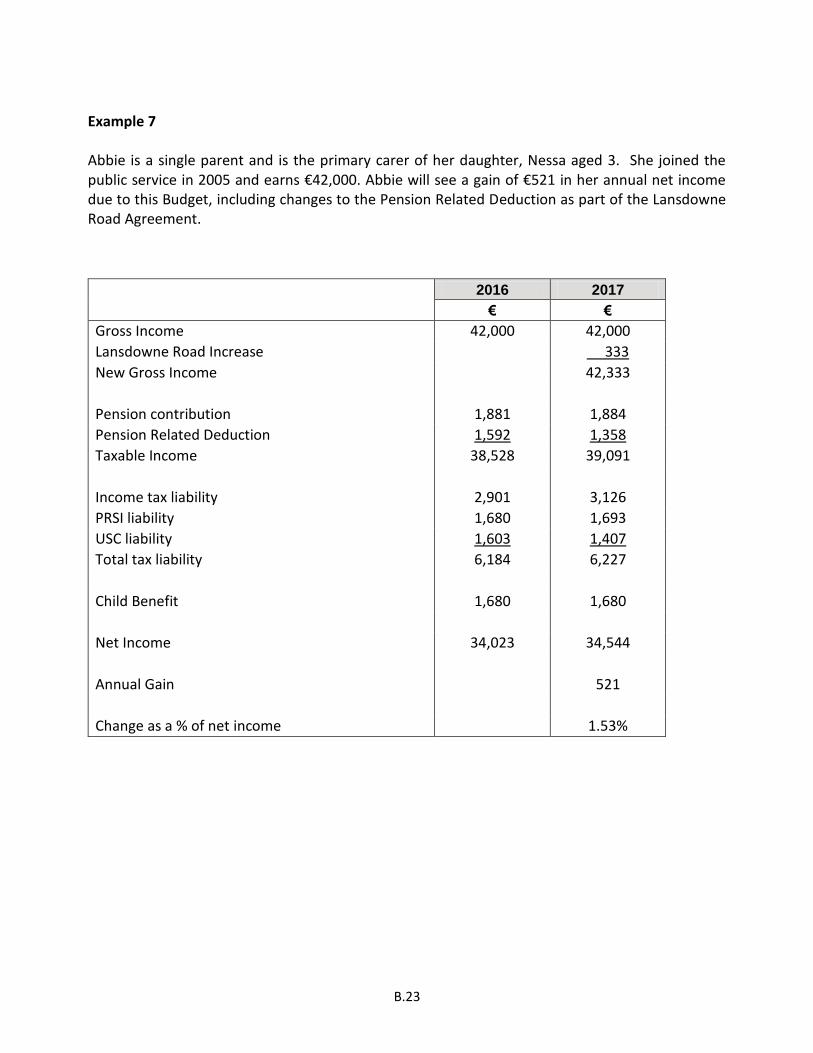
Example 7 Abbie is a single parent and is the primary carer of her daughter, Nessa aged 3. She joined the public service in 2005 and earns €42,000. Abbie will see a gain of €521 in her annual net income due to this Budget, including changes to the Pension Related Deduction as part of the Lansdowne Road Agreement.
2016 2017
€ €
Gross Income 42,000 42,000
Lansdowne Road Increase 333
New Gross Income 42,333
Pension contribution 1,881 1,884
Pension Related Deduction 1,592 1,358
Taxable Income 38,528 39,091
Income tax liability 2,901 3,126
PRSI liability 1,680 1,693
USC liability 1,603 1,407
Total tax liability 6,184 6,227
Child Benefit 1,680 1,680
Net Income 34,023 34,544
Annual Gain 521
Change as a % of net income 1.53%

B.24
Example 8
Dónal is 72 and receives the full Contributory State Pension in addition to an occupational pension of €15,000 per annum. Donal will see a gain of €247 in his annual net income due to this Budget.
2016 2017
€ €
Occupational Pension 15,000 15,000
Contributory Old Age Pension* 12,132 12,347
Total Income 27,132 27,347
Income tax liability 1,881 1,924
PRSI liability 0 0
USC liability 210 135
Total tax liability 2,091 2,059
Net Income 25,041 25,288
Annual Gain 247
Change as a % of net income 0.99% *2017 State Pension assumes rate of €233.30 for 9 weeks and €238.30 for 43 weeks

B.25
ANNEX B
Income Tax and Progressivity Issues
Introduction In a recent study2 the OECD set out a range of channels through which taxes can affect the income distribution. These included:
reducing higher incomes to a greater extent than lower incomes,
redistributing to lower incomes,
financing public spending which reduces inequality,
redistributing income across an individual’s life-cycle, and
impacting labour market participation and education decisions.
This annex considers the role of the first two of these, in particular focusing on the progressivity in the Irish income tax system. Under a progressive income tax, the proportion of income paid in tax rises as income rises. This progressivity causes those on higher incomes to pay proportionately more of their income in tax than those on lower incomes.
Context – Income Distribution in Ireland The Gini coefficient is a measure of the distribution of income where 0 represents a situation where all households have an equal income and 1 indicates that one household has all national income. The Gini coefficients presented here are on the basis of equivalised household income.3
Source: Eurostat [ilc_di12]
2 Brys, Bert, et al. (2016) "Tax Design for Inclusive Economic Growth." OECD Taxation Working Papers, No. 26 3 Equivalisation adjusts household income on the basis of household size and composition. Eurostat uses a scale of 1 for the first adult, 0.5 for subsequent adults and 0.3 for children (aged under 14). In this way the income of all households is expressed in the same terms. A single adult household with an actual income of 100 (100 ÷ 1 = 100) is said to have the same equivalised income as a two adult household with an income of 150 (150 ÷ {1+0.5} =100).
0.00
0.05
0.10
0.15
0.20
0.25
0.30
0.35
0.40
0.45
0.50
Gin
i Co
effi
cien
t
Gini coefficient of equivalised income
EU 15 - Disposable Income Ireland - Disposable Income
EU 15 - Market Income Ireland - Market Income

B.26
Using Eurostat data, it is possible to compare Ireland’s Gini coefficient since 1995 to that for the then EU 15 member states. As shown above, for both Ireland and the EU 15, the Gini coefficient for disposable income has been remarkably stable, with inequality measured on this basis in Ireland close to that of the EU 15 over the entire period. For the second half of the 1990s, the dispersion of incomes in Ireland was slightly greater than the EU-15 figure with the gap narrowing after 2000. For more recent years up to and including 2014, the Gini coefficient in Ireland has been more or less the same as for the EU-15.
It should be noted that the Gini coefficient for market income – household income before taxes and transfers are accounted for – is considerably higher than for disposable income, both for the EU-15 and particularly for Ireland. In Ireland, this difference grew substantially when the economy contracted post-2007. The difference between the market and disposable income measures indicates the strong redistributive character of the Irish tax and welfare systems.
Reduction in Income Inequality through the Tax and Welfare Systems Using OECD data, the extent to which taxation and welfare respectively contribute to the narrowing of the income distribution, measured by the reduction from the initial market Gini coefficient, can be examined.4
The graph below shows that from 2004 to 2007, the Gini for market income in Ireland was stable. Following a step increase in 2009, the market Gini held steady at a higher level. In a similar pattern, the redistributive impact of tax and welfare systems also experienced a step change which counteracted the increase in the market Gini. Reflecting these developments, the Gini for disposable income (after taxes and transfers) held at a slightly lower level more recently. As is evident from the graph the welfare system makes a greater contribution than the tax system in reducing income inequality. This is also the case across the OECD.
Source: OECD, Income Distribution and Poverty Dataset
4 The OECD’s equivalence scale differs slightly from the one used by Eurostat and the Central Statistics Office.
-0.3
-0.2
-0.1
0
0.1
0.2
0.3
0.4
0.5
0.6
2004 2005 2006 2007 2008 2009 2010 2011 2012 2013
Composition of Gini Coefficient
Market Gini Welfare Redistribution Tax Redistribution Final Gini

B.27
The latest OECD data (2013) show that Ireland had the largest absolute reduction in the Gini coefficient between market and disposable income among the 29 OECD countries for which data are available. The Irish tax and welfare systems reduced the initial market Gini by nearly half (-46%) from 0.58 to a disposable income Gini of 0.31. Finland was the only country with a proportionately greater reduction in the Gini coefficient (-47%). Over one quarter (27%) of the reduction in Ireland in 2013 was attributable to the tax system, a proportion exceeded in only seven OECD countries. The absolute size of the reduction in the Gini coefficient due to tax in Ireland was the largest in the OECD.
Source: OECD, Income Distribution and Poverty Dataset
When looked at over a slightly longer time period and taking a more limited sample of countries for which data are available, it is evident that Ireland’s tax system has consistently reduced the Gini coefficient to greater extent than is the case with tax systems in other OECD countries (see below). The absolute contribution of the tax system to narrowing the dispersion of incomes has been increasing since 2004 both in Ireland and in the 16 other OECD countries for which the data are available. In proportionate terms, the relative contribution of the tax system has been increasing in Ireland since 2008 but has not changed in the 16 other OECD countries.
Source: Department of Finance Analysis of OECD Income Distribution and Poverty Dataset
-0.1
93
-0.0
73
-0.3
-0.25
-0.2
-0.15
-0.1
-0.05
0
Reduction in Gini Coefficient due to Tax & Welfare 2013
Redistribution due to Welfare Redistribution due to Tax
-0.0
37
-0.0
73
-0.080
-0.070
-0.060
-0.050
-0.040
-0.030
-0.020
-0.010
0.000
2004 2005 2006 2007 2008 2009 2010 2011 2012 2013
Reduction in the Gini Coefficient due to Taxation
OECD-16 Ireland

B.28
Factors which determine the reduction in the Gini coefficient include the initial distribution of income and the progressivity of the taxation system. Progressivity of the Income Tax System The following chart demonstrates the evolution of the progressivity of the income tax system since 1997 by highlighting the average tax rate (ATR) at different income levels. The gross incomes are adjusted using the Consumer Price Index so that the value of a euro of income is equivalent in each year. Over 1997-2009, the income tax system became more progressive, as ATRs dropped more steeply for lower incomes than higher incomes. Since 2009, ATRs have increased more for higher incomes, again raising the system’s progressivity. The slope of the ATR as gross incomes increase, is generally steeper in 2016 than in earlier years. This is particularly notable at higher levels of gross income and broadly indicates that the income tax system in Ireland has become more progressive since 1997.
Source: Budget Books, Central Statistics Office and Department of Finance analysis
Looking at 2016 in particular, it can be seen that the ATR increases from 1.4% at gross incomes of €15,000 to 41.6% at €120,000. The change in the average rate of income tax makes up the largest part of the increase in overall ATR, reflecting tax credits and the higher rates applicable on income tax. As indicated by the relative steepness of the respective lines, the greatest rate of progressivity can be seen in income tax, then USC (which makes up an increasing proportion of progressivity at higher incomes) and then Employee PRSI.
0%
5%
10%
15%
20%
25%
30%
35%
40%
45%
50%
- 20,000 40,000 60,000 80,000 100,000 120,000 140,000 160,000
Ave
rage
Tax
Rat
e
Gross Income € in December 2011 Prices (CPI adjusted)
Average Tax Rates by Year, Single Full Rate PRSI
1997 2001 2009 2016

B.29
Source: Budget Books, Central Statistics Office and Department of Finance analysis
A similar picture emerges when the measure of income tax progressivity developed by the OECD is used. This measure compares the ratio of the tax wedge5 of individuals on 167% of the average wage and on 67% of the average wage. 6 On this basis, estimates using OECD data show that with a score of 1.79 Ireland had the second highest progressivity outcome of OECD member countries in 2015 and the highest among EU members.
Source: Department of Finance Analysis of OECD Taxing Wages - Comparative tables
5 The tax wedge is defined by the OECD as the sum of personal income tax, employee and employer social security contributions plus any payroll tax less cash transfers, expressed as a percentage of labour costs. 6 Based on average earnings in Ireland of €34,800 the OECD measure compares the ratio of the tax wedges of individuals earning approximately €58,200 to €23,300.
0%
5%
10%
15%
20%
25%
30%
35%
40%
45%
50%
0 20,000 40,000 60,000 80,000 100,000 120,000
Ave
rage
Tax
Rat
e
Gross Income € in 2016
Average Tax Rates - Composition 2016
Income Tax Employee PRSI
USC Total Direct Tax
1.79
1.26
0.00
0.50
1.00
1.50
2.00
2.50
Isra
el
Irel
and
Ne
w Z
eal
and
Mex
ico
Au
stra
lia
Luxe
mb
ou
rg
Un
ited
Kin
gdo
m
Swit
zerl
and
Gre
ece
Ne
the
rlan
ds
Po
rtu
gal
Ital
y
Fin
lan
d
Ko
rea
Ice
lan
d
OEC
D -
Ave
rage
No
rway
Can
ada
Swe
de
n
Fran
ce
De
nm
ark
Un
ited
Sta
tes
Spai
n
Be
lgiu
m
Slo
ven
ia
Turk
ey
Au
stri
a
Ch
ile
Ge
rman
y
Jap
an
Cze
ch R
ep
ub
lic
Slo
vak
Re
pu
blic
Po
lan
d
Esto
nia
Hu
nga
ry
OECD Progressivity Measure - Ratio of tax wedges at 167% and 67% of Average Wage, 2015

B.30
It should be borne in mind that these comparisons are based on tax rates as set out in the income tax schedule and do not take account of income tax expenditures, for example in respect of pension contributions, which have the effect of reducing the final tax paid. Effective tax rates and the effective tax wedge are likely to be lower which would be expected to result in reduced progressivity as the greater tax liabilities of higher earners have a larger potential to be reduced. This difference between the rates set out in the income tax schedule and effective rates actually paid will exist in all countries with income tax expenditures. Perceptions of Progressivity It is also worth noting that there is evidence that people state different preferences regarding how progressive the tax system should be depending on whether tax liabilities are described in absolute or in relative terms. When asked how much tax should be paid at different income levels, people appear to favour more progressivity when they express liabilities as a percentage of income rather than if describing them in absolute terms (in euro terms) because they perceive percentage terms to be less progressive than euro terms (McCaffery and Baron, 2006)7. This implies that that the existing tax system will be perceived as more progressive when described in euro terms and more regressive when described in percentage terms. Summary This annex has sought to address some of the channels through which taxes can affect the income distribution. While acknowledging the necessarily static nature of the results (for example the analyses do not take into account redistribution and progressivity on a lifetime basis), it is evident that, compared to other countries, the Irish tax and welfare systems contribute substantially to the redistribution of income and a reduction in income inequality. The income tax system has become more progressive over time and ranks as one of the most progressive in the OECD.
7 McCaffery, E. J., & Baron, J. (2006). Thinking about tax. Psychology, Public Policy, and Law, 12(1), 106.

B.31
ANNEX C
Review of the Corporation Tax Code by an independent expert
Appointment of an independent expert
On 2 September, the Government decided to arrange for a review of Ireland’s corporation tax code by an independent expert to be appointed by the Minister for Finance. The Minister has decided to appoint Mr. Seamus Coffey to undertake the review.
Terms of Reference
The review of the corporation tax code shall be conducted by an independent expert, to be
appointed by the Minister for Finance, in respect of the following matters:
achieving the highest international standards in tax transparency, including in the automatic
exchange of information on tax rulings with other relevant jurisdictions, having regard to
benefits which may accrue to developing countries from enhancing global tax transparency;
ensuring that the corporation tax code does not provide preferential treatment to any
taxpayer;
further implementing Ireland’s commitments under the Organisation for Economic Co-
operation and Development’s Base Erosion and Profit Shifting (BEPS) project to tackle
harmful tax competition and aggressive tax planning;
delivering tax certainty for business and maintaining the competitiveness of Ireland’s
corporation tax offering; and,
maintaining the 12.5% rate of corporation tax.
The review shall make recommendations to the Minister for Finance by the end of the second
quarter of 2017.
The Department of Finance may, as required, facilitate a public consultation with citizens, civil
society and stakeholders on any or all of the matters under review.

B.32
ANNEX D
Help to Buy
Background As a complement to the structural actions in the Action Plan for Housing and Homelessness published on 19th July 2016, the launch of a new tax-based 'Help to Buy' incentive in the Budget was announced.
This Help to Buy incentive is aimed at assisting first time buyers of new homes to fund the deposit required under the Central Bank macro-prudential rules. It will also assist those looking to build once-off houses for their own occupation.
Outline of the Incentive
The incentive will take the form of a rebate of income tax paid over the previous four tax years as
a contribution to the deposit needed to fund the purchase of a new home.
The maximum rebate available will be up to 5% of the purchase price of a new home valued at up
to €400,000. Where a new homes is valued between €400,000 and €600,000, the maximum rebate
(i.e. €20,000) will continue to be available. No rebate will be available for new purchases costing
over €600,000.
The amount of rebate available to an applicant is calculated based on their total income tax
(including DIRT) paid over the previous four tax years. No refund of USC will be available.
The property (house or apartment) must be a new build or a self-build. It must be purchased or
built as the applicant’s principal private residence. The relief is not available for buy-to-let
properties.
In order to qualify, applicants must take out a mortgage of at least 80% of the purchase price, or in
the case of a self-build, 80% of the valuation approved by the mortgage provider. Individuals who
are in a position to avail of a mortgage at a lower loan to value ratio than 80% already have sufficient
resources to more than meet the deposit requirements of the macro-prudential rules and thus are
less in need of assistance from the Exchequer.
This incentive will be open to applicants who have signed contracts to purchase their home on or
after 19 July 2016. In the case of a self-build, applicants who drew down the first tranche of their
mortgage on or after 19 July 2016 will also be eligible. This was the date of the launch of ‘Rebuilding
Ireland: Action Plan for Housing and Homelessness’. The backdating of this incentive was
announced at that time with a view to avoiding any potential interruption in house sales, by
purchasers who may otherwise have deferred purchases, pending the commencement of the
incentive. The incentive is scheduled to run until the end of 2019.

B.33
Additional Information To be eligible for the incentive, you must be a First Time Buyer (FTB). If you have purchased a house before, you will not be eligible for the incentive.
The maximum amount of rebate available is €20,000 per property. This can be made up of the
income tax (including DIRT) paid over the previous four years by an individual or by joint purchasers.
In line with the Central Bank macro-prudential rules, a joint purchase between a FTB and a non-FTB will not be eligible for the incentive.
With a view towards incentivising the additional supply of homes, the rebate will only be available
in respect of newly built property.
Self-builds are included in the incentive, although they still must meet all the other conditions as
set out by the incentive, including the requirement to take out a mortgage of at least 80% of the
valuation of the property.
Applicants will be able to apply online via the Revenue website to see how much of a rebate they
could be entitled to under the scheme. It is expected that the electronic facility to avail of this
scheme will be available from January 2017. Rebates in respect of eligible purchases made between
19 July 2016 and 31 December 2016 can also be processed from January 2017.
Some individuals may not qualify for the incentive. As with all time limited or targeted reliefs, there will always be those who just miss out. This incentive prioritises those who are struggling to raise sufficient deposits in order to purchase their first home. Any extension of the parameters of this measure could make it less targeted and indeed significantly more costly to the Exchequer.
Examples of potential applications under the Help to Buy
Example 1 Rose and Charlie signed a contract to buy a new house for €300,000 from a developer in August 2016. They paid a deposit of €38,000, in line with the minimum deposit requirement under the Central Bank macro-prudential rules. As their contract with the developer to purchase the property was put in place after 19 July 2016, they are eligible to apply to Revenue for the Help to Buy scheme, when applications begin to be accepted from January 2017. This may see them qualify for a rebate of income tax paid over the previous four years up to a maximum of 5% of the purchase price of the property, which equates to €15,000.
Example 2
Mairead and James are hoping to purchase their first home, a newly-built apartment priced at €280,000. Under the Central Bank rules they will require a minimum deposit of €34,000, which comprises €22,000 (10% of the first €220,000) and €12,000 (20% of the additional €60,000). Under the Help to Buy initiative, as first time purchasers they would be eligible for a refund of income tax paid over the previous four years of 5% of the purchase price of the property. Assuming they have

B.34
paid sufficient income tax over the previous four years, this would equate to €14,000. They can use this as part of their deposit when signing the contract to purchase their new apartment.
Example 3 Denise and Noel are looking to buy a home together valued at €350,000. Noel is a first time purchaser but Denise has bought a house previously. If they are buying the property jointly they would not qualify for the Help to Buy scheme as Denise has previously owned a house. Example 4 Deirdre and Evan are planning to self-build their own home in 2017. They estimate that the value of the home will be €375,000 when completed. For this, provided they have paid sufficient income tax over the previous four years and they are taking out a minimum 80% mortgage, they will qualify for a rebate under the Help to Buy scheme of €18,750. Example 5 Adam and Cillian are hoping to buy a newly-built house priced at €530,000. As first time purchasers they should qualify for the Help to Buy scheme provided they have paid income tax in the previous four years. However, as the property they hope to buy is over the €400,000 limit, the maximum rebate they can hope to receive under the scheme is €20,000. Example 6 Amy is looking to buy her first property. The home she is considering is a new build priced at €680,000. As this is over the threshold for the Help to Buy scheme she will not qualify. Example 7 Tom and Mary signed a contract to purchase a newly built home off the plans in May 2016. Neither of them have purchased a property before. They paid the deposit on the house at the time of contract signing but the developer is still constructing the estate and they have not moved into their new home. As they signed the contract to purchase their property prior to 19 July 2016, they will not qualify for the Help to Buy incentive. Example 8 Simon is purchasing a second-hand home. Unfortunately, as this is not a new build it does not qualify for the Help to Buy incentive. Example 9 Katherine is purchasing a new build home, at a value of €300,000. Katherine is not taking out a mortgage and is paying in cash. As such, she does not qualify for the Help to Buy incentive.
Related Documents