BIOMA$$ Dale Cowan Senior Agronomist, AGRIS Cooperative Peter Johnson Cereal Specialist, OMAF/MRA Buck$ or Bunk?

Welcome message from author
This document is posted to help you gain knowledge. Please leave a comment to let me know what you think about it! Share it to your friends and learn new things together.
Transcript
BIOMA$$
Dale Cowan Senior Agronomist, AGRIS Cooperative
Peter Johnson Cereal Specialist, OMAF/MRA
Buck$ or Bunk?
Emerging Opportunity on Crop Biomass
• Emerging market to use crop residues and purpose grown crops for cellulosic ethanol and sugar
• Cellulosic sugar can be used to produce higher value “Green Chemicals” that otherwise would come from crude oil
• Succinic acid • Proposed plant in Sarnia to convert sugars to
succinic acid • End users lined up to use the final product

http://www.youtube.com/watch?v=9_ItEhCrLoQ&list=PLE2DBD6E94D67397B


Project Overview • A project was undertaken last year by OFA • Collect information on baling corn stover • 3 sites and cooperators • One contractor • Field operation costs –cutting, raking, baling • Yields- stacks covered and uncovered • Stover Content- tested every 2 months • Testing Stover for sugar yields • Economic assessment and business case
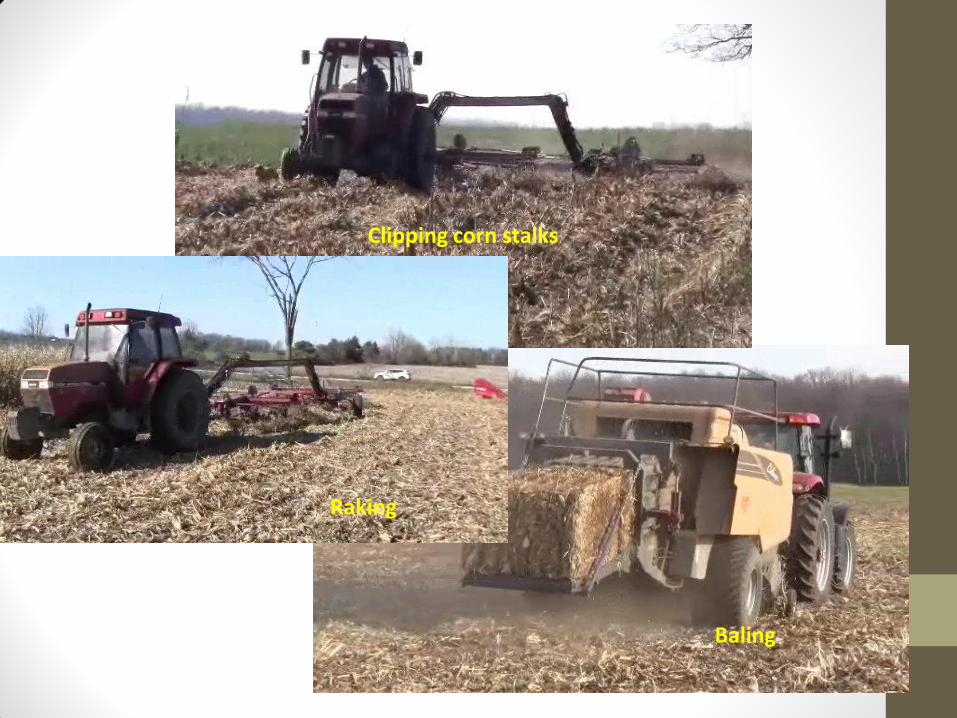
Clipping corn stalks
Baling
Raking

Spring harvest Site 2 and 3 : 10 Wheel V Rake - 18 foot swath
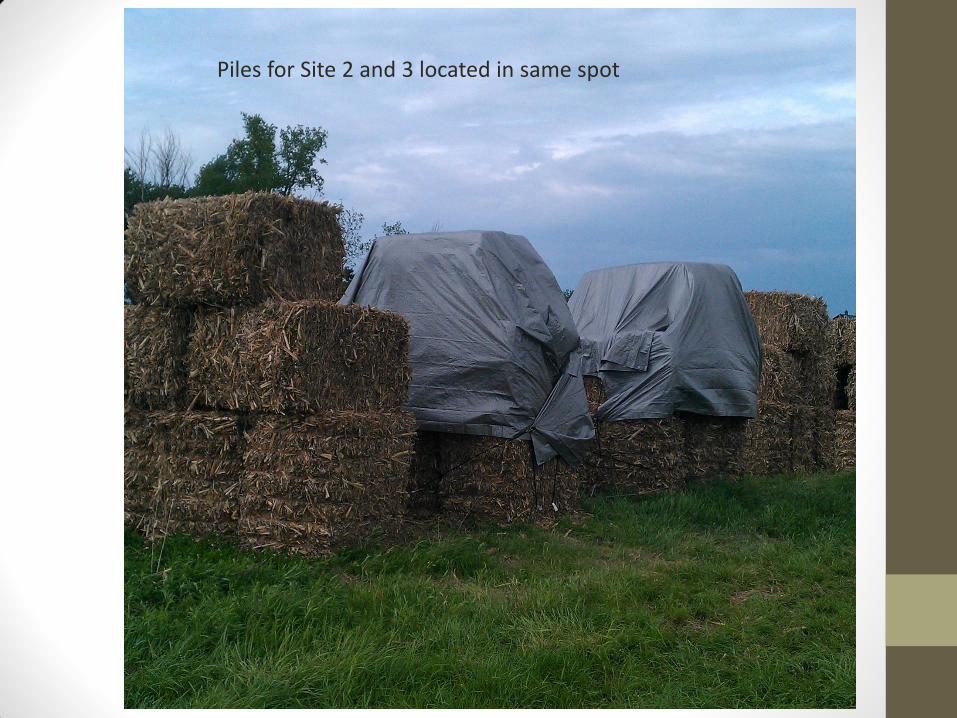
Piles for Site 2 and 3 located in same spot
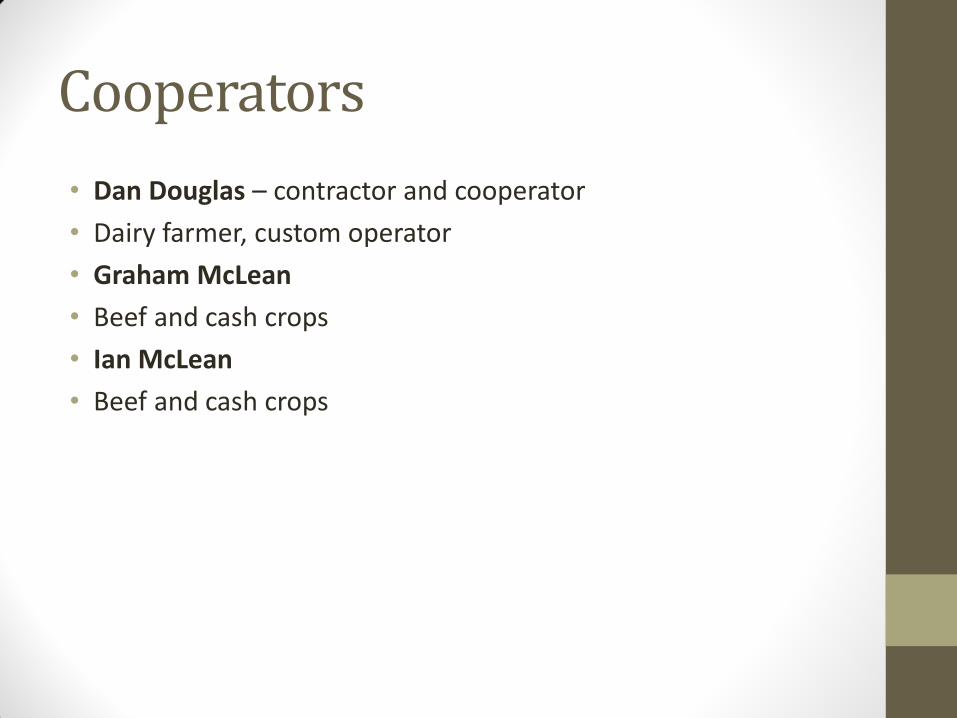
Cooperators • Dan Douglas – contractor and cooperator • Dairy farmer, custom operator • Graham McLean • Beef and cash crops • Ian McLean • Beef and cash crops

What questions would you have?
• If a person knocked on your door and wanted to buy your cornstalks? • Agronomic? • Economic? • Logistical? • Sustaining soil quality?
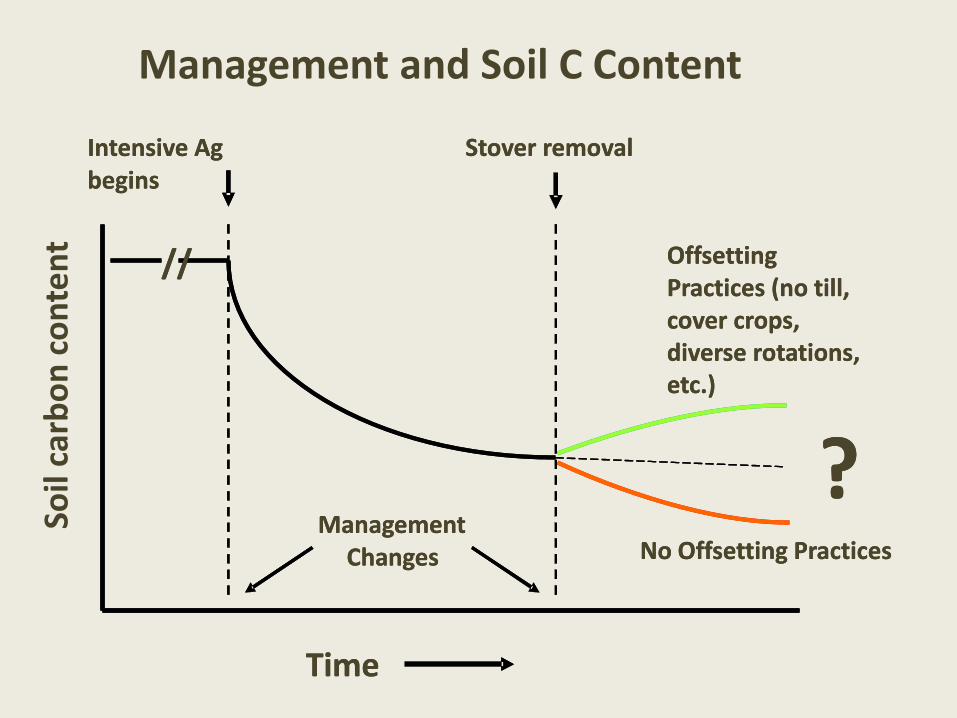
Management and Soil C Content
//
Intensive Ag begins
Management Changes
Stover removal
Offsetting Practices (no till, cover crops, diverse rotations, etc.)
No Offsetting Practices
Time
?
Soil
carb
on c
onte
nt
//
Intensive Ag begins
Management Changes
Stover removal
Offsetting Practices (no till, cover crops, diverse rotations, etc.)
No Offsetting Practices
Time
?

How much stover do you have? • How would you calculate that ?
• Yield index • Above ground? • What is below ground? • What yields did you get from the project?
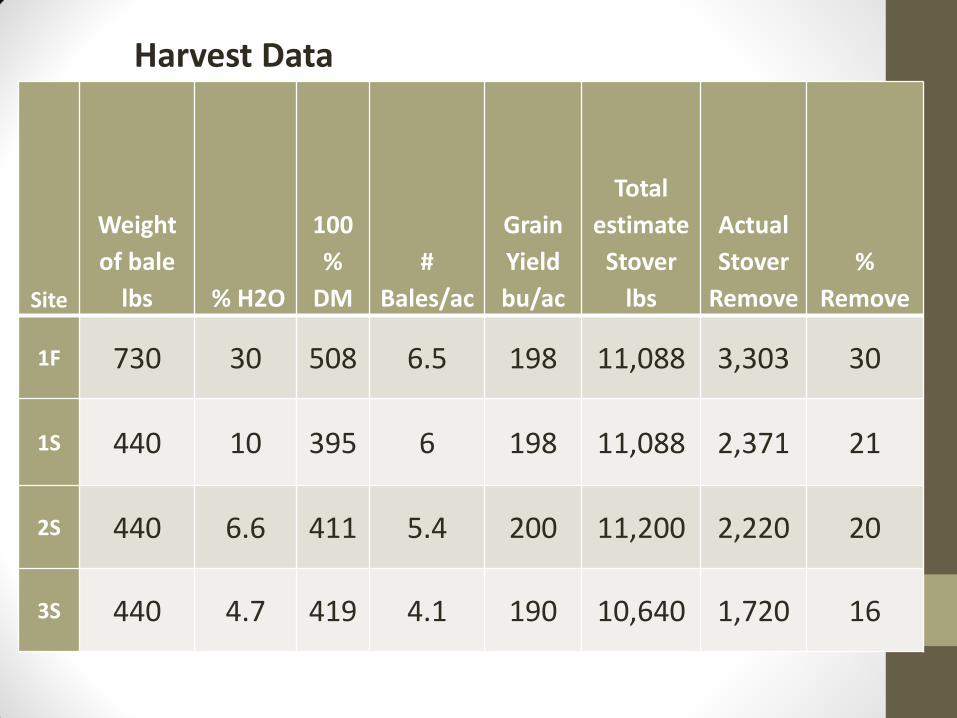
Site
Weight of bale
lbs % H2O
100%
DM #
Bales/ac
Grain Yield bu/ac
Total estimate
Stover lbs
Actual Stover
Remove %
Remove
1F 730 30 508 6.5 198 11,088 3,303 30
1S 440 10 395 6 198 11,088 2,371 21
2S 440 6.6 411 5.4 200 11,200 2,220 20
3S 440 4.7 419 4.1 190 10,640 1,720 16
Harvest Data
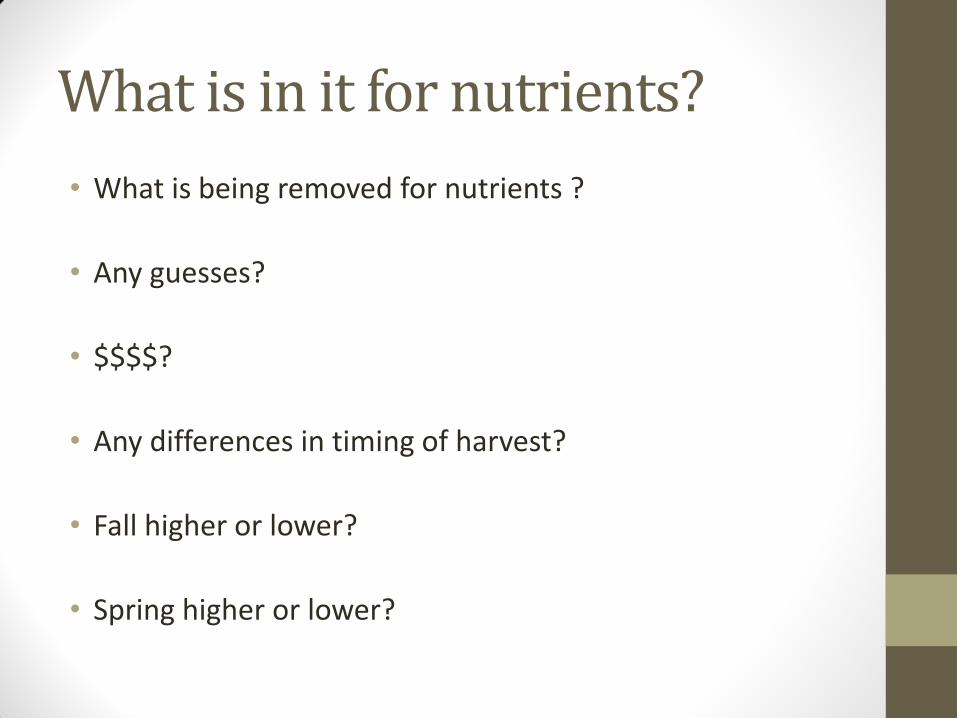
What is in it for nutrients? • What is being removed for nutrients ?
• Any guesses?
• $$$$?
• Any differences in timing of harvest?
• Fall higher or lower?
• Spring higher or lower?
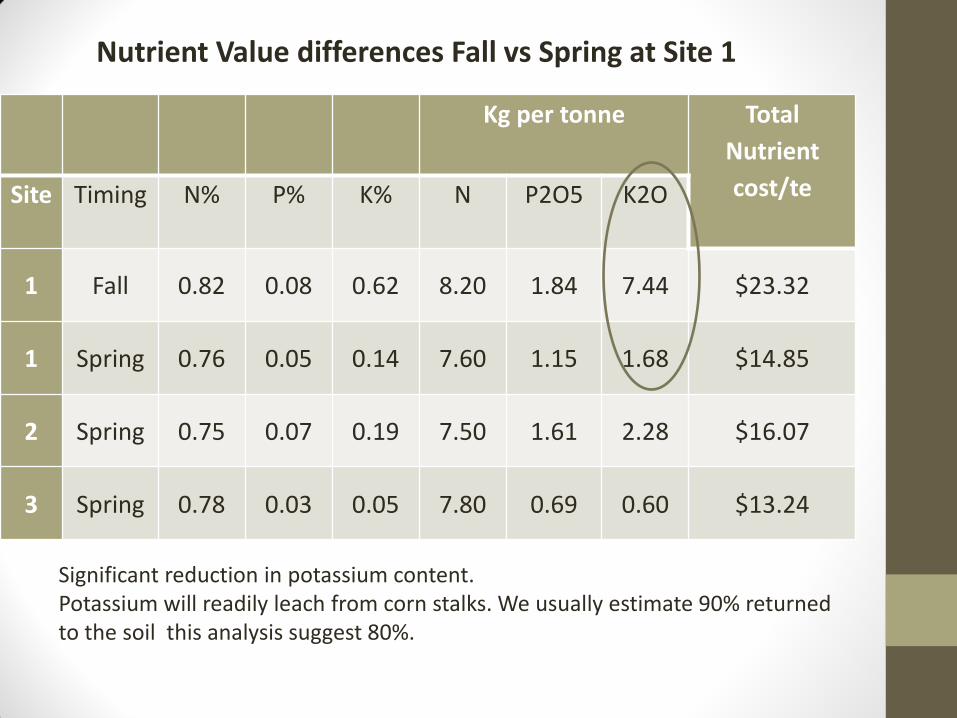
Nutrient Value differences Fall vs Spring at Site 1
Significant reduction in potassium content. Potassium will readily leach from corn stalks. We usually estimate 90% returned to the soil this analysis suggest 80%.
Kg per tonne Total Nutrient cost/te Site Timing N% P% K% N P2O5 K2O
1 Fall 0.82 0.08 0.62 8.20 1.84 7.44 $23.32
1 Spring 0.76 0.05 0.14 7.60 1.15 1.68 $14.85
2 Spring 0.75 0.07 0.19 7.50 1.61 2.28 $16.07
3 Spring 0.78 0.03 0.05 7.80 0.69 0.60 $13.24

What does the field look like after harvest?
• How many trips over the field?
• Soil conditions?
• What if it is too wet?
• What were the experiences in this project?

Site 2 & 3: no till planted to soybeans right after bales were removed
Dry soil conditions carried equipment well
Sustaining soil quality • How much soil organic matter (SOM) is lost each year?
• What are your answers?
• How do I calculate the amount of SOM I may have?
• Soil test results
• Do the math- 4% SOM How much and what is the annual
loss?

Sustainability – Impact on Soil Organic Matter (SOM)
Site Grain Yield
bushels Total
Stover lbs Harvest
Removal lbs
Est soil OM loss lbs/acre
Gain or (loss)
lbs/acre
Breakeven removal
lbs/ac
1 198 9300 3,300 1,200 0 3300
2 202 9558 2,219 1,140 327 3854
3 190 8906 1,719 1,050 389 3664

What does poor soil quality look like?
• Drainage • Ponding • Compacted • Crusted • Slow to dry • Delayed planting • Lumpy seed bed • More replants • Uneven crops • Delayed maturity • Yearly yield swings • Low yields
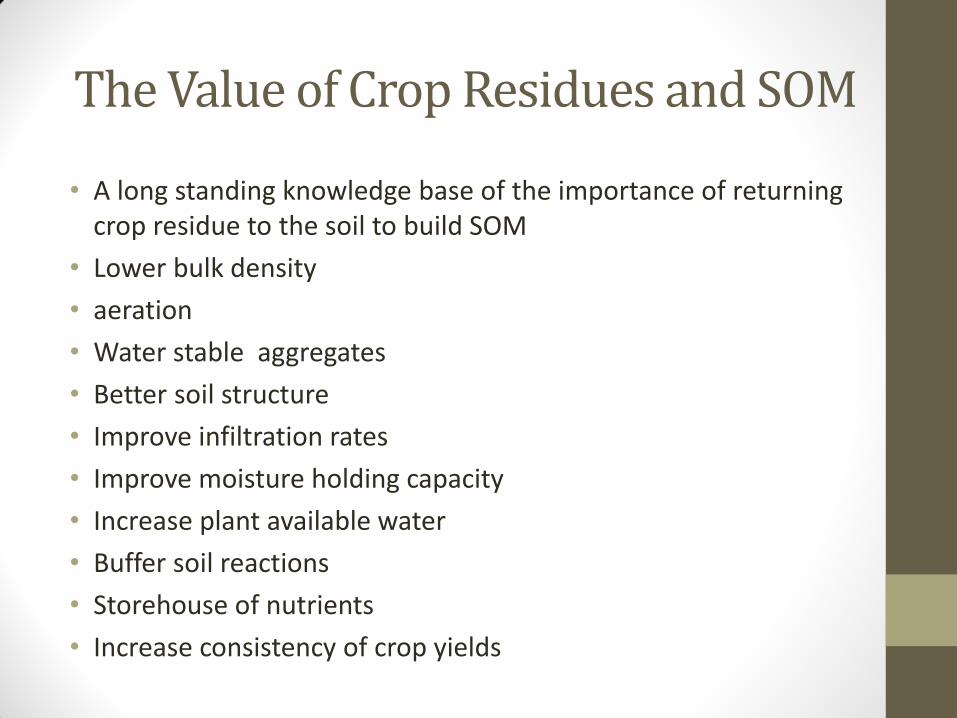
The Value of Crop Residues and SOM
• A long standing knowledge base of the importance of returning crop residue to the soil to build SOM
• Lower bulk density • aeration • Water stable aggregates • Better soil structure • Improve infiltration rates • Improve moisture holding capacity • Increase plant available water • Buffer soil reactions • Storehouse of nutrients • Increase consistency of crop yields

Sustainability –Value of SOM • Total potential Stover yields calculated by using Yield
Indexes (0.5) • Annual loss of SOM varies 0.5 to 3% • Retention of crop residues and other organic wastes
are 10 to 20% • Soil with 3% SOM would lose 300 lbs to 1800 lbs per
acre each year • 1000 lbs of residue would result in retention of 100 to
200 lbs of SOM • Therefore to maintain SOM at 3% at 1.5% loss and
using 15% retention requires 6000 lbs per acre of residue each year to sustain present levels
Sustainability – Impact on Soil Organic Matter (SOM)
Site Grain Yield
bushels Total
Stover lbs Harvest
Removal lbs
Est soil OM loss lbs/acre
Gain or (loss)
lbs/acre
Breakeven removal
lbs/ac
1 198 9300 3,300 1,200 0 3300
2 202 9558 2,219 1,140 327 3854
3 190 8906 1,719 1,050 389 3664

Accounting for all the biomass • Above ground residue estimated by yield
index of 0.5 • At 0.5 yield index every pound of grain
represents a pound of stover • Corn has equal biomass below ground • Soybeans have 20% more ( 2700+ 3240) • Winter Wheat has 60% more below
ground (5400+ 8640)

Value of Crop Rotation • Corn, Soybeans, Winter Wheat • Continuous corn • Soybeans and wheat • Value of living roots for long periods of time in the crop
rotation • New thinking is considering that crop residues are rather short
term affect in building SOM in the long term (4 to 5 years) • The compounds produced from root exudates may account for
half of the active SOM • Some lignin is consumed in one year • Some simple sugars last decades • Current thinking is lignin last forever and sugars are consumed
by soil bacteria and fungi rather quickly
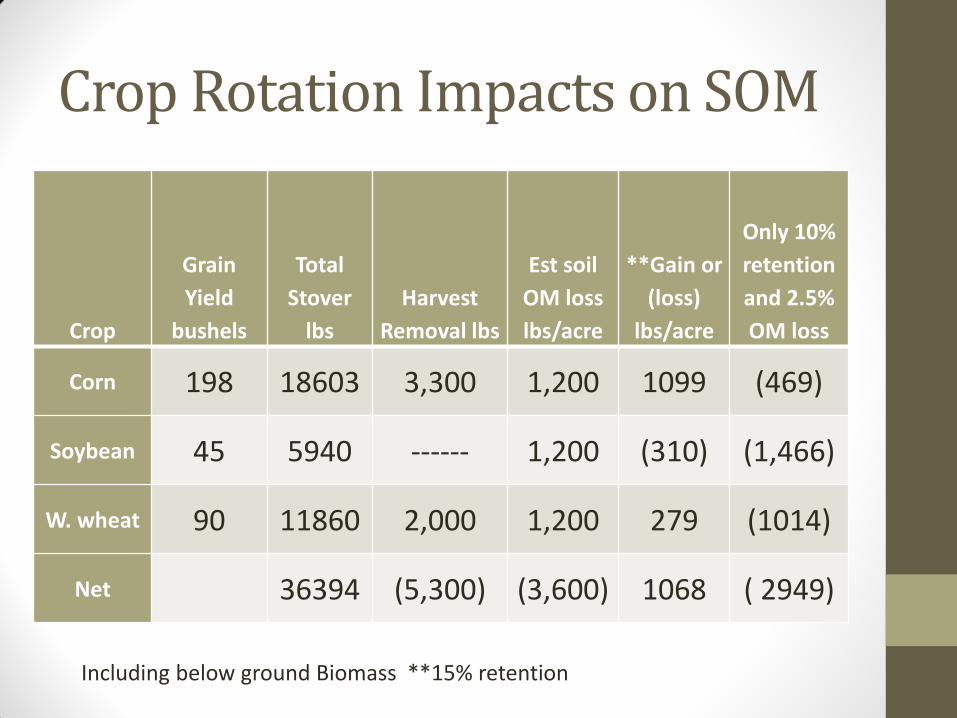
Crop Rotation Impacts on SOM
Including below ground Biomass **15% retention
Crop
Grain Yield
bushels
Total Stover
lbs Harvest
Removal lbs
Est soil OM loss lbs/acre
**Gain or (loss)
lbs/acre
Only 10% retention and 2.5% OM loss
Corn 198 18603 3,300 1,200 1099 (469)
Soybean 45 5940 ------ 1,200 (310) (1,466)
W. wheat 90 11860 2,000 1,200 279 (1014)
Net 36394 (5,300) (3,600) 1068 ( 2949)
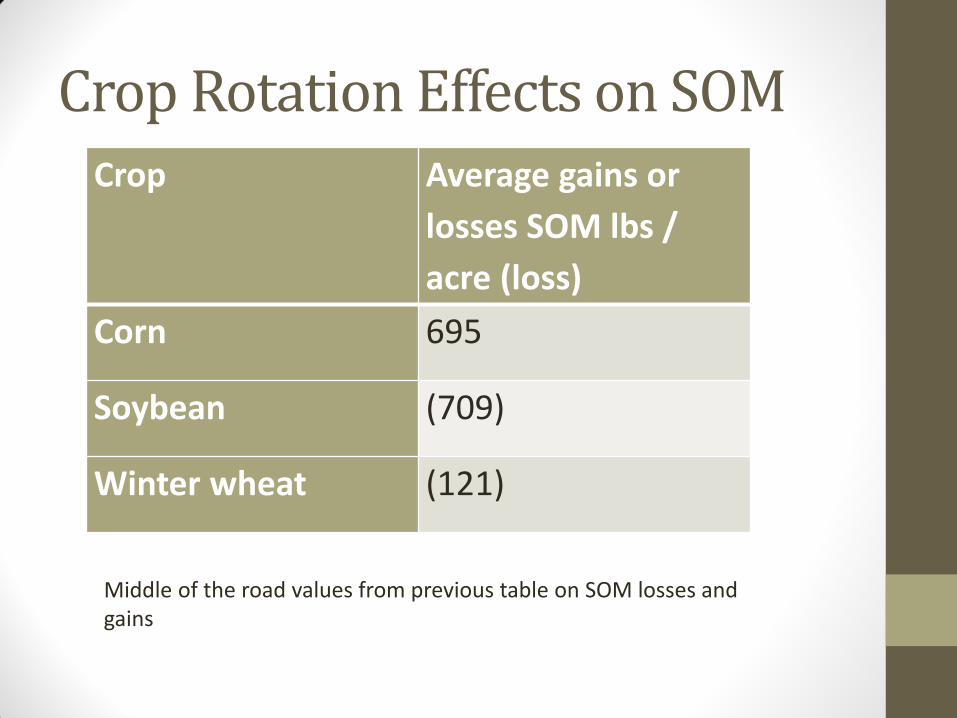
Crop Rotation Effects on SOM Crop Average gains or
losses SOM lbs / acre (loss)
Corn 695
Soybean (709)
Winter wheat (121)
Middle of the road values from previous table on SOM losses and gains

Crop Rotation Effects on SOM • 22 years of SOM research at Elora resulted in 2.25%
SOM loss and 10% - 20% retention • In SW Ontario with longer/warmer season less mixed
farming more soybeans we could be in the last column • 2 years of Soybeans and 1 year of wheat is far more
alarming than 1 year of corn stover removal • Apart from supplying the demands of a biomass industry;
to build SOM levels and improve soil quality do we need to grow more corn per acre and more acres of corn?
• The only crop with the ability to increase SOM substantially
Utilizing Cover Crops to Keep
Our Soil Protected
Shannon Osborne Mike Lehman, Tom Schumacher, Walter Riedell,
Amber Hammerbeck, Sarah Stetson, and Joe Pikul

Residue Removal
• 1995-2000 – Alfalfa under No-Till (NT)
• Established 2000
• Corn Residue Removal
• Crop Rotation
• No-Tillage
• Cover Crops (2005)

Experimental Design
• Randomized complete block design (3 reps) • Split-plot design
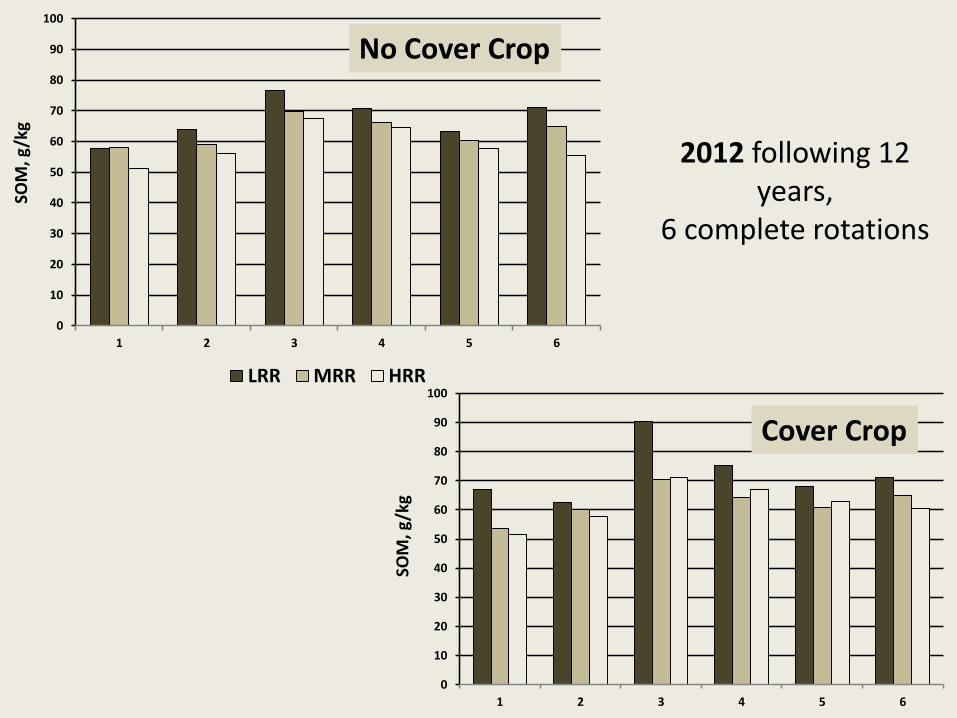
• Whole Plot (residue removal) – HRR (All residue removed by a silage cutter) – MRR (Grain harvested, residue chopped and baled) – LRR (Grain harvested, residue remain on surface)
• Split-plot (Fall 2005) – Cover crop – No cover crop
• Two-year corn/soybean rotation – No-till

Cover Crop Growth
• Soybean Phase
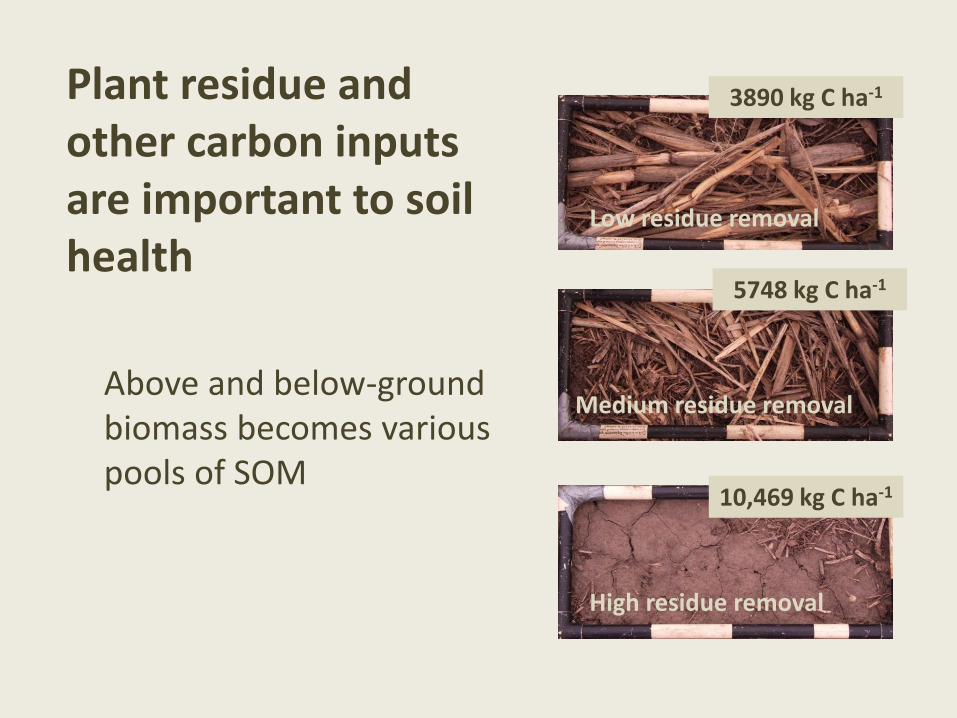
Plant residue and other carbon inputs are important to soil health
Above and below-ground biomass becomes various pools of SOM
Low residue removal
Medium residue removal
High residue removal
3890 kg C ha-1
10,469 kg C ha-1
5748 kg C ha-1

Erodible fraction ‡ (top 5 cm of soil)
‡EF – Erodible fraction is the mass fraction of soil <0.84 mm in diameter.
Residue Removal 2008 2012 2012
Combine No Cover Crop Cover Crop
LRR 93 85 75
MRR 154 130 150
HRR 184 307 161
Pr > F 0.001 0.001 0.001
0
10
20
30
40
50
60
70
80
90
100
1 2 3 4 5 6
0
10
20
30
40
50
60
70
80
90
100
1 2 3 4 5 6
LRR MRR HRRSO
M, g
/kg
SOM
, g/k
g
2012 following 12 years,
6 complete rotations
No Cover Crop
Cover Crop

2.2
2.3
2.4
2.5
2.6
2.7
2.8
2.9
LRR MRR HRR
Soil
Carb
on ,
%
Residue Removal
Soil Carbon, 0-3 in
No Cover
Cover Crop

Soil Health Score - Elora
0
10
20
30
40
50
60
70
80
90
Alf-alf-corn-corn
Contalfalfa
Cont corn C-C-O(RC)-B(RC)
C-C-O-B Corn-corn-soy-
soy
Corn-corn-soy-w wheat
C-C-S-WW(RC)
Conventional No-till

90
100
110
120
130
140
150
160
170
Irst y
ear c
orn
yiel
d (b
u/ac
@15
.5%
)
MP
NT
Corn Yields at Elora 2012
186
157
175 173b
198
162
184 181a
100
120
140
160
180
200
220
Grai
n Yi
eld
(bu/
ac)
2010 2011
Corn Yields after Wheat +/- Red Clover, Ridgetown 2010-12
C-S-
W
C-S-
W(r
c)
2012
C-S-
W
C-S-
W(r
c)
C-S-
W
C-S-
W(r
c)
C-S-
W
C-S-
W(r
c)
Ave

133c
150b 154 152b
161c
150b 156b
159 156b
183b 178a
186a
157
175a
195a
100
110
120
130
140
150
160
170
180
190
200
Grai
n Yi
eld
(bu/
ac)
2009 2010 2011
The “Rotation Effect” on corn yields Ridgetown 2009-13
C-C
C-S
C-S-
W
2012
Note: Mean separation within year (p=0.05)
C-C
C-S
C-S-
W
C-C
C-S
C-S-
W
C-C
C-S
C-S-
W
C-C
C-S
C-S-
W
2013
Hooker (UG Ridgetown

50c
42b
60b
73c
61b
55b
43b
62b
78b
60b 60a
47a
69a
86a
65a
30
40
50
60
70
80
90
Rotation
Seed
Yie
ld (b
u/ac
)
2009
Averaged Across Tillage and Corn N treatments at Ridgetown. Est. 1991; letters within year statistically different at p=0.05 Source: Hooker et al., 2011 (UofG Ridgetown) Note: Mean separation within year (p=0.05)
C-S
C-S-
W
S-S
The “Rotation Effect” on Soybean Yields Ridgetown 2009-13
2010 2011 2012 2013
C-S
C-S-
W
S-S
C-S
C-S-
W
S-S
C-S
C-S-
W
S-S
C-S
C-S-
W
S-S

Next Steps • Establish a market for cellulosic sugar
production $$$$$ • Need a facility to process corn stalks • Create the value chain for crop residues • Look at the total impact on field management • Increase harvest efficiencies drive out costs • Develop a matrix table of yield vs breakeven
stover removal thresholds • Decide on a business structure

Future Opportunities
� New harvesting equipment and logistic processes
� Sustainable harvest – field advisors � Large acreages have high yields � Incorporating process to remove NPK � Lower operating & capital costs as
technology improves/emerges
45
Thank You to the following:
Investment in this project has been provided by Agriculture and Agri-Food Canada through the Canadian Agricultural Adaptation Program (CAAP). In Ontario, this program is delivered by the Agricultural Adaptation Council.
46

Volunteers – Soil Carbon Study • Joint project OFA/Harrow Research Station
• Funded through Natural Resources Canada via AAFC • Analysis of core soil samples for carbon content
• 12 inch deep samples taken by AgriFood Labs • Confidential analysis at the Harrow Research Station
• Need farm volunteers to make cornstalk fields available • Area of interest is Oxford/Brant westward
• Area of interest is farms that have removed cornstalk in past but do not utilize manure • Contact Charlie Lalonde at end of session or leave
name and phone number on cards
Related Documents