Bubbling Baking Soda Authors: Kelly Chan, Liam Madsen, Nikki Kashani, Robin Lee Abstract: The objective of this study was to determine whether or not the amount of baking soda (sodium bicarbonate) used affects the amount of carbon dioxide produced when reacting with vinegar (acetic acid). Our null hypothesis was that if different amounts of baking soda react with 70 mL of vinegar, then the mean volume of bubbles formed should be the same because the amount of baking soda used does not affect the amount of carbon dioxide produced. This experiment was done by mixing a small amount of liquid soap with vinegar so that the soap is able to catch the carbon dioxide gas produced when mixed with baking soda. The theoretical value of baking soda (5 g) needed to react with all the acetic acid present in 70 mL of vinegar was used as a control and from there, the experiment was replicated multiple times but increasing the amount of baking soda by 2x, 1.5x, and decreasing it by 0.75, 0.5x, and 0.25x for each respective trial. The P-value for the one-way ANOVA test was lower than 0.0001, therefore we were able to reject the null hypothesis.The results of this experiment was that when different amounts of baking soda were used for the reaction, the volume of bubbles formed differed as well. Introduction: Often in chemistry, scientists need to be able to make accurate predictions for the quantity of their desired products. The characterization of type and quantity of both reactants and products in a chemical reaction is called stoichiometry and is used to make predictions on the quantity of the product based on the quantity of the reactants (McMahon et al., 2019). Stoichiometry is an important aspect of any chemical reaction that may occur, either in a lab or in nature, as changing the amount of one reactant relative to another has profound effects on the products of the reaction. It was found that along with reaction-rate and mixing, stoichiometry was a top factor in the yield of a product (Shah et al., 2012).

Welcome message from author
This document is posted to help you gain knowledge. Please leave a comment to let me know what you think about it! Share it to your friends and learn new things together.
Transcript
Bubbling Baking Soda
Authors:
Kelly Chan, Liam Madsen, Nikki Kashani, Robin Lee
Abstract:
The objective of this study was to determine whether or not the amount of baking soda(sodium bicarbonate) used affects the amount of carbon dioxide produced when reacting withvinegar (acetic acid). Our null hypothesis was that if different amounts of baking soda react with70 mL of vinegar, then the mean volume of bubbles formed should be the same because theamount of baking soda used does not affect the amount of carbon dioxide produced. Thisexperiment was done by mixing a small amount of liquid soap with vinegar so that the soap isable to catch the carbon dioxide gas produced when mixed with baking soda. The theoreticalvalue of baking soda (5 g) needed to react with all the acetic acid present in 70 mL of vinegarwas used as a control and from there, the experiment was replicated multiple times but increasingthe amount of baking soda by 2x, 1.5x, and decreasing it by 0.75, 0.5x, and 0.25x for eachrespective trial. The P-value for the one-way ANOVA test was lower than 0.0001, therefore wewere able to reject the null hypothesis.The results of this experiment was that when differentamounts of baking soda were used for the reaction, the volume of bubbles formed differed aswell.
Introduction:
Often in chemistry, scientists need to be able to make accurate predictions for the
quantity of their desired products. The characterization of type and quantity of both reactants and
products in a chemical reaction is called stoichiometry and is used to make predictions on the
quantity of the product based on the quantity of the reactants (McMahon et al., 2019).
Stoichiometry is an important aspect of any chemical reaction that may occur, either in a lab or
in nature, as changing the amount of one reactant relative to another has profound effects on the
products of the reaction. It was found that along with reaction-rate and mixing, stoichiometry
was a top factor in the yield of a product (Shah et al., 2012).
We set out to experiment on the effects of stoichiometry in the lab on a visual scale. The
baking soda and vinegar reaction (sodium bicarbonate and acetic acid respectively) is not only
safe to perform at home, but provides a large-scale visual representation of the reaction product
in the form of carbon dioxide bubbles. The baking soda and vinegar react one-to-one meaning
that for each mole of baking soda consumed, one mole of vinegar will also be consumed (Veltri
et al., 2020). Mixing the two results in carbonic acid formation that quickly breaks down into
water and carbon dioxide (Helmenstine, 2020).
Balanced Equation:
𝐶2𝐻
4𝑂
2+ 𝑁𝑎𝐻𝐶𝑂
3→ 𝑁𝑎𝐶
2𝐻
3𝑂
2+ 𝐻
2𝑂 + 𝐶𝑂
2
Using a membrane forming agent, like dish detergent detergent, captures the carbon
dioxide and allows for the volume of carbon dioxide produced to be determined. We predict that
the volume of bubbles formed will be similar among the different amounts of baking soda used
to react with vinegar. Our null hypothesis is that if different amounts of baking soda react with
70mL of vinegar, then the mean volume of bubbles formed should be the same because the
amount of baking soda used does not affect the amount of carbon dioxide produced.
Methods:
To start this experiment, we calculated the amount of baking soda needed to react with 70
mL of vinegar which was ~5 g (refer to calculations below). Then using a 500mL liquid
measuring cup, we labeled the cup with the amount of baking soda that will be used for the trial.
We measured out 5 mL of dish soap as well as 70 mL of vinegar (5% acetic acid) into the liquid
measuring cup and mixed them together. To transfer the baking soda, we folded a piece of paper
in half, then placed it on the baking scale. After setting the scale to zero with the piece of paper
on top, we measured out 5 g of baking soda. Before mixing the baking soda into the liquid
measuring cup, we set up our phones to record the reaction. Once the phone was set up, we
poured all the baking soda into the liquid measuring cup, stirred it so that all the baking soda
reacted with the vinegar and once the reaction seemed to have maximum height, we marked the
height with a dry erase marker. Once the reaction was complete, we stopped the recording then
repeated these steps five times, but using 2x, 1.5x, 0.75x, 0.5x and 0.25x the amount of baking
soda for each trial respectively.
For data collection, we observed the maximum height of the bubbles formed in this
reaction using our phones. We rewatched the videos of each reaction and recorded this maximum
height into our lab notebooks. Since a volume liquid measuring cup was used, we looked at the
marked lines on the side of the cup for volume measurements, and for the trials that did not meet
the line exactly, we used a ruler to calculate what proportion of the bubbles were above or below
the closest line to determine the approximate volume. For this experiment, the reaction was
quick and the bubbles did not maintain maximum height for a long period of time, therefore it is
important to not only watch the reaction occurring but also be recording it with another device.
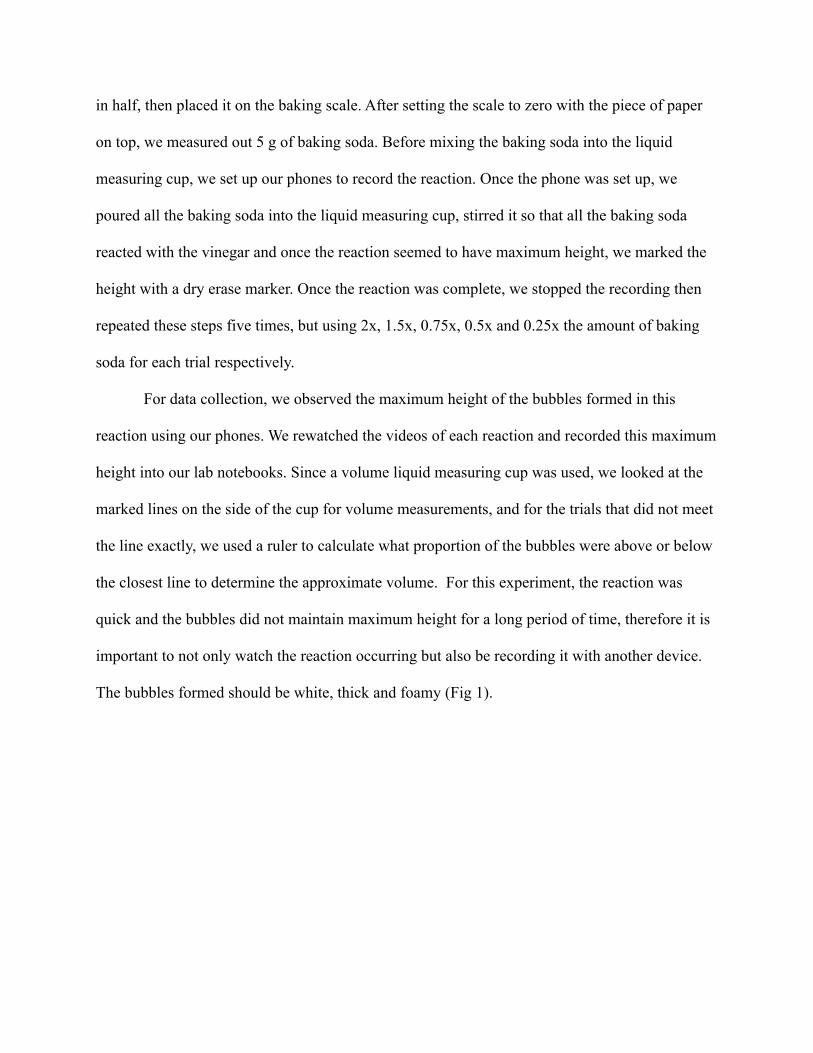
The bubbles formed should be white, thick and foamy (Fig 1).
Figure 1. For this experiment, a 500 mL pyrex liquid measuring cup was used. Top of the
bubbles at maximum height of reaction used to determine volume. Volume includes the liquid at
the bottom to be consistent with the other trials and prevent error that could occur when
calculating for just the bubble volume.
For data analysis we used GraphPad Prism 9.1.0 and ran a one-way ANOVA.
Calculations:
Balanced Equation of Vinegar and Baking Soda Reaction:
𝐶2𝐻
4𝑂
2+ 𝑁𝑎𝐻𝐶𝑂
3→ 𝑁𝑎𝐶
2𝐻
3𝑂
2+ 𝐻
2𝑂 + 𝐶𝑂
2
Vinegar (acetic acid) + baking soda (sodium bicarbonate)-> sodium acetate + water + carbon
dioxide
Calculations for Baking Soda:
Vinegar used was 5% acetic acid.
x x x x x 70.0 mL Vinegar84.007 𝑔1 𝑚𝑜𝑙 𝑜𝑓 𝑁𝑎𝐻𝐶𝑂3
1 𝑚𝑜𝑙 𝑁𝑎𝐻𝐶𝑂31 𝑚𝑜𝑙 𝐶2𝐻4𝑂2
1 𝑚𝑜𝑙 𝐶2𝐻4𝑂2 60.052 𝑔
0.05𝑔 𝑁𝑎𝐻𝐶𝑂31 𝑔 𝑉𝑖𝑛𝑒𝑔𝑎𝑟
1 𝑔 𝑉𝑖𝑛𝑒𝑔𝑎𝑟 1 𝑚𝐿 𝑉𝑖𝑛𝑒𝑔𝑎𝑟
= 4.89 ~ 5 grams of baking soda.
We did not have access to scientific scale so rounded to 5 grams which was easier to measure
using cooking scale.
Results:
For this experiment six different amounts of baking soda were used to react with 70 mL
of vinegar to observe the effects of it on the volume of reaction. Figure 2 shows that 70 mL of
vinegar with 10 grams of baking soda had the highest volume and CO2 gas produced, and 70 mL
of vinegar with 1.25 grams of baking soda had the lowest volume and CO2 gas produced. For
data analysis, we used GraphPad Prism 9.1.0 to run a one-way ANOVA test. A QQ plot was
performed to check for equal distributions. The QQ plot showed a linear distribution indicating
that the data has equal distribution and fits the assumptions of a one-way ANOVA test. The
significance level of 0.05 (alpha) was chosen because 95% confidence interval is best fitted to
our data given that the sample size was not large. The P-value from this test was 0.0001 which is
less than the significance level of 0.05 (alpha), therefore we are able to reject the null hypothesis.
Tukey’s multiple comparisons test was performed to indicate which groups (amounts of baking
soda) were significantly different from each other in regard to their volume. The results showed
there was significance between 10g vs. 3.75g, 10g vs. 2.5g, 10g vs. 1.25g, 7.5g vs 2.5g, 7.5g vs.
1.25g and 5g vs. 1.25g.
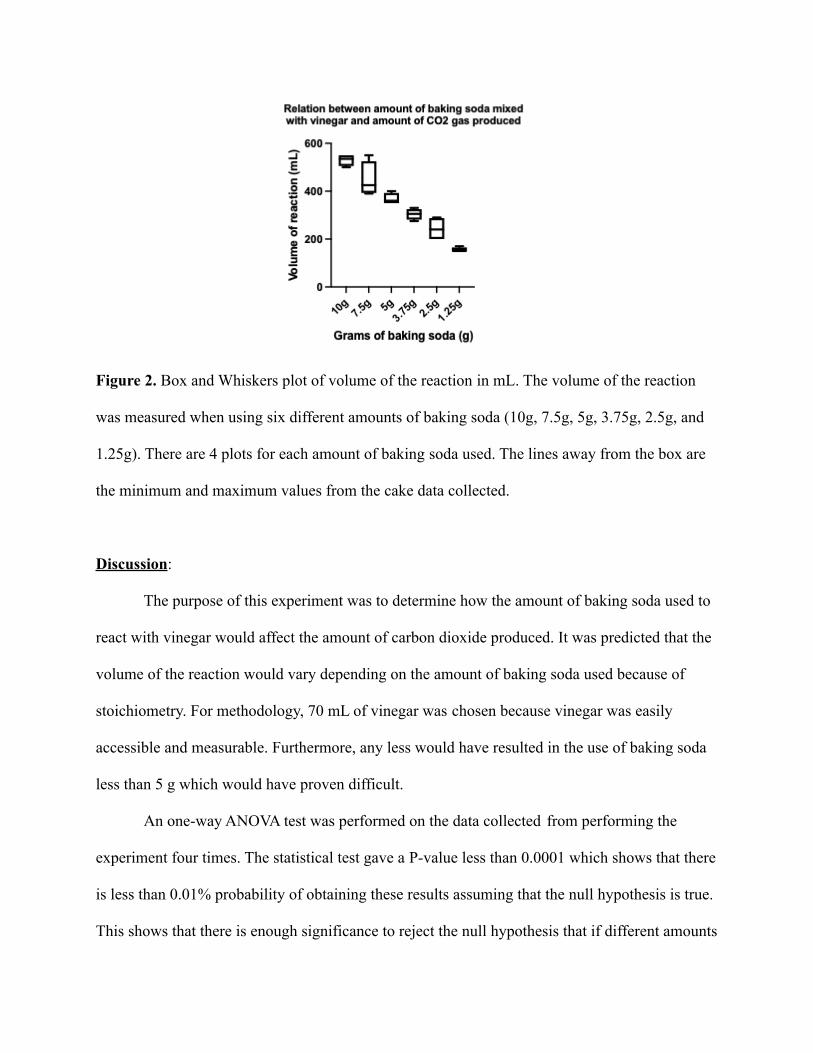
Figure 2. Box and Whiskers plot of volume of the reaction in mL. The volume of the reaction
was measured when using six different amounts of baking soda (10g, 7.5g, 5g, 3.75g, 2.5g, and
1.25g). There are 4 plots for each amount of baking soda used. The lines away from the box are
the minimum and maximum values from the cake data collected.
Discussion:
The purpose of this experiment was to determine how the amount of baking soda used to
react with vinegar would affect the amount of carbon dioxide produced. It was predicted that the
volume of the reaction would vary depending on the amount of baking soda used because of
stoichiometry. For methodology, 70 mL of vinegar was chosen because vinegar was easily
accessible and measurable. Furthermore, any less would have resulted in the use of baking soda
less than 5 g which would have proven difficult.
An one-way ANOVA test was performed on the data collected from performing the
experiment four times. The statistical test gave a P-value less than 0.0001 which shows that there
is less than 0.01% probability of obtaining these results assuming that the null hypothesis is true.
This shows that there is enough significance to reject the null hypothesis that if different amounts
of baking soda are reacted with the same amount of vinegar, then the amount of carbon dioxide
produced would be the same. We accept the alternative hypothesis that the varying amount of
baking soda would impact the amount of carbon dioxide produced which could be visualized by
measuring the volume of the reaction. Since there were 5 groups aside from control, a Tukey test
was performed as well to determine the significance between the groups. The results showed
there was significance between 10g vs. 3.75g, 10g vs. 2.5g, 10g vs. 1.25g, 7.5g vs 2.5g, 7.5g vs.
1.25g and 5g vs. 1.25g. From these groups, only 1.25g shows significance compared to the
control group of 5g. However, all these groups demonstrated that the volume of reaction between
the groups was significant.
Based on stoichiometry, decreasing the amount of baking soda made it the limiting
reagent which would limit the product, in this case carbon dioxide being produced. However, by
increasing the baking soda amount above control, it becomes the excess reagent and the fixed
vinegar amount is the limiting reagent since the mol ratio is 1:1 (McMahon et al., 2019). The
Tukey test shows that between the control group and the other groups, only 0.25 times the
amount of baking soda would cause a significant difference in product produced. The 10g group
which was 2 times the control amount showed a significance with the amounts that were less
than the control group (3.75g, 2.5g and 1.25g). However, the 7.5g which was 1.5 times the
control amount showed a significance with only two the decreased amount compared to control
(2.5g and 1.25g). This showed that as long as the groups were greater than 2 times apart, there
would be a significant difference in the volume of the reactions. Based on the chemical reaction,
as long as the baking soda amount was increased by greater than 2 would there be a significant
difference in the amount of carbon dioxide produced.
A source of uncertainty was that the experiments took place in different locations
between 4 different people which affects the consistency of the reading on the liquid measuring
cup. Since the exact same liquid measuring cups were used by every group member, it was not
considered as a source of uncertainty. Another source of uncertainty that was not considered was
the temperature in which each experiment took place. Temperature is a factor that could affect
the reaction rate. A higher temperature would have increased the reaction rate and may have
observed a greater volume increase when combining the baking soda and vinegar. Taking into
account the time for the reaction to occur would be useful to consider if the reaction rates were
different between the 4 sets of experiments (Shah et al., 2012).
For further research, the baking soda and vinegar reaction can be tested for effectiveness
for cleaning. The results of this paper can be used to test if different amounts of baking soda and
vinegar change the cleanliness of a surface and prevent the same amount of mold growth (Fong
et al., 2011).
Conclusion:
This experiment tested how varying the amount of baking soda in the reaction with
vinegar would affect product outcomes. The results of the experiment found a P-value of less
than 0.0001 therefore rejecting the null hypothesis and instead supporting the alternative
hypothesis that if a different amount of baking soda is mixed with vinegar, then the volume of
the reaction will change every time. The project studies the reaction of these chemicals as it is
used frequently in our daily lives such as baking and cleaning. The combination of vinegar and
baking soda can be useful for baking as the carbon dioxide produced acts as a leavening agent. It
creates air pockets in the dough to create a light baked good instead of dense. Vinegar and baking
soda can be used as alternative cleaners for stains and dirt instead of harsh chemicals.
Acknowledgements:
We would like to thank our professor, Dr. Celeste Leander, for giving useful advice and
resources to help us with this experiment. Furthermore, we would like to acknowledge the
traditional, ancestral, unceded territory of the Musqueam people on which UBC’s Vancouver
Point Grey campus resides as well as the traditional owners and caretakers of the land where
each of us resides on. A special thank you to peer reviewers, Sharon Li, Stanley Chung, and
Karina To for their critical input. We would also like to thank the University of British Columbia
for allowing us to take BIOL 342 and develop our laboratory skills.
References:
Helmenstine, A. M. (2020). Equation for Reaction Between Baking Soda and Vinegar.
https://www.thoughtco.com/equation-for-the-reaction-of-baking-soda-and-vinegar-604
043
Fong, D., Gaulin, C., Lê, M.-L., & Shum, M. (2011). Effectiveness of Alternative
Antimicrobial Agents for Disinfection of Hard Surfaces.
McMahon, P. E., McMahon, R. F., Khomtchouk, B. B., McMahon, P. E., McMahon, R. F., &
Khomtchouk, B. B. (2019). Techniques for Performing Stoichiometric Calculations. In
Survival Guide to General Chemistry (pp. 89–107). CRC Press.
https://doi.org/10.1201/9780429445828-8
Shah, S. I. A., Kostiuk, L. W., & Kresta, S. M. (2012). The effects of mixing, reaction rates,
and stoichiometry on yield for mixing sensitive reactions - Part I: Model development.
International Journal of Chemical Engineering. https://doi.org/10.1155/2012/750162
Veltri, L. M., & Holland, L. A. (2020). Microfluidics for Personalized Reactions to
Demonstrate Stoichiometry. Journal of Chemical Education, 97(4), 1035–1040.
https://doi.org/10.1021/acs.jchemed.9b00544
Appendix:
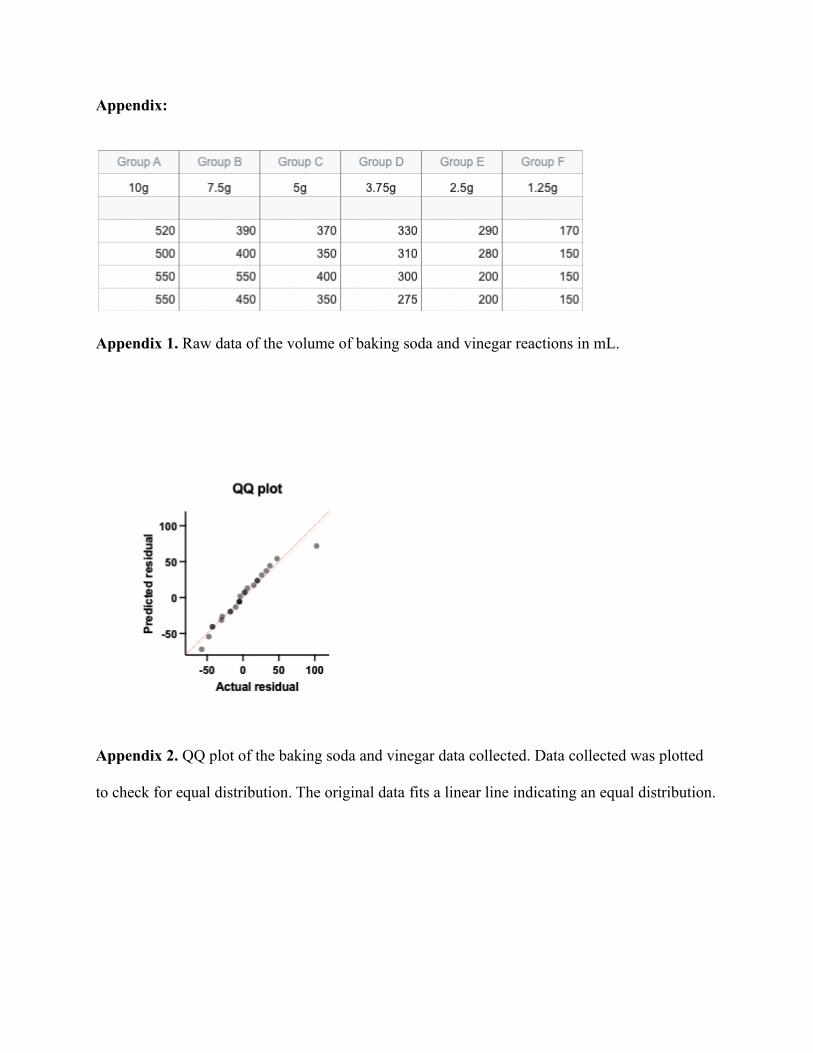
Appendix 1. Raw data of the volume of baking soda and vinegar reactions in mL.
Appendix 2. QQ plot of the baking soda and vinegar data collected. Data collected was plotted
to check for equal distribution. The original data fits a linear line indicating an equal distribution.
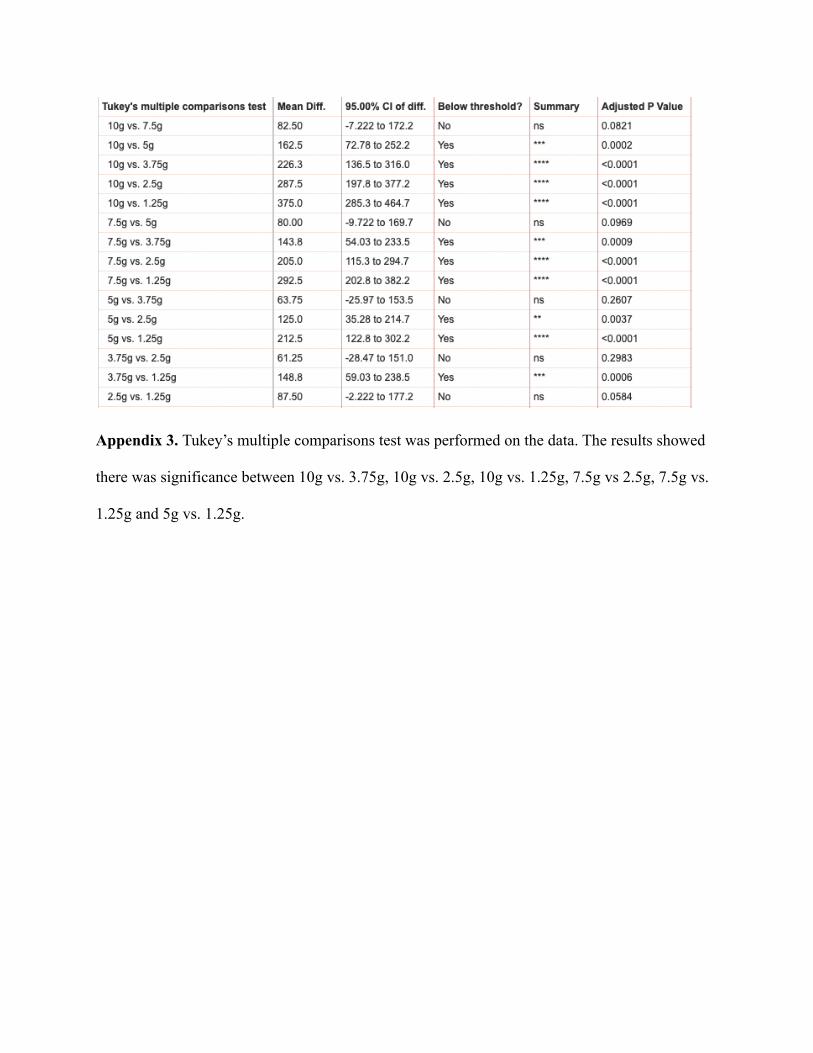
Appendix 3. Tukey’s multiple comparisons test was performed on the data. The results showed
there was significance between 10g vs. 3.75g, 10g vs. 2.5g, 10g vs. 1.25g, 7.5g vs 2.5g, 7.5g vs.
1.25g and 5g vs. 1.25g.
Related Documents


![Assorted Baking CupsAssorted Baking Cups - Pastry Pro Cup [NP-2016-09-09].pdf · Assorted Baking CupsAssorted Baking Cups PET Laminated Baking Cup Paper Baking Cup Food grade and](https://static.cupdf.com/doc/110x72/5a9dbea27f8b9abd0a8c98bb/assorted-baking-cupsassorted-baking-cups-pastry-cup-np-2016-09-09pdfassorted.jpg)

