Presented by:

Welcome message from author
This document is posted to help you gain knowledge. Please leave a comment to let me know what you think about it! Share it to your friends and learn new things together.
Transcript

Presented by:Presented by:
Presented by:
Looking Back at the last 50 Years and Forward Toward the Next 50
Rob StrandSenior Economist
American Bankers Association
Presented by:
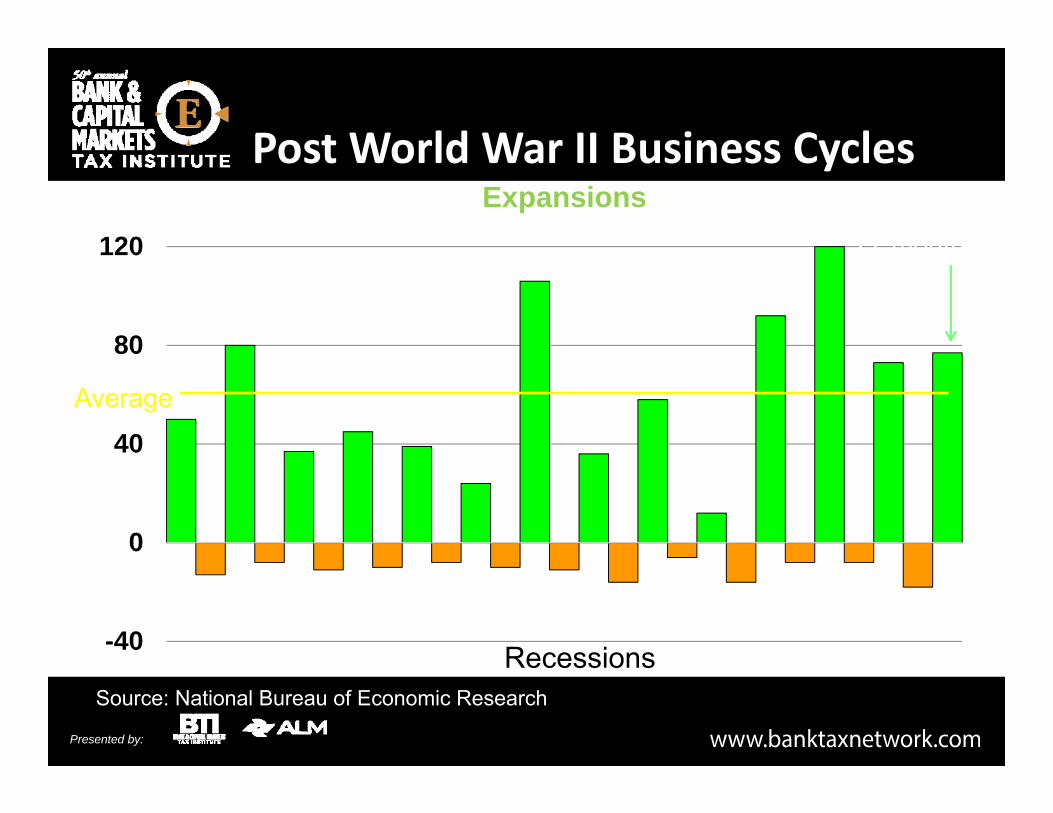
Source: National Bureau of Economic Research
-40
0
40
80
120
Post World War II Business CyclesMonths Expansions
Recessions
Current77 months
Average

Presented by:
Source: U.S. Bureau of Economic Analysis
-1%
0%
1%
2%
3%
4%
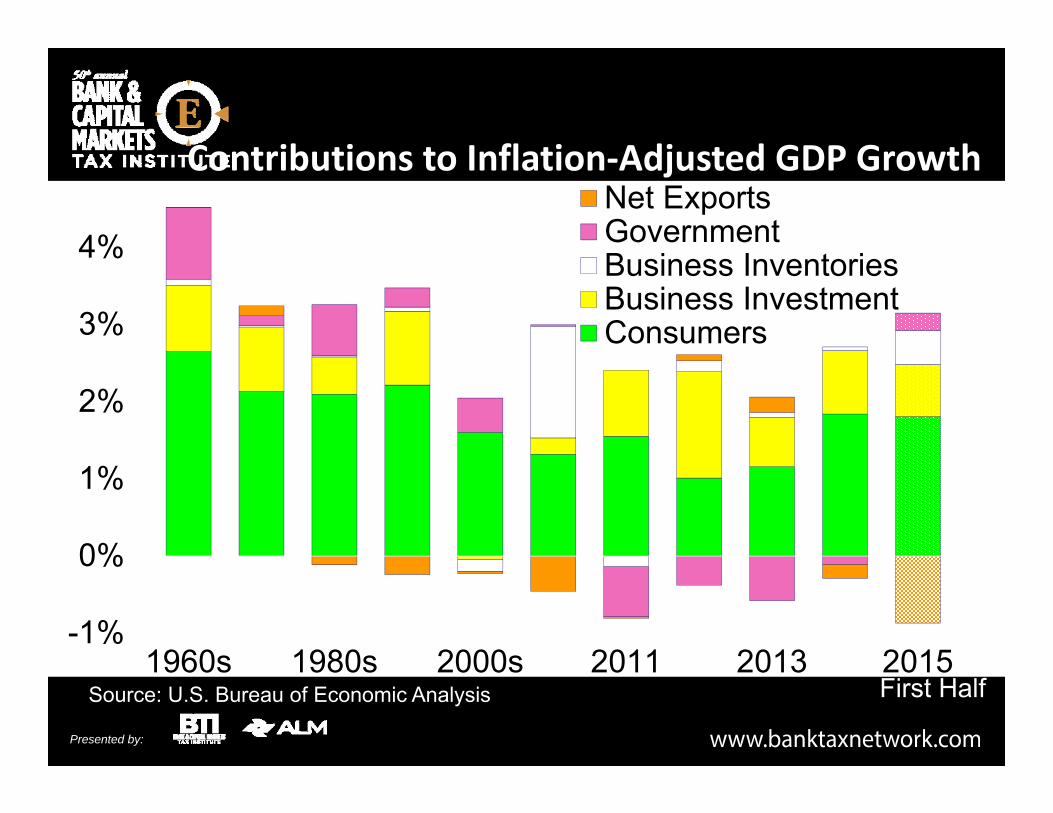
1960s 1980s 2000s 2011 2013 2015
Net ExportsGovernmentBusiness InventoriesBusiness InvestmentConsumers
Contributions to Inflation‐Adjusted GDP Growth
First Half

Presented by:
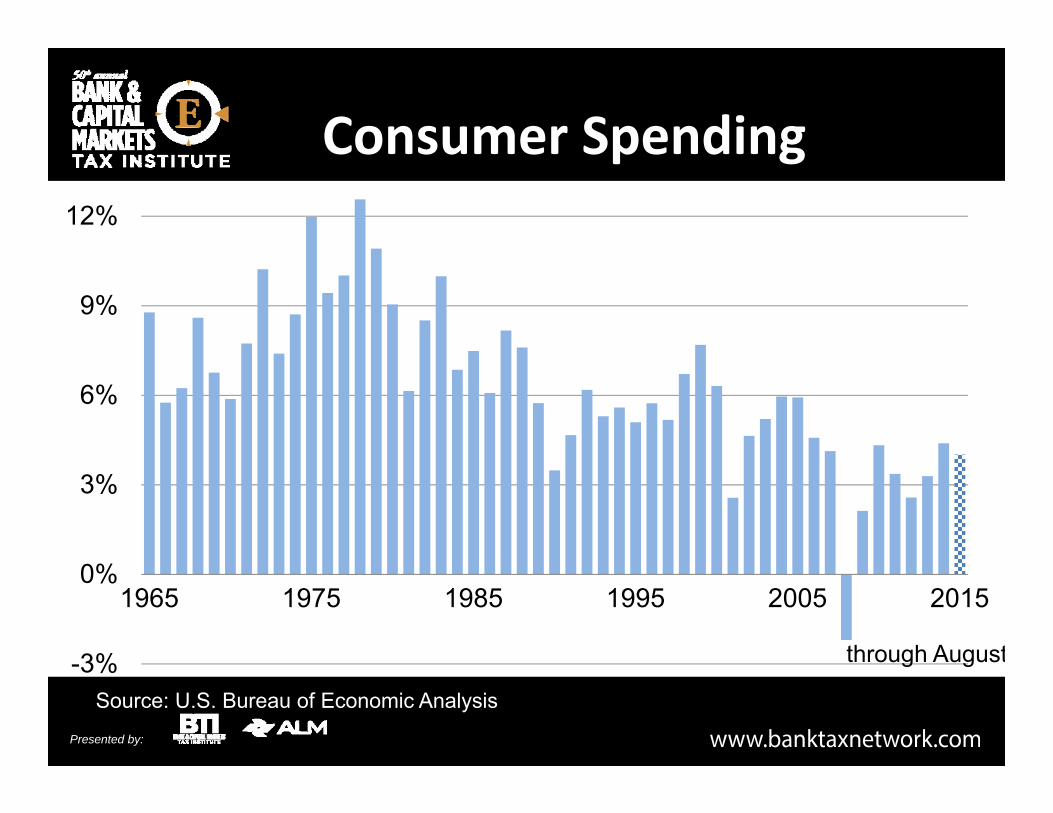
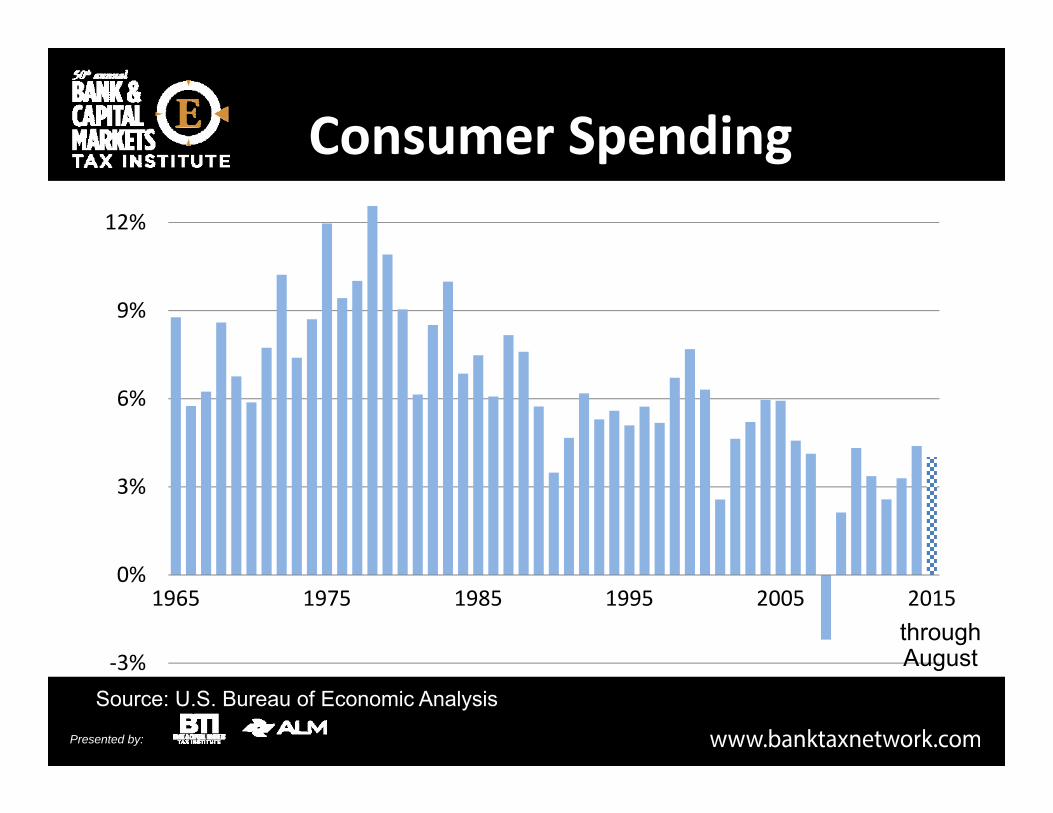
Consumer Spending
‐3%
0%
3%
6%
9%
12%
1965 1975 1985 1995 2005 2015
Source: U.S. Bureau of Economic Analysis
throughAugust
Annual Growth
Presented by:
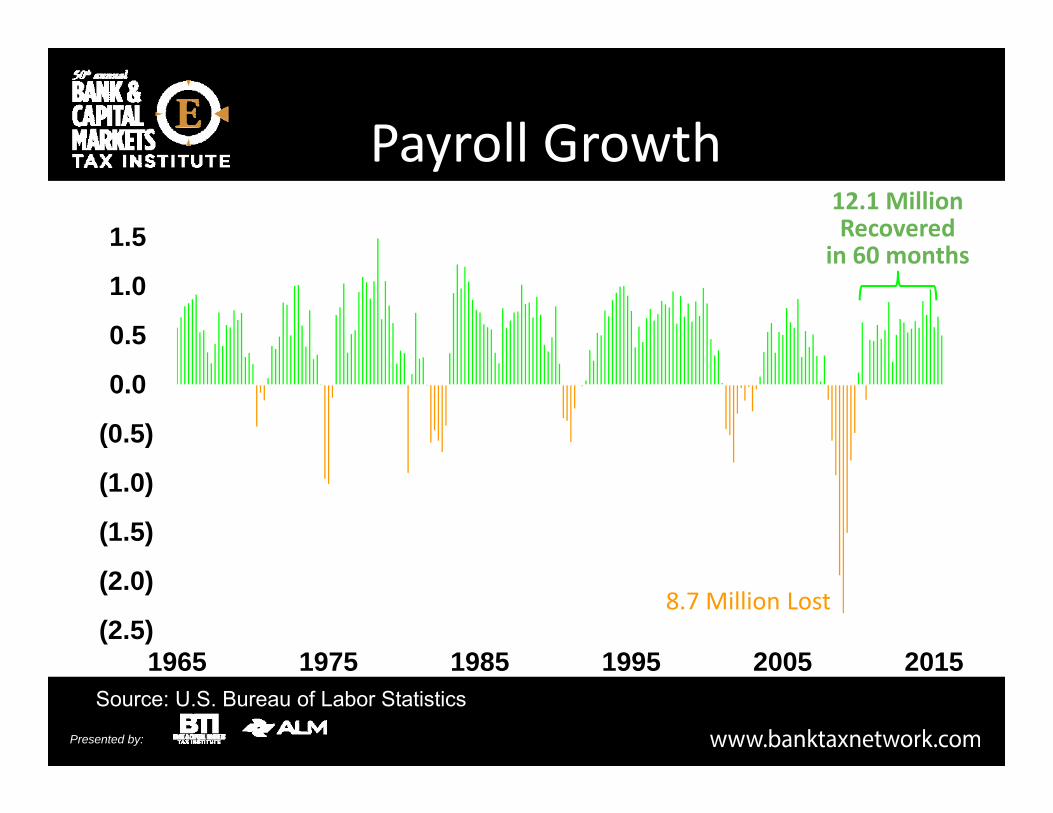
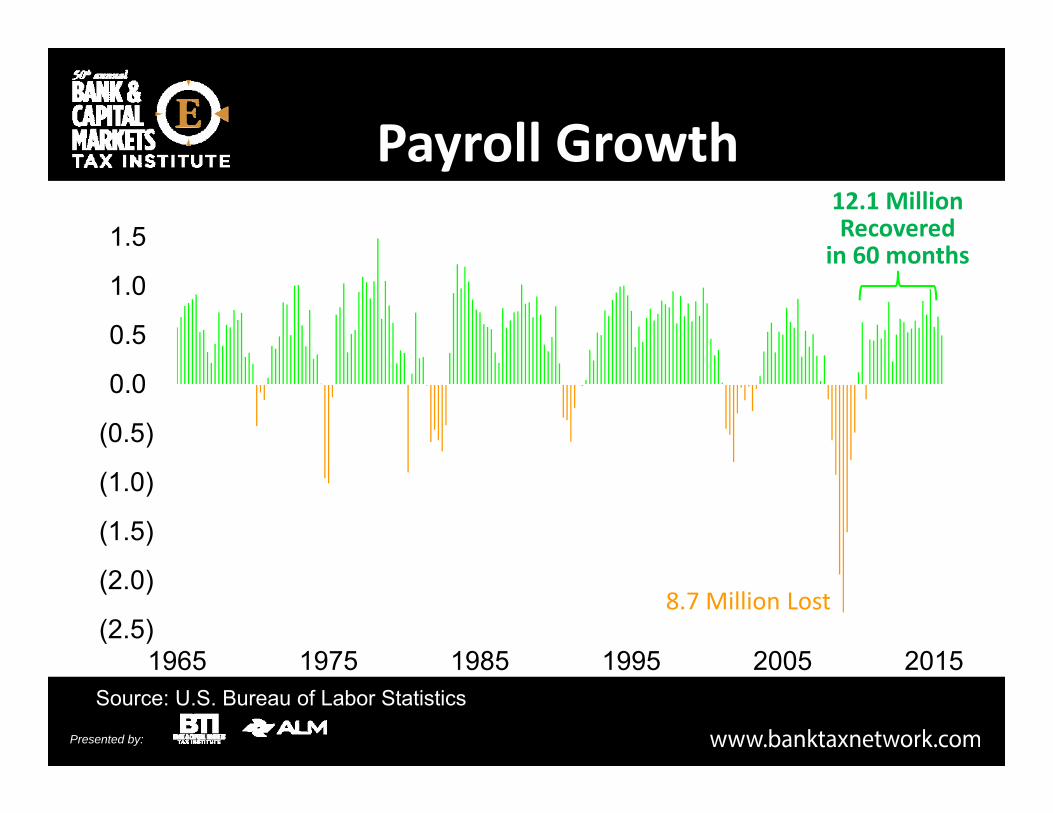
(2.5)
(2.0)
(1.5)
(1.0)
(0.5)
0.0
0.5
1.0
1.5
1965 1975 1985 1995 2005 2015Source: U.S. Bureau of Labor Statistics
8.7 Million Lost
12.1 Million Recovered
in 60 months
Payroll GrowthMillions Quarterly

Presented by:
0%
5%
10%
15%
1965 1975 1985 1995 2005 2015
Hun
dred
s
Source: U.S. Bureau of Labor Statistics
Underemployed
10.0%
5.1%Unemployed
Unemployment Rate
10.8%
Presented by:
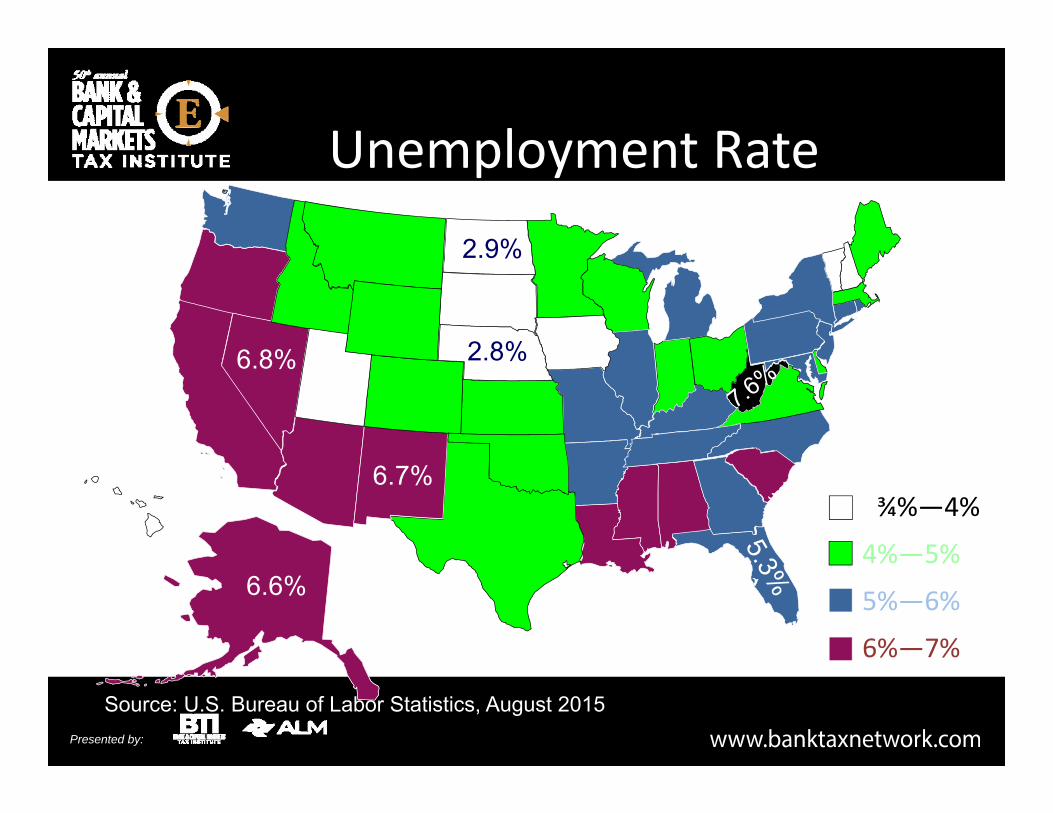
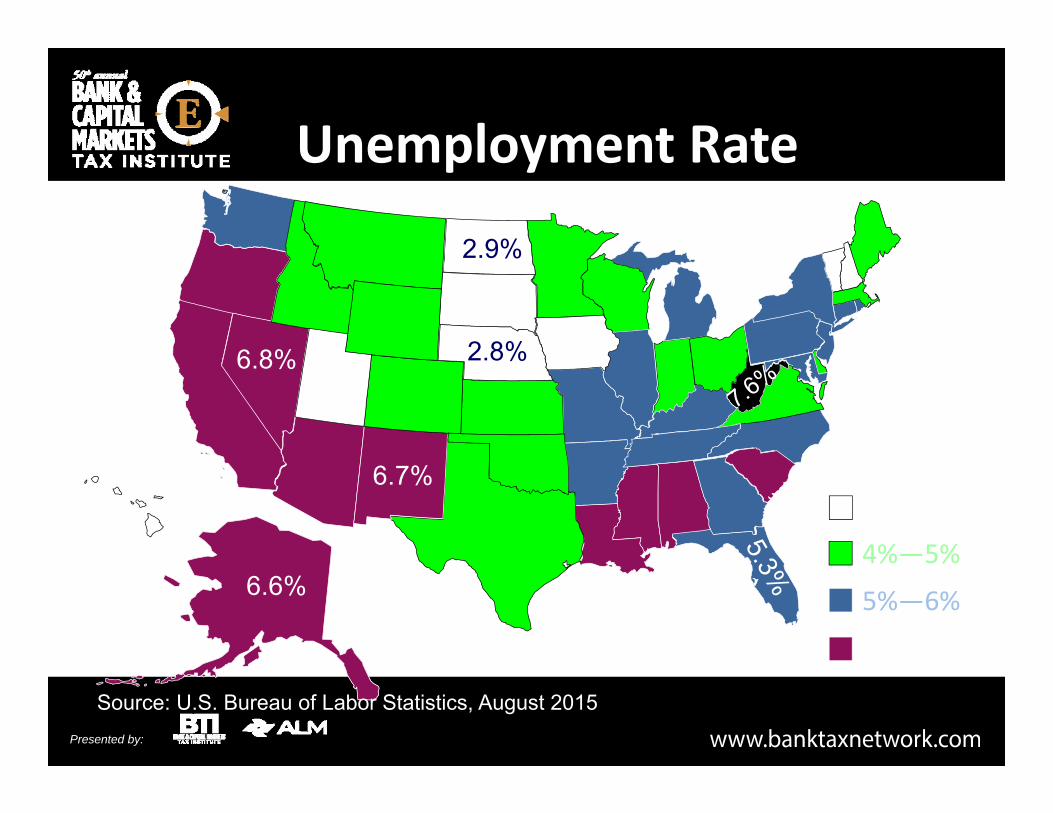
2¾%—4%
4%—5%
5%—6%
6%—7%
Unemployment Rate
Source: U.S. Bureau of Labor Statistics, August 2015
2.8%
2.9%
6.8%
6.7%
6.6%

Presented by:
11%
9%
9%
0.3%
-2%
-3%
-6%
-12%
-14%
-18%
Health Care
Bus. & Prof. Services
Leisure & Hospitality
Education
Trade & Transportation
Finance
Government
News & Entertainment
Manufacturing
Construction
Employment Change from Pre‐2011 Peak
Source: U.S. Bureau of Labor Statistics

Presented by:
Shifts in Employment Shares by Industry
GovernmentOther
TradeManufacturing
GovernmentOther
Trade
Manufacturing
1965 2015
Source: U.S. Bureau of Labor Statistics
Presented by:
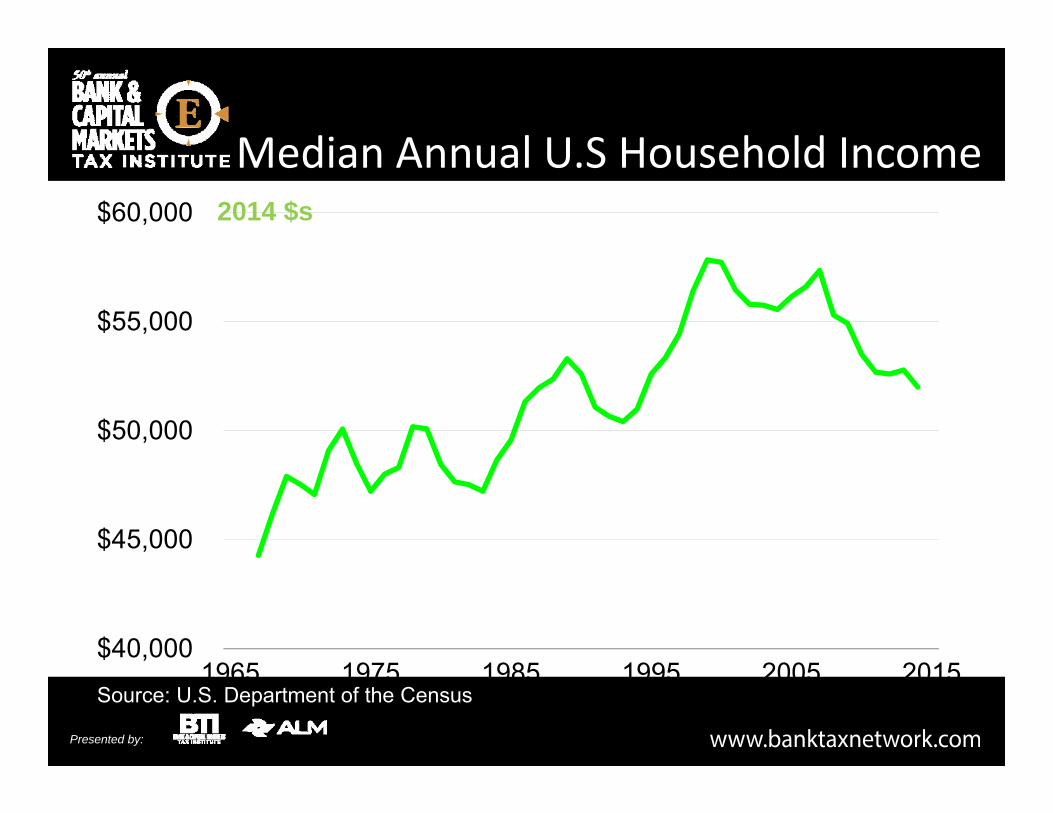
Median Annual U.S Household Income
$40,000
$45,000
$50,000
$55,000
$60,000
1965 1975 1985 1995 2005 2015Source: U.S. Department of the Census
2014 $s
Presented by:
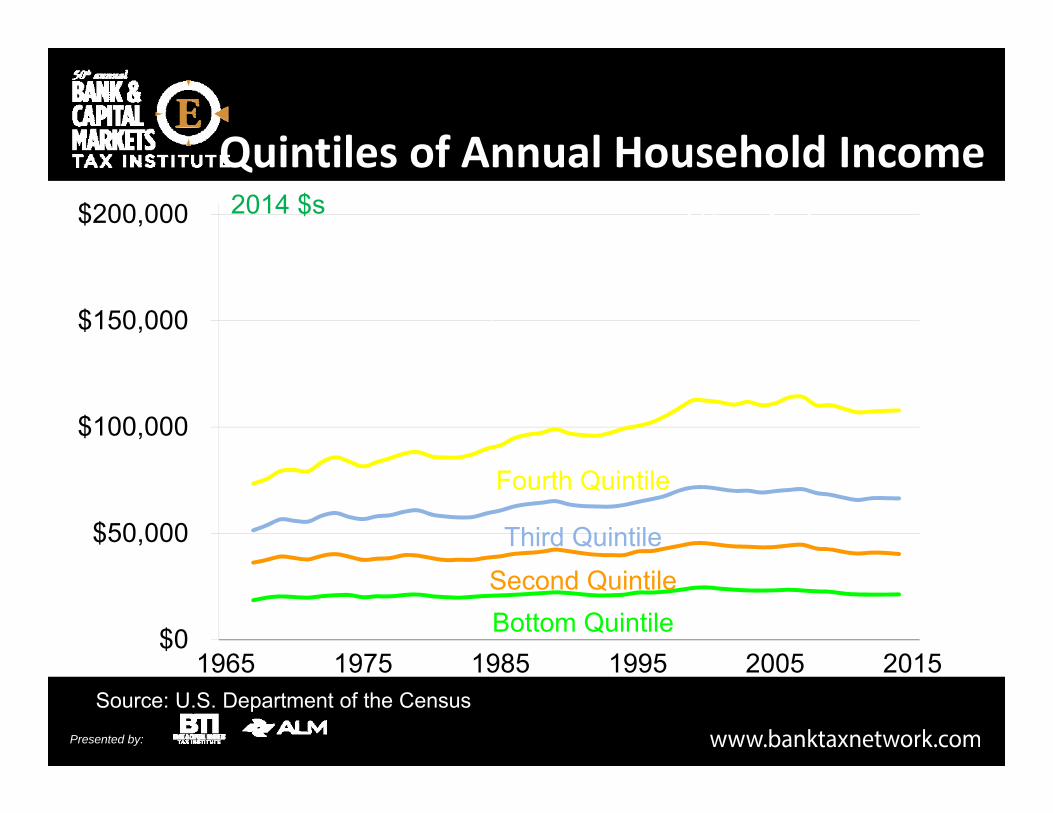
Quintiles of Annual Household Income
$0
$50,000
$100,000
$150,000
$200,000
1965 1975 1985 1995 2005 2015Source: U.S. Department of the Census
2014 $sTop 5 Percent
Top Quintile
Fourth Quintile
Third QuintileSecond QuintileBottom Quintile
Presented by:
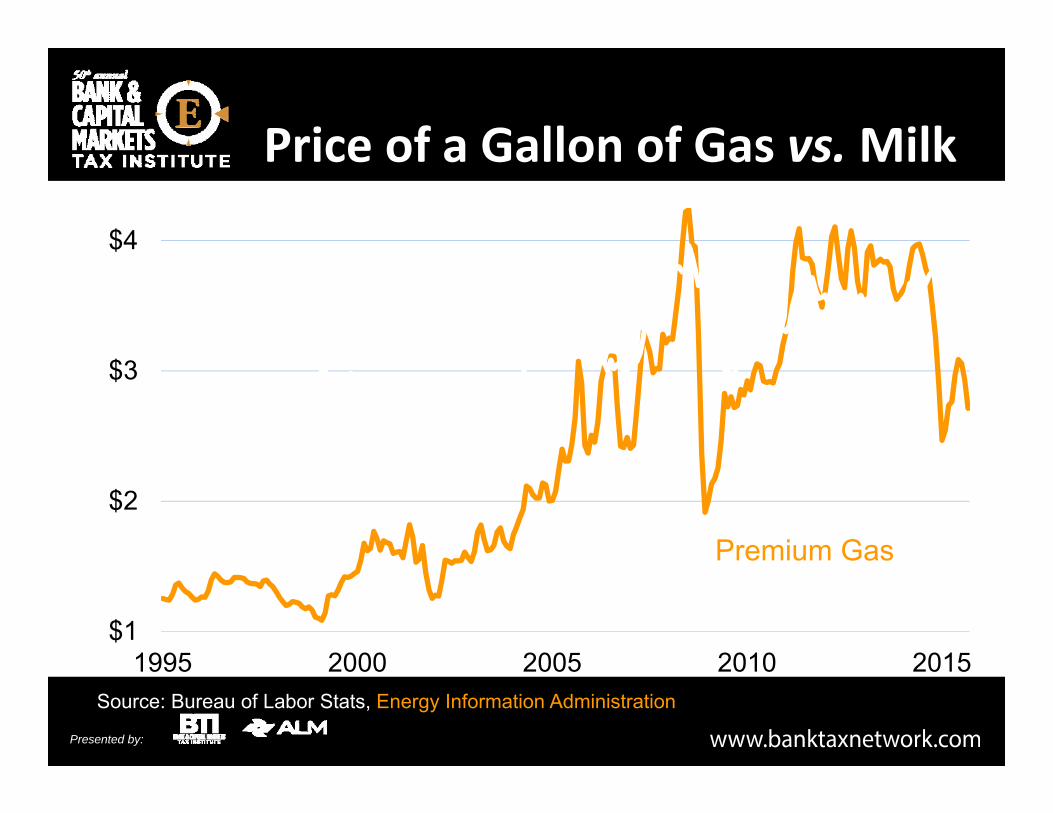
Price of a Gallon of Gas vs.Milk
$1
$2
$3
$4
1995 2000 2005 2010 2015
Premium Gas
Whole Milk
Source: Bureau of Labor Stats, Energy Information Administration
Presented by:
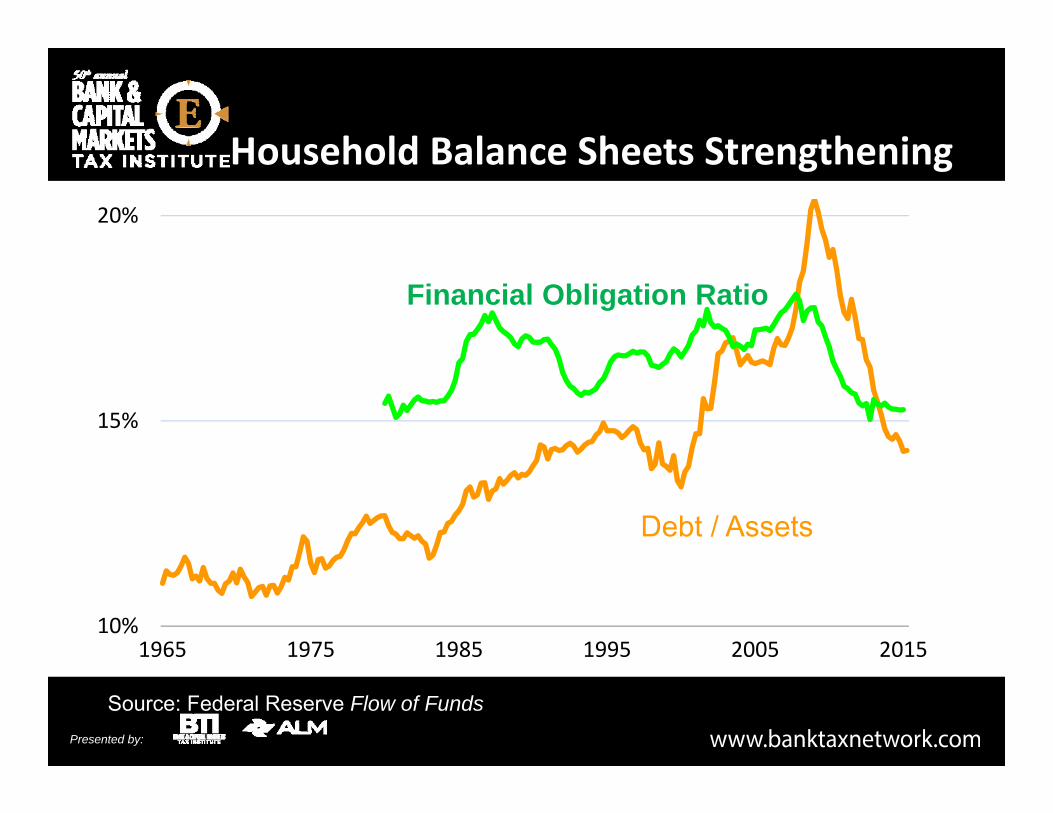
1965 1975 1985 1995 2005 201510%
15%
20%
Household Balance Sheets Strengthening
Source: Federal Reserve Flow of Funds
Debt / Assets
Financial Obligation Ratio
Presented by:
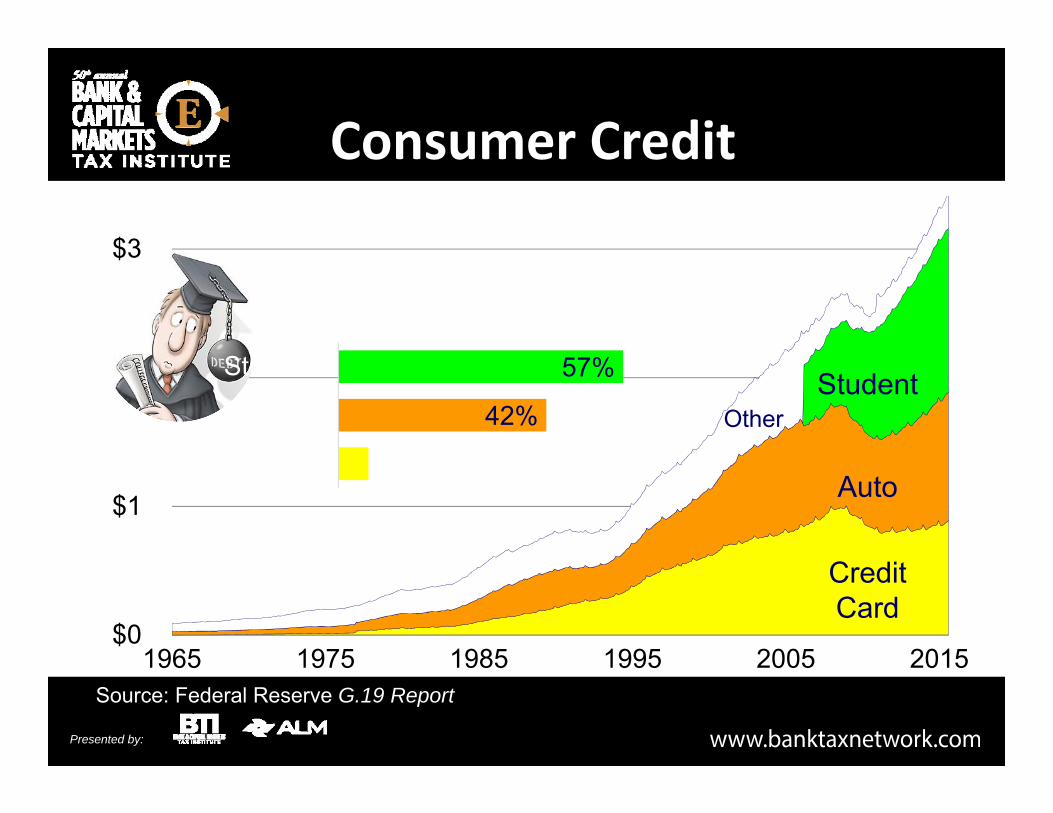
Consumer Credit
Source: Federal Reserve G.19 Report
$0
$1
$2
$3
1965 1975 1985 1995 2005 2015
CreditCard
Auto
StudentOther
6%
42%
57%
Credit Card
Auto
Student
Growth Since 2010 Trough
Trillions

Presented by:
2¾%—4%
4%—5%
5%—6%
6%—7%
Unemployment Rate
Source: U.S. Bureau of Labor Statistics, August 2015
2.8%
2.9%
6.8%
6.7%
6.6%

Presented by:
11%
9%
9%
0.3%
-2%
-3%
-6%
-12%
-14%
-18%
Health Care
Bus. & Prof. Services
Leisure & Hospitality
Education
Trade & Transportation
Finance
Government
News & Entertainment
Manufacturing
Construction
Employment Change from Pre‐2011 Peak
Source: U.S. Bureau of Labor Statistics
Presented by:
2¾%—4%
4%—5%
5%—6%
6%—7%
Unemployment Rate
Source: U.S. Bureau of Labor Statistics, August 2015
2.8%
2.9%
6.8%
6.7%
6.6%

Presented by:
0%
5%
10%
15%
1965 1975 1985 1995 2005 2015
Source: U.S. Bureau of Labor Statistics
Underemployed
10.0%
5.1%Unemployed
Unemployment Rate
10.8%
Presented by:
(2.5)
(2.0)
(1.5)
(1.0)
(0.5)
0.0
0.5
1.0
1.5
1965 1975 1985 1995 2005 2015Source: U.S. Bureau of Labor Statistics
8.7 Million Lost
12.1 Million Recovered
in 60 months
Payroll GrowthMillions Quarterly
Presented by:
Consumer Spending
-3%
0%
3%
6%
9%
12%
1965 1975 1985 1995 2005 2015
Source: U.S. Bureau of Economic Analysis
through August
Annual Growth
Presented by:
Consumer Spending
‐3%
0%
3%
6%
9%
12%
1965 1975 1985 1995 2005 2015
Source: U.S. Bureau of Economic Analysis
throughAugust
Annual Growth
Presented by:
Source: U.S. Bureau of Economic Analysis
-1%
0%
1%
2%
3%
4%
1960s 1980s 2000s 2011 2013 2015
Net ExportsGovernmentBusiness InventoriesBusiness InvestmentConsumers
Contributions to Inflation‐Adjusted GDP Growth
First Half
Presented by:
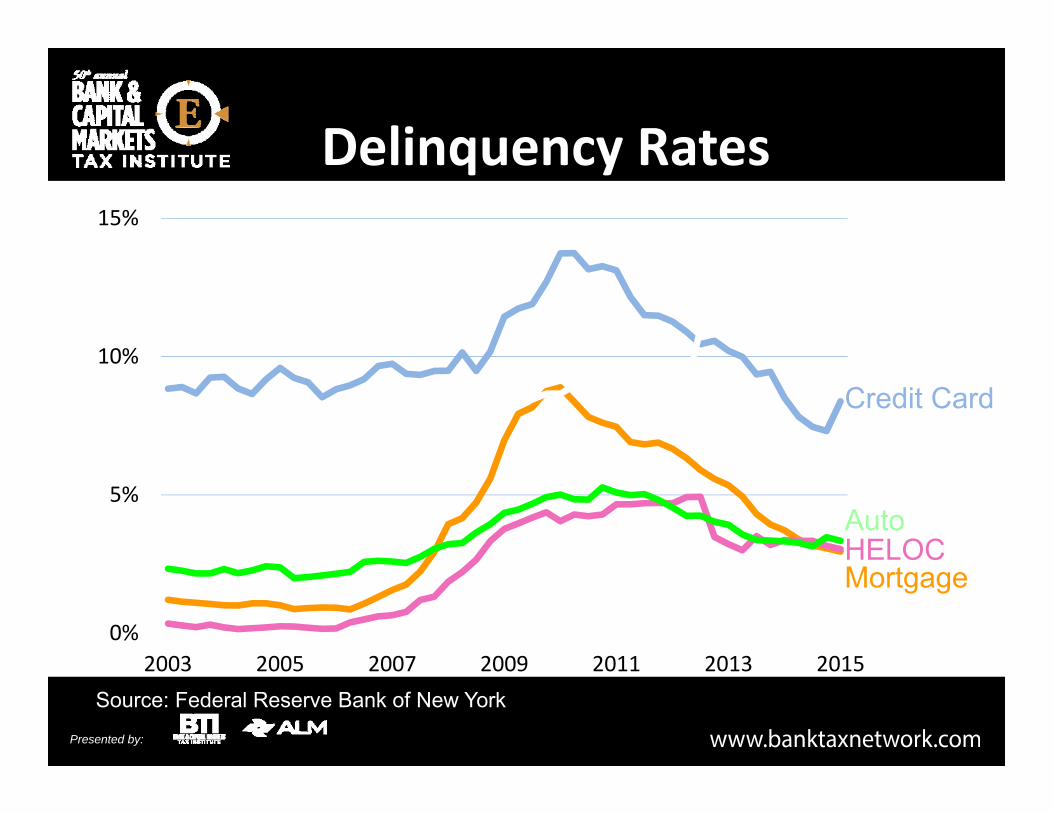
Delinquency Rates
0%
5%
10%
15%
2003 2005 2007 2009 2011 2013 2015Source: Federal Reserve Bank of New York
Mortgage
Credit Card
HELOCAuto
Student
Presented by:
Presidential Election Issue• Permit refinancing of student loans
• Increase tax deductions for tuition
• Incentivize colleges to lower costs
• Increase funding for higher education
• Increase competition with private sector loans
• Increase participation in existing programsSource: Market Watch
Presented by:
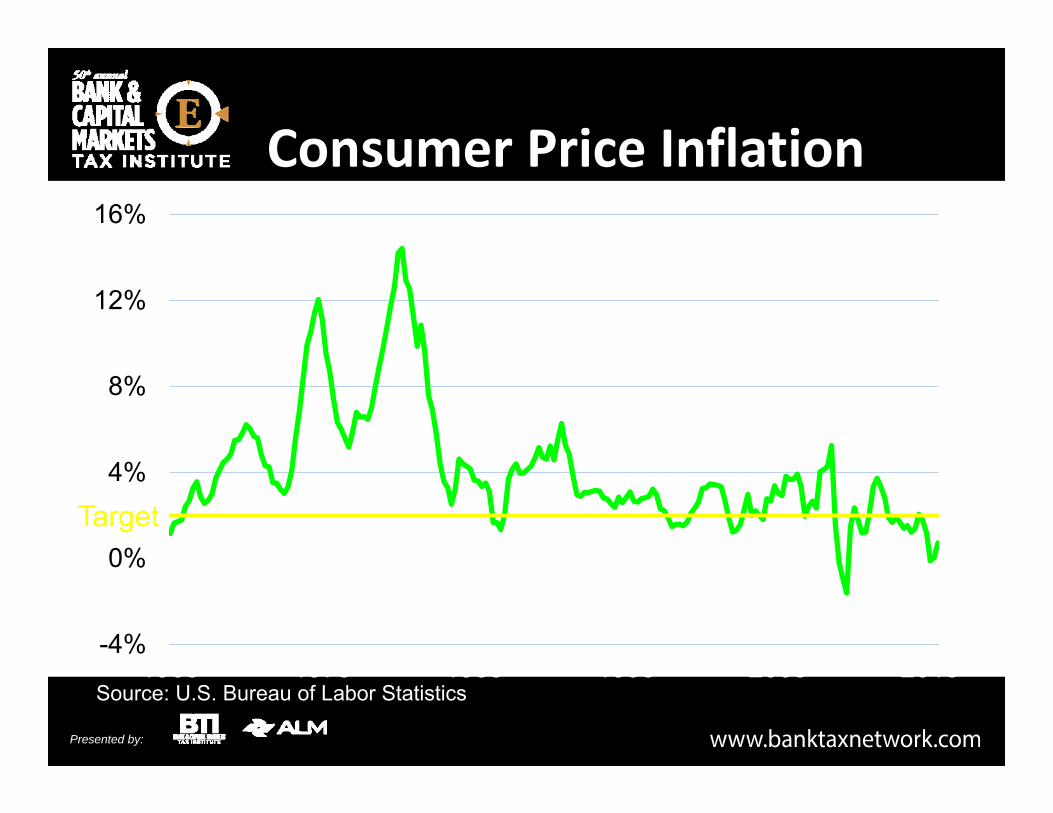
-4%
0%
4%
8%
12%
16%
1965 1975 1985 1995 2005 2015
Target
Source: U.S. Bureau of Labor Statistics
Consumer Price Inflation
Presented by:
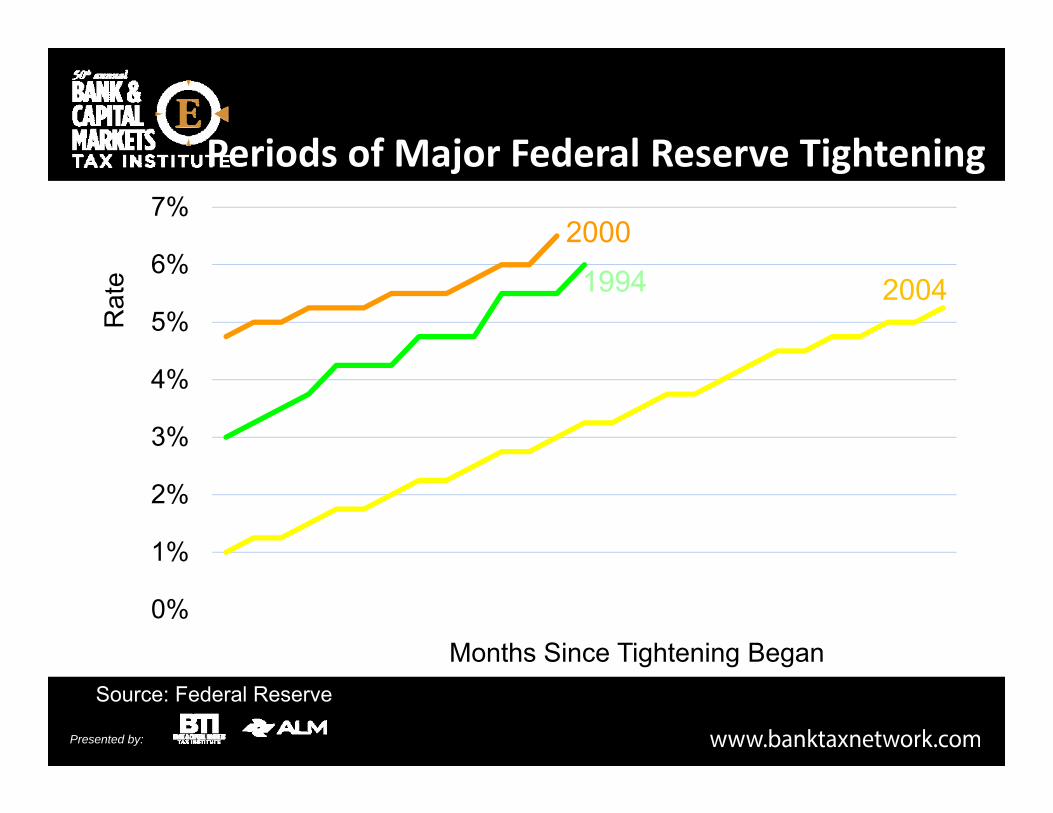
Periods of Major Federal Reserve Tightening
0%
1%
2%
3%
4%
5%
6%
7%
-1 1 3 5 7 9 11 13 15 17 19 21 23 25
Fed
Fund
s Ta
rget
Rat
e
Months Since Tightening Began
1994 2004
2000
Source: Federal Reserve

Presented by:
‐1%
0%
1%
2%
3%
4%
2014 2015 2016 2017 2018
FOMC
Federal Funds Rate Forecast (Year End)
Sources: Federal Reserve (Sept.), Chicago Mercantile Exchange
FF FuturesJuly
October
Presented by:
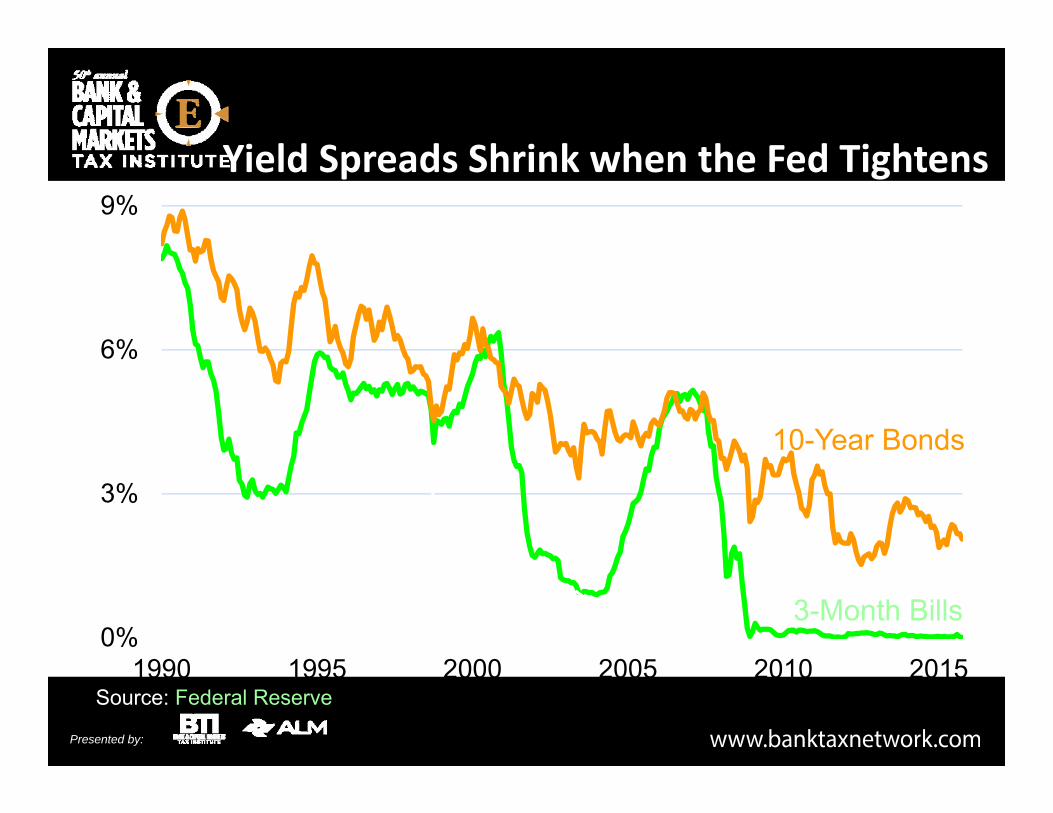
Yield Spreads Shrink when the Fed Tightens
0%
3%
6%
9%
1990 1995 2000 2005 2010 2015
Tightening Began
Source: Federal Reserve
10-Year Bonds
3-Month Bills
Presented by:
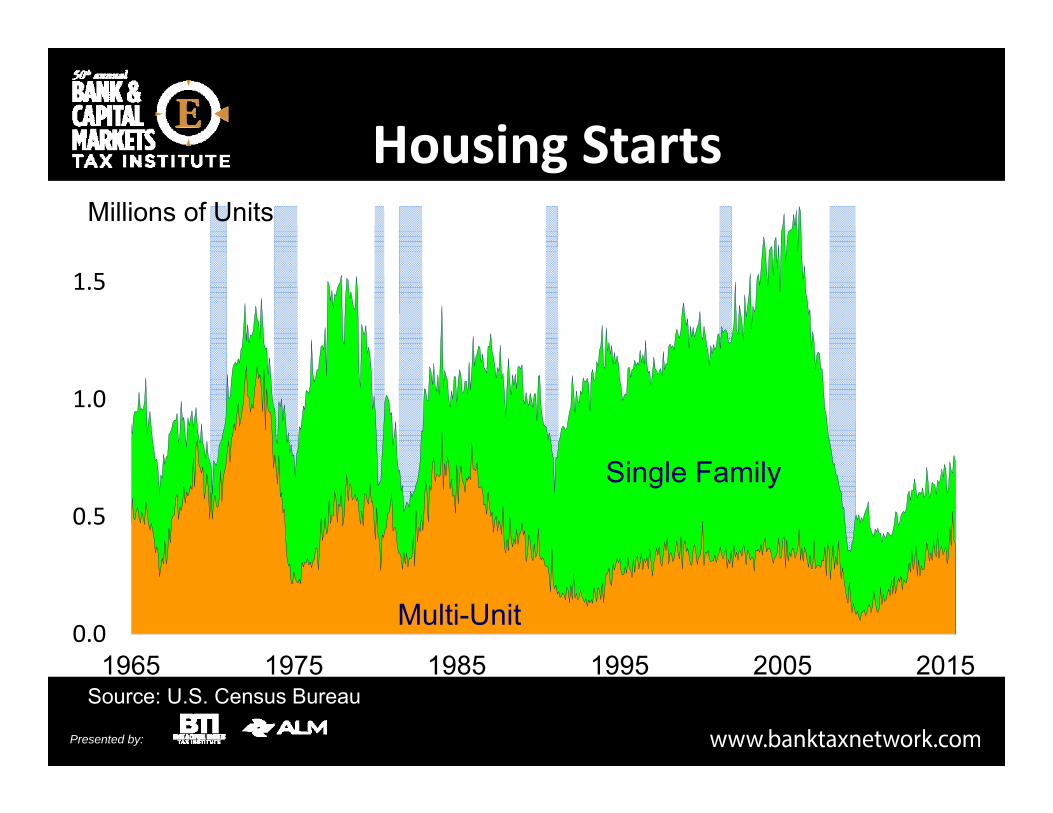
0.0
0.5
1.0
1.5
1965 1975 1985 1995 2005 2015
Housing Starts
Source: U.S. Census Bureau
Millions of Units
Single Family
Multi-Unit
Presented by:
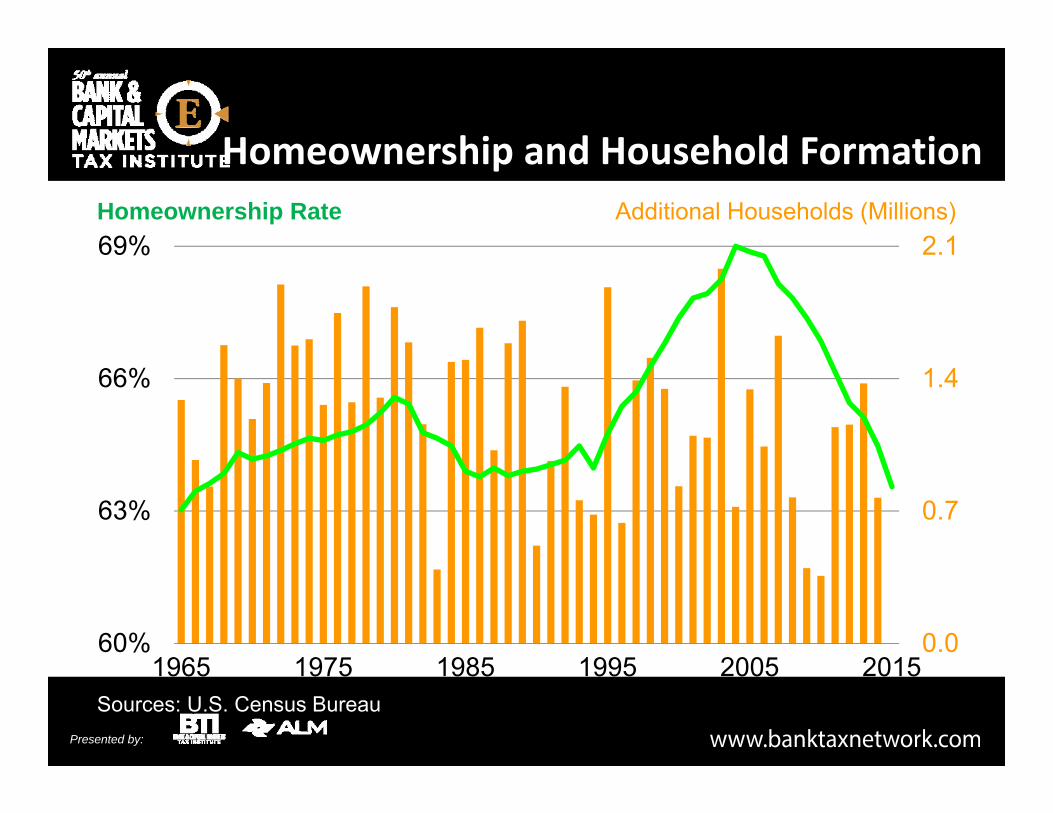
Homeownership and Household Formation
0.0
0.7
1.4
2.1
60%
63%
66%
69%
1965 1975 1985 1995 2005 2015Sources: U.S. Census Bureau
Additional Households (Millions)Homeownership Rate
Presented by:
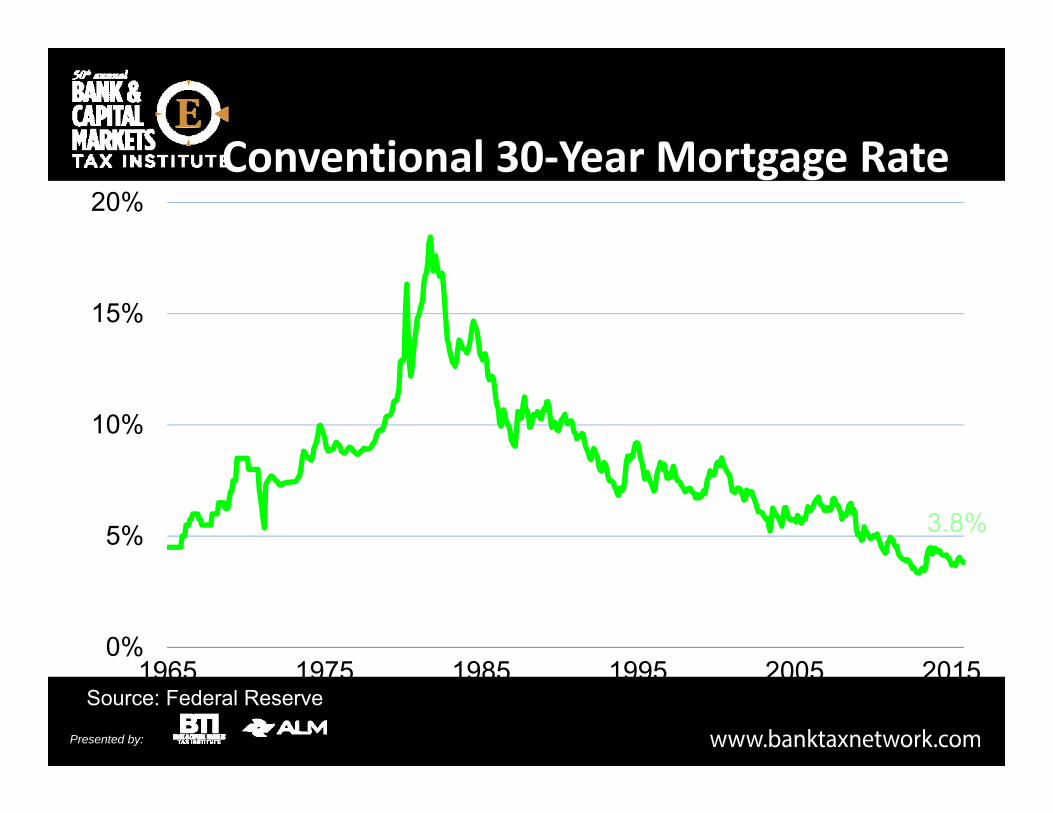
Conventional 30‐Year Mortgage Rate
0%
5%
10%
15%
20%
1965 1975 1985 1995 2005 2015Source: Federal Reserve
3.8%

Presented by:
Home Sales
0
3
6
9
2000 2005 2010 2015
Millions of UnitsSAAR
Sources: U.S. Census Bureau, National Association of Realtors
New Homes
Existing Homes
Presented by:
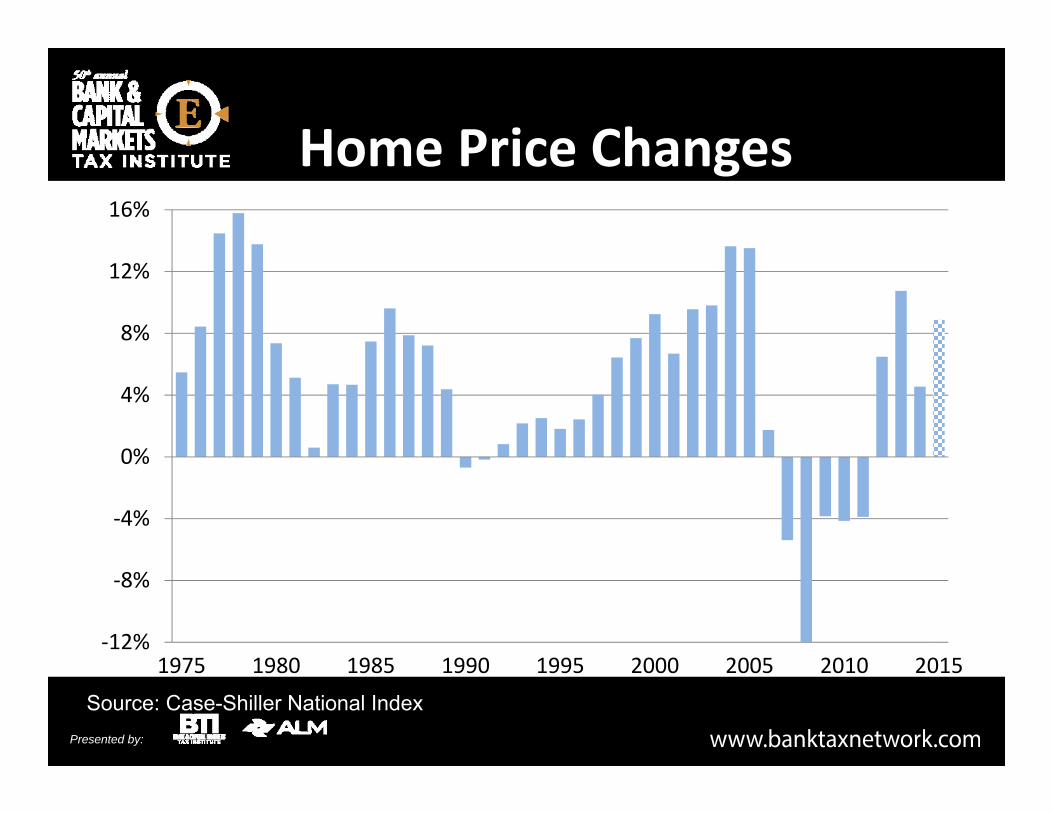
Home Price Changes
‐12%
‐8%
‐4%
0%
4%
8%
12%
16%
1975 1980 1985 1990 1995 2000 2005 2010 2015Source: Case-Shiller National Index
FirstHalf
Presented by:
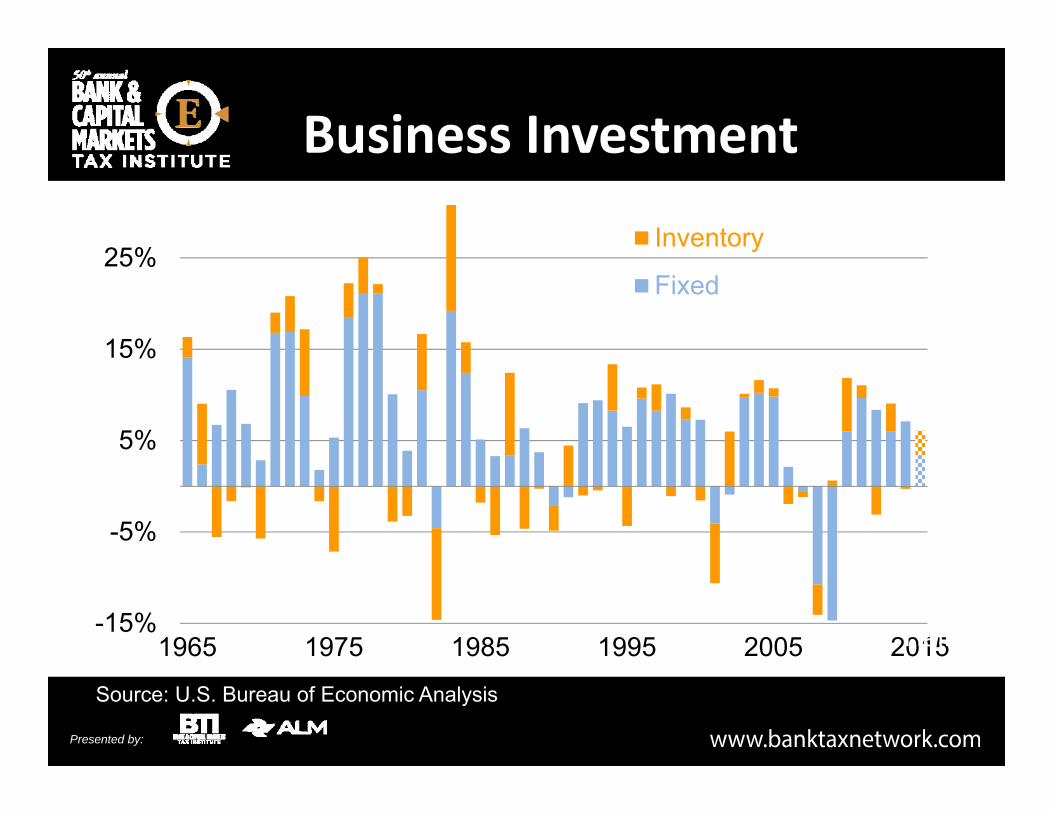
Business Investment
-15%
-5%
5%
15%
25%
1965 1975 1985 1995 2005 2015
Inventory
Fixed
Source: U.S. Bureau of Economic Analysis
FirstHalf
Presented by:
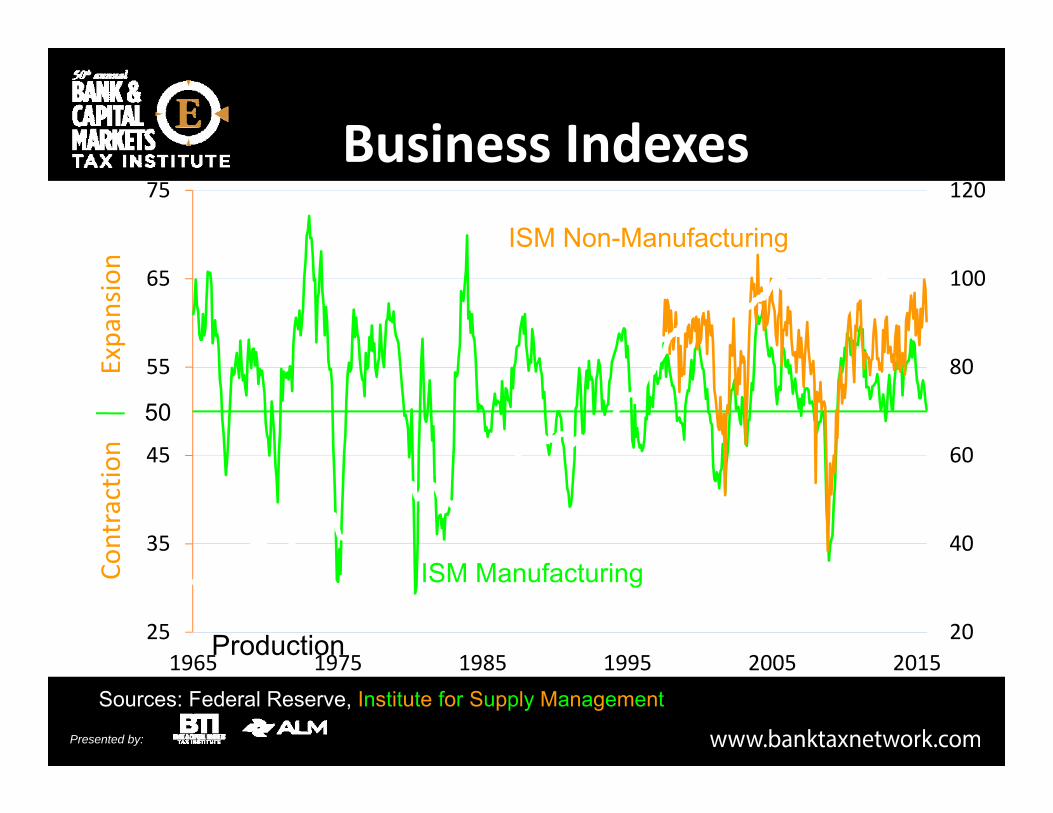
Business Indexes
20
40
60
80
100
120
25
35
45
55
65
75
1965 1975 1985 1995 2005 2015
Industrial Production
Contraction Expansion
ISM Manufacturing
Sources: Federal Reserve, Institute for Supply Management
ISM Non-Manufacturing
50
Presented by:
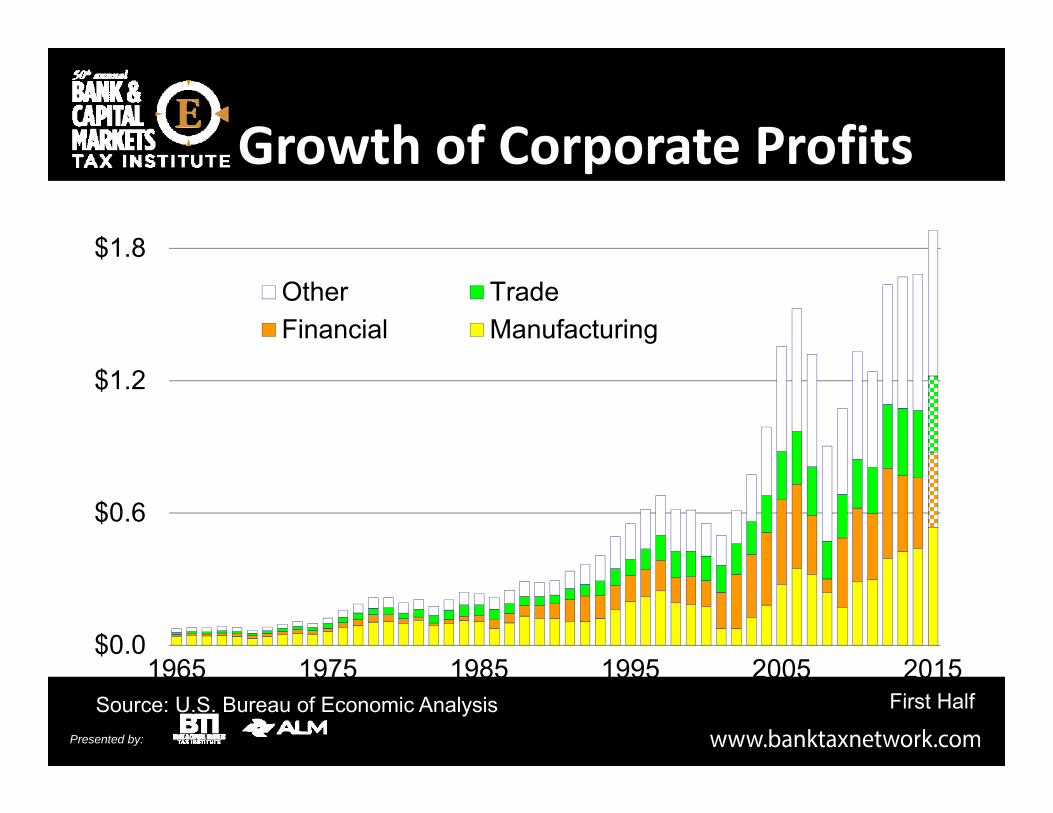
Growth of Corporate Profits
Source: U.S. Bureau of Economic Analysis
$0.0
$0.6
$1.2
$1.8
1965 1975 1985 1995 2005 2015
Other TradeFinancial Manufacturing
With inventory valuation and capital consumption adjustments, SAAR, $Trillions
First Half
Presented by:
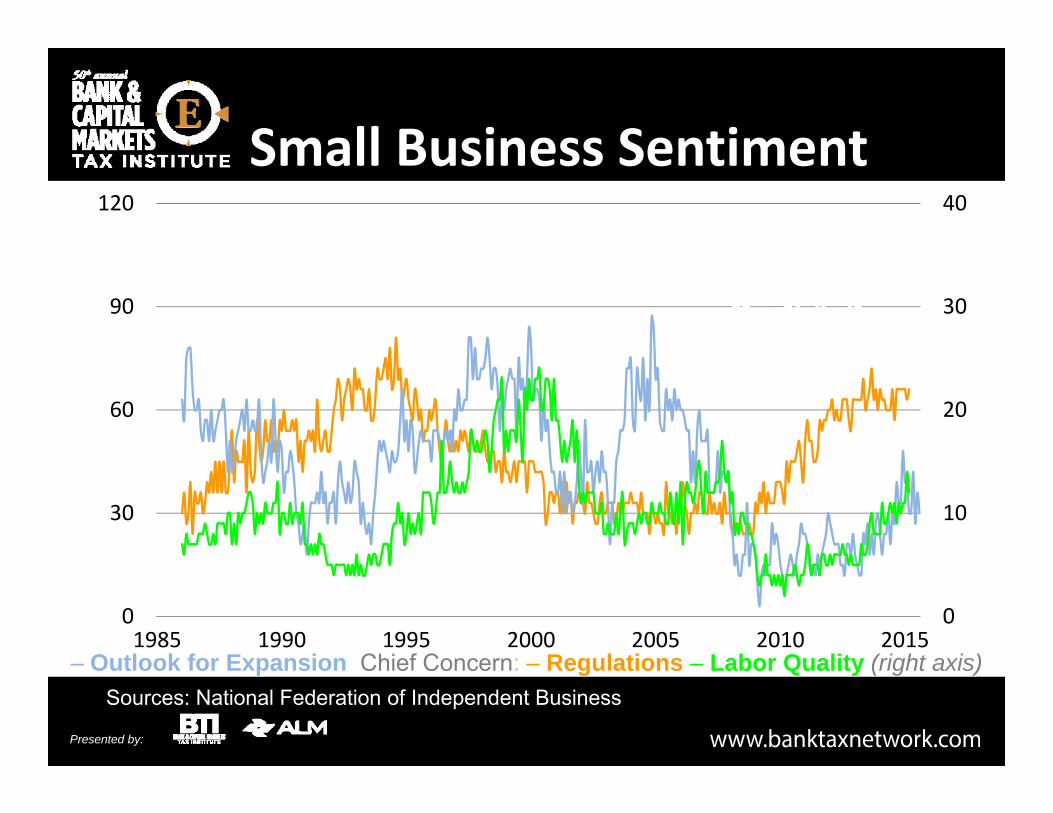
Small Business Sentiment
0
10
20
30
40
0
30
60
90
120
1985 1990 1995 2000 2005 2010 2015
Sources: National Federation of Independent Business
Index of Small Business Optimism (left axis)
– Outlook for Expansion Chief Concern: – Regulations – Labor Quality (right axis)

Presented by:
Labor Productivity Growth
-0.5%
0.0%
0.5%
1.0%
1.5%
2.0%
2.5%
3.0%
1960s 1980s 2000s 2011 2013 2015Source: Bureau of Labor Statistics
FirstHalf

Presented by:
Commercial Real Estate
Source: Green Tree Advisors Commercial Property Price Index
0
30
60
90
120
1998 2000 2002 2004 2006 2008 2010 2012 2014
11.6% Annual Growth Since Mid-2009
Presented by:
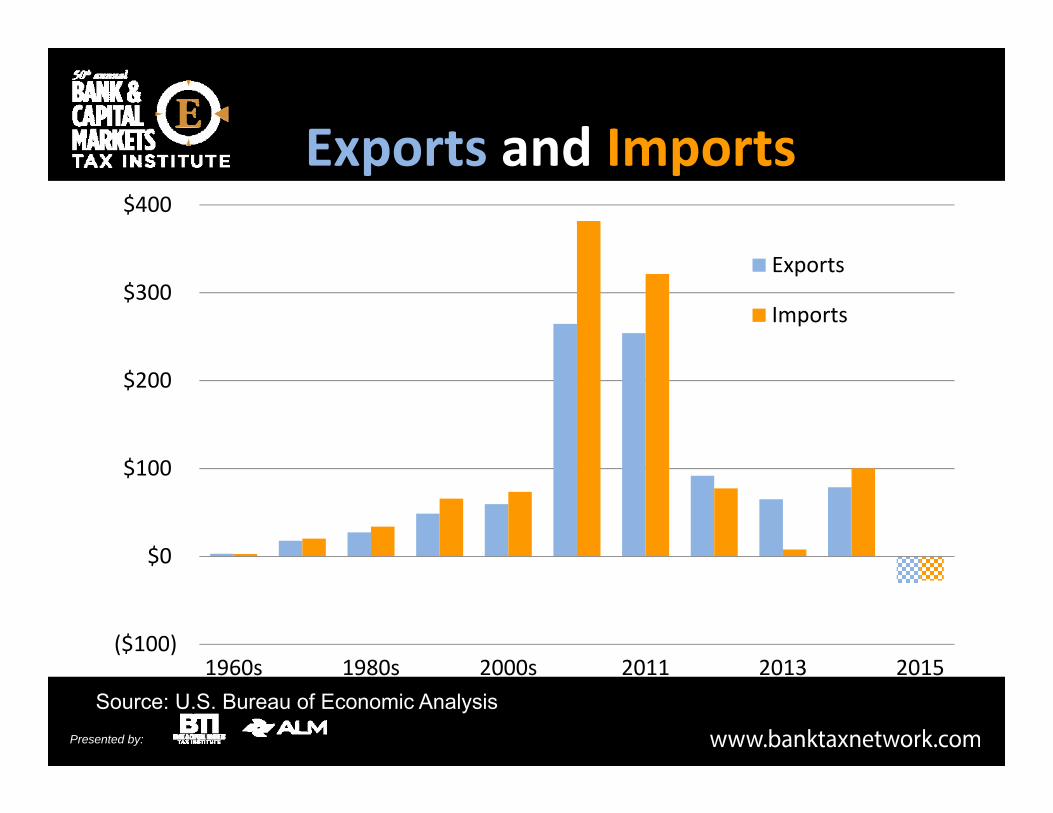
Exports and Imports
($100)
$0
$100
$200
$300
$400
1960s 1980s 2000s 2011 2013 2015
Exports
Imports
Source: U.S. Bureau of Economic Analysis
FirstHalf
Annual ChangeBillions of Dollars
Presented by:
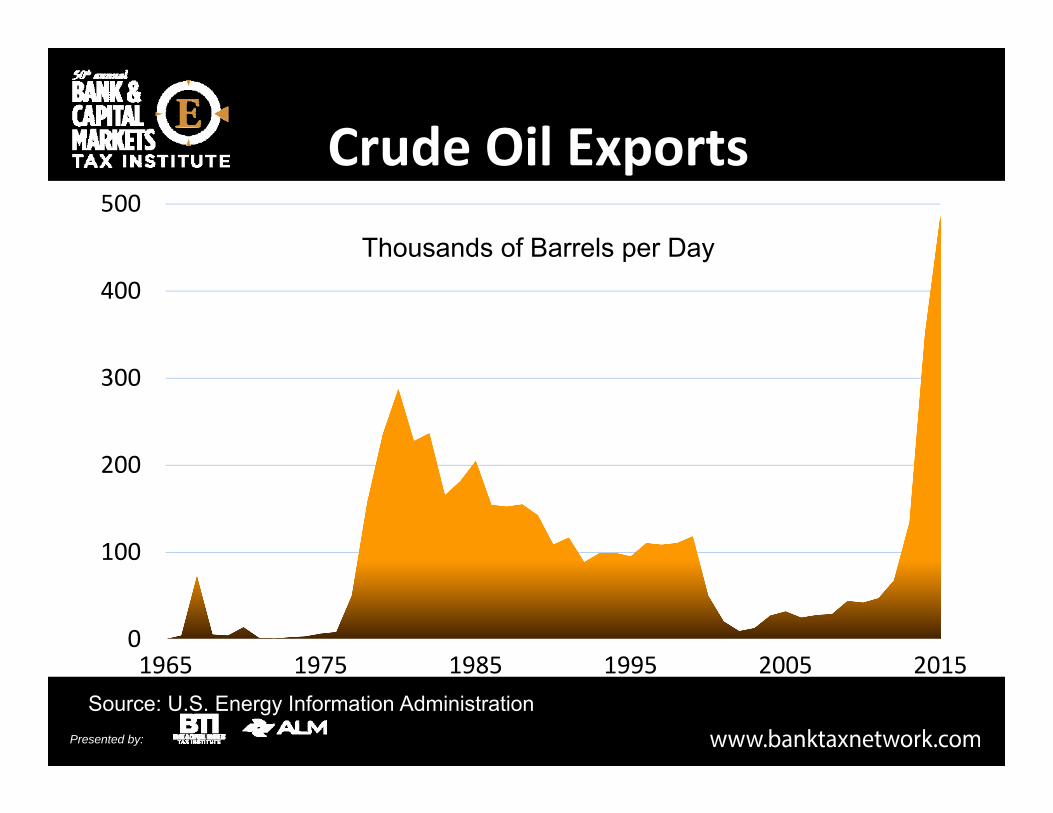
Crude Oil Exports
0
100
200
300
400
500
1965 1975 1985 1995 2005 2015Source: U.S. Energy Information Administration
Thousands of Barrels per Day

Presented by:
Major Currency Trade‐Weighted U.S. Dollar
60
90
120
150
1973 1979 1985 1991 1997 2003 2009 2015Source: Federal Reserve
1973=00

Presented by:
U.S. Exports$248
$172
$134
$82
$56
$33
$32
$19
European Union
Canada
Mexico
China
Japan
South Korea
Brazil
India
All other
U.K. Germ Fra IT
$466Source: U.S. Bureau of Economic Analysis
Billions of Dollars in the First Half of 2015
Presented by:
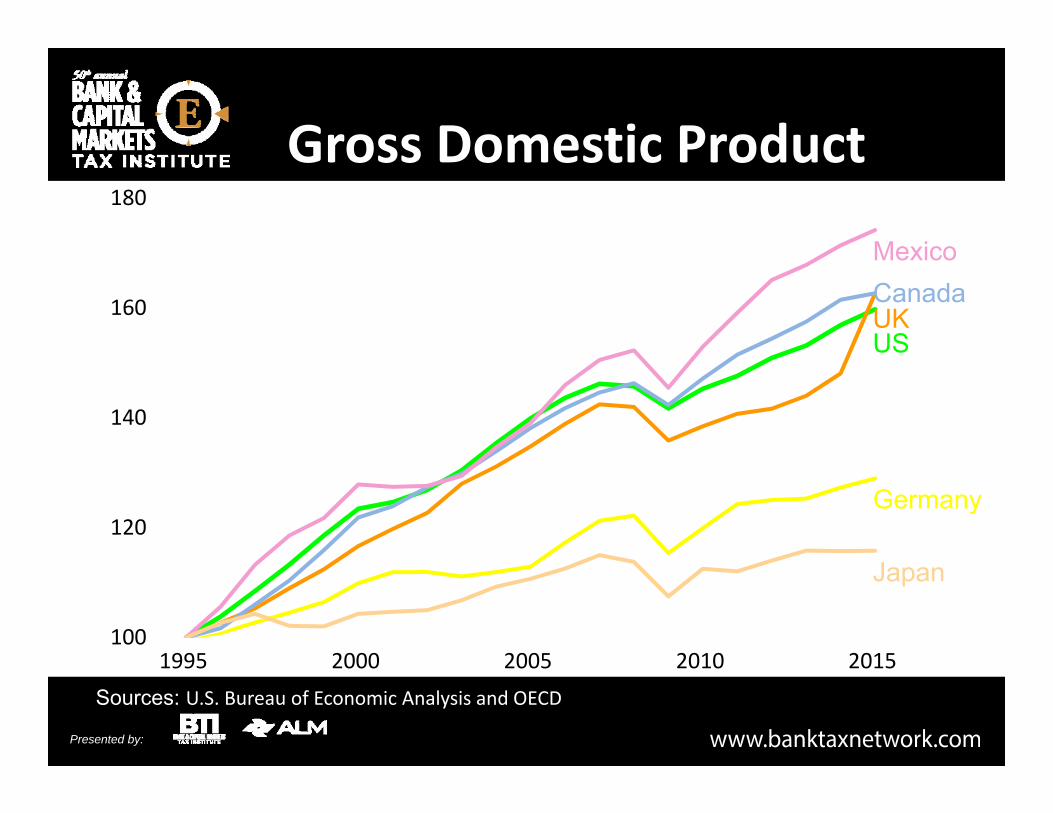
100
120
140
160
180
1995 2000 2005 2010 2015
Gross Domestic Product
Sources: U.S. Bureau of Economic Analysis and OECD
Index (1995=100)
US
France
Japan
CanadaMexico
UK
Germany

Presented by:
GDP Growth Slowing in Emerging Nations
0%
3%
6%
9%
12%
Brazil China India South Korea
1960s 1970s 1980s 1990s 2000s 2010s
Source: International Monetary Fund
Presented by:
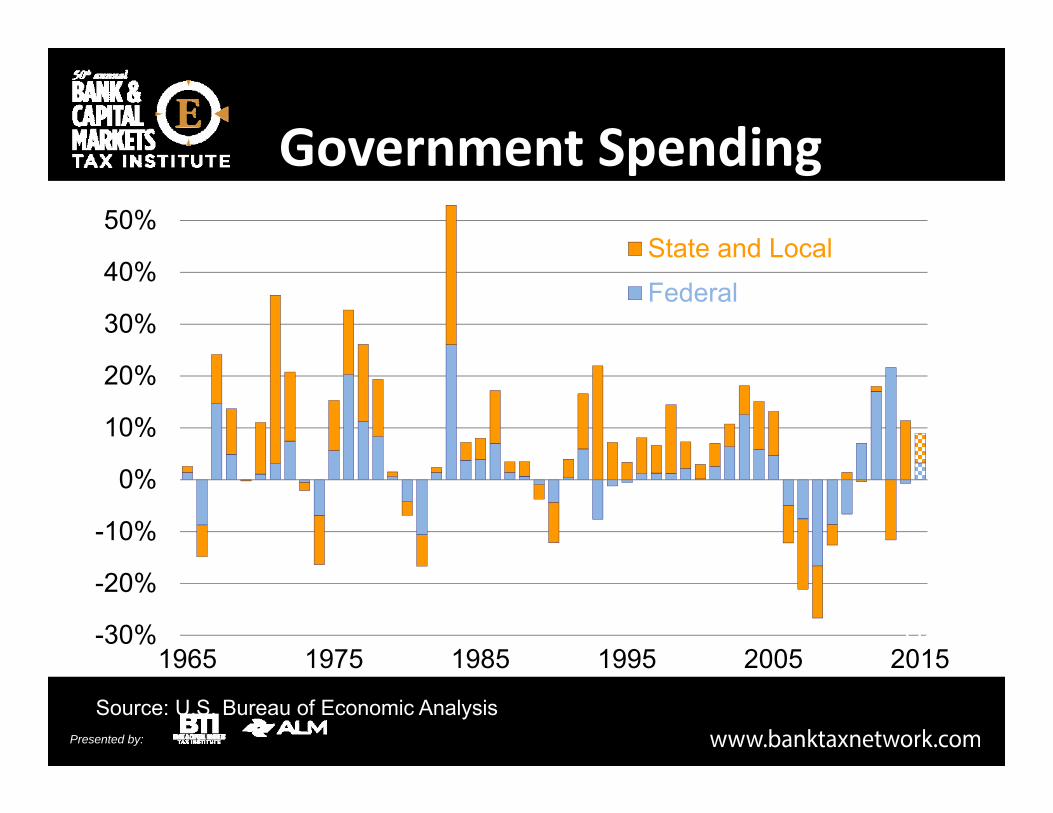
Government Spending
-30%
-20%
-10%
0%
10%
20%
30%
40%
50%
1965 1975 1985 1995 2005 2015
State and Local
Federal
Source: U.S. Bureau of Economic Analysis
FirstHalf
Growth Rate
Presented by:
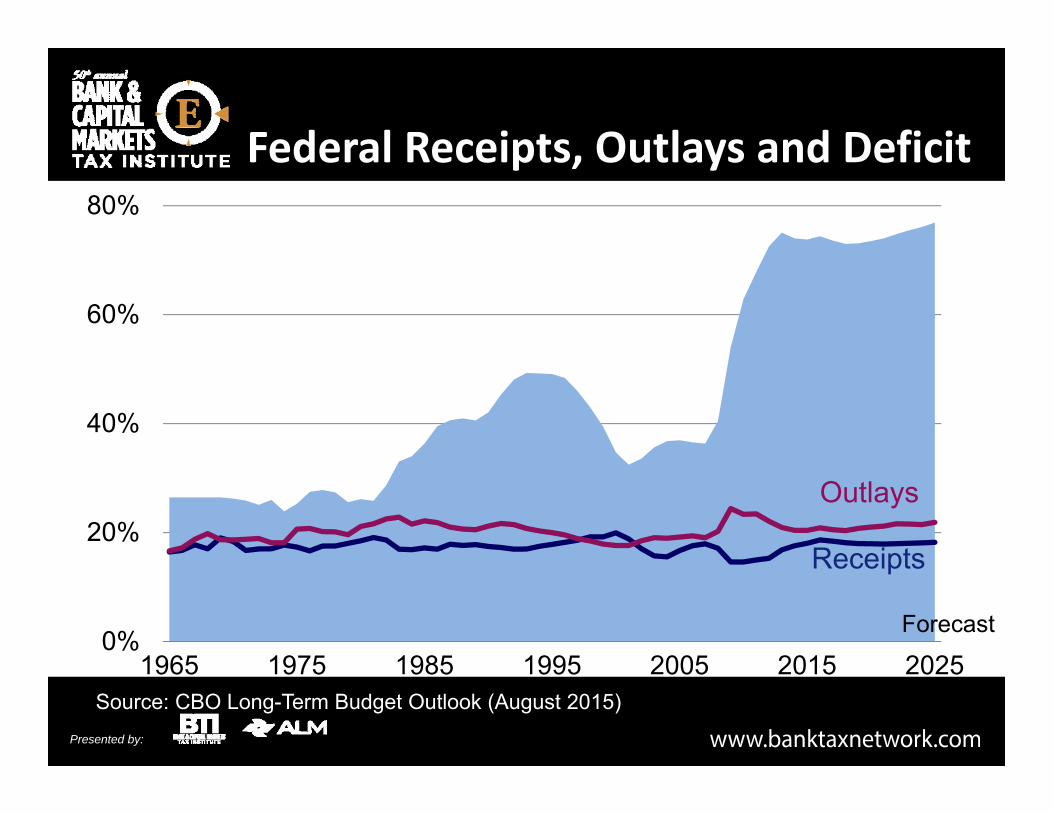
Federal Receipts, Outlays and Deficit
0%
20%
40%
60%
80%
1965 1975 1985 1995 2005 2015 2025
Receipts
Outlays
Forecast
Percent of GDP
Source: CBO Long-Term Budget Outlook (August 2015)
Presented by:
Long‐Term Structural ImbalanceThe long‐term fiscal problem cannot be solved by:
• a growing economy,
• eradicating fraud, waste and abuse,
• pulling U.S. troops out of the Middle East and cutting defense,
• restraining discretionary spending, and
• eliminating Congressional earmarks.
Source: U.S. Congressional Budget Office
Presented by:
Conclusion: Stress Points• Concentration of Income and Wealth• Fed Lift‐off and Interest Rates• Housing Recovery• Student Debt• Business Capital Formation• Foreign Economies• Government Finances
Presented by:
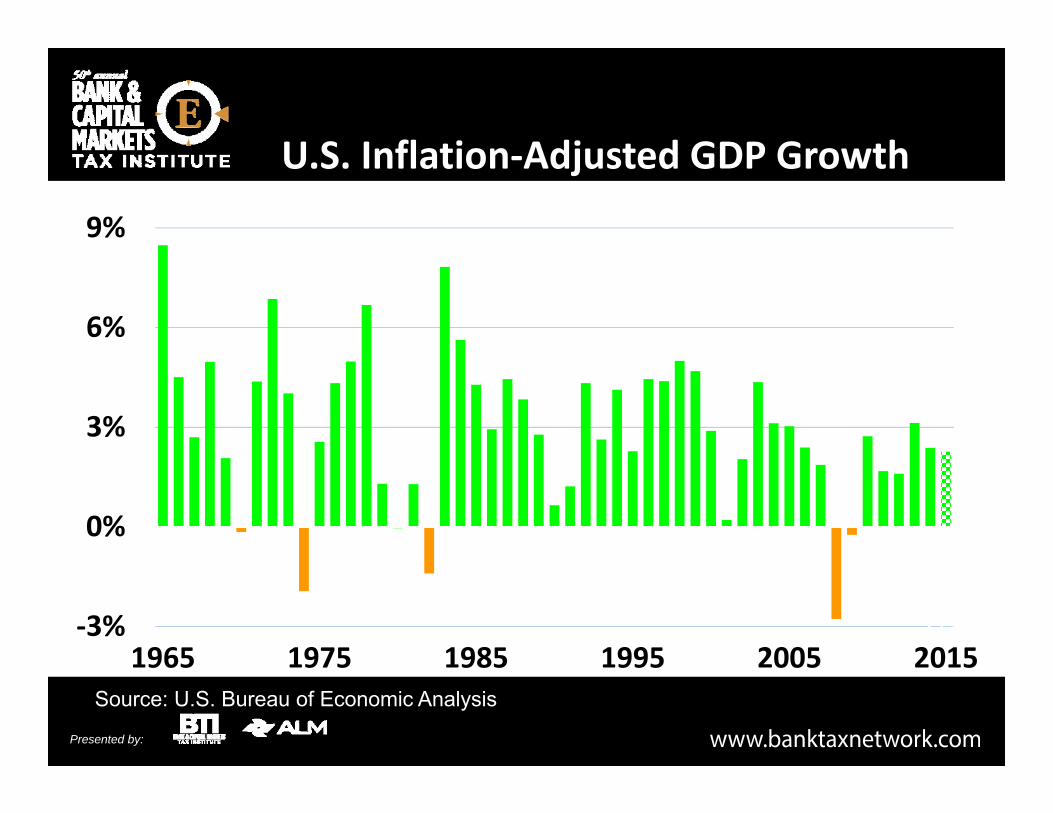
U.S. Inflation‐Adjusted GDP Growth
‐3%
0%
3%
6%
9%
1965 1975 1985 1995 2005 2015Source: U.S. Bureau of Economic Analysis
FirstHalf

Presented by:
0
500
1000
1500
2000
2005 2007 2009 2011 2013 2015
S&P 500 Index
Source: Standard & Poor’s
Up 164%in 6½ years
Presented by:
U.S. Traditional Advantages• Highly diverse economy
• Robust entrepreneurial culture
• Flexible capital and labor markets
→ Technological leader
→ Strong global competitor
Presented by:
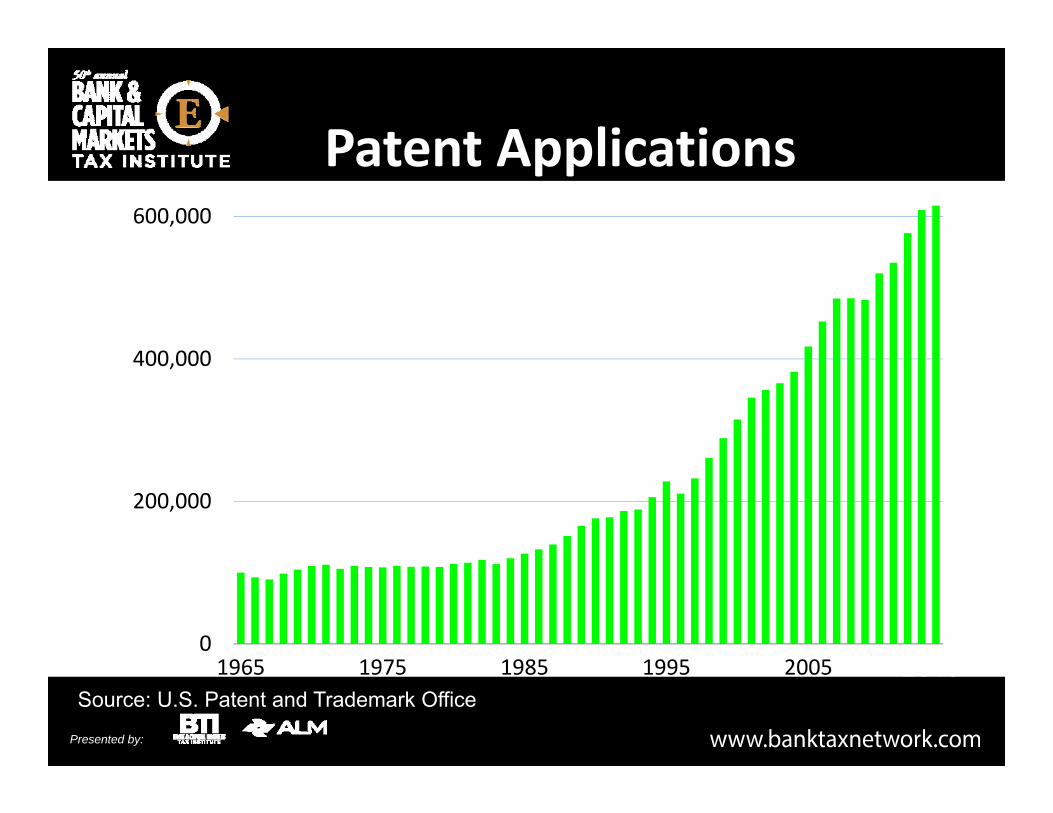
Patent Applications
0
200,000
400,000
600,000
1965 1975 1985 1995 2005Source: U.S. Patent and Trademark Office
2015

Presented by:
Related Documents


