Aurora's Technological and Research Institute Department of Civil 1 Strength of Materials STRENGTH OF MATERIALS LAB MANUAL B.Tech II Year – I SEM DEPARTMENT OF CIVIL ENGINEERING Aurora’s Technological & Research Institute Parvathapur, Uppal, Hyderabad-98 NAME: ________________________________________ ROLL NO: _____________________________________ BRANCH: ______________________________________

Welcome message from author
This document is posted to help you gain knowledge. Please leave a comment to let me know what you think about it! Share it to your friends and learn new things together.
Transcript

Aurora's Technological and Research Institute
Department of Civil 1
Strength of Materials
STRENGTH OF MATERIALSLAB MANUAL
B.Tech II Year – I SEM
DEPARTMENT OF
CIVIL ENGINEERING
Aurora’s Technological & Research InstituteParvathapur, Uppal, Hyderabad-98
NAME: ________________________________________
ROLL NO: _____________________________________
BRANCH: ______________________________________
Aurora's Technological and Research Institute
Department of Civil 2
Strength of Materials
STRENGTH OF MATERIALS LAB
CONTENTS
Sl.No. Experiment Page No
Evaluation of Laboratory Marks Internal 1
Evaluation of Laboratory Marks End Exams 3
Lab code 4
Introduction 5
1. Hardness / Rockwell Hardness Test 6-12
2. Izod & Charpy Impact Test 13-15
3. Bending Test On A Simply Supported Beam 16-21
4. Bending Test On A Cantilever Beam 22-26
5. Spring Test 27-31
6. Torsion Test 32-35
7. Tension Test 36-43
8. Shear test 44-44
9. Compressive strength on concrete 45-46
10. Verification of maxwells reciprocal theorem 47-48
11. Continuous beam deflection test 49-50
12. Effect of loading and unloading beyond the elastic limit 51-52
Aurora's Technological and Research Institute
Department of Civil 3
Strength of Materials
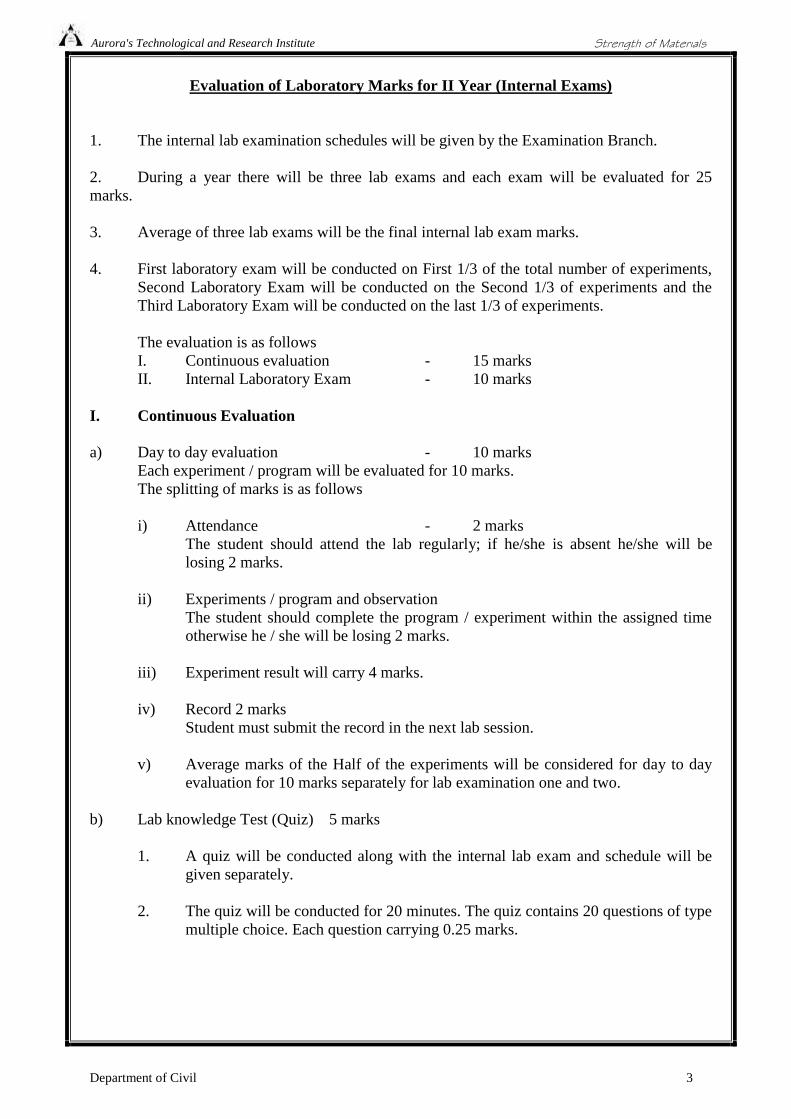
Evaluation of Laboratory Marks for II Year (Internal Exams)
1. The internal lab examination schedules will be given by the Examination Branch.
2. During a year there will be three lab exams and each exam will be evaluated for 25marks.
3. Average of three lab exams will be the final internal lab exam marks.
4. First laboratory exam will be conducted on First 1/3 of the total number of experiments,Second Laboratory Exam will be conducted on the Second 1/3 of experiments and theThird Laboratory Exam will be conducted on the last 1/3 of experiments.
The evaluation is as followsI. Continuous evaluation - 15 marksII. Internal Laboratory Exam - 10 marks
I. Continuous Evaluation
a) Day to day evaluation - 10 marksEach experiment / program will be evaluated for 10 marks.The splitting of marks is as follows
i) Attendance - 2 marksThe student should attend the lab regularly; if he/she is absent he/she will belosing 2 marks.
ii) Experiments / program and observationThe student should complete the program / experiment within the assigned timeotherwise he / she will be losing 2 marks.
iii) Experiment result will carry 4 marks.
iv) Record 2 marksStudent must submit the record in the next lab session.
v) Average marks of the Half of the experiments will be considered for day to dayevaluation for 10 marks separately for lab examination one and two.
b) Lab knowledge Test (Quiz) 5 marks
1. A quiz will be conducted along with the internal lab exam and schedule will begiven separately.
2. The quiz will be conducted for 20 minutes. The quiz contains 20 questions of typemultiple choice. Each question carrying 0.25 marks.
Aurora's Technological and Research Institute
Department of Civil 4
Strength of Materials
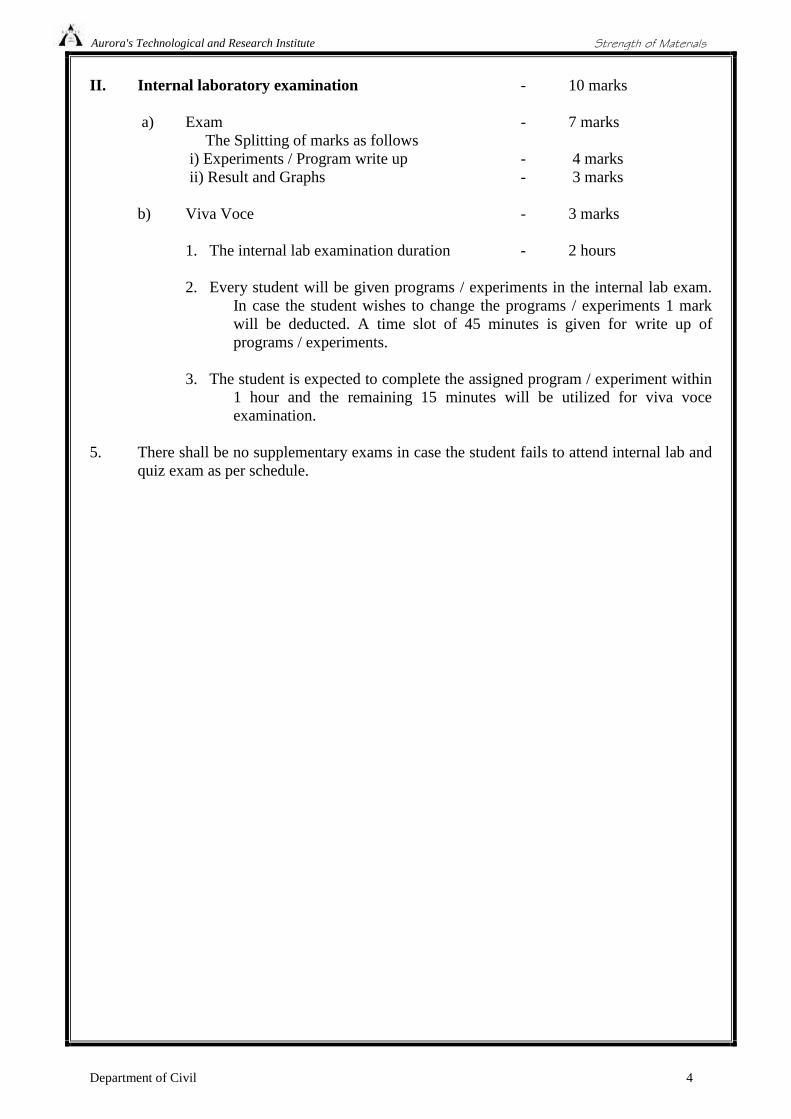
II. Internal laboratory examination - 10 marks
a) Exam - 7 marksThe Splitting of marks as follows
i) Experiments / Program write up - 4 marksii) Result and Graphs - 3 marks
b) Viva Voce - 3 marks
1. The internal lab examination duration - 2 hours
2. Every student will be given programs / experiments in the internal lab exam.In case the student wishes to change the programs / experiments 1 markwill be deducted. A time slot of 45 minutes is given for write up ofprograms / experiments.
3. The student is expected to complete the assigned program / experiment within1 hour and the remaining 15 minutes will be utilized for viva voceexamination.
5. There shall be no supplementary exams in case the student fails to attend internal lab andquiz exam as per schedule.
Aurora's Technological and Research Institute
Department of Civil 5
Strength of Materials
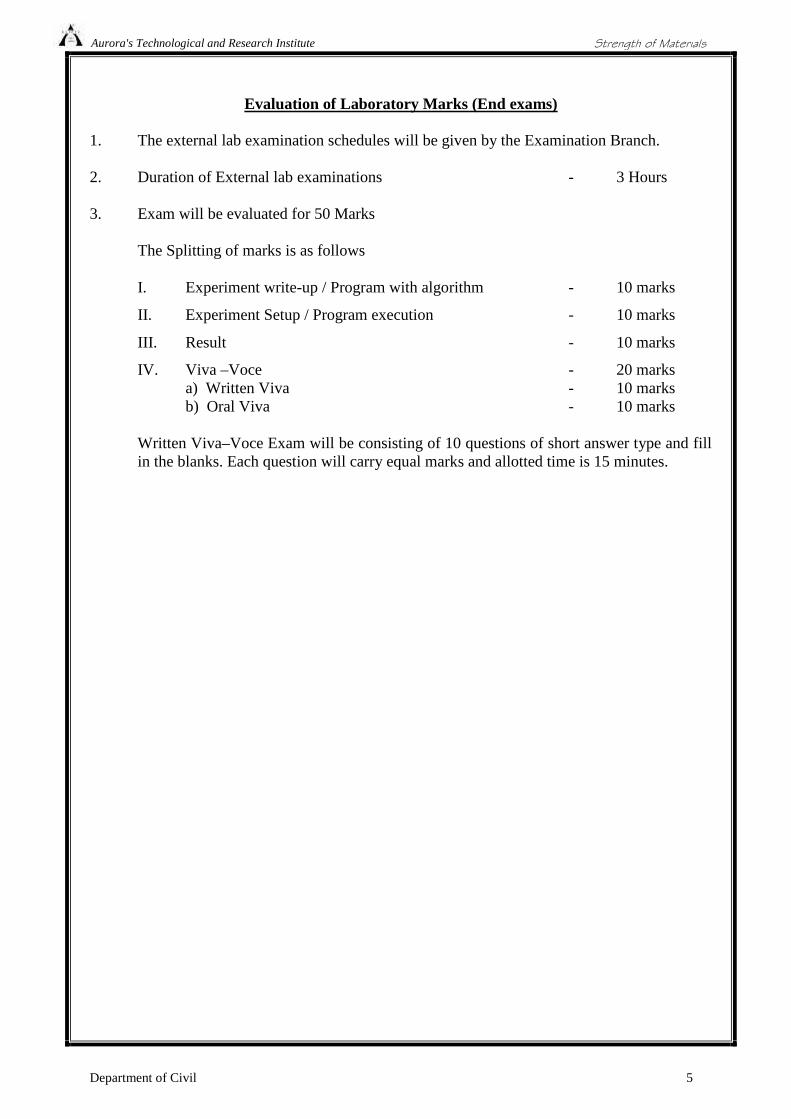
Evaluation of Laboratory Marks (End exams)
1. The external lab examination schedules will be given by the Examination Branch.
2. Duration of External lab examinations - 3 Hours
3. Exam will be evaluated for 50 Marks
The Splitting of marks is as follows
I. Experiment write-up / Program with algorithm - 10 marks
II. Experiment Setup / Program execution - 10 marks
III. Result - 10 marks
IV. Viva –Voce - 20 marksa) Written Viva - 10 marksb) Oral Viva - 10 marks
Written Viva–Voce Exam will be consisting of 10 questions of short answer type and fillin the blanks. Each question will carry equal marks and allotted time is 15 minutes.
Aurora's Technological and Research Institute
Department of Civil 6
Strength of Materials
LAB CODE
1. Students should report to the labs concerned as per the timetable.
2. Students who turn up late to the labs will in no case be permitted to perform theexperiment scheduled for the day.
3. After completion of the experiment, certification of the staff in-charge concerned in theobservation book is necessary.
4. Students should bring a notebook of about 100 pages and should enter thereadings/observations/results into the notebook while performing the experiment.
5. The record of observations along with the detailed experimental procedure of theexperiment performed in the immediate previous session should be submitted andcertified by the staff member in-charge.
6. Not more than three students in a group are permitted to perform the experiment on a setup.
7. The group-wise division made in the beginning should be adhered to, and no mix up ofstudent among different groups will be permitted later.
8. The components required pertaining to the experiment should be collected from Lab- in-charge after duly filling in the requisition form.
9. When the experiment is completed, students should disconnect the setup made by them,and should return all the components/instruments taken for the purpose.
10. Any damage of the equipment or burnout of components will be viewed seriously eitherby putting penalty or by dismissing the total group of students from the lab for thesemester/year.
11. Students should be present in the labs for the total scheduled duration.
12. Students are expected to prepare thoroughly to perform the experiment before coming toLaboratory.
13. Procedure sheets/data sheets provided to the students’ groups should be maintainedneatly and are to be returned after the experiment.
14. DRESS CODE:
Boys - Formal white shirt neatly tucked in, and white trousers, white / black / brown / tanshoes and belt, I-cards worn round neck
Girls - Formal white Salwar Kameez, white / black / brown / tan shoes, I-cards wornround neck
Aurora's Technological and Research Institute
Department of Civil 7
Strength of Materials
INTRODUCTION
Materials which we come across may be classified into elastic, plastic and rigid maerials. Anelastic material undergoes a deformation when subjected to an external loading such that thedeformation disappears on the removal of loading. A plastic material undergoes a continuousdeformation during the period of loading and the deformation is permanent and the material doesnot regain its original dimensions on the removal of the loading. A rigid material does notundergo any deformation when subjected to an external loading.
In practice no material is absolutely elastic nor plastic nor rigid. We attribute these propertieswhen the deformations are within certain limits. Generally we handle a member in its elasticrange. Structural members are all generally designed so as to remain in the elastic conditionunder the action of the working loads.
A material when subjected to an external load system undergoes a deformation. It becomesnecessary to study the deformations in order to determine the conditions under which failure mayoccur. The ability of a part or element of a structure to resist failure by virtue of its strength.The ability to resist deformation is called stiffness. The material will have the ability to offer thenecessary resistance when the deformation is with in a certain limit. A loaded member remainsin equilibrium when the resistance offered by the member against the deformation and theapplied load are in equilibrium. When the member is incapable of offering the necessaryresistance against the external forces, the deformation will continue leading to the failure of themember.
Because of the complexity involved certain simplifying assumptions are made in strengthcalculations:
1. The material of the body has a solid continuous structure.2. Within the limits of the part of the body the material is homogeneous and isotropic i.e., it
has identical properties in all directions at all points3. There are no internal forces in a body prior to loading4. The effect of the system of forces acting on a body is equal to the sum of the effects of
these same forces applied in succession and in any order. This is the principle of superimposition.
5. At points in a body sufficiently away from the points of application of loads, internalforces are independent of the manner in which the loads are applied. This is known asSaint Venant Principle. Theoretical investigations show that points more than 1.5-2 timesthe greatest linear dimension of the area of load transmission from the region of loading adistributed load can be replaced by a concentrated load. Thus the principle enables adistributed load replaced by a point load over a small area.
Aurora's Technological and Research Institute
Department of Civil 8
Strength of Materials
1. ROCKWELL HARDNESS TEST
1. AIM: To determine the Rockwell Hardness of a given test specimen
II. APPARATUS: Rockwell Hardness testing machine, Test specimen.
III. THEORY:
HARDNESS-It is defined as the resistance of a metal to plastic deformation against
Indentation, scratching, abrasion of cutting.
The hardness of a material by this Rockwell hardness test method is measured by the
depth of Penetration of the indenter. The depth of Penetration is inversely proportional to the
hardness. Both ball or diamond cone types of indenters are used in this test. There are three
scales on the machine for taking hardness readings. Scale “A” with load 60 kgf or 588.4 N and
diamond indenter is used for performing tests on thin steel and shallow case hardened steel.
Scale “B” with load 100 kgf or 980.7 N and 1.588 mm dia ball indenter is used for performing
tests on soft steel, malleable iron, copper and aluminum alloys.
First minor load is applied to over come the film thickness on the metal surface. Minor
load also eliminates errors in the depth of measurements due to spring of the machine frame or
setting down of the specimen and table attachments.
The Rockwell hardness is derived from the measurement of the depth of the impression
EP = Depth of penetration due to Minor load of 98.07 N.
Ea = Increase in depth of penetration due to Major load.
E = Permanent increase of depth of indentation under minor load at 98.07 N even after
removal of Major load.
This method of test is suitable for finished or machined parts of simple shapes.
Aurora's Technological and Research Institute
Department of Civil 9
Strength of Materials
IV. PROCEDURE:
1. Select the load by rotating the Knob and fix the suitable indenter.
2. Clean the test-piece and place n the special anvil or work table of the machine.
3. Turn the capstan wheel to elevate the test specimen into contact with the indenter
point.
4. Further turn the wheel for three rotations forcing the test specimen against the
indenter. This will ensure that the Minor load of 98.07 N has been applied
5. Set the pointer on the Scale dial at the appropriate position.
6. Push the lever to apply the Major load. A Dash Pot provided in the loading
mechanism to ensure that the load is applied gradually.
7. As soon as the pointer comes to rest pull the handle in the reverse direction
slowly. This releases the Major, but not Minor load. The pointer will now rotate
in the reverse direction.
8. The Rockwell hardness can be read off the scale dial, on the appropriate scale,
after the pointer comes to rest.
V. OBSERVATIONS:
Material of test piece =
Thickness of test piece =
Hardness Scale used =
Minor Load =
Major Load =
Test No. 1 2 3 4
Hard ness value
VI. PRECAUTIONS:
1. For testing cylindrical test specimen, use V-type platform.
2. Calibrate the machine occasionally using standard test blocks.
Aurora's Technological and Research Institute
Department of Civil 10
Strength of Materials
3. For thin metal prices place another sufficiently thick metal piece between the test
specimen and the platform to avoid any damage which may likely occur to the
platform.
4. After applying Major load, wait for sometime to allow the needle to come to rest.
The waiting time vary from 2 to 8 seconds.
5. The surface of the test piece should be smooth and even and free from oxide scale
and foreign matter.
6. Test specimen should not be subjected to any heating or cold working.
7. The thickness of test piece or of the layer under test should be at least 8 times the
permanent increase of depth of “E”.
8. The distance between the centers of two adjacent indentation should be at least 4
indentation to the edge of the test piece should be at least 2.5 times the diameter
of the indentation.
VII. VIVA QUESTIONS:
3. Define Hardness.
4. Applications of Rockwell Hardness A – Scale, B-Scale, C-Scale.
5. Type of Indentor used in the Three Different Scales of Rockwell Hardness Test.
6. Different Types of Hardness Testing Methods.
7. Size of the Ball to be used in Ball Indentor of Rockwell Hardness Test.
8. Diameters of the different Balls used in Brinell Hardness Test.
9. Selection of Load in Brinell Hardness Test.
10. Selection of Load in Rockwell Hardness Test.
Aurora's Technological and Research Institute
Department of Civil 11
Strength of Materials
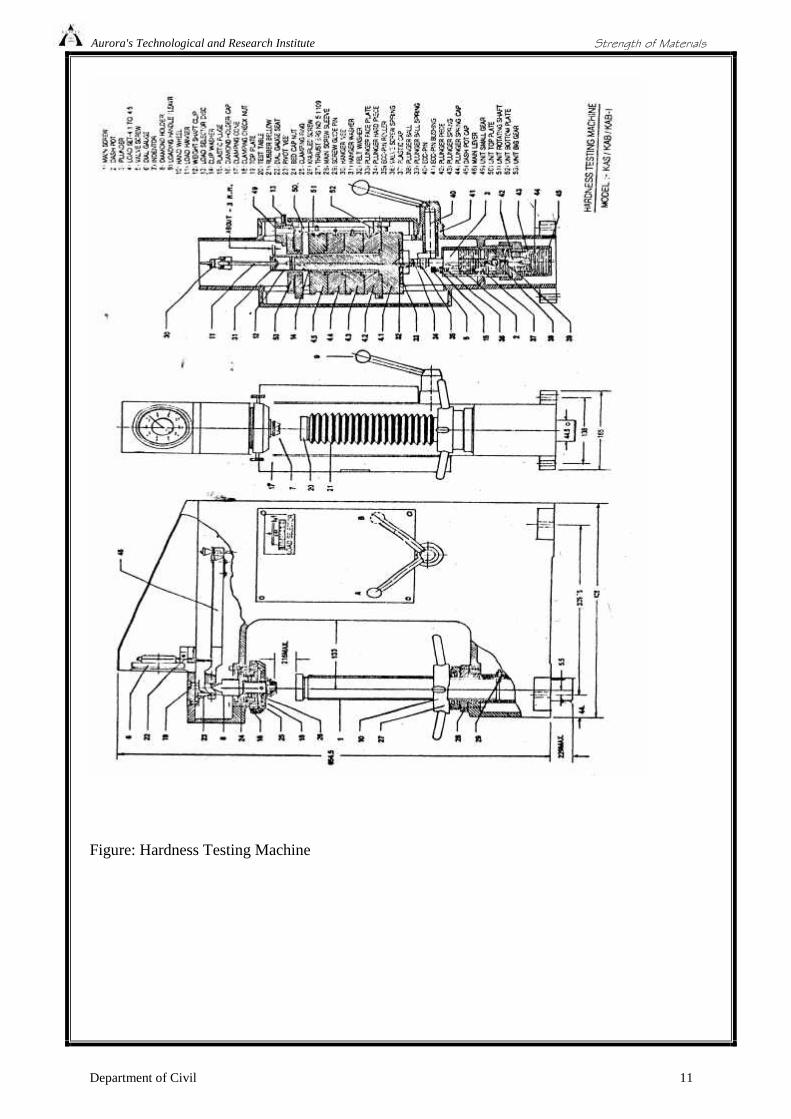
Figure: Hardness Testing Machine
Aurora's Technological and Research Institute
Department of Civil 12
Strength of Materials
BRINELL HARDNESS TEST
I. AIM: To determine the Brinell hardness of the given test specimen.
II. APPARATUS: Brinell hardness machine, test specimen. Brinell Microscope
III. THEORY:
INDENTATION HARDNESS-A number related to the area or to the depth of the
impression made by an indenter or fixed geometry under a known fixed load.
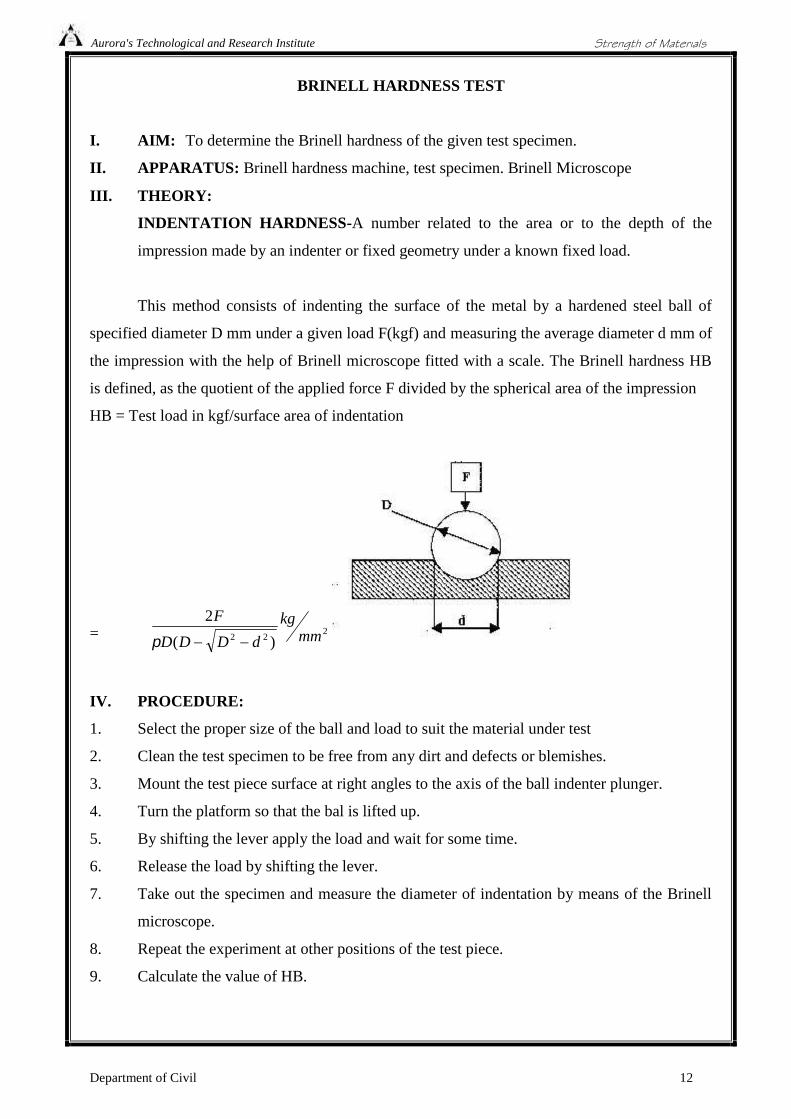
This method consists of indenting the surface of the metal by a hardened steel ball of
specified diameter D mm under a given load F(kgf) and measuring the average diameter d mm of
the impression with the help of Brinell microscope fitted with a scale. The Brinell hardness HB
is defined, as the quotient of the applied force F divided by the spherical area of the impression
HB = Test load in kgf/surface area of indentation
= 222 )(
2mm
kg
dDDD
F
IV. PROCEDURE:
1. Select the proper size of the ball and load to suit the material under test
2. Clean the test specimen to be free from any dirt and defects or blemishes.
3. Mount the test piece surface at right angles to the axis of the ball indenter plunger.
4. Turn the platform so that the bal is lifted up.
5. By shifting the lever apply the load and wait for some time.
6. Release the load by shifting the lever.
7. Take out the specimen and measure the diameter of indentation by means of the Brinell
microscope.
8. Repeat the experiment at other positions of the test piece.
9. Calculate the value of HB.
Aurora's Technological and Research Institute
Department of Civil 13
Strength of Materials
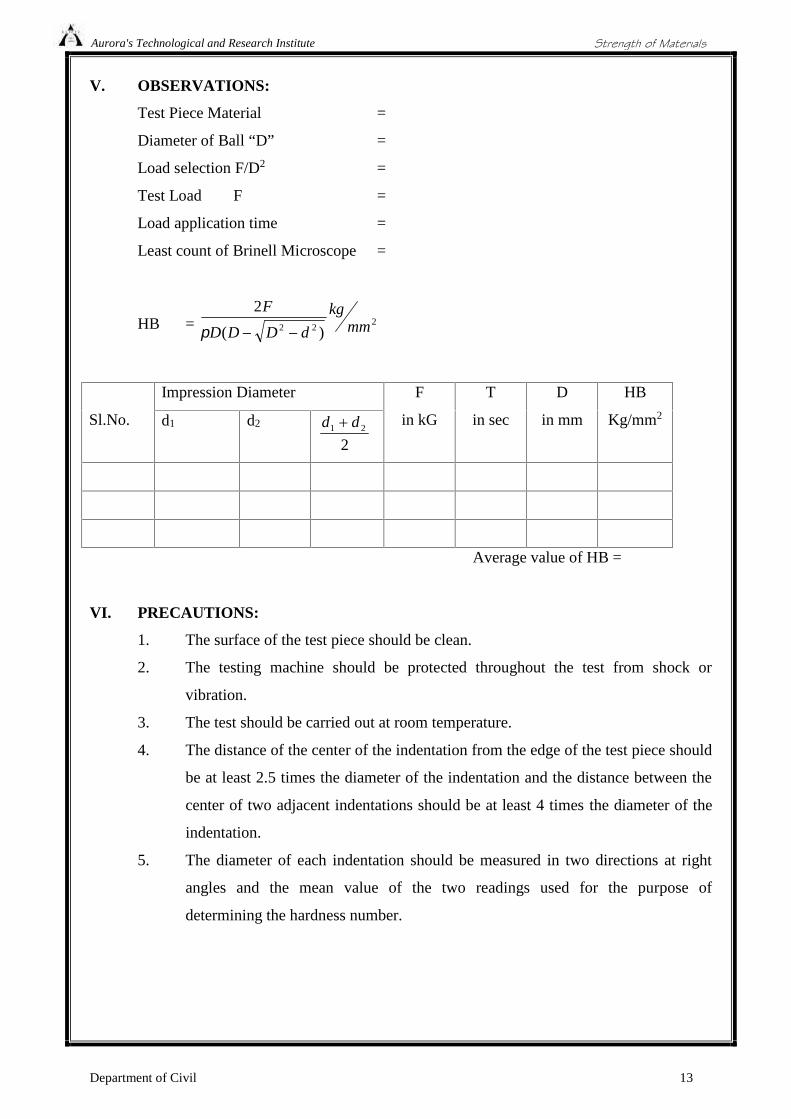
V. OBSERVATIONS:
Test Piece Material =
Diameter of Ball “D” =
Load selection F/D2 =
Test Load F =
Load application time =
Least count of Brinell Microscope =
HB = 222 )(
2mm
kg
dDDD
F
Sl.No.
Impression Diameter F
in kG
T
in sec
D
in mm
HB
Kg/mm2d1 d2
221 dd
Average value of HB =
VI. PRECAUTIONS:
1. The surface of the test piece should be clean.
2. The testing machine should be protected throughout the test from shock or
vibration.
3. The test should be carried out at room temperature.
4. The distance of the center of the indentation from the edge of the test piece should
be at least 2.5 times the diameter of the indentation and the distance between the
center of two adjacent indentations should be at least 4 times the diameter of the
indentation.
5. The diameter of each indentation should be measured in two directions at right
angles and the mean value of the two readings used for the purpose of
determining the hardness number.
Aurora's Technological and Research Institute
Department of Civil 14
Strength of Materials
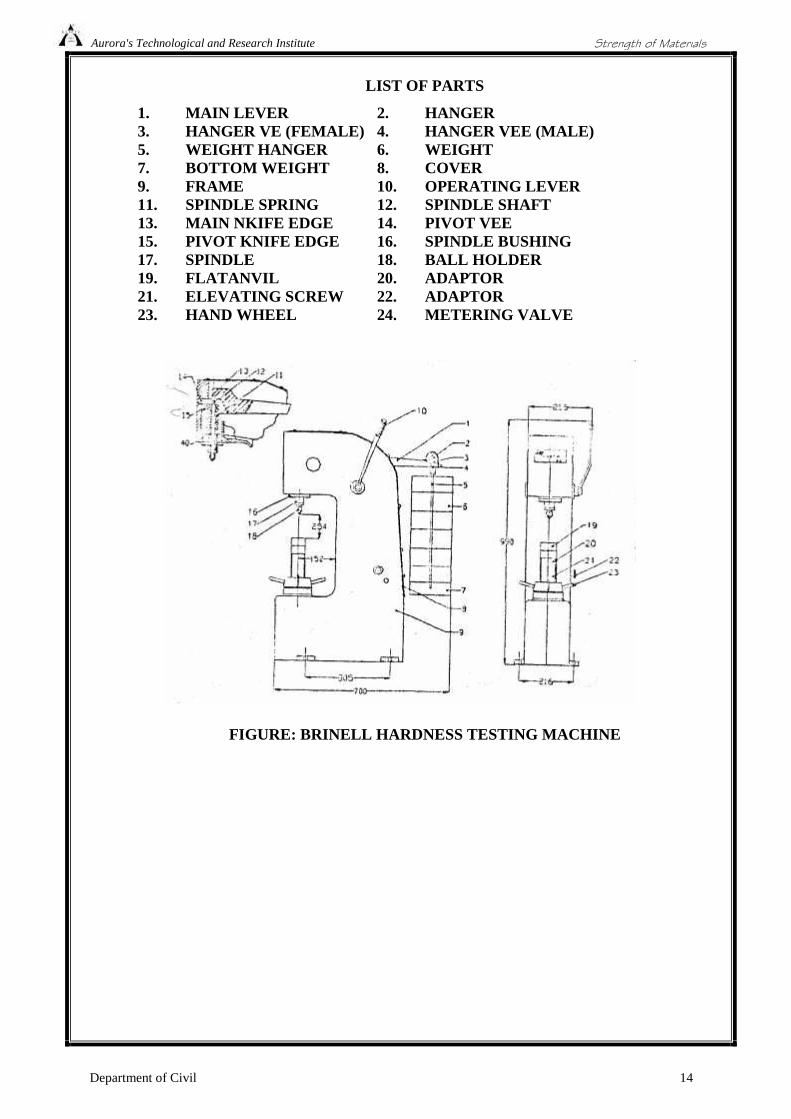
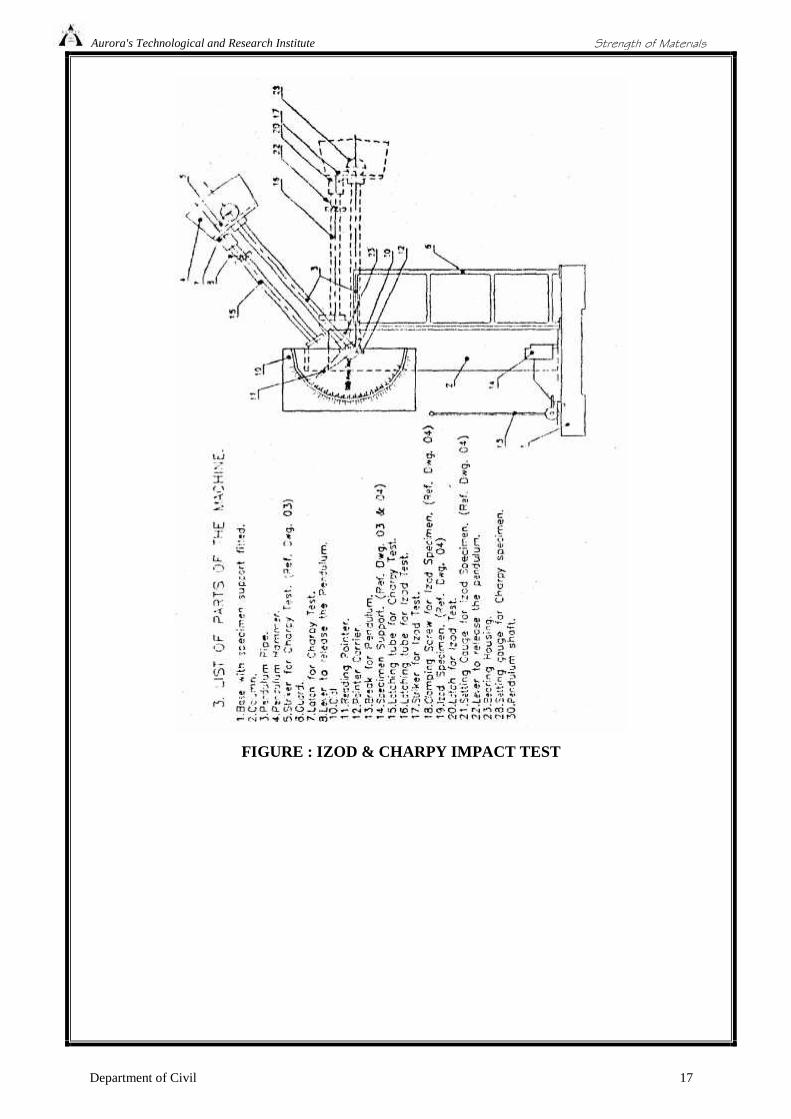
LIST OF PARTS
1. MAIN LEVER 2. HANGER3. HANGER VE (FEMALE) 4. HANGER VEE (MALE)5. WEIGHT HANGER 6. WEIGHT7. BOTTOM WEIGHT 8. COVER9. FRAME 10. OPERATING LEVER11. SPINDLE SPRING 12. SPINDLE SHAFT13. MAIN NKIFE EDGE 14. PIVOT VEE15. PIVOT KNIFE EDGE 16. SPINDLE BUSHING17. SPINDLE 18. BALL HOLDER19. FLATANVIL 20. ADAPTOR21. ELEVATING SCREW 22. ADAPTOR23. HAND WHEEL 24. METERING VALVE
FIGURE: BRINELL HARDNESS TESTING MACHINE
Aurora's Technological and Research Institute
Department of Civil 15
Strength of Materials
2. IZOD IMPACT TEST
I. AIM: To perform the Izod Impact test on Metals.
II. APPARATUS: Izod impact testing machine, test specimen, verniar caliper,
steel rule
III. THEORY:
IMPACT STRENGTH: The high resistance of material to fracture under suddenly applied
loads.
The types of test pieces are used for this test as given.
i. Square cross-section ii. Round cross-section
The specimens may have single, two or three notches. The testing machine should have
the following specifications. Angle between top fce of grips and face holding the specimen
vertical = 900 Angle of tip of hammer = 750 10
Angle between normal to the specimen and the underside face of the
Hammer at striking point = 100 10
Speed of hammer at impact = 3.99 m/sec
Striking energy = 168 N-M or Joules.
Angle of drop of pendulum = 900
Effective weight of pendulum = 21.79 kg.
Minimum value of scale graduation = 2 Joules.
Permissible total friction loss of corresponding energy = 0.50%
Distance from axis of rotation of distance between base of specimen notch and the point of
specimen hit by the hammer = 22 mm 0.5 mm.
The longitudinal Axis of the test piece shall lie in the plane of swing of the center of gravity of
the hammer. The notch shall be positioned so that it is in the plane of the hammer. The notch
shall be positioned so that its plane of symmetry coincides with the top face of the grips. For
setting the specimen. The notch impact strength I is calculated according to the following
relation.
I=K/A
Where I = Impact Strength in Joules/m2
Aurora's Technological and Research Institute
Department of Civil 16
Strength of Materials
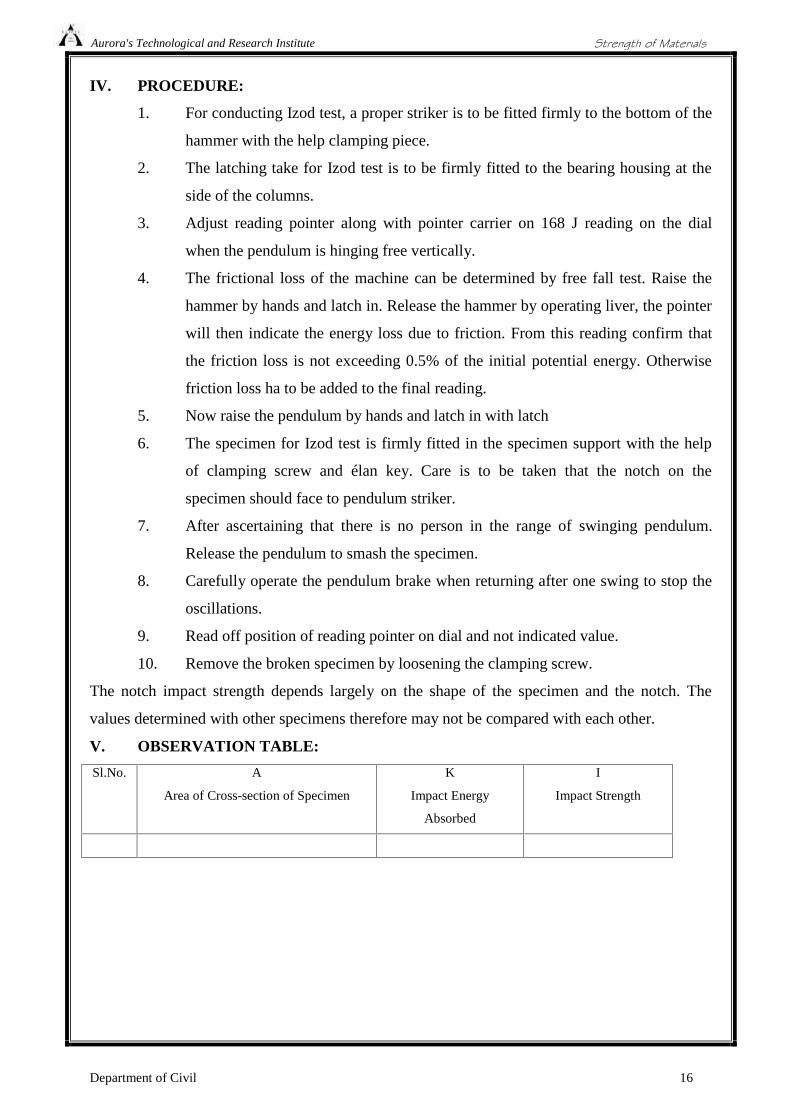
IV. PROCEDURE:
1. For conducting Izod test, a proper striker is to be fitted firmly to the bottom of the
hammer with the help clamping piece.
2. The latching take for Izod test is to be firmly fitted to the bearing housing at the
side of the columns.
3. Adjust reading pointer along with pointer carrier on 168 J reading on the dial
when the pendulum is hinging free vertically.
4. The frictional loss of the machine can be determined by free fall test. Raise the
hammer by hands and latch in. Release the hammer by operating liver, the pointer
will then indicate the energy loss due to friction. From this reading confirm that
the friction loss is not exceeding 0.5% of the initial potential energy. Otherwise
friction loss ha to be added to the final reading.
5. Now raise the pendulum by hands and latch in with latch
6. The specimen for Izod test is firmly fitted in the specimen support with the help
of clamping screw and élan key. Care is to be taken that the notch on the
specimen should face to pendulum striker.
7. After ascertaining that there is no person in the range of swinging pendulum.
Release the pendulum to smash the specimen.
8. Carefully operate the pendulum brake when returning after one swing to stop the
oscillations.
9. Read off position of reading pointer on dial and not indicated value.
10. Remove the broken specimen by loosening the clamping screw.
The notch impact strength depends largely on the shape of the specimen and the notch. The
values determined with other specimens therefore may not be compared with each other.
V. OBSERVATION TABLE:
Sl.No. A
Area of Cross-section of Specimen
K
Impact Energy
Absorbed
I
Impact Strength
Aurora's Technological and Research Institute
Department of Civil 17
Strength of Materials
FIGURE : IZOD & CHARPY IMPACT TEST
Aurora's Technological and Research Institute
Department of Civil 18
Strength of Materials
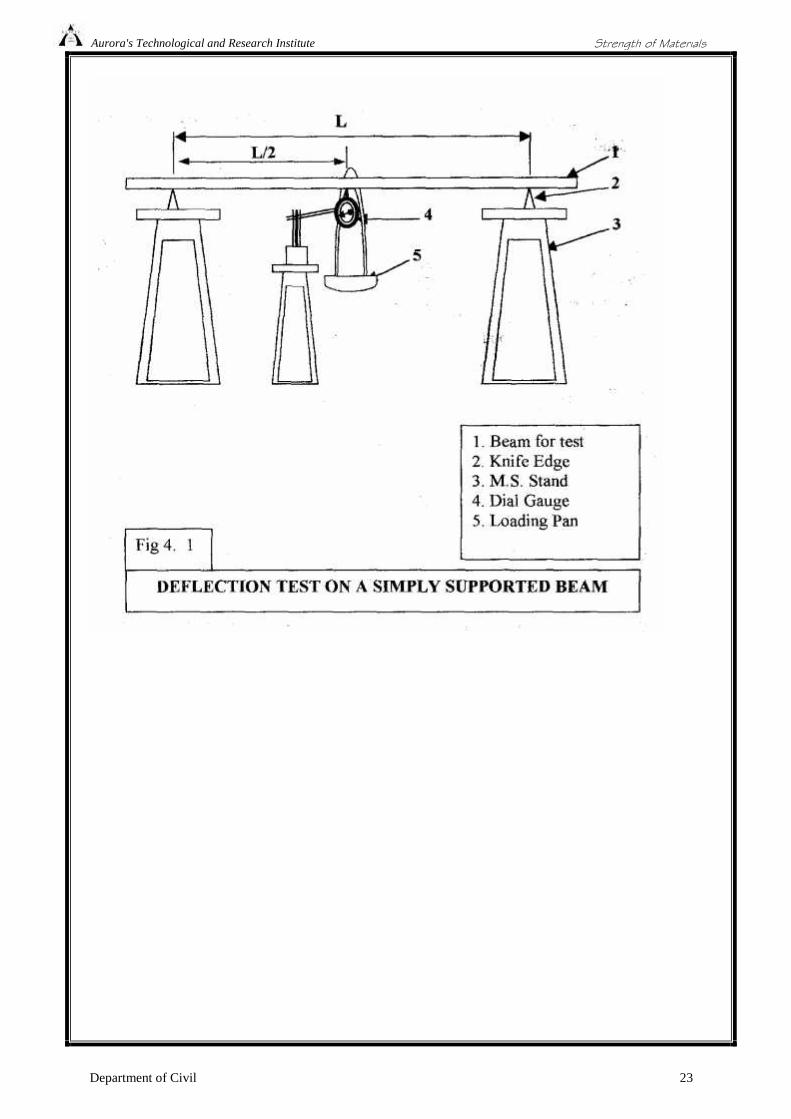
3. BENDING TEST ON A SIMPLY SUPPORTED BEAM
III. AIM:
This experiment is to demonstrate the effect of span of a simply supported beam
on deflection of the beam.
The effect of young’s modulus of the material of the beam using different
materials bars.
The effect of type of cross section on the deflection because of the effect of
moment of inertia of the beam.
Determine the bending stres
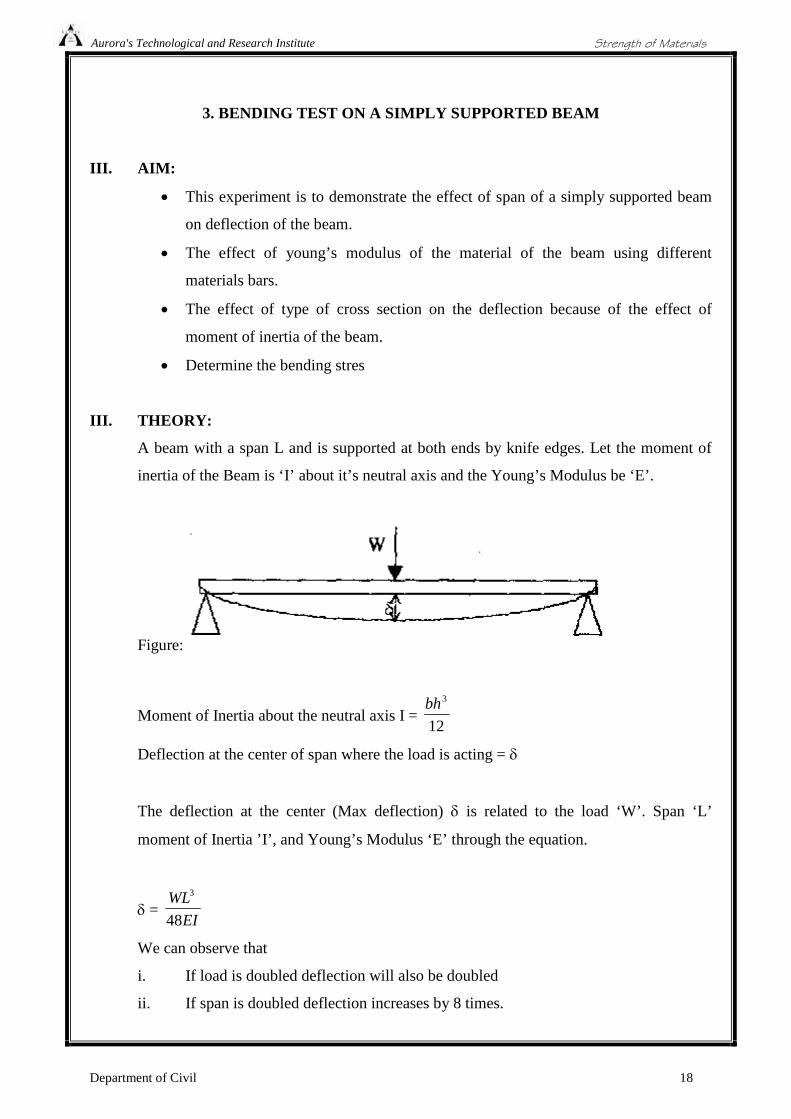
III. THEORY:
A beam with a span L and is supported at both ends by knife edges. Let the moment of
inertia of the Beam is ‘I’ about it’s neutral axis and the Young’s Modulus be ‘E’.
Figure:
Moment of Inertia about the neutral axis I =12
3bh
Deflection at the center of span where the load is acting =
The deflection at the center (Max deflection) is related to the load ‘W’. Span ‘L’
moment of Inertia ’I’, and Young’s Modulus ‘E’ through the equation.
=EI
WL
48
3
We can observe that
i. If load is doubled deflection will also be doubled
ii. If span is doubled deflection increases by 8 times.
Aurora's Technological and Research Institute
Department of Civil 19
Strength of Materials
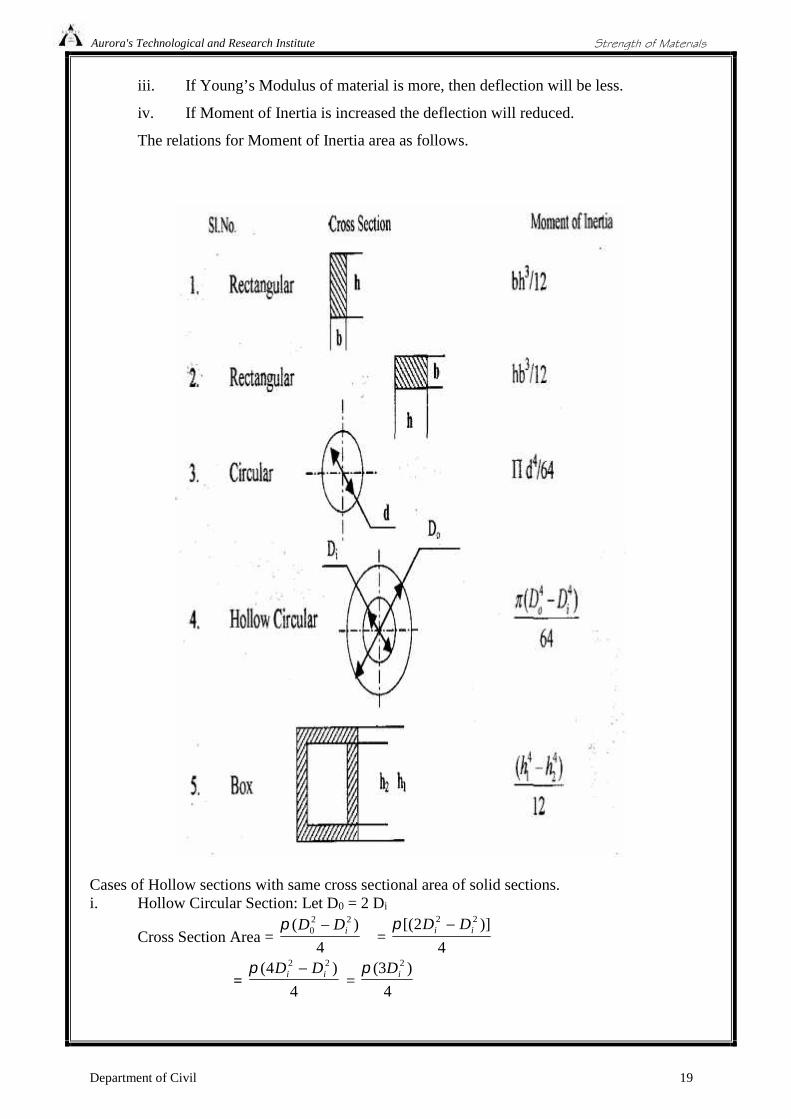
iii. If Young’s Modulus of material is more, then deflection will be less.
iv. If Moment of Inertia is increased the deflection will reduced.
The relations for Moment of Inertia area as follows.
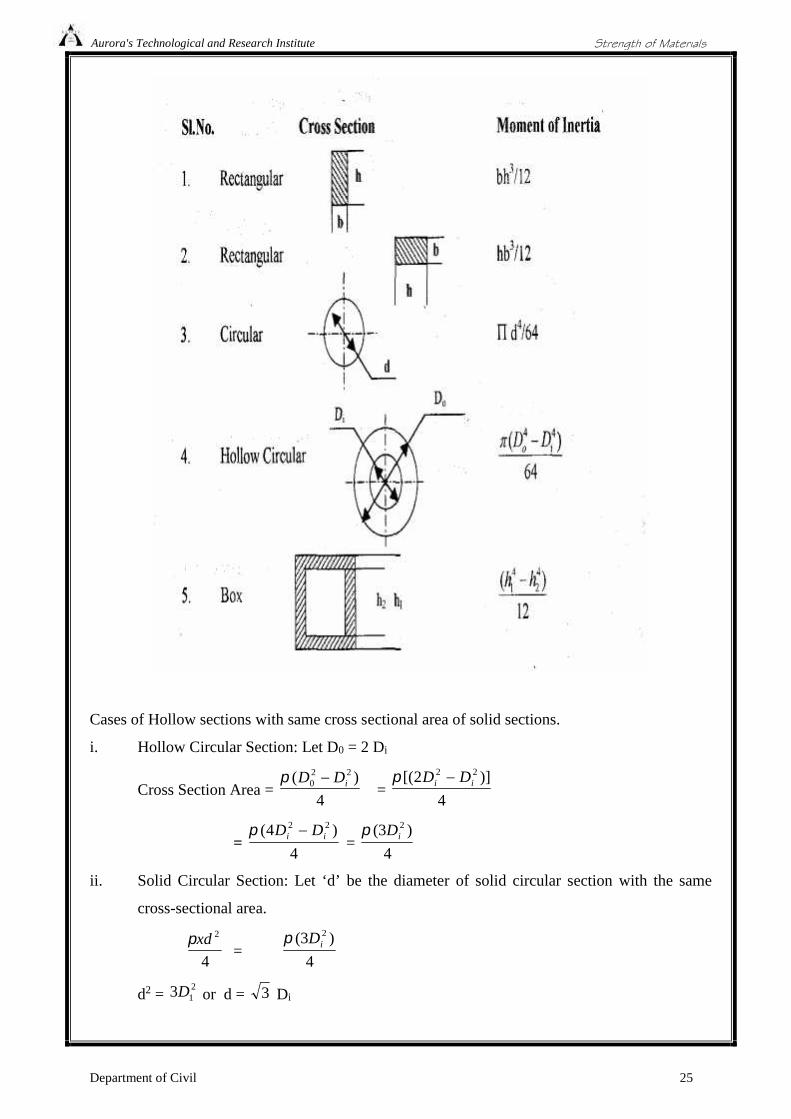
Cases of Hollow sections with same cross sectional area of solid sections.i. Hollow Circular Section: Let D0 = 2 Di
Cross Section Area =4
)( 220 iDD
=4
)]2[( 22ii DD
=4
)4( 22ii DD
=4
)3( 2iD
Aurora's Technological and Research Institute
Department of Civil 20
Strength of Materials
ii. Solid Circular Section: Let ‘d’ be the diameter of solid circular section with the samecross-sectional area.
4
2xd=
4
)3( 2iD
d2 =23 iD or d = 3 Di
Moment of Inertia for Hollow Section
Ihollow =64
)( 440 iDD
=64
)]2[( 22ii DD
=
64
)16( 44ii DD
64
)15( 4iD
Moment of Inertia for Solid Section
Isolid =64
]9[
64
]3[
64
)( 444ii DDd
Hollow section has more ‘I’ than solid section with same cross-sectional area.
Some comments on sections of Beams & Materials.i. Hollow section with same cross sectional area of a solid section; will have
more load carrying capacity and hence more stiffness.
ii. Beams area used with depth longer than width because of more Momentof Inertia for the same cross-sectional area.
iii. Mild Steel is stiffer than Aluminum because the Young’s Modulus of theformer material is bigger.
Concept of stiffness of Beam’s in Bending (Kb)Stiffness of component in bending is defined as the ration of load required for unitdeflection in bending.
Bending stiffness Kb = W/
In the case of Simply supported Beam with control loading the Stiffness
Kb = 3
48
L
EI
Hencei. If E is doubled Stiffness will be doubled.ii. If Moment of Inertia is doubled Stiffness will be doubled.iii. If the Distance of load is doubled the Stiffness reduced by 1/8 times.iv. Higher the Stiffness lesser will be the deflection of beam for the same load
applied.
Bending stress in beam at the extreme fiber at the cross section located at center of thebeam (f) = (3/2) * (WL/BD2)
Aurora's Technological and Research Institute
Department of Civil 21
Strength of Materials
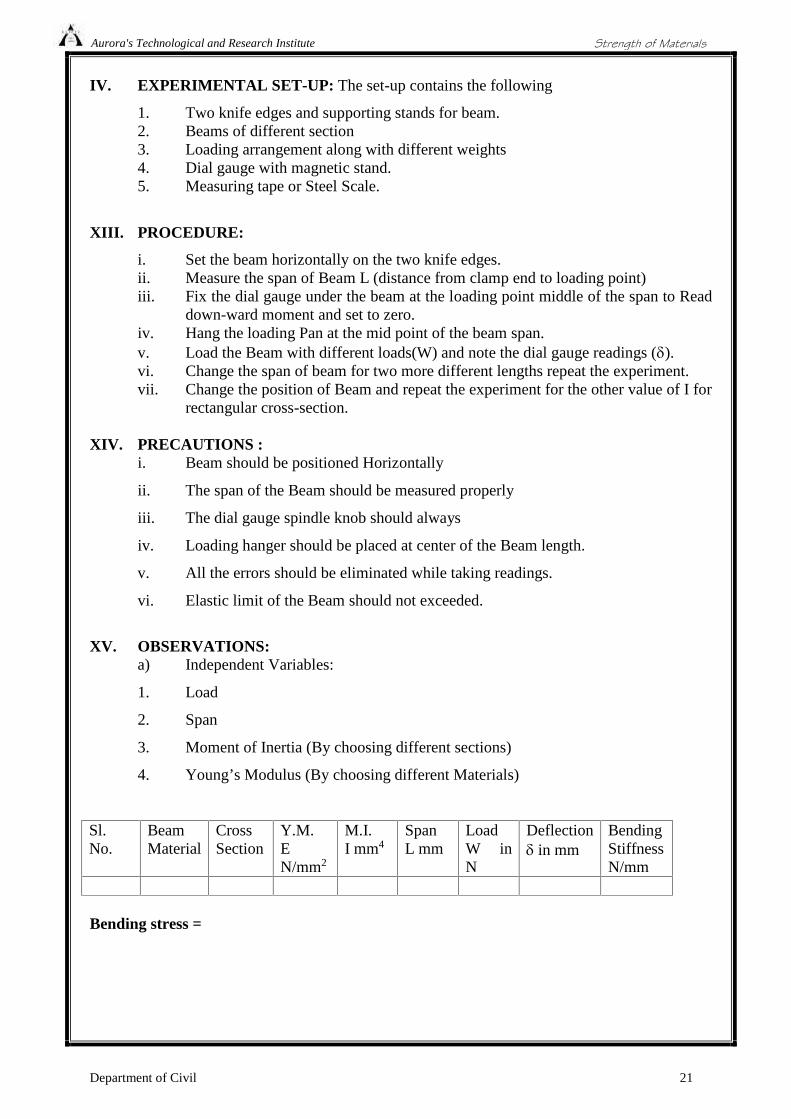
IV. EXPERIMENTAL SET-UP: The set-up contains the following
1. Two knife edges and supporting stands for beam.2. Beams of different section3. Loading arrangement along with different weights4. Dial gauge with magnetic stand.5. Measuring tape or Steel Scale.
XIII. PROCEDURE:
i. Set the beam horizontally on the two knife edges.ii. Measure the span of Beam L (distance from clamp end to loading point)iii. Fix the dial gauge under the beam at the loading point middle of the span to Read
down-ward moment and set to zero.iv. Hang the loading Pan at the mid point of the beam span.v. Load the Beam with different loads(W) and note the dial gauge readings ().vi. Change the span of beam for two more different lengths repeat the experiment.vii. Change the position of Beam and repeat the experiment for the other value of I for
rectangular cross-section.
XIV. PRECAUTIONS :i. Beam should be positioned Horizontally
ii. The span of the Beam should be measured properly
iii. The dial gauge spindle knob should always
iv. Loading hanger should be placed at center of the Beam length.
v. All the errors should be eliminated while taking readings.
vi. Elastic limit of the Beam should not exceeded.
XV. OBSERVATIONS:a) Independent Variables:
1. Load
2. Span
3. Moment of Inertia (By choosing different sections)
4. Young’s Modulus (By choosing different Materials)
Sl.No.
BeamMaterial
CrossSection
Y.M.EN/mm2
M.I.I mm4
SpanL mm
LoadW inN
Deflection in mm
BendingStiffnessN/mm
Bending stress =
Aurora's Technological and Research Institute
Department of Civil 22
Strength of Materials
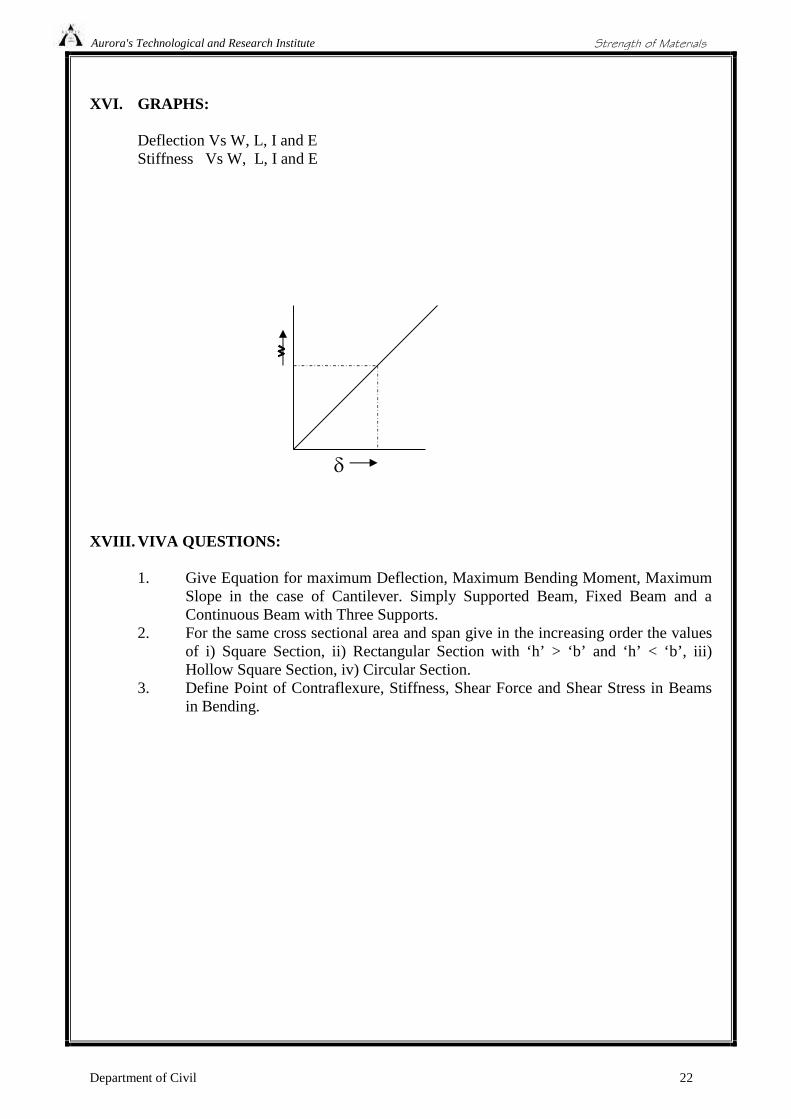
XVI. GRAPHS:
Deflection Vs W, L, I and EStiffness Vs W, L, I and E
XVIII. VIVA QUESTIONS:
1. Give Equation for maximum Deflection, Maximum Bending Moment, MaximumSlope in the case of Cantilever. Simply Supported Beam, Fixed Beam and aContinuous Beam with Three Supports.
2. For the same cross sectional area and span give in the increasing order the valuesof i) Square Section, ii) Rectangular Section with ‘h’ > ‘b’ and ‘h’ < ‘b’, iii)Hollow Square Section, iv) Circular Section.
3. Define Point of Contraflexure, Stiffness, Shear Force and Shear Stress in Beamsin Bending.
Aurora's Technological and Research Institute
Department of Civil 23
Strength of Materials
Aurora's Technological and Research Institute
Department of Civil 24
Strength of Materials
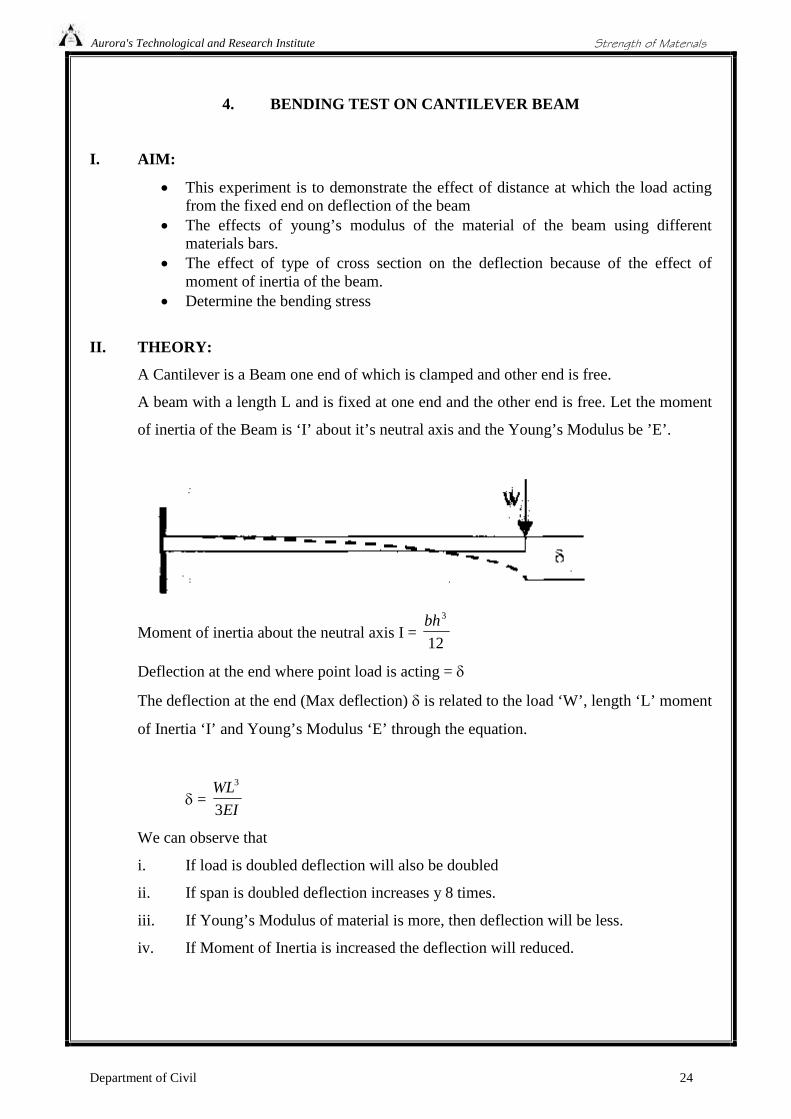
4. BENDING TEST ON CANTILEVER BEAM
I. AIM:
This experiment is to demonstrate the effect of distance at which the load actingfrom the fixed end on deflection of the beam
The effects of young’s modulus of the material of the beam using differentmaterials bars.
The effect of type of cross section on the deflection because of the effect ofmoment of inertia of the beam.
Determine the bending stress
II. THEORY:
A Cantilever is a Beam one end of which is clamped and other end is free.
A beam with a length L and is fixed at one end and the other end is free. Let the moment
of inertia of the Beam is ‘I’ about it’s neutral axis and the Young’s Modulus be ’E’.
Moment of inertia about the neutral axis I =12
3bh
Deflection at the end where point load is acting =
The deflection at the end (Max deflection) is related to the load ‘W’, length ‘L’ moment
of Inertia ‘I’ and Young’s Modulus ‘E’ through the equation.
=EI
WL
3
3
We can observe that
i. If load is doubled deflection will also be doubled
ii. If span is doubled deflection increases y 8 times.
iii. If Young’s Modulus of material is more, then deflection will be less.
iv. If Moment of Inertia is increased the deflection will reduced.
Aurora's Technological and Research Institute
Department of Civil 25
Strength of Materials
Cases of Hollow sections with same cross sectional area of solid sections.
i. Hollow Circular Section: Let D0 = 2 Di
Cross Section Area =4
)( 220 iDD
=4
)]2[( 22ii DD
=4
)4( 22ii DD
=4
)3( 2iD
ii. Solid Circular Section: Let ‘d’ be the diameter of solid circular section with the same
cross-sectional area.
4
2xd=
4
)3( 2iD
d2 =2
13D or d = 3 Di
Aurora's Technological and Research Institute
Department of Civil 26
Strength of Materials
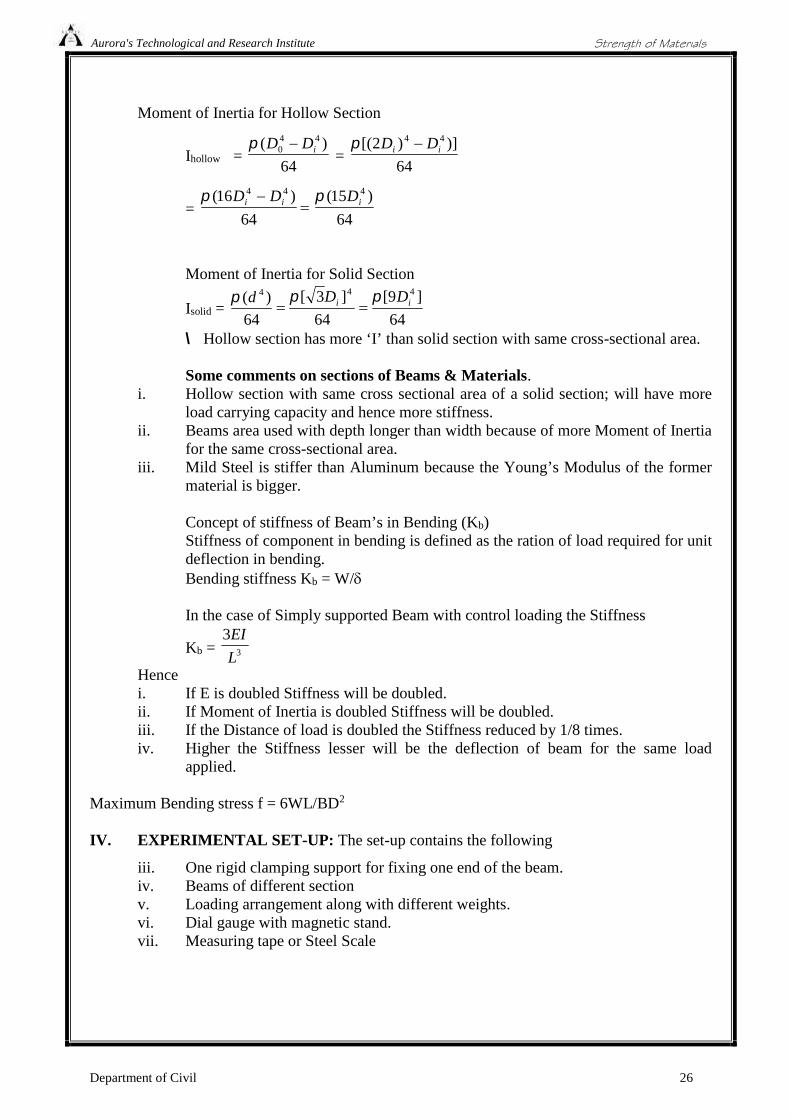
Moment of Inertia for Hollow Section
Ihollow =64
)( 440 iDD
=64
)])2[( 44ii DD
=
64
)16( 44ii DD
64
)15( 4iD
Moment of Inertia for Solid Section
Isolid =64
]9[
64
]3[
64
)( 444ii DDd
Hollow section has more ‘I’ than solid section with same cross-sectional area.
Some comments on sections of Beams & Materials.i. Hollow section with same cross sectional area of a solid section; will have more
load carrying capacity and hence more stiffness.ii. Beams area used with depth longer than width because of more Moment of Inertia
for the same cross-sectional area.iii. Mild Steel is stiffer than Aluminum because the Young’s Modulus of the former
material is bigger.
Concept of stiffness of Beam’s in Bending (Kb)Stiffness of component in bending is defined as the ration of load required for unitdeflection in bending.Bending stiffness Kb = W/
In the case of Simply supported Beam with control loading the Stiffness
Kb = 3
3
L
EI
Hencei. If E is doubled Stiffness will be doubled.ii. If Moment of Inertia is doubled Stiffness will be doubled.iii. If the Distance of load is doubled the Stiffness reduced by 1/8 times.iv. Higher the Stiffness lesser will be the deflection of beam for the same load
applied.
Maximum Bending stress f = 6WL/BD2
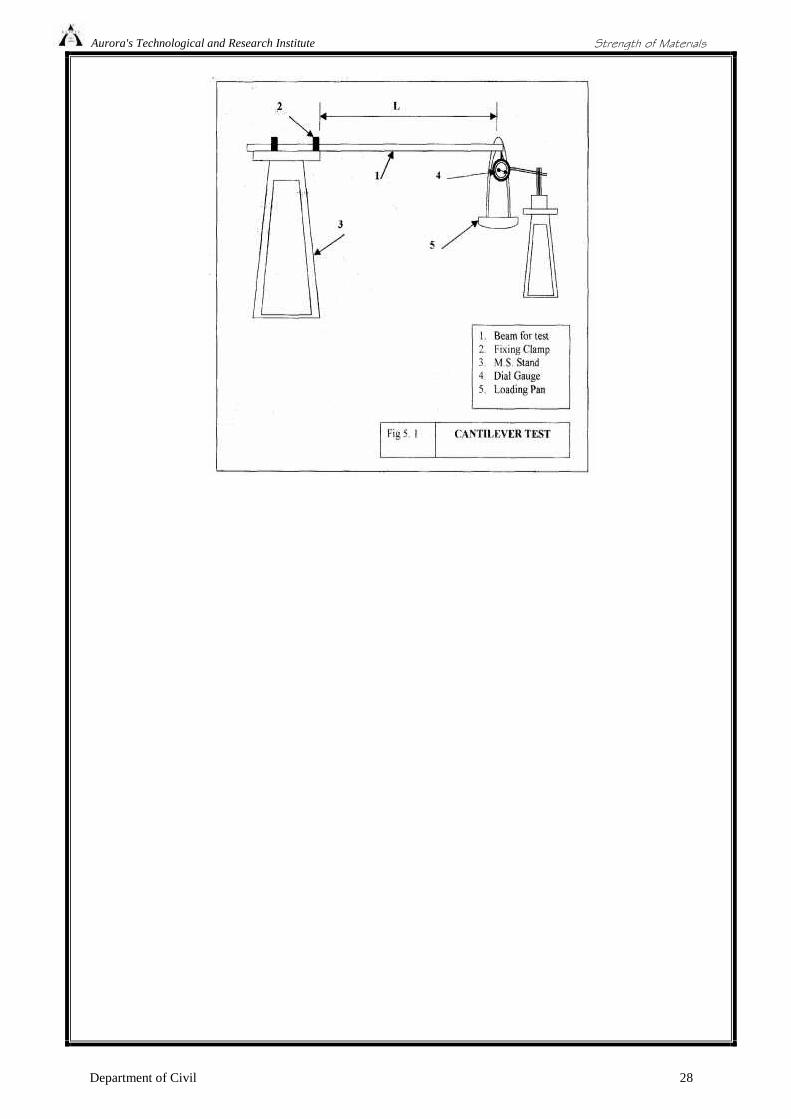
IV. EXPERIMENTAL SET-UP: The set-up contains the following
iii. One rigid clamping support for fixing one end of the beam.iv. Beams of different sectionv. Loading arrangement along with different weights.vi. Dial gauge with magnetic stand.vii. Measuring tape or Steel Scale
Aurora's Technological and Research Institute
Department of Civil 27
Strength of Materials
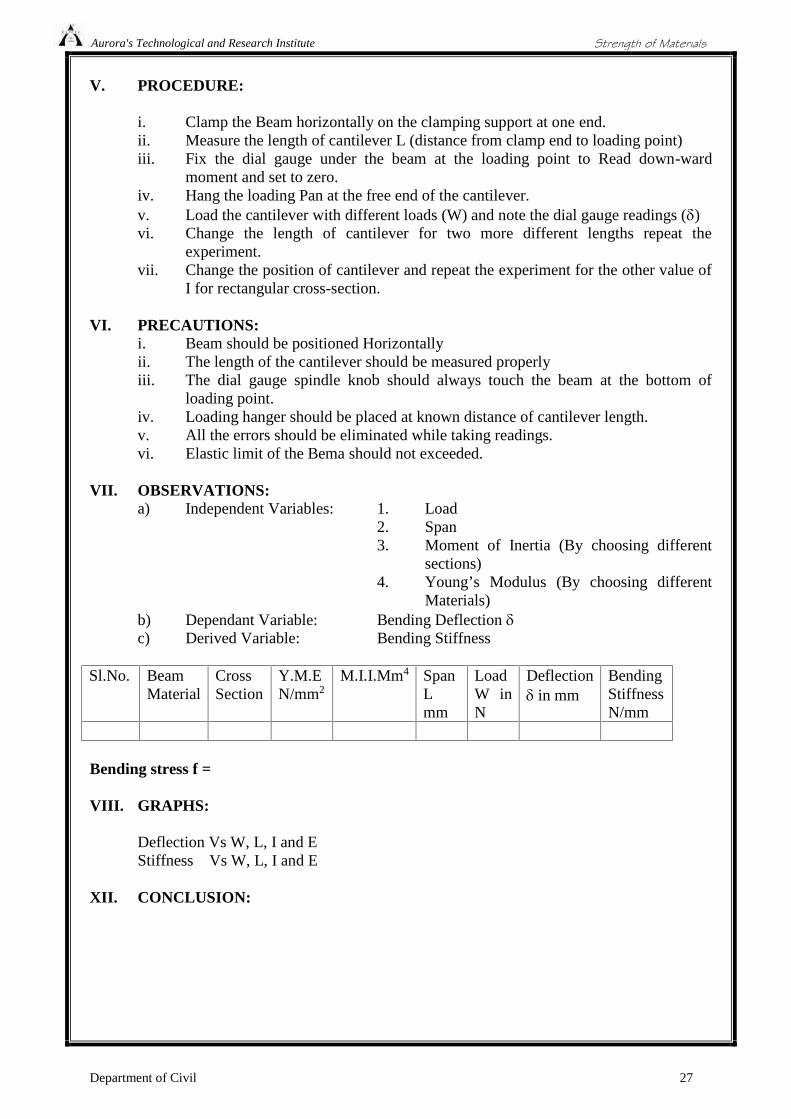
V. PROCEDURE:
i. Clamp the Beam horizontally on the clamping support at one end.ii. Measure the length of cantilever L (distance from clamp end to loading point)iii. Fix the dial gauge under the beam at the loading point to Read down-ward
moment and set to zero.iv. Hang the loading Pan at the free end of the cantilever.v. Load the cantilever with different loads (W) and note the dial gauge readings ()vi. Change the length of cantilever for two more different lengths repeat the
experiment.vii. Change the position of cantilever and repeat the experiment for the other value of
I for rectangular cross-section.
VI. PRECAUTIONS:i. Beam should be positioned Horizontallyii. The length of the cantilever should be measured properlyiii. The dial gauge spindle knob should always touch the beam at the bottom of
loading point.iv. Loading hanger should be placed at known distance of cantilever length.v. All the errors should be eliminated while taking readings.vi. Elastic limit of the Bema should not exceeded.
VII. OBSERVATIONS:a) Independent Variables: 1. Load
2. Span3. Moment of Inertia (By choosing different
sections)4. Young’s Modulus (By choosing different
Materials)b) Dependant Variable: Bending Deflection c) Derived Variable: Bending Stiffness
Sl.No. BeamMaterial
CrossSection
Y.M.EN/mm2
M.I.I.Mm4 SpanLmm
LoadW inN
Deflection in mm
BendingStiffnessN/mm
Bending stress f =
VIII. GRAPHS:
Deflection Vs W, L, I and EStiffness Vs W, L, I and E
XII. CONCLUSION:
Aurora's Technological and Research Institute
Department of Civil 28
Strength of Materials
Aurora's Technological and Research Institute
Department of Civil 29
Strength of Materials
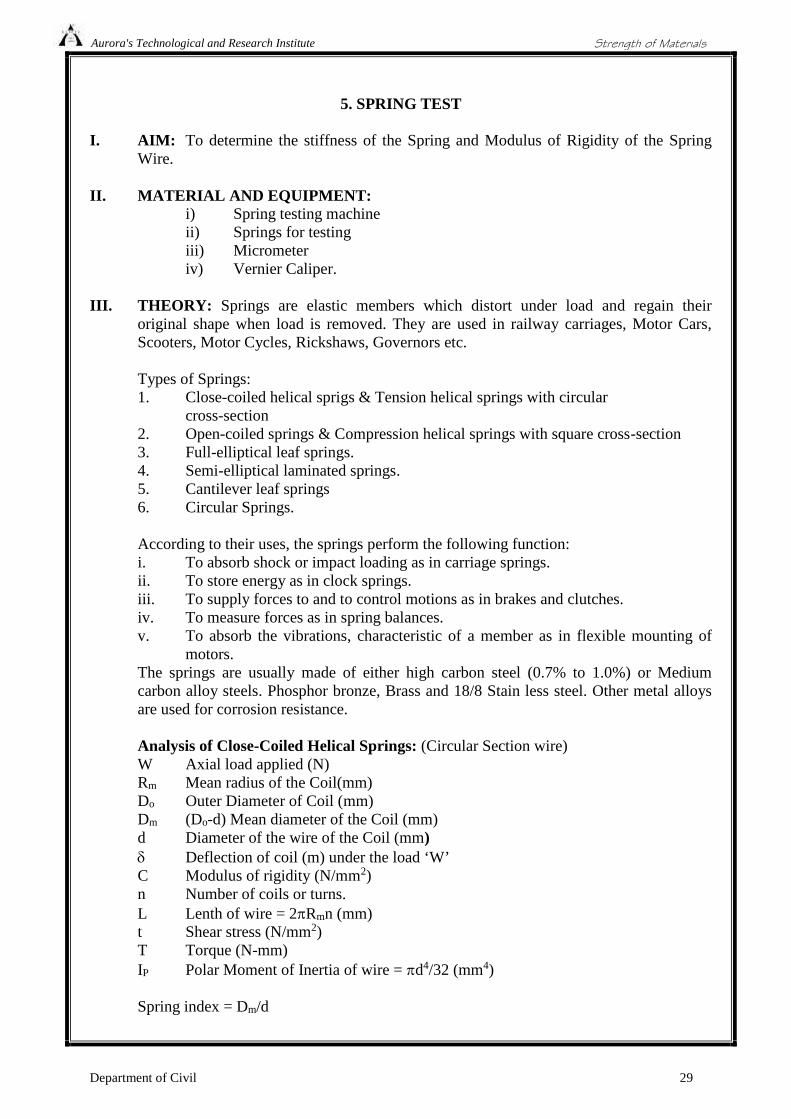
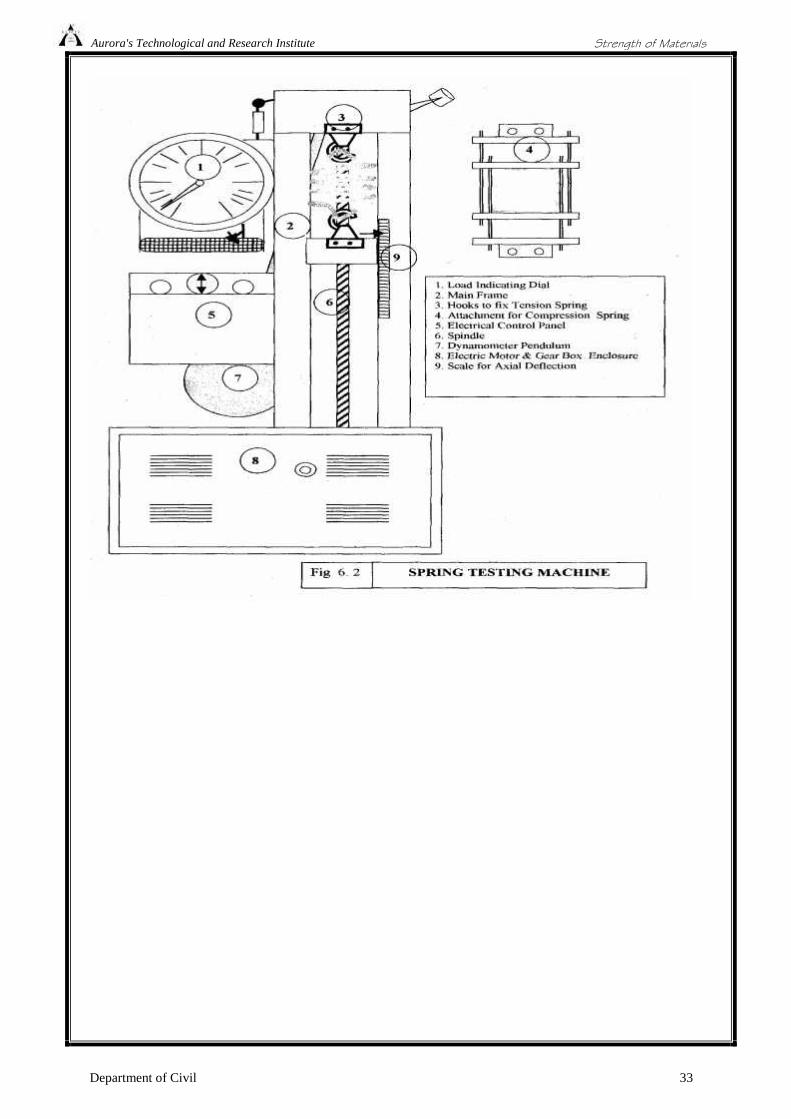
5. SPRING TEST
I. AIM: To determine the stiffness of the Spring and Modulus of Rigidity of the SpringWire.
II. MATERIAL AND EQUIPMENT:i) Spring testing machineii) Springs for testingiii) Micrometeriv) Vernier Caliper.
III. THEORY: Springs are elastic members which distort under load and regain theiroriginal shape when load is removed. They are used in railway carriages, Motor Cars,Scooters, Motor Cycles, Rickshaws, Governors etc.
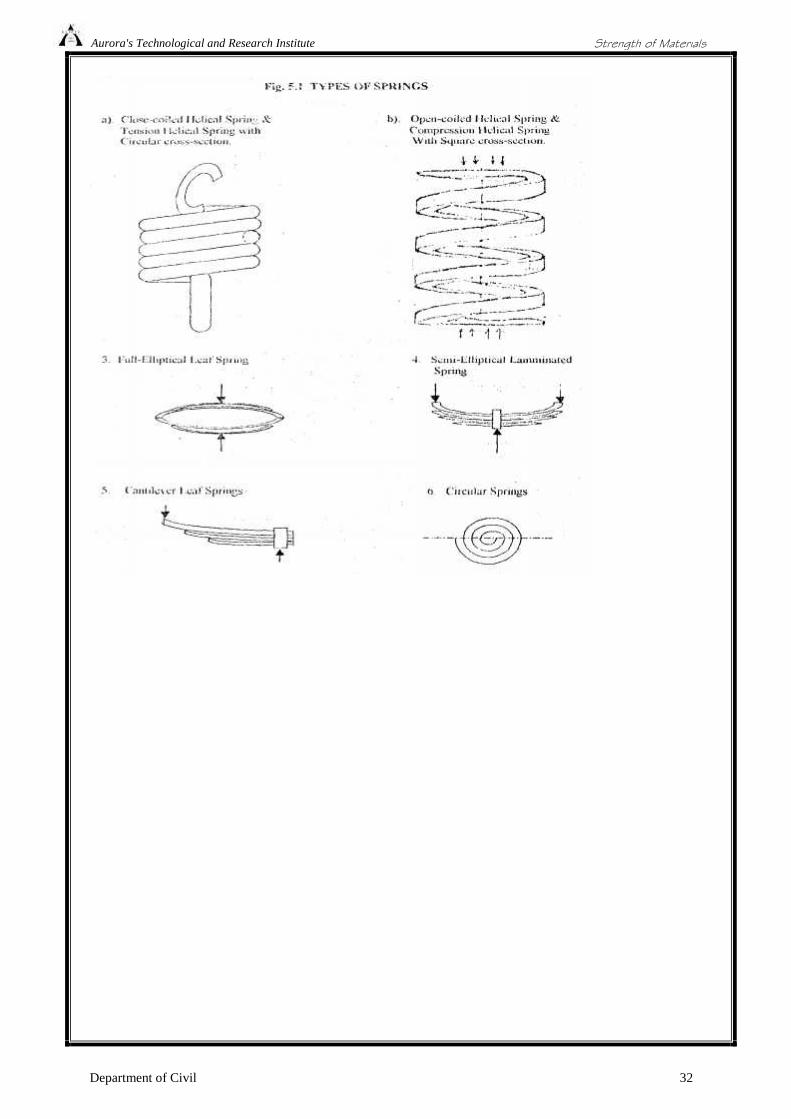
Types of Springs:1. Close-coiled helical sprigs & Tension helical springs with circular
cross-section2. Open-coiled springs & Compression helical springs with square cross-section3. Full-elliptical leaf springs.4. Semi-elliptical laminated springs.5. Cantilever leaf springs6. Circular Springs.
According to their uses, the springs perform the following function:i. To absorb shock or impact loading as in carriage springs.ii. To store energy as in clock springs.iii. To supply forces to and to control motions as in brakes and clutches.iv. To measure forces as in spring balances.v. To absorb the vibrations, characteristic of a member as in flexible mounting of
motors.The springs are usually made of either high carbon steel (0.7% to 1.0%) or Mediumcarbon alloy steels. Phosphor bronze, Brass and 18/8 Stain less steel. Other metal alloysare used for corrosion resistance.
Analysis of Close-Coiled Helical Springs: (Circular Section wire)W Axial load applied (N)Rm Mean radius of the Coil(mm)Do Outer Diameter of Coil (mm)Dm (Do-d) Mean diameter of the Coil (mm)d Diameter of the wire of the Coil (mm) Deflection of coil (m) under the load ‘W’C Modulus of rigidity (N/mm2)n Number of coils or turns.L Lenth of wire = 2Rmn (mm)t Shear stress (N/mm2)T Torque (N-mm)IP Polar Moment of Inertia of wire = d4/32 (mm4)
Spring index = Dm/d
Aurora's Technological and Research Institute
Department of Civil 30
Strength of Materials
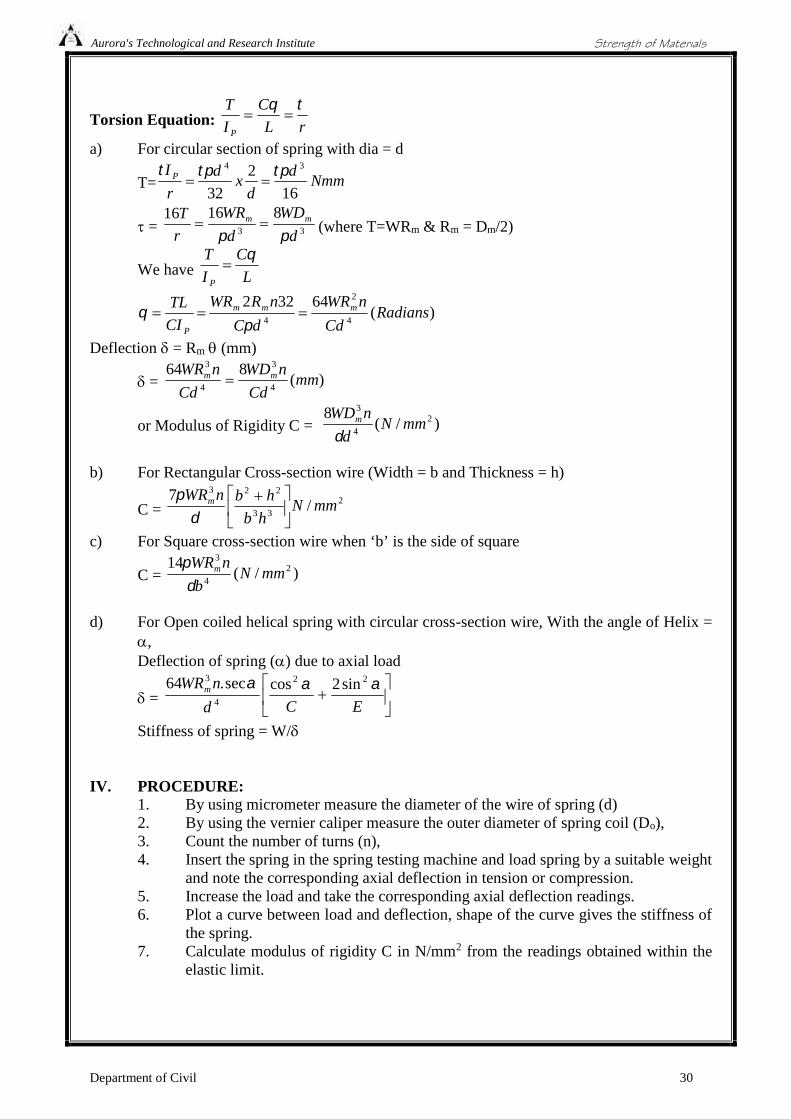
Torsion Equation: rL
C
I
T
P
a) For circular section of spring with dia = d
T= Nmmd
dx
d
r
I P
16
2
32
34
= 33
81616
d
WD
d
WR
r
T mm
(where T=WRm & Rm = Dm/2)
We have L
C
I
T
P
)(64322
4
2
4Radians
Cd
nWR
dC
nRWR
CI
TL mmm
P
Deflection = Rm (mm)
= )(864
4
3
4
3
mmCd
nWD
Cd
nWR mm
or Modulus of Rigidity C = )/(8 2
4
3
mmNd
nWDm
b) For Rectangular Cross-section wire (Width = b and Thickness = h)
C =2
33
223
/7
mmNhb
hbnWRm
c) For Square cross-section wire when ‘b’ is the side of square
C = )/(14 2
4
3
mmNb
nWRm
d) For Open coiled helical spring with circular cross-section wire, With the angle of Helix =,Deflection of spring () due to axial load
=
ECd
nWRm 22
4
3 sin2cossec.64
Stiffness of spring = W/
IV. PROCEDURE:1. By using micrometer measure the diameter of the wire of spring (d)2. By using the vernier caliper measure the outer diameter of spring coil (Do),3. Count the number of turns (n),4. Insert the spring in the spring testing machine and load spring by a suitable weight
and note the corresponding axial deflection in tension or compression.5. Increase the load and take the corresponding axial deflection readings.6. Plot a curve between load and deflection, shape of the curve gives the stiffness of
the spring.7. Calculate modulus of rigidity C in N/mm2 from the readings obtained within the
elastic limit.
Aurora's Technological and Research Institute
Department of Civil 31
Strength of Materials
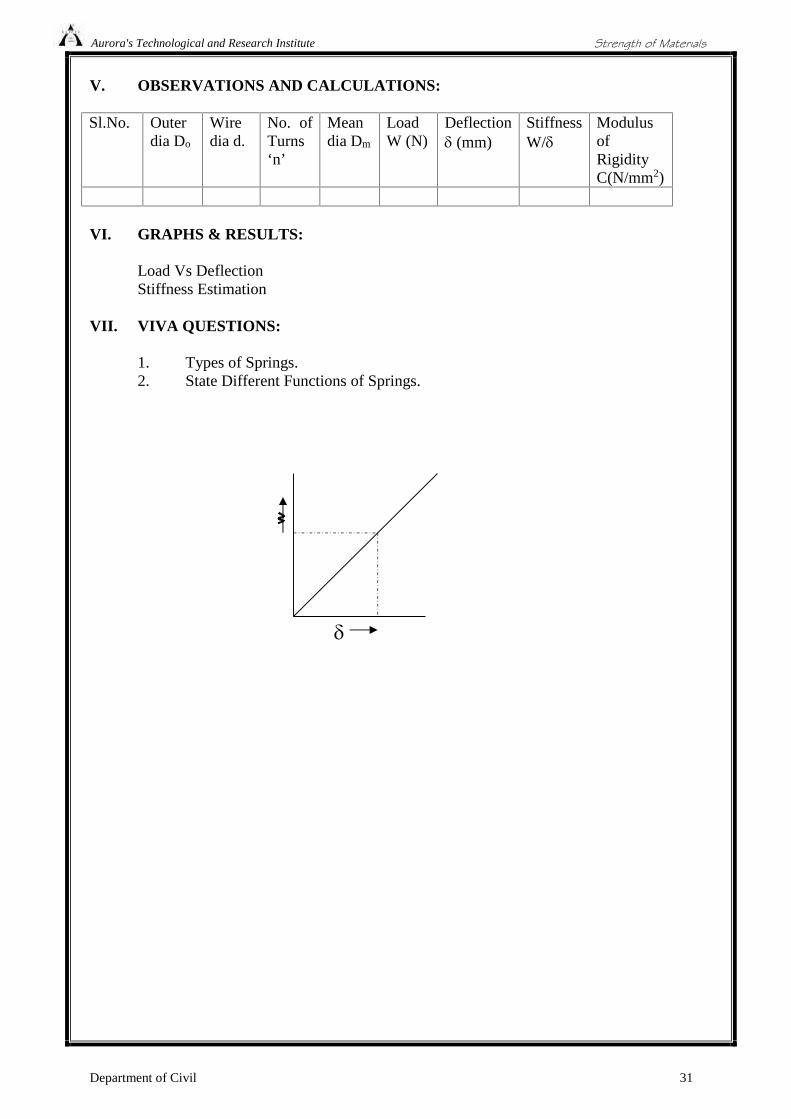
V. OBSERVATIONS AND CALCULATIONS:
Sl.No. Outerdia Do
Wiredia d.
No. ofTurns‘n’
Meandia Dm
LoadW (N)
Deflection (mm)
StiffnessW/
ModulusofRigidityC(N/mm2)
VI. GRAPHS & RESULTS:
Load Vs DeflectionStiffness Estimation
VII. VIVA QUESTIONS:
1. Types of Springs.2. State Different Functions of Springs.
Aurora's Technological and Research Institute
Department of Civil 32
Strength of Materials
Aurora's Technological and Research Institute
Department of Civil 33
Strength of Materials
Aurora's Technological and Research Institute
Department of Civil 34
Strength of Materials
6. TORSION TEST
I. AIM: To conduct torsion on mild steel or cast iron specimens to fine outModulus of Rigidity or to fine angle of twist of the materials which are subjectedto Torsion
II. MATERIAL AND EQUIPMENT:4. A Torsion testing machine along with angle of twist measuring attachment5. Standard specimen of mild steel or cast iron.6. A steel rule.7. Vernier caliper or Micrometer.
III. THEORY: For transmitting power through a rotating shaft it is necessary to apply aturning force. The force is applied tangentially and in the plane of transverse cross-section. The torque of twisting moment may be calculated by multiplying to two oppositeturning moments, it is said to be in pure torsion and it will exhibit the tendency ofshearing off at every cross-section which is perpendicular to longitudinal axis.Torsion Equation:If T = Maximum Twisting Torque (Nmm)
=610
2
60x
N
Px
where Power (P) Transmitted by shaft in kW
and N is Revolutions per minute of shaft.
D = Diameter of a solid shaft (mm)Do= Outer diameter of hollow shaft (mm)Dt = Inner Moment of Inertia (mm)IP= Polar Moment of Inertia (mm4)
For Solid shafts IP= D4/32 (mm4)For Hollow shafts IP = (D0
4-32 (mm4) = Shear Stress (N/mm2)C = Modulus of Rigidity (N/mm2) = The angle of twist in radiansL =Length of shaft under Torsion (mm)
Torsion Equation is L
C
RI
T
P
Where R = D/2 in mm for Solid shaft
R = Do/2 in mm for Hollow shaft
Torque applied T = WD/2 (Nmm) Where W is tangential load applied.
The value of Modulus of Rigidity can be find by C = PI
TLin N/mm2
Or Angle of Twist per unit Length CI
T
L P
(Radian/mm Length)
Assumptions made for getting Torsion Equation1. The material of the shaft is uniform throughout2. The shaft, circular in section remain circular after loading.
Aurora's Technological and Research Institute
Department of Civil 35
Strength of Materials
3. Plane sections of shaft normal to its axis before loading remain plane after thetorque have been applied.
4. The twist along the length of shaft is uniform throughout.5. The distance between any two normal – sections remains the same after the
applications of torque.6. Maximum Shear Stress induced in the shaft due to application of Torque does not
exceed its Elastic Limit.
IV. PROCEDURE:1. Select suitable grips to suit the size of the Specimen and clamp it in the machine
by adjusting sliding Jaw.2. Measure the diameter at about three places and take average value.3. Choose the appropriate loading range depending upon specimen.4. Set the maximum load pointer to zero.5. Carry out straining by rotating the hand wheel or by switching on the motor.6. Load the member in suitable increments, observe and record strain readings.7. Continue till failure of specimen.8. Calculate the value of Modulus of Rigidity C by using C = TL/IP taking values
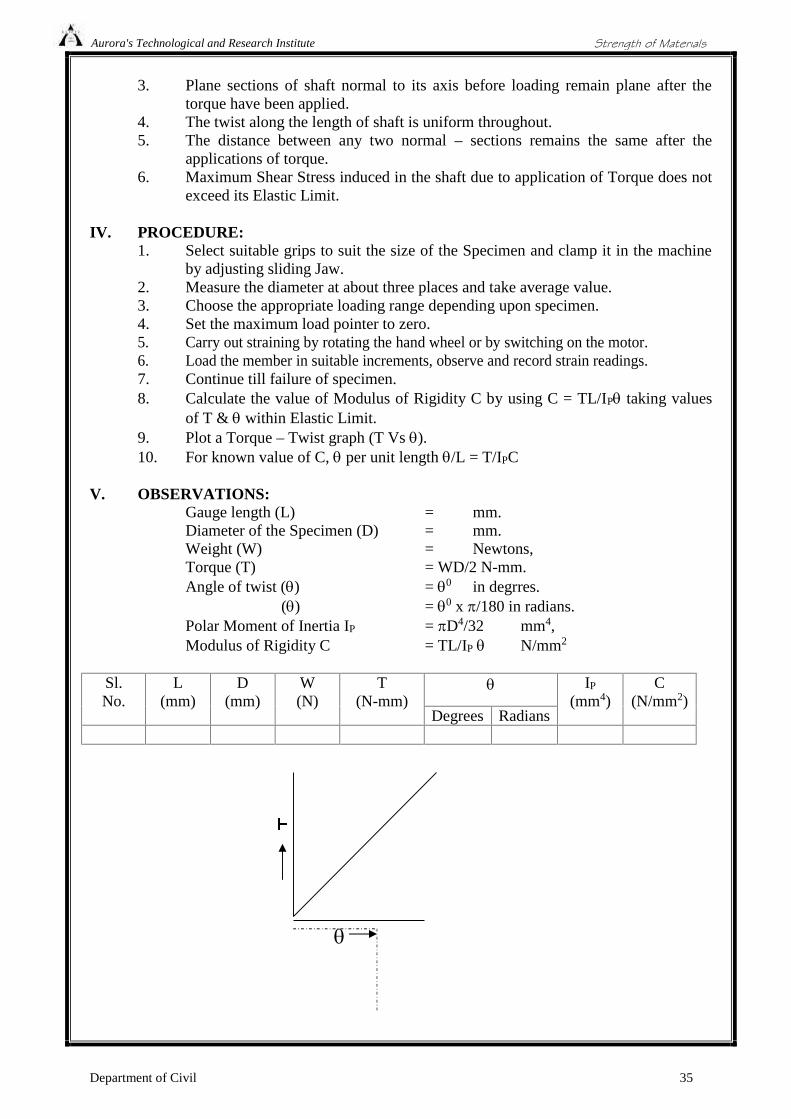
of T & within Elastic Limit.9. Plot a Torque – Twist graph (T Vs ).10. For known value of C, per unit length /L = T/IPC
V. OBSERVATIONS:Gauge length (L) = mm.Diameter of the Specimen (D) = mm.Weight (W) = Newtons,Torque (T) = WD/2 N-mm.Angle of twist () = 0 in degrres.
() = 0 x /180 in radians.Polar Moment of Inertia IP = D4/32 mm4,Modulus of Rigidity C = TL/IP N/mm2
Sl.No.
L(mm)
D(mm)
W(N)
T(N-mm)
IP
(mm4)C
(N/mm2)Degrees Radians
Aurora's Technological and Research Institute
Department of Civil 36
Strength of Materials
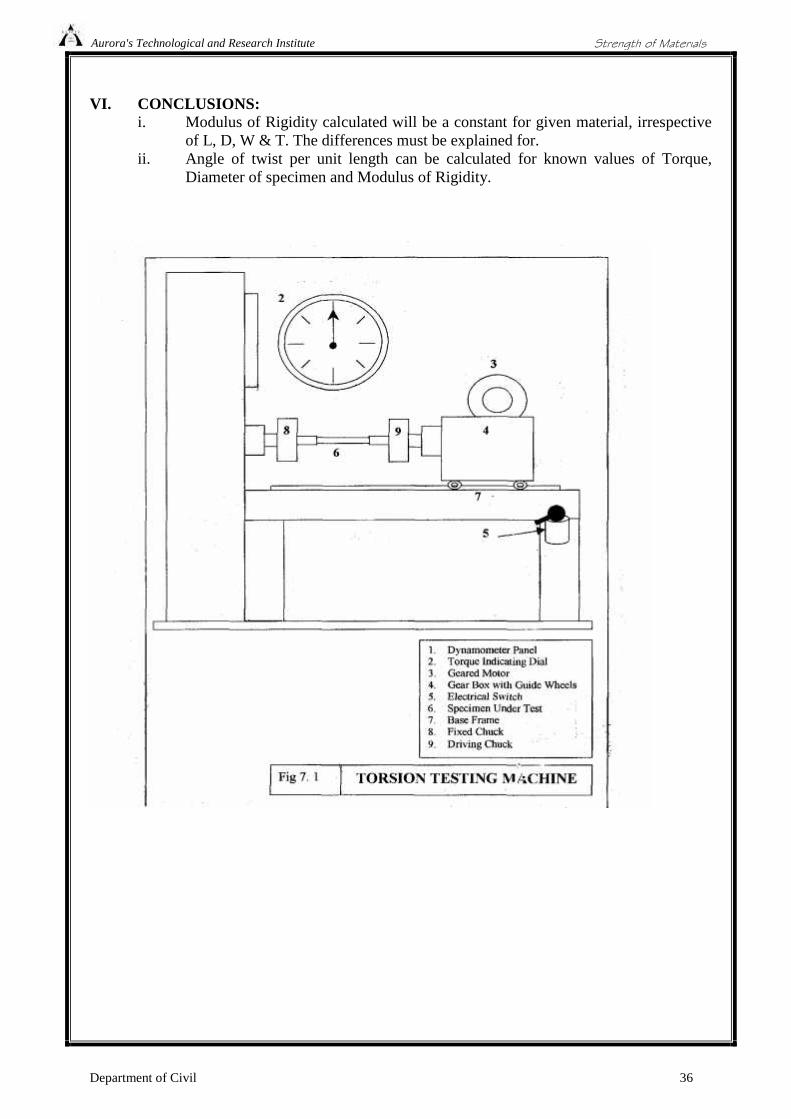
VI. CONCLUSIONS:i. Modulus of Rigidity calculated will be a constant for given material, irrespective
of L, D, W & T. The differences must be explained for.ii. Angle of twist per unit length can be calculated for known values of Torque,
Diameter of specimen and Modulus of Rigidity.
Aurora's Technological and Research Institute
Department of Civil 37
Strength of Materials
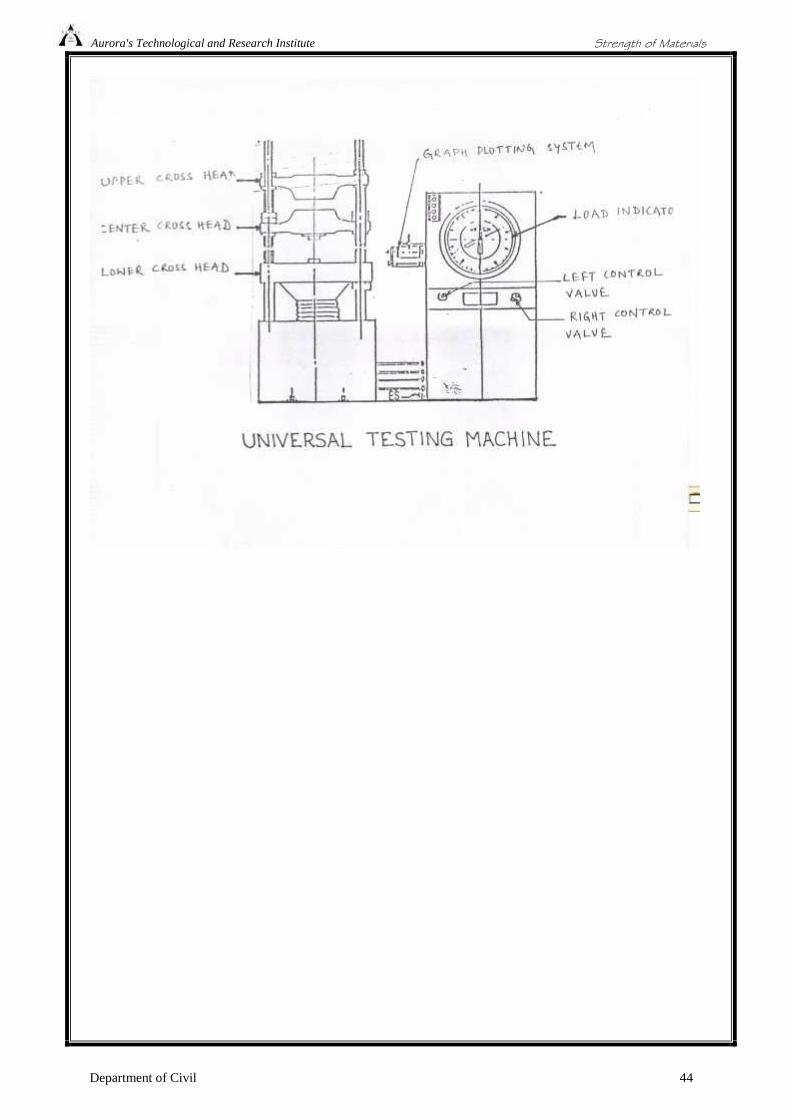
7. TENSILE TEST USING UTM
I. AIM: To conduct tensile test on a mild steel specimen and determine thefollowing:i) Limit of proportionality ii) Upper yield pointiii) Ultimate strength iv) Lower yield pointv) Ultimate strength vi) Fracture Strengthvii) Young’s modulus viii) Percentage elongationix) Percentage reduction in area x) Duetilityxi) Toughness xii) True-Stress & true-strain
valuesxiii) Malleability
II. MATERIAL & EQUIPMENT:
i) Tensile testing machine ii) Specimeniii) Steel rule iv) Vernier caliperv) Micrometer
III. THEORY:
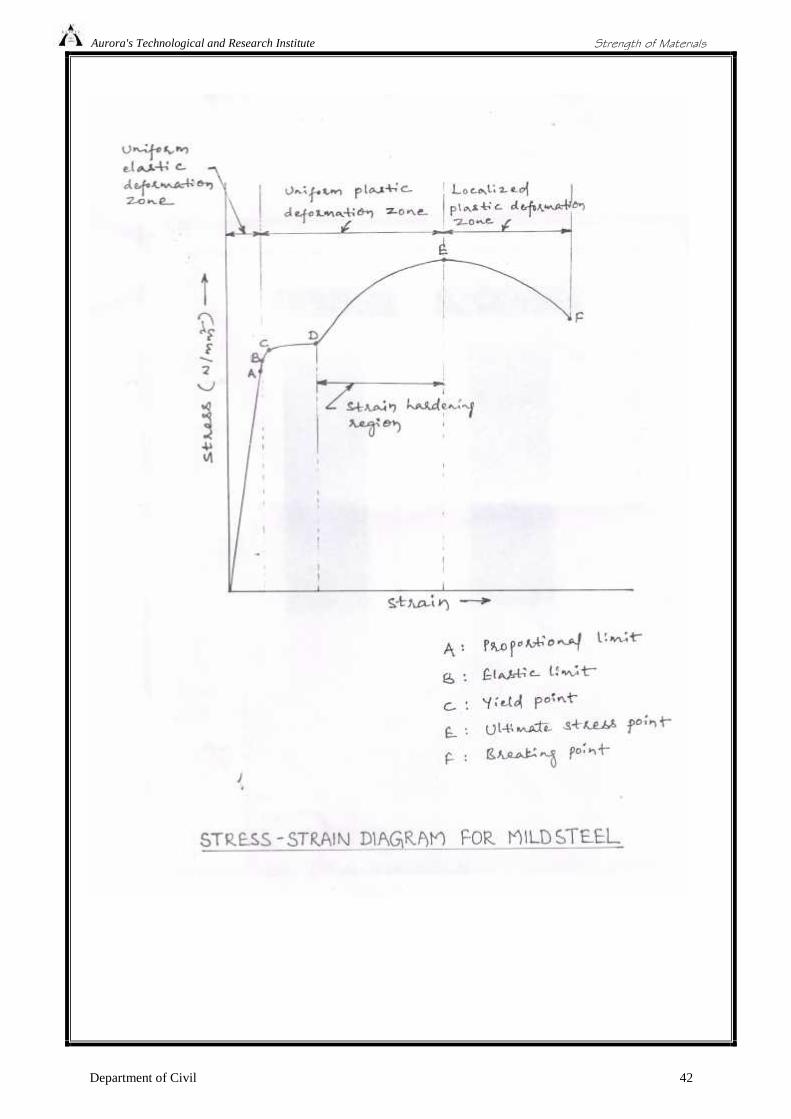
The tensile test is mot applied one of all mechanical tests. In this test, a test specimen isfixed into grips connected to a Straining device and to a load-measuring device. (one end instationary grips and the other in movable grips). If the applied load is small enough, thedeformation of any solid body is entirely elastic. An elastically deformed solid will return to itsoriginal form as soon as load is removed. However if the load is too large, the material can bedeformed permanently. The initial part of the tension curve, which represents the manner inwhich solid undergoes plastic deformation is termed plastic. The stress below which thedeformation is essentially entirely elastic is known as the elastic limit of material. In somematerials like mild steel the onset of plastic deformation is denoted by a sudden drop in loadindicating both an upper and lower yield point. How ever some materials do not exhibit a sharpyield point. During plastic deformation, at larger extensions, strain hardening cannot compensatefor the decrease in section and thus the load passes through a maximum and then begins todecrease. At this stage the ULTIMATE STRENGTH which is defined as the ration of the loadon the specimen to original cross-sectional area, reaches a maximum value. Until this point thedeformation is uniform at all sections of the specimen. Further loading will eventually
Usually a tension test is conducted at room temperature. And the tensile load is applied slowly.During this test either round or flat specimens may be used. The load on the specimen is appliedmechanically or hydraulically depending on the type of testing machine.
3.1) Nomial/Engg. Stress and Nominal/Engg Strain:Original C/S are = A0 (mm2) Nominal Stress = P/A0 (N/mm2)Original gauge length = L0(mm) Nominal Strain = L0/L0
Aurora's Technological and Research Institute
Department of Civil 38
Strength of Materials
3.2 Limit of Proportionality (Point A in Fig 9)Stress is proportional to strain upto this point.Nominal Stress = PA/A0
Nominal Strain = ( L0)A/L0
3.3 Elastic Limit (Point B in Fig.9)When the load is removed at “B”, the specimen will go back to original dimension ie.e.L0
and A0
Nominal Stress = P0/A0
3.4 Upper Yield (point C in Fig.9)Nominal Stress = P0/A0
Nominal Strain = (L0)c/L0
3.5 Lower Yield point (Point D in Fig.9)Nominal Stress = PD/A0
Nominal Strain = (L0)D/L0
3.6 Ultimate Load or Maximum Load Point (Point E in Fig.9)Nominal Ultimate Stress = PE/A0
Nominal Strain = (L0)E/L0
3.7 Fracture Load Pont F(Point F in Fig.9)Nominal Fracture stress = PF/A0
Nominal Strain at fracture = (L0)F/L0
3.8 Young’s Modulus (E)Young Modulus (E) = Stress / strain(in the elastic region limit of Proportionality= Nominal Stress at A/Nominal Strain at A
3.9 Modulus of Resilience = (Nominal stress at elastic limit)2/2E( Area under Engg. Stress-Strain diagram upto elastic limit)
3.10 Resilience = Modulus of Resilience X Volume of specimen undergoing tensile stress.
3.11 Yield Point ElongationElongation taking place in the specimen from C to D’. This is taking place withoutincrease in stress.
3.12 Modulus of toughnessArea under Engineering stress-strain diagram upto fracture.
3.13 Toughness = Modulus of toughness x Volume of specimenThis indicates the amount of energy absorbed by the specimen before fracture takesplace.
3.13 Malleability:It is the ability of the material to undergo plastic deformation prior fracture underCompressive Loading conditions. In a tensile test it is approximated as percentagereduction in cross sectional area of the specimen.Malleability = (A0 - Af)/A0) X 100
Aurora's Technological and Research Institute
Department of Civil 39
Strength of Materials
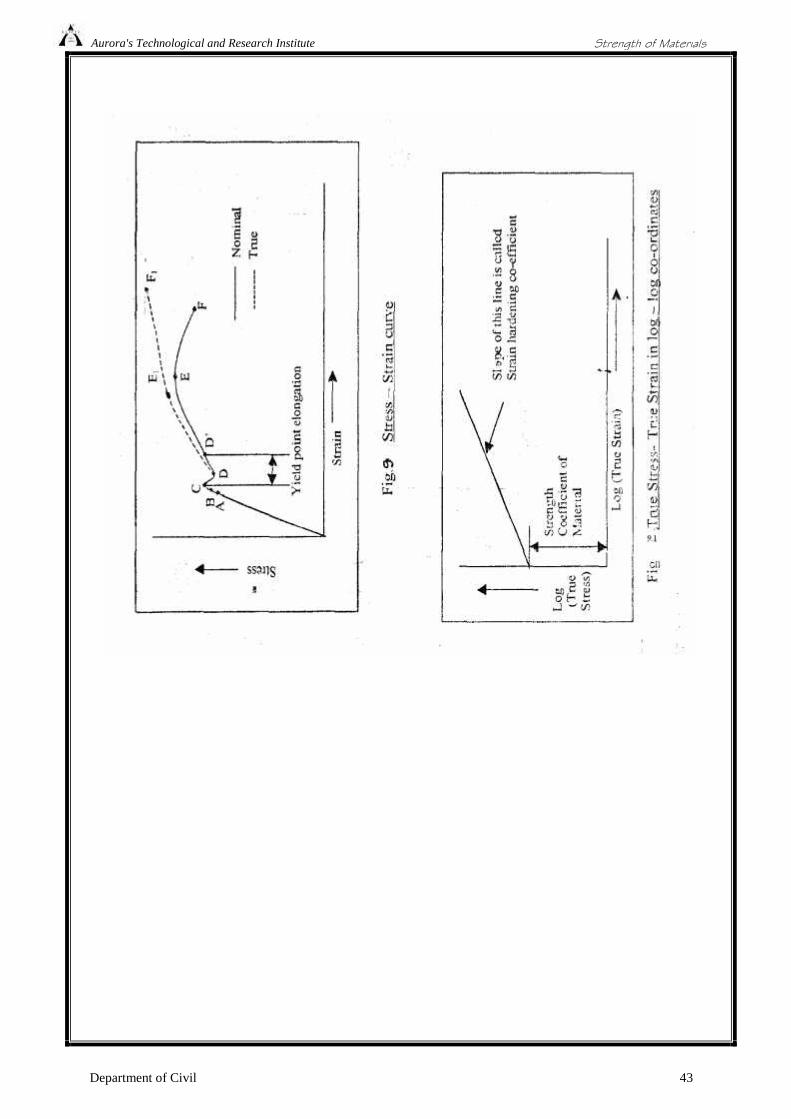
4. True Stress – True strain diagramEngineering stress is calculated based on original cross sectional area (A0) but not on theactual cross sectional area at load ‘ P’.
True stress = P/A = P/A0 X A0/ASince volume remains constant during plastic deformation we have A0L0 = AL
True Stress = P/A0 X L/L0
= P/A0 X (L0 + L0) / L0)= P/A0 X (1+L0) / L0) = p(1+e)= Normal stress (1+Nominal strain)
True Strain = = In(1+e)
These relations are valid upto ultimate load ie. Upto which the strain is uniform all alonghe gauge length.
4.1 True Stress at Upper Yield Point= Nominal stress at upper yield point (1+ec)True strain C = In(1+ec)
4.2 True Stress at Ultimate Load (Point EI)= Nominal ultimate stress (1+eE)True strain at ultimate load = In(1+eE)
4.3 True Stress at Fracture (At point FI)True stress at fracture = Pf/Af
Where Af is the area of cross section at fracture can be measured.True strain at Fracture = In (A0/Af)Area relation is taken instead of lengths because the strains are localized in the regionbetween ultimate load point and Fracture point.
4.4 Strain HardeningFrom lower yield point onwards increase in load is required for increase in strain. Thusthe stress required for further deformation is more. This phenomenon is called strainhardening.
4.5 True-Stress-True Strain Curve in log-log co-ordinatesWhen the True – stress and True strain are plotted on log-log co-ordinates the curve looksas in Fig.2 i.e. Straight line.
4.6 Ductile and Brittle MaterialsIf a material fails without much plastic deformation it can be called brittle. If thepercentage elongation at fracture is less than 2.5 the material is classified as brittle. ExGrey Cast Iron- Usually the metals with F.C.C and CPH structures are highly ductile. Ex Al, Cu,
Ag, Au etc.
IV. PROCEDURE:1. Measure the originals gauge length and diameter of the specimen.
Aurora's Technological and Research Institute
Department of Civil 40
Strength of Materials
2. Insert the specimen into grips of the test machine3. Begin the load application and record load versus elongation data4. Take readings more frequently as yield point is approached5. Measure elongation values6. Continue the test till fracture occurs.7. By joining the two broken halves of the specimen together measure the final
length and diameter of specimen at fracture.
V. RESULTS & DISCUSSIONSa) Plot the Engg. Stress stain curve and determine the following
i) Limit of proportionality = (N/mm2)ii) Yield strength = (N/mm2)iii) Ultimate Strength = (N/mm2)iv) Young’s modulus = (N/mm2)v) Percentage Elongation = %
(Ductility)vi) Percentage reduction in area = %vii) Fracture Strength = (Nominal / Engg)viii) Toughness = area under Stress-Strain curve up to fractureix) Malleability
b) Plot True-Stress, True-strain curve after calculating true-Stress and True-strain values atvarious points.Estimate i) Strength coefficient
ii) Strain hardening coefficient
c) Determine whether the material is Ductile or Brittle?d) Comment on the results.
VI. PRECAUTIONS:When the UTM is in operation stay away from the machine jaws
VII. VIVA QUESTIONS:
Define the following terms1. Elasticity.2. Plasticity3. Rigidity4. Ductility5. Toughness6. Brittleness7. Stress.8. Strain9. Tensile Stress10. Shear Stress11. Limit of Proportionality12. Elastic Limit13. Yield Point14. Upper Yield Point
Aurora's Technological and Research Institute
Department of Civil 41
Strength of Materials
15. Lower Yield Point16. Strain Hardening.17. Proof Stress.18. Modulus of Resilience.19. Resilience.20. Percentage Elongation21. Percentage Reduction in Area22. True Stress23. True Strain24. Ultimate Strength25. Breaking Strength26. Elastic Constants27. Young’s Modulus28. Shear Modulus or Modulus or Rigidity29. Bulk Modulus30. Poissons/Ratio31. Modulus of Elasticity for Mild Steel, Copper, Aluminum, Cost Iron etc.32. Examples for Ductile Materials33. Examples for Brittle Materials34. Examples for Malleable Materials .35. Failure of Ductile Material under Tension36. Failure of Brittle Material under Tension.
.
Aurora's Technological and Research Institute
Department of Civil 42
Strength of Materials
Aurora's Technological and Research Institute
Department of Civil 43
Strength of Materials
Aurora's Technological and Research Institute
Department of Civil 44
Strength of Materials
Aurora's Technological and Research Institute
Department of Civil 45
Strength of Materials
8. SHEAR TEST
Aim:To find the shear stress of the given specimen
Apparatus:UTM, specimen, shear test attachment
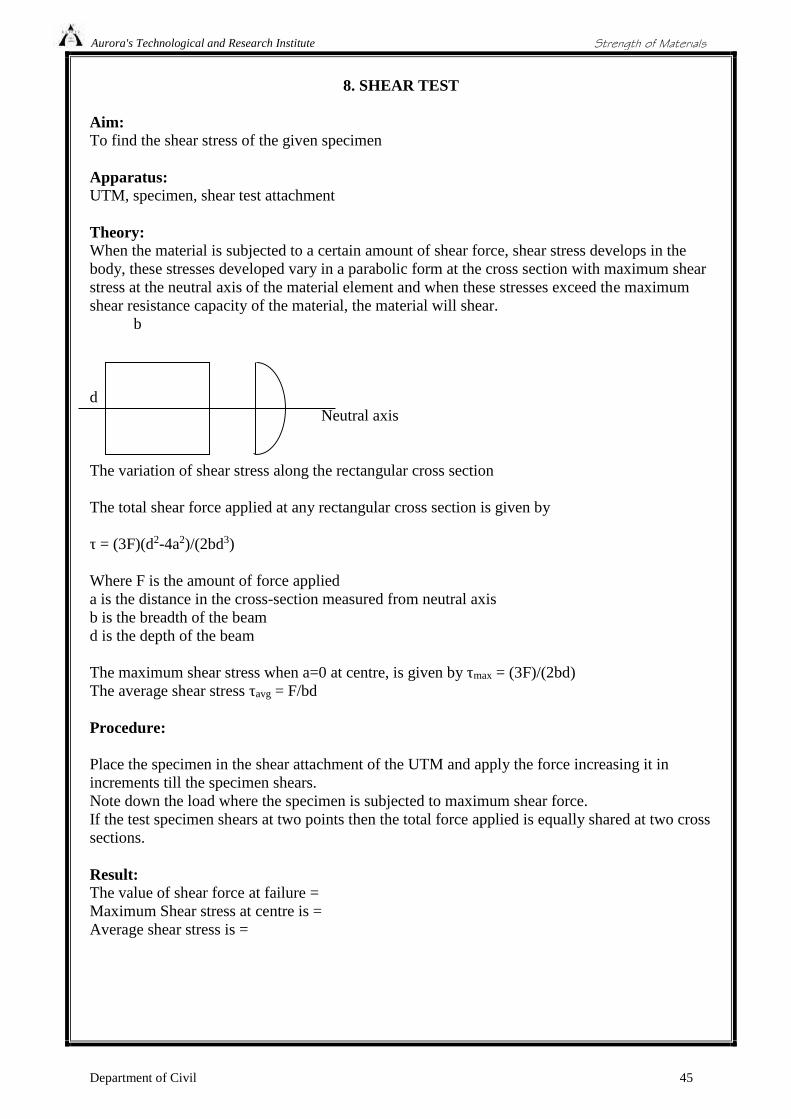
Theory:When the material is subjected to a certain amount of shear force, shear stress develops in thebody, these stresses developed vary in a parabolic form at the cross section with maximum shearstress at the neutral axis of the material element and when these stresses exceed the maximumshear resistance capacity of the material, the material will shear.
b
dNeutral axis
The variation of shear stress along the rectangular cross section
The total shear force applied at any rectangular cross section is given by
τ = (3F)(d2-4a2)/(2bd3)
Where F is the amount of force applieda is the distance in the cross-section measured from neutral axisb is the breadth of the beamd is the depth of the beam
The maximum shear stress when a=0 at centre, is given by τmax = (3F)/(2bd)The average shear stress τavg = F/bd
Procedure:
Place the specimen in the shear attachment of the UTM and apply the force increasing it inincrements till the specimen shears.Note down the load where the specimen is subjected to maximum shear force.If the test specimen shears at two points then the total force applied is equally shared at two crosssections.
Result:The value of shear force at failure =Maximum Shear stress at centre is =Average shear stress is =
Aurora's Technological and Research Institute
Department of Civil 46
Strength of Materials
9. COMPRESSION TEST ON CONCRETE
Aim:To determine the 7 day and 28 day compressive strength of concrete specimen of size 150 mmcube using compression testing machine
Apparatus/material required:Cement, coarse aggregate of size 20 mm, fine aggregate, water, casting cube, trowel, standardbowl, tray, hand gloves, weigh balance, oil, water
Theory:The method of concrete mix design consists of selection of optimum combination of cement,coarse aggregate and fine aggregate and water to produce concrete specimen of desiredproperties. The concrete is graded according to its compressive strength as per Indian Standards456-2000. The design of mix shall involve determination of water, cement, fine aggregate andcoarse aggregate so that the concrete of specified properties can be obtained economically.
Steps to mix the aggregate: Weigh the aggregate in the following proportions:
Aggregate for eachspecimen of 150
mm cube
Weight in Kilograms(except water)
Measure using
Cement 1.0164 Weighing machine
Coarse aggregate 1.655
Fine aggregate 3.406
Water 0.613 ltr(density = 1gm/cc)
Measuring flask
Total weight 6.75 approximately
Take a clean bowl and place the coarse aggregate and fine aggregate and cement in theorder and thoroughly mix the aggregate and add water and mix till the aggregate mixattains consistency.
Take two numbers standard 150mm cube test moulds and apply oil on all inner sides.
Pour the aggregate mix into this mould ensure that the cast is continuous and no voids areobserved.
Remove any excess material and allow the mould to set for 24 hours.
After 24 hours, the following day after when the material is set demould the material andcure the specimen thoroughly for seven days and twenty eight days.
Thorough curing operation need to done.
After seven days, one of the specimens is tested using a compressive testing machine forcrushing strength.

Aurora's Technological and Research Institute
Department of Civil 47
Strength of Materials
After twenty eight days, the second specimen is tested using a Compressive testingmachine for crushing strength.
Result:1. Water cement ratio used =
2. 7-day crushing strength =
3. 28 day crushing strength =
Aurora's Technological and Research Institute
Department of Civil 48
Strength of Materials
10. VERIFICATION OF MAXWELLS RECIPROCAL THEOREM ON BEAMS
Aim:To verify the Maxwells reciprocal theorem on beams
Apparatus required:Simply supported beam set up, cantilever beam set up, dial gauges, weights
Theory:
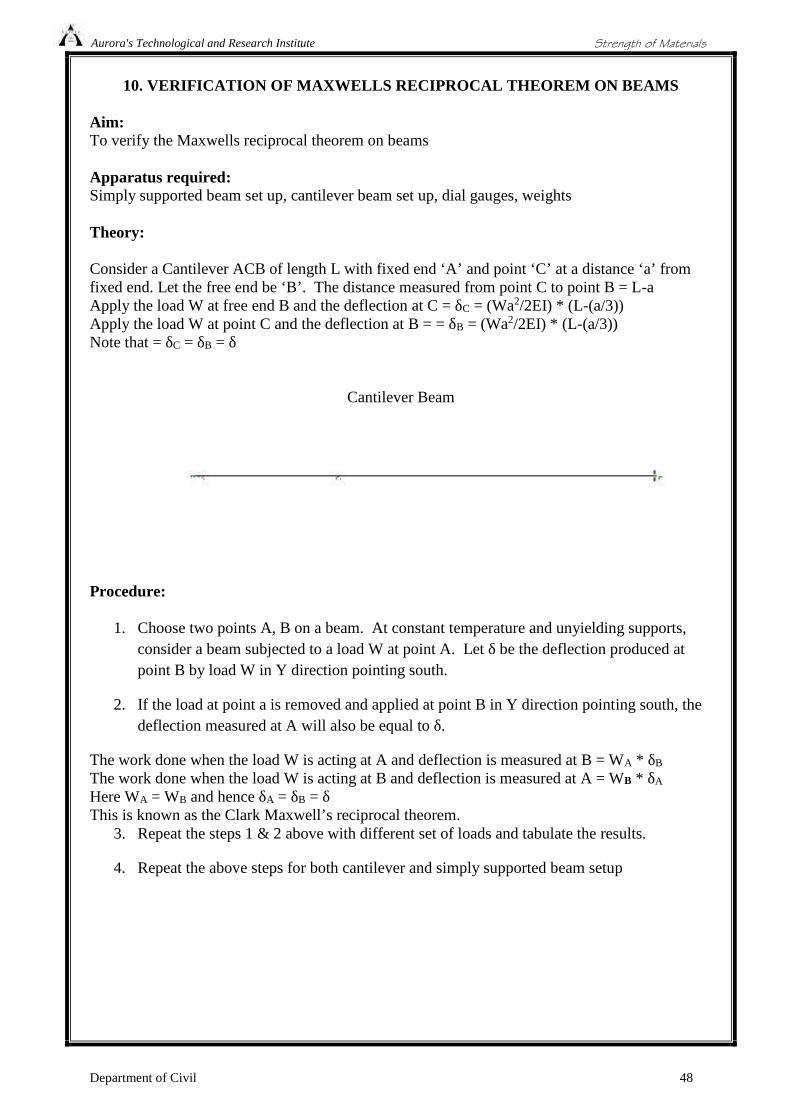
Consider a Cantilever ACB of length L with fixed end ‘A’ and point ‘C’ at a distance ‘a’ fromfixed end. Let the free end be ‘B’. The distance measured from point C to point B = L-aApply the load W at free end B and the deflection at C = δC = (Wa2/2EI) * (L-(a/3))Apply the load W at point C and the deflection at B = = δB = (Wa2/2EI) * (L-(a/3))Note that = δC = δB = δ
Cantilever Beam
Procedure:
1. Choose two points A, B on a beam. At constant temperature and unyielding supports,consider a beam subjected to a load W at point A. Let δ be the deflection produced atpoint B by load W in Y direction pointing south.
2. If the load at point a is removed and applied at point B in Y direction pointing south, thedeflection measured at A will also be equal to δ.
The work done when the load W is acting at A and deflection is measured at B = WA * δB
The work done when the load W is acting at B and deflection is measured at A = WB * δA
Here WA = WB and hence δA = δB = δThis is known as the Clark Maxwell’s reciprocal theorem.
3. Repeat the steps 1 & 2 above with different set of loads and tabulate the results.
4. Repeat the above steps for both cantilever and simply supported beam setup
Aurora's Technological and Research Institute
Department of Civil 49
Strength of Materials
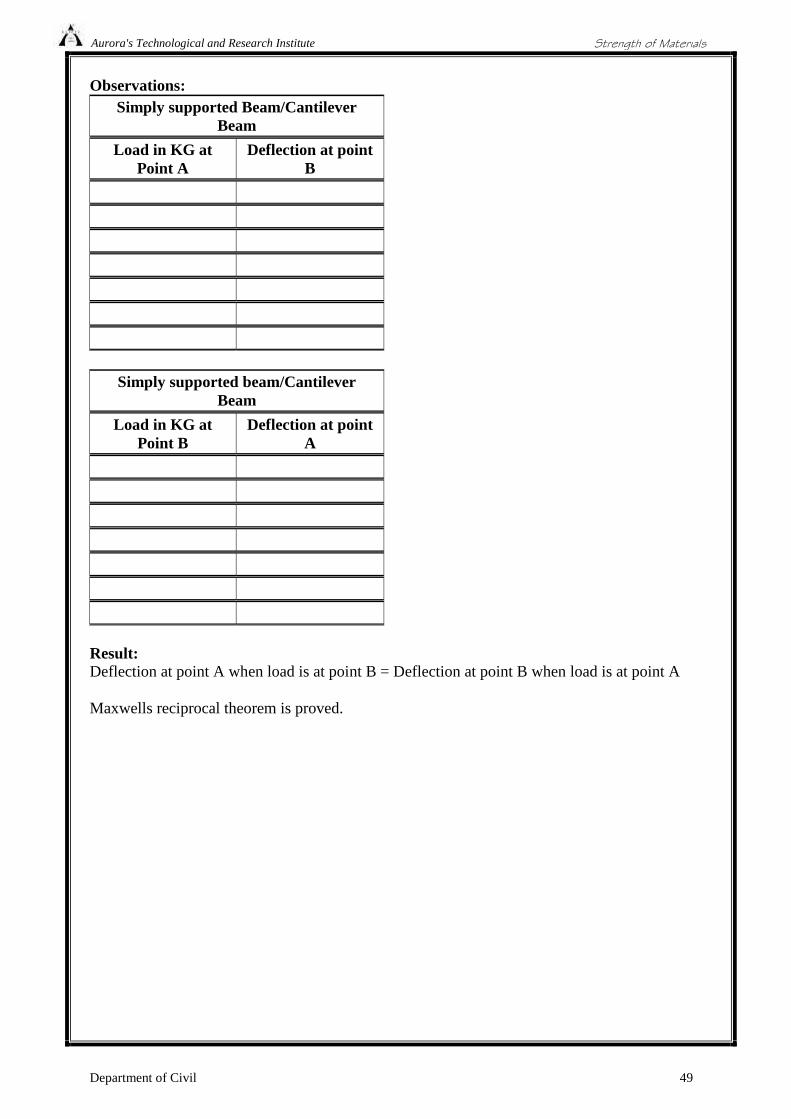
Observations:Simply supported Beam/Cantilever
Beam
Load in KG atPoint A
Deflection at pointB
Simply supported beam/CantileverBeam
Load in KG atPoint B
Deflection at pointA
Result:Deflection at point A when load is at point B = Deflection at point B when load is at point A
Maxwells reciprocal theorem is proved.
Aurora's Technological and Research Institute
Department of Civil 50
Strength of Materials
11. CONTINUOUS BEAM - DEFLECTION TEST
Aim:To conduct the deflection test on continuous beam
Apparatus :Continuous beam set up, dial gauges, weights
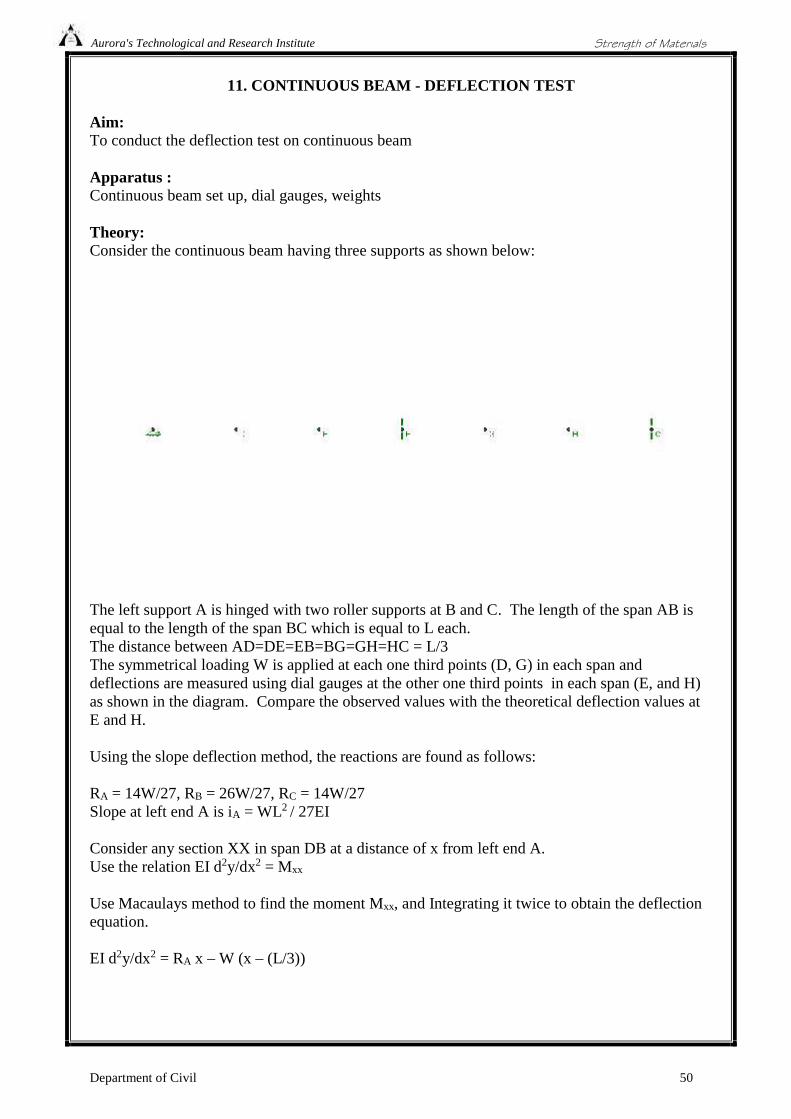
Theory:Consider the continuous beam having three supports as shown below:
The left support A is hinged with two roller supports at B and C. The length of the span AB isequal to the length of the span BC which is equal to L each.The distance between AD=DE=EB=BG=GH=HC = L/3The symmetrical loading W is applied at each one third points (D, G) in each span anddeflections are measured using dial gauges at the other one third points in each span (E, and H)as shown in the diagram. Compare the observed values with the theoretical deflection values atE and H.
Using the slope deflection method, the reactions are found as follows:
RA = 14W/27, RB = 26W/27, RC = 14W/27Slope at left end A is iA = WL2 / 27EI
Consider any section XX in span DB at a distance of x from left end A.Use the relation EI d2y/dx2 = Mxx
Use Macaulays method to find the moment Mxx, and Integrating it twice to obtain the deflectionequation.
EI d2y/dx2 = RA x – W (x – (L/3))
Aurora's Technological and Research Institute
Department of Civil 51
Strength of Materials
The two conditions used to find constants of integration C1 and C2 are the slope and deflection atpoint B are zero (symmetrical loading on both the spans and support at B)
C1 = - 0.09259259 WL2
C2 = 6.1722 x 10⁻³ WL3
Compute the theoretical values of deflection using the following expression
The deflection at any point x in span DB is given by
Y = RA (x3/6) – W(x3/6) + WL (x2/6) + C1x + C2
A Sample calculation for deflection at point E for the sample data is given below:
Take,W = 10 NL = 1000 mmX = 2/3 m = 666.66 mmE = 2 x 10⁵ N/mm2
Breadth b = 30 mmDepth d = 5 mmI = bd3/12 = 312.5 mm4
EI = 625 x 105 Nmm2
C1 = - 0.09259259 *10 *1000*1000C2 = 6.1722 x 10-3 *10* 10003
EIY (at x = 666.66 mm) = (140/27) (666.663/6) – 10(666.663/6) + 10.1000 (666.662/6) + 666.66* (- 0.09259259 *10 *1000*1000) + 6.1722 x 10-3 *10* 10003
Y = 0.841 mm in the downward direction
Observations:LOAD Observed
Deflection at EObservedDeflection at H
Calculateddeflection at E
Calculateddeflection at H
AT D AT G
Result:
Deflection calculated =
The observed values of deflection match with the theoretical values.
Aurora's Technological and Research Institute
Department of Civil 52
Strength of Materials
12. EFFECT OF LOADING AND UNLOADING BEYOND ELASTIC LIMIT
Aim:The aim of the experiment is to understand the behavior of the material when loading andunloading is continued beyond elastic limit
Appartus:UTM, test specimen, dial gauge reading, vernier calipers
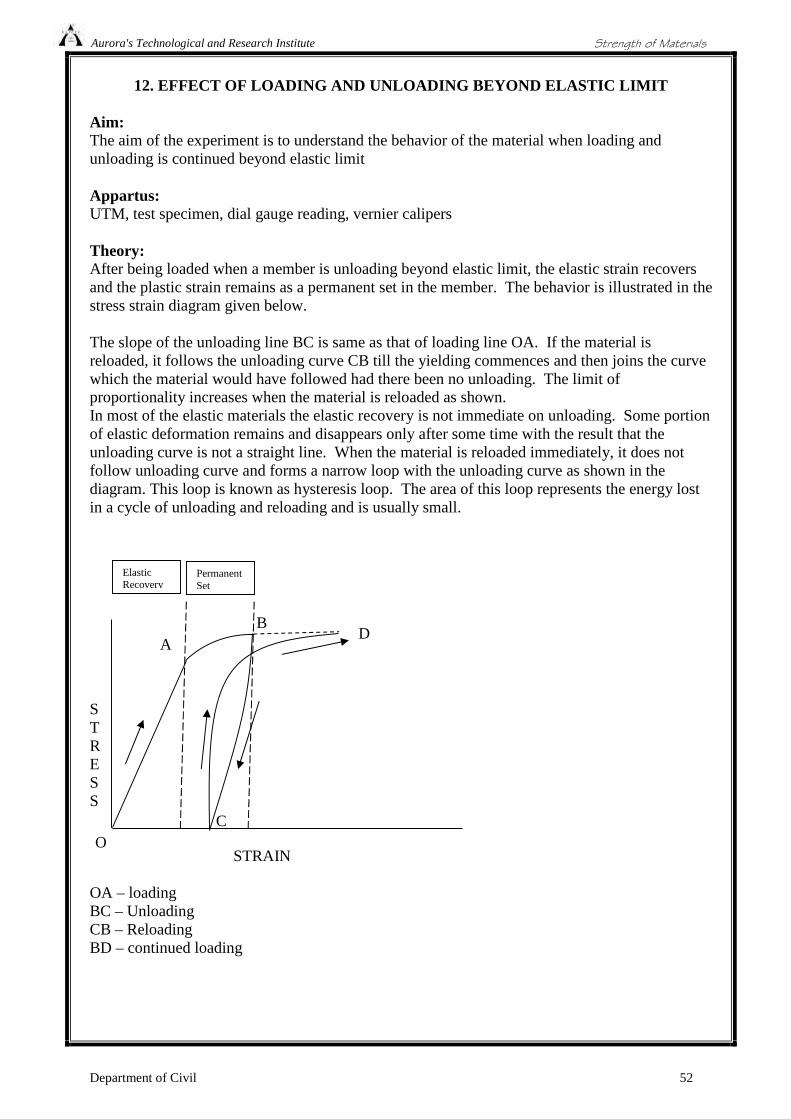
Theory:After being loaded when a member is unloading beyond elastic limit, the elastic strain recoversand the plastic strain remains as a permanent set in the member. The behavior is illustrated in thestress strain diagram given below.
The slope of the unloading line BC is same as that of loading line OA. If the material isreloaded, it follows the unloading curve CB till the yielding commences and then joins the curvewhich the material would have followed had there been no unloading. The limit ofproportionality increases when the material is reloaded as shown.In most of the elastic materials the elastic recovery is not immediate on unloading. Some portionof elastic deformation remains and disappears only after some time with the result that theunloading curve is not a straight line. When the material is reloaded immediately, it does notfollow unloading curve and forms a narrow loop with the unloading curve as shown in thediagram. This loop is known as hysteresis loop. The area of this loop represents the energy lostin a cycle of unloading and reloading and is usually small.
STRESS
STRAIN
OA – loadingBC – UnloadingCB – ReloadingBD – continued loading
O
AB
C
D
ElasticRecovery
PermanentSet
Aurora's Technological and Research Institute
Department of Civil 53
Strength of Materials
Procedure:
1. Mark two points on the specimen and measure the length of specimen between the two points.Mount the specimen in the UTM apply the loading on the test specimen incrementally, notedown the loading and the corresponding dial gauge readings, once after the material crosses theelastic limit and enters the yielding zone stop the loading and slowly unload till zero. Unmountthe specimen and note down the increase in length.2. Again mount the test specimen in the UTM and apply the loading incrementally, note downthe loading and the corresponding dial gauge readings. Once after the reloading crosses the lastloading point and material starts further yielding stop the loading and gradually unload till zero.Note down the loading and any changes in the dial gauge readings. Unmount the specimen andnote down the change in length between the same marked points.3. Repeat step two till the ultimate stress point is attained.4. Plot the stress strain curve with loading, unloading, reloading and continued loading phasesand with the corresponding strain on x-axis
Tabulate your results:
Load in KN Dial gauge reading Phase/cycle Length of thespecimen
Result:
Cycle 1 maximum Loading isPermanent Set =
Cycle 2 maximum loadingPermanent set =
Cycle 3 maximum loadingPermanent set =
The behavior of the material under loading and unloading and reloading phases is graphed andhysteresis loop is observed.
Related Documents