Faculty of Organisation and Management BSc (Honours) Hospitality Business Management Title: The study of the success of the fast food industry in Hong Kong Name: Chan Kai Wah, Eric Student No: 91203406 Month Year April 2009

Welcome message from author
This document is posted to help you gain knowledge. Please leave a comment to let me know what you think about it! Share it to your friends and learn new things together.
Transcript
Faculty of Organisation and Management
BSc (Honours) Hospitality Business
Management
Title: The study of the success of the fast food industry in Hong Kong
Name: Chan Kai Wah, Eric
Student No: 91203406
Month Year April 2009
Sheffield Hallam University
Faculty of Organisation and Management
Title: The study of the success of the fast food industry in Hong Kong
FULL NAME: Chan Kai Wah
STUDENT No; 91203406
Supervisor: Professor Ray Pine
In partial fulfilment of the requirements for the degree of Bachelor of Science in
Hospitality Business Management.
Month Year April 2009
1
Abstract
The aim of this research study was to analyze the success of fast food industry in
Hong Kong. The objectives were to define the relationship between Hong Kong
eating culture and the success of fast food industry, and to give suggestions to “cha
chaan tengs” , the Hong Kong style restaurants, which were under the thread of fast
food restaurants. This research study provided the basic history and information of
fast food restaurants and “cha chaan tengs”, and the keys to their success and its
relationship to Hong Kong culture. The research result was come from the collection
and analysis of quantitative data from a questionnaire. The questionnaire consisted of
thirty-eight questions including twelve likert scale questions. The Questionnaire were
taken place in interviewer-administered interview and self-completion surveys.The
results of conducting this questionnaire may help to find out if our eating culture was
linked to the success of the Hong Kong fast food industry. For example, sixty five
percent of the participants like eating fast food. It may be an effective strategic
initiative that enables long-term success, enhances value, and helps to increase an
organizations competitive advantage. It can also provide “cha chaan teng” some
suggestions to improve their own management, such as, improving the hygiene level
of the restaurant and reduce the waiting time for the food production. It may let them
know how to survive in the economic environment nowaday.
2
Contents
Abstract 2
Contents 3
List of Figures 6
List of Tables 6
Chapter 1: Introduction
Rationale 9
Aim of research 10
Objective of research 10
The subject area & the areas in which the research will cover 10
The overall structure of the report 12
Chapter 2: Literature Review
Introduction 13
Culture 13
Success 14
Fast food 15
Cha chaan teng 16
History of fast food industry in Hong Kong 17
Factors make fast food become success 20
3
The link between culture and the success of fast food industry in
Hong Kong
24
Chapter summary 29
Chapter 3: Methodology
Research method 30
Primary research 31
Secondary research 31
Research instrument 32
Target interviewee 32
Sampling 33
Data collection media 34
Questionnaire design 35
Data analysis 36
limitations 36
Chapter summary 37
Chapter 4: Results
Introduction 38
Quantitative data collection 38
Questionnaire-Part A 39
4
Questionnaire-Part B 52
Questionnaire-Part C 55
Questionnaire-Part D 59
Chapter summary 63
Chapter 5: Conclusions and Recommendations
Conclusions 64
Recommendations 65
Recommendation for further research 67
References 68
Appendices
Appendix 1. The final questionnaire 78
5
List of Figures
Figure 1: Monthly purchase frequency for fast food and drinks in Hong
Kong
28
List of Tables
Table 1: Top ten global markets for weekly fast food consumption 27
Table 2: Frequency Distributions-Demographic Questions 40
Table 3: Frequency Distributions-Monthly Income & Occupation 42
Table 4: Frequency Distributions-Do you like eating fast food? 42
Table 5: Cross tabulation of Length of Stay in Hong Kong & ‘Do you
like eating fast food?’
43
Table 6: Frequency Distributions- ‘Have you visit fast food restaurant
before?’, ‘Could you find a fast food restaurant near your
working place or school?’ &‘How often do you visit a fast food
restaurant?’
44
Table 7: Cross tabulation of Occupation & ‘How often do you visit a
fast food restaurant?’
46
Table 8: Frequency Distributions-‘Which meal do you usually have in
fast food restaurant?’
47
6
Table 9: Frequency Distributions- ‘How much time do you have for
meal?’ & ‘How much do you usually spend on each time?’
48
Table 10: Cross tabulation of Respondent's Age & ‘How much time do
you have for meal?’
49
Table 11: Frequency Distributions- ‘Do you think that the new fast food
products can attract you to visit fast food restaurants?’
50
Table 12: Frequency Distributions-‘What is the most important thing
when you choose a fast food restaurant to dine?’
50
Table 13: Cross tabulation of Respondent's Age & ‘What is the most
important thing when you choose a fast food restaurant to
dine?’
51
Table 14: Descriptive Statistics-Questionnaire Part B-means 52
Table 15: Frequency Distributions-Questionnaire Part C 56
Table 16: Frequency Distributions-‘In your opinion, why is fast food so
popular among Hong Kong?’
60
Table 17: Frequency Distributions-‘What thing do you think the fast
food restaurants need to improve most?’
61
Table 18: Frequency Distributions- ‘Which places do you prefer to have
meal, fast food restaurant or cha chaan teng?’
61
7
Table 19: Cross tabulation of Occupation & ‘Which places do you prefer
to have meal, fast food restaurant or cha chaan teng?’
62
Table 20: Frequency Distributions- ‘Have you ever been affected by the
financial tsunami?’
62
Table 21: Cross tabulation of ‘Have you ever been affected by the
financial tsunami?’ & ‘What is the most important thing when
you choose a fast food restaurant to dine?’
63
8
Chapter 1
Introduction
Rationale
All people need to eat. Eating is an essential need for people’s life. The Hong
Kong economy is now influenced by the financial tsunami. Many restaurants are now
facing their own financial problems and some of them choose to close their business
to avoid further loss. According to Wong (2008), a Japan chain restaurant was closed
because of the financial problems. Although the financial tsunami affected the Hong
Kong economy, it seemed not having much effect on the fast food industry. According
to the Standard (2008), 1,000 companies included the Fast food companies planned
not to cut manpower in the coming year and provided more than fifty thousand jobs to
the unemployed people. The fast food industry was challenged with complex and
dynamic operating environments. The restaurant location, taste of food, eating culture
of people, price and etc influenced the success of the fast food industry.
According to Lumpur (2005), the type of cuisine, price and convenient location
were found to be the most important choice criteria across around the globe. Because
of the Firebaugh (2006) said that success depended on what you were searching for in
life, and searching for in business. “Ongoing development and improvement is
essential if the catering industry is to continue its positive growth trend.” (First
9
National Bank, 2009).
Aim of the research
The aim of the research is to discover why the fast food industry is successful in
Hong Kong.
Objectives of the research
The objectives of the research are to find out how Hong Kong culture is linked to
the success of the fast food industry and to provide some recommendations to the
“cha chaan teng”, the traditional Hong Kong style restaurant.
The subject area & the areas in which the research will cover
The subject area of the research was to find out how the Hong Kong eating culture
is linked to the success of the fast food industry. It was because many restaurants
chose to close their business or cut their budget but only the fast food restaurants
chose to expand their business during this hard time. According to Scent (2008), the
senior investment strategist of DBS Bank (Hong Kong), Daniel Chan Po-Ming said
that only the fast food industry could have a good performance. According to the Café
de Coral Final Report to Shareholders (2008), they have planned to build a new food
10
processing plant and open new branches. The success of fast food industry was not
only because of the price of food and the large financial support. It was also because
of the eating culture of the Hong Kong people. According to Goodman et al (1991),
fast food first appeared in 1950. Due to a long history of establishment in Hong Kong,
the fast food industry must have its own key factor to be successful. According to the
Swiss Association for Nutrition (2003), the success of the fast food was related to the
living conditions of people, such as, more working people, short meal time and etc.
Other area of the research is to provide some recommendations to “cha chaan
teng”, the traditional Hong Kong style restaurant. The recommendations were in
chapter 5. Understanding what the key factors to success are can help the fast food
companies to make improvement. The fast food companies may know more about
what they need to do more to cater the customers’ needs. It may also help “cha chaan
teng” to know what they need to improve. It was because learning from the strengths
and weaknesses of the competitors can help the company to find out which strategy
they need to choose. Also, it can help to boost the economy of Hong Kong because of
the keen competition among the industry.
11
The overall structure of the report
The report was divided into five chapters. Chapter one was the introduction. It
was to introduce the overall structure of the report. It included the aim and objectives
of the research and the rationale and the areas in which the research would cover.
Chapter two was the literature review. The information in this chapter was collected
from the internet, chapters in books, newspaper, statistical digests and research report
from the agent. It was divided into seven parts and there was a small conclusion in
each part. This chapter was to find out the link between culture and the success of the
fast food industry.
Chapter three was the methodology. This chapter included the research method,
the primary and the secondary research, research instrument, Data collection method
and the research method. The research method was quantitative method and
questionnaire would be used to discover the factors that linkage between the eating
culture and the success of the fast food industry. Chapter four was the results. It was
the data collected form the questionnaires. These findings were presented and related
to the literature review through evaluation. The last chapter was the conclusion and
recommendations from the findings. This was the sum up of the research and made
some realistic and viable recommendations. It also provided the recommendation for
further research on this topic.
12
Chapter 2
Literature Review
Introduction
This literature review consisted of seven parts with a short conclusion. The first
and second parts explained my points of view of culture and success. Then, it would
be parts to explain the definition of “cha chaan teng” and fast food. The sixth and
seventh parts gave details of the factors make fast food a success and how the Hong
Kong culture contributed toit. Finally, there was a conclusion of the literature review.
Culture
Oak (2008) said that culture was shared by a group of people. She also said that
culture was depending on the region they lived in, the climate of the region and their
history. It forms a set of values and beliefs of their life and shapes their culture.
According to Dictionary.com (2009), culture had different meanings. Culture was
the quality in a person on society that arises from a concern for what was regarded as
excellent in arts, manners and etc. it can also be the beliefs and behaviors
characteristic of a popular social, ethnic, or age group. It was the totality of socially
13
transmitted behavior patterns and all other products of human work and thoughts.
To sum up, culture was a development or improvement of the mind by education
or training. It was shared by a group of people who lived in the same society and
depended on their life and their history.
Success
Firebaugh (2006) said that success depended on what you were searching for in
life, and searching for in business. For the fast food company, their success depended
on the profits they made and the market share they can get within the industry.
According to Answer.com (2009), success means the achievement of something
desired, planned or attempted and the gaining of frame or prosperity and etc.
According to Isidro (2008), success for small business can be based on 10 rules,
such as, product differentiation, good reputation, constant improvement, being
innovative, having plan for success and listen to their customers and etc.
To sum up, success was the achievement of something. It can be attaining a goal
of a business plan or project. It depended on what you are searching for and can be
based on some rules.
14
Fast food
Fast food had many different definitions. According to Hill and Jones (2007), fast
food industry was under the category of fragmented industry. It is consists of a large
number of small and medium sized companies. The Swiss Association for Nutrition
(2003) suggested that fast food required little time, offered a limited selection and the
silverware and plates were disposable.
According to Ball (1992), he had a set of meaning about fast food quoted from
several people who from Hyam, J, Ratcliffe, M and Thompson, J. Hyam (1985) said
that fast food should be freshly prepared at the point where it should be suitable for
eating with fingers and quickly prepared. Ratcliffe (1982) mentioned that fast food
was basically a system of technology and not a product. Based on the above, fast food
was a product which is freshly and quickly prepared and can be produced under a
system of technology. Thompson (1988) stated that for many catering business, fast
food was defined as that sold over the counter.
In a recent study, Leung (2004) said that fast food in Hong Kong was cheap fast
and convenient. The fast-food operations in Hong Kong can be divided into two
categories: international chains and local chains. They have different management
style.
15
The major products sold of international fast-food chains are hamburger, chicken,
and pizza. The three major local fast food chains are Cafe de Coral, Fairwood, and
Maxim's. They are all Chinese-style fast-food restaurants.
To conclude, fast food is a food product which is cheap, fast, quickly prepared
under a set of food processing system and sell over the counter. It is also a small and
medium sized business.
Cha chaan teng
In cha chaan teng (2009), it explained that cha chaan teng was a type of Chinese
tea restaurant commonly found in Hong Kong. It can also call tea restaurant because
they provide tea to customer as soon as they seated. It served to distinguish itself from
Western restaurants that provided water to customers instead of tea. The customers
would like to use the tea to wash their utensils. Also, the customers can choose the
table they like.
Next, cha chaan teng allowed different people to share the same tables. These are
the difference between the western restaurants. These can increase the number of
customers come to cha chaan teng.
The menus include many dishes from Hong Kong cuisine and Hong Kong-style
Western cuisine. Cha chaan teng serves a wide range of food, from steak to wonton
16
noodles to curry to sandwiches. Both fast food and a la carte dishes are available. The
drinks like yuan yang, Hong Kong style milk tea, iced coffee with lemon and
Coca-Cola with lemon are invented by cha chaan teng. Today, cha chaan teng can also
be found in many chins towns.
Generally, cha chaan teng is a kind of restaurant found in Hong Kong. It can also
call tea restaurant. The founder of cha chaan teng is Hong Kong people and it can be a
kind of Hong Kong style restaurant. The famous drinks are yuan yang and Hong
Kong style milk tea.
History of fast food industry in Hong Kong
According to Ball (1992), fast food first appeared in Britain in the Industrial
Revolution. Fish and chips were the original fast food. In Cuisine of Hong Kong
(2009), it stated that the cuisine of Hong Kong can trace its origins to its founding as a
Britain colony. The British culture has influenced the cuisine in Hong Kong. The start
of the history of fast food can be referred to the 1950s.
According to Goodman et al (1991), it stated that during the period between 1951
and 1981 women started to work outside to earn money. Their wages rose from under
one-third to roughly a half. They did not have time to manage the housework, so, they
chose eating out during this period. The words “eating out” became what we call fast
17
food today. It was an important time for the start of fast food.
Also, during 1960 to 1970, the rapid industrialization in Hong Kong speeded up
the effect of fast food culture. It encouraged the government to change the land use of
the New Territories from agriculture to industrial and commercial use. Because of the
change of land use, more women went to work outside. Because of less time to do
their home work, eating out became their only choice. Goodman et al pointed out that
Chinese take-away service was the outcome of social and demographic changes
during 1960s and 1970s. Many fast food chains started their operation in Hong Kong,
such as, Café de Coral, Maxim’s and etc.
The British also helped to develop the service industry and its outcome was the
Chinese catering. The North American fast-food chains, such as, Mc Donald’s and
KFC competed with the local fast food restaurant. It formed the fast food market
nowadays. It was similar to the situation of the invasion of Britain’s high streets by
North American fast food mentioned in Ball (1992).
During 1980s-90s, one of the fast growing industries in Hong Kong had been the
fast-food industry. In a recent study (Lan et al, 1995), it found that fast-food receipts
increased from HK$488 million in 1980 to HK$6,422 million in 1991 according to a
report by the Hong Kong Department of Census and Statistics. They also said that the
number of fast-food restaurants jumped from 377 to 1,040, and the number of
18
employees in the fast-food industry increased from 3,848 to 22,247. 90 percent of the
population ate out at least once a week, more and more people visited the fast food
restaurants.
Besides, they said that the rapid economic development in the Pacific Rim over
the past 30 years, the lifestyle of Hong Kong residents had changed dramatically. In
1990 the average Hong Kong household spent 56 percent of its food budget on eating
out. That was twice the level of the Japanese and three times that of Americans. With
the high speed of life in Hong Kong, working couples and single professionals began
to eat out, especially for lunch. Most of them preferred Chinese food as their main
diet, and local fast-food chains responded to the demand. As a result, many local
Chinese fast food chains changed their operating system to attract more customers but
also competing directly with the international chains. The three major local chains'
share of the fast-food market is estimated to be 50 percent in an extremely
competitive market.
In conclusion, fast food first appeared in Hong Kong during 1950s. It first called
eating out. The fast food appeared because many people go to work outside during
1950-1980. They do not have time to cook and choose to eat outside. The concept of
fast food service was brought by the west. Now, fast food industry becomes one of the
large industries in Hong Kong.
19
Factors make fast food become success
Fast food becomes successful based on different factors.
According to the Swiss Association for Nutrition (2003), the success of fast food
arose from the changes in our living conditions. It was because many women or both
parents now need to work and the number of single-parent households was increased.
In a recent study (Population By-census, 2006), it stated that the numbers of people
who divorced and separated have been increased from 1.9% to 3.8% during the past
10 years. The adults needed to look after their family members and work. They did
not have time to cook at home and therefore they chose fast food.
Also, the Swiss Association for Nutrition (2003) stated that the lunch time of
working people and student were usually short. People needed to have quick meals
and they chose fast food. The lunch hour in Hong Kong started from 12:00 noon and
finished at 1pm. Having only one hour for lunch, people would have their lunch near
their workplace and schools. Apart from the working people, the fast food culture also
affected the young people.
According to The Effect of the Fast Food Culture on Young People (2008), it
stated that fast food affected most of the secondary school student. They did not have
enough time to have meal if the teachers keep on talking after the bell ring. They may
need to meet the teachers during the lunch time. Therefore, they would choose to eat
20
fast food because of convenience.
Ritzer (2004), it suggested some factors which made the fast food success. The
higher profits and lower costs was one of the factors. The food cost was very low but
the food was produced in mass production. Therefore, it was easy to get a large profit.
The prices of fast food products were low and affordable for common people, this
lead to fast foods being alternative sources of food consumption for both residents and
tourists. Other factor was the continuing promotion of the products on mass media. It
can attract more people to visit the restaurant.
In a recent study (The Knowledge @ Wharton, 2006); it stated that
standardization was one of the factors for the success of fast food industry.
Standardization can help the company to set strict rules on raw material and
management. Due to standardization, all the food production process can be
simplified and the preparation time can be shortened to match the short meal time of
Hong Kong people.
Lan et al. (1995) said that production and distribution related to the success of fast
food industry. The concept of mass production and central distribution of food in the
local fast food chains were brought by the West. It was because most Chinese dishes
involved many steps in washing, chopping, seasoning, and cooking. It spent too much
time on such preparation work. Therefore, local Chinese fast food chains tried to
21
centralize food processing and ordering to minimize such labor-intensive work. As an
example, Cafe de Coral relies on its central food processing plant to do most of the
food preparation, leaving only some last-minute cooking and heating to be done at the
individual outlets.
According to the 10 rules for small business success provided by Isidro (2008),
the fast food companies have followed some of the rules.
Firstly, the fast food companies in Hong Kong have good reputation. Because of
the long history of establishment in Hong Kong, they have developed a good
relationship among the community, such as; the Hong Kong Ronald McDonald House
and they seldom have any food poisoning news in Hong Kong.
Secondly, listen to their customers was also one of the key points to make them
success. Customers need to feel that they are important to the companies. When you
came to every fast food shop, they can find a comment box in the counter and it
allowed the customers to send their comments by email.
Thirdly, the fast food companies had their plan to develop their business. We can
see their plans in their website or their online annual reports. For example, Café de
Coral, one of the famous fast food shops in Hong Kong, their annual report stated that
the new food processing plants will be open in 2010. Also, we can see their mission
statement and goal in their company website.
22
Fourthly, it is the product innovation. Since the living standard of people and their
expectation of fast food quality have been increased. They had a higher expectation
on food and they require unique food product for their meal. The fast food companies
introduced new food products regularly. They promoted their new food products in
their shops, official website and through mass media. Café De Coral Strategic
Business Units (2005) stated that they would introduce new products on a seasonally
basis in their official website.
To sum up, there were many reasons why the fast food is a success. The increased
number of single-parent household and working parents made the fast food industry in
Hong Kong becomes a success. Because of the rapid development of the society,
people need to spend more time to work and this cause the people chose fast food.
Next, mass production and distribution helped to the development of the fast food
industry. It can help to reduce the time for doing repeating works and the high labor
costs. Besides, the 10 rules for small business success are also the key factors of the
success of fast food industry.
23
The link between culture and the success of fast food industry in Hong Kong
Montanari (2006) stated that food was culture when it was eaten because man,
while able to eat anything, did not in fact eat everything but rather chose his own food.
Therefore, fast food can be a culture of a place if the people living there chose to eat
fast food as their meal.
According to Goodman (1991), people in Hong Kong chose eating out since
1950s. Up to now, people in Hong Kong still chose to have meal outside. Because of
the long history of eating outside, it had already developed in our mind. It was one
kind of culture in Hong Kong.
According to Ball (1992), the development of fast food industry in Britain was
affected by the American fast food chain. It is similar to Britain that the American fast
food chains start their business in Hong Kong during 1970s.
To look at the relationship between culture and fast food, the fast food culture in
American could be a good example. Fast Food and American Culture (2007) states
that fast food is popular in American because of the emergence of working mothers.
They did not have time to cook and their children needed to go to the daycare after
school. Therefore, there were no needs to prepare the meal to them. It was easy to see
that why fast-food was popular now just because of their busy life. It also stated that
America's need for speed had changed not only what they ate and how they ate it, but
24
also the way in which they viewed food. The Quality of the food became less
important and they depended more on the quick finished product.
Luke (2008) stated that restaurant chains in the world geared toward quick
production. It was more likely to the situation in Hong Kong because women and men
worked outside home and the speed of life were fast and busy. The time to stay at
home was less than that at the office. It gave them more chance to eat outside. Eating
outside became the trend of Hong Kong eating style. These were the characteristic of
Hong Kong people. It can explain why fast-food became more popular and success in
Hong Kong.
In the recent study (the Swiss Association for Nutrition, 2003); it stated that the
success of fast food industry was because of the short meal time, increased number of
single-parent households and the influence of the working mother and father. The
factors of success matched with the culture of the Hong Kong people. Because of the
increasing number of the working mother, they chose fast food as meal for their
family members. Also, because of the high speed of life in Hong Kong, people had to
spend a lot of time to work.
The Student Standard (2006) said that the advantage of fast food was convenient
which suit the pace of modern life and the fast food culture represents the race for
efficiency in the modern world. The Effect of the Fast Food Culture on Young People
25
(2008) stated that fast food affect most of the secondary school student because of not
enough time to have meal. They may need to meet the teachers during the lunch time.
The time for them to have meal was relatively short. In order to save time, people
would like to choose fast food as their meal.
BBC (2002) said that now individuals had also argued that it was not just the
types of food on offer that had an impact on people's lives, but that the fast food
invasion had also affected the social fabric. The traditional Chinese diet with several
shared dishes was being swapped for convenience food because both parents often
working full-time. “A change in eating practices is an indication that Chinese culture
is being diminished” (BBC, 2002).
According to the survey done by AC Nielsen, Lumpur (2005) said that 34 percent
of Asia Pacific adults ate at take-away restaurants at least once a week. For the top 10
global markets for weekly fast food consumption market percentage of adult
population that ate at take-away restaurants at least once a week, Hong Kong has the
largest number of people with 61% over the other nine markets, including China, U.S.,
Singapore and etc (See Table 1). Hong Kong ranked the world’s No. 1 in terms of
frequency of fast food restaurant visits. “Busy lifestyles and ease of access to a wide
variety of fast food restaurants have proven to be a powerful combination. Where
fast-food restaurants still have a significant advantage, though, is the ease with which
26

consumers can make their purchases. Perhaps we’ll begin to see drive-thru windows
at grocery stores or at least more convenient in-store prepared food sections with
dedicated registers.”(Lumpur, 2005). The associate Director of AC Nielsen Hong
Kong, Ng (2005) said that Hong Kong people made an average of 20 fast food and
drink purchases per month (See Figure 1).
Table 1. Top ten global markets for weekly fast food consumption
Top 10 Global Markets for Weekly
Fast Food Consumption
Hong Kong 61%
Malaysia 59%
Philippines 54%
Singapore 50%
Thailand 44%
China 41%
India 37%
US 35%
Australia 30%
New Zealand 29%
Source: AC Nielsen Online Survey, October 2004
27
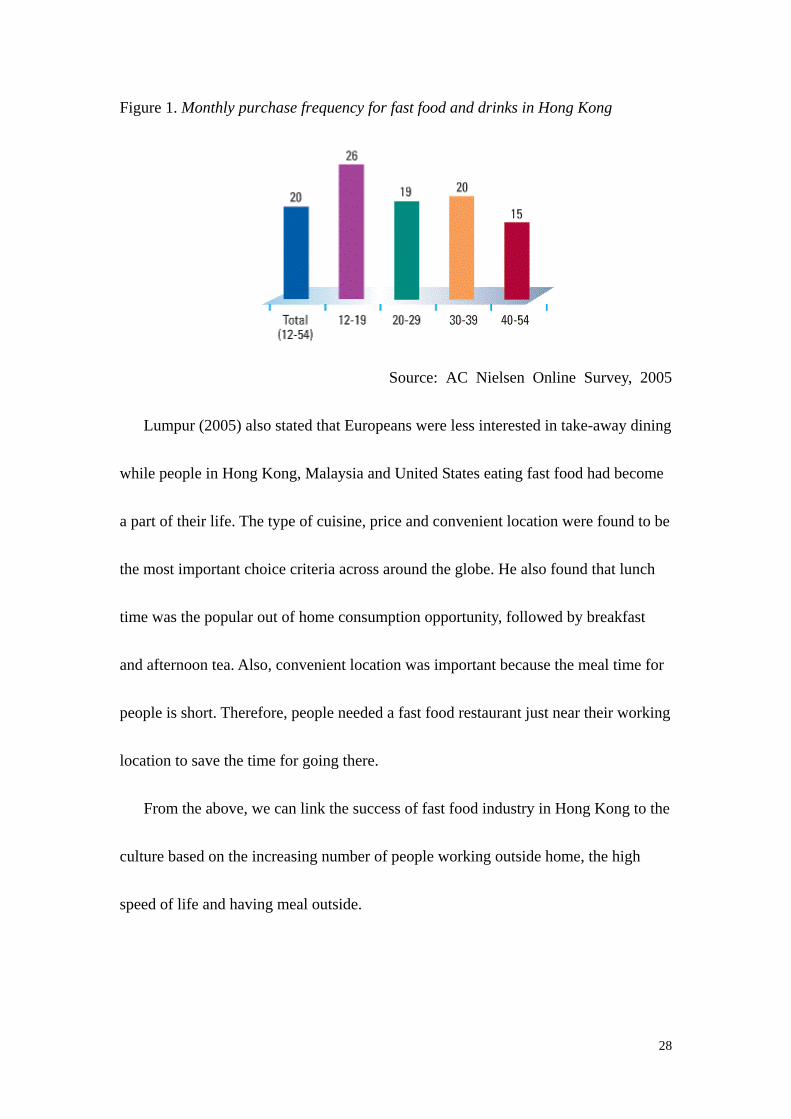
Figure 1. Monthly purchase frequency for fast food and drinks in Hong Kong
Source: AC Nielsen Online Survey, 2005
Lumpur (2005) also stated that Europeans were less interested in take-away dining
while people in Hong Kong, Malaysia and United States eating fast food had become
a part of their life. The type of cuisine, price and convenient location were found to be
the most important choice criteria across around the globe. He also found that lunch
time was the popular out of home consumption opportunity, followed by breakfast
and afternoon tea. Also, convenient location was important because the meal time for
people is short. Therefore, people needed a fast food restaurant just near their working
location to save the time for going there.
From the above, we can link the success of fast food industry in Hong Kong to the
culture based on the increasing number of people working outside home, the high
speed of life and having meal outside.
28
Chapter summary
In conclusion, the most important issue of the research was that the living culture
of Hong Kong people was related to the success of fast food industry. The number of
single-parent household and the number of both parents need to work have been
increased since 1960s. The speed of life in Hong Kong is busy. The adults did not
have time to manage their housework. Therefore, they chose to eat outside and fast
food became one of their food choices. Also, not only has the high speed of life
affected their choice of meal but also the short meal time. In Hong Kong, many
people only had one hour to have their lunch, especially the students and the working
people. Because of large group of people live with high speed, fast food became a
suitable food choice for them. That was the reason why Hong Kong ranked the
world’s No. 1 in terms of frequency of fast food restaurant visits.
Besides, the price, product and convenient location were also one of the factors
due to the success of fast food industry in Hong Kong. Because of the high speed of
life and the short meal time, a convenient location of fast food shop was important to
the customers to save their time. Also, because of the mass production, the price of
fast food was relatively low and can attract the customers.
The next chapter, Methodology, would introduce the primary and secondary
research, the research method and instrument, the limitations of the research and etc.
29
Chapter 3
Methodology
Research method
Generally, there are two types of research methods, qualitative and quantitative
methods. Clark et al (1998) said that qualitative method relied on the skills of
researcher as an interviewer or observer in gathering data and quantitative methods
relied on the research instruments. The method used in this research was quantitative
method. Berger (2000) said that the data got from the questionnaire result can be
expressed in numbers and it can provide detailed information. Also, the data was
easily to be collected by directly asking people to fill in a questionnaire.
The reason for not choosing qualitative method was because of some reasons.
Berger (2000) had some explanations on this. Firstly, the people may not always tell
the truth. They might want to put their best foot forward and therefore, they lied. Also,
people may not remember things accurately and have useful information. Next, the
people may tell something you want to hear only. Finally, the languages used by the
interviewee may be in different ways. It came out with a communication problem
because the intended meaning might not be the communicated or articulated meaning
and the interviewer might receive the wrong meaning. Therefore, Qualitative research
method would not be used in this research.
30
Primary research
Clark et al (1998, p.8) said “Primary research generally refers to that research
which involves the collection of original data using an accepted research
methodology.” They also said that primary data was the data which was collected
specifically in pursuit of the research objectives.
The primary research data would be collected and gathered by using
questionnaires. The interviewee will be asked to fill in the questionnaire and then the
data will be analyzed and presented in percentage or in numbers.
Secondary research
Clark et al (1998, p.8) said “secondary research normally denotes an activity
whereby no new original data is collected but where the research project draws on
existing sources alone”. McKinnon Secondary College (2005) stated that secondary
data was a whole lot cheaper and easier to acquire than primary data.
The data has been collected from external sources, such as, internet, research
articles, newspapers, books and etc which have been used in the literature review
(Chapter 2). The secondary data indicates the link between the culture and the
success of fast food industry in Hong Kong and helped the design of the
questionnaire.
31
Research instrument
The research instrument used is questionnaire. This questionnaire would
investigate about the factors that link the culture to the success of the fast food
industry. The Hong Kong residents who age over eighteen will be invited to answer
the questionnaire. Milne (1999) said that the responses from questionnaires were
gathered in a standardized way. Therefore, the result of the questionnaire was more
objective. Also, the information can be collected quickly and the cost of doing a
questionnaire is cheap.
Target interviewee
The people who are Hong Kong residents with aged over eighteen would be
interviewed and answered the questionnaire. They would be the interviewee of this
research.
32
Sampling
Fridah (2004) said that “Sampling is the act, process, or technique of selecting a
suitable sample, or a representative part of a population for the purpose of
determining parameters or characteristics of the whole population.”
Galloway (1997) said that “A convenience sample is used when you simply stop
anybody in the street who is prepared to stop, or when you wander round a business, a
shop, a restaurant, a theatre or whatever, asking people you meet whether they will
answer your questions. In other words, the sample comprises subjects who are simply
available in a convenient way to the researcher.” Convenience sampling approach will
be implemented as well for collecting samples in this case study. Due to the time limit
and low budget, this method enables collecting information rapidly.
The target interviewees are the Hong Kong residents who are over eighteen.
According to Census and Statistics Department (2008), the number of people who are
over eighteen is 5.6768million. The ideal sampling size should be three hundred and
eighty five but the sampling size was set as one hundred. It was a relatively small in
size of the number of samples because of time limit. The margin of error with a
sampling size of one hundred would be 9.80 percent. According to Raosoft Inc (2004),
“The margin of error is the amount of error that you can tolerate. If 90% of
respondents answer yes, while 10% answer no, you may be able to tolerate a larger
33
amount of error than if the respondents are split 50-50 or 45-55. Lower margin of
error requires a larger sample size.” The common choice of margin of error is five
percent. Therefore, error of this sampling size was still acceptable.
Data collection media
The Questionnaire would be taken place in two ways. One is
interviewer-administered interview and one is self-completion surveys.
Using the interviewer-administered interview has some benefits. “Queries about
the meaning of a question can be dealt with and a misunderstood question may be
corrected.”(Brace, 2004, p.24). For the interviewer-administered interview, it would
be taken part in the parks. It was because the interviewees of the research included all
the people over eighteen. The people who over fifty may not know how to use the
computer or they may spend less time on surfing the Net. Therefore, the
interviewer-administered interview would be done with them. Some misunderstood
question can be corrected and explained. This questionnaire would be carried in the
early March 2009 and last for 2 weeks in every morning. It was because the elder
people like to do exercise in the morning and the questionnaire would be carried in
the morning after doing the exercise.
34
For the self-completion survey, the Web-based self-completion method had been
chosen to conduct this survey. Brace (2004) said that Web-based self-completion
questionnaire allowed complex routing and got fast analysis. The Web-based
self-completion questionnaire would also be carried in the early March and last for
three weeks. The reason for choosing this method was because of the time limit. Also,
the people who were between eighteen to fifty were more often to use the computer
because of their work and study. The questionnaire had been placed on the website
called online-survey.net and my3q.com since the early March 2009.
Questionnaire design
Balnaves et al (2001, 84) said the layout of a questionnaire had to include an
introduction, question instructions, order and a numerical code. They also said that
there were no set rules for the length of a questionnaire and the response rates
dropped rapidly if a questionnaire was too long.
There were thirty-eight questions which had been set for this questionnaire. It had
been divided into four sections. The first and forth parts has twenty single choice
questions. They were used to collect the background information and the point of
view of the interviewees to fast food restaurant. Twelve Likert Scale Questions had
been used in the second part. Articulate Global (2007) stated that a Likert Scale
35
Question was a survey question that allowed the user to choose the response that best
represents his or her opinion relative to a series of statements. There was a minimum
of one and maximum of 10 choices for each question. The questions were used to
investigate the point of view of the interviewee to fast food restaurant and its
competitors, “cha chaan teng”. The third part was used to compare the fast food
restaurant and “cha chaan teng” in different sections and chose who did the best.
Data analysis
The data collected was analyzed by using the system called Statistical Package for
Social Sciences (SPSS) Program and Excel. The data would be presented in the forms
of table. And the information would be analyzed as percentage and made them easy
understand.
Limitations
The time factor was the first limitation. Because of only three weeks time to
conduct the survey, the sample size was set to one hundred instead of three hundred
and eighty five. This will affect the accuracy of the research. Next, it was the
limitation of the primary data. The interviewees might not answer the truth thing.
Because of the time limit, the questionnaire might not be done through with the
36
interviewees. Finally, it was the limitation of the secondary data. The findings of the
books, articles and research might not really point out the link between the link of
culture and the success of the fast food industry. Also, because of the changing
industrial environment had changed rapidly and the information gathered might not
up-to-date.
Chapter summary
This chapter introduced the research method, the primary and secondary research
of the research, the questionnaire design and the limitation of the research.
The next chapter, Results, would analyze the result of the questionnaires. The
findings from the questionnaires were related back to the findings from literature
review through evaluation.
37
Chapter 4
Results
Introduction
The purpose of this chapter, Results, is to present the data collected and analyzed
that answers the research question: How the culture link to the success of the fast food
industry in Hong Kong? To answer this question and provide a better way to
understand the relationship between culture and the success of the fast food industry,
the quantitative method was used. This chapter presents a more in-depth analysis and
provided quantitative data results gathered from the interviewees in the research.
Quantitative data collection
This research included the collection of quantitative data through questionnaires.
All the questions are closed-ended questions. Fink (1995) said that the advantage of
using this type of question was easy to standardize. The quantitative data collection
was conducted in March 2009. One hundred Hong Kong residents were participated
and completed the questionnaire. The participants were allotted five minutes to
complete the survey.
38
The demographic data collected from the questionnaire included the respondents’
gender, age, occupation, length of time in Hong Kong, how much money they spend
on each time, whether they like to eat fast food or not and etc in the first part. There
were twelve likert scale questions about customers’ point of view about the fast food
restaurants and cha chaan teng were collected in the second part. The third part was
about which of these two food sector, fast food restaurant or cha chaan teng
performed better in different parts. Finally, the forth part was about other opinions of
the respondents on fast food.
Questionnaire-Part A
Question one to sixteen belonged to Part A. The quantitative data collected from
all one hundred questionnaires were valid. A descriptive analysis of the demographic
data (questions 1-16) from the questionnaire enabled to develop a demographic
profile of the respondents.
The first five questions of the survey provided the participants’ gender, age,
marital status, length of stay in Hong Kong (See Table 2). The one hundred
respondents were all Hong Kong residents and all over eighteen. There were forty
nine women (49%) and fifty one men (51%) who participated in this survey, fifty two
were between the ages of 18-25 (52%), ten were between the ages of 26-35 (10%),
39
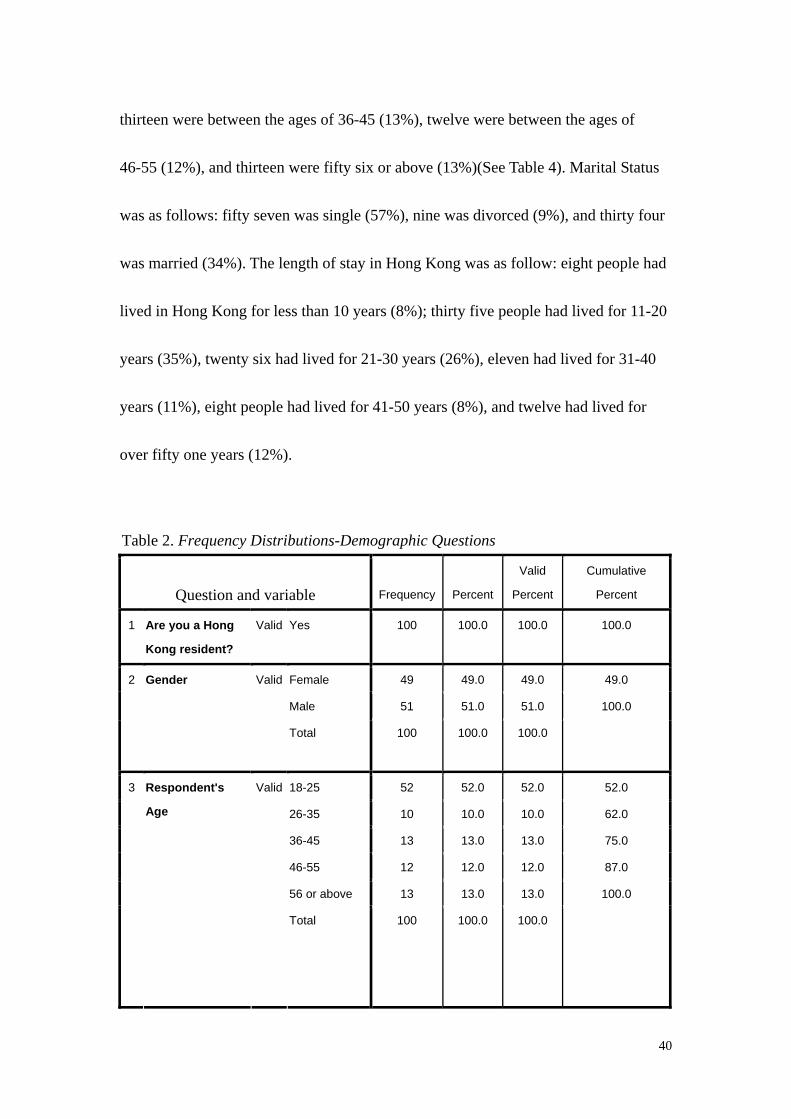
thirteen were between the ages of 36-45 (13%), twelve were between the ages of
46-55 (12%), and thirteen were fifty six or above (13%)(See Table 4). Marital Status
was as follows: fifty seven was single (57%), nine was divorced (9%), and thirty four
was married (34%). The length of stay in Hong Kong was as follow: eight people had
lived in Hong Kong for less than 10 years (8%); thirty five people had lived for 11-20
years (35%), twenty six had lived for 21-30 years (26%), eleven had lived for 31-40
years (11%), eight people had lived for 41-50 years (8%), and twelve had lived for
over fifty one years (12%).
Table 2. Frequency Distributions-Demographic Questions
Question and variable Frequency Percent
Valid
Percent
Cumulative
Percent
1 Are you a Hong
Kong resident?
Valid Yes 100 100.0 100.0 100.0
Female 49 49.0 49.0 49.0
Male 51 51.0 51.0 100.0
2 Gender Valid
Total
100 100.0 100.0
18-25 52 52.0 52.0 52.0
26-35 10 10.0 10.0 62.0
36-45 13 13.0 13.0 75.0
46-55 12 12.0 12.0 87.0
56 or above 13 13.0 13.0 100.0
3 Respondent's
Age
Valid
Total
100 100.0 100.0
40
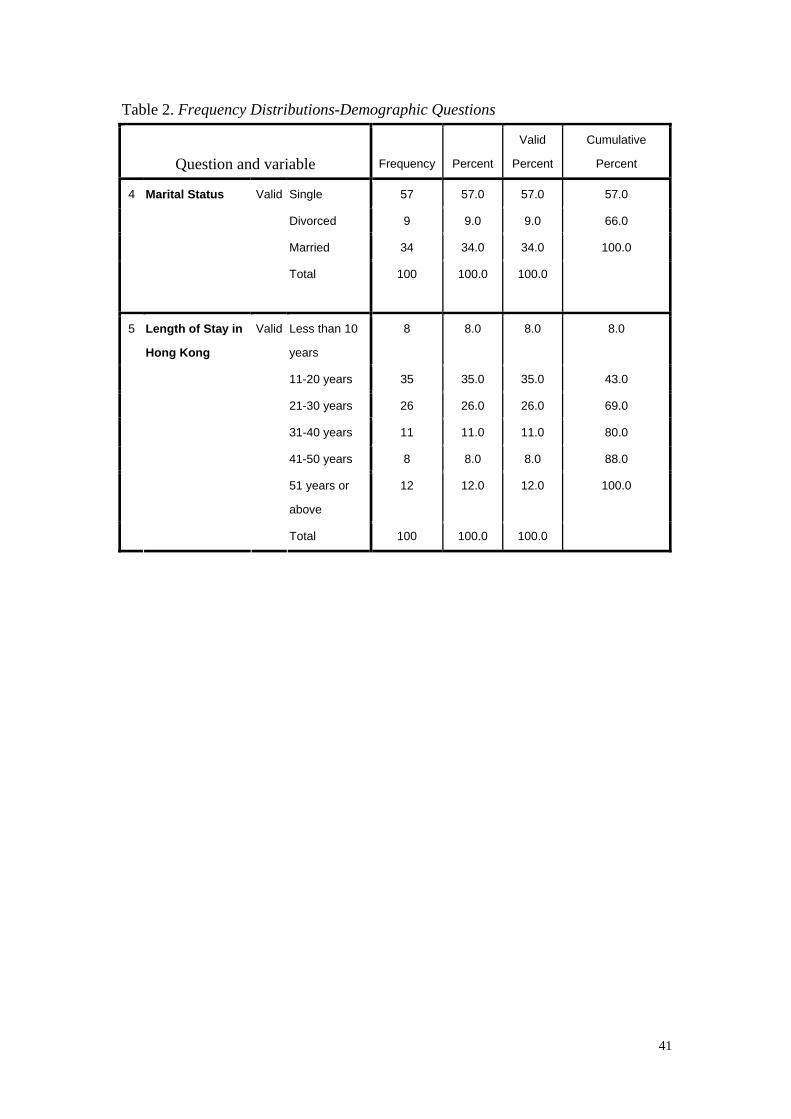
Table 2. Frequency Distributions-Demographic Questions
Valid Cumulative
Question and variable Frequency Percent Percent Percent
Single 57 57.0 57.0 57.0
Divorced 9 9.0 9.0 66.0
Married 34 34.0 34.0 100.0
4 Marital Status Valid
Total
100 100.0 100.0
Less than 10
years
8 8.0 8.0 8.0
11-20 years 35 35.0 35.0 43.0
21-30 years 26 26.0 26.0 69.0
31-40 years 11 11.0 11.0 80.0
41-50 years 8 8.0 8.0 88.0
51 years or
above
12 12.0 12.0 100.0
5 Length of Stay in
Hong Kong
Valid
Total 100 100.0 100.0
41
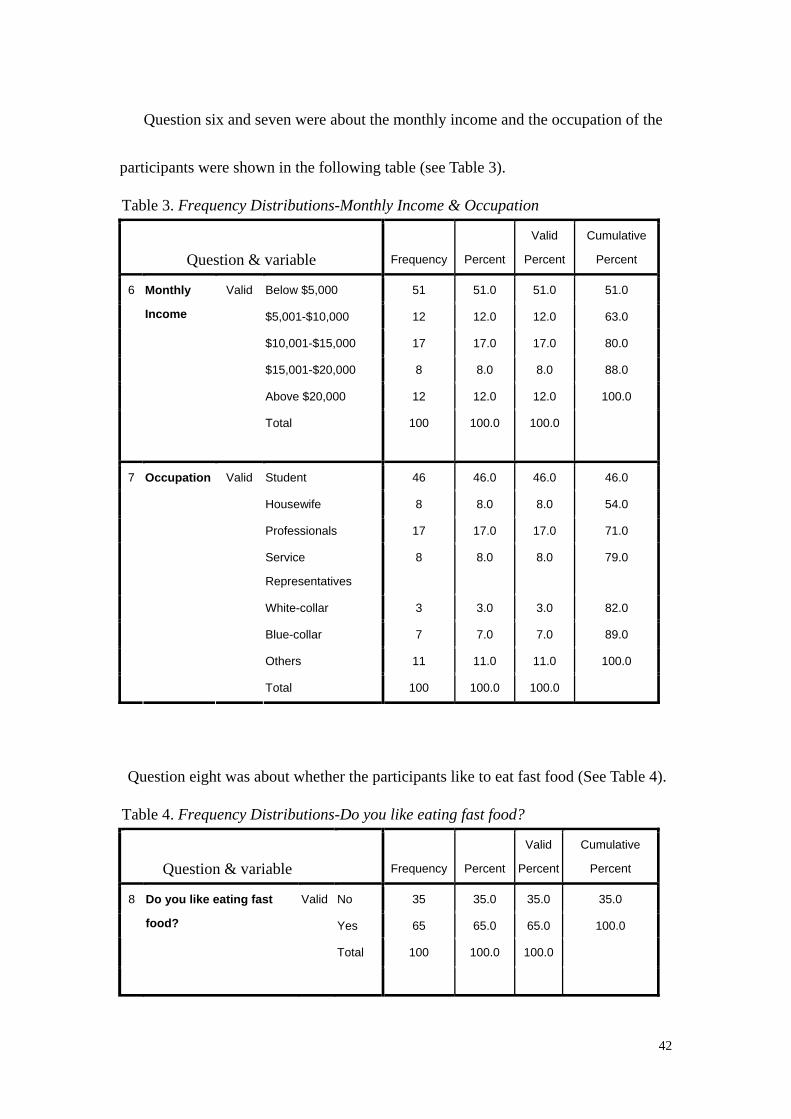
Question six and seven were about the monthly income and the occupation of the
participants were shown in the following table (see Table 3).
Table 3. Frequency Distributions-Monthly Income & Occupation
Question & variable Frequency Percent
Valid
Percent
Cumulative
Percent
Below $5,000 51 51.0 51.0 51.0
$5,001-$10,000 12 12.0 12.0 63.0
$10,001-$15,000 17 17.0 17.0 80.0
$15,001-$20,000 8 8.0 8.0 88.0
Above $20,000 12 12.0 12.0 100.0
6 Monthly
Income
Valid
Total
100 100.0 100.0
Student 46 46.0 46.0 46.0
Housewife 8 8.0 8.0 54.0
Professionals 17 17.0 17.0 71.0
Service
Representatives
8 8.0 8.0 79.0
White-collar 3 3.0 3.0 82.0
Blue-collar 7 7.0 7.0 89.0
Others 11 11.0 11.0 100.0
7 Occupation Valid
Total 100 100.0 100.0
Question eight was about whether the participants like to eat fast food (See Table 4).
Table 4. Frequency Distributions-Do you like eating fast food?
Question & variable
Frequency Percent
Valid
Percent
Cumulative
Percent
No 35 35.0 35.0 35.0
Yes 65 65.0 65.0 100.0
8 Do you like eating fast
food?
Valid
Total 100 100.0 100.0
42
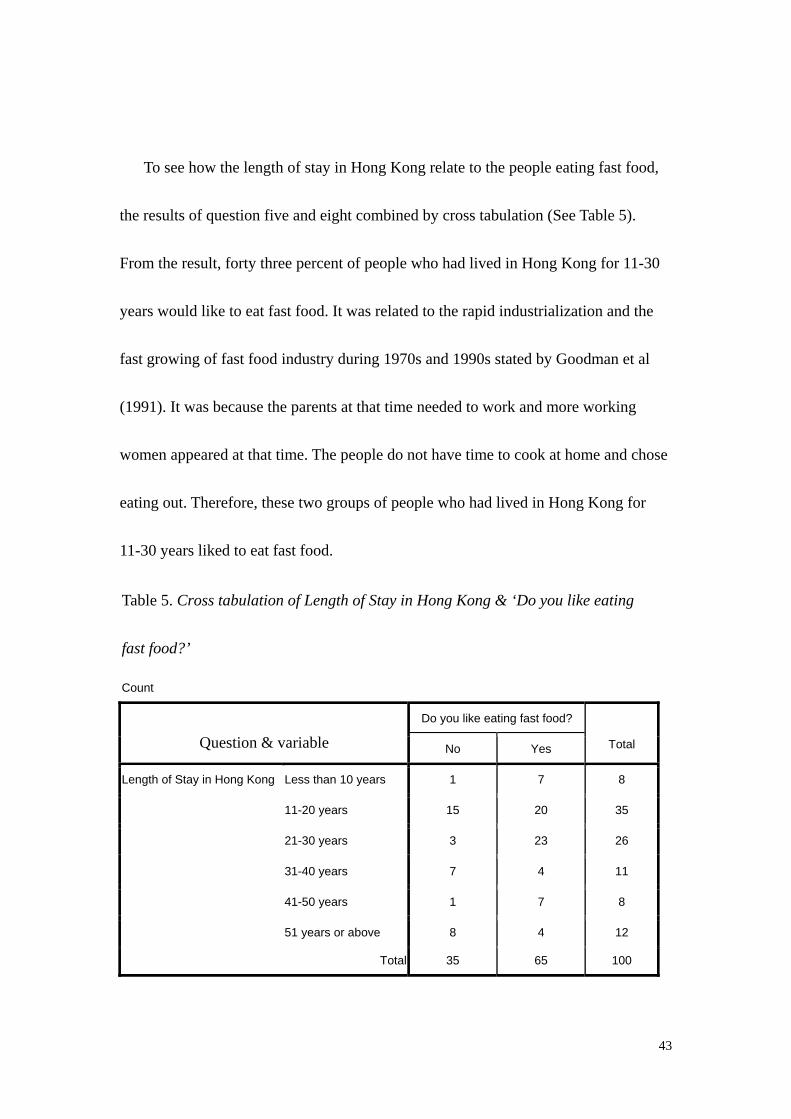
To see how the length of stay in Hong Kong relate to the people eating fast food,
the results of question five and eight combined by cross tabulation (See Table 5).
From the result, forty three percent of people who had lived in Hong Kong for 11-30
years would like to eat fast food. It was related to the rapid industrialization and the
fast growing of fast food industry during 1970s and 1990s stated by Goodman et al
(1991). It was because the parents at that time needed to work and more working
women appeared at that time. The people do not have time to cook at home and chose
eating out. Therefore, these two groups of people who had lived in Hong Kong for
11-30 years liked to eat fast food.
Table 5. Cross tabulation of Length of Stay in Hong Kong & ‘Do you like eating
fast food?’
Count
Do you like eating fast food?
Question & variable No Yes Total
Less than 10 years 1 7 8
11-20 years 15 20 35
21-30 years 3 23 26
31-40 years 7 4 11
41-50 years 1 7 8
Length of Stay in Hong Kong
51 years or above 8 4 12
Total 35 65 100
43
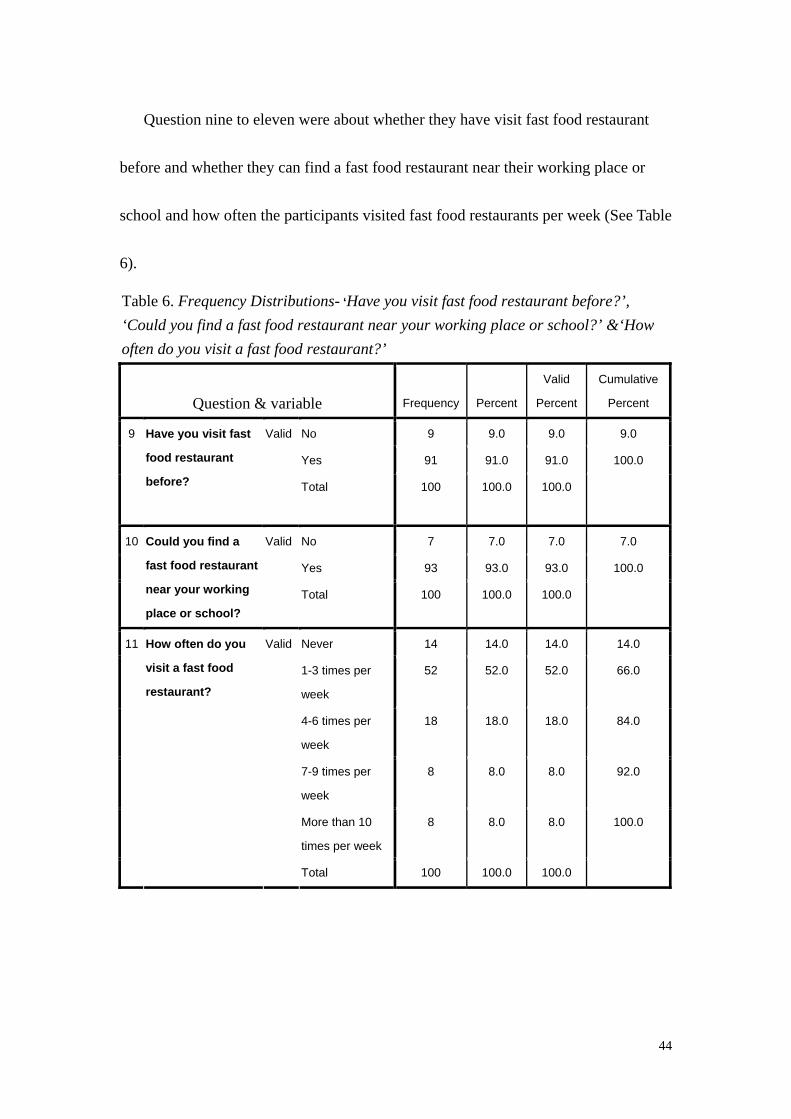
Question nine to eleven were about whether they have visit fast food restaurant
before and whether they can find a fast food restaurant near their working place or
school and how often the participants visited fast food restaurants per week (See Table
6).
Table 6. Frequency Distributions- ‘Have you visit fast food restaurant before?’,
‘Could you find a fast food restaurant near your working place or school?’ &‘How
often do you visit a fast food restaurant?’
Question & variable Frequency Percent
Valid
Percent
Cumulative
Percent
No 9 9.0 9.0 9.0
Yes 91 91.0 91.0 100.0
9 Have you visit fast
food restaurant
before?
Valid
Total
100 100.0 100.0
No 7 7.0 7.0 7.0
Yes 93 93.0 93.0 100.0
10 Could you find a
fast food restaurant
near your working
place or school?
Valid
Total 100 100.0 100.0
Never 14 14.0 14.0 14.0
1-3 times per
week
52 52.0 52.0 66.0
4-6 times per
week
18 18.0 18.0 84.0
7-9 times per
week
8 8.0 8.0 92.0
More than 10
times per week
8 8.0 8.0 100.0
11 How often do you
visit a fast food
restaurant?
Valid
Total 100 100.0 100.0
44
According to the result of question nine and ten, ninety one percent of participants
had visited fast food restaurant and ninety three percent of participants could find a
fast food restaurant near their working place and school. From question eleven, fifty
two percent of participants visited a fast food restaurant 1-3 times per week and
eighteen percent visited a fast food restaurant 4-6 times per week.
The cross tabulation of question seven and eleven showed that thirty four percent
of participants who were students visited fast food restaurant 1-3 times a week (See
Table 7 on the next page). The reason for the majority people visited a fast food
restaurant because of the convenient location and the five days of working or studying
a week. Also, Lumpur (2005) stated that one of the most important choice criteria of
people chose fast foot restaurant was location.
45
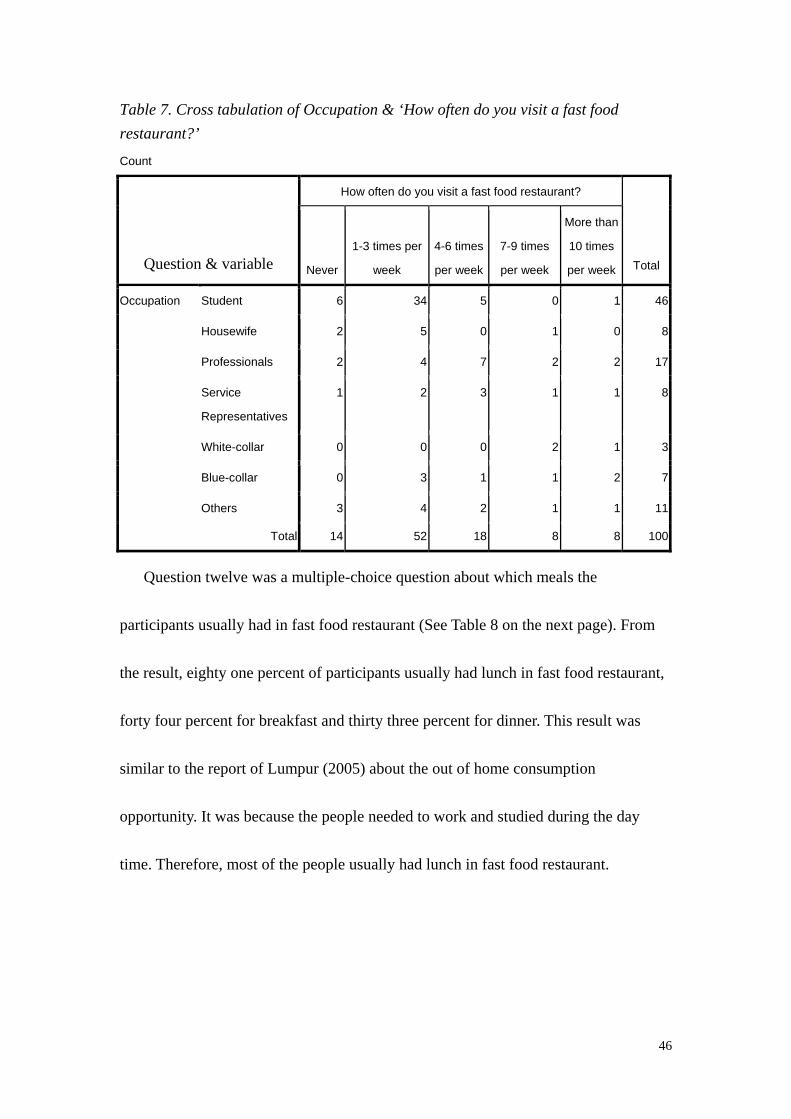
Table 7. Cross tabulation of Occupation & ‘How often do you visit a fast food
restaurant?’
Count
How often do you visit a fast food restaurant?
Question & variable Never
1-3 times per
week
4-6 times
per week
7-9 times
per week
More than
10 times
per week Total
Student 6 34 5 0 1 46
Housewife 2 5 0 1 0 8
Professionals 2 4 7 2 2 17
Service
Representatives
1 2 3 1 1 8
White-collar 0 0 0 2 1 3
Blue-collar 0 3 1 1 2 7
Occupation
Others 3 4 2 1 1 11
Total 14 52 18 8 8 100
Question twelve was a multiple-choice question about which meals the
participants usually had in fast food restaurant (See Table 8 on the next page). From
the result, eighty one percent of participants usually had lunch in fast food restaurant,
forty four percent for breakfast and thirty three percent for dinner. This result was
similar to the report of Lumpur (2005) about the out of home consumption
opportunity. It was because the people needed to work and studied during the day
time. Therefore, most of the people usually had lunch in fast food restaurant.
46
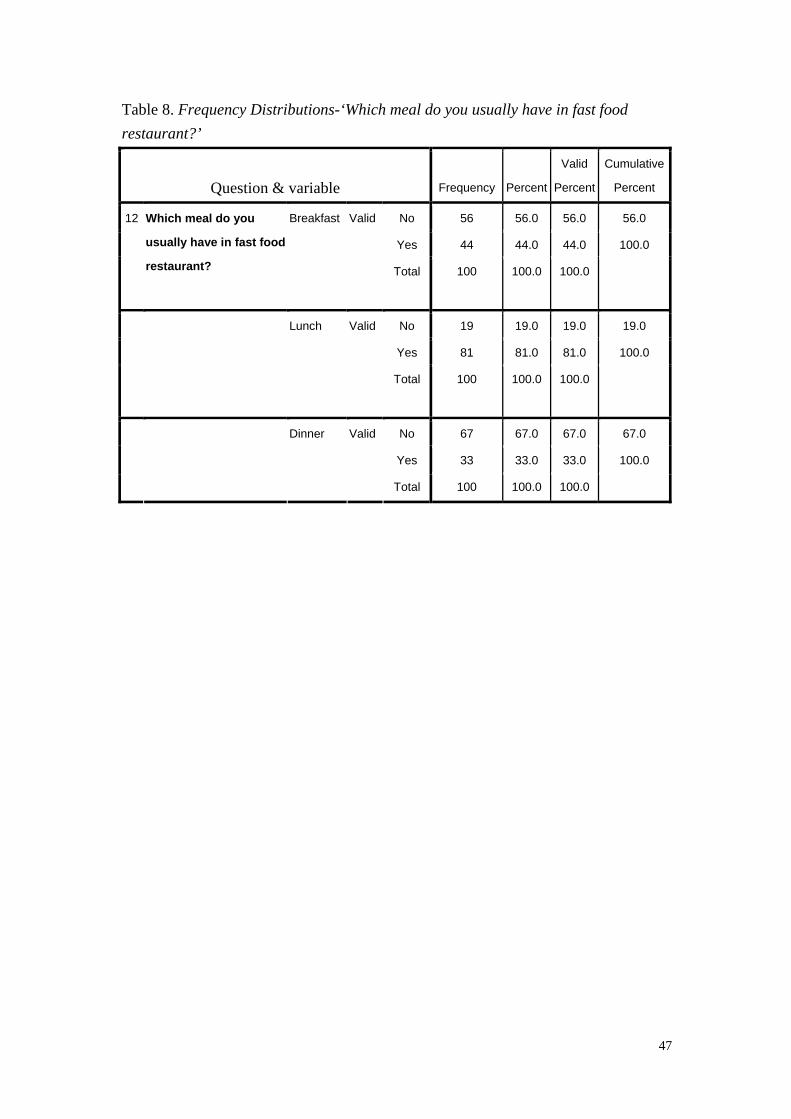
Table 8. Frequency Distributions-‘Which meal do you usually have in fast food
restaurant?’
Question & variable Frequency Percent
Valid
Percent
Cumulative
Percent
No 56 56.0 56.0 56.0
Yes 44 44.0 44.0 100.0
12 Which meal do you
usually have in fast food
restaurant?
Breakfast Valid
Total
100 100.0 100.0
No 19 19.0 19.0 19.0
Yes 81 81.0 81.0 100.0
Lunch Valid
Total
100 100.0 100.0
No 67 67.0 67.0 67.0
Yes 33 33.0 33.0 100.0
Dinner Valid
Total 100 100.0 100.0
47
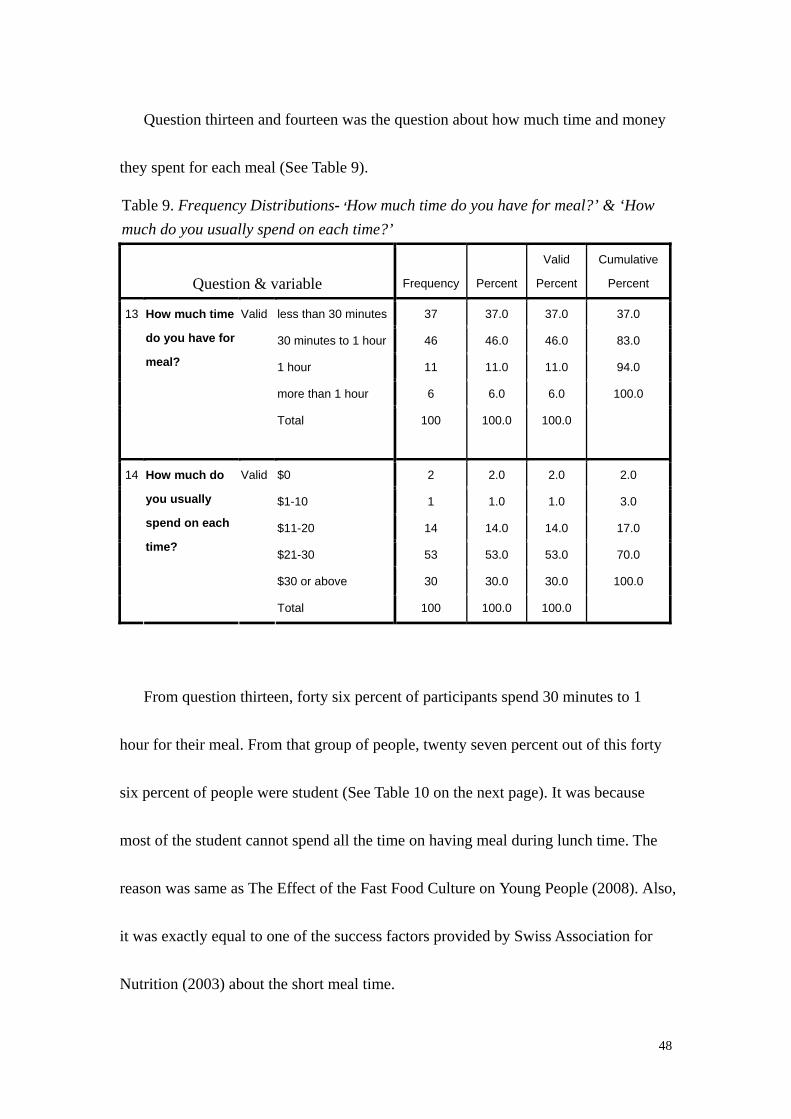
Question thirteen and fourteen was the question about how much time and money
they spent for each meal (See Table 9).
Table 9. Frequency Distributions- ‘How much time do you have for meal?’ & ‘How
much do you usually spend on each time?’
Question & variable Frequency Percent
Valid
Percent
Cumulative
Percent
less than 30 minutes 37 37.0 37.0 37.0
30 minutes to 1 hour 46 46.0 46.0 83.0
1 hour 11 11.0 11.0 94.0
more than 1 hour 6 6.0 6.0 100.0
13 How much time
do you have for
meal?
Valid
Total
100 100.0 100.0
$0 2 2.0 2.0 2.0
$1-10 1 1.0 1.0 3.0
$11-20 14 14.0 14.0 17.0
$21-30 53 53.0 53.0 70.0
$30 or above 30 30.0 30.0 100.0
14 How much do
you usually
spend on each
time?
Valid
Total 100 100.0 100.0
From question thirteen, forty six percent of participants spend 30 minutes to 1
hour for their meal. From that group of people, twenty seven percent out of this forty
six percent of people were student (See Table 10 on the next page). It was because
most of the student cannot spend all the time on having meal during lunch time. The
reason was same as The Effect of the Fast Food Culture on Young People (2008). Also,
it was exactly equal to one of the success factors provided by Swiss Association for
Nutrition (2003) about the short meal time.
48
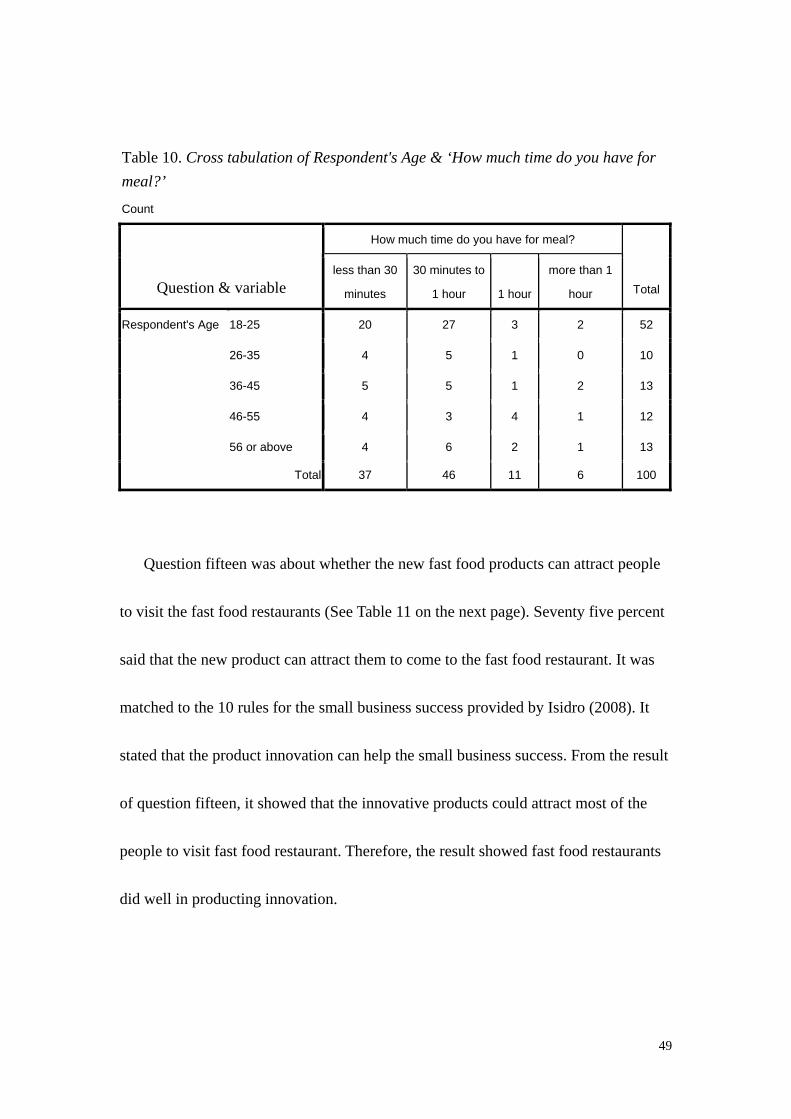
Table 10. Cross tabulation of Respondent's Age & ‘How much time do you have for
meal?’
Count
How much time do you have for meal?
Question & variable less than 30
minutes
30 minutes to
1 hour 1 hour
more than 1
hour Total
18-25 20 27 3 2 52
26-35 4 5 1 0 10
36-45 5 5 1 2 13
46-55 4 3 4 1 12
Respondent's Age
56 or above 4 6 2 1 13
Total 37 46 11 6 100
Question fifteen was about whether the new fast food products can attract people
to visit the fast food restaurants (See Table 11 on the next page). Seventy five percent
said that the new product can attract them to come to the fast food restaurant. It was
matched to the 10 rules for the small business success provided by Isidro (2008). It
stated that the product innovation can help the small business success. From the result
of question fifteen, it showed that the innovative products could attract most of the
people to visit fast food restaurant. Therefore, the result showed fast food restaurants
did well in producting innovation.
49
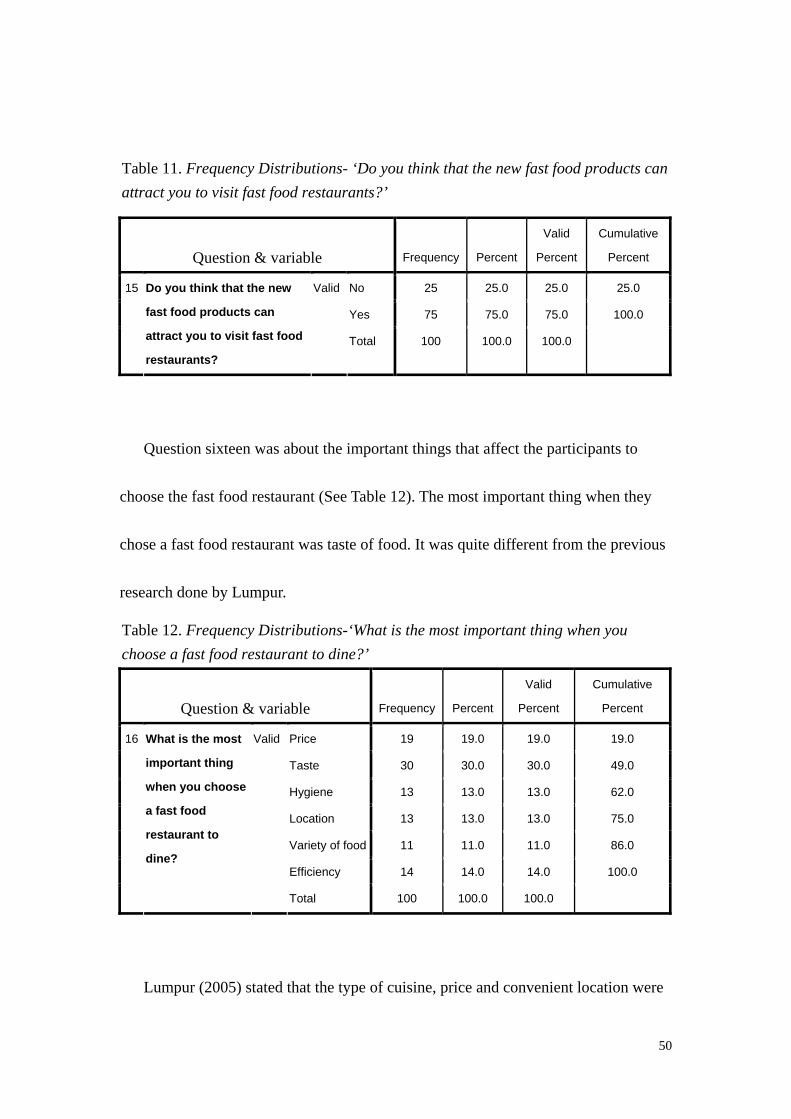
Table 11. Frequency Distributions- ‘Do you think that the new fast food products can
attract you to visit fast food restaurants?’
Question & variable Frequency Percent
Valid
Percent
Cumulative
Percent
No 25 25.0 25.0 25.0
Yes 75 75.0 75.0 100.0
15 Do you think that the new
fast food products can
attract you to visit fast food
restaurants?
Valid
Total 100 100.0 100.0
Question sixteen was about the important things that affect the participants to
choose the fast food restaurant (See Table 12). The most important thing when they
chose a fast food restaurant was taste of food. It was quite different from the previous
research done by Lumpur.
Table 12. Frequency Distributions-‘What is the most important thing when you
choose a fast food restaurant to dine?’
Question & variable Frequency Percent
Valid
Percent
Cumulative
Percent
Price 19 19.0 19.0 19.0
Taste 30 30.0 30.0 49.0
Hygiene 13 13.0 13.0 62.0
Location 13 13.0 13.0 75.0
Variety of food 11 11.0 11.0 86.0
Efficiency 14 14.0 14.0 100.0
16 What is the most
important thing
when you choose
a fast food
restaurant to
dine?
Valid
Total 100 100.0 100.0
Lumpur (2005) stated that the type of cuisine, price and convenient location were
50
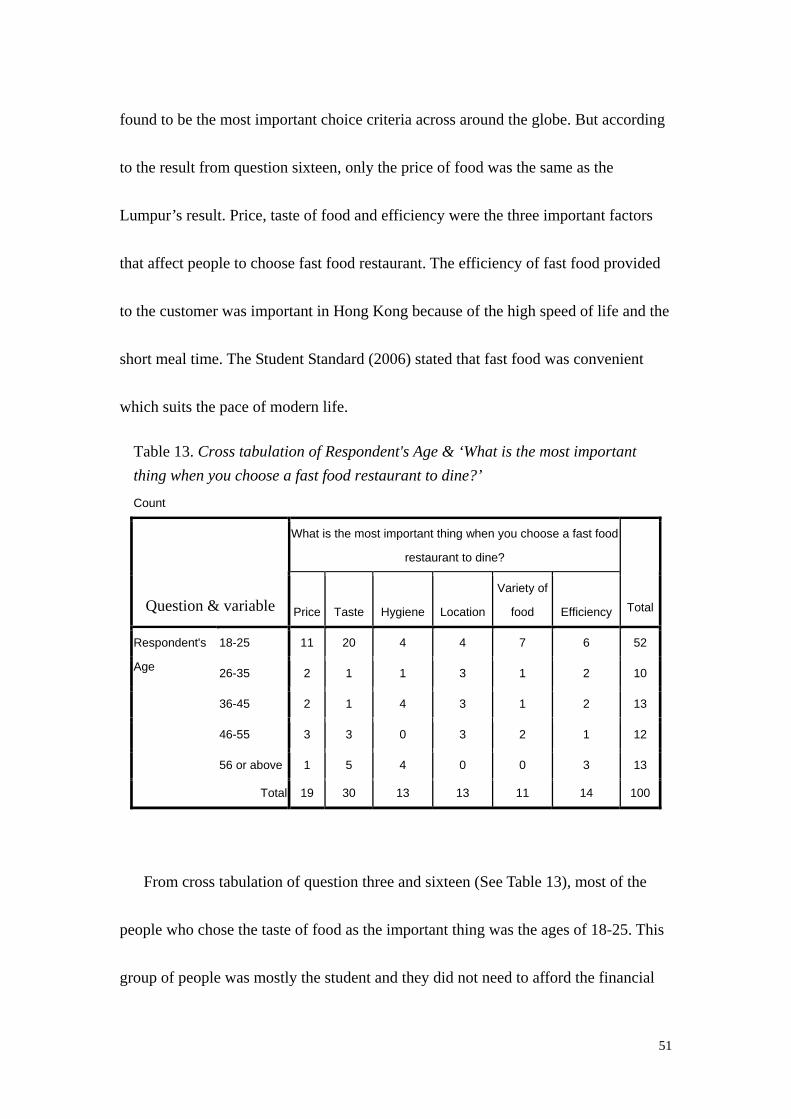
found to be the most important choice criteria across around the globe. But according
to the result from question sixteen, only the price of food was the same as the
Lumpur’s result. Price, taste of food and efficiency were the three important factors
that affect people to choose fast food restaurant. The efficiency of fast food provided
to the customer was important in Hong Kong because of the high speed of life and the
short meal time. The Student Standard (2006) stated that fast food was convenient
which suits the pace of modern life.
Table 13. Cross tabulation of Respondent's Age & ‘What is the most important
thing when you choose a fast food restaurant to dine?’
Count
What is the most important thing when you choose a fast food
restaurant to dine?
Question & variable Price Taste Hygiene Location
Variety of
food Efficiency Total
18-25 11 20 4 4 7 6 52
26-35 2 1 1 3 1 2 10
36-45 2 1 4 3 1 2 13
46-55 3 3 0 3 2 1 12
Respondent's
Age
56 or above 1 5 4 0 0 3 13
Total 19 30 13 13 11 14 100
From cross tabulation of question three and sixteen (See Table 13), most of the
people who chose the taste of food as the important thing was the ages of 18-25. This
group of people was mostly the student and they did not need to afford the financial
51
load of their family. Therefore, they thought the taste of food was important.
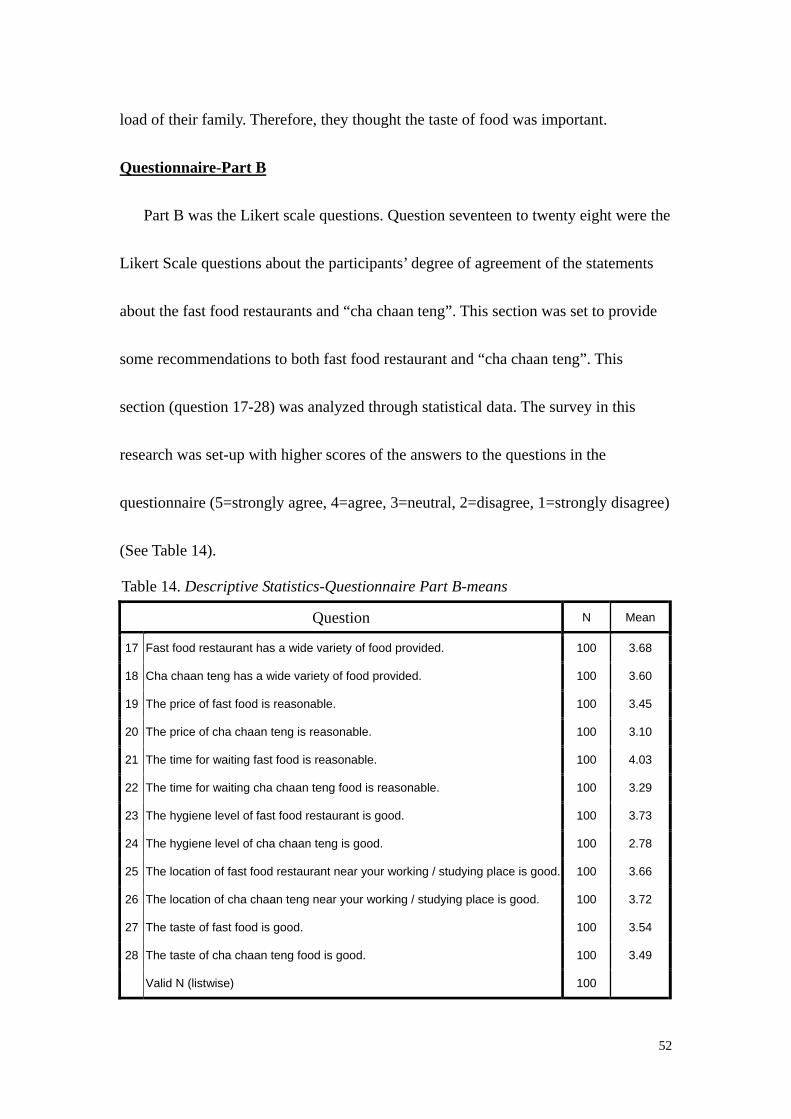
Questionnaire-Part B
Part B was the Likert scale questions. Question seventeen to twenty eight were the
Likert Scale questions about the participants’ degree of agreement of the statements
about the fast food restaurants and “cha chaan teng”. This section was set to provide
some recommendations to both fast food restaurant and “cha chaan teng”. This
section (question 17-28) was analyzed through statistical data. The survey in this
research was set-up with higher scores of the answers to the questions in the
questionnaire (5=strongly agree, 4=agree, 3=neutral, 2=disagree, 1=strongly disagree)
(See Table 14).
Table 14. Descriptive Statistics-Questionnaire Part B-means
Question N Mean
17 Fast food restaurant has a wide variety of food provided. 100 3.68
18 Cha chaan teng has a wide variety of food provided. 100 3.60
19 The price of fast food is reasonable. 100 3.45
20 The price of cha chaan teng is reasonable. 100 3.10
21 The time for waiting fast food is reasonable. 100 4.03
22 The time for waiting cha chaan teng food is reasonable. 100 3.29
23 The hygiene level of fast food restaurant is good. 100 3.73
24 The hygiene level of cha chaan teng is good. 100 2.78
25 The location of fast food restaurant near your working / studying place is good. 100 3.66
26 The location of cha chaan teng near your working / studying place is good. 100 3.72
27 The taste of fast food is good. 100 3.54
28 The taste of cha chaan teng food is good. 100 3.49
Valid N (listwise) 100
52
When compare the result of these questions, the mean of the questions were very
close. From question seventeen and eighteen, the mean were 3.68 and 3.60
respectively. The participants’ degrees of agreement of the wide variety of food
provided by fast food restaurant and cha chaan teng were close but the score of fast
food restaurant was still higher than that of cha chaan teng. It was because most of the
fast food restaurants introduced their own innovative food product regularly. But the
menu of cha chaan teng usually remained the same for the whole year with a large
variety of food.
Question nineteen and twenty was about the price of fast food restaurant and cha
chaan teng and the means were 3.45 and 3.10 respectively. The mean of price of fast
food restaurant was higher than that of the cha chaan teng. This meant that the degree
of agreement of participants about the price was higher than that of the cha chaan teng.
It was because the fast food restaurants in Hong Kong were operated by medium sized
companies. They can produce the food products in mass production and the cooking
procedures were standardized. The cha chaan teng in Hong Kong usually operated in
family style and owned by the owner not a company. Because of the large financial
support, the fast food restaurant can change their selling price in a reasonable level.
Therefore, the participants thought that the price of fast food was reasonable.
53
According to the result of question twenty one and twenty two, the means are 4.03
and 3.29 respectively. The mean of question twenty one was higher than that of
twenty two because fast food restaurant produced the food in a system. It was related
to Ball (1992). Ball (1992) stated that fast food was basically a system of technology
and not a product. Because of the system and with the help of the equipment, the fast
food products can produce in a fast way and therefore, the mean of question twenty
one was higher than that of the cha chaan teng.
According to question twenty three and twenty four, the mean were 3.73 and 2.78
respectively. The mean of question twenty three was higher than that of question
twenty four. These two questions were about the hygiene level of the eating
environment. The average score was three and the mean of question twenty four was
below average. Cha chaan teng (2009) stated that only some of the cha chaan teng
operated in chains most of them operated in family style. The hygiene standard of
each cha chaan teng was different. Therefore, the participants dissatisfied with the
hygiene level of cha chaan teng.
From question twenty five and twenty six, the mean of question twenty five and
twenty six were 3.66 and 3.72 respectively. These two questions were about the
degree of agreement of the location of fast food restaurant and cha chaan teng. The
participants’ degree of agreement of the location of cha chaan teng was higher than
54
that of fast food restaurant. It was because the number of cha chaan teng was not
evenly distributed in Hong Kong and they were not operated by a large company.
Therefore, there were no limitations for the number of cha chaan teng in each district.
This might be the reason for the participants to have a higher degree of agreement
about the location of cha chaan teng.
Finally, the mean of question twenty seven and twenty eight were 3.54 and 3.49
respectively. The mean of these two questions were very close. It was because the
point of view of the participants on the taste of food were different, therefore, the
result of the mean of these two questions were nearly the same.
Questionnaire-Part C
Question twenty nine to question thirty four were the questions about which parts
the cha chaan teng or fast food restaurant did well (See Table 15). These questions
including the areas, such as, wide variety of food provided, reasonable price of food,
waiting time for food, the hygiene level of the restaurant, convenient location of
restaurant and the taste of food.
55
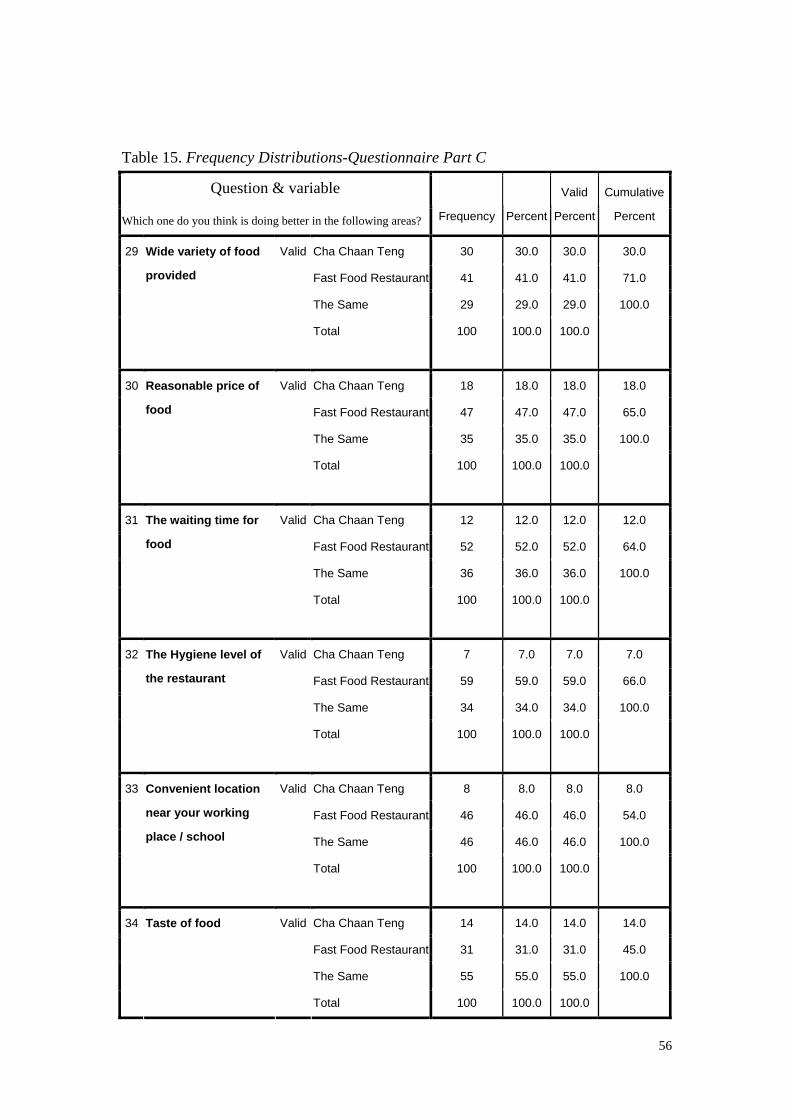
Table 15. Frequency Distributions-Questionnaire Part C
Question & variable
Which one do you think is doing better in the following areas? Frequency Percent
Valid
Percent
Cumulative
Percent
Cha Chaan Teng 30 30.0 30.0 30.0
Fast Food Restaurant 41 41.0 41.0 71.0
The Same 29 29.0 29.0 100.0
29 Wide variety of food
provided
Valid
Total
100 100.0 100.0
Cha Chaan Teng 18 18.0 18.0 18.0
Fast Food Restaurant 47 47.0 47.0 65.0
The Same 35 35.0 35.0 100.0
30 Reasonable price of
food
Valid
Total
100 100.0 100.0
Cha Chaan Teng 12 12.0 12.0 12.0
Fast Food Restaurant 52 52.0 52.0 64.0
The Same 36 36.0 36.0 100.0
31 The waiting time for
food
Valid
Total
100 100.0 100.0
Cha Chaan Teng 7 7.0 7.0 7.0
Fast Food Restaurant 59 59.0 59.0 66.0
The Same 34 34.0 34.0 100.0
32 The Hygiene level of
the restaurant
Valid
Total
100 100.0 100.0
Cha Chaan Teng 8 8.0 8.0 8.0
Fast Food Restaurant 46 46.0 46.0 54.0
The Same 46 46.0 46.0 100.0
33 Convenient location
near your working
place / school
Valid
Total
100 100.0 100.0
Cha Chaan Teng 14 14.0 14.0 14.0
Fast Food Restaurant 31 31.0 31.0 45.0
The Same 55 55.0 55.0 100.0
34 Taste of food Valid
Total 100 100.0 100.0
56
For question twenty nine, about forty percent of the participants thought the fast
food restaurant provided a wide variety of food. The result is the same as questions
seventeen and eighteen. Therefore, fast food restaurant did better in the areas of
providing a wide variety of food.
Question thirty was about the price of food provided by fast food restaurant and
“cha chaan teng”. From the result, above forty percent of participants thought that the
price of fast food was more reasonable than that of “cha chaan teng”. It was because
fast food restaurants had a large financial support and their competitive advantages
were higher than that of “cha chaan teng”.
For the result of question thirty one. More than half of the participants believed
that the waiting time for fast food was faster than that of the cha chaan teng food.
Only twelve percent of the participants thought that the waiting time for cha chaan
teng food was better. It had the same result as question twenty one and twenty two. It
was also similar to The Student Standard (2006). The participants chose fast food
restaurant because it was convenient and suited their life.
Question thirty two was about the hygiene level of the restaurant. Nearly sixty
percent of the participants agreed that the hygiene level of fast food restaurant was
better than that of cha chaan teng. The result was the same as the question twenty
57
three and twenty four. The Knowledge @ Wharton (2006) stated that the factor led to
the success of fast food industry was standardization. It also said that standardization
prevented the uneven levels of quality within the individual stores. Therefore, the
participants thought that the hygiene level of fast food restaurant was better.
Apart from the above, question thirty three was about the participants’ point of
view on the location of fast food restaurant and “cha chaan teng”. Forty six percent of
participants who thought the location of both fast food restaurant and “cha chaan
teng” were convenient. It was the same from the result of question twenty five and
twenty six.
Question thirty four was about the taste of food of fast food restaurant and cha
chaan teng. Over half of the participants believed that the taste of food of both fast
food restaurant and cha chaan teng were the same. It was because the points of view
of participants about the taste of food were not the same and it might be difficult for
them to judge which food was better. Therefore, over half of the participants thought
that was the same.
58
Questionnaire-Part D
This part consisted of four questions. The questions were about the participants’
opinion on why eating fast food was popular in Hong Kong, the thing fast food
restaurants needed to improve, which place they preferred to have meal. The last
question of the questionnaire was a closed-ended question. The question was asked if
they had been affected by the financial tsunami. The purpose of asking this question
was to clarify the information they provided. Nowadays, many people have been
affected by the financial tsunami, most of them chose fast food restaurant because of
the cheap price. The aim of the research was to find out the link between the culture
and the success of Hong Kong people not the financial tsunami. This question was
used to find out how many participants chose fast food because of own financial
problem.
Question thirty five was about why eating fast food was popular in Hong Kong
(See Table 16 on the next page). More than half of the participants believed that the
reason for fast food to become popular in Hong Kong was because of fast. It showed
that fast food was now affecting the life of the people. Luke (2008) stated that
restaurant chains in the world geared toward quick production. Therefore, this
convenience food suited the high speed of life of Hong Kong people.
59
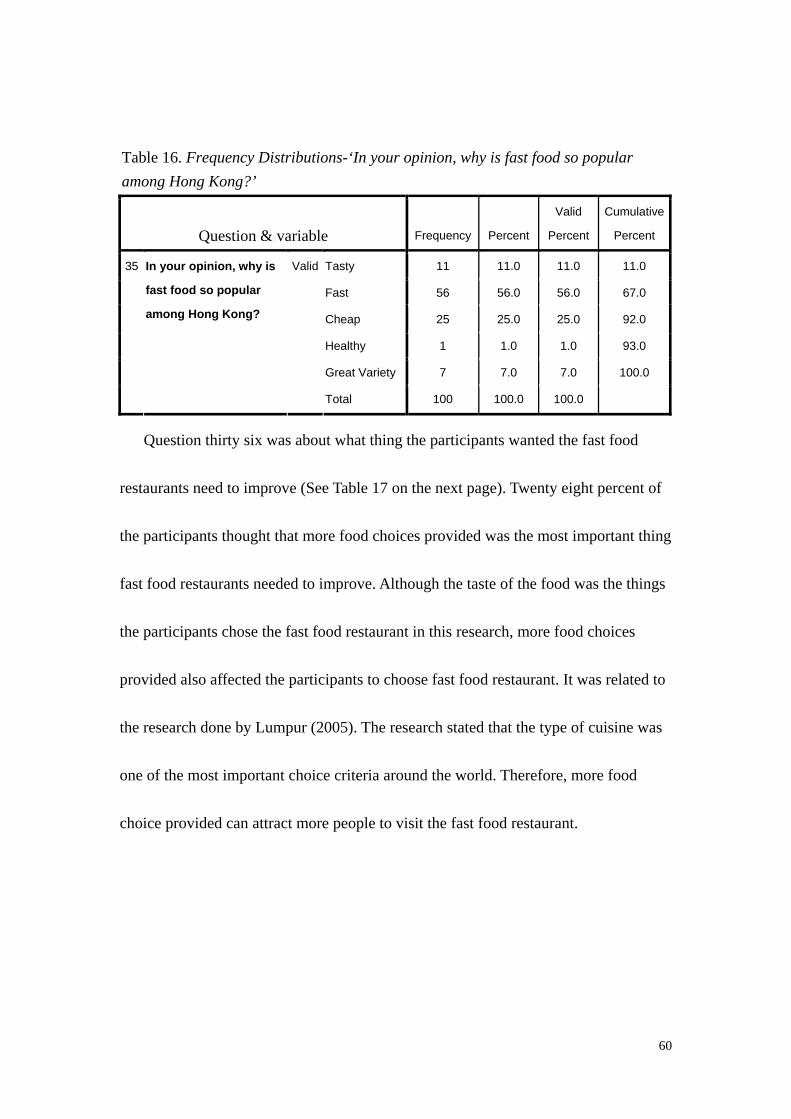
Table 16. Frequency Distributions-‘In your opinion, why is fast food so popular
among Hong Kong?’
Question & variable Frequency Percent
Valid
Percent
Cumulative
Percent
Tasty 11 11.0 11.0 11.0
Fast 56 56.0 56.0 67.0
Cheap 25 25.0 25.0 92.0
Healthy 1 1.0 1.0 93.0
Great Variety 7 7.0 7.0 100.0
35 In your opinion, why is
fast food so popular
among Hong Kong?
Valid
Total 100 100.0 100.0
Question thirty six was about what thing the participants wanted the fast food
restaurants need to improve (See Table 17 on the next page). Twenty eight percent of
the participants thought that more food choices provided was the most important thing
fast food restaurants needed to improve. Although the taste of the food was the things
the participants chose the fast food restaurant in this research, more food choices
provided also affected the participants to choose fast food restaurant. It was related to
the research done by Lumpur (2005). The research stated that the type of cuisine was
one of the most important choice criteria around the world. Therefore, more food
choice provided can attract more people to visit the fast food restaurant.
60
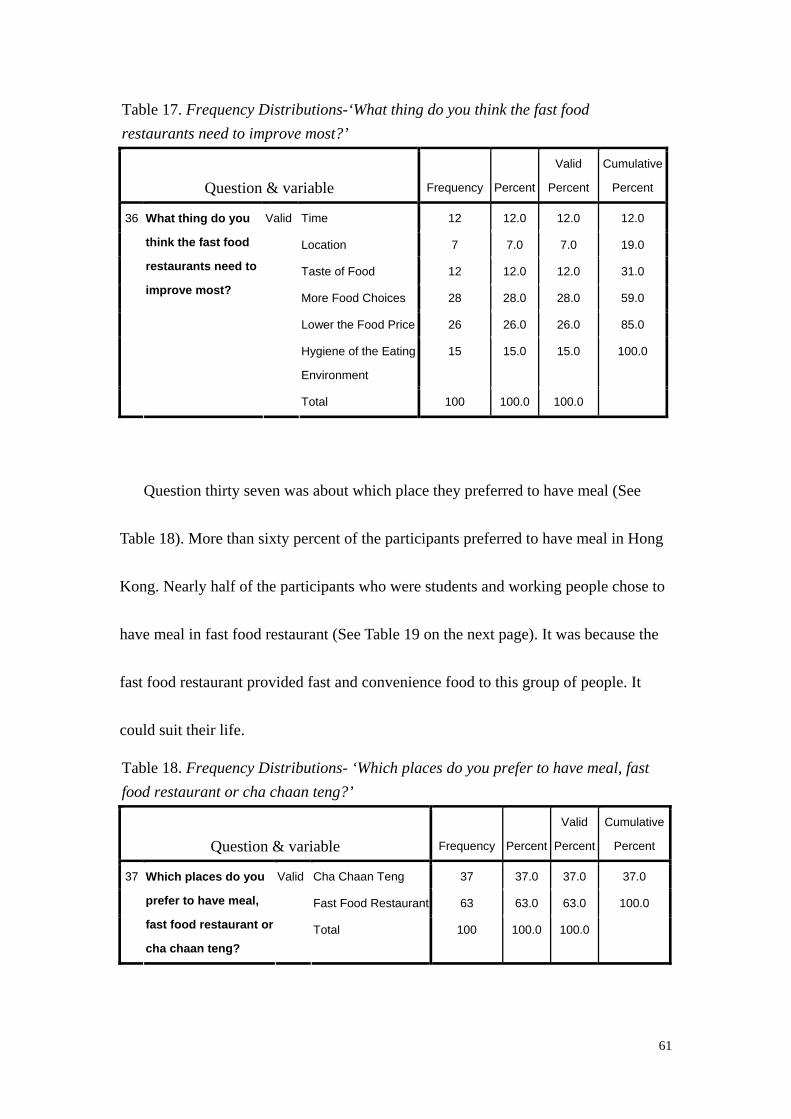
Table 17. Frequency Distributions-‘What thing do you think the fast food
restaurants need to improve most?’
Question & variable Frequency Percent
Valid
Percent
Cumulative
Percent
Time 12 12.0 12.0 12.0
Location 7 7.0 7.0 19.0
Taste of Food 12 12.0 12.0 31.0
More Food Choices 28 28.0 28.0 59.0
Lower the Food Price 26 26.0 26.0 85.0
Hygiene of the Eating
Environment
15 15.0 15.0 100.0
36 What thing do you
think the fast food
restaurants need to
improve most?
Valid
Total 100 100.0 100.0
Question thirty seven was about which place they preferred to have meal (See
Table 18). More than sixty percent of the participants preferred to have meal in Hong
Kong. Nearly half of the participants who were students and working people chose to
have meal in fast food restaurant (See Table 19 on the next page). It was because the
fast food restaurant provided fast and convenience food to this group of people. It
could suit their life.
Table 18. Frequency Distributions- ‘Which places do you prefer to have meal, fast
food restaurant or cha chaan teng?’
Question & variable Frequency Percent
Valid
Percent
Cumulative
Percent
Cha Chaan Teng 37 37.0 37.0 37.0
Fast Food Restaurant 63 63.0 63.0 100.0
37 Which places do you
prefer to have meal,
fast food restaurant or
cha chaan teng?
Valid
Total 100 100.0 100.0
61
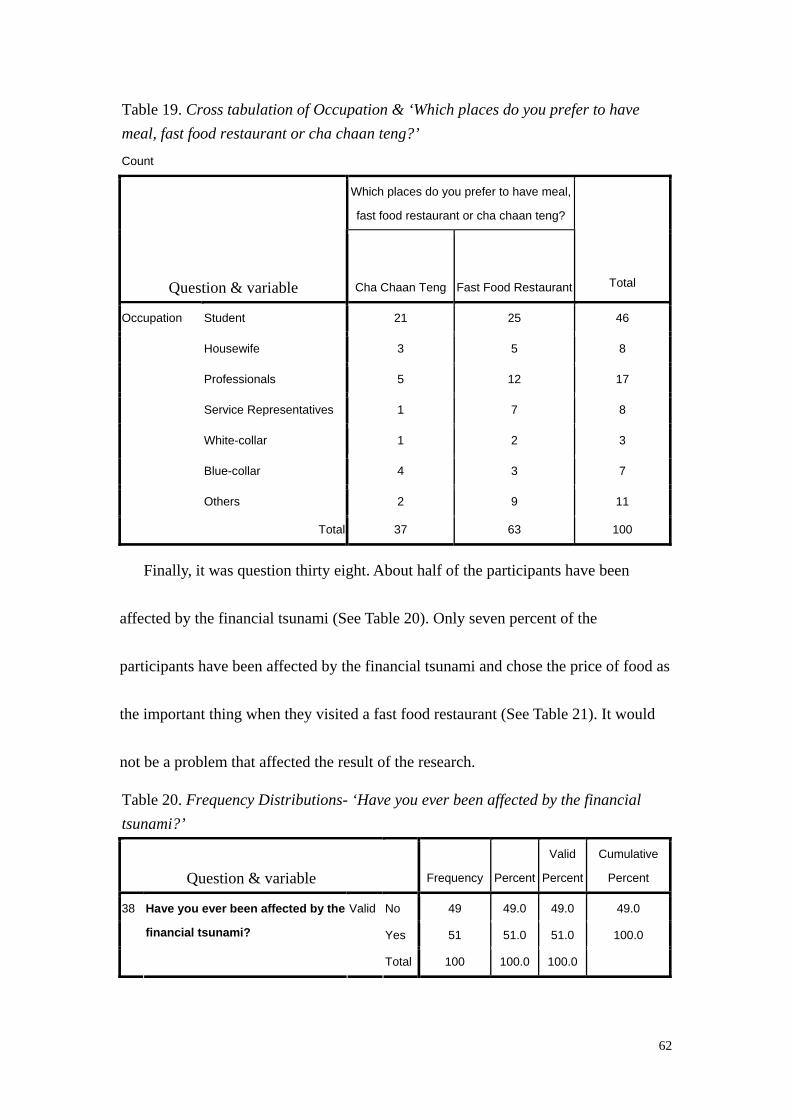
Table 19. Cross tabulation of Occupation & ‘Which places do you prefer to have
meal, fast food restaurant or cha chaan teng?’
Count
Which places do you prefer to have meal,
fast food restaurant or cha chaan teng?
Question & variable Cha Chaan Teng Fast Food Restaurant Total
Student 21 25 46
Housewife 3 5 8
Professionals 5 12 17
Service Representatives 1 7 8
White-collar 1 2 3
Blue-collar 4 3 7
Occupation
Others 2 9 11
Total 37 63 100
Finally, it was question thirty eight. About half of the participants have been
affected by the financial tsunami (See Table 20). Only seven percent of the
participants have been affected by the financial tsunami and chose the price of food as
the important thing when they visited a fast food restaurant (See Table 21). It would
not be a problem that affected the result of the research.
Table 20. Frequency Distributions- ‘Have you ever been affected by the financial
tsunami?’
Question & variable
Frequency Percent
Valid
Percent
Cumulative
Percent
No 49 49.0 49.0 49.0
Yes 51 51.0 51.0 100.0
38 Have you ever been affected by the
financial tsunami?
Valid
Total 100 100.0 100.0
62
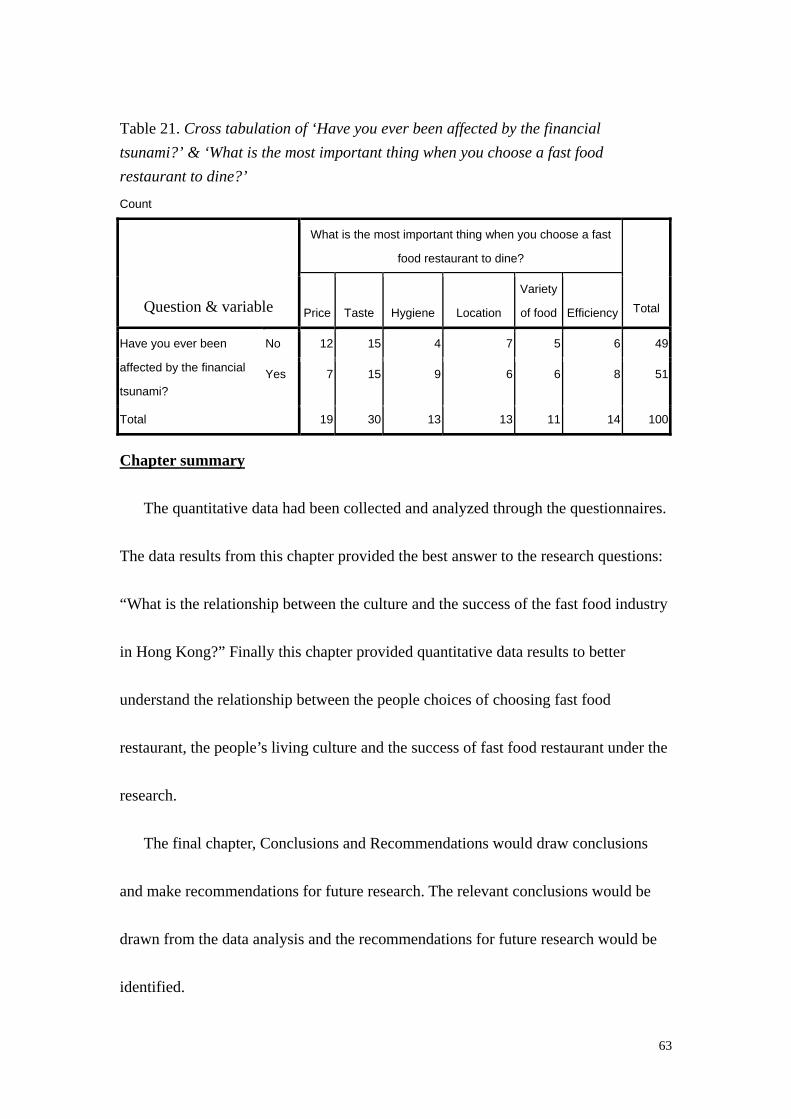
Table 21. Cross tabulation of ‘Have you ever been affected by the financial
tsunami?’ & ‘What is the most important thing when you choose a fast food
restaurant to dine?’
Count
What is the most important thing when you choose a fast
food restaurant to dine?
Question & variable Price Taste Hygiene Location
Variety
of food Efficiency Total
No 12 15 4 7 5 6 49Have you ever been
affected by the financial
tsunami?
Yes 7 15 9 6 6 8 51
Total 19 30 13 13 11 14 100
Chapter summary
The quantitative data had been collected and analyzed through the questionnaires.
The data results from this chapter provided the best answer to the research questions:
“What is the relationship between the culture and the success of the fast food industry
in Hong Kong?” Finally this chapter provided quantitative data results to better
understand the relationship between the people choices of choosing fast food
restaurant, the people’s living culture and the success of fast food restaurant under the
research.
The final chapter, Conclusions and Recommendations would draw conclusions
and make recommendations for future research. The relevant conclusions would be
drawn from the data analysis and the recommendations for future research would be
identified.
63
Chapter 5
Conclusions and Recommendations
Conclusions
The aim of the research was to discover why the fast food industry is successful in
Hong Kong. If the fast food restaurants better understand the relationship of the living
culture of the Hong Kong people, their opinions about the fast food product, and the
factors that can make the success, they could enhance the value and provide more
success to their company.
The findings from the literature review concluded that the living culture was
related to the success of fast food industry. Oak (2008) said that culture forms a set of
values and beliefs of people’s life. Montanari (2006) stated that food was culture if
people chose the same type food as their meal. Because of the long history of the fast
food industry in Hong Kong, fast food had influenced people’s life and became the
culture of Hong Kong people. Lumpur (2005) said that Hong Kong ranked the world’s
No. 1 in terms of frequency of fast food restaurant visits. It was a survey done by AC
Nielsen in 2005. The factor led to the success of the fast food industry included the
increasing number of working people, short meal time and high speed of life. The
number of single-parent household and the number of both parents needed to work
have been increased since 1960s. Therefore, they chose to eat outside and fast food
64
became one of their food choices.
The quantitative analysis findings from the questionnaire concluded that
sixty-three percent of participants preferred to have meal in fast food restaurants (see
table). Most of the participants did not believe price as the important thing when they
chose a fast food restaurant to dine although half of them had been affected by the
financial tsunami (See Table 20). They thought that the taste of food was more
important than the price of food. Most of the participants visited fast food restaurants
at least 1 to 3 times per week. The people who preferred to have meal in fast food
restaurants were mostly the student and the working people. Over half of the
participants believed that the reason of the popularity of fast food among Hong Kong
was because of the fast production. Also, nearly thirty percent of the participants
thought the thing fast food restaurant needed to improve was to provide more food
choices, followed by lower the food selling price, the hygiene of the eating
environment, taste of food, production time and the location of shop.
Recommendations
Based on the result of the questionnaires and the findings from the literature
review, here were some recommendations to the fast food industry and cha chaan teng
in Hong Kong. In order to provide more success to the fast food industry, there were
65
some recommendations to the fast food industry. Firstly, the fast food restaurants
should know who their target market was. According to the research done by Lumpur,
Swiss Association for Nutrition and the questionnaire, we can conclude that the target
market should be the students and the working people. It was because they were the
people who usually visited the fast food restaurants. Next, they should reduce the
waiting time for the fast food products because of the short meal time of the students
and working people. Finally, the fast food restaurants should consider opening more
branches around the commercial and industrial districts. This can help them to capture
more market shares.
To survive in the changing business environment in Hong Kong, there were some
recommendations that can help the traditional Hong Kong style restaurant, “cha chaan
teng” to improve. Firstly, the hygiene level of “cha chaan teng” should be improved.
According to the question twenty four, the mean the degree of agreement of the
participants on the hygiene level of “cha chaan teng” was below average. It meant that
the participants did not satisfy with the hygiene level of “cha chaan teng”.
Also, waiting time for the “cha chaan teng” food should be improved. Only twelve
percent of the participants believed that “cha chaan teng” did well in this part. They
should shorten the waiting time for the cha chaan teng food. One thing they could do
is to increase the efficiency of food production. They should standardize the recipe of
66
their food product and guided the staff about the cooking procedures.
Finally, it was about the price of food. It was difficult for “cha chaan teng” to
compete with the fast food restaurants because of no large financial support. Lumpur
(2005) stated that the price of food was found to be one of the most important choice
criteria around the world. Therefore, if “cha chaan teng” slightly put down the price, it
will help them to attract more customers to visit. From the above, these were the
recommendations that provided to the fast food restaurant and cha chaan teng based
on the primary research and literature review.
Recommendation for further research
The quantitative data analysis was reported in this research study even though the
sample size was small. The data was analyzed and run by the SPSS system.
One recommendation for further research of these quantitative analysis findings to
examine what characteristics of “cha chaan teng” could attract people to visit. It was
because this study was mainly about the success of the fast food industry and it
seemed that there were still a group of people who prefer to have meal in “cha chaan
teng”. The further research study on this area could expand this topic and provide a
better understand on both fast food restaurants and “cha chaan teng”.
67
References
Articulate Global, Inc. (2007). Likert Scale Questions. [online]. Last accessed on 12th
March 2009 at:
http://www.articulate.com/support/help/quizmaker/v2/content/Likert_Scale_Questio
ns.htm
Ball, Stephen D. (1992). Fast-Food Operations and Their Management. Stanley
Thornes (Publishers) Ltd
Balnaves, Mark and Caputi, Peter. (2001). Introduction to quantitative research
methods: an investigative approach. [online]. SAGE. Book from Google books last
accessed on 12th March 2009 at:
http://books.google.com.tw/books?id=Ny5ENZZ0yeAC
BBC News. (2002). Hong Kong hungers for fast food. [online]. UK Edition. Last
accessed on 18th February 2009 at:
http://news.bbc.co.uk/1/low/business/1872661.stm
68
Berger, Asa. (2000). Media and communication research methods: an introduction to
qualitative and quantitative approaches. [online]. Book from Google books last
accessed on 12th March 2009 at:
http://books.google.com.tw/books?id=1GvtAstA_oQC
Brace, Ian. (2004). Questionnaire Design. [online]. Kogan Page, Limited. Book from
ebrary last accessed on 12th March 2009 at:
http://site.ebrary.com.vtclib9.vtc.edu.hk:2048/lib/hkive/docDetail.action?docID=1008
4461
Café de Coral Final Report to Shareholders 2007/2008. [online]. Last accessed on
18th February 2009 at: http://www.cafedecoral.com/web/download/are2008.pdf
Café de Coral Corporate Information. (2005). [online]. Last accessed on 18th
February 2009 at: http://www.cafedecoral.com/web/ci/coporate3.htm
Café De Coral Strategic Business Units. (2005). [online]. Last accessed on 18th
February 2009 at: http://www.cafedecoral.com/web/sbu/sbu1_2.htm
69
Census & Statistics Department. (2006). Population Aged 15 and Over by Marital
Status, 1996, 2001 and 2006. [online]. Source from Census & Statistics Department
last accessed on 20th February 2009 at:
http://www.bycensus2006.gov.hk/FileManager/EN/Content_981/a104e.xls
Census & Statistics Department. (2009). Population by Age Group and Sex. [online].
Source from Census & Statistics Department last accessed on 12th March 2009 at:
http://www.censtatd.gov.hk/hong_kong_statistics/statistical_tables/index.jsp?subjectI
D=1&tableID=002
Cha chaan teng. (2009). [online]. Article from Wikipedla last accessed on 20th
February 2009 at: http://en.wikipedia.org/wiki/Cha_chaan_teng
Clark, Mona, Wilkie, Ella, Wood, Roy C. (1998). Researching and writing
dissertations in hospitality and tourism. Cengage Learning EMEA
Cuisine of Hong Kong. (2009). [online]. Article from Wikipedla last accessed on 20th
February 2009 at: http://en.wikipedia.org/wiki/Cuisine_of_Hong_Kong
70
http://www.censtatd.gov.hk/hong_kong_statistics/statistical_tables/index.jsp?subjectID=1&tableID=002
Culture. (2008). [online]. Source from Dictionary.com last accessed on 20th
November 2008 at: http://dictionary.reference.com/browse/culture
Fast Food and American Culture. (2007). [online]. Article from Associated Content
last accessed on 20th November 2008 at:
http://www.associatedcontent.com/article/132823/fast_food_and_american_culture.ht
ml?cat=5
Fink, A. (1995). How to ask survey questions. Thousand Oaks, CA: SAGE
Publications.
First National Bank. (2009). FNB Solutions for Tourism. [online]. Last accessed on
25th February 2009 at:
https://www.fnb.co.za/frames/content/campaign/tourismtrend.htm
Firebaugh, Doug. (2006). Success to Success - What is the Meaning of Success in
Life?. [online]. Article from EzineArticles.com last accessed on 19th February 2009 at:
http://ezinearticles.com/?Success-to-Success---What-is-the-Meaning-of-Success-in-Li
fe?&id=139160
71
Fridah, W Mugo. (2004). Sampling In Research. [online]. Last accessed on 12th
March 2009 at: http://www.socialresearchmethods.net/tutorial/Mugo/tutorial.htm
Galloway, Kate. (1997). Non-Probability Samples. [online]. Last accessed on 12th
March 2009 at: http://www.tardis.ed.ac.uk/~kate/qmcweb/s8.htm
Goodman, David, Redclift, M.R. (1991). Refashioning Nature: Food, Ecology, and
Culture, Routledge. [online]. Book from Google books last accessed on 20th
November 2008 at: http://books.google.com.tw/books?id=L5GN8p1Fc3YC
Hill, C.W. and Jones G.P., (2007) Strategic Management, 7 ed. Houghton Miffin.,
pp. 188
Isidro, Isabel M. (2008). 10 Rules for Small Business Success. [online]. Article from
Power Home Biz. Com last accessed on 21st February 2009 at:
http://www.powerhomebiz.com/vol19/rules.htm
72
Lan, Li, Khan, Mahmood, A. (1995). Hong Kong’s fast-food industry: an overview.
[online]. Cornell Hotel & Restaurant Administration Quarterly. Article from All
Business.com last accessed on 21st February at:
http://www.allbusiness.com/accommodation-food-services/511425-1.html
Leung, Jess. (2004). Super Size Hong Kong. [online]. Article from Dragon News last
accessed on 19th February 2009 at:
http://dragonnet.hkis.edu.hk/hs/dragonnews/newsandviews/articles05/art05_9.htm
Luke, Aba. (2008). Fast Food Culture is Home Cooked Meals a Thing of the Past.
[online]. Article from The Guardian of Democracy last accessed on 20th November
2008 at: http://www.guardian.co.tt/archives/2008-04-30/features1.html
Lumpur, Kuala. (2005). Asians the World’s Greatest Fast Food Fans. [online]. Article
From AC Nielsen last accessed on 18th February 2009 at:
http://my.nielsen.com/news/20050126.shtml
73
McKinnon Secondary College. (2005). Primary and Secondary Data. [online]. Last
accessed on 13th March 2009 at:
http://www.mckinnonsc.vic.edu.au/vceit/infodata/primarysecondary.htm
Milne, John. (1999). Questionnaires: Advantages and Disadvantages. [online]. Last
accessed on 12th March 2009 at:
http://www.icbl.hw.ac.uk/ltdi/cookbook/info_questionnaires/index.html
Montanari, Massimo. (2006). Food is Culture. [online]. Columbia University Press.
Book from ebrary last accessed on 20th November 2008 at:
http://site.ebrary.com.vtclib9.vtc.edu.hk:2048/lib/hkive/Doc?id=10183599
Ng, Eva. (2005). A 360º View of Fast Food and Impulse Habits. [online]. Article from
AC Nielsen last accessed on 12th February 2009 at:
http://my.acnielsen.com/pubs/2005_q2_ap_fastfood.shtml
Oak, Manali. (2008). Characteristics of Culture. [online]. Article from Buzzle.com
last accessed on 27th February 2009 at:
http://www.buzzle.com/articles/characteristics-of-culture.html
74
Raosoft Inc. (2004). Sample Size Calculator. [online]. Last accessed on 12th March
2009 at: http://www.raosoft.com/samplesize.html
Ritzer, George. (2004). The McDonaldization of Society. [online]. Pine Forge Press.
Book from Google books last accessed on 20th November 2008 at:
http://books.google.com.tw/books?id=JAHhSDKSxz0C
Scent, Benjamin. (2008). 100,000 jobs on the line. [online]. Article from the Standard.
Last accessed on 25th February 2009 at:
http://www.thestandard.com.hk/news_detail.asp?pp_cat=30&art_id=74552&sid=2152
5477&con_type=1&d_str=20081119&sear_year=2008
Success. (2008). [online]. Source from Answers.com last accessed on 20th November
2008 at: http://www.answers.com/topic/success
Success and Failure in the Chinese Fast Food Industry: It’s All About Standardization.
(2006). [online]. Article from Knowledge @ Wharton last accessed on 19th February
2009 at: http://knowledge.wharton.upenn.edu/article.cfm?articleid=1470
75
Swiss Association for Nutrition. (2003). Fast Food as a Sign of theTimes. [online].
Source from the Swiss Association for Nutrition last accessed on 20th November
2008 at: http://www.healthandage.com/Home/gm=20!gid2=2662
The Effect of the Fast Food Culture on Young People. (2008). [online].Article from
Scribd.com last accessed on 20th February 2009 at:
http://www.scribd.com/doc/3928584/The-Effect-of-the-Fast-Food-Culture-on-Young-
People
The Student Standard. (2006). Dining in the fast lane. [online]. Last accessed on 18th
February 2009 at:
http://content.slowfood.it/upload/3E6E345B1dc962719AgyI12166BA/files/student.th
estandard.pdf
The Standard. (2008). At last, some good news for workers. [online]. Last accessed on
25th February 2009 at:
http://www.thestandard.com.hk/news_detail.asp?pp_cat=21&art_id=75817&sid=2190
7791&con_type=1&d_str=20081216&sear_year=2008
76

Wong, Adele. (2008). Raw deal for sushi chain closes. [online]. Article from the
Standard last accessed on 25th February 2009 at:
http://www.thestandard.com.hk/news_detail.asp?pp_cat=30&art_id=74244&sid=2141
9283&con_type=1&d_str=20081112&sear_year=2008
77
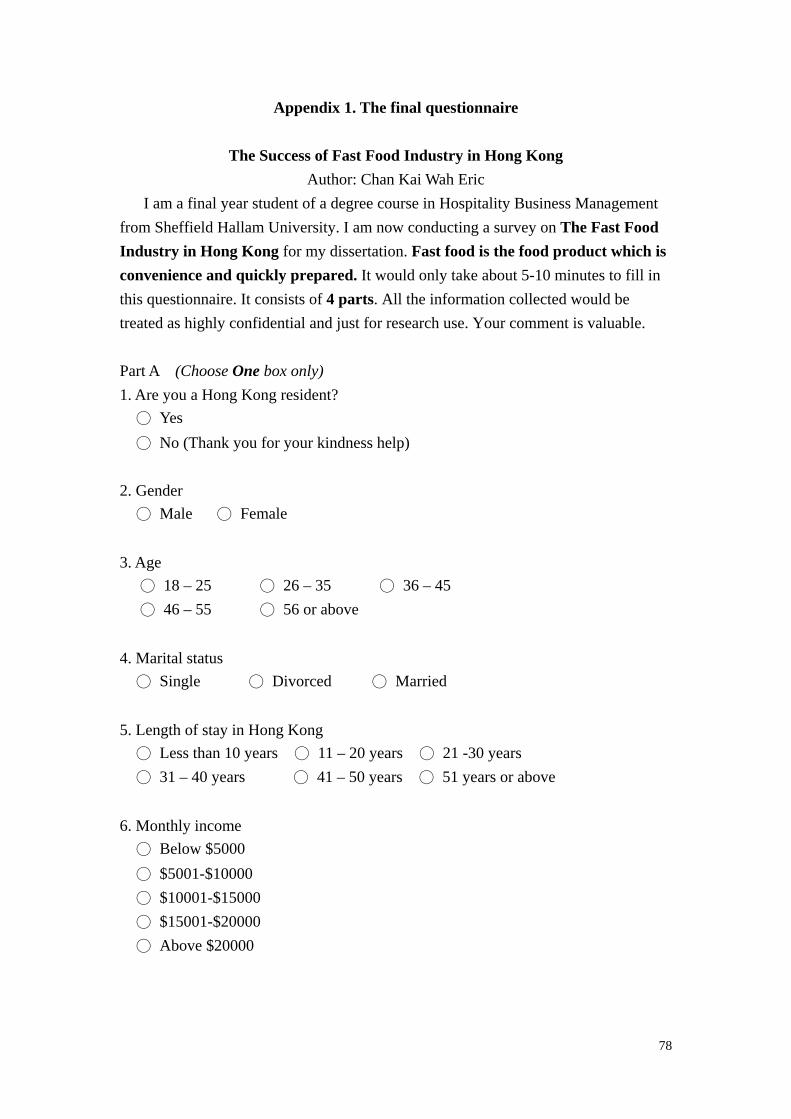
Appendix 1. The final questionnaire
The Success of Fast Food Industry in Hong Kong
Author: Chan Kai Wah Eric
I am a final year student of a degree course in Hospitality Business Management
from Sheffield Hallam University. I am now conducting a survey on The Fast Food
Industry in Hong Kong for my dissertation. Fast food is the food product which is
convenience and quickly prepared. It would only take about 5-10 minutes to fill in
this questionnaire. It consists of 4 parts. All the information collected would be
treated as highly confidential and just for research use. Your comment is valuable.
Part A (Choose One box only)
1. Are you a Hong Kong resident?
○ Yes
○ No (Thank you for your kindness help)
2. Gender
○ Male ○ Female
3. Age
○ 18 – 25 ○ 26 – 35 ○ 36 – 45
○ 46 – 55 ○ 56 or above
4. Marital status
○ Single ○ Divorced ○ Married
5. Length of stay in Hong Kong
○ Less than 10 years ○ 11 – 20 years ○ 21 -30 years
○ 31 – 40 years ○ 41 – 50 years ○ 51 years or above
6. Monthly income
○ Below $5000
○ $5001-$10000
○ $10001-$15000
○ $15001-$20000
○ Above $20000
78
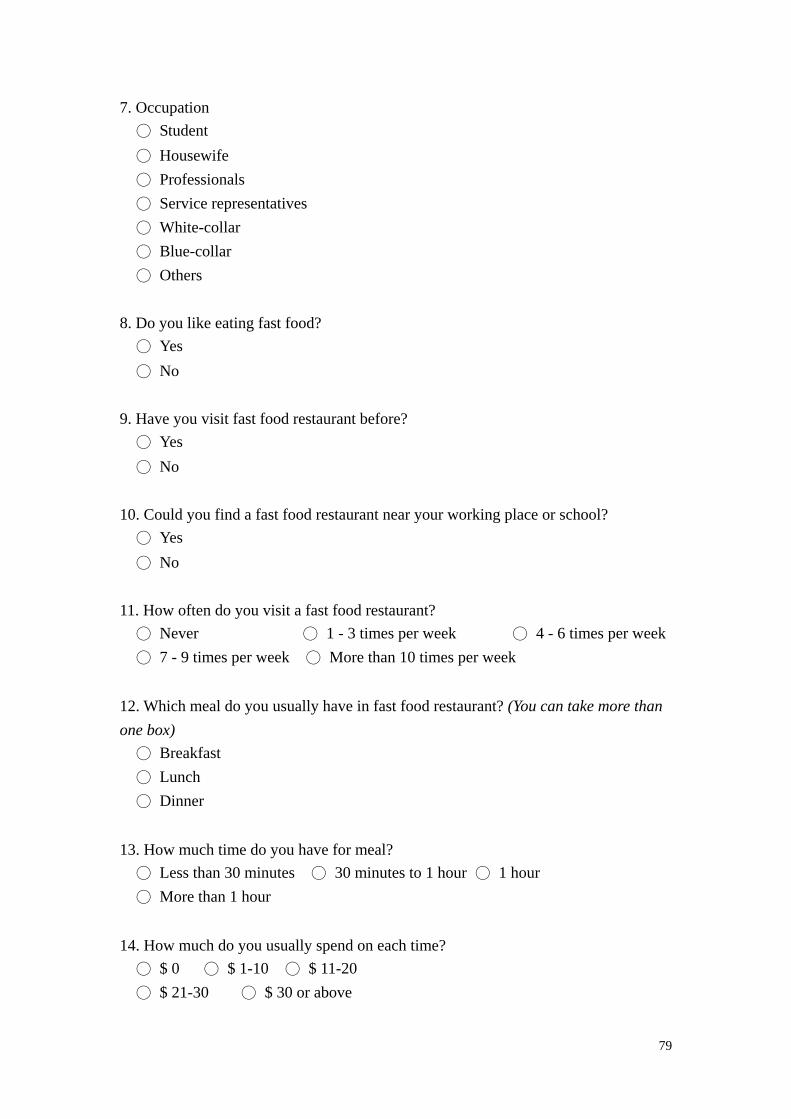
7. Occupation
○ Student
○ Housewife
○ Professionals
○ Service representatives
○ White-collar
○ Blue-collar
○ Others
8. Do you like eating fast food?
○ Yes
○ No
9. Have you visit fast food restaurant before?
○ Yes
○ No
10. Could you find a fast food restaurant near your working place or school?
○ Yes
○ No
11. How often do you visit a fast food restaurant?
○ Never ○ 1 - 3 times per week ○ 4 - 6 times per week
○ 7 - 9 times per week ○ More than 10 times per week
12. Which meal do you usually have in fast food restaurant? (You can take more than
one box)
○ Breakfast
○ Lunch
○ Dinner
13. How much time do you have for meal?
○ Less than 30 minutes ○ 30 minutes to 1 hour ○ 1 hour
○ More than 1 hour
14. How much do you usually spend on each time?
○ $ 0 ○ $ 1-10 ○ $ 11-20
○ $ 21-30 ○ $ 30 or above
79
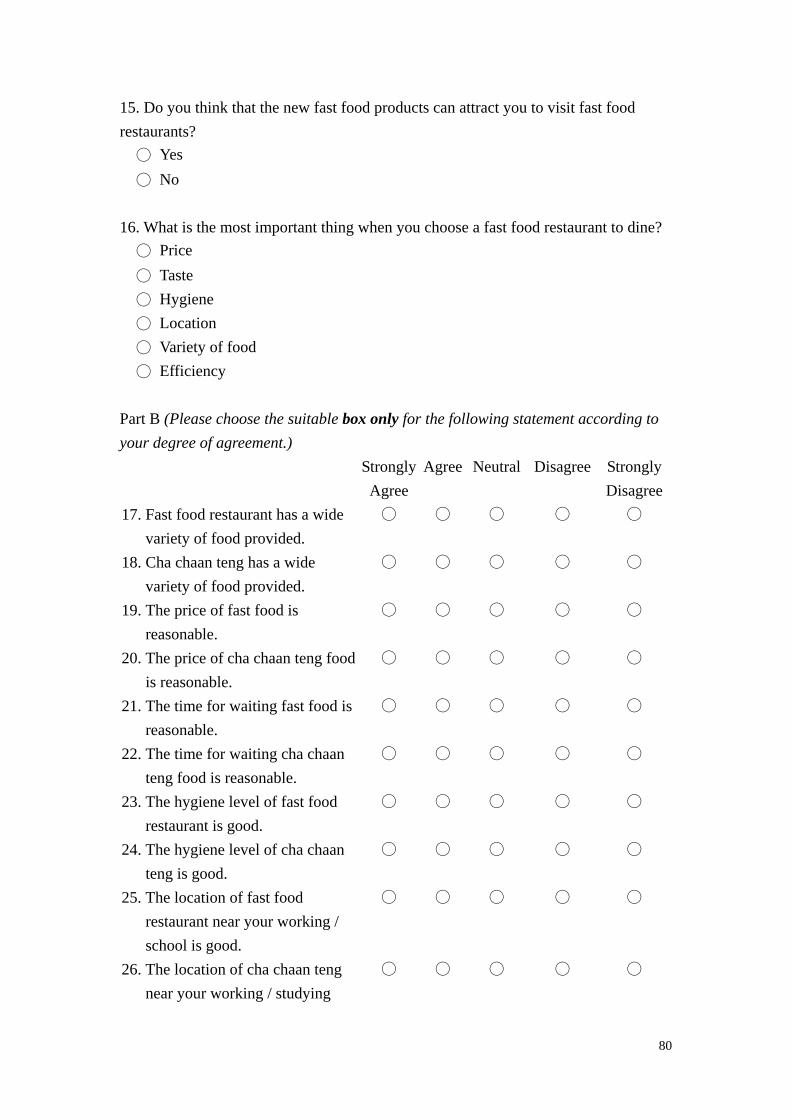
15. Do you think that the new fast food products can attract you to visit fast food
restaurants?
○ Yes
○ No
16. What is the most important thing when you choose a fast food restaurant to dine?
○ Price
○ Taste
○ Hygiene
○ Location
○ Variety of food
○ Efficiency
Part B (Please choose the suitable box only for the following statement according to
your degree of agreement.)
Strongly
Agree
Agree Neutral Disagree Strongly
Disagree
17. Fast food restaurant has a wide
variety of food provided.
○ ○ ○ ○ ○
18. Cha chaan teng has a wide
variety of food provided.
○ ○ ○ ○ ○
19. The price of fast food is
reasonable.
○ ○ ○ ○ ○
20. The price of cha chaan teng food
is reasonable.
○ ○ ○ ○ ○
21. The time for waiting fast food is
reasonable.
○ ○ ○ ○ ○
22. The time for waiting cha chaan
teng food is reasonable.
○ ○ ○ ○ ○
23. The hygiene level of fast food
restaurant is good.
○ ○ ○ ○ ○
24. The hygiene level of cha chaan
teng is good.
○ ○ ○ ○ ○
25. The location of fast food
restaurant near your working /
school is good.
○ ○ ○ ○ ○
26.
The location of cha chaan teng
near your working / studying
○ ○ ○ ○ ○
80
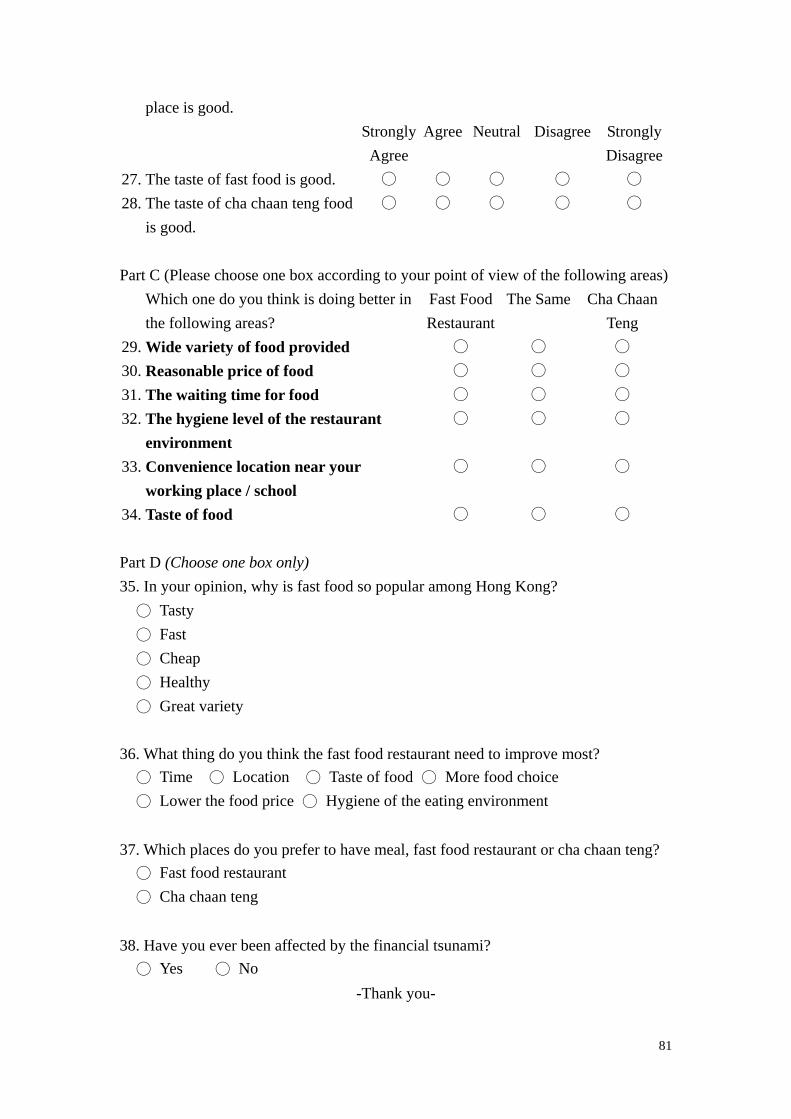
81
place is good.
Strongly
Agree
Agree Neutral Disagree Strongly
Disagree
27. The taste of fast food is good. ○ ○ ○ ○ ○
28. The taste of cha chaan teng food
is good.
○ ○ ○ ○ ○
Part C (Please choose one box according to your point of view of the following areas)
Which one do you think is doing better in
the following areas?
Fast Food
Restaurant
The Same Cha Chaan
Teng
29. Wide variety of food provided ○ ○ ○
30. Reasonable price of food ○ ○ ○
31. The waiting time for food ○ ○ ○
32. The hygiene level of the restaurant
environment
○ ○ ○
33. Convenience location near your
working place / school
○ ○ ○
34. Taste of food ○ ○ ○
Part D (Choose one box only)
35. In your opinion, why is fast food so popular among Hong Kong?
○ Tasty
○ Fast
○ Cheap
○ Healthy
○ Great variety
36. What thing do you think the fast food restaurant need to improve most?
○ Time ○ Location ○ Taste of food ○ More food choice
○ Lower the food price ○ Hygiene of the eating environment
37. Which places do you prefer to have meal, fast food restaurant or cha chaan teng?
○ Fast food restaurant
○ Cha chaan teng
38. Have you ever been affected by the financial tsunami?
○ Yes ○ No
-Thank you-
Related Documents