ACPD 10, 3827–3860, 2010 Bromine measurements over the Arctic Ocean J. A. Neuman et al. Title Page Abstract Introduction Conclusions References Tables Figures Back Close Full Screen / Esc Printer-friendly Version Interactive Discussion Atmos. Chem. Phys. Discuss., 10, 3827–3860, 2010 www.atmos-chem-phys-discuss.net/10/3827/2010/ © Author(s) 2010. This work is distributed under the Creative Commons Attribution 3.0 License. Atmospheric Chemistry and Physics Discussions This discussion paper is/has been under review for the journal Atmospheric Chemistry and Physics (ACP). Please refer to the corresponding final paper in ACP if available. Bromine measurements in ozone depleted air over the Arctic Ocean J. A. Neuman 1,2 , J. B. Nowak 1,2 , L. G. Huey 3 , J. B. Burkholder 2 , J. E. Dibb 4 , J. S. Holloway 1,2 , J. Liao 3 , J. Peischl 1,2 , J. M. Roberts 2 , T. B. Ryerson 2 , E. Scheuer 4 , H. Stark 1,2 , R. E. Stickel 3 , D. J. Tanner 3 , and A. Weinheimer 5 1 Cooperative Institute for Research in Environmental Sciences, University of Colorado at Boulder, Boulder, CO, USA 2 Earth System Research Laboratory, NOAA, Boulder, CO, USA 3 School of Earth and Atmospheric Science, Georgia Institute of Technology, Atlanta, GA, USA 4 Institute for the Study of Earth, Oceans, and Space, University of New Hampshire, Durham, NH, USA 5 Atmospheric Chemistry Division, National Center for Atmospheric Research, Boulder, CO, USA Received: 7 January 2010 – Accepted: 26 January 2010 – Published: 10 February 2010 Correspondence to: J. A. Neuman ([email protected]) Published by Copernicus Publications on behalf of the European Geosciences Union. 3827

Welcome message from author
This document is posted to help you gain knowledge. Please leave a comment to let me know what you think about it! Share it to your friends and learn new things together.
Transcript
ACPD10, 3827–3860, 2010
Brominemeasurements over
the Arctic Ocean
J. A. Neuman et al.
Title Page
Abstract Introduction
Conclusions References
Tables Figures
J I
J I
Back Close
Full Screen / Esc
Printer-friendly Version
Interactive Discussion
Atmos. Chem. Phys. Discuss., 10, 3827–3860, 2010www.atmos-chem-phys-discuss.net/10/3827/2010/© Author(s) 2010. This work is distributed underthe Creative Commons Attribution 3.0 License.
AtmosphericChemistry
and PhysicsDiscussions
This discussion paper is/has been under review for the journal Atmospheric Chemistryand Physics (ACP). Please refer to the corresponding final paper in ACP if available.
Bromine measurements in ozonedepleted air over the Arctic OceanJ. A. Neuman1,2, J. B. Nowak1,2, L. G. Huey3, J. B. Burkholder2, J. E. Dibb4,J. S. Holloway1,2, J. Liao3, J. Peischl1,2, J. M. Roberts2, T. B. Ryerson2,E. Scheuer4, H. Stark1,2, R. E. Stickel3, D. J. Tanner3, and A. Weinheimer5
1Cooperative Institute for Research in Environmental Sciences, University of Colorado atBoulder, Boulder, CO, USA2Earth System Research Laboratory, NOAA, Boulder, CO, USA3School of Earth and Atmospheric Science, Georgia Institute of Technology, Atlanta, GA, USA4Institute for the Study of Earth, Oceans, and Space, University of New Hampshire, Durham,NH, USA5Atmospheric Chemistry Division, National Center for Atmospheric Research, Boulder,CO, USA
Received: 7 January 2010 – Accepted: 26 January 2010 – Published: 10 February 2010
Correspondence to: J. A. Neuman ([email protected])
Published by Copernicus Publications on behalf of the European Geosciences Union.
3827
ACPD10, 3827–3860, 2010
Brominemeasurements over
the Arctic Ocean
J. A. Neuman et al.
Title Page
Abstract Introduction
Conclusions References
Tables Figures
J I
J I
Back Close
Full Screen / Esc
Printer-friendly Version
Interactive Discussion
Abstract
In situ measurements of ozone, photochemically active bromine compounds, and othertrace gases over the Arctic Ocean in April 2008 are used to examine the chemistryand geographical extent of ozone depletion in the arctic marine boundary layer (MBL).Data were obtained from the NOAA WP-3D aircraft during the Aerosol, Radiation, and5
Cloud Processes affecting Arctic Climate (ARCPAC) study and the NASA DC-8 aircraftduring the Arctic Research of the Composition of the Troposphere from Aircraft andSatellites (ARCTAS) study. Fast (1 s) and sensitive (detection limits at the low pptvlevel) measurements of BrCl and BrO were obtained from three different chemical ion-ization mass spectrometer (CIMS) instruments, and soluble bromide was measured10
with a mist chamber. The CIMS instruments also detected Br2. Subsequent laboratorystudies showed that HOBr rapidly converts to Br2 on the Teflon instrument inlets. Thisdetected Br2 is identified as active bromine and represents a lower limit of the sumHOBr+Br2. The measured active bromine is shown to likely be HOBr during daytimeflights in the arctic. In the MBL over the Arctic Ocean, soluble bromide and active15
bromine were consistently elevated and ozone was depleted. Ozone depletion andactive bromine enhancement were confined to the MBL that was capped by a tem-perature inversion at 200–500 m altitude. In ozone-depleted air, BrO rarely exceeded10 pptv and was always substantially lower than soluble bromide that was as high as40 pptv. BrCl was rarely enhanced above the 2-pptv detection limit, either in the MBL,20
over Alaska, or in the arctic free troposphere.
1 Introduction
Low ozone mixing ratios over the Arctic Ocean region in the spring have been ob-served for nearly three decades (Oltmans, 1981). Model studies and measurementsof ozone, halogen compounds, and volatile organic compounds that react with halo-25
gens have shown that bromine from the Arctic Ocean causes ozone depletion inthe springtime arctic boundary layer (Simpson et al., 2007, and references therein).
3828
ACPD10, 3827–3860, 2010
Brominemeasurements over
the Arctic Ocean
J. A. Neuman et al.
Title Page
Abstract Introduction
Conclusions References
Tables Figures
J I
J I
Back Close
Full Screen / Esc
Printer-friendly Version
Interactive Discussion
Atmospheric concentrations of photochemically active bromine species are elevatedby heterogeneous chemistry that converts condensed phase bromine to volatile andphotolabile species such as Br2 (Fan and Jacob, 1992). Photolysis of either Br2 orHOBr then forms Br atoms. In seawater, chloride is 700 times more abundant thanbromide. Yet in the atmosphere over the arctic in spring, the selective liberation of5
bromine from sea ice causes Br atoms to exceed Cl atoms by factors of hundreds, asshown by measurements of VOC ratios (Jobson et al., 1994; Impey et al., 1999; Keiland Shepson, 2006). Br atoms react with ozone by
Br+O3 →BrO+O2 , (R1)
and catalytic ozone destruction occurs if Br atoms are regenerated by BrO self-reaction10
or reaction with HO2. BrO produced from the reaction of Br and ozone has beenobserved in arctic regions and provides further confirmation of bromine-induced ozonedestruction (Hausmann and Platt, 1994). In the springtime arctic, a stable boundarylayer isolates the air in the lowest several hundred meters of the atmosphere fromthe free troposphere above. This reduces dilution of ozone-depleted air in the marine15
boundary layer (MBL) with ozone-rich air in the free troposphere and further allowsbromine species to build to high levels.
Most arctic studies of ozone depletion have been conducted over land from coastalground sites near ocean source regions of halogens (Barrie et al., 1988). Back tra-jectories and ozone observations have shown that the predominant transport pathway20
for ozone depleted air arriving at arctic ground sites is over the Arctic Ocean, sug-gesting that ozone depletion chemistry occurs over the ocean (Bottenheim and Chan,2006). The few measurements obtained directly over Arctic Ocean ice have shownthat ozone depletion is persistent in the spring (Hopper et al., 1998). Sustained ozonedepletion over arctic ice has been observed at high latitudes (81–88◦ N) from a ship25
that drifted while frozen in the Arctic Ocean (Bottenheim et al., 2009). Ozone depletionand bromine chemistry in the lower troposphere at northern high latitudes also havebeen studied using satellite measurements of BrO combined with a chemical transportmodel (Zeng et al., 2003).
3829
ACPD10, 3827–3860, 2010
Brominemeasurements over
the Arctic Ocean
J. A. Neuman et al.
Title Page
Abstract Introduction
Conclusions References
Tables Figures
J I
J I
Back Close
Full Screen / Esc
Printer-friendly Version
Interactive Discussion
Measurements from aircraft, which permit investigations over these ocean regionswhere ozone depletion originates, also have shown that ozone depletion is ubiquitousover the Arctic Ocean in spring (Leaitch et al., 1994; Hopper et al., 1998). Large re-gions with both major (O3<4 ppbv) and partial (4<O3<20 ppbv) ozone depletions weredetected by aircraft measurements over the Canadian Arctic, the Arctic Ocean north5
of Greenland, and occasionally at more southern latitudes (Ridley et al., 2003). Inthat study, ozone depletion was observed regularly and was associated with increasedlevels of soluble bromide. The largest levels of soluble bromide were in the northern-most ozone-depleted air, but interestingly not in the layers with the least ozone. Therelationship between ozone and bromine is investigated further here.10
Arctic ozone depletion chemistry needs to be better understood, since it may haveimportant regional environmental consequences. The presence of bromine and thedepletion of ozone alter the oxidizing characteristics of the atmosphere to make thearctic a sink for some compounds. Elemental mercury (Hg), which is long-lived anddistributed globally, is oxidized to reactive forms by Br atoms (Donohoue et al., 2006).15
This reactive gaseous mercury deposits to surfaces more readily than elemental Hgand could collect in arctic regions (Steffen et al., 2008, and references therein).
Although severe ozone depletion caused by halogen chemistry is usually confined toa thin layer of the atmosphere over the polar oceans and occurs primarily in the spring,the same processes may occur throughout the year over all oceans. Understanding the20
processes that cause ozone depletion in the arctic can reveal whether these reactionssubstantially affect global ozone concentrations. Ozone reductions caused by reactivehalogens have been modeled to occur throughout the troposphere (Yang et al., 2005)and in polluted marine air masses transported over the ocean (Sander and Crutzen,1996). Experimental verification of these model results regarding halogen chemistry25
is challenging. Although several bromine-containing compounds are expected to beelevated in air masses where bromine-induced ozone destruction is important, mea-surement capabilities for low levels of inorganic bromine-containing molecules are lim-ited primarily to BrO (Read et al., 2008; Platt and Honninger, 2003). In particular,
3830
ACPD10, 3827–3860, 2010
Brominemeasurements over
the Arctic Ocean
J. A. Neuman et al.
Title Page
Abstract Introduction
Conclusions References
Tables Figures
J I
J I
Back Close
Full Screen / Esc
Printer-friendly Version
Interactive Discussion
HBr, BrO, HOBr, Br2, and Br are predicted to be elevated at some point during ozonedepletion, and their abundance indicates the temporal evolution of the ozone deple-tion chemistry (Lehrer et al., 2004; Calvert and Lindberg, 2003; Martinez et al., 1999;Sander and Crutzen, 1996; Evans et al., 2003; Fan and Jacob, 1992). Extending thelimited geographical range of bromine observations and number of measured bromine5
compounds will provide experimental evidence for the effect of reactive halogens uponglobal lower tropospheric ozone abundance.
This study examines ozone depletion and bromine abundance over the Arctic Oceannear Alaska. New techniques for rapidly detecting low concentrations of Br2, HOBr,BrO, and BrCl are developed. The extent and causes of ozone depletion in the spring-10
time arctic are investigated with expanded capabilities for speciating inorganic bromine.
2 Measurements
Aircraft measurements were performed over the Arctic Ocean in April 2008 as part ofthe Polar Study using Aircraft, Remote Sensing, Surface Measurements, and Modelsof Climate, Chemistry, Aerosols, and Transport (POLARCAT) during the International15
Polar Year. Data were obtained from the NOAA WP-3D aircraft during the Aerosol,Radiation, and Cloud Processes affecting Arctic Climate (ARCPAC) experiment and theNASA DC-8 aircraft during the Arctic Research of the Composition of the Tropospherefrom Aircraft and Satellites (ARCTAS) experiment. Flights targeted many different airmass types to address the multiple goals of the ARCPAC (Brock et al., 2010) and20
ARCTAS studies (Jacob et al., 2009). A small fraction of the WP-3D (20%) and DC-8 (10%) arctic flights were dedicated to sampling in or near the MBL over the ArcticOcean to examine halogen chemistry. The WP-3D measurements are described indetail here and the data are available at http://www.esrl.noaa.gov/csd/arcpac/. The DC-8 measurements are briefly summarized, and the data are available at http://www-air.25
larc.nasa.gov/data.htm.
3831
ACPD10, 3827–3860, 2010
Brominemeasurements over
the Arctic Ocean
J. A. Neuman et al.
Title Page
Abstract Introduction
Conclusions References
Tables Figures
J I
J I
Back Close
Full Screen / Esc
Printer-friendly Version
Interactive Discussion
2.1 Aircraft sampling platforms
The NOAA WP-3D aircraft flew over the Arctic Ocean on five flights that departed fromFairbanks, Alaska. The flights were performed during the day on 12, 15, 18, 19, and21 April 2008 (Fig. 1). Over sea ice, the WP-3D typically flew between 100–160 maltitude, with occasional dips to 60 m. Air was sampled above the MBL in frequent5
altitude profiles and higher altitude flight legs up to 7.4 km. Approximately 20–90 minof flight time was dedicated to sampling in the MBL on each eight hour flight. Most ofthe MBL studies were conducted over the Beaufort and Chukchi Seas adjacent to thenorthern coastline of Alaska.
The NASA DC-8 aircraft conducted seven flights in the arctic region between 4 and10
17 April 2008. Flight altitudes in the MBL over the Arctic Ocean were typically 100 m.Although the DC-8 devoted less time to studies of halogen chemistry in the MBL, itcovered a much larger area, with measurements at high latitudes all the way to thepole and further east over the Canadian Arctic.
In situ measurements were obtained from fast-response, high-sensitivity instru-15
ments. Complete instrument descriptions, as well as field intercomparison results,are detailed in ARCPAC and ARCTAS overview papers (Brock et al., 2010; Jacobet al., 2009). On the WP-3D, ozone was measured by chemiluminescence. The datawere averaged to once per second with a 1-sigma uncertainty of ±(4%+0.05) ppbv.Additional fast response measurements used to characterize the air masses in-20
cluded SO2 (uncertainty ±(13%+0.55) ppbv), CO (uncertainty ±3%), NO (uncer-tainty ±(8%+0.02) ppbv), NO2 (uncertainty ±(10%+0.04) ppbv), and NOy (uncertainty±(12%+0.05) ppbv). Measurements of actinic flux between 280 and 690 nm were per-formed both in the upward and downward looking directions at 1 nm resolution us-ing two grating spectrometer/CCD systems (Stark et al., 2007). Photolysis rates for25
bromine compounds were calculated from the actinic flux measurements using litera-ture values for the absorption cross-sections and quantum yields (Sander et al., 2006).
3832
ACPD10, 3827–3860, 2010
Brominemeasurements over
the Arctic Ocean
J. A. Neuman et al.
Title Page
Abstract Introduction
Conclusions References
Tables Figures
J I
J I
Back Close
Full Screen / Esc
Printer-friendly Version
Interactive Discussion
On the DC-8, soluble bromide was measured with a mist chamber. The species re-sponsible for bromide in the mist chamber are uncertain but include inorganic brominecompounds HBr, HOBr, particulate bromide, and possibly BrO and Br2 (Ridley et al.,2003; Dibb et al., 2010; Liao et al., 2010). Each measurement averaged over 1.5 min,with a 3-pptv detection limit and a 20–30% uncertainty. Ozone was measured by5
chemiluminescence with 5% uncertainty, <1 s time response, and <0.1 ppbv impre-cision. The chemical ionization mass spectrometers (CIMS) (Huey, 2007) used tomeasured halogen species on both aircraft are described in detail below.
2.2 CIMS halogen detection
Fast response measurements of reactive halogen compounds were achieved using10
newly developed detection techniques. Gas phase reactive halogen compounds weremeasured by a CIMS instrument on the DC-8 and by two independent CIMS instru-ments on the WP-3D. The CIMS techniques used here evolve from instruments thatmeasure atmospheric SO2 (Kim et al., 2007) and peroxyacyl nitrates (Slusher et al.,2004), with modifications that exploit laboratory studies of ion-molecule reactions in-15
volving halogen compounds (Huey et al., 1995; Roberts et al., 2008). Reagent ionsare made in-flight and mixed with ambient air in a low-pressure flow tube, where ion-molecule reactions form unique product ions used to determine ambient mixing ratios.Br2, BrCl, and BrO are measured using either I− or SF−
6 reagent ions. The reagent andproduct ions are mass-filtered with quadrupole mass spectrometers and then counted20
with electron multiplier detectors. The air is admitted into the instruments through sep-arate inlets by pulling flows of several standard liters per minute (slm) through heated(≈30 ◦C) tubes. All wetted inlet parts are made from perfluoroalkoxy (PFA) Teflon (ab-breviated as Teflon below). The aircraft inlets are housed in winglets that extend per-pendicular to the skin of the aircraft and beyond the aircraft boundary layer, with inlet25
tips that are 0.4 cm ID Teflon tubes. Total inlet lengths are less than 1 m for eachinstrument, resulting in inlet residence times of tens of ms.
Instrument operation and diagnostics, including sampling, calibration, and zeroing,3833
ACPD10, 3827–3860, 2010
Brominemeasurements over
the Arctic Ocean
J. A. Neuman et al.
Title Page
Abstract Introduction
Conclusions References
Tables Figures
J I
J I
Back Close
Full Screen / Esc
Printer-friendly Version
Interactive Discussion
are given below for the WP-3D CIMS that uses I− ion chemistry. I− reagent ions areproduced by flowing 2 slm N2 doped with 2.5 ppmv CH3I through a 210Po radioactivesource. The CH3I is obtained from a 5 sccm flow of 0.1% CH3I in N2. This ion flow iscombined with 1.6 slm ambient air in a 46-cm long flow tube at 20 Torr. Adding a 20-sccm N2 flow bubbled through distilled H2O humidifies the flow tube. Humidification5
increases the abundance of I−·H2O cluster ions, which provide better sensitivity tohalogen detection than I− alone.
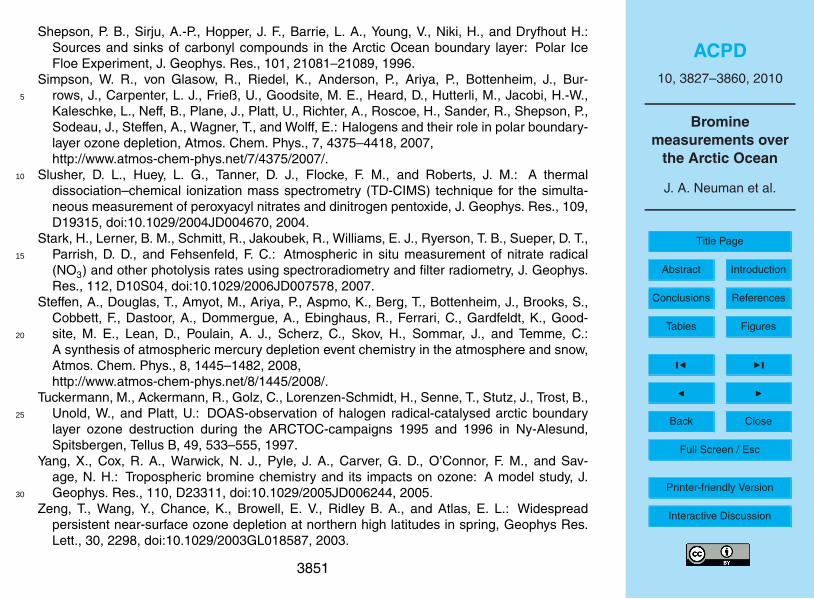
I−·H2O reacts with Br2, BrCl, Cl2, and BrO to form clusters of I− with the halogenmolecules. Since atomic I has no isotopes and a mass given by 127 atomic mass units(amu), and atomic Br and Cl have two naturally occurring isotopes (79Br (50.7%), 81Br10
(49.3%), and 35Cl (75.8%), 37Cl (24.2%)), the cluster ions have simple but distinct iso-tope ratios. For example, I−·Br2 clusters have three isotopes: 285 amu (25%), 287 amu(50%), and 289 amu (25%) (Fig. 2). These isotope patterns facilitate unambiguousidentification of the ions. However, instrument sensitivity is reduced, since only onemass can be measured at a time, and isotopes distribute the ion products over sev-15
eral masses simultaneously. Ions are monitored in flight in the following sequence:127 amu (I−) for 100 ms, 145 amu (I−·H2O) for 100 ms, 224 amu (I−·BrO) for 500 ms,243 amu (I−·BrCl) for 500 ms, and 287 amu (I−·Br2) for 500 ms. Consequently, BrO,BrCl, and Br2 mixing ratios are determined once every 2 s. I− and its water clusters areorders of magnitude more abundant than any other negative ions in the flow tube, with20
I− and I−·H2O ion count rates typically 400 kHz (Figs. 2 and 4).Entirely different ion chemistry and resulting product ions are used for halogen de-
tection on the DC-8 and in the other WP-3D CIMS instrument. Nitrogen doped withSF6 is used to produce the SF−
6 reagent ions. SF−6 is a reactive ion that was employed
with the primary goal of measuring SO2, but it also reacts efficiently with halogen com-25
pounds to form negatively charged halogens by charge transfer. For example, SF−6
reacts with BrO to form BrO−. The operation of these two instruments is not detailedhere, but they perform similarly to the WP-3D I− CIMS, with in-flight calibrations andbackground determinations as described below.
3834
ACPD10, 3827–3860, 2010
Brominemeasurements over
the Arctic Ocean
J. A. Neuman et al.
Title Page
Abstract Introduction
Conclusions References
Tables Figures
J I
J I
Back Close
Full Screen / Esc
Printer-friendly Version
Interactive Discussion
2.3 Sensitivity
Instrument sensitivity is determined in-flight by standard addition calibrations of Br2.The Br2 source is a commercial permeation device (Kin-tek USA). 20 sccm of N2 con-tinuously flows around a Br2 permeation tube that is pressure controlled at 2 atm andtemperature controlled at 25 ◦C. The Br2 output was measured to be 12 ng/min by op-5
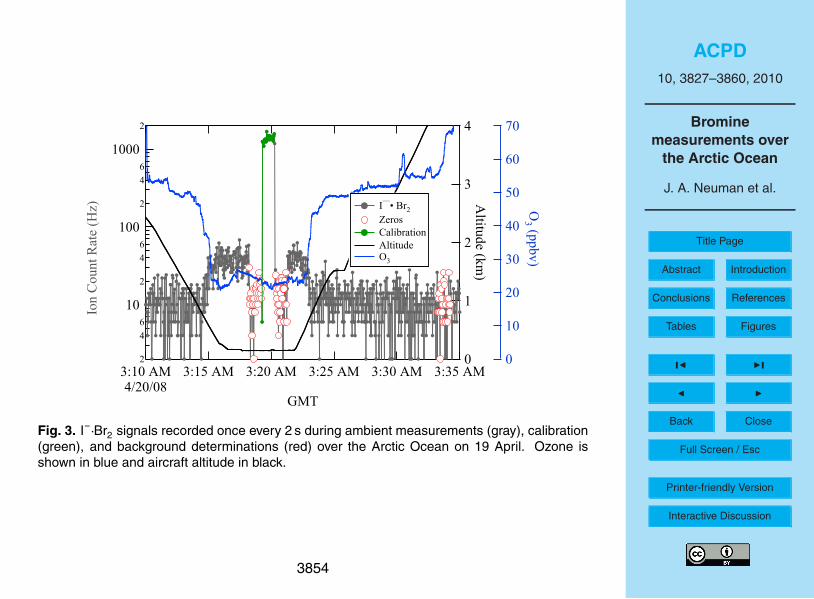
tical absorption at 404 nm. At 40 ◦C, the measured output was 56 ng/min, and 14%higher than the manufacturer’s gravimetric determination of 49 ng/min. The calibrationgas is mixed with the 5-slm inlet airflow to give 340 pptv calibrations. Br2 is admittedinto the inlet for 1 min approximately once per hour. The response to the calibrationis rapid, with a >90% rise and fall in <2 s (Fig. 3). The sensitivity to Br2 detection10
averages 5 ion counts per second per pptv (Hz/pptv).The sensitivity to other halogen compounds was determined in the laboratory both
before and after the field study, and in-flight sensitivity is calculated from the laboratoryratios to Br2 sensitivity. Cl2 sensitivity was determined using permeation devices andcompressed gas mixtures containing 3–5 ppmv Cl2 in N2. Placing Br2 and Cl2 perme-15
ation tubes in a single oven at 40 ◦C made BrCl. The BrCl output was related to Br2by the reduction in Br2 when Cl2 was added and BrCl was formed, assuming quantita-tive conversion of Br2 to BrCl. The sensitivities to Cl2 and BrCl detection at the mostabundant product isotopes (I−·70Cl2 (58%), I−·116BrCl (50%), Fig. 2) are approximatelyequal to that for Br2 (I−·160Br2, 50%). BrO was made by flowing Br2 in He through20
a microwave discharge to make Br atoms (Orlando et al., 1991), and then ozone wasadded after the discharge to make BrO by Reaction (R1). The sensitivity is determinedby comparing BrO to Br2 variations when the discharge and ozone were modulated.Ozone addition lowers the Br2 output since Br recombination that regenerates Br2 isreduced by the loss of Br to BrO (Reaction R1). Similarly, operation of the microwave25
discharge reduces Br2 signals. These experiments place upper and lower bounds onthe BrO sensitivity relative to Br2, since Br atoms may be lost to surfaces without Br2reformation. Using I− ion chemistry, the sensitivity to BrO detection is approximately
3835
ACPD10, 3827–3860, 2010
Brominemeasurements over
the Arctic Ocean
J. A. Neuman et al.
Title Page
Abstract Introduction
Conclusions References
Tables Figures
J I
J I
Back Close
Full Screen / Esc
Printer-friendly Version
Interactive Discussion
half the Br2 sensitivity. BrO and BrCl measurement uncertainties are larger since theircalibration magnitudes are not independently measured but are derived from changesin Br2 signals.
2.4 Background determination and measurement uncertainty
The instrument background is measured by sampling ambient air through a scrubber5
that removes halogen compounds without otherwise changing the ambient air. Every15 min, the Teflon valve located at the inlet tip (see Fig. 1 in the work of Neuman et al.,2002) was actuated and ambient air was directed through a scrubber before enteringthe inlet. After 1 min, the valve was switched to bypass the scrubber and directly sampleambient air. The scrubbing material in the WP-3D I− CIMS is untreated fine Pyrex glass10
wool that readily removes all Br2 and BrO. Other tested materials, including steel wooland nylon wool, do not remove Br2 completely. Activated charcoal, which is used asa scrubbing material in the other two CIMS instruments, effectively removes Br2 froma gas stream, but it also removes many other compounds.
Background signal levels at the ion masses used for halogen detection were low.15
The measurement sequence shown in Fig. 3 illustrates the response to in-flight back-ground determinations at ion mass 287 used for Br2 detection. The open red circlesindicate when ambient air was directed through the glass wool filter. Importantly, theinstrument background did not change with altitude and remained low (≈2 pptv) andstable. BrO background levels were also consistently a few pptv. BrCl backgrounds20
were sometimes higher and more variable, causing greater uncertainty in the BrClmeasurements. The measured background values for each ion mass are subtractedfrom the total signal at that mass to determine ambient mixing ratios. Although sensi-tivity to Cl2 is high, occasional rapid and large changes in the background at 197 amu(I−·Cl2) prevented accurate quantification of Cl2 at levels less than a few hundred pptv.25
Hence, Cl2 mixing ratios are not determined.Imprecision, uncertainty in calibration addition and response, and background uncer-
tainty contribute to total measurement uncertainties. Overall measurement uncertainty3836
ACPD10, 3827–3860, 2010
Brominemeasurements over
the Arctic Ocean
J. A. Neuman et al.
Title Page
Abstract Introduction
Conclusions References
Tables Figures
J I
J I
Back Close
Full Screen / Esc
Printer-friendly Version
Interactive Discussion
for 2 s data from the WP-3D I− CIMS is ±(15%+2) pptv for Br2 detection, and±(40%+3) pptv for BrO and BrCl detection. Greater uncertainties for BrO and BrCldetection are caused by the additional uncertainty in determining BrO and BrCl cali-bration magnitudes (discussed above) and the higher and more variable backgroundlevels. The SF−
6 CIMS instruments on the WP-3D and DC-8 also detected BrO and5
Br2. The sensitivity to Br2 detection using SF−6 was better than 4 Hz/pptv for both in-
struments. The DC-8 CIMS measured BrO on two flights and Br2 on all seven arcticflights, with measurements once every 30 s.
2.5 Selectivity
Bromine speciation is achieved by exploiting ion chemistry to detect each bromine-10
containing compound at a unique mass, as described above. The distinct isotopicsignatures from bromine-containing compounds reduce ambiguity in ion identification(Fig. 2). Additionally, the product ions are at high masses and far from interfering ionsor fragments of ion clusters. However, measuring highly reactive species is subject tosampling artifacts, including reaction on instrument surfaces that cause loss or chem-15
ical conversion of compounds. Laboratory tests showed that sampling air through theTeflon inlet did not introduce temporary retention or loss of BrO, BrCl, or Br2. But ex-periments conducted after the field campaign showed that HOBr readily converts toBr2 on the aircraft inlets used here. This conversion is similar to the efficient uptake ofHOBr onto salt solutions (Fickert et al., 1999) and other surfaces (Mochida et al., 1998)20
that have been shown to produce gas phase Br2.The conversion of HOBr to Br2 is quantified by synthesizing and measuring HOBr
and studying its behavior on inlet surfaces. Gas phase HOBr is produced by liberatingHOBr formed in solution by Br2 hydrolysis (Eigen and Kustin, 1962) in the reaction
Br2+H2O⇔HOBr+Br−+H+ . (R2)25
Br2 hydrolysis is performed by flowing 4 sccm humidified N2 and 0.2 ppmv Br2 in3837
ACPD10, 3827–3860, 2010
Brominemeasurements over
the Arctic Ocean
J. A. Neuman et al.
Title Page
Abstract Introduction
Conclusions References
Tables Figures
J I
J I
Back Close
Full Screen / Esc
Printer-friendly Version
Interactive Discussion
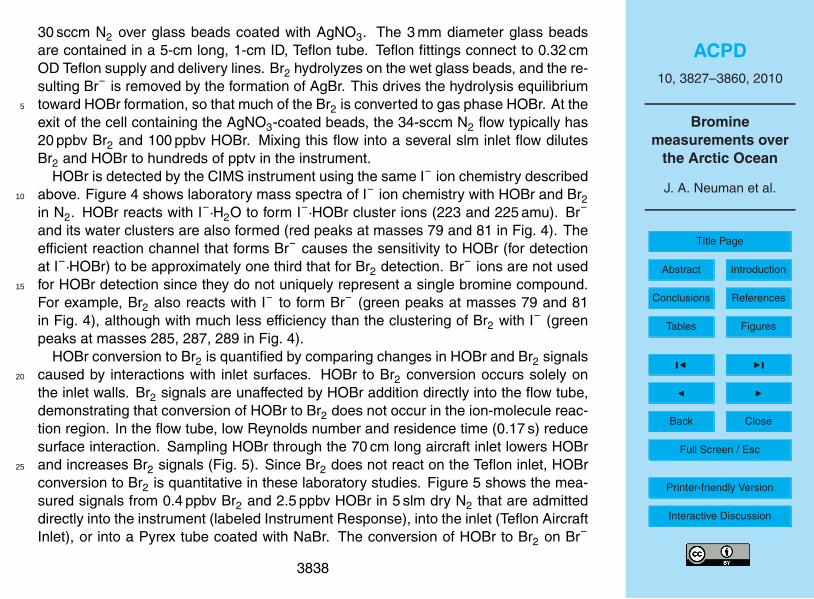
30 sccm N2 over glass beads coated with AgNO3. The 3 mm diameter glass beadsare contained in a 5-cm long, 1-cm ID, Teflon tube. Teflon fittings connect to 0.32 cmOD Teflon supply and delivery lines. Br2 hydrolyzes on the wet glass beads, and the re-sulting Br− is removed by the formation of AgBr. This drives the hydrolysis equilibriumtoward HOBr formation, so that much of the Br2 is converted to gas phase HOBr. At the5
exit of the cell containing the AgNO3-coated beads, the 34-sccm N2 flow typically has20 ppbv Br2 and 100 ppbv HOBr. Mixing this flow into a several slm inlet flow dilutesBr2 and HOBr to hundreds of pptv in the instrument.
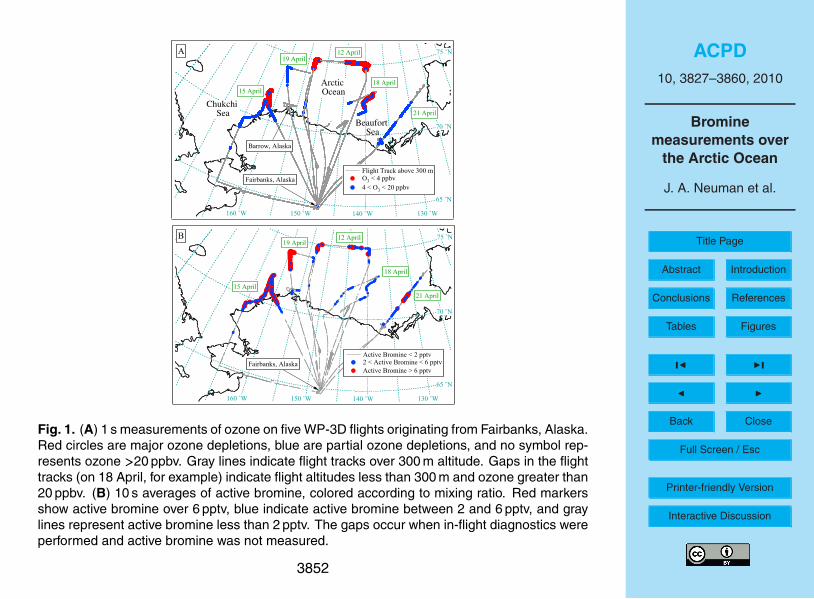
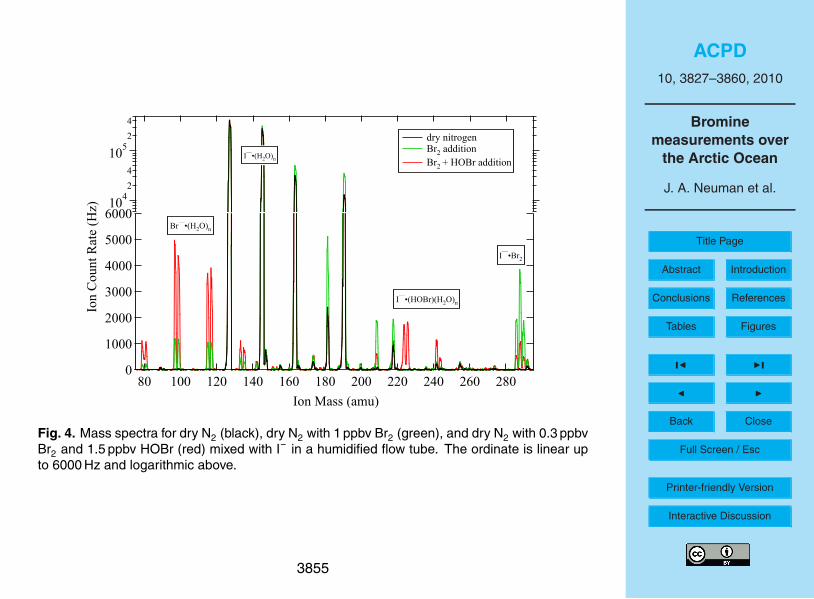
HOBr is detected by the CIMS instrument using the same I− ion chemistry describedabove. Figure 4 shows laboratory mass spectra of I− ion chemistry with HOBr and Br210
in N2. HOBr reacts with I−·H2O to form I−·HOBr cluster ions (223 and 225 amu). Br−
and its water clusters are also formed (red peaks at masses 79 and 81 in Fig. 4). Theefficient reaction channel that forms Br− causes the sensitivity to HOBr (for detectionat I−·HOBr) to be approximately one third that for Br2 detection. Br− ions are not usedfor HOBr detection since they do not uniquely represent a single bromine compound.15
For example, Br2 also reacts with I− to form Br− (green peaks at masses 79 and 81in Fig. 4), although with much less efficiency than the clustering of Br2 with I− (greenpeaks at masses 285, 287, 289 in Fig. 4).
HOBr conversion to Br2 is quantified by comparing changes in HOBr and Br2 signalscaused by interactions with inlet surfaces. HOBr to Br2 conversion occurs solely on20
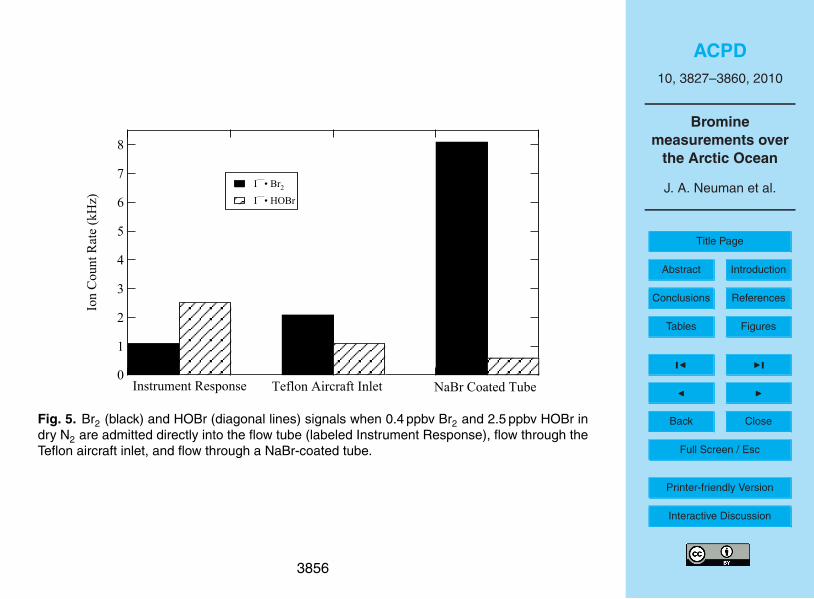
the inlet walls. Br2 signals are unaffected by HOBr addition directly into the flow tube,demonstrating that conversion of HOBr to Br2 does not occur in the ion-molecule reac-tion region. In the flow tube, low Reynolds number and residence time (0.17 s) reducesurface interaction. Sampling HOBr through the 70 cm long aircraft inlet lowers HOBrand increases Br2 signals (Fig. 5). Since Br2 does not react on the Teflon inlet, HOBr25
conversion to Br2 is quantitative in these laboratory studies. Figure 5 shows the mea-sured signals from 0.4 ppbv Br2 and 2.5 ppbv HOBr in 5 slm dry N2 that are admitteddirectly into the instrument (labeled Instrument Response), into the inlet (Teflon AircraftInlet), or into a Pyrex tube coated with NaBr. The conversion of HOBr to Br2 on Br−
3838
ACPD10, 3827–3860, 2010
Brominemeasurements over
the Arctic Ocean
J. A. Neuman et al.
Title Page
Abstract Introduction
Conclusions References
Tables Figures
J I
J I
Back Close
Full Screen / Esc
Printer-friendly Version
Interactive Discussion
coated surfaces is five times more efficient than conversion on the Teflon aircraft inlet(Fig. 5). On other materials, including glass, aluminum, stainless steel, polyvinylidenefluoride (PVDF), and several other types of Teflon, HOBr converts to Br2 with equal orgreater efficiency than with PFA Teflon. On nylon, however, HOBr is removed withoutsubstantial Br2 production.5
Since HOBr is converted to Br2 on the aircraft inlet, Br2 signals at the detector rep-resent a sum of atmospheric Br2 and HOBr. Conversion efficiency is enhanced bywall contact, which is not quantified for all flight conditions. Furthermore, conversionof HOBr to Br2 increases dramatically on bromide-coated surfaces, yet the extent towhich the aircraft inlets were bromide-coated is not known. Therefore, HOBr to Br210
conversion efficiency is uncertain but no greater than unity. Consequently, Br2 signalsrepresent a lower limit of the sum of atmospheric HOBr+Br2, which is called activebromine below.
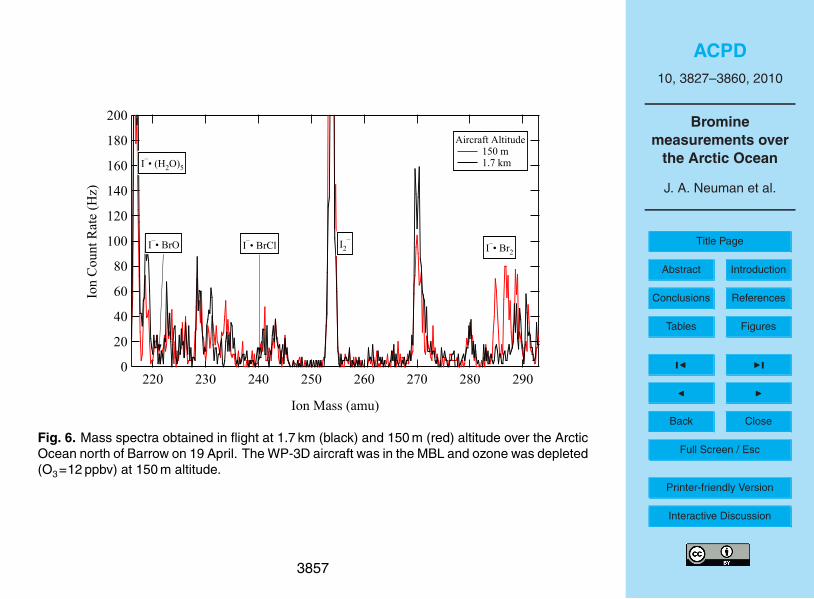
In-flight diagnostics performed by the WP-3D I− CIMS include mass scans from 215–295 amu once every 90 min. These were performed to assess mass spectrometer and15
ion chemistry stability, interferences from other compounds, and possible detection ofother molecules. As an example, Fig. 6 shows mass spectra obtained over the ArcticOcean north of Barrow on 12 April. Ozone mixing ratios were 12 ppbv at 150 m altitudeand 50 ppbv at 1.7 km. In the ozone-depleted air, I−·Br2 ions were elevated, but clustersof I− with BrO, HOBr, and BrCl were not elevated above detection limits. The similarity20
of all spectra, absence of interferences near the product ion masses used for brominedetection, and unique isotopic signature of Br demonstrate that bromine was enhancedin ozone-depleted air and was detected as Br2.
The two CIMS instruments that used SF−6 chemistry recorded similarly large Br2
signals. The Br2 measurements from the two CIMS instruments on the WP-3D were25
in quantitative agreement. Both instruments use the same calibration sources, so thecorrelation slopes between the two measurements do not reveal absolute accuracy. Buthigh correlation coefficients (e.g., r=0.86 on 19 April) indicate that elevated Br2 signalsare not artifacts of one instrument’s ion chemistry or scrubbing materials. Thus, either
3839
ACPD10, 3827–3860, 2010
Brominemeasurements over
the Arctic Ocean
J. A. Neuman et al.
Title Page
Abstract Introduction
Conclusions References
Tables Figures
J I
J I
Back Close
Full Screen / Esc
Printer-friendly Version
Interactive Discussion
atmospheric Br2 or conversion of HOBr to Br2 on the inlets of both CIMS instrumentscaused the elevated Br2 signals (called active bromine here).
3 Results
3.1 Ozone depletion
Ozone depletion is identified and categorized by comparing ozone mixing ratios in the5
MBL to values in the lower free troposphere, where ozone was never substantiallydepleted and variability was low. For example, between 1 and 2 km altitude on the fivearctic WP-3D flights, average ozone mixing ratios were 54±9 ppbv, with a 33–73 ppbvrange. In the MBL, ozone was often considerably lower than these free troposphericlevels. Major ozone depletion (O3<4 ppbv, as defined in the work of Ridley et al., 2003)10
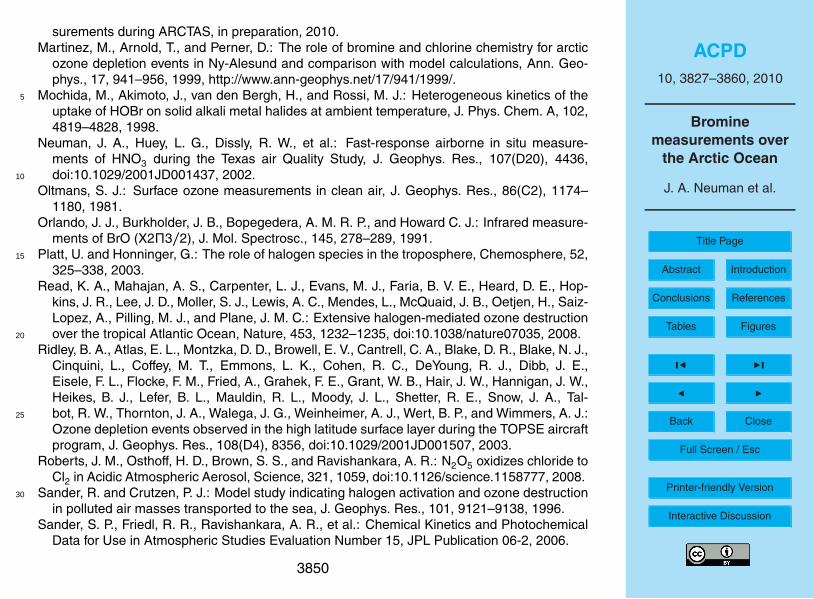
was encountered on three WP-3D flights: 12 April, 15 April, and 18 April, for 71, 25,and 13 min, respectively. Partial ozone depletion (4<O3<20 ppbv) was measured onall 5 arctic WP-3D flights, for a total of 10–67 min on each flight. In total, major ozonedepletions were sampled for 1.8 h, and partial ozone depletions were sampled for 2.7 h.The map showing the five WP-3D aircraft flights that sampled the arctic boundary layer15
illustrates the location of ozone-depleted air (Fig. 1). Ozone was usually depleted atlow altitudes over the Arctic Ocean. The exception was on 18 April, when ozone wasnot depleted in the MBL (indicated by the gaps along the flight track in Fig. 1). Uniqueto this flight, winds were predominately from land to the south, and ozone-rich air wasadvected over the ocean. Similarly, ozone-depleted air was sometimes transported20
inland when winds were from the north, as shown by the colored markers over land on15 April. Above 300 m altitude ozone was nearly always greater than 30 ppbv.
Observations from the DC-8 were similar. Ozone-depleted air was encountered inthe MBL on six of the seven DC-8 flights in the arctic, with major ozone depletionssampled on 3 flights. In total, the DC-8 sampled major ozone depletions for 0.7 h25
and partial ozone depletions for 1.2 h. The DC-8 measurements also show that ozone
3840
ACPD10, 3827–3860, 2010
Brominemeasurements over
the Arctic Ocean
J. A. Neuman et al.
Title Page
Abstract Introduction
Conclusions References
Tables Figures
J I
J I
Back Close
Full Screen / Esc
Printer-friendly Version
Interactive Discussion
depletion (O3<20 ppbv) was confined to the MBL. On all seven flights in the arctic,ozone was always greater than 33 ppbv above 1 km altitude.
Ozone depletion is identified here only when ozone was less than 20 ppbv. However,both aircraft regularly observed ozone levels both in and above the MBL that were be-tween 20–40 ppbv and lower than the average lower tropospheric values. These slight5
reductions in ozone mixing ratios, which are not analyzed here, also may have beencaused by bromine chemistry, followed by transport and dilution of ozone-depleted air.In the MBL, extremely low ozone values were occasionally observed. Both the DC-8and WP-3D measured O3<1 ppbv on two flights and O3<0.1 ppbv on one flight.
3.2 Bromine distributions and speciation10
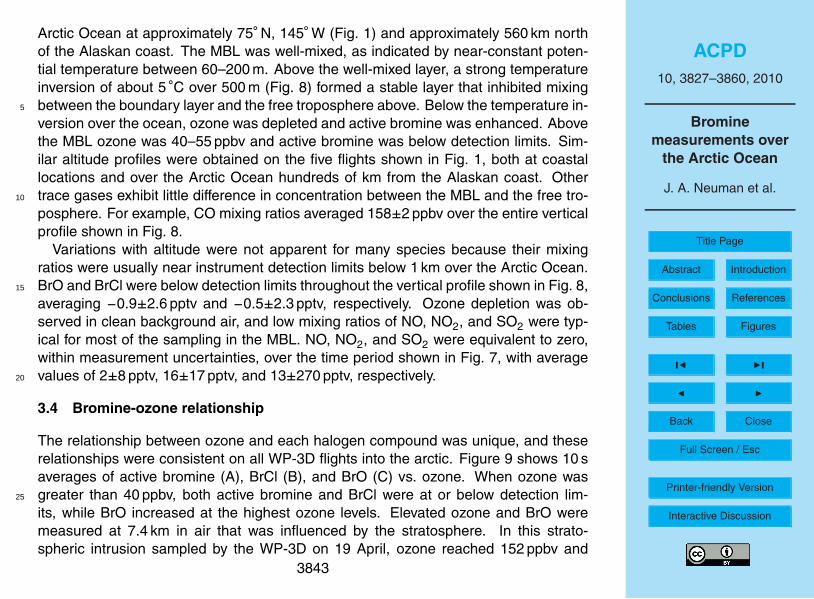
The compounds and reactions involved in ozone depletion chemistry are investigatedwith speciated bromine measurements. Active bromine, which represents a lower limitof the sum HOBr+Br2, was consistently enhanced in the MBL when ozone was de-pleted (Fig. 1). Active bromine measured along the WP-3D flight tracks (Fig. 1b) wasco-located with ozone-depleted air (Fig. 1a). BrO measured from the WP-3D aircraft15
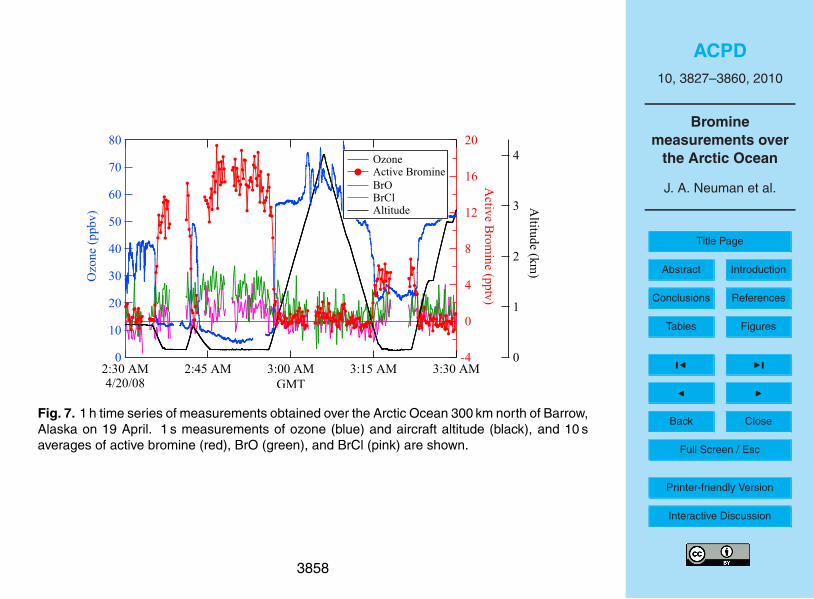
was usually less than active bromine, and BrCl levels were typically less than the 2-pptv detection limit (Fig. 7). Above 300 m altitude (gray lines in Fig. 1a), active brominewas below the 2-pptv detection limit (gray lines in Fig. 1b) indicating little transport ofactive bromine out of the MBL.
The relationship between active bromine and photolysis rates is examined to assess20
the relative contribution of Br2 and HOBr to active bromine. Br2 and BrO photolysisrates calculated from actinic flux measurements varied from 0.02/s to 0.06/s, whileHOBr photolysis rates were approximately 30 times slower (e.g., Lehrer et al., 2004;Martinez et al., 1999). Models show that rapid Br2 photolysis should restrict daytimeBr2 to the bottom few cm of the atmosphere (Lehrer et al., 2004). Since Br recombina-25
tion or BrO self reaction that forms Br2 is slow compared to photolysis, Br2 is predictedto be elevated only in close proximity to its surface source. Since the time requiredfor air to travel from the surface to aircraft altitudes (∼100 m) is many Br2 photolysis
3841
ACPD10, 3827–3860, 2010
Brominemeasurements over
the Arctic Ocean
J. A. Neuman et al.
Title Page
Abstract Introduction
Conclusions References
Tables Figures
J I
J I
Back Close
Full Screen / Esc
Printer-friendly Version
Interactive Discussion
lifetimes, atmospheric Br2 should be near zero in these daytime aircraft measurements.And if Br2 were elevated, its abundance ought to depend upon the large Br2 photolysisrate, jBr2
, which varied with latitude, time, cloud cover, and surface albedo. For exam-ple, the aircraft flew over open ocean leads in the ice, which had much lower albedothan arctic ice. The reduction in reflected light over the leads caused rapid and large5
(>30%) reductions in jBr2that should alter Br2 mixing ratios. However, active bromine
did not vary with jBr2, suggesting that there was little contribution from Br2 to active
bromine. Therefore, the measured active bromine is likely HOBr.Bromine measurements from the DC-8 show similar distributions and enhance-
ments. In ozone-depleted air sampled in the MBL over the Arctic Ocean, active10
bromine, BrO, and soluble bromide were elevated. BrO levels (typically <10 pptv) werelow compared to soluble bromide, which ranged from 10–40 pptv. Although severalcompounds could be responsible for the measured soluble bromide, both the activebromine and soluble bromide observations are consistent with the presence of HOBrin ozone-depleted air.15
3.3 Vertical distributions
Altitude profiles further illustrate the confinement of ozone depletion and bromine en-hancement to the MBL. The WP-3D measurements shown in Fig. 7 illustrate that allbromine compounds were zero, within measurement uncertainty, just above the MBL.Very steep gradients in both ozone and active bromine occurred at the MBL top. For20
example, active bromine dropped from tens of pptv to zero and ozone increased fromless than 10 ppbv to 40 ppbv between the MBL and above 600 m altitude (at 02:42 andbefore 02:35 in Fig. 7). The DC-8 also measured elevated active bromine in the MBLand values below detection limit above.
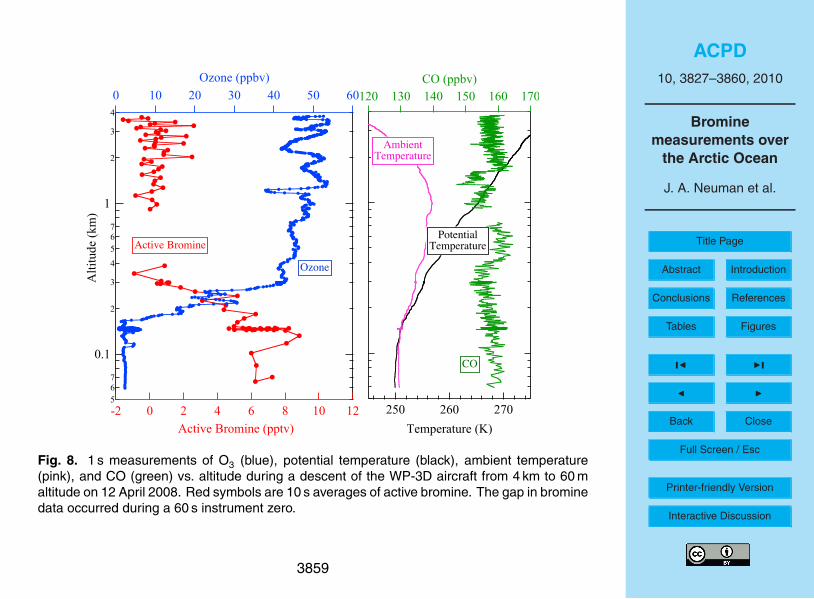
Boundary layer meteorology plays an important role in determining the vertical extent25
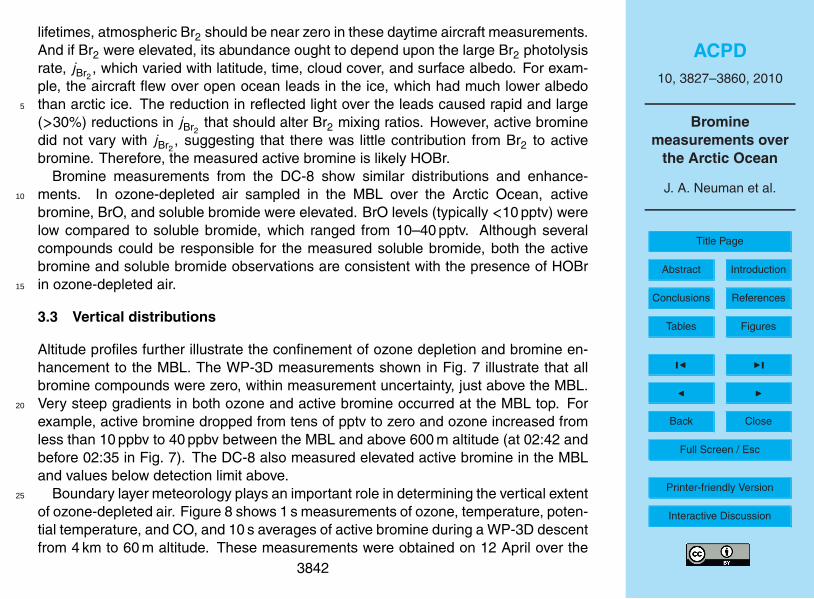
of ozone-depleted air. Figure 8 shows 1 s measurements of ozone, temperature, poten-tial temperature, and CO, and 10 s averages of active bromine during a WP-3D descentfrom 4 km to 60 m altitude. These measurements were obtained on 12 April over the
3842
ACPD10, 3827–3860, 2010
Brominemeasurements over
the Arctic Ocean
J. A. Neuman et al.
Title Page
Abstract Introduction
Conclusions References
Tables Figures
J I
J I
Back Close
Full Screen / Esc
Printer-friendly Version
Interactive Discussion
Arctic Ocean at approximately 75◦ N, 145◦ W (Fig. 1) and approximately 560 km northof the Alaskan coast. The MBL was well-mixed, as indicated by near-constant poten-tial temperature between 60–200 m. Above the well-mixed layer, a strong temperatureinversion of about 5 ◦C over 500 m (Fig. 8) formed a stable layer that inhibited mixingbetween the boundary layer and the free troposphere above. Below the temperature in-5
version over the ocean, ozone was depleted and active bromine was enhanced. Abovethe MBL ozone was 40–55 ppbv and active bromine was below detection limits. Sim-ilar altitude profiles were obtained on the five flights shown in Fig. 1, both at coastallocations and over the Arctic Ocean hundreds of km from the Alaskan coast. Othertrace gases exhibit little difference in concentration between the MBL and the free tro-10
posphere. For example, CO mixing ratios averaged 158±2 ppbv over the entire verticalprofile shown in Fig. 8.
Variations with altitude were not apparent for many species because their mixingratios were usually near instrument detection limits below 1 km over the Arctic Ocean.BrO and BrCl were below detection limits throughout the vertical profile shown in Fig. 8,15
averaging −0.9±2.6 pptv and −0.5±2.3 pptv, respectively. Ozone depletion was ob-served in clean background air, and low mixing ratios of NO, NO2, and SO2 were typ-ical for most of the sampling in the MBL. NO, NO2, and SO2 were equivalent to zero,within measurement uncertainties, over the time period shown in Fig. 7, with averagevalues of 2±8 pptv, 16±17 pptv, and 13±270 pptv, respectively.20
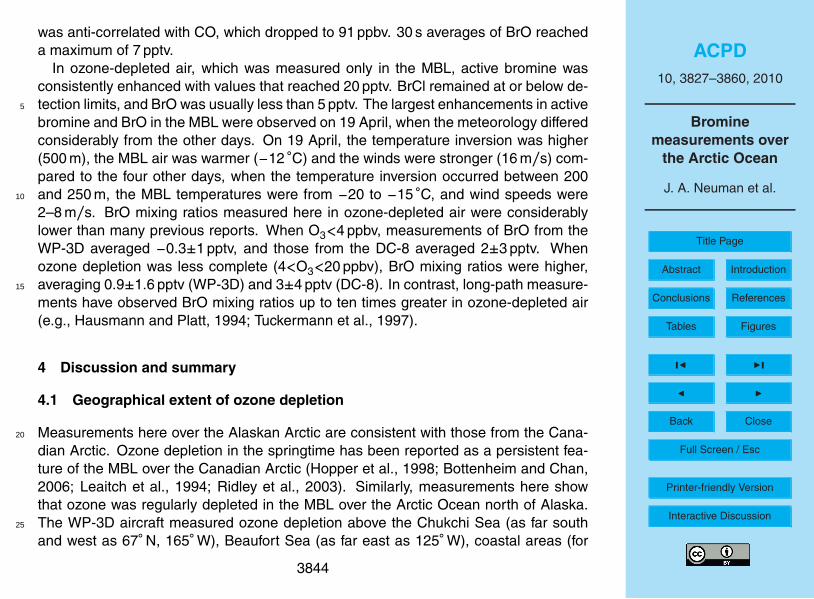
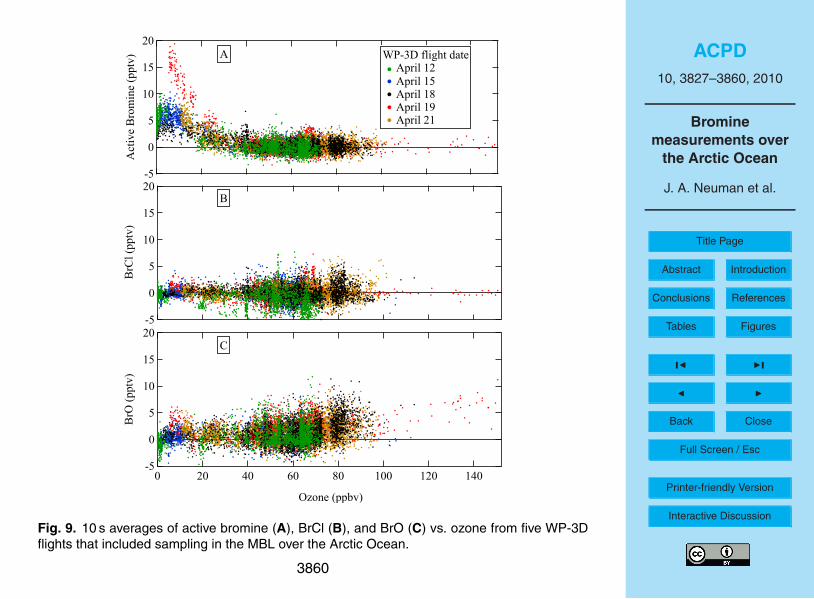
3.4 Bromine-ozone relationship
The relationship between ozone and each halogen compound was unique, and theserelationships were consistent on all WP-3D flights into the arctic. Figure 9 shows 10 saverages of active bromine (A), BrCl (B), and BrO (C) vs. ozone. When ozone wasgreater than 40 ppbv, both active bromine and BrCl were at or below detection lim-25
its, while BrO increased at the highest ozone levels. Elevated ozone and BrO weremeasured at 7.4 km in air that was influenced by the stratosphere. In this strato-spheric intrusion sampled by the WP-3D on 19 April, ozone reached 152 ppbv and
3843
ACPD10, 3827–3860, 2010
Brominemeasurements over
the Arctic Ocean
J. A. Neuman et al.
Title Page
Abstract Introduction
Conclusions References
Tables Figures
J I
J I
Back Close
Full Screen / Esc
Printer-friendly Version
Interactive Discussion
was anti-correlated with CO, which dropped to 91 ppbv. 30 s averages of BrO reacheda maximum of 7 pptv.
In ozone-depleted air, which was measured only in the MBL, active bromine wasconsistently enhanced with values that reached 20 pptv. BrCl remained at or below de-tection limits, and BrO was usually less than 5 pptv. The largest enhancements in active5
bromine and BrO in the MBL were observed on 19 April, when the meteorology differedconsiderably from the other days. On 19 April, the temperature inversion was higher(500 m), the MBL air was warmer (−12 ◦C) and the winds were stronger (16 m/s) com-pared to the four other days, when the temperature inversion occurred between 200and 250 m, the MBL temperatures were from −20 to −15 ◦C, and wind speeds were10
2–8 m/s. BrO mixing ratios measured here in ozone-depleted air were considerablylower than many previous reports. When O3<4 ppbv, measurements of BrO from theWP-3D averaged −0.3±1 pptv, and those from the DC-8 averaged 2±3 pptv. Whenozone depletion was less complete (4<O3<20 ppbv), BrO mixing ratios were higher,averaging 0.9±1.6 pptv (WP-3D) and 3±4 pptv (DC-8). In contrast, long-path measure-15
ments have observed BrO mixing ratios up to ten times greater in ozone-depleted air(e.g., Hausmann and Platt, 1994; Tuckermann et al., 1997).
4 Discussion and summary
4.1 Geographical extent of ozone depletion
Measurements here over the Alaskan Arctic are consistent with those from the Cana-20
dian Arctic. Ozone depletion in the springtime has been reported as a persistent fea-ture of the MBL over the Canadian Arctic (Hopper et al., 1998; Bottenheim and Chan,2006; Leaitch et al., 1994; Ridley et al., 2003). Similarly, measurements here showthat ozone was regularly depleted in the MBL over the Arctic Ocean north of Alaska.The WP-3D aircraft measured ozone depletion above the Chukchi Sea (as far south25
and west as 67◦ N, 165◦ W), Beaufort Sea (as far east as 125◦ W), coastal areas (for
3844
ACPD10, 3827–3860, 2010
Brominemeasurements over
the Arctic Ocean
J. A. Neuman et al.
Title Page
Abstract Introduction
Conclusions References
Tables Figures
J I
J I
Back Close
Full Screen / Esc
Printer-friendly Version
Interactive Discussion
example, 71◦ N, 151◦ W near Barrow, Alaska), and hundreds of km from land (as far as75◦ N, north of the Alaskan Coast). In all of these cases, ozone depletion was confinedto the lower few hundred meters of the atmosphere in the MBL. Ozone depletion wasobserved in air masses with temperatures that ranged from −22 ◦C to −10 ◦C, suggest-ing that ozone depletion can occur over a wide range of temperatures, as has been5
noted previously (Simpson et al., 2007; Bottenheim et al., 2009).
4.2 HOBr and Br2 measurements
This study might lead to new speciated measurements of inorganic bromine and as-sist with the interpretation of previous reports of photochemically active bromine com-pounds. HOBr is shown to convert rapidly to Br2 on many types of Teflon, glass, and10
metal, even without bromide coatings applied to the materials’ surfaces. Sampling airwithout introducing wall contact eliminates this reaction, although this is not always fea-sible. Alternatively, rapid conversion can be exploited to quantitatively convert all HOBrto Br2 by sampling air through a bromide-coated inlet to measure the sum HOBr+Br2.And Br2 can be measured independently by sampling air through a nylon wool filter,15
since HOBr is removed on nylon, but Br2 is not. From these two measurements, HOBrcan be determined from the difference between (HOBr+Br2) and Br2.
HOBr conversion on instrument surfaces may have contributed to previous observa-tions of Br2. For example, up to 27 pptv of Br2 was observed after sunrise in ozone-depleted air by a CIMS technique that sampled a large gas flow through a 9 m long20
Teflon inlet (Foster et al., 2001). If HOBr were present in the atmosphere and the sam-pled air contacted the inlet walls, HOBr conversion likely contributed to the Br2 signal.Similarly, measurements of HOBr and Br2 using glass cells (Impey et al., 1999) alsomay have been affected by the conversion of HOBr to Br2 on surfaces.
3845
ACPD10, 3827–3860, 2010
Brominemeasurements over
the Arctic Ocean
J. A. Neuman et al.
Title Page
Abstract Introduction
Conclusions References
Tables Figures
J I
J I
Back Close
Full Screen / Esc
Printer-friendly Version
Interactive Discussion
4.3 Bromine chemistry
Several inorganic bromine compounds participate in chemical reactions that lead toozone depletion in the springtime over the Arctic Ocean, and several of those com-pounds were observed here. Previous observations of BrO and total bromine in ozone-depleted air show that BrO accounts for a widely varying fraction of total bromine (Mar-5
tinez et al., 1999; Hausmann and Platt, 1994). But speciated measurements of in-organic bromine other than BrO are sparse (Barrie et al., 1994; Impey et al., 1999;Foster et al., 2001), and the relative contribution of each bromine compound to totalbromine is not certain. HOBr is often comparable to or larger than BrO during the day-time measurements reported here, assuming that the measured active bromine is only10
HOBr. The predominance of HOBr over Br2 is consistent with previous measurements(Impey et al., 1999), and HOBr has been predicted to be more abundant than BrO inozone depleted air (Martinez et al., 1999). However, the BrO mixing ratios measuredhere (typically a few pptv in ozone-depleted air) from three different aircraft CIMS in-struments were much lower than the tens of pptv that has been observed previously15
from ground-based instruments. The causes for low BrO values have not been deter-mined, but several factors may explain these results. If BrO were confined to the lowestaltitudes of the MBL, these aircraft observations at approximately 100 m altitude mayhave been above regions with enhanced BrO. Low BrO could be caused by losses oninlets exposed to ambient air, although BrO losses on Teflon inlets were measured to20
be insignificant in the laboratory. Lastly, the weak correlation between ozone and BrO(Hausmann and Platt, 1994) and BrO variations between 0–30 pptv in ozone-depletedair (Tuckermann et al., 1997) make it possible that these few aircraft flights may havesampled only those ozone depletions with low BrO. However, the observed increasesin active bromine indicates the presence of bromine chemistry in the sampled ozone-25
depleted air masses, where both BrO and HOBr are predicted to be enhanced (e.g.,Martinez et al., 1999; Evans et al., 2003; Calvert and Lindberg, 2003; Lehrer et al.,2004).
3846
ACPD10, 3827–3860, 2010
Brominemeasurements over
the Arctic Ocean
J. A. Neuman et al.
Title Page
Abstract Introduction
Conclusions References
Tables Figures
J I
J I
Back Close
Full Screen / Esc
Printer-friendly Version
Interactive Discussion
Bromine partitioning between HBr, BrO, and HOBr may reveal whether ozone deple-tion has terminated or is still occurring in a sampled air mass. Several models exam-ined the temporal behavior of halogen-initiated ozone depletion and show HBr, BrO,and HOBr enhancements of many pptv during daytime in ozone-depleted air (Martinezet al., 1999; Calvert and Lindberg, 2003; Evans et al., 2003; Fan and Jacob, 1992;5
Shepson et al., 1996; Lehrer et al., 2004), with relative abundances that vary with theduration of ozone depletion chemistry. Bromine accumulates as HBr when ozone de-pletion has terminated (Lehrer et al., 2004; Martinez et al., 1999), and the presenceof HOBr may indicate that ozone depletion chemistry is still in progress. Improvedmeasurements of these halogen compounds as suggested above might allow for iden-10
tification and better characterization of halogen chemistry that depletes ozone.
Acknowledgement. The Air Quality and the Climate Research and Modeling Programs of theNational Oceanic and Atmospheric Administration (NOAA) supported the WP-3D measure-ments. We are grateful to Hendrik Fuchs for measuring Br2 to calibrate the permeation devicesand Chuck Brock for helpful discussions. The NASA Tropospheric Chemistry Program sup-15
ported the DC-8 measurements.
References
Barrie, L. A., Bottenheim, J. W., Schnell, R. C., Crutzen P. J., and Rasmussen, R. A.: Ozonedestruction and photochemical reactions at polar sunrise in the lower Arctic atmosphere,Nature, 334, 138–141, 1988.20
Barrie, L. A., Li, S.-M., Toom, D. L., Landsberger, S., and Sturges, W.: Lower troposphericmeasurements of halogens, nitrates and sulphur oxides during Polar Sunrise Experiment1992, J. Geophys. Res., 99, 25453–25467, 1994.
Bottenheim, J. W. and Chan, E.: A trajectory study into the origin of spring time Arctic boundarylayer ozone depletion, J. Geophys. Res., 111, D19301, doi:10.129/2006JD007055, 2006.25
Bottenheim, J. W., Netcheva, S., Morin, S., and Nghiem, S. V.: Ozone in the boundary layer airover the Arctic Ocean: measurements during the TARA transpolar drift 2006–2008, Atmos.Chem. Phys., 9, 4545–4557, 2009, http://www.atmos-chem-phys.net/9/4545/2009/.
3847
ACPD10, 3827–3860, 2010
Brominemeasurements over
the Arctic Ocean
J. A. Neuman et al.
Title Page
Abstract Introduction
Conclusions References
Tables Figures
J I
J I
Back Close
Full Screen / Esc
Printer-friendly Version
Interactive Discussion
Brock, C., Cozic, J., Bahreini, R., Brioude, J., de Gouw, J. A., Fahey, D. W., Ferrare, R., Froyd, K.D., Holloway, J. S., Hbler, G., Lack, D., Lance, S., Middlebrook, A. M., Montzka, S. A., Murphy,D. M., Neuman, J. A., Nowak, J., Peischl, J., Ryerson, T. B., Schwarz, J. P., Sodemann, H.,Spackman, R., Stohl, A., Veres P., and Warneke C.: Arctic Aerosol Properties Measured inSpring 2008 During the Aerosol, Radiation, and Cloud Processes Affecting Arctic Climate5
(ARCPAC) Project, in preparation, 2010.Calvert, J. G. and Lindberg, S. E.: A modeling study of the mechanism of the halogen-ozone-
mercury homogeneous reactions in the troposphere during the polar spring, Atmos. Environ.,37, 4467–4481, 2003.
Dibb, J. E., Ziemba, L. D., Luxford, J., and Beckman, P.: Bromide and Other Ions in the Snow,10
Firn Air, and Atmospheric Boundary Layer at Summit during GSHOX, in preparation, 2010.Donohoue, D. L., Bauer, D., Cossairt, B., and Hynes, A. J.: Temperature and pressure depen-
dent rate coefficients for the reaction of Hg with Br and the reaction of Br with Br: a pulsedlaser photolysis-pulsed laser induced fluorescence study, J. Phys. Chem. A, 110, 6623–6632, 2006.15
Eigen, M. and Kustin, K.: The kinetics of halogen hydrolysis, J. Am. Chem. Soc., 84(8), 1355–1361, doi:10.1021/ja00867a005, 1962.
Evans, M. J., Jacob, D. J., Atlas, E., Cantrell, C. A., Eisele, F., Flocke, F., Fried, A.,Mauldin, R. L., Ridley, B. A., Wert, B., Talbot, R., Blake, D., Heikes, B., Snow, J., Walega, J.,Weinheimer, A. J., and Dibb, J.: Coupled evolution of BrOx-ClOx-HOx-NOx chemistry during20
bromine-catalyzed ozone depletion events in the arctic boundary layer, J. Geophys. Res.,108(D4), 8368, doi:10.1029/2002JD002732, 2003.
Fan, S.-M. and Jacob, D. J.: Surface ozone depletion in Arctic spring sustained by brominereactions on aerosols, Nature, 359, 522–524, 1992.
Fickert, S., Adams, J. W., and Crowley, J. N.: Activation of Br2 and BrCl via uptake of HOBr25
onto aqueous salt solutions, J. Geophys. Res., 104, 23719–23727, 1999.Foster, K. L., Plastridge, R. A., Bottenheim, J. W., Shepson, P. B., Finlayson-Pitts, B. J., and
Spicer, C. W.: The role of Br2 and BrCl in surface ozone destruction at polar sunrise, Science,291, 471–474, 2001.
Hausmann, M. and Platt, U.: Spectroscopic measurement of bromine monoxide and ozone in30
the high Arctic during Polar Sunrise Experiment 1992, J. Geophys. Res., 99, 25399–25413,1994.
Hopper, J. F., Barrie, L. A., Silis, A., Hart, W., Gallant, A. J., and Dryfhout, H.: Ozone and
3848
ACPD10, 3827–3860, 2010
Brominemeasurements over
the Arctic Ocean
J. A. Neuman et al.
Title Page
Abstract Introduction
Conclusions References
Tables Figures
J I
J I
Back Close
Full Screen / Esc
Printer-friendly Version
Interactive Discussion
meteorology during the 1994 Polar Sunrise Experiment, J. Geophys. Res., 103, 1481–1492,1998.
Huey, L. G.: Measurement of trace atmospheric species by chemical ionization mass spec-trometry: Speciation of reactive nitrogen and future directions, Mass Spectrom. Rev., 26,166–184, 2007.5
Huey, L. G., Hanson, D. R., and Howard, C. J.: Reactions of SF−6 and I− with atmospheric trace
gases, J. Phys. Chem., 99(14), 5001–5008, 1995.Impey, G. A., Mihele, C. M., Anlauf, K. G., Barrie, L. A., Hastie, D. R., and Shepson, P. B.:
Measurements of photolyzable halogen compounds and bromine radicals during the PolarSunrise Experiment 1997, J. Atmos. Chem., 34, 21–37, 1999.10
Jacob, D. J., Crawford, J. H., Maring, H., Clarke, A. D., Dibb, J. E., Ferrare, R. A.,Hostetler, C. A., Russell, P. B., Singh, H. B., Thompson, A. M., Shaw, G. E., McCauley, E.,Pederson, J. R., and Fisher, J. A.: The ARCTAS aircraft mission: design and execution, At-mos. Chem. Phys. Discuss., 9, 17073–17123, 2009,http://www.atmos-chem-phys-discuss.net/9/17073/2009/.15
Jobson, B. T., Niki, H., Yokouchi, Y., Bottenheim, J., Hopper, F., and Leaitch, R.: Measurementsof C2–C6 hydrocarbons during the Polar Sunrise 1992 Experiment: Evidence for Cl atomand Br atom chemistry, J. Geophys. Res., 99(D12), 25355–25368, 1994.
Keil, A. D. and Shepson, P. B.: Chlorine and bromine atom ratios in the springtime Arctic tro-posphere as determined from measurements of halogenated volatile organic compounds,20
J. Geophys. Res., 111, D17303, doi:10.129/2006JD007119, 2006.Kim, S., Huey, L. G., Stickel, R. E., Tanner, D. J., Crawford, J. H., Olson, J. R., Chen, G.,
Brune, W. H., Ren, X., Lesher, R., Wooldridge, P. J., Bertram, T. H., Perring, A., Cohen, R. C.,Lefer, B. L., Shetter, R. E., Avery, M., Diskin, G., and Sokolik, I.: Measurement of HO2NO2in the free troposphere during the Intercontinental Chemical Transport Experiment–North25
America, J. Geophys. Res., 112, D12S01, doi:10.1029/2006JD007676, 2007.Leaitch, W. R., Barrie, L. A., Bottenheim, J. W., Li, S. M., Shepson, P. B., Muthuramu, K., and
Yokouchi, Y.: Airborne observations related to ozone depletion at polar sunrise, J. Geophys.Res., 99, 25499–25517, 1994.
Lehrer, E., Honninger, G., and Platt, U.: A one dimensional model study of the mechanism of30
halogen liberation and vertical transport in the polar troposphere, Atmos. Chem. Phys., 4,2427–2440, 2004, http://www.atmos-chem-phys.net/4/2427/2004/.
Liao, J., Huey, L. G., Scheuer, E., and Dibb, J. E.: Characterization of soluble bromide mea-
3849
ACPD10, 3827–3860, 2010
Brominemeasurements over
the Arctic Ocean
J. A. Neuman et al.
Title Page
Abstract Introduction
Conclusions References
Tables Figures
J I
J I
Back Close
Full Screen / Esc
Printer-friendly Version
Interactive Discussion
surements during ARCTAS, in preparation, 2010.Martinez, M., Arnold, T., and Perner, D.: The role of bromine and chlorine chemistry for arctic
ozone depletion events in Ny-Alesund and comparison with model calculations, Ann. Geo-phys., 17, 941–956, 1999, http://www.ann-geophys.net/17/941/1999/.
Mochida, M., Akimoto, J., van den Bergh, H., and Rossi, M. J.: Heterogeneous kinetics of the5
uptake of HOBr on solid alkali metal halides at ambient temperature, J. Phys. Chem. A, 102,4819–4828, 1998.
Neuman, J. A., Huey, L. G., Dissly, R. W., et al.: Fast-response airborne in situ measure-ments of HNO3 during the Texas air Quality Study, J. Geophys. Res., 107(D20), 4436,doi:10.1029/2001JD001437, 2002.10
Oltmans, S. J.: Surface ozone measurements in clean air, J. Geophys. Res., 86(C2), 1174–1180, 1981.
Orlando, J. J., Burkholder, J. B., Bopegedera, A. M. R. P., and Howard C. J.: Infrared measure-ments of BrO (X2Π3/2), J. Mol. Spectrosc., 145, 278–289, 1991.
Platt, U. and Honninger, G.: The role of halogen species in the troposphere, Chemosphere, 52,15
325–338, 2003.Read, K. A., Mahajan, A. S., Carpenter, L. J., Evans, M. J., Faria, B. V. E., Heard, D. E., Hop-
kins, J. R., Lee, J. D., Moller, S. J., Lewis, A. C., Mendes, L., McQuaid, J. B., Oetjen, H., Saiz-Lopez, A., Pilling, M. J., and Plane, J. M. C.: Extensive halogen-mediated ozone destructionover the tropical Atlantic Ocean, Nature, 453, 1232–1235, doi:10.1038/nature07035, 2008.20
Ridley, B. A., Atlas, E. L., Montzka, D. D., Browell, E. V., Cantrell, C. A., Blake, D. R., Blake, N. J.,Cinquini, L., Coffey, M. T., Emmons, L. K., Cohen, R. C., DeYoung, R. J., Dibb, J. E.,Eisele, F. L., Flocke, F. M., Fried, A., Grahek, F. E., Grant, W. B., Hair, J. W., Hannigan, J. W.,Heikes, B. J., Lefer, B. L., Mauldin, R. L., Moody, J. L., Shetter, R. E., Snow, J. A., Tal-bot, R. W., Thornton, J. A., Walega, J. G., Weinheimer, A. J., Wert, B. P., and Wimmers, A. J.:25
Ozone depletion events observed in the high latitude surface layer during the TOPSE aircraftprogram, J. Geophys. Res., 108(D4), 8356, doi:10.1029/2001JD001507, 2003.
Roberts, J. M., Osthoff, H. D., Brown, S. S., and Ravishankara, A. R.: N2O5 oxidizes chloride toCl2 in Acidic Atmospheric Aerosol, Science, 321, 1059, doi:10.1126/science.1158777, 2008.
Sander, R. and Crutzen, P. J.: Model study indicating halogen activation and ozone destruction30
in polluted air masses transported to the sea, J. Geophys. Res., 101, 9121–9138, 1996.Sander, S. P., Friedl, R. R., Ravishankara, A. R., et al.: Chemical Kinetics and Photochemical
Data for Use in Atmospheric Studies Evaluation Number 15, JPL Publication 06-2, 2006.
3850
ACPD10, 3827–3860, 2010
Brominemeasurements over
the Arctic Ocean
J. A. Neuman et al.
Title Page
Abstract Introduction
Conclusions References
Tables Figures
J I
J I
Back Close
Full Screen / Esc
Printer-friendly Version
Interactive Discussion
Shepson, P. B., Sirju, A.-P., Hopper, J. F., Barrie, L. A., Young, V., Niki, H., and Dryfhout H.:Sources and sinks of carbonyl compounds in the Arctic Ocean boundary layer: Polar IceFloe Experiment, J. Geophys. Res., 101, 21081–21089, 1996.
Simpson, W. R., von Glasow, R., Riedel, K., Anderson, P., Ariya, P., Bottenheim, J., Bur-rows, J., Carpenter, L. J., Frieß, U., Goodsite, M. E., Heard, D., Hutterli, M., Jacobi, H.-W.,5
Kaleschke, L., Neff, B., Plane, J., Platt, U., Richter, A., Roscoe, H., Sander, R., Shepson, P.,Sodeau, J., Steffen, A., Wagner, T., and Wolff, E.: Halogens and their role in polar boundary-layer ozone depletion, Atmos. Chem. Phys., 7, 4375–4418, 2007,http://www.atmos-chem-phys.net/7/4375/2007/.
Slusher, D. L., Huey, L. G., Tanner, D. J., Flocke, F. M., and Roberts, J. M.: A thermal10
dissociation–chemical ionization mass spectrometry (TD-CIMS) technique for the simulta-neous measurement of peroxyacyl nitrates and dinitrogen pentoxide, J. Geophys. Res., 109,D19315, doi:10.1029/2004JD004670, 2004.
Stark, H., Lerner, B. M., Schmitt, R., Jakoubek, R., Williams, E. J., Ryerson, T. B., Sueper, D. T.,Parrish, D. D., and Fehsenfeld, F. C.: Atmospheric in situ measurement of nitrate radical15
(NO3) and other photolysis rates using spectroradiometry and filter radiometry, J. Geophys.Res., 112, D10S04, doi:10.1029/2006JD007578, 2007.
Steffen, A., Douglas, T., Amyot, M., Ariya, P., Aspmo, K., Berg, T., Bottenheim, J., Brooks, S.,Cobbett, F., Dastoor, A., Dommergue, A., Ebinghaus, R., Ferrari, C., Gardfeldt, K., Good-site, M. E., Lean, D., Poulain, A. J., Scherz, C., Skov, H., Sommar, J., and Temme, C.:20
A synthesis of atmospheric mercury depletion event chemistry in the atmosphere and snow,Atmos. Chem. Phys., 8, 1445–1482, 2008,http://www.atmos-chem-phys.net/8/1445/2008/.
Tuckermann, M., Ackermann, R., Golz, C., Lorenzen-Schmidt, H., Senne, T., Stutz, J., Trost, B.,Unold, W., and Platt, U.: DOAS-observation of halogen radical-catalysed arctic boundary25
layer ozone destruction during the ARCTOC-campaigns 1995 and 1996 in Ny-Alesund,Spitsbergen, Tellus B, 49, 533–555, 1997.
Yang, X., Cox, R. A., Warwick, N. J., Pyle, J. A., Carver, G. D., O’Connor, F. M., and Sav-age, N. H.: Tropospheric bromine chemistry and its impacts on ozone: A model study, J.Geophys. Res., 110, D23311, doi:10.1029/2005JD006244, 2005.30
Zeng, T., Wang, Y., Chance, K., Browell, E. V., Ridley B. A., and Atlas, E. L.: Widespreadpersistent near-surface ozone depletion at northern high latitudes in spring, Geophys Res.Lett., 30, 2298, doi:10.1029/2003GL018587, 2003.
3851
ACPD10, 3827–3860, 2010
Brominemeasurements over
the Arctic Ocean
J. A. Neuman et al.
Title Page
Abstract Introduction
Conclusions References
Tables Figures
J I
J I
Back Close
Full Screen / Esc
Printer-friendly Version
Interactive Discussion
Active Bromine < 2 pptv 2 < Active Bromine < 6 pptv Active Bromine > 6 pptv
21 April
12 April19 April
15 April
18 April
65 ˚N
70 ˚N
75 ˚N
150 ˚W 140 ˚W 130 ˚W160 ˚W
Fairbanks, Alaska
Flight Track above 300 m O3 < 4 ppbv 4 < O3 < 20 ppbv
Fairbanks, Alaska
21 April
12 April19 April
15 April18 April
Barrow, Alaska
65 ˚N
70 ˚N
75 ˚N
150 ˚W 140 ˚W 130 ˚W160 ˚W
Arctic Ocean
Chukchi Sea
Beaufort Sea
A
B
Fig. 1. (A) 1 s measurements of ozone on five WP-3D flights originating from Fairbanks, Alaska.Red circles are major ozone depletions, blue are partial ozone depletions, and no symbol rep-resents ozone >20 ppbv. Gray lines indicate flight tracks over 300 m altitude. Gaps in the flighttracks (on 18 April, for example) indicate flight altitudes less than 300 m and ozone greater than20 ppbv. (B) 10 s averages of active bromine, colored according to mixing ratio. Red markersshow active bromine over 6 pptv, blue indicate active bromine between 2 and 6 pptv, and graylines represent active bromine less than 2 pptv. The gaps occur when in-flight diagnostics wereperformed and active bromine was not measured.
3852
ACPD10, 3827–3860, 2010
Brominemeasurements over
the Arctic Ocean
J. A. Neuman et al.
Title Page
Abstract Introduction
Conclusions References
Tables Figures
J I
J I
Back Close
Full Screen / Esc
Printer-friendly Version
Interactive Discussion
1042
4
1052
4
I—• (H2O)n
laboratory air Cl2, Br2, BrCl addition
4000
3500
3000
2500
2000
1500
1000
500
0
Ion
Cou
nt R
ate
(Hz)
2802602402202001801601401201008060Ion Mass (amu)
I—•BrCl
I—• Cl2
I—•Br2
Cl—• (H2O)n
Br—• (H2O)n
Fig. 2. Mass spectra for laboratory air admitted into a humidified flow tube with I− ions (blackline). The ordinate is linear up to 4000 Hz and logarithmic above. The red line includes additionof 0.3 ppbv Br2, 0.1 ppbv BrCl, and 1.5 ppbv Cl2.
3853
ACPD10, 3827–3860, 2010
Brominemeasurements over
the Arctic Ocean
J. A. Neuman et al.
Title Page
Abstract Introduction
Conclusions References
Tables Figures
J I
J I
Back Close
Full Screen / Esc
Printer-friendly Version
Interactive Discussion
2
46
10
2
46
100
2
46
1000
2
Ion
Cou
nt R
ate
(Hz)
3:10 AM4/20/08
3:15 AM 3:20 AM 3:25 AM 3:30 AM 3:35 AM
GMT
4
3
2
1
0
Altitude (km
)
70
60
50
40
30
20
10
0
O3 (ppbv)
I—• Br2 Zeros Calibration Altitude O3
Fig. 3. I−·Br2 signals recorded once every 2 s during ambient measurements (gray), calibration(green), and background determinations (red) over the Arctic Ocean on 19 April. Ozone isshown in blue and aircraft altitude in black.
3854
ACPD10, 3827–3860, 2010
Brominemeasurements over
the Arctic Ocean
J. A. Neuman et al.
Title Page
Abstract Introduction
Conclusions References
Tables Figures
J I
J I
Back Close
Full Screen / Esc
Printer-friendly Version
Interactive Discussion
6000
5000
4000
3000
2000
1000
0
Ion
Cou
nt R
ate
(Hz)
28026024022020018016014012010080 Ion Mass (amu)
I—•Br2
I—•(HOBr)(H2O)n
Br—•(H2O)n
10424
10524
dry nitrogen Br2 addition Br2 + HOBr addition
I—•(H2O)n
Fig. 4. Mass spectra for dry N2 (black), dry N2 with 1 ppbv Br2 (green), and dry N2 with 0.3 ppbvBr2 and 1.5 ppbv HOBr (red) mixed with I− in a humidified flow tube. The ordinate is linear upto 6000 Hz and logarithmic above.
3855
ACPD10, 3827–3860, 2010
Brominemeasurements over
the Arctic Ocean
J. A. Neuman et al.
Title Page
Abstract Introduction
Conclusions References
Tables Figures
J I
J I
Back Close
Full Screen / Esc
Printer-friendly Version
Interactive Discussion
8
7
6
5
4
3
2
1
0
Ion
Cou
nt R
ate
(kH
z)
I—• Br2
I—• HOBr
Instrument Response Teflon Aircraft Inlet NaBr Coated Tube
Fig. 5. Br2 (black) and HOBr (diagonal lines) signals when 0.4 ppbv Br2 and 2.5 ppbv HOBr indry N2 are admitted directly into the flow tube (labeled Instrument Response), flow through theTeflon aircraft inlet, and flow through a NaBr-coated tube.
3856
ACPD10, 3827–3860, 2010
Brominemeasurements over
the Arctic Ocean
J. A. Neuman et al.
Title Page
Abstract Introduction
Conclusions References
Tables Figures
J I
J I
Back Close
Full Screen / Esc
Printer-friendly Version
Interactive Discussion
200
180
160
140
120
100
80
60
40
20
0
Ion
Cou
nt R
ate
(Hz)
290280270260250240230220
Ion Mass (amu)
Aircraft Altitude 150 m 1.7 kmI–• (H2O)5
I–• Br2I–• BrO I–• BrCl I2
–
Fig. 6. Mass spectra obtained in flight at 1.7 km (black) and 150 m (red) altitude over the ArcticOcean north of Barrow on 19 April. The WP-3D aircraft was in the MBL and ozone was depleted(O3=12 ppbv) at 150 m altitude.
3857
ACPD10, 3827–3860, 2010
Brominemeasurements over
the Arctic Ocean
J. A. Neuman et al.
Title Page
Abstract Introduction
Conclusions References
Tables Figures
J I
J I
Back Close
Full Screen / Esc
Printer-friendly Version
Interactive Discussion
20
16
12
8
4
0
-4
Active B
romine (pptv)
2:30 AM4/20/08
2:45 AM 3:00 AM 3:15 AM 3:30 AMGMT
4
3
2
1
0
Altitude (km
)
80
70
60
50
40
30
20
10
0
Ozo
ne (p
pbv)
Ozone Active Bromine BrO BrCl Altitude
Fig. 7. 1 h time series of measurements obtained over the Arctic Ocean 300 km north of Barrow,Alaska on 19 April. 1 s measurements of ozone (blue) and aircraft altitude (black), and 10 saverages of active bromine (red), BrO (green), and BrCl (pink) are shown.
3858
ACPD10, 3827–3860, 2010
Brominemeasurements over
the Arctic Ocean
J. A. Neuman et al.
Title Page
Abstract Introduction
Conclusions References
Tables Figures
J I
J I
Back Close
Full Screen / Esc
Printer-friendly Version
Interactive Discussion
270260250Temperature (K)
170160150140130120CO (ppbv)
AmbientTemperature
PotentialTemperature
CO
567
0.1
2
3
4
567
1
2
3
4
Alti
tude
(km
)
121086420-2Active Bromine (pptv)
6050403020100Ozone (ppbv)
Active Bromine
Ozone
Fig. 8. 1 s measurements of O3 (blue), potential temperature (black), ambient temperature(pink), and CO (green) vs. altitude during a descent of the WP-3D aircraft from 4 km to 60 maltitude on 12 April 2008. Red symbols are 10 s averages of active bromine. The gap in brominedata occurred during a 60 s instrument zero.
3859
ACPD10, 3827–3860, 2010
Brominemeasurements over
the Arctic Ocean
J. A. Neuman et al.
Title Page
Abstract Introduction
Conclusions References
Tables Figures
J I
J I
Back Close
Full Screen / Esc
Printer-friendly Version
Interactive Discussion
20
15
10
5
0
-5
Act
ive
Bro
min
e (p
ptv) WP-3D flight date
April 12April 15April 18April 19April 21
20
15
10
5
0
-5
BrC
l (pp
tv)
20
15
10
5
0
-5
BrO
(ppt
v)
140120100806040200
Ozone (ppbv)
A
B
C
Fig. 9. 10 s averages of active bromine (A), BrCl (B), and BrO (C) vs. ozone from five WP-3Dflights that included sampling in the MBL over the Arctic Ocean.
3860
Related Documents


![Theoretical investigation study of Bromine radical reaction ...ability of bromine is almost 100 times more destructive to stratospheric ozone than chlorine atom[9,10]. The present](https://static.cupdf.com/doc/110x72/610de418855c2826235f60d1/theoretical-investigation-study-of-bromine-radical-reaction-ability-of-bromine.jpg)