Φ Abstract -- This paper presents a procedure for broken rotor bar diagnosis in induction motors based in data extracted from stator current, which is calculated in the time and frequency domains. Data comes from a tested motor fed by different types of supply: direct line and two different Voltage Source Inverters. Diagnosis is always difficult in Voltage Source Inverter fed motors due to inherent noise level and the presence of additional non-related fault harmonics in the stator current spectrum. Moreover, the motor was tested under different load conditions, from no-load to full-load. Diagnosis is also more difficult at lower load levels. Previous to fault classification, a variable reduction was carried out using Principal Component Analysis. Fault classification was performed using Linear Discriminant Analysis. The motor was tested with different fault severities, what allowed us to perform an analysis oriented to different maintenance approaches, considering the criticality of the motor. Index Terms--Fault diagnosis, Induction motors, Linear Discriminant Analysis, Principal Component Analysis. I. NOMENCLATURE s: slip. f 1 fundamental harmonic. f b frequency of the broken bar related sideband. II. INTRODUCTION . Induction motors are essential in many industries, where they are the horsepower in many factories [1]. Although these machines are very rugged and their reliability is very high, they are not free from suffering faults when they are subjected to stresses greater to thresholds predetermined in the design stage [2]. These stresses can be classified in the following categories: electric, thermal, dielectric, mechanical, dynamic, residual, electromagnetic and environmental stresses. When a certain threshold is exceeded, or a combination of some of these stresses happens, one or more motor components fail, namely, rotor cage, stator winding, bearing, motor shaft, etc. [3], [4]. P.E. Gardel-Sotomayor was granted an Erasmus-Mundus Doctoral Scholarship from E.U. This research is partially supported by the University of Valladolid. M. Fernandez-Temprano is with the Department of Statistics and Operational Research, University of Valladolid, UVa, 47011 Valladolid, Spain (e-mail: [email protected]). P.E. Gardel-Sotomayor is with the University of Valladolid, UVa, and with the National University of Asuncion, UNA (e-mail: [email protected], [email protected]). O. Duque-Perez and D. Morinigo-Sotelo are with the Department of Electrical Engineering, University of Valladolid, UVa. 47011 Valladolid, Spain (e-mail: [email protected], [email protected]). Of all possible induction motor faults, we considered in this work the failure through broken rotor bars, which is common in many industrial applications. This failure can be caused by large starting currents when cooling is at minimum, and this result in thermal and mechanical stresses being at a maximum. The impact of this failure mode is more significant when the start-up time is relatively long, and when frequent starts are required as part of a heavy-duty cycle [5]. Although a broken rotor bar is not a cause for a motor to stop, there can be serious secondary effects as torque reduction, inconsistent motor operation and safety concerns [6], [7]. In fact, broken rotor bars can be a major problem for some users [8]. A fault detection and diagnosis system is very important for any efficient industry in order to minimize costs of electrical machine failures and production downtime. To diagnose a faulty motor, many techniques are being used based in the analysis of vibrations, temperature, magnetic flux, but the most widespread one is based in the analysis of the stator current, and it is well known as Motor Current Signature Analysis [9]-[11]. The majority of these faults cause an asymmetry in the motor that is reflected as additional harmonics in the stator current spectrum. These fault-related harmonics appear at specific frequencies depending on the specific fault and motor rotation speed. There is an extensive bibliography giving formulas to calculate where these harmonics will appear in the stator current spectrum [6], [10], [12]. These harmonics amplitude, which also depends on the motor load, is indicative of the fault severity and is used as fault features to diagnose the motor condition [7]. These features are calculated in the frequency domain [13]. Although it is not usual, additional fault features can also be calculated in the time domain from the stator current signal [5], [14], [15]. This is more common in vibrational signal analysis, where some features are computed, such as root-mean-square, crest factor, skewness, kurtosis, and some cumulants and momentums. But, now they are also being used for induction motor diagnosis and calculated from the stator current in the time domain [16]- [18]. Nowadays, many induction motors are being fed by Voltage Source Inverters (VSI) due to the advantages provided. To name some of them, a VSI drive is more energy-efficient that one with a direct line supply and permits the motor to rotate at the exact speed demanded by the load. But, despite these advantages, there are some drawbacks Broken bar condition monitoring of an induction motor under different supplies using a Linear Discriminant Analysis M. Fernandez-Temprano, P.E. Gardel-Sotomayor, O. Duque-Perez, D. Morinigo-Sotelo, Member, IEEE F T 978-1-4799-0025-1/13/$31.00 ©2013 IEEE 162 162

Welcome message from author
This document is posted to help you gain knowledge. Please leave a comment to let me know what you think about it! Share it to your friends and learn new things together.
Transcript

ΦAbstract -- This paper presents a procedure for broken rotor bar diagnosis in induction motors based in data extracted from stator current, which is calculated in the time and frequency domains. Data comes from a tested motor fed by different types of supply: direct line and two different Voltage Source Inverters. Diagnosis is always difficult in Voltage Source Inverter fed motors due to inherent noise level and the presence of additional non-related fault harmonics in the stator current spectrum. Moreover, the motor was tested under different load conditions, from no-load to full-load. Diagnosis is also more difficult at lower load levels. Previous to fault classification, a variable reduction was carried out using Principal Component Analysis. Fault classification was performed using Linear Discriminant Analysis. The motor was tested with different fault severities, what allowed us to perform an analysis oriented to different maintenance approaches, considering the criticality of the motor.
Index Terms--Fault diagnosis, Induction motors, Linear Discriminant Analysis, Principal Component Analysis.
I. NOMENCLATURE s: slip. f1 fundamental harmonic. fb frequency of the broken bar related sideband.
II. INTRODUCTION . Induction motors are essential in many industries, where they are the horsepower in many factories [1].
Although these machines are very rugged and their reliability is very high, they are not free from suffering faults when they are subjected to stresses greater to thresholds predetermined in the design stage [2]. These stresses can be classified in the following categories: electric, thermal, dielectric, mechanical, dynamic, residual, electromagnetic and environmental stresses. When a certain threshold is exceeded, or a combination of some of these stresses happens, one or more motor components fail, namely, rotor cage, stator winding, bearing, motor shaft, etc. [3], [4].
P.E. Gardel-Sotomayor was granted an Erasmus-Mundus Doctoral
Scholarship from E.U. This research is partially supported by the University of Valladolid.
M. Fernandez-Temprano is with the Department of Statistics and Operational Research, University of Valladolid, UVa, 47011 Valladolid, Spain (e-mail: [email protected]).
P.E. Gardel-Sotomayor is with the University of Valladolid, UVa, and with the National University of Asuncion, UNA (e-mail: [email protected], [email protected]).
O. Duque-Perez and D. Morinigo-Sotelo are with the Department of Electrical Engineering, University of Valladolid, UVa. 47011 Valladolid, Spain (e-mail: [email protected], [email protected]).
Of all possible induction motor faults, we considered in this work the failure through broken rotor bars, which is common in many industrial applications. This failure can be caused by large starting currents when cooling is at minimum, and this result in thermal and mechanical stresses being at a maximum. The impact of this failure mode is more significant when the start-up time is relatively long, and when frequent starts are required as part of a heavy-duty cycle [5]. Although a broken rotor bar is not a cause for a motor to stop, there can be serious secondary effects as torque reduction, inconsistent motor operation and safety concerns [6], [7]. In fact, broken rotor bars can be a major problem for some users [8].
A fault detection and diagnosis system is very important for any efficient industry in order to minimize costs of electrical machine failures and production downtime. To diagnose a faulty motor, many techniques are being used based in the analysis of vibrations, temperature, magnetic flux, but the most widespread one is based in the analysis of the stator current, and it is well known as Motor Current Signature Analysis [9]-[11]. The majority of these faults cause an asymmetry in the motor that is reflected as additional harmonics in the stator current spectrum. These fault-related harmonics appear at specific frequencies depending on the specific fault and motor rotation speed. There is an extensive bibliography giving formulas to calculate where these harmonics will appear in the stator current spectrum [6], [10], [12]. These harmonics amplitude, which also depends on the motor load, is indicative of the fault severity and is used as fault features to diagnose the motor condition [7]. These features are calculated in the frequency domain [13]. Although it is not usual, additional fault features can also be calculated in the time domain from the stator current signal [5], [14], [15]. This is more common in vibrational signal analysis, where some features are computed, such as root-mean-square, crest factor, skewness, kurtosis, and some cumulants and momentums. But, now they are also being used for induction motor diagnosis and calculated from the stator current in the time domain [16]-[18].
Nowadays, many induction motors are being fed by Voltage Source Inverters (VSI) due to the advantages provided. To name some of them, a VSI drive is more energy-efficient that one with a direct line supply and permits the motor to rotate at the exact speed demanded by the load.
But, despite these advantages, there are some drawbacks
Broken bar condition monitoring of an induction motor under different supplies using a Linear Discriminant Analysis
M. Fernandez-Temprano, P.E. Gardel-Sotomayor, O. Duque-Perez, D. Morinigo-Sotelo, Member, IEEE
FT
978-1-4799-0025-1/13/$31.00 ©2013 IEEE
162162

related to the diagnosis of the motor. A VSI fed motor shows a higher floor noise in the stator current than a direct line fed one. This makes more difficult to identify fault related harmonics, above all at low loads [19], [20]. Depending on the commutation technique and open-loop or closed-loop operation, VSIs also introduce additional harmonic content in the stator current that it is not fault related, and this also hinders true fault-related harmonics recognition [21]. VSI-fed motor faults have been analyzed and initial results are given in literature [22]–[26] but further investigation is still required [9], [19]. In these conditions, VSI fed motor and a wide range of motor loads, any fault diagnosis technique will face serious challenges.
The general procedure for a fault diagnosis technique has the following steps:
1. Data acquisition. 2. Feature extraction. 3. Feature set dimensional reduction and Classifier
development. 4. Fault diagnosis.
In this case, we have adopted the following procedure. After the data acquisition step, where the stator current is recorded, a number of features are extracted from this signal. Some methods are available for feature extraction as Fast Fourier Transform, Wavelet Transform [27], [28], Wigner-Ville Transform [29], Bi-Spectrum [12], Cepstrum [30] or Hilbert Transform [31]. In our case, extracted features belong to the time and frequency domains, and will be explained later in Section IV. A large number of tests were carried out, with the motor fed by different power supplies (direct line and two VSIs) and at different load levels, from no load to full load. A broken bar failure was simulated by drilling a hole in one of the rotor cage bars. Four fault severities were considered (from healthy state to full broken bar) drilling different hole depths. As the number of extracted features is quite large, an initial analysis to avoid the existence of redundant information is required, since these redundancies may be inconvenient for the classification rule. In this work we have performed a Principal Component Analysis (PCA) to eliminate, from the initial data set, all features showing a strong correlation between them [32].
The next step is to develop a classification rule, based in the constructed data set. In this case, we choose the Linear Discriminant Analysis (LDA) technique in order to discriminate between normal and faulty operation conditions. This data-driven technique has not been used very frequently for induction motor diagnosis [33]-[35]. Other classifier methods that are being used in the literature are: Artificial Neural Networks [14], [36]-[39], Neuro-Fuzzy [40], [41], Robust Clustering Techniques [42], Support vector machine classifier [43]-[45], Nearest Neighbor classifiers [46], [47], Multiple Discriminant classifiers [48], [49].
As we consider that the diagnosis tool must be connected
to the maintenance policy adopted, we evaluated the rules obtained using LDA in two different situations. First, we consider the scenario where we are interested in detecting whether a motor is faulty or not, no matter the fault severity. This would be useful when one is interested in diagnosing a critical motor, that is, if it is not acceptable that this motor can suffer any fault and must be replaced immediately, once a possible fault is detected.
In the second scenario, we try to distinguish between a healthy motor, or with an incipient fault, and a motor with a full broken bar, or almost full broken. This would be interesting when the motor is not so critical as in the first case, and it is only important to decide if the fault severity is high or not.
III. LABORATORY SETUP The laboratory setup is shown in Fig. 1. In order to get
data for this study, an induction motor with the following specifications was tested in a laboratory:
• Rated power: 1.1 kW • Rated voltage: 400 V • Rated current: 2.6 A • Number of pole pairs: 2 • Rated speed: 1415 RPM. • Rated voltage: 400 V. The motor was loaded with a magnetic powder brake, and
tested in all load conditions, from no load to full load. Three different supplies were considered, direct line and two different VSIs: Micromaster 420 by Siemens, and a PowerFlux 40 by Allen Bradley. The operating frequency was 50 Hz for the three supplies.
Stator current was acquired by a Hall Effect current transducer by LEM. A National Instruments NI cDAQ-9174 base platform with a NI 9215 acquisition module was used for data acquisition, with a sampling frequency of 80 kHz and sampling time of 10 s.
Fig. 1. General view of the laboratory setup.
The motor was tested first in a healthy condition. Faulty
conditions were simulated by drilling a hole in one of the rotor bars. An incipient fault was obtained by drilling 6 mm
163163

depth hole in one of the bars. Next, a partially broken bar was obtained with a depth hole of 12 mm, and finally, a full-broken bar was obtained drilling an 18 mmm hole.
For each fault severity, the motor was tested with all the power supplies previously mentioned, and at a wide range of load conditions. The number of tests performed was:
• Healthy motor: • Direct line supply: 109 • Micromaster 420 by Siemens at 50 Hz: 102 • PowerFlex 40 by Allen Bradley at 50 Hz: 108 • Incipient fault state: • Direct line supply: 48 • Micromaster 420 by Siemens at 50 Hz: 41 • PowerFlex 40 by Allen Bradley at 50 Hz: 46 • Partially broken bar: • Direct line supply: 41 • Micromaster 420 by Siemens at 50 Hz: 41 • PowerFlex 40 by Allen Bradley at 50 Hz: 40 • Full broken bar: • Direct line supply: 46 • Micromaster 420 by Siemens at 50 Hz: 41 • PowerFlex 40 by Allen Bradley at 50 Hz: 46
IV. FEATURE EXTRACTION AND PRINCIPAL COMPONENT ANALYSIS
Once the stator current was acquired and registered, the following features were calculated.
A. Time domain statistical data In previous works [5], [14], [15], time domain statistical
features have been proposed as input data to different diagnosis techniques. In this work, 16 statistical features (including root mean square, RMS) were first considered and are shown in Table I.
B. Frequency domain data Assuming a purely and balanced sinusoidal voltage
supply and a symmetrical cage winding, there is only a forward rotating field at slip frequency, with respect to the rotor. When a rotor asymmetry happens, such as a broken bar, there will be a resultant backward rotating field at slip frequency with respect to the forward rotating rotor. This backward rotating field induces a voltage and a current in the stator winding at (1-2s)f1 frequency, where s is the motor slip and f1 is the main frequency. This induced current is the cause of torque and speed pulsations, which at the same time induce new electromotive forces in the stator. As a result of this force, new counter currents are produced at frequency (1+2s)f1. This process goes on indefinitely, until it is damped and a pair of new sidebands appears around the main frequency f1 [50]. Considering that sidebands also appear around some higher order harmonics as 5th or 7th, a more general equation of these sidebands frequencies is:
𝑓! = 1 ± 2𝑘𝑠 𝑘!𝑓! (1)
where:
• k = 1,2,... • k1 = 1,5,7,... Amplitudes of the sidebands around the main, fifth and
seventh harmonics are indicative of a broken bar fault, and are chosen as input data to the LDA. Table II shows the frequencies of the 8 sidebands selected for this paper.
C. Data reduction using Principal Component Analysis PCA [51], [52] is a dimension reduction technique that is
widely used in practice. Its main objective is to find a low- dimension linear subspace such that the projections of the original data onto that subspace retain as much information from the original data as possible. The vectors that generate that low-dimension linear subspace can be expressed as linear combinations of the original variables and are the new variables that contain as much information as possible from the original data. If the dimension of the subspace is low, there are a small number of these new variables and hence we have reduced the dimension of the set of data losing an amount of information as small as possible. This will be possible when there are high correlations among some of the original variables.
TABLE I TIME DOMAIN STATISTICAL FEATURES
Statistical feature Equation
1 1st Order Moment (Mean)
2 2nd Order Moment (Variance)
3 3er Order Moment
4 4th Order Moment
5 Normalized 6th Order Moment
1st Order Cumulant c1=m1
6 2nd Order Cumulant c2=m2-m12
7 3er Order Cumulant c3=m3-3m1m2+2m13
8 4th Order Cumulant c4=m4+m3m1-3m2
2+12m2m12-6m1
4
9 Skewness
10 Kurtosis
11 Absolute mean
12 Maximum peak value xp=max
13 Square root value
14 Crest factor
15 Shape factor
16 Root mean square
∑= )(11 xnm
∑ −= 2)(12 xxm n
∑ −= 33 )(1 xxnm
∑ −= 44 )(1 xxnm
∑ −= 6
26 )()*(
1 xxmnm
( )323
mmskew =
( )424
mmkurt =
∑= xnx 1
x
⎟⎠⎞⎜
⎝⎛ ∑= xnxr 1
2
rmsp
f xxc =
xxs rms
f =
rmsx =1N
x − x( )2∑
164164

Moreover, if the coefficients of the original values in these
linear combinations are studied, it can be determined which variables are more relevant in each linear combination. Consequently, those variables having coefficients close to 0 in all linear combinations may be excluded from further analyses reducing the number of variables in the original set. These excluded variables will be the ones that have high correlations with some of the conserved ones so that they do not give much additional information and therefore may be dropped without substantial loss of information. The algebra underlying PCA, which involves matrix diagonalization and eigenvector computation, is well known and may be found in many texts [51], [52]. For the problem at hand, we applied PCA to the two set of variables we are considering, namely the time domain statistical features appearing in Table I and the time spectrum data sidebands in Table II. There were no big associations among the spectrum variables and therefore all 8 variables of this type are considered in the next step. On the other hand, when the time domain statistical features were treated using PCA, several very strong associations were detected and only the first four moments, kurtosis, crest factor and shape factor (i.e. variables 1 to 4, 10, 14 and 15 in Table I) were selected to be considered in the second step of the procedure.
TABLE II TIME SPECTRUM DATA SIDEBANDS
Sideband Nomenclature Frequency
1st harmonic, 1st left BI ( ) 121 fsfb −=
1st harmonic, 2nd left BI2 ( ) 141 fsfb −=
1st harmonic, 1st right BS ( ) 121 fsfb +=
1st harmonic, 2nd right BS2 ( ) 141 fsfb +=
5th harmonic, 1st left B5I ( ) 1521 fsfb −=
5th harmonic, 1st right B5S ( ) 1521 fsfb +=
7th harmonic, 1st left B7I ( ) 1721 fsfb −=
7th harmonic, 1st right B7S ( ) 1721 fsfb +=
V. LINEAR DISCRIMINANT ANALYSIS Although many and more complex supervised
classification techniques are being developed, LDA [52], originally developed by R. A. Fisher in 1936, is still being successfully employed in many applications to classify objects in c≥2 classes using a set of characteristics. LDA determines linear combinations of the explanatory variables such that the values of each linear combination for the objects in each class are as similar as possible, and the values for the objects in different classes are as different as possible. In statistical terms, it is said that the linear combinations minimize the variance inside the classes and maximize the variance between classes. An alternative, and perhaps more clear, formulation of LDA, is to consider the
squared estimated Mahalanobis distance. Assume that we have a set of objects {x1,…,xN} where xi ϵ Rd, that we call training sample, and that we know to which class j=1,2,..,c each of the object in the training set belongs to. The squared estimated Mahalanobis distance between an object y=(y1,…,yd)’ and the estimated center of the jth class ӯj, r2(y, ӯj), that can be defined as:
𝑟! 𝑦, 𝑦! = 𝑦 − 𝑦! ′𝑆!! 𝑦 − 𝑦! (2)
where ӯj ϵ Rd is the mean of the objects in class j and S ϵ Rd x d is the pooled covariance matrix.
Now, the classification rule is to classify object y in the class j for which the squared Mahalanobis distance r2(y, ӯj) is smallest.
Since a single covariance matrix for all classes is considered, LDA assumes that the covariance between characteristics does not change between classes. (Notice that otherwise (2) would not be a linear function of y). The calculation of the Mahalanobis distance in (2) assumes that S is non-singular. However, if there are approximate linear relationships among the characteristics, the matrix will be ill-conditioned and the results would not be stable. This issue, called multicollinearity, is usual when a moderate to large number of characteristics is considered. The filter of characteristics made by our use of PCA allows guaranteeing that this sort of problem will not appear. In our case, we have made a second variable selection using stepwise methods inside the PCA procedure for selecting which characteristics are more useful to classify the objects.
Once the LDA has been performed, the classification power of the rule has to be evaluated computing the so-called generalization error (the capacity of the procedure to correctly classify future new observations). The most intuitive method of evaluation is called re-substitution. The re-substitution error, or apparent error (APPE), of the rule is just the percentage of objects in the training set that are incorrectly classified. Unfortunately, this error overestimates the generalization error. The reason for this is obvious. As the objects are being used to determine the rule (for computing the means in each class and the pooled covariance matrix) it is clear that they will be better classified than new independent objects that were not used in determining the rule.
In order to solve the problem of overestimation suffered by the apparent error, new procedures for estimating the generalization error have been defined. Two of the procedures more widely used in practice are k-fold crossvalidation and 632+ boostrap estimation.
In k-fold crossvalidation [52], the training sample is randomly partitioned in k subsamples. One of these subsamples is retained and the other (k-1) subsamples are used to determine the rule (compute the class means and the pooled covariance matrix). Then the observations in the retained subsample are classified with the rule based on the other (k-1) subsamples and the percentage of error is
165165
computed. This process is repeated retaining one of the k subsamples each time and using the rest for computing the rule. The k-fold error (KFE) is the mean of the k errors obtained with each of the k subsamples. The most commonly used value for k is k=10.
The procedure for obtaining the 632+ error is more elaborate. First, a bootstrap sample of size N (the training sample size) is obtained randomly and with replacement from the original training sample. Now the rule based on the bootstrap sample is computed, and the observations in the training sample not belonging to the boostrap sample are classified and the percentage of wrongly classified observations computed. This procedure is repeated B times (B is the number of boostrap samples extracted, in this work we have used B=100). The average of the B errors obtained is the bootstrap error (632+E) [53]. This bootstrap error (BE) tends to overestimate the generalization error so the 632+ bootstrap error is defined as follows [54]:
632+E = (1-α) APPE + α BE (3)
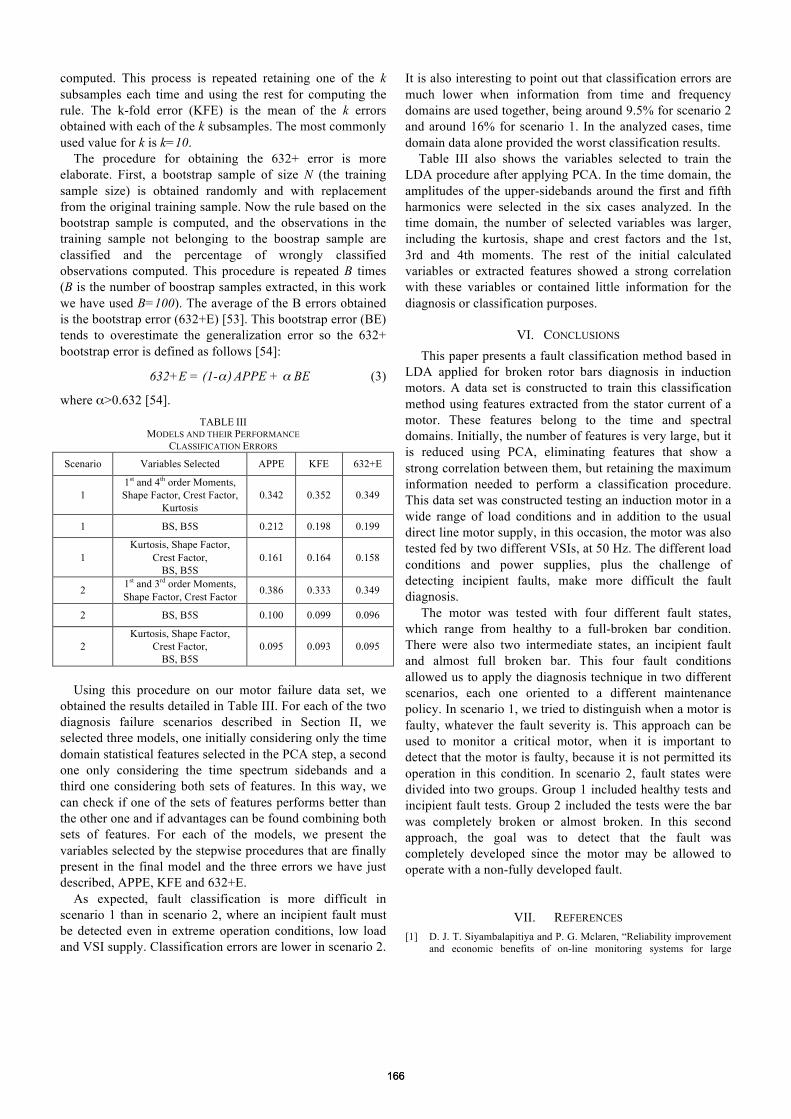
where α>0.632 [54]. TABLE III
MODELS AND THEIR PERFORMANCE CLASSIFICATION ERRORS
Scenario Variables Selected APPE KFE 632+E
1 1st and 4th order Moments, Shape Factor, Crest Factor,
Kurtosis 0.342 0.352 0.349
1 BS, B5S 0.212 0.198 0.199
1 Kurtosis, Shape Factor,
Crest Factor, BS, B5S
0.161 0.164 0.158
2 1st and 3rd order Moments, Shape Factor, Crest Factor 0.386 0.333 0.349
2 BS, B5S 0.100 0.099 0.096
2 Kurtosis, Shape Factor,
Crest Factor, BS, B5S
0.095 0.093 0.095
Using this procedure on our motor failure data set, we
obtained the results detailed in Table III. For each of the two diagnosis failure scenarios described in Section II, we selected three models, one initially considering only the time domain statistical features selected in the PCA step, a second one only considering the time spectrum sidebands and a third one considering both sets of features. In this way, we can check if one of the sets of features performs better than the other one and if advantages can be found combining both sets of features. For each of the models, we present the variables selected by the stepwise procedures that are finally present in the final model and the three errors we have just described, APPE, KFE and 632+E.
As expected, fault classification is more difficult in scenario 1 than in scenario 2, where an incipient fault must be detected even in extreme operation conditions, low load and VSI supply. Classification errors are lower in scenario 2.
It is also interesting to point out that classification errors are much lower when information from time and frequency domains are used together, being around 9.5% for scenario 2 and around 16% for scenario 1. In the analyzed cases, time domain data alone provided the worst classification results.
Table III also shows the variables selected to train the LDA procedure after applying PCA. In the time domain, the amplitudes of the upper-sidebands around the first and fifth harmonics were selected in the six cases analyzed. In the time domain, the number of selected variables was larger, including the kurtosis, shape and crest factors and the 1st, 3rd and 4th moments. The rest of the initial calculated variables or extracted features showed a strong correlation with these variables or contained little information for the diagnosis or classification purposes.
VI. CONCLUSIONS This paper presents a fault classification method based in
LDA applied for broken rotor bars diagnosis in induction motors. A data set is constructed to train this classification method using features extracted from the stator current of a motor. These features belong to the time and spectral domains. Initially, the number of features is very large, but it is reduced using PCA, eliminating features that show a strong correlation between them, but retaining the maximum information needed to perform a classification procedure. This data set was constructed testing an induction motor in a wide range of load conditions and in addition to the usual direct line motor supply, in this occasion, the motor was also tested fed by two different VSIs, at 50 Hz. The different load conditions and power supplies, plus the challenge of detecting incipient faults, make more difficult the fault diagnosis.
The motor was tested with four different fault states, which range from healthy to a full-broken bar condition. There were also two intermediate states, an incipient fault and almost full broken bar. This four fault conditions allowed us to apply the diagnosis technique in two different scenarios, each one oriented to a different maintenance policy. In scenario 1, we tried to distinguish when a motor is faulty, whatever the fault severity is. This approach can be used to monitor a critical motor, when it is important to detect that the motor is faulty, because it is not permitted its operation in this condition. In scenario 2, fault states were divided into two groups. Group 1 included healthy tests and incipient fault tests. Group 2 included the tests were the bar was completely broken or almost broken. In this second approach, the goal was to detect that the fault was completely developed since the motor may be allowed to operate with a non-fully developed fault.
VII. REFERENCES [1] D. J. T. Siyambalapitiya and P. G. Mclaren, “Reliability improvement
and economic benefits of on-line monitoring systems for large
166166

induction machines,” IEEE Trans. Ind. Appl. vol. 26, pp. 1018-1025, 1990.
[2] B. Yanga, S. K. Jeonga, Y. M. Ohb, and A. C. C. Tanc, “Case-based reasoning system with Petri nets for induction motor fault diagnosis,” Expert Systems with Applications, vol. 27, pp. 301–311, 2004.
[3] A.H. Bonnett and G.C. Soukup, "Cause and analysis of stator and rotor failures in three-phase squirrel-cage induction motors," IEEE Trans. Industry Applications, vol. 28, pp. 921-937, Jul./Aug. 1982.
[4] M. Perez-Alonso, O. Duque-Perez and D. Morinigo-Sotelo, "Characteristic faults in induction motors: stator faults (I)," Ingeniería y Gestión de Mantenimiento, vol. VII, nº 34, pp.79-84, March/Apr. 2004 (In Spanish).
[5] B.S. Payne, A. Ball and F. Gu, "Detection and Diagnosis on Induction Motor Faults using Statistical Measures," International Journal of Condition Monitoring and Diagnostics Engineering Management, vol. 5, no. 2, pp. 5-19, Apr. 2002.
[6] W. T. Thomson and M. Fenger, "Industrial application of current signature analysis to diagnose faults in 3-phase squirrel cage induction motors," in Proc. 2000. Pulp and Paper Industry Technical Conference, pp. 205-211.
[7] E. Germen, D.G. Ece and Ö.N. Gerek, "Self organizing map (SOM) approach for classification of mechanical faults in induction motors," in Proc. 2007 9th international work conference on Artificial neural networks (IWANN'07), pp. 855-861.
[8] W. T. Thomson and D. Rankin, "Case Histories of Rotor winding Fault Diagnosis in Induction Motors“, in Proc. of the 2nd Int. Conf. on Condition Monitoring, 1987.
[9] A. Bellini, F. Filippetti, C. Tassoni, and G.A. Capolino, "Advances in Diagnostic Techniques for Induction Machines," IEEE Trans. Industrial Electronics, vol.55, no.12, pp.4109-4126, Dec. 2008.
[10] M.E.H. Benbouzid, "A review of induction motors signature analysis as a medium for faults detection," IEEE Trans. Ind. Electron., vol. 47, pp. 984–993, Oct. 2000.
[11] V. Climente-Alarcon; J. Antonino-Daviu; F. Vedreno-Santos, and R. Puche-Panadero “ Vibration transient detection of broken bars by PSH sidebands” in Proc. XXth International Conference on Electrical Machines (ICEM), Marseille, France, Sept. 2012.
[12] L. Saidi, H. Henao, F. Fnaiech, G.A. Capolino and G. Cirrincione, "Application of higher order spectral analysis for rotor broken bar detection in induction machines Diagnostics for Electric Machines, " in 2011 IEEE International Symposium on Diagnostics for Electric Machines, Power Electronics & Drives (SDEMPED), pp. 31-38.
[13] S. Hamdani, O. Touhami, R. Ibtiouen and M. Fadel, "Neural Network technique for induction motor rotor faults classification – Dynamic eccentricity and broken bar faults," in 2011 IEEE International Symposium on Diagnostics for Electric Machines, Power Electronics & Drives (SDEMPED), pp. 626-631.
[14] P. Gardel, D. Morinigo-Sotelo, O. Duque-Perez, M. Perez-Alonso, and L.A. Garcia-Escudero, “Neural network broken bar detection using time domain and current spectrum data” in Proc. 2012 XXth International Conference on Electrical Machines (ICEM), Marseille, France.
[15] J. Zaeri, “Induction motors bearing fault detection using pattern recognition techniques” in Expert Systems with Applications vol. 39, Issue 1, pp. 68-73, Jan. 2012.
[16] J. Zhong, Z. Yang and S.F. Wong, "Machine condition monitoring and fault diagnosis based on support vector machine," in Proc. 2010 International Conference on Industrial Engineering and Engineering Management, pp. 2228–2233.
[17] V. Ghate and S. Dudul, "Optimal MLP neural network classifier for fault detection of three phase induction motor," Expert Systems with Applications, vol. 37, no. 4, pp. 3468-3481, Apr. 2010.
[18] V.T. Tran, B.-S. Yang, M.-S. Oh, and A.C.C. Tan, "Fault diagnosis of induction motor based on decision trees and adaptive neuro-fuzzy inference,” Expert Systems with Applications, vol. 36, no. 2, pp. 1840-1849, March 2009.
[19] B. Akin, U. Orguner, H.A. Toliyat and M. Rayner, “Low order PWM inverter harmonics contributions to the inverter-fed induction machine fault diagnosis,” IEEE Trans. Ind. Electron., vol. 55, no. 2, pp. 610–619, 2008.
[20] F. Briz, M. W. Degner, P. Garcia, and A. B. Diez, ”High-frequency carrier-signal voltage selection for stator winding fault diagnosis in
inverter-fed ac machines,” IEEE Trans. Ind. Electron., vol. 55(12), pp. 4181–4190, 2008.
[21] R. Wieser, C. Kral, F. Pirker, and M. Schagginger, “On-line rotor cage monitoring of inverter-fed induction machines by means of an improved method,” IEEE Trans. Power Electronics, vol. 14(5), pp. 858-865, 1999.
[22] O. Duque, M. Perez, and D. Morinigo, “Detection of bearing faults in cage induction motors fed by frequency converter using spectral analysis of line current. in Proc. 2005 IEEE International Electric Machines and Drives Conference, pp. 17– 22.
[23] G. R. Bossio, C. H. D. Angelo, G. O. Garcia, J. A. Solsona, and M. I. Valla, “Effects of rotor bar and end-ring faults over the signals of position estimation strategy for induction motors,“ IEEE Trans. Ind. Appl., vol. 41(4), pp. 1005–1012, 2005.
[24] J. Yang, S.B. Lee, J. Yoo, S. Lee, Y. Oh and C. Choi, “A stator winding insulation condition monitoring technique for inverter-fed machines,” IEEE Trans. Power Electron., vol. 22(5), pp. 2026–2033, 2007.
[25] O. Duque-Perez, M. Perez-Alonso, and D. Morinigo-Sotelo, “Practical application of the spectral analysis of line current for the detection of mixed eccentricity in cage induction motors fed by frequency converter,“ in Proc. 2004 16th International Conference on Electrical Machines.
[26] D. Morinigo-Sotelo, L. A. Garcia-Escudero, O. Duque-Perez, and M. Perez-Alonso, “Practical Aspects of Mixed Eccentricity Detection in PWM Voltage Source Inverter Fed Induction Motors,” IEEE Trans. Ind. Electron., vol. 57(1), pp. 252–262, 2010.
[27] T.W.S. Chow and S. Hai, "Induction machine fault diagnostic analysis with wavelet technique," IEEE Trans. Ind. Electron., vol. 51, no. 3, pp. 558–565, Jun. 2004.
[28] M. Riera-Guasp, J.A. Antonino-Daviu, J. Roger-Folch, and M.P. Molina Palomares, "The use of the wavelet approximation signal as a tool for the diagnosis of rotor bar failures," IEEE Trans. Ind. Appl., vol. 44, no. 3, pp. 716–726, May/Jun. 2008.
[29] V. Climente-Alarcon, J.A. Antonino-Daviu, M. Riera, R. Puche-Panadero, and L.A. Escobar, "Wigner-Ville distribution for the detection of high-order harmonics due to rotor asymmetries," 2009 IEEE International Symposium on Diagnostics for Electric Machines, Power Electronics & Drives (SDEMPED)., pp.1-6.
[30] Y.-R. Hwang, K.-K. Jen, and Y.-T. Shen, "Application of cepstrum and neural network to bearing fault detection," Journal of Mechanical Science and Technology, vol. 23, no.10, pp. 2730-2737.
[31] R. Puche-Panadero, M. Pineda-Sanchez, M. Riera-Guasp, J. Roger-Folch, E. Hurtado-Perez, and J. Perez-Cruz, "Improved Resolution of the MCSA Method Via Hilbert Transform, Enabling the Diagnosis of Rotor Asymmetries at Very Low Slip," IEEE Transactions on Energy Conversion, vol.24, no.1, pp.52-59, March 2009.
[32] Q. He, R. Yan, F. Kong, and R. Du, “Machine condition monitoring using principal component representations”, Mechanical Systems and Signal Processing, vol. 23, pp. 446-466, 2009.
[33] B.B. Jakovljevic, Z.S. Kanovic, and Z.D. Jelicic, "Induction motor broken bar detection using vibration signal analysis, principal component analysis and linear discriminant analysis", 2012 IEEE International Conference on Control Applications, pp.1686,1690.
[34] E.G. Strangas, S. Aviyente, and S.S.H. Zaidi, "Time–Frequency Analysis for Efficient Fault Diagnosis and Failure Prognosis for Interior Permanent-Magnet AC Motors", IEEE Transactions on Industrial Electronics, vol.55, no.12, pp.4191-4199, Dec. 2008.
[35] R. Casimir, E. Boutleux, and G. Clerc, "Fault diagnosis in an induction motor by pattern recognition methods," 2003 EEE International Symposium on Diagnostics for Electric Machines, Power Electronics and Drives, SDEMPED 2003, pp.294-299, 24-26.
[36] C.T. Kowalski and T. Orlowska-Kowalska, "Neural networks application for induction motor faults diagnosis," Mathematics and Computers in Simulation, vol. 63, pp. 435-448, Nov. 2003.
[37] M.Y. Chow, P.M. Mangum, and S.O. Yee, "A neural network approach to real-time condition monitoring of induction motors," IEEE Trans. Ind. Electron., vol. 38, no. 6, pp. 448–453, Dec. 1991.
[38] F. Filippetti, G. Franceschini, and C. Tassoni, "Neural networks aided online diagnostics of induction motor rotor faults, " IEEE Trans. Ind. Appl., vol. 31, no. 4, pp. 892–899, Jul./Aug. 1995.
167167

[39] H. Su and K. T. Chong, "Induction machine condition monitoring using neural network modeling," IEEE Trans. Ind. Electron., vol. 54, no. 1, pp. 241–249, Feb. 2007.
[40] M.S. Ballal, Z.J. Khan, H.M. Suryawanshi, and R.L. Sonolikar, "Adaptive Neural Fuzzy Inference System for the Detection of Inter- Turn Insulation and Bearing Wear Faults in Induction Motors," IEEE Trans. Ind. Electron., vol. 54, no. 1, pp. 250-258, Feb. 2007.
[41] S. Altug, M.-Y. Chen, and H. J. Trussell, "Fuzzy inference systems implemented on neural architectures for motor fault detection and diagnosis," IEEE Trans. Ind. Electron., vol. 46, no. 6, pp. 1069–1079, Dec. 1999.
[42] L. A. García-Escudero, O. Duque-Perez, D. Morinigo-Sotelo, and M. Perez-Alonso, “Robust condition monitoring for early detection of broken rotor bars in induction motors,” Expert Systems with Applications, vol. 38(1), pp. 2653-2660, 2011.
[43] A. Widodo, B. S. Yang, and T. Han, “Combination of independent component analysis and support vector machines for intelligent faults diagnosis of induction motors,” Expert Systems with Applications, vol. 32, pp. 299–312, 2007.
[44] Lu Shuang and Li Meng, "Bearing Fault Diagnosis Based on PCA and SVM," 2007 International Conference on Mechatronics and Automation, ICMA 2007, pp.3503,3507, 5-8.
[45] Lu Shuang and Yu Fujin, "Fault Pattern Recognition of Bearing Based on Principal Components Analysis and Support Vector Machine," 2009 Second International Conference on Intelligent Computation Technology and Automation, ICICTA '09, vol.2, pp.533-536.
[46] Han Sang-Bo, Don-Ha Hwang, Sang-Hwa Yi, and Dong-Sik Kang, "Development of diagnosis algorithm for induction motor using flux sensor," 2008 International Conference on Condition Monitoring and Diagnosis, CMD 2008, pp.140-142.
[47] S.P. Santos and J.A.F. Costa, "A Comparison between Hybrid and Non-hybrid Classifiers in Diagnosis of Induction Motor Faults," 2008 11th IEEE International Conference on Computational Science and Engineering, CSE '08, pp.301-306.
[48] B. Ayhan, Chow Mo-Yuen, and Song Myung-Hyun, "Multiple Discriminant Analysis and Neural-Network-Based Monolith and Partition Fault-Detection Schemes for Broken Rotor Bar in Induction Motors", IEEE Transactions on Industrial Electronics, vol.53, no.4, pp.1298-1308, June 2006.
[49] B. Ayhan, Chow Mo-Yuen, and Song Myung-Hyun, "Multiple signature processing-based fault detection schemes for broken rotor bar in induction motors," IEEE Transactions on Energy Conversion, vol.20, no.2, pp.336-343, June 2005
[50] F. Filippetti, G. Franceschini, C. Tassoni, and P Vas, "Impact of speed ripple on rotor fault diagnosis of induction machines," in Proc. 1994 International Conference of Electric Machines and Drives (ICEM94), pp 452-456, 1994.
[51] G. H. Dunteman and H. George, Brief description: principal component analysis. London: Sage, 1989.
[52] R. O. Duda, P. E. Hart, and D. G. Stork, Pattern classification. John Willy and sons, Inc., 2001.
[53] B. Efron, “Estimating the error rate of a prediction rule: Improvement on cross-validation,” Journal of the American Statistical Association, vol. 78, pp. 316-331, 1983.
[54] B. Efron and R. Tibshirani, "Improvements on cross-validation: The 632+ bootstrap method,” J. Amer. Statist. Assoc., vol. 92, pp. 548–560, 1997.
VIII. BIOGRAPHIES
M. Fernandez-Temprano received the B.S and Ph.D. degrees in Mathematics from the Universidad de Valladolid (UVA) in Spain in 1991 and 1995 respectively. He is currently with the Department of Statistics and Operations Research where he is Full Professor. His main research fields are reliability engineering, order restricted inference and circular data. P.E. Gardel-Sotomayor received the B.S. degree in Electromechanical Engineering from the National University of Asuncion (UNA), Paraguay, in 2006. He is currently a Ph.D. student at the University of Valladolid, Spain. His research interests are monitoring of induction machines and electric power system optimization. O. Duque-Perez received the B.S. and Ph.D. degrees in Electrical Engineering from the University of Valladolid (UVA), Spain, in 1992 and
2000, respectively. In 1994, he joined the E.T.S. de Ingenieros Industriales, UVA, where he is currently Full Professor with the Research Group in Predictive Maintenance and Testing of Electrical Machines, Department of Electrical Engineering. His main research fields are power systems reliability, condition monitoring, and heuristic optimization techniques. D. Morinigo-Sotelo (M’04) received the B.S. and Ph.D. degrees in Electrical Engineering from the University of Valladolid, Valladolid, Spain, in 1999 and 2006, respectively. He is currently with the Research Group in Predictive Maintenance and Testing of Electrical Machines, Department of Electrical Engineering, University of Valladolid and is a Research Collaborator in Electromagnetic Processing of Materials with the Light Alloys Division, CIDAUT Foundation, Valladolid. His current research interests also include condition monitoring of induction machines, optimal electromagnetic design, and heuristic optimization techniques.
168168
Related Documents