BROILER GROWTH MODELS DYNAMICALLY INTERFACING METABOLIC EFFICIENCY WITH THE PRODUCTION ENVIRONMENT By LELAND JAMES MCKINNEY Bachelor of Science Kansas State University 1998 Master of Science Kansas State University 2000 Submitted to the Faculty of the Graduate College of Oklahoma State University in partial fulfillment of the requirements for the Degree of DOCTOR OF PHILOSOPHY May, 2005

Welcome message from author
This document is posted to help you gain knowledge. Please leave a comment to let me know what you think about it! Share it to your friends and learn new things together.
Transcript
BROILER GROWTH MODELS DYNAMICALLY
INTERFACING METABOLIC EFFICIENCY
WITH THE PRODUCTION
ENVIRONMENT
By
LELAND JAMES MCKINNEY
Bachelor of Science Kansas State University
1998
Master of Science Kansas State University
2000
Submitted to the Faculty of the Graduate College of Oklahoma State University in partial fulfillment
of the requirements for the Degree of DOCTOR OF PHILOSOPHY
May, 2005

ii
BROILER GROWTH MODELS DYNAMICALLY
INTERFACING METABOLIC EFFICIENCY
WITH THE PRODUCTION
ENVIRONMENT
Dissertation Approved:
Robert Teeter
Dissertation Adviser Scott Carter
Clinton Krehbiel
James Breazile
A. Gordon Emslie
Dean of the Graduate College

iii
TABLE OF CONTENTS Chapter …………………………………………………………………. Page I. INTRODUCTION …………………………………………………….. 1 II. REVIEW OF THE LITERATURE ……………………………….…… 9
Energy Evaluation ……………………………………………….……. 9 Broiler Management ……………………………………………….….. 10 Pelleting as a Nonnutritive Factor Influencing Broiler Performance ...… 11 Pelleting and Dietary Lysine Requirement ……………………….….... 12 Dual Energy X-Ray Absorptiometry as a Method for Rapidly Determining Body Composition in Poultry ………………………………………....
14
References ………………………………………….……………...….. 16 III. Refinement of Novel Estimations of Poultry Body Composition and
Evaluation Dual Energy X-Ray Absorptiometry as a Method for Rapid Broiler Body Composition Assessment .....…………….……………..
26 Abstract ……………………………………………….……………… 27 Introduction …………………………………………….…………….. 28 Materials and Methods ……………………………….………………. 30 Results and Discussion ……………………………….………………. 32 References …………………………………………….…………….... 36
IV. Predicting Effective Caloric Value of Nonnutritive Factors: I. Pellet
Quality and II. Prediction of Consequential Formulation Dead Zones ………………………………………………………………….
50 Abstract ………………………………………….…………………… 51 Introduction ……………………………………….………………….. 52 Materials and Methods …………………………….…………………. 54 Results and Discussion …………………………….…………………. 58 References …………………………………………….……………… 66
V. Predicting Effective Caloric Value of Nonnutritive Factors: III. Feed
Form Impacts Broiler Performance by Modifying Behavior Patterns ……………………………………………………….…..…...
81 Abstract ……………………………………………………….……… 82 Introduction …………………………………………………….…….. 83 Materials and Methods ……………………………………….………. 85 Results and Discussion ………………………………………….……. 89 References ……………………………………………………………. 97

iv
Chapter …………………………………………………………………… Page VI. Predicting Effective Caloric Value of Nonnutritive Factors: IV. Nutrient
to calorie ratios as influenced by pelleting ……..……………………
106 Abstract …………………………………………..………………… 107 Introduction ……………………………………..………………….. 108 Materials and Methods ………………………..……………………. 109 Results and Discussion …………………………..…………………. 113 References ……………………………………..……………………. 118
VII. A Novel Approach for Determining the Efficiencies of Metabolizable Energy Utilization for Protein and Lipid Tissue Accretion in Broilers ………………………………………………………………
128 Abstract ……………………………..……….……………………… 129 Introduction …………………………...…………………………….. 130 Materials and Methods ……………..….……………………………. 131 Results and Discussion ……………..….……………………………. 133 References …………………………..………………………………. 137 Appendix …………………………..………………………………. 149

v
LIST OF TABLES
Table ………………………………………………………….. Page Chapter II
1. Reported estimates for efficiencies of metabolizable energy use for protein (kp) and fat (kf) tissue accretion ……………………………………….....
22
Chapter III
1. Carbon and nitrogen concentrations in the whole carcass and protein and lipid factions of broilers ………………………………………………….
39
2. Ether extract predicted from protein and lipid tissue carbon and nitrogen concentrations ……………………………...…………………………….
40
3. Regression equation of water content (W) on protein (P) and lipid (L) in whole bird carcasses (W = a + b P + c L) ………………………………..
41
4. Regression equation coefficients relating dual energy x-ray absorptiometry (DEXA) measurements with proximate analysis values ………………
42
5. Comparison of adjusted dual energy x-ray absorptiometry (αDEXA) and proximate analysis measurements of total broiler protein, fat, ash, water, and body weight …………………………………………………….………..
43 6. Proposed equation coefficients relating dual energy x-ray absorptiometry
(DEXA) measurements with proximate analysis values for broilers weighing more than 3000 grams ………………………………………...
44
Chapter IV 1. Composition of diets used in Experiment 1 ……………………………... 70 2. Composition of diets used in Experiment 2 ……………………………... 71 3. Body weight, feed and energy consumption, and feed conversion ratio by
dietary treatment, Experiment 1 ……………………………...………….
72 4. Carcass composition by dietary treatment, Experiment 1 ………………. 73 5. Regression equation coefficients relating body weight (BW) and feed conversion
ratio (FCR) and caloric density, expressed both as cumulative and daily values ……………………………………………………………………………
74 6. Growth performance and behavior traits of 38-day old broilers fed a diet of
varying pellet quality1 during a 7 d assessment of feed conversion, Experiment 2 ……………………………………………………………..
75 7. Dietary caloric value of changing pellet quality ………………………… 76 8. Interactive effects of added fat and pellet quality on dietary caloric gain
(MEn/kg) …………………………………………………………………..
77

vi
Table ………………………………………………………….. Page Chapter V
1. Broiler performance, energy, and behavior traits of two strains of broilers fed either pellets or mash from 23 to 30 d of age, Trial 1 ………………
100
2. Correlations among traits measured1, Trial 1 …………………………... 101 3. Broiler performance, energy, and behavior traits of two strains of broilers
fed either pellets or mash from 37 to 44 d of age, Trial 2 ……….……...
102 4. Correlations among traits measured1, Trial 2 ………………………………….. 103
Chapter VI 1. Composition of diets used to rear broilers to the ages evaluated in
Experiments 1, 2, and 3 ………………………………………………….
122 2. Basal diets used in Experiments 1, 2, and 3 ……………………………... 123 3. Broiler growth performance and whole body protein and lipid deposition
and retention efficiencies as influenced by dietary treatment, Experiment 1 ……………………………………………………………..
124 4. Broiler growth performance and whole body protein and lipid deposition
and retention efficiencies as influenced by dietary treatment, Experiment 2 ……………………………………………………………..
125 5. Broiler growth performance and whole body protein and lipid deposition
and retention efficiencies as influenced by dietary treatment, Experiment 3 ……………………………………………………………..
126
Chapter VII 1. Composition of the basal diets used for Experiments 1 and 2 …………... 139 2. Chemical composition of the basal diets used for Experiments 1 and 2 ….. 140 3. General outline of treatment combinations in Experiments 1 and 2 ……… 141 4. Data utilized for estimating kp and kf values (data from Experiments 1 and 2
were pooled) ……………………………………………………………..
142 5. Linear regression equations for determining maintenance energy
requirement …………………………………………………………………
143 6. Results of regression analysis to determine the efficiencies of energy
utilization for protein and lipid retention ………………………………….
144

vii
LIST OF FIGURES
Figure ………..…………………………………………………………….... Page Chapter II
1. Factors affecting pellet durability ………………………………………..... 24 2. Dual energy x-ray absorptiometry scan image and results of a chicken …... 25
Chapter III
1. Ether extract estimated using proposed carbon and nitrogen contents of protein and lipid and the corresponding residual errors ……...………….
45
2. Dual energy x-ray absorptiometry scan image and results of a chicken …... 46 3. Relationship between body composition measured by dual energy x-ray
absorptiometry (DEXA) and proximate analysis …………………………
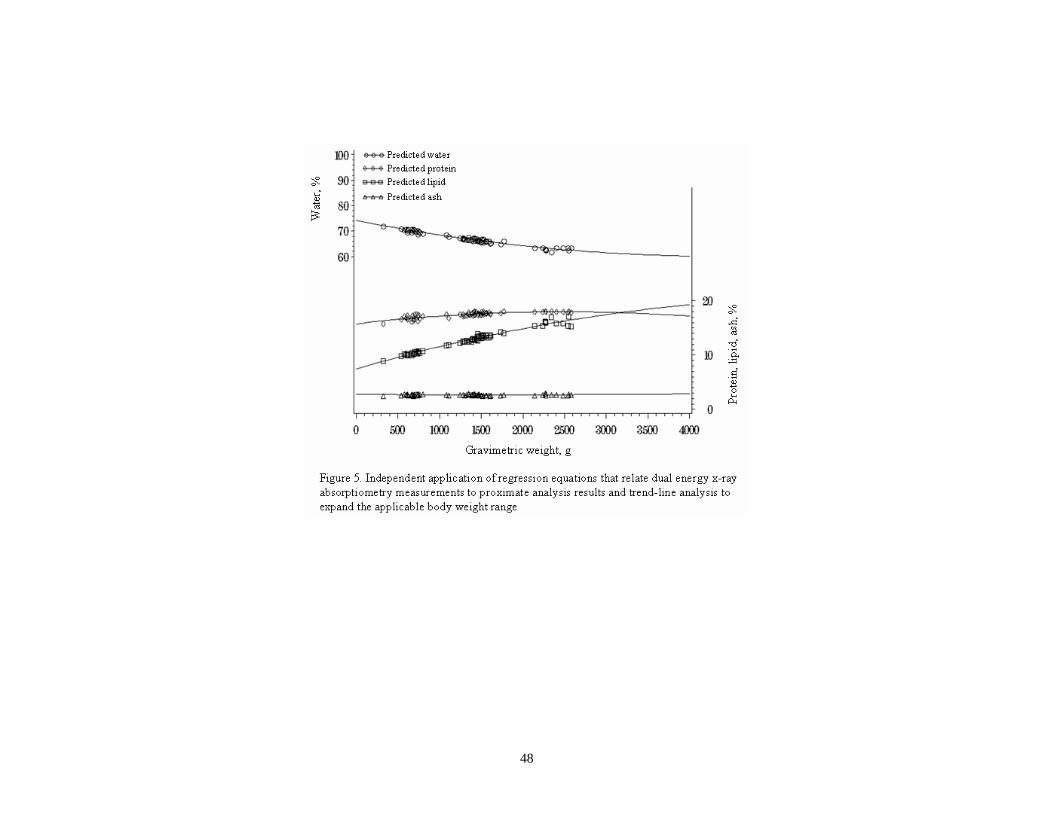
47 4. Independent application of regression equations that relate dual energy x-ray
absorptiometry measurements to proximate analysis results and trend line analysis to expand the applicable body weight range …………………….
48 5. Broiler water, protein, lipid and ash predicted from regression equations that
DEXA measurements with proximate analysis results
Chapter IV
1. Relationship among body weight, conventionally-calculated feed conversion ratio (CFCR), and dietary energy …………………………………………
78
2. Relationship among body weight, feed conversion ratio calculated on a daily basis (DFCR), and dietary energy …………………………………………
79
3. Pelleting and pellet quality effects on dietary caloric density and broiler behavior ………………………………………………………………….
80
Chapter V
1. Interactive relationship among percent time eating (EAT) and percent time resting (REST) and effective caloric value ………………………………
104
2. Relationship between feed intake and percent time birds were observed eating ……………………………………………………………………..
105
Chapter VI
1. Recommended and predicted total and digestible daily lysine requirement of male and female broilers …………………………………………………
127

viii
Figure ………..…………………………………………………………….... Page Chapter VII
1. Relationship between metabolizable energy intake (MEI) and energy retention in broilers ………………………………………………………..
145
2. Relationship between energy retained as protein and lipid ……………….. 146 3. Illustration of predicting metabolizable energy intake (MEI) using a matrix
of efficiencies of energy utilization for protein (kp) and lipid (kf) tissue retention …………………………………………………………………..
147 4. Utilizing a matrix of kp and kf to predict MEI …………………………… 148

1
CHAPTER I
INTRODUCTION
Within the last century, broiler production in the United States has evolved from small
“backyard” flocks into a multi-million dollar sector of agriculture. Overall, U.S. broiler
meat production for 2005 is projected to be close to 16 million metric tons, which is
approximately 40% of the total animal protein market (Haley, 2005). The broiler
industry’s success in part can be attributed to its vertically integrated corporate structure,
which to a certain extent provides continuity among broiler flocks. Nonetheless, due to
differing facilities and equipment, as well as environmental and animal welfare concerns,
broilers are inevitably reared under varying circumstances, particularly from a global
perspective.
Nonnutritive factors such as stocking density (Cravener et al., 1992; Puron et al.,
1997), lighting program (Buyse et al., 1996; Ingram et al., 2000), ventilation (Lott et al.,
1998; Yahav et al., 2004) and feed form (Acar et al., 1991; Scheideler, 1995; Moritz et
al., 2001) are well documented throughout the literature to impact bird performance.
Though the precise mode of action by which such nonnutritive factors impact broiler
performance may be subject to debate, one could surmise each as having a nutritional
consequence to the bird. Given the varying conditions in which broilers are reared
throughout the world, and that the nutritional positive or negative consequences of those

2
conditions are more or less a guess, the expression “nutrition is more of an art than a
science” has credence.
Broiler management aside, there is an inherent caloric cost associated with accretion
of lean and lipid tissues, the associated inefficiencies of which contribute to heat
production. In an effort to quantify these costs, Kielanowski (1965) subdivided retained
energy as follows: ME = MEm + (1/kp × ERP) + (1/kf × ERF), where: ME =
metabolizable energy intake, MEm = metabolizable energy required for maintenance,
ERP = energy retained as protein, ERF = energy retained as fat, kp = efficiency of energy
utilization for protein, and kf = efficiency of energy utilization for fat. And through
regression analysis obtained values for MEm, kp, and kf. Proposed values for kp and kf are
shown in Table 1. This regression approach, however, has received criticism due to the
autocorrelation among the variables (Emmans, 1994; Noblet et al., 1999), and its inability
for separating metabolizable energy into contributing dietary substrates (Noblet et al.,
1993). Utilizing mechanistic models based on theoretical biochemical costs and returns
has been suggested as a solution to these criticisms (van Milgen, 2002). However, as
Birkett and de Lange (2001) pointed out, solid experimental observations are lacking and
the metabolic detail required in a mechanistic model is essentially noise when viewed at
the higher spatial level.
Any approach to estimating the efficiency of energy utilization for tissue accretions
requires a sound understanding of energy required for maintenance. Errors or
assumptions made relative to the maintenance energy requirement carries-over resulting
in an over or under estimation of energy available for gain and ultimately false estimates
for the metabolic costs of tissue accretion. Nonetheless, relatively little research as of

3
late that has been directed at understanding maintenance energy need in broilers or
factors that may alter maintenance energy requirement.
Mathematical models have long been utilized to describe broiler growth (Zoons et al.
1991), evaluate feedstuffs (MacLeod, 2000), compute nutrient requirements (Oviedo-
Rondon and Waldroup, 2002) and understand managerial consequences on broiler
performance (Cobb Vantress, 2003). Provided that the body of data is such to underpin
proposed predictive models, these equations serve as an invaluable tool in making
decisions. However, application of such models require either that conditions mimic
those under which the model was developed or the flawed assumption that nutrition and
management are separate entities of broiler production. The latter introduces error into
the predicted values, potentially resulting in spurious interpretations.
Historically, comparative slaughter has been the most commonly used method for
evaluating nutritional and/or managerial effects on broiler body composition. This
methodology, however, is time consuming, difficult to apply to an entire growth curve,
and requires bird destruction as well as the assumption that the composition of birds
initially examined are the same as those incorporated into an experiment (Blaxter, 1967).
Recently, dual energy x-ray absorptiometry (DEXA) has been proposed as a method for
measuring bone density and content in poultry (Schreiweis, 2003; and Onyango, 2004).
Additionally, a large body of evidence exists validating the use of this technology for
assessing soft tissues in swine (Lukashi et al., 1999; Chauhan et al., 2003; and Koo et al.,
2004). An experiment conducted by Mitchell et al. (1997), however, is the only known
evaluation of DEXA for quantifying lean and lipid tissues in poultry. Though this report
was largely inconclusive, it did suggest that DEXA could potentially be utilized to

4
rapidly quantify broiler body composition and enable the option of returning that bird
back to production. More work is needed, however, to validate this technology.
Studies described herein were designed with the intent of addressing areas outlined
above where current knowledge is lacking. More specifically, in Chapter 3, DEXA was
evaluated as a method for rapidly quantifying broiler body composition. Chapters 4 and
5 focus on developing mathematical models to describe the caloric costs associated with
broiler management decisions that impact activity energy expenditure. Chapter 6 utilizes
this methodology in evaluating dietary nutrient-calorie ratio under varying broiler
management conditions. Lastly in Chapter 7, experiments were directed at first,
quantifying metabolizable energy required for maintenance and tissue accretion, and
second, to propose methodology for calculating the efficiencies of metabolizable energy
use for protein and lipid tissue accretion.

5
REFERENCES
Acar, N., E. T. Moran, Jr., W. H. Revingtion, and S.F. Bilgili. 1991. Effect of improved
pellet quality from using a calcium lignosulfonate binder on performance and
carcass yield of broilers reared under different marketing schemes. Poult. Sci.
70:1339-1344.
Birkett, S. and K. de Lange. 2001. Limitations of conventional models and a conceptual
framework for a nutrient flow representation of energy utilization by animals. Br.
J. Nutr. 86:647-659.
Blaxter, K. L. 1967. Nutrition balance techniques and their limitations. Proc. Nutr. Soc.
26:86-96.
Buyse, J., E. R. Kuhn, and E. Decuypere. 1996. The use of intermittent lighting in
broiler raising. 1. Effect on broiler performance and efficiency of nitrogen
retention. Poult. Sci. 75:589-594.
Chauhan, S., W.W.K. Koo, M. Hammami, and E. Hockman. 2003. Fan beam dual energy
x-ray absorptiometry body composition measurements in piglets. Journal of the
American College of Nutrition 22:408-414.
Cravener, T. L., W. B. Roush, and M. M. Mashaly. 1992. Broiler production under
varying population densities. Poult. Sci. 71:427-433.
Cobb Vantress, Inc. 2003. Cobb Broiler Nutrition Guide. Cobb-Vantress, Inc. Siloam
Springs, AR.
Emmans, G. C. 1994. Effective energy: A concept of energy utilization applied across
species. Br. J. of Nutr. 71:801-821.

6
Haley, M. M. 2005. Livestock, Dairy, and Poultry Outlook.United States Department of
Agriculture Report. www.ers.usda.gov.
Ingram, D. R., L. F. Hatten, III, and B. N. McPherson. 2000. Effects of light restriction
on broiler performance and specific body structure measurements. J. Appl. Poult.
Res. 9:501-504.
Kielanowski, J. 1965. Estimates of the energy cost of protein deposition in growing
animals, In: Proceedings of the 3rd Symposium on Energy Metabolism. Page 13 –
18. Ed. K. L. Blaxter. Academic Press, London.
Koo, W. W. K., M. Hammami, E. M. Hockman. 2004. Validation of bone mass and body
composition measurements in small subjects with pencil beam dual energy x-ray
absorptiometry. Journal of the American College of Nutrition 23:79-94.
Lukaski, H. C., M. J. Marchello, C. B. Hall, D. M. Schafer, and W. A. Siders. 1999. Soft
tissue composition of pigs measured with dual x-ray absorptiometry: comparison
with chemical analyses and effects of carcass thickness. Nutrition 15:697-703.
MacLeod, M. G. 2000. Modeling the utilization of dietary energy and amino acids by
poultry. Pages 393-412 In: Feeding systems and feed evaluation models. Ed.
Theodorou, M. K. and J. France. CAB International.
Mitchell, A. D., R. W. Rosebrouch, and J. M. Conway. 1997. Body composition analysis
by dual energy x-ray absorptiometry. Poult. Sci. 76:1746-1752.
Moritz, J. S., R. S. Beyer, K. J. Wilson, K. R. Cramer, L. J. McKinney, and F. J.
Fairchild. 2001. Effect of moisture addition at the mixer to a corn-soybean based
diet on broiler performance. J. Appl. Poult. Res. 10:347-353.

7
Noblet, J. X. S. Shi, and S. Dubois. 1993. Metabolic utilization of dietary energy and
nutrients for maintenance energy requirements in sows: basis for a net energy
system. Br. J. Nutr. 70:407-419.
Noblet, J., C. Karege, S. Dubois, and J. van Milgen. 1999. Metabolic utilization of energy
and maintenance requirements in growing pigs: effect of sex and genotype. J.
Anim. Sci. 77:1208-1216.
Onyango, E. M., P. Y. Hester, R. Stroshine, and O. Adeola. 2003. Bone densitometry as
an indicator of percentage tibia ash in broiler chicks fed varying dietary calcium
and phosphorus levels. Poult. Sci. 82:1787-1791.
Oviedo-Rondon, E. O., and P. W. Waldroup. 2002. Models to estimate amino acid
requirements for broiler chickens: a review. Int. J. Poult. Sci. 5:106-113.
Puron, D., R. Santamaria, and J. C. Segura. 1997. Sodium bicarbonate and broiler
performance at high stocking densities in a tropical environment. J. Appl. Poult.
Res. 6:443-448.
Scheideler, S. E. 1995. Is pelleting cost effective? Feed Mangement. Vol 46, No. 1. p
21-26
Schreiweis, M. A., J. I. Orban, M. C. Ledur, D. E. Moody, and P. Y. Hester. 2004.
Effects of ovulatory and egg laying cycle on bone mineral density and content of
live white leghorns as assessed by dual-energy x-ray absorptiometry. Poult. Sci.
83:1011-1019.
van Milgen, J. 2002. Modeling biochemical aspects of energy metabolism in mammals. J.
Nutr. 132:3195-3202.

8
Yahav, S., A. Straschnow, D. Luger, D. Shinder, J. Tanny, and S. Cohen. 2004.
Ventilation, sensible heat loss, broiler energy, and water balance under harsh
environmental conditions. Poult. Sci. 83:253-258.
Zoons J., J. Buyse, and E. Decuypere. 1991. Mathematical models in broiler raising.
World’s Poultry Science Journal. 47:243-255.

9
CHAPTER II
REVIEW OF LITERATURE
ENERGY EVALUATION
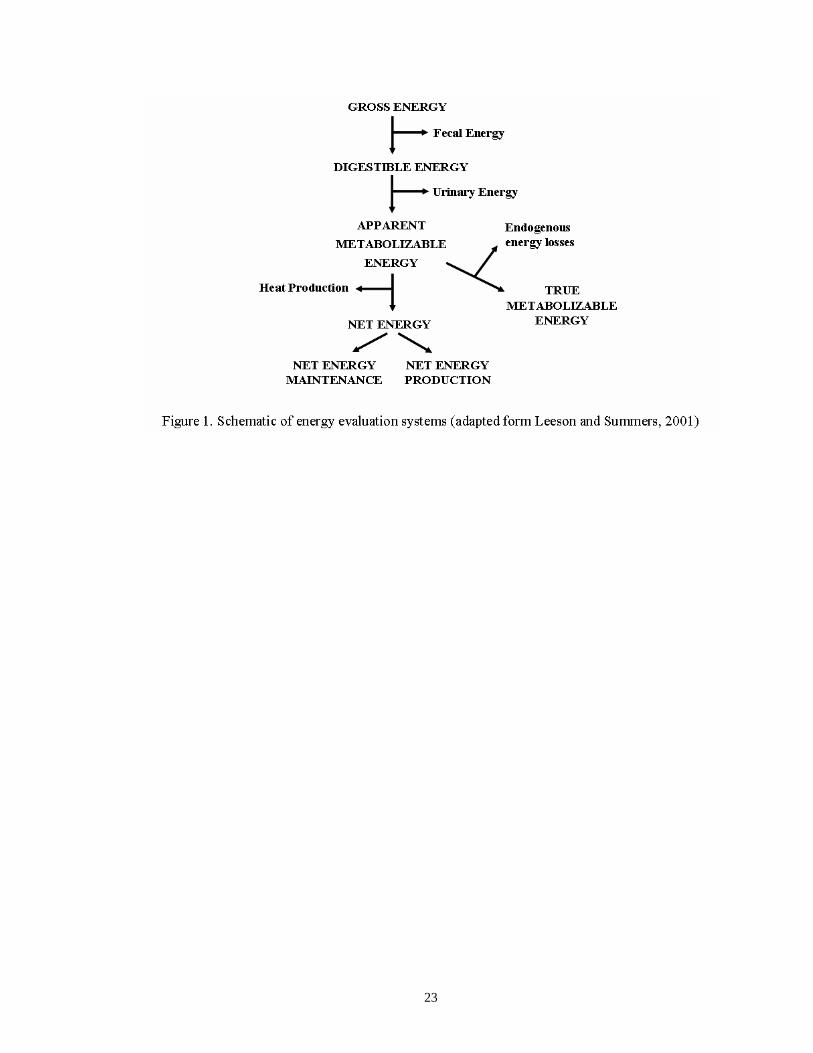
Energy value of feedstuffs may be expressed in a variety of ways as illustrated in
Figure 1. Gross or combustible energy is certainly the simplest most straight forward
measure, however from a nutritional perspective, gross energy offers little meaningful
information relative to a feedstuffs energy value. Gross energy minus the energy from
the combustion of the feces yields digestible energy, which with the use of indigestible
tracers, is also easily quantified in mammals. In avian species however, digestible energy
is difficult to attain as feces and urine are excreted together via the cloaca. Conversely,
because birds excrete feces and urine simultaneously, quantification of metabolizable
energy (gross energy minus the energy excreted as feces and urine) is simplified. Overall,
net energy offers the most accurate assessment of dietary energy available to an animal,
as calories lost as heat due to maintenance of basal metabolism, activity, and production
(i.e., tissue and eggs) are accounted.
Though net energy fully accounts for energetic inefficiencies, a net energy system is
difficult to establish. The difficulty lies not only with the experimental facilities and
equipment (i.e., calorimetric chambers) required for net energy determination, but also
with the practical application given the numerous factors that influence heat production
such as tissue type synthesized (MacLeod, 1997), ambient temperature (Beker, 1996), as
10
well as rearing condition effects on broiler activity (Jensen, 1962; Ohtani and Leeson,
2000; McKinney and Teeter, 2004). As a consequence of these obstacles, and the fact
that metabolizable energy can be rapidly and precisely determined (Sibbald, 1976;
McNab and Blair, 1988) and adjusted to account for nitrogen excretion (8.22 kcal/g
nitrogen retained; Hill and Anderson, 1958) and endogenous losses, metabolizable energy
remains the standard measure for evaluating energy available for maintenance and
production for poultry.
BROILER MANANGEMENT
Flock managers face making broiler husbandry decisions daily. Decisions that
ultimately impact growth and the efficiency of feed utilization for maintenance and
production. For example, feed processing techniques such as pelleting have been touted
for beneficial effects on poultry performance (Acar et al., 1991; Scheideler, 1995; Moritz
et al., 2001). Likewise numerous managerial – husbandry decisions related to stocking
density (Cravener et al., 1992; Puron et al., 1997), lighting program (Buyse et al., 1996;
Ingram et al., 2000), and ventilation (Lott et al., 1998) are well known to impact BW and
feed conversion ratio (FCR). Though the precise mode of action by which such
nonnutritive factors impact poultry performance is considered disjoint from nutrition in
application, their use is critical to successful poultry production. However, since growth
rate and FCR are also related to nutrition, the traditional approach of separating
nonnutritive factors that impact average daily gain and FCR from nutrition must be
questioned.

11
PELLETING AS A NONNUTRITIVE INFLUENCING BROILER PERFORMANCE
A general definition of the pelleting process is “the agglomeration of small particles
into larger particles by the means of a mechanical process in combination with moisture,
heat, and pressure” (Falk, 1985). Pelleting was introduced to the united states in the
1930’s and today virtually all broiler and turkey feeds undergo this process. In addition
to growth performance benefits obtained by feeding pellets, pelleting improves feed
handling characteristics (i.e. dustiness and flowability) and reduces the incidence of
pathogenic organisms (Fairfield, 1994). However, the most commonly touted advantages
to pelleting is the growth and feed efficiency improvements realized (Acar et al., 1991;
Scheideler, 1995; Moritz et al., 2001).
There has been much debate as to the mode of action by which broilers benefit from
pelleting. Initially, it was thought that via steam conditioning and extrusion of the feed
through the pellet die, the integrity of the starch granules and proteins were disrupted in a
manner that improved diet digestibility (Behnke, 1996). This may indeed be an accurate
conclusion with respect to swine (Hancock and Behnke, 2001). However with poultry,
the majority of evidence does not support any pelleting effects on protein or energy
digestion (Husser and Roblble 1962; Bolton, 1960; Sibbald, 1977).
It was work reported by Jensen (1962) that brought forth the notion that pelleting
enhances bird performance by reducing energy expenditure for prehension thereby
yielding more energy available for tissue accretion. In this study (Jensen, 1962) birds
were provided either mash or pellets and then observed for time spent feeding, number of
times the feeder was visited, and feed disappearance. It was reported that birds fed mash

12
spent approximately 14.3% of a 12 hour day eating verses 4.7% observed for birds fed
pellets.
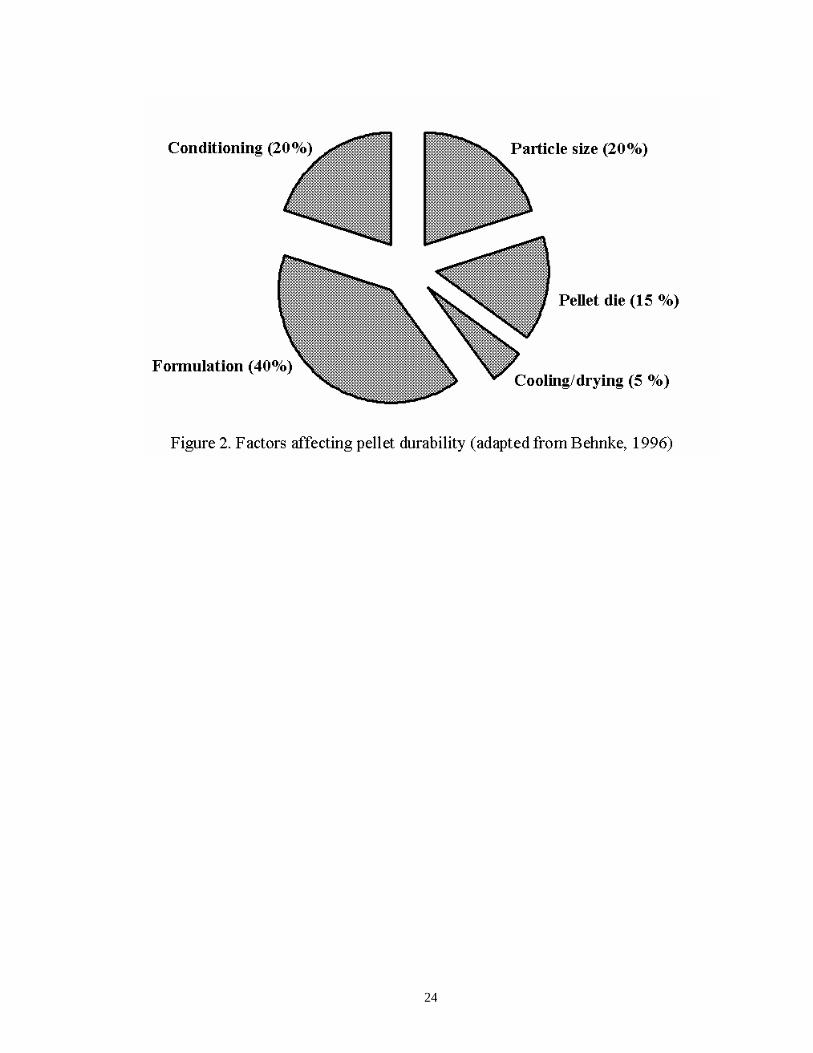
In accepting the premise that pelleting enhances bird performance by reducing activity
energy expenditure, emphasis must be given to pellet quality. Indeed, obtaining feeds
where zero pellet breakage occurs is practically unattainable. However several factors
determine the amount of pellet breakage that takes place (Figure 2). Within the feed mill,
diet formulation, particle size of the mash, conditioning time and temperature, pellet die
thickness, and cooling and drying time, contribute to pellet quality (Behnke, 1996). The
proportion of intact pellets presented to the bird further depends on feed delivery systems
on the trucks and within the broiler house (Scheideler, 1995).
Paramount among nutritional goals is the reasonable balance between dietary
provision of nutrients and energy. However, numerous nonnutritive factors, such as those
related to feed processing and general husbandry that modify broiler behavior (Skinner-
Noble, 2005), are generally not considered as variables directly influencing the desired
ration formula. This failure to account for variations in calories lost or spared due to
broiler activity modification eventually has the net result of creating an uncertain ratio of
ingested energy available for tissue accretion to dietary protein and other nutrients.
PELLETING AND DIETARY LYSINE REQUIREMENT
In practical corn-soybean meal based broiler diets, methionine is considered first
limiting followed by lysine, arginine, valine, and threonine (Han et al., 1992). However,
lysine is the amino acid to which all others are proportionally related (Baker and Han,
1994; Baker, 1997). This is because lysine has no major precursor role and has been the

13
subject of extensive evaluation under a wide range of dietary and environmental
circumstances (Han and Baker, 1993; Emmert and Baker, 1997). Furthermore, lysine is
generally expressed in ratio with dietary caloric density, as dietary energy largely
regulates voluntary consumption (Leeson et al., 1996; McKinney and Teeter, 2004). By
expressing dietary nutrients on a digestible basis, and in proportion to one another,
nutritionists are better able to adjust nutrient specification in the face of changing
nutritional needs (i.e., climate, sex) or feedstuff source, while maintaining an “ideal”
balance of dietary amino acids and energy.
As lysine is viewed as a pivotal amino acid in broiler rations, recent work has focused
on evaluating whether lysine need is influenced by pelleting (Greenwood et al., 2004a,
2004b). The basis for this stems from a report compiled by Jensen (1965), in which diets
of sub-optimal lysine and protein levels were fed either as mash or pellets to broad
breasted bronze turkeys. It was concluded that pelleting exacerbated the lysine
deficiency because pelleting enhanced the productive energy of the diet (Reddy et al.,
1962), thereby resulting in an energy-lysine imbalance.
This was re-evaluated by Greenwood et al. (2004) in an experiment of factorial
design, where dietary lysine (0.85, 0.95, and 1.05%), caloric density (3,050 and 3,200
kcal ME/kg diet), and feed form (mash verses pellets) were fed to broilers. Greenwood et
al. (2004) reported significantly higher body weight gain in broilers fed pellets and the
highest level of protein. It was concluded that pelleting provides more energy for weight
gain (via reduced activity energy expenditure) thus increasing the need for lysine to
support tissue accretion.

14
Interestingly, feeding the low energy (3,050 kcal ME/kg diet) diet as pellets compared
with the higher energy (3,200 kcal ME/kg diet) diet, fed as mash, resulted in similar
growth performance. One could surmise from this that birds do not differentiate between
energy spared from reduced activity and energy provided in the diet. If this is the case,
activity energy expenditure should be considered in establishing nutrient:energy ratios.
DUAL ENERGY X-RAY ABSORPTIOMETRY AS A METHOD FOR RAPIDLY DETERMINING BODY COMPOSITION IN POULTRY Numerous methods exist for estimating the body composition of animals used in
nutritional studies (Hendrick, 1983; Topel and Kauffman, 1988). Historically though,
body composition assessment of poultry has been most often achieved by comparative
slaughter. This method is time consuming, difficult to apply to an entire growth curve,
and requires bird destruction as well as the assumption that the composition of birds
initially examined is the same as those incorporated into an experiment (Blaxter, 1967).
Advancements in dual energy x-ray absorptiometry (DEXA) have resulted in the
availability of instruments that utilize a slit collimator coupled with multidetector array
(fan beam x-ray pattern; Koo et al., 2004). This decreases the time required to complete
a scan, as compared with the pencil beam type instruments, without yielding accuracy or
precision (Koo et al., 2004).
This has sparked interest in the use of DEXA technology as a non-invasive method for
assessing body compositional responses to nutritional regimes in animals reared for
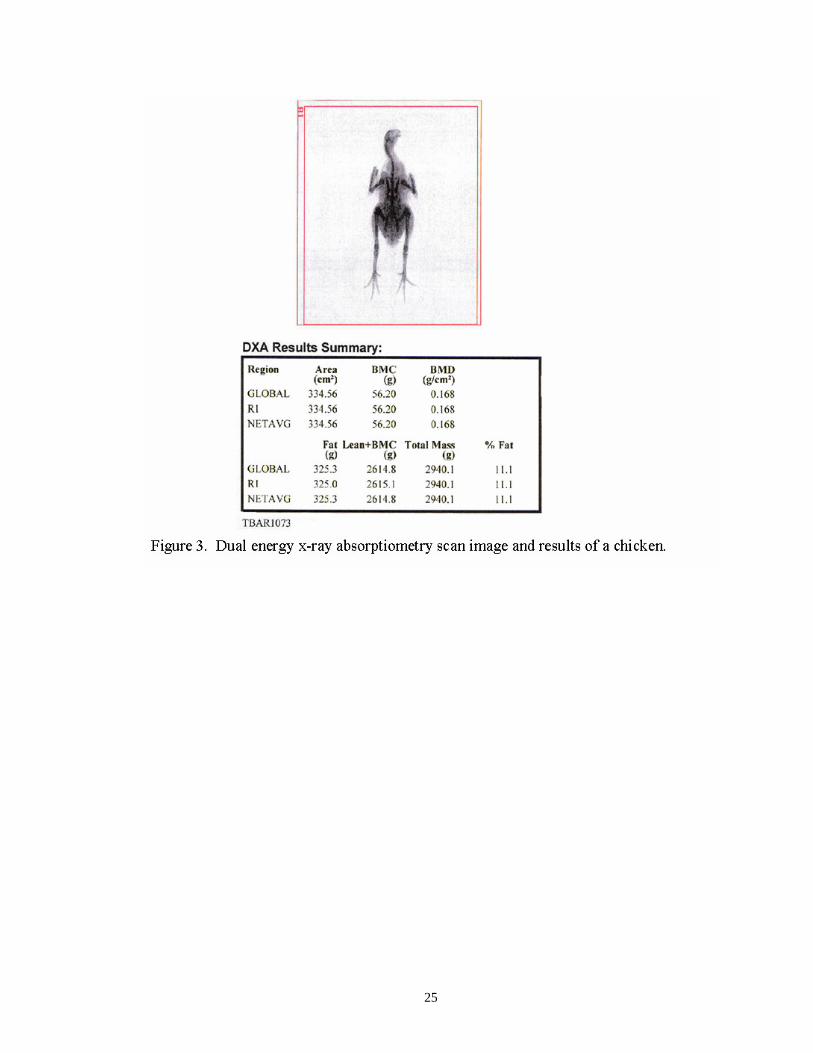
consumption. Dual energy x-ray absorptiometry assesses body composition via
algorithems that differentiate between the absorption of high (70 keV) and low (38 keV)
energy x-rays (Mitchell et al., 1997; Kelly, 2004). By relating this measure with x-ray

15
absorptive characteristics of pure tissues (Mitchell et al., 1997), fat and lean tissue mass
can be estimated. An example of information attained from scan analysis is shown in
Figure 3.
A large body of data exists validating DEXA for accurately measuring soft tissues
(lean and fat tissues) and bone mineral content in swine (Lukashi et al., 1999; Chauhan et
al., 2003; and Koo et al., 2004), as piglets are use extensively as a model for human
infant studies (Fiorotto et al., 1986). However, little evidence is available verifying its
use for poultry.
Chauhan et al. (2003) and Koo et al. (2004) reported DEXA as a method for
accurately measuring bone mineral content and density in layers. However, an
experiment conducted by Mitchell et al. (1997) is the only known evaluation of DEXA
for quantifying lean and lipid tissues in poultry. They found the technology to fall short
of accurately assessing bird lean and lipid content, but did suggest that the technique may
be applicable with software and or hardware modifications. If DEXA technology is to be
accepted as a method for estimating body composition in poultry research, more work is
need proving its accuracy and precision.

16
REFERENCE
Acar, N., E. T. Moran, Jr., W. H. Revingtion, and S.F. Bilgili. 1991. Effect of improved
pellet quality from using a calcium lignosulfonate binder on performance and
carcass yield of broilers reared under different marketing schemes. Poult. Sci.
70:1339-1344.
Baker, D. H. and Y. Han. 1994. Ideal amino acid profile for broiler chicks during the first
three weeks posthatching. Poult. Sci. 73:1441 – 1447.
Baker, D. H., 1997. Ideal amino acid profiles for swine and poultry and their application
in feed formulation. Biokyowa Tech. Rev. 9:1 – 24.
Behnke, K. C. 1996. Feed manufacturing technology: current issues and challenges.
Anim. Feed Sci. Tech. 62:49-57
Beker, A. 1996. Broiler energy and oxygen metabolism and the effect of oxygen
concentration and ambient temperature on ascites incidence. Ph.D. Thesis.
Oklahoma State University.
Boekholt, H. A., V. Grinten, A. M. Schreus, M. J. N. Los. and C. P. Leffering. Effect of
dietary energy restriction on retention of protein, fat, and energy in broiler
chickens. Br. Poult. Sci. 35:603 – 614.
Bolton, W. 1960. The digestibility of mash and pellets by chicks. J. Agric. Sci. 55:141-
142.
Chauhan, S., W.W.K. Koo, M. Hammami, and E. Hockman. 2003. Fan beam dual energy
x-ray absorptiometry body composition measurements in piglets. Journal of the
American College of Nutrition 22:408-414.
Cravener, T. L., W. B. Roush, and M. M. Mashaly. 1992. Broiler production under

17
varying population densities. Poult. Sci. 71:427-433.
Emmert, J. L. and D. H. Baker, 1997. Use of the ideal protein concept for precision
formulation of amino acid levels in broiler diets. J. Appl. Poult. Res. 6:462 –
470.
Falk, D. 1985. Pelleting cost center. In: Feed Manufacturing Technology III. Ed. R. R.
McEllhiney. American Feed Industry Association. Arlington, VA.
FairField, D. 1994. Pelleting cost center. In: Feed Manufacturing Technology IV. Ed. R.
R. McEllhiney. American Feed Industry Association. Arlington, VA.
Fiorotto, M. L., R. J. Shulman, H. P., Shang, and C. Garza. 1986. The effects of different
total parental nutrition fuel mixes on skeletal muscle composition of infant
miniature pigs. 35:354 – 359.
Greenwood, M. W., K. R. Cramer, P. M. Clark, K. C. Behnke, and R. S. Beyer. 2004.
Influence of feed form on dietary lysine and energy intake and utilization of
broilers from 14 to 30 days of ager. Int. J. Poultr. Sci. 3:189 – 194.
Han, Y. and D. H. Baker. 1993. Effects of sex, heat stress, body weight, and genetic
strain on the dietary lysine requirement of broiler chicks. Poult. Sci. 72:701-708.
Han, Y., H. Suzuki, C. M. Parsons, and D. H. Baker. 1992. Amino acid fortification of a
low-protein corn and soybean meal diet for chicks. Poul. Science. 71:1168 –
1178.
Hancock, J. D. and K. C. Behnke. 2001. Use of ingredient and diet processing
technologies (grinding, mixing, pelleting, and extruding) to produce quality feeds
for pigs. In: Swine Nutrition 2nd edition. Pages 469 – 487. Ed. A. J. Lewis and L.
L. Southern. CRC Press, Boca Raton, Florida.
18
Hendrick, H. B. 1983. Methods of estimating live animal and carcass composition. J.
Anim. Sci. 57:1316-1327.
Hill, F. W., and D. L. Anderson. 1958. Comparison of ME and PE determinations with
growing chicks. J. Nutr. 64:587.
Hussar, H., and A. R. Robblee. 1962. Effects of pelleting on the utilization of feed by the
growing chicken. Poult. Sci. 41:1489-1493.
Ingram, D. R., L. F. Hatten, III, and B. N. McPherson. 2000. Effects of light restriction
on broiler performance and specific body structure measurements. J. Appl. Poult.
Res. 9:501-504.
Jensen, L. S., L. H. Merrill, C. V. Reddy, and J. McGinnis. 1962. Observations on eating
patterns and rate of food passage of birds fed pelleted and unpelleted diets. Poult.
Sci. 41:1414-1419.
Jensen, L. S., G. O. Ranit, R. K. Wagstaff, and J. McGinnis. 1965. Protein and lysine
requirements of developing turkeys as influened by pelleting.
Kelly, T., 2004. Hologic Corporation, Waltham, MA. Personnel communication.
Kielanowski, J. 1965. Estimates of the energy cost of protein deposition in growing
animals, In: Proceedings of the 3rd Symposium on Energy Metabolism. Page 13 –
18. Ed. K. L. Blaxter. Academic Press, London.
Koo, W. W. K., M. Hammami, E. M. Hockman. 2004. Validation of bone mass and body
composition measurements in small subjects with pencil beam dual energy x-ray
absorptiometry. Journal of the American College of Nutrition 23:79-94.
Leeson, S., L. Caston, and J. D. Summers. 1996. Broiler response to diet energy. Poult.
Sci. 75:529 – 535.
19
Leeson, S. and J. D. Summers, 2001. Energy. Pages 35 – 99 In: Nutrition of the
Chicken.4th edition. University Books, Guelph, Ontario, Canada.
Lukaski, H. C., M. J. Marchello, C. B. Hall, D. M. Schafer, and W. A. Siders. 1999. Soft
tissue composition of pigs measured with dual x-ray absorptiometry: comparison
with chemical analyses and effects of carcass thickness. Nutrition 15:697-703.
MacLeod, M. G. 2000. Modeling the utilization of dietary energy and amino acids by
poultry. Pages 393-412 In: Feeding systems and feed evaluation models. Ed.
Theodorou, M. K. and J. France. CAB International.
McKinney, L. J. and R. G. Teeter. 2004. Predicting effective caloric value of nonnutritive
factors: I. Pellet quality and II. Prediction of consequential formulation dead
zones. Poult. Sci. 83:1165-1174.
McNab, J. M. and Blair, J. C. 1988. Modified assay for true and apparent metabolizable
energy based on tube feeding. Br. Poult. Sci. 29:697-707.
Mitchell, A. D., R. W. Rosebrouch, and J. M. Conway. 1997. Body composition analysis
by dual energy x-ray absorptiometry. Poult. Sci. 76:1746-1752.
Moritz, J. S., R. S. Beyer, K. J. Wilson, K. R. Cramer, L. J. McKinney, and F. J.
Fairchild. 2001. Effect of moisture addition at the mixer to a corn-soybean based
diet on broiler performance. J. Appl. Poult. Res. 10:347-353.
Pullar, J. D. and A. J. F. Webster, 1977. The energy cost of fat and protein deposition in
the rat. Br. J. Nutr. 37:355 – 363.
Puron, D., R. Santamaria, and J. C. Segura. 1997. Sodium bicarbonate and broiler
performance at high stocking densities in a tropical environment. J. Appl. Poult.
Res. 6:443-448.
20
Onyango, E. M., P. Y. Hester, R. Stroshine, and O. Adeola. 2003. Bone densitometry as
an indicator of percentage tibia ash in broiler chicks fed varying dietary calcium
and phosphorus levels. Poult. Sci. 82:1787-1791.
Reddy, C. V., L. S. Jensen, L. H. Merrill, and J. McGinnis. 1962. Influence of mechanical
alteration of dietary density on energy available for chick growth. J. Nutr. 77:428
– 432.
Sakomura, N. K. 2004. Modeling Energy Utilization in broiler breeders, laying hens, and
broilers. Brazilian J. Poult. Sci. 6:1-11.
Scheideler, S. E. 1995. Is pelleting cost effective? Feed Mangement. Vol 46, No. 1. p
21-26
Schreiweis, M. A., J. I. Orban, M. C. Ledur, D. E. Moody, and P. Y. Hester. 2004.
Effects of ovulatory and egg laying cycle on bone mineral density and content of
live white leghorns as assessed by dual-energy x-ray absorptiometry. Poult. Sci.
83:1011-1019.
Sibbald, I. R. 1976. A bioassay for true metabolizable energy in feedstuffs. Poul. Sci.
55:303-308.
Sibbald, I. R. 1977. The effect of steam pelleting on the true metabolizable energy values
of poultry diets. Poult. Sci. 56:1686-1688.
Skinner-Noble, D. O., L. J. McKinney, and R. G. Teeter. 2005. Predicting effective
caloric value of nonnutritive factors: III. Feed form affects broiler performance
by modifying behavior patterns. Poult. Sci. 84:403 – 411.

21
Topel, D. G., and R. Kauffman. 1988. Live animal and carcass composition
measurement. Pages 258 – 272 In: Designing Foods. National Research Council.
National Academy Press, Washington DC.
van Milgen, J. and J. Noblet. 1999. Energy partitioning in growing pigs: The use of a
multivariate model as an alternative for the factorial analysis. J. Anim.
Sci.77:2154 – 2162.

22
Table 1. Reported estimates for efficiencies of metabolizable energy use for protein (kp) and fat (kf) tissue accretion
Reference kp kf Species Kielanowski, 1965 0.70 0.79 Pigs Puller and Webster, 1977 0.45 0.74 Rats Boekholt et al., 1994 0.66 0.86 Poultry van Milgen and Noblet, 1999 0.51 0.92 Swine Sakomura, 2004 0.45 0.69 Poultry
23
24
25

26
CHAPTER III
Refinement of Novel Estimations of Poultry Body Composition and Evaluation Dual
Energy X-Ray Absorptiometry as a Method for Rapid Broiler Body Composition
Assessment
L. J. McKinney, S. Yadalam, K. R. McDonald and R. G. Teeter
Department of Animal Science
Oklahoma State University
Stillwater, OK 74078
TEL: 405-744-8866
FAX: 405-744-5300
E-mail: [email protected]
Section Preference: Education and Production
Research Note: Full-Length Paper: X
RUNNING TITLE: Body composition of poultry by DEXA
Abbreviation Key: DEXA = dual energy x-ray absorptiometry, BMC = bone mineral
content, CNB = carbon and nitrogen balance

27
ABSTRACT
Two experiments were conducted to validate and or refine methodologies for
quantifying body composition in poultry. In the first experiment, constants classically
used to derive body composition in C and N balance studies were evaluated for
application in poultry. In Experiment 2, the efficacy of using dual energy x-ray
absorptiometry (DEXA) to rapidly assess body composition in poultry was examined. In
Experiment 1, broilers ranging in body weight from 1,660 to 2,240 g were sacrificed, and
used for either measuring whole bird composition or determining the composition of the
protein and lipid fractions. In Experiment 2, broilers ranging in body weight from 280 to
3,075 g were sacrificed, and DEXA measurements of lean, fat, and bone mineral content
were obtained. The birds were then chemically assayed to determine protein, lipid, and
ash for comparison. Results from Experiment 1 demonstrate that though poultry protein
and lipid tissue do not greatly differ in composition compared to other species, the
differences may significantly impact the assessment of body composition, and should
therefore be considered as a source of error in C and N balance studies using poultry.
Results from Experiment 2 demonstrate that DEXA measurements failed to accurately
quantify the body composition of poultry when direct comparisons are made. Instead,
DEXA measurements must be applied to regression equations that inter-relate DEXA
measurements with compositions obtained by chemical analysis.
(Key words: carbon nitrogen balance, dual energy x-ray absorptometry, body
composition, poultry)
28
INTRODUCTION
The principle goal of poultry producers is to consistently meet consumer demand for
product taste and nutritional acceptability in a profitable manner. Accomplishing this
requires that the end product be defined and that the criteria for success be centered on
obtaining that defined product, and not entirely on live performance characteristics. As
demonstrated by McKinney and Teeter (2004), body weight and FCR improvements
obtained by increasing dietary caloric density did not in all cases equate into increased
lean mass but rather greater amounts of carcass fat. Assuming fat to be at some level a
waste product undesirable to the consumer, production decisions based solely on body
weight and FCR are potentially misguided. Therefore, nutritional, environmental, and
managerial decision consequences on body composition must be quantified.
Though numerous methods exist for estimating the body composition of animals used
in nutritional studies (Hendrick, 1983; Topel and Kauffman, 1988), comparative
slaughter has historically been the method applied in experiments with poultry. This
methodology, however, is time consuming, difficult to apply to an entire growth curve,
requires bird destruction, and the assumption that the composition of birds initially
examined is the same as those incorporated into an experiment (Blaxter, 1967).
However, according to work presented by Wolynetz and Sibbald (1987), the initial
slaughter group may not be necessary for comparison purposes, which would result in a
considerable reduction in the required resources.
Measures of C, N, and energy content of the feed and excreta, and CO2 production
have also been used for assessing body composition in poultry (Farrel, 1974).
Advantages of using C and N balance (CNB) as compared to comparative slaughter are

29
measurements of the same animal can be repeated over time, as animal sacrifice is not
required, and that the importance of initial body composition uniformity is negated
(Blaxter, 1967). As outlined by Farrel (1974), there are assumptions associated with
CNB: 1) that energy is retained only in the form of fat and protein tissue; 2) the
composition of fat and protein are constant; and 3) poultry protein and lipid tissue are not
significantly different in composition compared to other species.
Regarding the latter assumption, one would not expect sizable tissue compositional
differences to exist between species. However, as CNB is already susceptible to
analytical errors (Blaxter, 1967), examination of this assumption is warranted.
Additionally, estimates for fat and protein tissue constituents are dated (Armsby, 1903;
Blaxter and Rook, 1953; and Brouwer, 1965).
Advancements in dual energy x-ray absorptiometry (DEXA) have resulted in the
availability of fan beam technology, which enables faster scan acquisition (Koo et al.,
2004). This has sparked interest in the use of DEXA technology as a non-invasive
method for assessing body composition in experiments with animals reared for
consumption. A large body of data exists validating DEXA for accurately measuring soft
tissues (lean and fat tissues) and bone mineral content in swine (Lukashi et al., 1999;
Chauhan et al., 2003; and Koo et al., 2004) as piglets are used extensively as models for
human infant studies (Fiorotto et al., 1986). However, little evidence is available
verifying DEXA use for poultry.
An experiment conducted by Mitchell et al. (1997) is the only known evaluation of
DEXA for quantifying lean and lipid tissues in poultry. They found the technology to fall
short of accurately assessing bird lean and lipid content, but did suggest that the
30
technique may be applicable with software and or hardware modifications. However, this
conclusion was based on results of simple linear regression analysis. Perhaps more
sophisticated statistical models are needed.
Therefore, two experiments were conducted with the first directed at validating and/or
refining estimations of protein and fat constituents with specificity to poultry. In the
second experiment, DEXA was evaluated for accuracy and precision in quantifying soft
tissue (lean and fat tissue) and bone mineral content (BMC) in poultry.
MATERIALS AND METHODS
Experiment 1 – Validation and or refinement of constants for poultry tissue constituents
Twenty-four broilers ranging in body weight from 1,660 to 2,240 g were obtained
commercially, fasted (24 h), and euthanized by carbon dioxide asphyxiation. After
autoclaving (20 h; 11 psi; 116 °C), the birds were equilibrated to ambient temperature.
Each bird was then homogenized (including feathers) with a commercial grade blender
and samples of each homogenate were obtained and frozen (20°C) until analysis.
Twelve of the samples were randomly selected and partitioned by ether extraction into
protein and lipid factions for analysis of DM, N, ash, (AOAC, 1990) and C (Harjo, 1994).
The remaining homogenates of the whole bird were analyzed for DM, ash, ether extract C
and N (AOAC, 1990). These samples were used to evaluate whether whole bird ether
extract could be accurately estimated using the compositions of the protein and lipid
fractions determined from the first 12 samples analyzed. Equations used were as follows:
(Eq. 1) TP = N x (1 / % N in P)
(Eq. 2) PC = TP x % C in P

31
(Eq. 3) LC = TC – PC
(Eq. 4) EE = LC / % C in L
where: TP = total protein (g), P = pure protein (g), PC = carbon as protein (g), TC = total
carbon (g), L = pure lipid (g), LC = carbon as lipid (g), and EE = estimated whole bird
ether extract (%).
Experiment 2 – Evaluation of DEXA for measuring body composition in poultry
All scans were obtained using a fan beam dual energy x-ray absorptiometer operated
in the infant whole body mode. Rat-scan software was used for scan analysis. A total of
35 broilers ranging in body weight from 280 to 3,075 g were obtained commercially, and
fasted and euthanized as described in Experiment 1. Previous work in this laboratory
(unpublished) and that of Lukaski et al. (1999) demonstrated that animal positioning on
the scanning surface does not impact scan results. However, for consistency all birds
were scanned individually (5 times) in a prostrate position with the long axis of the bird
perpendicular to the length of the table. After scanning the birds were immediately
autoclaved and sampled for chemical analysis as previously described.
Data Analysis
In both experiments, bird served as the experimental unit. Regression analysis was
used initially to compare DEXA measurements of body composition with those obtained
by proximate analysis. Subsequently the effectiveness of these developed regression
models in relating DEXA results with measures obtained through proximate analysis
were evaluated using General Linear Models of SAS (2000).

32
RESULTS AND DISCUSSION
Experiment 1 – Validation and or refinement of constants for poultry tissue constituents
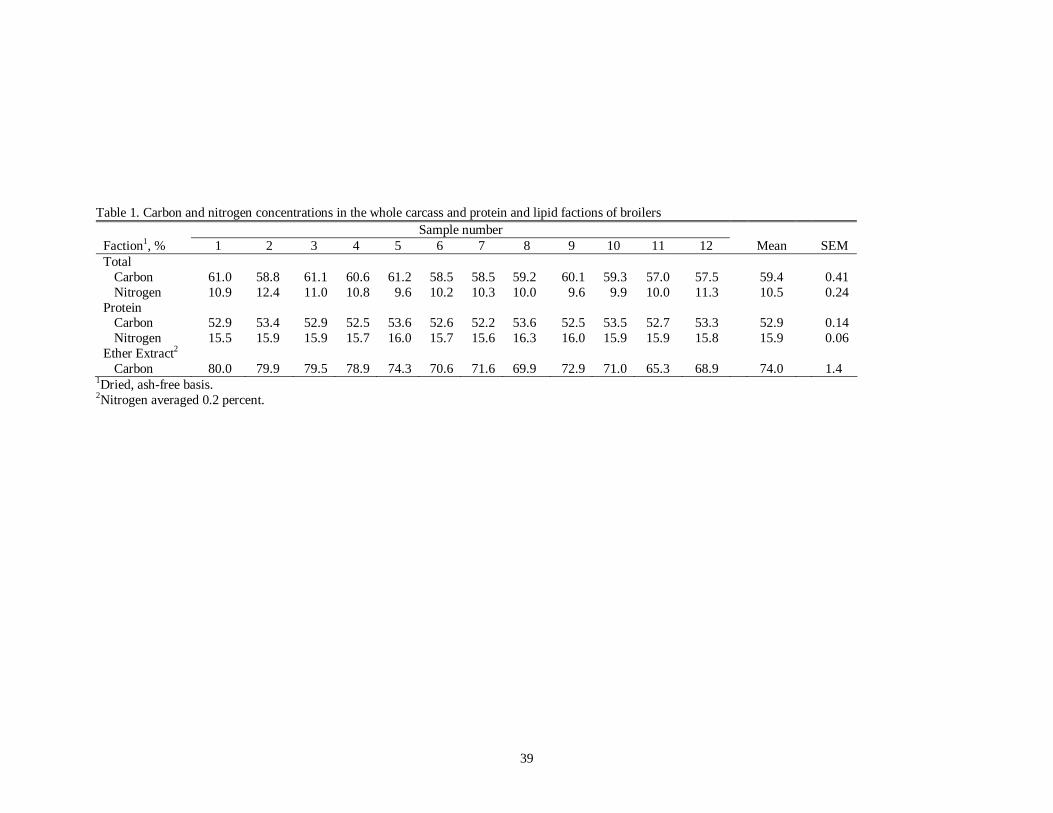
The C and N content of protein and lipid determined herein (Tables 1) were in close
agreement with those values traditionally accepted (Armsby, 1903, Blaxter and Rook,
1953 and Brouwer, 1965) and utilized in assessing body composition through CNB
techniques. For example, nitrogen as a percent of protein averaged 15.9 ± 0.06%,
essentially matching that which is generally applied (16.0%) across numerous protein
sources. Carbon as a proportion of protein and lipid was determined as 52.96 ± 0.14 and
74.0 ± 1.4%, respectively. The latter of which exhibited the most variability across
samples measured and averaged slightly lower than the other constants evaluated (Table
2). Nonetheless, values determined herein for the C and N contents of protein and lipid
resulted in the best overall estimation of whole bird ether extract when applied to
equations 1 through 4 (Table 2). In comparison, estimates obtained with protein and lipid
C and protein N estimates of Armsby (1903) and Blaxter and Rook (1953) resulted in
roughly an 8% overestimation of whole bird ether extract (Table 2; Figure 1). Using
constants proposed by Brower (1965), whole bird ether extract estimates were still
inflated, but only slightly (approximately 2%). As it was successfully demonstrated that
whole bird ether extract could be accurately computed from the composition of protein
and lipid determined from independent samples, this approach was accepted as a means
for estimating whole bird ether extract. Therefore, procedures were modified for
Experiment 2 in that ether extract was estimated by determined C and N constants rather
than AOAC (1990) methods. However, for simplification, ether extract estimated in this
manner may be referred to as fat determined by proximate analysis.

33
Experiment 2 – Evaluation of DEXA for measuring body composition in poultry
An example of a DEXA scan and the information that appears in the scan report is
shown in Figure 2. Note that lean tissue is not further subdivided in the report into its
protein and water constituents. Thus, in order to directly compare DEXA measurements
from the report with values obtained from proximate analysis, actual bird water content
must be determined. To estimate this, the difference between the body weight of the bird
and the sum of its protein, lipid, and ash (dry matter basis) were determined. Bird protein
and fat were then regressed on the estimated bird water content. As indicated by the lack
of a significance coefficient (Table 3), zero bird water content was associated with the
lipid parameter. This was expected as the water in adipose tissue is predominantly
associated with its vasculature and connective tissues (Pitts et al., 1971; Digirolamo and
Owens, 1976). As a result, direct comparisons could be made between DEXA measures
of lean, and the protein determined by chemical analysis plus the estimated bird water
content (Figure 3). However, this was done only to illustrate direct relationships. Bird
water content and protein were not coupled when developing regression models.
On the basis of simple linear regression, DEXA failed to accurately measure lipid and
ash as determined by proximate analysis (Table 4), which agrees with conclusions
reached by Mitchell et al. (1997). Error associated with BMC as it relates to ash are most
likely a consequence of the hollow bone structure of poultry, as programming software
was developed for mammals (Kelly, 2004). Additionally, BMC was not determined per
se, rather the ash content of the whole body was measured. This potentially explains the
consistent under-estimation of DEXA measure of ash.
34
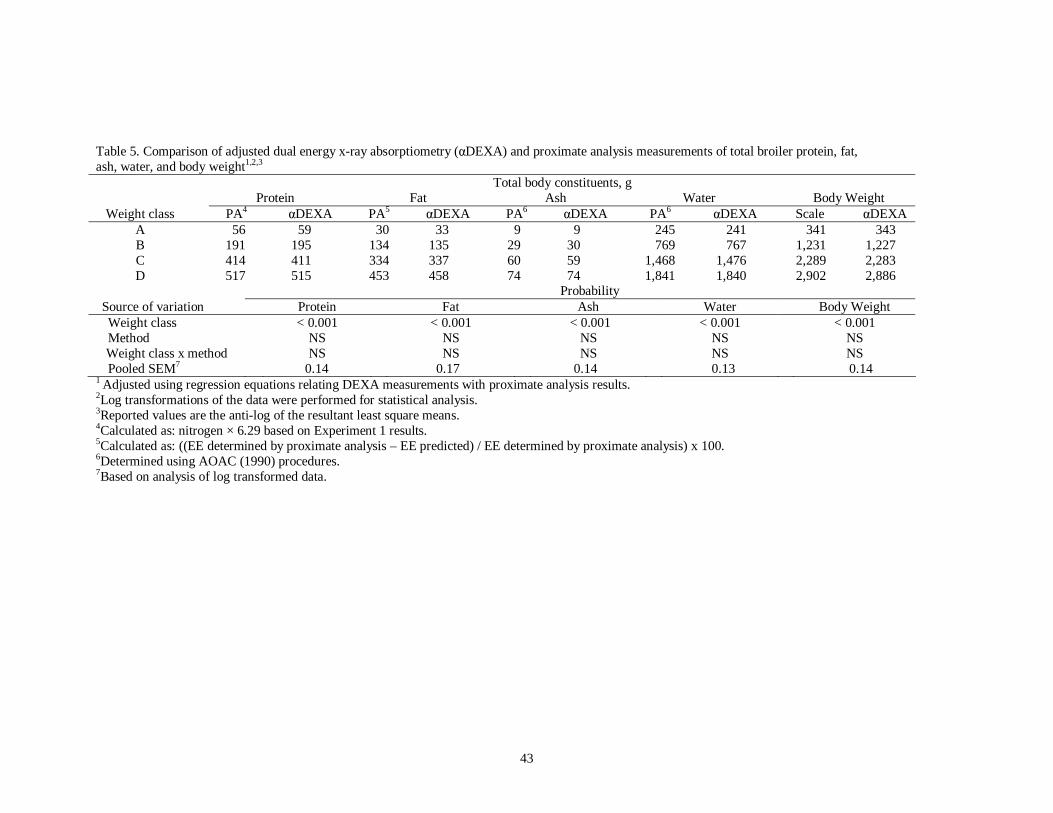
In an attempt to correct for these errors, forward stepwise regression procedures
(Neter, 1990) were used to develop more complex predictive models (Table 4),
incorporating more parameters and their cross-products. Indeed, with these equations,
the accuracy in which DEXA measurements could be inter-related with chemically
determined values increased markedly. This was demonstrated through comparisons
between DEXA measurements adjusted using these regression equations (αDEXA) and
those obtained through chemical analysis (Table 5). No significant (P > 0.05) differences
were detected between predicted (αDEXA) and determined values for any of the
variables monitored. Additionally, the sum of αDEXA estimates of protein, lipid, water,
and ash closely matched the body weights of the birds when they were initially scanned.
An inherent limitation of the proposed predictive models is the fact that the body
weights of birds used in the experiment did to completely encompass the entire growth
curve, depending on the end product desired (i.e., Cornish hen verses birds reared for
breast meat). As such, using these equations to estimate the body composition of birds
weighing more than 3,000 grams requires extrapolating beyond the models inference
base, which with polynomial equations particularly, leads to erroneous estimations of the
dependent variable.
This limitation of the models was clearly observed in an effort to quantify broiler body
compositions using DEXA in a study designed to compare broiler rearing conditions
typically found in different parts of the world. As part of this study, broilers were
selected to represent body weights of approximately 500, 1,500, 2,500, and 3,500 grams.
Application of the predictive equations to DEXA measurements appeared to work well
(based on body weight accountability: the sum of the predicted body components vs.

35
gravimetric weight) in every case except for birds outside the inference base of the
models. For birds weighing more the 3,000 grams, the predicted protein and lipid (as a %
of body weight) was greatly underestimated. Concomitantly, predicted water content was
largely exaggerated. As drastic changes of this manner were viewed as physiologically
infeasible, the only logical explanation was that the models were failing in this zone of
body weights.
In pending data to expand the inference base of the models, equations were modified
by first fitting, for each body composition measure, trend lines to data that fell within the
scope of the original equations (Figure 5). In assuming that these trend lines represent
mid-points or bird population means, αDEXA estimates for protein, lipid, water, and ash
were assigned to each trend line. Subsequently, DEXA measures were regressed on these
mid-points to modify the equations so as to encompass the entire growth curve (Table 6).
Note, however, that variability among birds is attenuated with these modified equations
and thus would only be of use when describing a population as was the case here (Figure
6).
In conclusion, research reported herein has demonstrated that though
poultry protein and lipid tissue may not appear to differ significantly in composition
compared to other species, these differences significantly impact the assessment of body
composition and should therefore be considered as a source of error in C and N balance
studies with poultry. Furthermore, DEXA technology can be used to rapidly assess body
composition in poultry, however, not directly. For this technology to be of value,
regression equations inter-relating DEXA measurements of BMC, and lean and lipid
tissue, with PA determined protein, ether extract, ash, and water content are required.

36
REFERENCES
Association of Official Analytical Chemists. 1990. Official methods of analysis. 15th ed.
Association of Official Analytical Chemists, Washington, DC.
Armsby, H. P. 1903. The Principle of Animal Nutrition with Special Reference to the
Nutrition of Farm Animals. New York. John Wiley and Sons.
Brouwer, E. 1965. Report of sub-committee on constrants and factors. Publs. Eur. Ass.
Anim. Prod. No. 11, p. 411.
Blaxter, K. L. 1967. Nutrition balance techniques and their limitations. Proc. Nutr. Soc.
26:86-96.
Blaxter, K. L., and J. A. F. Rook. 1953. The heat of combustion of the tissues of cattle in
relation to their chemical composition. Br. J. Nutr. 7:83-91.
Chauhan, S., W.W.K. Koo, M. Hammami, and E. Hockman. 2003. Fan beam dual energy
x-ray absorptiometry body composition measurements in piglets. Journal of the
American College of Nutrition 22:408-414.
DiGirolamo, M, and J. L. Owens. Water content of rat adipose tissue and isolated
adipocytes in relation to cell size. Am. J. Phy. 231:1568 – 1572.
Fiorotto, M. L., R. J. Shulman, H. P., Shang, and C. Garza. 1986. The effects of different
total parental nutrition fuel mixes on skeletal muscle composition of infant
miniature pigs. 35:354 – 359.
Harjo, C. O., and R. G. Teeter. 1994. A method to quantify combustible carbon. Poult.
Sci. 73:1914-1916.
Hendrick, H. B. 1983. Methods of estimating live animal and carcass composition. J.
Anim. Sci. 57:1316-1327.

37
Lukaski, H. C., M. J. Marchello, C. B. Hall, D. M. Schafer, and W. A. Siders. 1999. Soft
tissue composition of pigs measured with dual x-ray absorptiometry: comparison
with chemical analyses and effects of carcass thickness. Nutrition 15:697-703.
Kelly, T., 2004. Hologic Corporation, Waltham, MA. Personnel communication.
Koo, W. W. K., M. Hammami, E. M. Hockman. 2004. Validation of bone mass and body
composition measurements in small subjects with pencil beam dual energy x-ray
absorptiometry. Journal of the American College of Nutrition 23:79-94.
McKinney, L. J. and R. G. Teeter. 2004. Predicting effective caloric value of nonnutritive
factors: I. Pellet quality and II. Prediction of consequential formulation dead
zones. Poult. Sci. 83:1165-1174.
Mitchell, A. D., R. W. Rosebrouch, and J. M. Conway. 1997. Body composition analysis
by dual energy x-ray absorptiometry. Poult. Sci. 76:1746-1752.
Neter, J., W. Wasserman, and M. H. Kutner. 1990. Building the regression model.
Pages 433-483 in Applied Linear Statistical Models. Richard D. Irwin, Inc.
Homewood, IL.
Onyango, E. M., P. Y. Hester, R. Stroshine, and O. Adeola. 2003. Bone densitometry as
an indicator of percentage tibia ash in broiler chicks fed varying dietary calcium
and phosphorus levels. Poult. Sci. 82:1787-1791.
Pitts, G. C., L. S. Bull, and G. Hollifield. 1971. Physiologic changes in composition an
mass of total adipose tissue. Am. J. Phy. 221:961 – 966.
SAS Institute. 2000. The SAS System for Windows 2000. Release 8.1 SAS Institute Inc.,
Cary, NC.

38
Schreiweis, M. A., J. I. Orban, M. C. Ledur, D. E. Moody, and P. Y. Hester. 2004.
Effects of ovulatory and egg laying cycle on bone mineral density and content of
live white leghorns as assessed by dual-energy x-ray absorptiometry. Poult. Sci.
83:1011-1019.
Topel, D. G., and R. Kauffman. 1988. Live animal and carcass composition
measurement. Pages 258 – 272 In: Designing Foods. National Research Council.
National Academy Press, Washington DC.
39
Table 1. Carbon and nitrogen concentrations in the whole carcass and protein and lipid factions of broilers Sample number Faction1, % 1 2 3 4 5 6 7 8 9 10 11 12 Mean SEM Total
Carbon 61.0 58.8 61.1 60.6 61.2 58.5 58.5 59.2 60.1 59.3 57.0 57.5 59.4 0.41 Nitrogen 10.9 12.4 11.0 10.8 9.6 10.2 10.3 10.0 9.6 9.9 10.0 11.3 10.5 0.24
Protein Carbon 52.9 53.4 52.9 52.5 53.6 52.6 52.2 53.6 52.5 53.5 52.7 53.3 52.9 0.14 Nitrogen 15.5 15.9 15.9 15.7 16.0 15.7 15.6 16.3 16.0 15.9 15.9 15.8 15.9 0.06
Ether Extract2 Carbon 80.0 79.9 79.5 78.9 74.3 70.6 71.6 69.9 72.9 71.0 65.3 68.9 74.0 1.4
1Dried, ash-free basis. 2Nitrogen averaged 0.2 percent.

40
Table 2. Ether extract predicted from protein and lipid tissue carbon and nitrogen concentrations % Reference
Tissue
Carbon
Nitrogen
Predicted ether extract1
Predicted ether extract error2
Armbsy, 1903 Protein 52.5 16.7 Lipid 76.5 –
24.7
8.62a
Blaxter and Rook, 1953 Protein 51.2 16.0 Lipid 74.8 –
24.5
7.94a
Brouwer, 1965 Protein 52.0 16.0 Lipid 76.7 –
23.3
2.19b
Present experiment Protein 52.9 15.9 Lipid 74.0 –
22.8
0.01b
a,bMeans within a column with different superscripts differ (P < 0.05). 1Calculated as: total carbon – (protein x protein carbon) / lipid carbon). 1Ether extract (EE) determined by proximate analysis (AOAC, 1990) was 22.8 percent. 2Calculated as: ((EE determined by proximate analysis – EE predicted) / EE determined by proximate analysis) x 100.

41
Table 3. Regression equation of water content (W) on protein (P) and lipid (L) in whole bird carcasses (W = a + b P + c L) Parameter Coefficient Standard error Probability
a 78.23313 18.45308 0.0002 b 3.41462 0.20961 < 0.0001 c -0.00639 0.21166 0.9761

42
Table 4. Regression equation coefficients relating dual energy x-ray absorptiometry (DEXA) measurements with proximate analysis values DEXA variables Dependent variable Intercept Lean Lipid Lean2 Lipid2 Lean x Lipid Lean2 x Lipid2 R2, % Protein1, g -8.90481+ 0.21571** 96.91
-11.13536** 0.18779** 0.15961** 99.42 -15.14152** 0.19686** 0.15655** -2.99e-6 99.43 -15.15759** 0.2024** 0.11615** -4.0e-6* 4.494e-5* 99.44 -15.14395** 0.20176** 0.12014** 3.5e-6 4.909e-5+ 4.07e-6 99.44 -10.9351**4 0.2019** -7.42e-3 7.0e-6* 1.5831e-4** 9.223e-5** -4.4712e-11** 99.49
Lipid2, g Intercept Lipid Lean Lipid2 Lean2 Lean x Lipid Lean2 x Lipid2 102.47233** 0.60302** 58.54 -44.29583** 0.21388** 0.17341** 96.27 -39.60899** 0.07553 0.18212** 1.5789e-4 96.42 -12.03683 0.14717** 0.11281** 1.0157e-4+ 2.184e-5** 96.75 -11.97534 0.16515** 0.10993** 1.2025e-4+ 2.409e-5** 1.835e-5 96.76 -4.945664 -0.04790 0.11017** 3.0268e-4** 1.825e-5** 1.4249e-4* -7.4679e-11** 96.88
Ash3, g Intercept BMC Lean Lipid Lean x BMC Lipid x BMC Lean x Lipid 7.2132** 1.29866** 82.64 -0.46329 0.42645** 0.02246* 99.02 -0.24389 0.30121** 0.02344** 7.24-3* 99.05 -1.59568** 0.383** 0.02479** 7.61e-3** -5.672e-5** 99.10 -2.17225** 0.43985** 0.02713** 8.57e-3 -1.2359e-4** 3.0354e-4** 99.15 -1.64751**4 0.16682+ 0.02813** 0.01159 -5.8e-6 5.1384e-4** 1.634e-5** 99.20
Water3, g Intercept Lean Lipid Lean2 Lipid2 Lean x Lipid Lean2 x Lipid2 41.99924** 0.73998** 97.06 34.0781** 0.64084** 0.5668** 99.76 18.63859* 0.6758** 0.55503** -1.153e-5** 99.76 18.65469* 0.67025** 0.5955** -1.052e-5* -4.501e-5 99.76 18.66013* 0.66999** 0.5971** -1.032e-5+ -4.3366e-5 -1.62e-6 99.76 8.330594 0.66965** 0.91016** -1.76e-6 -3.1142e-4** -2.3796e-4** 1.09734e-11** 99.79
1Calculated as: nitrogen × 6.29. 2Calculated as: ((EE determined by proximate analysis – EE predicted) / EE determined by proximate analysis) x 100. 3Determined using AOAC (1990) procedures. 2Equation used to adjust DEXA measurements to proximate analysis data. +Significant (P < 0.1). * Significant (P < 0.05). ** Significant (P < .01).
43
Table 5. Comparison of adjusted dual energy x-ray absorptiometry (αDEXA) and proximate analysis measurements of total broiler protein, fat, ash, water, and body weight1,2,3
Total body constituents, g Protein Fat Ash Water Body Weight
Weight class PA4 αDEXA PA5 αDEXA PA6 αDEXA PA6 αDEXA Scale αDEXA A 56 59 30 33 9 9 245 241 341 343 B 191 195 134 135 29 30 769 767 1,231 1,227 C 414 411 334 337 60 59 1,468 1,476 2,289 2,283 D 517 515 453 458 74 74 1,841 1,840 2,902 2,886
Probability Source of variation Protein Fat Ash Water Body Weight Weight class < 0.001 < 0.001 < 0.001 < 0.001 < 0.001 Method NS NS NS NS NS
Weight class x method NS NS NS NS NS Pooled SEM7 0.14 0.17 0.14 0.13 0.14
1 Adjusted using regression equations relating DEXA measurements with proximate analysis results. 2Log transformations of the data were performed for statistical analysis. 3Reported values are the anti-log of the resultant least square means. 4Calculated as: nitrogen × 6.29 based on Experiment 1 results. 5Calculated as: ((EE determined by proximate analysis – EE predicted) / EE determined by proximate analysis) x 100. 6Determined using AOAC (1990) procedures. 7Based on analysis of log transformed data.

44
Table 6. Proposed equation coefficients relating dual energy x-ray absorptiometry (DEXA) measurements with proximate analysis values for broilers weighing more than 3000 grams DEXA variables Dependent variable1 Intercept BMC Lipid Lean Lipid2 Lean2 Lean x Lipid Fat x BMC Lean x BMC Lean2 x Lipid2
Protein -6.13349* – 0.1119* 0.18308* 3.567e-5* 3.7e-6* 4.728e-5* – – -1.252e-11* Lipid -5.6813* – 0.03129* 0.10041* 6.536e-5* 2.336e-5* 9.6e-5* – – -1.2042e-11* Water 5.79504* – 0.76994* 0.68501* -3.797e-5* -1.373e-5* -1.5077e-4* – – 2.43437e-11* Ash -1.6675* 0.01579 0.02434* 0.02658* – – 1.44e-6 -2.54e-6 -3.95e-6* –
1Determined by trend-line analysis of adjusted dual energy x-ray absorptiometry measurements (αDEXA). *Significant (P < 0.05).

45

46

47
48

49
50
CHAPTER IV
Predicting Effective Caloric Value of Nonnutritive Factors: I. Pellet Quality and II.
Prediction of Consequential Formulation Dead Zones
L. J. McKinney and R. G. Teeter
Department of Animal Science
Oklahoma State University
Stillwater, OK 74078
Section Preference: Nutrition and Metabolism
Research Note: Full-Length Paper: X
RUNNING TITLE: Caloric Value of Pelleting
Abbreviation Key: CD=caloric density; CFCR=cumulative feed conversion ratio;
DFCR=daily feed conversion ratio; ECV=effective caloric value; FCR=feed conversion
ratio; M=mash; PQ=pellet quality

51
ABSTRACT
Two experiments were conducted with male broilers to establish a methodology for
predicting effective caloric value (ECV), defined as dietary caloric density (CD)
necessary for broilers to achieve specific body weight (BW) and feed conversion ratio
(FCR) combinations under standardized conditions, and to quantify the ECV attributable
to pellet quality (PQ), defined as the pellet to pellet fines ratio in the feeder. In
Experiment 1, chicks were reared to 56 d on diets varying in CD. Dietary caloric
densities examined ranged from 2,650 to 3,250 kcal MEn/kg. Pen BW, feed intake, and
FCR were measured at 21, 42, and 56 d. On 42 and 56 d, carcass traits were measured.
Increasing CD significantly enhanced BW, energy consumption, and FCR. Feed intake
remained similar across the upper three CD treatments to 42 days. By day 56, feed
consumption tended to decline as CD increased. Increasing CD beyond 3,066 kcal
MEn/kg diet did not increase lean tissue accretion, while fat deposition rose
disproportionately. Experiment 1 results enabled creation of equations whereby CD,
hence ECV, might be predicted using BW and FCR. In Experiment 2, 38-d old broilers
were used to evaluate PQ effects on growth, feed intake, FCR, and behavior in a 7-d FCR
assay. The BW gain and FCR were significantly enhanced by pelleting and were
positively correlated with PQ. Feed intake was not affected by PQ. The Experiment 1
model was validated for Experiment 2, as it closely estimated the CD for diets of similar
PQ used in Experiment 1. Results suggest pelleting contributes 187 kcal ECV to the diet
at 100% PQ and that the ECV declines curvilinearly as PQ falls. Birds were observed
eating less and resting more as PQ increased, suggesting that ECV of pelleting is
mediated by energy expenditure for activity. These studies provide a method for

52
estimating ECV of nonnutritive factors that impact BW and/or FCR. Further, application
reveals potential for creation of formulation “dead zones” whereby dietary changes to
enhance CD may be offset due to reduced ECV.
(Key words: Pelleting, energy, behavior, effective caloric value, broiler performance)
INTRODUCTION
Numerous nonnutritive factors, such as those related to feed processing and
general husbandry, are well documented throughout the literature to impact bird
performance. For example, feed processing techniques such as pelleting have been
touted for beneficial effects on poultry performance (Acar et al., 1991; Scheideler, 1995;
Moritz et al., 2001). Likewise numerous managerial – husbandry decisions related to
stocking density (Cravener et al., 1992; Puron et al., 1997), lighting program (Buyse et
al., 1996; Ingram et al., 2000), and ventilation (Lott et al., 1998) are well known to
impact BW and FCR. Though the precise mode of action by which such nonnutritive
factors impact poultry performance is considered disjoint from nutrition in application,
their use is critical to successful poultry production. However, since growth rate and
FCR are also related to nutrition, the traditional approach of separating nonnutritive
factors that impact average daily gain and FCR from nutrition must be questioned.
Bird energy retention is the net result of energy inputs minus expenditures as
excreta and heat. The importance of excreta energy to retention is reduced when inputs
are measured as MEn. Though the basic precept of ration formulation programs is that
MEn values are generally independent of, for example, bird sex and age, its utilization for
retention is reduced when heat production is elevated. Bird heat production is influenced
53
by a myriad of factors including ration composition and tissue type synthesized
(MacLeod, 1997), intermittent lighting (Ohtani and Leeson, 2000), and activity among
others. Indeed, energy expenditure for activity has been suggested to be influenced by
nonnutritive factors as feed processing (Jensen et al, 1962) and lighting (Ohtani and
Leeson, 2000). Failure to account for variations in heat production, regardless of source,
eventually has the net result of creating an uncertain ratio of ingested MEn calories
available for tissue accretion to dietary protein and other nutrients. The amount of
dietary MEn available to promote BW and FCR is hereby defined as the effective caloric
value (ECV) of MEn. Under fixed experimental conditions, where nonnutritive factors
impacting heat production are held constant, varying the calorie to protein ratio impacts
BW and FCR (Sizemore and Siegel, 1993; Leeson et al., 1996; MacLeod, 1997). One
might conversely anticipate that experimental variation of nonnutritive factors, with
ration formulation held constant and BW and/or FCR changing, would be better
expressed as a variant of MEn that more closely represents feeding value as ability to
achieve a specified BW and FCR.
The improved BW and FCR performance associated with processed feeds is an
example of a nonnutritive factor impacting the ECV of the diet fed. Such results are
presumably attributable to either enhanced feed value and/or a reduced nutrient need by
the animal, whereby the net result is more efficient tissue accretion. Regarding this latter
point, previous reports examining pelleting effects on energy digestibility indicate that
either pelleting does not impact nutrient bioavailabililty (Bolton, 1960; Sibbald, 1977) or
that the positive impact response upon nutrient bioavailabililty (Hussar and Robblee,
1962) is relatively small compared to bird response. Processing may also alter nutrient

54
need of the bird by reducing energy expenditure associated with feed consumption
(Jensen et al., 1962). Though the true value of processing may be due to a combination
of variables, methodology is desirable whereby the ECV of such nonnutritive alterations
may be estimated and taken advantage of in other segments of the production cycle.
Nonnutritive factors encountered in the production enterprise, that are well known
to impact BW and/or FCR, are generally not considered as variables (with exception of
season and feed cost) directly influencing desired ration formula. This approach,
however, is presumably attributable to a lack of methodology enabling value
quantification. Nonetheless, the majority of poultry rations utilized today undergo some
type of post-mixing processing, and production manuals (Cobb Vantress, 2003) contain
many managerial-husbandry recommendations that impact BW and FCR in a manner that
“takes away” or “adds to” consumed energy value. Methodology is needed to place
caloric values on such relationships so that diets may be appropriately adjusted. Short of
a net energy system development, this methodology should enable the general accounting
of nonnutritive factor influence upon the ECV of MEn under standardized conditions.
Therefore, studies were conducted to develop a generalized growth and FCR relationship
with dietary MEn under standardized conditions and, further, to apply the methodology to
examine the benefits and/or consequence of varying pellet quality as a nonnutritive
variable.
MATERIALS AND METHODS
General
Two studies were conducted, with the first directed at establishing mathematical
relationships between dietary caloric density, expressed as MEn, with broiler growth and

55
FCR under fixed managerial conditions. This enabled the prediction of MEn (expressed
as ECV), from bird BW and FCR combinations as ECV. In the second study, the
approach was used to estimate the ECV of diets with varying feed forms. Both studies
utilized Cobb 500 male broilers that were obtained at hatching from a commercial
hatchery. Floor pens utilized were equipped with two cylinder-shaped gravity feeders,
nipple drinkers, and used litter (wood shavings) that was top-dressed with fresh litter.
Stocking density in the floor pens was 40 birds per pen providing 0.03 m3 of floor space
per bird. Cages used for Experiment 2 were elevated (1.2 m) and constructed of plastic-
coated-wire (46 x 60 x 60 cm). Birds were housed individually, and each cage was
equipped with a stainless steel feeder and a nipple drinker. Unless stated, dietary nutrient
concentrations met or exceeded those levels recommended by the National Research
Council (1994), and feed and water were provided for ad libitum consumption.
Definition of Energy-Growth Relationships (Experiment 1)
Experiment 1 was designed to develop mathematical models describing
relationships among CD, BW, and FCR of broilers. Additionally, dietary CD influences
on carcass weight, dry matter, specific gravity, and composition were examined. One-
day-old broilers (1,440 total) were allotted to 36 floors pens (40 birds/pen), which were
sectioned into 9 blocks (based upon location within the floor pen house) of 4 pens per
block. Experimental diets (Table 1) were formulated to 4 CD within each of the starter
(0-21 d), grower (21-42 d), and finisher phases (42-56 d) while protein concentrations
were adjusted maintaining a constant calorie:protein ratio across diets within feeding
phases. Starter diets were fed as mash, while grower and finisher diets were pelleted.

56
The dietary CD (MEn, kcal/kg diet) examined are presented in Table 1. Treatments were
randomly assigned to pens within block, and pen BW, feed consumption, and FCR (g
feed/g gain corrected for mortality by adding the BW of dead birds) were measured at 21,
42, and 56 d of age. Following 42 and 56 d of age, two and three birds, respectively,
from each pen were randomly selected to determine dressing percentage, carcass specific
gravity, abdominal fat weight, and breast weight (Belay and Teeter, 1994). Carcass
specific gravity and dry matter results were then applied to predictive equations proposed
by Wiernusz et al. (1999) to estimated carcass fat, protein, and ash.
Evaluation of pellet quality influences (Experiment 2)
Experiment 2 was conducted to independently test Experiment 1 methodology for
ability to predict CD and to quantify PQ (defined as the ratio of pellets to pellet fines in
the feeder) effects on growth, feed consumption, FCR, ECV, and activity of broilers.
Broilers were reared to 31 days of age in floor pens on standard starter and grower diets,
fed as mash (Skinner-Noble et al., 2002). On day 31, 192 broilers were transferred to
cages and for 7-d adapted to cages and pellet treatments to be tested (Jensen et al., 1962).
Subsequently, feeders were emptied and fresh treatments added. The WG gain, feed
consumption, and FCR were measured from 38 to 45 days of age. Treatments were
derived from a pelleted diet (Table 2) that was screened (0.3 cm sieve). Ration samples
were collected for protein (N × 6.25) and carbon analysis. For each feeder, resultant
pellet fines were re-blended with the pellets to form the designated pellet:fines ratio.
Treatments were: 100) 100% pellets; 80) 80% pellets:20% pellet fines; 60) 60%
pellets:40% pellet fines; 40) 40% pellets:60% pellet fines; and 20) 20% pellets:80%
57
pellet fines. Unprocessed mash (M) was included as a treatment to serve as a negative
control representing unprocessed feeds. During the experiment, scan sample behavior
observations (Skinner-Noble et al., 2001; 2003) were conducted so as to quantify PQ
effects on ingestive and resting behaviors. Birds were observed at 1000 and 1400 h on 3
different days of the 7 d FCR test. During these observations, the observer passed by
each cage 10 times within 45 minutes. At the conclusion of the experiment, all remaining
feed in each feeder was sieved and the actual consumption of pellets and pellet fines were
estimated by difference such that any potential preferential consumption of pellets or
pellet fines could be identified. The experiment 1 model was used to transform the
second study BW and FCR responses, attributable to PQ, into ECV.
Data Analyses
For the studies, pen (Experiment1) and cage (Experiment 2) served as the
experimental unit. Data were analyzed using General Linear Models of SAS (2000), with
probability values of P < 0.05 considered significant. Actual P-values are noted and not
considered significant if 0.05 < P < 0.10. When a significant F-statistic was detected,
least square means were used for treatment comparisons. Experiment 1 was designed and
analyzed as a randomized complete block with pen location within house serving as the
blocking factor. Multiple regression coefficients for predicting dietary CD (Experiment
1) were as follows: first, BW and feed consumption were regressed upon bird age to
enable prediction of these values for each day of the study; second, daily weight gain and
feed consumption were computed as the difference between dayx and dayx+1; third, daily
FCR was computed; fourth, bird daily performance values (BW, FCR) were regressed
upon CD. The resulting regression equations predicted CD from BW and FCR. Model

58
selection was based on forward stepwise regression (Neter et al., 1990). Factors were
added to the regression model until three conditions were met: 1) adding factors to the
model did not result in a substantial (R2 improvement < 2 %) increase in the model R2; 2)
all factors in the model were significant at P < 0.10; and 3) the resulting model matched
known properties of the independent variables (e.g., BW increases cubically, whereas
FCR increases quadratically). Experiment 2 was designed and analyzed as a completely
randomized experimental design. Experiment 1 equation predicting CD from BW and
FCR was applied to PQ data in order that the ECV attributable to PQ might be estimated
for each replicate. Treatment means were separated as described for Experiment 1.
RESULTS AND DISCUSSION
Experiment 1. Definition of Energy-Growth Relationships
The CD effects on body weight, feed and energy consumption, and FCR (total
feed/BW) are shown in Table 3. Results of CD effects on carcass traits are presented in
Table 4. Each CD increase resulted in greater (P < 0.02) 21 and 42-d BW. Though
increasing CD continued to result in greater 56-d BW, only the upper (Treatments C and
D) and lower (Treatment A and B) pairs of CD treatments differed (P < 0.05). Increasing
the CD of the diet also resulted in prominent FCR differences (P < 0.001). At both 42
and 56 days of age, FCR was reduced with each CD increase. Feed consumption
remained similar across Treatments B, C, and D through 42 days of age. At that point,
only birds fed the lowest CD responded by increasing (P < 0.01) feed intake. By day 56,
feed consumption for birds fed Treatment B did not differ (P < 0.06) from Treatment A
birds. Also, there was a prevalent feed intake decline as diet CD increased. This
59
response supports the dogma that birds eat to fulfill energy need (Rice and Botsford,
1956; Moreng and Avens, 1985). However, such a governing effect was less notable at
higher CD, as energy consumption increased quadratically (P < 0.001) with CD. Birds
fed Treatment C consumed similar total energy (0-56 d) compared to birds fed
Treatments A (P < 0.07) and B (P < 0.07). Moreover, birds fed the diet with 3,250 kcal
MEn / kg diet (Treatment D) had similar (P < 0.09) energy intakes as birds fed Treatment
C.
Indeed, increasing CD positively influenced both BW and FCR. However,
attention must also be given to the final sellable product. Assuming that fat is a product
of minimal value compared to lean tissue, increasing CD would only be of benefit if lean
mass also increased. Such was true as CD increased from 2,700 to 3,066 kcal MEn / kg
diet. Feeding Treatment C resulted in greater (P < 0.01) carcass weights, dressing
percentages, breast mass, and carcass protein, compared to the lowest CD treatment, with
intermediate responses observed for Treatment B. Though abdominal fat appeared to
increase with CD, carcass fat was similar for Treatments A, B, and C. Fate of energy
consumed shifted, however, when CD exceeded 3,066 kcal MEn/kg, providing additional
energy failed to result in greater breast percent, breast mass, or carcass protein. At that
point, lean tissue accretion plateaued. Conversely, feeding the diet with 3,250 kcal
MEn/kg diet resulted in disproportionate increases of abdominal fat and carcass lipid.
The observed plateau of lean tissue accretion as CD increased suggests that if adequate
nutrients are available to the bird, maximal lean tissue accretion is genetically
predetermined. Nonetheless, increasing CD resulted in heavier more efficient birds even
though gains for the highest CD were principally fat. The data indicate that providing

60
energy in excess to that required for lean tissue accretion will improve FCR, but does so
without elevation in sellable lean mass. Consequently, the improved FCR presumably
occurs as a dilution of maintenance energy needs in proportion to energy consumption
and not water content associated with lean accretion.
The negative impact of increasing BW on FCR was apparent and presumably the
result of increasing energy need for maintenance and lipid deposition as BW increases.
Therefore, the influence of CD on FCR is not disjoint from BW. Hence, BW and CD
were collectively used in modeling FCR. Resulting regression equations are presented in
Table 5. Linear, quadratic, and interactive combinations of BW and FCR were regressed
on CD to create equations enabling CD prediction. The best equations utilized interactive
BW and FCR components. The selected regression equations demonstrating the
interrelationships among CD, BW, and FCR are illustrated as 3-dimensional plots
(Figures 1 and 2). In Figure 1, FCR is expressed cumulatively (CFCR) based on
predicted cumulative feed consumption and BW relationships throughout the experiment.
The second approach (Figure 2) created a more dynamic model by expressing BW and
CD values in relation to FCR utilizing predicted daily feed intake / predicted daily BW
gain (DFCR). Though both approaches have acceptable R2 (0.88 to 0.98), it is
anticipated that equations based upon daily values will more accurately estimate CD
values in settings where only segments of the growth curve are utilized, as in Experiment
2. For that reason, values obtained from DFCR values will be used hereafter.
Experiment 2. Evaluation of pellet quality influences
Results will be discussed first as PQ effects on broiler feed consumption, BW
gain, and FCR (feed intake / weight gain; Table 6). Secondly, results will be discussed as
61
PQ caloric consequences on ECV (Table 7, Figure 3) as modeled from Experiment 1, and
PQ effects on broiler behavior (Table 6, Figure 3).
Neither pelleting nor PQ significantly impacted feed consumption (Table 6; P = 0.5).
There was a numerical elevation in feed intake for birds that were fed pelleted treatments,
compared to M, which agrees with other studies (Choi et al., 1986; Nir and Hillel, 1995).
Though feed consumption did not appear to be associated with PQ, birds did selectively
consume pellets over pellet fines in some treatments. For example, birds offered a
combination of 80% pellets and 20% pellet fines consumed (on average) 87% pellets and
13% pellet fines. This preferential consumption of pellets over pellet fines was
dependent upon the ratio of pellets to pellet fines in the feeder. As the proportion of
pellet fines increased and pellets decreased, either the preference for pellets or the ability
to select pellets diminished and was not present for birds fed 20 % pellets. At that point,
birds consumed the pellet:fines ratio provided.
When pellet treatments (from 20 to 80% pellets) were pooled and compared with
M, pelleting increased (P < 0.01) BW gain 6% and improved (P < 0.05) FCR by 5%.
The birds that received 100% pellets were excluded from the comparison so as to avoid
inflating pelleting effects with a practically unattainable PQ. Other comparisons made
between pellets and M have resulted in similar BW gain and FCR (Choi et al., 1986; Nir
and Hillel, 1995; Plavnik et al., 1997) improvements.
The treatments significantly influenced weight gain (P < 0.001) and FCR (P <
0.01; Table 6). Responses to PQ appeared to be biphasic with an intermediate plateau in
the 40 to 60% PQ range (Figure 3). This finding suggests there is little need to improve
PQ above 40%, unless it will also be in excess of 60%. Keep in mind, however, that

62
birds will selectively consume pellets if possible. As a consequence, the proportion of
pellets and pellet fines consumed could vary markedly from bird to bird. At the onset of
the experiment the question posed was, at what pellet quality (if any) are growth
performance benefits of pelleting lost? In other words, if a certain pellet quality is not
achieved, is there any bird related advantage of pelleting as compared to feeding mash?
Statistically, these data indicate that at 40% PQ and above, pelleting results in enhanced
BW gain (P < 0.05) and FCR (P < 0.07), compared to a diet fed as M.
From Experiment 1, using CFCR in the model resulted in an equation better
predicting diet CD (Table 5; P < 0.0001; R2 = 0.98) compared to DFCR values (P <
0.0001; R2 = 0.88). However, Experiment 2 was conducted for a relatively short interval
of the latter stages of the growth curve. As such, using CFCR would dilute PQ effects.
Therefore, daily values (DFCR) were used to increase the precision of estimating ECV
for PQ. Across all Experiment 1 diets, the proportion of pellets to pellet fines in the
feeder averaged 50 %. This average value was used to test the CD predictive equation
derived from Experiment 1 for applicability in Experiment 2. This test involved
predicting the CD of the average of the 40 and 60% PQ diets from Experiment 2 to
simulate the 50 ± 10% PQ of Experiment 1 diets. The model predicted 3,225 kcal MEn /
kg diet, which exactly matched the calculated energy concentration of the diet (3,225 kcal
MEn). Consequently, the CD predictive equation was accepted as a methodology for
estimating the ECV associated with PQ in Experiment 2 because of this confirmation
from independent experiments. As such, Experiment 2 BW and DFCR were transformed
into CD and then examined as deviations from the M so as to produce an estimate of the
kcal MEn /kg added to the M via pelleting.

63
The ECV of pelleting and pellet quality are displayed in Figure 3. As PQ
increased, the apparent ECV of the diet became greater. Energy sparing attributable to
pelleting peaked at 187 kcal MEn/kg feed consumed for the 100% PQ treatment. The
estimated energy sparing values diminish as the proportion of pellets to fines decreases,
but still appears greater than zero for the 20% pellets (76 kcal MEn / kg diet; Table 7).
Considering proposed modes of action suggests that as pellet quality increases, either the
bird expends less energy for consumption or the bioavailabililty of nutrients and/or
energy increases. Regarding this latter point, previous reports examining pelleting effects
on energy digestibility indicate that pelleting does not impact nutrient bioavailabililty
(Bolton, 1960; Hussar and Robblee, 1962; Sibbald, 1977). In support of pelleted feeds
modulating bird energy expenditure, Jensen et al. (1962) observed that birds provided
pellets as compared to mash visited the feeder less frequently and spent less time at the
feeder, while consuming similar amounts of feed. Behavior observations of the current
study (Table 6, Figure 3) concur. As the proportion of pellets in the feeder increased,
birds were observed eating less frequently (P < 0.001) and resting more (P < 0.001)
frequently. Interestingly, plotting bird resting frequency and calories attributable to PQ
on the same graph resulted in curves of very similar shapes. Given that feed intake did
not differ across treatments, and that as pellet quality increased birds spent less time
eating, the concept that BW gain and FCR differences are associated with altered nutrient
need via decreased energy expenditure for obtaining food is supported. A consequence
of reducing energy costs associated with the activity of feed consumption by pelleting or
increasing PQ would allow the diverting of calories to tissue accretion (Jensen et al.,
1962; Reddy et al., 1962). Credence for this proposed mechanism is the supporting

64
evidence that the M and pellet rations were similar for carbon (P = 0.50) and nitrogen
content (P = 0.30) suggesting that treatment differences, attributable to blending, would
indeed be due to feed form.
Final quality of the processed feed is the result of numerous factors influencing
the feed form actually presented to the bird for consumption. With pelleted feeds, it is
the percentage of intact pellets at the feeder and not the feed mill that determines
processing efficacy. Fundamentally, pellet integrity is affected by diet formulation, plant
operation, and feed handling during transport and delivery (Behnke, 1996). Of these, diet
formulation is paramount. The ingredients used and their inclusion levels markedly
influence the overall pellet integrity of the final product (Richardson and Day, 1976;
Briggs et al., 1999). As such, interactions between ration composition and pellet quality
may have counteractive effects with respect to bird performance. Though increasing
dietary fat positively impacts feed efficiency (Leeson et al., 1996), when fat is added
prior to pelleting it also reduces pellet quality (Richardson and Day, 1976, Behnke, 1996,
Briggs et al., 1999).
Producers may face the expense of increasing CD by fat supplementation only to
have it partially negated by feed form deterioration prior to bird consumption. Under
circumstances where low quality fats are utilized, fat addition could eliminate the ECV.
Formulation “dead zones”, whereby the addition of fat does not result in the addition of
calories due to pellet quality degradation is possible. To ascertain the net caloric value
(energy attributable to fat inclusion minus energy lost due to pellet degradation) of fat
fortified-pelleted diets, both the caloric gain attributable to fat supplementation and the
ECV (Table 8) of altered pellet quality must be considered.

65
Ideally, decisions regarding diet formula for broiler production settings would be
interactive with the numerous managerial decisions impacting the nutrient and energy
input/output balance. As noted from the studies reported herein, elevating CD enhances
energy intake, bird accretion and FCR. However, the CD response does not necessarily
improve lean tissue production. Though FCR improved with CD, it can do so via
elevated lipid accretion independently of lean tissue. Consequently, the desired carcass
composition should be first defined and birds fed to that outcome, rather than FCR.
Similar to CD changes, nonnutritive factor manipulations such as alteration in PQ, impact
BW gain and FCR. The data suggests that the PQ differences on bird performance are
strongly related to a reduced bird activity with results approaching an ECV of 187 kcal
MEn/ kg diet. As a consequence, formula alterations should be coupled with their impact
on PQ so that the ECV value is optimized. Indeed, the impact of such factors may occur
independently of caloric value, measured as MEn, and their “takes away” or “adds to”
impact on activity energy expenditures divergently impact BW and/or FCR. Application
of the ECV equations provided estimates for the nonnutritive variable impact examined
herein. In conclusion, ECV offers the opportunity to place quantitative energy value
upon non-nutritive factors influencing broiler production efficiency.

66
REFERENCES
Acar, N., E. T. Moran, Jr., W. H. Revingtion, and S.F. Bilgili. 1991. Effect of improved
pellet quality from using a calcium lignosulfonate binder on performance and
carcass yield of broilers reared under different marketing schemes. Poult. Sci.
70:1339-1344.
Behnke, K. C. 1996. Feed manufacturing technology: current issues and challenges.
Anim. Feed Sci. Tech. 62:49-57
Belay, T., and R. G. Teeter. 1994. Virginiamycin effects on performance and salable
carcass of broilers. J. Appl. Poult. Res. 3:111-116.
Bolton, W. 1960. The digestibility of mash and pellets by chicks. J. Agric. Sci. 55:141-
142.
Briggs, J. L., D. E. Maier, B. A. Watkins, and K. C. Behnke. 1999. Effect of ingredients
and processing parameters on pellet quality. Poult. Sci. 78:1464-1471.
Buyse, J., E. R. Kuhn, and E. Decuypere. 1996. The use of intermittent lighting in
broiler raising. 1. Effect on broiler performance and efficiency of nitrogen
retention. Poult. Sci. 75:589-594.
Choi, J. H., B. S. So, K. S. Ryu, and S. L. Kang. 1986. Effects of pelleted or crumbled
diets on the performance and the development of the digestive organs of broilers.
Poult. Sci. 65:594-597.
Cobb Vantress, Inc. 2003. Cobb Broiler Nutrition Guide. Cobb-Vantress, Inc. Siloam
Springs, AR.
Cravener, T. L., W. B. Roush, and M. M. Mashaly. 1992. Broiler production under
varying population densities. Poult. Sci. 71:427-433.

67
Hollander, M., and D. A. Wolf. 1973. Nonparametric Statistical Methods. John Wiley
and Sons. New York.
Hussar, H., and A. R. Robblee. 1962. Effects of pelleting on the utilization of feed by the
growing chicken. Poult. Sci. 41:1489-1493.
Ingram, D. R., L. F. Hatten, III, and B. N. McPherson. 2000. Effects of light restriction
on broiler performance and specific body structure measurements. J. Appl. Poult.
Res. 9:501-504.
Jensen, L. S., L. H. Merrill, C. V. Reddy, and J. McGinnis. 1962. Observations on eating
patterns and rate of food passage of birds fed pelleted and unpelleted diets. Poult.
Sci. 41:1414-1419.
Leeson, S., L. Caston, and J. D. Summers. 1996. Broiler response to diet energy. Poult.
Sci. 75:529-535.
Lott, B. D., J. D. Simmons, and J. D. May. 1998. Air velocity and high temperature
effects on broiler performance. Poult. Sci. 77:391-393.
MacLeod, M. G. 1997. Effects of amino acid balance and energy:protein ratio on energy
and nitrogen metabolism in male broiler chickens. Br. Poult. Sci. 38:405-411.
Moreng, R. E., and J. S. Avens. 1985. Nutrition and feeding. Pages 203-234 in Poultry
Science and Production. Reston Publishing Company, Inc., Reston, Virginia.
Moritz, J. S., R. S. Beyer, K. J. Wilson, K. R. Cramer, L. J. McKinney, and F. J.
Fairchild. 2001. Effect of moisture addition at the mixer to a corn-soybean based
diet on broiler performance. J. Appl. Poult. Res. 10:347-353.
National Research Council. 1994. Nutrient Requirements of Poultry. 9th rev. ed. Natl.
Acad. Press. Washington, DC.
68
Neter, J., W. Wasserman, and M. H. Kutner. 1990. Building the regression model.
Pages 433-483 in Applied Linear Statistical Models. Richard D. Irwin, Inc.
Homewood, IL.
Nir, I., and R. Hillel. 1995. Effect of particle size on performance. 3. Grinding pelleting
interactions. Poult. Sci. 74:771-783.
Ohtani, S., and S. Leeson. 2000. The effect of intermittent lighting on metabolizable
energy intake and heat production of male broilers. Poult. Sci. 79:167-171.
Plavnik, I., E. Wax, D. Sklan, and S. Horwitz. 1997. The response of broiler chickens and
turkey poults to steam-pelleted diets supplemented with fat or carbohydrates.
Poult. Sci. 76:1006-1013.
Puron, D., R. Santamaria, and J. C. Segura. 1997. Sodium bicarbonate and broiler
performance at high stocking densities in a tropical environment. J. Appl. Poult.
Res. 6:443-448.
Reddy, C. V., L. S. Jensen, L. H. Merrill, and J. McGinnis. 1962. Influence of
mechanical alteration of dietary density on energy available for chick growth. J.
Nutr. 77:428-432.
Rice, J. E., and H. E. Botsford. 1956. Principles of feeding and formulating rations. Pages
118-138 in Practical Poultry Management. John Wiley and Sons, Inc. New York.
Richardson, W., and E. J. Day. 1976. Effect of varying levels of added fat in broiler diets
on pellet quality. Feedstuffs (May 17):24.
SAS Institute. 2000. The SAS System for Windows 2000. Release 8.1 SAS Institute Inc.,
Cary, NC.
Scheideler, S. E. 1995. Is pelleting cost effective? Feed Mangement. Vol 46, No. 1. p

69
21-26
Sibbald, I. R. 1977. The effect of steam pelleting on the true metabolizable energy values
of poultry diets. Poult Sci. 56:1687-1688.
Sizemore, F. G., and H. S. Siegel. 1993. Growth, feed conversion, and carcass
composition in females of four broiler crosses fed starter diets with different
energy levels and energy to protein ratios. Poult. Sci. 72:2216-2228.
Skinner-Noble, D. O., R. B. Jones, and R. G. Teeter. 2001. Is improved feed conversion
associated with increased lethargy and docility in broiler chickens? Poult. Sci.
80(Suppl):44.
Skinner-Noble, D. O., J. G. Berry, and R. G. Teeter. 2002. Use of simple feeding
programs for broilers. Animal Science Research Report. Oklahoma State
University. Stillwater, OK.
Skinner-Noble, D. O., R. B. Jones, and R. G. Teeter. 2003. Components of feed
efficiency in broiler breeding stock: Is improved feed conversion associated
with increased letargy and docility in broiler chickens? Poult. Sci. 82: 532-537.
Wiernusz, C. W., B. C. Park, and R. G. Teeter. 1999. Prediction of carcass fat, protein,
and energy content from carcass dry matter and specific gravity of broilers. Asian
J. Anim. Sci. 12:42-48.
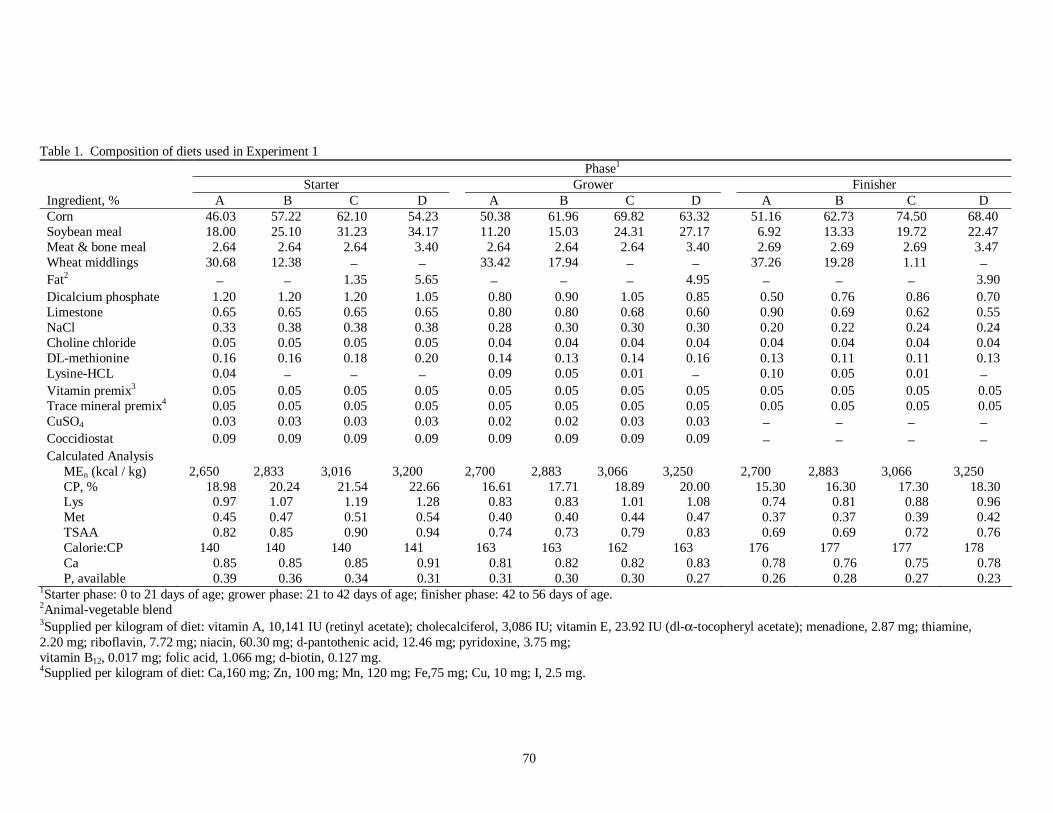
70
Table 1. Composition of diets used in Experiment 1 Phase1 Starter Grower Finisher Ingredient, % A B C D A B C D A B C D Corn 46.03 57.22 62.10 54.23 50.38 61.96 69.82 63.32 51.16 62.73 74.50 68.40 Soybean meal 18.00 25.10 31.23 34.17 11.20 15.03 24.31 27.17 6.92 13.33 19.72 22.47 Meat & bone meal 2.64 2.64 2.64 3.40 2.64 2.64 2.64 3.40 2.69 2.69 2.69 3.47 Wheat middlings 30.68 12.38 − − 33.42 17.94 − − 37.26 19.28 1.11 − Fat2 − − 1.35 5.65 − − − 4.95 − − − 3.90 Dicalcium phosphate 1.20 1.20 1.20 1.05 0.80 0.90 1.05 0.85 0.50 0.76 0.86 0.70 Limestone 0.65 0.65 0.65 0.65 0.80 0.80 0.68 0.60 0.90 0.69 0.62 0.55 NaCl 0.33 0.38 0.38 0.38 0.28 0.30 0.30 0.30 0.20 0.22 0.24 0.24 Choline chloride 0.05 0.05 0.05 0.05 0.04 0.04 0.04 0.04 0.04 0.04 0.04 0.04 DL-methionine 0.16 0.16 0.18 0.20 0.14 0.13 0.14 0.16 0.13 0.11 0.11 0.13 Lysine-HCL 0.04 − − − 0.09 0.05 0.01 − 0.10 0.05 0.01 − Vitamin premix3 0.05 0.05 0.05 0.05 0.05 0.05 0.05 0.05 0.05 0.05 0.05 0.05 Trace mineral premix4 0.05 0.05 0.05 0.05 0.05 0.05 0.05 0.05 0.05 0.05 0.05 0.05 CuSO4 0.03 0.03 0.03 0.03 0.02 0.02 0.03 0.03 − − − − Coccidiostat 0.09 0.09 0.09 0.09 0.09 0.09 0.09 0.09 − − − − Calculated Analysis
MEn (kcal / kg) 2,650 2,833 3,016 3,200 2,700 2,883 3,066 3,250 2,700 2,883 3,066 3,250 CP, % 18.98 20.24 21.54 22.66 16.61 17.71 18.89 20.00 15.30 16.30 17.30 18.30 Lys 0.97 1.07 1.19 1.28 0.83 0.83 1.01 1.08 0.74 0.81 0.88 0.96 Met 0.45 0.47 0.51 0.54 0.40 0.40 0.44 0.47 0.37 0.37 0.39 0.42 TSAA 0.82 0.85 0.90 0.94 0.74 0.73 0.79 0.83 0.69 0.69 0.72 0.76 Calorie:CP 140 140 140 141 163 163 162 163 176 177 177 178 Ca 0.85 0.85 0.85 0.91 0.81 0.82 0.82 0.83 0.78 0.76 0.75 0.78 P, available 0.39 0.36 0.34 0.31 0.31 0.30 0.30 0.27 0.26 0.28 0.27 0.23
1Starter phase: 0 to 21 days of age; grower phase: 21 to 42 days of age; finisher phase: 42 to 56 days of age. 2Animal-vegetable blend 3Supplied per kilogram of diet: vitamin A, 10,141 IU (retinyl acetate); cholecalciferol, 3,086 IU; vitamin E, 23.92 IU (dl-α-tocopheryl acetate); menadione, 2.87 mg; thiamine, 2.20 mg; riboflavin, 7.72 mg; niacin, 60.30 mg; d-pantothenic acid, 12.46 mg; pyridoxine, 3.75 mg; vitamin B12, 0.017 mg; folic acid, 1.066 mg; d-biotin, 0.127 mg. 4Supplied per kilogram of diet: Ca,160 mg; Zn, 100 mg; Mn, 120 mg; Fe,75 mg; Cu, 10 mg; I, 2.5 mg.
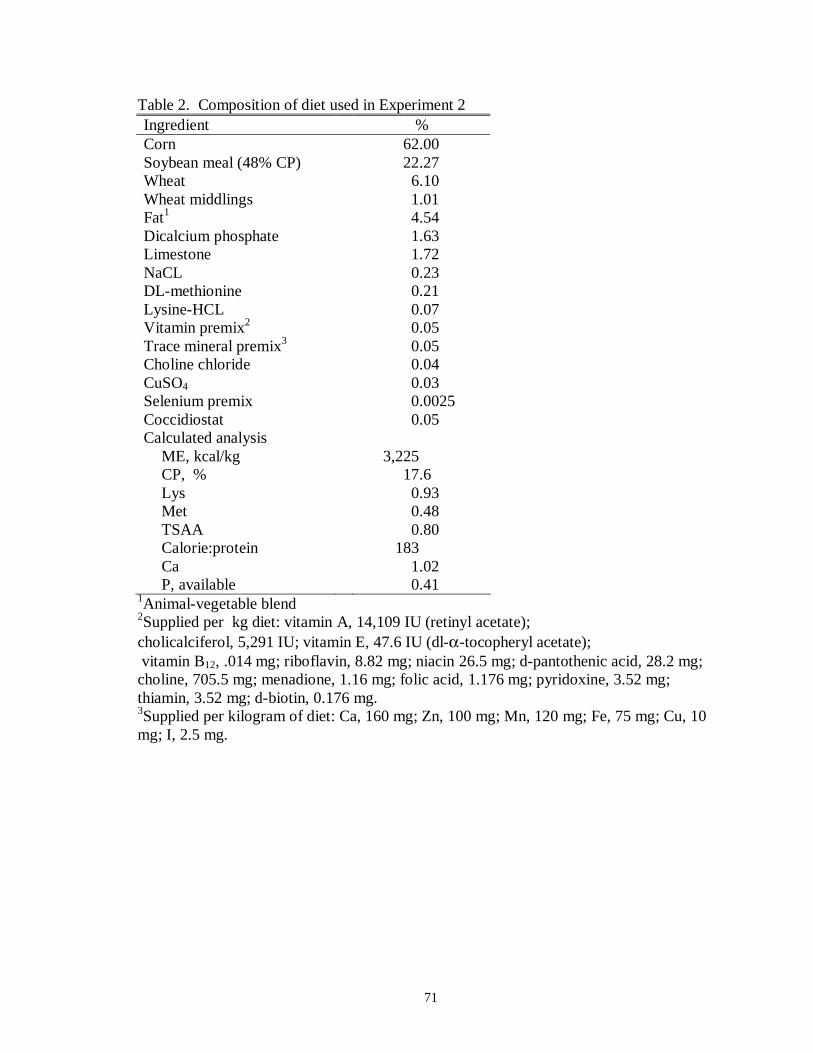
71
Table 2. Composition of diet used in Experiment 2 Ingredient % Corn 62.00 Soybean meal (48% CP) 22.27 Wheat 6.10 Wheat middlings 1.01 Fat1 4.54 Dicalcium phosphate 1.63 Limestone 1.72 NaCL 0.23 DL-methionine 0.21 Lysine-HCL 0.07 Vitamin premix2 0.05 Trace mineral premix3 0.05 Choline chloride 0.04 CuSO4 0.03 Selenium premix 0.0025 Coccidiostat 0.05 Calculated analysis
ME, kcal/kg 3,225 CP, % 17.6 Lys 0.93 Met 0.48 TSAA 0.80 Calorie:protein 183 Ca 1.02 P, available 0.41
1Animal-vegetable blend 2Supplied per kg diet: vitamin A, 14,109 IU (retinyl acetate); cholicalciferol, 5,291 IU; vitamin E, 47.6 IU (dl-α-tocopheryl acetate); vitamin B12, .014 mg; riboflavin, 8.82 mg; niacin 26.5 mg; d-pantothenic acid, 28.2 mg; choline, 705.5 mg; menadione, 1.16 mg; folic acid, 1.176 mg; pyridoxine, 3.52 mg; thiamin, 3.52 mg; d-biotin, 0.176 mg. 3Supplied per kilogram of diet: Ca, 160 mg; Zn, 100 mg; Mn, 120 mg; Fe, 75 mg; Cu, 10 mg; I, 2.5 mg.
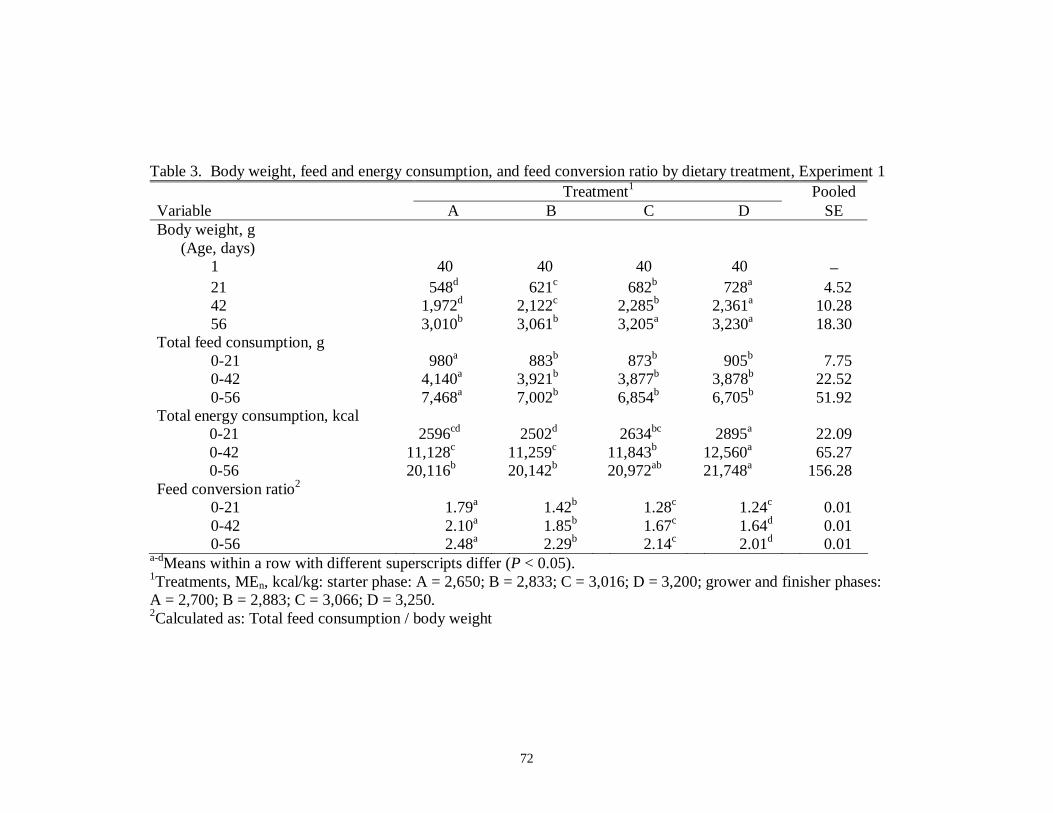
72
Table 3. Body weight, feed and energy consumption, and feed conversion ratio by dietary treatment, Experiment 1 Treatment1 Pooled Variable A B C D SE Body weight, g
(Age, days) 1 40 40 40 40 − 21 548d 621c 682b 728a 4.52 42 1,972d 2,122c 2,285b 2,361a 10.28 56 3,010b 3,061b 3,205a 3,230a 18.30
Total feed consumption, g 0-21 980a 883b 873b 905b 7.75 0-42 4,140a 3,921b 3,877b 3,878b 22.52 0-56 7,468a 7,002b 6,854b 6,705b 51.92
Total energy consumption, kcal 0-21 2596cd 2502d 2634bc 2895a 22.09 0-42 11,128c 11,259c 11,843b 12,560a 65.27 0-56 20,116b 20,142b 20,972ab 21,748a 156.28
Feed conversion ratio2 0-21 1.79a 1.42b 1.28c 1.24c 0.01 0-42 2.10a 1.85b 1.67c 1.64d 0.01 0-56 2.48a 2.29b 2.14c 2.01d 0.01
a-dMeans within a row with different superscripts differ (P < 0.05). 1Treatments, MEn, kcal/kg: starter phase: A = 2,650; B = 2,833; C = 3,016; D = 3,200; grower and finisher phases: A = 2,700; B = 2,883; C = 3,066; D = 3,250. 2Calculated as: Total feed consumption / body weight

73
Table 4. Carcass composition by dietary treatment, Experiment 1 Treatment1 Pooled Variable A B C D SE Carcass weight, g
(Age, d) 42 1,336c 1,443b 1,547a 1,594a 15.50 56 2,199b 2,250b 2,500a 2,445a 24.71
Dressing percentage 42 71.98 71.06 71.62 70.45 0.59 56 74.30c 75.86bc 78.91a 78.13ab 0.46
Dry matter, % 42 35.86b 36.12ab 35.48b 36.65a 0.13 56 34.91 34.99 34.09 34.93 0.26
Specific gravity2 42 1.048 1.047 1.045 1.046 0.001 56 1.043 1.044 1.043 1.039 0.001
Breast, g 42 255.33c 285.5b 326.11a 314.59a 4.07 56 418.35b 460.57ab 503.69a 482.21a 8.86
Abdominal fat, g 42 30.51b 27.35b 30.98b 36.43a 0.80 56 53.48b 54.50ab 65.59a 61.72ab 2.04
Carcass protein, g3 42 236.38c 254.73b 272.41a 278.84a 2.80 56 394.66b 405.32b 450.29a 433.64a 4.48
Carcass fat, g3 42 192.23c 211.16bc 219.95b 244.22a 3.38 56 297.74b 303.04ab 320.07ab 340.37a 6.68
Carcass ash, g3 42 17.79c 19.40bc 19.69b 21.63a 0.30 56 25.67 26.75 27.52 27.28 0.55
a-dMeans within a row with different superscripts differ (P < 0.05). 1Treatments, MEn, kcal/kg: starter phase: A = 2,650; B = 2,833; C = 3,016; D = 3,200; grower and finisher phases: A = 2,700; B = 2,883; C = 3,066; D = 3,250. 2 Specific gravity = carcass wt. in air/(carcass wt. in air - (carcass wt. in water x 0.10)). 3Calculated based on predictive equations proposed by Wiernusz et al., 1999

74
Table 5. Regression equation coefficients relating body weight (BW) and feed conversion ratio (FCR) and caloric density, expressed both as cumulative and daily values
Cumulative Equations Intercept BW BW2 BW3 FCR FCR2 FCR3 BW*FCR BW2*FCR2 R2 (%)
2,903 0.04+ - - - - - - - 1.82 3,656 - - - -398.03** - - - - 31.82 4,040 0.24** - - -865.11** - - - - 82.25 4,451 0.01 - - -1,112.79** - - 0.13** - 84.09 5,032 0.02 6.6 x 10⁻⁵** - -1,800.17** 248.83** - - - 87.78 7,085 0.86** 1.8 x 10⁻⁴** - -4,985.84** 1,472.84** - -0.69** - 92.79 7,018 1.38** -9.0 x 10⁻⁵+ 5.25 x 10⁻⁸** -5,201** 1,566.93** - -0.76 - 93.91
17,014 1.63** -4.3 x 10⁻⁵ 4.66 x 10⁻⁸** -22,031** 10,689** -1,581.30** -0.96 - 97.72 15,919 1.43** -6.95 x 10-5* 6.32 x 10-8** -19,848** 9,296** -1,302.72** -0.77** -1.71 x 10-5* 97.82
Daily Equations
Intercept BW BW2 BW3 FCR FCR2 FCR3 BW*FCR BW2*FCR2 R2 (%) 2,903 0.04+ - - - - - - - 1.82 3,014 - - - -21.75 - - - - 0.81 3,085 0.26** - - -240.88** - - - - 22.74 4,771 -0.19** - - -1,291.96** - - -0.33** - 77.79 4,825 0.05 1.6 x 10⁻⁴** -1,523.77** 164.76** - - - 84.14 4,778 0.17** 2.7 x 10⁻⁴** -1,581.26** 256.59** - -0.22** - 85.19
4,1801 1.17** -3.0 x 10⁻⁴** 1.36 x 10⁻⁷** -1,408.90** 272.21** - -0.37** - 88.34 4,665 1.46** -0.003** 1.43 x 10⁻⁷** -2,214.92** 641.57** -29.58+ -0.59** - 88.59 4,774 1.59** -3.8 x 10⁻⁴** 1.82 x 10⁻⁷** -2,395.09** 672.28** -20.96 -0.57** 7.06 x 10⁻⁶ 88.69
+ P < 0.10 *P < 0.05 **P < 0.01 1 This is the regression model used to predict effective caloric value from BW and FCR.

75
Table 6. Growth performance and behavior traits of 38-day old broilers fed a diet of varying pellet quality1 during a 7 d assessment of feed conversion, Experiment 2 Treatment2 Pooled Performance trait 100 80 60 40 20 M SE
Weight gain, g 725a 701ab 687ab 685ab 675bc 643c 6.16 Feed consumption, g 1,348 1,306 1,312 1,316 1,313 1,280 8.92 Feed conversion ratio 1.87a 1.88a 1.92a 1.93ab 1.95ab 2.02b 0.01
Behavior trait Pellets consumed3, % 100a 87b 63c 42d 21e 0f 0.18 Eating frequency4 0.32a 0.52a 0.78b 0.84b 1.18c 1.31c 0.37 Resting frequency 8.61a 8.48a 8.09b 7.97b 7.48c 7.21c 0.06
a-cMeans within a row with no common superscript differ (P < 0.05). 1Defined as the proportion (%) of pellets to post pellet fines. 2Treatments: 100 = 100 % pellets, 0 % fines; 80 = 80 % pellets, 20 % fines; 60 = 60% pellets, 40 % pellet; 20 = 20 % pellets, 80 % pellet; M = unprocessed mash. 3Pellets consumed = ((initial pellets offered – pellets remaining)/feed consumption) × 100. 4Eating or Resting frequency = times specific activity was observed / 10 observations. Other behaviors recorded, but not presented include: drinking, standing, walking, pecking, and preening.

76
Table 7. Dietary caloric value of changing pellet quality1 Pellet quality Calorie change (MEn/kg) attributable to pellet quality divergence
To From 100 90 80 70 60 50 40 30 20
100 0 -4 -18 -41 -74 -84 -89 -96 -111 90 4 0 -14 -37 -70 -80 -85 -92 -107 80 18 14 0 -23 -56 -66 -71 -78 -93 70 41 37 23 0 -33 -43 -48 -55 -70 60 74 70 56 33 0 -10 -15 -22 -37 50 84 80 66 43 10 0 -5 -12 -27 40 89 85 71 48 15 5 0 -7 -22 30 96 92 78 55 22 12 7 0 -15 20 111 107 93 70 37 27 22 15 0
1The calorific value of pellet quality change is attained by the intersection between initial and final pellet qualities. Negative values represent declining while positive values improving pellet quality change.

77
Table 8. Interactive effects of added fat and pellet quality on dietary caloric gain (MEn/kg)
Added fat, %
Anticipated diet caloric value due to added fat,
MEn/kg
Anticipated pellet quality1, %
Additional calories
due to pelleting, MEn/kg
Effective
caloric value, MEn/kg2
Incremental calorie change via added fat
and pellet quality, MEn/kg
0 2,977 90 183 3,160 − 1 3,014 82 173 3,187 27 2 3,049 78 165 3,214 27 3 3,084 71 149 3,233 19 4 3,120 68 140 3,260 27 5 3,157 49 103 3,260 0
1Based upon data reported by Richardson and Day (1976). 2Energy attributable to fat inclusion minus energy lost due to pellet degradation.
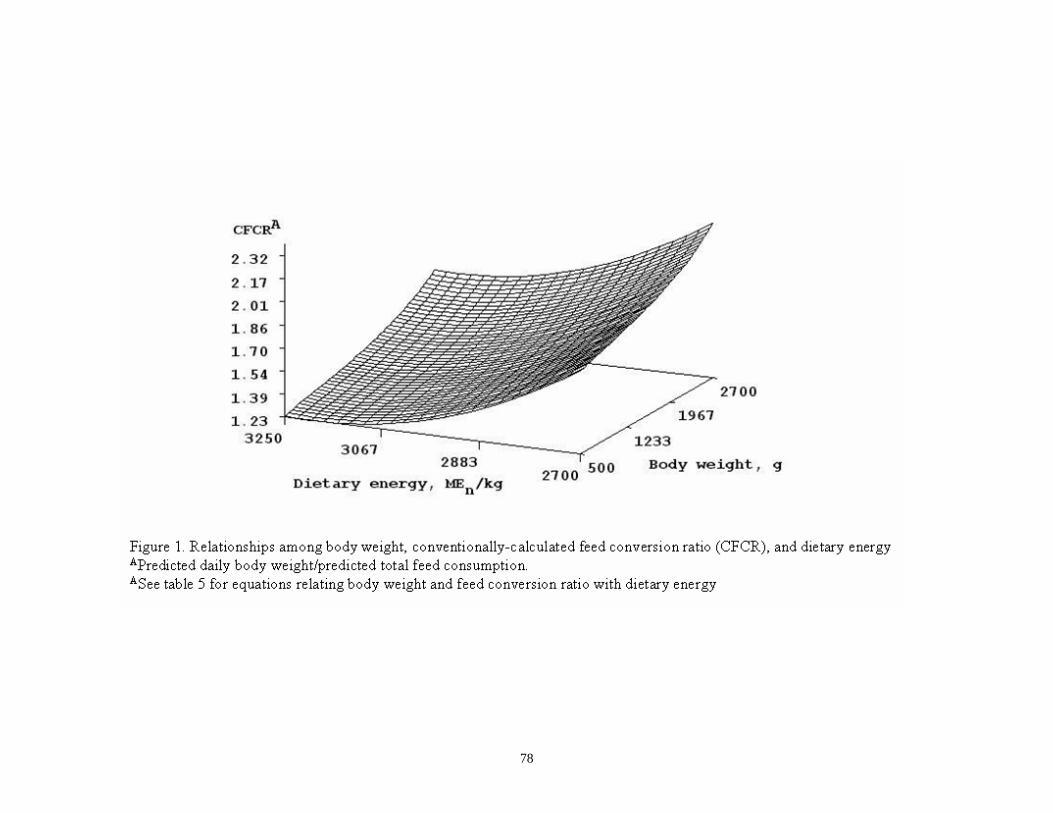
78
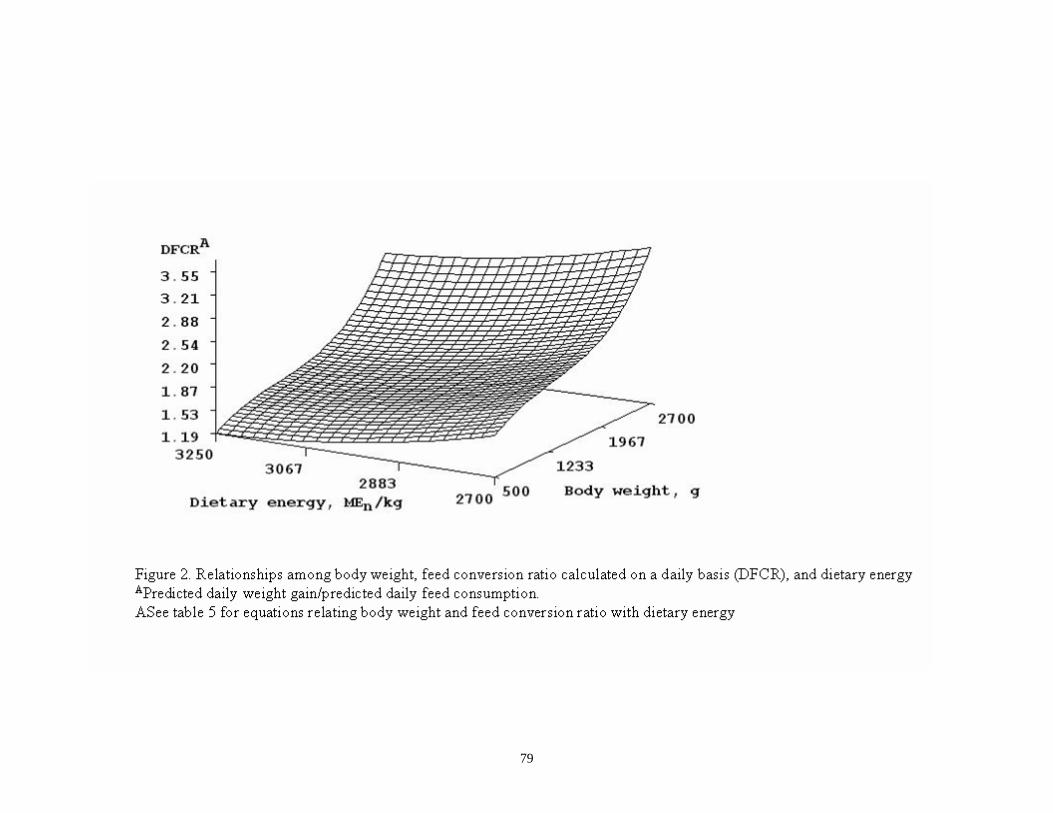
79

80

81
CHAPTER V
Predicting Effective Caloric Value of Nonnutritive Factors: III. Feed Form
Impacts Broiler Performance by Modifying Behavior Patterns
D. O. Skinner-Noble, L. J. McKinney, and R. G. Teeter
Department of Animal Science
Oklahoma State University
Stillwater, OK 74078
Section Preference: Nutrition and Metabolism
Research Note: Full-Length Paper: X
RUNNING TITLE: Pelleting, Net Energy, and Behavior
Abbreviation Key: ECV=effective caloric value; FCR=feed conversion ratio; M=mash;
NEg=net energy for gain; P=pellets; PQ=pellet quality

82
ABSTRACT
Two trials of an experiment were conducted to confirm the relationships among
effective caloric value (ECV) of the diet, net energy for gain (NEg), BW, feed conversion
ratio (FCR), and broiler behavior. Further the study sought to examine such factors with
benefits of pelleting, including feed form history (pellets vs. mash) in females from two
strains of commercial broilers. Composition of gain was measured on a sample of birds
in both trials. In Trial 1 birds were reared to 23 d on feed in crumble form, at which time
the birds were fed a feed in either pellet or mash form. Pelleting the feed increased ECV,
total NEg, while decreasing eating, and increasing resting behavior. Significant
correlations (P < 0.05) between resting, NEg, and ECV occurred. In Trial 2, birds were
reared to 23 d on a crumble diet, then fed diet in either mash or pellet form to 36 d. At 37
d of age, half of the birds from each strain and feed form history combination were
switched to the alternative feed form. Strain by grower feed form interactions were
present for BW, initial fat, and energy content indicating that pelleted feed was required
for optimum broiler performance of one strain. Grower feed form by finisher feed form
interactions were present that demonstrated that birds switched to the alternate feed form
consumed more feed in less than half the time of the birds that remained on their previous
feed form. Significant correlations were observed in both trials between behaviors and
FCR and ECV, while NEg reflected these differences in Trial 1 but not Trial 2.
Regression analysis indicated that FCR (and subsequently ECV) was best predicted by
lean gain, whereas NEg was best predicted by fat gain. Further, regression analysis
established interactive equations where ECV was predicted (R2 > 0.99) by eating and
resting behavior. The results of these trials indicate that the effects of feed form are
83
caused by a modification of behavior patterns, that ECV is responsive to such behavior
changes, and that ECV is an effective estimator of the relative caloric value of genetic,
management, and husbandry influences.
(Key words: pelleting, net energy, effective caloric value, behavior, genotype by
environment interactions)
INTRODUCTION
Paramount among nutritional goals is the reasonable balance between dietary
provision of nutrients and energy. Consequently, rations are generally formulated to
specific nutrient:energy ratios. Such ratios are usually not interactive with the genetics
and managerial environment (NRC, 1994). One could surmise this to leave a lesser
importance being attributable to nutritional and managerial interface. However, the
interfacing of nutrition with the ambient and managerial environments has profound
influence upon the extent and profitability of the poultry enterprise. For example,
numerous managerial – husbandry decisions related to stocking density (Cravener et al.,
1992; Puron et al., 1997), lighting program (Buyse et al., 1996; Ingram et al., 2000),
ventilation (Lott et al., 1998), feed processing techniques as pelleting (Acar et al., 1991;
Schiedeler, 1995; Moritz et al., 2001), and nutritional consideration (NRC, 1994) are well
documented to have significant impact upon poultry performance. Coupling such
observations with the suggestion that no cessation of selection response has been
observed for increased BW of turkeys (Nestor et al., 1996), chickens (Dunnington and
Siegel, 1996), and Japanese quail (Marks, 1996), even up to nearly 100 generations of

84
selection, indicates that mechanistic understanding of interactions for the aforementioned
variables is needed.
Traditionally, studies examining genetic × nonnutritional × nutritional interactions
are limited. Such is the case presumably due to the complexity of variable type, number
of variables involved, and difficulty in manipulating the three components at multiple
levels simultaneously. Paramount among nutritional influences upon broiler performance
are factors influencing growth and FCR. Bird nutrient and energy requirements are
closely related to performance as growth and FCR. McKinney and Teeter (2004)
proposed a methodology that enables predicting dietary caloric density from boiler
growth and FCR. Energy values so predicted, termed effective caloric value (ECV) of
dietary MEn, provide a relative value for combined dietary and non-dietary factors
influencing broiler performance. That study went on to confirm the model and used
pellet quality (PQ; defined as the ratio of pellets:pellet fines presented to the bird), as a
nonnutritive variable. The authors concluded that pelleting results in up to an additional
187 kcal MEn/kg of diet, and that PQ and resting behavior were well correlated.
Consequently, a component of the aforementioned managerial influence upon broiler
performance may well relate to energy expenditure associated with activity.
The traditional wisdom of poultry producers is that environmental variability,
attributable to management-husbandry, elicits broiler behavioral responses, though such
are not well documented in the literature. If the beneficial effects of feed form as
reported by McKinney and Teeter (2004) were indeed due to alteration in bird behavior,
it is thereby logical to assume that feed form inconsistencies would also be important.
Whether among batches received from the feed mill or within house variation, feed form

85
inconsistencies (i.e., fluctuating PQ or mash vs. pellets) will inevitably exist. However,
consequences of varying feed form or feed form history effects have yet to be
demonstrated and may vary with the ability or inability of the various broiler strains to
adapt to alternating feed form.
Selection for increased BW in turkeys has led to an apparent increase in resting
behavior, and a decrease in walking behavior in terms of time spent walking and number
of steps taken (Noble et al., 1996). If similar patterns are present with broiler chickens, it
may be reasonable to assume that resting behavior in broilers has either increased with
continued selection for improved BW and FCR, or is potentially influenced by bird
strain. Given the relationship observed among PQ, resting behavior, FCR, and ECV
(McKinney and Teeter, 2004), then improvements in FCR cannot be totally disjoint from
correlated responses to selection on behaviors. Likewise, changes in behavior could be
applied independent of selection to improve FCR and other broiler traits. The study
reported herein was conducted: 1) to confirm the relationship among ECV, BW, FCR,
and behavior of broilers; 2) to further describe benefits of pelleting by assessing pelleting
effects on NEg; and 3) to determine the effects of strain, feed form history, and current
pellet treatment on broiler performance, behaviors, ECV, and NEg.
MATERIALS AND METHODS
General.
Female broiler chicks (200 from each of strain A and B; 400 total) were obtained
from a commercial hatchery following sexing and vaccination for Marek’s disease.
These strains used the same sire lines reported by Skinner-Noble et al. (2003b). Upon
86
arrival, all birds were wingbanded and placed into 12 floor pens. Birds were provided
feed and water for ad libitum consumption while in floor pens (except as noted), and the
lighting program used was 23L:1D from 0 to 7 d, 16L:8D thereafter in the floor pens, and
14L:10D while in FCR cages. All birds were fed a starter diet in crumble form
containing 22.67% CP and 3,026 kcal MEn/kg from hatching to 16 d of age. From 16 to
22 d, all birds were fed a grower diet containing 20.20% CP and 3,119 kcal MEn/kg,
again in crumble form. The grower diet was fed to 32 d of age, at which time birds were
fed a finisher containing 17.33% CP and 3,199 kcal MEn/kg diet. The amino acid levels
of the diets fed matched current recommendations (NRC, 1994).
At 20 d of age, all birds were randomly assigned to one of four testing weeks, of
which two are reported herein. All birds were handled, their wingbands read, and spray
paint was applied to their wing bows to minimize additional handling as birds were used
for the subsequent FCR testing. At 23 d of age, half of the birds from each strain were
provided their diet in mash form, whereas the remaining birds were fed their diets in
pellet form. Though feeds were changed from starter to grower at 16 d, and from grower
to finisher at 32 d of age, treatments will be described as “grower feed form” to describe
the feed form offered from 23 to 36 d of age, and “finisher feed form” to describe the
feed form offered from 37 to 44 d of age.
When in FCR testing cages, scan sample behavior observations were conducted
on three days of the 7-d FCR test. Birds were observed 5 times every 2 h during the light
phase, and classified as eating, drinking, standing, resting, walking, pecking, preening, or
any other behavior (as described by Skinner-Noble et al., 2003a). In addition to the
aforementioned behavior categories, birds were also classified as dustbathing if their

87
body was in contact with the litter and actively moving it through their feathers. In each
trial a sample of the birds (36 of 72 in Trial 1 and 32 of 72 in Trial 2) were assessed for
initial and final body composition. In both trials birds were anesthesitized (by
intramuscular injection of a solution of 75% Rompin and 25% Ace at a dose of 0.26 mL /
kg of BW) and their body lean, fat, and bone mass measured using an x-ray
densitometer1. Total energy content was calculated as the sum of: (fat mass x 9.31) and
[(lean mass x 0.2477 x 5.65); Dixson, 2003]. The net energy for gain (NEg) was
calculated as the difference between initial and final energy, and expressed both in total
and per kg of diet consumed.
As birds were removed from the floor pens, the number of pens used was reduced
to maintain constant stocking density. Differences between the two trials will be
discussed as follows.
Trial 1.
At 22 d of age, 72 birds (36 per strain) were removed from their pens and fasted
overnight in preparation for a 7-d assessment of feed conversion. At 23 d of age, 36 birds
(18 per strain) were anesthesitized and their body composition measured. Following
body composition measurement, all feeders were weighed, and all birds were weighed
and placed into FCR testing cages (as described by Skinner-Noble et al., 2003a). In FCR
cages, birds were provided the aforementioned grower diet in either pellet or mash form.
At the end of the FCR test all feeders and birds were weighed, and the birds which were
previously assessed for body composition had their body composition measured, after
being euthanized by carbon dioxide inhalation. Treatments were arranged in a 2 strains
(A vs. B) 2 grower feed forms (pellets vs. mash) factorial arrangement for this trial.
1 Holdel QDR4500. Hologic Corporation, Waltham, MA 02154

88
Trial 2.
At 36 d of age, 72 birds [18 from each strain (A vs. B) and grower feed form
(pellets vs. mash from 23-36 d) combination] were removed from their floor pens and
fasted overnight in preparation for a 7-d FCR test. Half of the birds from each strain and
grower feed form were switched to the alternate finisher feed form, whereas the
remaining half remained on their previous feed form. Body composition was measured
on 32 birds (8 from each strain and grower feed form combination). Treatments were
arranged in a 2 strains, 2 grower feed form, × two finisher feed form (switched to the
alternate feed form or not from 37-44 d) factorial arrangement for this trial.
Data analysis.
In both trials, data were analyzed by analysis of variance as a completely
randomized design with the aforementioned factorial arrangement of treatments, with
appropriate interaction terms. Significance was accepted at P < 0.05. Actual P values are
presented where P < 0.10. Behaviors were averaged across all observation days and time
of day to provide a summary of activity patterns, and to provide a single unit for each
behavior trait that could then be used in subsequent correlation analyses. The ECV was
calculated by the equation of McKinney and Teeter (2004) using the average of the
starting and ending BW and the FCR while on test. Correlations were made between
broiler traits (starting and ending BW, feed intake, BW gain, FCR, and ECV) and
behaviors for all birds. Correlations were also made between behaviors, ECV, and total
NEg and NEg per kg of diet consumed to determine if activity of broilers affects NEg.

89
Regression analyses were used for both trials to establish quantitative relationships
among ECV, feed consumption, and behaviors.
RESULTS AND DISCUSSION
Trial 1.
As with McKinney and Teeter (2004), pelleting improved BW gain, feed intake,
FCR, and subsequent ECV (Table 1) compared to feeding mash. As expected from
results of Jensen et al. (1962), birds fed pellets were observed eating less often (4.25% vs.
18.81%) and resting more (62.48% vs. 47.35%) than those fed mash. The magnitude of
difference between pellets and mash for eating behavior agrees well with Jensen et al.
(1962), who found a three-fold difference in time spent eating between chickens fed
pellets vs. mash. Strain differences were significant for BW gain and FCR, in agreement
with Skinner-Noble et al. (2003b) who used the same sire lines as the current report.
When the model of McKinney and Teeter (2004) relating caloric density to BW
and FCR was applied, the resulting ECV (in MEn) of the diet was 3,028 kcal/kg for mash
and 3,179 kcal/kg for pellets, resulting in an average of 3,103 kcal MEn/kg (Table 1),
closely matching the calculated MEn of the current grower diet of 3,119 kcal MEn/kg.
Both strain and feed form impacted ECV (P < 0.05). Pelleting benefits, calculated as the
differential ECV between pellets and mash, was 151 Kcal MEn/kg of ration. Though the
model of McKinney and Teeter (2004) used males and the current study used females,
the aforementioned model appears to fit the current data. This may be due in part to the
age of birds utilized in Trial 1. The model would be expected to fit less well as female
birds aged, and sexual dimorphism would become a greater factor.
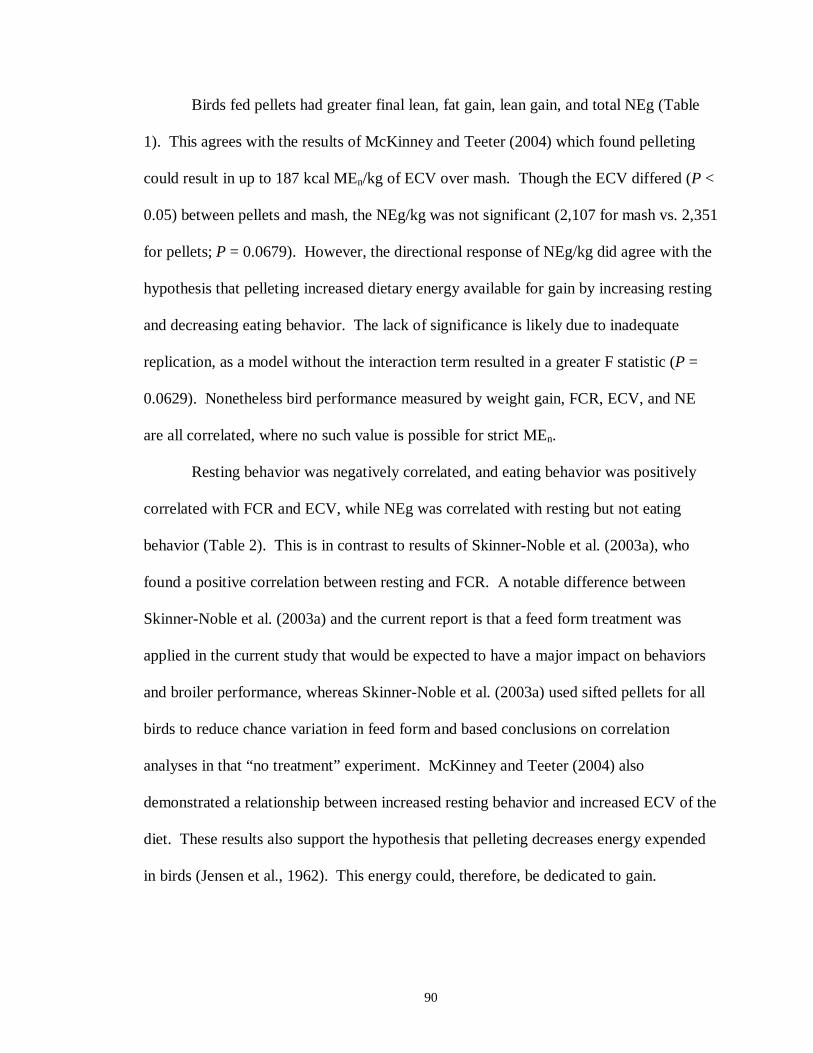
90
Birds fed pellets had greater final lean, fat gain, lean gain, and total NEg (Table
1). This agrees with the results of McKinney and Teeter (2004) which found pelleting
could result in up to 187 kcal MEn/kg of ECV over mash. Though the ECV differed (P <
0.05) between pellets and mash, the NEg/kg was not significant (2,107 for mash vs. 2,351
for pellets; P = 0.0679). However, the directional response of NEg/kg did agree with the
hypothesis that pelleting increased dietary energy available for gain by increasing resting
and decreasing eating behavior. The lack of significance is likely due to inadequate
replication, as a model without the interaction term resulted in a greater F statistic (P =
0.0629). Nonetheless bird performance measured by weight gain, FCR, ECV, and NE
are all correlated, where no such value is possible for strict MEn.
Resting behavior was negatively correlated, and eating behavior was positively
correlated with FCR and ECV, while NEg was correlated with resting but not eating
behavior (Table 2). This is in contrast to results of Skinner-Noble et al. (2003a), who
found a positive correlation between resting and FCR. A notable difference between
Skinner-Noble et al. (2003a) and the current report is that a feed form treatment was
applied in the current study that would be expected to have a major impact on behaviors
and broiler performance, whereas Skinner-Noble et al. (2003a) used sifted pellets for all
birds to reduce chance variation in feed form and based conclusions on correlation
analyses in that “no treatment” experiment. McKinney and Teeter (2004) also
demonstrated a relationship between increased resting behavior and increased ECV of the
diet. These results also support the hypothesis that pelleting decreases energy expended
in birds (Jensen et al., 1962). This energy could, therefore, be dedicated to gain.
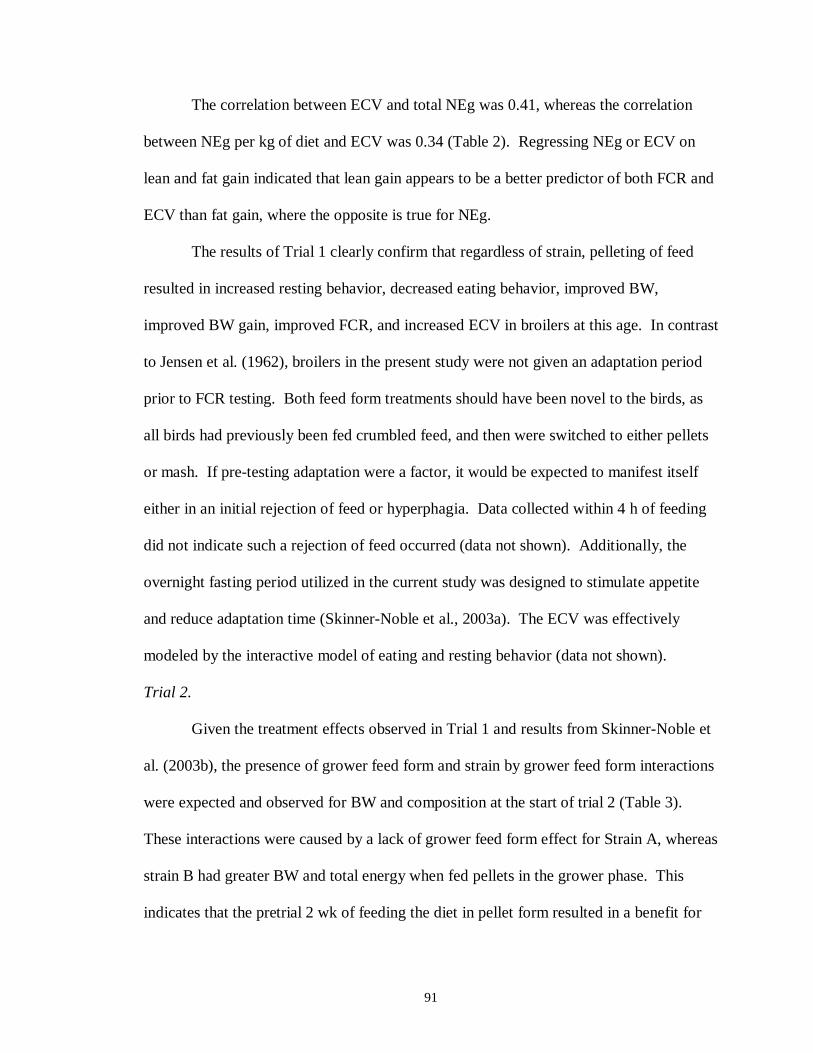
91
The correlation between ECV and total NEg was 0.41, whereas the correlation
between NEg per kg of diet and ECV was 0.34 (Table 2). Regressing NEg or ECV on
lean and fat gain indicated that lean gain appears to be a better predictor of both FCR and
ECV than fat gain, where the opposite is true for NEg.
The results of Trial 1 clearly confirm that regardless of strain, pelleting of feed
resulted in increased resting behavior, decreased eating behavior, improved BW,
improved BW gain, improved FCR, and increased ECV in broilers at this age. In contrast
to Jensen et al. (1962), broilers in the present study were not given an adaptation period
prior to FCR testing. Both feed form treatments should have been novel to the birds, as
all birds had previously been fed crumbled feed, and then were switched to either pellets
or mash. If pre-testing adaptation were a factor, it would be expected to manifest itself
either in an initial rejection of feed or hyperphagia. Data collected within 4 h of feeding
did not indicate such a rejection of feed occurred (data not shown). Additionally, the
overnight fasting period utilized in the current study was designed to stimulate appetite
and reduce adaptation time (Skinner-Noble et al., 2003a). The ECV was effectively
modeled by the interactive model of eating and resting behavior (data not shown).
Trial 2.
Given the treatment effects observed in Trial 1 and results from Skinner-Noble et
al. (2003b), the presence of grower feed form and strain by grower feed form interactions
were expected and observed for BW and composition at the start of trial 2 (Table 3).
These interactions were caused by a lack of grower feed form effect for Strain A, whereas
strain B had greater BW and total energy when fed pellets in the grower phase. This
indicates that the pretrial 2 wk of feeding the diet in pellet form resulted in a benefit for

92
strain B, whereas no such benefit was observed for strain A from 23-36 d. As a result,
the relative position of birds on the growth curve differed at experiment initiation and
would be expected to impact the results of Trial 2. This is reflected in the initial BW and
composition of birds in Trial 2. These differences agreed with results of trial 1 and are
consistent with previous studies (McKinney and Teeter, 2004).
The results of Trial 2 become clear when the finisher feed form is considered
from the view of being switched from the grower feed form or left the same. When
viewed in that context, birds that were switched to the alternate feed form consumed 50 g
more feed in less than half the time of those birds that were not switched to the alternate
feed form, regardless of the grower feed form (Table 3). This indicates that birds
adjusted to a switch in feed form with hyperphagia. Anecdotal evidence from the
authors’ laboratory indicates that similar hyperphagia often occurs in response to a
perceived stressor. This decreased time spent eating was then devoted to resting. This
increase in resting and decrease in eating appears to be the driving factor leading to a 10
point improvement in FCR during the finisher phase. Again, this was regardless of
grower feed form. When used in a regression model, the interactive effects of eating and
resting effectively model ECV, with an R2 of over 99% (Figure 1). While it may seem
contrary to expectations that the coefficients of both eating and resting behavior were
positive for their effect on ECV, it should be noted that feed intake increased as eating
time decreased (Figure 2).
There appears to be a carry-over effect of grower feed form that affected
subsequent feed intake and weight gain (Table 3). Birds fed pellets during the grower
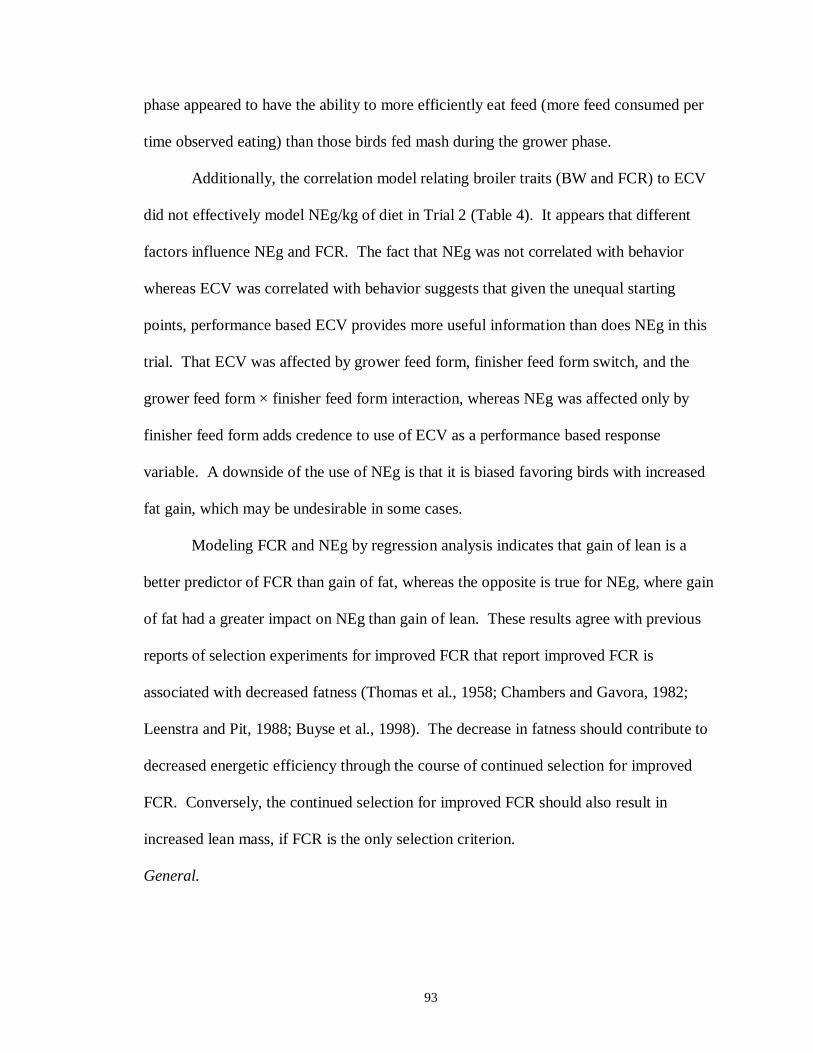
93
phase appeared to have the ability to more efficiently eat feed (more feed consumed per
time observed eating) than those birds fed mash during the grower phase.
Additionally, the correlation model relating broiler traits (BW and FCR) to ECV
did not effectively model NEg/kg of diet in Trial 2 (Table 4). It appears that different
factors influence NEg and FCR. The fact that NEg was not correlated with behavior
whereas ECV was correlated with behavior suggests that given the unequal starting
points, performance based ECV provides more useful information than does NEg in this
trial. That ECV was affected by grower feed form, finisher feed form switch, and the
grower feed form × finisher feed form interaction, whereas NEg was affected only by
finisher feed form adds credence to use of ECV as a performance based response
variable. A downside of the use of NEg is that it is biased favoring birds with increased
fat gain, which may be undesirable in some cases.
Modeling FCR and NEg by regression analysis indicates that gain of lean is a
better predictor of FCR than gain of fat, whereas the opposite is true for NEg, where gain
of fat had a greater impact on NEg than gain of lean. These results agree with previous
reports of selection experiments for improved FCR that report improved FCR is
associated with decreased fatness (Thomas et al., 1958; Chambers and Gavora, 1982;
Leenstra and Pit, 1988; Buyse et al., 1998). The decrease in fatness should contribute to
decreased energetic efficiency through the course of continued selection for improved
FCR. Conversely, the continued selection for improved FCR should also result in
increased lean mass, if FCR is the only selection criterion.
General.

94
That diets differing only in feed form resulted in different broiler performance and
NEg responses of broilers should not be surprising. MacLeod (2000) stated that while
ME is a property of the feed, net energy is the response of the bird to its feed.
Concomitantly, it appears appropriate because ECV represents the interfacing of bird,
diet, and environment. Similarly, Skinner-Noble and Teeter (2003) reported that broilers
differing in FCR expressed greater NE response than measured ME responses. The lack
of difference in NEg between pellets and mash (P = 0.0679) in Trial 1 may be due to
difficulties associated with measuring NEg, or it may be an artifact of the sample size.
Skinner-Noble and Teeter (2003) reported NEg values obtained by subtracting total heat
production from measured apparent ME. The current study obtained NEg by subtracting
initial energy from final energy as measured by whole bird live body composition. As
such, this method would have fewer sources of error than those of Skinner-Noble and
Teeter (2003).
This study also points out how NEg and FCR are influenced by different factors,
most notably gain of fat having a greater impact on NEg, whereas gain of lean has a
greater impact on FCR and consequently ECV. This would be expected, given that each
g of protein gained yields 3.03 g of lean (and thus BW) gain and 1.695 calories of energy,
whereas 1 g of lipid gained yields 1 g of fat (and thus BW) gain and 9.31 calories of
energy (Dixson, 2003).
While the ECV of McKinney and Teeter (2004) and NEg was well correlated
(Trial 1), the correlation was not significant in Trial 2. The unequal initial BW and
composition as lean and fat would be expected to influence bird maintenance energy need
and may have unduly influenced NEg to the point that the current feed form effects were

95
masked by previous actions. Nonetheless, in both trials ECV provided a useful
assessment of the relative practical value of a management-husbandry practice, as
correlations between bird behavior and performance were attained. Because ECV is
based on two traits (BW and FCR) that are fairly easy to measure in the field (as opposed
to NEg, which is difficult to measure in the field), they can be used to place relative merit
on management and husbandry practices. Ultimately the goal of animal production is
efficient production of lean tissue with acceptable fatness. Whereas NEg is related to fat
gain, ECV more closely expresses the relationship between the bird and its environment.
If NEg were the only criterion for efficiency of production, then increased fatness would
result and indeed appears that it masks husbandry relationships. Thus, ECV does appear
to be a practical predictor of the effective and relative values of any management-
husbandry changes that result in changes in BW and FCR. Subsequent energy utilization
fate will be determined by the “ration balance”, relative to the birds’ potential for lean
mass accretion. Those wishing to produce a specific bird composition must thereby
integrate both nutrition and management.
The most striking finding of these trials is the manner in which the interactive
model of eating and resting behavior effectively predicted ECV. It indeed appears that
pelleting benefits broiler performance by modifying behavior patterns, notably by
reducing times observed eating and increasing times observed resting. Similar
relationships among eating, resting, and ECV were observed in both trials. Similarly,
voracity of eating occurred in both trials indicating that increased feed intake occurred in
a reduced time observed eating. Jensen et al. (1962) determined that broilers reduced
eating time in response to pelleting feed. This response occurred after a week of

96
adaptation to the tested feed forms. The current study did not use an adaptation period,
and observed more extreme modifications of behavior patterns (hyperphagia in response
to changing feed form in Trial 2) than those observed by Jensen et al. (1962).
The results of these trials indicate that feed form impacts broiler performance
through a reduction in activity, and that response to pelleting of feed depends on the
strain of broiler utilized and their previous feed form history. Regression analysis
indicated that FCR (and subsequently ECV) was best predicted by lean gain, whereas
NEg was best predicted by fat gain. Results indicate that Trial 2 data were biased by
unequal starting composition, where ECV resulted in greater separation of statistical
effects that were not detected by NEg. The ECV appears to be an effective estimator of
the caloric value of management-husbandry practices.
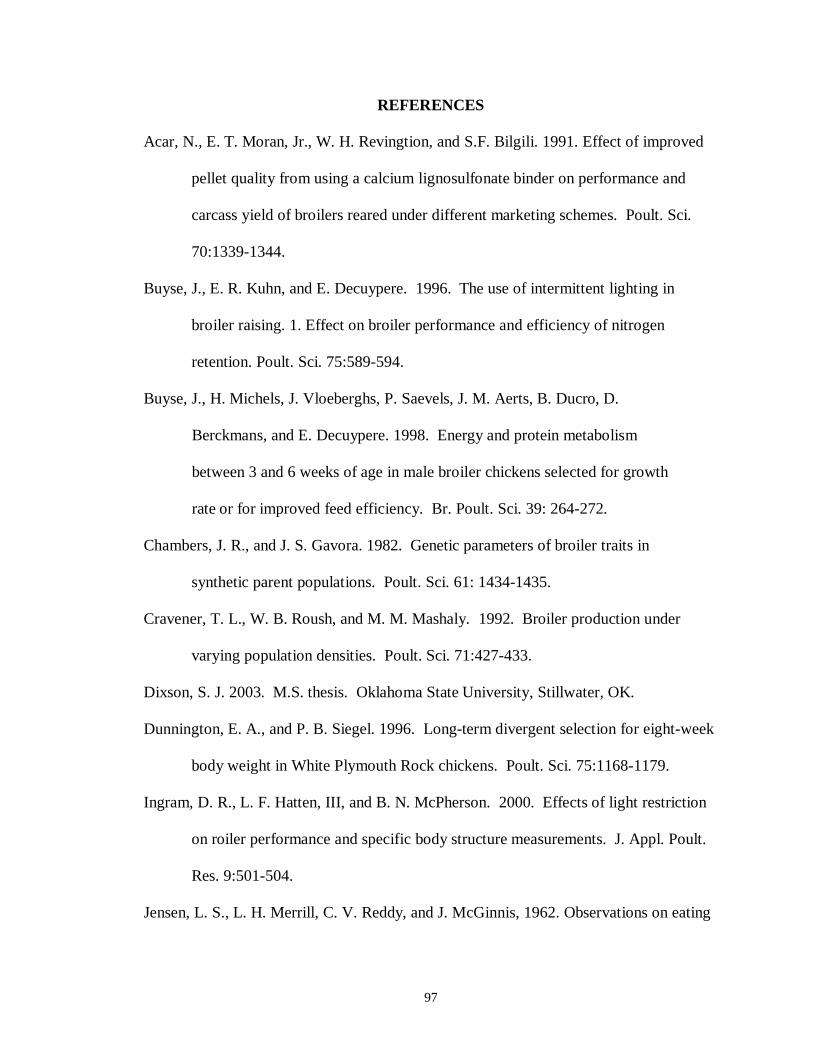
97
REFERENCES
Acar, N., E. T. Moran, Jr., W. H. Revingtion, and S.F. Bilgili. 1991. Effect of improved
pellet quality from using a calcium lignosulfonate binder on performance and
carcass yield of broilers reared under different marketing schemes. Poult. Sci.
70:1339-1344.
Buyse, J., E. R. Kuhn, and E. Decuypere. 1996. The use of intermittent lighting in
broiler raising. 1. Effect on broiler performance and efficiency of nitrogen
retention. Poult. Sci. 75:589-594.
Buyse, J., H. Michels, J. Vloeberghs, P. Saevels, J. M. Aerts, B. Ducro, D.
Berckmans, and E. Decuypere. 1998. Energy and protein metabolism
between 3 and 6 weeks of age in male broiler chickens selected for growth
rate or for improved feed efficiency. Br. Poult. Sci. 39: 264-272.
Chambers, J. R., and J. S. Gavora. 1982. Genetic parameters of broiler traits in
synthetic parent populations. Poult. Sci. 61: 1434-1435.
Cravener, T. L., W. B. Roush, and M. M. Mashaly. 1992. Broiler production under
varying population densities. Poult. Sci. 71:427-433.
Dixson, S. J. 2003. M.S. thesis. Oklahoma State University, Stillwater, OK.
Dunnington, E. A., and P. B. Siegel. 1996. Long-term divergent selection for eight-week
body weight in White Plymouth Rock chickens. Poult. Sci. 75:1168-1179.
Ingram, D. R., L. F. Hatten, III, and B. N. McPherson. 2000. Effects of light restriction
on roiler performance and specific body structure measurements. J. Appl. Poult.
Res. 9:501-504.
Jensen, L. S., L. H. Merrill, C. V. Reddy, and J. McGinnis, 1962. Observations on eating
98
patterns and rate of food passage of birds fed pelleted and unpelleted diets. Poult.
Sci. 41:1414-1419.
Leenstra, F. R., and R. Pit. 1988. Fat deposition in a broiler sire strain. 3. heritability of
and genetic correlations among body weight, abdominal fat, and feed conversion.
Poult. Sci. 67:1-9.
Lott, B. D., J. D. Simmons, and J. D. May. 1998. Air velocity and high temperature
effects on broiler performance. Poult. Sci. 77:391-393.
MacLeod, M. G. 2000. Modelling the utilization of dietary energy and amino acids by
poultry. Pages 393-412 in: Feeding Systems and Feed Evaluation Models. M. K.
Theodorou and J. France, ed. CAB International, Wallingford, Oxon, UK.
Marks, H. L. 1996. Long-term selection for body weight in Japanese Quail under
different environments. Poult. Sci. 75: 1198-1203.
McKinney, L. J., and R. G. Teeter. 2004. Predicting effective caloric value of
nonnutritive factors: I. Pellet quality and II. Prediction of consequential
formulation dead zones. Poult. Sci. (In press).
Moritz, J. S., R. S. Beyer, K. J. Wilson, K. R. Cramer, L. J. McKinney, and F. J.
Fairchild. 2001. Effect of moisture addition at the mixer to a corn-soybean based
diet on broiler performance. J. Appl. Poult. Res. 10:347-353.
National Research Council. 1994. Nutrient Requirements of Poultry. 9th rev. ed. Natl.
Acad. Press. Washington, DC.
Nestor, K. E., D. O. Noble, J. Zhu, and Y. Moritsu. 1996. Direct and correlated
responses to long-term selection for increased body weight and increased
egg production in turkeys. Poult. Sci. 75: 1180-1191.
99
Noble, D. O., J. W. Anderson, and K. E. Nestor. 1996. Range and confinement rearing of
four genetic lines of turkeys. 2. Effects on behavior and tonic immobility. Poultry
Sci. 75:165-171.
Puron, D., R. Santamaria, and J. C. Segura. 1997. Sodium bicarbonate and broiler
performance at high stocking densities in a tropical environment. J. Appl. Poult.
Res. 6:443-448.
Scheideler, S. E. 1995. Is pelleting cost effective? Feed Mangement. Vol 46, No. 1. p
21-26.
Skinner-Noble, D. O., and R. G. Teeter, 2003. Components of feed efficiency in broiler
breeding stock: Energetics, performance, carcass composition, metabolism, and
body temperature. Poultry Sci. 82:1080-1090.
Skinner-Noble, D. O., R. B. Jones, and R. G. Teeter, 2003a. Components of feed
efficiency in broiler breeding stock: Is improved feed conversion associated with
increased docility and lethargy in broilers? Poultry Sci. 82:532-537.
Skinner-Noble, D. O., L. J. McKinney, and R. G. Teeter, 2003b. Pellet quality effects on
broiler growth, efficiency, and palatibility. Poultry Sci. 82: (suppl 1.) 21.
Thomas, C. H., E. W. Glazener, and W. L. Blow. 1958. The relationship between
feed conversion and ether extract of broilers. Poult. Sci. 37: 1177-1179.

100
Table 1. Broiler performance, energy, and behavior traits of two strains of broilers fed either pellets or mash from 23 to 30 d of age, Trial 1 Broiler performance and energy traits1
Strain (S) Treatment (T) BW30 WG2330 FI2330 FCR2330 ECV Fat gain (g)
Lean gain (g)
NE gain (kcal)
NE gain (kcal/kg diet)
Means A Mash 1,207 477 769 1.62 3,013 81.0 334.3 1,222 1,601 A Pellets 1,383 596 923 1.56 3,124 108.6 401.8 1,574 1,779 B Mash 1,249 523 831 1.59 3,044 120.2 353.7 1,614 1,917 B Pellets 1,418 637 922 1.45 3,233 145.2 409.0 1,925 2,159 probability ANOVA Source S NS ** NS * * ** NS ** ** T ** ** ** ** ** * ** * 0.0672 S x T NS NS NS NS NS NS NS NS NS Pooled SEM 18.75 10.28 12.81 0.017 18.07 6.77 8.11 66.55 62.94 Behavior traits2
Strain (S) Treatment (T) Eat Drink Stand Rest Walk Peck Preen Dust Other Means A Mash 17.37 7.13 15.09 47.13 8.72 0.89 3.04 0.55 0.07 A Pellets 5.03 9.87 13.59 59.02 6.08 0.78 4.77 0.98 0.00 B Mash 20.26 7.65 12.42 47.58 5.82 1.05 3.46 1.90 0.00 B Pellets 3.46 7.25 11.76 65.95 6.54 0.98 2.94 1.18 0.00 probability ANOVA Source S NS NS NS NS NS NS NS * NS T ** NS NS ** NS NS NS NS NS S x T 0.053 0.09 NS NS NS NS 0.09 NS NS Pooled SEM 1.04 0.47 0.77 1.53 0.54 0.14 0.33 0.19 0.02
1BW23=BW at 23 d of age; BW30= BW at 30 d of age; WG2330= BW gained from 23 to 30 d of age; FI2330= feed intake from 23 to 30 d of age; FCR2330= feed conversion ratio (g feed/g gain) from 23 to 30 d of age; ECV=effective caloric value, the equivalent value of dietary ME needed to achieve the FCR and BW response observed 2Percent of times each bird was observed performing each behavior NS= not significant (P > 0.10); **= P < 0.01; *= P < 0.05

101
Table 2. Correlations among traits measured1, Trial 1 Trait2
Broiler trait3 Eat Drink Stand Rest Walk Peck Preen Dust Other ECV Lean gain Fat gain BW23 -0.41** NS NS 0.24* NS NS NS NS NS 0.34** 0.38* NS BW30 -0.58** NS NS 0.43** NS NS NS NS NS 0.65** 0.72** 0.35* WG2330 -0.60** NS NS 0.52** NS NS NS NS NS 0.81** 0.85** 0.55** FI2330 -0.51** NS NS 0.41** NS NS NS NS NS 0.39** 0.75** 0.52** FI/BW23 NS NS NS NS -0.26* NS NS NS NS NS NS 0.31+ FCR2330 0.37** NS NS -0.33** NS NS NS NS NS -0.93** -0.47** NS ECV -0.52** NS NS 0.44** NS NS NS NS NS -- 0.63** 0.32+ NE gain (kcal) NS NS -0.38* 0.40* NS NS NS NS NS 0.41* 0.38** 0.99** NE gain (kcal/kg) NS NS -0.42* 0.38* -0.33+ NS NS NS NS 0.34* NS 0.96** 1Lean gain, fat gain, and NE gain were measured on 36 birds, whereas 72 birds were measured for the remaining traits 2Eat=percent of times the bird was observed eating; Drink=percent of times the bird was observed drinking; Stand=percent of times the bird was observed standing; Rest=percent of times the bird was observed resting; Walk=the percent of times the bird was observed walking; Peck=percent of times the bird was observed pecking; Preen=percent of times the bird was observed preening; Dust=percent of times the bird was observed dustbathing; Other=percent of times the bird was observed performing any behavior other that the aforementioned eight behaviors; ECV=effective caloric value, the equivalent dietary ME required for the specific body weight and feed conversion response 3BW23=BW at 23 d of age; BW30=BW at 30 d of age; WG2330=BW gained from 23 to 30 d of age; FI2330=feed intake from 23 to 30 d of age; FI/BW23= feed consumed per unit initial BW; FCR2330=feed conversion ration (g feed/g gain) from 23 to 30 d of age; NE gain= the gain of energy (in total kcal and per kg of diet consumed) from 23 to 30 d of age NS= not significant (P > 0.10); **= P < 0.01; *= P < 0.05
102
Table 3. Broiler performance, energy, and behavior traits of two strains of broilers fed either pellets or mash from 37 to 44 d of age, Trial 2 Broiler and energy trait1 Strain (S) Grower feed form
(G) Finisher feed form (F) switched?
Initial fat (g)
Initial lean (g)
Initial energy (kcal)
BW37 (g) FI (g) WG (g) FCR (g) BW44 (g) ECV
Means A Mash No 341 1,362 5,081 1,679 1,081 561 1.95 2,177 3,192 A Mash Yes 305 1,421 4,823 1,764 1,110 589 1.89 2,344 3,383 A Pellets Yes 308 1,417 4,849 1,772 1,171 672 1.75 2,362 3,524 A Pellets No 265 1,411 4,442 1,775 1,136 597 1.92 2,371 3,378 B Mash No 207 1,434 3,930 1,714 937 489 1.93 2,005 3,154 B Mash Yes 243 1,319 4,105 1,649 1,015 551 1.85 2,178 3,360 B Pellets Yes 383 1,547 5,726 1,966 1,237 726 1.71 2,581 3,803 B Pellets No 337 1,496 5,231 1,901 1,056 579 1.84 2,426 3,535 probability ANOVA Source S NS NS NS NS * NS NS NS 0.09 G 0.06 * * ** ** ** * ** ** F NS NS NS NS ** ** * * ** S x G ** 0.09 ** * 0.06 0.08 NS ** * S x F NS NS NS NS NS NS NS NS NS G x F NS NS NS * NS NS NS NS NS S x G x F NS NS NS NS NS NS NS NS NS Pooled SEM 14.70 19.61 150.18 21.56 17.39 12.80 0.022 29.54 34.55 Behavior trait2 Strain (S) Grower feed form
(G) Finisher feed form (F) switched?
Eat Drink Stand Rest Walk Peck Preen Dust
Means A Mash No 20.60 3.67 9.32 57.09 3.41 1.71 3.80 0.39 A Mash Yes 10.29 6.39 11.20 62.33 3.25 0.91 5.10 0.52 A Pellets Yes 4.59 6.02 10.47 69.88 3.54 1.44 3.27 0.78 A Pellets No 8.49 5.67 10.01 67.35 1.89 1.06 5.30 0.24 B Mash No 27.12 4.71 17.53 40.96 4.18 1.44 3.40 0.65 B Mash Yes 11.38 6.15 11.37 62.08 2.87 1.83 4.19 0.13 B Pellets Yes 6.54 6.28 4.58 72.13 1.57 1.05 7.72 0.13 B Pellets No 13.26 4.13 8.25 65.36 1.18 1.62 5.46 0.74 Probability ANOVA Source S 0.09 NS NS NS NS NS NS NS G ** NS ** ** 0.07 NS 0.09 NS F ** ** NS ** NS NS NS NS S x G NS NS ** NS NS NS 0.06 NS S x F NS NS * 0.08 NS NS NS 0.07 G x F 0.07 NS NS NS NS NS NS NS S x G x F NS NS NS NS NS NS NS NS Pooled SEM 1.30 0.31 0.77 1.72 0.37 0.18 0.39 0.12 1BW37=BW at 37 d of age; BW44= BW at 44 d of age; FI3744= feed intake from 37 to 44 d of age 2Percent of times each bird was observed performing each behavior NS= not significant (P > 0.10); **= P < 0.01; *= P < 0.05
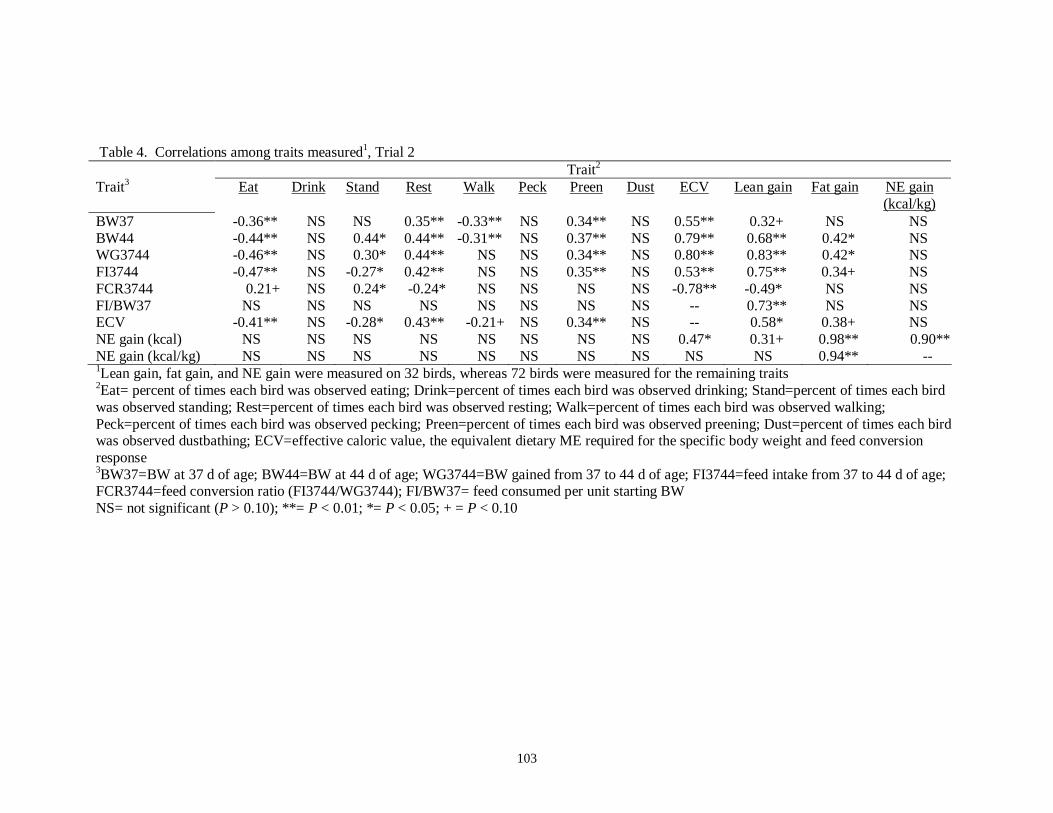
103
Table 4. Correlations among traits measured1, Trial 2 Trait2 Trait3 Eat Drink Stand Rest Walk Peck Preen Dust ECV Lean gain Fat gain NE gain
(kcal/kg) BW37 -0.36** NS NS 0.35** -0.33** NS 0.34** NS 0.55** 0.32+ NS NS BW44 -0.44** NS 0.44* 0.44** -0.31** NS 0.37** NS 0.79** 0.68** 0.42* NS WG3744 -0.46** NS 0.30* 0.44** NS NS 0.34** NS 0.80** 0.83** 0.42* NS FI3744 -0.47** NS -0.27* 0.42** NS NS 0.35** NS 0.53** 0.75** 0.34+ NS FCR3744 0.21+ NS 0.24* -0.24* NS NS NS NS -0.78** -0.49* NS NS FI/BW37 NS NS NS NS NS NS NS NS -- 0.73** NS NS ECV -0.41** NS -0.28* 0.43** -0.21+ NS 0.34** NS -- 0.58* 0.38+ NS NE gain (kcal) NS NS NS NS NS NS NS NS 0.47* 0.31+ 0.98** 0.90** NE gain (kcal/kg) NS NS NS NS NS NS NS NS NS NS 0.94** -- 1Lean gain, fat gain, and NE gain were measured on 32 birds, whereas 72 birds were measured for the remaining traits 2Eat= percent of times each bird was observed eating; Drink=percent of times each bird was observed drinking; Stand=percent of times each bird was observed standing; Rest=percent of times each bird was observed resting; Walk=percent of times each bird was observed walking; Peck=percent of times each bird was observed pecking; Preen=percent of times each bird was observed preening; Dust=percent of times each bird was observed dustbathing; ECV=effective caloric value, the equivalent dietary ME required for the specific body weight and feed conversion response 3BW37=BW at 37 d of age; BW44=BW at 44 d of age; WG3744=BW gained from 37 to 44 d of age; FI3744=feed intake from 37 to 44 d of age; FCR3744=feed conversion ratio (FI3744/WG3744); FI/BW37= feed consumed per unit starting BW NS= not significant (P > 0.10); **= P < 0.01; *= P < 0.05; + = P < 0.10

104

105
106
CHAPTER VI
Predicting Effective Caloric Value of Nonnutritive Factors: IV. Nutrient to calorie
ratios as influenced by pelleting
L. J. McKinney, S. Yadalam, and R. G. Teeter
Department of Animal Science
Oklahoma State University
Stillwater, OK 74078
TEL: 405-744-8866
FAX: 405-744-5300
E-mail: [email protected]
Section Preference: Nutrition and Metabolism
Research Note: Full-Length Paper: X
RUNNING TITLE: Pelleting influences on nutrient-calorie ratios
Abbreviation Key: ECV = effective caloric value; BWG = body weight gain; FCR = feed
conversion ratio; M = mash; C = mash steam pelleted and crumbled; P = mash steam
pelleted and sifted; PD = protein deposition; LD = lipid deposition; kLysPD = efficiency
of dietary lysine for protein deposition; kRE = apparent energetic efficiency

107
ABSTRACT
Three experiments of similar design were conducted to first, evaluate dietary lysine in
ratio with effective caloric value (ECV) altered either through the addition of soybean oil
or by feed form, and second, to develop mathematical models that describe lysine
requirement based on body composition. Studies utilized male and female broilers over
age intervals ranging from 1 to 10 (Experiment 1), 19 to 29 (Experiment 2), and 45 to 55
(Experiment 3) days. Treatments evaluated were structured as 4 suboptimal dietary
lysine levels by 2 (Experiment 1) or 3 (Experiments 2 and 3) ECV treatments. ECV
treatments examined were: 1) unprocessed mash (M), 2) M plus 187 kcal MEn/kg of
soybean oil (M187), and 3) M steam pelleted (P). No significant sex × treatment
interactions were detected therefore sex effects were combined. In all experiments,
increasing dietary lysine level resulted in greater feed intake, weight gain, protein and
lipid tissue gain, and feed efficiency. No significant dietary ECV effects were detected in
Experiments 1 and 2. However, overall in Experiment 2 results suggest that calories
provided in the diet can be replaced on a one-to-one basis by calories spared through
reduced activity. In Experiment 3, P fed birds had higher feed intake, weight gain,
protein and lipid gain, and feed efficiency compared to M187. Responses to P and M187
were equal when lysine intake was used as a covariate in the model. Regression models
were successful in inter-relating body composition with lysine need. Models indicated
that current recommendations for dietary lysine fail to sufficiently meet lysine
requirement for the fist 10 d of age. Afterwards, recommended dietary lysine levels
exceed requirements particularly towards the end of the growth curve.
(Key words: broilers, pelleting, lysine, effective caloric value)

108
INTRODUCTION
Intrinsic factors determine a broiler’s overall capacity to synthesize and accumulate
muscle (Lawrence and Fowler, 1997). However, whether or not the inherent upper limit
is realized largely depends on the dietary supply of essential amino acids, as well as
energy, as protein accretion is energetically costly (4 to 7 moles of ATP per peptide bond
formed; Bequette, 2003). As maximum meat yield at optimal efficiency is a principle
goal, nutritionist’s routinely tweak nutrient to calorie ratios in an attempt to provide an
ideally balanced ration.
In practical corn-soybean meal based broiler diets, methionine is considered first
limiting followed by lysine, arginine, valine, and threonine (Han et al., 1992). However,
lysine is the amino acid to which all others are proportionally related (i.e. ideal protein
concept; Baker and Han, 1994; Baker, 1997). Additionally, lysine is generally expressed
in ratio to energy, as dietary caloric density largely regulates voluntary feed intake
(Leeson et al., 1996; McKinney and Teeter, 2004). Lysine is largely viewed as a pivotal
nutrient because lysine has no major precursor role, and there has been extensive work to
quantify digestible lysine need in broilers reared under a wide range of dietary and
environmental circumstances (Han and Baker, 1993; Emmert and Baker, 1997).
In addition to pelleting, numerous other nonnutritive factors encountered in broiler
production such as stocking density (Cravener et al., 1992; Puron et al., 1997), lighting
program (Buyse et al., 1996; Ingram et al., 2000), ventilation (Lott et al., 1998), and feed
processing techniques (i.e., pelleting; Acar et al., 1991; Schiedeler, 1995; Moritz et al.,
2001) are well documented to impact body weight (BW) and feed conversion ratio
(FCR). If the paradigm is accepted that these responses are consequences of managerial-

109
husbandry decisions that either “take away” or “add to” energy provided by the diet, then
nonnutritive entities of broiler production need to be considered as variables directly
influencing the ration formula.
Therefore, the following experiments were conducted to evaluate the efficacy of
expressing lysine in ratio with calories added to the diet in two ways. 1) by increasing
ME through substrate addition, or 2) through reduced activity energy expenditure by
differing broiler management circumstances. Secondly, data will be utilized to develop a
model that enables lysine requirement to be inter-related with body composition.
MATERIALS AND METHODS
General Information
In a related experiment that was directed at evaluating the ECV of pelleting under
conditions mimicking those found commercially, male and female broilers (Cobb 500)
were obtained from a commercial hatchery following sexing and vaccination for Marek’s
disease. The chicks were wing-banded and allotted by sex to floor pens (3.5 × 2.0 m)
with used litter top-dressed with fresh wood shavings. The lighting program followed
was 23L:1D and the stocking density was 45 birds per pen. Birds were reared with ad
libitum access to feed and water on starter (0-18 d), grower (18-35 d), and finisher (35-60
d) diets (Table 1) formulated to meet or exceed nutrient recommendations of the Cobb
Broiler Nutrition Guide (2003). Treatments during the starter phase were: 1) unprocessed
mash (M) and 2) M steam pelleted and crumbled (C). Treatments for the grower and
finisher phases were: 1) M; 2) M plus soybean oil (187 kcals MEn / kg diet; M187); and
3) M steam pelleted and sifted (P). Pens assigned to C in the starter phase were randomly

110
re-assigned to either M187 or P in the grower and finisher phases. At the outset of this
experiment, 25 wing-bands from each pen were randomly selected. Spray paint was
applied to the wing bows of the birds with pre-selected wing-bands so that those birds
could be easily identified for use in the experiments reported herein.
The aim of the experiments described herein was also to evaluate dietary ECV,
namely the efficacy of expressing dietary nutrients in ratio to ECV. Experiments were of
similar design and utilized male and female broilers (obtained from the aforementioned
bird population) over age intervals ranging from 1 to 10 (Experiment 1; EXP1), 19 to 29
(Experiment 2; EXP2), and 45 to 55 (Experiment 3; EXP3) days. During the test periods,
the birds were housed individually in floor pens (46 x 60 x 60 cm) equipped with a
stainless steel feeder, a nipple drinker, and fresh wood-shavings. Feed and water were
provided for ad libitum consumption and the same lighting program stated previously
was followed. The general treatment structure for the three experiments was four dietary
lysine levels and 2 (M and M187; Experiment1) or 3 (M, M187, and P; Experiments 2
and 3) ECV treatments in a factorial arrangement. Note, dietary ECV treatments
formerly assigned were maintained in these experiments. Body weight gain (BWG), feed
intake (FI), and whole-body protein (PD) and lipid (LD) deposition were quantified in
each assay. Further, digestible lysine (LI) and metabolizable energy (MEI) intake, feed
conversion ratio (FCR), apparent efficiency of energy retention (retained energy/energy
intake; kRE), and the efficiency of lysine for whole-body protein deposition (protein
gain/lysine intake; kLysPD) were calculated.
To obtain whole-body PD and LD, initial and final body composition was determined
using dual-energy x-ray absorptiometry (DXA) as described by McKinney et al. (2005).

111
In brief, birds were fasted (8 h), anesthetized (Skinner-Noble et al., 2005), and scanned 4
consecutive times in the prone position. Equations developed by McKinney et al. (2005)
were used to adjust DXA measurements to match what would otherwise have been
obtained by proximate analysis (AOAC, 1990). As a check of DXA results, the
summation of the adjusted bird protein, water, lipid, and ash were compared with the
gravimetric weight. Body weight calculated from adjust DXA measurements not within
± 5% of the respective gravimetric weight were excluded and the accepted scans for each
bird were combined for analysis.
Diets
The preparation of the experimental diets involved several steps. First, for each
experiment, a basal diet (Table 2) was formulated to 105% of recommended nutrient
concentrations (Cobb Broiler Nutrition Guide, 2003), with the exception of lysine.
Second, four premixes with graded levels of lysine were formulated to be iso-caloric, iso-
nitrogenous and equal in Na+ and Cl- ions, utilizing L-lysine-HCL, NaCL, NaHCO3,
glutamic acid, corn starch, and Solka-Floc®. Four additional premixes were formulated
in the same manner with the exception that the energy level was increased by adding
soybean oil at the expense of Solka-Floc®. The experimental diets were then prepared
by mixing proportions of the basal diet (95%) and the premixes (5%). In Experiments 2
and 3, half of the diets of the base energy level were steam conditioned and pelleted.
Experimental design
All dietary lysine levels examined were deficient relative to that recommended (Cobb
Broiler Nutrition Guide, 2003). Not focusing replication around the zone where

112
responses to lysine plateau allowed a wider range of lysine levels to be evaluated. In
addition, this approach ensured response linearity, which enables the lysine requirement
to be projected based on slope analysis. Experiment 1 had a 2 × 4 factorial arrangement
of dietary treatments. Diets of four lysine levels (3.9, 5.2, 6.5, and 7.8 g/kg) were fed as:
1) M (3,053 kcal MEn / kg diet) and 2) M187 (3240 kcal MEn / kg diet). Experiments 2
and 3 had a 3 × 4 factorial arrangement of dietary treatments. Dietary lysine levels in
Experiments 2 and 3 were: 3.5, 4.8, 6.1, and 7.4, and 3.0, 4.3, 5.6, and 6.9 g/kg,
respectively. In Experiment 2, each of the lysine levels were fed as: 1) M (3,131 kcal
MEn / kg diet); 2) M187 (3,318 kcal MEn / kg diet); and 3) P (3,131 kcal MEn / kg diet).
In Experiment 3, each of the lysine levels were fed as: 1) M (3,174 kcal MEn / kg diet); 2)
M187 (3,361 kcal MEn / kg diet); and 3) P (3,174 kcal MEn / kg diet).
Data Analysis
Bird served as the experimental unit and the experiments were analyzed as a completely
randomized design. Data were analyzed using General Linear Models of SAS (2000),
with probability values of P < 0.05 considered significant. When a significant F-statistic
was detected, least square means were used for treatment comparisons. Orthogonal
polynomial contrasts were used to test for linear and curvilinear responses with respect to
lysine level.
Modeling procedures were based on forward stepwise regression (Neter et al., 1990).
Factors were added to the regression model until three conditions were met: 1) adding
factors to the model did not result in a substantial (R2 improvement < 2 %) increase in the

113
model R2; 2) all factors in the model were significant at P < 0.10; and 3) the resulting
model matched known properties of the independent variables.
RESULTS AND DISCUSSION
No significant sex × lysine treatment interactions were detected in any of the
experiments. This was expected as prior research with both swine (Susenbeth, 1995) and
poultry (Han and Baker, 1993) have shown no sex differences when diets of sub-optimal
lysine content were fed. Limited data is available as to differences between male and
female responses to pelleting. However, it has been suggested (Nir and Hillel, 1995) that
females are slightly less responsive to pellets. However, similar observations were
obtained from two independent studies, one utilizing males (McKinney and Teeter,
2004), the other females (Skinner-Noble et al., 2005), as to the activity calories spared
due to pelleting. In the present study no sex × ECV treatment interactions were detected
indicating that males and females response similarly to pelleting. As no significant sex ×
dietary treatment interactions were detected sex effects were combined (Table 3, 4, and
5).
No significant ECV × lysine level interactions were detected for FI, LI, or MEI.
Overall, there was a tendency for feed consumption to increase in a linear manner (P <
0.09) as dietary lysine level was increased. Observations that a bird’s appetite increases
to a point as dietary lysine is increased are well documented throughout the literature
(Tesseraud et al. 1992; Edwards et al., 1999; Fatufe et al., 2004). Lysine fed in excess of
need has the opposite effect. Dietary ECV did not influence feed consumption in EXP1
or EX2. However in EXP3, birds provided pellets consumed more (P < 0.05) feed,

114
lysine, and energy compared to those fed M187, which appeared to have a depressed
appetite. It is generally accepted that voluntary intake is largely controlled by energy
consumption (Leeson et al. 1996; McKinney and Teeter, 2004). However, birds fed P
consumed more energy overall compared to the M187 fed group. This would suggest
that calories spared by reduced activity are not perceived in a manner that would regulate
consumption.
No ECV × dietary lysine level interactions were detected for BWG, PD, or LD in EXP
2 and EXP 3. A significant interaction was observed in EXP1. Birds fed the lowest
lysine level and M had significantly higher (P < 0.05) BWG, PD, and LD compared to
birds fed the same lysine level and M187. Then as the dietary lysine levels increased,
M187 fed birds surpassed those receiving M. It should be noted that birds on the low
lysine M187 treatment did not consume feed well. Either birds on this treatment did not
adapt to the experimental cages or as Jensen (1965) reported, the supplemental dietary
energy resulted in an energy-lysine imbalance. Unfortunately, birds of this age are
unable to consume whole pellets so Jensen’s (1965) hypothesis that pelleting exacerbates
a deficiency could not be evaluated.
In EXP2 and EXP3, BWG, PD and LD increased (EXP2; linearly P < 0.05) as more
dietary lysine was provided. Based on the work of Urdaneta-Rincon and Leeson (2004)
this is a result of increased tissue synthesis rather than a reduction in tissue degradation.
Similarly, Tesseraud et al. (1992) demonstrated that both fractional synthesis and
degradation of protein increases with lysine consumption, only fractional synthesis
occurs at a higher level. In EXP3, P resulted in significantly more PD and LD compared
to M187 and M birds. This may be partially attributed to the greater lysine consumption

115
of birds fed P. However, when lysine consumption was included in the model as a
covariate, a significant F-statistic for ECV was obtained. Means separation revealed the
P still yielded higher PD. Additionally, though not statistically different, it should be
noted that in EXP2, treatment P and M187 were virtually the same with respect to BWG,
PD, and LD, and had similar lysine intakes.
In general FCR and kRE were improved and kLysPD reduced as dietary lysine was
increased. Regarding the latter, several reports have suggested that the efficiency of
lysine utilization declines with increased LI (Batterham et al., 1990; Gahl et al., 1991;
Fatufe et al., 2004). In contrast, Möhn et al. (2000) reported that lysine utilization did not
decline with increasing LI. It ultimately may depend on the manner in which lysine
efficiency is quantified (Lys/Lys verses Lys/Prot). There is still discussion as to the
composition of protein under conditions of sub-optimal lysine. For example, Skan and
Noy (2004, 2005) contend that the lysine content of chicken tissue remains constant when
dietary lysine is deficient. Conversely, Edwards et al. (1999) and Fatufe et al. (2004)
contend that during lysine deficiency the lysine content of the tissue proportionally
decreases. Nonetheless, lysine content of tissues was not evaluated in this study and
kLysPD is expressed as lysine consumed per unit protein gain. This is an apparent
estimation and subject to error if the lysine content of the animal actually changes (i.e.,
increase collagen vs. breast tissue).
Indeed, the results of this experiment were somewhat variable. This may have resulted
from 1) birds individually housed; 2) lack of appropriate replication; 3) birds in EXP2 not
having an adaptation period to pellets; or 4) an inadequate experimental period.
However, overall the data suggests that calories provided in the diet can be replaced by
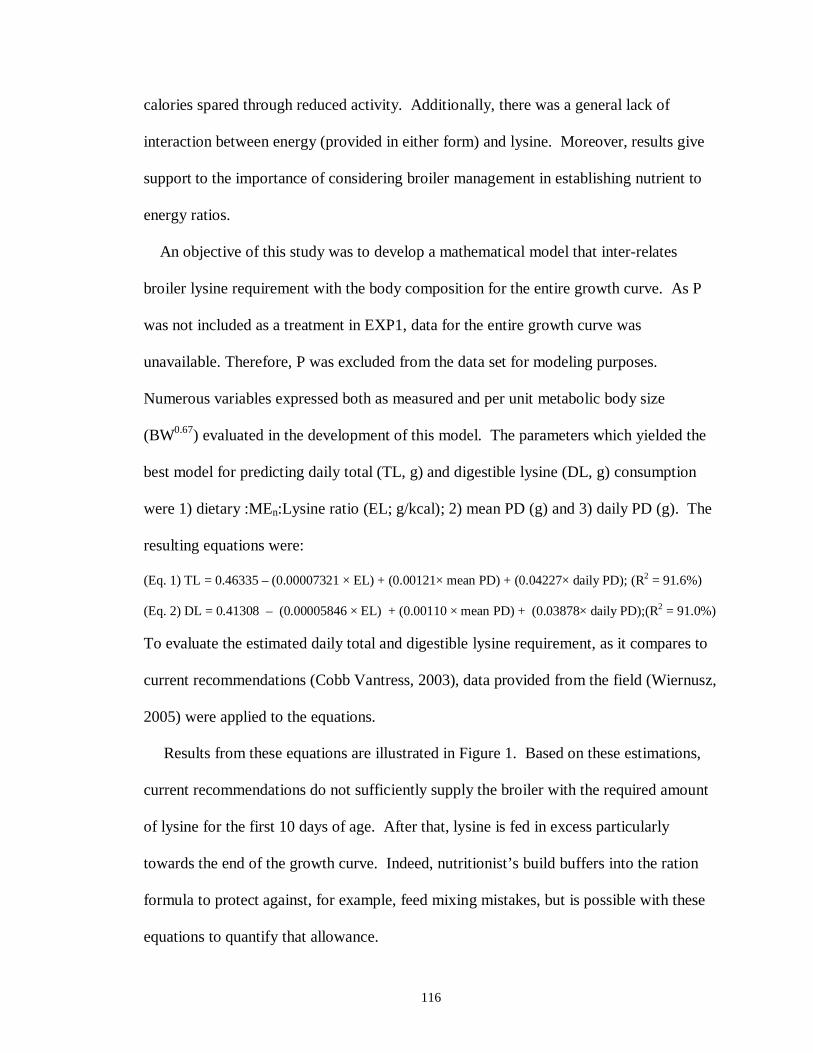
116
calories spared through reduced activity. Additionally, there was a general lack of
interaction between energy (provided in either form) and lysine. Moreover, results give
support to the importance of considering broiler management in establishing nutrient to
energy ratios.
An objective of this study was to develop a mathematical model that inter-relates
broiler lysine requirement with the body composition for the entire growth curve. As P
was not included as a treatment in EXP1, data for the entire growth curve was
unavailable. Therefore, P was excluded from the data set for modeling purposes.
Numerous variables expressed both as measured and per unit metabolic body size
(BW0.67) evaluated in the development of this model. The parameters which yielded the
best model for predicting daily total (TL, g) and digestible lysine (DL, g) consumption
were 1) dietary :MEn:Lysine ratio (EL; g/kcal); 2) mean PD (g) and 3) daily PD (g). The
resulting equations were:
(Eq. 1) TL = 0.46335 – (0.00007321 × EL) + (0.00121× mean PD) + (0.04227× daily PD); (R2 = 91.6%)
(Eq. 2) DL = 0.41308 – (0.00005846 × EL) + (0.00110 × mean PD) + (0.03878× daily PD);(R2 = 91.0%)
To evaluate the estimated daily total and digestible lysine requirement, as it compares to
current recommendations (Cobb Vantress, 2003), data provided from the field (Wiernusz,
2005) were applied to the equations.
Results from these equations are illustrated in Figure 1. Based on these estimations,
current recommendations do not sufficiently supply the broiler with the required amount
of lysine for the first 10 days of age. After that, lysine is fed in excess particularly
towards the end of the growth curve. Indeed, nutritionist’s build buffers into the ration
formula to protect against, for example, feed mixing mistakes, but is possible with these
equations to quantify that allowance.

117
Potentially, information obtained from these equations could be used to modify the
existing ideal protein model. Furthermore, it may be possible to integrate these equations
into a more mechanistic approach whereby producers could specify, for example, desired
bird composition, total days available for production, and rearing conditions, and these
models would provide dietary provisions necessary to achieve that target.

118
REFERENCES
Acar, N., E. T. Moran, Jr., W. H. Revingtion, and S.F. Bilgili. 1991. Effect of improved
pellet quality from using a calcium lignosulfonate binder on performance and
carcass yield of broilers reared under different marketing schemes. Poult. Sci.
70:1339-1344.
Ajinomoto Heartland. 2001. True digestibility of essential amino acids for poultry.
Revision 7. Ajinomoto Heartland Lysine, Chicago, IL.
Baker, D. H. and Y. Han. 1994. Ideal amino acid profile for broiler chicks during the first
three weeks posthatching. Poult. Sci. 73:1441 – 1447.
Baker, D. H., 1997. Ideal amino acid profiles for swine and poultry and their application
in feed formulation. Biokyowa Tech. Rev. 9:1 – 24.
Batterham, E. S., L. M. Anderson, D. R. Baigant, and E. White. 1990. Utilization of ileal
digestible amino acids by growing pigs: effect of dietary lysine concentration on
efficiency of lysine retention. Br. J. Nut. 64:81-92.
Bequette, B. J. 2003. Amino acid metabolism in animals: An overview. Pages 103-124 in
Amino Acids in Animal Nutrition. 2nd. Ed. J. P. F. D’Mello, ed. CAB
International, Wallingford, UK.
Buyse, J., E. R. Kuhn, and E. Decuypere. 1996. The use of intermittent lighting in
broiler raising. 1. Effect on broiler performance and efficiency of nitrogen
retention.
Cobb Vantress, Inc. 2003. Cobb Broiler Nutrition Guide. Cobb-Vantress, Inc. Siloam
Springs, AR.
Cravener, T. L., W. B. Roush, and M. M. Mashaly. 1992. Broiler production under

119
varying population densities. Poult. Sci. 71:427-433.
Poult. Sci. 75:589-594.
Emmert, J. L. and D. H. Baker, 1997. Use of the ideal protein concept for precision
formulation of amino acid levels in broiler diets. J. Appl. Poult. Res. 6:462 –
470.
Fatufe, A. A., R. Timmler, and M. Rodehutscord. 2004. Response to lysine intake in
composition of body weight gain and efficiency of lysine utilization of growing
male chickens from two genotypes. Poult Sci. 83:1314-1324.
Gahl, M. J., M. D. Finke, T. D. Crenshaw, and N. J. Benevenga. 1991. Use of a four-
parameter logistic equation to evaluate the response of growing rats to ten levels
of each indispensable amino acid. J. Nutr. 121:1720-1729.
Han, Y. and D. H. Baker. 1993. Effects of sex, heat stress, body weight, and genetic
strain on the dietary lysine requirement of broiler chicks. Poult. Sci. 72:701-708.
Han, Y., H. Suzuki, C. M. Parsons, and D. H. Baker. 1992. Amino acid fortification of a
low-protein corn and soybean meal diet for chicks. Poul. Science. 71:1168 –
1178.
Jensen; L. S., G. O. Ranit, R. K. Wagstaff, and J. McGinnis. 1965. Protein and lysine
requirements of developing turkeys as influened by pelleting.
Lawrence, T. L. J., and V. R. Fowler. 1997. Tissues: Muscle tissue. Pages 72-92 in
Growth of Farm Animals. T. L. J. Lawrence and V. R. Fowler, ed. CAB
International, Wallingford, UK.
Leeson, S., L. Caston, and J. D. Summers. 1996. Broiler response to diet energy. Poult.
Sci. 75:529-535.

120
Lott, B. D., J. D. Simmons, and J. D. May. 1998. Air velocity and high temperature
effects on broiler performance. Poult. Sci. 77:391-393.
McKinney, L. J. and R. G. Teeter. 2004. Predicting effective caloric value of nonnutritive
factors: I. Pellet quality and II. Prediction of consequential formulation dead
zones. Poult. Sci. 83:1165-1174.
Möhn, S., A. M. Gillis, P. J. Moughan, and G. F. M. de Lange. 2000. Influence of dietary
lysine and energy intakes on body protein deposition and lysine utilization in the
growing pig. J. Anim. Sci. 78:1510-1519.
Moritz, J. S., R. S. Beyer, K. J. Wilson, K. R. Cramer, L. J. McKinney, and F. J.
Fairchild. 2001. Effect of moisture addition at the mixer to a corn-soybean based
diet on broiler performance. J. Appl. Poult. Res. 10:347-353.
Nir, I. and R. Hillel. 1995. Effect of particle size on performance. 3. Grinding pelleting
interactions. Poult. Sci. 74:771-783.
Puron, D., R. Santamaria, and J. C. Segura. 1997. Sodium bicarbonate and broiler
performance at high stocking densities in a tropical environment. J. Appl. Poult.
Res. 6:443-448.
Reddy, C. V., L. S. Jensen, L. H. Merrill, and J. McGinnis. 1962. Influence of mechanical
alteration of dietary density on energy available for chick growth. J. Nutr. 77:428
– 432.
Scheideler, S. E. 1995. Is pelleting cost effective? Feed Mangement. Vol 46, No. 1. p
21-26.
Sklan, D., and Y. Noy. 2004. Catabolism and deposition of amino acids in growing
chicks: effect of dietary supply. Poult Sci. 83:952-961.

121
Sklan, D. and Y. Noy. 2005. Direct determination of optimal amino acid intake for
maintenance and growth in broilers. Poult. Sci. 84:412 - 418
Tesseraud, S., M. Larbirer, A. M. Chagneau, P. A. Geraert. 1992. Effect of dietary lysine
on muscle protein turnover in growing chickens.
Urdaneta-Rincon, M., and S. Leeson. 2004. Muscle (pectoralis major) protein turnover in
young broiler chickens fed graded levels of lysine and crude protein. Poult Sci.
83:1897-1903.
Wiernusz, C. L. 2005. Cobb-Vantress, Inc. Personal communication. Siloam Springs,
AR.

122
Table1. Composition of diets used to rear broilers to the ages evaluated in Experiments 1, 2, and 3 Age interval, d and Treatments1,2
0 to 18 18 to 35 35 to 60 Ingredient, % M and P M and P M187 M and P M187 Corn 58.12 64.89 60.73 68.72 64.31 Soybean meal (48% CP) 32.66 24.59 25.61 22.76 23.63 Soybean oil 2.90 2.93 6.4 3.32 6.89 Poultry by-product meal 1.50 3.00 3.00 0.50 0.50 Monocalcium phosphate 1.36 1.05 0.94 1.20 1.21 Limestone 1.32 1.04 0.94 1.08 1.07 NaCl 0.34 0.29 0.32 0.34 0.35 NaHCO3 0.25 0.32 0.27 0.30 0.28 Vitamin premix3 0.28 0.24 0.24 0.25 0.25 Trace mineral premix4 0.09 0.09 0.09 0.09 0.09 Selenium premix 0.04 0.04 0.04 0.04 0.04 CuSO4 0.002 0.002 0.002 0.002 0.002 Choline chloride 0.001 – – – – DL-Methionine 0.22 0.22 0.19 0.12 0.12 Lysine 0.076 0.157 0.10 0.10 0.08 Arginine 0.03 0.05 0.03 0.05 0.03 Threonine 0.03 0.05 0.02 0.05 0.04 AmeriBond 2x 0.75 1.00 1.00 1.00 1.00 Coccidiostat 0.05 0.05 0.05 0.08 0.08 Ethoxyquin 0.012 0.012 0.012 0.012 0.012 Calculated Analysis MEn (kcal / kg) 3,053 3,131 3,318 3,174 3,361
CP, % 22.1 19.8 19.8 17.5 17.5 Arg 1.49 1.30 1.30 1.16 1.16 Lys 1.26 1.14 1.14 0.96 0.96 Met 0.55 0.52 0.52 0.42 0.42 TSAA 0.94 0.88 0.88 0.76 0.76 Ca 0.90 0.80 0.80 0.72 0.72 P, available 0.44 0.40 0.40 0.37 0.37
1Treatments: M = mash; M187 = M plus soybean oil (187 kcal MEn/kg); P = M steam pelleted and sifted. 2From 0 to 18 days, P was crumbled. 3Supplied per kilogram of diet: vitamin A, 10,141 IU (retinyl acetate); cholecalciferol, 3,086 IU; vitamin E, 23.92 IU (dl-α-tocopheryl acetate); menadione, 2.87 mg; thiamine, 2.20 mg; riboflavin, 7.72 mg; niacin, 60.30 mg; d-pantothenic acid, 12.46 mg; pyridoxine, 3.75 mg; vitamin B12, 0.017 mg; folic acid, 1.066 mg; d-biotin, 0.127 mg. 4Supplied per kilogram of diet: Ca,160 mg; Zn, 100 mg; Mn, 120 mg; Fe,75 mg; Cu, 10 mg; I, 2.5 mg.

123
Table 2. Basal diets used in Experiments 1, 2, and 3 Experiment
Ingredient 1 2 3 Corn 62.0 70.2 76.2 Corn gluten meal 15.0 13.9 11.4 Wheat bran 5.6 2.1 – Soybean oil 3.2 3.0 3.0 Poultry by-product meal 1.58 1.28 1.22 Soybean meal 1.58 1.26 0.53 Mono-calcium phosphate 1.56 1.46 1.34 Limestone 1.54 1.39 1.22 Corn Starch 1.26 – – Potassium sulfate 1.26 0.87 0.95 Arginine 0.99 0.81 0.71 Pellet binder 0.79 1.05 1.05 NaHCO3 0.72 0.62 0.54 Vitamin premix1 0.68 0.27 0.28 Isoleucine 0.33 0.23 0.18 Serine 0.33 – – Threonine 0.29 0.23 0.23 Glycine 0.29 0.13 0.29 Valine 0.28 0.18 0.18 Histidine 0.22 0.15 0.07 Methionine 0.21 0.18 0.09 Tryptophan 0.13 0.11 0.09 Trace mineral premix2 0.095 0.095 0.100 Coccidiostat 0.053 0.079 0.079 Selenium premix 0.011 0.021 0.028 Ethoxyquin 0.013 0.013 0.013 CuSO4 0.002 0.002 0.002 Choline chloride – 0.116 0.026 NaCl – 0.105 0.175 Calculated Analysis
MEn (kcal / kg) 3,214 3,296 3,341 CP, % 22.01 19.93 17.68 Arg3 1.44 1.25 1.11 Lys3 0.39 0.35 0.30 Met3 0.55 0.50 0.41 TSAA3 0.84 0.78 0.69 Ca 0.95 0.84 0.76 P, available 0.46 0.42 0.39
1Supplied per kilogram of diet: vitamin A, 10,141 IU (retinyl acetate); cholecalciferol, 3,086 IU; vitamin E, 23.92 IU (dl-α-tocopheryl acetate); menadione, 2.87 mg; thiamine, 2.20 mg; riboflavin, 7.72 mg; niacin, 60.30 mg; d-pantothenic acid, 12.46 mg; pyridoxine, 3.75 mg; vitamin B12, 0.017 mg; folic acid, 1.066 mg; d-biotin, 0.127 mg. 2Supplied per kilogram of diet: Ca,160 mg; Zn, 100 mg; Mn, 120 mg; Fe,75 mg; Cu, 10 mg; I, 2.5 mg. 3True digestible basis according to the listing of Ajinomoto Heartland, Incorporated (2001).
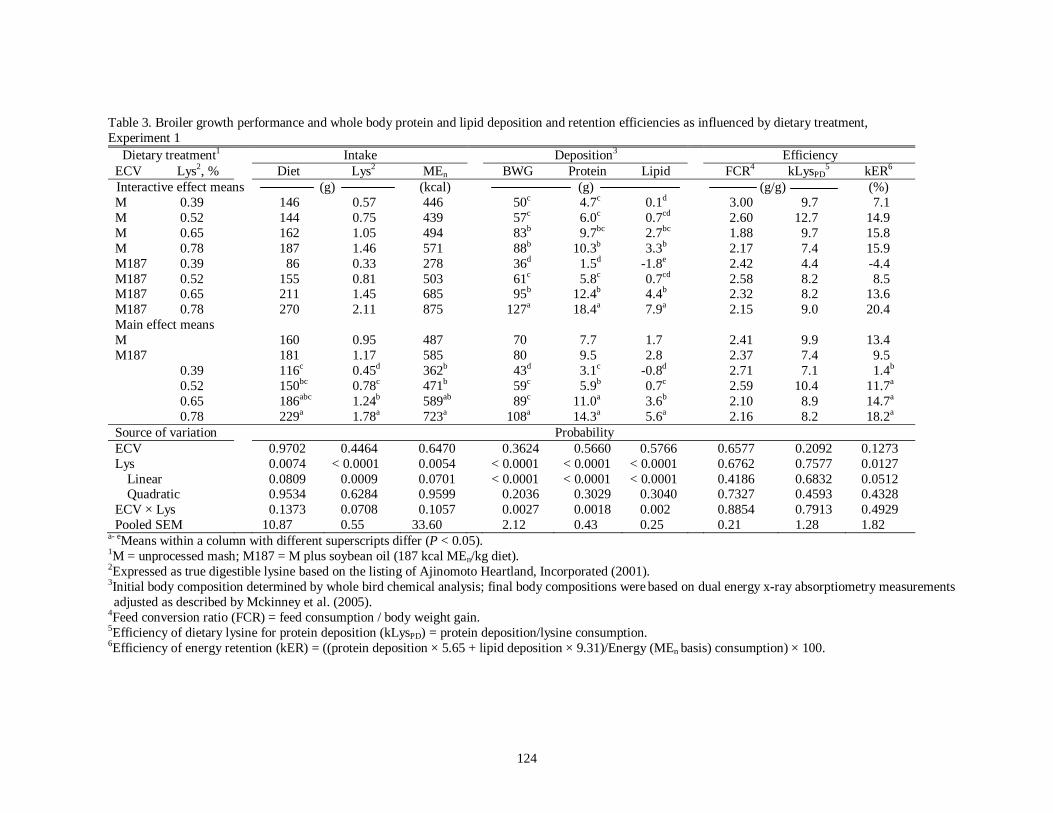
124
Table 3. Broiler growth performance and whole body protein and lipid deposition and retention efficiencies as influenced by dietary treatment, Experiment 1
Dietary treatment1 Intake Deposition3 Efficiency ECV Lys2, % Diet Lys2 MEn BWG Protein Lipid FCR4 kLysPD
5 kER6
Interactive effect means (g) (kcal) (g) (g/g) (%) M 0.39 146 0.57 446 50c 4.7c 0.1d 3.00 9.7 7.1 M 0.52 144 0.75 439 57c 6.0c 0.7cd 2.60 12.7 14.9 M 0.65 162 1.05 494 83b 9.7bc 2.7bc 1.88 9.7 15.8 M 0.78 187 1.46 571 88b 10.3b 3.3b 2.17 7.4 15.9 M187 0.39 86 0.33 278 36d 1.5d -1.8e 2.42 4.4 -4.4 M187 0.52 155 0.81 503 61c 5.8c 0.7cd 2.58 8.2 8.5 M187 0.65 211 1.45 685 95b 12.4b 4.4b 2.32 8.2 13.6 M187 0.78 270 2.11 875 127a 18.4a 7.9a 2.15 9.0 20.4 Main effect means M 160 0.95 487 70 7.7 1.7 2.41 9.9 13.4 M187 181 1.17 585 80 9.5 2.8 2.37 7.4 9.5 0.39 116c 0.45d 362b 43d 3.1c -0.8d 2.71 7.1 1.4b 0.52 150bc 0.78c 471b 59c 5.9b 0.7c 2.59 10.4 11.7a 0.65 186abc 1.24b 589ab 89c 11.0a 3.6b 2.10 8.9 14.7a 0.78 229a 1.78a 723a 108a 14.3a 5.6a 2.16 8.2 18.2a Source of variation Probability ECV 0.9702 0.4464 0.6470 0.3624 0.5660 0.5766 0.6577 0.2092 0.1273 Lys 0.0074 < 0.0001 0.0054 < 0.0001 < 0.0001 < 0.0001 0.6762 0.7577 0.0127
Linear 0.0809 0.0009 0.0701 < 0.0001 < 0.0001 < 0.0001 0.4186 0.6832 0.0512 Quadratic 0.9534 0.6284 0.9599 0.2036 0.3029 0.3040 0.7327 0.4593 0.4328
ECV × Lys 0.1373 0.0708 0.1057 0.0027 0.0018 0.002 0.8854 0.7913 0.4929 Pooled SEM 10.87 0.55 33.60 2.12 0.43 0.25 0.21 1.28 1.82
a- eMeans within a column with different superscripts differ (P < 0.05). 1M = unprocessed mash; M187 = M plus soybean oil (187 kcal MEn/kg diet). 2Expressed as true digestible lysine based on the listing of Ajinomoto Heartland, Incorporated (2001). 3Initial body composition determined by whole bird chemical analysis; final body compositions were based on dual energy x-ray absorptiometry measurements adjusted as described by Mckinney et al. (2005).
4Feed conversion ratio (FCR) = feed consumption / body weight gain. 5Efficiency of dietary lysine for protein deposition (kLysPD) = protein deposition/lysine consumption. 6Efficiency of energy retention (kER) = ((protein deposition × 5.65 + lipid deposition × 9.31)/Energy (MEn basis) consumption) × 100.

125
Table 4. Broiler growth performance and whole body protein and lipid deposition and retention efficiencies as influenced by dietary treatment, Experiment 2
Dietary treatment1 Intake Deposition3 Retention ECV Lys2, % Diet Lys2 MEn BWG Protein Lipid FCR4 kLysPD
5 kER6
Interactive effect means (g) (kcal) (g) (g/g) (%) M 0.35 490 1.71 1,533 135 22 16 3.64 12.9 17.7 M 0.48 668 3.21 2,091 244 41 31 2.84 12.7 24.7 M 0.61 718 4.38 2,248 318 56 43 2.30 12.8 31.8 M 0.74 819 6.06 2,565 376 65 51 2.21 10.6 32.4 M187 0.35 648 2.27 2,149 209 34 26 3.23 14.4 19.3 M187 0.48 574 2.75 1,904 229 38 29 2.53 14.6 26.8 M187 0.61 735 4.48 2,439 342 59 47 2.17 13.0 31.1 M187 0.74 815 6.03 2,704 396 70 57 2.07 11.5 34.1 P 0.35 700 2.45 2,191 273 46 36 2.83 18.7 27.2 P 0.48 594 2.85 1,860 226 38 30 2.65 13.4 26.2 P 0.61 712 4.34 2,228 285 49 38 2.53 11.4 28.2 P 0.74 863 6.13 2,703 398 68 54 2.20 10.9 32.0 Main effect means M 674 3.84 2,109 268 46 35 2.75 12.2 26.7 M187 693 3.88 2,299 294 50 40 2.50 13.4 27.8 P 717 3.94 2,246 295 50 39 2.55 13.6 28.4 0.35 612c 2.14d 1,958c 205c 34c 26c 3.23a 15.3a 21.4c 0.48 612c 2.94c 1,952c 233c 39c 30c 2.67b 13.6ab 25.9b 0.61 721b 4.40b 2,305b 315b 55b 42b 2.33c 12.4bc 30.4a 0.74 832a 6.07a 2,657a 390a 68a 54a 2.16c 11.0c 32.8a Source of variation Probability ECV 0.8513 0.9775 0.7756 0.8037 0.8685 0.767 0.3575 0.5164 0.8149 Lys 0.0006 < 0.0001 0.0006 < 0.0001 < 0.0001 < 0.0001 < 0.0001 0.0005 < 0.0001
Linear 0.0856 < 0.0001 0.0875 0.0017 0.001 0.0029 < 0.0001 0.0182 0.0002 Quadratic 0.2670 0.2748 0.2577 0.2988 0.2787 0.3096 0.4576 0.7612 0.9861
ECV × Lys 0.655 0.9431 0.6659 0.4284 0.4726 0.4835 0.3927 0.1839 0.2115 Pooled SEM 19.29 0.12 61.72 10.24 1.87 1.64 0.06 0.37 0.69
a- dMeans within a column with different superscripts differ (P < 0.05). 1M = unprocessed mash; M187 = M plus soybean oil (187 kcal MEn/kg diet); P = M steam pelleted and sifted. 2Expressed as true digestible lysine based on the listing of Ajinomoto Heartland, Incorporated (2001). 3Based on dual energy x-ray absorptiometry measurements adjusted as described by Mckinney et al. (2005). 4Feed conversion ratio (FCR) = feed consumption / body weight gain. 5Efficiency of dietary lysine for protein deposition (kLysPD) = protein deposition/lysine consumption. 6Efficiency of energy retention (kER) = ((protein deposition × 5.65 + lipid deposition × 9.31)/Energy (MEn basis) consumption) × 100.

126
Table 5. Broiler growth performance and whole body protein and lipid deposition and retention efficiencies as influenced by dietary treatment, Experiment 3
Dietary treatment1 Intake Deposition3 Retention ECV Lys2, % Diet Lys2 MEn BWG Protein Lipid FCR4 kLysPD
5 kER6
Interactive effect means (g) (kcal) (g) (g/g) (%) M 0.30 1,412 4.24 4,482 245 40.5 50.5 5.86 9.6bc 15.6 M 0.43 1,515 6.51 4,809 306 55.5 75.7 5.21 8.8bc 21.8 M 0.56 1,520 8.51 4,824 351 60.3 80.0 4.54 7.1bc 22.5 M 0.69 1,663 11.48 5,279 395 59.5 81.0 4.51 5.1c 20.2 M187 0.30 1,233 3.70 4,144 222 39.6 52.0 5.55 10.7bc 17.1 M187 0.43 1,137 4.89 3,820 321 49.2 69.0 4.13 10.3bc 24.5 M187 0.56 1,445 8.09 4,857 353 58.6 76.3 4.69 7.0bc 20.6 M187 0.69 1,505 10.39 5,059 524 79.0 111.0 2.96 7.8bc 29.7 P 0.30 1,079 3.24 3,426 322 69.1 91.4 3.34 22.9a 39.1 P 0.43 1,557 6.69 4,940 423 74.4 102.7 3.75 11.0b 27.6 P 0.56 2,230 12.49 7,078 570 102.9 142.7 4.09 8.2bc 26.7 P 0.69 2,086 14.40 6,622 680 104.6 161.9 3.38 7.1bc 30.8 Main effect means M 1,528b 7.68ab 4,849ab 324b 54.0b 71.8b 5.03a 7.6b 20.0b M187 1,330b 6.77b 4,470b 355ab 56.6b 77.1b 4.34ab 8.9b 23.0b P 1,738a 9.20a 5,517a 499a 87.8a 124.7a 3.64b 12.3a 31.0a 0.30 1,241c 3.72d 4,017c 263b 49.7b 64.7b 4.92 14.4a 23.9 0.43 1,403bc 6.03c 4,523bc 350b 59.7ab 82.5ab 4.37 10.0b 24.6 0.56 1,732ab 9.70b 5,587ab 425ab 73.9ab 99.6ab 4.44 7.4bc 23.3 0.69 1,752a 12.09a 5,653a 533a 81.0a 118.0a 3.62 6.7c 26.9 Source of variation Probability ECV 0.0072 0.0043 0.0295 0.0226 0.0046 0.0029 0.0358 0.0036 0.0076 Lys 0.0027 < 0.0001 0.0027 0.0071 0.0691 0.0320 0.2847 < 0.0001 0.8227
Linear 0.0111 < 0.0001 0.0112 0.0868 0.0992 0.1228 0.4948 0.0002 0.8793 Quadratic 0.5779 0.4541 0.5636 0.9370 0.8593 0.9862 0.5843 0.5276 0.7763
ECV × Lys 0.1938 0.3146 0.2039 0.9201 0.9398 0.9004 0.5828 0.0094 0.2783 Pooled SEM 52.07 0.31 166.73 26.34 4.10 6.36 0.20 0.48 1.28
a- dMeans within a column with different superscripts differ (P < 0.05). 1M = unprocessed mash; M187 = M plus soybean oil (187 kcal MEn/kg diet); P = M steam pelleted and sifted. 2Expressed as true digestible lysine based on the listing of Ajinomoto Heartland, Incorporated (2001). 3Based on dual energy x-ray absorptiometry measurements adjusted as described by Mckinney et al. (2005). 4Feed conversion ratio (FCR) = feed consumption / body weight gain. 5Efficiency of dietary lysine for protein deposition (kLysPD) = protein deposition/lysine consumption. 6Efficiency of energy retention (kER) = ((protein deposition × 5.65 + lipid deposition × 9.31)/Energy (MEn basis) consumption) × 100.

127

128
CHAPTER VII
A Novel Approach for Determining the Efficiencies of Metabolizable Energy
Utilization for Protein and Lipid Tissue Accretion in Broilers
L. J. McKinney and R. G. Teeter
Department of Animal Science
Oklahoma State University
Stillwater, OK 74078
TEL: 405-744-8866
FAX: 405-744-5300
E-mail: [email protected]
Section Preference: Education and Production
Research Note: X Full-Length Paper:
RUNNING TITLE: Research Note
Abbreviation Key: MEI = intake of metabolizable energy; MEm = intake of
metabolizable energy for maintenance; RE = metabolizable energy retained in body
tissue; ERP = metabolizable energy retained as protein; ERL = metabolizable energy
retained as lipid; kp = efficiency of energy utilization for protein tissue retention; kf =
efficiency of energy utilization for lipid tissue retention

129
ABSTRACT
Data from two 10 d experiments utilizing 15 and 34 d old Cobb 500 male broilers
were conducted, pooled and used to model metabolizable energy (ME) need for
maintenance, and tissue accretion. Methodologies used to estimate energetic efficiency of
energy consumed above maintenance for protein (kp) and lipid (kf) tissue accretion were
tested and a novel method developed. The maintenance energy requirement, expressed
per unit metabolic body size, was independent of bird age and was determined as 114
kcal/ kg BW0.67. Values determined using regression analyses were 0.75 and 0.86 for kp
and kf, respectively. Regression analysis separating retained energy into energy retained
as protein and lipid tissue has been criticized due to the colinearity between protein and
lipid tissue accretion. To circumvent this, a novel methodology was developed as
follows: first a matrix of biologically possible kp and kf values is created followed by its
application to predict ME intake above maintenance. The kp kf combination enabling ME
intake computation with zero error was accepted. Between the two methods, values for kf
were in close agreement (0.86 verses 0.88). While the regression analysis estimated kp as
0.75 vs. 0.61 for the novel approach. Utilizing resulting kp and kf values, coupled with
protein and lipid accretion to estimate ME intake above maintenance, indicated less error
for the novel approach. Based upon the regression overestimate it was thereby concluded
that the method discrepancy was a result of muticollinearity between the predictor
variables in the regression model. Further, the proposed methodology for calculating kp
and kf appears to provide more accurate estimates.
(Key words: broiler, maintenance energy, energetic efficiency, body composition)

130
INTRODUCTION
Intrinsically, there is a caloric cost associated with the accretion of lean and lipid
tissue. These costs are reflected in the overall heat production of an animal and are
accounted for when a diet’s energy value is expressed as net energy. Though net energy
fully accounts for energetic inefficiencies, a net energy system has been difficult to
establish due to the complexity of its accurate measure and practical application.
Conversely, metabolizable energy can be rapidly and precisely determined (Sibbald
1976; McNab and Blair, 1988), and therefore remains the standard measure for
evaluating dietary energy in poultry diets. As such, efforts have been directed towards
quantifying the metabolizable energy required for maintenance and the efficiency of
metabolizable energy utilization for broiler tissue accretion (Leclercq and Saadoun, 1982;
Boekholt et al. 1994).
The simplest approach for assessing the efficiency of metabolizable energy utilization
for tissue accretion is by partitioning metabolizable energy intake into energy utilized for
maintenance and that retained as tissue. This is accomplished by regressing retained
energy on metabolizable energy consumption. In this instance, the slope parameter
estimate yields the efficiency of metabolizable energy for tissue accretion and the
residual energy (intercept) indicates the energy needed for maintenance (DeGroote,
1974). However, this approach is not descriptive as to the type of tissue accreted and
thus differences in efficiencies of energy utilization associated with protein and lipid
tissue are ignored.
In an effort to separate the energetic efficiencies associated with the production of
protein and lipid tissue, Kielanowski (1965) proposed subdividing metabolizable energy
131
intake as follows: MEI = MEm + (1/kp × RPE) + (1/kf × RLE), where: MEI =
metabolizable energy intake, MEm = metabolizable energy required for maintenance,
RPE = energy retained as protein, RLE = energy retained as fat, kp = efficiency of energy
utilization for protein, and kf = efficiency of energy utilization for fat. Through
regression analysis values for MEm, kp, and kf can be attained. This approach however,
has received criticism due to the autocorrelation among the predictor variables (Emmans,
1994; Noblet et al., 1999), and its inability for separating metabolizable energy into
contributing dietary substrates (Noblet et al., 1993). Further, any approach to estimating
the efficiency of energy utilization for tissue accretion requires a sound understanding of
energy required for maintenance. Errors or assumptions made relative to the
maintenance energy requirement carries-over resulting in an over or under estimation of
energy available for gain and ultimately false estimates for the metabolic costs of tissue
accretion.
The objective of the following chapter is first directed at quantifying metabolizable
energy required for maintenance and production in broilers, and second, to examine
potential errors associated with the method proposed by Kielanowski (1965) for
separating the energetic efficiencies associated with the production of protein and lipid
tissue and its associated criticisms.
MATERIALS AND METHODS
Data Source
Data analyzed in this report were obtained from two experiments of the same design
that were conducted in an effort to quantify differences in the energetic efficiency of

132
dietary protein, starch, and fat (unpublished). Diets were formulated to represent ranges
of nutrients typically fed to broilers in the United States. Both studies utilized Cobb 500
male broilers that were obtained from a commercial hatchery. Birds were reared in floor
pens equipped with two cylinder-shaped gravity feeders, nipple drinkers, and used litter
(wood shavings) that was top-dressed with fresh litter. Stocking density in the floor pens
was 40 birds per pen providing 0.03 m3 of floor space per bird and ad libitum access to a
commercial diet and water was provided. On 15 (Experiment 1) and 34 (Experiment 2)
days of age, 90 broilers were randomly selected from the floor pens and individually
housed in cages. Cages were elevated (1.2 m) and constructed of plastic-coated-wire (46
x 60 x 60 cm) equipped with a small plastic trough feeder and a nipple drinker. For a 6
day period, the birds were fed 1 of 15 dietary treatments (Table 3) twice per day (0900
and 2100 h) so as to provide 50, 100, or 150% of the estimated maintenance energy
requirement (Leclercq and Saadoun, 1982).
Preparation of the experimental diets involved several steps. First, for each
experiment, three basal diets (Table 1) were formulated to either: 97.5, 100, or 102.5%
the dietary crude protein recommended by the NRC (1994) and 3,050 kcal ME/kg diet.
Amino acids were balanced in proportion to lysine in accordance to minimum amino acid
ratios of the ideal protein concept (Baker and Han, 1994; Baker, 1997). Secondly, either
corn starch or corn oil was added in place of areaneous flour to increase the dietary
caloric density to either 0, 3,200, or 3,350 kcal ME/kg diet.
Initial and final body composition was determined using dual-energy x-ray
absorptiometry (DEXA) as described by McKinney et al. (2005). In brief, birds were
fasted (8 h), anesthetized (Skinner-Noble et al., 2005), and scanned 4 consecutive times

133
in the prone position. Equations developed by McKinney et al. (2005) were used to adjust
DEXA measurements to match what would otherwise have been obtained by proximate
analysis (AOAC, 1990). As a check of DXA results, the summation of the adjusted bird
protein, water, lipid, and ash were compared with the gravimetric weight. Body weight
calculated from adjust DXA measurements not within ± 5% of the respective gravimetric
weight were excluded and the accepted scans for each bird were combined for analysis.
Calculations and Data Analysis
Variables used in the analysis were calculated as: mean metabolic body size (MBW) =
((final body weight + initial body weight)/2) to the exponent of 0.67; energy retained as
lipid (RLE) = change in body lipid (kg) × 9,310 kcal; energy retained as protein (RPE)
change in body protein (kg) × 5,650 kcal; and retained energy = RPE + RLE. All data
presented herein are expressed per unit MBW. Maintenance energy requirement and the
efficiency of metabolizable energy intake (MEI) for protein (kp) and lipid (kf) tissue
accretion were estimated according to the following regression models:
(1) MEm = a + b × RE
(2) MEI = MEm + (1/kp) × RPE + (1/kf) × RLE
RESULTS AND DISCUSSION
When the data were expressed on a per MBW basis, no differences were detected
between Experiments 1 and 2, therefore data of the two experiments were combined and
are presented in Table 4 and Figure 1.
Maintenance Energy Requirement

134
Metabolizable energy required for maintenance was estimated in three ways (Table 5).
In the first approach, all of the data were used in developing the regression equation
(Table 5; equation 1). This approach requires the assumption that RE responses are
linear as MEI increases. This was tested using a polynomial regression model (MEI = a
+ b × RE + c × RE2). In this instance, the quadratic parameter estimate was not
significant (P = 0.60), which would indicate that this assumption is true. However, if a
slight change in the slope of the line below verses above maintenance does exist, as has
been proposed (NRC, 1994), then the maintenance energy requirement (intercept) would
be overestimated. Therefore, the second and third approaches in estimating maintenance
energy requirement were to subdivide the data into regions (Figure 1). Comparison of
the resultant regression equations (Table 5) indicate that the slope of the line does change
slightly as MEI increases above the maintenance energy requirement. All of the
estimates for maintenance energy requirement were in close agreement with previously
reported values (Leclercq and Saadoun, 1982; Robbins, and Ballew, 1984; Pinchasov and
Galili, 1990; Sakomura, 2004).
Estimates for the Efficiency of Energy Utilization for Protein and Lipid Tissue
Retention
The regression model where RE was subdivided into RPE and RLE (Table 6) resulted
in kp and kf estimates of 0.75 and 0.86, respectively. The kf estimate was similar to that
reported by Leclercq and Saadoun (1982; 0.87), Boekholt et al. (1994; 0.86), Pullar and
Webster (1977; 0.74), and van Milgen and Noblet (1999; 0.92). The value determined
for kp appeared to be overestimated compared to previously reported estimates (Leclercq
and Saadoun, 1982; kp = 0.4; Boekholt et al., 1994; kp = 0.66; Pullar and Webster, 1977;

135
kp = 0.45). Note however, that considerable variability exists among the proposed values.
This variation has been attributed to the autocorrelation that exists among the variables in
the model (Emmans, 1994; Noblet et al., 1999). It appears however, that the variability is
not necessarily due to autocorrelation, but rather the collinearity between RPE and RLE
(Figure 2).
Multicollinearity is a term that denotes correlation among variables in the
regression model (Neter et al., 1990). Multicollinearity is not necessarily problematic if
the goal of the model is predicting the independent variable. However, as the goal is to
obtain kp and kf through regression analysis, interpreting the parameter coefficients
becomes difficult if not impossible when multicollinearity exists among the dependent
variables. In general correlation coefficients of 0.70 or higher establish that significant
multicollinearity exists (Leahy, 2000).
In order to avoid the variability associated with the interpretation of the parameter
estimates when multicollinearity exists, a different approach is suggested for obtaining kp
and kf values (Appendix). Consider a data set (EnergyforGain) that includes the
following variables MEI, MEm, RPE, and RLE. Based on this data set, a new data set
(Matrix) can be created. In that data set, a matrix of biologically possible kp and kf values
can be generated (use caution in generating this kp and kf matrix: if the matrix becomes to
large then the SAS output will cease). Using the matrix data set, a new data set (kpkf)
can be created. Next, by subtracting MEm from MEI the following equation can be
derived: MEforgain = RPE/kp + RLE/kf. The program will examine every combination of
kp and kf in the equation and thus enable the identification of a kp and kf combination that
yields the actually MEI value, as illustrated in Figure 3.
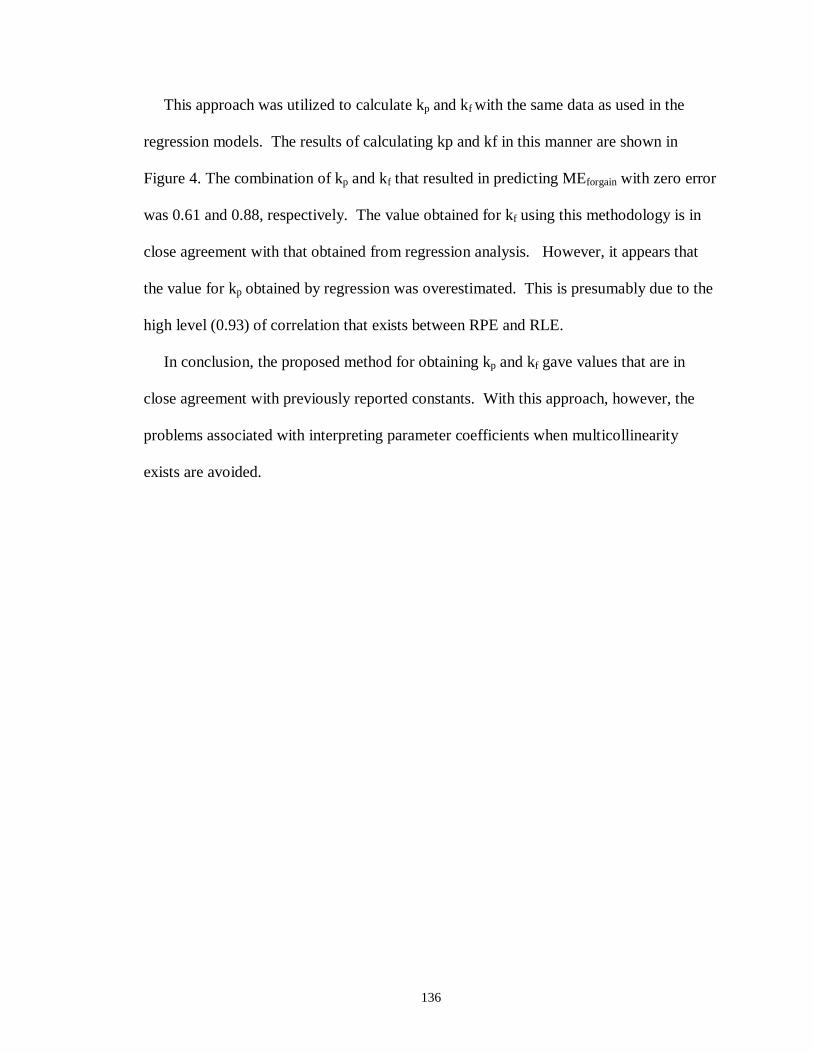
136
This approach was utilized to calculate kp and kf with the same data as used in the
regression models. The results of calculating kp and kf in this manner are shown in
Figure 4. The combination of kp and kf that resulted in predicting MEforgain with zero error
was 0.61 and 0.88, respectively. The value obtained for kf using this methodology is in
close agreement with that obtained from regression analysis. However, it appears that
the value for kp obtained by regression was overestimated. This is presumably due to the
high level (0.93) of correlation that exists between RPE and RLE.
In conclusion, the proposed method for obtaining kp and kf gave values that are in
close agreement with previously reported constants. With this approach, however, the
problems associated with interpreting parameter coefficients when multicollinearity
exists are avoided.
137
REFERENCES
Boekholt, H. A., P. H. Van der Grinten, V. V. A. M. Schreurs, M.J.N. Los, and C. P.
Leffering. 1994. Effect of dietary energy restriction on retention of protein, fat
and energy in broiler chickens. Br. Poult. Sci. 35:603 – 614.
Baker, D. H. and Y. Han. 1994. Ideal amino acid profile for broiler chicks during the first
three weeks posthatching. Poult. Sci. 73:1441 – 1447.
Baker, D. H., 1997. Ideal amino acid profiles for swine and poultry and their application
in feed formulation. Biokyowa Tech. Rev. 9:1 – 24.
De Groote, G. 1974. Utilization of metabolizable energy. In: Energy requirements of
poultry. Ed. T. R. Morris and B. M. Freeman. Edinburgh: Br. Poult. Sci. Pages
113 – 133.
Emmans, G. C. 1994. Effective energy: A concept of energy utilization applied across
species. Br. J. of Nutr. 71:801-821.
Kielanowski, J. 1965. Estimates of the energy cost of protein deposition in growing
animals, In: Proceedings of the 3rd Symposium on Energy Metabolism. Page 13 –
18. Ed. K. L. Blaxter. Academic Press, London.
Leclercq, B. and A. Saadoun. 1982. Selecting broilers for low and high abdominal fat:
comparison of energy metabolism of the lean and fat lines. Poult. Sci. 61:1799-
1803.
Leahy, K. 2000. Multicollinearity: when the solution is the problem. In: Data Mining
Cookbook. Ed: O. P. Rud. John Wiley & Sons, Inc.
McNab, J. M. and Blair, J. C. 1988. Modified assay for true and apparent metabolizable
energy based on tube feeding. Br. Poult. Sci. 29:697-707.

138
Neter, J., M. H. Kutner, C. J. Nachtsheim, and W. Wasserman. 1990. Applied Linear
Regression Models 3rd Edition. Richard D. Irwin, Inc.
Noblet, J. X. S. Shi, and S. Dubois. 1993. Metabolic utilization of dietary energy and
nutrients for maintenance energy requirements in sows: basis for a net energy
system. Br. J. Nutr. 70:407-419.
Noblet, J., C. Karege, S. Dubois, and J. van Milgen. 1999. Metabolic utilization of energy
and maintenance requirements in growing pigs: effect of sex and genotype. J.
Anim. Sci. 77:1208-1216.
National Research Council. 1994. Nutrient Requirements of Poultry. 9th rev. ed. Natl.
Acad. Press. Washington, DC.
Pinchasov, Y. and D. Galili. 1990. Energy requirementof feed-restricted broiler breeder
pullets. Poult. Sci. 69:1792 – 1795.
Pullar, J. D. and A. J. F. Webster. 1977. The energy cost of fat and protein deposition in
the rat. Br. J. Nutr. 37:355 – 363.
Robbins, K. R. and Ballew, J. E. 1984. Utilization of energy for maintenance and gain in
broilers and leghorns at two ages. Poult. Sci. 63:1419 – 1424.
Sakomura, N. K. 2004. Modeling energy utilization in broiler breeders, laying hens and
broilers. Brazilian J. of Poult. Sci. 6:1 – 11.
Sibbald, I. R. 1976. A bioassay for true metabolizable energy in feedstuffs. Poul. Sci.
55:303-308.
van Milgen, J. and J. Noblet. 1999. Energy partitioning in growing: the use of a
multivariate model as an alternative for the factorial analysis. J. Anim. Sci.
77:2154 – 2162.

139
Table 1. Composition of the basal diets used for Experiments 1 and 2
Age interval, d 15 – 21 34 – 40
Ingredient, % B1 B2 B3 B1 B2 B3 Corn 40.21 35.36 31.02 51.18 46.33 41.46 Soybean meal, 48% CP 29.24 31.12 32.02 19.44 21.3 23.14 Arenaceous flour 10.09 10.09 10.09 10.26 10.26 10.26 Corn oil 8.57 8.66 8.56 6.55 6.63 6.73 Wheat 4.50 4.5 4.5 4.49 4.49 4.49 Corn gluten meal 2.61 5.78 9.42 3.9 7.06 10.11 Dicalcium phosphorus 1.86 1.83 1.82 1.38 1.36 1.33 Limestone 1.44 1.45 1.46 1.52 1.53 1.53 Salt 0.52 0.52 0.52 0.38 0.38 0.38 Vitamin premix1 0.31 0.31 0.31 0.31 0.31 0.31 Lysine HCL 0.16 0.07 — 0.24 0.14 0.05 DL-Methionine 0.12 0.02 — 0.04 — — Choline chloride 0.12 0.11 0.11 0.04 0.04 0.04 Trace mineral premix2 0.07 0.07 0.07 0.07 0.07 0.07 Threonine 0.06 — — 0.06 — — Salinomycin 0.05 0.05 0.05 0.05 0.05 0.05 Avizyme 1502 0.05 0.05 0.05 0.05 0.05 0.05 Selenium premix 0.02 0.02 0.01 0.02 0.02 0.01 Tryptophan — — — 0.01 — —
1Supplied per kilogram of diet: vitamin A, 10,141 IU (retinyl acetate); cholecalciferol, 3,086 IU; vitamin E, 23.92 IU (dl-α-tocopheryl acetate); menadione, 2.87 mg; thiamine, 2.20 mg; riboflavin, 7.72 mg; niacin, 60.30 mg; d-pantothenic acid, 12.46 mg; pyridoxine, 3.75 mg; vitamin B12, 0.017 mg; folic acid, 1.066 mg; d-biotin, 0.127 mg. 2Supplied per kilogram of diet: Ca,160 mg; Zn, 100 mg; Mn, 120 mg; Fe,75 mg; Cu, 10 mg; I, 2.5 mg.
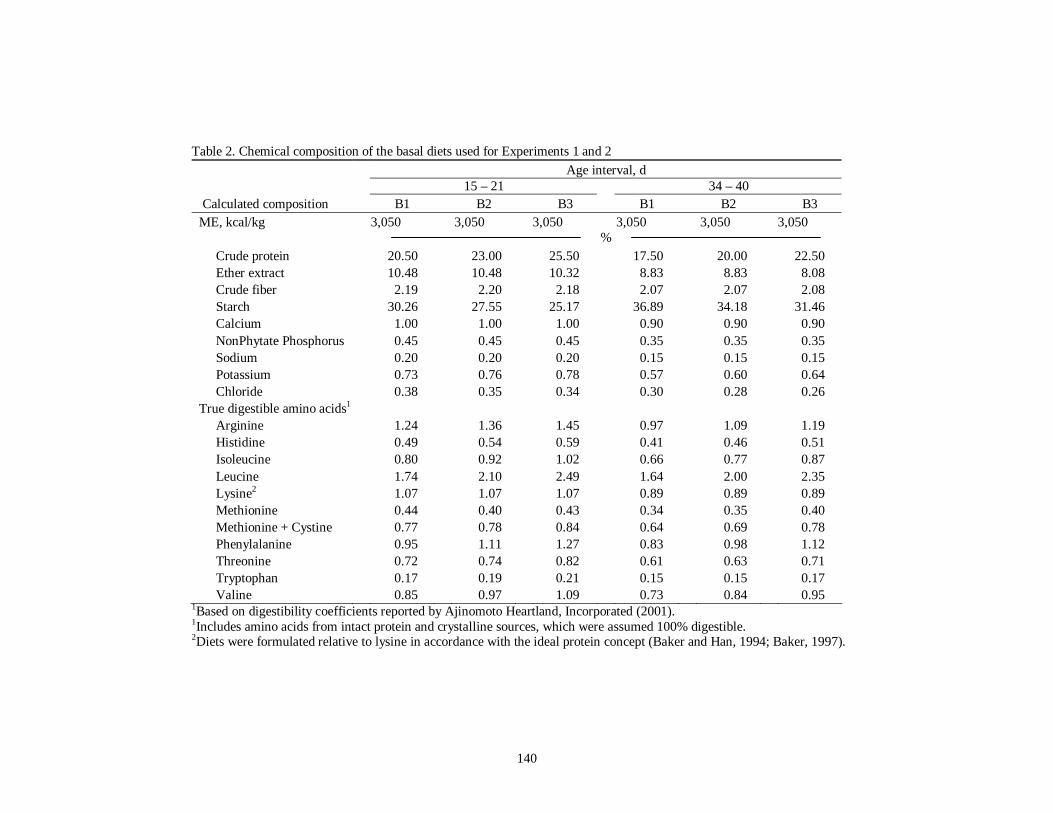
140
Table 2. Chemical composition of the basal diets used for Experiments 1 and 2
Age interval, d 15 – 21 34 – 40 Calculated composition B1 B2 B3 B1 B2 B3 ME, kcal/kg 3,050 3,050 3,050 3,050 3,050 3,050 %
Crude protein 20.50 23.00 25.50 17.50 20.00 22.50 Ether extract 10.48 10.48 10.32 8.83 8.83 8.08 Crude fiber 2.19 2.20 2.18 2.07 2.07 2.08 Starch 30.26 27.55 25.17 36.89 34.18 31.46 Calcium 1.00 1.00 1.00 0.90 0.90 0.90 NonPhytate Phosphorus 0.45 0.45 0.45 0.35 0.35 0.35 Sodium 0.20 0.20 0.20 0.15 0.15 0.15 Potassium 0.73 0.76 0.78 0.57 0.60 0.64 Chloride 0.38 0.35 0.34 0.30 0.28 0.26
True digestible amino acids1 Arginine 1.24 1.36 1.45 0.97 1.09 1.19 Histidine 0.49 0.54 0.59 0.41 0.46 0.51 Isoleucine 0.80 0.92 1.02 0.66 0.77 0.87 Leucine 1.74 2.10 2.49 1.64 2.00 2.35 Lysine2 1.07 1.07 1.07 0.89 0.89 0.89 Methionine 0.44 0.40 0.43 0.34 0.35 0.40 Methionine + Cystine 0.77 0.78 0.84 0.64 0.69 0.78 Phenylalanine 0.95 1.11 1.27 0.83 0.98 1.12 Threonine 0.72 0.74 0.82 0.61 0.63 0.71 Tryptophan 0.17 0.19 0.21 0.15 0.15 0.17 Valine 0.85 0.97 1.09 0.73 0.84 0.95
1Based on digestibility coefficients reported by Ajinomoto Heartland, Incorporated (2001). 1Includes amino acids from intact protein and crystalline sources, which were assumed 100% digestible. 2Diets were formulated relative to lysine in accordance with the ideal protein concept (Baker and Han, 1994; Baker, 1997).
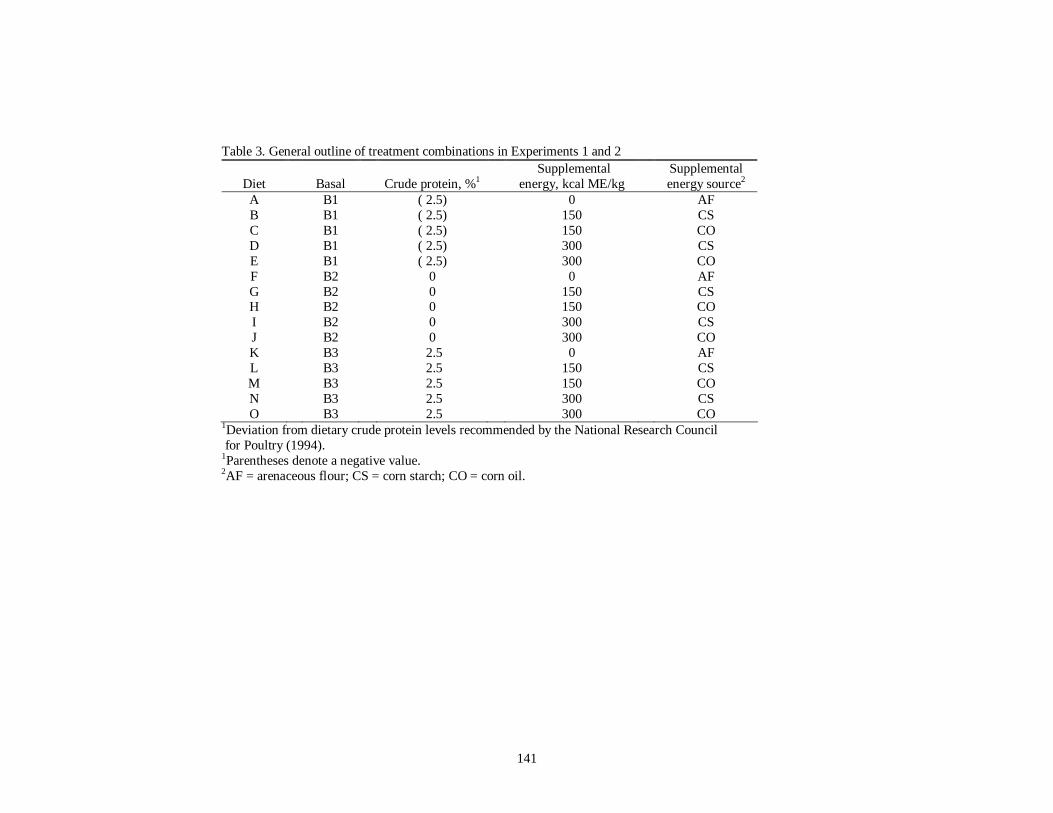
141
Table 3. General outline of treatment combinations in Experiments 1 and 2
Diet
Basal
Crude protein, %1 Supplemental
energy, kcal ME/kg Supplemental
energy source2
A B1 ( 2.5) 0 AF B B1 ( 2.5) 150 CS C B1 ( 2.5) 150 CO D B1 ( 2.5) 300 CS E B1 ( 2.5) 300 CO F B2 0 0 AF G B2 0 150 CS H B2 0 150 CO I B2 0 300 CS J B2 0 300 CO K B3 2.5 0 AF L B3 2.5 150 CS M B3 2.5 150 CO N B3 2.5 300 CS O B3 2.5 300 CO
1Deviation from dietary crude protein levels recommended by the National Research Council for Poultry (1994). 1Parentheses denote a negative value. 2AF = arenaceous flour; CS = corn starch; CO = corn oil.

142
Table 4. Data utilized for estimating kp and kf values (data from Experiments 1 and 2 were pooled) Dietary treatments1
B1 B2 B3
AF CS CO AF CS CO AF CS CO
Variable2, kcal/BW0.67 and feed restriction3 0 150 300 150 300 0 150 300 150 300 0 150 300
150 300
TMEI 50 56.8 59.0 63.2 58.7 61.7 56.4 59.1 62.0 58.6 61.2 56.8 60.0 62.5 58.2 62.6 100 108.6 114.8 112.7 112.1 120.7 110.1 112.6 117.0 114.5 117.5 106.8 110.1 118.0 112.6 117.9 150 158.8 164.6 162.3 165.3 169.3 158.8 164.7 174.2 163.0 171.8 159.3 161.2 171.5 163.3 176.3 BMEI 50 56.8 56.3 57.5 55.9 56.2 56.4 56.3 56.4 55.8 55.7 56.8 57.2 56.9 55.4 57.0 100 108.6 109.4 102.6 106.9 109.9 110.1 107.4 106.5 109.2 107.0 106.8 104.9 107.4 107.3 107.3 150 158.8 156.9 147.7 157.5 154.1 158.8 157.0 158.6 155.4 156.4 159.3 153.6 156.2 155.6 160.5 SMEI 50 – 2.8 5.7 2.8 5.5 – 2.8 5.6 2.7 5.5 – 2.8 5.6 2.7 5.6 100 – 5.4 10.1 5.3 10.8 – 5.3 10.5 5.4 10.5 – 5.2 10.6 5.3 10.6 150 – 7.7 14.5 7.7 15.2 – 7.7 15.6 7.6 15.4 – 7.6 15.4 7.7 15.8 RPE 50 (25.1) (7.1) (18.1) (16.8) (20.0) (23.1) (18.3) (19.7) (18.8) (19.1) (21.1) (17.6) (21.3) (21.0) (19.7) 100 (1.0) (0.9) (2.2) 3.4 (0.9) 0.9 2.3 2.4 (1.5) (0.1) (0.4) 2.2 (1.4) 2.6 0.7 150 11.7 9.2 13.7 15.1 16.1 14.7 11.8 17.9 17.5 20.1 18.6 21.1 27.2 21.2 20.9 RLE 50 (32.8) (16.9) (18.9) (23.3) (27.3) (29.3) (33.8) (26.2) (26.9) (26.4) (29.3) (27.3) (36.7) (24.2) (29.1) 100 (4.4) (12.8) (2.4) 2.8 (7.1) (5.3) (0.9) 0.3 (7.7) 2.7 (2.8) 2.3 (5.6) 0.0 (1.3) 150 13.4 10.0 14.2 17.1 17.6 17.0 12.5 26.3 18.9 19.9 24.2 22.0 30.1 22.9 30.5 TRE 50 (57.8) (24.0) (37.0) (40.1) (47.3) (52.4) (52.0) (45.9) (45.7) (45.5) (50.5) (44.9) (58.0) (45.2) (48.8) 100 (5.3) (13.7) (4.6) 6.2 (8.0) (4.4) 1.4 2.7 (9.2) 2.7 (3.2) 4.5 (7.0) 2.6 (0.6) 150 25.1 19.2 27.9 32.2 33.7 31.7 24.4 44.2 36.4 40.0 42.9 43.1 57.3 44.1 51.4
1Refer to Table 3 for dietary treatment structure. 2Variables: TMEI = total metabolizable energy intake; BMEI = metabolizable energy intake supplied by basal diet; SMEI = metabolizable energy intake supplied by supplement; RPE = energy retained as protein; RLE = energy retained as lipid; TRE = total retained energy. 3Percent of proposed maintenance energy requirement (Leclercq and Saadoun, 1982).

143
Table 5. Linear regression equations for determining maintenance energy requirement
MEI = a + (1/kg) × RE1 Equation Region2 a 1/kg R2
1 1 & 2 118.46151** 1.9787** 0.958 2 1 114.94056** 1.11644** 0.972 3 2 119.81672** 1.15217** 0.968
**P < 0.001. 1MEI = metabolizable energy intake (kcal/kg BW0.67); RE = retained energy (kcal/kg BW0.67); a = intercept; b = parameter coefficient. 2Denote the data used in regression analysis, refer to Figure 1.

144
Table 6. Results of regression analysis to determine the efficiencies of energy utilization for protein and lipid retention1
MEI = intercept + (1/kp) × RPE + (1/kf) × RLE2 Intercept 1/kp 1/kf
116.93674** 1.32438 1.16356 kp = 0.75 kf = 0.86
**P < 0.001. 1All birds used in analysis were in positive energy balance 2MEI = metabolizable energy intake; REP = energy retained as protein; REL = energy retained as lipid; kp = efficiency of energy utilization for protein retention; kf = efficiency of energy utilization for lipid retention.

145

146

147

148
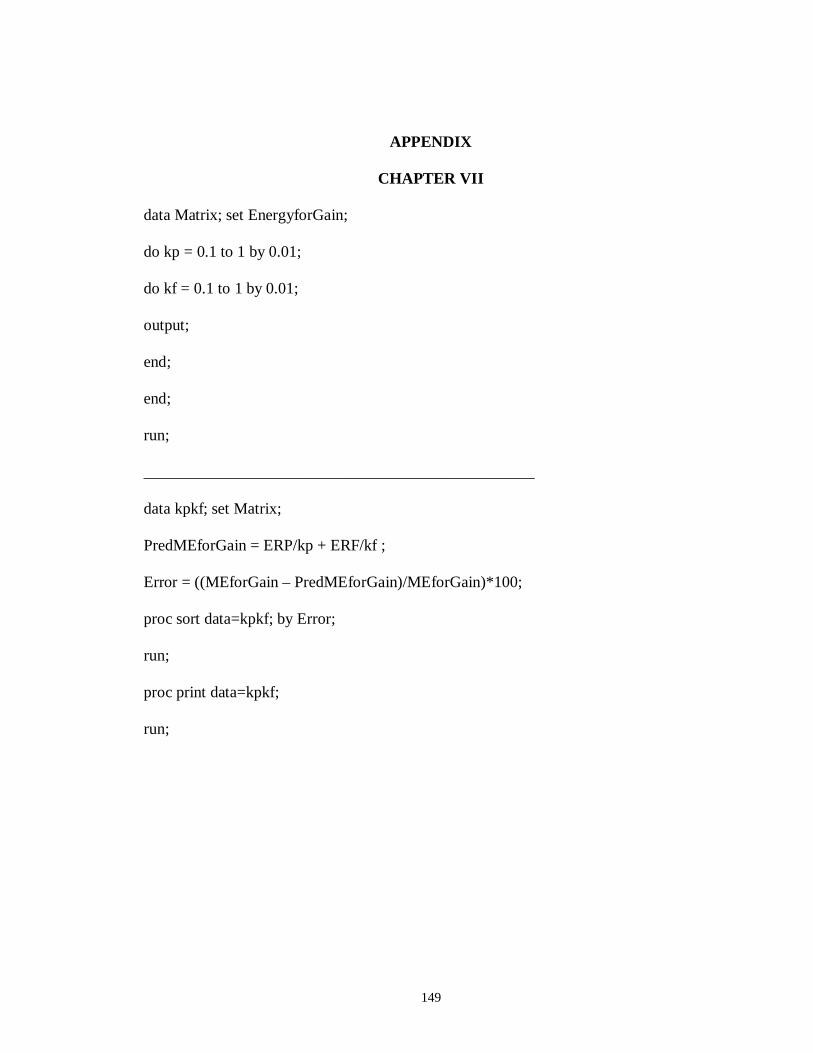
149
APPENDIX
CHAPTER VII
data Matrix; set EnergyforGain;
do kp = 0.1 to 1 by 0.01;
do kf = 0.1 to 1 by 0.01;
output;
end;
end;
run;
_________________________________________________
data kpkf; set Matrix;
PredMEforGain = ERP/kp + ERF/kf ;
Error = ((MEforGain – PredMEforGain)/MEforGain)*100;
proc sort data=kpkf; by Error;
run;
proc print data=kpkf;
run;

VITA
LELAND JAMES MCKINNEY
Candidate for the degree of
Doctor of Philosophy
Thesis: BROILER GROWTH MODELS DYNAMICALLY INTERFACING METABOLIC EFFICIENCY WITH THE PRODUCTION ENVIRONMENT
Major Field: Animal Nutrition
Biographical:
Personal Data: Born in Wellington, Kansas, February 4, 1975, the son of David and Linda McKinney.
Education: Graduated from Manhattan High School, Manhattan, Kansas, in May 1993;
received Bachelor of Science degree in Feed Science from Kansas State University, Manhattan, Kansas, in May 1998; received Master of Science degree from the Department of Grain Science, Kansas State University, Manhattan, Kansas, in 2000; completed requirements for the Doctor of Philosophy degree from Oklahoma State University, Stillwater, Oklahoma, in May 2005.
Professional Experience: Graduate Research Assistant; Oklahoma State University 2000 – 2005 Graduate Teaching and Research Assistant; Kansas State University 1998 – 2000 Internship; XIT Feeders, Continental Grain Co., Dalhart, TX summer 1997 Student employee; Feed Manufacturing Center; Kansas State University 1996 – 1998 Self employed; Stocker cattle and cow-calf management 1990 – 1998 Professional Organizations: Poultry Science Association
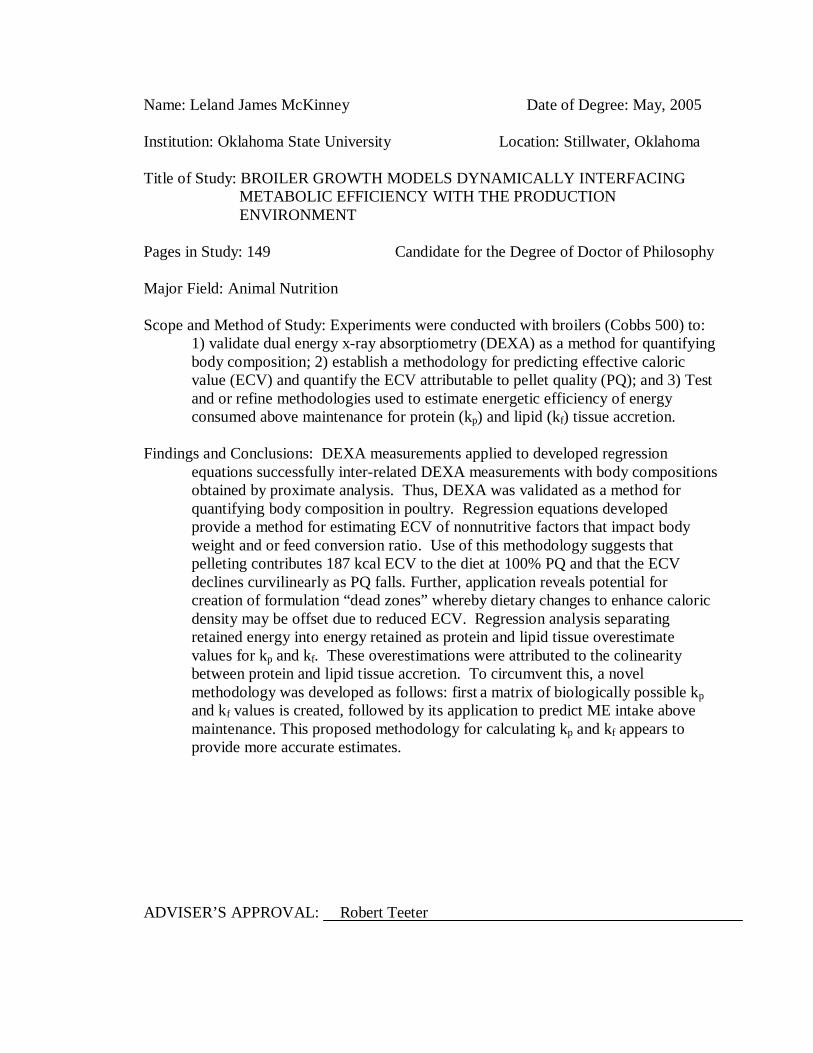
Name: Leland James McKinney Date of Degree: May, 2005 Institution: Oklahoma State University Location: Stillwater, Oklahoma Title of Study: BROILER GROWTH MODELS DYNAMICALLY INTERFACING
METABOLIC EFFICIENCY WITH THE PRODUCTION ENVIRONMENT
Pages in Study: 149 Candidate for the Degree of Doctor of Philosophy
Major Field: Animal Nutrition Scope and Method of Study: Experiments were conducted with broilers (Cobbs 500) to:
1) validate dual energy x-ray absorptiometry (DEXA) as a method for quantifying body composition; 2) establish a methodology for predicting effective caloric value (ECV) and quantify the ECV attributable to pellet quality (PQ); and 3) Test and or refine methodologies used to estimate energetic efficiency of energy consumed above maintenance for protein (kp) and lipid (kf) tissue accretion.
Findings and Conclusions: DEXA measurements applied to developed regression
equations successfully inter-related DEXA measurements with body compositions obtained by proximate analysis. Thus, DEXA was validated as a method for quantifying body composition in poultry. Regression equations developed provide a method for estimating ECV of nonnutritive factors that impact body weight and or feed conversion ratio. Use of this methodology suggests that pelleting contributes 187 kcal ECV to the diet at 100% PQ and that the ECV declines curvilinearly as PQ falls. Further, application reveals potential for creation of formulation “dead zones” whereby dietary changes to enhance caloric density may be offset due to reduced ECV. Regression analysis separating retained energy into energy retained as protein and lipid tissue overestimate values for kp and kf. These overestimations were attributed to the colinearity between protein and lipid tissue accretion. To circumvent this, a novel methodology was developed as follows: first a matrix of biologically possible kp and kf values is created, followed by its application to predict ME intake above maintenance. This proposed methodology for calculating kp and kf appears to provide more accurate estimates.
ADVISER’S APPROVAL: Robert Teeter
Related Documents