Broadband Study and Action Plan for CONNECT NW PA Supplemental Report Creating Optimum Networks n Expanding Connectivity to North west PA A Broadband Project of the Northwest Pennsylvania Regional Planning & Development Commission Submitted December 23, 2003 Spotts, Stevens and McCoy, Inc. 1047 North Park Road Reading, PA 19610-0307 Tel: 610.621.2000 Fax: 610.621.2001 www.ssmgroup.com Icon Broadband Technologies 6745 Bells Ferry Road Woodstock GA 30189 Tel: 770.592.9797 © Copyright Spotts, Stevens and McCoy, Incorporated 2003. Fax: 770.592.7363 All rights reserved www.iconbroadband.com

Welcome message from author
This document is posted to help you gain knowledge. Please leave a comment to let me know what you think about it! Share it to your friends and learn new things together.
Transcript

Broadband Study and Action Plan for CONNECT NW PA
Supplemental Report
Creating Optimum Networks n Expanding Connectivity to Northwest PA
A Broadband Project of the Northwest Pennsylvania Regional
Planning & Development Commission
Submitted December 23, 2003
Spotts, Stevens and McCoy, Inc. 1047 North Park Road
Reading, PA 19610-0307 Tel: 610.621.2000 Fax: 610.621.2001
www.ssmgroup.com
Icon Broadband Technologies 6745 Bells Ferry Road Woodstock GA 30189
Tel: 770.592.9797 © Copyright Spotts, Stevens and McCoy, Incorporated 2003. Fax: 770.592.7363 All rights reserved www.iconbroadband.com

Northwest Pennsylvania Regional Planning & Development Commission CONNECT NW PA Broadband Supplemental Report - Preliminary Draft
Table of Contents Main Report-Overview for All Eight (8) Counties………………………………......Sections 1-8 Supplemental Report-Additional Case Studies and Data by County………............Sections 9-10
Section 9: Additional Case Studies.....................................................................................114
Case Studies Utilizing Various Types of Business Models............................................................. 114
Section 10: Additional Exhibits ............................................................................................126 Demographics Data for Pennsylvania and by County .................................................................... 126
Pennsylvania Data.............................................................................................................................................................126 County Data .......................................................................................................................................................................140 Clarion County ..................................................................................................................................................................142 Crawford County...............................................................................................................................................................150 Erie County ........................................................................................................................................................................158 Forest County.....................................................................................................................................................................166 Lawrence County..............................................................................................................................................................174 Mercer County...................................................................................................................................................................182 Venango County................................................................................................................................................................190 Warren County ..................................................................................................................................................................198
Economic Development Initiatives Data by County ...................................................................... 206 Clarion County ..................................................................................................................................................................206
Table 10-A: Clarion County Development Initiatives...............................................................................................207 Crawford County...............................................................................................................................................................208
Table 10-B: Crawford County Development Initiatives ...........................................................................................210 Erie County ........................................................................................................................................................................212
Table 10-C: Erie County Development Initiatives....................................................................................................215 Figure 10-A: Erie County 2030 Transportation Plan-Highway Network...................................................................217 Figure 10-B: Erie County 2030 Transportation Plan-Erie Urban Area ......................................................................218 Figure 10-C: Erie County-Keystone Zones ................................................................................................................219 Figure 10-D: Erie County-Wide Enterprise Zone Program ........................................................................................220 Figure 10-E: Erie County Plans for Land Use & Community Facilities ....................................................................221 Figure 10-F: Erie County Composite Local Zoning Districts....................................................................................222
Forest County.....................................................................................................................................................................223 Table 10-D: Forest County Development Initiatives.................................................................................................226
Lawrence County..............................................................................................................................................................227 Table 10-E: Lawrence County Development Initiatives...........................................................................................228
Mercer County...................................................................................................................................................................230 Table 10-F: Mercer County Development Initiatives ...............................................................................................235 Figure 10-G: Mercer County Future Land UseVenango County................................................................................237
Venango County.............................................................................................................................................................. 238 Table 10-G: Venango County Development Initiatives ............................................................................................239
Warren County ..................................................................................................................................................................240 Table 10-H: Warren County Development Initiatives...............................................................................................242
End-User Survey Response Data ................................................................................................. 243 Table 10-I: End-User Survey By: All 8 Counties – All Entities..............................................................................243 Table 10-J: End-User Survey By: All 8 Counties – Residential Entities .................................................................249 Table 10-K: End-User Survey By: All 8 Counties – Business Entities.....................................................................255 Table 10-L: End-User Survey By: All 8 Counties School (K-12) Entities ...............................................................261 Table 10-N: End-User Survey By: All 8 Counties Nonprofit Agency Entities.........................................................273 Table 10-O: End-User Survey By: All 8 Counties – Government Entities...............................................................279 Table 10-P: End-User Survey By: All 8 Counties – Health Care Facility Entities...................................................285 Table 10-Q: End-User Survey By: All 8 Counties – Other Entities.........................................................................291
Service Provider Survey Response Data....................................................................................... 297 Table 10-R: Service Provider Survey By: All 19 Survey Respondents ...................................................................297
USGS Maps ............................................................................................................................... 307 Figures 2-E, 2-F, 2-G, and 2-H (Located at end of Supplemental Report)......................................................................307

Northwest Pennsylvania Regional Planning & Development Commission CONNECT NW PA Broadband Study and Action Plan Supplemental Report
December 23, 2003 Page 114
Section 9: Additional Case Studies
Case Studies Utilizing Various Types of Business Models
Big Sandy Telecommunications Center
Project Location: Pikeville, Kentucky Grant Recipient: Big Sandy Telecommuting Services, Inc./Pikeville College Total ARC Funding: $553,530 Total Matching Funds: $1,105,106
Prior to the ARC grant, very few businesses or residents in the Pikeville region had Internet access. In fact, there was no Internet service provider (ISP) in the region at the time the grant recipient applied for ARC funds. In addition to the lack of an ISP, most businesses and residents in Pikesville lacked access to training in the latest computer software programs. Given its isolated setting, there was also a desire to use the Internet and other forms of telecommunications technology, such as videoconferencing, to link schools, businesses, and community leaders with other communities in eastern Kentucky.
This project was primarily designed to provide a range of services to the businesses and residents of the five counties in the Big Sandy region of Kentucky. These included serving as an ISP, providing training and technical support in the use of the Internet and software, and building a telecommunications access site equipped with computers and videoconferencing equipment. Although the original ARC grant was designed to support a wide range of activities, much of the effort focused on establishing and maintaining the community's only ISP.
In serving as the region's first ISP, the project connected over 750 customers to the Internet. In addition, through the project’s training and telecommunications acquisitions, community businesses, educational institutions, and residents were exposed to new and emerging technologies. While this might have occurred without the ARC project, many felt that the ARC project accelerated this process. There are now 4-6 ISPs in the region, which are staffed or managed by people who received training or were exposed to the Internet through the project. In addition, the entire Big Sandy area was recently upgraded with a fiber optic backbone, which would not have been possible if not for the ARC grant and the resulting use of the Internet throughout the region.
Over the life of the ARC grant, over 700 people participated in classes on computer skills and applications. Because of the project, these professionals were able to take advantage of continuing education opportunities without leaving the community. People who attended BSTSI training are now employed in numerous businesses and educational institutions practicing the skills learned at BSTSI. Finally, the region has experienced increases in business productivity and job security, and several businesses had located in the region in part because they were able to find employees who had computer skills obtained through BSTSI.

Northwest Pennsylvania Regional Planning & Development Commission CONNECT NW PA Broadband Study and Action Plan Supplemental Report
December 23, 2003 Page 115
Medical and Government Internet Coalition Network (MAGICNET)
Project Location: Athens, Ohio Grant Recipient: Ohio University Total ARC Funding: $77,167 Total Matching Funds: $149,168
The primary goal of the Medical and Government Internet Coalition Network (MAGICnet) was to provide rural physicians and government officials access to "local services, state resources, and global connectivity" through the Internet. Toward this end, Ohio University’s College of Osteopathic Medicine (COM) and Institute for Local Government Administration and Rural Development (ILGARD) provided project participants with hardware, software, training, implementation assistance, and one year's worth of Internet access. COM and ILGARD also assisted local Internet service providers (ISPs) in expanding their service to underserved areas of southeast Ohio.
Project participants have taken advantage of the capacity-building opportunities made possible through the MAGICnet project. Sites have been able to institute computerized billing systems, saving time and money. Internet access has provided sites with access to a wealth of information, such as inter- library loan services for physicians and federal and state grant opportunities for government sites. Members of the community have received better service as a result. Physicians can access patient education materials online and print and disseminate them to their patients. Government officials can provide services in a timelier manner and can use technology to gain information, which makes their grant applications more competitive. The ISP situation has changed dramatically as well, with more competing ISPs and choices for service.
Recognizing the impact of technology, many sites have taken the initiative to upgrade their equipment and expand their vision of how they can use technology. As an example, some local governments have expressed an interest in learning Geographic Information Systems (GIS), which can be used for resource management and community planning and development.
N-Logue’s Rural Connectivity Model
Although among the top 10 largest networks in the world and the third largest among developing countries, India currently has only a teledensity of 2.5 per 100 persons (1). With development resources directed primarily towards the urban areas, rural populations conceal a strong latent demand for connectivity and communication access. Yet rough terrain, absent or decaying infrastructure, dispersed populations, and low per-capita incomes continue to ward off both public and private sector investment.
Business Model - Where others see obstacles, Indian start-up n-Logue Communications sees opportunity. N-Logue has created a for-profit business model to tap into this latent rural demand for connectivity. N-Logue was incubated by the Telecommunications and Computer Network (TeNet) Group of the Indian Institute of Technology in Madras as part of the institute's strategy for developing and disseminating innovative, affordable communication technologies to the rural

Northwest Pennsylvania Regional Planning & Development Commission CONNECT NW PA Broadband Study and Action Plan Supplemental Report
December 23, 2003 Page 116
poor of developing countries. N-Logue has fashioned a franchise-based business model that consists of three levels of interdependent networks. At the foundation- level, n-Logue forges and facilitates relationships among a wide-range of organizations—hardware and equipment providers, non-governmental organizations, content providers, and government—that enable and support the businesses of franchise owners. At the next level, n-Logue maintains a regional network of franchised Local Service Partners (LSP). The LSP works in tandem with n-Logue to set up an Access Center or node to which individual kiosk operators will be connected. At the highest level of the business model, local entrepreneurs are recruited by the LSP to establish village-level kiosk franchises that provide Internet and telephone access to the local population. Through the LSP, n-Logue offers low-priced "kiosk packages" consisting of a subscriber wall set (that connects the kiosk to the Access Center), a computer, printer and backup battery. The kiosks essentially function as combination rural Internet cafes and pay phone booths. While n-Logue provides kiosk owners with training, support, and technical assistance, local franchise owners themselves are responsible for developing additional product and service offerings (e.g., computer courses) and marketing strategies.
Infrastructure - N-Logue employs a unique, TeNet-designed Wireless Local Loop technology as the basis for its village- level communications package. This CorDECT technology consists of a fixed wireless local loop (WLL). CorDECT operates on the same principles as regular wireless technology with voice and data communication moving through radio frequency rather than wires. With WLL a fixed unit emits the originating signal. The CorDECT system provides voice, voice band FAX/DATA transfer and Internet connectivity at 35-70 Kbps to 1 Gbps when digitized. The subscriber wall set (WS-IP) can transmit both voice and data signals simultaneously to an access center, which must be located within a 25km line of sight distance. CorDECT technology effectively and inexpensively addresses the problems of distance and lack of infrastructure in rural areas. Installing a fixed wireless local loop does not require expensive digging, and the system consists of only 4 major components. Because the central base station/ direct interface unit (CBS/DIU) handles traffic from 200-1000 subscribers, it works ideally in small, dispersed markets and does not require the large subscriber base that traditional landline or cellular systems require for profitability. This low infrastructure investment, combined with low usage costs, makes the proposition affordable both for suppliers and customers in capital-constrained economies. Human Capacity - N-Logue offers training and business advisory services to its franchisees at the kiosk and LSP level. To find qualified kiosk operators, it has drawn from the large pool of graduates from India's many technical/computer institutes. It has been less successful in recruiting entrepreneurs at the LSP level, but recently has restructured and accelerated that process. N-Logue's own management consists of mature executives with extensive experience in the telecommunications sector and in sales, marketing, and business development for multinationals and blue chip Indian companies.

Northwest Pennsylvania Regional Planning & Development Commission CONNECT NW PA Broadband Study and Action Plan Supplemental Report
December 23, 2003 Page 117
Enterprise - The following factors enhance the sustainability of n-Logue's business model: « income generation at the local level « cost effective technology « decentralized organizational structure « local adaptability « local accountability
To implement its model, n-Logue has forged partnerships with an impressive network of organizations and entrepreneurs. To gain access to the long-haul telephone network and Internet backbone, n-Logue has negotiated relationships with BSNL, the former Department of Transportation monopoly, and Satyam Infoway, India's primary bandwidth provider. To facilitate entrepreneurs' access to capital, it has partnered with financial institutions such as the National Bank of Agriculture and Rural Development (NABARD) and Indian Bank. It has overcome the barrier of expensive hardware through its relationships with IIT incubated R&D and manufacturing companies and by obtaining volume discounts with suppliers. N-Logue's partnerships with entrepreneurs form the crux of its business. Local service providers (LSPs), who are usually established businesspeople or district governments, maintain access centers and recruit kiosk operators. LSPs provide training, business advisory services, and collect the revenues from the kiosk operators, which are then passed on to n-Logue. Kiosk operators develop and market their own business offerings. To date, most kiosk operators have generated the largest portions of their revenue from net-based services, computer education and job work.
Key Lessons - N-Logue's success in its pilot phase and the headway it has made towards resolving national and regional licensing and regulatory issues can be attributed to the strong relationships it established with influence makers, governments, other businesses and entrepreneurs. It has leveraged these relationships to overcome a host of obstacles ranging from capital constraints to expensive hardware to lack of relevant content. The company will need strong infusions of cash to meet its growth projections. Fortunately it has many of the other necessary inputs for growth in place. The enthusiastic response to the business opportunity of kiosk ownership and the innovation kiosk operators have demonstrated in developing their businesses have exceeded the most optimistic expectations of n-Logue managers. By developing a business that is locally adaptable and locally accountable, n-Logue has positioned itself to successfully tap into an enormous latent demand for connectivity in rural India.
Buffalo, Minnesota
Buffalo, Minnesota, a growing town of 12,000, decided to install a control and data acquisition system for its electric utility, so adding a few more strands of fiber for data transmission seemed an easy option for broadband connectivity for the community. However, demand suddenly
Northwest Pennsylvania Regional Planning & Development Commission CONNECT NW PA Broadband Study and Action Plan Supplemental Report
December 23, 2003 Page 118
increased from both residential and business users in the area. Since 90 percent of those in demand were not on the planned fiber route, and extending fiber to them was far too costly for the town to absorb, Buffalo decided to find another way to reach those demanding service.
Buffalo partnered with wireless equipment provider WaveRider Communications, Inc. and decided to become its own Internet Service Provider (ISP). The town is currently installing a non- line-of-sight (NLOS) broadband fixed wireless system that it hopes will reach about 1,700 homes and business, or about 60 percent of the available market.
Buffalo plans a two-phase rollout. The first phase is now complete and cost $180,000. This included the construction of three wireless towers. Residential users within one kilometer (five-eighths of a mile) of each tower pay $29.99 a month for 128 kilobits/ second for access. Business users can purchase speeds up to 256 kilobits/sec at a higher price. The second phase will require the construction of five more towers and will cost about $300,000. The town anticipates a four-year return on the total $480,000 investment.
Residential service started in late 2001. Over 125 customers had signed up by mid-January 2001, and two to three new subscribers sign up each day. According to Merton Auger, the city administrator, people looking to buy homes or set up businesses in Buffalo, just 26 miles from Minneapolis/St. Paul, are already asking if properties are located inside the high-speed Internet areas.
Grant County, Washington
The Grant County Public Utility District (GCPUD), a municipally owned public electric utility, has deployed a Fiber to the Home (FTTH) network in the city of Ephrata in Central Washington. The project, called ZIPP, includes a municipal fiber network and an all- fiber local access network. The utility deploys and operates the ZIPP fiber network, while independent service providers contract with the GCPUD to offer Internet access, voice, and video over the network.
In 1998, the utility began deploying a fiber network connecting the electric generating plants, power substations, and office buildings together for monitoring purposes. Once the utility points were connected, GCPUD decided to extend the network into a fiber ring and offer excess capacity to other businesses and organizations, including individual homes. The fiber ring was completed in 2000. The utility uses the network to offer advanced services such as automated metering and monitoring, and then leases the excess capacity to telecommunications service providers. In August of 2000, the utility started operating the network on a trial basis, serving 100 homes and 30 businesses. The FTTH network connects to the ZIPP municipal fiber ring and then connects through the Northwest Open Access Network (NoaNET) to a major Internet Point of Presence (PoP) located in the Westin building in Seattle.
The utility began deploying the network only to homes that had ordered the services. However, they decided to gradually deploy the network to all of the homes for a given stage of deployment since the fiber splicing and resealing process was so expensive. As of June 2000, network cabling was placed near 3,700 homes and businesses. The plan was to deploy the network to

Northwest Pennsylvania Regional Planning & Development Commission CONNECT NW PA Broadband Study and Action Plan Supplemental Report
December 23, 2003 Page 119
8,000 homes and businesses by the end of 2001 and complete coverage to all sites (approximately 40,000) in the next three to five years.
The project is financed by the utility’s capital budget. The first stage of the project has cost around $12 million and the total cost is estimated to be $130 million over the next three to five years. The utility estimates that it will pay $35 to 40 million of the total cost and that revenues will cover the rest of the costs. Equipment installed on a customer’s premises costs approximately $1,000 per subscriber, but consumers only pay the utility a one-time connection fee of $300 and an ongoing monthly fee of $40 to use the network. Subscribers choose their own service provider from four Internet Service Providers in the community. They provide symmetric broadband Internet access at 100 Mbps, with monthly fees ranging from $9 to $25 a month. A digital TV service with 120 channels and video-on-demand began on a trial basis in the summer of 2001.
Jacksonville, Florida
Jacksonville, Florida is a thriving community that boasts state-of-the-art fiber-optic connections in many of its downtown businesses, but the city wanted to find a way to get affordable broadband access to community centers in poor neighborhoods and economic development zones outside the downtown area. The city plans to conduct a pilot project over the next year that would create wireless zones across the region based on the 802.11b wireless local area network standard. Anyone within a defined Wireless Internet Zone (WIZ) created using 802.11b connections can access the Internet at speeds of up to 11 megabits/sec.
The city's first WIZ began operating in late 2001 as a technology proof-of-concept at Jacksonville Landing, a retail, restaurant and amusement center located on Jacksonville's downtown riverfront. Anyone with an appropriately equipped laptop or handheld computer can access the Internet within that zone, free of charge. As WIZ expands, the city may charge a small fee for access. WIZ will reach about 80 percent of the people in areas that want broadband services but cannot otherwise afford them. A WIZ can be installed for about an eighth of the price for a comparable wired solution.
Pocahontas, Iowa
Adopting the most appropriate (and sometimes innovative) technology can overcome many cost or deployment hurdles for rural areas. The most appropriate technology also takes into account demand factors, leading to higher take rates by consumers.
Pocahontas, Iowa, a community of approximately 2000 people, turned to a wireless system provider after being told that Qwest was not interested in providing broadband service. Rather than spending $4 million upgrading the town’s cable system for broadband, Pocahontas chose a multipoint microwave distribution system (MMDS) for an initial investment of only $32,000. The system is based on recently developed non- line-of-sight technology, which provides greater flexibility and quicker installation, but less bandwidth, than older line-of-sight systems. The

Northwest Pennsylvania Regional Planning & Development Commission CONNECT NW PA Broadband Study and Action Plan Supplemental Report
December 23, 2003 Page 120
system from Evertek Inc. provides MMDS technology in the 2.1 to 2.7 Ghz frequency range, allowing a single radio tower to cover a 35-mile radius.86 The city splits the monthly customer revenue with Evertek and expects to recoup their initial investment within three years.
Pocahontas is able to supply 512 Kbps downloads to customers for a $29.95 monthly fee. This is a broadband value proposition that seems to be hitting home with area residents. Around 20% of the town’s 900 households have signed up for the service, which has only been available since December of 2001. City Administrator Greg Fritz notes that the relatively low cost is the key to the system’s success. The lowest cost using a line-of-sight option would have been $45 per month for 128 Kbps service and $99 per month for businesses to receive 256 Kbps. Pocahontas charges the same price for business and residential and has 20% of the area businesses signed up as well. The 20% take rates for both residential and business customers are nearly double the national rate, which seems to confirm the importance of a broadband price point of approximately $30.
Stockholm, Sweden
The City of Stockholm believed broadband capacity would create an educated workforce, a prosperous economy, and an attractive lifestyle for its residents. In 1994, the city chartered a company called Stokab to build and manage a publicly owned, open-access fiber-optic network in the city that would provide dark fiber to telecommunications operators and other users at cost. Stockholm did not want multiple providers repetitively digging up its streets, so the city granted access to its ducts and tunnels. Stokab hung fiber-optic cable in the subways, and pulled it alongside steam and water pipes, electric cables, and sewer lines.
The City of Stockholm also realized it was cheaper and more practical for providers to lease Stokab fiber, than build their own networks. Stokab supplies dark fiber to carriers and resellers, who terminate and light their own fiber and supply all services above the fiber layer. Stokab is not involved in customer premises wiring. Any provider can use the network to deliver their services, allowing providers to customize their services for a specific customer. Customers of the Stokab network include telecom operators, Internet Service Providers, cable television networks, mobile telephone operators, municipalities, county councils, major banks, insurance companies, and the new media companies.
Under Swedish law, municipality-owned companies are operated to benefit the citizens and not to make a profit, so Stokab does not compete with the private sector. This increases competition among operators and thereby benefits business enterprise in the region. The users pay an access fee to use the network.
The Stokab fiber optic network began in the commercial districts of central Stockholm and the large industrial areas around Stockholm. In 1999, the network covered most of the central city and included public schools, libraries, district administrations, and industrial, office, and business centers in Stockholm. Based on the Stokab model, the Swedish Government is considering funding programs to assist municipalities in deploying open-access fiber infrastructure to every home, school, library, and business in the country. Sweden, working with the regional

Northwest Pennsylvania Regional Planning & Development Commission CONNECT NW PA Broadband Study and Action Plan Supplemental Report
December 23, 2003 Page 121
municipalities, has accepted responsibility for planning and coordination of a nationwide fiber optic network.

Northwest Pennsylvania Regional Planning & Development Commission CONNECT NW PA Broadband Study and Action Plan Supplemental Report
December 23, 2003 Page 122
Troy, New Hampshire The Troy Industrial Development Authority, seeking an innovative way to level the playing field, is creating a cooperative entity to provide broadband services. Subscribers would pay a town broadband entity, which would in turn pay a service provider. Since most providers don’t handle small business or residential users and Troy has a number of people who’d like higher bandwidth at more affordable prices, Troy officials are seeking to join Monadnock Connect as a town aggregate, not as an individual business. This project was in progress as of December 1, 2001, and attempts to serve all in the community. Digital Rivers
The Digital Rivers project in the Pittsburgh region is a comprehensive example of what can be done to gain an understanding of the market for broadband services.87 It focuses on the urban Pittsburgh area, but the demand analysis expands into surrounding rural counties. This project covers all the essentials for aligning broadband supply and demand factors. Broadband projects of this scope would serve greatly to enhance the broadband environment for any city. But short of replicating such a project, much can be applied to other areas from the Digital Rivers experience.
The major aspects of the project include the following:
« Status of local infrastructure « Area demographics « Cost analysis of various technologies and deployment « Survey of early adopters and unmet demand (county by county) « Analysis of current telecommunications environment, including the best practices of
others « Impediments to deployment « Implementation strategies « Pilot project
3 Rivers Connect (3rc) played a large role in the Digital Rivers project as well as the follow-up efforts based on the results of the project. 3rc, a non-profit organization, describes itself as a “project-oriented group (aiming) to provide broad, visionary leadership in the development of Western Pennsylvania’s information infrastructure.” One broadband deployment effort in Pittsburgh was implemented by 3rc, along with technology partner, Proxicast, LLC. Four different community improvement associations’ buildings were the first to be interconnected using Nokia Rooftop Wireless technology. Rooftop Wireless is a fixed wireless, mesh networking solution, which, in this case, delivers service speeds of 512 Kbps. The cost is approximately one-third of an equivalent speed DSL connection. The Digital River report points out that the Rooftop Wireless system is a competitive broadband technology for urban or suburban settings but is not suitable for areas where the number of houses per square mile is less than about 175. The ideal setting would be approximately 40 subscribers in a 1.5-mile radius. The Rooftop Wireless technology is one of several technological deployments considered by 3rc as they examine the various cost/performance tradeoffs for each community.

Northwest Pennsylvania Regional Planning & Development Commission CONNECT NW PA Broadband Study and Action Plan Supplemental Report
December 23, 2003 Page 123
The Digital Rivers project was a joint effort including state and local government, university and private resources. Carnegie Mellon University provided a great deal of expertise in cooperation with the Alleghany County Department of Economic Development, the Pennsylvania Technology Investment Authority and the Howard Heinz Endowment. An advisory group also included input from the Army National Guard, Pittsburgh Supercomputing Center and Redleaf Inc. Finally, there was a large group of stakeholders with direct interest in the region’s broadband capabilities. This included local and national companies, the City of Pittsburgh, and other interest groups. It takes an alignment of goals from all these groups in order to meet the broadband needs of communities.
Wireless Internet Zone
The Wireless Internet Zone in Jacksonville, Florida is one example of a project, which incorporates broadband access, computers, where needed, and training to maximize use of the technology. City officials and community activists are bringing wireless Internet connectivity to two low income neighborhoods. The recent emergence of low cost Wi-Fi wireless technology is making such broadband Internet deployments more feasible. The Internet zones cover two different community areas with wireless access. However, because Internet access cannot be accomplished without computers, they have also been made available to residents who need them through a combination of the Urban League, Humana and Florida’s Agency for Workforce Innovation. Awareness and education is also key; organizers stress the importance of getting the message out to local residents about what is now available. The larger goals for the project are to enhance literacy, workforce development, minority business development and voter education. The project is a joint effort by the City of Jacksonville, the Chamber of Commerce, the Urban League, BellSouth, and consulting firms, the Boardwalk Group, Connexsys, and the inc.well consulting group.
Thomasville, Georgia
Local efforts to aggregate organize and direct local demand can also accelerate the migration towards broadband adoption. Broadband efforts of regional municipalities can be combined in order to increase the scale of the operation. This provides more leverage in obtaining access to Internet backbone capacity and allows costs to be allocated more broadly. One example of this is occurring in rural Thomas County with a population of 43,000 in southern Georgia. Thomasville, the county seat, serves as the local cable head end and provides a broadband link to Camilla, Moultrie, and Cairo, Georgia. This broadband rollout was initiated through the Thomasville City Utility when the city could not talk anyone else into providing the service. Now that they are up and running, new competitors are starting to take the market more seriously, with the other local cable provider now upgrading its systems for broadband and a DSL competitor on the way.
Meanwhile, 50% to 60% of Thomasville’s residents have signed up for the new cable TV system and 47% of these customers have taken the cable modem service, called Rose.net. This works

Northwest Pennsylvania Regional Planning & Development Commission CONNECT NW PA Broadband Study and Action Plan Supplemental Report
December 23, 2003 Page 124
out to an overall broadband penetration for the city of almost 25%. The secrets of success in this case are likely to be found in price and customer service. Rose.net service for cable TV customers begins at $28.95 per month for 256 Kbps and climbs to $53.95 for 1 Mbps. Customers who subscribe to the cable modem service alone pay $43.95 for the 256 Kbps offering.
Dedicated customer service seems to be another factor for the higher take rate. Taking into account that most customers likely have limited technical expertise as well as patience, cable modems are installed by support staff for every customer, the technical support number is a local call and the wait is negligible. Moreover, the charges are incorporated on monthly utility bills in a precise, understandable manner.
“Hometown Utilicom”-Kutztown, Pennsylvania
The Borough of Kutztown with a population of over 5,000 is located approximately 50 miles northwest of Philadelphia between the cities of Reading and Allentown and adjacent to Kutztown University with an enrollment of over 8,000 students. In 2002, Kutztown completed construction of a broadband telecommunications infrastructure and facilities with fiber-optic cabling to the home/business (FTTH) capable of providing numerous voice, video, and data services. The borough was successful in building public-private service partnerships for the provisioning of services across the system. Just some of the services include traditional voice services, 10-100 Mbps Internet connectivity, security services, community intranet services and television programming from the municipal-owned headend. Some future anticipated services include state-of-the-art video and music offerings including both video and music-on-demand and interactive television and virtual private networking. These new voice, video and data services join the already existing borough electric energy supply and management services, water supply and treatment services, wastewater collection and treatment services and resource management (solid waste and recycling) services to provide one stop shopping, diverse billing and payment options and a value added services approach to the customer. This type of system was very complimentary to the municipal-owned electric system due to utility pole ownership, right-of-way assignments, bucket truck and other needed equipment being available, and technically competent staff for construction, service and maintenance, as well as marketing and billing services. Kutztown is also implementing an Automated Meter Reading (AMR) system for utilities. These new services will join the Borough’s existing Geographic Information System (GIS) and Supervisory Controlled and Data Acquisition (SCADA) systems in enhancing the development of Information Technologies (IT) of the Borough to better serve the propertie s and residents.
These services are marketed and billed under the registered service mark of “Hometown Utilicom”. Revenues stay within the community. Property owners and residents are not required to purchase any of the new services being offered, and the borough realizes that it must prove services are a benefit and competitive in cost to not only compete, but to justify municipal ownership of the system.

Northwest Pennsylvania Regional Planning & Development Commission CONNECT NW PA Broadband Study and Action Plan Supplemental Report
December 23, 2003 Page 125
A step-down star configuration passive optical network architecture was constructed to deliver converged voice, video and data services from the network operating center (NOC) or service control Point-of-Presence (POP) located in the municipal building to the customers’ premise. A fiber optics communication system was previously chosen for the utility’s SCADA system. The borough wanted to utilize future-proof technology to meet the high speed Internet and bandwidth demands and optical network solutions needed for additional services that will become available.
The borough has already discussed incorporating the Hometown Utilicom service industry with the Kutztown Main Street program, a downtown revitalization/reinvestment proposal. In addition, the borough is currently working on an economic development incentive initiative to attract commercial and industrial development along the Route 222 corridor to not only provide a basis for additional utility revenue, but to help relieve the growing school district tax burden on the constituents. The previously purchased Kutztown-Topton railroad spur by the borough may play a significant role in expanding services outside the Borough.
The borough felt that as a university host community, Kutztown’s needs to provide present and future adaptable technology to handle the needs of the information age is essential to remain attractive and viable to the students, as well as other residents who call Kutztown home.

Northwest Pennsylvania Regional Planning & Development Commission CONNECT NW PA Broadband Study and Action Plan Supplemental Report
December 23, 2003 Page 126
Section 10: Additional Exhibits
Demographics Data for Pennsylvania and by County
Pennsylvania Data
Main | Search | Feedback | FAQs | Glossary
Quick Tables Load Query | Save Query
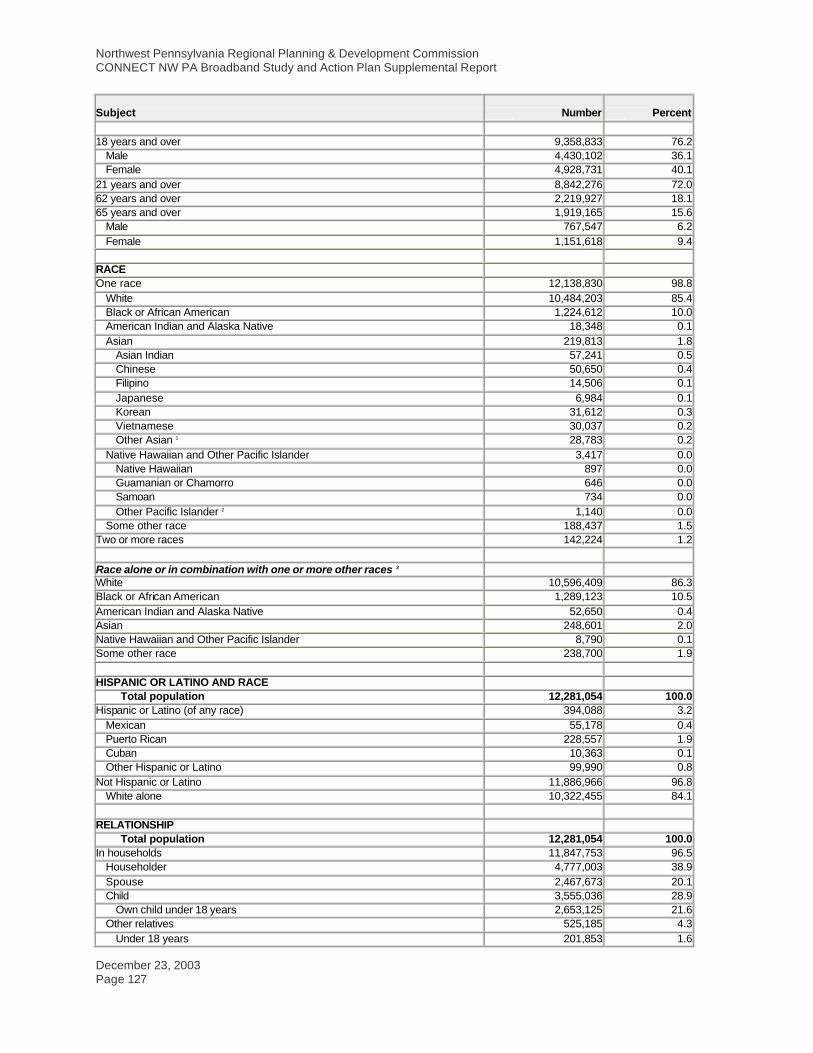
DP-1. Profile of General Demographic Characteristics: 2000 Data Set: Census 2000 Summary File 1 (SF 1) 100-Percent Data Geographic Area: Pennsylvania NOTE: For information on confidentiality protection, nonsampling error, and definitions, see http://factfinder.census.gov/home/en/datanotes/expsf1u.htm.
Subject Number Percent
Total population 12,281,054 100.0
SEX AND AGE Male 5,929,663 48.3 Female 6,351,391 51.7
Under 5 years 727,804 5.9 5 to 9 years 827,945 6.7 10 to 14 years 863,849 7.0 15 to 19 years 850,986 6.9 20 to 24 years 746,086 6.1 25 to 34 years 1,560,486 12.7 35 to 44 years 1,948,076 15.9 45 to 54 years 1,705,032 13.9 55 to 59 years 619,969 5.0 60 to 64 years 511,656 4.2 65 to 74 years 969,272 7.9 75 to 84 years 712,326 5.8 85 years and over 237,567 1.9
Median age (years) 38.0 (X)
Northwest Pennsylvania Regional Planning & Development Commission CONNECT NW PA Broadband Study and Action Plan Supplemental Report
December 23, 2003 Page 127
Subject Number Percent
18 years and over 9,358,833 76.2
Male 4,430,102 36.1 Female 4,928,731 40.1
21 years and over 8,842,276 72.0 62 years and over 2,219,927 18.1 65 years and over 1,919,165 15.6
Male 767,547 6.2 Female 1,151,618 9.4
RACE One race 12,138,830 98.8
White 10,484,203 85.4 Black or African American 1,224,612 10.0 American Indian and Alaska Native 18,348 0.1 Asian 219,813 1.8
Asian Indian 57,241 0.5 Chinese 50,650 0.4 Filipino 14,506 0.1 Japanese 6,984 0.1 Korean 31,612 0.3 Vietnamese 30,037 0.2 Other Asian 1 28,783 0.2
Native Hawaiian and Other Pacific Islander 3,417 0.0 Native Hawaiian 897 0.0 Guamanian or Chamorro 646 0.0 Samoan 734 0.0 Other Pacific Islander 2 1,140 0.0
Some other race 188,437 1.5 Two or more races 142,224 1.2
Race alone or in combination with one or more other races 3 White 10,596,409 86.3 Black or African American 1,289,123 10.5 American Indian and Alaska Native 52,650 0.4 Asian 248,601 2.0 Native Hawaiian and Other Pacific Islander 8,790 0.1 Some other race 238,700 1.9
HISPANIC OR LATINO AND RACE
Total population 12,281,054 100.0 Hispanic or Latino (of any race) 394,088 3.2
Mexican 55,178 0.4 Puerto Rican 228,557 1.9 Cuban 10,363 0.1 Other Hispanic or Latino 99,990 0.8
Not Hispanic or Latino 11,886,966 96.8 White alone 10,322,455 84.1
RELATIONSHIP
Total population 12,281,054 100.0 In households 11,847,753 96.5
Householder 4,777,003 38.9 Spouse 2,467,673 20.1 Child 3,555,036 28.9
Own child under 18 years 2,653,125 21.6 Other relatives 525,185 4.3
Under 18 years 201,853 1.6

Northwest Pennsylvania Regional Planning & Development Commission CONNECT NW PA Broadband Study and Action Plan Supplemental Report
December 23, 2003 Page 128
Subject Number Percent
Nonrelatives 522,856 4.3 Unmarried partner 237,622 1.9
In group quarters 433,301 3.5 Institutionalized population 213,790 1.7 Noninstitutionalized population 219,511 1.8
HOUSEHOLDS BY TYPE
Total households 4,777,003 100.0 Family households (families) 3,208,388 67.2
With own children under 18 years 1,430,808 30.0 Married-couple family 2,467,673 51.7
With own children under 18 years 1,043,071 21.8 Female householder, no husband present 554,693 11.6
With own children under 18 years 298,021 6.2 Nonfamily households 1,568,615 32.8
Householder living alone 1,320,941 27.7 Householder 65 years and over 555,374 11.6
Households with individuals under 18 years 1,559,281 32.6 Households with individuals 65 years and over 1,328,237 27.8
Average household size 2.48 (X) Average family size 3.04 (X)
HOUSING OCCUPANCY
Total housing units 5,249,750 100.0 Occupied housing units 4,777,003 91.0 Vacant housing units 472,747 9.0
For seasonal, recreational, or occasional use 148,230 2.8
Homeowner vacanc y rate (percent) 1.6 (X) Rental vacancy rate (percent) 7.2 (X)
HOUSING TENURE
Occupied housing units 4,777,003 100.0 Owner-occupied housing units 3,406,337 71.3 Renter-occupied housing units 1,370,666 28.7
Average household size of owner-occupied unit 2.62 (X) Average household size of renter-occupied unit 2.12 (X)
Subject Number Percent (X) Not applicable 1 Other Asian alone, or two or more Asian categories. 2 Other Pacific Islander alone, or two or more Native Hawaiian and Other Pacific Islander categories. 3 In combination with one or more other races listed. The six numbers may add to more than the total population and the six percentages may add to more than 100 percent because individuals may report more than one race. Source: U.S. Census Bureau, Census 2000 Summary File 1, Matrices P1, P3, P4, P8, P9, P12, P13, P,17, P18, P19, P20, P23, P27, P28, P33, PCT5, PCT8, PCT11, PCT15, H1, H3, H4, H5, H11, and H12.

Northwest Pennsylvania Regional Planning & Development Commission CONNECT NW PA Broadband Study and Action Plan Supplemental Report
December 23, 2003 Page 129
Main | Search | Feedback | FAQs | Glossary
Quick Tables Load Query | Save Query
DP-2. Profile of Selected Social Characteristics: 2000 Data Set: Census 2000 Summary File 3 (SF 3) - Sample Data Geographic Area: Pennsylvania NOTE: Data based on a sample except in P3, P4, H3, and H4. For information on confidentiality protection, sampling error, nonsampling error, and definitions see http://factfinder.census.gov/home/en/datanotes/expsf3.htm.
Subject Number Percent
SCHOOL ENROLLMENT
Population 3 years and over enrolled in school 3,135,934 100.0 Nursery school, preschool 203,934 6.5 Kindergarten 159,146 5.1 Elementary school (grades 1-8) 1,379,671 44.0 High school (grades 9-12) 690,020 22.0 College or graduate school 703,163 22.4
EDUCATIONAL ATTAINMENT
Population 25 years and over 8,266,284 100.0 Less than 9th grade 452,069 5.5 9th to 12th grade, no diploma 1,044,036 12.6 High school graduate (includes equivalency) 3,150,013 38.1 Some college, no degree 1,284,731 15.5 Associate degree 487,804 5.9 Bachelor's degree 1,153,383 14.0 Graduate or professional degree 694,248 8.4
Percent high school graduate or higher 81.9 (X) Percent bachelor's degree or higher 22.4 (X)
MARITAL STATUS
Population 15 years and over 9,861,713 100.0 Never married 2,685,328 27.2 Now married, except separated 5,352,297 54.3 Separated 215,846 2.2 Widowed 808,903 8.2
Female 656,381 6.7

Northwest Pennsylvania Regional Planning & Development Commission CONNECT NW PA Broadband Study and Action Plan Supplemental Report
December 23, 2003 Page 130
Divorced 799,339 8.1
Female 456,801 4.6
GRANDPARENTS AS CAREGIVERS Grandparent living in household with one or more own grandchildren under 18 years 204,909 100.0
Grandparent responsible for grandchildren 80,423 39.2
VETERAN STATUS Civilian population 18 years and over 9,354,471 100.0
Civilian veterans 1,280,788 13.7
DISABILITY STATUS OF THE CIVILIAN NONINSTITUTIONALIZED POPULATION Population 5 to 20 years 2,689,895 100.0
With a disability 202,259 7.5
Population 21 to 64 years 6,837,268 100.0 With a disability 1,196,717 17.5
Percent employed 54.8 (X) No disability 5,640,551 82.5
Percent employed 78.3 (X)
Population 65 years and over 1,809,320 100.0 With a disability 712,795 39.4
RESIDENCE IN 1995
Population 5 years and over 11,555,538 100.0 Same house in 1995 7,333,591 63.5 Different house in the U.S. in 1995 4,056,716 35.1
Same county 2,513,167 21.7 Different county 1,543,549 13.4
Same state 874,796 7.6 Different state 668,753 5.8
Elsewhere in 1995 165,231 1.4
NATIVITY AND PLACE OF BIRTH Total population 12,281,054 100.0
Native 11,772,763 95.9 Born in United States 11,620,495 94.6
State of residence 9,544,251 77.7 Different state 2,076,244 16.9
Born outside United States 152,268 1.2 Foreign born 508,291 4.1
Entered 1990 to March 2000 209,123 1.7 Naturalized citizen 257,339 2.1 Not a citizen 250,952 2.0
REGION OF BIRTH OF FOREIGN BORN
Total (excluding born at sea) 508,282 100.0 Europe 182,667 35.9 Asia 182,967 36.0 Africa 25,413 5.0 Oceania 2,178 0.4 Latin America 99,514 19.6 Northern America 15,543 3.1
LANGUAGE SPOKEN AT HOME
Population 5 years and over 11,555,538 100.0 English only 10,583,054 91.6 Language other than English 972,484 8.4
Northwest Pennsylvania Regional Planning & Development Commission CONNECT NW PA Broadband Study and Action Plan Supplemental Report
December 23, 2003 Page 131
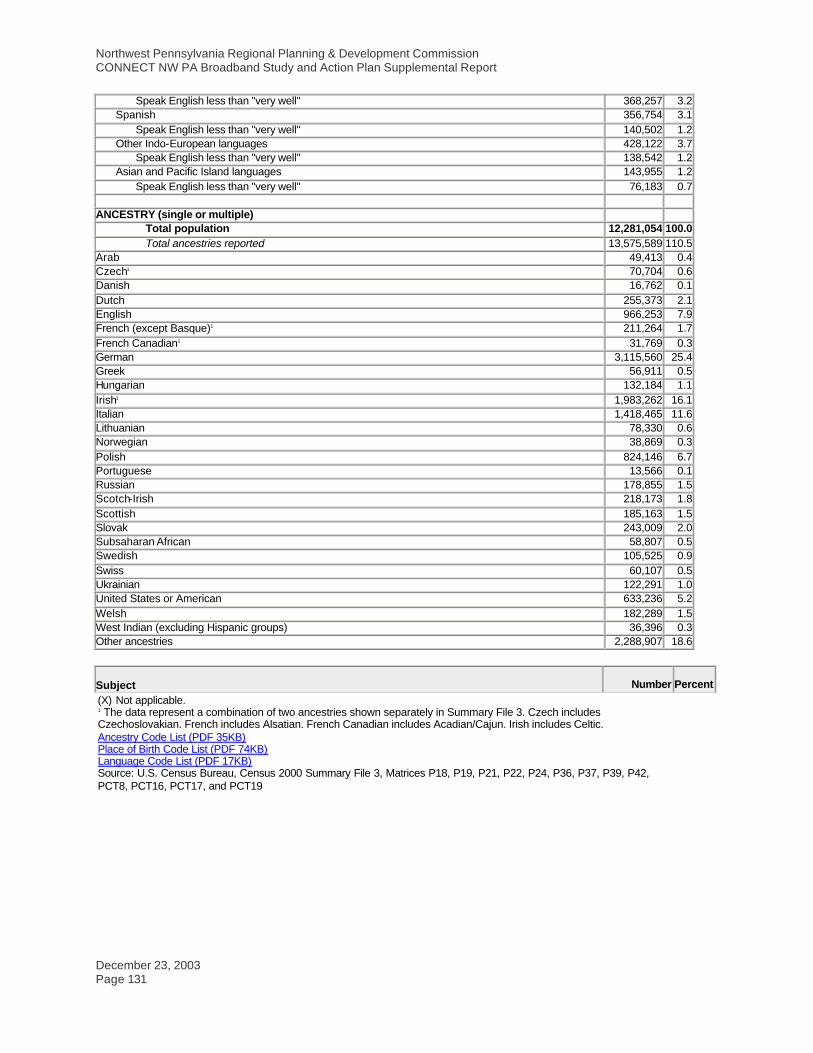
Speak English less than "very well" 368,257 3.2 Spanish 356,754 3.1
Speak English less than "very well" 140,502 1.2 Other Indo-European languages 428,122 3.7
Speak English less than "very well" 138,542 1.2 Asian and Pacific Island languages 143,955 1.2
Speak English less than "very well" 76,183 0.7
ANCESTRY (single or multiple) Total population 12,281,054 100.0 Total ancestries reported 13,575,589 110.5
Arab 49,413 0.4 Czech1 70,704 0.6 Danish 16,762 0.1 Dutch 255,373 2.1 English 966,253 7.9 French (except Basque)1 211,264 1.7 French Canadian1 31,769 0.3 German 3,115,560 25.4 Greek 56,911 0.5 Hungarian 132,184 1.1 Irish1 1,983,262 16.1 Italian 1,418,465 11.6 Lithuanian 78,330 0.6 Norwegian 38,869 0.3 Polish 824,146 6.7 Portuguese 13,566 0.1 Russian 178,855 1.5 Scotch-Irish 218,173 1.8 Scottish 185,163 1.5 Slovak 243,009 2.0 Subsaharan African 58,807 0.5 Swedish 105,525 0.9 Swiss 60,107 0.5 Ukrainian 122,291 1.0 United States or American 633,236 5.2 Welsh 182,289 1.5 West Indian (excluding Hispanic groups) 36,396 0.3 Other ancestries 2,288,907 18.6
Subject Number Percent (X) Not applicable. 1 The data represent a combination of two ancestries shown separately in Summary File 3. Czech includes Czechoslovakian. French includes Alsatian. French Canadian includes Acadian/Cajun. Irish includes Celtic. Ancestry Code List (PDF 35KB) Place of Birth Code List (PDF 74KB) Language Code List (PDF 17KB) Source: U.S. Census Bureau, Census 2000 Summary File 3, Matrices P18, P19, P21, P22, P24, P36, P37, P39, P42, PCT8, PCT16, PCT17, and PCT19
Northwest Pennsylvania Regional Planning & Development Commission CONNECT NW PA Broadband Study and Action Plan Supplemental Report
December 23, 2003 Page 132
Main | Search | Feedback | FAQs | Glossary
Quick Tables Load Query | Save Query
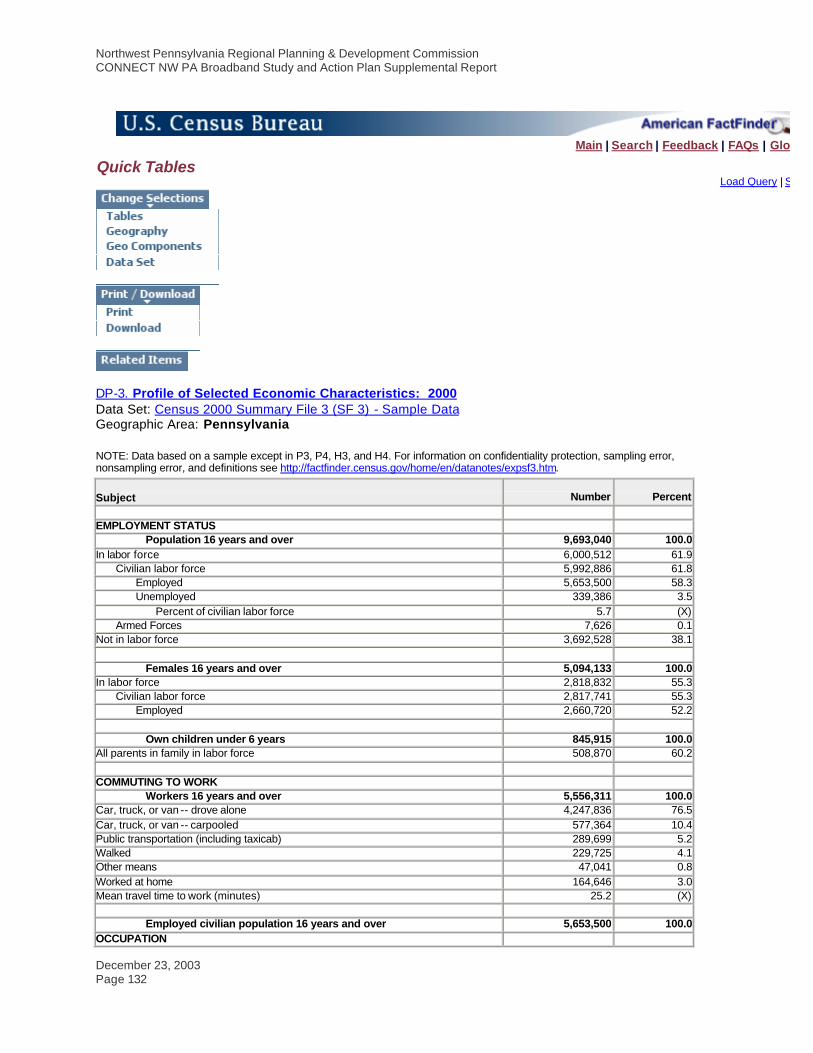
DP-3. Profile of Selected Economic Characteristics: 2000 Data Set: Census 2000 Summary File 3 (SF 3) - Sample Data Geographic Area: Pennsylvania NOTE: Data based on a sample except in P3, P4, H3, and H4. For information on confidentiality protection, sampling error, nonsampling error, and definitions see http://factfinder.census.gov/home/en/datanotes/expsf3.htm.
Subject Number Percent
EMPLOYMENT STATUS
Population 16 years and over 9,693,040 100.0 In labor force 6,000,512 61.9
Civilian labor force 5,992,886 61.8 Employed 5,653,500 58.3 Unemployed 339,386 3.5
Percent of civilian labor force 5.7 (X) Armed Forces 7,626 0.1
Not in labor force 3,692,528 38.1
Females 16 years and over 5,094,133 100.0 In labor force 2,818,832 55.3
Civilian labor force 2,817,741 55.3 Employed 2,660,720 52.2
Own children under 6 years 845,915 100.0
All parents in family in labor force 508,870 60.2
COMMUTING TO WORK Workers 16 years and over 5,556,311 100.0
Car, truck, or van -- drove alone 4,247,836 76.5 Car, truck, or van -- carpooled 577,364 10.4 Public transportation (including taxicab) 289,699 5.2 Walked 229,725 4.1 Other means 47,041 0.8 Worked at home 164,646 3.0 Mean travel time to work (minutes) 25.2 (X)
Employed civilian population 16 years and over 5,653,500 100.0
OCCUPATION

Northwest Pennsylvania Regional Planning & Development Commission CONNECT NW PA Broadband Study and Action Plan Supplemental Report
December 23, 2003 Page 133
Subject Number Percent Management, professional, and related occupations 1,841,175 32.6 Service occupations 838,137 14.8 Sales and office occupations 1,525,131 27.0 Farming, fishing, and forestry occupations 26,722 0.5 Construction, extraction, and maintenance occupations 500,898 8.9 Production, transportation, and material moving occupations 921,437 16.3
INDUSTRY Agriculture, forestry, fishing and hunting, and mining 73,459 1.3 Construction 339,363 6.0 Manufacturing 906,398 16.0 Wholesale trade 201,084 3.6 Retail trade 684,179 12.1 Transportation and warehousing, and utilities 304,335 5.4 Information 148,841 2.6 Finance, insurance, real estate, and rental and leasing 372,148 6.6 Professional, scientific, management, administrative, and waste management services 478,937 8.5 Educational, health and social services 1,237,090 21.9 Arts, entertainment, recreation, accommodation and food services 397,871 7.0 Other services (except public administration) 274,028 4.8 Public administration 235,767 4.2
CLASS OF WORKER Private wage and salary workers 4,657,372 82.4 Government workers 639,088 11.3 Self-employed workers in own not incorporated business 339,631 6.0 Unpaid family workers 17,409 0.3
INCOME IN 1999
Households 4,779,186 100.0 Less than $10,000 465,860 9.7 $10,000 to $14,999 333,381 7.0 $15,000 to $24,999 657,266 13.8 $25,000 to $34,999 633,953 13.3 $35,000 to $49,999 809,165 16.9 $50,000 to $74,999 929,863 19.5 $75,000 to $99,999 457,480 9.6 $100,000 to $149,999 317,171 6.6 $150,000 to $199,999 84,173 1.8 $200,000 or more 90,874 1.9 Median household income (dollars) 40,106 (X)
With earnings 3,667,238 76.7
Mean earnings (dollars) 54,209 (X) With Social Security income 1,451,386 30.4
Mean Social Security income (dollars) 11,717 (X) With Supplemental Security Income 203,851 4.3
Mean Supplemental Security Income (dollars) 6,523 (X) With public assistance income 149,203 3.1
Mean public assistance income (dollars) 2,848 (X) With retirement income 940,184 19.7
Mean retirement income (dollars) 14,663 (X)
Families 3,225,707 100.0 Less than $10,000 167,090 5.2 $10,000 to $14,999 124,473 3.9 $15,000 to $24,999 352,867 10.9 $25,000 to $34,999 410,489 12.7
Northwest Pennsylvania Regional Planning & Development Commission CONNECT NW PA Broadband Study and Action Plan Supplemental Report
December 23, 2003 Page 134
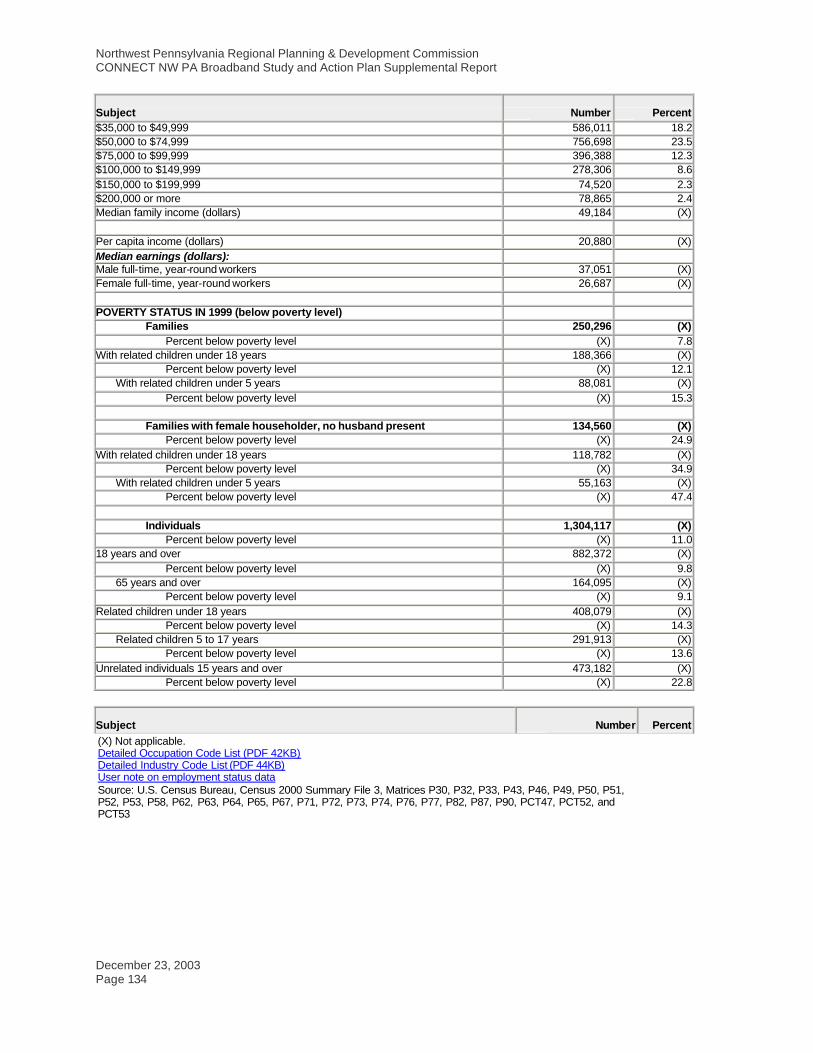
Subject Number Percent $35,000 to $49,999 586,011 18.2 $50,000 to $74,999 756,698 23.5 $75,000 to $99,999 396,388 12.3 $100,000 to $149,999 278,306 8.6 $150,000 to $199,999 74,520 2.3 $200,000 or more 78,865 2.4 Median family income (dollars) 49,184 (X)
Per capita income (dollars) 20,880 (X) Median earnings (dollars): Male full-time, year-round workers 37,051 (X) Female full-time, year-round workers 26,687 (X)
POVERTY STATUS IN 1999 (below poverty level)
Families 250,296 (X) Percent below poverty level (X) 7.8
With related children under 18 years 188,366 (X) Percent below poverty level (X) 12.1
With related children under 5 years 88,081 (X) Percent below poverty level (X) 15.3
Families with female householder, no husband present 134,560 (X)
Percent below poverty level (X) 24.9 With related children under 18 years 118,782 (X)
Percent below poverty level (X) 34.9 With related children under 5 years 55,163 (X)
Percent below poverty level (X) 47.4
Individuals 1,304,117 (X) Percent below poverty level (X) 11.0
18 years and over 882,372 (X) Percent below poverty level (X) 9.8
65 years and over 164,095 (X) Percent below poverty level (X) 9.1
Related children under 18 years 408,079 (X) Percent below poverty level (X) 14.3
Related children 5 to 17 years 291,913 (X) Percent below poverty level (X) 13.6
Unrelated individuals 15 years and over 473,182 (X) Percent below poverty level (X) 22.8
Subject Number Percent (X) Not applicable. Detailed Occupation Code List (PDF 42KB) Detailed Industry Code List (PDF 44KB) User note on employment status data Source: U.S. Census Bureau, Census 2000 Summary File 3, Matrices P30, P32, P33, P43, P46, P49, P50, P51, P52, P53, P58, P62, P63, P64, P65, P67, P71, P72, P73, P74, P76, P77, P82, P87, P90, PCT47, PCT52, and PCT53

Northwest Pennsylvania Regional Planning & Development Commission CONNECT NW PA Broadband Study and Action Plan Supplemental Report
December 23, 2003 Page 135
Main | Search | Feedback | FAQs | Glossary
Quick Tables
Load Query | Save Query
DP-4. Profile of Selected Housing Characteristics: 2000 Data Set: Census 2000 Summary File 3 (SF 3) - Sample Data Geographic Area: Pennsylvania NOTE: Data based on a sample except in P3, P4, H3, and H4. For information on confidentiality protection, sampling error, nonsampling error, and definitions see http://factfinder.census.gov/home/en/datanotes/expsf3.htm.
Subject Number Percent
Total housing units 5,249,750 100.0
UNITS IN STRUCTURE 1-unit, detached 2,935,248 55.9 1-unit, attached 940,396 17.9 2 units 273,798 5.2 3 or 4 units 241,745 4.6 5 to 9 units 179,909 3.4 10 to 19 units 131,691 2.5 20 or more units 283,714 5.4 Mobile home 258,551 4.9 Boat, RV, van, etc. 4,698 0.1
YEAR STRUCTURE BUILT 1999 to March 2000 66,916 1.3 1995 to 1998 212,916 4.1 1990 to 1994 266,445 5.1 1980 to 1989 531,986 10.1 1970 to 1979 709,768 13.5 1960 to 1969 595,897 11.4 1940 to 1959 1,275,149 24.3 1939 or earlier 1,590,673 30.3
ROOMS 1 room 62,654 1.2

Northwest Pennsylvania Regional Planning & Development Commission CONNECT NW PA Broadband Study and Action Plan Supplemental Report
December 23, 2003 Page 136
2 rooms 143,152 2.7 3 rooms 403,457 7.7 4 rooms 668,040 12.7 5 rooms 924,603 17.6 6 rooms 1,220,416 23.2 7 rooms 767,695 14.6 8 rooms 561,360 10.7 9 or more rooms 498,373 9.5 Median (rooms) 5.8 (X)
Occupied Housing Units 4,777,003 100.0
YEAR HOUSEHOLDER MOVED INTO UNIT 1999 to March 2000 696,279 14.6 1995 to 1998 1,139,483 23.9 1990 to 1994 734,248 15.4 1980 to 1989 821,152 17.2 1970 to 1979 575,344 12.0 1969 or earlier 810,497 17.0
VEHICLES AVAILABLE None 613,249 12.8 1 1,667,535 34.9 2 1,791,526 37.5 3 or more 704,693 14.8
HOUSE HEATING FUEL Utility gas 2,452,941 51.3 Bottled, tank, or LP gas 145,254 3.0 Electricity 786,648 16.5 Fuel oil, kerosene, etc. 1,217,155 25.5 Coal or coke 67,986 1.4 Wood 76,060 1.6 Solar energy 663 0.0 Other fuel 20,500 0.4 No fuel used 9,796 0.2
SELECTED CHARACTERISTICS Lacking complete plumbing facilities 24,450 0.5 Lacking complete kitchen facilities 25,831 0.5 No telephone service 65,680 1.4
OCCUPANTS PER ROOM
Occupied housing units 4,777,003 100.0 1.00 or less 4,685,858 98.1 1.01 to 1.50 60,627 1.3 1.51 or more 30,518 0.6
Specified owner-occupied units 2,889,484 100.0
VALUE Less than $50,000 435,193 15.1 $50,000 to $99,999 1,079,698 37.4 $100,000 to $149,999 703,093 24.3 $150,000 to $199,999 344,172 11.9 $200,000 to $299,999 214,812 7.4 $300,000 to $499,999 84,425 2.9 $500,000 to $999,999 23,654 0.8 $1,000,000 or more 4,437 0.2 Median (dollars) 97,000 (X)

Northwest Pennsylvania Regional Planning & Development Commission CONNECT NW PA Broadband Study and Action Plan Supplemental Report
December 23, 2003 Page 137
MORTGAGE STATUS AND SELECTED MONTHLY OWNER COSTS With a mortgage 1,798,402 62.2
Less than $300 9,157 0.3 $300 to $499 108,720 3.8 $500 to $699 270,083 9.3 $700 to $999 498,003 17.2 $1,000 to $1,499 546,365 18.9 $1,500 to $1,999 220,493 7.6 $2,000 or more 145,581 5.0 Median (dollars) 1,010 (X)
Not mortgaged 1,091,082 37.8 Median (dollars) 318 (X)
SELECTED MONTHLY OWNER COSTS AS A PERCENTAGE OF HOUSEHOLD INCOME IN 1999
Less than 15 percent 1,091,368 37.8 15 to 19 percent 509,245 17.6 20 to 24 percent 399,694 13.8 25 to 29 percent 264,015 9.1 30 to 34 percent 164,558 5.7 35 percent or more 436,159 15.1 Not computed 24,445 0.8
Specified renter-occupied units 1,348,824 100.0
GROSS RENT Less than $200 85,346 6.3 $200 to $299 89,493 6.6 $300 to $499 389,144 28.9 $500 to $749 454,749 33.7 $750 to $999 167,064 12.4 $1,000 to $1,499 65,230 4.8 $1,500 or more 19,811 1.5 No cash rent 77,987 5.8 Median (dollars) 531 (X)
GROSS RENT AS A PERCENTAGE OF HOUSEHOLD INCOME IN 1999 Less than 15 percent 259,386 19.2 15 to 19 percent 193,612 14.4 20 to 24 percent 165,624 12.3 25 to 29 percent 139,877 10.4 30 to 34 percent 93,260 6.9 35 percent or more 386,384 28.6 Not computed 110,681 8.2
Subject Number Percent (X) Not applicable. Source: U.S. Census Bureau, Census 2000 Summary File 3, Matrices H1, H7, H20, H23, H24, H30, H34, H38, H40, H43, H44, H48, H51, H62, H63, H69, H74, H76, H90, H91, and H94

Northwest Pennsylvania Regional Planning & Development Commission CONNECT NW PA Broadband Study and Action Plan Supplemental Report
December 23, 2003 Page 138
Main | Search | Feedback | FAQs | Glossary
Quick Tables Load Query | Save Query
QT-H1. General Housing Characteristics: 2000 Data Set: Census 2000 Summary File 1 (SF 1) 100-Percent Data Geographic Area: Pennsylvania NOTE: For information on confidentiality protection, nonsampling error, and definitions, see http://factfinder.census.gov/home/en/datanotes/expsf1u.htm.
Subject
Number
Percent
OCCUPANCY STATUS
Total housing units 5,249,750 100.0 Occupied housing units 4,777,003 91.0 Vacant housing units 472,747 9.0
TENURE
Occupied housing units 4,777,003 100.0 Owner-occupied housing units 3,406,337 71.3 Renter-occupied housing units 1,370,666 28.7
VACANCY STATUS
Vacant housing units 472,747 100.0 For rent 105,585 22.3 For sale only 55,891 11.8 Rented or sold, not occupied 37,494 7.9 For seasonal, recreational, or occasional use 148,230 31.4 For migratory workers 386 0.1 Other vacant 125,161 26.5
RACE OF HOUSEHOLDER
Occupied housing units 4,777,003 100.0 One race 4,739,424 99.2
White 4,177,452 87.4 Black or African American 435,073 9.1 American Indian and Alaska Native 6,580 0.1 Asian 67,792 1.4 Native Hawaiian and Other Pacific Islander 873 0.0 Some other race 51,654 1.1
Two or more races 37,579 0.8
Northwest Pennsylvania Regional Planning & Development Commission CONNECT NW PA Broadband Study and Action Plan Supplemental Report
December 23, 2003 Page 139
Subject
Number
Percent
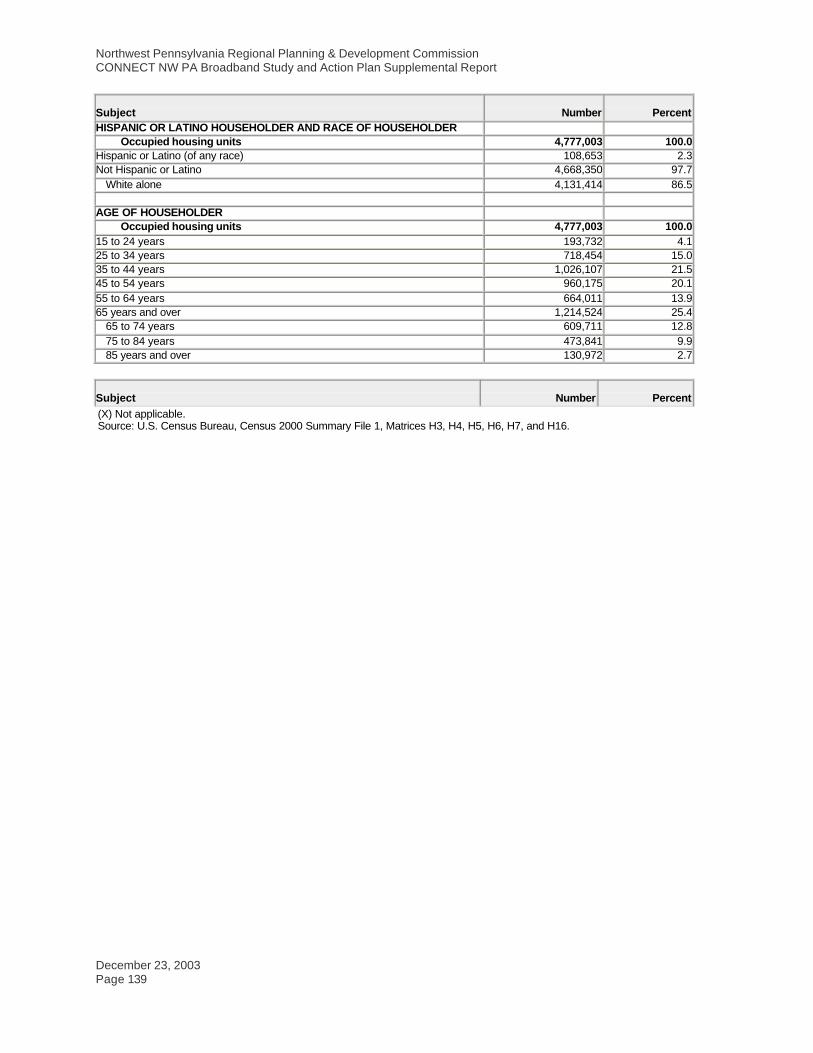
HISPANIC OR LATINO HOUSEHOLDER AND RACE OF HOUSEHOLDER Occupied housing units 4,777,003 100.0
Hispanic or Latino (of any race) 108,653 2.3 Not Hispanic or Latino 4,668,350 97.7
White alone 4,131,414 86.5
AGE OF HOUSEHOLDER Occupied housing units 4,777,003 100.0
15 to 24 years 193,732 4.1 25 to 34 years 718,454 15.0 35 to 44 years 1,026,107 21.5 45 to 54 years 960,175 20.1 55 to 64 years 664,011 13.9 65 years and over 1,214,524 25.4
65 to 74 years 609,711 12.8 75 to 84 years 473,841 9.9 85 years and over 130,972 2.7
Subject
Number
Percent
(X) Not applicable. Source: U.S. Census Bureau, Census 2000 Summary File 1, Matrices H3, H4, H5, H6, H7, and H16.

Northwest Pennsylvania Regional Planning & Development Commission CONNECT NW PA Broadband Study and Action Plan Supplemental Report
December 23, 2003 Page 140
County Data
Main | Search | Feedback | FAQs | Glossary
Geographic Comparison Table Load Query | Save Query
GCT-PH1. Population, Housing Units, Area, and Density: 2000 Data Set: Census 2000 Summary File 1 (SF 1) 100-Percent Data Geographic Area: Pennsylvania – County NOTE: For information on confidentiality protection, nonsampling error, and definitions, see http://factfinder.census.gov/home/en/datanotes/expsf1u.htm.
Area in square miles
Density per square mile of land area
Geographic area
Population
Housing
units
Total area
Water
area
Land area
Population
Housing
units Pennsylvania 12,281,054 5,249,750 46,055.24 1,238.63 44,816.61 274.0 117.1
COUNTY Adams County 91,292 35,831 521.52 1.51 520.01 175.6 68.9 Allegheny County 1,281,666 583,646 744.71 14.54 730.17 1,755.3 799.3 Armstrong County 72,392 32,387 664.44 10.51 653.93 110.7 49.5 Beaver County 181,412 77,765 443.90 9.69 434.21 417.8 179.1 Bedford County 49,984 23,529 1,017.40 2.89 1,014.51 49.3 23.2 Berks County 373,638 150,222 865.67 6.79 858.88 435.0 174.9 Blair County 129,144 55,061 527.11 1.31 525.80 245.6 104.7 Bradford County 62,761 28,664 1,161.03 10.37 1,150.67 54.5 24.9 Bucks County 597,635 225,498 622.11 14.74 607.38 984.0 371.3 Butler County 174,083 69,868 794.79 6.26 788.53 220.8 88.6 Cambria County 152,598 65,796 693.43 5.41 688.02 221.8 95.6 Cameron County 5,974 4,592 398.60 1.44 397.16 15.0 11.6 Carbon County 58,802 30,492 387.23 6.20 381.04 154.3 80.0 Centre County 135,758 53,161 1,111.85 4.32 1,107.53 122.6 48.0 Chester County 433,501 163,773 759.81 3.84 755.97 573.4 216.6 Clarion County 41,765 19,426 608.95 6.51 602.44 69.3 32.2 Clearfield County 83,382 37,855 1,153.80 6.49 1,147.32 72.7 33.0 Clinton County 37,914 18,166 898.09 7.23 890.87 42.6 20.4 Columbia County 64,151 27,733 489.79 4.24 485.55 132.1 57.1 Crawford County 90,366 42,416 1,037.74 25.01 1,012.72 89.2 41.9 Cumberland County 213,674 86,951 551.14 0.98 550.17 388.4 158.0 Dauphin County 251,798 111,133 557.53 32.24 525.29 479.4 211.6 Delaware County 550,864 216,978 190.74 6.53 184.21 2,990.4 1,177.9

Northwest Pennsylvania Regional Planning & Development Commission CONNECT NW PA Broadband Study and Action Plan Supplemental Report
December 23, 2003 Page 141
Area in square miles
Density per square mile of land area
Geographic area
Population
Housing
units
Total area
Water
area
Land area
Population
Housing
units Elk County 35,112 18,115 832.23 3.58 828.65 42.4 21.9 Erie County 280,843 114,322 1,558.40 756.46 801.95 350.2 142.6 Fayette County 148,644 66,490 798.00 7.86 790.14 188.1 84.1 Forest County 4,946 8,701 431.40 3.28 428.12 11.6 20.3 Franklin County 129,313 53,803 772.63 0.71 771.92 167.5 69.7 Fulton County 14,261 6,790 438.03 0.46 437.57 32.6 15.5 Greene County 40,672 16,678 577.95 2.09 575.86 70.6 29.0 Huntingdon County 45,586 21,058 889.03 14.98 874.05 52.2 24.1 Indiana County 89,605 37,250 834.29 5.02 829.27 108.1 44.9 Jefferson County 45,932 22,104 656.87 1.39 655.48 70.1 33.7 Juniata County 22,821 10,031 393.57 1.98 391.59 58.3 25.6 Lackawanna County 213,295 95,362 464.51 5.88 458.63 465.1 207.9 Lancaster County 470,658 179,990 983.81 34.75 949.06 495.9 189.7 Lawrence County 94,643 39,635 362.76 2.30 360.46 262.6 110.0 Lebanon County 120,327 49,320 362.60 0.74 361.86 332.5 136.3 Lehigh County 312,090 128,910 348.34 1.68 346.66 900.3 371.9 Luzerne County 319,250 144,686 907.13 16.32 890.81 358.4 162.4 Lycoming County 120,044 52,464 1,243.77 8.91 1,234.85 97.2 42.5 McKean County 45,936 21,644 984.17 2.60 981.57 46.8 22.1 Mercer County 120,293 49,859 682.57 10.76 671.82 179.1 74.2 Mifflin County 46,486 20,745 414.60 2.75 411.86 112.9 50.4 Monroe County 138,687 67,581 617.42 8.92 608.50 227.9 111.1 Montgomery County 750,097 297,434 487.45 4.33 483.12 1,552.6 615.7 Montour County 18,236 7,627 132.30 1.55 130.75 139.5 58.3 Northampton County 267,066 106,710 377.36 3.56 373.80 714.5 285.5 Northumberland County 94,556 43,164 477.38 17.47 459.91 205.6 93.9 Perry County 43,602 18,941 555.77 2.25 553.52 78.8 34.2 Philadelphia County 1,517,550 661,958 142.64 7.55 135.09 11,233.6 4,900.1 Pike County 46,302 34,681 566.64 19.83 546.81 84.7 63.4 Potter County 18,080 12,159 1,081.42 0.25 1,081.17 16.7 11.2 Schuylkill County 150,336 67,806 782.61 4.25 778.36 193.1 87.1 Snyder County 37,546 14,890 332.16 0.95 331.20 113.4 45.0 Somerset County 80,023 37,163 1,081.17 6.51 1,074.66 74.5 34.6 Sullivan County 6,556 6,017 452.35 2.41 449.94 14.6 13.4 Susquehanna County 42,238 21,829 832.40 9.54 822.86 51.3 26.5 Tioga County 41,373 19,893 1,137.30 3.58 1,133.73 36.5 17.5 Union County 41,624 14,684 317.12 0.39 316.73 131.4 46.4 Venango County 57,565 26,904 683.02 7.98 675.04 85.3 39.9 Warren County 43,863 23,058 897.81 14.36 883.45 49.6 26.1 Washington County 202,897 87,267 860.95 3.86 857.09 236.7 101.8 Wayne County 47,722 30,593 750.54 21.32 729.22 65.4 42.0 Westmoreland County 369,993 161,058 1,036.34 10.86 1,025.48 360.8 157.1 Wyoming County 28,080 12,713 404.79 7.59 397.20 70.7 32.0 York County 381,751 156,720 910.25 5.80 904.45 422.1 173.3
Area in square miles
Density per square mile of land area
Geographic area Population
Housing
units
Total area
Water
area
Land area Population
Housing
units (X) Not applicable Source: U.S. Census Bureau, Census 2000 Summary File 1

Northwest Pennsylvania Regional Planning & Development Commission CONNECT NW PA Broadband Study and Action Plan Supplemental Report
December 23, 2003 Page 142
Clarion County
U.S. Census Data
Table DP-1. Profile of General Demographic Characteristics: 2000 Geographic area: Clarion County, Pennsylvania [For information on confidentiality protection, nonsampling error, and definitions, see text] Subject Number Percent Total population. . . . . . . . . . . . . . . . . . . . . . . . . . 41,765 100.0 SEX AND AGE Male . . . . . . . . . . . . . . . . . . . . . . . . . . . . . . . . . . . . . . . . 20,162 48.3 Female. . . . . . . . . . . . . . . . . . . . . . . . . . . . . . . . . . . . . . 21,603 51.7 Under 5 years . . . . . . . . . . . . . . . . . . . . . . . . . . . . . . . 2,267 5.4 5 to 9 years . . . . . . . . . . . . . . . . . . . . . . . . . . . . . . . . . 2,500 6.0 10 to 14 years . . . . . . . . . . . . . . . . . . . . . . . . . . . . . . . 2,669 6.4 15 to 19 years . . . . . . . . . . . . . . . . . . . . . . . . . . . . . . . 3,798 9.1 20 to 24 years . . . . . . . . . . . . . . . . . . . . . . . . . . . . . . . 4,221 10.1 25 to 34 years . . . . . . . . . . . . . . . . . . . . . . . . . . . . . . . 4,765 11.4 35 to 44 years . . . . . . . . . . . . . . . . . . . . . . . . . . . . . . . 5,748 13.8 45 to 54 years . . . . . . . . . . . . . . . . . . . . . . . . . . . . . . . 5,386 12.9 55 to 59 years . . . . . . . . . . . . . . . . . . . . . . . . . . . . . . . 2,124 5.1 60 to 64 years . . . . . . . . . . . . . . . . . . . . . . . . . . . . . . . 1,951 4.7 65 to 74 years . . . . . . . . . . . . . . . . . . . . . . . . . . . . . . . 3,348 8.0 75 to 84 years . . . . . . . . . . . . . . . . . . . . . . . . . . . . . . . 2,244 5.4 85 years and over . . . . . . . . . . . . . . . . . . . . . . . . . . . . 744 1.8 Median age (years) . . . . . . . . . . . . . . . . . . . . . . . . . . . 36.3 (X) 18 years and over . . . . . . . . . . . . . . . . . . . . . . . . . . . . 32,730 78.4 Male . . . . . . . . . . . . . . . . . . . . . . . . . . . . . . . . . . . . . . 15,543 37.2 Female. . . . . . . . . . . . . . . . . . . . . . . . . . . . . . . . . . . . 17,187 41.2 21 years and over . . . . . . . . . . . . . . . . . . . . . . . . . . . . 29,352 70.3 62 years and over . . . . . . . . . . . . . . . . . . . . . . . . . . . . 7,479 17.9 65 years and over . . . . . . . . . . . . . . . . . . . . . . . . . . . . 6,336 15.2 Male . . . . . . . . . . . . . . . . . . . . . . . . . . . . . . . . . . . . . . 2,691 6.4 Female. . . . . . . . . . . . . . . . . . . . . . . . . . . . . . . . . . . . 3,645 8.7 RACE One race . . . . . . . . . . . . . . . . . . . . . . . . . . . . . . . . . . . . 41,548 99.5 White . . . . . . . . . . . . . . . . . . . . . . . . . . . . . . . . . . . . . 40,998 98.2 Black or African American . . . . . . . . . . . . . . . . . . . 329 0.8 American Indian and Alaska Native . . . . . . . . . . . 45 0.1 Asian . . . . . . . . . . . . . . . . . . . . . . . . . . . . . . . . . . . . . 142 0.3 Asian Indian . . . . . . . . . . . . . . . . . . . . . . . . . . . . . 35 0.1 Chinese . . . . . . . . . . . . . . . . . . . . . . . . . . . . . . . . . 26 0.1 Filipino . . . . . . . . . . . . . . . . . . . . . . . . . . . . . . . . . . 20 - Japanese. . . . . . . . . . . . . . . . . . . . . . . . . . . . . . . . 7 - Korean. . . . . . . . . . . . . . . . . . . . . . . . . . . . . . . . . . 26 0.1 Vietnamese. . . . . . . . . . . . . . . . . . . . . . . . . . . . . . 9 - Other Asian 1 . . . . . . . . . . . . . . . . . . . . . . . . . . . . 19 - Native Hawaiian and Other Pacific Islander. . . . 2 - Native Hawaiian. . . . . . . . . . . . . . . . . . . . . . . . . . 2 - Guamanian or Chamorro . . . . . . . . . . . . . . . . . . - - Samoan. . . . . . . . . . . . . . . . . . . . . . . . . . . . . . . . . - - Other Pacific Islander 2 . . . . . . . . . . . . . . . . . . . - - Some other race . . . . . . . . . . . . . . . . . . . . . . . . . . . 32 0.1 Two or more races . . . . . . . . . . . . . . . . . . . . . . . . . . . 217 0.5 Race alone or in combination with one or more other races: 3
White . . . . . . . . . . . . . . . . . . . . . . . . . . . . . . . . . . . . . . . 41,200 98.6 Black or African American . . . . . . . . . . . . . . . . . . . . . 396 0.9 American Indian and Alaska Native . . . . . . . . . . . . . 133 0.3 Asian . . . . . . . . . . . . . . . . . . . . . . . . . . . . . . . . . . . . . . . 189 0.5 Native Hawaiian and Other Pacific Islander. . . . . . 9 - Some other race . . . . . . . . . . . . . . . . . . . . . . . . . . . . . 62 0.1 Subject Number Percent HISPANIC OR LATINO AND RACE Total population. . . . . . . . . . . . . . . . . . . . . . . . . . 41,765 100.0 Hispanic or Latino (of any race) . . . . . . . . . . . . . . . . 172 0.4

Northwest Pennsylvania Regional Planning & Development Commission CONNECT NW PA Broadband Study and Action Plan Supplemental Report
December 23, 2003 Page 143
Mexican. . . . . . . . . . . . . . . . . . . . . . . . . . . . . . . . . . . 62 0.1 Puerto Rican. . . . . . . . . . . . . . . . . . . . . . . . . . . . . . . 44 0.1 Cuban . . . . . . . . . . . . . . . . . . . . . . . . . . . . . . . . . . . . 5 - Other Hispanic or Latino . . . . . . . . . . . . . . . . . . . . 61 0.1 Not Hispanic or Latino . . . . . . . . . . . . . . . . . . . . . . . . 41,593 99.6 White alone. . . . . . . . . . . . . . . . . . . . . . . . . . . . . . . . 40,867 97.8 RELATIONSHIP Total population. . . . . . . . . . . . . . . . . . . . . . . . . . 41,765 100.0 In households. . . . . . . . . . . . . . . . . . . . . . . . . . . . . . . . 39,448 94.5 Householder . . . . . . . . . . . . . . . . . . . . . . . . . . . . . . . 16,052 38.4 Spouse . . . . . . . . . . . . . . . . . . . . . . . . . . . . . . . . . . . 8,820 21.1 Child. . . . . . . . . . . . . . . . . . . . . . . . . . . . . . . . . . . . . . 11,103 26.6 Own child under 18 years . . . . . . . . . . . . . . . . 8,443 20.2 Other relatives . . . . . . . . . . . . . . . . . . . . . . . . . . . . . 1,006 2.4 Under 18 years . . . . . . . . . . . . . . . . . . . . . . . . . 333 0.8 Nonrelatives . . . . . . . . . . . . . . . . . . . . . . . . . . . . . . . 2,467 5.9 Unmarried partner . . . . . . . . . . . . . . . . . . . . . . . 797 1.9 In group quarters . . . . . . . . . . . . . . . . . . . . . . . . . . . . . 2,317 5.5 Institutionalized population. . . . . . . . . . . . . . . . . . . 517 1.2 Noninstitutionalized population . . . . . . . . . . . . . . . 1,800 4.3 HOUSEHOLD BY TYPE Total households. . . . . . . . . . . . . . . . . . . . . . . . . 16,052 100.0 Family households (families). . . . . . . . . . . . . . . . . . . 10,735 66.9 With own children under 18 years . . . . . . . . . . 4,594 28.6 Married-couple family . . . . . . . . . . . . . . . . . . . . . . . 8,820 54.9 With own children under 18 years . . . . . . . . . . 3,519 21.9 Female householder, no husband present . . . . . 1,351 8.4 With own children under 18 years . . . . . . . . . . 788 4.9 Nonfamily households . . . . . . . . . . . . . . . . . . . . . . . . 5,317 33.1 Householder living alone . . . . . . . . . . . . . . . . . . . . 4,178 26.0 Householder 65 years and over . . . . . . . . . . . . 1,819 11.3 Households with individuals under 18 years . . . . . 4,903 30.5 Households with individuals 65 years and over . . 4,381 27.3 Average household size. . . . . . . . . . . . . . . . . . . . . . . 2.46 (X) Average family size. . . . . . . . . . . . . . . . . . . . . . . . . . . 2.95 (X) HOUSING OCCUPANCY Total housing units. . . . . . . . . . . . . . . . . . . . . . . 19,426 100.0 Occupied housing units . . . . . . . . . . . . . . . . . . . . . . . 16,052 82.6 Vacant housing units. . . . . . . . . . . . . . . . . . . . . . . . . . 3,374 17.4 For seasonal, recreational, or occasional use. . . . . . . . . . . . . . . . . . . . . . . . . . . . 2,331 12.0 Homeowner vacancy rate (percent). . . . . . . . . . . . . 1.4 (X) Rental vacancy rate (percent). . . . . . . . . . . . . . . . . . 7.0 (X) HOUSING TENURE Occupied housing units . . . . . . . . . . . . . . . . . . 16,052 100.0 Owner-occupied housing units . . . . . . . . . . . . . . . . . 11,599 72.3 Renter-occupied housing units . . . . . . . . . . . . . . . . . 4,453 27.7 Average household size of owner-occupied units. 2.55 (X) Average household size of renter-occupied units . 2.21 (X) - Represents zero or rounds to zero. (X) Not applicable. 1 Other Asian alone, or two or more Asian categories. 2 Other Pacific Islander alone, or two or more Native Hawaiian and Other Pacific Islander categories. 3 In combination with one or more of the other races listed. The six numbers may add to more than the total population and the six percentages may add to more than 100 percent because individuals may report more than one race. Source: U.S. Census Bureau, Census 2000. U.S. Census Bureau 1

Northwest Pennsylvania Regional Planning & Development Commission CONNECT NW PA Broadband Study and Action Plan Supplemental Report
December 23, 2003 Page 144
Table DP-2. Profile of Selected Social Characteristics: 2000 Geographic area: Clarion County, Pennsylvania [Data based on a sample. For information on confidentiality protection, sampling error, nonsampling error, and definitions, see text] Subject Number Percent SCHOOL ENROLLMENT Population 3 years and over enrolled in school. . . . . . . . . . . . . . . . . . . . 12,036 100.0 Nursery school, preschool . . . . . . . . . . . . . . . . . . . . . 518 4.3 Kindergarten. . . . . . . . . . . . . . . . . . . . . . . . . . . . . . . . . 510 4.2 Elementary school (grades 1-8) . . . . . . . . . . . . . . . . 4,180 34.7 High school (grades 9-12) . . . . . . . . . . . . . . . . . . . . . 2,178 18.1 College or graduate school . . . . . . . . . . . . . . . . . . . . 4,650 38.6 EDUCATIONAL ATTAINMENT Population 25 years and over . . . . . . . . . . 26,334 100.0 Less than 9th grade . . . . . . . . . . . . . . . . . . . . . . . . . . 1,650 6.3 9th to 12th grade, no diploma. . . . . . . . . . . . . . . . . . 3,153 12.0 High school graduate (includes equivalency). . . . . 13,276 50.4 Some college, no degree. . . . . . . . . . . . . . . . . . . . . . 3,074 11.7 Associate degree. . . . . . . . . . . . . . . . . . . . . . . . . . . . . 1,156 4.4 Bachelor’s degree . . . . . . . . . . . . . . . . . . . . . . . . . . . . 2,470 9.4 Graduate or professional degree . . . . . . . . . . . . . . . 1,555 5.9 Percent high school graduate or higher . . . . . . . . . 81.8 (X) Percent bachelor’s degree or higher . . . . . . . . . . . . 15.3 (PX) MARITAL STATUS Population 15 years and over . . . . . . . . . . 34,305 100.0 Never married . . . . . . . . . . . . . . . . . . . . . . . . . . . . . . . 10,242 29.9 Now married, except separated . . . . . . . . . . . . . . . . 18,579 54.2 Separated . . . . . . . . . . . . . . . . . . . . . . . . . . . . . . . . . . . 551 1.6 Widowed . . . . . . . . . . . . . . . . . . . . . . . . . . . . . . . . . . . . 2,616 7.6 Female. . . . . . . . . . . . . . . . . . . . . . . . . . . . . . . . . . . . 2,111 6.2 Divorced . . . . . . . . . . . . . . . . . . . . . . . . . . . . . . . . . . . . 2,317 6.8 Female. . . . . . . . . . . . . . . . . . . . . . . . . . . . . . . . . . . . 1,211 3.5 GRANDPARENTS AS CAREGIVERS Grandparent living in household with one or more own grandchildren under 18 years . . . . . . . . . . . . . . . . . . . . . . . . . . . . . 332 100.0 Grandparent responsible for grandchildren . . . . . . 122 36.7 VETERAN STATUS Civilian population 18 years and over . . 32,679 100.0 Civilian veterans . . . . . . . . . . . . . . . . . . . . . . . . . . . . . 4,456 13.6 DISABILITY STATUS OF THE CIVILIAN NONINSTITUTIONALIZED POPULATION Population 5 to 20 years. . . . . . . . . . . . . . . 10,184 100.0 With a disability . . . . . . . . . . . . . . . . . . . . . . . . . . . . . . 650 6.4 Population 21 to 64 years. . . . . . . . . . . . . . 22,889 100.0 With a disability . . . . . . . . . . . . . . . . . . . . . . . . . . . . . . 3,987 17.4 Percent employed . . . . . . . . . . . . . . . . . . . . . . . . . . 44.5 (X) No disability . . . . . . . . . . . . . . . . . . . . . . . . . . . . . . . . . 18,902 82.6 Percent employed . . . . . . . . . . . . . . . . . . . . . . . . . . 73.6 (X) Population 65 years and over . . . . . . . . . . 5,885 100.0 With a disability . . . . . . . . . . . . . . . . . . . . . . . . . . . . . . 2,321 39.4 RESIDENCE IN 1995 Population 5 years and over . . . . . . . . . . . 39,484 100.0 Same house in 1995. . . . . . . . . . . . . . . . . . . . . . . . . . 24,873 63.0 Different house in the U.S. in 1995 . . . . . . . . . . . . . 14,388 36.4 Same county . . . . . . . . . . . . . . . . . . . . . . . . . . . . . . 7,094 18.0 Different county . . . . . . . . . . . . . . . . . . . . . . . . . . . . 7,294 18.5 Same state . . . . . . . . . . . . . . . . . . . . . . . . . . . . . . 5,916 15.0 Different state. . . . . . . . . . . . . . . . . . . . . . . . . . . . 1,378 3.5 Elsewhere in 1995. . . . . . . . . . . . . . . . . . . . . . . . . . . . 223 0.6 Subject Number Percent NATIVITY AND PLACE OF BIRTH Total population. . . . . . . . . . . . . . . . . . . . . . . . . . 41,765 100.0 Native. . . . . . . . . . . . . . . . . . . . . . . . . . . . . . . . . . . . . . . 41,346 99.0 Born in United States . . . . . . . . . . . . . . . . . . . . . . . 41,177 98.6 State of residence . . . . . . . . . . . . . . . . . . . . . . . . 37,159 89.0 Different state. . . . . . . . . . . . . . . . . . . . . . . . . . . . 4,018 9.6 Born outside United States . . . . . . . . . . . . . . . . . . 169 0.4 Foreign born . . . . . . . . . . . . . . . . . . . . . . . . . . . . . . . . . 419 1.0

Northwest Pennsylvania Regional Planning & Development Commission CONNECT NW PA Broadband Study and Action Plan Supplemental Report
December 23, 2003 Page 145
Entered 1990 to March 2000 . . . . . . . . . . . . . . 139 0.3 Naturalized citizen . . . . . . . . . . . . . . . . . . . . . . . . . . 249 0.6 Not a citizen . . . . . . . . . . . . . . . . . . . . . . . . . . . . . . . 170 0.4 REGION OF BIRTH OF FOREIGN BORN Total (excluding born at sea). . . . . . . . . . . . . . 419 100.0 Europe. . . . . . . . . . . . . . . . . . . . . . . . . . . . . . . . . . . . . . 171 40.8 Asia . . . . . . . . . . . . . . . . . . . . . . . . . . . . . . . . . . . . . . . . 195 46.5 Africa . . . . . . . . . . . . . . . . . . . . . . . . . . . . . . . . . . . . . . . 26 6.2 Oceania. . . . . . . . . . . . . . . . . . . . . . . . . . . . . . . . . . . . . 2 0.5 Latin America . . . . . . . . . . . . . . . . . . . . . . . . . . . . . . . . 20 4.8 Northern America. . . . . . . . . . . . . . . . . . . . . . . . . . . . . 5 1.2 LANGUAGE SPOKEN AT HOME Population 5 years and over . . . . . . . . . . . . . . 39,484 100.0 English only . . . . . . . . . . . . . . . . . . . . . . . . . . . . . . . . . 38,438 97.4 Language other than English . . . . . . . . . . . . . . . . . . 1,046 2.6 Speak English less than ��very well�� . . . . . . . . 325 0.8 Spanish . . . . . . . . . . . . . . . . . . . . . . . . . . . . . . . . . . . 292 0.7 Speak English less than ��very well�� . . . . . . . . 85 0.2 Other Indo-European languages . . . . . . . . . . . . . 621 1.6 Speak English less than ��very well�� . . . . . . . . 189 0.5 Asian and Pacific Island languages. . . . . . . . . . . 94 0.2 Speak English less than ��very well�� . . . . . . . . 39 0.1 ANCESTRY (single or multiple) Total population. . . . . . . . . . . . . . . . . . . . . . . . . . 41,765 100.0 Total ancestries reported . . . . . . . . . . . . . . . . . . . 41,360 99.0 Arab . . . . . . . . . . . . . . . . . . . . . . . . . . . . . . . . . . . . . . . . 24 0.1 Czech1. . . . . . . . . . . . . . . . . . . . . . . . . . . . . . . . . . . . . . 62 0.1 Danish . . . . . . . . . . . . . . . . . . . . . . . . . . . . . . . . . . . . . . 27 0.1 Dutch . . . . . . . . . . . . . . . . . . . . . . . . . . . . . . . . . . . . . . . 2,113 5.1 English. . . . . . . . . . . . . . . . . . . . . . . . . . . . . . . . . . . . . . 2,912 7.0 French (except Basque)1 . . . . . . . . . . . . . . . . . . . . . . 666 1.6 French Canadian1 . . . . . . . . . . . . . . . . . . . . . . . . . . . . 51 0.1 German . . . . . . . . . . . . . . . . . . . . . . . . . . . . . . . . . . . . . 16,549 39.6 Greek. . . . . . . . . . . . . . . . . . . . . . . . . . . . . . . . . . . . . . . 42 0.1 Hungarian . . . . . . . . . . . . . . . . . . . . . . . . . . . . . . . . . . . 147 0.4 Irish1. . . . . . . . . . . . . . . . . . . . . . . . . . . . . . . . . . . . . . . . 5,607 13.4 Italian . . . . . . . . . . . . . . . . . . . . . . . . . . . . . . . . . . . . . . . 2,470 5.9 Lithuanian . . . . . . . . . . . . . . . . . . . . . . . . . . . . . . . . . . . 31 0.1 Norwegian. . . . . . . . . . . . . . . . . . . . . . . . . . . . . . . . . . . 44 0.1 Polish . . . . . . . . . . . . . . . . . . . . . . . . . . . . . . . . . . . . . . . 1,089 2.6 Portuguese . . . . . . . . . . . . . . . . . . . . . . . . . . . . . . . . . . 11 - Russian . . . . . . . . . . . . . . . . . . . . . . . . . . . . . . . . . . . . . 133 0.3 Scotch-Irish. . . . . . . . . . . . . . . . . . . . . . . . . . . . . . . . . . 1,256 3.0 Scottish . . . . . . . . . . . . . . . . . . . . . . . . . . . . . . . . . . . . . 926 2.2 Slovak . . . . . . . . . . . . . . . . . . . . . . . . . . . . . . . . . . . . . . 253 0.6 Subsaharan African. . . . . . . . . . . . . . . . . . . . . . . . . . . 71 0.2 Swedish. . . . . . . . . . . . . . . . . . . . . . . . . . . . . . . . . . . . . 519 1.2 Swiss . . . . . . . . . . . . . . . . . . . . . . . . . . . . . . . . . . . . . . . 121 0.3 Ukrainian . . . . . . . . . . . . . . . . . . . . . . . . . . . . . . . . . . . . 119 0.3 United States or American. . . . . . . . . . . . . . . . . . . . . 3,074 7.4 Welsh. . . . . . . . . . . . . . . . . . . . . . . . . . . . . . . . . . . . . . . 307 0.7 West Indian (excluding Hispanic groups) . . . . . . . . 16 - Other ancestries . . . . . . . . . . . . . . . . . . . . . . . . . . . . . 2,720 6.5 -Represents zero or rounds to zero. (X) Not applicable. 1The data represent a combination of two ancestries shown separately in Summary File 3. Czech includes Czechoslovakian. French includes Alsatian. French Canadian includes Acadian/Cajun. Irish includes Celtic. Source: U.S. Bureau of the Census, Census 2000. U.S. Census Bureau 2

Northwest Pennsylvania Regional Planning & Development Commission CONNECT NW PA Broadband Study and Action Plan Supplemental Report
December 23, 2003 Page 146
Table DP-3. Profile of Selected Economic Characteristics: 2000 Geographic area: Clarion County, Pennsylvania [Data based on a sample. For information on confidentiality protection, sampling error, nonsampling error, and definitions, see text] Subject Number Percent EMPLOYMENT STATUS Population 16 years and over . . . . . . . . . . . . 33,781 100.0 In labor force . . . . . . . . . . . . . . . . . . . . . . . . . . . . . . . . 19,261 57.0 Civilian labor force. . . . . . . . . . . . . . . . . . . . . . . . . . 19,248 57.0 Employed . . . . . . . . . . . . . . . . . . . . . . . . . . . . . . . 17,969 53.2 Unemployed . . . . . . . . . . . . . . . . . . . . . . . . . . . . . 1,279 3.8 Percent of civilian labor force . . . . . . . . . . . . 6.6 (X) Armed Forces. . . . . . . . . . . . . . . . . . . . . . . . . . . . . . 13 - Not in labor force. . . . . . . . . . . . . . . . . . . . . . . . . . . . . 14,520 43.0 Females 16 years and over . . . . . . . . . . . . . . 17,723 100.0 In labor force . . . . . . . . . . . . . . . . . . . . . . . . . . . . . . . . 8,925 50.4 Civilian labor force. . . . . . . . . . . . . . . . . . . . . . . . . . 8,920 50.3 Employed . . . . . . . . . . . . . . . . . . . . . . . . . . . . . . . 8,380 47.3 Own children under 6 years. . . . . . . . . . . . . . 2,661 100.0 All parents in family in labor force . . . . . . . . . . . . . . 1,457 54.8 COMMUTING TO WORK Workers 16 years and over . . . . . . . . . . . . . . 17,652 100.0 Car, truck, or van - - drove alone . . . . . . . . . . . . . . . 13,949 79.0 Car, truck, or van - - carpooled. . . . . . . . . . . . . . . . . 1,697 9.6 Public transportation (including taxicab) . . . . . . . . . 48 0.3 Walked. . . . . . . . . . . . . . . . . . . . . . . . . . . . . . . . . . . . . . 1,194 6.8 Other means. . . . . . . . . . . . . . . . . . . . . . . . . . . . . . . . . 123 0.7 Worked at home . . . . . . . . . . . . . . . . . . . . . . . . . . . . . 641 3.6 Mean travel time to work (minutes)1 . . . . . . . . . . . . 22.9 (X) Employed civilian population 16 years and over . . . . . . . . . . . . . . . . . . . . . 17,969 100.0 OCCUPATION Management, professional, and related occupations . . . . . . . . . . . . . . . . . . . . . . . . . . . . . . . . 4,629 25.8 Service occupations . . . . . . . . . . . . . . . . . . . . . . . . . . 2,990 16.6 Sales and office occupations . . . . . . . . . . . . . . . . . . 4,266 23.7 Farming, fishing, and forestry occupations. . . . . . . 253 1.4 Construction, extraction, and maintenance occupations . . . . . . . . . . . . . . . . . . . . . . . . . . . . . . . . 2,119 11.8 Production, transportation, and material moving occupations . . . . . . . . . . . . . . . . . . . . . . . . . . . . . . . . 3,712 20.7 INDUSTRY Agriculture, forestry, fishing and hunting, and mining . . . . . . . . . . . . . . . . . . . . . . . . . . . . . . . . . 629 3.5 Construction . . . . . . . . . . . . . . . . . . . . . . . . . . . . . . . . . 1,156 6.4 Manufacturing. . . . . . . . . . . . . . . . . . . . . . . . . . . . . . . . 3,133 17.4 Wholesale trade. . . . . . . . . . . . . . . . . . . . . . . . . . . . . . 457 2.5 Retail trade . . . . . . . . . . . . . . . . . . . . . . . . . . . . . . . . . . 2,538 14.1 Transportation and warehousing, and utilities . . . . 1,147 6.4 Information . . . . . . . . . . . . . . . . . . . . . . . . . . . . . . . . . . 225 1.3 Finance, insurance, real estate, and rental and leasing . . . . . . . . . . . . . . . . . . . . . . . . . . . . . . . . . . . . . 592 3.3 Professional, scientific, management, administrative, and waste management services . . . . . . . 673 3.7 Educational, health and social services . . . . . . . . . 4,456 24.8 Arts, entertainment, recreation, accommodation and food services . . . . . . . . . . . . . . . . . . . . . . . . . . . 1,565 8.7 Other services (except public administration) . . . . 832 4.6 Public administration. . . . . . . . . . . . . . . . . . . . . . . . . . 566 3.1 CLASS OF WORKER Private wage and salary workers . . . . . . . . . . . . . . . 13,648 76.0 Government workers. . . . . . . . . . . . . . . . . . . . . . . . . . 2,744 15.3 Self-employed workers in own not incorporated business . . . . . . . . . . . . . . . . . . . . . . . . . . . . . . . . . . . 1,492 8.3 Unpaid family workers . . . . . . . . . . . . . . . . . . . . . . . . 85 0.5 Subject Number Percent INCOME IN 1999 Households. . . . . . . . . . . . . . . . . . . . . . . . . . . . . 16,011 100.0 Less than $10,000. . . . . . . . . . . . . . . . . . . . . . . . . . . . 2,088 13.0 $10,000 to $14,999. . . . . . . . . . . . . . . . . . . . . . . . . . . 1,434 9.0

Northwest Pennsylvania Regional Planning & Development Commission CONNECT NW PA Broadband Study and Action Plan Supplemental Report
December 23, 2003 Page 147
$15,000 to $24,999. . . . . . . . . . . . . . . . . . . . . . . . . . . 2,963 18.5 $25,000 to $34,999. . . . . . . . . . . . . . . . . . . . . . . . . . . 2,584 16.1 $35,000 to $49,999. . . . . . . . . . . . . . . . . . . . . . . . . . . 2,798 17.5 $50,000 to $74,999. . . . . . . . . . . . . . . . . . . . . . . . . . . 2,595 16.2 $75,000 to $99,999. . . . . . . . . . . . . . . . . . . . . . . . . . . 917 5.7 $100,000 to $149,999. . . . . . . . . . . . . . . . . . . . . . . . . 430 2.7 $150,000 to $199,999. . . . . . . . . . . . . . . . . . . . . . . . . 94 0.6 $200,000 or more . . . . . . . . . . . . . . . . . . . . . . . . . . . . 108 0.7 Median household income (dollars) . . . . . . . . . . . . . 30,770 (X) With earnings . . . . . . . . . . . . . . . . . . . . . . . . . . . . . . . . 11,843 74.0 Mean earnings (dollars)1 . . . . . . . . . . . . . . . . . . . . 39,326 (X) With Social Security income . . . . . . . . . . . . . . . . . . . 5,197 32.5 Mean Social Security income (dollars)1 . . . . . . . 11,230 (X) With Supplemental Security Income . . . . . . . . . . . . 796 5.0 Mean Supplemental Security Income (dollars)1 . . . . . . . . . . . . . . . . . . . . . . . . . . . . . . . . . 6,328 (X) With public assistance income . . . . . . . . . . . . . . . . . 448 2.8 Mean public assistance income (dollars)1 . . . . . 2,036 (X) With retirement income . . . . . . . . . . . . . . . . . . . . . . . 3,189 19.9 Mean retirement income (dollars)1. . . . . . . . . . . . 13,471 (X) Families . . . . . . . . . . . . . . . . . . . . . . . . . . . . . . . . 10,781 100.0 Less than $10,000. . . . . . . . . . . . . . . . . . . . . . . . . . . . 794 7.4 $10,000 to $14,999. . . . . . . . . . . . . . . . . . . . . . . . . . . 550 5.1 $15,000 to $24,999. . . . . . . . . . . . . . . . . . . . . . . . . . . 1,670 15.5 $25,000 to $34,999. . . . . . . . . . . . . . . . . . . . . . . . . . . 1,895 17.6 $35,000 to $49,999. . . . . . . . . . . . . . . . . . . . . . . . . . . 2,276 21.1 $50,000 to $74,999. . . . . . . . . . . . . . . . . . . . . . . . . . . 2,231 20.7 $75,000 to $99,999. . . . . . . . . . . . . . . . . . . . . . . . . . . 788 7.3 $100,000 to $149,999. . . . . . . . . . . . . . . . . . . . . . . . . 404 3.7 $150,000 to $199,999. . . . . . . . . . . . . . . . . . . . . . . . . 87 0.8 $200,000 or more . . . . . . . . . . . . . . . . . . . . . . . . . . . . 86 0.8 Median family income (dollars) . . . . . . . . . . . . . . . . . 37,964 (X) Per capita income (dollars)1 . . . . . . . . . . . . . . . . . . . 15,243 (X) Median earnings (dollars): Male full-time, year-round workers. . . . . . . . . . . . . . 30,019 (X) Female full-time, year-round workers . . . . . . . . . . . 19,625 (X) Subject Number below poverty level Percent below poverty level POVERTY STATUS IN 1999 Families . . . . . . . . . . . . . . . . . . . . . . . . . . . . . . . . 1,122 10.4 With related children under 18 years. . . . . . . . . . . . 783 16.2 With related children under 5 years. . . . . . . . . . . 355 19.7 Families with female householder, no husband present . . . . . . . . . . . . . . . . . . . . . . . 513 37.1 With related children under 18 years. . . . . . . . . . . . 444 53.1 With related children under 5 years. . . . . . . . . . . 196 69.8 Individuals . . . . . . . . . . . . . . . . . . . . . . . . . . . . . . 6,059 15.4 18 years and over . . . . . . . . . . . . . . . . . . . . . . . . . . . . 4,539 14.9 65 years and over . . . . . . . . . . . . . . . . . . . . . . . . . . 522 8.9 Related children under 18 years . . . . . . . . . . . . . . . 1,487 16.9 Related children 5 to 17 years . . . . . . . . . . . . . . . 1,033 15.7 Unrelated individuals 15 years and over. . . . . . . . . 2,720 37.4 -Represents zero or rounds to zero. (X) Not applicable. 1If the denominator of a mean value or per capita value is less than 30, then that value is calculated using a rounded aggregate in the numerator. See text. Source: U.S. Bureau of the Census, Census 2000. U.S. Census Bureau
3 Table DP-4. Profile of Selected Housing Characteristics: 2000

Northwest Pennsylvania Regional Planning & Development Commission CONNECT NW PA Broadband Study and Action Plan Supplemental Report
December 23, 2003 Page 148
Geographic area: Clarion County, Pennsylvania [Data based on a sample. For information on confidentiality protection, sampling error, nonsampling error, and definitions, see text] Subject Number Percent Total housing units. . . . . . . . . . . . . . . . . . . . 19,426 100.0 UNITS IN STRUCTURE 1-unit, detached. . . . . . . . . . . . . . . . . . . . . . . . . . . . . . 13,754 70.8 1-unit, attached . . . . . . . . . . . . . . . . . . . . . . . . . . . . . . 128 0.7 2 units . . . . . . . . . . . . . . . . . . . . . . . . . . . . . . . . . . . . . . 543 2.8 3 or 4 units . . . . . . . . . . . . . . . . . . . . . . . . . . . . . . . . . . 513 2.6 5 to 9 units . . . . . . . . . . . . . . . . . . . . . . . . . . . . . . . . . . 519 2.7 10 to 19 units . . . . . . . . . . . . . . . . . . . . . . . . . . . . . . . . 183 0.9 20 or more units . . . . . . . . . . . . . . . . . . . . . . . . . . . . . 526 2.7 Mobile home. . . . . . . . . . . . . . . . . . . . . . . . . . . . . . . . . 3,115 16.0 Boat, RV, van, etc . . . . . . . . . . . . . . . . . . . . . . . . . . . . 145 0.7 YEAR STRUCTURE BUILT 1999 to March 2000 . . . . . . . . . . . . . . . . . . . . . . . . . . 291 1.5 1995 to 1998 . . . . . . . . . . . . . . . . . . . . . . . . . . . . . . . . 885 4.6 1990 to 1994 . . . . . . . . . . . . . . . . . . . . . . . . . . . . . . . . 761 3.9 1980 to 1989 . . . . . . . . . . . . . . . . . . . . . . . . . . . . . . . . 2,295 11.8 1970 to 1979 . . . . . . . . . . . . . . . . . . . . . . . . . . . . . . . . 3,510 18.1 1960 to 1969 . . . . . . . . . . . . . . . . . . . . . . . . . . . . . . . . 2,177 11.2 1940 to 1959 . . . . . . . . . . . . . . . . . . . . . . . . . . . . . . . . 3,466 17.8 1939 or earlier . . . . . . . . . . . . . . . . . . . . . . . . . . . . . . . 6,041 31.1 ROOMS 1 room . . . . . . . . . . . . . . . . . . . . . . . . . . . . . . . . . . . . . . 406 2.1 2 rooms . . . . . . . . . . . . . . . . . . . . . . . . . . . . . . . . . . . . . 667 3.4 3 rooms . . . . . . . . . . . . . . . . . . . . . . . . . . . . . . . . . . . . . 1,224 6.3 4 rooms . . . . . . . . . . . . . . . . . . . . . . . . . . . . . . . . . . . . . 3,047 15.7 5 rooms . . . . . . . . . . . . . . . . . . . . . . . . . . . . . . . . . . . . . 4,052 20.9 6 rooms . . . . . . . . . . . . . . . . . . . . . . . . . . . . . . . . . . . . . 4,235 21.8 7 rooms . . . . . . . . . . . . . . . . . . . . . . . . . . . . . . . . . . . . . 2,792 14.4 8 rooms . . . . . . . . . . . . . . . . . . . . . . . . . . . . . . . . . . . . . 1,689 8.7 9 or more rooms . . . . . . . . . . . . . . . . . . . . . . . . . . . . . 1,314 6.8 Median (rooms) . . . . . . . . . . . . . . . . . . . . . . . . . . . . . . 5.6 (X) Occupied housing units . . . . . . . . . . . . . . . 16,052 100.0 YEAR HOUSEHOLDER MOVED INTO UNIT 1999 to March 2000 . . . . . . . . . . . . . . . . . . . . . . . . . . 2,613 16.3 1995 to 1998 . . . . . . . . . . . . . . . . . . . . . . . . . . . . . . . . 3,413 21.3 1990 to 1994 . . . . . . . . . . . . . . . . . . . . . . . . . . . . . . . . 2,110 13.1 1980 to 1989 . . . . . . . . . . . . . . . . . . . . . . . . . . . . . . . . 2,750 17.1 1970 to 1979 . . . . . . . . . . . . . . . . . . . . . . . . . . . . . . . . 2,146 13.4 1969 or earlier . . . . . . . . . . . . . . . . . . . . . . . . . . . . . . . 3,020 18.8 VEHICLES AVAILABLE None . . . . . . . . . . . . . . . . . . . . . . . . . . . . . . . . . . . . . . . 1,171 7.3 1 . . . . . . . . . . . . . . . . . . . . . . . . . . . . . . . . . . . . . . . . . . . 5,466 34.1 2 . . . . . . . . . . . . . . . . . . . . . . . . . . . . . . . . . . . . . . . . . . . 6,759 42.1 3 or more . . . . . . . . . . . . . . . . . . . . . . . . . . . . . . . . . . . 2,656 16.5 HOUSE HEATING FUEL Utility gas . . . . . . . . . . . . . . . . . . . . . . . . . . . . . . . . . . . 12,223 76.1 Bottled, tank, or LP gas . . . . . . . . . . . . . . . . . . . . . . . 693 4.3 Electricity. . . . . . . . . . . . . . . . . . . . . . . . . . . . . . . . . . . . 1,020 6.4 Fuel oil, kerosene, etc . . . . . . . . . . . . . . . . . . . . . . . . 1,299 8.1 Coal or coke. . . . . . . . . . . . . . . . . . . . . . . . . . . . . . . . . 117 0.7 Wood . . . . . . . . . . . . . . . . . . . . . . . . . . . . . . . . . . . . . . . 541 3.4 Solar energy. . . . . . . . . . . . . . . . . . . . . . . . . . . . . . . . . 3 - Other fuel . . . . . . . . . . . . . . . . . . . . . . . . . . . . . . . . . . . 130 0.8 No fuel used. . . . . . . . . . . . . . . . . . . . . . . . . . . . . . . . . 26 0.2 SELECTED CHARACTERISTICS Lacking complete plumbing facilities . . . . . . . . . . . . 229 1.4 Lacking complete kitchen facilities . . . . . . . . . . . . . . 213 1.3 No telephone service . . . . . . . . . . . . . . . . . . . . . . . . . 378 2.4 Subject Number Percent OCCUPANTS PER ROOM Occupied housing units . . . . . . . . . . . . . . . 16,052 100.0 1.00 or less. . . . . . . . . . . . . . . . . . . . . . . . . . . . . . . . . . 15,820 98.6 1.01 to 1.50 . . . . . . . . . . . . . . . . . . . . . . . . . . . . . . . . . 182 1.1 1.51 or more. . . . . . . . . . . . . . . . . . . . . . . . . . . . . . . . . 50 0.3 Specified owner-occupied units . . . . . . . . 7,833 100.0 VALUE
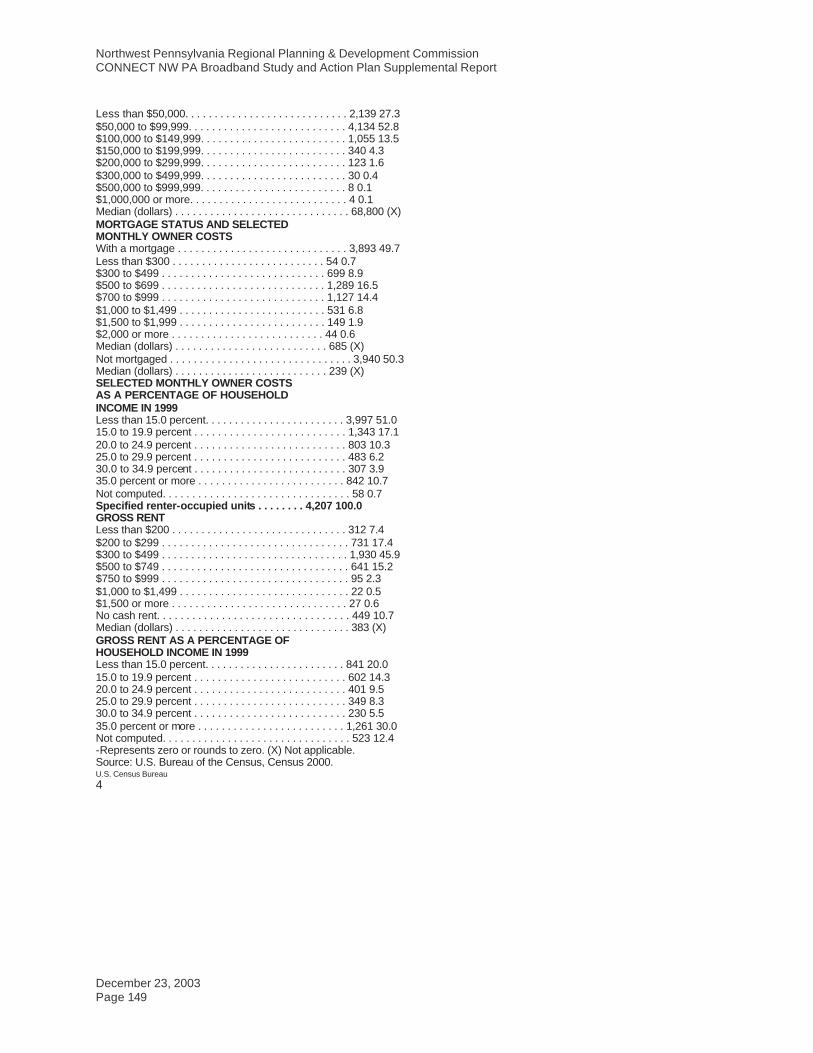
Northwest Pennsylvania Regional Planning & Development Commission CONNECT NW PA Broadband Study and Action Plan Supplemental Report
December 23, 2003 Page 149
Less than $50,000. . . . . . . . . . . . . . . . . . . . . . . . . . . . 2,139 27.3 $50,000 to $99,999. . . . . . . . . . . . . . . . . . . . . . . . . . . 4,134 52.8 $100,000 to $149,999. . . . . . . . . . . . . . . . . . . . . . . . . 1,055 13.5 $150,000 to $199,999. . . . . . . . . . . . . . . . . . . . . . . . . 340 4.3 $200,000 to $299,999. . . . . . . . . . . . . . . . . . . . . . . . . 123 1.6 $300,000 to $499,999. . . . . . . . . . . . . . . . . . . . . . . . . 30 0.4 $500,000 to $999,999. . . . . . . . . . . . . . . . . . . . . . . . . 8 0.1 $1,000,000 or more. . . . . . . . . . . . . . . . . . . . . . . . . . . 4 0.1 Median (dollars) . . . . . . . . . . . . . . . . . . . . . . . . . . . . . . 68,800 (X) MORTGAGE STATUS AND SELECTED MONTHLY OWNER COSTS With a mortgage . . . . . . . . . . . . . . . . . . . . . . . . . . . . . 3,893 49.7 Less than $300 . . . . . . . . . . . . . . . . . . . . . . . . . . 54 0.7 $300 to $499 . . . . . . . . . . . . . . . . . . . . . . . . . . . . 699 8.9 $500 to $699 . . . . . . . . . . . . . . . . . . . . . . . . . . . . 1,289 16.5 $700 to $999 . . . . . . . . . . . . . . . . . . . . . . . . . . . . 1,127 14.4 $1,000 to $1,499 . . . . . . . . . . . . . . . . . . . . . . . . . 531 6.8 $1,500 to $1,999 . . . . . . . . . . . . . . . . . . . . . . . . . 149 1.9 $2,000 or more . . . . . . . . . . . . . . . . . . . . . . . . . . 44 0.6 Median (dollars) . . . . . . . . . . . . . . . . . . . . . . . . . . 685 (X) Not mortgaged . . . . . . . . . . . . . . . . . . . . . . . . . . . . . . . 3,940 50.3 Median (dollars) . . . . . . . . . . . . . . . . . . . . . . . . . . 239 (X) SELECTED MONTHLY OWNER COSTS AS A PERCENTAGE OF HOUSEHOLD INCOME IN 1999 Less than 15.0 percent. . . . . . . . . . . . . . . . . . . . . . . . 3,997 51.0 15.0 to 19.9 percent . . . . . . . . . . . . . . . . . . . . . . . . . . 1,343 17.1 20.0 to 24.9 percent . . . . . . . . . . . . . . . . . . . . . . . . . . 803 10.3 25.0 to 29.9 percent . . . . . . . . . . . . . . . . . . . . . . . . . . 483 6.2 30.0 to 34.9 percent . . . . . . . . . . . . . . . . . . . . . . . . . . 307 3.9 35.0 percent or more . . . . . . . . . . . . . . . . . . . . . . . . . 842 10.7 Not computed. . . . . . . . . . . . . . . . . . . . . . . . . . . . . . . . 58 0.7 Specified renter-occupied units . . . . . . . . 4,207 100.0 GROSS RENT Less than $200 . . . . . . . . . . . . . . . . . . . . . . . . . . . . . . 312 7.4 $200 to $299 . . . . . . . . . . . . . . . . . . . . . . . . . . . . . . . . 731 17.4 $300 to $499 . . . . . . . . . . . . . . . . . . . . . . . . . . . . . . . . 1,930 45.9 $500 to $749 . . . . . . . . . . . . . . . . . . . . . . . . . . . . . . . . 641 15.2 $750 to $999 . . . . . . . . . . . . . . . . . . . . . . . . . . . . . . . . 95 2.3 $1,000 to $1,499 . . . . . . . . . . . . . . . . . . . . . . . . . . . . . 22 0.5 $1,500 or more . . . . . . . . . . . . . . . . . . . . . . . . . . . . . . 27 0.6 No cash rent. . . . . . . . . . . . . . . . . . . . . . . . . . . . . . . . . 449 10.7 Median (dollars) . . . . . . . . . . . . . . . . . . . . . . . . . . . . . . 383 (X) GROSS RENT AS A PERCENTAGE OF HOUSEHOLD INCOME IN 1999 Less than 15.0 percent. . . . . . . . . . . . . . . . . . . . . . . . 841 20.0 15.0 to 19.9 percent . . . . . . . . . . . . . . . . . . . . . . . . . . 602 14.3 20.0 to 24.9 percent . . . . . . . . . . . . . . . . . . . . . . . . . . 401 9.5 25.0 to 29.9 percent . . . . . . . . . . . . . . . . . . . . . . . . . . 349 8.3 30.0 to 34.9 percent . . . . . . . . . . . . . . . . . . . . . . . . . . 230 5.5 35.0 percent or more . . . . . . . . . . . . . . . . . . . . . . . . . 1,261 30.0 Not computed. . . . . . . . . . . . . . . . . . . . . . . . . . . . . . . . 523 12.4 -Represents zero or rounds to zero. (X) Not applicable. Source: U.S. Bureau of the Census, Census 2000. U.S. Census Bureau 4

Northwest Pennsylvania Regional Planning & Development Commission CONNECT NW PA Broadband Study and Action Plan Supplemental Report
December 23, 2003 Page 150
Crawford County
Table DP-1. Profile of General Demographic Characteristics: 2000 Geographic area: Crawford County, Pennsylvania [For information on confidentiality protection, nonsampling error, and definitions, see text] Subject Number Percent Total population. . . . . . . . . . . . . . . . . . . . . . . . . . 90,366 100.0 SEX AND AGE Male . . . . . . . . . . . . . . . . . . . . . . . . . . . . . . . . . . . . . . . . 43,968 48.7 Female. . . . . . . . . . . . . . . . . . . . . . . . . . . . . . . . . . . . . . 46,398 51.3 Under 5 years . . . . . . . . . . . . . . . . . . . . . . . . . . . . . . . 5,366 5.9 5 to 9 years . . . . . . . . . . . . . . . . . . . . . . . . . . . . . . . . . 6,205 6.9 10 to 14 years . . . . . . . . . . . . . . . . . . . . . . . . . . . . . . . 6,570 7.3 15 to 19 years . . . . . . . . . . . . . . . . . . . . . . . . . . . . . . . 7,123 7.9 20 to 24 years . . . . . . . . . . . . . . . . . . . . . . . . . . . . . . . 5,399 6.0 25 to 34 years . . . . . . . . . . . . . . . . . . . . . . . . . . . . . . . 10,637 11.8 35 to 44 years . . . . . . . . . . . . . . . . . . . . . . . . . . . . . . . 13,406 14.8 45 to 54 years . . . . . . . . . . . . . . . . . . . . . . . . . . . . . . . 12,744 14.1 55 to 59 years . . . . . . . . . . . . . . . . . . . . . . . . . . . . . . . 4,897 5.4 60 to 64 years . . . . . . . . . . . . . . . . . . . . . . . . . . . . . . . 3,967 4.4 65 to 74 years . . . . . . . . . . . . . . . . . . . . . . . . . . . . . . . 7,170 7.9 75 to 84 years . . . . . . . . . . . . . . . . . . . . . . . . . . . . . . . 5,097 5.6 85 years and over . . . . . . . . . . . . . . . . . . . . . . . . . . . . 1,785 2.0 Median age (years) . . . . . . . . . . . . . . . . . . . . . . . . . . . 38.1 (X) 18 years and over . . . . . . . . . . . . . . . . . . . . . . . . . . . . 68,046 75.3 Male . . . . . . . . . . . . . . . . . . . . . . . . . . . . . . . . . . . . . . 32,379 35.8 Female. . . . . . . . . . . . . . . . . . . . . . . . . . . . . . . . . . . . 35,667 39.5 21 years and over . . . . . . . . . . . . . . . . . . . . . . . . . . . . 63,758 70.6 62 years and over . . . . . . . . . . . . . . . . . . . . . . . . . . . . 16,366 18.1 65 years and over . . . . . . . . . . . . . . . . . . . . . . . . . . . . 14,052 15.6 Male . . . . . . . . . . . . . . . . . . . . . . . . . . . . . . . . . . . . . . 5,898 6.5 Female. . . . . . . . . . . . . . . . . . . . . . . . . . . . . . . . . . . . 8,154 9.0 RACE One race . . . . . . . . . . . . . . . . . . . . . . . . . . . . . . . . . . . . 89,668 99.2 White . . . . . . . . . . . . . . . . . . . . . . . . . . . . . . . . . . . . . 87,653 97.0 Black or African American . . . . . . . . . . . . . . . . . . . 1,437 1.6 American Indian and Alaska Native . . . . . . . . . . . 184 0.2 Asian . . . . . . . . . . . . . . . . . . . . . . . . . . . . . . . . . . . . . 254 0.3 Asian Indian . . . . . . . . . . . . . . . . . . . . . . . . . . . . . 37 - Chinese . . . . . . . . . . . . . . . . . . . . . . . . . . . . . . . . . 49 0.1 Filipino . . . . . . . . . . . . . . . . . . . . . . . . . . . . . . . . . . 58 0.1 Japanese. . . . . . . . . . . . . . . . . . . . . . . . . . . . . . . . 24 - Korean. . . . . . . . . . . . . . . . . . . . . . . . . . . . . . . . . . 44 - Vietnamese. . . . . . . . . . . . . . . . . . . . . . . . . . . . . . 18 - Other Asian 1 . . . . . . . . . . . . . . . . . . . . . . . . . . . . 24 - Native Hawaiian and Other Pacific Islander. . . . 23 - Native Hawaiian. . . . . . . . . . . . . . . . . . . . . . . . . . 7 - Guamanian or Chamorro . . . . . . . . . . . . . . . . . . 1 - Samoan. . . . . . . . . . . . . . . . . . . . . . . . . . . . . . . . . 2 - Other Pacific Islander 2 . . . . . . . . . . . . . . . . . . . 13 - Some other race . . . . . . . . . . . . . . . . . . . . . . . . . . . 117 0.1 Two or more races . . . . . . . . . . . . . . . . . . . . . . . . . . . 698 0.8 Race alone or in combination with one or more other races: 3
White . . . . . . . . . . . . . . . . . . . . . . . . . . . . . . . . . . . . . . . 88,309 97.7 Black or African American . . . . . . . . . . . . . . . . . . . . . 1,711 1.9 American Indian and Alaska Native . . . . . . . . . . . . . 448 0.5 Asian . . . . . . . . . . . . . . . . . . . . . . . . . . . . . . . . . . . . . . . 369 0.4 Native Hawaiian and Other Pacific Islander. . . . . . 42 - Some other race . . . . . . . . . . . . . . . . . . . . . . . . . . . . . 232 0.3 Subject Number Percent HISPANIC OR LATINO AND RACE Total population. . . . . . . . . . . . . . . . . . . . . . . . . . 90,366 100.0 Hispanic or Latino (of any race) . . . . . . . . . . . . . . . . 537 0.6 Mexican. . . . . . . . . . . . . . . . . . . . . . . . . . . . . . . . . . . 147 0.2 Puerto Rican. . . . . . . . . . . . . . . . . . . . . . . . . . . . . . . 167 0.2 Cuban . . . . . . . . . . . . . . . . . . . . . . . . . . . . . . . . . . . . 15 - Other Hispanic or Latino . . . . . . . . . . . . . . . . . . . . 208 0.2

Northwest Pennsylvania Regional Planning & Development Commission CONNECT NW PA Broadband Study and Action Plan Supplemental Report
December 23, 2003 Page 151
Not Hispanic or Latino . . . . . . . . . . . . . . . . . . . . . . . . 89,829 99.4 White alone. . . . . . . . . . . . . . . . . . . . . . . . . . . . . . . . 87,263 96.6 RELATIONSHIP Total population. . . . . . . . . . . . . . . . . . . . . . . . . . 90,366 100.0 In households. . . . . . . . . . . . . . . . . . . . . . . . . . . . . . . . 86,664 95.9 Householder . . . . . . . . . . . . . . . . . . . . . . . . . . . . . . . 34,678 38.4 Spouse . . . . . . . . . . . . . . . . . . . . . . . . . . . . . . . . . . . 19,270 21.3 Child. . . . . . . . . . . . . . . . . . . . . . . . . . . . . . . . . . . . . . 25,918 28.7 Own child under 18 years . . . . . . . . . . . . . . . . 20,489 22.7 Other relatives . . . . . . . . . . . . . . . . . . . . . . . . . . . . . 2,732 3.0 Under 18 years . . . . . . . . . . . . . . . . . . . . . . . . . 1,096 1.2 Nonrelatives . . . . . . . . . . . . . . . . . . . . . . . . . . . . . . . 4,066 4.5 Unmarried partner . . . . . . . . . . . . . . . . . . . . . . . 1,909 2.1 In group quarters . . . . . . . . . . . . . . . . . . . . . . . . . . . . . 3,702 4.1 Institutionalized population. . . . . . . . . . . . . . . . . . . 1,917 2.1 Noninstitutionalized population . . . . . . . . . . . . . . . 1,785 2.0 HOUSEHOLD BY TYPE Total households. . . . . . . . . . . . . . . . . . . . . . . . . 34,678 100.0 Family households (families). . . . . . . . . . . . . . . . . . . 23,871 68.8 With own children under 18 years . . . . . . . . . . 10,559 30.4 Married-couple family . . . . . . . . . . . . . . . . . . . . . . . 19,270 55.6 With own children under 18 years . . . . . . . . . . 7,867 22.7 Female householder, no husband present . . . . . 3,177 9.2 With own children under 18 years . . . . . . . . . . 1,878 5.4 Nonfamily households . . . . . . . . . . . . . . . . . . . . . . . . 10,807 31.2 Householder living alone . . . . . . . . . . . . . . . . . . . . 9,071 26.2 Householder 65 years and over . . . . . . . . . . . . 4,025 11.6 Households with individuals under 18 years . . . . . 11,396 32.9 Households with individuals 65 years and over . . 9,580 27.6 Average household size. . . . . . . . . . . . . . . . . . . . . . . 2.50 (X) Average family size. . . . . . . . . . . . . . . . . . . . . . . . . . . 3.01 (X) HOUSING OCCUPANCY Total housing units. . . . . . . . . . . . . . . . . . . . . . . 42,416 100.0 Occupied housing units . . . . . . . . . . . . . . . . . . . . . . . 34,678 81.8 Vacant housing units. . . . . . . . . . . . . . . . . . . . . . . . . . 7,738 18.2 For seasonal, recreational, or occasional use. . . . . . . . . . . . . . . . . . . . . . . . . . . . 4,964 11.7 Homeowner vacancy rate (percent). . . . . . . . . . . . . 2.0 (X) Rental vacancy rate (percent). . . . . . . . . . . . . . . . . . 8.3 (X) HOUSING TENURE Occupied housing units . . . . . . . . . . . . . . . . . . 34,678 100.0 Owner-occupied housing units . . . . . . . . . . . . . . . . . 26,190 75.5 Renter-occupied housing units . . . . . . . . . . . . . . . . . 8,488 24.5 Average household size of owner-occupied units. 2.61 (X) Average household size of renter-occupied units . 2.17 (X) - Represents zero or rounds to zero. (X) Not applicable. 1 Other Asian alone, or two or more Asian categories. 2 Other Pacific Islander alone, or two or more Native Hawaiian and Other Pacific Islander categories. 3 In combination with one or more of the other races listed. The six numbers may add to more than the total population and the six percentages may add to more than 100 percent because individuals may report more than one race. Source: U.S. Census Bureau, Census 2000. U.S. Census Bureau 1

Northwest Pennsylvania Regional Planning & Development Commission CONNECT NW PA Broadband Study and Action Plan Supplemental Report
December 23, 2003 Page 152
Table DP-2. Profile of Selected Social Characteristics: 2000 Geographic area: Crawford County, Pennsylvania [Data based on a sample. For information on confidentiality protection, sampling error, nonsampling error, and definitions, see text] Subject Number Percent SCHOOL ENROLLMENT Population 3 years and over enrolled in school. . . . . . . . . . . . . . . . . . . . 22,134 100.0 Nursery school, preschool . . . . . . . . . . . . . . . . . . . . . 1,176 5.3 Kindergarten. . . . . . . . . . . . . . . . . . . . . . . . . . . . . . . . . 1,055 4.8 Elementary school (grades 1-8) . . . . . . . . . . . . . . . . 10,483 47.4 High school (grades 9-12) . . . . . . . . . . . . . . . . . . . . . 5,379 24.3 College or graduate school . . . . . . . . . . . . . . . . . . . . 4,041 18.3 EDUCATIONAL ATTAINMENT Population 25 years and over . . . . . . . . . . 59,684 100.0 Less than 9th grade . . . . . . . . . . . . . . . . . . . . . . . . . . 3,574 6.0 9th to 12th grade, no diploma. . . . . . . . . . . . . . . . . . 7,435 12.5 High school graduate (includes equivalency). . . . . 28,758 48.2 Some college, no degree. . . . . . . . . . . . . . . . . . . . . . 8,494 14.2 Associate degree. . . . . . . . . . . . . . . . . . . . . . . . . . . . . 2,650 4.4 Bachelor’s degree . . . . . . . . . . . . . . . . . . . . . . . . . . . . 5,657 9.5 Graduate or professional degree . . . . . . . . . . . . . . . 3,116 5.2 Percent high school graduate or higher . . . . . . . . . 81.6 (X) Percent bachelor’s degree or higher . . . . . . . . . . . . 14.7 (X) MARITAL STATUS Population 15 years and over . . . . . . . . . . 72,230 100.0 Never married . . . . . . . . . . . . . . . . . . . . . . . . . . . . . . . 16,975 23.5 Now married, except separated . . . . . . . . . . . . . . . . 41,337 57.2 Separated . . . . . . . . . . . . . . . . . . . . . . . . . . . . . . . . . . . 1,759 2.4 Widowed . . . . . . . . . . . . . . . . . . . . . . . . . . . . . . . . . . . . 5,763 8.0 Female. . . . . . . . . . . . . . . . . . . . . . . . . . . . . . . . . . . . 4,582 6.3 Divorced . . . . . . . . . . . . . . . . . . . . . . . . . . . . . . . . . . . . 6,396 8.9 Female. . . . . . . . . . . . . . . . . . . . . . . . . . . . . . . . . . . . 3,466 4.8 GRANDPARENTS AS CAREGIVERS Grandparent living in household with one or more own grandchildren under 18 years . . . . . . . . . . . . . . . . . . . . . . . . . . . . . 1,216 100.0 Grandparent responsible for grandchildren . . . . . . 483 39.7 VETERAN STATUS Civilian population 18 years and over . . 68,045 100.0 Civilian veterans . . . . . . . . . . . . . . . . . . . . . . . . . . . . . 10,589 15.6 DISABILITY STATUS OF THE CIVILIAN NONINSTITUTIONALIZED POPULATION Population 5 to 20 years. . . . . . . . . . . . . . . 21,151 100.0 With a disability . . . . . . . . . . . . . . . . . . . . . . . . . . . . . . 1,704 8.1 Population 21 to 64 years. . . . . . . . . . . . . . 48,837 100.0 With a disability . . . . . . . . . . . . . . . . . . . . . . . . . . . . . . 8,997 18.4 Percent employed . . . . . . . . . . . . . . . . . . . . . . . . . . 48.2 (X) No disability . . . . . . . . . . . . . . . . . . . . . . . . . . . . . . . . . 39,840 81.6 Percent employed . . . . . . . . . . . . . . . . . . . . . . . . . . 77.7 (X) Population 65 years and over . . . . . . . . . . 13,057 100.0 With a disability . . . . . . . . . . . . . . . . . . . . . . . . . . . . . . 5,276 40.4 RESIDENCE IN 1995 Population 5 years and over . . . . . . . . . . . 85,025 100.0 Same house in 1995. . . . . . . . . . . . . . . . . . . . . . . . . . 53,444 62.9 Different house in the U.S. in 1995 . . . . . . . . . . . . . 31,294 36.8 Same county . . . . . . . . . . . . . . . . . . . . . . . . . . . . . . 18,477 21.7 Different county . . . . . . . . . . . . . . . . . . . . . . . . . . . . 12,817 15.1 Same state . . . . . . . . . . . . . . . . . . . . . . . . . . . . . . 7,911 9.3 Different state. . . . . . . . . . . . . . . . . . . . . . . . . . . . 4,906 5.8 Elsewhere in 1995. . . . . . . . . . . . . . . . . . . . . . . . . . . . 287 0.3 Subject Number Percent NATIVITY AND PLACE OF BIRTH Total population. . . . . . . . . . . . . . . . . . . . . . . . . . 90,366 100.0 Native. . . . . . . . . . . . . . . . . . . . . . . . . . . . . . . . . . . . . . . 89,385 98.9 Born in United States . . . . . . . . . . . . . . . . . . . . . . . 89,045 98.5 State of residence . . . . . . . . . . . . . . . . . . . . . . . . 73,700 81.6 Different state. . . . . . . . . . . . . . . . . . . . . . . . . . . . 15,345 17.0 Born outside United States . . . . . . . . . . . . . . . . . . 340 0.4 Foreign born . . . . . . . . . . . . . . . . . . . . . . . . . . . . . . . . . 981 1.1

Northwest Pennsylvania Regional Planning & Development Commission CONNECT NW PA Broadband Study and Action Plan Supplemental Report
December 23, 2003 Page 153
Entered 1990 to March 2000 . . . . . . . . . . . . . . 250 0.3 Naturalized citizen . . . . . . . . . . . . . . . . . . . . . . . . . . 645 0.7 Not a citizen . . . . . . . . . . . . . . . . . . . . . . . . . . . . . . . 336 0.4 REGION OF BIRTH OF FOREIGN BORN Total (excluding born at sea). . . . . . . . . . . . . . 981 100.0 Europe. . . . . . . . . . . . . . . . . . . . . . . . . . . . . . . . . . . . . . 541 55.1 Asia . . . . . . . . . . . . . . . . . . . . . . . . . . . . . . . . . . . . . . . . 232 23.6 Africa . . . . . . . . . . . . . . . . . . . . . . . . . . . . . . . . . . . . . . . 20 2.0 Oceania. . . . . . . . . . . . . . . . . . . . . . . . . . . . . . . . . . . . . 4 0.4 Latin America . . . . . . . . . . . . . . . . . . . . . . . . . . . . . . . . 94 9.6 Northern America. . . . . . . . . . . . . . . . . . . . . . . . . . . . . 90 9.2 LANGUAGE SPOKEN AT HOME Population 5 years and over . . . . . . . . . . . . . . 85,025 100.0 English only . . . . . . . . . . . . . . . . . . . . . . . . . . . . . . . . . 80,421 94.6 Language other than English . . . . . . . . . . . . . . . . . . 4,604 5.4 Speak English less than ��very well�� . . . . . . . . 1,800 2.1 Spanish . . . . . . . . . . . . . . . . . . . . . . . . . . . . . . . . . . . 664 0.8 Speak English less than ��very well�� . . . . . . . . 275 0.3 Other Indo-European languages . . . . . . . . . . . . . 3,680 4.3 Speak English less than ��very well�� . . . . . . . . 1,473 1.7 Asian and Pacific Island languages. . . . . . . . . . . 184 0.2 Speak English less than ��very well�� . . . . . . . . 37 - ANCESTRY (single or multiple) Total population. . . . . . . . . . . . . . . . . . . . . . . . . . 90,366 100.0 Total ancestries reported . . . . . . . . . . . . . . . . . . . 94,373 104.4 Arab . . . . . . . . . . . . . . . . . . . . . . . . . . . . . . . . . . . . . . . . 134 0.1 Czech1. . . . . . . . . . . . . . . . . . . . . . . . . . . . . . . . . . . . . . 694 0.8 Danish . . . . . . . . . . . . . . . . . . . . . . . . . . . . . . . . . . . . . . 202 0.2 Dutch . . . . . . . . . . . . . . . . . . . . . . . . . . . . . . . . . . . . . . . 2,366 2.6 English. . . . . . . . . . . . . . . . . . . . . . . . . . . . . . . . . . . . . . 10,769 11.9 French (except Basque)1 . . . . . . . . . . . . . . . . . . . . . . 3,291 3.6 French Canadian1 . . . . . . . . . . . . . . . . . . . . . . . . . . . . 280 0.3 German . . . . . . . . . . . . . . . . . . . . . . . . . . . . . . . . . . . . . 24,965 27.6 Greek. . . . . . . . . . . . . . . . . . . . . . . . . . . . . . . . . . . . . . . 180 0.2 Hungarian . . . . . . . . . . . . . . . . . . . . . . . . . . . . . . . . . . . 817 0.9 Irish1. . . . . . . . . . . . . . . . . . . . . . . . . . . . . . . . . . . . . . . . 13,077 14.5 Italian . . . . . . . . . . . . . . . . . . . . . . . . . . . . . . . . . . . . . . . 6,030 6.7 Lithuanian . . . . . . . . . . . . . . . . . . . . . . . . . . . . . . . . . . . 135 0.1 Norwegian. . . . . . . . . . . . . . . . . . . . . . . . . . . . . . . . . . . 344 0.4 Polish . . . . . . . . . . . . . . . . . . . . . . . . . . . . . . . . . . . . . . . 5,075 5.6 Portuguese . . . . . . . . . . . . . . . . . . . . . . . . . . . . . . . . . . 82 0.1 Russian . . . . . . . . . . . . . . . . . . . . . . . . . . . . . . . . . . . . . 387 0.4 Scotch-Irish. . . . . . . . . . . . . . . . . . . . . . . . . . . . . . . . . . 2,879 3.2 Scottish . . . . . . . . . . . . . . . . . . . . . . . . . . . . . . . . . . . . . 1,884 2.1 Slovak . . . . . . . . . . . . . . . . . . . . . . . . . . . . . . . . . . . . . . 909 1.0 Subsaharan African. . . . . . . . . . . . . . . . . . . . . . . . . . . 87 0.1 Swedish. . . . . . . . . . . . . . . . . . . . . . . . . . . . . . . . . . . . . 1,842 2.0 Swiss . . . . . . . . . . . . . . . . . . . . . . . . . . . . . . . . . . . . . . . 612 0.7 Ukrainian . . . . . . . . . . . . . . . . . . . . . . . . . . . . . . . . . . . . 433 0.5 United States or American. . . . . . . . . . . . . . . . . . . . . 7,665 8.5 Welsh. . . . . . . . . . . . . . . . . . . . . . . . . . . . . . . . . . . . . . . 1,080 1.2 West Indian (excluding Hispanic groups) . . . . . . . . 8 - Other ancestries . . . . . . . . . . . . . . . . . . . . . . . . . . . . . 8,146 9.0 -Represents zero or rounds to zero. (X) Not applicable. 1The data represent a combination of two ancestries shown separately in Summary File 3. Czech includes Czechoslovakian. French includes Alsatian. French Canadian includes Acadian/Cajun. Irish includes Celtic. Source: U.S. Bureau of the Census, Census 2000. U.S. Census Bureau 2

Northwest Pennsylvania Regional Planning & Development Commission CONNECT NW PA Broadband Study and Action Plan Supplemental Report
December 23, 2003 Page 154
Table DP-3. Profile of Selected Economic Characteristics: 2000 Geographic area: Crawford County, Pennsylvania [Data based on a sample. For information on confidentiality protection, sampling error, nonsampling error, and definitions, see text] Subject Number Percent EMPLOYMENT STATUS Population 16 years and over . . . . . . . . . . . . 70,845 100.0 In labor force . . . . . . . . . . . . . . . . . . . . . . . . . . . . . . . . 42,044 59.3 Civilian labor force. . . . . . . . . . . . . . . . . . . . . . . . . . 42,016 59.3 Employed . . . . . . . . . . . . . . . . . . . . . . . . . . . . . . . 39,514 55.8 Unemployed . . . . . . . . . . . . . . . . . . . . . . . . . . . . . 2,502 3.5 Percent of civilian labor force . . . . . . . . . . . . 6.0 (X) Armed Forces. . . . . . . . . . . . . . . . . . . . . . . . . . . . . . 28 - Not in labor force. . . . . . . . . . . . . . . . . . . . . . . . . . . . . 28,801 40.7 Females 16 years and over . . . . . . . . . . . . . . 37,107 100.0 In labor force . . . . . . . . . . . . . . . . . . . . . . . . . . . . . . . . 19,217 51.8 Civilian labor force. . . . . . . . . . . . . . . . . . . . . . . . . . 19,214 51.8 Employed . . . . . . . . . . . . . . . . . . . . . . . . . . . . . . . 18,111 48.8 Own children under 6 years. . . . . . . . . . . . . . 6,291 100.0 All parents in family in labor force . . . . . . . . . . . . . . 3,470 55.2 COMMUTING TO WORK Workers 16 years and over . . . . . . . . . . . . . . 38,871 100.0 Car, truck, or van - - drove alone . . . . . . . . . . . . . . . 30,243 77.8 Car, truck, or van - - carpooled. . . . . . . . . . . . . . . . . 4,391 11.3 Public transportation (including taxicab) . . . . . . . . . 151 0.4 Walked. . . . . . . . . . . . . . . . . . . . . . . . . . . . . . . . . . . . . . 2,117 5.4 Other means. . . . . . . . . . . . . . . . . . . . . . . . . . . . . . . . . 315 0.8 Worked at home . . . . . . . . . . . . . . . . . . . . . . . . . . . . . 1,654 4.3 Mean travel time to work (minutes)1 . . . . . . . . . . . . 21.5 (X) Employed civilian population 16 years and over . . . . . . . . . . . . . . . . . . . . . 39,514 100.0 OCCUPATION Management, professional, and related occupations . . . . . . . . . . . . . . . . . . . . . . . . . . . . . . . . 10,438 26.4 Service occupations . . . . . . . . . . . . . . . . . . . . . . . . . . 6,189 15.7 Sales and office occupations . . . . . . . . . . . . . . . . . . 8,481 21.5 Farming, fishing, and forestry occupations. . . . . . . 548 1.4 Construction, extraction, and maintenance occupations . . . . . . . . . . . . . . . . . . . . . . . . . . . . . . . . 3,619 9.2 Production, transportation, and material moving occupations . . . . . . . . . . . . . . . . . . . . . . . . . . . . . . . . 10,239 25.9 INDUSTRY Agriculture, forestry, fishing and hunting, and mining . . . . . . . . . . . . . . . . . . . . . . . . . . . . . . . . . 1,386 3.5 Construction . . . . . . . . . . . . . . . . . . . . . . . . . . . . . . . . . 2,352 6.0 Manufacturing. . . . . . . . . . . . . . . . . . . . . . . . . . . . . . . . 10,384 26.3 Wholesale trade. . . . . . . . . . . . . . . . . . . . . . . . . . . . . . 864 2.2 Retail trade . . . . . . . . . . . . . . . . . . . . . . . . . . . . . . . . . . 4,373 11.1 Transportation and warehousing, and utilities . . . . 1,705 4.3 Information . . . . . . . . . . . . . . . . . . . . . . . . . . . . . . . . . . 612 1.5 Finance, insurance, real estate, and rental and leasing . . . . . . . . . . . . . . . . . . . . . . . . . . . . . . . . . . . . . 1,162 2.9 Professional, scientific, management, administrative, and waste management services . . . . . . . 1,793 4.5 Educational, health and social services . . . . . . . . . 8,351 21.1 Arts, entertainment, recreation, accommodation and food services . . . . . . . . . . . . . . . . . . . . . . . . . . . 2,832 7.2 Other services (except public administration) . . . . 2,124 5.4 Public administration. . . . . . . . . . . . . . . . . . . . . . . . . . 1,576 4.0 CLASS OF WORKER Private wage and salary workers . . . . . . . . . . . . . . . 30,924 78.3 Government workers. . . . . . . . . . . . . . . . . . . . . . . . . . 4,603 11.6 Self-employed workers in own not incorporated business . . . . . . . . . . . . . . . . . . . . . . . . . . . . . . . . . . . 3,785 9.6 Unpaid family workers . . . . . . . . . . . . . . . . . . . . . . . . 202 0.5 Subject Number Percent INCOME IN 1999 Households. . . . . . . . . . . . . . . . . . . . . . . . . . . . . 34,695 100.0 Less than $10,000. . . . . . . . . . . . . . . . . . . . . . . . . . . . 3,493 10.1 $10,000 to $14,999. . . . . . . . . . . . . . . . . . . . . . . . . . . 2,979 8.6

Northwest Pennsylvania Regional Planning & Development Commission CONNECT NW PA Broadband Study and Action Plan Supplemental Report
December 23, 2003 Page 155
$15,000 to $24,999. . . . . . . . . . . . . . . . . . . . . . . . . . . 6,051 17.4 $25,000 to $34,999. . . . . . . . . . . . . . . . . . . . . . . . . . . 5,517 15.9 $35,000 to $49,999. . . . . . . . . . . . . . . . . . . . . . . . . . . 6,339 18.3 $50,000 to $74,999. . . . . . . . . . . . . . . . . . . . . . . . . . . 6,053 17.4 $75,000 to $99,999. . . . . . . . . . . . . . . . . . . . . . . . . . . 2,363 6.8 $100,000 to $149,999. . . . . . . . . . . . . . . . . . . . . . . . . 1,309 3.8 $150,000 to $199,999. . . . . . . . . . . . . . . . . . . . . . . . . 287 0.8 $200,000 or more . . . . . . . . . . . . . . . . . . . . . . . . . . . . 304 0.9 Median household income (dollars) . . . . . . . . . . . . . 33,560 (X) With earnings . . . . . . . . . . . . . . . . . . . . . . . . . . . . . . . . 25,956 74.8 Mean earnings (dollars)1 . . . . . . . . . . . . . . . . . . . . 43,816 (X) With Social Security income . . . . . . . . . . . . . . . . . . . 11,296 32.6 Mean Social Security income (dollars)1 . . . . . . . 11,522 (X) With Supplemental Security Income . . . . . . . . . . . . 1,848 5.3 Mean Supplemental Security Income (dollars)1 . . . . . . . . . . . . . . . . . . . . . . . . . . . . . . . . . 6,562 (X) With public assistance income . . . . . . . . . . . . . . . . . 1,205 3.5 Mean public assistance income (dollars)1 . . . . . 2,432 (X) With retirement income . . . . . . . . . . . . . . . . . . . . . . . 6,608 19.0 Mean retirement income (dollars)1. . . . . . . . . . . . 13,394 (X) Families . . . . . . . . . . . . . . . . . . . . . . . . . . . . . . . . 23,960 100.0 Less than $10,000. . . . . . . . . . . . . . . . . . . . . . . . . . . . 1,281 5.3 $10,000 to $14,999. . . . . . . . . . . . . . . . . . . . . . . . . . . 1,147 4.8 $15,000 to $24,999. . . . . . . . . . . . . . . . . . . . . . . . . . . 3,576 14.9 $25,000 to $34,999. . . . . . . . . . . . . . . . . . . . . . . . . . . 3,949 16.5 $35,000 to $49,999. . . . . . . . . . . . . . . . . . . . . . . . . . . 5,014 20.9 $50,000 to $74,999. . . . . . . . . . . . . . . . . . . . . . . . . . . 5,232 21.8 $75,000 to $99,999. . . . . . . . . . . . . . . . . . . . . . . . . . . 2,117 8.8 $100,000 to $149,999. . . . . . . . . . . . . . . . . . . . . . . . . 1,140 4.8 $150,000 to $199,999. . . . . . . . . . . . . . . . . . . . . . . . . 276 1.2 $200,000 or more . . . . . . . . . . . . . . . . . . . . . . . . . . . . 228 1.0 Median family income (dollars) . . . . . . . . . . . . . . . . . 40,755 (X) Per capita income (dollars)1 . . . . . . . . . . . . . . . . . . . 16,870 (X) Median earnings (dollars): Male full-time, year-round workers. . . . . . . . . . . . . . 32,102 (X) Female full-time, year-round workers . . . . . . . . . . . 21,608 (X) Subject Number below poverty level Percent below poverty level POVERTY STATUS IN 1999 Families . . . . . . . . . . . . . . . . . . . . . . . . . . . . . . . . 2,083 8.7 With related children under 18 years. . . . . . . . . . . . 1,575 14.0 With related children under 5 years. . . . . . . . . . . 758 18.7 Families with female householder, no husband present . . . . . . . . . . . . . . . . . . . . . . . 854 28.2 With related children under 18 years. . . . . . . . . . . . 790 39.4 With related children under 5 years. . . . . . . . . . . 350 54.5 Individuals . . . . . . . . . . . . . . . . . . . . . . . . . . . . . . 11,024 12.8 18 years and over . . . . . . . . . . . . . . . . . . . . . . . . . . . . 7,035 10.9 65 years and over . . . . . . . . . . . . . . . . . . . . . . . . . . 1,118 8.6 Related children under 18 years . . . . . . . . . . . . . . . 3,806 17.7 Related children 5 to 17 years . . . . . . . . . . . . . . . 2,686 16.5 Unrelated individuals 15 years and over. . . . . . . . . 3,808 26.4 -Represents zero or rounds to zero. (X) Not applicable. 1If the denominator of a mean value or per capita value is less than 30, then that value is calculated using a rounded aggregate in the numerator. See text. Source: U.S. Bureau of the Census, Census 2000. U.S. Census Bureau
3

Northwest Pennsylvania Regional Planning & Development Commission CONNECT NW PA Broadband Study and Action Plan Supplemental Report
December 23, 2003 Page 156
Table DP-4. Profile of Selected Housing Characteristics: 2000 Geographic area: Crawford County, Pennsylvania [Data based on a sample. For information on confidentiality protection, sampling error, nonsampling error, and definitions, see text] Subject Number Percent Total housing units. . . . . . . . . . . . . . . . . . . . 42,416 100.0 UNITS IN STRUCTURE 1-unit, detached. . . . . . . . . . . . . . . . . . . . . . . . . . . . . . 29,404 69.3 1-unit, attached . . . . . . . . . . . . . . . . . . . . . . . . . . . . . . 486 1.1 2 units . . . . . . . . . . . . . . . . . . . . . . . . . . . . . . . . . . . . . . 2,242 5.3 3 or 4 units . . . . . . . . . . . . . . . . . . . . . . . . . . . . . . . . . . 1,230 2.9 5 to 9 units . . . . . . . . . . . . . . . . . . . . . . . . . . . . . . . . . . 990 2.3 10 to 19 units . . . . . . . . . . . . . . . . . . . . . . . . . . . . . . . . 526 1.2 20 or more units . . . . . . . . . . . . . . . . . . . . . . . . . . . . . 639 1.5 Mobile home. . . . . . . . . . . . . . . . . . . . . . . . . . . . . . . . . 6,769 16.0 Boat, RV, van, etc . . . . . . . . . . . . . . . . . . . . . . . . . . . . 130 0.3 YEAR STRUCTURE BUILT 1999 to March 2000 . . . . . . . . . . . . . . . . . . . . . . . . . . 582 1.4 1995 to 1998 . . . . . . . . . . . . . . . . . . . . . . . . . . . . . . . . 2,095 4.9 1990 to 1994 . . . . . . . . . . . . . . . . . . . . . . . . . . . . . . . . 1,988 4.7 1980 to 1989 . . . . . . . . . . . . . . . . . . . . . . . . . . . . . . . . 3,883 9.2 1970 to 1979 . . . . . . . . . . . . . . . . . . . . . . . . . . . . . . . . 7,616 18.0 1960 to 1969 . . . . . . . . . . . . . . . . . . . . . . . . . . . . . . . . 4,482 10.6 1940 to 1959 . . . . . . . . . . . . . . . . . . . . . . . . . . . . . . . . 8,289 19.5 1939 or earlier . . . . . . . . . . . . . . . . . . . . . . . . . . . . . . . 13,481 31.8 ROOMS 1 room . . . . . . . . . . . . . . . . . . . . . . . . . . . . . . . . . . . . . . 366 0.9 2 rooms . . . . . . . . . . . . . . . . . . . . . . . . . . . . . . . . . . . . . 673 1.6 3 rooms . . . . . . . . . . . . . . . . . . . . . . . . . . . . . . . . . . . . . 2,639 6.2 4 rooms . . . . . . . . . . . . . . . . . . . . . . . . . . . . . . . . . . . . . 6,924 16.3 5 rooms . . . . . . . . . . . . . . . . . . . . . . . . . . . . . . . . . . . . . 9,836 23.2 6 rooms . . . . . . . . . . . . . . . . . . . . . . . . . . . . . . . . . . . . . 8,871 20.9 7 rooms . . . . . . . . . . . . . . . . . . . . . . . . . . . . . . . . . . . . . 5,927 14.0 8 rooms . . . . . . . . . . . . . . . . . . . . . . . . . . . . . . . . . . . . . 3,725 8.8 9 or more rooms . . . . . . . . . . . . . . . . . . . . . . . . . . . . . 3,455 8.1 Median (rooms) . . . . . . . . . . . . . . . . . . . . . . . . . . . . . . 5.6 (X) Occupied housing units . . . . . . . . . . . . . . . 34,678 100.0 YEAR HOUSEHOLDER MOVED INTO UNIT 1999 to March 2000 . . . . . . . . . . . . . . . . . . . . . . . . . . 4,735 13.7 1995 to 1998 . . . . . . . . . . . . . . . . . . . . . . . . . . . . . . . . 8,387 24.2 1990 to 1994 . . . . . . . . . . . . . . . . . . . . . . . . . . . . . . . . 5,537 16.0 1980 to 1989 . . . . . . . . . . . . . . . . . . . . . . . . . . . . . . . . 6,086 17.6 1970 to 1979 . . . . . . . . . . . . . . . . . . . . . . . . . . . . . . . . 4,657 13.4 1969 or earlier . . . . . . . . . . . . . . . . . . . . . . . . . . . . . . . 5,276 15.2 VEHICLES AVAILABLE None . . . . . . . . . . . . . . . . . . . . . . . . . . . . . . . . . . . . . . . 3,187 9.2 1 . . . . . . . . . . . . . . . . . . . . . . . . . . . . . . . . . . . . . . . . . . . 12,319 35.5 2 . . . . . . . . . . . . . . . . . . . . . . . . . . . . . . . . . . . . . . . . . . . 13,695 39.5 3 or more . . . . . . . . . . . . . . . . . . . . . . . . . . . . . . . . . . . 5,477 15.8 HOUSE HEATING FUEL Utility gas . . . . . . . . . . . . . . . . . . . . . . . . . . . . . . . . . . . 17,717 51.1 Bottled, tank, or LP gas . . . . . . . . . . . . . . . . . . . . . . . 4,222 12.2 Electricity. . . . . . . . . . . . . . . . . . . . . . . . . . . . . . . . . . . . 2,492 7.2 Fuel oil, kerosene, etc . . . . . . . . . . . . . . . . . . . . . . . . 6,967 20.1 Coal or coke. . . . . . . . . . . . . . . . . . . . . . . . . . . . . . . . . 64 0.2 Wood . . . . . . . . . . . . . . . . . . . . . . . . . . . . . . . . . . . . . . . 2,843 8.2 Solar energy. . . . . . . . . . . . . . . . . . . . . . . . . . . . . . . . . - - Other fuel . . . . . . . . . . . . . . . . . . . . . . . . . . . . . . . . . . . 331 1.0 No fuel used. . . . . . . . . . . . . . . . . . . . . . . . . . . . . . . . . 42 0.1 SELECTED CHARACTERISTICS Lacking complete plumbing facilities . . . . . . . . . . . . 575 1.7 Lacking complete kitchen facilities . . . . . . . . . . . . . . 532 1.5 No telephone service . . . . . . . . . . . . . . . . . . . . . . . . . 1,104 3.2 Subject Number Percent OCCUPANTS PER ROOM Occupied housing units . . . . . . . . . . . . . . . 34,678 100.0 1.00 or less. . . . . . . . . . . . . . . . . . . . . . . . . . . . . . . . . . 34,044 98.2 1.01 to 1.50 . . . . . . . . . . . . . . . . . . . . . . . . . . . . . . . . . 478 1.4 1.51 or more. . . . . . . . . . . . . . . . . . . . . . . . . . . . . . . . . 156 0.4 Specified owner-occupied units . . . . . . . . 16,247 100.0

Northwest Pennsylvania Regional Planning & Development Commission CONNECT NW PA Broadband Study and Action Plan Supplemental Report
December 23, 2003 Page 157
VALUE Less than $50,000. . . . . . . . . . . . . . . . . . . . . . . . . . . . 3,726 22.9 $50,000 to $99,999. . . . . . . . . . . . . . . . . . . . . . . . . . . 8,814 54.3 $100,000 to $149,999. . . . . . . . . . . . . . . . . . . . . . . . . 2,503 15.4 $150,000 to $199,999. . . . . . . . . . . . . . . . . . . . . . . . . 661 4.1 $200,000 to $299,999. . . . . . . . . . . . . . . . . . . . . . . . . 382 2.4 $300,000 to $499,999. . . . . . . . . . . . . . . . . . . . . . . . . 114 0.7 $500,000 to $999,999. . . . . . . . . . . . . . . . . . . . . . . . . 24 0.1 $1,000,000 or more. . . . . . . . . . . . . . . . . . . . . . . . . . . 23 0.1 Median (dollars) . . . . . . . . . . . . . . . . . . . . . . . . . . . . . . 72,800 (X) MORTGAGE STATUS AND SELECTED MONTHLY OWNER COSTS With a mortgage . . . . . . . . . . . . . . . . . . . . . . . . . . . . . 9,556 58.8 Less than $300 . . . . . . . . . . . . . . . . . . . . . . . . . . 79 0.5 $300 to $499 . . . . . . . . . . . . . . . . . . . . . . . . . . . . 1,145 7.0 $500 to $699 . . . . . . . . . . . . . . . . . . . . . . . . . . . . 2,685 16.5 $700 to $999 . . . . . . . . . . . . . . . . . . . . . . . . . . . . 3,197 19.7 $1,000 to $1,499 . . . . . . . . . . . . . . . . . . . . . . . . . 1,819 11.2 $1,500 to $1,999 . . . . . . . . . . . . . . . . . . . . . . . . . 437 2.7 $2,000 or more . . . . . . . . . . . . . . . . . . . . . . . . . . 194 1.2 Median (dollars) . . . . . . . . . . . . . . . . . . . . . . . . . . 771 (X) Not mortgaged . . . . . . . . . . . . . . . . . . . . . . . . . . . . . . . 6,691 41.2 Median (dollars) . . . . . . . . . . . . . . . . . . . . . . . . . . 283 (X) SELECTED MONTHLY OWNER COSTS AS A PERCENTAGE OF HOUSEHOLD INCOME IN 1999 Less than 15.0 percent. . . . . . . . . . . . . . . . . . . . . . . . 6,930 42.7 15.0 to 19.9 percent . . . . . . . . . . . . . . . . . . . . . . . . . . 3,030 18.6 20.0 to 24.9 percent . . . . . . . . . . . . . . . . . . . . . . . . . . 2,123 13.1 25.0 to 29.9 percent . . . . . . . . . . . . . . . . . . . . . . . . . . 1,188 7.3 30.0 to 34.9 percent . . . . . . . . . . . . . . . . . . . . . . . . . . 841 5.2 35.0 percent or more . . . . . . . . . . . . . . . . . . . . . . . . . 2,002 12.3 Not computed. . . . . . . . . . . . . . . . . . . . . . . . . . . . . . . . 133 0.8 Specified renter-occupied units . . . . . . . . 8,100 100.0 GROSS RENT Less than $200 . . . . . . . . . . . . . . . . . . . . . . . . . . . . . . 707 8.7 $200 to $299 . . . . . . . . . . . . . . . . . . . . . . . . . . . . . . . . 985 12.2 $300 to $499 . . . . . . . . . . . . . . . . . . . . . . . . . . . . . . . . 3,585 44.3 $500 to $749 . . . . . . . . . . . . . . . . . . . . . . . . . . . . . . . . 1,704 21.0 $750 to $999 . . . . . . . . . . . . . . . . . . . . . . . . . . . . . . . . 310 3.8 $1,000 to $1,499 . . . . . . . . . . . . . . . . . . . . . . . . . . . . . 52 0.6 $1,500 or more . . . . . . . . . . . . . . . . . . . . . . . . . . . . . . 26 0.3 No cash rent. . . . . . . . . . . . . . . . . . . . . . . . . . . . . . . . . 731 9.0 Median (dollars) . . . . . . . . . . . . . . . . . . . . . . . . . . . . . . 406 (X) GROSS RENT AS A PERCENTAGE OF HOUSEHOLD INCOME IN 1999 Less than 15.0 percent. . . . . . . . . . . . . . . . . . . . . . . . 1,844 22.8 15.0 to 19.9 percent . . . . . . . . . . . . . . . . . . . . . . . . . . 1,113 13.7 20.0 to 24.9 percent . . . . . . . . . . . . . . . . . . . . . . . . . . 837 10.3 25.0 to 29.9 percent . . . . . . . . . . . . . . . . . . . . . . . . . . 744 9.2 30.0 to 34.9 percent . . . . . . . . . . . . . . . . . . . . . . . . . . 619 7.6 35.0 percent or more . . . . . . . . . . . . . . . . . . . . . . . . . 2,126 26.2 Not computed. . . . . . . . . . . . . . . . . . . . . . . . . . . . . . . . 817 10.1 -Represents zero or rounds to zero. (X) Not applicable. Source: U.S. Bureau of the Census, Census 2000. U.S. Census Bureau
4

Northwest Pennsylvania Regional Planning & Development Commission CONNECT NW PA Broadband Study and Action Plan Supplemental Report
December 23, 2003 Page 158
Erie County
Table DP-1: Profile of General Demographic Characteristics: 2000 Geographic area: Erie County, Pennsylvania [For information on confidentiality protection, nonsampling error, and definitions, see text] Subject Number Percent Total population. . . . . . . . . . . . . . . . . . . . . . . . . . 280,843 100.0 SEX AND AGE Male . . . . . . . . . . . . . . . . . . . . . . . . . . . . . . . . . . . . . . . . 136,967 48.8 Female. . . . . . . . . . . . . . . . . . . . . . . . . . . . . . . . . . . . . . 143,876 51.2 Under 5 years . . . . . . . . . . . . . . . . . . . . . . . . . . . . . . . 17,440 6.2 5 to 9 years . . . . . . . . . . . . . . . . . . . . . . . . . . . . . . . . . 19,997 7.1 10 to 14 years . . . . . . . . . . . . . . . . . . . . . . . . . . . . . . . 20,251 7.2 15 to 19 years . . . . . . . . . . . . . . . . . . . . . . . . . . . . . . . 22,404 8.0 20 to 24 years . . . . . . . . . . . . . . . . . . . . . . . . . . . . . . . 20,419 7.3 25 to 34 years . . . . . . . . . . . . . . . . . . . . . . . . . . . . . . . 35,225 12.5 35 to 44 years . . . . . . . . . . . . . . . . . . . . . . . . . . . . . . . 42,507 15.1 45 to 54 years . . . . . . . . . . . . . . . . . . . . . . . . . . . . . . . 38,188 13.6 55 to 59 years . . . . . . . . . . . . . . . . . . . . . . . . . . . . . . . 13,454 4.8 60 to 64 years . . . . . . . . . . . . . . . . . . . . . . . . . . . . . . . 10,702 3.8 65 to 74 years . . . . . . . . . . . . . . . . . . . . . . . . . . . . . . . 19,968 7.1 75 to 84 years . . . . . . . . . . . . . . . . . . . . . . . . . . . . . . . 15,396 5.5 85 years and over . . . . . . . . . . . . . . . . . . . . . . . . . . . . 4,892 1.7 Median age (years) . . . . . . . . . . . . . . . . . . . . . . . . . . . 36.2 (X) 18 years and over . . . . . . . . . . . . . . . . . . . . . . . . . . . . 210,532 75.0 Male . . . . . . . . . . . . . . . . . . . . . . . . . . . . . . . . . . . . . . 100,729 35.9 Female. . . . . . . . . . . . . . . . . . . . . . . . . . . . . . . . . . . . 109,803 39.1 21 years and over . . . . . . . . . . . . . . . . . . . . . . . . . . . . 195,750 69.7 62 years and over . . . . . . . . . . . . . . . . . . . . . . . . . . . . 46,439 16.5 65 years and over . . . . . . . . . . . . . . . . . . . . . . . . . . . . 40,256 14.3 Male . . . . . . . . . . . . . . . . . . . . . . . . . . . . . . . . . . . . . . 16,109 5.7 Female. . . . . . . . . . . . . . . . . . . . . . . . . . . . . . . . . . . . 24,147 8.6 RACE One race . . . . . . . . . . . . . . . . . . . . . . . . . . . . . . . . . . . . 277,344 98.8 White . . . . . . . . . . . . . . . . . . . . . . . . . . . . . . . . . . . . . 255,282 90.9 Black or African American . . . . . . . . . . . . . . . . . . . 17,202 6.1 American Indian and Alaska Native . . . . . . . . . . . 464 0.2 Asian . . . . . . . . . . . . . . . . . . . . . . . . . . . . . . . . . . . . . 1,929 0.7 Asian Indian . . . . . . . . . . . . . . . . . . . . . . . . . . . . . 519 0.2 Chinese . . . . . . . . . . . . . . . . . . . . . . . . . . . . . . . . . 327 0.1 Filipino . . . . . . . . . . . . . . . . . . . . . . . . . . . . . . . . . . 217 0.1 Japanese. . . . . . . . . . . . . . . . . . . . . . . . . . . . . . . . 82 - Korean. . . . . . . . . . . . . . . . . . . . . . . . . . . . . . . . . . 219 0.1 Vietnamese. . . . . . . . . . . . . . . . . . . . . . . . . . . . . . 353 0.1 Other Asian 1 . . . . . . . . . . . . . . . . . . . . . . . . . . . . 212 0.1 Native Hawaiian and Other Pacific Islander. . . . 61 - Native Hawaiian. . . . . . . . . . . . . . . . . . . . . . . . . . 16 - Guamanian or Chamorro . . . . . . . . . . . . . . . . . . 9 - Samoan. . . . . . . . . . . . . . . . . . . . . . . . . . . . . . . . . 13 - Other Pacific Islander 2 . . . . . . . . . . . . . . . . . . . 23 - Some other race . . . . . . . . . . . . . . . . . . . . . . . . . . . 2,406 0.9 Two or more races . . . . . . . . . . . . . . . . . . . . . . . . . . . 3,499 1.2 Race alone or in combination with one or more other races: 3
White . . . . . . . . . . . . . . . . . . . . . . . . . . . . . . . . . . . . . . . 258,388 92.0 Black or African American . . . . . . . . . . . . . . . . . . . . . 18,910 6.7 American Indian and Alaska Native . . . . . . . . . . . . . 1,331 0.5 Asian . . . . . . . . . . . . . . . . . . . . . . . . . . . . . . . . . . . . . . . 2,417 0.9 Native Hawaiian and Other Pacific Islander. . . . . . 184 0.1 Some other race . . . . . . . . . . . . . . . . . . . . . . . . . . . . . 3,330 1.2 Subject Number Percent HISPANIC OR LATINO AND RACE Total population. . . . . . . . . . . . . . . . . . . . . . . . . . 280,843 100.0 Hispanic or Latino (of any race) . . . . . . . . . . . . . . . . 6,126 2.2 Mexican. . . . . . . . . . . . . . . . . . . . . . . . . . . . . . . . . . . 1,211 0.4 Puerto Rican. . . . . . . . . . . . . . . . . . . . . . . . . . . . . . . 3,538 1.3 Cuban . . . . . . . . . . . . . . . . . . . . . . . . . . . . . . . . . . . . 85 - Other Hispanic or Latino . . . . . . . . . . . . . . . . . . . . 1,292 0.5

Northwest Pennsylvania Regional Planning & Development Commission CONNECT NW PA Broadband Study and Action Plan Supplemental Report
December 23, 2003 Page 159
Not Hispanic or Latino . . . . . . . . . . . . . . . . . . . . . . . . 274,717 97.8 White alone. . . . . . . . . . . . . . . . . . . . . . . . . . . . . . . . 252,258 89.8 RELATIONSHIP Total population. . . . . . . . . . . . . . . . . . . . . . . . . . 280,843 100.0 In households. . . . . . . . . . . . . . . . . . . . . . . . . . . . . . . . 266,890 95.0 Householder . . . . . . . . . . . . . . . . . . . . . . . . . . . . . . . 106,507 37.9 Spouse . . . . . . . . . . . . . . . . . . . . . . . . . . . . . . . . . . . 53,792 19.2 Child. . . . . . . . . . . . . . . . . . . . . . . . . . . . . . . . . . . . . . 83,279 29.7 Own child under 18 years . . . . . . . . . . . . . . . . 64,019 22.8 Other relatives . . . . . . . . . . . . . . . . . . . . . . . . . . . . . 9,942 3.5 Under 18 years . . . . . . . . . . . . . . . . . . . . . . . . . 4,227 1.5 Nonrelatives . . . . . . . . . . . . . . . . . . . . . . . . . . . . . . . 13,370 4.8 Unmarried partner . . . . . . . . . . . . . . . . . . . . . . . 5,902 2.1 In group quarters . . . . . . . . . . . . . . . . . . . . . . . . . . . . . 13,953 5.0 Institutionalized population. . . . . . . . . . . . . . . . . . . 6,365 2.3 Noninstitutionalized population . . . . . . . . . . . . . . . 7,588 2.7 HOUSEHOLD BY TYPE Total households. . . . . . . . . . . . . . . . . . . . . . . . . 106,507 100.0 Family households (families). . . . . . . . . . . . . . . . . . . 71,039 66.7 With own children under 18 years . . . . . . . . . . 33,659 31.6 Married-couple family . . . . . . . . . . . . . . . . . . . . . . . 53,792 50.5 With own children under 18 years . . . . . . . . . . 23,437 22.0 Female householder, no husband present . . . . . 12,890 12.1 With own children under 18 years . . . . . . . . . . 7,870 7.4 Nonfamily households . . . . . . . . . . . . . . . . . . . . . . . . 35,468 33.3 Householder living alone . . . . . . . . . . . . . . . . . . . . 29,362 27.6 Householder 65 years and over . . . . . . . . . . . . 11,957 11.2 Households with individuals under 18 years . . . . . 36,508 34.3 Households with individuals 65 years and over . . 27,552 25.9 Average household size. . . . . . . . . . . . . . . . . . . . . . . 2.51 (X) Average family size. . . . . . . . . . . . . . . . . . . . . . . . . . . 3.07 (X) HOUSING OCCUPANCY Total housing units. . . . . . . . . . . . . . . . . . . . . . . 114,322 100.0 Occupied housing units . . . . . . . . . . . . . . . . . . . . . . . 106,507 93.2 Vacant housing units. . . . . . . . . . . . . . . . . . . . . . . . . . 7,815 6.8 For seasonal, recreational, or occasional use. . . . . . . . . . . . . . . . . . . . . . . . . . . . 1,126 1.0 Homeowner vacancy rate (percent). . . . . . . . . . . . . 1.6 (X) Rental vacancy rate (percent). . . . . . . . . . . . . . . . . . 7.9 (X) HOUSING TENURE Occupied housing units . . . . . . . . . . . . . . . . . . 106,507 100.0 Owner-occupied housing units . . . . . . . . . . . . . . . . . 73,729 69.2 Renter-occupied housing units . . . . . . . . . . . . . . . . . 32,778 30.8 Average household size of owner-occupied units. 2.65 (X) Average household size of renter-occupied units . 2.17 (X) - Represents zero or rounds to zero. (X) Not applicable. 1 Other Asian alone, or two or more Asian categories. 2 Other Pacific Islander alone, or two or more Native Hawaiian and Other Pacific Islander categories. 3 In combination with one or more of the other races listed. The six numbers may add to more than the total population and the six percentages may add to more than 100 percent because individuals may report more than one race. Source: U.S. Census Bureau, Census 2000. U.S. Census Bureau 1
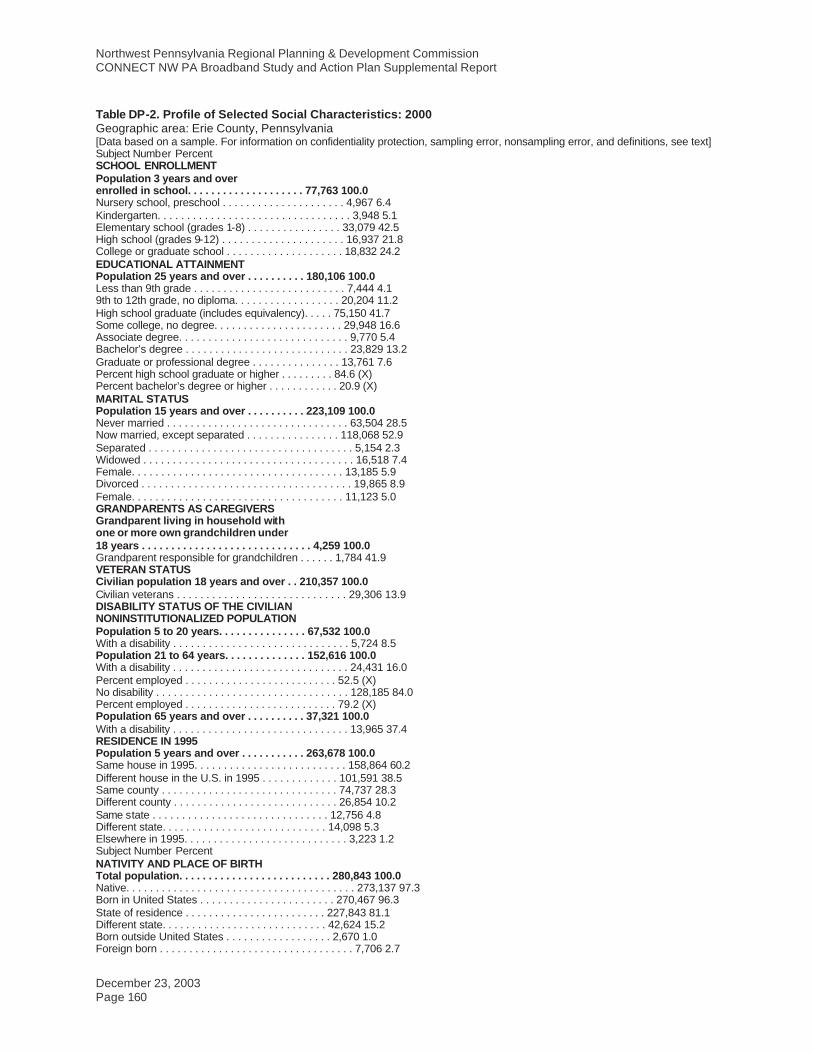
Northwest Pennsylvania Regional Planning & Development Commission CONNECT NW PA Broadband Study and Action Plan Supplemental Report
December 23, 2003 Page 160
Table DP-2. Profile of Selected Social Characteristics: 2000 Geographic area: Erie County, Pennsylvania [Data based on a sample. For information on confidentiality protection, sampling error, nonsampling error, and definitions, see text] Subject Number Percent SCHOOL ENROLLMENT Population 3 years and over enrolled in school. . . . . . . . . . . . . . . . . . . . 77,763 100.0 Nursery school, preschool . . . . . . . . . . . . . . . . . . . . . 4,967 6.4 Kindergarten. . . . . . . . . . . . . . . . . . . . . . . . . . . . . . . . . 3,948 5.1 Elementary school (grades 1-8) . . . . . . . . . . . . . . . . 33,079 42.5 High school (grades 9-12) . . . . . . . . . . . . . . . . . . . . . 16,937 21.8 College or graduate school . . . . . . . . . . . . . . . . . . . . 18,832 24.2 EDUCATIONAL ATTAINMENT Population 25 years and over . . . . . . . . . . 180,106 100.0 Less than 9th grade . . . . . . . . . . . . . . . . . . . . . . . . . . 7,444 4.1 9th to 12th grade, no diploma. . . . . . . . . . . . . . . . . . 20,204 11.2 High school graduate (includes equivalency). . . . . 75,150 41.7 Some college, no degree. . . . . . . . . . . . . . . . . . . . . . 29,948 16.6 Associate degree. . . . . . . . . . . . . . . . . . . . . . . . . . . . . 9,770 5.4 Bachelor’s degree . . . . . . . . . . . . . . . . . . . . . . . . . . . . 23,829 13.2 Graduate or professional degree . . . . . . . . . . . . . . . 13,761 7.6 Percent high school graduate or higher . . . . . . . . . 84.6 (X) Percent bachelor’s degree or higher . . . . . . . . . . . . 20.9 (X) MARITAL STATUS Population 15 years and over . . . . . . . . . . 223,109 100.0 Never married . . . . . . . . . . . . . . . . . . . . . . . . . . . . . . . 63,504 28.5 Now married, except separated . . . . . . . . . . . . . . . . 118,068 52.9 Separated . . . . . . . . . . . . . . . . . . . . . . . . . . . . . . . . . . . 5,154 2.3 Widowed . . . . . . . . . . . . . . . . . . . . . . . . . . . . . . . . . . . . 16,518 7.4 Female. . . . . . . . . . . . . . . . . . . . . . . . . . . . . . . . . . . . 13,185 5.9 Divorced . . . . . . . . . . . . . . . . . . . . . . . . . . . . . . . . . . . . 19,865 8.9 Female. . . . . . . . . . . . . . . . . . . . . . . . . . . . . . . . . . . . 11,123 5.0 GRANDPARENTS AS CAREGIVERS Grandparent living in household with one or more own grandchildren under 18 years . . . . . . . . . . . . . . . . . . . . . . . . . . . . . 4,259 100.0 Grandparent responsible for grandchildren . . . . . . 1,784 41.9 VETERAN STATUS Civilian population 18 years and over . . 210,357 100.0 Civilian veterans . . . . . . . . . . . . . . . . . . . . . . . . . . . . . 29,306 13.9 DISABILITY STATUS OF THE CIVILIAN NONINSTITUTIONALIZED POPULATION Population 5 to 20 years. . . . . . . . . . . . . . . 67,532 100.0 With a disability . . . . . . . . . . . . . . . . . . . . . . . . . . . . . . 5,724 8.5 Population 21 to 64 years. . . . . . . . . . . . . . 152,616 100.0 With a disability . . . . . . . . . . . . . . . . . . . . . . . . . . . . . . 24,431 16.0 Percent employed . . . . . . . . . . . . . . . . . . . . . . . . . . 52.5 (X) No disability . . . . . . . . . . . . . . . . . . . . . . . . . . . . . . . . . 128,185 84.0 Percent employed . . . . . . . . . . . . . . . . . . . . . . . . . . 79.2 (X) Population 65 years and over . . . . . . . . . . 37,321 100.0 With a disability . . . . . . . . . . . . . . . . . . . . . . . . . . . . . . 13,965 37.4 RESIDENCE IN 1995 Population 5 years and over . . . . . . . . . . . 263,678 100.0 Same house in 1995. . . . . . . . . . . . . . . . . . . . . . . . . . 158,864 60.2 Different house in the U.S. in 1995 . . . . . . . . . . . . . 101,591 38.5 Same county . . . . . . . . . . . . . . . . . . . . . . . . . . . . . . 74,737 28.3 Different county . . . . . . . . . . . . . . . . . . . . . . . . . . . . 26,854 10.2 Same state . . . . . . . . . . . . . . . . . . . . . . . . . . . . . . 12,756 4.8 Different state. . . . . . . . . . . . . . . . . . . . . . . . . . . . 14,098 5.3 Elsewhere in 1995. . . . . . . . . . . . . . . . . . . . . . . . . . . . 3,223 1.2 Subject Number Percent NATIVITY AND PLACE OF BIRTH Total population. . . . . . . . . . . . . . . . . . . . . . . . . . 280,843 100.0 Native. . . . . . . . . . . . . . . . . . . . . . . . . . . . . . . . . . . . . . . 273,137 97.3 Born in United States . . . . . . . . . . . . . . . . . . . . . . . 270,467 96.3 State of residence . . . . . . . . . . . . . . . . . . . . . . . . 227,843 81.1 Different state. . . . . . . . . . . . . . . . . . . . . . . . . . . . 42,624 15.2 Born outside United States . . . . . . . . . . . . . . . . . . 2,670 1.0 Foreign born . . . . . . . . . . . . . . . . . . . . . . . . . . . . . . . . . 7,706 2.7
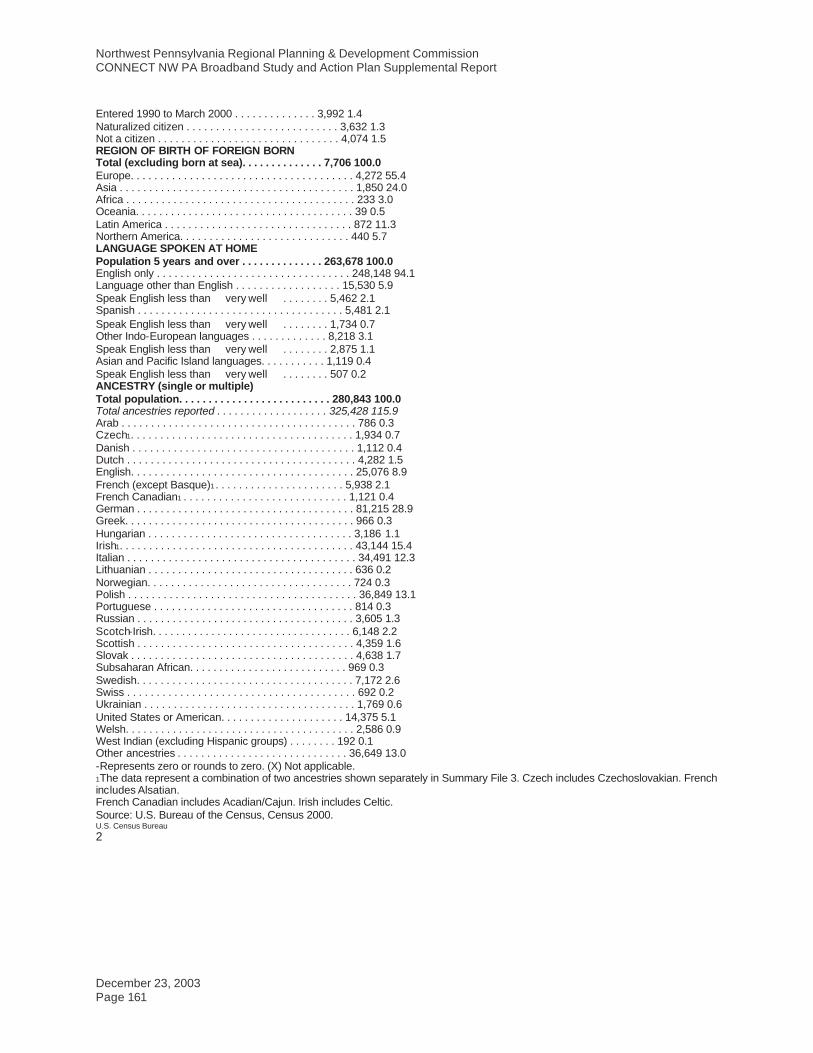
Northwest Pennsylvania Regional Planning & Development Commission CONNECT NW PA Broadband Study and Action Plan Supplemental Report
December 23, 2003 Page 161
Entered 1990 to March 2000 . . . . . . . . . . . . . . 3,992 1.4 Naturalized citizen . . . . . . . . . . . . . . . . . . . . . . . . . . 3,632 1.3 Not a citizen . . . . . . . . . . . . . . . . . . . . . . . . . . . . . . . 4,074 1.5 REGION OF BIRTH OF FOREIGN BORN Total (excluding born at sea). . . . . . . . . . . . . . 7,706 100.0 Europe. . . . . . . . . . . . . . . . . . . . . . . . . . . . . . . . . . . . . . 4,272 55.4 Asia . . . . . . . . . . . . . . . . . . . . . . . . . . . . . . . . . . . . . . . . 1,850 24.0 Africa . . . . . . . . . . . . . . . . . . . . . . . . . . . . . . . . . . . . . . . 233 3.0 Oceania. . . . . . . . . . . . . . . . . . . . . . . . . . . . . . . . . . . . . 39 0.5 Latin America . . . . . . . . . . . . . . . . . . . . . . . . . . . . . . . . 872 11.3 Northern America. . . . . . . . . . . . . . . . . . . . . . . . . . . . . 440 5.7 LANGUAGE SPOKEN AT HOME Population 5 years and over . . . . . . . . . . . . . . 263,678 100.0 English only . . . . . . . . . . . . . . . . . . . . . . . . . . . . . . . . . 248,148 94.1 Language other than English . . . . . . . . . . . . . . . . . . 15,530 5.9 Speak English less than ��very well�� . . . . . . . . 5,462 2.1 Spanish . . . . . . . . . . . . . . . . . . . . . . . . . . . . . . . . . . . 5,481 2.1 Speak English less than ��very well�� . . . . . . . . 1,734 0.7 Other Indo-European languages . . . . . . . . . . . . . 8,218 3.1 Speak English less than ��very well�� . . . . . . . . 2,875 1.1 Asian and Pacific Island languages. . . . . . . . . . . 1,119 0.4 Speak English less than ��very well�� . . . . . . . . 507 0.2 ANCESTRY (single or multiple) Total population. . . . . . . . . . . . . . . . . . . . . . . . . . 280,843 100.0 Total ancestries reported . . . . . . . . . . . . . . . . . . . 325,428 115.9 Arab . . . . . . . . . . . . . . . . . . . . . . . . . . . . . . . . . . . . . . . . 786 0.3 Czech1. . . . . . . . . . . . . . . . . . . . . . . . . . . . . . . . . . . . . . 1,934 0.7 Danish . . . . . . . . . . . . . . . . . . . . . . . . . . . . . . . . . . . . . . 1,112 0.4 Dutch . . . . . . . . . . . . . . . . . . . . . . . . . . . . . . . . . . . . . . . 4,282 1.5 English. . . . . . . . . . . . . . . . . . . . . . . . . . . . . . . . . . . . . . 25,076 8.9 French (except Basque)1 . . . . . . . . . . . . . . . . . . . . . . 5,938 2.1 French Canadian1 . . . . . . . . . . . . . . . . . . . . . . . . . . . . 1,121 0.4 German . . . . . . . . . . . . . . . . . . . . . . . . . . . . . . . . . . . . . 81,215 28.9 Greek. . . . . . . . . . . . . . . . . . . . . . . . . . . . . . . . . . . . . . . 966 0.3 Hungarian . . . . . . . . . . . . . . . . . . . . . . . . . . . . . . . . . . . 3,186 1.1 Irish1. . . . . . . . . . . . . . . . . . . . . . . . . . . . . . . . . . . . . . . . 43,144 15.4 Italian . . . . . . . . . . . . . . . . . . . . . . . . . . . . . . . . . . . . . . . 34,491 12.3 Lithuanian . . . . . . . . . . . . . . . . . . . . . . . . . . . . . . . . . . . 636 0.2 Norwegian. . . . . . . . . . . . . . . . . . . . . . . . . . . . . . . . . . . 724 0.3 Polish . . . . . . . . . . . . . . . . . . . . . . . . . . . . . . . . . . . . . . . 36,849 13.1 Portuguese . . . . . . . . . . . . . . . . . . . . . . . . . . . . . . . . . . 814 0.3 Russian . . . . . . . . . . . . . . . . . . . . . . . . . . . . . . . . . . . . . 3,605 1.3 Scotch-Irish. . . . . . . . . . . . . . . . . . . . . . . . . . . . . . . . . . 6,148 2.2 Scottish . . . . . . . . . . . . . . . . . . . . . . . . . . . . . . . . . . . . . 4,359 1.6 Slovak . . . . . . . . . . . . . . . . . . . . . . . . . . . . . . . . . . . . . . 4,638 1.7 Subsaharan African. . . . . . . . . . . . . . . . . . . . . . . . . . . 969 0.3 Swedish. . . . . . . . . . . . . . . . . . . . . . . . . . . . . . . . . . . . . 7,172 2.6 Swiss . . . . . . . . . . . . . . . . . . . . . . . . . . . . . . . . . . . . . . . 692 0.2 Ukrainian . . . . . . . . . . . . . . . . . . . . . . . . . . . . . . . . . . . . 1,769 0.6 United States or American. . . . . . . . . . . . . . . . . . . . . 14,375 5.1 Welsh. . . . . . . . . . . . . . . . . . . . . . . . . . . . . . . . . . . . . . . 2,586 0.9 West Indian (excluding Hispanic groups) . . . . . . . . 192 0.1 Other ancestries . . . . . . . . . . . . . . . . . . . . . . . . . . . . . 36,649 13.0 -Represents zero or rounds to zero. (X) Not applicable. 1The data represent a combination of two ancestries shown separately in Summary File 3. Czech includes Czechoslovakian. French includes Alsatian. French Canadian includes Acadian/Cajun. Irish includes Celtic. Source: U.S. Bureau of the Census, Census 2000. U.S. Census Bureau 2

Northwest Pennsylvania Regional Planning & Development Commission CONNECT NW PA Broadband Study and Action Plan Supplemental Report
December 23, 2003 Page 162
Table DP-3. Profile of Selected Economic Characteristics: 2000 Geographic area: Erie County, Pennsylvania [Data based on a sample. For information on confidentiality protection, sampling error, nonsampling error, and definitions, see text] Subject Number Percent EMPLOYMENT STATUS Population 16 years and over . . . . . . . . . . . . 218,948 100.0 In labor force . . . . . . . . . . . . . . . . . . . . . . . . . . . . . . . . 137,485 62.8 Civilian labor force. . . . . . . . . . . . . . . . . . . . . . . . . . 137,337 62.7 Employed . . . . . . . . . . . . . . . . . . . . . . . . . . . . . . . 129,325 59.1 Unemployed . . . . . . . . . . . . . . . . . . . . . . . . . . . . . 8,012 3.7 Percent of civilian labor force . . . . . . . . . . . . 5.8 (X) Armed Forces. . . . . . . . . . . . . . . . . . . . . . . . . . . . . . 148 0.1 Not in labor force. . . . . . . . . . . . . . . . . . . . . . . . . . . . . 81,463 37.2 Females 16 years and over . . . . . . . . . . . . . . 114,236 100.0 In labor force . . . . . . . . . . . . . . . . . . . . . . . . . . . . . . . . 64,956 56.9 Civilian labor force. . . . . . . . . . . . . . . . . . . . . . . . . . 64,942 56.8 Employed . . . . . . . . . . . . . . . . . . . . . . . . . . . . . . . 61,650 54.0 Own children under 6 years. . . . . . . . . . . . . . 20,386 100.0 All parents in family in labor force . . . . . . . . . . . . . . 12,955 63.5 COMMUTING TO WORK Workers 16 years and over . . . . . . . . . . . . . . 126,797 100.0 Car, truck, or van - - drove alone . . . . . . . . . . . . . . . 101,299 79.9 Car, truck, or van - - carpooled. . . . . . . . . . . . . . . . . 14,187 11.2 Public transportation (including taxicab) . . . . . . . . . 1,781 1.4 Walked. . . . . . . . . . . . . . . . . . . . . . . . . . . . . . . . . . . . . . 5,409 4.3 Other means. . . . . . . . . . . . . . . . . . . . . . . . . . . . . . . . . 1,245 1.0 Worked at home . . . . . . . . . . . . . . . . . . . . . . . . . . . . . 2,876 2.3 Mean travel time to work (minutes)1 . . . . . . . . . . . . 18.5 (X) Employed civilian population 16 years and over . . . . . . . . . . . . . . . . . . . . . 129,325 100.0 OCCUPATION Management, professional, and related occupations . . . . . . . . . . . . . . . . . . . . . . . . . . . . . . . . 37,776 29.2 Service occupations . . . . . . . . . . . . . . . . . . . . . . . . . . 21,122 16.3 Sales and office occupations . . . . . . . . . . . . . . . . . . 33,126 25.6 Farming, fishing, and forestry occupations. . . . . . . 587 0.5 Construction, extraction, and maintenance occupations . . . . . . . . . . . . . . . . . . . . . . . . . . . . . . . . 10,148 7.8 Production, transportation, and material moving occupations . . . . . . . . . . . . . . . . . . . . . . . . . . . . . . . . 26,566 20.5 INDUSTRY Agriculture, forestry, fishing and hunting, and mining . . . . . . . . . . . . . . . . . . . . . . . . . . . . . . . . . 1,320 1.0 Construction . . . . . . . . . . . . . . . . . . . . . . . . . . . . . . . . . 6,113 4.7 Manufacturing. . . . . . . . . . . . . . . . . . . . . . . . . . . . . . . . 30,731 23.8 Wholesale trade. . . . . . . . . . . . . . . . . . . . . . . . . . . . . . 3,305 2.6 Retail trade . . . . . . . . . . . . . . . . . . . . . . . . . . . . . . . . . . 15,642 12.1 Transportation and warehousing, and utilities . . . . 4,583 3.5 Information . . . . . . . . . . . . . . . . . . . . . . . . . . . . . . . . . . 2,775 2.1 Finance, insurance, real estate, and rental and leasing . . . . . . . . . . . . . . . . . . . . . . . . . . . . . . . . . . . . . 6,352 4.9 Professional, scientific, management, administrative, and waste management services . . . . . . . 7,554 5.8 Educational, health and social services . . . . . . . . . 30,431 23.5 Arts, entertainment, recreation, accommodation and food services . . . . . . . . . . . . . . . . . . . . . . . . . . . 10,948 8.5 Other services (except public administration) . . . . 5,838 4.5 Public administration. . . . . . . . . . . . . . . . . . . . . . . . . . 3,733 2.9 CLASS OF WORKER Private wage and salary workers . . . . . . . . . . . . . . . 109,084 84.3 Government workers. . . . . . . . . . . . . . . . . . . . . . . . . . 12,955 10.0 Self-employed workers in own not incorporated business . . . . . . . . . . . . . . . . . . . . . . . . . . . . . . . . . . . 6,903 5.3 Unpaid family workers . . . . . . . . . . . . . . . . . . . . . . . . 383 0.3 Subject Number Percent INCOME IN 1999 Households. . . . . . . . . . . . . . . . . . . . . . . . . . . . . 106,488 100.0 Less than $10,000. . . . . . . . . . . . . . . . . . . . . . . . . . . . 10,749 10.1 $10,000 to $14,999. . . . . . . . . . . . . . . . . . . . . . . . . . . 8,442 7.9

Northwest Pennsylvania Regional Planning & Development Commission CONNECT NW PA Broadband Study and Action Plan Supplemental Report
December 23, 2003 Page 163
$15,000 to $24,999. . . . . . . . . . . . . . . . . . . . . . . . . . . 16,307 15.3 $25,000 to $34,999. . . . . . . . . . . . . . . . . . . . . . . . . . . 15,330 14.4 $35,000 to $49,999. . . . . . . . . . . . . . . . . . . . . . . . . . . 19,705 18.5 $50,000 to $74,999. . . . . . . . . . . . . . . . . . . . . . . . . . . 20,429 19.2 $75,000 to $99,999. . . . . . . . . . . . . . . . . . . . . . . . . . . 8,665 8.1 $100,000 to $149,999. . . . . . . . . . . . . . . . . . . . . . . . . 4,560 4.3 $150,000 to $199,999. . . . . . . . . . . . . . . . . . . . . . . . . 1,019 1.0 $200,000 or more . . . . . . . . . . . . . . . . . . . . . . . . . . . . 1,282 1.2 Median household income (dollars) . . . . . . . . . . . . . 36,627 (X) With earnings . . . . . . . . . . . . . . . . . . . . . . . . . . . . . . . . 83,052 78.0 Mean earnings (dollars)1 . . . . . . . . . . . . . . . . . . . . 46,625 (X) With Social Security income . . . . . . . . . . . . . . . . . . . 30,664 28.8 Mean Social Security income (dollars)1 . . . . . . . 11,724 (X) With Supplemental Security Income . . . . . . . . . . . . 4,611 4.3 Mean Supplemental Security Income (dollars)1 . . . . . . . . . . . . . . . . . . . . . . . . . . . . . . . . . 6,541 (X) With public assistance income . . . . . . . . . . . . . . . . . 3,839 3.6 Mean public assistance income (dollars)1 . . . . . 2,520 (X) With retirement income . . . . . . . . . . . . . . . . . . . . . . . 19,232 18.1 Mean retirement income (dollars)1. . . . . . . . . . . . 13,134 (X) Families . . . . . . . . . . . . . . . . . . . . . . . . . . . . . . . . 71,650 100.0 Less than $10,000. . . . . . . . . . . . . . . . . . . . . . . . . . . . 3,682 5.1 $10,000 to $14,999. . . . . . . . . . . . . . . . . . . . . . . . . . . 3,030 4.2 $15,000 to $24,999. . . . . . . . . . . . . . . . . . . . . . . . . . . 9,093 12.7 $25,000 to $34,999. . . . . . . . . . . . . . . . . . . . . . . . . . . 10,128 14.1 $35,000 to $49,999. . . . . . . . . . . . . . . . . . . . . . . . . . . 14,655 20.5 $50,000 to $74,999. . . . . . . . . . . . . . . . . . . . . . . . . . . 17,255 24.1 $75,000 to $99,999. . . . . . . . . . . . . . . . . . . . . . . . . . . 7,817 10.9 $100,000 to $149,999. . . . . . . . . . . . . . . . . . . . . . . . . 4,037 5.6 $150,000 to $199,999. . . . . . . . . . . . . . . . . . . . . . . . . 919 1.3 $200,000 or more . . . . . . . . . . . . . . . . . . . . . . . . . . . . 1,034 1.4 Median family income (dollars) . . . . . . . . . . . . . . . . . 44,829 (X) Per capita income (dollars)1 . . . . . . . . . . . . . . . . . . . 17,932 (X) Median earnings (dollars): Male full-time, year-round workers. . . . . . . . . . . . . . 35,465 (X) Female full-time, year-round workers . . . . . . . . . . . 23,886 (X) Subject Number below poverty level Percent below poverty level POVERTY STATUS IN 1999 Families . . . . . . . . . . . . . . . . . . . . . . . . . . . . . . . . 5,888 8.2 With related children under 18 years. . . . . . . . . . . . 4,951 13.5 With related children under 5 years. . . . . . . . . . . 2,512 18.3 Families with female householder, no husband present . . . . . . . . . . . . . . . . . . . . . . . 3,446 28.1 With related children under 18 years. . . . . . . . . . . . 3,210 37.2 With related children under 5 years. . . . . . . . . . . 1,653 51.1 Individuals . . . . . . . . . . . . . . . . . . . . . . . . . . . . . . 32,108 12.0 18 years and over . . . . . . . . . . . . . . . . . . . . . . . . . . . . 20,945 10.5 65 years and over . . . . . . . . . . . . . . . . . . . . . . . . . . 2,864 7.7 Related children under 18 years . . . . . . . . . . . . . . . 10,764 15.7 Related children 5 to 17 years . . . . . . . . . . . . . . . 7,755 15.0 Unrelated individuals 15 years and over. . . . . . . . . 12,261 25.7 -Represents zero or rounds to zero. (X) Not applicable. 1If the denominator of a mean value or per capita value is less than 30, then that value is calculated using a rounded aggregate in the numerator. See text. Source: U.S. Bureau of the Census, Census 2000. U.S. Census Bureau
3
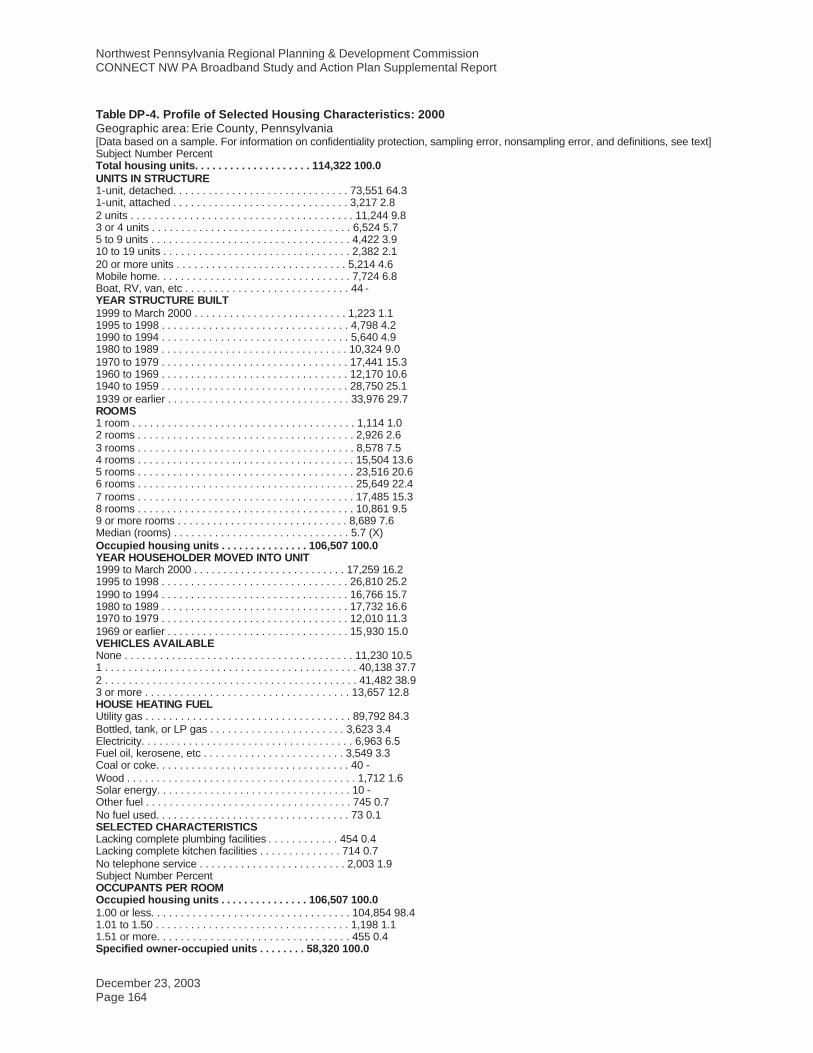
Northwest Pennsylvania Regional Planning & Development Commission CONNECT NW PA Broadband Study and Action Plan Supplemental Report
December 23, 2003 Page 164
Table DP-4. Profile of Selected Housing Characteristics: 2000 Geographic area: Erie County, Pennsylvania [Data based on a sample. For information on confidentiality protection, sampling error, nonsampling error, and definitions, see text] Subject Number Percent Total housing units. . . . . . . . . . . . . . . . . . . . 114,322 100.0 UNITS IN STRUCTURE 1-unit, detached. . . . . . . . . . . . . . . . . . . . . . . . . . . . . . 73,551 64.3 1-unit, attached . . . . . . . . . . . . . . . . . . . . . . . . . . . . . . 3,217 2.8 2 units . . . . . . . . . . . . . . . . . . . . . . . . . . . . . . . . . . . . . . 11,244 9.8 3 or 4 units . . . . . . . . . . . . . . . . . . . . . . . . . . . . . . . . . . 6,524 5.7 5 to 9 units . . . . . . . . . . . . . . . . . . . . . . . . . . . . . . . . . . 4,422 3.9 10 to 19 units . . . . . . . . . . . . . . . . . . . . . . . . . . . . . . . . 2,382 2.1 20 or more units . . . . . . . . . . . . . . . . . . . . . . . . . . . . . 5,214 4.6 Mobile home. . . . . . . . . . . . . . . . . . . . . . . . . . . . . . . . . 7,724 6.8 Boat, RV, van, etc . . . . . . . . . . . . . . . . . . . . . . . . . . . . 44 - YEAR STRUCTURE BUILT 1999 to March 2000 . . . . . . . . . . . . . . . . . . . . . . . . . . 1,223 1.1 1995 to 1998 . . . . . . . . . . . . . . . . . . . . . . . . . . . . . . . . 4,798 4.2 1990 to 1994 . . . . . . . . . . . . . . . . . . . . . . . . . . . . . . . . 5,640 4.9 1980 to 1989 . . . . . . . . . . . . . . . . . . . . . . . . . . . . . . . . 10,324 9.0 1970 to 1979 . . . . . . . . . . . . . . . . . . . . . . . . . . . . . . . . 17,441 15.3 1960 to 1969 . . . . . . . . . . . . . . . . . . . . . . . . . . . . . . . . 12,170 10.6 1940 to 1959 . . . . . . . . . . . . . . . . . . . . . . . . . . . . . . . . 28,750 25.1 1939 or earlier . . . . . . . . . . . . . . . . . . . . . . . . . . . . . . . 33,976 29.7 ROOMS 1 room . . . . . . . . . . . . . . . . . . . . . . . . . . . . . . . . . . . . . . 1,114 1.0 2 rooms . . . . . . . . . . . . . . . . . . . . . . . . . . . . . . . . . . . . . 2,926 2.6 3 rooms . . . . . . . . . . . . . . . . . . . . . . . . . . . . . . . . . . . . . 8,578 7.5 4 rooms . . . . . . . . . . . . . . . . . . . . . . . . . . . . . . . . . . . . . 15,504 13.6 5 rooms . . . . . . . . . . . . . . . . . . . . . . . . . . . . . . . . . . . . . 23,516 20.6 6 rooms . . . . . . . . . . . . . . . . . . . . . . . . . . . . . . . . . . . . . 25,649 22.4 7 rooms . . . . . . . . . . . . . . . . . . . . . . . . . . . . . . . . . . . . . 17,485 15.3 8 rooms . . . . . . . . . . . . . . . . . . . . . . . . . . . . . . . . . . . . . 10,861 9.5 9 or more rooms . . . . . . . . . . . . . . . . . . . . . . . . . . . . . 8,689 7.6 Median (rooms) . . . . . . . . . . . . . . . . . . . . . . . . . . . . . . 5.7 (X) Occupied housing units . . . . . . . . . . . . . . . 106,507 100.0 YEAR HOUSEHOLDER MOVED INTO UNIT 1999 to March 2000 . . . . . . . . . . . . . . . . . . . . . . . . . . 17,259 16.2 1995 to 1998 . . . . . . . . . . . . . . . . . . . . . . . . . . . . . . . . 26,810 25.2 1990 to 1994 . . . . . . . . . . . . . . . . . . . . . . . . . . . . . . . . 16,766 15.7 1980 to 1989 . . . . . . . . . . . . . . . . . . . . . . . . . . . . . . . . 17,732 16.6 1970 to 1979 . . . . . . . . . . . . . . . . . . . . . . . . . . . . . . . . 12,010 11.3 1969 or earlier . . . . . . . . . . . . . . . . . . . . . . . . . . . . . . . 15,930 15.0 VEHICLES AVAILABLE None . . . . . . . . . . . . . . . . . . . . . . . . . . . . . . . . . . . . . . . 11,230 10.5 1 . . . . . . . . . . . . . . . . . . . . . . . . . . . . . . . . . . . . . . . . . . . 40,138 37.7 2 . . . . . . . . . . . . . . . . . . . . . . . . . . . . . . . . . . . . . . . . . . . 41,482 38.9 3 or more . . . . . . . . . . . . . . . . . . . . . . . . . . . . . . . . . . . 13,657 12.8 HOUSE HEATING FUEL Utility gas . . . . . . . . . . . . . . . . . . . . . . . . . . . . . . . . . . . 89,792 84.3 Bottled, tank, or LP gas . . . . . . . . . . . . . . . . . . . . . . . 3,623 3.4 Electricity. . . . . . . . . . . . . . . . . . . . . . . . . . . . . . . . . . . . 6,963 6.5 Fuel oil, kerosene, etc . . . . . . . . . . . . . . . . . . . . . . . . 3,549 3.3 Coal or coke. . . . . . . . . . . . . . . . . . . . . . . . . . . . . . . . . 40 - Wood . . . . . . . . . . . . . . . . . . . . . . . . . . . . . . . . . . . . . . . 1,712 1.6 Solar energy. . . . . . . . . . . . . . . . . . . . . . . . . . . . . . . . . 10 - Other fuel . . . . . . . . . . . . . . . . . . . . . . . . . . . . . . . . . . . 745 0.7 No fuel used. . . . . . . . . . . . . . . . . . . . . . . . . . . . . . . . . 73 0.1 SELECTED CHARACTERISTICS Lacking complete plumbing facilities . . . . . . . . . . . . 454 0.4 Lacking complete kitchen facilities . . . . . . . . . . . . . . 714 0.7 No telephone service . . . . . . . . . . . . . . . . . . . . . . . . . 2,003 1.9 Subject Number Percent OCCUPANTS PER ROOM Occupied housing units . . . . . . . . . . . . . . . 106,507 100.0 1.00 or less. . . . . . . . . . . . . . . . . . . . . . . . . . . . . . . . . . 104,854 98.4 1.01 to 1.50 . . . . . . . . . . . . . . . . . . . . . . . . . . . . . . . . . 1,198 1.1 1.51 or more. . . . . . . . . . . . . . . . . . . . . . . . . . . . . . . . . 455 0.4 Specified owner-occupied units . . . . . . . . 58,320 100.0

Northwest Pennsylvania Regional Planning & Development Commission CONNECT NW PA Broadband Study and Action Plan Supplemental Report
December 23, 2003 Page 165
VALUE Less than $50,000. . . . . . . . . . . . . . . . . . . . . . . . . . . . 8,384 14.4 $50,000 to $99,999. . . . . . . . . . . . . . . . . . . . . . . . . . . 28,981 49.7 $100,000 to $149,999. . . . . . . . . . . . . . . . . . . . . . . . . 12,785 21.9 $150,000 to $199,999. . . . . . . . . . . . . . . . . . . . . . . . . 4,853 8.3 $200,000 to $299,999. . . . . . . . . . . . . . . . . . . . . . . . . 2,272 3.9 $300,000 to $499,999. . . . . . . . . . . . . . . . . . . . . . . . . 782 1.3 $500,000 to $999,999. . . . . . . . . . . . . . . . . . . . . . . . . 216 0.4 $1,000,000 or more. . . . . . . . . . . . . . . . . . . . . . . . . . . 47 0.1 Median (dollars) . . . . . . . . . . . . . . . . . . . . . . . . . . . . . . 85,300 (X) MORTGAGE STATUS AND SELECTED MONTHLY OWNER COSTS With a mortgage . . . . . . . . . . . . . . . . . . . . . . . . . . . . . 37,373 64.1 Less than $300 . . . . . . . . . . . . . . . . . . . . . . . . . . 175 0.3 $300 to $499 . . . . . . . . . . . . . . . . . . . . . . . . . . . . 2,770 4.7 $500 to $699 . . . . . . . . . . . . . . . . . . . . . . . . . . . . 7,942 13.6 $700 to $999 . . . . . . . . . . . . . . . . . . . . . . . . . . . . 12,940 22.2 $1,000 to $1,499 . . . . . . . . . . . . . . . . . . . . . . . . . 9,462 16.2 $1,500 to $1,999 . . . . . . . . . . . . . . . . . . . . . . . . . 2,689 4.6 $2,000 or more . . . . . . . . . . . . . . . . . . . . . . . . . . 1,395 2.4 Median (dollars) . . . . . . . . . . . . . . . . . . . . . . . . . . 872 (X) Not mortgaged . . . . . . . . . . . . . . . . . . . . . . . . . . . . . . . 20,947 35.9 Median (dollars) . . . . . . . . . . . . . . . . . . . . . . . . . . 308 (X) SELECTED MONTHLY OWNER COSTS AS A PERCENTAGE OF HOUSEHOLD INCOME IN 1999 Less than 15.0 percent. . . . . . . . . . . . . . . . . . . . . . . . 22,861 39.2 15.0 to 19.9 percent . . . . . . . . . . . . . . . . . . . . . . . . . . 11,275 19.3 20.0 to 24.9 percent . . . . . . . . . . . . . . . . . . . . . . . . . . 8,220 14.1 25.0 to 29.9 percent . . . . . . . . . . . . . . . . . . . . . . . . . . 5,157 8.8 30.0 to 34.9 percent . . . . . . . . . . . . . . . . . . . . . . . . . . 2,910 5.0 35.0 percent or more . . . . . . . . . . . . . . . . . . . . . . . . . 7,595 13.0 Not computed. . . . . . . . . . . . . . . . . . . . . . . . . . . . . . . . 302 0.5 Specified renter-occupied units . . . . . . . . 32,315 100.0 GROSS RENT Less than $200 . . . . . . . . . . . . . . . . . . . . . . . . . . . . . . 2,446 7.6 $200 to $299 . . . . . . . . . . . . . . . . . . . . . . . . . . . . . . . . 3,529 10.9 $300 to $499 . . . . . . . . . . . . . . . . . . . . . . . . . . . . . . . . 13,042 40.4 $500 to $749 . . . . . . . . . . . . . . . . . . . . . . . . . . . . . . . . 9,028 27.9 $750 to $999 . . . . . . . . . . . . . . . . . . . . . . . . . . . . . . . . 1,886 5.8 $1,000 to $1,499 . . . . . . . . . . . . . . . . . . . . . . . . . . . . . 461 1.4 $1,500 or more . . . . . . . . . . . . . . . . . . . . . . . . . . . . . . 320 1.0 No cash rent. . . . . . . . . . . . . . . . . . . . . . . . . . . . . . . . . 1,603 5.0 Median (dollars) . . . . . . . . . . . . . . . . . . . . . . . . . . . . . . 445 (X) GROSS RENT AS A PERCENTAGE OF HOUSEHOLD INCOME IN 1999 Less than 15.0 percent. . . . . . . . . . . . . . . . . . . . . . . . 6,432 19.9 15.0 to 19.9 percent . . . . . . . . . . . . . . . . . . . . . . . . . . 4,821 14.9 20.0 to 24.9 percent . . . . . . . . . . . . . . . . . . . . . . . . . . 3,728 11.5 25.0 to 29.9 percent . . . . . . . . . . . . . . . . . . . . . . . . . . 3,437 10.6 30.0 to 34.9 percent . . . . . . . . . . . . . . . . . . . . . . . . . . 2,345 7.3 35.0 percent or more . . . . . . . . . . . . . . . . . . . . . . . . . 9,169 28.4 Not computed. . . . . . . . . . . . . . . . . . . . . . . . . . . . . . . . 2,383 7.4 -Represents zero or rounds to zero. (X) Not applicable. Source: U.S. Bureau of the Census, Census 2000. U.S. Census Bureau
4

Northwest Pennsylvania Regional Planning & Development Commission CONNECT NW PA Broadband Study and Action Plan Supplemental Report
December 23, 2003 Page 166
Forest County
Table DP-1. Profile of General Demographic Characteristics: 2000 Geographic area: Forest County, Pennsylvania [For information on confidentiality protection, nonsampling error, and definitions, see text] Subject Number Percent Total population. . . . . . . . . . . . . . . . . . . . . . . . . . 4,946 100.0 SEX AND AGE Male . . . . . . . . . . . . . . . . . . . . . . . . . . . . . . . . . . . . . . . . 2,604 52.6 Female. . . . . . . . . . . . . . . . . . . . . . . . . . . . . . . . . . . . . . 2,342 47.4 Under 5 years . . . . . . . . . . . . . . . . . . . . . . . . . . . . . . . 178 3.6 5 to 9 years . . . . . . . . . . . . . . . . . . . . . . . . . . . . . . . . . 249 5.0 10 to 14 years . . . . . . . . . . . . . . . . . . . . . . . . . . . . . . . 314 6.3 15 to 19 years . . . . . . . . . . . . . . . . . . . . . . . . . . . . . . . 533 10.8 20 to 24 years . . . . . . . . . . . . . . . . . . . . . . . . . . . . . . . 140 2.8 25 to 34 years . . . . . . . . . . . . . . . . . . . . . . . . . . . . . . . 443 9.0 35 to 44 years . . . . . . . . . . . . . . . . . . . . . . . . . . . . . . . 677 13.7 45 to 54 years . . . . . . . . . . . . . . . . . . . . . . . . . . . . . . . 689 13.9 55 to 59 years . . . . . . . . . . . . . . . . . . . . . . . . . . . . . . . 362 7.3 60 to 64 years . . . . . . . . . . . . . . . . . . . . . . . . . . . . . . . 376 7.6 65 to 74 years . . . . . . . . . . . . . . . . . . . . . . . . . . . . . . . 545 11.0 75 to 84 years . . . . . . . . . . . . . . . . . . . . . . . . . . . . . . . 357 7.2 85 years and over . . . . . . . . . . . . . . . . . . . . . . . . . . . . 83 1.7 Median age (years) . . . . . . . . . . . . . . . . . . . . . . . . . . . 44.2 (X) 18 years and over . . . . . . . . . . . . . . . . . . . . . . . . . . . . 3,825 77.3 Male . . . . . . . . . . . . . . . . . . . . . . . . . . . . . . . . . . . . . . 1,934 39.1 Female. . . . . . . . . . . . . . . . . . . . . . . . . . . . . . . . . . . . 1,891 38.2 21 years and over . . . . . . . . . . . . . . . . . . . . . . . . . . . . 3,643 73.7 62 years and over . . . . . . . . . . . . . . . . . . . . . . . . . . . . 1,208 24.4 65 years and over . . . . . . . . . . . . . . . . . . . . . . . . . . . . 985 19.9 Male . . . . . . . . . . . . . . . . . . . . . . . . . . . . . . . . . . . . . . 467 9.4 Female. . . . . . . . . . . . . . . . . . . . . . . . . . . . . . . . . . . . 518 10.5 RACE One race . . . . . . . . . . . . . . . . . . . . . . . . . . . . . . . . . . . . 4,916 99.4 White . . . . . . . . . . . . . . . . . . . . . . . . . . . . . . . . . . . . . 4,745 95.9 Black or African American . . . . . . . . . . . . . . . . . . . 110 2.2 American Indian and Alaska Native . . . . . . . . . . . 20 0.4 Asian . . . . . . . . . . . . . . . . . . . . . . . . . . . . . . . . . . . . . 7 0.1 Asian Indian . . . . . . . . . . . . . . . . . . . . . . . . . . . . . 1 - Chinese . . . . . . . . . . . . . . . . . . . . . . . . . . . . . . . . . 1 - Filipino . . . . . . . . . . . . . . . . . . . . . . . . . . . . . . . . . . 1 - Japanese. . . . . . . . . . . . . . . . . . . . . . . . . . . . . . . . 2 - Korean. . . . . . . . . . . . . . . . . . . . . . . . . . . . . . . . . . - - Vietnamese. . . . . . . . . . . . . . . . . . . . . . . . . . . . . . - - Other Asian 1 . . . . . . . . . . . . . . . . . . . . . . . . . . . . 2 - Native Hawaiian and Other Pacific Islander. . . . - - Native Hawaiian. . . . . . . . . . . . . . . . . . . . . . . . . . - - Guamanian or Chamorro . . . . . . . . . . . . . . . . . . - - Samoan. . . . . . . . . . . . . . . . . . . . . . . . . . . . . . . . . - - Other Pacific Islander 2 . . . . . . . . . . . . . . . . . . . - - Some other race . . . . . . . . . . . . . . . . . . . . . . . . . . . 34 0.7 Two or more races . . . . . . . . . . . . . . . . . . . . . . . . . . . 30 0.6 Race alone or in combination with one or more other races: 3
White . . . . . . . . . . . . . . . . . . . . . . . . . . . . . . . . . . . . . . . 4,773 96.5 Black or African American . . . . . . . . . . . . . . . . . . . . . 113 2.3 American Indian and Alaska Native . . . . . . . . . . . . . 40 0.8 Asian . . . . . . . . . . . . . . . . . . . . . . . . . . . . . . . . . . . . . . . 12 0.2 Native Hawaiian and Other Pacific Islander. . . . . . 1 - Some other race . . . . . . . . . . . . . . . . . . . . . . . . . . . . . 37 0.7 Subject Number Percent HISPANIC OR LATINO AND RACE Total population. . . . . . . . . . . . . . . . . . . . . . . . . . 4,946 100.0 Hispanic or Latino (of any race) . . . . . . . . . . . . . . . . 60 1.2 Mexican. . . . . . . . . . . . . . . . . . . . . . . . . . . . . . . . . . . 8 0.2 Puerto Rican. . . . . . . . . . . . . . . . . . . . . . . . . . . . . . . 1 -

Northwest Pennsylvania Regional Planning & Development Commission CONNECT NW PA Broadband Study and Action Plan Supplemental Report
December 23, 2003 Page 167
Cuban . . . . . . . . . . . . . . . . . . . . . . . . . . . . . . . . . . . . 3 0.1 Other Hispanic or Latino . . . . . . . . . . . . . . . . . . . . 48 1.0 Not Hispanic or Latino . . . . . . . . . . . . . . . . . . . . . . . . 4,886 98.8 White alone. . . . . . . . . . . . . . . . . . . . . . . . . . . . . . . . 4,719 95.4 RELATIONSHIP Total population. . . . . . . . . . . . . . . . . . . . . . . . . . 4,946 100.0 In households. . . . . . . . . . . . . . . . . . . . . . . . . . . . . . . . 4,570 92.4 Householder . . . . . . . . . . . . . . . . . . . . . . . . . . . . . . . 2,000 40.4 Spouse . . . . . . . . . . . . . . . . . . . . . . . . . . . . . . . . . . . 1,113 22.5 Child. . . . . . . . . . . . . . . . . . . . . . . . . . . . . . . . . . . . . . 1,132 22.9 Own child under 18 years . . . . . . . . . . . . . . . . 837 16.9 Other relatives . . . . . . . . . . . . . . . . . . . . . . . . . . . . . 159 3.2 Under 18 years . . . . . . . . . . . . . . . . . . . . . . . . . 67 1.4 Nonrelatives . . . . . . . . . . . . . . . . . . . . . . . . . . . . . . . 166 3.4 Unmarried partner . . . . . . . . . . . . . . . . . . . . . . . 92 1.9 In group quarters . . . . . . . . . . . . . . . . . . . . . . . . . . . . . 376 7.6 Institutionalized population. . . . . . . . . . . . . . . . . . . 95 1.9 Noninstitutionalized population . . . . . . . . . . . . . . . 281 5.7 HOUSEHOLD BY TYPE Total households. . . . . . . . . . . . . . . . . . . . . . . . . 2,000 100.0 Family households (families). . . . . . . . . . . . . . . . . . . 1,328 66.4 With own children under 18 years . . . . . . . . . . 464 23.2 Married-couple family . . . . . . . . . . . . . . . . . . . . . . . 1,113 55.7 With own children under 18 years . . . . . . . . . . 366 18.3 Female householder, no husband present . . . . . 134 6.7 With own children under 18 years . . . . . . . . . . 61 3.1 Nonfamily households . . . . . . . . . . . . . . . . . . . . . . . . 672 33.6 Householder living alone . . . . . . . . . . . . . . . . . . . . 582 29.1 Householder 65 years and over . . . . . . . . . . . . 301 15.1 Households with individuals under 18 years . . . . . 510 25.5 Households with individuals 65 years and over . . 692 34.6 Average household size. . . . . . . . . . . . . . . . . . . . . . . 2.29 (X) Average family size. . . . . . . . . . . . . . . . . . . . . . . . . . . 2.81 (X) HOUSING OCCUPANCY Total housing units. . . . . . . . . . . . . . . . . . . . . . . 8,701 100.0 Occupied housing units . . . . . . . . . . . . . . . . . . . . . . . 2,000 23.0 Vacant housing units. . . . . . . . . . . . . . . . . . . . . . . . . . 6,701 77.0 For seasonal, recreational, or occasional use. . . . . . . . . . . . . . . . . . . . . . . . . . . . 6,560 75.4 Homeowner vacancy rate (percent). . . . . . . . . . . . . 2.2 (X) Rental vacancy rate (percent). . . . . . . . . . . . . . . . . . 6.5 (X) HOUSING TENURE Occupied housing units . . . . . . . . . . . . . . . . . . 2,000 100.0 Owner-occupied housing units . . . . . . . . . . . . . . . . . 1,654 82.7 Renter-occupied housing units . . . . . . . . . . . . . . . . . 346 17.3 Average household size of owner-occupied units. 2.34 (X) Average household size of renter-occupied units . 2.03 (X) - Represents zero or rounds to zero. (X) Not applicable. 1 Other Asian alone, or two or more Asian categories. 2 Other Pacific Islander alone, or two or more Native Hawaiian and Other Pacific Islander categories. 3 In combination with one or more of the other races listed. The six numbers may add to more than the total population and the six percentages may add to more than 100 percent because individuals may report more than one race. Source: U.S. Census Bureau, Census 2000. U.S. Census Bureau 1

Northwest Pennsylvania Regional Planning & Development Commission CONNECT NW PA Broadband Study and Action Plan Supplemental Report
December 23, 2003 Page 168
Table DP-2. Profile of Selected Social Characteristics: 2000 Geographic area: Forest County, Pennsylvania [Data based on a sample. For information on confidentiality protection, sampling error, nonsampling error, and definitions, see text] Subject Number Percent SCHOOL ENROLLMENT Population 3 years and over enrolled in school. . . . . . . . . . . . . . . . . . . . 1,101 100.0 Nursery school, preschool . . . . . . . . . . . . . . . . . . . . . 47 4.3 Kindergarten. . . . . . . . . . . . . . . . . . . . . . . . . . . . . . . . . 52 4.7 Elementary school (grades 1-8) . . . . . . . . . . . . . . . . 505 45.9 High school (grades 9-12) . . . . . . . . . . . . . . . . . . . . . 436 39.6 College or graduate school . . . . . . . . . . . . . . . . . . . . 61 5.5 EDUCATIONAL ATTAINMENT Population 25 years and over . . . . . . . . . . 3,540 100.0 Less than 9th grade . . . . . . . . . . . . . . . . . . . . . . . . . . 190 5.4 9th to 12th grade, no diploma. . . . . . . . . . . . . . . . . . 538 15.2 High school graduate (includes equivalency). . . . . 1,885 53.2 Some college, no degree. . . . . . . . . . . . . . . . . . . . . . 463 13.1 Associate degree. . . . . . . . . . . . . . . . . . . . . . . . . . . . . 149 4.2 Bachelor’s degree . . . . . . . . . . . . . . . . . . . . . . . . . . . . 196 5.5 Graduate or professional degree . . . . . . . . . . . . . . . 119 3.4 Percent high school graduate or higher . . . . . . . . . 79.4 (X) Percent bachelor’s degree or higher . . . . . . . . . . . . 8.9 (X) MARITAL STATUS Population 15 years and over . . . . . . . . . . 4,191 100.0 Never married . . . . . . . . . . . . . . . . . . . . . . . . . . . . . . . 1,049 25.0 Now married, except separated . . . . . . . . . . . . . . . . 2,264 54.0 Separated . . . . . . . . . . . . . . . . . . . . . . . . . . . . . . . . . . . 63 1.5 Widowed . . . . . . . . . . . . . . . . . . . . . . . . . . . . . . . . . . . . 440 10.5 Female. . . . . . . . . . . . . . . . . . . . . . . . . . . . . . . . . . . . 335 8.0 Divorced . . . . . . . . . . . . . . . . . . . . . . . . . . . . . . . . . . . . 375 8.9 Female. . . . . . . . . . . . . . . . . . . . . . . . . . . . . . . . . . . . 149 3.6 GRANDPARENTS AS CAREGIVERS Grandparent living in household with one or more own grandchildren under 18 years . . . . . . . . . . . . . . . . . . . . . . . . . . . . . 70 100.0 Grandparent responsible for grandchildren . . . . . . 32 45.7 VETERAN STATUS Civilian population 18 years and over . . 3,812 100.0 Civilian veterans . . . . . . . . . . . . . . . . . . . . . . . . . . . . . 811 21.3 DISABILITY STATUS OF THE CIVILIAN NONINSTITUTIONALIZED POPULATION Population 5 to 20 years. . . . . . . . . . . . . . . 1,101 100.0 With a disability . . . . . . . . . . . . . . . . . . . . . . . . . . . . . . 79 7.2 Population 21 to 64 years. . . . . . . . . . . . . . 2,633 100.0 With a disability . . . . . . . . . . . . . . . . . . . . . . . . . . . . . . 646 24.5 Percent employed . . . . . . . . . . . . . . . . . . . . . . . . . . 39.0 (X) No disability . . . . . . . . . . . . . . . . . . . . . . . . . . . . . . . . . 1,987 75.5 Percent employed . . . . . . . . . . . . . . . . . . . . . . . . . . 70.3 (X) Population 65 years and over . . . . . . . . . . 875 100.0 With a disability . . . . . . . . . . . . . . . . . . . . . . . . . . . . . . 351 40.1 RESIDENCE IN 1995 Population 5 years and over . . . . . . . . . . . 4,765 100.0 Same house in 1995. . . . . . . . . . . . . . . . . . . . . . . . . . 3,267 68.6 Different house in the U.S. in 1995 . . . . . . . . . . . . . 1,482 31.1 Same county . . . . . . . . . . . . . . . . . . . . . . . . . . . . . . 417 8.8 Different county . . . . . . . . . . . . . . . . . . . . . . . . . . . . 1,065 22.4 Same state . . . . . . . . . . . . . . . . . . . . . . . . . . . . . . 759 15.9 Different state. . . . . . . . . . . . . . . . . . . . . . . . . . . . 306 6.4 Elsewhere in 1995. . . . . . . . . . . . . . . . . . . . . . . . . . . . 16 0.3 Subject Number Percent NATIVITY AND PLACE OF BIRTH Total population. . . . . . . . . . . . . . . . . . . . . . . . . . 4,946 100.0 Native. . . . . . . . . . . . . . . . . . . . . . . . . . . . . . . . . . . . . . . 4,918 99.4 Born in United States . . . . . . . . . . . . . . . . . . . . . . . 4,898 99.0 State of residence . . . . . . . . . . . . . . . . . . . . . . . . 4,143 83.8 Different state. . . . . . . . . . . . . . . . . . . . . . . . . . . . 755 15.3 Born outside United States . . . . . . . . . . . . . . . . . . 20 0.4 Foreign born . . . . . . . . . . . . . . . . . . . . . . . . . . . . . . . . . 28 0.6

Northwest Pennsylvania Regional Planning & Development Commission CONNECT NW PA Broadband Study and Action Plan Supplemental Report
December 23, 2003 Page 169
Entered 1990 to March 2000 . . . . . . . . . . . . . . 11 0.2 Naturalized citizen . . . . . . . . . . . . . . . . . . . . . . . . . . 18 0.4 Not a citizen . . . . . . . . . . . . . . . . . . . . . . . . . . . . . . . 10 0.2 REGION OF BIRTH OF FOREIGN BORN Total (excluding born at sea). . . . . . . . . . . . . . 28 100.0 Europe. . . . . . . . . . . . . . . . . . . . . . . . . . . . . . . . . . . . . . 11 39.3 Asia . . . . . . . . . . . . . . . . . . . . . . . . . . . . . . . . . . . . . . . . - - Africa . . . . . . . . . . . . . . . . . . . . . . . . . . . . . . . . . . . . . . . 2 7.1 Oceania. . . . . . . . . . . . . . . . . . . . . . . . . . . . . . . . . . . . . 3 10.7 Latin America . . . . . . . . . . . . . . . . . . . . . . . . . . . . . . . . 12 42.9 Northern America. . . . . . . . . . . . . . . . . . . . . . . . . . . . . - - LANGUAGE SPOKEN AT HOME Population 5 years and over . . . . . . . . . . . . . . 4,765 100.0 English only . . . . . . . . . . . . . . . . . . . . . . . . . . . . . . . . . 4,617 96.9 Language other than English . . . . . . . . . . . . . . . . . . 148 3.1 Speak English less than ��very well�� . . . . . . . . 23 0.5 Spanish . . . . . . . . . . . . . . . . . . . . . . . . . . . . . . . . . . . 54 1.1 Speak English less than ��very well�� . . . . . . . . 11 0.2 Other Indo-European languages . . . . . . . . . . . . . 76 1.6 Speak English less than ��very well�� . . . . . . . . 10 0.2 Asian and Pacific Island languages. . . . . . . . . . . 2 - Speak English less than ��very well�� . . . . . . . . 2 - ANCESTRY (single or multiple) Total population. . . . . . . . . . . . . . . . . . . . . . . . . . 4,946 100.0 Total ancestries reported . . . . . . . . . . . . . . . . . . . 5,133 103.8 Arab . . . . . . . . . . . . . . . . . . . . . . . . . . . . . . . . . . . . . . . . - - Czech1. . . . . . . . . . . . . . . . . . . . . . . . . . . . . . . . . . . . . . 32 0.6 Danish . . . . . . . . . . . . . . . . . . . . . . . . . . . . . . . . . . . . . . 18 0.4 Dutch . . . . . . . . . . . . . . . . . . . . . . . . . . . . . . . . . . . . . . . 142 2.9 English. . . . . . . . . . . . . . . . . . . . . . . . . . . . . . . . . . . . . . 455 9.2 French (except Basque)1 . . . . . . . . . . . . . . . . . . . . . . 112 2.3 French Canadian1 . . . . . . . . . . . . . . . . . . . . . . . . . . . . 18 0.4 German . . . . . . . . . . . . . . . . . . . . . . . . . . . . . . . . . . . . . 1,783 36.0 Greek. . . . . . . . . . . . . . . . . . . . . . . . . . . . . . . . . . . . . . . 8 0.2 Hungarian . . . . . . . . . . . . . . . . . . . . . . . . . . . . . . . . . . . 81 1.6 Irish1. . . . . . . . . . . . . . . . . . . . . . . . . . . . . . . . . . . . . . . . 886 17.9 Italian . . . . . . . . . . . . . . . . . . . . . . . . . . . . . . . . . . . . . . . 223 4.5 Lithuanian . . . . . . . . . . . . . . . . . . . . . . . . . . . . . . . . . . . 6 0.1 Norwegian. . . . . . . . . . . . . . . . . . . . . . . . . . . . . . . . . . . 4 0.1 Polish . . . . . . . . . . . . . . . . . . . . . . . . . . . . . . . . . . . . . . . 133 2.7 Portuguese . . . . . . . . . . . . . . . . . . . . . . . . . . . . . . . . . . 2 - Russian . . . . . . . . . . . . . . . . . . . . . . . . . . . . . . . . . . . . . 34 0.7 Scotch-Irish. . . . . . . . . . . . . . . . . . . . . . . . . . . . . . . . . . 189 3.8 Scottish . . . . . . . . . . . . . . . . . . . . . . . . . . . . . . . . . . . . . 96 1.9 Slovak . . . . . . . . . . . . . . . . . . . . . . . . . . . . . . . . . . . . . . 36 0.7 Subsaharan African. . . . . . . . . . . . . . . . . . . . . . . . . . . - - Swedish. . . . . . . . . . . . . . . . . . . . . . . . . . . . . . . . . . . . . 106 2.1 Swiss . . . . . . . . . . . . . . . . . . . . . . . . . . . . . . . . . . . . . . . 24 0.5 Ukrainian . . . . . . . . . . . . . . . . . . . . . . . . . . . . . . . . . . . . 13 0.3 United States or American. . . . . . . . . . . . . . . . . . . . . 299 6.0 Welsh. . . . . . . . . . . . . . . . . . . . . . . . . . . . . . . . . . . . . . . 31 0.6 West Indian (excluding Hispanic groups) . . . . . . . . - - Other ancestries . . . . . . . . . . . . . . . . . . . . . . . . . . . . . 402 8.1 -Represents zero or rounds to zero. (X) Not applicable. 1The data represent a combination of two ancestries shown separately in Summary File 3. Czech includes Czechoslovakian. French includes Alsatian. French Canadian includes Acadian/Cajun. Irish includes Celtic. Source: U.S. Bureau of the Census, Census 2000. U.S. Census Bureau 2

Northwest Pennsylvania Regional Planning & Development Commission CONNECT NW PA Broadband Study and Action Plan Supplemental Report
December 23, 2003 Page 170
Table DP-3. Profile of Selected Economic Characteristics: 2000 Geographic area: Forest County, Pennsylvania [Data based on a sample. For information on confidentiality protection, sampling error, nonsampling error, and definitions, see text] Subject Number Percent EMPLOYMENT STATUS Population 16 years and over . . . . . . . . . . . . 4,015 100.0 In labor force . . . . . . . . . . . . . . . . . . . . . . . . . . . . . . . . 1,975 49.2 Civilian labor force. . . . . . . . . . . . . . . . . . . . . . . . . . 1,969 49.0 Employed . . . . . . . . . . . . . . . . . . . . . . . . . . . . . . . 1,830 45.6 Unemployed . . . . . . . . . . . . . . . . . . . . . . . . . . . . . 139 3.5 Percent of civilian labor force . . . . . . . . . . . . 7.1 (X) Armed Forces. . . . . . . . . . . . . . . . . . . . . . . . . . . . . . 6 0.1 Not in labor force. . . . . . . . . . . . . . . . . . . . . . . . . . . . . 2,040 50.8 Females 16 years and over . . . . . . . . . . . . . . 1,985 100.0 In labor force . . . . . . . . . . . . . . . . . . . . . . . . . . . . . . . . 840 42.3 Civilian labor force. . . . . . . . . . . . . . . . . . . . . . . . . . 840 42.3 Employed . . . . . . . . . . . . . . . . . . . . . . . . . . . . . . . 775 39.0 Own children under 6 years. . . . . . . . . . . . . . 204 100.0 All parents in family in labor force . . . . . . . . . . . . . . 129 63.2 COMMUTING TO WORK Workers 16 years and over . . . . . . . . . . . . . . 1,809 100.0 Car, truck, or van - - drove alone . . . . . . . . . . . . . . . 1,339 74.0 Car, truck, or van - - carpooled. . . . . . . . . . . . . . . . . 249 13.8 Public transportation (including taxicab) . . . . . . . . . 17 0.9 Walked. . . . . . . . . . . . . . . . . . . . . . . . . . . . . . . . . . . . . . 111 6.1 Other means. . . . . . . . . . . . . . . . . . . . . . . . . . . . . . . . . 29 1.6 Worked at home . . . . . . . . . . . . . . . . . . . . . . . . . . . . . 64 3.5 Mean travel time to work (minutes)1 . . . . . . . . . . . . 24.4 (X) Employed civilian population 16 years and over . . . . . . . . . . . . . . . . . . . . . 1,830 100.0 OCCUPATION Management, professional, and related occupations . . . . . . . . . . . . . . . . . . . . . . . . . . . . . . . . 432 23.6 Service occupations . . . . . . . . . . . . . . . . . . . . . . . . . . 300 16.4 Sales and office occupations . . . . . . . . . . . . . . . . . . 348 19.0 Farming, fishing, and forestry occupations. . . . . . . 31 1.7 Construction, extraction, and maintenance occupations . . . . . . . . . . . . . . . . . . . . . . . . . . . . . . . . 229 12.5 Production, transportation, and material moving occupations . . . . . . . . . . . . . . . . . . . . . . . . . . . . . . . . 490 26.8 INDUSTRY Agriculture, forestry, fishing and hunting, and mining . . . . . . . . . . . . . . . . . . . . . . . . . . . . . . . . . 89 4.9 Construction . . . . . . . . . . . . . . . . . . . . . . . . . . . . . . . . . 153 8.4 Manufacturing. . . . . . . . . . . . . . . . . . . . . . . . . . . . . . . . 362 19.8 Wholesale trade. . . . . . . . . . . . . . . . . . . . . . . . . . . . . . 20 1.1 Retail trade . . . . . . . . . . . . . . . . . . . . . . . . . . . . . . . . . . 231 12.6 Transportation and warehousing, and utilities . . . . 127 6.9 Information . . . . . . . . . . . . . . . . . . . . . . . . . . . . . . . . . . 27 1.5 Finance, insurance, real estate, and rental and leasing . . . . . . . . . . . . . . . . . . . . . . . . . . . . . . . . . . . . . 31 1.7 Professional, scientific, management, administrative, and waste management services . . . . . . . 59 3.2 Educational, health and social services . . . . . . . . . 331 18.1 Arts, entertainment, recreation, accommodation and food services . . . . . . . . . . . . . . . . . . . . . . . . . . . 184 10.1 Other services (except public administration) . . . . 82 4.5 Public administration. . . . . . . . . . . . . . . . . . . . . . . . . . 134 7.3 CLASS OF WORKER Private wage and salary workers . . . . . . . . . . . . . . . 1,353 73.9 Government workers. . . . . . . . . . . . . . . . . . . . . . . . . . 347 19.0 Self-employed workers in own not incorporated business . . . . . . . . . . . . . . . . . . . . . . . . . . . . . . . . . . . 120 6.6 Unpaid family workers . . . . . . . . . . . . . . . . . . . . . . . . 10 0.5 Subject Number Percent INCOME IN 1999 Households. . . . . . . . . . . . . . . . . . . . . . . . . . . . . 1,996 100.0 Less than $10,000. . . . . . . . . . . . . . . . . . . . . . . . . . . . 268 13.4 $10,000 to $14,999. . . . . . . . . . . . . . . . . . . . . . . . . . . 209 10.5

Northwest Pennsylvania Regional Planning & Development Commission CONNECT NW PA Broadband Study and Action Plan Supplemental Report
December 23, 2003 Page 171
$15,000 to $24,999. . . . . . . . . . . . . . . . . . . . . . . . . . . 437 21.9 $25,000 to $34,999. . . . . . . . . . . . . . . . . . . . . . . . . . . 295 14.8 $35,000 to $49,999. . . . . . . . . . . . . . . . . . . . . . . . . . . 373 18.7 $50,000 to $74,999. . . . . . . . . . . . . . . . . . . . . . . . . . . 283 14.2 $75,000 to $99,999. . . . . . . . . . . . . . . . . . . . . . . . . . . 76 3.8 $100,000 to $149,999. . . . . . . . . . . . . . . . . . . . . . . . . 46 2.3 $150,000 to $199,999. . . . . . . . . . . . . . . . . . . . . . . . . 5 0.3 $200,000 or more . . . . . . . . . . . . . . . . . . . . . . . . . . . . 4 0.2 Median household income (dollars) . . . . . . . . . . . . . 27,581 (X) With earnings . . . . . . . . . . . . . . . . . . . . . . . . . . . . . . . . 1,328 66.5 Mean earnings (dollars)1 . . . . . . . . . . . . . . . . . . . . 34,801 (X) With Social Security income . . . . . . . . . . . . . . . . . . . 833 41.7 Mean Social Security income (dollars)1 . . . . . . . 10,096 (X) With Supplemental Security Income . . . . . . . . . . . . 115 5.8 Mean Supplemental Security Income (dollars)1 . . . . . . . . . . . . . . . . . . . . . . . . . . . . . . . . . 6,419 (X) With public assistance income . . . . . . . . . . . . . . . . . 45 2.3 Mean public assistance income (dollars)1 . . . . . 1,387 (X) With retirement income . . . . . . . . . . . . . . . . . . . . . . . 586 29.4 Mean retirement income (dollars)1. . . . . . . . . . . . 10,739 (X) Families . . . . . . . . . . . . . . . . . . . . . . . . . . . . . . . . 1,320 100.0 Less than $10,000. . . . . . . . . . . . . . . . . . . . . . . . . . . . 98 7.4 $10,000 to $14,999. . . . . . . . . . . . . . . . . . . . . . . . . . . 81 6.1 $15,000 to $24,999. . . . . . . . . . . . . . . . . . . . . . . . . . . 277 21.0 $25,000 to $34,999. . . . . . . . . . . . . . . . . . . . . . . . . . . 215 16.3 $35,000 to $49,999. . . . . . . . . . . . . . . . . . . . . . . . . . . 305 23.1 $50,000 to $74,999. . . . . . . . . . . . . . . . . . . . . . . . . . . 228 17.3 $75,000 to $99,999. . . . . . . . . . . . . . . . . . . . . . . . . . . 69 5.2 $100,000 to $149,999. . . . . . . . . . . . . . . . . . . . . . . . . 40 3.0 $150,000 to $199,999. . . . . . . . . . . . . . . . . . . . . . . . . 5 0.4 $200,000 or more . . . . . . . . . . . . . . . . . . . . . . . . . . . . 2 0.2 Median family income (dollars) . . . . . . . . . . . . . . . . . 34,257 (X) Per capita income (dollars)1 . . . . . . . . . . . . . . . . . . . 14,341 (X) Median earnings (dollars): Male full-time, year-round workers. . . . . . . . . . . . . . 27,925 (X) Female full-time, year-round workers . . . . . . . . . . . 21,025 (X) Subject Number below poverty level Percent below poverty level POVERTY STATUS IN 1999 Families . . . . . . . . . . . . . . . . . . . . . . . . . . . . . . . . 132 10.0 With related children under 18 years. . . . . . . . . . . . 62 12.4 With related children under 5 years. . . . . . . . . . . 21 16.0 Families with female householder, no husband present . . . . . . . . . . . . . . . . . . . . . . . 32 25.6 With related children under 18 years. . . . . . . . . . . . 23 35.4 With related children under 5 years. . . . . . . . . . . 8 38.1 Individuals . . . . . . . . . . . . . . . . . . . . . . . . . . . . . . 779 16.4 18 years and over . . . . . . . . . . . . . . . . . . . . . . . . . . . . 454 12.4 65 years and over . . . . . . . . . . . . . . . . . . . . . . . . . . 86 9.8 Related children under 18 years . . . . . . . . . . . . . . . 141 15.8 Related children 5 to 17 years . . . . . . . . . . . . . . . 105 14.7 Unrelated individuals 15 years and over. . . . . . . . . 366 35.1 -Represents zero or rounds to zero. (X) Not applicable. 1If the denominator of a mean value or per capita value is less than 30, then that value is calculated using a rounded aggregate in the numerator. See text. Source: U.S. Bureau of the Census, Census 2000. U.S. Census Bureau
3

Northwest Pennsylvania Regional Planning & Development Commission CONNECT NW PA Broadband Study and Action Plan Supplemental Report
December 23, 2003 Page 172
Table DP-4. Profile of Selected Housing Characteristics: 2000 Geographic area: Forest County, Pennsylvania [Data based on a sample. For information on confidentiality protection, sampling error, nonsampling error, and definitions, see text] Subject Number Percent Total housing units. . . . . . . . . . . . . . . . . . . . 8,701 100.0 UNITS IN STRUCTURE 1-unit, detached. . . . . . . . . . . . . . . . . . . . . . . . . . . . . . 6,794 78.1 1-unit, attached . . . . . . . . . . . . . . . . . . . . . . . . . . . . . . 22 0.3 2 units . . . . . . . . . . . . . . . . . . . . . . . . . . . . . . . . . . . . . . 25 0.3 3 or 4 units . . . . . . . . . . . . . . . . . . . . . . . . . . . . . . . . . . 7 0.1 5 to 9 units . . . . . . . . . . . . . . . . . . . . . . . . . . . . . . . . . . 9 0.1 10 to 19 units . . . . . . . . . . . . . . . . . . . . . . . . . . . . . . . . 33 0.4 20 or more units . . . . . . . . . . . . . . . . . . . . . . . . . . . . . 57 0.7 Mobile home. . . . . . . . . . . . . . . . . . . . . . . . . . . . . . . . . 1,665 19.1 Boat, RV, van, etc . . . . . . . . . . . . . . . . . . . . . . . . . . . . 89 1.0 YEAR STRUCTURE BUILT 1999 to March 2000 . . . . . . . . . . . . . . . . . . . . . . . . . . 15 0.2 1995 to 1998 . . . . . . . . . . . . . . . . . . . . . . . . . . . . . . . . 439 5.0 1990 to 1994 . . . . . . . . . . . . . . . . . . . . . . . . . . . . . . . . 277 3.2 1980 to 1989 . . . . . . . . . . . . . . . . . . . . . . . . . . . . . . . . 867 10.0 1970 to 1979 . . . . . . . . . . . . . . . . . . . . . . . . . . . . . . . . 757 8.7 1960 to 1969 . . . . . . . . . . . . . . . . . . . . . . . . . . . . . . . . 1,478 17.0 1940 to 1959 . . . . . . . . . . . . . . . . . . . . . . . . . . . . . . . . 3,050 35.1 1939 or earlier . . . . . . . . . . . . . . . . . . . . . . . . . . . . . . . 1,818 20.9 ROOMS 1 room . . . . . . . . . . . . . . . . . . . . . . . . . . . . . . . . . . . . . . 33 0.4 2 rooms . . . . . . . . . . . . . . . . . . . . . . . . . . . . . . . . . . . . . 328 3.8 3 rooms . . . . . . . . . . . . . . . . . . . . . . . . . . . . . . . . . . . . . 911 10.5 4 rooms . . . . . . . . . . . . . . . . . . . . . . . . . . . . . . . . . . . . . 1,865 21.4 5 rooms . . . . . . . . . . . . . . . . . . . . . . . . . . . . . . . . . . . . . 2,076 23.9 6 rooms . . . . . . . . . . . . . . . . . . . . . . . . . . . . . . . . . . . . . 1,719 19.8 7 rooms . . . . . . . . . . . . . . . . . . . . . . . . . . . . . . . . . . . . . 848 9.7 8 rooms . . . . . . . . . . . . . . . . . . . . . . . . . . . . . . . . . . . . . 490 5.6 9 or more rooms . . . . . . . . . . . . . . . . . . . . . . . . . . . . . 431 5.0 Median (rooms) . . . . . . . . . . . . . . . . . . . . . . . . . . . . . . 5.1 (X) Occupied housing units . . . . . . . . . . . . . . . 2,000 100.0 YEAR HOUSEHOLDER MOVED INTO UNIT 1999 to March 2000 . . . . . . . . . . . . . . . . . . . . . . . . . . 224 11.2 1995 to 1998 . . . . . . . . . . . . . . . . . . . . . . . . . . . . . . . . 368 18.4 1990 to 1994 . . . . . . . . . . . . . . . . . . . . . . . . . . . . . . . . 350 17.5 1980 to 1989 . . . . . . . . . . . . . . . . . . . . . . . . . . . . . . . . 440 22.0 1970 to 1979 . . . . . . . . . . . . . . . . . . . . . . . . . . . . . . . . 276 13.8 1969 or earlier . . . . . . . . . . . . . . . . . . . . . . . . . . . . . . . 342 17.1 VEHICLES AVAILABLE None . . . . . . . . . . . . . . . . . . . . . . . . . . . . . . . . . . . . . . . 135 6.8 1 . . . . . . . . . . . . . . . . . . . . . . . . . . . . . . . . . . . . . . . . . . . 708 35.4 2 . . . . . . . . . . . . . . . . . . . . . . . . . . . . . . . . . . . . . . . . . . . 873 43.7 3 or more . . . . . . . . . . . . . . . . . . . . . . . . . . . . . . . . . . . 284 14.2 HOUSE HEATING FUEL Utility gas . . . . . . . . . . . . . . . . . . . . . . . . . . . . . . . . . . . 1,076 53.8 Bottled, tank, or LP gas . . . . . . . . . . . . . . . . . . . . . . . 273 13.7 Electricity. . . . . . . . . . . . . . . . . . . . . . . . . . . . . . . . . . . . 104 5.2 Fuel oil, kerosene, etc . . . . . . . . . . . . . . . . . . . . . . . . 266 13.3 Coal or coke. . . . . . . . . . . . . . . . . . . . . . . . . . . . . . . . . 2 0.1 Wood . . . . . . . . . . . . . . . . . . . . . . . . . . . . . . . . . . . . . . . 259 13.0 Solar energy. . . . . . . . . . . . . . . . . . . . . . . . . . . . . . . . . - - Other fuel . . . . . . . . . . . . . . . . . . . . . . . . . . . . . . . . . . . 20 1.0 No fuel used. . . . . . . . . . . . . . . . . . . . . . . . . . . . . . . . . - - SELECTED CHARACTERISTICS Lacking complete plumbing facilities . . . . . . . . . . . . 36 1.8 Lacking complete kitchen facilities . . . . . . . . . . . . . . 23 1.2 No telephone service . . . . . . . . . . . . . . . . . . . . . . . . . 47 2.4 Subject Number Percent OCCUPANTS PER ROOM Occupied housing units . . . . . . . . . . . . . . . 2,000 100.0 1.00 or less. . . . . . . . . . . . . . . . . . . . . . . . . . . . . . . . . . 1,988 99.4 1.01 to 1.50 . . . . . . . . . . . . . . . . . . . . . . . . . . . . . . . . . 12 0.6 1.51 or more. . . . . . . . . . . . . . . . . . . . . . . . . . . . . . . . . - - Specified owner-occupied units . . . . . . . . 1,213 100.0

Northwest Pennsylvania Regional Planning & Development Commission CONNECT NW PA Broadband Study and Action Plan Supplemental Report
December 23, 2003 Page 173
VALUE Less than $50,000. . . . . . . . . . . . . . . . . . . . . . . . . . . . 498 41.1 $50,000 to $99,999. . . . . . . . . . . . . . . . . . . . . . . . . . . 610 50.3 $100,000 to $149,999. . . . . . . . . . . . . . . . . . . . . . . . . 74 6.1 $150,000 to $199,999. . . . . . . . . . . . . . . . . . . . . . . . . 15 1.2 $200,000 to $299,999. . . . . . . . . . . . . . . . . . . . . . . . . 13 1.1 $300,000 to $499,999. . . . . . . . . . . . . . . . . . . . . . . . . - - $500,000 to $999,999. . . . . . . . . . . . . . . . . . . . . . . . . 3 0.2 $1,000,000 or more. . . . . . . . . . . . . . . . . . . . . . . . . . . - - Median (dollars) . . . . . . . . . . . . . . . . . . . . . . . . . . . . . . 57,300 (X) MORTGAGE STATUS AND SELECTED MONTHLY OWNER COSTS With a mortgage . . . . . . . . . . . . . . . . . . . . . . . . . . . . . 499 41.1 Less than $300 . . . . . . . . . . . . . . . . . . . . . . . . . . 2 0.2 $300 to $499 . . . . . . . . . . . . . . . . . . . . . . . . . . . . 134 11.0 $500 to $699 . . . . . . . . . . . . . . . . . . . . . . . . . . . . 198 16.3 $700 to $999 . . . . . . . . . . . . . . . . . . . . . . . . . . . . 122 10.1 $1,000 to $1,499 . . . . . . . . . . . . . . . . . . . . . . . . . 36 3.0 $1,500 to $1,999 . . . . . . . . . . . . . . . . . . . . . . . . . 5 0.4 $2,000 or more . . . . . . . . . . . . . . . . . . . . . . . . . . 2 0.2 Median (dollars) . . . . . . . . . . . . . . . . . . . . . . . . . . 608 (X) Not mortgaged . . . . . . . . . . . . . . . . . . . . . . . . . . . . . . . 714 58.9 Median (dollars) . . . . . . . . . . . . . . . . . . . . . . . . . . 216 (X) SELECTED MONTHLY OWNER COSTS AS A PERCENTAGE OF HOUSEHOLD INCOME IN 1999 Less than 15.0 percent. . . . . . . . . . . . . . . . . . . . . . . . 615 50.7 15.0 to 19.9 percent . . . . . . . . . . . . . . . . . . . . . . . . . . 198 16.3 20.0 to 24.9 percent . . . . . . . . . . . . . . . . . . . . . . . . . . 116 9.6 25.0 to 29.9 percent . . . . . . . . . . . . . . . . . . . . . . . . . . 101 8.3 30.0 to 34.9 percent . . . . . . . . . . . . . . . . . . . . . . . . . . 50 4.1 35.0 percent or more . . . . . . . . . . . . . . . . . . . . . . . . . 109 9.0 Not computed. . . . . . . . . . . . . . . . . . . . . . . . . . . . . . . . 24 2.0 Specified renter-occupied units . . . . . . . . 329 100.0 GROSS RENT Less than $200 . . . . . . . . . . . . . . . . . . . . . . . . . . . . . . 44 13.4 $200 to $299 . . . . . . . . . . . . . . . . . . . . . . . . . . . . . . . . 41 12.5 $300 to $499 . . . . . . . . . . . . . . . . . . . . . . . . . . . . . . . . 122 37.1 $500 to $749 . . . . . . . . . . . . . . . . . . . . . . . . . . . . . . . . 37 11.2 $750 to $999 . . . . . . . . . . . . . . . . . . . . . . . . . . . . . . . . - - $1,000 to $1,499 . . . . . . . . . . . . . . . . . . . . . . . . . . . . . - - $1,500 or more . . . . . . . . . . . . . . . . . . . . . . . . . . . . . . - - No cash rent. . . . . . . . . . . . . . . . . . . . . . . . . . . . . . . . . 85 25.8 Median (dollars) . . . . . . . . . . . . . . . . . . . . . . . . . . . . . . 337 (X) GROSS RENT AS A PERCENTAGE OF HOUSEHOLD INCOME IN 1999 Less than 15.0 percent. . . . . . . . . . . . . . . . . . . . . . . . 54 16.4 15.0 to 19.9 percent . . . . . . . . . . . . . . . . . . . . . . . . . . 29 8.8 20.0 to 24.9 percent . . . . . . . . . . . . . . . . . . . . . . . . . . 38 11.6 25.0 to 29.9 percent . . . . . . . . . . . . . . . . . . . . . . . . . . 29 8.8 30.0 to 34.9 percent . . . . . . . . . . . . . . . . . . . . . . . . . . 26 7.9 35.0 percent or more . . . . . . . . . . . . . . . . . . . . . . . . . 64 19.5 Not computed. . . . . . . . . . . . . . . . . . . . . . . . . . . . . . . . 89 27.1 -Represents zero or rounds to zero. (X) Not applicable. Source: U.S. Bureau of the Census, Census 2000. U.S. Census Bureau
4

Northwest Pennsylvania Regional Planning & Development Commission CONNECT NW PA Broadband Study and Action Plan Supplemental Report
December 23, 2003 Page 174
Lawrence County
Table DP-1. Profile of General Demographic Characteristics: 2000 Geographic area: Lawrence County, Pennsylvania [For information on confidentiality protection, nonsampling error, and definitions, see text] Subject Number Percent Total population. . . . . . . . . . . . . . . . . . . . . . . . . . 94,643 100.0 SEX AND AGE Male . . . . . . . . . . . . . . . . . . . . . . . . . . . . . . . . . . . . . . . . 44,994 47.5 Female. . . . . . . . . . . . . . . . . . . . . . . . . . . . . . . . . . . . . . 49,649 52.5 Under 5 years . . . . . . . . . . . . . . . . . . . . . . . . . . . . . . . 5,305 5.6 5 to 9 years . . . . . . . . . . . . . . . . . . . . . . . . . . . . . . . . . 6,130 6.5 10 to 14 years . . . . . . . . . . . . . . . . . . . . . . . . . . . . . . . 6,405 6.8 15 to 19 years . . . . . . . . . . . . . . . . . . . . . . . . . . . . . . . 6,686 7.1 20 to 24 years . . . . . . . . . . . . . . . . . . . . . . . . . . . . . . . 5,247 5.5 25 to 34 years . . . . . . . . . . . . . . . . . . . . . . . . . . . . . . . 10,342 10.9 35 to 44 years . . . . . . . . . . . . . . . . . . . . . . . . . . . . . . . 13,990 14.8 45 to 54 years . . . . . . . . . . . . . . . . . . . . . . . . . . . . . . . 13,240 14.0 55 to 59 years . . . . . . . . . . . . . . . . . . . . . . . . . . . . . . . 4,827 5.1 60 to 64 years . . . . . . . . . . . . . . . . . . . . . . . . . . . . . . . 4,248 4.5 65 to 74 years . . . . . . . . . . . . . . . . . . . . . . . . . . . . . . . 8,829 9.3 75 to 84 years . . . . . . . . . . . . . . . . . . . . . . . . . . . . . . . 7,166 7.6 85 years and over . . . . . . . . . . . . . . . . . . . . . . . . . . . . 2,228 2.4 Median age (years) . . . . . . . . . . . . . . . . . . . . . . . . . . . 40.5 (X) 18 years and over . . . . . . . . . . . . . . . . . . . . . . . . . . . . 72,763 76.9 Male . . . . . . . . . . . . . . . . . . . . . . . . . . . . . . . . . . . . . . 33,841 35.8 Female. . . . . . . . . . . . . . . . . . . . . . . . . . . . . . . . . . . . 38,922 41.1 21 years and over . . . . . . . . . . . . . . . . . . . . . . . . . . . . 68,848 72.7 62 years and over . . . . . . . . . . . . . . . . . . . . . . . . . . . . 20,763 21.9 65 years and over . . . . . . . . . . . . . . . . . . . . . . . . . . . . 18,223 19.3 Male . . . . . . . . . . . . . . . . . . . . . . . . . . . . . . . . . . . . . . 7,216 7.6 Female. . . . . . . . . . . . . . . . . . . . . . . . . . . . . . . . . . . . 11,007 11.6 RACE One race . . . . . . . . . . . . . . . . . . . . . . . . . . . . . . . . . . . . 93,848 99.2 White . . . . . . . . . . . . . . . . . . . . . . . . . . . . . . . . . . . . . 89,894 95.0 Black or African American . . . . . . . . . . . . . . . . . . . 3,416 3.6 American Indian and Alaska Native . . . . . . . . . . . 95 0.1 Asian . . . . . . . . . . . . . . . . . . . . . . . . . . . . . . . . . . . . . 258 0.3 Asian Indian . . . . . . . . . . . . . . . . . . . . . . . . . . . . . 44 - Chinese . . . . . . . . . . . . . . . . . . . . . . . . . . . . . . . . . 27 - Filipino . . . . . . . . . . . . . . . . . . . . . . . . . . . . . . . . . . 57 0.1 Japanese. . . . . . . . . . . . . . . . . . . . . . . . . . . . . . . . 18 - Korean. . . . . . . . . . . . . . . . . . . . . . . . . . . . . . . . . . 62 0.1 Vietnamese. . . . . . . . . . . . . . . . . . . . . . . . . . . . . . 24 - Other Asian 1 . . . . . . . . . . . . . . . . . . . . . . . . . . . . 26 - Native Hawaiian and Other Pacific Islander. . . . 9 - Native Hawaiian. . . . . . . . . . . . . . . . . . . . . . . . . . 6 - Guamanian or Chamorro . . . . . . . . . . . . . . . . . . - - Samoan. . . . . . . . . . . . . . . . . . . . . . . . . . . . . . . . . 2 - Other Pacific Islander 2 . . . . . . . . . . . . . . . . . . . 1 - Some other race . . . . . . . . . . . . . . . . . . . . . . . . . . . 176 0.2 Two or more races . . . . . . . . . . . . . . . . . . . . . . . . . . . 795 0.8 Race alone or in combination with one or more other races: 3
White . . . . . . . . . . . . . . . . . . . . . . . . . . . . . . . . . . . . . . . 90,639 95.8 Black or African American . . . . . . . . . . . . . . . . . . . . . 3,834 4.1 American Indian and Alaska Native . . . . . . . . . . . . . 329 0.3 Asian . . . . . . . . . . . . . . . . . . . . . . . . . . . . . . . . . . . . . . . 352 0.4 Native Hawaiian and Other Pacific Islander. . . . . . 18 - Some other race . . . . . . . . . . . . . . . . . . . . . . . . . . . . . 306 0.3 Subject Number Percent HISPANIC OR LATINO AND RACE Total population. . . . . . . . . . . . . . . . . . . . . . . . . . 94,643 100.0 Hispanic or Latino (of any race) . . . . . . . . . . . . . . . . 529 0.6 Mexican. . . . . . . . . . . . . . . . . . . . . . . . . . . . . . . . . . . 169 0.2 Puerto Rican. . . . . . . . . . . . . . . . . . . . . . . . . . . . . . . 171 0.2 Cuban . . . . . . . . . . . . . . . . . . . . . . . . . . . . . . . . . . . . 19 - Other Hispanic or Latino . . . . . . . . . . . . . . . . . . . . 170 0.2

Northwest Pennsylvania Regional Planning & Development Commission CONNECT NW PA Broadband Study and Action Plan Supplemental Report
December 23, 2003 Page 175
Not Hispanic or Latino . . . . . . . . . . . . . . . . . . . . . . . . 94,114 99.4 White alone. . . . . . . . . . . . . . . . . . . . . . . . . . . . . . . . 89,573 94.6 RELATIONSHIP Total population. . . . . . . . . . . . . . . . . . . . . . . . . . 94,643 100.0 In households. . . . . . . . . . . . . . . . . . . . . . . . . . . . . . . . 91,671 96.9 Householder . . . . . . . . . . . . . . . . . . . . . . . . . . . . . . . 37,091 39.2 Spouse . . . . . . . . . . . . . . . . . . . . . . . . . . . . . . . . . . . 20,199 21.3 Child. . . . . . . . . . . . . . . . . . . . . . . . . . . . . . . . . . . . . . 27,827 29.4 Own child under 18 years . . . . . . . . . . . . . . . . 19,944 21.1 Other relatives . . . . . . . . . . . . . . . . . . . . . . . . . . . . . 3,800 4.0 Under 18 years . . . . . . . . . . . . . . . . . . . . . . . . . 1,414 1.5 Nonrelatives . . . . . . . . . . . . . . . . . . . . . . . . . . . . . . . 2,754 2.9 Unmarried partner . . . . . . . . . . . . . . . . . . . . . . . 1,497 1.6 In group quarters . . . . . . . . . . . . . . . . . . . . . . . . . . . . . 2,972 3.1 Institutionalized population. . . . . . . . . . . . . . . . . . . 1,512 1.6 Noninstitutionalized population . . . . . . . . . . . . . . . 1,460 1.5 HOUSEHOLD BY TYPE Total households. . . . . . . . . . . . . . . . . . . . . . . . . 37,091 100.0 Family households (families). . . . . . . . . . . . . . . . . . . 25,886 69.8 With own children under 18 years . . . . . . . . . . 10,690 28.8 Married-couple family . . . . . . . . . . . . . . . . . . . . . . . 20,199 54.5 With own children under 18 years . . . . . . . . . . 7,830 21.1 Female householder, no husband present . . . . . 4,269 11.5 With own children under 18 years . . . . . . . . . . 2,197 5.9 Nonfamily households . . . . . . . . . . . . . . . . . . . . . . . . 11,205 30.2 Householder living alone . . . . . . . . . . . . . . . . . . . . 10,032 27.0 Householder 65 years and over . . . . . . . . . . . . 5,351 14.4 Households with individuals under 18 years . . . . . 11,655 31.4 Households with individuals 65 years and over . . 12,531 33.8 Average household size. . . . . . . . . . . . . . . . . . . . . . . 2.47 (X) Average family size. . . . . . . . . . . . . . . . . . . . . . . . . . . 3.00 (X) HOUSING OCCUPANCY Total housing units. . . . . . . . . . . . . . . . . . . . . . . 39,635 100.0 Occupied housing units . . . . . . . . . . . . . . . . . . . . . . . 37,091 93.6 Vacant housing units. . . . . . . . . . . . . . . . . . . . . . . . . . 2,544 6.4 For seasonal, recreational, or occasional use. . . . . . . . . . . . . . . . . . . . . . . . . . . . 302 0.8 Homeowner vacancy rate (percent). . . . . . . . . . . . . 1.6 (X) Rental vacancy rate (percent). . . . . . . . . . . . . . . . . . 7.4 (X) HOUSING TENURE Occupied housing units . . . . . . . . . . . . . . . . . . 37,091 100.0 Owner-occupied housing units . . . . . . . . . . . . . . . . . 28,673 77.3 Renter-occupied housing units . . . . . . . . . . . . . . . . . 8,418 22.7 Average household size of owner-occupied units. 2.58 (X) Average household size of renter-occupied units . 2.12 (X) - Represents zero or rounds to zero. (X) Not applicable. 1 Other Asian alone, or two or more Asian categories. 2 Other Pacific Islander alone, or two or more Native Hawaiian and Other Pacific Islander categories. 3 In combination with one or more of the other races listed. The six numbers may add to more than the total population and the six percentages may add to more than 100 percent because individuals may report more than one race. Source: U.S. Census Bureau, Census 2000. U.S. Census Bureau 1

Northwest Pennsylvania Regional Planning & Development Commission CONNECT NW PA Broadband Study and Action Plan Supplemental Report
December 23, 2003 Page 176
Table DP-2. Profile of Selected Social Characteristics: 2000 Geographic area: Lawrence County, Pennsylvania [Data based on a sample. For information on confidentiality protection, sampling error, nonsampling error, and definitions, see text] Subject Number Percent SCHOOL ENROLLMENT Population 3 years and over enrolled in school. . . . . . . . . . . . . . . . . . . . 21,804 100.0 Nursery school, preschool . . . . . . . . . . . . . . . . . . . . . 1,247 5.7 Kindergarten. . . . . . . . . . . . . . . . . . . . . . . . . . . . . . . . . 1,232 5.7 Elementary school (grades 1-8) . . . . . . . . . . . . . . . . 10,311 47.3 High school (grades 9-12) . . . . . . . . . . . . . . . . . . . . . 5,098 23.4 College or graduate school . . . . . . . . . . . . . . . . . . . . 3,916 18.0 EDUCATIONAL ATTAINMENT Population 25 years and over . . . . . . . . . . 64,767 100.0 Less than 9th grade . . . . . . . . . . . . . . . . . . . . . . . . . . 3,256 5.0 9th to 12th grade, no diploma. . . . . . . . . . . . . . . . . . 8,677 13.4 High school graduate (includes equivalency). . . . . 29,568 45.7 Some college, no degree. . . . . . . . . . . . . . . . . . . . . . 9,712 15.0 Associate degree. . . . . . . . . . . . . . . . . . . . . . . . . . . . . 3,776 5.8 Bachelor’s degree . . . . . . . . . . . . . . . . . . . . . . . . . . . . 6,437 9.9 Graduate or professional degree . . . . . . . . . . . . . . . 3,341 5.2 Percent high school graduate or higher . . . . . . . . . 81.6 (X) Percent bachelor’s degree or higher . . . . . . . . . . . . 15.1 (X) MARITAL STATUS Population 15 years and over . . . . . . . . . . 76,742 100.0 Never married . . . . . . . . . . . . . . . . . . . . . . . . . . . . . . . 17,952 23.4 Now married, except separated . . . . . . . . . . . . . . . . 43,412 56.6 Separated . . . . . . . . . . . . . . . . . . . . . . . . . . . . . . . . . . . 1,330 1.7 Widowed . . . . . . . . . . . . . . . . . . . . . . . . . . . . . . . . . . . . 7,511 9.8 Female. . . . . . . . . . . . . . . . . . . . . . . . . . . . . . . . . . . . 6,255 8.2 Divorced . . . . . . . . . . . . . . . . . . . . . . . . . . . . . . . . . . . . 6,537 8.5 Female. . . . . . . . . . . . . . . . . . . . . . . . . . . . . . . . . . . . 3,671 4.8 GRANDPARENTS AS CAREGIVERS Grandparent living in household with one or more own grandchildren under 18 years . . . . . . . . . . . . . . . . . . . . . . . . . . . . . 1,395 100.0 Grandparent responsible for grandchildren . . . . . . 593 42.5 VETERAN STATUS Civilian population 18 years and over . . 72,698 100.0 Civilian veterans . . . . . . . . . . . . . . . . . . . . . . . . . . . . . 10,809 14.9 DISABILITY STATUS OF THE CIVILIAN NONINSTITUTIONALIZED POPULATION Population 5 to 20 years. . . . . . . . . . . . . . . 20,062 100.0 With a disability . . . . . . . . . . . . . . . . . . . . . . . . . . . . . . 1,418 7.1 Population 21 to 64 years. . . . . . . . . . . . . . 50,479 100.0 With a disability . . . . . . . . . . . . . . . . . . . . . . . . . . . . . . 9,202 18.2 Percent employed . . . . . . . . . . . . . . . . . . . . . . . . . . 49.9 (X) No disability . . . . . . . . . . . . . . . . . . . . . . . . . . . . . . . . . 41,277 81.8 Percent employed . . . . . . . . . . . . . . . . . . . . . . . . . . 77.1 (X) Population 65 years and over . . . . . . . . . . 17,197 100.0 With a disability . . . . . . . . . . . . . . . . . . . . . . . . . . . . . . 6,374 37.1 RESIDENCE IN 1995 Population 5 years and over . . . . . . . . . . . 89,361 100.0 Same house in 1995. . . . . . . . . . . . . . . . . . . . . . . . . . 60,669 67.9 Different house in the U.S. in 1995 . . . . . . . . . . . . . 28,236 31.6 Same county . . . . . . . . . . . . . . . . . . . . . . . . . . . . . . 18,534 20.7 Different county . . . . . . . . . . . . . . . . . . . . . . . . . . . . 9,702 10.9 Same state . . . . . . . . . . . . . . . . . . . . . . . . . . . . . . 6,023 6.7 Different state. . . . . . . . . . . . . . . . . . . . . . . . . . . . 3,679 4.1 Elsewhere in 1995. . . . . . . . . . . . . . . . . . . . . . . . . . . . 456 0.5 Subject Number Percent NATIVITY AND PLACE OF BIRTH Total population. . . . . . . . . . . . . . . . . . . . . . . . . . 94,643 100.0 Native. . . . . . . . . . . . . . . . . . . . . . . . . . . . . . . . . . . . . . . 93,382 98.7 Born in United States . . . . . . . . . . . . . . . . . . . . . . . 93,016 98.3 State of residence . . . . . . . . . . . . . . . . . . . . . . . . 80,385 84.9 Different state. . . . . . . . . . . . . . . . . . . . . . . . . . . . 12,631 13.3 Born outside United States . . . . . . . . . . . . . . . . . . 366 0.4 Foreign born . . . . . . . . . . . . . . . . . . . . . . . . . . . . . . . . . 1,261 1.3

Northwest Pennsylvania Regional Planning & Development Commission CONNECT NW PA Broadband Study and Action Plan Supplemental Report
December 23, 2003 Page 177
Entered 1990 to March 2000 . . . . . . . . . . . . . . 260 0.3 Naturalized citizen . . . . . . . . . . . . . . . . . . . . . . . . . . 889 0.9 Not a citizen . . . . . . . . . . . . . . . . . . . . . . . . . . . . . . . 372 0.4 REGION OF BIRTH OF FOREIGN BORN Total (excluding born at sea). . . . . . . . . . . . . . 1,261 100.0 Europe. . . . . . . . . . . . . . . . . . . . . . . . . . . . . . . . . . . . . . 773 61.3 Asia . . . . . . . . . . . . . . . . . . . . . . . . . . . . . . . . . . . . . . . . 333 26.4 Africa . . . . . . . . . . . . . . . . . . . . . . . . . . . . . . . . . . . . . . . 5 0.4 Oceania. . . . . . . . . . . . . . . . . . . . . . . . . . . . . . . . . . . . . - - Latin America . . . . . . . . . . . . . . . . . . . . . . . . . . . . . . . . 83 6.6 Northern America. . . . . . . . . . . . . . . . . . . . . . . . . . . . . 67 5.3 LANGUAGE SPOKEN AT HOME Population 5 years and over . . . . . . . . . . . . . . 89,361 100.0 English only . . . . . . . . . . . . . . . . . . . . . . . . . . . . . . . . . 84,856 95.0 Language other than English . . . . . . . . . . . . . . . . . . 4,505 5.0 Speak English less than ��very well�� . . . . . . . . 1,416 1.6 Spanish . . . . . . . . . . . . . . . . . . . . . . . . . . . . . . . . . . . 870 1.0 Speak English less than ��very well�� . . . . . . . . 257 0.3 Other Indo-European languages . . . . . . . . . . . . . 3,334 3.7 Speak English less than ��very well�� . . . . . . . . 1,066 1.2 Asian and Pacific Island languages. . . . . . . . . . . 115 0.1 Speak English less than ��very well�� . . . . . . . . 56 0.1 ANCESTRY (single or multiple) Total population. . . . . . . . . . . . . . . . . . . . . . . . . . 94,643 100.0 Total ancestries reported . . . . . . . . . . . . . . . . . . . 114,282 120.8 Arab . . . . . . . . . . . . . . . . . . . . . . . . . . . . . . . . . . . . . . . . 1,227 1.3 Czech1. . . . . . . . . . . . . . . . . . . . . . . . . . . . . . . . . . . . . . 338 0.4 Danish . . . . . . . . . . . . . . . . . . . . . . . . . . . . . . . . . . . . . . 103 0.1 Dutch . . . . . . . . . . . . . . . . . . . . . . . . . . . . . . . . . . . . . . . 1,844 1.9 English. . . . . . . . . . . . . . . . . . . . . . . . . . . . . . . . . . . . . . 8,946 9.5 French (except Basque)1 . . . . . . . . . . . . . . . . . . . . . . 1,581 1.7 French Canadian1 . . . . . . . . . . . . . . . . . . . . . . . . . . . . 159 0.2 German . . . . . . . . . . . . . . . . . . . . . . . . . . . . . . . . . . . . . 25,193 26.6 Greek. . . . . . . . . . . . . . . . . . . . . . . . . . . . . . . . . . . . . . . 620 0.7 Hungarian . . . . . . . . . . . . . . . . . . . . . . . . . . . . . . . . . . . 1,285 1.4 Irish1. . . . . . . . . . . . . . . . . . . . . . . . . . . . . . . . . . . . . . . . 15,223 16.1 Italian . . . . . . . . . . . . . . . . . . . . . . . . . . . . . . . . . . . . . . . 23,361 24.7 Lithuanian . . . . . . . . . . . . . . . . . . . . . . . . . . . . . . . . . . . 171 0.2 Norwegian. . . . . . . . . . . . . . . . . . . . . . . . . . . . . . . . . . . 189 0.2 Polish . . . . . . . . . . . . . . . . . . . . . . . . . . . . . . . . . . . . . . . 7,468 7.9 Portuguese . . . . . . . . . . . . . . . . . . . . . . . . . . . . . . . . . . 31 - Russian . . . . . . . . . . . . . . . . . . . . . . . . . . . . . . . . . . . . . 797 0.8 Scotch-Irish. . . . . . . . . . . . . . . . . . . . . . . . . . . . . . . . . . 4,716 5.0 Scottish . . . . . . . . . . . . . . . . . . . . . . . . . . . . . . . . . . . . . 1,926 2.0 Slovak . . . . . . . . . . . . . . . . . . . . . . . . . . . . . . . . . . . . . . 2,179 2.3 Subsaharan African. . . . . . . . . . . . . . . . . . . . . . . . . . . 195 0.2 Swedish. . . . . . . . . . . . . . . . . . . . . . . . . . . . . . . . . . . . . 758 0.8 Swiss . . . . . . . . . . . . . . . . . . . . . . . . . . . . . . . . . . . . . . . 205 0.2 Ukrainian . . . . . . . . . . . . . . . . . . . . . . . . . . . . . . . . . . . . 381 0.4 United States or American. . . . . . . . . . . . . . . . . . . . . 3,616 3.8 Welsh. . . . . . . . . . . . . . . . . . . . . . . . . . . . . . . . . . . . . . . 1,969 2.1 West Indian (excluding Hispanic groups) . . . . . . . . 22 - Other ancestries . . . . . . . . . . . . . . . . . . . . . . . . . . . . . 9,779 10.3 -Represents zero or rounds to zero. (X) Not applicable. 1The data represent a combination of two ancestries shown separately in Summary File 3. Czech includes Czechoslovakian. French includes Alsatian. French Canadian includes Acadian/Cajun. Irish includes Celtic. Source: U.S. Bureau of the Census, Census 2000. U.S. Census Bureau 2

Northwest Pennsylvania Regional Planning & Development Commission CONNECT NW PA Broadband Study and Action Plan Supplemental Report
December 23, 2003 Page 178
Table DP-3. Profile of Selected Economic Characteristics: 2000 Geographic area: Lawrence County, Pennsylvania [Data based on a sample. For information on confidentiality protection, sampling error, nonsampling error, and definitions, see text] Subject Number Percent EMPLOYMENT STATUS Population 16 years and over . . . . . . . . . . . . 75,345 100.0 In labor force . . . . . . . . . . . . . . . . . . . . . . . . . . . . . . . . 43,782 58.1 Civilian labor force. . . . . . . . . . . . . . . . . . . . . . . . . . 43,715 58.0 Employed . . . . . . . . . . . . . . . . . . . . . . . . . . . . . . . 41,035 54.5 Unemployed . . . . . . . . . . . . . . . . . . . . . . . . . . . . . 2,680 3.6 Percent of civilian labor force . . . . . . . . . . . . 6.1 (X) Armed Forces. . . . . . . . . . . . . . . . . . . . . . . . . . . . . . 67 0.1 Not in labor force. . . . . . . . . . . . . . . . . . . . . . . . . . . . . 31,563 41.9 Females 16 years and over . . . . . . . . . . . . . . 40,184 100.0 In labor force . . . . . . . . . . . . . . . . . . . . . . . . . . . . . . . . 20,210 50.3 Civilian labor force. . . . . . . . . . . . . . . . . . . . . . . . . . 20,199 50.3 Employed . . . . . . . . . . . . . . . . . . . . . . . . . . . . . . . 18,854 46.9 Own children under 6 years. . . . . . . . . . . . . . 6,299 100.0 All parents in family in labor force . . . . . . . . . . . . . . 3,622 57.5 COMMUTING TO WORK Workers 16 years and over . . . . . . . . . . . . . . 40,285 100.0 Car, truck, or van - - drove alone . . . . . . . . . . . . . . . 33,987 84.4 Car, truck, or van - - carpooled. . . . . . . . . . . . . . . . . 3,197 7.9 Public transportation (including taxicab) . . . . . . . . . 295 0.7 Walked. . . . . . . . . . . . . . . . . . . . . . . . . . . . . . . . . . . . . . 1,342 3.3 Other means. . . . . . . . . . . . . . . . . . . . . . . . . . . . . . . . . 278 0.7 Worked at home . . . . . . . . . . . . . . . . . . . . . . . . . . . . . 1,186 2.9 Mean travel time to work (minutes)1 . . . . . . . . . . . . 21.3 (X) Employed civilian population 16 years and over . . . . . . . . . . . . . . . . . . . . . 41,035 100.0 OCCUPATION Management, professional, and related occupations . . . . . . . . . . . . . . . . . . . . . . . . . . . . . . . . 10,897 26.6 Service occupations . . . . . . . . . . . . . . . . . . . . . . . . . . 6,240 15.2 Sales and office occupations . . . . . . . . . . . . . . . . . . 10,918 26.6 Farming, fishing, and forestry occupations. . . . . . . 172 0.4 Construction, extraction, and maintenance occupations . . . . . . . . . . . . . . . . . . . . . . . . . . . . . . . . 4,329 10.5 Production, transportation, and material moving occupations . . . . . . . . . . . . . . . . . . . . . . . . . . . . . . . . 8,479 20.7 INDUSTRY Agriculture, forestry, fishing and hunting, and mining . . . . . . . . . . . . . . . . . . . . . . . . . . . . . . . . . 540 1.3 Construction . . . . . . . . . . . . . . . . . . . . . . . . . . . . . . . . . 3,037 7.4 Manufacturing. . . . . . . . . . . . . . . . . . . . . . . . . . . . . . . . 6,943 16.9 Wholesale trade. . . . . . . . . . . . . . . . . . . . . . . . . . . . . . 1,626 4.0 Retail trade . . . . . . . . . . . . . . . . . . . . . . . . . . . . . . . . . . 5,463 13.3 Transportation and warehousing, and utilities . . . . 2,943 7.2 Information . . . . . . . . . . . . . . . . . . . . . . . . . . . . . . . . . . 748 1.8 Finance, insurance, real estate, and rental and leasing . . . . . . . . . . . . . . . . . . . . . . . . . . . . . . . . . . . . . 2,080 5.1 Professional, scientific, management, administrative, and waste management services . . . . . . . 2,243 5.5 Educational, health and social services . . . . . . . . . 8,779 21.4 Arts, entertainment, recreation, accommodation and food services . . . . . . . . . . . . . . . . . . . . . . . . . . . 2,980 7.3 Other services (except public administration) . . . . 1,982 4.8 Public administration. . . . . . . . . . . . . . . . . . . . . . . . . . 1,671 4.1 CLASS OF WORKER Private wage and salary workers . . . . . . . . . . . . . . . 33,599 81.9 Government workers. . . . . . . . . . . . . . . . . . . . . . . . . . 4,522 11.0 Self-employed workers in own not incorporated business . . . . . . . . . . . . . . . . . . . . . . . . . . . . . . . . . . . 2,761 6.7 Unpaid family workers . . . . . . . . . . . . . . . . . . . . . . . . 153 0.4 Subject Number Percent INCOME IN 1999 Households. . . . . . . . . . . . . . . . . . . . . . . . . . . . . 37,136 100.0 Less than $10,000. . . . . . . . . . . . . . . . . . . . . . . . . . . . 4,353 11.7 $10,000 to $14,999. . . . . . . . . . . . . . . . . . . . . . . . . . . 3,483 9.4

Northwest Pennsylvania Regional Planning & Development Commission CONNECT NW PA Broadband Study and Action Plan Supplemental Report
December 23, 2003 Page 179
$15,000 to $24,999. . . . . . . . . . . . . . . . . . . . . . . . . . . 6,092 16.4 $25,000 to $34,999. . . . . . . . . . . . . . . . . . . . . . . . . . . 5,400 14.5 $35,000 to $49,999. . . . . . . . . . . . . . . . . . . . . . . . . . . 6,460 17.4 $50,000 to $74,999. . . . . . . . . . . . . . . . . . . . . . . . . . . 6,772 18.2 $75,000 to $99,999. . . . . . . . . . . . . . . . . . . . . . . . . . . 2,486 6.7 $100,000 to $149,999. . . . . . . . . . . . . . . . . . . . . . . . . 1,457 3.9 $150,000 to $199,999. . . . . . . . . . . . . . . . . . . . . . . . . 366 1.0 $200,000 or more . . . . . . . . . . . . . . . . . . . . . . . . . . . . 267 0.7 Median household income (dollars) . . . . . . . . . . . . . 33,152 (X) With earnings . . . . . . . . . . . . . . . . . . . . . . . . . . . . . . . . 26,746 72.0 Mean earnings (dollars)1 . . . . . . . . . . . . . . . . . . . . 43,907 (X) With Social Security income . . . . . . . . . . . . . . . . . . . 13,987 37.7 Mean Social Security income (dollars)1 . . . . . . . 11,727 (X) With Supplemental Security Income . . . . . . . . . . . . 1,860 5.0 Mean Supplemental Security Income (dollars)1 . . . . . . . . . . . . . . . . . . . . . . . . . . . . . . . . . 6,290 (X) With public assistance income . . . . . . . . . . . . . . . . . 1,377 3.7 Mean public assistance income (dollars)1 . . . . . 2,260 (X) With retirement income . . . . . . . . . . . . . . . . . . . . . . . 8,284 22.3 Mean retirement income (dollars)1. . . . . . . . . . . . 12,616 (X) Families . . . . . . . . . . . . . . . . . . . . . . . . . . . . . . . . 26,026 100.0 Less than $10,000. . . . . . . . . . . . . . . . . . . . . . . . . . . . 1,552 6.0 $10,000 to $14,999. . . . . . . . . . . . . . . . . . . . . . . . . . . 1,288 4.9 $15,000 to $24,999. . . . . . . . . . . . . . . . . . . . . . . . . . . 3,503 13.5 $25,000 to $34,999. . . . . . . . . . . . . . . . . . . . . . . . . . . 4,023 15.5 $35,000 to $49,999. . . . . . . . . . . . . . . . . . . . . . . . . . . 5,425 20.8 $50,000 to $74,999. . . . . . . . . . . . . . . . . . . . . . . . . . . 6,074 23.3 $75,000 to $99,999. . . . . . . . . . . . . . . . . . . . . . . . . . . 2,212 8.5 $100,000 to $149,999. . . . . . . . . . . . . . . . . . . . . . . . . 1,376 5.3 $150,000 to $199,999. . . . . . . . . . . . . . . . . . . . . . . . . 341 1.3 $200,000 or more . . . . . . . . . . . . . . . . . . . . . . . . . . . . 232 0.9 Median family income (dollars) . . . . . . . . . . . . . . . . . 41,463 (X) Per capita income (dollars)1 . . . . . . . . . . . . . . . . . . . 16,835 (X) Median earnings (dollars): Male full-time, year-round workers. . . . . . . . . . . . . . 32,526 (X) Female full-time, year-round workers . . . . . . . . . . . 21,600 (X) Subject Number below poverty level Percent below poverty level POVERTY STATUS IN 1999 Families . . . . . . . . . . . . . . . . . . . . . . . . . . . . . . . . 2,320 8.9 With related children under 18 years. . . . . . . . . . . . 1,784 15.4 With related children under 5 years. . . . . . . . . . . 862 20.5 Families with female householder, no husband present . . . . . . . . . . . . . . . . . . . . . . . 1,120 26.9 With related children under 18 years. . . . . . . . . . . . 1,028 43.0 With related children under 5 years. . . . . . . . . . . 433 53.6 Individuals . . . . . . . . . . . . . . . . . . . . . . . . . . . . . . 11,096 12.1 18 years and over . . . . . . . . . . . . . . . . . . . . . . . . . . . . 7,165 10.2 65 years and over . . . . . . . . . . . . . . . . . . . . . . . . . . 1,496 8.7 Related children under 18 years . . . . . . . . . . . . . . . 3,856 18.1 Related children 5 to 17 years . . . . . . . . . . . . . . . 2,735 16.9 Unrelated individuals 15 years and over. . . . . . . . . 3,393 24.4 -Represents zero or rounds to zero. (X) Not applicable. 1If the denominator of a mean value or per capita value is less than 30, then that value is calculated using a rounded aggregate in the numerator. See text. Source: U.S. Bureau of the Census, Census 2000. U.S. Census Bureau
3

Northwest Pennsylvania Regional Planning & Development Commission CONNECT NW PA Broadband Study and Action Plan Supplemental Report
December 23, 2003 Page 180
Table DP-4. Profile of Selected Housing Characteristics: 2000 Geographic area: Lawrence County, Pennsylvania [Data based on a sample. For information on confidentiality protection, sampling error, nonsampling error, and definitions, see text] Subject Number Percent Total housing units. . . . . . . . . . . . . . . . . . . . 39,635 100.0 UNITS IN STRUCTURE 1-unit, detached. . . . . . . . . . . . . . . . . . . . . . . . . . . . . . 29,737 75.0 1-unit, attached . . . . . . . . . . . . . . . . . . . . . . . . . . . . . . 841 2.1 2 units . . . . . . . . . . . . . . . . . . . . . . . . . . . . . . . . . . . . . . 1,729 4.4 3 or 4 units . . . . . . . . . . . . . . . . . . . . . . . . . . . . . . . . . . 1,331 3.4 5 to 9 units . . . . . . . . . . . . . . . . . . . . . . . . . . . . . . . . . . 1,120 2.8 10 to 19 units . . . . . . . . . . . . . . . . . . . . . . . . . . . . . . . . 398 1.0 20 or more units . . . . . . . . . . . . . . . . . . . . . . . . . . . . . 1,121 2.8 Mobile home. . . . . . . . . . . . . . . . . . . . . . . . . . . . . . . . . 3,330 8.4 Boat, RV, van, etc . . . . . . . . . . . . . . . . . . . . . . . . . . . . 28 0.1 YEAR STRUCTURE BUILT 1999 to March 2000 . . . . . . . . . . . . . . . . . . . . . . . . . . 421 1.1 1995 to 1998 . . . . . . . . . . . . . . . . . . . . . . . . . . . . . . . . 1,565 3.9 1990 to 1994 . . . . . . . . . . . . . . . . . . . . . . . . . . . . . . . . 1,300 3.3 1980 to 1989 . . . . . . . . . . . . . . . . . . . . . . . . . . . . . . . . 2,524 6.4 1970 to 1979 . . . . . . . . . . . . . . . . . . . . . . . . . . . . . . . . 4,787 12.1 1960 to 1969 . . . . . . . . . . . . . . . . . . . . . . . . . . . . . . . . 3,567 9.0 1940 to 1959 . . . . . . . . . . . . . . . . . . . . . . . . . . . . . . . . 11,614 29.3 1939 or earlier . . . . . . . . . . . . . . . . . . . . . . . . . . . . . . . 13,857 35.0 ROOMS 1 room . . . . . . . . . . . . . . . . . . . . . . . . . . . . . . . . . . . . . . 298 0.8 2 rooms . . . . . . . . . . . . . . . . . . . . . . . . . . . . . . . . . . . . . 533 1.3 3 rooms . . . . . . . . . . . . . . . . . . . . . . . . . . . . . . . . . . . . . 2,165 5.5 4 rooms . . . . . . . . . . . . . . . . . . . . . . . . . . . . . . . . . . . . . 5,835 14.7 5 rooms . . . . . . . . . . . . . . . . . . . . . . . . . . . . . . . . . . . . . 9,020 22.8 6 rooms . . . . . . . . . . . . . . . . . . . . . . . . . . . . . . . . . . . . . 11,057 27.9 7 rooms . . . . . . . . . . . . . . . . . . . . . . . . . . . . . . . . . . . . . 5,205 13.1 8 rooms . . . . . . . . . . . . . . . . . . . . . . . . . . . . . . . . . . . . . 3,143 7.9 9 or more rooms . . . . . . . . . . . . . . . . . . . . . . . . . . . . . 2,379 6.0 Median (rooms) . . . . . . . . . . . . . . . . . . . . . . . . . . . . . . 5.7 (X) Occupied housing units . . . . . . . . . . . . . . . 37,091 100.0 YEAR HOUSEHOLDER MOVED INTO UNIT 1999 to March 2000 . . . . . . . . . . . . . . . . . . . . . . . . . . 4,358 11.7 1995 to 1998 . . . . . . . . . . . . . . . . . . . . . . . . . . . . . . . . 7,812 21.1 1990 to 1994 . . . . . . . . . . . . . . . . . . . . . . . . . . . . . . . . 5,233 14.1 1980 to 1989 . . . . . . . . . . . . . . . . . . . . . . . . . . . . . . . . 5,802 15.6 1970 to 1979 . . . . . . . . . . . . . . . . . . . . . . . . . . . . . . . . 5,194 14.0 1969 or earlier . . . . . . . . . . . . . . . . . . . . . . . . . . . . . . . 8,692 23.4 VEHICLES AVAILABLE None . . . . . . . . . . . . . . . . . . . . . . . . . . . . . . . . . . . . . . . 3,571 9.6 1 . . . . . . . . . . . . . . . . . . . . . . . . . . . . . . . . . . . . . . . . . . . 12,866 34.7 2 . . . . . . . . . . . . . . . . . . . . . . . . . . . . . . . . . . . . . . . . . . . 14,291 38.5 3 or more . . . . . . . . . . . . . . . . . . . . . . . . . . . . . . . . . . . 6,363 17.2 HOUSE HEATING FUEL Utility gas . . . . . . . . . . . . . . . . . . . . . . . . . . . . . . . . . . . 23,140 62.4 Bottled, tank, or LP gas . . . . . . . . . . . . . . . . . . . . . . . 938 2.5 Electricity. . . . . . . . . . . . . . . . . . . . . . . . . . . . . . . . . . . . 4,249 11.5 Fuel oil, kerosene, etc . . . . . . . . . . . . . . . . . . . . . . . . 7,913 21.3 Coal or coke. . . . . . . . . . . . . . . . . . . . . . . . . . . . . . . . . 131 0.4 Wood . . . . . . . . . . . . . . . . . . . . . . . . . . . . . . . . . . . . . . . 538 1.5 Solar energy. . . . . . . . . . . . . . . . . . . . . . . . . . . . . . . . . - - Other fuel . . . . . . . . . . . . . . . . . . . . . . . . . . . . . . . . . . . 136 0.4 No fuel used. . . . . . . . . . . . . . . . . . . . . . . . . . . . . . . . . 46 0.1 SELECTED CHARACTERISTICS Lacking complete plumbing facilities . . . . . . . . . . . . 360 1.0 Lacking complete kitchen facilities . . . . . . . . . . . . . . 315 0.8 No telephone service . . . . . . . . . . . . . . . . . . . . . . . . . 625 1.7 Subject Number Percent OCCUPANTS PER ROOM Occupied housing units . . . . . . . . . . . . . . . 37,091 100.0 1.00 or less. . . . . . . . . . . . . . . . . . . . . . . . . . . . . . . . . . 36,687 98.9 1.01 to 1.50 . . . . . . . . . . . . . . . . . . . . . . . . . . . . . . . . . 354 1.0 1.51 or more. . . . . . . . . . . . . . . . . . . . . . . . . . . . . . . . . 50 0.1 Specified owner-occupied units . . . . . . . . 23,244 100.0

Northwest Pennsylvania Regional Planning & Development Commission CONNECT NW PA Broadband Study and Action Plan Supplemental Report
December 23, 2003 Page 181
VALUE Less than $50,000. . . . . . . . . . . . . . . . . . . . . . . . . . . . 6,759 29.1 $50,000 to $99,999. . . . . . . . . . . . . . . . . . . . . . . . . . . 10,596 45.6 $100,000 to $149,999. . . . . . . . . . . . . . . . . . . . . . . . . 3,667 15.8 $150,000 to $199,999. . . . . . . . . . . . . . . . . . . . . . . . . 1,451 6.2 $200,000 to $299,999. . . . . . . . . . . . . . . . . . . . . . . . . 629 2.7 $300,000 to $499,999. . . . . . . . . . . . . . . . . . . . . . . . . 119 0.5 $500,000 to $999,999. . . . . . . . . . . . . . . . . . . . . . . . . 15 0.1 $1,000,000 or more. . . . . . . . . . . . . . . . . . . . . . . . . . . 8 - Median (dollars) . . . . . . . . . . . . . . . . . . . . . . . . . . . . . . 72,200 (X) MORTGAGE STATUS AND SELECTED MONTHLY OWNER COSTS With a mortgage . . . . . . . . . . . . . . . . . . . . . . . . . . . . . 12,008 51.7 Less than $300 . . . . . . . . . . . . . . . . . . . . . . . . . . 80 0.3 $300 to $499 . . . . . . . . . . . . . . . . . . . . . . . . . . . . 1,411 6.1 $500 to $699 . . . . . . . . . . . . . . . . . . . . . . . . . . . . 3,447 14.8 $700 to $999 . . . . . . . . . . . . . . . . . . . . . . . . . . . . 3,999 17.2 $1,000 to $1,499 . . . . . . . . . . . . . . . . . . . . . . . . . 2,319 10.0 $1,500 to $1,999 . . . . . . . . . . . . . . . . . . . . . . . . . 527 2.3 $2,000 or more . . . . . . . . . . . . . . . . . . . . . . . . . . 225 1.0 Median (dollars) . . . . . . . . . . . . . . . . . . . . . . . . . . 762 (X) Not mortgaged . . . . . . . . . . . . . . . . . . . . . . . . . . . . . . . 11,236 48.3 Median (dollars) . . . . . . . . . . . . . . . . . . . . . . . . . . 297 (X) SELECTED MONTHLY OWNER COSTS AS A PERCENTAGE OF HOUSEHOLD INCOME IN 1999 Less than 15.0 percent. . . . . . . . . . . . . . . . . . . . . . . . 10,191 43.8 15.0 to 19.9 percent . . . . . . . . . . . . . . . . . . . . . . . . . . 3,902 16.8 20.0 to 24.9 percent . . . . . . . . . . . . . . . . . . . . . . . . . . 2,849 12.3 25.0 to 29.9 percent . . . . . . . . . . . . . . . . . . . . . . . . . . 1,895 8.2 30.0 to 34.9 percent . . . . . . . . . . . . . . . . . . . . . . . . . . 1,298 5.6 35.0 percent or more . . . . . . . . . . . . . . . . . . . . . . . . . 2,899 12.5 Not computed. . . . . . . . . . . . . . . . . . . . . . . . . . . . . . . . 210 0.9 Specified renter-occupied units . . . . . . . . 8,240 100.0 GROSS RENT Less than $200 . . . . . . . . . . . . . . . . . . . . . . . . . . . . . . 931 11.3 $200 to $299 . . . . . . . . . . . . . . . . . . . . . . . . . . . . . . . . 1,056 12.8 $300 to $499 . . . . . . . . . . . . . . . . . . . . . . . . . . . . . . . . 2,969 36.0 $500 to $749 . . . . . . . . . . . . . . . . . . . . . . . . . . . . . . . . 1,927 23.4 $750 to $999 . . . . . . . . . . . . . . . . . . . . . . . . . . . . . . . . 300 3.6 $1,000 to $1,499 . . . . . . . . . . . . . . . . . . . . . . . . . . . . . 77 0.9 $1,500 or more . . . . . . . . . . . . . . . . . . . . . . . . . . . . . . 31 0.4 No cash rent. . . . . . . . . . . . . . . . . . . . . . . . . . . . . . . . . 949 11.5 Median (dollars) . . . . . . . . . . . . . . . . . . . . . . . . . . . . . . 424 (X) GROSS RENT AS A PERCENTAGE OF HOUSEHOLD INCOME IN 1999 Less than 15.0 percent. . . . . . . . . . . . . . . . . . . . . . . . 1,420 17.2 15.0 to 19.9 percent . . . . . . . . . . . . . . . . . . . . . . . . . . 984 11.9 20.0 to 24.9 percent . . . . . . . . . . . . . . . . . . . . . . . . . . 824 10.0 25.0 to 29.9 percent . . . . . . . . . . . . . . . . . . . . . . . . . . 899 10.9 30.0 to 34.9 percent . . . . . . . . . . . . . . . . . . . . . . . . . . 652 7.9 35.0 percent or more . . . . . . . . . . . . . . . . . . . . . . . . . 2,369 28.8 Not computed. . . . . . . . . . . . . . . . . . . . . . . . . . . . . . . . 1,092 13.3 -Represents zero or rounds to zero. (X) Not applicable. Source: U.S. Bureau of the Census, Census 2000. U.S. Census Bureau 4

Northwest Pennsylvania Regional Planning & Development Commission CONNECT NW PA Broadband Study and Action Plan Supplemental Report
December 23, 2003 Page 182
Mercer County
Table DP-1. Profile of General Demographic Characteristics: 2000 Geographic area: Mercer County, Pennsylvania [For information on confidentiality protection, nonsampling error, and definitions, see text] Subject Number Percent Total population. . . . . . . . . . . . . . . . . . . . . . . . . . 120,293 100.0 SEX AND AGE Male . . . . . . . . . . . . . . . . . . . . . . . . . . . . . . . . . . . . . . . . 58,523 48.7 Female. . . . . . . . . . . . . . . . . . . . . . . . . . . . . . . . . . . . . . 61,770 51.3 Under 5 years . . . . . . . . . . . . . . . . . . . . . . . . . . . . . . . 6,915 5.7 5 to 9 years . . . . . . . . . . . . . . . . . . . . . . . . . . . . . . . . . 7,615 6.3 10 to 14 years . . . . . . . . . . . . . . . . . . . . . . . . . . . . . . . 8,339 6.9 15 to 19 years . . . . . . . . . . . . . . . . . . . . . . . . . . . . . . . 8,976 7.5 20 to 24 years . . . . . . . . . . . . . . . . . . . . . . . . . . . . . . . 7,097 5.9 25 to 34 years . . . . . . . . . . . . . . . . . . . . . . . . . . . . . . . 13,505 11.2 35 to 44 years . . . . . . . . . . . . . . . . . . . . . . . . . . . . . . . 17,857 14.8 45 to 54 years . . . . . . . . . . . . . . . . . . . . . . . . . . . . . . . 16,537 13.7 55 to 59 years . . . . . . . . . . . . . . . . . . . . . . . . . . . . . . . 6,285 5.2 60 to 64 years . . . . . . . . . . . . . . . . . . . . . . . . . . . . . . . 5,427 4.5 65 to 74 years . . . . . . . . . . . . . . . . . . . . . . . . . . . . . . . 10,904 9.1 75 to 84 years . . . . . . . . . . . . . . . . . . . . . . . . . . . . . . . 8,198 6.8 85 years and over . . . . . . . . . . . . . . . . . . . . . . . . . . . . 2,638 2.2 Median age (years) . . . . . . . . . . . . . . . . . . . . . . . . . . . 39.6 (X) 18 years and over . . . . . . . . . . . . . . . . . . . . . . . . . . . . 92,109 76.6 Male . . . . . . . . . . . . . . . . . . . . . . . . . . . . . . . . . . . . . . 43,836 36.4 Female. . . . . . . . . . . . . . . . . . . . . . . . . . . . . . . . . . . . 48,273 40.1 21 years and over . . . . . . . . . . . . . . . . . . . . . . . . . . . . 86,671 72.0 62 years and over . . . . . . . . . . . . . . . . . . . . . . . . . . . . 24,909 20.7 65 years and over . . . . . . . . . . . . . . . . . . . . . . . . . . . . 21,740 18.1 Male . . . . . . . . . . . . . . . . . . . . . . . . . . . . . . . . . . . . . . 8,852 7.4 Female. . . . . . . . . . . . . . . . . . . . . . . . . . . . . . . . . . . . 12,888 10.7 RACE One race . . . . . . . . . . . . . . . . . . . . . . . . . . . . . . . . . . . . 119,193 99.1 White . . . . . . . . . . . . . . . . . . . . . . . . . . . . . . . . . . . . . 112,031 93.1 Black or African American . . . . . . . . . . . . . . . . . . . 6,318 5.3 American Indian and Alaska Native . . . . . . . . . . . 127 0.1 Asian . . . . . . . . . . . . . . . . . . . . . . . . . . . . . . . . . . . . . 486 0.4 Asian Indian . . . . . . . . . . . . . . . . . . . . . . . . . . . . . 120 0.1 Chinese . . . . . . . . . . . . . . . . . . . . . . . . . . . . . . . . . 104 0.1 Filipino . . . . . . . . . . . . . . . . . . . . . . . . . . . . . . . . . . 41 - Japanese. . . . . . . . . . . . . . . . . . . . . . . . . . . . . . . . 57 - Korean. . . . . . . . . . . . . . . . . . . . . . . . . . . . . . . . . . 91 0.1 Vietnamese. . . . . . . . . . . . . . . . . . . . . . . . . . . . . . 30 - Other Asian 1 . . . . . . . . . . . . . . . . . . . . . . . . . . . . 43 - Native Hawaiian and Other Pacific Islander. . . . 27 - Native Hawaiian. . . . . . . . . . . . . . . . . . . . . . . . . . 5 - Guamanian or Chamorro . . . . . . . . . . . . . . . . . . 7 - Samoan. . . . . . . . . . . . . . . . . . . . . . . . . . . . . . . . . 8 - Other Pacific Islander 2 . . . . . . . . . . . . . . . . . . . 7 - Some other race . . . . . . . . . . . . . . . . . . . . . . . . . . . 204 0.2 Two or more races . . . . . . . . . . . . . . . . . . . . . . . . . . . 1,100 0.9 Race alone or in combination with one or more other races: 3
White . . . . . . . . . . . . . . . . . . . . . . . . . . . . . . . . . . . . . . . 113,036 94.0 Black or African American . . . . . . . . . . . . . . . . . . . . . 6,869 5.7 American Indian and Alaska Native . . . . . . . . . . . . . 511 0.4 Asian . . . . . . . . . . . . . . . . . . . . . . . . . . . . . . . . . . . . . . . 656 0.5 Native Hawaiian and Other Pacific Islander. . . . . . 59 - Some other race . . . . . . . . . . . . . . . . . . . . . . . . . . . . . 358 0.3 Subject Number Percent HISPANIC OR LATINO AND RACE Total population. . . . . . . . . . . . . . . . . . . . . . . . . . 120,293 100.0 Hispanic or Latino (of any race) . . . . . . . . . . . . . . . . 803 0.7 Mexican. . . . . . . . . . . . . . . . . . . . . . . . . . . . . . . . . . . 199 0.2 Puerto Rican. . . . . . . . . . . . . . . . . . . . . . . . . . . . . . . 315 0.3 Cuban . . . . . . . . . . . . . . . . . . . . . . . . . . . . . . . . . . . . 42 - Other Hispanic or Latino . . . . . . . . . . . . . . . . . . . . 247 0.2

Northwest Pennsylvania Regional Planning & Development Commission CONNECT NW PA Broadband Study and Action Plan Supplemental Report
December 23, 2003 Page 183
Not Hispanic or Latino . . . . . . . . . . . . . . . . . . . . . . . . 119,490 99.3 White alone. . . . . . . . . . . . . . . . . . . . . . . . . . . . . . . . 111,507 92.7 RELATIONSHIP Total population. . . . . . . . . . . . . . . . . . . . . . . . . . 120,293 100.0 In households. . . . . . . . . . . . . . . . . . . . . . . . . . . . . . . . 113,931 94.7 Householder . . . . . . . . . . . . . . . . . . . . . . . . . . . . . . . 46,712 38.8 Spouse . . . . . . . . . . . . . . . . . . . . . . . . . . . . . . . . . . . 25,609 21.3 Child. . . . . . . . . . . . . . . . . . . . . . . . . . . . . . . . . . . . . . 33,638 28.0 Own child under 18 years . . . . . . . . . . . . . . . . 25,372 21.1 Other relatives . . . . . . . . . . . . . . . . . . . . . . . . . . . . . 4,083 3.4 Under 18 years . . . . . . . . . . . . . . . . . . . . . . . . . 1,680 1.4 Nonrelatives . . . . . . . . . . . . . . . . . . . . . . . . . . . . . . . 3,889 3.2 Unmarried partner . . . . . . . . . . . . . . . . . . . . . . . 2,011 1.7 In group quarters . . . . . . . . . . . . . . . . . . . . . . . . . . . . . 6,362 5.3 Institutionalized population. . . . . . . . . . . . . . . . . . . 3,065 2.5 Noninstitutionalized population . . . . . . . . . . . . . . . 3,297 2.7 HOUSEHOLD BY TYPE Total households. . . . . . . . . . . . . . . . . . . . . . . . . 46,712 100.0 Family households (families). . . . . . . . . . . . . . . . . . . 32,387 69.3 With own children under 18 years . . . . . . . . . . 13,689 29.3 Married-couple family . . . . . . . . . . . . . . . . . . . . . . . 25,609 54.8 With own children under 18 years . . . . . . . . . . 9,993 21.4 Female householder, no husband present . . . . . 5,094 10.9 With own children under 18 years . . . . . . . . . . 2,848 6.1 Nonfamily households . . . . . . . . . . . . . . . . . . . . . . . . 14,325 30.7 Householder living alone . . . . . . . . . . . . . . . . . . . . 12,597 27.0 Householder 65 years and over . . . . . . . . . . . . 6,169 13.2 Households with individuals under 18 years . . . . . 14,883 31.9 Households with individuals 65 years and over . . 14,672 31.4 Average household size. . . . . . . . . . . . . . . . . . . . . . . 2.44 (X) Average family size. . . . . . . . . . . . . . . . . . . . . . . . . . . 2.96 (X) HOUSING OCCUPANCY Total housing units. . . . . . . . . . . . . . . . . . . . . . . 49,859 100.0 Occupied housing units . . . . . . . . . . . . . . . . . . . . . . . 46,712 93.7 Vacant housing units. . . . . . . . . . . . . . . . . . . . . . . . . . 3,147 6.3 For seasonal, recreational, or occasional use. . . . . . . . . . . . . . . . . . . . . . . . . . . . 482 1.0 Homeowner vacancy rate (percent). . . . . . . . . . . . . 1.5 (X) Rental vacancy rate (percent). . . . . . . . . . . . . . . . . . 6.7 (X) HOUSING TENURE Occupied housing units . . . . . . . . . . . . . . . . . . 46,712 100.0 Owner-occupied housing units . . . . . . . . . . . . . . . . . 35,646 76.3 Renter-occupied housing units . . . . . . . . . . . . . . . . . 11,066 23.7 Average household size of owner-occupied units. 2.54 (X) Average household size of renter-occupied units . 2.12 (X) - Represents zero or rounds to zero. (X) Not applicable. 1 Other Asian alone, or two or more Asian categories. 2 Other Pacific Islander alone, or two or more Native Hawaiian and Other Pacific Islander categories. 3 In combination with one or more of the other races listed. The six numbers may add to more than the total population and the six percentages may add to more than 100 percent because individuals may report more than one race. Source: U.S. Census Bureau, Census 2000. U.S. Census Bureau 1

Northwest Pennsylvania Regional Planning & Development Commission CONNECT NW PA Broadband Study and Action Plan Supplemental Report
December 23, 2003 Page 184
Table DP-2. Profile of Selected Social Characteristics: 2000 Geographic area: Mercer County, Pennsylvania [Data based on a sample. For information on confidentiality protection, sampling error, nonsampling error, and definitions, see text] Subject Number Percent SCHOOL ENROLLMENT Population 3 years and over enrolled in school. . . . . . . . . . . . . . . . . . . . 29,378 100.0 Nursery school, preschool . . . . . . . . . . . . . . . . . . . . . 1,576 5.4 Kindergarten. . . . . . . . . . . . . . . . . . . . . . . . . . . . . . . . . 1,464 5.0 Elementary school (grades 1-8) . . . . . . . . . . . . . . . . 13,313 45.3 High school (grades 9-12) . . . . . . . . . . . . . . . . . . . . . 7,104 24.2 College or graduate school . . . . . . . . . . . . . . . . . . . . 5,921 20.2 EDUCATIONAL ATTAINMENT Population 25 years and over . . . . . . . . . . 81,499 100.0 Less than 9th grade . . . . . . . . . . . . . . . . . . . . . . . . . . 3,975 4.9 9th to 12th grade, no diploma. . . . . . . . . . . . . . . . . . 9,921 12.2 High school graduate (includes equivalency). . . . . 36,823 45.2 Some college, no degree. . . . . . . . . . . . . . . . . . . . . . 12,285 15.1 Associate degree. . . . . . . . . . . . . . . . . . . . . . . . . . . . . 4,402 5.4 Bachelor’s degree . . . . . . . . . . . . . . . . . . . . . . . . . . . . 9,191 11.3 Graduate or professional degree . . . . . . . . . . . . . . . 4,902 6.0 Percent high school graduate or higher . . . . . . . . . 82.9 (X) Percent bachelor’s degree or higher . . . . . . . . . . . . 17.3 (X) MARITAL STATUS Population 15 ye ars and over . . . . . . . . . . 97,365 100.0 Never married . . . . . . . . . . . . . . . . . . . . . . . . . . . . . . . 22,419 23.0 Now married, except separated . . . . . . . . . . . . . . . . 55,203 56.7 Separated . . . . . . . . . . . . . . . . . . . . . . . . . . . . . . . . . . . 2,202 2.3 Widowed . . . . . . . . . . . . . . . . . . . . . . . . . . . . . . . . . . . . 8,906 9.1 Female. . . . . . . . . . . . . . . . . . . . . . . . . . . . . . . . . . . . 6,910 7.1 Divorced . . . . . . . . . . . . . . . . . . . . . . . . . . . . . . . . . . . . 8,635 8.9 Female. . . . . . . . . . . . . . . . . . . . . . . . . . . . . . . . . . . . 4,652 4.8 GRANDPARENTS AS CAREGIVERS Grandparent living in household with one or more own grandchildren under 18 years . . . . . . . . . . . . . . . . . . . . . . . . . . . . . 1,865 100.0 Grandparent responsible for grandchildren . . . . . . 794 42.6 VETERAN STATUS Civilian population 18 years and over . . 92,053 100.0 Civilian veterans . . . . . . . . . . . . . . . . . . . . . . . . . . . . . 13,775 15.0 DISABILITY STATUS OF THE CIVILIAN NONINSTITUTIONALIZED POPULATION Population 5 to 20 years. . . . . . . . . . . . . . . 26,129 100.0 With a disability . . . . . . . . . . . . . . . . . . . . . . . . . . . . . . 1,995 7.6 Population 21 to 64 years. . . . . . . . . . . . . . 63,840 100.0 With a disability . . . . . . . . . . . . . . . . . . . . . . . . . . . . . . 11,404 17.9 Percent employed . . . . . . . . . . . . . . . . . . . . . . . . . . 52.6 (X) No disability . . . . . . . . . . . . . . . . . . . . . . . . . . . . . . . . . 52,436 82.1 Percent employed . . . . . . . . . . . . . . . . . . . . . . . . . . 77.1 (X) Population 65 years and over . . . . . . . . . . 20,407 100.0 With a disability . . . . . . . . . . . . . . . . . . . . . . . . . . . . . . 7,566 37.1 RESIDENCE IN 1995 Population 5 years and over . . . . . . . . . . . 113,496 100.0 Same house in 1995. . . . . . . . . . . . . . . . . . . . . . . . . . 74,164 65.3 Different house in the U.S. in 1995 . . . . . . . . . . . . . 38,919 34.3 Same county . . . . . . . . . . . . . . . . . . . . . . . . . . . . . . 24,324 21.4 Different county . . . . . . . . . . . . . . . . . . . . . . . . . . . . 14,595 12.9 Same state . . . . . . . . . . . . . . . . . . . . . . . . . . . . . . 7,826 6.9 Different state. . . . . . . . . . . . . . . . . . . . . . . . . . . . 6,769 6.0 Elsewhere in 1995. . . . . . . . . . . . . . . . . . . . . . . . . . . . 413 0.4 Subject Number Percent NATIVITY AND PLACE OF BIRTH Total population. . . . . . . . . . . . . . . . . . . . . . . . . . 120,293 100.0 Native. . . . . . . . . . . . . . . . . . . . . . . . . . . . . . . . . . . . . . . 118,337 98.4 Born in United States . . . . . . . . . . . . . . . . . . . . . . . 117,640 97.8 State of residence . . . . . . . . . . . . . . . . . . . . . . . . 97,859 81.4 Different state. . . . . . . . . . . . . . . . . . . . . . . . . . . . 19,781 16.4 Born outside United States . . . . . . . . . . . . . . . . . . 697 0.6 Foreign born . . . . . . . . . . . . . . . . . . . . . . . . . . . . . . . . . 1,956 1.6

Northwest Pennsylvania Regional Planning & Development Commission CONNECT NW PA Broadband Study and Action Plan Supplemental Report
December 23, 2003 Page 185
Entered 1990 to March 2000 . . . . . . . . . . . . . . 397 0.3 Naturalized citizen . . . . . . . . . . . . . . . . . . . . . . . . . . 1,331 1.1 Not a citizen . . . . . . . . . . . . . . . . . . . . . . . . . . . . . . . 625 0.5 REGION OF BIRTH OF FOREIGN BORN Total (excluding born at sea). . . . . . . . . . . . . . 1,956 100.0 Europe. . . . . . . . . . . . . . . . . . . . . . . . . . . . . . . . . . . . . . 951 48.6 Asia . . . . . . . . . . . . . . . . . . . . . . . . . . . . . . . . . . . . . . . . 636 32.5 Africa . . . . . . . . . . . . . . . . . . . . . . . . . . . . . . . . . . . . . . . 33 1.7 Oceania. . . . . . . . . . . . . . . . . . . . . . . . . . . . . . . . . . . . . 2 0.1 Latin America . . . . . . . . . . . . . . . . . . . . . . . . . . . . . . . . 184 9.4 Northern America. . . . . . . . . . . . . . . . . . . . . . . . . . . . . 150 7.7 LANGUAGE SPOKEN AT HOME Population 5 years and over . . . . . . . . . . . . . . 113,496 100.0 English only . . . . . . . . . . . . . . . . . . . . . . . . . . . . . . . . . 108,034 95.2 Language other than English . . . . . . . . . . . . . . . . . . 5,462 4.8 Speak English less than ��very well�� . . . . . . . . 2,005 1.8 Spanish . . . . . . . . . . . . . . . . . . . . . . . . . . . . . . . . . . . 1,269 1.1 Speak English less than ��very well�� . . . . . . . . 400 0.4 Other Indo-European languages . . . . . . . . . . . . . 3,580 3.2 Speak English less than ��very well�� . . . . . . . . 1,360 1.2 Asian and Pacific Island languages. . . . . . . . . . . 401 0.4 Speak English less than ��very well�� . . . . . . . . 202 0.2 ANCESTRY (single or multiple) Total population. . . . . . . . . . . . . . . . . . . . . . . . . . 120,293 100.0 Total ancestries reported . . . . . . . . . . . . . . . . . . . 135,820 112.9 Arab . . . . . . . . . . . . . . . . . . . . . . . . . . . . . . . . . . . . . . . . 341 0.3 Czech1. . . . . . . . . . . . . . . . . . . . . . . . . . . . . . . . . . . . . . 859 0.7 Danish . . . . . . . . . . . . . . . . . . . . . . . . . . . . . . . . . . . . . . 100 0.1 Dutch . . . . . . . . . . . . . . . . . . . . . . . . . . . . . . . . . . . . . . . 3,545 2.9 English. . . . . . . . . . . . . . . . . . . . . . . . . . . . . . . . . . . . . . 13,991 11.6 French (except Basque)1 . . . . . . . . . . . . . . . . . . . . . . 2,241 1.9 French Canadian1 . . . . . . . . . . . . . . . . . . . . . . . . . . . . 243 0.2 German . . . . . . . . . . . . . . . . . . . . . . . . . . . . . . . . . . . . . 33,033 27.5 Greek. . . . . . . . . . . . . . . . . . . . . . . . . . . . . . . . . . . . . . . 398 0.3 Hungarian . . . . . . . . . . . . . . . . . . . . . . . . . . . . . . . . . . . 2,587 2.2 Irish1. . . . . . . . . . . . . . . . . . . . . . . . . . . . . . . . . . . . . . . . 17,839 14.8 Italian . . . . . . . . . . . . . . . . . . . . . . . . . . . . . . . . . . . . . . . 13,281 11.0 Lithuanian . . . . . . . . . . . . . . . . . . . . . . . . . . . . . . . . . . . 255 0.2 Norwegian. . . . . . . . . . . . . . . . . . . . . . . . . . . . . . . . . . . 356 0.3 Polish . . . . . . . . . . . . . . . . . . . . . . . . . . . . . . . . . . . . . . . 5,514 4.6 Portuguese . . . . . . . . . . . . . . . . . . . . . . . . . . . . . . . . . . 46 - Russian . . . . . . . . . . . . . . . . . . . . . . . . . . . . . . . . . . . . . 691 0.6 Scotch-Irish. . . . . . . . . . . . . . . . . . . . . . . . . . . . . . . . . . 5,373 4.5 Scottish . . . . . . . . . . . . . . . . . . . . . . . . . . . . . . . . . . . . . 2,593 2.2 Slovak . . . . . . . . . . . . . . . . . . . . . . . . . . . . . . . . . . . . . . 5,332 4.4 Subsaharan African. . . . . . . . . . . . . . . . . . . . . . . . . . . 59 - Swedish. . . . . . . . . . . . . . . . . . . . . . . . . . . . . . . . . . . . . 1,311 1.1 Swiss . . . . . . . . . . . . . . . . . . . . . . . . . . . . . . . . . . . . . . . 312 0.3 Ukrainian . . . . . . . . . . . . . . . . . . . . . . . . . . . . . . . . . . . . 622 0.5 United States or American. . . . . . . . . . . . . . . . . . . . . 6,409 5.3 Welsh. . . . . . . . . . . . . . . . . . . . . . . . . . . . . . . . . . . . . . . 2,829 2.4 West Indian (excluding Hispanic groups) . . . . . . . . 109 0.1 Other ancestries . . . . . . . . . . . . . . . . . . . . . . . . . . . . . 15,551 12.9 -Represents zero or rounds to zero. (X) Not applicable. 1The data represent a combination of two ancestries shown separately in Summary File 3. Czech includes Czechoslovakian. French includes Alsatian. French Canadian includes Acadian/Cajun. Irish includes Celtic. Source: U.S. Bureau of the Census, Census 2000. U.S. Census Bureau 2

Northwest Pennsylvania Regional Planning & Development Commission CONNECT NW PA Broadband Study and Action Plan Supplemental Report
December 23, 2003 Page 186
Table DP-3. Profile of Selected Economic Characteristics: 2000 Geographic area: Mercer County, Pennsylvania [Data based on a sample. For information on confidentiality protection, sampling error, nonsampling error, and definitions, see text] Subject Number Percent EMPLOYMENT STATUS Population 16 years and over . . . . . . . . . . . . 95,664 100.0 In labor force . . . . . . . . . . . . . . . . . . . . . . . . . . . . . . . . 55,551 58.1 Civilian labor force. . . . . . . . . . . . . . . . . . . . . . . . . . 55,495 58.0 Employed . . . . . . . . . . . . . . . . . . . . . . . . . . . . . . . 52,142 54.5 Unemployed . . . . . . . . . . . . . . . . . . . . . . . . . . . . . 3,353 3.5 Percent of civilian labor force . . . . . . . . . . . . 6.0 (X) Armed Forces. . . . . . . . . . . . . . . . . . . . . . . . . . . . . . 56 0.1 Not in labor force. . . . . . . . . . . . . . . . . . . . . . . . . . . . . 40,113 41.9 Females 16 years and over . . . . . . . . . . . . . . 50,100 100.0 In labor force . . . . . . . . . . . . . . . . . . . . . . . . . . . . . . . . 25,877 51.7 Civilian labor force. . . . . . . . . . . . . . . . . . . . . . . . . . 25,868 51.6 Employed . . . . . . . . . . . . . . . . . . . . . . . . . . . . . . . 24,613 49.1 Own children under 6 years. . . . . . . . . . . . . . 7,765 100.0 All parents in family in labor force . . . . . . . . . . . . . . 4,758 61.3 COMMUTING TO WORK Workers 16 years and over . . . . . . . . . . . . . . 51,120 100.0 Car, truck, or van - - drove alone . . . . . . . . . . . . . . . 42,534 83.2 Car, truck, or van - - carpooled. . . . . . . . . . . . . . . . . 4,725 9.2 Public transportation (including taxicab) . . . . . . . . . 177 0.3 Walked. . . . . . . . . . . . . . . . . . . . . . . . . . . . . . . . . . . . . . 1,611 3.2 Other means. . . . . . . . . . . . . . . . . . . . . . . . . . . . . . . . . 428 0.8 Worked at home . . . . . . . . . . . . . . . . . . . . . . . . . . . . . 1,645 3.2 Mean travel time to work (minutes)1 . . . . . . . . . . . . 19.6 (X) Employed civilian population 16 years and over . . . . . . . . . . . . . . . . . . . . . 52,142 100.0 OCCUPATION Management, professional, and related occupations . . . . . . . . . . . . . . . . . . . . . . . . . . . . . . . . 14,392 27.6 Service occupations . . . . . . . . . . . . . . . . . . . . . . . . . . 9,001 17.3 Sales and office occupations . . . . . . . . . . . . . . . . . . 13,203 25.3 Farming, fishing, and forestry occupations. . . . . . . 319 0.6 Construction, extraction, and maintenance occupations . . . . . . . . . . . . . . . . . . . . . . . . . . . . . . . . 4,281 8.2 Production, transportation, and material moving occupations . . . . . . . . . . . . . . . . . . . . . . . . . . . . . . . . 10,946 21.0 INDUSTRY Agriculture, forestry, fishing and hunting, and mining . . . . . . . . . . . . . . . . . . . . . . . . . . . . . . . . . 850 1.6 Construction . . . . . . . . . . . . . . . . . . . . . . . . . . . . . . . . . 2,642 5.1 Manufacturing. . . . . . . . . . . . . . . . . . . . . . . . . . . . . . . . 10,501 20.1 Wholesale trade. . . . . . . . . . . . . . . . . . . . . . . . . . . . . . 1,984 3.8 Retail trade . . . . . . . . . . . . . . . . . . . . . . . . . . . . . . . . . . 6,970 13.4 Transportation and warehousing, and utilities . . . . 2,594 5.0 Information . . . . . . . . . . . . . . . . . . . . . . . . . . . . . . . . . . 835 1.6 Finance, insurance, real estate, and rental and leasing . . . . . . . . . . . . . . . . . . . . . . . . . . . . . . . . . . . . . 2,179 4.2 Professional, scientific, management, administrative, and waste management services . . . . . . . 2,425 4.7 Educational, health and social services . . . . . . . . . 12,362 23.7 Arts , entertainment, recreation, accommodation and food services . . . . . . . . . . . . . . . . . . . . . . . . . . . 4,036 7.7 Other services (except public administration) . . . . 2,588 5.0 Public administration. . . . . . . . . . . . . . . . . . . . . . . . . . 2,176 4.2 CLASS OF WORKER Private wage and salary workers . . . . . . . . . . . . . . . 42,591 81.7 Government workers. . . . . . . . . . . . . . . . . . . . . . . . . . 5,774 11.1 Self-employed workers in own not incorporated business . . . . . . . . . . . . . . . . . . . . . . . . . . . . . . . . . . . 3,528 6.8 Unpaid family workers . . . . . . . . . . . . . . . . . . . . . . . . 249 0.5 Subject Number Percent INCOME IN 1999 Households. . . . . . . . . . . . . . . . . . . . . . . . . . . . . 46,755 100.0 Less than $10,000. . . . . . . . . . . . . . . . . . . . . . . . . . . . 4,486 9.6 $10,000 to $14,999. . . . . . . . . . . . . . . . . . . . . . . . . . . 3,613 7.7

Northwest Pennsylvania Regional Planning & Development Commission CONNECT NW PA Broadband Study and Action Plan Supplemental Report
December 23, 2003 Page 187
$15,000 to $24,999. . . . . . . . . . . . . . . . . . . . . . . . . . . 7,974 17.1 $25,000 to $34,999. . . . . . . . . . . . . . . . . . . . . . . . . . . 7,527 16.1 $35,000 to $49,999. . . . . . . . . . . . . . . . . . . . . . . . . . . 8,732 18.7 $50,000 to $74,999. . . . . . . . . . . . . . . . . . . . . . . . . . . 8,629 18.5 $75,000 to $99,999. . . . . . . . . . . . . . . . . . . . . . . . . . . 3,246 6.9 $100,000 to $149,999. . . . . . . . . . . . . . . . . . . . . . . . . 1,614 3.5 $150,000 to $199,999. . . . . . . . . . . . . . . . . . . . . . . . . 430 0.9 $200,000 or more . . . . . . . . . . . . . . . . . . . . . . . . . . . . 504 1.1 Median household income (dollars) . . . . . . . . . . . . . 34,666 (X) With earnings . . . . . . . . . . . . . . . . . . . . . . . . . . . . . . . . 34,441 73.7 Mean earnings (dollars)1 . . . . . . . . . . . . . . . . . . . . 43,973 (X) With Social Security income . . . . . . . . . . . . . . . . . . . 16,267 34.8 Mean Social Security income (dollars)1 . . . . . . . 12,159 (X) With Supplemental Security Income . . . . . . . . . . . . 2,303 4.9 Mean Supplemental Security Income (dollars)1 . . . . . . . . . . . . . . . . . . . . . . . . . . . . . . . . . 6,514 (X) With public assistance income . . . . . . . . . . . . . . . . . 1,493 3.2 Mean public assistance income (dollars)1 . . . . . 2,791 (X) With retirement income . . . . . . . . . . . . . . . . . . . . . . . 11,325 24.2 Mean retirement income (dollars)1. . . . . . . . . . . . 13,910 (X) Families . . . . . . . . . . . . . . . . . . . . . . . . . . . . . . . . 32,494 100.0 Less than $10,000. . . . . . . . . . . . . . . . . . . . . . . . . . . . 1,813 5.6 $10,000 to $14,999. . . . . . . . . . . . . . . . . . . . . . . . . . . 1,357 4.2 $15,000 to $24,999. . . . . . . . . . . . . . . . . . . . . . . . . . . 4,462 13.7 $25,000 to $34,999. . . . . . . . . . . . . . . . . . . . . . . . . . . 5,295 16.3 $35,000 to $49,999. . . . . . . . . . . . . . . . . . . . . . . . . . . 6,853 21.1 $50,000 to $74,999. . . . . . . . . . . . . . . . . . . . . . . . . . . 7,466 23.0 $75,000 to $99,999. . . . . . . . . . . . . . . . . . . . . . . . . . . 2,960 9.1 $100,000 to $149,999. . . . . . . . . . . . . . . . . . . . . . . . . 1,495 4.6 $150,000 to $199,999. . . . . . . . . . . . . . . . . . . . . . . . . 400 1.2 $200,000 or more . . . . . . . . . . . . . . . . . . . . . . . . . . . . 393 1.2 Median family income (dollars) . . . . . . . . . . . . . . . . . 41,776 (X) Per capita income (dollars)1 . . . . . . . . . . . . . . . . . . . 17,636 (X) Median earnings (dollars): Male full-time, year-round workers. . . . . . . . . . . . . . 33,743 (X) Female full-time, year-round workers . . . . . . . . . . . 21,842 (X) Subject Number below poverty level Percent below poverty level POVERTY STATUS IN 1999 Families . . . . . . . . . . . . . . . . . . . . . . . . . . . . . . . . 2,850 8.8 With related children under 18 years. . . . . . . . . . . . 2,219 14.9 With related children under 5 years. . . . . . . . . . . 1,056 19.3 Families with female householder, no husband present . . . . . . . . . . . . . . . . . . . . . . . 1,605 32.0 With related children under 18 years. . . . . . . . . . . . 1,494 46.1 With related children under 5 years. . . . . . . . . . . 745 63.8 Individuals . . . . . . . . . . . . . . . . . . . . . . . . . . . . . . 13,092 11.5 18 years and over . . . . . . . . . . . . . . . . . . . . . . . . . . . . 8,229 9.5 65 years and over . . . . . . . . . . . . . . . . . . . . . . . . . . 1,460 7.2 Related children under 18 years . . . . . . . . . . . . . . . 4,717 17.5 Related children 5 to 17 years . . . . . . . . . . . . . . . 3,347 16.5 Unrelated individuals 15 years and over. . . . . . . . . 3,899 21.6 -Represents zero or rounds to zero. (X) Not applicable. 1If the denominator of a mean value or per capita value is less than 30, then that value is calculated using a rounded aggregate in the numerator. See text. Source: U.S. Bureau of the Census, Census 2000. U.S. Census Bureau
3

Northwest Pennsylvania Regional Planning & Development Commission CONNECT NW PA Broadband Study and Action Plan Supplemental Report
December 23, 2003 Page 188
Table DP-4. Profile of Selected Housing Characteristics: 2000 Geographic area: Mercer County, Pennsylvania [Data based on a sample. For information on confidentiality protection, sampling error, nonsampling error, and definitions, see text] Subject Number Percent Total housing units. . . . . . . . . . . . . . . . . . . . 49,859 100.0 UNITS IN STRUCTURE 1-unit, detached. . . . . . . . . . . . . . . . . . . . . . . . . . . . . . 36,684 73.6 1-unit, attached . . . . . . . . . . . . . . . . . . . . . . . . . . . . . . 829 1.7 2 units . . . . . . . . . . . . . . . . . . . . . . . . . . . . . . . . . . . . . . 2,084 4.2 3 or 4 units . . . . . . . . . . . . . . . . . . . . . . . . . . . . . . . . . . 1,655 3.3 5 to 9 units . . . . . . . . . . . . . . . . . . . . . . . . . . . . . . . . . . 1,668 3.3 10 to 19 units . . . . . . . . . . . . . . . . . . . . . . . . . . . . . . . . 922 1.8 20 or more units . . . . . . . . . . . . . . . . . . . . . . . . . . . . . 1,284 2.6 Mobile home. . . . . . . . . . . . . . . . . . . . . . . . . . . . . . . . . 4,721 9.5 Boat, RV, van, etc . . . . . . . . . . . . . . . . . . . . . . . . . . . . 12 - YEAR STRUCTURE BUILT 1999 to March 2000 . . . . . . . . . . . . . . . . . . . . . . . . . . 419 0.8 1995 to 1998 . . . . . . . . . . . . . . . . . . . . . . . . . . . . . . . . 2,116 4.2 1990 to 1994 . . . . . . . . . . . . . . . . . . . . . . . . . . . . . . . . 2,051 4.1 1980 to 1989 . . . . . . . . . . . . . . . . . . . . . . . . . . . . . . . . 3,678 7.4 1970 to 1979 . . . . . . . . . . . . . . . . . . . . . . . . . . . . . . . . 7,028 14.1 1960 to 1969 . . . . . . . . . . . . . . . . . . . . . . . . . . . . . . . . 5,647 11.3 1940 to 1959 . . . . . . . . . . . . . . . . . . . . . . . . . . . . . . . . 12,940 26.0 1939 or earlier . . . . . . . . . . . . . . . . . . . . . . . . . . . . . . . 15,980 32.1 ROOMS 1 room . . . . . . . . . . . . . . . . . . . . . . . . . . . . . . . . . . . . . . 212 0.4 2 rooms . . . . . . . . . . . . . . . . . . . . . . . . . . . . . . . . . . . . . 536 1.1 3 rooms . . . . . . . . . . . . . . . . . . . . . . . . . . . . . . . . . . . . . 2,940 5.9 4 rooms . . . . . . . . . . . . . . . . . . . . . . . . . . . . . . . . . . . . . 6,546 13.1 5 rooms . . . . . . . . . . . . . . . . . . . . . . . . . . . . . . . . . . . . . 11,461 23.0 6 rooms . . . . . . . . . . . . . . . . . . . . . . . . . . . . . . . . . . . . . 12,992 26.1 7 rooms . . . . . . . . . . . . . . . . . . . . . . . . . . . . . . . . . . . . . 7,397 14.8 8 rooms . . . . . . . . . . . . . . . . . . . . . . . . . . . . . . . . . . . . . 4,179 8.4 9 or more rooms . . . . . . . . . . . . . . . . . . . . . . . . . . . . . 3,596 7.2 Median (rooms) . . . . . . . . . . . . . . . . . . . . . . . . . . . . . . 5.7 (X) Occupied housing units . . . . . . . . . . . . . . . 46,712 100.0 YEAR HOUSEHOLDER MOVED INTO UNIT 1999 to March 2000 . . . . . . . . . . . . . . . . . . . . . . . . . . 6,163 13.2 1995 to 1998 . . . . . . . . . . . . . . . . . . . . . . . . . . . . . . . . 10,273 22.0 1990 to 1994 . . . . . . . . . . . . . . . . . . . . . . . . . . . . . . . . 7,190 15.4 1980 to 1989 . . . . . . . . . . . . . . . . . . . . . . . . . . . . . . . . 7,776 16.6 1970 to 1979 . . . . . . . . . . . . . . . . . . . . . . . . . . . . . . . . 5,955 12.7 1969 or earlier . . . . . . . . . . . . . . . . . . . . . . . . . . . . . . . 9,355 20.0 VEHICLES AVAILABLE None . . . . . . . . . . . . . . . . . . . . . . . . . . . . . . . . . . . . . . . 3,688 7.9 1 . . . . . . . . . . . . . . . . . . . . . . . . . . . . . . . . . . . . . . . . . . . 17,395 37.2 2 . . . . . . . . . . . . . . . . . . . . . . . . . . . . . . . . . . . . . . . . . . . 18,548 39.7 3 or more . . . . . . . . . . . . . . . . . . . . . . . . . . . . . . . . . . . 7,081 15.2 HOUSE HEATING FUEL Utility gas . . . . . . . . . . . . . . . . . . . . . . . . . . . . . . . . . . . 31,744 68.0 Bottled, tank, or LP gas . . . . . . . . . . . . . . . . . . . . . . . 1,283 2.7 Electricity. . . . . . . . . . . . . . . . . . . . . . . . . . . . . . . . . . . . 4,819 10.3 Fuel oil, kerosene, etc . . . . . . . . . . . . . . . . . . . . . . . . 7,161 15.3 Coal or coke. . . . . . . . . . . . . . . . . . . . . . . . . . . . . . . . . 74 0.2 Wood . . . . . . . . . . . . . . . . . . . . . . . . . . . . . . . . . . . . . . . 1,287 2.8 Solar energy. . . . . . . . . . . . . . . . . . . . . . . . . . . . . . . . . 2 - Other fuel . . . . . . . . . . . . . . . . . . . . . . . . . . . . . . . . . . . 270 0.6 No fuel used. . . . . . . . . . . . . . . . . . . . . . . . . . . . . . . . . 72 0.2 SELECTED CHARACTERISTICS Lacking complete plumbing facilities . . . . . . . . . . . . 466 1.0 Lacking complete kitchen facilities . . . . . . . . . . . . . . 438 0.9 No telephone service . . . . . . . . . . . . . . . . . . . . . . . . . 912 2.0 Subject Number Percent OCCUPANTS PER ROOM Occupied housing units . . . . . . . . . . . . . . . 46,712 100.0 1.00 or less. . . . . . . . . . . . . . . . . . . . . . . . . . . . . . . . . . 46,214 98.9 1.01 to 1.50 . . . . . . . . . . . . . . . . . . . . . . . . . . . . . . . . . 397 0.8 1.51 or more. . . . . . . . . . . . . . . . . . . . . . . . . . . . . . . . . 101 0.2 Specified owner-occupied units . . . . . . . . 27,133 100.0

Northwest Pennsylvania Regional Planning & Development Commission CONNECT NW PA Broadband Study and Action Plan Supplemental Report
December 23, 2003 Page 189
VALUE Less than $50,000. . . . . . . . . . . . . . . . . . . . . . . . . . . . 6,575 24.2 $50,000 to $99,999. . . . . . . . . . . . . . . . . . . . . . . . . . . 12,780 47.1 $100,000 to $149,999. . . . . . . . . . . . . . . . . . . . . . . . . 5,055 18.6 $150,000 to $199,999. . . . . . . . . . . . . . . . . . . . . . . . . 1,589 5.9 $200,000 to $299,999. . . . . . . . . . . . . . . . . . . . . . . . . 813 3.0 $300,000 to $499,999. . . . . . . . . . . . . . . . . . . . . . . . . 219 0.8 $500,000 to $999,999. . . . . . . . . . . . . . . . . . . . . . . . . 89 0.3 $1,000,000 or more. . . . . . . . . . . . . . . . . . . . . . . . . . . 13 - Median (dollars) . . . . . . . . . . . . . . . . . . . . . . . . . . . . . . 76,000 (X) MORTGAGE STATUS AND SEL ECTED MONTHLY OWNER COSTS With a mortgage . . . . . . . . . . . . . . . . . . . . . . . . . . . . . 14,579 53.7 Less than $300 . . . . . . . . . . . . . . . . . . . . . . . . . . 102 0.4 $300 to $499 . . . . . . . . . . . . . . . . . . . . . . . . . . . . 1,613 5.9 $500 to $699 . . . . . . . . . . . . . . . . . . . . . . . . . . . . 4,206 15.5 $700 to $999 . . . . . . . . . . . . . . . . . . . . . . . . . . . . 4,748 17.5 $1,000 to $1,499 . . . . . . . . . . . . . . . . . . . . . . . . . 2,791 10.3 $1,500 to $1,999 . . . . . . . . . . . . . . . . . . . . . . . . . 758 2.8 $2,000 or more . . . . . . . . . . . . . . . . . . . . . . . . . . 361 1.3 Median (dollars) . . . . . . . . . . . . . . . . . . . . . . . . . . 771 (X) Not mortgaged . . . . . . . . . . . . . . . . . . . . . . . . . . . . . . . 12,554 46.3 Median (dollars) . . . . . . . . . . . . . . . . . . . . . . . . . . 286 (X) SELECTED MONTHLY OWNER COSTS AS A PERCENTAGE OF HOUSEHOLD INCOME IN 1999 Less than 15.0 percent. . . . . . . . . . . . . . . . . . . . . . . . 12,270 45.2 15.0 to 19.9 percent . . . . . . . . . . . . . . . . . . . . . . . . . . 4,777 17.6 20.0 to 24.9 percent . . . . . . . . . . . . . . . . . . . . . . . . . . 3,427 12.6 25.0 to 29.9 percent . . . . . . . . . . . . . . . . . . . . . . . . . . 1,990 7.3 30.0 to 34.9 percent . . . . . . . . . . . . . . . . . . . . . . . . . . 1,319 4.9 35.0 percent or more . . . . . . . . . . . . . . . . . . . . . . . . . 3,144 11.6 Not computed. . . . . . . . . . . . . . . . . . . . . . . . . . . . . . . . 206 0.8 Specified renter-occupied units . . . . . . . . 10,707 100.0 GROSS RENT Less than $200 . . . . . . . . . . . . . . . . . . . . . . . . . . . . . . 942 8.8 $200 to $299 . . . . . . . . . . . . . . . . . . . . . . . . . . . . . . . . 1,215 11.3 $300 to $499 . . . . . . . . . . . . . . . . . . . . . . . . . . . . . . . . 3,999 37.3 $500 to $749 . . . . . . . . . . . . . . . . . . . . . . . . . . . . . . . . 3,236 30.2 $750 to $999 . . . . . . . . . . . . . . . . . . . . . . . . . . . . . . . . 374 3.5 $1,000 to $1,499 . . . . . . . . . . . . . . . . . . . . . . . . . . . . . 38 0.4 $1,500 or more . . . . . . . . . . . . . . . . . . . . . . . . . . . . . . 37 0.3 No cash rent. . . . . . . . . . . . . . . . . . . . . . . . . . . . . . . . . 866 8.1 Median (dollars) . . . . . . . . . . . . . . . . . . . . . . . . . . . . . . 443 (X) GROSS RENT AS A PERCENTAGE OF HOUSEHOLD INCOME IN 1999 Less than 15.0 percent. . . . . . . . . . . . . . . . . . . . . . . . 2,107 19.7 15.0 to 19.9 percent . . . . . . . . . . . . . . . . . . . . . . . . . . 1,545 14.4 20.0 to 24.9 percent . . . . . . . . . . . . . . . . . . . . . . . . . . 1,282 12.0 25.0 to 29.9 percent . . . . . . . . . . . . . . . . . . . . . . . . . . 1,097 10.2 30.0 to 34.9 percent . . . . . . . . . . . . . . . . . . . . . . . . . . 806 7.5 35.0 percent or more . . . . . . . . . . . . . . . . . . . . . . . . . 2,801 26.2 Not computed. . . . . . . . . . . . . . . . . . . . . . . . . . . . . . . . 1,069 10.0 -Represents zero or rounds to zero. (X) Not applicable. Source: U.S. Bureau of the Census, Census 2000. U.S. Census Bureau 4

Northwest Pennsylvania Regional Planning & Development Commission CONNECT NW PA Broadband Study and Action Plan Supplemental Report
December 23, 2003 Page 190
Venango County
Table DP-1. Profile of General Demographic Characteristics: 2000 Geographic area: Venango County, Pennsylvania [For information on confidentiality protection, nonsampling error, and definitions, see text] Subject Number Percent Total population. . . . . . . . . . . . . . . . . . . . . . . . . . 57,565 100.0 SEX AND AGE Male . . . . . . . . . . . . . . . . . . . . . . . . . . . . . . . . . . . . . . . . 28,103 48.8 Female. . . . . . . . . . . . . . . . . . . . . . . . . . . . . . . . . . . . . . 29,462 51.2 Under 5 years . . . . . . . . . . . . . . . . . . . . . . . . . . . . . . . 3,268 5.7 5 to 9 years . . . . . . . . . . . . . . . . . . . . . . . . . . . . . . . . . 3,725 6.5 10 to 14 years . . . . . . . . . . . . . . . . . . . . . . . . . . . . . . . 4,224 7.3 15 to 19 years . . . . . . . . . . . . . . . . . . . . . . . . . . . . . . . 4,183 7.3 20 to 24 years . . . . . . . . . . . . . . . . . . . . . . . . . . . . . . . 2,709 4.7 25 to 34 years . . . . . . . . . . . . . . . . . . . . . . . . . . . . . . . 6,351 11.0 35 to 44 years . . . . . . . . . . . . . . . . . . . . . . . . . . . . . . . 8,992 15.6 45 to 54 years . . . . . . . . . . . . . . . . . . . . . . . . . . . . . . . 8,551 14.9 55 to 59 years . . . . . . . . . . . . . . . . . . . . . . . . . . . . . . . 3,125 5.4 60 to 64 years . . . . . . . . . . . . . . . . . . . . . . . . . . . . . . . 2,780 4.8 65 to 74 years . . . . . . . . . . . . . . . . . . . . . . . . . . . . . . . 5,269 9.2 75 to 84 years . . . . . . . . . . . . . . . . . . . . . . . . . . . . . . . 3,321 5.8 85 years and over . . . . . . . . . . . . . . . . . . . . . . . . . . . . 1,067 1.9 Median age (years) . . . . . . . . . . . . . . . . . . . . . . . . . . . 40.2 (X) 18 years and over . . . . . . . . . . . . . . . . . . . . . . . . . . . . 43,618 75.8 Male . . . . . . . . . . . . . . . . . . . . . . . . . . . . . . . . . . . . . . 20,915 36.3 Female. . . . . . . . . . . . . . . . . . . . . . . . . . . . . . . . . . . . 22,703 39.4 21 years and over . . . . . . . . . . . . . . . . . . . . . . . . . . . . 41,636 72.3 62 years and over . . . . . . . . . . . . . . . . . . . . . . . . . . . . 11,310 19.6 65 years and over . . . . . . . . . . . . . . . . . . . . . . . . . . . . 9,657 16.8 Male . . . . . . . . . . . . . . . . . . . . . . . . . . . . . . . . . . . . . . 4,003 7.0 Female. . . . . . . . . . . . . . . . . . . . . . . . . . . . . . . . . . . . 5,654 9.8 RACE One race . . . . . . . . . . . . . . . . . . . . . . . . . . . . . . . . . . . . 57,180 99.3 White . . . . . . . . . . . . . . . . . . . . . . . . . . . . . . . . . . . . . 56,208 97.6 Black or African American . . . . . . . . . . . . . . . . . . . 626 1.1 American Indian and Alaska Native . . . . . . . . . . . 105 0.2 Asian . . . . . . . . . . . . . . . . . . . . . . . . . . . . . . . . . . . . . 132 0.2 Asian Indian . . . . . . . . . . . . . . . . . . . . . . . . . . . . . 20 - Chinese . . . . . . . . . . . . . . . . . . . . . . . . . . . . . . . . . 17 - Filipino . . . . . . . . . . . . . . . . . . . . . . . . . . . . . . . . . . 20 - Japanese. . . . . . . . . . . . . . . . . . . . . . . . . . . . . . . . 20 - Korean. . . . . . . . . . . . . . . . . . . . . . . . . . . . . . . . . . 31 0.1 Vietnamese. . . . . . . . . . . . . . . . . . . . . . . . . . . . . . 10 - Other Asian 1 . . . . . . . . . . . . . . . . . . . . . . . . . . . . 14 - Native Hawaiian and Other Pacific Islander. . . . 11 - Native Hawaiian. . . . . . . . . . . . . . . . . . . . . . . . . . 4 - Guamanian or Chamorro . . . . . . . . . . . . . . . . . . 2 - Samoan. . . . . . . . . . . . . . . . . . . . . . . . . . . . . . . . . 5 - Other Pacific Islander 2 . . . . . . . . . . . . . . . . . . . - - Some other race . . . . . . . . . . . . . . . . . . . . . . . . . . . 98 0.2 Two or more races . . . . . . . . . . . . . . . . . . . . . . . . . . . 385 0.7 Race alone or in combination with one or more other races: 3
White . . . . . . . . . . . . . . . . . . . . . . . . . . . . . . . . . . . . . . . 56,575 98.3 Black or African American . . . . . . . . . . . . . . . . . . . . . 783 1.4 American Indian and Alaska Native . . . . . . . . . . . . . 263 0.5 Asian . . . . . . . . . . . . . . . . . . . . . . . . . . . . . . . . . . . . . . . 173 0.3 Native Hawaiian and Other Pacific Islander. . . . . . 26 - Some other race . . . . . . . . . . . . . . . . . . . . . . . . . . . . . 153 0.3 Subject Number Percent HISPANIC OR LATINO AND RACE Total population. . . . . . . . . . . . . . . . . . . . . . . . . . 57,565 100.0 Hispanic or Latino (of any race) . . . . . . . . . . . . . . . . 298 0.5 Mexican. . . . . . . . . . . . . . . . . . . . . . . . . . . . . . . . . . . 84 0.1 Puerto Rican. . . . . . . . . . . . . . . . . . . . . . . . . . . . . . . 68 0.1 Cuban . . . . . . . . . . . . . . . . . . . . . . . . . . . . . . . . . . . . 8 - Other Hispanic or Latino . . . . . . . . . . . . . . . . . . . . 138 0.2

Northwest Pennsylvania Regional Planning & Development Commission CONNECT NW PA Broadband Study and Action Plan Supplemental Report
December 23, 2003 Page 191
Not Hispanic or Latino . . . . . . . . . . . . . . . . . . . . . . . . 57,267 99.5 White alone. . . . . . . . . . . . . . . . . . . . . . . . . . . . . . . . 56,016 97.3 RELATIONSHIP Total population. . . . . . . . . . . . . . . . . . . . . . . . . . 57,565 100.0 In households. . . . . . . . . . . . . . . . . . . . . . . . . . . . . . . . 55,735 96.8 Householder . . . . . . . . . . . . . . . . . . . . . . . . . . . . . . . 22,747 39.5 Spouse . . . . . . . . . . . . . . . . . . . . . . . . . . . . . . . . . . . 12,693 22.0 Child. . . . . . . . . . . . . . . . . . . . . . . . . . . . . . . . . . . . . . 16,356 28.4 Own child under 18 years . . . . . . . . . . . . . . . . 12,623 21.9 Other relatives . . . . . . . . . . . . . . . . . . . . . . . . . . . . . 1,762 3.1 Under 18 years . . . . . . . . . . . . . . . . . . . . . . . . . 688 1.2 Nonrelatives . . . . . . . . . . . . . . . . . . . . . . . . . . . . . . . 2,177 3.8 Unmarried partner . . . . . . . . . . . . . . . . . . . . . . . 1,229 2.1 In group quarters . . . . . . . . . . . . . . . . . . . . . . . . . . . . . 1,830 3.2 Institutionalized population. . . . . . . . . . . . . . . . . . . 1,154 2.0 Noninstitutionalized population . . . . . . . . . . . . . . . 676 1.2 HOUSEHOLD BY TYPE Total households. . . . . . . . . . . . . . . . . . . . . . . . . 22,747 100.0 Family households (families). . . . . . . . . . . . . . . . . . . 15,926 70.0 With own children under 18 years . . . . . . . . . . 6,920 30.4 Married-couple family . . . . . . . . . . . . . . . . . . . . . . . 12,693 55.8 With own children under 18 years . . . . . . . . . . 4,979 21.9 Female householder, no husband present . . . . . 2,248 9.9 With own children under 18 years . . . . . . . . . . 1,347 5.9 Nonfamily households . . . . . . . . . . . . . . . . . . . . . . . . 6,821 30.0 Householder living alone . . . . . . . . . . . . . . . . . . . . 5,971 26.2 Householder 65 years and over . . . . . . . . . . . . 2,852 12.5 Households with individuals under 18 years . . . . . 7,450 32.8 Households with individuals 65 years and over . . 6,633 29.2 Average household size. . . . . . . . . . . . . . . . . . . . . . . 2.45 (X) Average family size. . . . . . . . . . . . . . . . . . . . . . . . . . . 2.93 (X) HOUSING OCCUPANCY Total housing units. . . . . . . . . . . . . . . . . . . . . . . 26,904 100.0 Occupied housing units . . . . . . . . . . . . . . . . . . . . . . . 22,747 84.5 Vacant housing units. . . . . . . . . . . . . . . . . . . . . . . . . . 4,157 15.5 For seasonal, recreational, or occasional use. . . . . . . . . . . . . . . . . . . . . . . . . . . . 2,586 9.6 Homeowner vacancy rate (percent). . . . . . . . . . . . . 1.7 (X) Rental vacancy rate (percent). . . . . . . . . . . . . . . . . . 6.9 (X) HOUSING TENURE Occupied housing units . . . . . . . . . . . . . . . . . . 22,747 100.0 Owner-occupied housing units . . . . . . . . . . . . . . . . . 17,386 76.4 Renter-occupied housing units . . . . . . . . . . . . . . . . . 5,361 23.6 Average household size of owner-occupied units. 2.54 (X) Average household size of renter-occupied units . 2.15 (X) - Represents zero or rounds to zero. (X) Not applicable. 1 Other Asian alone, or two or more Asian categories. 2 Other Pacific Islander alone, or two or more Native Hawaiian and Other Pacific Islander categories. 3 In combination with one or more of the other races listed. The six numbers may add to more than the total population and the six percentages may add to more than 100 percent because individuals may report more than one race. Source: U.S. Census Bureau, Census 2000. U.S. Census Bureau 1

Northwest Pennsylvania Regional Planning & Development Commission CONNECT NW PA Broadband Study and Action Plan Supplemental Report
December 23, 2003 Page 192
Table DP-2. Profile of Selected Social Characteristics: 2000 Geographic area: Venango County, Pennsylvania [Data based on a sample. For information on confidentiality protection, sampling error, nonsampling error, and definitions, see text] Subject Number Percent SCHOOL ENROLLMENT Population 3 years and over enrolled in school. . . . . . . . . . . . . . . . . . . . 13,090 100.0 Nursery school, preschool . . . . . . . . . . . . . . . . . . . . . 595 4.5 Kindergarten. . . . . . . . . . . . . . . . . . . . . . . . . . . . . . . . . 715 5.5 Elementary school (grades 1-8) . . . . . . . . . . . . . . . . 6,620 50.6 High school (grades 9-12) . . . . . . . . . . . . . . . . . . . . . 3,762 28.7 College or graduate school . . . . . . . . . . . . . . . . . . . . 1,398 10.7 EDUCATIONAL ATTAINMENT Population 25 years and over . . . . . . . . . . 39,366 100.0 Less than 9th grade . . . . . . . . . . . . . . . . . . . . . . . . . . 2,485 6.3 9th to 12th grade, no diploma. . . . . . . . . . . . . . . . . . 4,990 12.7 High school graduate (includes equivalency). . . . . 19,471 49.5 Some college, no degree. . . . . . . . . . . . . . . . . . . . . . 5,068 12.9 Associate degree. . . . . . . . . . . . . . . . . . . . . . . . . . . . . 2,213 5.6 Bachelor’s degree . . . . . . . . . . . . . . . . . . . . . . . . . . . . 3,265 8.3 Graduate or professional degree . . . . . . . . . . . . . . . 1,874 4.8 Percent high school graduate or higher . . . . . . . . . 81.0 (X) Percent bachelor’s degree or higher . . . . . . . . . . . . 13.1 (X) MARITAL STATUS Population 15 years and over . . . . . . . . . . 46,353 100.0 Never married . . . . . . . . . . . . . . . . . . . . . . . . . . . . . . . 10,290 22.2 Now married, except separated . . . . . . . . . . . . . . . . 26,770 57.8 Separated . . . . . . . . . . . . . . . . . . . . . . . . . . . . . . . . . . . 1,086 2.3 Widowed . . . . . . . . . . . . . . . . . . . . . . . . . . . . . . . . . . . . 3,907 8.4 Female. . . . . . . . . . . . . . . . . . . . . . . . . . . . . . . . . . . . 3,189 6.9 Divorced . . . . . . . . . . . . . . . . . . . . . . . . . . . . . . . . . . . . 4,300 9.3 Female. . . . . . . . . . . . . . . . . . . . . . . . . . . . . . . . . . . . 2,247 4.8 GRANDPARENTS AS CAREGIVERS Grandparent living in household with one or more own grandchildren under 18 years . . . . . . . . . . . . . . . . . . . . . . . . . . . . . 698 100.0 Grandparent responsible for grandchildren . . . . . . 263 37.7 VETERAN STATUS Civilian population 18 years and over . . 43,577 100.0 Civilian veterans . . . . . . . . . . . . . . . . . . . . . . . . . . . . . 7,189 16.5 DISABILITY STATUS OF THE CIVILIAN NONINSTITUTIONALIZED POPULATION Population 5 to 20 years. . . . . . . . . . . . . . . 12,225 100.0 With a disability . . . . . . . . . . . . . . . . . . . . . . . . . . . . . . 957 7.8 Population 21 to 64 years. . . . . . . . . . . . . . 31,762 100.0 With a disability . . . . . . . . . . . . . . . . . . . . . . . . . . . . . . 6,517 20.5 Percent employed . . . . . . . . . . . . . . . . . . . . . . . . . . 47.2 (X) No disability . . . . . . . . . . . . . . . . . . . . . . . . . . . . . . . . . 25,245 79.5 Percent employed . . . . . . . . . . . . . . . . . . . . . . . . . . 76.7 (X) Population 65 years and over . . . . . . . . . . 9,130 100.0 With a disability . . . . . . . . . . . . . . . . . . . . . . . . . . . . . . 3,815 41.8 RESIDENCE IN 1995 Population 5 years and over . . . . . . . . . . . 54,307 100.0 Same house in 1995. . . . . . . . . . . . . . . . . . . . . . . . . . 36,513 67.2 Different house in the U.S. in 1995 . . . . . . . . . . . . . 17,549 32.3 Same county . . . . . . . . . . . . . . . . . . . . . . . . . . . . . . 10,993 20.2 Different county . . . . . . . . . . . . . . . . . . . . . . . . . . . . 6,556 12.1 Same state . . . . . . . . . . . . . . . . . . . . . . . . . . . . . . 4,360 8.0 Different state. . . . . . . . . . . . . . . . . . . . . . . . . . . . 2,196 4.0 Elsewhere in 1995. . . . . . . . . . . . . . . . . . . . . . . . . . . . 245 0.5 Subject Number Percent NATIVITY AND PLACE OF BIRTH Total population. . . . . . . . . . . . . . . . . . . . . . . . . . 57,565 100.0 Native. . . . . . . . . . . . . . . . . . . . . . . . . . . . . . . . . . . . . . . 57,221 99.4 Born in United States . . . . . . . . . . . . . . . . . . . . . . . 56,887 98.8 State of residence . . . . . . . . . . . . . . . . . . . . . . . . 50,866 88.4 Different state. . . . . . . . . . . . . . . . . . . . . . . . . . . . 6,021 10.5 Born outside United States . . . . . . . . . . . . . . . . . . 334 0.6 Foreign born . . . . . . . . . . . . . . . . . . . . . . . . . . . . . . . . . 344 0.6

Northwest Pennsylvania Regional Planning & Development Commission CONNECT NW PA Broadband Study and Action Plan Supplemental Report
December 23, 2003 Page 193
Entered 1990 to March 2000 . . . . . . . . . . . . . . 84 0.1 Naturalized citizen . . . . . . . . . . . . . . . . . . . . . . . . . . 223 0.4 Not a citizen . . . . . . . . . . . . . . . . . . . . . . . . . . . . . . . 121 0.2 REGION OF BIRTH OF FOREIGN BORN Total (excluding born at sea). . . . . . . . . . . . . . 344 100.0 Europe. . . . . . . . . . . . . . . . . . . . . . . . . . . . . . . . . . . . . . 205 59.6 Asia . . . . . . . . . . . . . . . . . . . . . . . . . . . . . . . . . . . . . . . . 57 16.6 Africa . . . . . . . . . . . . . . . . . . . . . . . . . . . . . . . . . . . . . . . - - Oceania. . . . . . . . . . . . . . . . . . . . . . . . . . . . . . . . . . . . . 2 0.6 Latin America . . . . . . . . . . . . . . . . . . . . . . . . . . . . . . . . 36 10.5 Northern America. . . . . . . . . . . . . . . . . . . . . . . . . . . . . 44 12.8 LANGUAGE SPOKEN AT HOME Population 5 years and over . . . . . . . . . . . . . . 54,307 100.0 English only . . . . . . . . . . . . . . . . . . . . . . . . . . . . . . . . . 52,687 97.0 Language other than English . . . . . . . . . . . . . . . . . . 1,620 3.0 Speak English less than ��very well�� . . . . . . . . 512 0.9 Spanish . . . . . . . . . . . . . . . . . . . . . . . . . . . . . . . . . . . 570 1.0 Speak English less than ��very well�� . . . . . . . . 219 0.4 Other Indo-European languages . . . . . . . . . . . . . 945 1.7 Speak English less than ��very well�� . . . . . . . . 258 0.5 Asian and Pacific Island languages. . . . . . . . . . . 53 0.1 Speak English less than ��very well�� . . . . . . . . 27 - ANCESTRY (single or multiple) Total population. . . . . . . . . . . . . . . . . . . . . . . . . . 57,565 100.0 Total ancestries reported . . . . . . . . . . . . . . . . . . . 57,212 99.4 Arab . . . . . . . . . . . . . . . . . . . . . . . . . . . . . . . . . . . . . . . . 35 0.1 Czech1. . . . . . . . . . . . . . . . . . . . . . . . . . . . . . . . . . . . . . 229 0.4 Danish . . . . . . . . . . . . . . . . . . . . . . . . . . . . . . . . . . . . . . 48 0.1 Dutch . . . . . . . . . . . . . . . . . . . . . . . . . . . . . . . . . . . . . . . 2,161 3.8 English. . . . . . . . . . . . . . . . . . . . . . . . . . . . . . . . . . . . . . 5,320 9.2 French (except Basque)1 . . . . . . . . . . . . . . . . . . . . . . 1,175 2.0 French Canadian1 . . . . . . . . . . . . . . . . . . . . . . . . . . . . 127 0.2 German . . . . . . . . . . . . . . . . . . . . . . . . . . . . . . . . . . . . . 17,866 31.0 Greek. . . . . . . . . . . . . . . . . . . . . . . . . . . . . . . . . . . . . . . 112 0.2 Hungarian . . . . . . . . . . . . . . . . . . . . . . . . . . . . . . . . . . . 301 0.5 Irish1. . . . . . . . . . . . . . . . . . . . . . . . . . . . . . . . . . . . . . . . 8,940 15.5 Italian . . . . . . . . . . . . . . . . . . . . . . . . . . . . . . . . . . . . . . . 2,812 4.9 Lithuanian . . . . . . . . . . . . . . . . . . . . . . . . . . . . . . . . . . . 68 0.1 Norwegian. . . . . . . . . . . . . . . . . . . . . . . . . . . . . . . . . . . 175 0.3 Polish . . . . . . . . . . . . . . . . . . . . . . . . . . . . . . . . . . . . . . . 3,005 5.2 Portuguese . . . . . . . . . . . . . . . . . . . . . . . . . . . . . . . . . . 12 - Russian . . . . . . . . . . . . . . . . . . . . . . . . . . . . . . . . . . . . . 135 0.2 Scotch-Irish. . . . . . . . . . . . . . . . . . . . . . . . . . . . . . . . . . 1,913 3.3 Scottish . . . . . . . . . . . . . . . . . . . . . . . . . . . . . . . . . . . . . 969 1.7 Slovak . . . . . . . . . . . . . . . . . . . . . . . . . . . . . . . . . . . . . . 331 0.6 Subsaharan African. . . . . . . . . . . . . . . . . . . . . . . . . . . 13 - Swedish. . . . . . . . . . . . . . . . . . . . . . . . . . . . . . . . . . . . . 1,233 2.1 Swiss . . . . . . . . . . . . . . . . . . . . . . . . . . . . . . . . . . . . . . . 217 0.4 Ukrainian . . . . . . . . . . . . . . . . . . . . . . . . . . . . . . . . . . . . 184 0.3 United States or American. . . . . . . . . . . . . . . . . . . . . 4,955 8.6 Welsh. . . . . . . . . . . . . . . . . . . . . . . . . . . . . . . . . . . . . . . 675 1.2 West Indian (excluding Hispanic groups) . . . . . . . . 92 0.2 Other ancestries . . . . . . . . . . . . . . . . . . . . . . . . . . . . . 4,109 7.1 -Represents zero or rounds to zero. (X) Not applicable. 1The data represent a combination of two ancestries shown separately in Summary File 3. Czech includes Czechoslovakian. French includes Alsatian. French Canadian includes Acadian/Cajun. Irish includes Celtic. Source: U.S. Bureau of the Census, Census 2000. U.S. Census Bureau 2

Northwest Pennsylvania Regional Planning & Development Commission CONNECT NW PA Broadband Study and Action Plan Supplemental Report
December 23, 2003 Page 194
Table DP-3. Profile of Selected Economic Characteristics: 2000 Geographic area: Venango County, Pennsylvania [Data based on a sample. For information on confidentiality protection, sampling error, nonsampling error, and definitions, see text] Subject Number Percent EMPLOYMENT STATUS Population 16 years and over . . . . . . . . . . . . 45,521 100.0 In labor force . . . . . . . . . . . . . . . . . . . . . . . . . . . . . . . . 26,430 58.1 Civilian labor force. . . . . . . . . . . . . . . . . . . . . . . . . . 26,386 58.0 Employed . . . . . . . . . . . . . . . . . . . . . . . . . . . . . . . 24,487 53.8 Unemployed . . . . . . . . . . . . . . . . . . . . . . . . . . . . . 1,899 4.2 Percent of civilian labor force . . . . . . . . . . . . 7.2 (X) Armed Forces. . . . . . . . . . . . . . . . . . . . . . . . . . . . . . 44 0.1 Not in labor force. . . . . . . . . . . . . . . . . . . . . . . . . . . . . 19,091 41.9 Females 16 ye ars and over . . . . . . . . . . . . . . 23,576 100.0 In labor force . . . . . . . . . . . . . . . . . . . . . . . . . . . . . . . . 11,837 50.2 Civilian labor force. . . . . . . . . . . . . . . . . . . . . . . . . . 11,836 50.2 Employed . . . . . . . . . . . . . . . . . . . . . . . . . . . . . . . 11,136 47.2 Own children under 6 years. . . . . . . . . . . . . . 3,818 100.0 All parents in family in labor force . . . . . . . . . . . . . . 2,353 61.6 COMMUTING TO WORK Workers 16 years and over . . . . . . . . . . . . . . 24,055 100.0 Car, truck, or van - - drove alone . . . . . . . . . . . . . . . 19,333 80.4 Car, truck, or van - - carpooled. . . . . . . . . . . . . . . . . 2,814 11.7 Public transportation (including taxicab) . . . . . . . . . 170 0.7 Walked. . . . . . . . . . . . . . . . . . . . . . . . . . . . . . . . . . . . . . 783 3.3 Other means. . . . . . . . . . . . . . . . . . . . . . . . . . . . . . . . . 287 1.2 Worked at home . . . . . . . . . . . . . . . . . . . . . . . . . . . . . 668 2.8 Mean travel time to work (minutes)1 . . . . . . . . . . . . 21.2 (X) Employed civilian population 16 years and over . . . . . . . . . . . . . . . . . . . . . 24,487 100.0 OCCUPATION Management, professional, and related occupations . . . . . . . . . . . . . . . . . . . . . . . . . . . . . . . . 6,256 25.5 Service occupations . . . . . . . . . . . . . . . . . . . . . . . . . . 4,087 16.7 Sales and office occupations . . . . . . . . . . . . . . . . . . 5,880 24.0 Farming, fishing, and forestry occupations. . . . . . . 170 0.7 Construction, extraction, and maintenance occupations . . . . . . . . . . . . . . . . . . . . . . . . . . . . . . . . 2,297 9.4 Production, transportation, and material moving occupations . . . . . . . . . . . . . . . . . . . . . . . . . . . . . . . . 5,797 23.7 INDUSTRY Agriculture, forestry, fishing and hunting, and mining . . . . . . . . . . . . . . . . . . . . . . . . . . . . . . . . . 431 1.8 Construction . . . . . . . . . . . . . . . . . . . . . . . . . . . . . . . . . 1,258 5.1 Manufacturing. . . . . . . . . . . . . . . . . . . . . . . . . . . . . . . . 4,860 19.8 Wholesale trade. . . . . . . . . . . . . . . . . . . . . . . . . . . . . . 673 2.7 Retail trade . . . . . . . . . . . . . . . . . . . . . . . . . . . . . . . . . . 3,380 13.8 Transportation and warehousing, and utilities . . . . 1,448 5.9 Information . . . . . . . . . . . . . . . . . . . . . . . . . . . . . . . . . . 377 1.5 Finance, insurance, real estate, and rental and leasing . . . . . . . . . . . . . . . . . . . . . . . . . . . . . . . . . . . . . 885 3.6 Professional, scientific, management, administrative, and waste management services . . . . . . . 1,316 5.4 Educational, health and social services . . . . . . . . . 5,995 24.5 Arts, entertainment, recreation, accommodation and food services . . . . . . . . . . . . . . . . . . . . . . . . . . . 1,441 5.9 Other services (except public administration) . . . . 1,245 5.1 Public administration. . . . . . . . . . . . . . . . . . . . . . . . . . 1,178 4.8 CLASS OF WORKER Private wage and salary workers . . . . . . . . . . . . . . . 18,785 76.7 Government workers. . . . . . . . . . . . . . . . . . . . . . . . . . 3,828 15.6 Self-employed workers in own not incorporated business . . . . . . . . . . . . . . . . . . . . . . . . . . . . . . . . . . . 1,776 7.3 Unpaid family workers . . . . . . . . . . . . . . . . . . . . . . . . 98 0.4 Subject Number Percent INCOME IN 1999 Households. . . . . . . . . . . . . . . . . . . . . . . . . . . . . 22,788 100.0 Less than $10,000. . . . . . . . . . . . . . . . . . . . . . . . . . . . 2,652 11.6 $10,000 to $14,999. . . . . . . . . . . . . . . . . . . . . . . . . . . 2,011 8.8
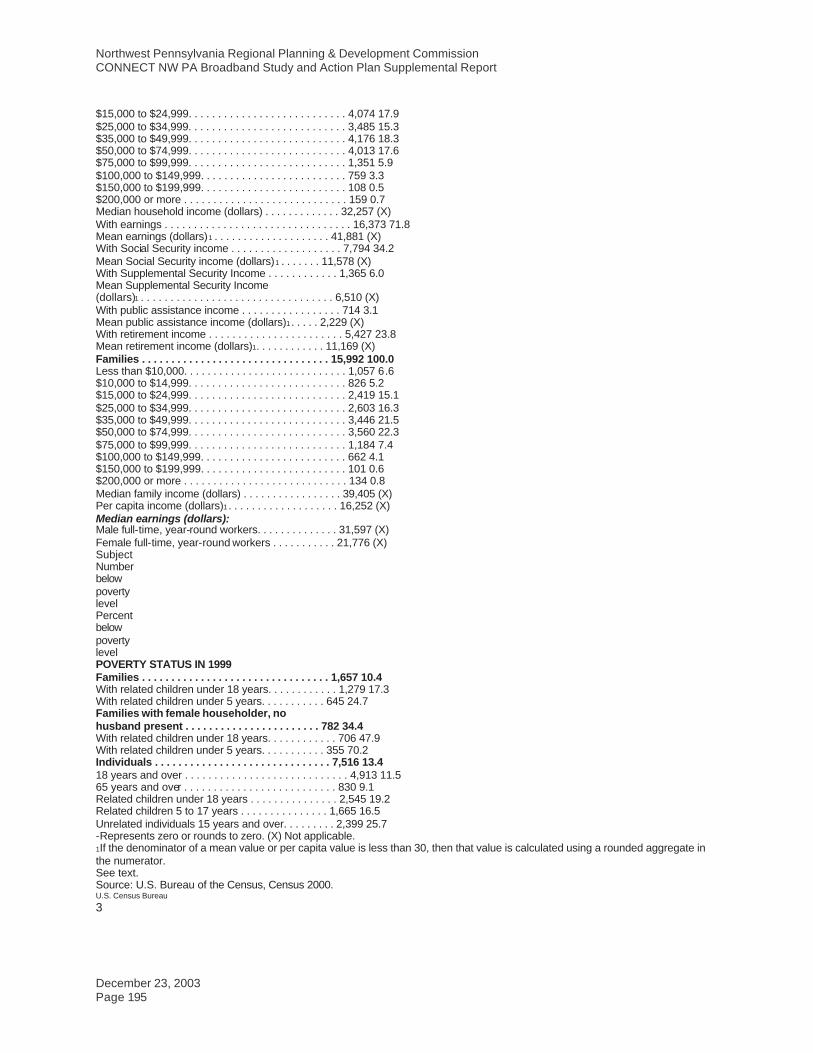
Northwest Pennsylvania Regional Planning & Development Commission CONNECT NW PA Broadband Study and Action Plan Supplemental Report
December 23, 2003 Page 195
$15,000 to $24,999. . . . . . . . . . . . . . . . . . . . . . . . . . . 4,074 17.9 $25,000 to $34,999. . . . . . . . . . . . . . . . . . . . . . . . . . . 3,485 15.3 $35,000 to $49,999. . . . . . . . . . . . . . . . . . . . . . . . . . . 4,176 18.3 $50,000 to $74,999. . . . . . . . . . . . . . . . . . . . . . . . . . . 4,013 17.6 $75,000 to $99,999. . . . . . . . . . . . . . . . . . . . . . . . . . . 1,351 5.9 $100,000 to $149,999. . . . . . . . . . . . . . . . . . . . . . . . . 759 3.3 $150,000 to $199,999. . . . . . . . . . . . . . . . . . . . . . . . . 108 0.5 $200,000 or more . . . . . . . . . . . . . . . . . . . . . . . . . . . . 159 0.7 Median household income (dollars) . . . . . . . . . . . . . 32,257 (X) With earnings . . . . . . . . . . . . . . . . . . . . . . . . . . . . . . . . 16,373 71.8 Mean earnings (dollars)1 . . . . . . . . . . . . . . . . . . . . 41,881 (X) With Social Security income . . . . . . . . . . . . . . . . . . . 7,794 34.2 Mean Social Security income (dollars)1 . . . . . . . 11,578 (X) With Supplemental Security Income . . . . . . . . . . . . 1,365 6.0 Mean Supplemental Security Income (dollars)1 . . . . . . . . . . . . . . . . . . . . . . . . . . . . . . . . . 6,510 (X) With public assistance income . . . . . . . . . . . . . . . . . 714 3.1 Mean public assistance income (dollars)1 . . . . . 2,229 (X) With retirement income . . . . . . . . . . . . . . . . . . . . . . . 5,427 23.8 Mean retirement income (dollars)1. . . . . . . . . . . . 11,169 (X) Families . . . . . . . . . . . . . . . . . . . . . . . . . . . . . . . . 15,992 100.0 Less than $10,000. . . . . . . . . . . . . . . . . . . . . . . . . . . . 1,057 6.6 $10,000 to $14,999. . . . . . . . . . . . . . . . . . . . . . . . . . . 826 5.2 $15,000 to $24,999. . . . . . . . . . . . . . . . . . . . . . . . . . . 2,419 15.1 $25,000 to $34,999. . . . . . . . . . . . . . . . . . . . . . . . . . . 2,603 16.3 $35,000 to $49,999. . . . . . . . . . . . . . . . . . . . . . . . . . . 3,446 21.5 $50,000 to $74,999. . . . . . . . . . . . . . . . . . . . . . . . . . . 3,560 22.3 $75,000 to $99,999. . . . . . . . . . . . . . . . . . . . . . . . . . . 1,184 7.4 $100,000 to $149,999. . . . . . . . . . . . . . . . . . . . . . . . . 662 4.1 $150,000 to $199,999. . . . . . . . . . . . . . . . . . . . . . . . . 101 0.6 $200,000 or more . . . . . . . . . . . . . . . . . . . . . . . . . . . . 134 0.8 Median family income (dollars) . . . . . . . . . . . . . . . . . 39,405 (X) Per capita income (dollars)1 . . . . . . . . . . . . . . . . . . . 16,252 (X) Median earnings (dollars): Male full-time, year-round workers. . . . . . . . . . . . . . 31,597 (X) Female full-time, year-round workers . . . . . . . . . . . 21,776 (X) Subject Number below poverty level Percent below poverty level POVERTY STATUS IN 1999 Families . . . . . . . . . . . . . . . . . . . . . . . . . . . . . . . . 1,657 10.4 With related children under 18 years. . . . . . . . . . . . 1,279 17.3 With related children under 5 years. . . . . . . . . . . 645 24.7 Families with female householder, no husband present . . . . . . . . . . . . . . . . . . . . . . . 782 34.4 With related children under 18 years. . . . . . . . . . . . 706 47.9 With related children under 5 years. . . . . . . . . . . 355 70.2 Individuals . . . . . . . . . . . . . . . . . . . . . . . . . . . . . . 7,516 13.4 18 years and over . . . . . . . . . . . . . . . . . . . . . . . . . . . . 4,913 11.5 65 years and over . . . . . . . . . . . . . . . . . . . . . . . . . . 830 9.1 Related children under 18 years . . . . . . . . . . . . . . . 2,545 19.2 Related children 5 to 17 years . . . . . . . . . . . . . . . 1,665 16.5 Unrelated individuals 15 years and over. . . . . . . . . 2,399 25.7 -Represents zero or rounds to zero. (X) Not applicable. 1If the denominator of a mean value or per capita value is less than 30, then that value is calculated using a rounded aggregate in the numerator. See text. Source: U.S. Bureau of the Census, Census 2000. U.S. Census Bureau
3

Northwest Pennsylvania Regional Planning & Development Commission CONNECT NW PA Broadband Study and Action Plan Supplemental Report
December 23, 2003 Page 196
Table DP-4. Profile of Selected Housing Characteristics: 2000 Geographic area: Venango County, Pennsylvania [Data based on a sample. For information on confidentiality protection, sampling error, nonsampling error, and definitions, see text] Subject Number Percent Total housing units. . . . . . . . . . . . . . . . . . . . 26,904 100.0 UNITS IN STRUCTURE 1-unit, detached. . . . . . . . . . . . . . . . . . . . . . . . . . . . . . 19,917 74.0 1-unit, attached . . . . . . . . . . . . . . . . . . . . . . . . . . . . . . 259 1.0 2 units . . . . . . . . . . . . . . . . . . . . . . . . . . . . . . . . . . . . . . 1,287 4.8 3 or 4 units . . . . . . . . . . . . . . . . . . . . . . . . . . . . . . . . . . 792 2.9 5 to 9 units . . . . . . . . . . . . . . . . . . . . . . . . . . . . . . . . . . 479 1.8 10 to 19 units . . . . . . . . . . . . . . . . . . . . . . . . . . . . . . . . 250 0.9 20 or more units . . . . . . . . . . . . . . . . . . . . . . . . . . . . . 637 2.4 Mobile home. . . . . . . . . . . . . . . . . . . . . . . . . . . . . . . . . 3,221 12.0 Boat, RV, van, etc . . . . . . . . . . . . . . . . . . . . . . . . . . . . 62 0.2 YEAR STRUCTURE BUILT 1999 to March 2000 . . . . . . . . . . . . . . . . . . . . . . . . . . 205 0.8 1995 to 1998 . . . . . . . . . . . . . . . . . . . . . . . . . . . . . . . . 898 3.3 1990 to 1994 . . . . . . . . . . . . . . . . . . . . . . . . . . . . . . . . 815 3.0 1980 to 1989 . . . . . . . . . . . . . . . . . . . . . . . . . . . . . . . . 2,429 9.0 1970 to 1979 . . . . . . . . . . . . . . . . . . . . . . . . . . . . . . . . 4,098 15.2 1960 to 1969 . . . . . . . . . . . . . . . . . . . . . . . . . . . . . . . . 2,588 9.6 1940 to 1959 . . . . . . . . . . . . . . . . . . . . . . . . . . . . . . . . 5,375 20.0 1939 or earlier . . . . . . . . . . . . . . . . . . . . . . . . . . . . . . . 10,496 39.0 ROOMS 1 room . . . . . . . . . . . . . . . . . . . . . . . . . . . . . . . . . . . . . . 231 0.9 2 rooms . . . . . . . . . . . . . . . . . . . . . . . . . . . . . . . . . . . . . 509 1.9 3 rooms . . . . . . . . . . . . . . . . . . . . . . . . . . . . . . . . . . . . . 1,744 6.5 4 rooms . . . . . . . . . . . . . . . . . . . . . . . . . . . . . . . . . . . . . 3,970 14.8 5 rooms . . . . . . . . . . . . . . . . . . . . . . . . . . . . . . . . . . . . . 5,694 21.2 6 rooms . . . . . . . . . . . . . . . . . . . . . . . . . . . . . . . . . . . . . 6,780 25.2 7 rooms . . . . . . . . . . . . . . . . . . . . . . . . . . . . . . . . . . . . . 3,641 13.5 8 rooms . . . . . . . . . . . . . . . . . . . . . . . . . . . . . . . . . . . . . 2,385 8.9 9 or more rooms . . . . . . . . . . . . . . . . . . . . . . . . . . . . . 1,950 7.2 Median (rooms) . . . . . . . . . . . . . . . . . . . . . . . . . . . . . . 5.7 (X) Occupied housing units . . . . . . . . . . . . . . . 22,747 100.0 YEAR HOUSEHOLDER MOVED INTO UNIT 1999 to March 2000 . . . . . . . . . . . . . . . . . . . . . . . . . . 2,669 11.7 1995 to 1998 . . . . . . . . . . . . . . . . . . . . . . . . . . . . . . . . 5,150 22.6 1990 to 1994 . . . . . . . . . . . . . . . . . . . . . . . . . . . . . . . . 3,590 15.8 1980 to 1989 . . . . . . . . . . . . . . . . . . . . . . . . . . . . . . . . 4,070 17.9 1970 to 1979 . . . . . . . . . . . . . . . . . . . . . . . . . . . . . . . . 3,324 14.6 1969 or earlier . . . . . . . . . . . . . . . . . . . . . . . . . . . . . . . 3,944 17.3 VEHICLES AVAILABLE None . . . . . . . . . . . . . . . . . . . . . . . . . . . . . . . . . . . . . . . 1,960 8.6 1 . . . . . . . . . . . . . . . . . . . . . . . . . . . . . . . . . . . . . . . . . . . 8,184 36.0 2 . . . . . . . . . . . . . . . . . . . . . . . . . . . . . . . . . . . . . . . . . . . 9,351 41.1 3 or more . . . . . . . . . . . . . . . . . . . . . . . . . . . . . . . . . . . 3,252 14.3 HOUSE HEATING FUEL Utility gas . . . . . . . . . . . . . . . . . . . . . . . . . . . . . . . . . . . 16,617 73.1 Bottled, tank, or LP gas . . . . . . . . . . . . . . . . . . . . . . . 1,575 6.9 Electricity. . . . . . . . . . . . . . . . . . . . . . . . . . . . . . . . . . . . 1,210 5.3 Fuel oil, kerosene, etc . . . . . . . . . . . . . . . . . . . . . . . . 1,841 8.1 Coal or coke. . . . . . . . . . . . . . . . . . . . . . . . . . . . . . . . . 43 0.2 Wood . . . . . . . . . . . . . . . . . . . . . . . . . . . . . . . . . . . . . . . 1,254 5.5 Solar energy. . . . . . . . . . . . . . . . . . . . . . . . . . . . . . . . . - - Other fuel . . . . . . . . . . . . . . . . . . . . . . . . . . . . . . . . . . . 167 0.7 No fuel used. . . . . . . . . . . . . . . . . . . . . . . . . . . . . . . . . 40 0.2 SELECTED CHARACTERISTICS Lacking complete plumbing facilities . . . . . . . . . . . . 119 0.5 Lacking complete kitchen facilities . . . . . . . . . . . . . . 146 0.6 No telephone service . . . . . . . . . . . . . . . . . . . . . . . . . 594 2.6 Subject Number Percent OCCUPANTS PER ROOM Occupied housing units . . . . . . . . . . . . . . . 22,747 100.0 1.00 or less. . . . . . . . . . . . . . . . . . . . . . . . . . . . . . . . . . 22,556 99.2 1.01 to 1.50 . . . . . . . . . . . . . . . . . . . . . . . . . . . . . . . . . 165 0.7 1.51 or more. . . . . . . . . . . . . . . . . . . . . . . . . . . . . . . . . 26 0.1 Specified owner-occupied units . . . . . . . . 12,554 100.0

Northwest Pennsylvania Regional Planning & Development Commission CONNECT NW PA Broadband Study and Action Plan Supplemental Report
December 23, 2003 Page 197
VALUE Less than $50,000. . . . . . . . . . . . . . . . . . . . . . . . . . . . 5,369 42.8 $50,000 to $99,999. . . . . . . . . . . . . . . . . . . . . . . . . . . 5,800 46.2 $100,000 to $149,999. . . . . . . . . . . . . . . . . . . . . . . . . 966 7.7 $150,000 to $199,999. . . . . . . . . . . . . . . . . . . . . . . . . 273 2.2 $200,000 to $299,999. . . . . . . . . . . . . . . . . . . . . . . . . 129 1.0 $300,000 to $499,999. . . . . . . . . . . . . . . . . . . . . . . . . 9 0.1 $500,000 to $999,999. . . . . . . . . . . . . . . . . . . . . . . . . 8 0.1 $1,000,000 or more. . . . . . . . . . . . . . . . . . . . . . . . . . . - - Median (dollars) . . . . . . . . . . . . . . . . . . . . . . . . . . . . . . 55,900 (X) MORTGAGE STATUS AND SELECTED MONTHLY OWNER COSTS With a mortgage . . . . . . . . . . . . . . . . . . . . . . . . . . . . . 6,599 52.6 Less than $300 . . . . . . . . . . . . . . . . . . . . . . . . . . 76 0.6 $300 to $499 . . . . . . . . . . . . . . . . . . . . . . . . . . . . 1,258 10.0 $500 to $699 . . . . . . . . . . . . . . . . . . . . . . . . . . . . 2,164 17.2 $700 to $999 . . . . . . . . . . . . . . . . . . . . . . . . . . . . 1,998 15.9 $1,000 to $1,499 . . . . . . . . . . . . . . . . . . . . . . . . . 912 7.3 $1,500 to $1,999 . . . . . . . . . . . . . . . . . . . . . . . . . 117 0.9 $2,000 or more . . . . . . . . . . . . . . . . . . . . . . . . . . 74 0.6 Median (dollars) . . . . . . . . . . . . . . . . . . . . . . . . . . 680 (X) Not mortgaged . . . . . . . . . . . . . . . . . . . . . . . . . . . . . . . 5,955 47.4 Median (dollars) . . . . . . . . . . . . . . . . . . . . . . . . . . 268 (X) SELECTED MONTHLY OWNER COSTS AS A PERCENTAGE OF HOUSEHOLD INCOME IN 1999 Less than 15.0 percent. . . . . . . . . . . . . . . . . . . . . . . . 6,113 48.7 15.0 to 19.9 percent . . . . . . . . . . . . . . . . . . . . . . . . . . 2,096 16.7 20.0 to 24.9 percent . . . . . . . . . . . . . . . . . . . . . . . . . . 1,300 10.4 25.0 to 29.9 percent . . . . . . . . . . . . . . . . . . . . . . . . . . 938 7.5 30.0 to 34.9 percent . . . . . . . . . . . . . . . . . . . . . . . . . . 526 4.2 35.0 percent or more . . . . . . . . . . . . . . . . . . . . . . . . . 1,507 12.0 Not computed. . . . . . . . . . . . . . . . . . . . . . . . . . . . . . . . 74 0.6 Specified renter-occupied units . . . . . . . . 5,142 100.0 GROSS RENT Less than $200 . . . . . . . . . . . . . . . . . . . . . . . . . . . . . . 591 11.5 $200 to $299 . . . . . . . . . . . . . . . . . . . . . . . . . . . . . . . . 690 13.4 $300 to $499 . . . . . . . . . . . . . . . . . . . . . . . . . . . . . . . . 2,521 49.0 $500 to $749 . . . . . . . . . . . . . . . . . . . . . . . . . . . . . . . . 724 14.1 $750 to $999 . . . . . . . . . . . . . . . . . . . . . . . . . . . . . . . . 59 1.1 $1,000 to $1,499 . . . . . . . . . . . . . . . . . . . . . . . . . . . . . 11 0.2 $1,500 or more . . . . . . . . . . . . . . . . . . . . . . . . . . . . . . 10 0.2 No cash rent. . . . . . . . . . . . . . . . . . . . . . . . . . . . . . . . . 536 10.4 Median (dollars) . . . . . . . . . . . . . . . . . . . . . . . . . . . . . . 382 (X) GROSS RENT AS A PERCENTAGE OF HOUSEHOLD INCOME IN 1999 Less than 15.0 percent. . . . . . . . . . . . . . . . . . . . . . . . 1,114 21.7 15.0 to 19.9 percent . . . . . . . . . . . . . . . . . . . . . . . . . . 717 13.9 20.0 to 24.9 percent . . . . . . . . . . . . . . . . . . . . . . . . . . 568 11.0 25.0 to 29.9 percent . . . . . . . . . . . . . . . . . . . . . . . . . . 535 10.4 30.0 to 34.9 percent . . . . . . . . . . . . . . . . . . . . . . . . . . 274 5.3 35.0 percent or more . . . . . . . . . . . . . . . . . . . . . . . . . 1,329 25.8 Not computed. . . . . . . . . . . . . . . . . . . . . . . . . . . . . . . . 605 11.8 -Represents zero or rounds to zero. (X) Not applicable. Source: U.S. Bureau of the Census, Census 2000. U.S. Census Bureau 4

Northwest Pennsylvania Regional Planning & Development Commission CONNECT NW PA Broadband Study and Action Plan Supplemental Report
December 23, 2003 Page 198
Warren County
Table DP-1. Profile of General Demographic Characteristics: 2000 Geographic area: Warren County, Pennsylvania [For information on confidentiality protection, nonsampling error, and definitions, see text] Subject Number Percent Total population. . . . . . . . . . . . . . . . . . . . . . . . . . 43,863 100.0 SEX AND AGE Male . . . . . . . . . . . . . . . . . . . . . . . . . . . . . . . . . . . . . . . . 21,506 49.0 Female. . . . . . . . . . . . . . . . . . . . . . . . . . . . . . . . . . . . . . 22,357 51.0 Under 5 years . . . . . . . . . . . . . . . . . . . . . . . . . . . . . . . 2,480 5.7 5 to 9 years . . . . . . . . . . . . . . . . . . . . . . . . . . . . . . . . . 2,860 6.5 10 to 14 years . . . . . . . . . . . . . . . . . . . . . . . . . . . . . . . 3,255 7.4 15 to 19 years . . . . . . . . . . . . . . . . . . . . . . . . . . . . . . . 2,962 6.8 20 to 24 years . . . . . . . . . . . . . . . . . . . . . . . . . . . . . . . 1,818 4.1 25 to 34 years . . . . . . . . . . . . . . . . . . . . . . . . . . . . . . . 4,948 11.3 35 to 44 years . . . . . . . . . . . . . . . . . . . . . . . . . . . . . . . 6,887 15.7 45 to 54 years . . . . . . . . . . . . . . . . . . . . . . . . . . . . . . . 6,504 14.8 55 to 59 years . . . . . . . . . . . . . . . . . . . . . . . . . . . . . . . 2,644 6.0 60 to 64 years . . . . . . . . . . . . . . . . . . . . . . . . . . . . . . . 2,193 5.0 65 to 74 years . . . . . . . . . . . . . . . . . . . . . . . . . . . . . . . 3,872 8.8 75 to 84 years . . . . . . . . . . . . . . . . . . . . . . . . . . . . . . . 2,591 5.9 85 years and over . . . . . . . . . . . . . . . . . . . . . . . . . . . . 849 1.9 Median age (years) . . . . . . . . . . . . . . . . . . . . . . . . . . . 40.5 (X) 18 years and over . . . . . . . . . . . . . . . . . . . . . . . . . . . . 33,276 75.9 Male . . . . . . . . . . . . . . . . . . . . . . . . . . . . . . . . . . . . . . 16,018 36.5 Female. . . . . . . . . . . . . . . . . . . . . . . . . . . . . . . . . . . . 17,258 39.3 21 years and over . . . . . . . . . . . . . . . . . . . . . . . . . . . . 31,928 72.8 62 years and over . . . . . . . . . . . . . . . . . . . . . . . . . . . . 8,574 19.5 65 years and over . . . . . . . . . . . . . . . . . . . . . . . . . . . . 7,312 16.7 Male . . . . . . . . . . . . . . . . . . . . . . . . . . . . . . . . . . . . . . 3,083 7.0 Female. . . . . . . . . . . . . . . . . . . . . . . . . . . . . . . . . . . . 4,229 9.6 RACE One race . . . . . . . . . . . . . . . . . . . . . . . . . . . . . . . . . . . . 43,636 99.5 White . . . . . . . . . . . . . . . . . . . . . . . . . . . . . . . . . . . . . 43,286 98.7 Black or African American . . . . . . . . . . . . . . . . . . . 90 0.2 American Indian and Alaska Native . . . . . . . . . . . 82 0.2 Asian . . . . . . . . . . . . . . . . . . . . . . . . . . . . . . . . . . . . . 118 0.3 Asian Indian . . . . . . . . . . . . . . . . . . . . . . . . . . . . . 45 0.1 Chinese . . . . . . . . . . . . . . . . . . . . . . . . . . . . . . . . . 24 0.1 Filipino . . . . . . . . . . . . . . . . . . . . . . . . . . . . . . . . . . 16 - Japanese. . . . . . . . . . . . . . . . . . . . . . . . . . . . . . . . 5 - Korean. . . . . . . . . . . . . . . . . . . . . . . . . . . . . . . . . . 19 - Vietnamese. . . . . . . . . . . . . . . . . . . . . . . . . . . . . . 7 - Other Asian 1 . . . . . . . . . . . . . . . . . . . . . . . . . . . . 2 - Native Hawaiian and Other Pacific Islander. . . . 8 - Native Hawaiian. . . . . . . . . . . . . . . . . . . . . . . . . . 6 - Guamanian or Chamorro . . . . . . . . . . . . . . . . . . - - Samoan. . . . . . . . . . . . . . . . . . . . . . . . . . . . . . . . . 2 - Other Pacific Islander 2 . . . . . . . . . . . . . . . . . . . - - Some other race . . . . . . . . . . . . . . . . . . . . . . . . . . . 52 0.1 Two or more races . . . . . . . . . . . . . . . . . . . . . . . . . . . 227 0.5 Race alone or in combination with one or more other races: 3
White . . . . . . . . . . . . . . . . . . . . . . . . . . . . . . . . . . . . . . . 43,495 99.2 Black or African American . . . . . . . . . . . . . . . . . . . . . 133 0.3 American Indian and Alaska Native . . . . . . . . . . . . . 205 0.5 Asian . . . . . . . . . . . . . . . . . . . . . . . . . . . . . . . . . . . . . . . 160 0.4 Native Hawaiian and Other Pacific Islander. . . . . . 18 - Some other race . . . . . . . . . . . . . . . . . . . . . . . . . . . . . 94 0.2 Subject Number Percent HISPANIC OR LATINO AND RACE Total population. . . . . . . . . . . . . . . . . . . . . . . . . . 43,863 100.0 Hispanic or Latino (of any race) . . . . . . . . . . . . . . . . 151 0.3 Mexican. . . . . . . . . . . . . . . . . . . . . . . . . . . . . . . . . . . 50 0.1 Puerto Rican. . . . . . . . . . . . . . . . . . . . . . . . . . . . . . . 20 - Cuban . . . . . . . . . . . . . . . . . . . . . . . . . . . . . . . . . . . . 11 - Other Hispanic or Latino . . . . . . . . . . . . . . . . . . . . 70 0.2

Northwest Pennsylvania Regional Planning & Development Commission CONNECT NW PA Broadband Study and Action Plan Supplemental Report
December 23, 2003 Page 199
Not Hispanic or Latino . . . . . . . . . . . . . . . . . . . . . . . . 43,712 99.7 White alone. . . . . . . . . . . . . . . . . . . . . . . . . . . . . . . . 43,176 98.4 RELATIONSHIP Total population. . . . . . . . . . . . . . . . . . . . . . . . . . 43,863 100.0 In households. . . . . . . . . . . . . . . . . . . . . . . . . . . . . . . . 42,794 97.6 Householder . . . . . . . . . . . . . . . . . . . . . . . . . . . . . . . 17,696 40.3 Spouse . . . . . . . . . . . . . . . . . . . . . . . . . . . . . . . . . . . 9,926 22.6 Child. . . . . . . . . . . . . . . . . . . . . . . . . . . . . . . . . . . . . . 12,338 28.1 Own child under 18 years . . . . . . . . . . . . . . . . 9,802 22.3 Other relatives . . . . . . . . . . . . . . . . . . . . . . . . . . . . . 1,179 2.7 Under 18 years . . . . . . . . . . . . . . . . . . . . . . . . . 508 1.2 Nonrelatives . . . . . . . . . . . . . . . . . . . . . . . . . . . . . . . 1,655 3.8 Unmarried partner . . . . . . . . . . . . . . . . . . . . . . . 925 2.1 In group quarters . . . . . . . . . . . . . . . . . . . . . . . . . . . . . 1,069 2.4 Institutionalized population. . . . . . . . . . . . . . . . . . . 884 2.0 Noninstitutionalized population . . . . . . . . . . . . . . . 185 0.4 HOUSEHOLD BY TYPE Total households. . . . . . . . . . . . . . . . . . . . . . . . . 17,696 100.0 Family households (families). . . . . . . . . . . . . . . . . . . 12,122 68.5 With own children under 18 years . . . . . . . . . . 5,270 29.8 Married-couple family . . . . . . . . . . . . . . . . . . . . . . . 9,926 56.1 With own children under 18 years . . . . . . . . . . 3,952 22.3 Female householder, no husband present . . . . . 1,495 8.4 With own children under 18 years . . . . . . . . . . 893 5.0 Nonfamily households . . . . . . . . . . . . . . . . . . . . . . . . 5,574 31.5 Householder living alone . . . . . . . . . . . . . . . . . . . . 4,814 27.2 Householder 65 years and over . . . . . . . . . . . . 2,155 12.2 Households with individuals under 18 years . . . . . 5,689 32.1 Households with individuals 65 years and over . . 4,954 28.0 Average household size. . . . . . . . . . . . . . . . . . . . . . . 2.42 (X) Average family size. . . . . . . . . . . . . . . . . . . . . . . . . . . 2.93 (X) HOUSING OCCUPANCY Total housing units. . . . . . . . . . . . . . . . . . . . . . . 23,058 100.0 Occupied housing units . . . . . . . . . . . . . . . . . . . . . . . 17,696 76.7 Vacant housing units. . . . . . . . . . . . . . . . . . . . . . . . . . 5,362 23.3 For seasonal, recreational, or occasional use. . . . . . . . . . . . . . . . . . . . . . . . . . . . 4,125 17.9 Homeowner vacancy rate (percent). . . . . . . . . . . . . 1.8 (X) Rental vacancy rate (percent). . . . . . . . . . . . . . . . . . 9.8 (X) HOUSING TENURE Occupied housing units . . . . . . . . . . . . . . . . . . 17,696 100.0 Owner-occupied housing units . . . . . . . . . . . . . . . . . 13,845 78.2 Renter-occupied housing units . . . . . . . . . . . . . . . . . 3,851 21.8 Average household size of owner-occupied units. 2.53 (X) Average household size of renter-occupied units . 2.03 (X) - Represents zero or rounds to zero. (X) Not applicable. 1 Other Asian alone, or two or more Asian categories. 2 Other Pacific Islander alone, or two or more Native Hawaiian and Other Pacific Islander categories. 3 In combination with one or more of the other races listed. The six numbers may add to more than the total population and the six percentages may add to more than 100 percent because individuals may report more than one race. Source: U.S. Census Bureau, Census 2000. U.S. Census Bureau 1

Northwest Pennsylvania Regional Planning & Development Commission CONNECT NW PA Broadband Study and Action Plan Supplemental Report
December 23, 2003 Page 200
Table DP-2. Profile of Selected Social Characteristics: 2000 Geographic area: Warren County, Pennsylvania [Data based on a sample. For information on confidentiality protection, sampling error, nonsampling error, and definitions, see text] Subject Number Percent SCHOOL ENROLLMENT Population 3 years and over enrolled in school. . . . . . . . . . . . . . . . . . . . 10,028 100.0 Nursery school, preschool . . . . . . . . . . . . . . . . . . . . . 667 6.7 Kindergarten. . . . . . . . . . . . . . . . . . . . . . . . . . . . . . . . . 516 5.1 Elementary school (grades 1-8) . . . . . . . . . . . . . . . . 5,085 50.7 High school (grades 9-12) . . . . . . . . . . . . . . . . . . . . . 2,700 26.9 College or graduate school . . . . . . . . . . . . . . . . . . . . 1,060 10.6 EDUCATIONAL ATTAINMENT Population 25 years and over . . . . . . . . . . 30,535 100.0 Less than 9th grade . . . . . . . . . . . . . . . . . . . . . . . . . . 1,403 4.6 9th to 12th grade, no diploma. . . . . . . . . . . . . . . . . . 3,230 10.6 High school graduate (includes equivalency). . . . . 14,820 48.5 Some college, no degree. . . . . . . . . . . . . . . . . . . . . . 4,875 16.0 Associate degree. . . . . . . . . . . . . . . . . . . . . . . . . . . . . 1,875 6.1 Bachelor’s degree . . . . . . . . . . . . . . . . . . . . . . . . . . . . 2,993 9.8 Graduate or professional degree . . . . . . . . . . . . . . . 1,339 4.4 Percent high school graduate or higher . . . . . . . . . 84.8 (X) Percent bachelor’s degree or higher . . . . . . . . . . . . 14.2 (X) MARITAL STATUS Population 15 years and over . . . . . . . . . . 35,280 100.0 Never married . . . . . . . . . . . . . . . . . . . . . . . . . . . . . . . 7,229 20.5 Now married, except separated . . . . . . . . . . . . . . . . 21,046 59.7 Separated . . . . . . . . . . . . . . . . . . . . . . . . . . . . . . . . . . . 584 1.7 Widowed . . . . . . . . . . . . . . . . . . . . . . . . . . . . . . . . . . . . 2,752 7.8 Female. . . . . . . . . . . . . . . . . . . . . . . . . . . . . . . . . . . . 2,165 6.1 Divorced . . . . . . . . . . . . . . . . . . . . . . . . . . . . . . . . . . . . 3,669 10.4 Female. . . . . . . . . . . . . . . . . . . . . . . . . . . . . . . . . . . . 1,903 5.4 GRANDPARENTS AS CAREGIVERS Grandparent living in household with one or more own grandchildren under 18 years . . . . . . . . . . . . . . . . . . . . . . . . . . . . . 588 100.0 Grandparent responsible for grandchildren . . . . . . 278 47.3 VETERAN STATUS Civilian population 18 years and over . . 33,278 100.0 Civilian veterans . . . . . . . . . . . . . . . . . . . . . . . . . . . . . 5,584 16.8 DISABILITY STATUS OF THE CIVILIAN NONINSTITUTIONALIZED POPULATION Population 5 to 20 years. . . . . . . . . . . . . . . 9,522 100.0 With a disability . . . . . . . . . . . . . . . . . . . . . . . . . . . . . . 887 9.3 Population 21 to 64 years. . . . . . . . . . . . . . 24,334 100.0 With a disability . . . . . . . . . . . . . . . . . . . . . . . . . . . . . . 4,355 17.9 Percent employed . . . . . . . . . . . . . . . . . . . . . . . . . . 51.7 (X) No disability . . . . . . . . . . . . . . . . . . . . . . . . . . . . . . . . . 19,979 82.1 Percent employed . . . . . . . . . . . . . . . . . . . . . . . . . . 80.9 (X) Population 65 years and over . . . . . . . . . . 6,665 100.0 With a disability . . . . . . . . . . . . . . . . . . . . . . . . . . . . . . 2,627 39.4 RESIDENCE IN 1995 Population 5 years and over . . . . . . . . . . . 41,426 100.0 Same house in 1995. . . . . . . . . . . . . . . . . . . . . . . . . . 28,034 67.7 Different house in the U.S. in 1995 . . . . . . . . . . . . . 13,297 32.1 Same county . . . . . . . . . . . . . . . . . . . . . . . . . . . . . . 9,190 22.2 Different county . . . . . . . . . . . . . . . . . . . . . . . . . . . . 4,107 9.9 Same state . . . . . . . . . . . . . . . . . . . . . . . . . . . . . . 2,190 5.3 Different state. . . . . . . . . . . . . . . . . . . . . . . . . . . . 1,917 4.6 Elsewhere in 1995. . . . . . . . . . . . . . . . . . . . . . . . . . . . 95 0.2 Subject Number Percent NATIVITY AND PLACE OF BIRTH Total population. . . . . . . . . . . . . . . . . . . . . . . . . . 43,863 100.0 Native. . . . . . . . . . . . . . . . . . . . . . . . . . . . . . . . . . . . . . . 43,485 99.1 Born in United States . . . . . . . . . . . . . . . . . . . . . . . 43,377 98.9 State of residence . . . . . . . . . . . . . . . . . . . . . . . . 35,436 80.8 Different state. . . . . . . . . . . . . . . . . . . . . . . . . . . . 7,941 18.1 Born outside United States . . . . . . . . . . . . . . . . . . 108 0.2 Foreign born . . . . . . . . . . . . . . . . . . . . . . . . . . . . . . . . . 378 0.9

Northwest Pennsylvania Regional Planning & Development Commission CONNECT NW PA Broadband Study and Action Plan Supplemental Report
December 23, 2003 Page 201
Entered 1990 to March 2000 . . . . . . . . . . . . . . 67 0.2 Naturalized citizen . . . . . . . . . . . . . . . . . . . . . . . . . . 262 0.6 Not a citizen . . . . . . . . . . . . . . . . . . . . . . . . . . . . . . . 116 0.3 REGION OF BIRTH OF FOREIGN BORN Total (excluding born at sea). . . . . . . . . . . . . . 378 100.0 Europe. . . . . . . . . . . . . . . . . . . . . . . . . . . . . . . . . . . . . . 219 57.9 Asia . . . . . . . . . . . . . . . . . . . . . . . . . . . . . . . . . . . . . . . . 90 23.8 Africa . . . . . . . . . . . . . . . . . . . . . . . . . . . . . . . . . . . . . . . - - Oceania. . . . . . . . . . . . . . . . . . . . . . . . . . . . . . . . . . . . . 1 0.3 Latin America . . . . . . . . . . . . . . . . . . . . . . . . . . . . . . . . 19 5.0 Northern America. . . . . . . . . . . . . . . . . . . . . . . . . . . . . 49 13.0 LANGUAGE SPOKEN AT HOME Population 5 years and over . . . . . . . . . . . . . . 41,426 100.0 English only . . . . . . . . . . . . . . . . . . . . . . . . . . . . . . . . . 40,078 96.7 Language other than English . . . . . . . . . . . . . . . . . . 1,348 3.3 Speak English less than ��very well�� . . . . . . . . 471 1.1 Spanish . . . . . . . . . . . . . . . . . . . . . . . . . . . . . . . . . . . 337 0.8 Speak English less than ��very well�� . . . . . . . . 120 0.3 Other Indo-European languages . . . . . . . . . . . . . 898 2.2 Speak English less than ��very well�� . . . . . . . . 304 0.7 Asian and Pacific Island languages. . . . . . . . . . . 106 0.3 Speak English less than ��very well�� . . . . . . . . 45 0.1 ANCESTRY (single or multiple) Total population. . . . . . . . . . . . . . . . . . . . . . . . . . 43,863 100.0 Total ancestries reported . . . . . . . . . . . . . . . . . . . 47,275 107.8 Arab . . . . . . . . . . . . . . . . . . . . . . . . . . . . . . . . . . . . . . . . 46 0.1 Czech1. . . . . . . . . . . . . . . . . . . . . . . . . . . . . . . . . . . . . . 200 0.5 Danish . . . . . . . . . . . . . . . . . . . . . . . . . . . . . . . . . . . . . . 657 1.5 Dutch . . . . . . . . . . . . . . . . . . . . . . . . . . . . . . . . . . . . . . . 1,415 3.2 English. . . . . . . . . . . . . . . . . . . . . . . . . . . . . . . . . . . . . . 4,797 10.9 French (except Basque)1 . . . . . . . . . . . . . . . . . . . . . . 1,139 2.6 French Canadian1 . . . . . . . . . . . . . . . . . . . . . . . . . . . . 269 0.6 German . . . . . . . . . . . . . . . . . . . . . . . . . . . . . . . . . . . . . 10,688 24.4 Greek. . . . . . . . . . . . . . . . . . . . . . . . . . . . . . . . . . . . . . . 115 0.3 Hungarian . . . . . . . . . . . . . . . . . . . . . . . . . . . . . . . . . . . 164 0.4 Irish1. . . . . . . . . . . . . . . . . . . . . . . . . . . . . . . . . . . . . . . . 6,140 14.0 Italian . . . . . . . . . . . . . . . . . . . . . . . . . . . . . . . . . . . . . . . 3,264 7.4 Lithuanian . . . . . . . . . . . . . . . . . . . . . . . . . . . . . . . . . . . 51 0.1 Norwegian. . . . . . . . . . . . . . . . . . . . . . . . . . . . . . . . . . . 118 0.3 Polish . . . . . . . . . . . . . . . . . . . . . . . . . . . . . . . . . . . . . . . 2,269 5.2 Portuguese . . . . . . . . . . . . . . . . . . . . . . . . . . . . . . . . . . 35 0.1 Russian . . . . . . . . . . . . . . . . . . . . . . . . . . . . . . . . . . . . . 105 0.2 Scotch-Irish. . . . . . . . . . . . . . . . . . . . . . . . . . . . . . . . . . 1,205 2.7 Scottish . . . . . . . . . . . . . . . . . . . . . . . . . . . . . . . . . . . . . 970 2.2 Slovak . . . . . . . . . . . . . . . . . . . . . . . . . . . . . . . . . . . . . . 332 0.8 Subsaharan African. . . . . . . . . . . . . . . . . . . . . . . . . . . - - Swedish. . . . . . . . . . . . . . . . . . . . . . . . . . . . . . . . . . . . . 5,504 12.5 Swiss . . . . . . . . . . . . . . . . . . . . . . . . . . . . . . . . . . . . . . . 421 1.0 Ukrainian . . . . . . . . . . . . . . . . . . . . . . . . . . . . . . . . . . . . 323 0.7 United States or American. . . . . . . . . . . . . . . . . . . . . 3,640 8.3 Welsh. . . . . . . . . . . . . . . . . . . . . . . . . . . . . . . . . . . . . . . 451 1.0 West Indian (excluding Hispanic groups) . . . . . . . . 7 - Other ancestries . . . . . . . . . . . . . . . . . . . . . . . . . . . . . 2,950 6.7 -Represents zero or rounds to zero. (X) Not applicable. 1The data represent a combination of two ancestries shown separately in Summary File 3. Czech includes Czechoslovakian. French includes Alsatian. French Canadian includes Acadian/Cajun. Irish includes Celtic. Source: U.S. Bureau of the Census, Census 2000. U.S. Census Bureau 2

Northwest Pennsylvania Regional Planning & Development Commission CONNECT NW PA Broadband Study and Action Plan Supplemental Report
December 23, 2003 Page 202
Table DP-3. Profile of Selected Economic Characteristics: 2000 Geographic area: Warren County, Pennsylvania [Data based on a sample. For information on confidentiality protection, sampling error, nonsampling error, and definitions, see text] Subject Number Percent EMPLOYMENT STATUS Population 16 years and over . . . . . . . . . . . . 34,582 100.0 In labor force . . . . . . . . . . . . . . . . . . . . . . . . . . . . . . . . 21,510 62.2 Civilian labor force. . . . . . . . . . . . . . . . . . . . . . . . . . 21,504 62.2 Employed . . . . . . . . . . . . . . . . . . . . . . . . . . . . . . . 20,408 59.0 Unemployed . . . . . . . . . . . . . . . . . . . . . . . . . . . . . 1,096 3.2 Percent of c ivilian labor force . . . . . . . . . . . . 5.1 (X) Armed Forces. . . . . . . . . . . . . . . . . . . . . . . . . . . . . . 6 - Not in labor force. . . . . . . . . . . . . . . . . . . . . . . . . . . . . 13,072 37.8 Females 16 years and over . . . . . . . . . . . . . . 17,836 100.0 In labor force . . . . . . . . . . . . . . . . . . . . . . . . . . . . . . . . 9,887 55.4 Civilian labor force. . . . . . . . . . . . . . . . . . . . . . . . . . 9,887 55.4 Employed . . . . . . . . . . . . . . . . . . . . . . . . . . . . . . . 9,479 53.1 Own children under 6 years. . . . . . . . . . . . . . 2,844 100.0 All parents in family in labor force . . . . . . . . . . . . . . 1,733 60.9 COMMUTING TO WORK Workers 16 years and over . . . . . . . . . . . . . . 20,062 100.0 Car, truck, or van - - drove alone . . . . . . . . . . . . . . . 15,733 78.4 Car, truck, or van - - carpooled. . . . . . . . . . . . . . . . . 2,515 12.5 Public transportation (including taxicab) . . . . . . . . . 127 0.6 Walked. . . . . . . . . . . . . . . . . . . . . . . . . . . . . . . . . . . . . . 873 4.4 Other means. . . . . . . . . . . . . . . . . . . . . . . . . . . . . . . . . 217 1.1 Worked at home . . . . . . . . . . . . . . . . . . . . . . . . . . . . . 597 3.0 Mean travel time to work (minutes)1 . . . . . . . . . . . . 19.6 (X) Employed civilian population 16 years and over . . . . . . . . . . . . . . . . . . . . . 20,408 100.0 OCCUPATION Management, professional, and related occupations . . . . . . . . . . . . . . . . . . . . . . . . . . . . . . . . 5,297 26.0 Service occupations . . . . . . . . . . . . . . . . . . . . . . . . . . 3,066 15.0 Sales and office occupations . . . . . . . . . . . . . . . . . . 4,827 23.7 Farming, fishing, and forestry occupations. . . . . . . 231 1.1 Construction, extraction, and maintenance occupations . . . . . . . . . . . . . . . . . . . . . . . . . . . . . . . . 1,803 8.8 Production, transportation, and material moving occupations . . . . . . . . . . . . . . . . . . . . . . . . . . . . . . . . 5,184 25.4 INDUSTRY Agriculture, forestry, fishing and hunting, and mining . . . . . . . . . . . . . . . . . . . . . . . . . . . . . . . . . 635 3.1 Construction . . . . . . . . . . . . . . . . . . . . . . . . . . . . . . . . . 838 4.1 Manufacturing. . . . . . . . . . . . . . . . . . . . . . . . . . . . . . . . 5,427 26.6 Wholesale trade. . . . . . . . . . . . . . . . . . . . . . . . . . . . . . 442 2.2 Retail trade . . . . . . . . . . . . . . . . . . . . . . . . . . . . . . . . . . 3,765 18.4 Transportation and warehousing, and utilities . . . . 931 4.6 Information . . . . . . . . . . . . . . . . . . . . . . . . . . . . . . . . . . 284 1.4 Finance, insurance, real estate, and rental and leasing . . . . . . . . . . . . . . . . . . . . . . . . . . . . . . . . . . . . . 650 3.2 Professional, scientific, management, administrative, and waste management services . . . . . . . 594 2.9 Educational, health and social services . . . . . . . . . 4,029 19.7 Arts, entertainment, recreation, accommodation and food services . . . . . . . . . . . . . . . . . . . . . . . . . . . 1,181 5.8 Other services (except public administration) . . . . 909 4.5 Public administration. . . . . . . . . . . . . . . . . . . . . . . . . . 723 3.5 CLASS OF WORKER Private wage and salary workers . . . . . . . . . . . . . . . 16,074 78.8 Government workers. . . . . . . . . . . . . . . . . . . . . . . . . . 2,695 13.2 Self-employed workers in own not incorporated business . . . . . . . . . . . . . . . . . . . . . . . . . . . . . . . . . . . 1,572 7.7 Unpaid family workers . . . . . . . . . . . . . . . . . . . . . . . . 67 0.3 Subject Number Percent INCOME IN 1999 Households. . . . . . . . . . . . . . . . . . . . . . . . . . . . . 17,700 100.0 Less than $10,000. . . . . . . . . . . . . . . . . . . . . . . . . . . . 1,398 7.9 $10,000 to $14,999. . . . . . . . . . . . . . . . . . . . . . . . . . . 1,426 8.1

Northwest Pennsylvania Regional Planning & Development Commission CONNECT NW PA Broadband Study and Action Plan Supplemental Report
December 23, 2003 Page 203
$15,000 to $24,999. . . . . . . . . . . . . . . . . . . . . . . . . . . 2,947 16.6 $25,000 to $34,999. . . . . . . . . . . . . . . . . . . . . . . . . . . 2,794 15.8 $35,000 to $49,999. . . . . . . . . . . . . . . . . . . . . . . . . . . 3,545 20.0 $50,000 to $74,999. . . . . . . . . . . . . . . . . . . . . . . . . . . 3,499 19.8 $75,000 to $99,999. . . . . . . . . . . . . . . . . . . . . . . . . . . 1,223 6.9 $100,000 to $149,999. . . . . . . . . . . . . . . . . . . . . . . . . 589 3.3 $150,000 to $199,999. . . . . . . . . . . . . . . . . . . . . . . . . 138 0.8 $200,000 or more . . . . . . . . . . . . . . . . . . . . . . . . . . . . 141 0.8 Median household income (dollars) . . . . . . . . . . . . . 36,083 (X) With earnings . . . . . . . . . . . . . . . . . . . . . . . . . . . . . . . . 13,457 76.0 Mean earnings (dollars)1 . . . . . . . . . . . . . . . . . . . . 44,167 (X) With Social Security income . . . . . . . . . . . . . . . . . . . 5,728 32.4 Mean Social Security income (dollars)1 . . . . . . . 11,769 (X) With Supplemental Security Income . . . . . . . . . . . . 603 3.4 Mean Supplemental Security Income (dollars)1 . . . . . . . . . . . . . . . . . . . . . . . . . . . . . . . . . 6,350 (X) With public assistance income . . . . . . . . . . . . . . . . . 322 1.8 Mean public assistance income (dollars)1 . . . . . 2,269 (X) With retirement income . . . . . . . . . . . . . . . . . . . . . . . 3,773 21.3 Mean retirement income (dollars)1. . . . . . . . . . . . 13,380 (X) Families . . . . . . . . . . . . . . . . . . . . . . . . . . . . . . . . 12,139 100.0 Less than $10,000. . . . . . . . . . . . . . . . . . . . . . . . . . . . 461 3.8 $10,000 to $14,999. . . . . . . . . . . . . . . . . . . . . . . . . . . 532 4.4 $15,000 to $24,999. . . . . . . . . . . . . . . . . . . . . . . . . . . 1,600 13.2 $25,000 to $34,999. . . . . . . . . . . . . . . . . . . . . . . . . . . 2,033 16.7 $35,000 to $49,999. . . . . . . . . . . . . . . . . . . . . . . . . . . 2,678 22.1 $50,000 to $74,999. . . . . . . . . . . . . . . . . . . . . . . . . . . 3,029 25.0 $75,000 to $99,999. . . . . . . . . . . . . . . . . . . . . . . . . . . 1,061 8.7 $100,000 to $149,999. . . . . . . . . . . . . . . . . . . . . . . . . 529 4.4 $150,000 to $199,999. . . . . . . . . . . . . . . . . . . . . . . . . 112 0.9 $200,000 or more . . . . . . . . . . . . . . . . . . . . . . . . . . . . 104 0.9 Median family income (dollars) . . . . . . . . . . . . . . . . . 42,658 (X) Per capita income (dollars)1 . . . . . . . . . . . . . . . . . . . 17,862 (X) Median earnings (dollars): Male full-time, year-round workers. . . . . . . . . . . . . . 33,072 (X) Female full-time, year-round workers . . . . . . . . . . . 22,124 (X) Subject Number below poverty level Percent below poverty level POVERTY STATUS IN 1999 Families . . . . . . . . . . . . . . . . . . . . . . . . . . . . . . . . 821 6.8 With related children under 18 years. . . . . . . . . . . . 602 10.7 With related children under 5 years. . . . . . . . . . . 274 15.1 Families with female householder, no husband present . . . . . . . . . . . . . . . . . . . . . . . 328 22.9 With related children under 18 years. . . . . . . . . . . . 298 32.9 With related children under 5 years. . . . . . . . . . . 125 47.0 Individuals . . . . . . . . . . . . . . . . . . . . . . . . . . . . . . 4,224 9.9 18 years and over . . . . . . . . . . . . . . . . . . . . . . . . . . . . 2,665 8.2 65 years and over . . . . . . . . . . . . . . . . . . . . . . . . . . 394 5.9 Related children under 18 years . . . . . . . . . . . . . . . 1,505 14.6 Related children 5 to 17 years . . . . . . . . . . . . . . . 1,108 14.0 Unrelated individuals 15 years and over. . . . . . . . . 1,277 17.9 -Represents zero or rounds to zero. (X) Not applicable. 1If the denominator of a mean value or per capita value is less than 30, then that value is calculated using a rounded aggregate in the numerator. See text. Source: U.S. Bureau of the Census, Census 2000. U.S. Census Bureau
3

Northwest Pennsylvania Regional Planning & Development Commission CONNECT NW PA Broadband Study and Action Plan Supplemental Report
December 23, 2003 Page 204
Table DP-4. Profile of Selected Housing Characteristics: 2000 Geographic area: Warren County, Pennsylvania [Data based on a sample. For information on confidentiality protection, sampling error, nonsampling error, and definitions, see text] Subject Number Percent Total housing units. . . . . . . . . . . . . . . . . . . . 23,058 100.0 UNITS IN STRUCTURE 1-unit, detached. . . . . . . . . . . . . . . . . . . . . . . . . . . . . . 16,719 72.5 1-unit, attached . . . . . . . . . . . . . . . . . . . . . . . . . . . . . . 274 1.2 2 units . . . . . . . . . . . . . . . . . . . . . . . . . . . . . . . . . . . . . . 1,133 4.9 3 or 4 units . . . . . . . . . . . . . . . . . . . . . . . . . . . . . . . . . . 727 3.2 5 to 9 units . . . . . . . . . . . . . . . . . . . . . . . . . . . . . . . . . . 377 1.6 10 to 19 units . . . . . . . . . . . . . . . . . . . . . . . . . . . . . . . . 141 0.6 20 or more units . . . . . . . . . . . . . . . . . . . . . . . . . . . . . 454 2.0 Mobile home. . . . . . . . . . . . . . . . . . . . . . . . . . . . . . . . . 3,078 13.3 Boat, RV, van, etc . . . . . . . . . . . . . . . . . . . . . . . . . . . . 155 0.7 YEAR STRUCTURE BUILT 1999 to March 2000 . . . . . . . . . . . . . . . . . . . . . . . . . . 309 1.3 1995 to 1998 . . . . . . . . . . . . . . . . . . . . . . . . . . . . . . . . 741 3.2 1990 to 1994 . . . . . . . . . . . . . . . . . . . . . . . . . . . . . . . . 989 4.3 1980 to 1989 . . . . . . . . . . . . . . . . . . . . . . . . . . . . . . . . 2,162 9.4 1970 to 1979 . . . . . . . . . . . . . . . . . . . . . . . . . . . . . . . . 3,379 14.7 1960 to 1969 . . . . . . . . . . . . . . . . . . . . . . . . . . . . . . . . 2,573 11.2 1940 to 1959 . . . . . . . . . . . . . . . . . . . . . . . . . . . . . . . . 4,596 19.9 1939 or earlier . . . . . . . . . . . . . . . . . . . . . . . . . . . . . . . 8,309 36.0 ROOMS 1 room . . . . . . . . . . . . . . . . . . . . . . . . . . . . . . . . . . . . . . 286 1.2 2 rooms . . . . . . . . . . . . . . . . . . . . . . . . . . . . . . . . . . . . . 582 2.5 3 rooms . . . . . . . . . . . . . . . . . . . . . . . . . . . . . . . . . . . . . 1,761 7.6 4 rooms . . . . . . . . . . . . . . . . . . . . . . . . . . . . . . . . . . . . . 3,240 14.1 5 rooms . . . . . . . . . . . . . . . . . . . . . . . . . . . . . . . . . . . . . 4,677 20.3 6 rooms . . . . . . . . . . . . . . . . . . . . . . . . . . . . . . . . . . . . . 4,791 20.8 7 rooms . . . . . . . . . . . . . . . . . . . . . . . . . . . . . . . . . . . . . 3,534 15.3 8 rooms . . . . . . . . . . . . . . . . . . . . . . . . . . . . . . . . . . . . . 2,081 9.0 9 or more rooms . . . . . . . . . . . . . . . . . . . . . . . . . . . . . 2,106 9.1 Median (rooms) . . . . . . . . . . . . . . . . . . . . . . . . . . . . . . 5.7 (X) Occupied housing units . . . . . . . . . . . . . . . 17,696 100.0 YEAR HOUSEHOLDER MOVED INTO UNIT 1999 to March 2000 . . . . . . . . . . . . . . . . . . . . . . . . . . 2,151 12.2 1995 to 1998 . . . . . . . . . . . . . . . . . . . . . . . . . . . . . . . . 3,880 21.9 1990 to 1994 . . . . . . . . . . . . . . . . . . . . . . . . . . . . . . . . 2,892 16.3 1980 to 1989 . . . . . . . . . . . . . . . . . . . . . . . . . . . . . . . . 3,423 19.3 1970 to 1979 . . . . . . . . . . . . . . . . . . . . . . . . . . . . . . . . 2,452 13.9 1969 or earlier . . . . . . . . . . . . . . . . . . . . . . . . . . . . . . . 2,898 16.4 VEHICLES AVAILABLE None . . . . . . . . . . . . . . . . . . . . . . . . . . . . . . . . . . . . . . . 1,170 6.6 1 . . . . . . . . . . . . . . . . . . . . . . . . . . . . . . . . . . . . . . . . . . . 6,498 36.7 2 . . . . . . . . . . . . . . . . . . . . . . . . . . . . . . . . . . . . . . . . . . . 7,639 43.2 3 or more . . . . . . . . . . . . . . . . . . . . . . . . . . . . . . . . . . . 2,389 13.5 HOUSE HEATING FUEL Utility gas . . . . . . . . . . . . . . . . . . . . . . . . . . . . . . . . . . . 12,714 71.8 Bottled, tank, or LP gas . . . . . . . . . . . . . . . . . . . . . . . 1,675 9.5 Electricity. . . . . . . . . . . . . . . . . . . . . . . . . . . . . . . . . . . . 705 4.0 Fuel oil, kerosene, etc . . . . . . . . . . . . . . . . . . . . . . . . 900 5.1 Coal or coke. . . . . . . . . . . . . . . . . . . . . . . . . . . . . . . . . 16 0.1 Wood . . . . . . . . . . . . . . . . . . . . . . . . . . . . . . . . . . . . . . . 1,420 8.0 Solar energy. . . . . . . . . . . . . . . . . . . . . . . . . . . . . . . . . - - Other fuel . . . . . . . . . . . . . . . . . . . . . . . . . . . . . . . . . . . 250 1.4 No fuel used. . . . . . . . . . . . . . . . . . . . . . . . . . . . . . . . . 16 0.1 SELECTED CHARACTERISTICS Lacking complete plumbing facilities . . . . . . . . . . . . 136 0.8 Lacking complete kitchen facilities . . . . . . . . . . . . . . 138 0.8 No telephone service . . . . . . . . . . . . . . . . . . . . . . . . . 307 1.7 Subject Number Percent OCCUPANTS PER ROOM Occupied housing units . . . . . . . . . . . . . . . 17,696 100.0 1.00 or less. . . . . . . . . . . . . . . . . . . . . . . . . . . . . . . . . . 17,506 98.9 1.01 to 1.50 . . . . . . . . . . . . . . . . . . . . . . . . . . . . . . . . . 157 0.9 1.51 or more. . . . . . . . . . . . . . . . . . . . . . . . . . . . . . . . . 33 0.2 Specified owner-occupied units . . . . . . . . 9,746 100.0

Northwest Pennsylvania Regional Planning & Development Commission CONNECT NW PA Broadband Study and Action Plan Supplemental Report
December 23, 2003 Page 205
VALUE Less than $50,000. . . . . . . . . . . . . . . . . . . . . . . . . . . . 3,083 31.6 $50,000 to $99,999. . . . . . . . . . . . . . . . . . . . . . . . . . . 5,074 52.1 $100,000 to $149,999. . . . . . . . . . . . . . . . . . . . . . . . . 1,150 11.8 $150,000 to $199,999. . . . . . . . . . . . . . . . . . . . . . . . . 253 2.6 $200,000 to $299,999. . . . . . . . . . . . . . . . . . . . . . . . . 123 1.3 $300,000 to $499,999. . . . . . . . . . . . . . . . . . . . . . . . . 36 0.4 $500,000 to $999,999. . . . . . . . . . . . . . . . . . . . . . . . . 19 0.2 $1,000,000 or more. . . . . . . . . . . . . . . . . . . . . . . . . . . 8 0.1 Median (dollars) . . . . . . . . . . . . . . . . . . . . . . . . . . . . . . 64,300 (X) MORTGAGE STATUS AND SELECTED MONTHLY OWNER COSTS With a mortgage . . . . . . . . . . . . . . . . . . . . . . . . . . . . . 5,494 56.4 Less than $300 . . . . . . . . . . . . . . . . . . . . . . . . . . 37 0.4 $300 to $499 . . . . . . . . . . . . . . . . . . . . . . . . . . . . 698 7.2 $500 to $699 . . . . . . . . . . . . . . . . . . . . . . . . . . . . 1,752 18.0 $700 to $999 . . . . . . . . . . . . . . . . . . . . . . . . . . . . 1,932 19.8 $1,000 to $1,499 . . . . . . . . . . . . . . . . . . . . . . . . . 856 8.8 $1,500 to $1,999 . . . . . . . . . . . . . . . . . . . . . . . . . 157 1.6 $2,000 or more . . . . . . . . . . . . . . . . . . . . . . . . . . 62 0.6 Median (dollars) . . . . . . . . . . . . . . . . . . . . . . . . . . 731 (X) Not mortgaged . . . . . . . . . . . . . . . . . . . . . . . . . . . . . . . 4,252 43.6 Median (dollars) . . . . . . . . . . . . . . . . . . . . . . . . . . 279 (X) SELECTED MONTHLY OWNER COSTS AS A PERCENTAGE OF HOUSEHOLD INCOME IN 1999 Less than 15.0 percent. . . . . . . . . . . . . . . . . . . . . . . . 4,685 48.1 15.0 to 19.9 percent . . . . . . . . . . . . . . . . . . . . . . . . . . 1,783 18.3 20.0 to 24.9 percent . . . . . . . . . . . . . . . . . . . . . . . . . . 1,135 11.6 25.0 to 29.9 percent . . . . . . . . . . . . . . . . . . . . . . . . . . 625 6.4 30.0 to 34.9 percent . . . . . . . . . . . . . . . . . . . . . . . . . . 442 4.5 35.0 percent or more . . . . . . . . . . . . . . . . . . . . . . . . . 1,037 10.6 Not computed. . . . . . . . . . . . . . . . . . . . . . . . . . . . . . . . 39 0.4 Specified renter-occupied units . . . . . . . . 3,713 100.0 GROSS RENT Less than $200 . . . . . . . . . . . . . . . . . . . . . . . . . . . . . . 212 5.7 $200 to $299 . . . . . . . . . . . . . . . . . . . . . . . . . . . . . . . . 432 11.6 $300 to $499 . . . . . . . . . . . . . . . . . . . . . . . . . . . . . . . . 1,855 50.0 $500 to $749 . . . . . . . . . . . . . . . . . . . . . . . . . . . . . . . . 710 19.1 $750 to $999 . . . . . . . . . . . . . . . . . . . . . . . . . . . . . . . . 57 1.5 $1,000 to $1,499 . . . . . . . . . . . . . . . . . . . . . . . . . . . . . 28 0.8 $1,500 or more . . . . . . . . . . . . . . . . . . . . . . . . . . . . . . 6 0.2 No cash rent. . . . . . . . . . . . . . . . . . . . . . . . . . . . . . . . . 413 11.1 Median (dollars) . . . . . . . . . . . . . . . . . . . . . . . . . . . . . . 401 (X) GROSS RENT AS A PERCENTAGE OF HOUSEHOLD INCOME IN 1999 Less than 15.0 percent. . . . . . . . . . . . . . . . . . . . . . . . 909 24.5 15.0 to 19.9 percent . . . . . . . . . . . . . . . . . . . . . . . . . . 563 15.2 20.0 to 24.9 percent . . . . . . . . . . . . . . . . . . . . . . . . . . 471 12.7 25.0 to 29.9 percent . . . . . . . . . . . . . . . . . . . . . . . . . . 355 9.6 30.0 to 34.9 percent . . . . . . . . . . . . . . . . . . . . . . . . . . 234 6.3 35.0 percent or more . . . . . . . . . . . . . . . . . . . . . . . . . 696 18.7 Not computed. . . . . . . . . . . . . . . . . . . . . . . . . . . . . . . . 485 13.1 -Represents zero or rounds to zero. (X) Not applicable. Source: U.S. Bureau of the Census, Census 2000. U.S. Census Bureau 4

Northwest Pennsylvania Regional Planning & Development Commission CONNECT NW PA Broadband Study and Action Plan Supplemental Report
December 23, 2003 Page 206
Economic Development Initiatives Data by County
Clarion County
Clarion County Economic Development Corporation is planning development of Beaver Township Industrial Park, a 77-acre KOZ. Construction of the roads and utilities is expected to commence in Spring, 2002. Another 43-acre KOZ is being privately developed by Clarion Trinity Development Corporation as part of a 155-acre development, known as “Trinity Point”, in Monroe Township at I-80 Exit 62.
Clarion County will need some additional KOZ land.
Industrial land development in Clarion County is somewhat unique compared to many adjacent jurisdictions…Clarion County is attracting new large users, primarily in the manufactured home building industry.
These data shows that almost all of the new industrial land development in Clarion County is the result of new companies moving to the County from outside of the region, and thus representing new growth of the region.39
39 Industrial Land Absorption Study Keystone Opportunity Zones Northwest Pennsylvania, March 2002; Prepared For: Northwest Pennsylvania Regional Planning and Development Commission by S. Patz and Associates, Inc. Herndon, Virginia

Northwest Pennsylvania Regional Planning & Development Commission CONNECT NW PA Broadband Study and Action Plan Supplemental Report
December 23, 2003 Page 207
Table 10-A: Clarion County Development Initiatives
County Name of Development or Assigned Name
Dev. Proj. ID
Type Development
General Location
Acres Status of Communication Infrastructure
Status of Other Utility Infrastructure:
Special Designation or Comments
Clarion Clarion County Commerce Center
CL-1 Industrial Park (Planned for 2004)
I-80 Exit 53 St. Rt. 338 N. 2 miles
77 Within DSL & Cable Modem Capability
W,S,G 2004 KOZ; Access road available;
Clarion Near Castle Housing Industrial Park
CL-2 Industrial Park (Existing)
I-80 Exit 53 St. Rt. 338 N 4 miles
50 Within DSL & Cable Modem Capability
W, S
Only 4.5 acres available Castle Housing anchor tenant; Access road
Clarion Identified Industrial Park
CL-3 Industrial Park (Planned)
I-80 Exit 60 St. Rt. 66N
Within DSL & Cable Modem Capability
Approx. 4 miles w/o infrastructure
Identified as industrial develop. corridor
Clarion Trinity Point CL-4 Mixed Use (Planned)
I-80 Exit 62 St. Rt. 68 S ½ mile
121 Within DSL & Cable Modem Capability
W,S,T 2004; 53 acres
KOEZ; Access road 2003; Clarion Univ. planned bio/nano technology R&D incubator
Clarion North Clarion Hospital Addition
CL-5 Health Facility (Existing 2003 and Planned 2nd phase)
I-80 Exit 62 St. Rt. 68
Within DSL & Cable Modem Capability
Existing 2 story cancer center; Second phase of 10,000 sf. On 3 rd level to expand clinical services
Clarion Clarion University Science Center & Dorm Village
CL-6 Instit utional (Planned)
I-80 Exit 62 St. Rt. 68N
DSL Capability New science center bldg. and dormitory village
Clarion Identified Industrial Growth Area
CL-7 Industrial (Planned)
I-80 Exit 64 St. Rt. 66S
No DSL or Cable Modem
Identified industrial growth area
Clarion Rt. 66 Growth Corridor
CL-
COR-8
Rt. 66 South-
bound to I-80
towards New
Bethlehem
No DSL or Cable Modem
Growth corridor
Clarion Rt. 28 Growth Corridor
CL-
COR-9
Rt. 28 from New Bethlehem to Hawthorn
Within Cable Modem and Partial DSL Capability

Northwest Pennsylvania Regional Planning & Development Commission CONNECT NW PA Broadband Study and Action Plan Supplemental Report
December 23, 2003 Page 208
Crawford County
Crawford County has industrial parks with the KOZ designation and ready-to-build lots. Crawford County has several former manufacturing plants converted to multi-tenant facilities with KOZ designations, including the Talon Plant 7 in Meadville and Titusville Opportunity Park in Titusville.
Crawford County has five KOZ sites, including the largest KOZ in the region. Two KOZ sites are the reuse of manufacturing plants, while the others are industrial parks. All the sites are active.
Crawford County is in excellent position to generate increased industrial land development with 1,300 well-located acres of KOZ land. This total is high compared with the past trends and may suggest that Crawford will be a much more competitive location within the region and may attract some development that previously may have been attracted to Erie or Mercer County.
All the County’s industrial properties are in or near Meadville or at Titusville.
Within Crawford County (and other adjacent Counties) most industrial expansion is not new development on vacant land.41
Some of these characteristics may be seen as opportunities. The fact that the County is a net exporter of workers to Warren and Mercer Counties in Pennsylvania, and Trumbull and Ashtabula Counties in Ohio, suggests that the potential labor force for jobs in the County is fairly high. Furthermore, prevailing wages are quite low and the County is in a good competitive position to lure industries seeking an abundant pool of inexpensive labor. Conversely, the estimates for the 1990s are very encouraging, suggesting that the County is rebounding.42
Some needed transportation system improvements in Crawford County include enhancing access to various industrial sites, reducing congestion on Meadville’s North Street, better coordinating social service transportation, upgrading roads and access areas for wide-body trucks (102 inches), and diverting through truck traffic out of Meadville. As with many areas throughout Pennsylvania and the country, improved truck routes in Crawford County are needed to attract new industry, specifically east-west corridor travel routes between Meadville and Titusville. Based on business information from the Meadville-Titusville East-West Corridor Study and the 1973 Comprehensive Plan, road improvements to State Routes 27, 77, and 408 are desirable. Additionally, improvements to State Route 198 and the roads to the industrial zones west of Meadville are needed. Beyond enhancing the County’s transportation
41 Industrial Land Absorption Study Keystone Opportunity Zones Northwest Pennsylvania, March 2002; Prepared For: Northwest Pennsylvania Regional Planning and Development Commission by S. Patz and Associates, Inc. Herndon, Virginia
42 Comprehensive Plan Phase II: Plan Elements for Crawford County, Pennsylvania, 1997-2000; Prepared by the: Crawford County Planning Commission and Richard C. Sutter & Associates, Inc., Hollidaysburg, Pennsylvania and of Pittsburgh, Pennsylvania

Northwest Pennsylvania Regional Planning & Development Commission CONNECT NW PA Broadband Study and Action Plan Supplemental Report
December 23, 2003 Page 209
network, such road improvements would increase the number of workers within a 30-minute commute of both Meadville and Titusville. This would be a significant business attraction.43
As the population has increased, residential development has spread out from the boroughs along existing roadways; primarily in the form of low-density, scattered single-family housing. Large development has occurred in the forms of intense commercial development along major transportation corridors, highway related commercial development, and tourist related commercial and seasonal housing. The redistribution of population over recent years indicates an increasing preference for a suburban or rural location as compared with housing within the boroughs. For financial reasons; - lower taxes and cheaper land - as well as some social reasons, families tend to move outward to newer areas, which are perceived by many to be more desirable. A large portion of the County’s land remains vacant or wooded; however, much of this land in the southern portion of the County is too steep for economical construction or any high-intensity use. At the present and for the next several decades, most of this wooded land is best reserved for watersheds and conservation purposes or for passive recreation areas. There remains potentially developable land immediately surrounding the already developed areas of the boroughs; however, the ever-increasing needs and demands upon the land, which will only be compounded in the future, make it imperative that growth throughout the County be properly guided.44
43 Comprehensive Plan Phase II: Plan Elements for Crawford County, Pennsylvania, 1997-2000; Prepared by the: Crawford County Planning Commission and Richard C. Sutter & Associates, Inc., Hollidaysburg, Pennsylvania and of Pittsburgh, Pennsylvania
44 Comprehensive Plan Phase II: Plan Elements for Crawford County, Pennsylvania, 1997-2000; Prepared by the: Crawford County Planning Commission and Richard C. Sutter & Associates, Inc., Hollidaysburg, Pennsylvania and of Pittsburgh, Pennsylvania

Northwest Pennsylvania Regional Planning & Development Commission CONNECT NW PA Broadband Study and Action Plan Supplemental Report
December 23, 2003 Page 210
Table 10-B: Crawford County Development Initiatives
County Name of Development or Assigned Name
Dev. Proj. ID
Type Development
General Location
Acres Status of Communication Infrastructure
Status of Other Utility Infrastructure:
Special Designation or Comments
Crawford Crawford County Industrial Park (CCIP) (brownfield)
CR-1 Redevelopment light manufacturing warehousing office space, education/ training facility
French Creek Valley Enterprise Zone in Vernon Twp.
300 (35 acres under roof)
Comprehensive, OC 48, T-1, T-3, Frame relay, Ethernet, AGIS & UUNET (D53-45 Mbps); Greater Meadville Area Local Access Network (GREMLAN) Internet Hub Rm. At CCIP; Within DSL & Cable Modem Capability
E,G,W,S existing
Regional Conference & Meeting Center (RCTC)-Globally interactive facilities; computer lab., conferencing & meeting rms., presentation center; Service providers-AllTel Tele., AT&T, Sprint, MCI, Armstrong Cable; Owned by CCDC Group; Approx. 800,000 sf of bldg. space redeveloped; 22 tenants employing 870 people
Crawford Crawford County Industrial Park West
CR-2 French Creek Valley Enterprise Zone
25 acres total, with 20 acres remaining for devel-opment
AllTEL Comm. & Armstrong Cable serving property; No broadband extended to site; Within DSL & Cable Modem Capability
Utility connections installed to properties fronting Mosiertown Rd.; Needed infrastructure for further dev.
All but 2 acres in KOEZ; Owned by CCDC Group; 22,000 sf bldg. w/offices and production areas ready for lease or sale (Bldg. not in KOEZ)
Crawford West Mead Industrial Park
CR-3 Heavy Industrial Park
West Mead Twp.
190 acres
Within DSL & Cable Modem Capability
G,W,S,E existing; Entrance road, RR , storm water facilities
Five businesses at park; CCDC sold all but about 25 acres & owns 20,500 sf of a 200,000 sf facility
Crawford Terrence St. Property
CR-4 City of Meadville, French Creek Valley Enterprise Zone
27 Within DSL and Cable Modem Capability
Utilities at edge of property
Extensive site work needed; Land available for development
County Name of Development or Assigned Name
Dev. Proj. ID
Type Development
General Location
Acres Status of Communication Infrastructure
Status of Other Utility Infrastructure:
Special Designation or Comments
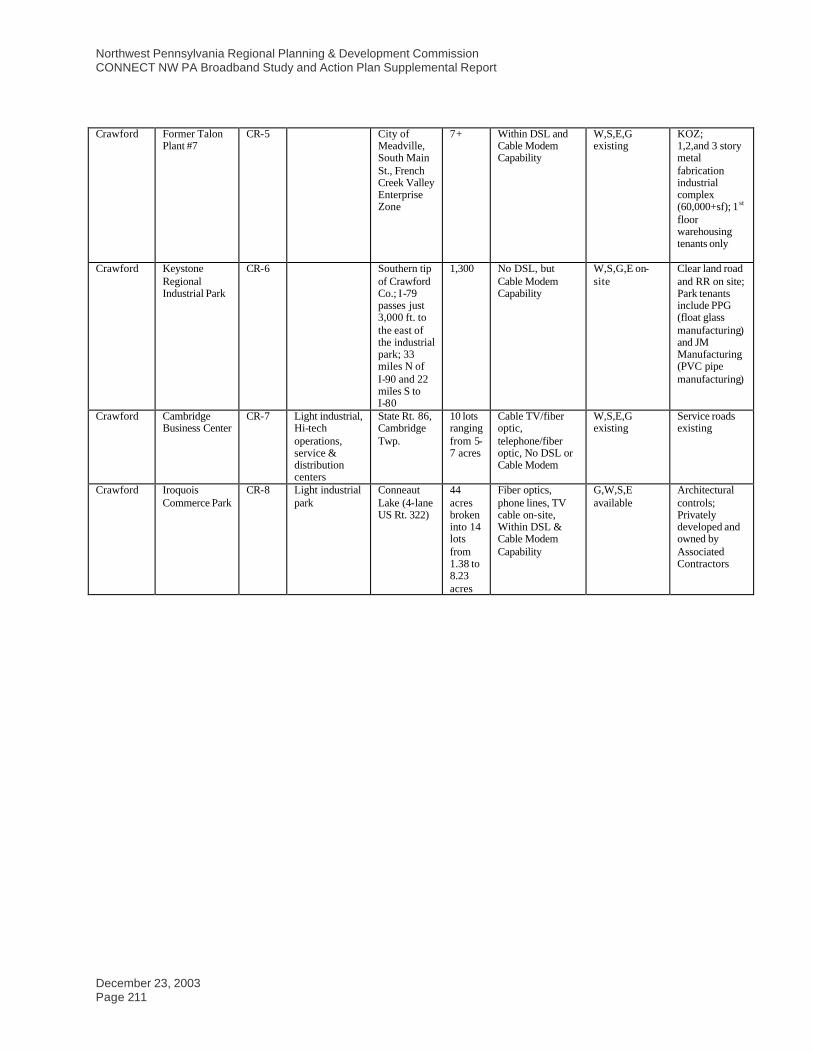
Northwest Pennsylvania Regional Planning & Development Commission CONNECT NW PA Broadband Study and Action Plan Supplemental Report
December 23, 2003 Page 211
Crawford Former Talon
Plant #7 CR-5 City of
Meadville, South Main St., French Creek Valley Enterprise Zone
7+ Within DSL and Cable Modem Capability
W,S,E,G existing
KOZ; 1,2,and 3 story metal fabrication industrial complex (60,000+sf); 1 st floor warehousing tenants only
Crawford Keystone Regional Industrial Park
CR-6 Southern tip of Crawford Co.; I-79 passes just 3,000 ft. to the east of the industrial park; 33 miles N of I-90 and 22 miles S to I-80
1,300 No DSL, but Cable Modem Capability
W,S,G,E on-site
Clear land road and RR on site; Park tenants include PPG (float glass manufacturing) and JM Manufacturing (PVC pipe manufacturing)
Crawford Cambridge Business Center
CR-7 Light industrial, Hi-tech operations, service & distribution centers
State Rt. 86, Cambridge Twp.
10 lots ranging from 5-7 acres
Cable TV/fiber optic, telephone/fiber optic, No DSL or Cable Modem
W,S,E,G existing
Service roads existing
Crawford Iroquois Commerce Park
CR-8 Light industrial park
Conneaut Lake (4-lane US Rt. 322)
44 acres broken into 14 lots from 1.38 to 8.23 acres
Fiber optics, phone lines, TV cable on-site, Within DSL & Cable Modem Capability
G,W,S,E available
Architectural controls; Privately developed and owned by Associated Contractors

Northwest Pennsylvania Regional Planning & Development Commission CONNECT NW PA Broadband Study and Action Plan Supplemental Report
December 23, 2003 Page 212
Erie County
Erie City, at 103,717, remains the County’s and the region’s largest municipality in 2000.
Millcreek Township (52,129) saw the greatest growth between 1990 and 2000, +5309. Harborcreek (16,267) had the second highest growth, +1159.
For the smaller urban areas, Edinboro Borough experienced the largest drop in population (-786) while Girard Borough (+285) and Lake City borough (+292) experienced the highest growth.
In the non-urban townships, Conneaut grew the most (+1,970) between 1990 and 2000; however, 1,885 of the change were due to the development of SCI-Albion. In terms of true residential growth, Girard (+411), Washington (+424) and Waterford Townships (+476) experienced the greatest increases. Greene Township (-191) saw the largest rural population loss.
One of the reasons that Erie County has kept its demographic vitality while neighboring counties are experiencing difficulties is its concentration of colleges and universities. These institutions represent a mini-community within the greater area.45
New housing developments favor communities along Erie’s Lake shore or the I-79 corridor. …Fairview is where most of the upscale units are built, followed by Millcreek. However, McKean and Washington Townships are also seeing increased development.46
Future changes in land use that will have a significant impact on traffic will generally proceed along existing development patterns, with residential development continuing in the municipalities surrounding the City of Erie. Some limited industrial redevelopment and new industrial development will occur in the City of Erie along the Bayfront and in the enterprise zone, in Millcreek Township, Harborcreek Township, Summit Township and the City of Corry. Commercial development is also planned along the Bayfront in the City of Erie and at selected locations throughout the City. In addition, commercial development is expected in Millcreek, Summit, Harborcreek and Fairview Townships.47
These data show a significant number of KOZ sites in Erie County, most located either in the City of Erie or in Corry, which is in the southeast corner of the county. Corry has had an active industrial development market in recent years. Many of the KOZ sites in the City of Erie have some environmental issues, but some of these are already being addressed. Erie County’s Albion site is in private ownership and currently inactive.
Erie County has industrial parks with the KOZ designation and ready-to-build lots. Erie County has several former manufacturing plants converted to multi-tenant facilities with KOZ designations, including the Erie Plastics facility in Corry.
45Erie County Demographic Study, January, 2003; Prepared by Graney, Grossman, Colosimo and Associates, Inc., Grove City, Pennsylvania, With the Assistance of the Erie county Department of Planning
46 Erie County Housing Plan, February 20, 2001; Prepared for the County of Erie, Assisted by Graney, Grossman, Ray and Associates, Harrisville, Pennsylvania
47 Erie County Long Range Transportation Plan, 1998 Update; Prepared by: The Erie County Department of Planning in cooperation with: The Pennsylvania Department of Transportation, The Erie Area Transportation Study Technical and Coordinating Committees, The Erie Metropolitan Transit Authority, The Erie-Western Pennsylvania Port Authority, Erie Municipal Airport Authority, Local Municipal Officials

Northwest Pennsylvania Regional Planning & Development Commission CONNECT NW PA Broadband Study and Action Plan Supplemental Report
December 23, 2003 Page 213
Some industrial parks have KOZ designation while other KOZ sites are raw land proposed for future development.
Erie County has considerable KOZ land but much of that land is in private ownership and not readily available. Much is also available in the Corry area. All of the KOZ land in the City of Erie (329 + acres) consists of brownfield sites, with 30 acres possibly available for development within 12 months (of March 2002). The major issue is funding for infrastructure which is being addressed. The 40 acres in Fairview Business Park, near the City of Erie, is available immediately. The data suggest that Erie County’s readily available KOZ property is insufficient for potential long-range demand based on past trends.48
The remaining narrative information (not maps and tabular information) is from the City of Erie Telecommunications Planning: Phase 1: Executive Report (See credits in footnote at end of section)
Recomme ndations
Perform more detailed business planning to determine the optimal partnering strategies for a community branded offering and determine the optimum route for the 6-mile fiber optic cable. This route should pass the largest number of potential businesses and multifamily residential units and still connect the necessary City facilities as originally intended.
The City should appropriate the necessary funds and construct the network.
Follow parallel paths of negotiating with current and potential services providers and forming the Not-For-Profit entity as the first step of creating a Public/Private partnership. Maintaining this flexibility will ensure the City has both maximum negotiating leverage with providers and can secure a business arrangement that can provide the greatest financial benefits to the community.
4. Pursue potential State of Pennsylvania grants currently available to fund technology infrastructure improvements that could benefit low-income housing residents and others within the community.
Next Steps (assuming the City affirms the above recommendations)
1. Prepare Detailed business plan
2. Initiate discussions with the 13 potential providers
3. Conduct an engineering study to determine both the optimum technology to deploy and costs for such.
4. File the necessary applications with the State of Pennsylvania Economic Development Department to obtain available technology grants for technology infrastructure construction.
48 Industrial Land Absorption Study Keystone Opportunity Zones Northwest Pennsylvania, March 2002; Prepared For: Northwest Pennsylvania Regional Planning and Development Commission by S. Patz and Associates, Inc. Herndon, Virginia

Northwest Pennsylvania Regional Planning & Development Commission CONNECT NW PA Broadband Study and Action Plan Supplemental Report
December 23, 2003 Page 214
5. Approach surrounding townships and boroughs to get their participation and financia l support if necessary.49
49 City of Erie Telecommunications Planning: Phase 1: Executive Report, April 3, 2002; ION Consulting, Chicago, Illinois

Northwest Pennsylvania Regional Planning & Development Commission CONNECT NW PA Broadband Study and Action Plan Supplemental Report
December 23, 2003 Page 215
Table 10-C: Erie County Development Initiatives
County Name of
Development or Assigned Name
Dev. Proj. ID
Type Development
General Location
Acres Status of Communication Infrastructure
Status of Other Utility Infrastructure:
Special Designation or Comments
Erie Cohen Site-Various
E-1 Industrial Park East of Downing, N of E 18 th St.
20 Within DSL & Cable Modem Capability
KOZ
Erie CSX (Conrail) E-2 Near Ash St., N of 18th St.
60 Within DSL & Cable Modem Capability
KOZ
Erie Liberty Iron & Metal
E-3 Property is on or near Parade Street from 14 th-20th St.
6 Within DSL & Cable Modem Capability
KOZ
Erie Redevelopment Auth.
E-4 Property is on or near Parade Street from 14 th-20th St.
4 Within DSL & Cable Modem Capability
KOZ
Erie Steve McGarvey
E-5 Property is on or near Parade Street from 14 th-20th St.
1 Within DSL & Cable Modem Capability
KOZ
Erie Randy Rydzewski
E-6 Property is on or near Parade Street from 14 th-20th St.
2 Within DSL & Cable Modem Capability
KOZ
Erie City of Erie E-7 Property is on or near Parade Street from 14 th-20th St.
4 Within DSL & Cable Modem Capability
KOZ
Erie Norfolk & Others
E-8 Property is on or near Parade Street from 14 th-20th St.
13 Within DSL & Cable Modem Capability
KOZ
Erie Erie Western PA Port Authority
E-9 On Ore Dock Road, N of Bayfront Parkway
89 Within DSL & Cable Modem Capability
KOZ; 16 acres decertified 2003 Dev. By Sun- burst & Jerilu
Erie Sixteenth & Pittsburg LLC (DiCarlo, Griffith ET Ux)
E-10 W 16 th & Pittsburgh Avenue
17 Within DSL & Cable Modem Capability
KOZ; Available
Erie International Paper
E-11 E 12 th at Downing
22.8 Within DSL & Cable Modem Capability
KOEZ; Available
Erie Empire Auto E-12 E 12 th at Downing
2.4 Within DSL & Cable Modem Capability
KOEZ; Available
Erie Kaiser Aluminum
E-13 E 12 th Near Pennsylvania Avenue
28.4 Within DSL & Cable Modem Capability
KOEZ; Available
Erie Koehler Brewery Square, LLC
E-14 W 22nd & State St.
1.6 Within DSL & Cable Modem Capability
KOEZ; In process of development
Erie Schvaro Reality E-15 E 33 rd & 15 Within DSL & KOEZ;

Northwest Pennsylvania Regional Planning & Development Commission CONNECT NW PA Broadband Study and Action Plan Supplemental Report
December 23, 2003 Page 216
McCain Cable Modem Capability
New owner; Available
Erie Fry (Mayer Bros)
E-16 E 33 rd & McCain
15 Within DSL & Cable Modem Capability
KOEZ; New owner; Available
Erie Various Owners
E-17 E 16 th-E18th Franklin McClelland
Within DSL & Cable Modem Capability
KOEZ; Available
Erie Hadspar (Herb Sweny)
E-18 W 13 th & Cranberry
4.5 Within DSL & Cable Modem Capability
KOEZ; Available
Erie Gunite/EMI E-19 S side W 12 th St. @ Cherry St.
12 Within DSL & Cable Modem Capability
KOZ/KOEZ; Available; City assisting reuse
Erie GE Refrigeration
E-20 SW Corner E 12th @ Franklin Ave.
11.2 Within DSL & Cable Modem Capability
KOZ/KOEZ; Available
Erie Skinner Engine Co.
E-21 S Side W 12th Near Myrt le St.
3.05 Within DSL & Cable Modem Capability
KOZ/KOEZ; Available
Erie Schnell Property (Lake Erie Bumper)
E-22 N Side W 12th St. @ Cascade St.
1.49 Within DSL & Cable Modem Capability
KOZ/KOEZ; Available;
Erie International Paper
E-23 S Side E Lake Road, W of Downing Ave.
55.73 Within DSL & Cable Modem Capability
KOZ/KOEZ; Available; City assisting reuse
Erie GEIDC Property
E-24 NE Corner E 34th @ Page St.
4.4 Within DSL & Cable Modem Capability
KOZ/KOEZ; Available
Erie GEIDC Property (Adj. for wetlands)
E-25 S Side E 26th St. Near McCain
10 Within DSL & Cable Modem Capability
KOZ/KOEZ; Available
Erie International Paper
E-26 W Lake Rd @ Hammerville Dr.
115 KOIZ; Available; City assisting in reuse

Northwest Pennsylvania Regional Planning & Development Commission CONNECT NW PA Broadband Study and Action Plan Supplemental Report
December 23, 2003 Page 217
Figure 10-A: Erie County 2030 Transportation Plan Highway Network

Northwest Pennsylvania Regional Planning & Development Commission CONNECT NW PA Broadband Study and Action Plan Supplemental Report
December 23, 2003 Page 218
Figure 10-B: Erie County 2030 Transportation Plan Erie Urban Area

Northwest Pennsylvania Regional Planning & Development Commission CONNECT NW PA Broadband Study and Action Plan Supplemental Report
December 23, 2003 Page 219
Figure 10-C: Erie County-Keystone Zones

Northwest Pennsylvania Regional Planning & Development Commission CONNECT NW PA Broadband Study and Action Plan Supplemental Report
December 23, 2003 Page 220
Figure 10-D: Erie County-Wide Enterprise Zone Program

Northwest Pennsylvania Regional Planning & Development Commission CONNECT NW PA Broadband Study and Action Plan Supplemental Report
December 23, 2003 Page 221
Figure 10-E: Erie County Plans for Land Use & Community Facilities

Northwest Pennsylvania Regional Planning & Development Commission CONNECT NW PA Broadband Study and Action Plan Supplemental Report
December 23, 2003 Page 222
Figure 10-F: Erie County Composite Local Zoning Districts

Northwest Pennsylvania Regional Planning & Development Commission CONNECT NW PA Broadband Study and Action Plan Supplemental Report
December 23, 2003 Page 223
Forest County
Forest County had a 200-acre KOZ site in Jenks Township north of Marienville, but that land has been taken off the market because it is currently being developed with a new Pennsylvania State Correctional Institution. Forest County is the only county in the Northwest region that is currently not actively developing and marketing one or more KOZ property.
Forest County has no KOZ land; however, it also had no demand.
Forest County also has the privately-owned Marienville Industrial Park, which is the reuse of the former Anchor Hocking Glass Plant in Marienville as a multi-tenant facility. Approximately 40,000 square feet of space is immediately available. A new electro-coating business and painting business represent recent industrial activity in the complex.50
The remaining narrative information (not tabular) for Forest County is from The Forest County Comprehensive Plan, 1998 (See footnote at end of section)
Growth Priority Areas
A local consensus is in near agreement that the Route 66 corridor, north and particularly south of Marienville and, the Route 36 corridor, south of Tionesta, represents the most suitable parcels for future growth. Fortunately, detailed land use infrastructure, environmental limitations, and even preliminary site planning information are available for these corridors (see the 1987 Forest County Tornado Disaster Economic Recovery Plan and the 1988 Marienville Corridor Economic Recovery Plan). With much of the detailed planning complete, what is now needed is a means of implementation.
What has kept these areas from developing in a manner desired by the community? There seems to be three factors. First, the lack of public water and sewer. Second, the lack of concerted marketing efforts by communities or property owners. Finally, based upon studies of similar situations throughout western and central Pennsylvania, is a lack of development incentives.
Economic Development Plan
Though it may be said that Forrest county got little lasting benefit from the Industrial Revolution, there is hope that the community can come out a winner in the new information-age economy.
The new information-age or post-industrial economy has certain characteristics which would make Forrest County an appropriate home for such economic activities. Locational emphasis in information–age economics is almost wholly based upon quality of life. Since information is a commodity, and it can be transferred inexpensively worldwide, proximity to labor pools and resources is unimportant. In spite of its problems, Forrest County has small pleasant towns, scenic vistas unmatched in the eastern United States, and a way of life which much of the nation envies.
50 Industrial Land Absorption Study Keystone Opportunity Zones Northwest Pennsylvania, March 2002; Prepared For: Northwest Pennsylvania Regional Planning and Development Commission by S. Patz and Associates, Inc. Herndon, Virginia

Northwest Pennsylvania Regional Planning & Development Commission CONNECT NW PA Broadband Study and Action Plan Supplemental Report
December 23, 2003 Page 224
The second notable factor of an information-age economy is its decentralization. Most of the new information-age businesses are relatively small and work in coalition with other businesses.
One final trend also lends itself to hope for Forest County’s economy. That trend is toward community-based economic development. Communities from Nova Scotia to the American Midwest are choosing, in part, to opt out of the global economy, and rebuild the economic infrastructure which will make them viable for the foreseeable future. The survival of the community depends, in large part, on whether we will be able to revitalize and resurrect our community-based economies.
Each of these sectors has various opportunities which can help close gaps and complete the web. They can be summarized in three general areas:
« Agro-Forestry and the Processing of Forest Products
« Tourism and Residential Development: Seeing Quality of Life as a Marketable Commodity
« Retail and the New Service Businesses
New Service Activities :
Many analysts extol the information-age economy, which is essentially service-based. For Forest County to participate in this economy will require attention to proper business infrastructure. This includes high-speed modem lines, fiber optics, and access to various Internet and computer-related services. It is recommended that the County work to aggressively pursue the development of such infrastructure. An excellent resource already exists in the IDC facility.
Correctional facility/Major Facility Impact: Overall, this new facility will be the most significant impact on Jenks Township and Forest County since the oil boom. (i.e. wages, jobs, population increases, increased housing, import of goods and supplies, construction, gasoline and food sales, etc.)
The actual economic impact of the project would probably be spread through large parts of Forest, Venango, Clarion, Warren, and Elk Counties. Though the prison would probably not adversely effect local quality of life, without preparation now, it will not create benefits.
Conclusion
There is a strong interest in economic development to create job opportunities and prevent the out migration of the young.
There is a strong preference for locally based development in the form of “cottage industries,” small business wood products and business opportunities based upon quality of local life. This desire can be tied to previous points as the local desire for a complete, fully functioning local economy and community.51
Tionesta Wireless Project
51 Forest County Comprehensive Plan, 1998; Prepared by the Forest County Conservation District and Planning Commission, Assisted by Graney, Grossman, Ray and Associates, New Wilmington, Pennsylvania, Franklin, Pennsylvania

Northwest Pennsylvania Regional Planning & Development Commission CONNECT NW PA Broadband Study and Action Plan Supplemental Report
December 23, 2003 Page 225
In cooperation with the Forest County Commissioners and the Forest County Industrial Development Corporation, the Northwest Commission was able to secure a $44,000 grant from the Appalachian Regional Commission to implement a public-private partnership offering broadband wireless Internet into Tionesta Borough and surrounding municipalities. Until October 2003, an affordable broadband solution was not available in the tiny, rural community. Recently, the telephone company began offering DSL in order to stay competitive with the wireless project. A bid process will take place in November to select a wireless provider who will implement the service and will complete the partnership. Implementation is set to be complete by January 2004.

Northwest Pennsylvania Regional Planning & Development Commission CONNECT NW PA Broadband Study and Action Plan Supplemental Report
December 23, 2003 Page 226
Table 10-D: Forest County Development Initiatives
County Name of Development or Assigned Name
Dev. Proj. ID
Type Development
General Location
Acres Status of Communication Infrastructure
Status of Other Utility Infrastructure:
Special Designation or Comments
Forest Hunter Station F-1 Along Rt. 62 S of Tionesta Station
No DSL or Cable Modem
Forest H&M Mus. Industrial Park
F-2 Along Rt. 62 near Tionesta
No DSL or Cable Modem
Forest SCI Forest F-3 SE of Rt. 66 between Marienville & Pigeon
No DSL or Cable Modem
Forest Res./Comm. Corridor
F-4 Marienville No DSL or Cable Modem

Northwest Pennsylvania Regional Planning & Development Commission CONNECT NW PA Broadband Study and Action Plan Supplemental Report
December 23, 2003 Page 227
Lawrence County
Lawrence County has industrial parks with the KOZ designation and ready-to-build lots.
Lawrence County has six KOZ sites.
Lawrence County appears to be in balance in terms of supply and demand, especially with the addition of a new industrial park that has ready-to-build lots and another proposed industrial park.
Lawrence County has eight industrial parks, but only one is new and highly competitive. None of the existing industrial parks are located near I-79. Several are brownfield developments and one is a relatively unusual sub-surface property. 52
52 Industrial Land Absorption Study Keystone Opportunity Zones Northwest Pennsylvania, March 2002; Prepared For: Northwest Pennsylvania Regional Planning and Development Commission by S. Patz and Associates, Inc. Herndon, Virginia

Northwest Pennsylvania Regional Planning & Development Commission CONNECT NW PA Broadband Study and Action Plan Supplemental Report
December 23, 2003 Page 228
Table 10-E: Lawrence County Development Initiatives
County Name of
Development or Assigned Name
Dev. Proj. ID
Type Development
General Location
Acres Status of Communication Infrastructure
Status of Other Utility Infrastructure:
Special Designation or Comments
Lawrence Shenango Commerce Park
L-1 Industrial, light industrial manufacturing, business warehousing
Shenango Twp.
202 Within DSL & Cable Modem Capability
Available
Lawrence Millenium Park L-2 High Tech manufacturing, R&D flex space
Neshannock Twp.
1,200 No DSL, but Cable Modem Capability
Proposed; Available
Lawrence Bruce Industrial Park
L-3 Industrial, light industrial manufacturing, business warehousing
City of New Castle
30 Within DSL & Cable Modem Capability
Available
Lawrence Gateway Commerce Center
L-4 Industrial, light industrial manufacturing, business warehousing
Wampum Borough
60 Within DSL & Cable Modem Capability
Available
Lawrence Eastgate Commerce Center
L-5 Industrial, light industrial manufacturing, business warehousing
Shenango Twp.
26 Within DSL & Cable Modem Capability
Available
Lawrence Linton Industrial Center
L-6 Industrial, light industrial manufacturing, business warehousing
Wilmington Twp.
12 Within DSL & Cable Modem Capability
Available
Lawrence New Castle Commerce Center
L-7 Industrial, light industrial manufacturing, business warehousing
City of New Castle
19 Within DSL & Cable Modem Capability
Available
Lawrence New Castle Development Company
L-8 Industrial, light industrial manufacturing, business warehousing
North Beaver Twp.
500 No DSL, but Cable Modem Capability
Available
Lawrence Northgate Industrial Park
L-9 Industrial, light industrial manufacturing, business warehousing
Neshannock Twp.
26 No DSL, but Cable Modem Capability
Available
Lawrence Phil Art Industrial Park
L-10 Industrial, light industrial manufacturing, business warehousing
Neshannock Twp.
42 Within DSL & Cable Modem Capability
Available
Lawrence RIDC Neshannock
L-11 Industrial, light industrial manufacturing, business warehousing
Neshannock Twp.
72 No DSL, but Cable Modem Capability
Available
Lawrence Riverview Commerce Park
L-12 Industrial, light industrial manufacturing, business warehousing
City of New Castle
75 Within DSL & Cable Modem Capability
Available

Northwest Pennsylvania Regional Planning & Development Commission CONNECT NW PA Broadband Study and Action Plan Supplemental Report
December 23, 2003 Page 229
Lawrence Robert P, Casey
Industrial Park L-13 Industrial, light
industrial manufacturing, business warehousing
Ellwood City Borough
50+ Within DSL & Cable Modem Capability
Filled
Lawrence Three Rivers Industrial Park
L-14 Industrial, light industrial manufacturing, business warehousing
City of New Castle
67 Within DSL & Cable Modem Capability
Available
Lawrence Wampum Industrial Park
L-15 Industrial, light industrial manufacturing, business warehousing
New Beaver Borough
40+ Within DSL & Cable Modem Capability
Filled

Northwest Pennsylvania Regional Planning & Development Commission CONNECT NW PA Broadband Study and Action Plan Supplemental Report
December 23, 2003 Page 230
Mercer County
Mercer County has multiple KOZ sites in the Shenango Valley industrial corridor on the west side of the County, as well as an industrial park in Greenville. Some of the KOZ sites in this area have environmental issues and may not be developed in the near term.
The Shenango Valley area includes the cities of Hermitage, Farrell, and Sharon. The Shenango Valley KOZ sites are typically brownfield sites that were part of closed steel mills, but there is also a Greenfield site and a residential site in that area.
Mercer County appears to be in balance in terms of land supply and demand. This is because 500 acres of brownfield KOZ property is unlikely to be developed for years, if ever. Mercer County has competed for large users recently and the KOZ property in the County does not provide adequate sites for this type of development with the exception of Greenville -Reynolds East.
Mercer County has numerous advantages for industrial development. There are two interstate highways (I-79 & I-80) that transverse the County, one in an east-west and one in a north-south direction. The County is in the path of the New York to Indiana market. The County has considerable heavy industrial land that is in great demand for a wide range of manufacturing companies, particularly steel manufacturing and processing companies. The area has an excellent labor force and is a pro-active political community, with highly trained economic development professionals throughout the County. Thus, in terms of demand, there is no reason that the potential demand for new industrial land over the 2000 to 2009 decade should not equal or exceed 400 acres, assuming that the national economy continues to be strong and continue to create the market for manufacturing products.
If that is the case, then the County is in a negative supply-demand condition in terms of available industrial land.53
The remaining narrative information (and map, but not tabular information) for Mercer County is from Mercer County-Future “Planning for Livable Communities” Land Use Plan and Trends & Data (See credits in footnote at end of section)
2. People and development have simply chosen to relocate themselves, typically from the older, urban areas to the newer suburban and rural areas.
3. Commercial - The growth in commercial land use is more due to movement of business from urban centers to new outlying commercial areas.
Whereas there was a past 20-year growth of 500 acres (250 acres each 10 years) under a scenario of sprawl development, it is projected that 250 acres will be needed for new commercial growth under a scenario of non-sprawl development.
53 Industrial Land Absorption Study Keystone Opportunity Zones Northwest Pennsylvania, March 2002; Prepared For: Northwest Pennsylvania Regional Planning and Development Commission by S. Patz and Associates, Inc. Herndon, Virginia

Northwest Pennsylvania Regional Planning & Development Commission CONNECT NW PA Broadband Study and Action Plan Supplemental Report
December 23, 2003 Page 231
4. Industrial
Given the desire to improve economic development and job creation results, it is estimated that more than double the recent land absorption will be needed to meet desired goals. Higher projections are proposed in consultation with Penn-Northwest Development Corporation for two reasons: 1) new industries in the I-80/I-79 corridors are likely to be warehouse and distribution which has greater land needs per employee, and 2) the interstate corridor locations will draw from a labor market involving several counties beyond Mercer County.
It is projected that 1,000 acres will be needed for new industrial growth in the next ten years.
5. Revitalization target areas
Southwest Region
The old business and industry heart of the Shenango Valley, also now the major part of the Shenango Valley Enterprise Zone – Larger economic development opportunities include reuse of idle portions of Caparo Steel in Farrell (in planning stages with Shenango Valley Industrial Development Corporation), reuse of the vacant Westinghouse plant in Sharon (pending Superfund environmental clean-up) and continued revitalization of downtown Sharon.
Urban residential neighborhoods adjacent to the business and industrial center – These neighborhoods include older, more dense housing and are characterized by low incomes, high minority population and high percentages of non-owner occupants.
Older business and residential areas at and around downtown West Middlesex.
Northwest Region
Older, urban centers in Greenville and Jamestown – The downtowns and older adjacent neighborhoods should be targets for revitalization efforts. Downtown Greenville should continue to be a focal point for regional attention. Downtown Jamestown, on the gateway to the popular Pymatuning recreation area, could be an interesting target for creative tourism and travel business opportunities.
Northeast Region
Town centers – The older town centers of Stoneboro, Sandy Lake, New Lebanon and Sheakleyville, both business and residential areas, should receive continued attention for revitalization and reinvestment.
Southeast Region
Downtown Grove City – The downtown area should be a regional priority for revitalization efforts to ensure its long-term viability.

Northwest Pennsylvania Regional Planning & Development Commission CONNECT NW PA Broadband Study and Action Plan Supplemental Report
December 23, 2003 Page 232
Central Region
Downtown Mercer – The downtown area should be a regional priority for revitalization efforts to ensure its long-term viability.
Town centers – The older town centers of Fredonia and Jackson Center, both business and residential areas, should receive continued attention for revitalization and reinvestment.
6. Growth target areas
Southwest Region
PA 18 from Morefield Road area to Lamor Road area in Hermitage – This corridor is favored for business growth and has substantial vacant parcels for development opportunities.
Broadway Road corridor and nearby areas in Hermitage and Wheatland – This area is currently targeted for industrial development and has some remaining parcels for further development.
East suburbs (Hermitage) and north suburbs (Hermitage & South Pymatuning) – These areas are within service reach of existing sanitary sewers and are logical growth choices for residential development.
West Middlesex outgrowth in Shenango Township – This area has sanitary sewer service which area proponents believe is under-exploited due to lack of development. It is a good opportunity for residential extension of the West Middlesex community. The PA 18 corridor should receive more attention for business/industrial development opportunities.
An area south of PA 318 between PA 60 and I-80 extending to Mitchell/Fennell/ Minner Roads presents an opportunity for economic development. It should be carefully planned to minimize impacts on existing residential development and sprawl into nearby rural areas. Completion of the half-diamond interchange at PA 60/ PA 318 is important for access.
Shenango Lake growth area – Recreation/tourism growth should be pursued here. Both the U.S. Army Corps of Engineers (Shenango Reservoir) and Shenango Valley Chamber of Commerce have discussed development opportunities despite the restrictions of federal ownership of the lake and surrounding lands.
Northwest Region
Extended communities around Greenville and Jamestown – These areas are good choices for extended residential growth and carefully planned business growth, coordinated so it does not adversely affect downtown revitalization efforts.
Reynolds industrial park growth areas – Two growth areas are being developed by Greenville -Reynolds Industrial Development

Northwest Pennsylvania Regional Planning & Development Commission CONNECT NW PA Broadband Study and Action Plan Supplemental Report
December 23, 2003 Page 233
Corporation. Reynolds East on the Kidd’s Mill Road has the most long-term industrial growth possibilities in the region.
Northeast Region
Extended communities around Stoneboro and Sandy Lake – These areas are good choices for extended residential growth and carefully planned business growth, coordinated so it does not adversely affect downtown revitalization efforts.
I-79/PA 358 interchange – This area is targeted for business and industrial development (a small amount exists already). It is more of a long-term consideration, however, because of the lack of public sewer and water service and the large cost of extending such service from the Sandy Lake/Stoneboro area or building new facilities at the interchange.
Southeast Region
Extended community around Grove City – This area is a good choice for extended residential growth and carefully planned business growth, coordinated so it does not adversely affect downtown revitalization efforts.
I-79/PA 208 interchange – This area underwent dramatic change beginning two years ago with development of a major retail outlet center and coattail businesses. Public sewer and water now serves much of the interchange and more growth is likely.
The area is a good target for further business and industrial growth, but growth should be contained within a limited, controlled area. There is potential here for unplanned growth to burst and sprawl along the PA 208 corridor creating a snarl of traffic signals, entering/exiting automobiles, and acres of pavement and agglomerations of signs which do not match the vision of an otherwise rural community. Initially, the development area should extend no further than from PA 258 on the east to the vicinity of Grove City Airport on the west.
Leesburg village – It is ideal for additional development of village uses already here (homes, shops, historic sites, etc.) and enhancement of the rural, small-town pathway of tourism developed at a scale similar and sensitive to the existing village (human-scale buildings, short road setback, reuse of homes, school). It is not ideal for sprawling suburban commercial development set back behind expansive parking lots underneath bright all-night lighting.
Central Region
Extended community around Mercer and Fredonia – These areas are good choices for extended residential growth and carefully planned business growth, coordinated so it does not adversely affect downtown revitalization efforts.

Northwest Pennsylvania Regional Planning & Development Commission CONNECT NW PA Broadband Study and Action Plan Supplemental Report
December 23, 2003 Page 234
I-79/US 62 interchange plus Jackson Center and Lake Latonka – This area attracted much interest at the regional meetings. There was even talk of a new, greater community by the linking of three areas:
Jackson Center has room to extend its existing community with more residential development.
Lake Latonka has room for significantly more infill residential development although the current lack of public sanitary sewer service is a serious constraint which must be overcome.
The I-79/US 62 interchange has land and potential for both industrial and business development oriented to serve a growing regional community. An industrial development project, Jackson Commerce Park being developed by Lakeview Industrial Development Corporation, is already underway on 100 acres in the SE interchange quadrant. Business development on available road frontage, carefully planned and contained without sprawl, would be an ideal complement to the region.
I-80/US 19 interchange – This interchange would be a very marketable location for economic development if public sewer and water service were provided. It should include primarily industrial development and effort should be made to secure as large as possible tracts of land for larger-scale development opportunities. Commercial development should be secondary and minimal so as not to sprawl the impact of development along US 19.
Charleston village – This village was suggested for extended residential growth with village-scale business possibilities.54
54 Mercer County-Future Land Use “Planning for Livable Communities” Land Use Plan-Trends & Data; Assisted by Graney, Grossman, Ray and Associates, New Wilmington, Pennsylvania, Franklin, Pennsylvania

Northwest Pennsylvania Regional Planning & Development Commission CONNECT NW PA Broadband Study and Action Plan Supplemental Report
December 23, 2003 Page 235
Table 10-F: Mercer County Development Initiatives
County Name of Development or Assigned Name
Dev. Proj. ID
Type Development
General Location
Acres Status of Communication Infrastructure
Status of Other Utility Infrastructure:
Special Designation or Comments
Mercer Shenango Valley (southwest)
M-1 Residential, industrial, commercial (Existing)
Sharon Hermitage Farrell Sharpsville Wheatland W. Middlesex
Within DSL & Cable Modem Capability
Potential new development at far reaches of W,S
Socio-economic center; KOZ site S of Farrell-new city neighborhood, 145 housing units; 50,000+ persons; Greatest development potential at SE & NE hermitage (PA 18 Corridor)
Mercer Grove City (southeast)
M-2 Residential, industrial (Existing)
Grove City Within DSL & Cable Modem Capability
Potential new development at far reaches of W,S
Socio-economic center; 17,000+ persons; Potential at S Grove City (Pine Twp. Into Liberty Twp.) Prime outlets at I-79/PA 208; 60 acres commercial
Mercer Greenville (northwest)
M-3 Residential, industrial (Existing)
Greenville Within DSL & Cable Modem Capability
Potential new development at far reaches of W,S
Socio-economic center; 15,000+ persons; Potential at E of Greenville (Hempfield Twp.)
Mercer Mercer (central)
M-4 Residential, industrial (Existing)
Mercer Borough
Within DSL & Cable Modem Capability
Socio-economic center; 8,000+ persons
Mercer Lakeview (northeast)
M-5 Residential, industrial (Existing)
Stoneboro Sandy Lake
Stoneboro & 1/3 of Sandy Lake within DSL & Cable Modem Capability
Socio-economic center; 5,000+ persons

Northwest Pennsylvania Regional Planning & Development Commission CONNECT NW PA Broadband Study and Action Plan Supplemental Report
December 23, 2003 Page 236
Mercer Old Sharon
steel Site
M-6 Industrial (Existing and revitalized)
Farrell and Sharon south
100 acres being used (hot/ cold mills) 35 acres being re-devel-oped; Legacy Com-mons 150-200 acres unused w/ poten-tial rede-velop-ment
W,S available
Most area KOZ
Mercer Westinghouse Site
M-7 Industrial (Existing and revitalized)
Sharon north flats
32 W,S available
Most area KOZ; Sharon Tube and Sawmill (pipe/tube manufacturers)
Mercer Wheatland Industrial Development
M-8 Industrial (Existing and revitalized)
W,S available
Most area KOZ; Legacy Commons redevelopment anchored by Sharon Tube (cold mill)
Mercer Hermitage Industrial Development
M-9 Industrial (Existing and revitalized)
Hermitage Several 25-40 acres available for devel-opment
W,S available
KOZ pending for two 25 acres pieces; Several manufacturing and trucking companies
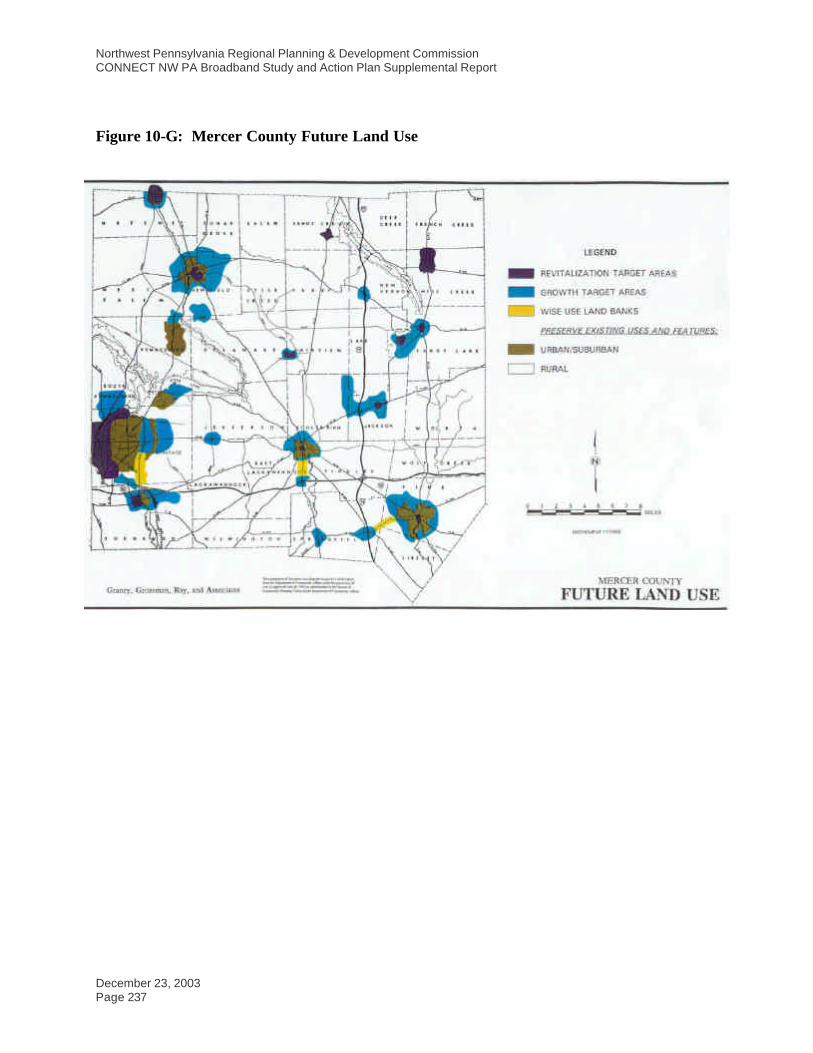
Northwest Pennsylvania Regional Planning & Development Commission CONNECT NW PA Broadband Study and Action Plan Supplemental Report
December 23, 2003 Page 237
Figure 10-G: Mercer County Future Land Use

Northwest Pennsylvania Regional Planning & Development Commission CONNECT NW PA Broadband Study and Action Plan Supplemental Report
December 23, 2003 Page 238
Venango County Venango County has industrial parks with the KOZ designation and ready-to-build lots.
Venango County has two attractive KOZ sites.
Venango County is in a similar position as Crawford with the very attractive Barkeyville KOZ site.
The County’s existing industrial parks are relatively small, ranging from 28 to 54 acres in size. These are located in the traditional development sectors of the County, in and near Franklin, and in and near Oil City.
While Venango County attracted 16 new companies that moved into the County during the 1990’s, all of the industrial land sales/development were the result of expansion of local companies. New companies primarily moved into existing industrial space rather than developed new plants.16
16 Industrial Land Absorption Study Keystone Opportunity Zones Northwest Pennsylvania, March 2002; Prepared For: Northwest Pennsylvania Regional Planning and Development Commission by S. Patz and Associates, Inc. Herndon, Virginia

Northwest Pennsylvania Regional Planning & Development Commission CONNECT NW PA Broadband Study and Action Plan Supplemental Report
December 23, 2003 Page 239
Table 10-G: Venango County Development Initiatives
County Name of Development or Assigned Name
Dev. Proj. ID
Type Development
General Location
Acres Status of Communication Infrastructure
Status of Other Utility Infrastructure:
Special Designation or Comments
Venango Central Venango growth area
V-1 Franklin, Oil City, Rouseville Boro, Sugarcreek Boro, Cranberry Twp., Cornplanter Twp., Frenchcreek Twp., Sandycreek Twp.
No Cable Modem, but DSL Capable
Majority of population lives & works within this area
Venango Northern growth area
V-2 (Center in City of Titusville in Crawford County), but has two radii into Venango Co.- Rt. 8 from Crosscreek resort into Titusville and Rt. 27 from Pleasantville into Titusville
No Cable Modem, DSL capable only around the center of Oil City & Franklin
Venango Polk Boro and Polk Center
V-3 Polk Boro No DSL or Cable Modem
Future growth and development
Venango Routes 8 and 38 V-4 Intersection of Rts. 8 and 38
No DSL or Cable Modem
Potential growth and development area
Venango Scrubgrass Power Plant
V-5 No DSL or Cable Modem
KOZ; Potential development area
Venango Barkeyville Industrial Park
V-6 Barkeyville Borough Exit 29 of I-80
120+ No DSL or Cable Modem
KOZ; Shovel Ready
Venango Routes 308 and I-80
V-7 Intersection of Rts. 308 and I-80 Exit 35
No DSL or Cable Modem
Potential growth area
Venango Emlenton KOZ V-8 Exit 42 of I-80 at Emlenton (Includes parts of Venango & Butler Co.)
No DSL or Cable Modem
KOZ
Venango Exit 45 of I-80 V-9 Exit 45 of I-80 No DSL or Cable Modem
Potential for future growth and development
Venango Rt. 8 and 227 Corridor
V- COR-10
No DSL or Cable Modem
Venango I-80 Corridor V- COR-11
No DSL or Cable Modem

Northwest Pennsylvania Regional Planning & Development Commission CONNECT NW PA Broadband Study and Action Plan Supplemental Report
December 23, 2003 Page 240
Warren County
Warren County has five KOZ properties.
Warren County has an excess supply of KOZ land based on past demand trends, although much of it is undeveloped. It is well-positioned to compete for a large land user due to the size of its sites.
At present, Warren county has one small publicly-owned industrial park, a large privately owned park and privately funded redevelopment of a vacated industrial property, a sizable incubator building, and five KOZ properties.
While the magnitude of industrial development activity in Warren County is small compared with most other counties Northwest Pennsylvania, current County activity represents sound progress for providing a more diverse industrial market, as “greenfield” land is being made available, in addition to the availability of land and buildings at redeveloped brownfield properties. Also, unlike most counties in Northwest Pennsylvania, where numerous submarkets exist, much of Warren County’s industrial development is located in one area/ i.e., within the vicinity of the City of Warren.56
The remaining narrative information (not tabular) is from the Warren County Comprehensive Plan, Draft Partial, April 2003 (See credits in footnote at end of section)
There was a consensus (from Citizen Visioning Meetings) that good industrial sites were needed with formal industrial parks and perhaps multi-tenant buildings.
Better access to I-86 (the Southern Tier Expressway), the construction of additional four-lane roads in the County, and improved access to major destinations (Erie, I-80, and I-79) were some specific concerns which did surface (during Citizen Visioning Meetings).
Industrial Focus Group
Transportation is OK – could improve access to Interstates, especially I-86.
Rail important, but used primarily for bulk freight-not time -sensitive.
Trained and motivated labor force is a big need.
Retention of professional staff a problem (hospital) – housing an issue
Out-of-County environmentalists hurting wood industry-competition from Mexico/South America woods and plastics is increasing
Job training/technical training a continuing need.
Need for immediate access to vacant industrial land and buildings. Tom Ehrensberger of the Governor’s Action Team stated that most companies scouting for space are interested in immediate access. “Spec” buildings, multi-tenant structures, and incubators are typical facilities.
56 Industrial Land Absorption Study Keystone Opportunity Zones Northwest Pennsylvania, March 2002; Prepared For: Northwest Pennsylvania Regional Planning and Development Commission by S. Patz and Associates, Inc. Herndon, Virginia

Northwest Pennsylvania Regional Planning & Development Commission CONNECT NW PA Broadband Study and Action Plan Supplemental Report
December 23, 2003 Page 241
Wood Products Focus Group
They recommended that a “niche” wood products industrial park be considered
Statement of Objectives
Overall Plan Priorities: Warren County’s most important asset is its youth – The children of today are the community builders of tomorrow. Over the past two decades, more and more of these young people have been leaving Warren County to seek work, education, and start families elsewhere. The primary purpose of this plan is to create economic opportunities in Warren County to keep our future leaders here, and attract new residents while maintaining a superior quality of life.
The Economy:
Industrial -Manufacturing-“High-Tech” Initiatives. Based upon State and County data, jobs in these sectors still, on average, pay better than any other economic sector. As a consequence, programs, policies, and initiatives to create jobs in these sectors will receive top priority. Generally, activities will focus in the following areas:
« Physical Assets – Create the needed physical resources, i.e. industrial land, the reuse of brownfield sites, and new structures to accommodate the expansion of existing businesses and attract new businesses to the County.
« Education – Support and create the infrastructure needed to both create and maintain a world-class workforce.
« Incentives
« Wise use of natural resources
« Improve retail options
« Promote tourist activities
Transportation
« Continue improvements to the condition and capacity of route 6.
« Create better access to I-86, the Southern Tier Expressway.
« Re-examine the County airport policy.
Community Facilities and Utilities
« Provide for cutting-edge technical training on a secondary and post-secondary basis.57
57 Warren County Comprehensive Plan, (Partial Draft Copy), April 2003; Prepared by Graney, Grossman, Colosimo, and Associates, the Warren County
Planning Commission and the Warren Intergovernmental Cooperative.

Northwest Pennsylvania Regional Planning & Development Commission CONNECT NW PA Broadband Study and Action Plan Supplemental Report
December 23, 2003 Page 242
Table 10-H: Warren County Development Initiatives
County Name of Development or Assigned Name
Dev. Proj. ID
Type Development
General Location
Acres Status of Communication Infrastructure
Status of Other Utility Infrastructure:
Special Designation or Comments
Warren Near Warren Mall & Fram Colony Industrial Park
W-1 Industrial and commercial growth (Existing and Planned)
Intersection Rt. 62 & 69 (Jackson Run Rd.) north to Russell Village
100+ State surplus in process of acquiring
Cable Modem Capability
W,S available
KOZ
Warren Starbrick W-2 Mostly industrial, some commercial (Existing)
West end of Warren westerly to Scott Run Rd.
Cable Modem and part DSL Capability
W,S,R existing
Three Proposed KOZs, Former Deluxe (Spedd prop.), Southwell prop., Warren Railcar; Existing electric generating plant & several commercial properties
Warren National Forge Industrial Park
W-3 Industrial (Planned)
Along Old Rt. 6, adjacent to Ellwood City
60 Cable Modem Capability
S,R available, W very near future
Proposed KOZ; Large manufacturing firm; Chamber negotiating to purchase
Warren Brokenstraw Rt. 6 Corridor
W-4 Industrial and commercial (Existing)
Western edge of Youngsville to intersection of Rt. 6 and 27
Cable Modem Capability
S,E available
Designated Industrial/Commercial Growth area; Several existing industrial & commercial properties
Warren Mead Twp. Rt. 6 Corridor
W-5 Primarily commercial, some industrial (Existing)
Along Rt. 6 between Warren & Clarendon
Cable Modem Capability
S available, Limited R & W
Warren Columbus Twp. Rt. 6 Corridor
W-6 S of Rt. 6 Industrial; N of Rt. 6 Commercial (Existing)
Along Rt. 6 in Columbus Twp. From Columbus Village west
300+ acres of KOZ
DSL Capability centered in Corry City
R along S side of Rt. 6; W,S available part of NW-Rt. 6
KOZ

Northwest Pennsylvania Regional Planning & Development Commission CONNECT NW PA Broadband Study and Action Plan Supplemental Report
December 23, 2003 Page 243
End-User Survey Response Data
Table 10-I: End-User Survey By: All 8 Counties – All Entities
Northwest Pennsylvania Regional Planning and Development Commission “CONNECT NW PA”- Broadband Study
End-User Survey Results By: All 8 Counties-All Entities
Q#1: What entity does this survey represent?
Residence 1855 74.5%Business 398 16.0%School (K-12) 21 0.8%School (College) 3 0.1%NonProfit Agency 24 1.0%Gov't Entity 154 6.2%Health Care Facil. 5 0.2%Other 31 1.2%
2491 100.0%
Q#2: Do you use the Internet or Bandwidth?
Yes 1881 76.7%No 572 23.3%
2453 100.0%
Q#3: What location do your answers to this survey represent?
Residence 1550 73.2%Business 393 18.6%School 25 1.2%Gov't Entity 117 5.5%Hospital/Health 11 0.5%Library 1 0.0%Other 21 1.0%
2118 100.0%
Q#4: What type of connection do you use?
Dial up 1558 81.5%ISDN Line 19 1.0%Cable Modem 114 6.0%Wireless 27 1.4%Optical Fiber 16 0.8%DSL 108 5.7%Satellite 23 1.2%Other 46 2.4%
1911 100.0%
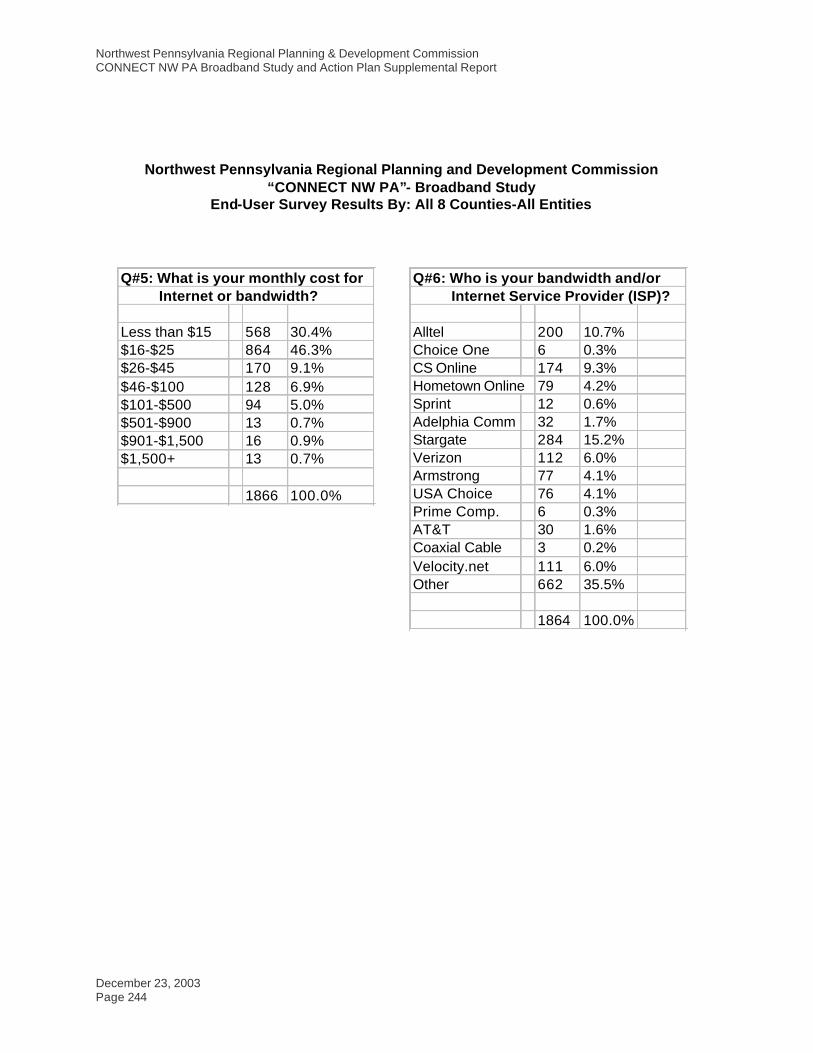
Northwest Pennsylvania Regional Planning & Development Commission CONNECT NW PA Broadband Study and Action Plan Supplemental Report
December 23, 2003 Page 244
Northwest Pennsylvania Regional Planning and Development Commission “CONNECT NW PA”- Broadband Study
End-User Survey Results By: All 8 Counties-All Entities
Q#5: What is your monthly cost for Internet or bandwidth?
Less than $15 568 30.4%$16-$25 864 46.3%$26-$45 170 9.1%$46-$100 128 6.9%$101-$500 94 5.0%$501-$900 13 0.7%$901-$1,500 16 0.9%$1,500+ 13 0.7%
1866 100.0%
Q#6: Who is your bandwidth and/or Internet Service Provider (ISP)?
Alltel 200 10.7%Choice One 6 0.3%CS Online 174 9.3%Hometown Online 79 4.2%Sprint 12 0.6%Adelphia Comm 32 1.7%Stargate 284 15.2%Verizon 112 6.0%Armstrong 77 4.1%USA Choice 76 4.1%Prime Comp. 6 0.3%AT&T 30 1.6%Coaxial Cable 3 0.2%Velocity.net 111 6.0%Other 662 35.5%
1864 100.0%

Northwest Pennsylvania Regional Planning & Development Commission CONNECT NW PA Broadband Study and Action Plan Supplemental Report
December 23, 2003 Page 245
Northwest Pennsylvania Regional Planning and Development Commission “CONNECT NW PA”- Broadband Study
End-User Survey Results By: All 8 Counties-All Entities
Q#7: How do you use the bandwidth/Internet?
E-mail 1833 23.1%Accounting 206 2.6%Intranet 157 2.0%Prod Desgn/Order 227 2.9%Text Messaging 314 4.0%Online Banking 575 7.2%Extranet 45 0.6%Surf the Web 1552 19.6%E-Commerce 299 3.8%CAD/CAM 95 1.2%Ext. Marketing 155 2.0%Chat Rooms 198 2.5%Data Transfer 438 5.5%Research/Info. 951 12.0%Video/Audio 394 5.0%Website Hosting 260 3.3%Telecommute 110 1.4%Other 125 1.6%
7934 100.0%

Northwest Pennsylvania Regional Planning & Development Commission CONNECT NW PA Broadband Study and Action Plan Supplemental Report
December 23, 2003 Page 246
Northwest Pennsylvania Regional Planning and Development Commission “CONNECT NW PA”- Broadband Study
End-User Survey Results By: All 8 Counties-All Entities
Q#8: Please rate your provider on: Price Very Satisfied 556 29.6%Satisfied 929 49.4%Not Satisfied 348 18.5%No Opinion 48 2.6%
1881 100.0%
Q#8: Please rate your provider on: Customer Service Response/Billing
Very Satisfied 523 29.3%Satisfied 1026 57.5%Not Satisfied 156 8.7%No Opinion 79 4.4%
1784 100.0%
Q#8: Please rate your provider on: Connection Speed/Bandwidth
Very Satisfied 233 13.3%Satisfied 735 42.0%Not Satisfied 734 42.0%No Opinion 47 2.7%
1749 100.0%
Q#9: Average on-line hours/month for entire entity?
Less than 40 791 43.3%41-100 616 33.7%101-400 359 19.7%Other 60 3.3%
1826 100.0%

Northwest Pennsylvania Regional Planning & Development Commission CONNECT NW PA Broadband Study and Action Plan Supplemental Report
December 23, 2003 Page 247
Northwest Pennsylvania Regional Planning and Development Commission “CONNECT NW PA”- Broadband Study
End-User Survey Results By: All 8 Counties-All Entities
Q#10: Do you need a higher speed?
Yes, but unavailable 585 33.5%Yes, available but 517 29.6% too expensiveNo 642 36.8%
1744 100.0%
Q#11: What would you be willing to pay a month for a higher speed?
Not Interested 615 35.0%$16-$25 682 38.9%$26-$45 312 17.8%$46-$100 89 5.1%$101-$500 47 2.7%$501-$900 4 0.2%$901-$1,500 4 0.2%$1,500+ 2 0.1%
1755 100.0%Q#12: What speed do you consider optimal for your needs?
56 Kbps 413 29.4%128 Kbps 520 37.1%1.544 Mbps 347 24.7%6.312 Mbps 63 4.5%Other 60 4.3%
1403 100.0%
Q#13: If not using the Internet, please explain why. ("X" all that apply)
Unavailable 30 3.3%Do not need it 214 23.2%Too expensive 101 11.0%No computer 342 37.1%Too slow 15 1.6%See no benefit 85 9.2%Need Training 71 7.7%Other 63 6.8%
921 100.0%

Northwest Pennsylvania Regional Planning & Development Commission CONNECT NW PA Broadband Study and Action Plan Supplemental Report
December 23, 2003 Page 248
Northwest Pennsylvania Regional Planning and Development Commission “CONNECT NW PA”- Broadband Study
End-User Survey Results By: All 8 Counties-All Entities
Q#14: If not using the Internet, will you within:
1 Year 55 11.3%3 Years 54 11.1%5 Years 28 5.7%No intention to 351 71.9%
488 100.0%
Q#15: What is your business classification or type?
Indus./Manufact. 330 37.5%Service/Retail 138 15.7%Finance/Banking 13 1.5%Utility 12 1.4%Construction 35 4.0%Transportation 22 2.5%Internet Based 17 1.9%Other 312 35.5%
879 100.0%
Q#16: Approximate company annual overall revenue/sales?
Less than $50K 187 29.2%$50K-$500K 152 23.8%$500K-$1million 63 9.8%$1million + 238 37.2%
640 100.0%
Q#17: How critical is bandwidth to your company general revenue/sales and are there plans for company growth in the next 2 years?
Very Critical 185 25.4%Not Critical 254 34.8%Yes, plan to grow 183 25.1%No plans to grow 107 14.7%
729 100.0%

Northwest Pennsylvania Regional Planning & Development Commission CONNECT NW PA Broadband Study and Action Plan Supplemental Report
December 23, 2003 Page 249
Table 10-J: End-User Survey By: All 8 Counties – Residential Entities
Northwest Pennsylvania Regional Planning and Development Commission “CONNECT NW PA”- Broadband Study
End-User Survey Results By: All 8 Counties-Residence Entities
Q#1: What entity does this survey represent?
Residence 783 100.0%Business 0 0.0%School (K-12) 0 0.0%School (College) 0 0.0%NonProfit Agency 0 0.0%Gov't Entity 0 0.0%Health Care Facil. 0 0.0%Other 0 0.0%
783 100.0%
Q#2: Do you use the Internet or Bandwidth?
Yes 522 67.8%No 248 32.2%
770 100.0%
Q#3: What location do your answers to this survey represent?
Residence 632 99.8%Business 0 0.0%School 0 0.0%Gov't Entity 0 0.0%Hospital/Health 0 0.0%Library 0 0.0%Other 1 0.2%
633 100.0%
Q#4: What type of connection do you use?
Dial up 492 94.1%ISDN Line 1 0.2%Cable Modem 13 2.5%Wireless 0 0.0%Optical Fiber 4 0.8%DSL 7 1.3%Satellite 4 0.8%Other 2 0.4%
523 100.0%

Northwest Pennsylvania Regional Planning & Development Commission CONNECT NW PA Broadband Study and Action Plan Supplemental Report
December 23, 2003 Page 250
Northwest Pennsylvania Regional Planning and Development Commission “CONNECT NW PA”- Broadband Study
End-User Survey Results By: All 8 Counties-Residence Entities
Q#5: What is your monthly cost for Internet or bandwidth?
Less than $15 186 36.3%$16-$25 269 52.5%$26-$45 38 7.4%$46-$100 14 2.7%$101-$500 5 1.0%$501-$900 0 0.0%$901-$1,500 0 0.0%$1,500+ 0 0.0%
512 100.0%
Q#6: Who is your bandwidth and/or Internet Service Provider (ISP)?
Alltel 14 2.8%Choice One 0 0.0%CS Online 52 10.3%Hometown Online 39 7.7%Sprint 1 0.2%Adelphia Comm 3 0.6%Stargate 38 7.5%Verizon 47 9.3%Armstrong 7 1.4%USA Choice 23 4.6%Prime Comp. 2 0.4%AT&T 10 2.0%Coaxial Cable 1 0.2%Velocity.net 15 3.0%Other 252 50.0%
504 100.0%

Northwest Pennsylvania Regional Planning & Development Commission CONNECT NW PA Broadband Study and Action Plan Supplemental Report
December 23, 2003 Page 251
Northwest Pennsylvania Regional Planning and Development Commission “CONNECT NW PA”- Broadband Study
End-User Survey Results By: All 8 Counties-Residence Entities
Q#7: How do you use the bandwidth/Internet?
E-mail 498 25.9%Accounting 37 1.9%Intranet 29 1.5%Prod Desgn/Order 45 2.3%Text Messaging 100 5.2%Online Banking 150 7.8%Extranet 4 0.2%Surf the Web 440 22.9%E-Commerce 63 3.3%CAD/CAM 7 0.4%Ext. Marketing 9 0.5%Chat Rooms 77 4.0%Data Transfer 69 3.6%Research/Info. 236 12.3%Video/Audio 138 7.2%Website Hosting 0 0.0%Telecommute 23 1.2%Other 0 0.0%
1925 100.0%

Northwest Pennsylvania Regional Planning & Development Commission CONNECT NW PA Broadband Study and Action Plan Supplemental Report
December 23, 2003 Page 252
Northwest Pennsylvania Regional Planning and Development Commission “CONNECT NW PA”- Broadband Study
End-User Survey Results By: All 8 Counties-Residence Entities
Q#8: Please rate your provider on: Price Very Satisfied 170 32.7%Satisfied 258 49.6%Not Satisfied 77 14.8%No Opinion 15 2.9%
520 100.0%
Q#8: Please rate your provider on: Customer Service Response/Billing
Very Satisfied 165 33.6%Satisfied 263 53.6%Not Satisfied 38 7.7%No Opinion 25 5.1%
491 100.0%
Q#8: Please rate your provider on: Connection Speed/Bandwidth
Very Satisfied 55 11.6%Satisfied 174 36.7%Not Satisfied 226 47.7%No Opinion 19 4.0%
474 100.0%
Q#9: Average on-line hours/month for entire entity?
Less than 40 230 48.1%41-100 172 36.0%101-400 70 14.6%Other 6 1.3%
478 100.0%

Northwest Pennsylvania Regional Planning & Development Commission CONNECT NW PA Broadband Study and Action Plan Supplemental Report
December 23, 2003 Page 253
Northwest Pennsylvania Regional Planning and Development Commission “CONNECT NW PA”- Broadband Study
End-User Survey Results By: All 8 Counties-Residence Entities
Q#10: Do you need a higher speed?
Yes, but unavailable 193 42.9%Yes, available but 113 25.1% too expensiveNo 144 32.0%
450 100.0%
Q#11: What would you be willing to pay a month for a higher speed?
Not Interested 148 30.5%$16-$25 207 42.6%$26-$45 112 23.0%$46-$100 18 3.7%$101-$500 1 0.2%$501-$900 0 0.0%$901-$1,500 0 0.0%$1,500+ 0 0.0%
486 100.0%Q#12: What speed do you consider optimal for your needs?
56 Kbps 143 36.9%128 Kbps 142 36.6%1.544 Mbps 75 19.3%6.312 Mbps 10 2.6%Other 18 4.6%
388 100.0%
Q#13: If not using the Internet, please explain why. ("X" all that apply)
Unavailable 12 3.2%Do not need it 81 21.4%Too expensive 36 9.5%No computer 162 42.9%Too slow 3 0.8%See no benefit 32 8.5%Need Training 30 7.9%Other 22 5.8%
378 100.0%

Northwest Pennsylvania Regional Planning & Development Commission CONNECT NW PA Broadband Study and Action Plan Supplemental Report
December 23, 2003 Page 254
Northwest Pennsylvania Regional Planning and Development Commission “CONNECT NW PA”- Broadband Study
End-User Survey Results By: All 8 Counties-Residence Entities
Q#14: If not using the Internet, will you within:
1 Year 24 11.5%3 Years 21 10.1%5 Years 10 4.8%No intention to 153 73.6%
208 100.0%
Q#15: What is your business classification or type?
Indus./Manufact. 17 13.1%Service/Retail 27 20.8%Finance/Banking 5 3.8%Utility 4 3.1%Construction 10 7.7%Transportation 3 2.3%Internet Based 8 6.2%Other 56 43.1%
130 100.0%
Q#16: Approximate company annual overall revenue/sales?
Less than $50K 52 75.4%$50K-$500K 10 14.5%$500K-$1million 0 0.0%$1million + 7 10.1%
69 100.0%
Q#17: How critical is bandwidth to your company general revenue/sales and are there plans for company growth in the next 2 years?
Very Critical 14 16.5%Not Critical 30 35.3%Yes, plan to grow 22 25.9%No plans to grow 19 22.4%
85 100.0%

Northwest Pennsylvania Regional Planning & Development Commission CONNECT NW PA Broadband Study and Action Plan Supplemental Report
December 23, 2003 Page 255
Table 10-K: End-User Survey By: All 8 Counties – Business Entities
Northwest Pennsylvania Regional Planning and Development Commission “CONNECT NW PA”- Broadband Study
End-User Survey Results By: All 8 Counties-Business Entities
Q#1: What entity does this survey represent?
Residence 0 0.0%Business 355 100.0%School (K-12) 0 0.0%School (College) 0 0.0%NonProfit Agency 0 0.0%Gov't Entity 0 0.0%Health Care Facil. 0 0.0%Other 0 0.0%
355 100.0%
Q#2: Do you use the Internet or Bandwidth?
Yes 333 96.0%No 14 4.0%
347 100.0%
Q#3: What location do your answers to this survey represent?
Residence 0 0.0%Business 341 99.4%School 0 0.0%Gov't Entity 0 0.0%Hospital/Health 0 0.0%Library 1 0.3%Other 1 0.3%
343 100.0%
Q#4: What type of connection do you use?
Dial up 158 47.2%ISDN Line 6 1.8%Cable Modem 47 14.0%Wireless 15 4.5%Optical Fiber 3 0.9%DSL 68 20.3%Satellite 9 2.7%Other 29 8.7%
335 100.0%

Northwest Pennsylvania Regional Planning & Development Commission CONNECT NW PA Broadband Study and Action Plan Supplemental Report
December 23, 2003 Page 256
Northwest Pennsylvania Regional Planning and Development Commission “CONNECT NW PA”- Broadband Study
End-User Survey Results By: All 8 Counties-Business Entities
Q#5: What is your monthly cost for Internet or bandwidth?
Less than $15 36 11.1%$16-$25 92 28.3%$26-$45 35 10.8%$46-$100 82 25.2%$101-$500 59 18.2%$501-$900 6 1.8%$901-$1,500 8 2.5%$1,500+ 7 2.2%
325 100.0%
Q#6: Who is your bandwidth and/or Internet Service Provider (ISP)?
Alltel 13 3.9%Choice One 5 1.5%CS Online 31 9.3%Hometown Online 16 4.8%Sprint 9 2.7%Adelphia Comm 20 6.0%Stargate 46 13.7%Verizon 20 6.0%Armstrong 26 7.8%USA Choice 18 5.4%Prime Comp. 1 0.3%AT&T 8 2.4%Coaxial Cable 0 0.0%Velocity.net 21 6.3%Other 101 30.1%
335 100.0%

Northwest Pennsylvania Regional Planning & Development Commission CONNECT NW PA Broadband Study and Action Plan Supplemental Report
December 23, 2003 Page 257
Northwest Pennsylvania Regional Planning and Development Commission “CONNECT NW PA”- Broadband Study
End-User Survey Results By: All 8 Counties-Business Entities
Q#7: How do you use the bandwidth/Internet?
E-mail 330 17.8%Accounting 58 3.1%Intranet 51 2.8%Prod Desgn/Order 79 4.3%Text Messaging 42 2.3%Online Banking 119 6.4%Extranet 27 1.5%Surf the Web 275 14.9%E-Commerce 105 5.7%CAD/CAM 67 3.6%Ext. Marketing 103 5.6%Chat Rooms 7 0.4%Data Transfer 157 8.5%Research/Info. 176 9.5%Video/Audio 47 2.5%Website Hosting 150 8.1%Telecommute 37 2.0%Other 21 1.1%
1851 100.0%

Northwest Pennsylvania Regional Planning & Development Commission CONNECT NW PA Broadband Study and Action Plan Supplemental Report
December 23, 2003 Page 258
Northwest Pennsylvania Regional Planning and Development Commission “CONNECT NW PA”- Broadband Study
End-User Survey Results By: All 8 Counties-Business Entities
Q#8: Please rate your provider on: Price Very Satisfied 71 21.3%Satisfied 205 61.4%Not Satisfied 51 15.3%No Opinion 7 2.1%
334 100.0%
Q#8: Please rate your provider on: Customer Service Response/Billing
Very Satisfied 77 23.8%Satisfied 209 64.7%Not Satisfied 31 9.6%No Opinion 6 1.9%
323 100.0%
Q#8: Please rate your provider on: Connection Speed/Bandwidth
Very Satisfied 53 16.5%Satisfied 176 54.7%Not Satisfied 87 27.0%No Opinion 6 1.9%
322 100.0%
Q#9: Average on-line hours/month for entire entity?
Less than 40 74 23.1%41-100 92 28.7%101-400 129 40.2%Other 26 8.1%
321 100.0%

Northwest Pennsylvania Regional Planning & Development Commission CONNECT NW PA Broadband Study and Action Plan Supplemental Report
December 23, 2003 Page 259
Northwest Pennsylvania Regional Planning and Development Commission “CONNECT NW PA”- Broadband Study
End-User Survey Results By: All 8 Counties-Business Entities
Q#10: Do you need a higher speed?
Yes, but unavailable 68 21.6%Yes, available but 86 27.3% too expensiveNo 161 51.1%
315 100.0%
Q#11: What would you be willing to pay a month for a higher speed?
Not Interested 129 40.7%$16-$25 53 16.7%$26-$45 50 15.8%$46-$100 43 13.6%$101-$500 36 11.4%$501-$900 3 0.9%$901-$1,500 2 0.6%$1,500+ 1 0.3%
317 100.0%Q#12: What speed do you consider optimal for your needs?
56 Kbps 37 12.9%128 Kbps 94 32.9%1.544 Mbps 119 41.6%6.312 Mbps 21 7.3%Other 15 5.2%
286 100.0%
Q#13: If not using the Internet, please explain why. ("X" all that apply)
Unavailable 1 4.3%Do not need it 7 30.4%Too expensive 3 13.0%No computer 3 13.0%Too slow 0 0.0%See no benefit 3 13.0%Need Training 2 8.7%Other 4 17.4%
23 100.0%

Northwest Pennsylvania Regional Planning & Development Commission CONNECT NW PA Broadband Study and Action Plan Supplemental Report
December 23, 2003 Page 260
Northwest Pennsylvania Regional Planning and Development Commission “CONNECT NW PA”- Broadband Study
End-User Survey Results By: All 8 Counties-Business Entities
Q#14: If not using the Internet, will you within:
1 Year 2 22.2%3 Years 1 11.1%5 Years 0 0.0%No intention to 6 66.7%
9 100.0%
Q#15: What is your business classification or type?
Indus./Manufact. 263 75.4%Service/Retail 43 12.3%Finance/Banking 0 0.0%Utility 1 0.3%Construction 10 2.9%Transportation 2 0.6%Internet Based 2 0.6%Other 28 8.0%
349 100.0%
Q#16: Approximate company annual overall revenue/sales?
Less than $50K 28 8.8%$50K-$500K 58 18.1%$500K-$1million 46 14.4%$1million + 188 58.8%
320 100.0%
Q#17: How critical is bandwidth to your company general revenue/sales and are there plans for company growth in the next 2 years?
Very Critical 108 31.9%Not Critical 99 29.2%Yes, plan to grow 106 31.3%No plans to grow 26 7.7%
339 100.0%

Northwest Pennsylvania Regional Planning & Development Commission CONNECT NW PA Broadband Study and Action Plan Supplemental Report
December 23, 2003 Page 261
Table 10-L: End-User Survey By: All 8 Counties School (K-12) Entities
Northwest Pennsylvania Regional Planning and Development Commission “CONNECT NW PA”- Broadband Study
End-User Survey Results By: All 8 Counties-School (K-12) Entities
Q#1: What entity does this survey represent?
Residence 0 0.0%Business 0 0.0%School (K-12) 20 100.0%School (College) 0 0.0%NonProfit Agency 0 0.0%Gov't Entity 0 0.0%Health Care Facil. 0 0.0%Other 0 0.0%
20 100.0%
Q#2: Do you use the Internet or Bandwidth?
Yes 20 100.0%No 0 0.0%
20 100.0%
Q#3: What location do your answers to this survey represent?
Residence 0 0.0%Business 0 0.0%School 20 100.0%Gov't Entity 0 0.0%Hospital/Health 0 0.0%Library 0 0.0%Other 0 0.0%
20 100.0%
Q#4: What type of connection do you use?
Dial up 1 5.6%ISDN Line 6 33.3%Cable Modem 0 0.0%Wireless 2 11.1%Optical Fiber 3 16.7%DSL 0 0.0%Satellite 0 0.0%Other 6 33.3%
18 100.0%

Northwest Pennsylvania Regional Planning & Development Commission CONNECT NW PA Broadband Study and Action Plan Supplemental Report
December 23, 2003 Page 262
Northwest Pennsylvania Regional Planning and Development Commission “CONNECT NW PA”- Broadband Study
End-User Survey Results By: All 8 Counties-School (K-12) Entities
Q#5: What is your monthly cost for Internet or bandwidth?
Less than $15 0 0.0%$16-$25 1 5.9%$26-$45 0 0.0%$46-$100 0 0.0%$101-$500 4 23.5%$501-$900 5 29.4%$901-$1,500 5 29.4%$1,500+ 2 11.8%
17 100.0%
Q#6: Who is your bandwidth and/or Internet Service Provider (ISP)?
Alltel 0 0.0%Choice One 1 5.0%CS Online 1 5.0%Hometown Online 0 0.0%Sprint 0 0.0%Adelphia Comm 1 5.0%Stargate 4 20.0%Verizon 3 15.0%Armstrong 1 5.0%USA Choice 5 25.0%Prime Comp. 0 0.0%AT&T 0 0.0%Coaxial Cable 0 0.0%Velocity.net 0 0.0%Other 4 20.0%
20 100.0%

Northwest Pennsylvania Regional Planning & Development Commission CONNECT NW PA Broadband Study and Action Plan Supplemental Report
December 23, 2003 Page 263
Northwest Pennsylvania Regional Planning and Development Commission “CONNECT NW PA”- Broadband Study
End-User Survey Results By: All 8 Counties-School (K-12) Entities
Q#7: How do you use the bandwidth/Internet?
E-mail 20 14.6%Accounting 7 5.1%Intranet 15 10.9%Prod Desgn/Order 2 1.5%Text Messaging 4 2.9%Online Banking 3 2.2%Extranet 3 2.2%Surf the Web 19 13.9%E-Commerce 2 1.5%CAD/CAM 4 2.9%Ext. Marketing 0 0.0%Chat Rooms 0 0.0%Data Transfer 13 9.5%Research/Info. 11 8.0%Video/Audio 14 10.2%Website Hosting 14 10.2%Telecommute 4 2.9%Other 2 1.5%
137 100.0%

Northwest Pennsylvania Regional Planning & Development Commission CONNECT NW PA Broadband Study and Action Plan Supplemental Report
December 23, 2003 Page 264
Northwest Pennsylvania Regional Planning and Development Commission “CONNECT NW PA”- Broadband Study
End-User Survey Results By: All 8 Counties-School (K-12) Entities
Q#8: Please rate your provider on: Price Very Satisfied 5 25.0%Satisfied 14 70.0%Not Satisfied 1 5.0%No Opinion 0 0.0%
20 100.0%
Q#8: Please rate your provider on: Customer Service Response/Billing
Very Satisfied 5 26.3%Satisfied 11 57.9%Not Satisfied 2 10.5%No Opinion 1 5.3%
19 100.0%
Q#8: Please rate your provider on: Connection Speed/Bandwidth
Very Satisfied 6 33.3%Satisfied 9 50.0%Not Satisfied 2 11.1%No Opinion 1 5.6%
18 100.0%
Q#9: Average on-line hours/month for entire entity?
Less than 40 0 0.0%41-100 1 5.3%101-400 6 31.6%Other 12 63.2%
19 100.0%

Northwest Pennsylvania Regional Planning & Development Commission CONNECT NW PA Broadband Study and Action Plan Supplemental Report
December 23, 2003 Page 265
Northwest Pennsylvania Regional Planning and Development Commission “CONNECT NW PA”- Broadband Study
End-User Survey Results By: All 8 Counties-School (K-12) Entities
Q#10: Do you need a higher speed?
Yes, but unavailable 0 0.0%Yes, available but 10 50.0% too expensiveNo 10 50.0%
20 100.0%
Q#11: What would you be willing to pay a month for a higher speed?
Not Interested 8 53.3%$16-$25 0 0.0%$26-$45 0 0.0%$46-$100 2 13.3%$101-$500 2 13.3%$501-$900 1 6.7%$901-$1,500 2 13.3%$1,500+ 0 0.0%
15 100.0%Q#12: What speed do you consider optimal for your needs?
56 Kbps 0 0.0%128 Kbps 1 5.6%1.544 Mbps 8 44.4%6.312 Mbps 6 33.3%Other 3 16.7%
18 100.0%
Q#13: If not using the Internet, please explain why. ("X" all that apply)
Unavailable 0 0.0%Do not need it 0 0.0%Too expensive 0 0.0%No computer 0 0.0%Too slow 0 0.0%See no benefit 0 0.0%Need Training 0 0.0%Other 1 100.0%
1 100.0%

Northwest Pennsylvania Regional Planning & Development Commission CONNECT NW PA Broadband Study and Action Plan Supplemental Report
December 23, 2003 Page 266
Northwest Pennsylvania Regional Planning and Development Commission “CONNECT NW PA”- Broadband Study
End-User Survey Results By: All 8 Counties-School (K-12) Entities
Q#14: If not using the Internet, will you within:
1 Year 0 0.0%3 Years 0 0.0%5 Years 0 0.0%No intention to 0 0.0%
0 0.0%
Q#15: What is your business classification or type?
Indus./Manufact. 0 0.0%Service/Retail 0 0.0%Finance/Banking 0 0.0%Utility 0 0.0%Construction 0 0.0%Transportation 0 0.0%Internet Based 0 0.0%Other 10 100.0%
10 100.0%
Q#16: Approximate company annual overall revenue/sales?
Less than $50K 1 20.0%$50K-$500K 0 0.0%$500K-$1million 0 0.0%$1million + 4 80.0%
5 100.0%
Q#17: How critical is bandwidth to your company general revenue/sales and are there plans for company growth in the next 2 years?
Very Critical 5 55.6%Not Critical 3 33.3%Yes, plan to grow 1 11.1%No plans to grow 0 0.0%
9 100.0%

Northwest Pennsylvania Regional Planning & Development Commission CONNECT NW PA Broadband Study and Action Plan Supplemental Report
December 23, 2003 Page 267
Table 10-M: End-User Survey Results By: All 8 Counties
School (College) Entities
Northwest Pennsylvania Regional Planning and Development Commission “CONNECT NW PA”- Broadband Study
End-User Survey Results By: All 8 Counties-School (College) Entities
Q#1: What entity does this survey represent?
Residence 0 0.0%Business 0 0.0%School (K-12) 0 0.0%School (College) 3 100.0%NonProfit Agency 0 0.0%Gov't Entity 0 0.0%Health Care Facil. 0 0.0%Other 0 0.0%
3 100.0%
Q#2: Do you use the Internet or Bandwidth?
Yes 3 100.0%No 0 0.0%
3 100.0%
Q#3: What location do your answers to this survey represent?
Residence 0 0.0%Business 0 0.0%School 3 100.0%Gov't Entity 0 0.0%Hospital/Health 0 0.0%Library 0 0.0%Other 0 0.0%
3 100.0%
Q#4: What type of connection do you use?
Dial up 0 0.0%ISDN Line 0 0.0%Cable Modem 0 0.0%Wireless 0 0.0%Optical Fiber 2 66.7%DSL 0 0.0%Satellite 0 0.0%Other 1 33.3%
3 100.0%

Northwest Pennsylvania Regional Planning & Development Commission CONNECT NW PA Broadband Study and Action Plan Supplemental Report
December 23, 2003 Page 268
Northwest Pennsylvania Regional Planning and Development Commission “CONNECT NW PA”- Broadband Study
End-User Survey Results By: All 8 Counties-School (College) Entities
Q#5: What is your monthly cost for Internet or bandwidth?
Less than $15 0 0.0%$16-$25 0 0.0%$26-$45 0 0.0%$46-$100 0 0.0%$101-$500 0 0.0%$501-$900 0 0.0%$901-$1,500 0 0.0%$1,500+ 2 100.0%
2 100.0%
Q#6: Who is your bandwidth and/or Internet Service Provider (ISP)?
Alltel 0 0.0%Choice One 0 0.0%CS Online 0 0.0%Hometown Online 0 0.0%Sprint 1 33.3%Adelphia Comm 0 0.0%Stargate 0 0.0%Verizon 0 0.0%Armstrong 0 0.0%USA Choice 0 0.0%Prime Comp. 0 0.0%AT&T 0 0.0%Coaxial Cable 0 0.0%Velocity.net 0 0.0%Other 2 66.7%
3 100.0%

Northwest Pennsylvania Regional Planning & Development Commission CONNECT NW PA Broadband Study and Action Plan Supplemental Report
December 23, 2003 Page 269
Northwest Pennsylvania Regional Planning and Development Commission “CONNECT NW PA”- Broadband Study
End-User Survey Results By: All 8 Counties-School (College) Entities
Q#7: How do you use the bandwidth/Internet?
E-mail 3 8.8%Accounting 3 8.8%Intranet 1 2.9%Prod Desgn/Order 1 2.9%Text Messaging 2 5.9%Online Banking 3 8.8%Extranet 1 2.9%Surf the Web 3 8.8%E-Commerce 2 5.9%CAD/CAM 0 0.0%Ext. Marketing 1 2.9%Chat Rooms 2 5.9%Data Transfer 3 8.8%Research/Info. 2 5.9%Video/Audio 3 8.8%Website Hosting 3 8.8%Telecommute 1 2.9%Other 0 0.0%
34 100.0%

Northwest Pennsylvania Regional Planning & Development Commission CONNECT NW PA Broadband Study and Action Plan Supplemental Report
December 23, 2003 Page 270
Northwest Pennsylvania Regional Planning and Development Commission “CONNECT NW PA”- Broadband Study
End-User Survey Results By: All 8 Counties-School (College) Entities
Q#8: Please rate your provider on: Price Very Satisfied 1 33.3%Satisfied 0 0.0%Not Satisfied 2 66.7%No Opinion 0 0.0%
3 100.0%
Q#8: Please rate your provider on: Customer Service Response/Billing
Very Satisfied 0 0.0%Satisfied 2 100.0%Not Satisfied 0 0.0%No Opinion 0 0.0%
2 100.0%
Q#8: Please rate your provider on: Connection Speed/Bandwidth
Very Satisfied 0 0.0%Satisfied 1 50.0%Not Satisfied 1 50.0%No Opinion 0 0.0%
2 100.0%
Q#9: Average on-line hours/month for entire entity?
Less than 40 0 0.0%41-100 0 0.0%101-400 0 0.0%Other 2 100.0%
2 100.0%

Northwest Pennsylvania Regional Planning & Development Commission CONNECT NW PA Broadband Study and Action Plan Supplemental Report
December 23, 2003 Page 271
Northwest Pennsylvania Regional Planning and Development Commission “CONNECT NW PA”- Broadband Study
End-User Survey Results By: All 8 Counties-School (College) Entities
Q#10: Do you need a higher speed?
Yes, but unavailable 0 0.0%Yes, available but 1 33.3% too expensiveNo 2 66.7%
3 100.0%
Q#11: What would you be willing to pay a month for a higher speed?
Not Interested 0 0.0%$16-$25 0 0.0%$26-$45 0 0.0%$46-$100 0 0.0%$101-$500 0 0.0%$501-$900 0 0.0%$901-$1,500 0 0.0%$1,500+ 1 100.0%
1 100.0%Q#12: What speed do you consider optimal for your needs?
56 Kbps 0 0.0%128 Kbps 0 0.0%1.544 Mbps 0 0.0%6.312 Mbps 1 50.0%Other 1 50.0%
2 100.0%
Q#13: If not using the Internet, please explain why. ("X" all that apply)
Unavailable 0 0.0%Do not need it 0 0.0%Too expensive 0 0.0%No computer 0 0.0%Too slow 0 0.0%See no benefit 0 0.0%Need Training 0 0.0%Other 0 0.0%
0 0.0%
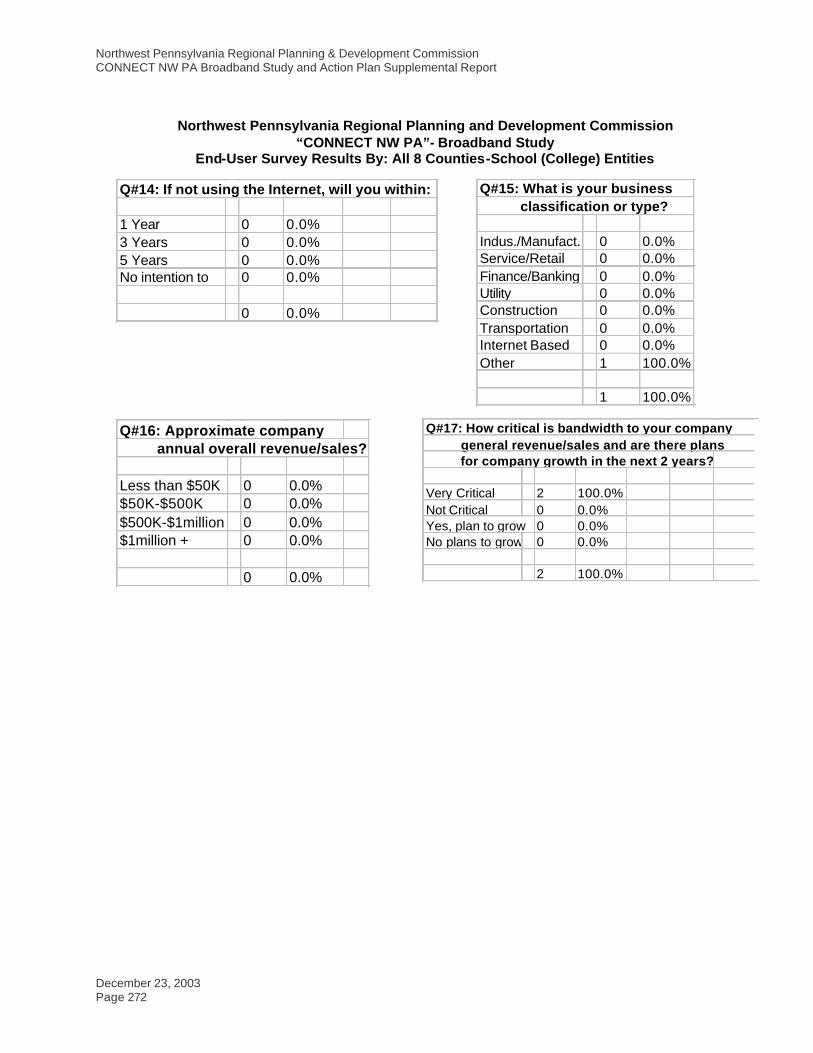
Northwest Pennsylvania Regional Planning & Development Commission CONNECT NW PA Broadband Study and Action Plan Supplemental Report
December 23, 2003 Page 272
Northwest Pennsylvania Regional Planning and Development Commission “CONNECT NW PA”- Broadband Study
End-User Survey Results By: All 8 Counties-School (College) Entities
Q#14: If not using the Internet, will you within:
1 Year 0 0.0%3 Years 0 0.0%5 Years 0 0.0%No intention to 0 0.0%
0 0.0%
Q#15: What is your business classification or type?
Indus./Manufact. 0 0.0%Service/Retail 0 0.0%Finance/Banking 0 0.0%Utility 0 0.0%Construction 0 0.0%Transportation 0 0.0%Internet Based 0 0.0%Other 1 100.0%
1 100.0%
Q#16: Approximate company annual overall revenue/sales?
Less than $50K 0 0.0%$50K-$500K 0 0.0%$500K-$1million 0 0.0%$1million + 0 0.0%
0 0.0%
Q#17: How critical is bandwidth to your company general revenue/sales and are there plans for company growth in the next 2 years?
Very Critical 2 100.0%Not Critical 0 0.0%Yes, plan to grow 0 0.0%No plans to grow 0 0.0%
2 100.0%

Northwest Pennsylvania Regional Planning & Development Commission CONNECT NW PA Broadband Study and Action Plan Supplemental Report
December 23, 2003 Page 273
Table 10-N: End-User Survey By: All 8 Counties Nonprofit Agency Entities
Northwest Pennsylvania Regional Planning and Development Commission “CONNECT NW PA”- Broadband Study
End-User Survey Results By: All 8 Counties-Nonprofit Agency Entities
Q#1: What entity does this survey represent?
Residence 0 0.0%Business 0 0.0%School (K-12) 0 0.0%School (College) 0 0.0%NonProfit Agency 22 100.0%Gov't Entity 0 0.0%Health Care Facil. 0 0.0%Other 0 0.0%
22 100.0%
Q#2: Do you use the Internet or Bandwidth?
Yes 20 90.9%No 2 9.1%
22 100.0%
Q#3: What location do your answers to this survey represent?
Residence 2 9.5%Business 9 42.9%School 0 0.0%Gov't Entity 0 0.0%Hospital/Health 2 9.5%Library 0 0.0%Other 8 38.1%
21 100.0%
Q#4: What type of connection do you use?
Dial up 10 50.0%ISDN Line 1 5.0%Cable Modem 3 15.0%Wireless 2 10.0%Optical Fiber 0 0.0%DSL 3 15.0%Satellite 1 5.0%Other 0 0.0%
20 100.0%

Northwest Pennsylvania Regional Planning & Development Commission CONNECT NW PA Broadband Study and Action Plan Supplemental Report
December 23, 2003 Page 274
Northwest Pennsylvania Regional Planning and Development Commission “CONNECT NW PA”- Broadband Study
End-User Survey Results By: All 8 Counties-Nonprofit Agency Entities
Q#5: What is your monthly cost for Internet or bandwidth?
Less than $15 5 25.0%$16-$25 5 25.0%$26-$45 2 10.0%$46-$100 3 15.0%$101-$500 4 20.0%$501-$900 0 0.0%$901-$1,500 0 0.0%$1,500+ 1 5.0%
20 100.0%
Q#6: Who is your bandwidth and/or Internet Service Provider (ISP)?
Alltel 1 5.0%Choice One 0 0.0%CS Online 4 20.0%Hometown Online 0 0.0%Sprint 1 5.0%Adelphia Comm 1 5.0%Stargate 4 20.0%Verizon 0 0.0%Armstrong 2 10.0%USA Choice 6 30.0%Prime Comp. 0 0.0%AT&T 0 0.0%Coaxial Cable 0 0.0%Velocity.net 0 0.0%Other 1 5.0%
20 100.0%

Northwest Pennsylvania Regional Planning & Development Commission CONNECT NW PA Broadband Study and Action Plan Supplemental Report
December 23, 2003 Page 275
Northwest Pennsylvania Regional Planning and Development Commission “CONNECT NW PA”- Broadband Study
End-User Survey Results By: All 8 Counties-Nonprofit Agency Entities
Q#7: How do you use the bandwidth/Internet?
E-mail 20 17.4%Accounting 3 2.6%Intranet 7 6.1%Prod Desgn/Order 1 0.9%Text Messaging 3 2.6%Online Banking 4 3.5%Extranet 1 0.9%Surf the Web 18 15.7%E-Commerce 5 4.3%CAD/CAM 0 0.0%Ext. Marketing 7 6.1%Chat Rooms 1 0.9%Data Transfer 16 13.9%Research/Info. 9 7.8%Video/Audio 6 5.2%Website Hosting 11 9.6%Telecommute 3 2.6%Other 0 0.0%
115 100.0%

Northwest Pennsylvania Regional Planning & Development Commission CONNECT NW PA Broadband Study and Action Plan Supplemental Report
December 23, 2003 Page 276
Northwest Pennsylvania Regional Planning and Development Commission “CONNECT NW PA”- Broadband Study
End-User Survey Results By: All 8 Counties-Nonprofit Agency Entities
Q#8: Please rate your provider on: Price Very Satisfied 5 27.8%Satisfied 10 55.6%Not Satisfied 3 16.7%No Opinion 0 0.0%
18 100.0%
Q#8: Please rate your provider on: Customer Service Response/Billing
Very Satisfied 6 33.3%Satisfied 11 61.1%Not Satisfied 1 5.6%No Opinion 0 0.0%
18 100.0%
Q#8: Please rate your provider on: Connection Speed/Bandwidth
Very Satisfied 6 30.0%Satisfied 6 30.0%Not Satisfied 8 40.0%No Opinion 0 0.0%
20 100.0%
Q#9: Average on-line hours/month for entire entity?
Less than 40 1 5.6%41-100 4 22.2%101-400 9 50.0%Other 4 22.2%
18 100.0%

Northwest Pennsylvania Regional Planning & Development Commission CONNECT NW PA Broadband Study and Action Plan Supplemental Report
December 23, 2003 Page 277
Northwest Pennsylvania Regional Planning and Development Commission “CONNECT NW PA”- Broadband Study
End-User Survey Results By: All 8 Counties-Nonprofit Agency Entities
Q#10: Do you need a higher speed?
Yes, but unavailable 3 16.7%Yes, available but 7 38.9% too expensiveNo 8 44.4%
18 100.0%
Q#11: What would you be willing to pay a month for a higher speed?
Not Interested 6 30.0%$16-$25 4 20.0%$26-$45 6 30.0%$46-$100 4 20.0%$101-$500 0 0.0%$501-$900 0 0.0%$901-$1,500 0 0.0%$1,500+ 0 0.0%
20 100.0%Q#12: What speed do you consider optimal for your needs?
56 Kbps 1 5.9%128 Kbps 8 47.1%1.544 Mbps 4 23.5%6.312 Mbps 1 5.9%Other 3 17.6%
17 100.0%
Q#13: If not using the Internet, please explain why. ("X" all that apply)
Unavailable 0 0.0%Do not need it 0 0.0%Too expensive 0 0.0%No computer 0 0.0%Too slow 0 0.0%See no benefit 0 0.0%Need Training 0 0.0%Other 1 100.0%
1 100.0%

Northwest Pennsylvania Regional Planning & Development Commission CONNECT NW PA Broadband Study and Action Plan Supplemental Report
December 23, 2003 Page 278
Northwest Pennsylvania Regional Planning and Development Commission “CONNECT NW PA”- Broadband Study
End-User Survey Results By: All 8 Counties-Nonprofit Agency Entities
Q#14: If not using the Internet, will you within:
1 Year 0 0.0%3 Years 0 0.0%5 Years 0 0.0%No intention to 2 100.0%
2 100.0%
Q#15: What is your business classification or type?
Indus./Manufact. 0 0.0%Service/Retail 4 26.7%Finance/Banking 0 0.0%Utility 0 0.0%Construction 0 0.0%Transportation 0 0.0%Internet Based 0 0.0%Other 11 73.3%
15 100.0%
Q#16: Approximate company annual overall revenue/sales?
Less than $50K 2 14.3%$50K-$500K 6 42.9%$500K-$1million 2 14.3%$1million + 4 28.6%
14 100.0%
Q#17: How critical is bandwidth to your company general revenue/sales and are there plans for company growth in the next 2 years?
Very Critical 6 33.3%Not Critical 4 22.2%Yes, plan to grow 8 44.4%No plans to grow 0 0.0%
18 100.0%

Northwest Pennsylvania Regional Planning & Development Commission CONNECT NW PA Broadband Study and Action Plan Supplemental Report
December 23, 2003 Page 279
Table 10-O: End-User Survey By: All 8 Counties – Government Entities
Northwest Pennsylvania Regional Planning and Development Commission “CONNECT NW PA” - Broadband Study
End-User Survey Results By: All 8 Counties-Government Entities
Q#1: What entity does this survey represent?
Residence 0 0.0%Business 0 0.0%School (K-12) 0 0.0%School (College) 0 0.0%NonProfit Agency 0 0.0%Gov't Entity 148 100.0%Health Care Facil. 0 0.0%Other 0 0.0%
148 100.0%
Q#2: Do you use the Internet or Bandwidth?
Yes 111 83.5%No 22 16.5%
133 100.0%
Q#3: What location do your answers to this survey represent?
Residence 1 0.7%Business 0 0.0%School 0 0.0%Gov't Entity 131 92.9%Hospital/Health 1 0.7%Library 0 0.0%Other 8 5.7%
141 100.0%
Q#4: What type of connection do you use?
Dial up 95 76.0%ISDN Line 0 0.0%Cable Modem 13 10.4%Wireless 5 4.0%Optical Fiber 0 0.0%DSL 6 4.8%Satellite 2 1.6%Other 4 3.2%
125 100.0%

Northwest Pennsylvania Regional Planning & Development Commission CONNECT NW PA Broadband Study and Action Plan Supplemental Report
December 23, 2003 Page 280
Northwest Pennsylvania Regional Planning and Development Commission “CONNECT NW PA”- Broadband Study
End-User Survey Results By: All 8 Counties-Government Entities
Q#5: What is your monthly cost for Internet or bandwidth?
Less than $15 53 45.7%$16-$25 38 32.8%$26-$45 9 7.8%$46-$100 6 5.2%$101-$500 9 7.8%$501-$900 0 0.0%$901-$1,500 1 0.9%$1,500+ 0 0.0%
116 100.0%
Q#6: Who is your bandwidth and/or Internet Service Provider (ISP)?
Alltel 5 4.0%Choice One 0 0.0%CS Online 17 13.7%Hometown Online 4 3.2%Sprint 0 0.0%Adelphia Comm 5 4.0%Stargate 14 11.3%Verizon 4 3.2%Armstrong 7 5.6%USA Choice 14 11.3%Prime Comp. 2 1.6%AT&T 1 0.8%Coaxial Cable 0 0.0%Velocity.net 6 4.8%Other 45 36.3%
124 100.0%

Northwest Pennsylvania Regional Planning & Development Commission CONNECT NW PA Broadband Study and Action Plan Supplemental Report
December 23, 2003 Page 281
Northwest Pennsylvania Regional Planning and Development Commission “CONNECT NW PA”- Broadband Study
End-User Survey Results By: All 8 Counties-Government Entities
Q#7: How do you use the bandwidth/Internet?
E-mail 115 26.6%Accounting 24 5.6%Intranet 5 1.2%Prod Desgn/Order 7 1.6%Text Messaging 12 2.8%Online Banking 36 8.3%Extranet 1 0.2%Surf the Web 70 16.2%E-Commerce 8 1.9%CAD/CAM 1 0.2%Ext. Marketing 2 0.5%Chat Rooms 4 0.9%Data Transfer 42 9.7%Research/Info. 66 15.3%Video/Audio 4 0.9%Website Hosting 15 3.5%Telecommute 6 1.4%Other 14 3.2%
432 100.0%
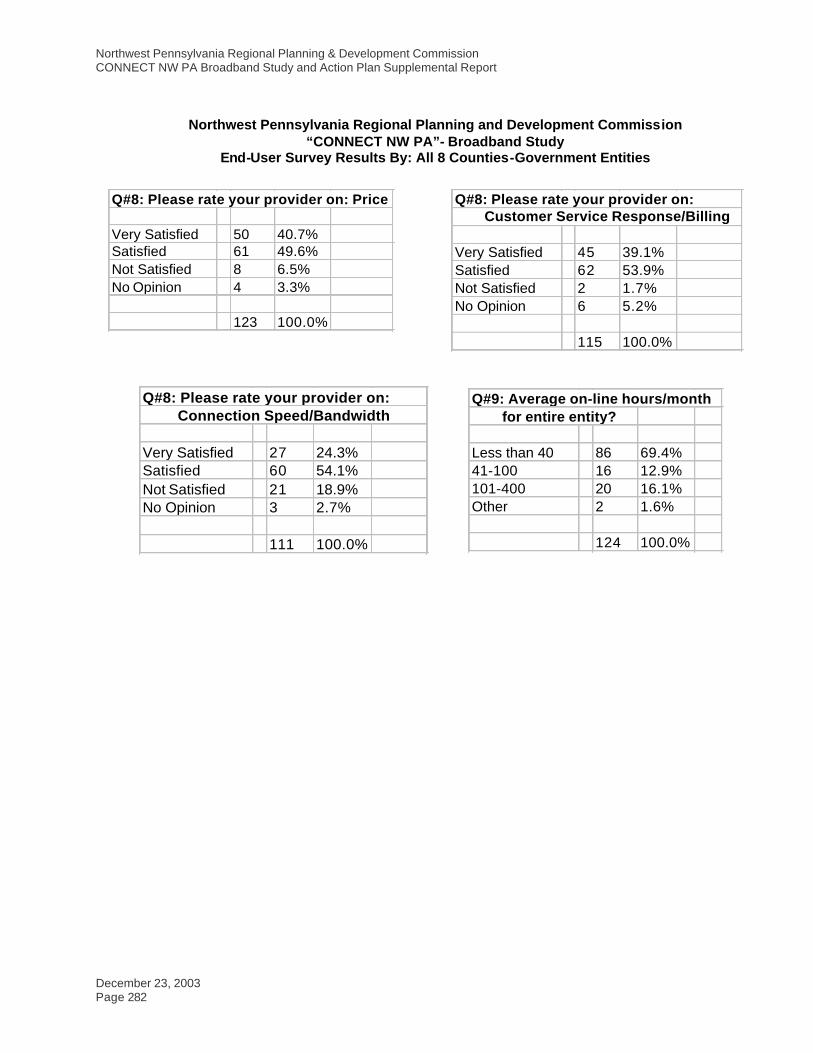
Northwest Pennsylvania Regional Planning & Development Commission CONNECT NW PA Broadband Study and Action Plan Supplemental Report
December 23, 2003 Page 282
Northwest Pennsylvania Regional Planning and Development Commission “CONNECT NW PA”- Broadband Study
End-User Survey Results By: All 8 Counties-Government Entities
Q#8: Please rate your provider on: Price Very Satisfied 50 40.7%Satisfied 61 49.6%Not Satisfied 8 6.5%No Opinion 4 3.3%
123 100.0%
Q#8: Please rate your provider on: Customer Service Response/Billing
Very Satisfied 45 39.1%Satisfied 62 53.9%Not Satisfied 2 1.7%No Opinion 6 5.2%
115 100.0%
Q#8: Please rate your provider on: Connection Speed/Bandwidth
Very Satisfied 27 24.3%Satisfied 60 54.1%Not Satisfied 21 18.9%No Opinion 3 2.7%
111 100.0%
Q#9: Average on-line hours/month for entire entity?
Less than 40 86 69.4%41-100 16 12.9%101-400 20 16.1%Other 2 1.6%
124 100.0%

Northwest Pennsylvania Regional Planning & Development Commission CONNECT NW PA Broadband Study and Action Plan Supplemental Report
December 23, 2003 Page 283
Northwest Pennsylvania Regional Planning and Development Commission “CONNECT NW PA”- Broadband Study
End-User Survey Results By: All 8 Counties-Government Entities
Q#10: Do you need a higher speed?
Yes, but unavailable 15 12.9%Yes, available but 21 18.1% too expensiveNo 80 69.0%
116 100.0%
Q#11: What would you be willing to pay a month for a higher speed?
Not Interested 57 55.9%$16-$25 30 29.4%$26-$45 11 10.8%$46-$100 3 2.9%$101-$500 1 1.0%$501-$900 0 0.0%$901-$1,500 0 0.0%$1,500+ 0 0.0%
102 100.0%Q#12: What speed do you consider optimal for your needs?
56 Kbps 30 42.3%128 Kbps 21 29.6%1.544 Mbps 10 14.1%6.312 Mbps 4 5.6%Other 6 8.5%
71 100.0%
Q#13: If not using the Internet, please explain why. ("X" all that apply)
Unavailable 1 4.2%Do not need it 7 29.2%Too expensive 1 4.2%No computer 5 20.8%Too slow 0 0.0%See no benefit 2 8.3%Need Training 3 12.5%Other 5 20.8%
24 100.0%

Northwest Pennsylvania Regional Planning & Development Commission CONNECT NW PA Broadband Study and Action Plan Supplemental Report
December 23, 2003 Page 284
Northwest Pennsylvania Regional Planning and Development Commission “CONNECT NW PA”- Broadband Study
End-User Survey Results By: All 8 Counties-Government Entities
Q#14: If not using the Internet, will you within:
1 Year 3 20.0%3 Years 5 33.3%5 Years 3 20.0%No intention to 4 26.7%
15 100.0%
Q#15: What is your business classification or type?
Indus./Manufact. 0 0.0%Service/Retail 1 0.9%Finance/Banking 0 0.0%Utility 3 2.8%Construction 0 0.0%Transportation 1 0.9%Internet Based 0 0.0%Other 101 95.3%
106 100.0%
Q#16: Approximate company annual overall revenue/sales?
Less than $50K 14 23.3%$50K-$500K 31 51.7%$500K-$1million 3 5.0%$1million + 12 20.0%
60 100.0%
Q#17: How critical is bandwidth to your company general revenue/sales and are there plans for company growth in the next 2 years?
Very Critical 6 7.6%Not Critical 40 50.6%Yes, plan to grow 7 8.9%No plans to grow 26 32.9%
79 100.0%

Northwest Pennsylvania Regional Planning & Development Commission CONNECT NW PA Broadband Study and Action Plan Supplemental Report
December 23, 2003 Page 285
Table 10-P: End-User Survey By: All 8 Counties – Health Care Facility Entities
Northwest Pennsylvania Regional Planning and Development Commission “CONNECT NW PA”- Broadband Study
End-User Survey Results By: All 8 Counties-Health Care Facility Entities
Q#1: What entity does this survey represent?
Residence 0 0.0%Business 0 0.0%School (K-12) 0 0.0%School (College) 0 0.0%NonProfit Agency 0 0.0%Gov't Entity 0 0.0%Health Care Facil. 5 100.0%Other 0 0.0%
5 100.0%
Q#2: Do you use the Internet or Bandwidth?
Yes 5 100.0%No 0 0.0%
5 100.0%
Q#3: What location do your answers to this survey represent?
Residence 0 0.0%Business 0 0.0%School 0 0.0%Gov't Entity 0 0.0%Hospital/Health 5 100.0%Library 0 0.0%Other 0 0.0%
5 100.0%
Q#4: What type of connection do you use?
Dial up 0 0.0%ISDN Line 1 20.0%Cable Modem 0 0.0%Wireless 0 0.0%Optical Fiber 0 0.0%DSL 2 40.0%Satellite 0 0.0%Other 2 40.0%
5 100.0%

Northwest Pennsylvania Regional Planning & Development Commission CONNECT NW PA Broadband Study and Action Plan Supplemental Report
December 23, 2003 Page 286
Northwest Pennsylvania Regional Planning and Development Commission “CONNECT NW PA”- Broadband Study
End-User Survey Results By: All 8 Counties-Health Care Facility Entities
Q#5: What is your monthly cost for Internet or bandwidth?
Less than $15 0 0.0%$16-$25 0 0.0%$26-$45 0 0.0%$46-$100 0 0.0%$101-$500 2 40.0%$501-$900 1 20.0%$901-$1,500 1 20.0%$1,500+ 1 20.0%
5 100.0%
Q#6: Who is your bandwidth and/or Internet Service Provider (ISP)?
Alltel 0 0.0%Choice One 0 0.0%CS Online 1 20.0%Hometown Online 0 0.0%Sprint 0 0.0%Adelphia Comm 0 0.0%Stargate 0 0.0%Verizon 0 0.0%Armstrong 0 0.0%USA Choice 0 0.0%Prime Comp. 0 0.0%AT&T 1 20.0%Coaxial Cable 0 0.0%Velocity.net 1 20.0%Other 2 40.0%
5 100.0%

Northwest Pennsylvania Regional Planning & Development Commission CONNECT NW PA Broadband Study and Action Plan Supplemental Report
December 23, 2003 Page 287
Northwest Pennsylvania Regional Planning and Development Commission “CONNECT NW PA”- Broadband Study
End-User Survey Results By: All 8 Counties-Health Care Facility Entities
Q#7: How do you use the bandwidth/Internet?
E-mail 5 23.8%Accounting 0 0.0%Intranet 2 9.5%Prod Desgn/Order 0 0.0%Text Messaging 0 0.0%Online Banking 1 4.8%Extranet 1 4.8%Surf the Web 4 19.0%E-Commerce 0 0.0%CAD/CAM 0 0.0%Ext. Marketing 0 0.0%Chat Rooms 0 0.0%Data Transfer 5 23.8%Research/Info. 1 4.8%Video/Audio 1 4.8%Website Hosting 0 0.0%Telecommute 0 0.0%Other 1 4.8%
21 100.0%

Northwest Pennsylvania Regional Planning & Development Commission CONNECT NW PA Broadband Study and Action Plan Supplemental Report
December 23, 2003 Page 288
Northwest Pennsylvania Regional Planning and Development Commission “CONNECT NW PA”- Broadband Study
End-User Survey Results By: All 8 Counties-Health Care Facility Entities
Q#8: Please rate your provider on: Price Very Satisfied 0 0.0%Satisfied 2 40.0%Not Satisfied 3 60.0%No Opinion 0 0.0%
5 100.0%
Q#8: Please rate your provider on: Customer Service Response/Billing
Very Satisfied 0 0.0%Satisfied 4 80.0%Not Satisfied 1 20.0%No Opinion 0 0.0%
5 100.0%
Q#8: Please rate your provider on: Connection Speed/Bandwidth
Very Satisfied 0 0.0%Satisfied 3 60.0%Not Satisfied 2 40.0%No Opinion 0 0.0%
5 100.0%
Q#9: Average on-line hours/month for entire entity?
Less than 40 0 0.0%41-100 2 40.0%101-400 2 40.0%Other 1 20.0%
5 100.0%

Northwest Pennsylvania Regional Planning & Development Commission CONNECT NW PA Broadband Study and Action Plan Supplemental Report
December 23, 2003 Page 289
Northwest Pennsylvania Regional Planning and Development Commission “CONNECT NW PA”- Broadband Study
End-User Survey Results By: All 8 Counties-Health Care Facility Entities
Q#10: Do you need a higher speed?
Yes, but unavailable 2 40.0%Yes, available but 0 0.0% too expensiveNo 3 60.0%
5 100.0%
Q#11: What would you be willing to pay a month for a higher speed?
Not Interested 2 50.0%$16-$25 0 0.0%$26-$45 0 0.0%$46-$100 0 0.0%$101-$500 2 50.0%$501-$900 0 0.0%$901-$1,500 0 0.0%$1,500+ 0 0.0%
4 100.0%Q#12: What speed do you consider optimal for your needs?
56 Kbps 0 0.0%128 Kbps 1 20.0%1.544 Mbps 1 20.0%6.312 Mbps 1 20.0%Other 2 40.0%
5 100.0%
Q#13: If not using the Internet, please explain why. ("X" all that apply)
Unavailable 0 0.0%Do not need it 0 0.0%Too expensive 0 0.0%No computer 0 0.0%Too slow 0 0.0%See no benefit 0 0.0%Need Training 0 0.0%Other 0 0.0%
0 0.0%

Northwest Pennsylvania Regional Planning & Development Commission CONNECT NW PA Broadband Study and Action Plan Supplemental Report
December 23, 2003 Page 290
Northwest Pennsylvania Regional Planning and Development Commission “CONNECT NW PA”- Broadband Study
End-User Survey Results By: All 8 Counties-Health Care Facility Entities
Q#14: If not using the Internet, will you within:
1 Year 0 0.0%3 Years 0 0.0%5 Years 0 0.0%No intention to 0 0.0%
0 100.0%
Q#15: What is your business classification or type?
Indus./Manufact. 0 0.0%Service/Retail 0 0.0%Finance/Banking 0 0.0%Utility 0 0.0%Construction 0 0.0%Transportation 0 0.0%Internet Based 0 0.0%Other 1 100.0%
1 100.0%
Q#16: Approximate company annual overall revenue/sales?
Less than $50K 1 25.0%$50K-$500K 1 25.0%$500K-$1million 0 0.0%$1million + 2 50.0%
4 100.0%
Q#17: How critical is bandwidth to your company general revenue/sales and are there plans for company growth in the next 2 years?
Very Critical 5 100.0%Not Critical 0 0.0%Yes, plan to grow 0 0.0%No plans to grow 0 0.0%
5 100.0%

Northwest Pennsylvania Regional Planning & Development Commission CONNECT NW PA Broadband Study and Action Plan Supplemental Report
December 23, 2003 Page 291
Table 10-Q: End-User Survey By: All 8 Counties – Other Entities
Northwest Pennsylvania Regional Planning and Development Commission “CONNECT NW PA”- Broadband Study
End-User Survey Results By: All 8 Counties-Other Entities
Q#1: What entity does this survey represent?
Residence 0 0.0%Business 0 0.0%School (K-12) 0 0.0%School (College) 0 0.0%NonProfit Agency 0 0.0%Gov't Entity 0 0.0%Health Care Facil. 0 0.0%Other 28 100.0%
28 100.0%
Q#2: Do you use the Internet or Bandwidth?
Yes 4 15.4%No 22 84.6%
26 100.0%
Q#3: What location do your answers to this survey represent?
Residence 1 10.0%Business 1 10.0%School 0 0.0%Gov't Entity 0 0.0%Hospital/Health 0 0.0%Library 0 0.0%Other 8 80.0%
10 100.0%
Q#4: What type of connection do you use?
Dial up 3 50.0%ISDN Line 0 0.0%Cable Modem 1 16.7%Wireless 0 0.0%Optical Fiber 0 0.0%DSL 1 16.7%Satellite 0 0.0%Other 1 16.7%
6 100.0%

Northwest Pennsylvania Regional Planning & Development Commission CONNECT NW PA Broadband Study and Action Plan Supplemental Report
December 23, 2003 Page 292
Northwest Pennsylvania Regional Planning and Development Commission “CONNECT NW PA”- Broadband Study
End-User Survey Results By: All 8 Counties-Other Entities
Q#5: What is your monthly cost for Internet or bandwidth?
Less than $15 0 0.0%$16-$25 1 25.0%$26-$45 0 0.0%$46-$100 1 25.0%$101-$500 2 50.0%$501-$900 0 0.0%$901-$1,500 0 0.0%$1,500+ 0 0.0%
4 100.0%
Q#6: Who is your bandwidth and/or Internet Service Provider (ISP)?
Alltel 0 0.0%Choice One 0 0.0%CS Online 0 0.0%Hometown Online 0 0.0%Sprint 0 0.0%Adelphia Comm 0 0.0%Stargate 0 0.0%Verizon 1 16.7%Armstrong 1 16.7%USA Choice 1 16.7%Prime Comp. 0 0.0%AT&T 0 0.0%Coaxial Cable 0 0.0%Velocity.net 0 0.0%Other 3 50.0%
6 100.0%

Northwest Pennsylvania Regional Planning & Development Commission CONNECT NW PA Broadband Study and Action Plan Supplemental Report
December 23, 2003 Page 293
Northwest Pennsylvania Regional Planning and Development Commission “CONNECT NW PA”- Broadband Study
End-User Survey Results By: All 8 Counties-Other Entities
Q#7: How do you use the bandwidth/Internet?
E-mail 4 17.4%Accounting 1 4.3%Intranet 0 0.0%Prod Desgn/Order 0 0.0%Text Messaging 2 8.7%Online Banking 1 4.3%Extranet 0 0.0%Surf the Web 3 13.0%E-Commerce 0 0.0%CAD/CAM 0 0.0%Ext. Marketing 1 4.3%Chat Rooms 2 8.7%Data Transfer 1 4.3%Research/Info. 4 17.4%Video/Audio 1 4.3%Website Hosting 1 4.3%Telecommute 1 4.3%Other 1 4.3%
23 100.0%

Northwest Pennsylvania Regional Planning & Development Commission CONNECT NW PA Broadband Study and Action Plan Supplemental Report
December 23, 2003 Page 294
Northwest Pennsylvania Regional Planning and Development Commission “CONNECT NW PA”- Broadband Study
End-User Survey Results By: All 8 Counties-Other Entities
Q#8: Please rate your provider on: Price Very Satisfied 2 33.3%Satisfied 4 66.7%Not Satisfied 0 0.0%No Opinion 0 0.0%
6 100.0%
Q#8: Please rate your provider on: Customer Service Response/Billing
Very Satisfied 1 20.0%Satisfied 3 60.0%Not Satisfied 1 20.0%No Opinion 0 0.0%
5 100.0%
Q#8: Please rate your provider on: Connection Speed/Bandwidth
Very Satisfied 1 20.0%Satisfied 3 60.0%Not Satisfied 1 20.0%No Opinion 0 0.0%
5 100.0%
Q#9: Average on-line hours/month for entire entity?
Less than 40 2 40.0%41-100 1 20.0%101-400 2 40.0%Other 0 0.0%
5 100.0%

Northwest Pennsylvania Regional Planning & Development Commission CONNECT NW PA Broadband Supplemental Report - Preliminary Draft
December 23, 2003 Page 295
Northwest Pennsylvania Regional Planning and Development Commission “CONNECT NW PA”- Broadband Study
End-User Survey Results By: All 8 Counties-Other Entities
Q#10: Do you need a higher speed?
Yes, but unavailable 1 20.0%Yes, available but 1 20.0% too expensiveNo 3 60.0%
5 100.0%
Q#11: What would you be willing to pay a month for a higher speed?
Not Interested 2 50.0%$16-$25 0 0.0%$26-$45 0 0.0%$46-$100 1 25.0%$101-$500 1 25.0%$501-$900 0 0.0%$901-$1,500 0 0.0%$1,500+ 0 0.0%
4 100.0%Q#12: What speed do you consider optimal for your needs?
56 Kbps 1 25.0%128 Kbps 1 25.0%1.544 Mbps 2 50.0%6.312 Mbps 0 0.0%Other 0 0.0%
4 100.0%
Q#13: If not using the Internet, please explain why. ("X" all that apply)
Unavailable 0 0.0%Do not need it 10 34.5%Too expensive 1 3.4%No computer 10 34.5%Too slow 0 0.0%See no benefit 3 10.3%Need Training 2 6.9%Other 3 10.3%
29 100.0%

CONNECT NW PA BROADBAND STUDY REPORT Northwest Pennsylvania Regional Planning and Development Commission
December 23, 2003 Page 296
Northwest Pennsylvania Regional Planning and Development Commission “CONNECT NW PA”- Broadband Study
End-User Survey Results By: All 8 Counties-Other Entities
Q#14: If not using the Internet, will you within:
1 Year 0 0.0%3 Years 0 0.0%5 Years 0 0.0%No intention to 14 100.0%
14 100.0%
Q#15: What is your business classification or type?
Indus./Manufact. 1 14.3%Service/Retail 0 0.0%Finance/Banking 0 0.0%Utility 1 14.3%Construction 0 0.0%Transportation 1 14.3%Internet Based 0 0.0%Other 4 57.1%
7 100.0%
Q#16: Approximate company annual overall revenue/sales?
Less than $50K 0 0.0%$50K-$500K 0 0.0%$500K-$1million 1 50.0%$1million + 1 50.0%
2 100.0%
Q#17: How critical is bandwidth to your company general revenue/sales and are there plans for company growth in the next 2 years?
Very Critical 1 50.0%Not Critical 1 50.0%Yes, plan to grow 0 0.0%No plans to grow 0 0.0%
2 100.0%
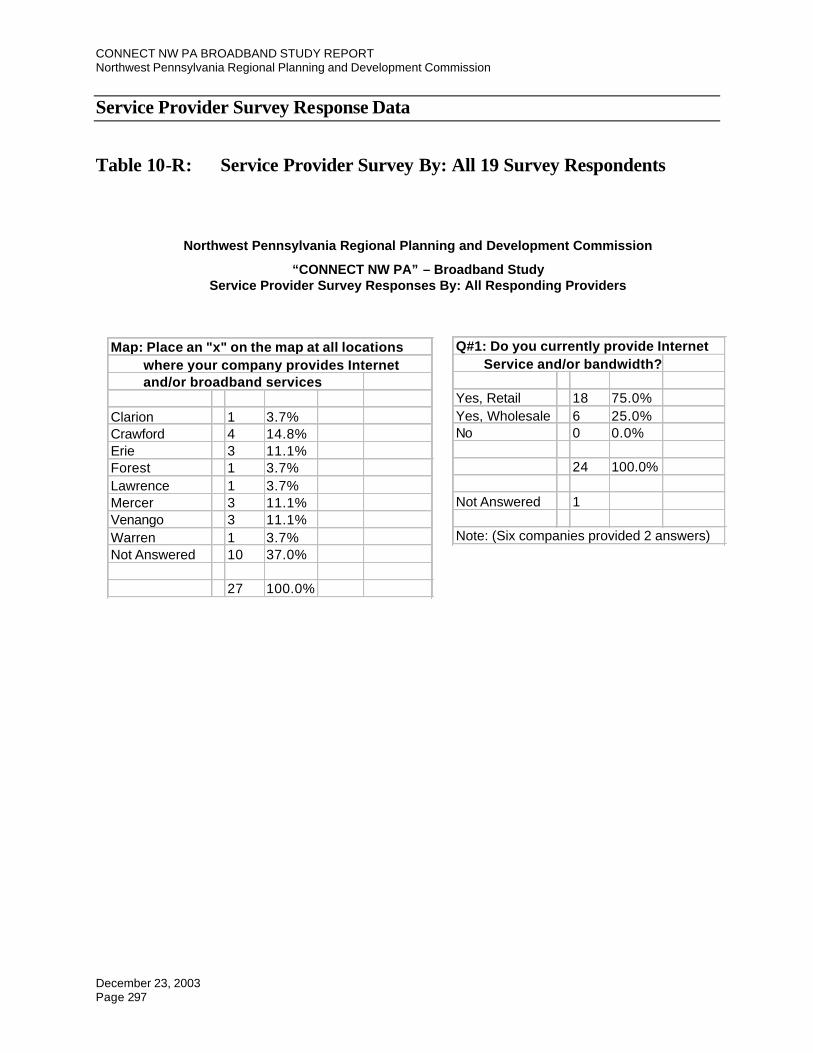
CONNECT NW PA BROADBAND STUDY REPORT Northwest Pennsylvania Regional Planning and Development Commission
December 23, 2003 Page 297
Service Provider Survey Response Data
Table 10-R: Service Provider Survey By: All 19 Survey Respondents
Northwest Pennsylvania Regional Planning and Development Commission
“CONNECT NW PA” – Broadband Study Service Provider Survey Responses By: All Responding Providers
Map: Place an "x" on the map at all locations where your company provides Internet and/or broadband services
Clarion 1 3.7%Crawford 4 14.8%Erie 3 11.1%Forest 1 3.7%Lawrence 1 3.7%Mercer 3 11.1%Venango 3 11.1%Warren 1 3.7%Not Answered 10 37.0%
27 100.0%
Q#1: Do you currently provide Internet Service and/or bandwidth?
Yes, Retail 18 75.0%Yes, Wholesale 6 25.0%No 0 0.0%
24 100.0%
Not Answered 1
Note: (Six companies provided 2 answers)

CONNECT NW PA BROADBAND STUDY REPORT Northwest Pennsylvania Regional Planning and Development Commission
December 23, 2003 Page 298
Northwest Pennsylvania Regional Planning and Development Commission
“CONNECT NW PA” – Broadband Study Service Provider Survey Responses By: All Responding Providers
Q#2: Which of the response options best describes your company's primary business?
Incumbent Local Exchange Carrier 3 13.0%Competitive Local Exchange Carrier 1 4.3%Competitive Access Provider 2 8.7%Long Distance Provider Interchange Carrier 0 0.0%Local Phone Company 1 4.3%Regional/Alternative Competitive Phone Company1 4.3%Cellular or Wireless Service Provider 3 13.0%Cable Company 4 17.4%ISP 8 34.8%Satellite Service 0 0.0%Other 0 0.0%
23 100.0%
Not Answered 0
Note: (Two companies provided 2 answers, One company provided 3 answers)

CONNECT NW PA BROADBAND STUDY REPORT Northwest Pennsylvania Regional Planning and Development Commission
December 23, 2003 Page 299
Northwest Pennsylvania Regional Planning and Development Commission
“CONNECT NW PA” – Broadband Study Service Provider Survey Responses By: All Responding Providers
Q#3: If you do not provide Internet Service and/or bandwidth, in which counties do you provide other services in?
Clarion 1 12.5%Crawford 1 12.5%Erie 1 12.5%Forest 1 12.5%Lawrence 1 12.5%Mercer 1 12.5%Venango 1 12.5%Warren 1 12.5%
8 100.0%
Not Answered 18
Note: (One company provided 8 answers)
Q#4: If you provide Internet Service and/or bandwidth, will you provide existing facility, infrastructure data & maps, as well as rate schedule data & service area maps to the Commission for use in the study?
Yes 6 33.3%No 1 5.6%Will provide some requested data 11 61.1%
18 100.0%
Not Answered 1

CONNECT NW PA BROADBAND STUDY REPORT Northwest Pennsylvania Regional Planning and Development Commission
December 23, 2003 Page 300
Northwest Pennsylvania Regional Planning and Development Commission
“CONNECT NW PA” – Broadband Study Service Provider Survey Responses By: All Responding Providers
Q#5: If you provide Internet Service and/or bandwidth, will you provide future facility, infrastructure data & maps, as well as rate schedule data & service area maps to the Commission for use in the study?
Yes 5 27.8%No 1 5.6%Will provide some data 12 66.7%
18 100.0%
Not Answered 1
Q#6: Please indicate in which counties your firm has a Point of Presence (POP) or Network Operating Center (NOC)?
Clarion 7 13.7%Crawford 7 13.7%Erie 9 17.6%Forest 5 9.8%Lawerence 3 5.9%Mercer 5 9.8%Venango 9 17.6%Warren 6 11.8%
51 100.0%
Not Answered 2

CONNECT NW PA BROADBAND STUDY REPORT Northwest Pennsylvania Regional Planning and Development Commission
December 23, 2003 Page 301
Northwest Pennsylvania Regional Planning and Development Commission
“CONNECT NW PA” – Broadband Study Service Provider Survey Responses By: All Responding Providers
Q#7: What type of connection is available to customers?
Dial up 12 24.0%ISDN Line 8 16.0%Cable Modem 6 12.0%DSL 7 14.0%Optical Fiber 3 6.0%2.5G 1 2.0%3G 1 2.0%Satellite 0 0.0%FWA 6 12.0%WLAN 4 8.0%Other 2 4.0%
50 100.0%
Not Answered 1
FWA = Fixed Wireless Access
WLAN = Wireless Local Area Networks

CONNECT NW PA BROADBAND STUDY REPORT Northwest Pennsylvania Regional Planning and Development Commission
December 23, 2003 Page 302
Northwest Pennsylvania Regional Planning and Development Commission
“CONNECT NW PA” – Broadband Study Service Provider Survey Responses By: All Responding Providers
Q#8: What is the monthly cost of basic Internet service for a residential user? (If other than dial-up service, please identify)
Less than $15 5 27.8%$16-$25 5 27.8% (1@ FWA, 1@Cable Modem
up to 3 Mbps, 1@$34.95 DSL)$26-$45 7 38.9%$45+/Other 1 5.6% Wireless 256K-900K
18 100.0%
Not Answered 4
Note:(One company provided 4 answers)
Q#9: What is the monthly average cost of a T1 Line for a commercial user? (use average transport cost for businesses using a T1 Line in the areas you serve in the 8 county region)
Less than $500 3 21.4%$501-$900 5 35.7%$901-$1,300 6 42.9%$1,300 +/Other 0 0.0%
14 100.0%
Not Answered 5

CONNECT NW PA BROADBAND STUDY REPORT Northwest Pennsylvania Regional Planning and Development Commission
December 23, 2003 Page 303
Northwest Pennsylvania Regional Planning and Development Commission
“CONNECT NW PA” – Broadband Study Service Provider Survey Responses By: All Responding Providers
Q#10: Are there multiple Internet/bandwidth providers also serving in your service area for customers to choose from?
Yes 16 94.1%No 1 5.9%Uncertain 0 0.0%
17 100.0%
Not Answered 2
Q#11: What percent of your service area do you currently offer 2 Mbps or more in at least one direction?
Less than 34% 4 22.2%34-66% 3 16.7%67-100% 6 33.3%Do not offer 2 Mbps or more 5 27.8%
18 100.0%
Not Answered 1Q#12: To what degree are features of your connectivity service (access time, transfer speed, etc.) affected by the number of users connected?
None or Little Affect 13 72.2%Moderate Affect 4 22.2%Large Affect 1 5.6%Other 0 0.0%
18 100.0%
Not Answered 1

CONNECT NW PA BROADBAND STUDY REPORT Northwest Pennsylvania Regional Planning and Development Commission
December 23, 2003 Page 304
Northwest Pennsylvania Regional Planning and Development Commission
“CONNECT NW PA” – Broadband Study Service Provider Survey Responses By: All Responding Providers
Q#13: What maximum bandwidth availability does your firm currently offer ?
56 Kbps (Dial up) 0 0.0%500 Kbps 0 0.0%1.544 Mbps (T1/DS1 Line) 7 41.2%6.312 Mbps (T2/DS2) 2 11.8%10 Mbps 2 11.8%44.736 Mbps (T3/DS3) 2 11.8%155.52 Mbps (OC3) 0 0.0%466.56 Mbps (OC9) 0 0.0%1.244 Gbps (OC24) 0 0.0%2.488 Gbps (OC48) 1 5.9%9.952 Gbps (OC 192) 1 5.9%Other 2 11.8%
17 100.0%
Not Answered 2
Q#14: What speed does your firm use to describe "broadband" in at least one direction?
Less than 200 Kbps 1 5.9%200 Kbps 0 0.0%200K+ to 500 Kbps 7 41.2%500+K to 1.544 Mbps 3 17.6%1.544 Mbps 3 17.6%1.544 M+ to 2 Mbps 1 5.9%More than 2 Mbps 2 11.8%Other 0 0.0%
17 100.0%
Not Answered 2

CONNECT NW PA BROADBAND STUDY REPORT Northwest Pennsylvania Regional Planning and Development Commission
December 23, 2003 Page 305
Northwest Pennsylvania Regional Planning and Development Commission
“CONNECT NW PA” – Broadband Study Service Provider Survey Responses By: All Responding Providers
Q#15: What is the highest priority to your business customers?
Security 1 4.3%Bandwidth Scalability 2 8.7%Availability of Service 5 21.7%Cost 4 17.4%Bundled Service 0 0.0%Quality of Service /Customer Support 9 39.1%Provider Reputation 1 4.3%Other 1 4.3%
23 100.0%
Not Answered 1
Note: (One company provided 6 answeres)
Q#16: Does your firm plan on providing Internet and/or bandwidth services in the future ?
Yes 14 93.3%No 0 0.0%Uncertain 1 6.7%
15 100.0%
Not Answered 4

CONNECT NW PA BROADBAND STUDY REPORT Northwest Pennsylvania Regional Planning and Development Commission
December 23, 2003 Page 306
Northwest Pennsylvania Regional Planning and Development Commission
“CONNECT NW PA” – Broadband Study Service Provider Survey Responses By: All Responding Providers
Q#17: Would your firm be interested in exploring public-private partnerships for service area expansion planning with the Northwest Commission ?
Yes 15 93.8%No 1 6.3%
16 100.0%
Not Answered 3
Q#18: Should local government or cooperatives be part of providing services where private companies are not serving?
Yes 5 27.8%No 9 50.0%Local Gov't Only 0 0.0%Co-ops Only 4 22.2%
18 100.0%
Not Answered 1
Q#19: Any comments you would like to offer?
Provided Comments 6 31.6%Not Provided Comments 13 68.4%
19 100.0%

CONNECT NW PA BROADBAND STUDY REPORT Northwest Pennsylvania Regional Planning and Development Commission
December 23, 2003 Page 307
USGS Maps
Figures 2-E, 2-F, 2-G, and 2-H (Located at end of Supplemental Report)
Related Documents


