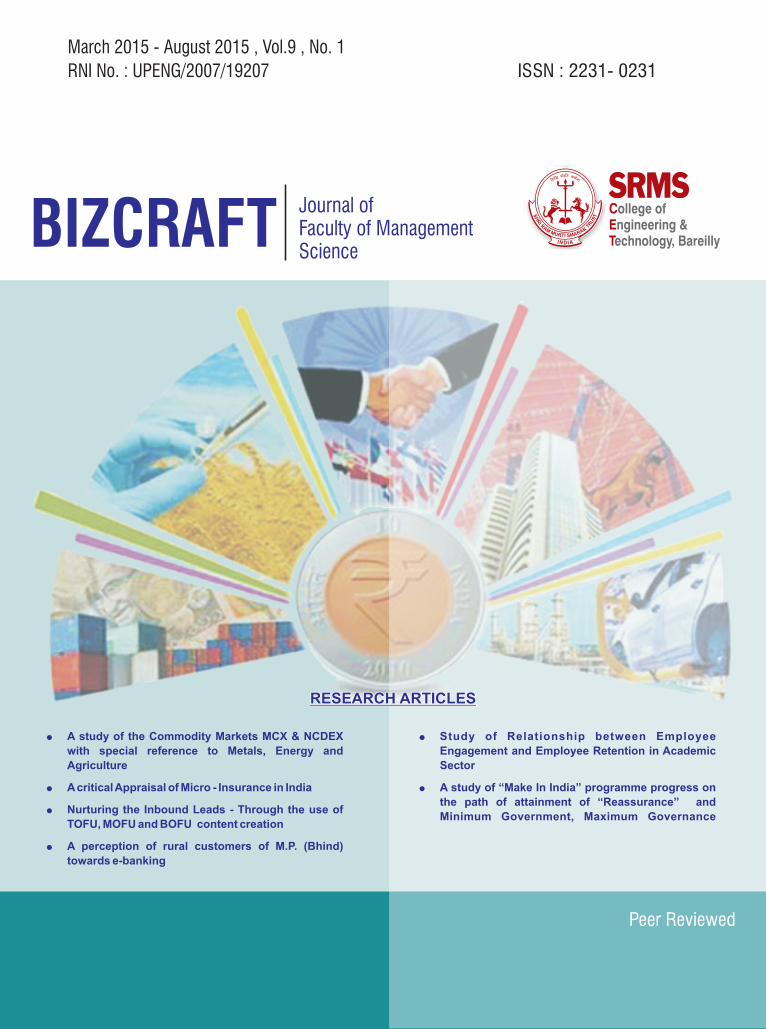
ISSN : 2231- 0231 RNI No. : UPENG/2007/19207 C E T ollege of ngineering & echnology, Bareilly SRMS Journal of Faculty of Management Science BIZCRAFT March 2015 - August 2015 , Vol.9 , No. 1 Peer Reviewed ? A study of the Commodity Markets MCX & NCDEX with special reference to Metals, Energy and Agriculture ? A critical Appraisal of Micro - Insurance in India ? Nurturing the Inbound Leads - Through the use of TOFU, MOFU and BOFU content creation ? A perception of rural customers of M.P. (Bhind) towards e-banking ? Study of Relationship between Employee Engagement and Employee Retention in Academic Sector ? A study of “Make In India” programme progress on the path of attainment of “Reassurance” and Minimum Government, Maximum Governance RESEARCH ARTICLES RESEARCH ARTICLES

Welcome message from author
This document is posted to help you gain knowledge. Please leave a comment to let me know what you think about it! Share it to your friends and learn new things together.
Transcript
ISSN : 2231- 0231RNI No. : UPENG/2007/19207
CET
ollege of ngineering & echnology, Bareilly
SRMSJournal of Faculty of Management Science
BIZCRAFT
March 2015 - August 2015 , Vol.9 , No. 1
Peer Reviewed
?A study of the Commodity Markets MCX & NCDEX
with special reference to Metals, Energy and
Agriculture
?A critical Appraisal of Micro - Insurance in India
?Nurturing the Inbound Leads - Through the use of
TOFU, MOFU and BOFU content creation
?A perception of rural customers of M.P. (Bhind)
towards e-banking
?Study of Relationship between Employee
Engagement and Employee Retention in Academic
Sector
?A study of “Make In India” programme progress on
the path of attainment of “Reassurance” and
Minimum Government, Maximum Governance
RESEARCH ARTICLES RESEARCH ARTICLES
Submission of Manuscript
All Manuscript should be submitted to :
Bizcraft is a halfyearly journal on contemporary management perspectives published by the Faculty of management Science,
SRMS College of Engg & Tech, Bareilly (UP), India . It invites original research articles, case study, executive deliberation,
book reviews and perspective based papers from academicians and practitioners on any issue of management and technology
perspectives. The author should send two print copies of manuscript on A4 size paper with double line space on Times New
Roman 12 point fonts on MS Word format. Sufficient left margin must be available on all the pages for facilitating the review
of the article by the reviewer. The review process normally takes one month from the date of receiving of the article by the
editor. The unaccepted articles will not be returned.
One soft copy must also be mailed to [email protected].
The manuscripts should be arranged in following order :
1. Cover page consisting the title of the submitted articles along with the name (s) of the contributor(s), his/her
designations and brief profile of each contributor(s) along with contact address. It must consists a declaration that “ It is
certified that the manuscript titled “Title” which is submitted for publication in Bizcraft. A half yearly journal of Faculty
of Management Sciences, Shri Ram Murti Smarak College of Engg & Tech, Bareilly (UP), India is my original work
and all references and source of data and conclusions are properly acknowledged”.
2. Abstract in around 100-150 words briefly explaining the theme of the contributed manuscript, its relevancy in
contemporary management practices and research methodology, which is used for preparation of the article (if
applicable).
3. The article itself in around 6000 to 10000 words depending upon the aspect of issue presented in the manuscript. It may
include the innovative thought with its practical applicability, conducted research work, case study, book review etc.
The data table, graphs and charts etc. must be numbered properly and attached as separate sheet with clear presentation
The acceptance of the article for publication is based on the understanding that the manuscript is an unpublished work and not
submitted for publication anywhere else. The editorial board reserved the right for suitable modification in the article.
It is suggested that all type of data and conclusions must be properly acknowledged in term of its source in proper format. The
references must be arranged in alphabetical order mentioning the name of the researcher/source. For example Hedge, L.V
(1995). “Statistical Method for Meta Analysis”, Journal of Statistical Research, Vol no, Page No. for referring the journals or
published works. Standard format may also be used for referring the books and working papers.
Editor reserves the right to accept or refuse an article for publication, and there is no obligation to assign reasons for the
decision. The author will receive a complementary copy of the Bizcraft in which their article is published.
The Editor
Bizcraft
Faculty of Management Science
SRMS college of Engg. & Tech.
Ram Murti Puram, 13 KM. Bareilly-Nainital Road, Bareilly-243202, Uttar Pradesh, India
Ph : 0581-2582246, 2582249, 2592331, 32 Fax 0581-2582330
E-Mail : [email protected]
Guidelines for references :
SRMSCET
ginn
eE
e
f
r
o
i
n
e
g
g
&
el
l
T
o
e
C
c
h
.
n
S.
ol
M
o
.
gR.
yS Ba
ly
r ile

EDITORIAL BOARD
Chief Patron
Shri Dev MurtiChairman, SRMS Trust(Bareilly & Lucknow)
Patron
Shri Aditya Murti Secretary, SRMS Trust (Bareilly & Lucknow)
Advisory Committee
Professor Syamal GuptaDirector
Shri Ram Murti Smarak International Business
School, Lucknow
Professor A.M. Agarwal(Former Director, Birla Institute
of Technology International Centre, Muscat, UAE)
Professor A. K. Sarkar(DMS, M.J.P. Rohilkhand
University, Bareilly)
Professor K.C. Prasad(Dean, Faculty of Science, Ranchi University, Ranchi)
Professor H.P. Mathur (FMS, BHU, Varanasi)
Editor-in-Chief
Dr. Anant Kumar SrivastavaProfessor
Faculty of Management Science Shri Ram Murti Smarak
College of Engineering & Technology, Bareilly
About SRMS College of Engineering & Technology Bareilly
Shri Ram Murti Smarak College of Engineering & Technology has an independent residential campus spread over 35 acres of land with all weather roads, lush green lawns, playgrounds, Multi-Purpose Hall, Gymnasium, Squash Court and 53020 sq.m. of built up area on the campus. The campus is aesthetically planned and designed with exquisite facilities.
The college offers courses of undergraduate and postgraduate levels, with a professional or vocational orientation to internationally recognized standards of excellence. All courses lay emphasis on practicals and are multi-disciplinary in approach. The college inculcates Values, Ethics in its students, so that the PRIDE of SRMSCET will become the ASSET of our Nation.
The College has demonstrated the perennial evidence for merit and quality. It is developing by leaps and bounds in terms of infrastructural facilities and human capital not only to fulfill the requirements of the current technological status but also to set itself as teaching and research centre of eminence in future.
20 YEARS OF QUALITY BASED EDUCATIONS :
ØCollege has been selected for the Technical Education
Quality Improvement Programme of National Project
Implementation Unit of the Government of India financed
by the World Bank.
ØAll B.Tech courses are accredited by NBA.
ØThe College is a STAR Performer College of UPTU and
winner of Excellence award in B.Tech., B.Pharm, MBA &
MCA in year 2009 and 2010 continuously.
ØRanked among best of all private colleges and government
colleges of UP Technical University in term of Gross
Average Intellectual Attainment Per Student
Ø Winner of Academic Excellence Award of UPTU for
MBA, B.Tech and B.Pharm in 2008
ØWinner of Academic Excellence Award of UPTU for
MBA, B.Tech and B.Pharm in 2009
i
ØConsistently ranked number 1 for its MBA course among
all institutions of UPTU.
ØWinner of National Awards for excellence in education -
2011 in Indian Education Congress -2011
ØApproved institutions for organizing INSPIRE by DST
Govt of India
Ø Winner of National Employability Award -2012 by
AMCAT
ØMOU with ICICI Bank for foundation course in Banking
for MBA students
Ø MOU with TCS and INFOSYS to run value addition
courses
ØEdupreneurs Award -2013 to the Chairman of this college
ØInstitutional Memberships of NASSCOM, NHRDN,
AIMA, CSI, RMA, AIMS
ØOver 7000 Alumni working at leading positions in reputed
companies of India and abroad
ØExcellent and valid placement record for all eligible
students
Editor
Prof. (Dr.) Mamta Gaur Professor and Faculty Incharge Faculty of Management Science
Shri Ram Murti Smarak College of Engineering &
Technology, Bareilly
Associate Editor
Mr. Abhishek Gupta Assitant Professor
Faculty of Management Science Shri Ram Murti Smarak
College of Engineering & Technology, Bareilly
Designer
Editorial Office
Mr. Pramod Sharma
Faculty of Management Science
Ram Murti Puram, 13 Km Bareilly-Nainital Road, Bareilly (U.P.), India
Ph.: 91-581-2582331-32, 2582246, 249, Fax : 91-581-2582330
Website : www.srmscet.edu, Email : [email protected]
Shri Ram Murti Smarak College of Engineering & Technology, Bareilly
ii
Shri Ram Murti Smarak College of Engineering and Technology, Bareilly,
UP has been offering its prestigious management programme since 1996. MBA from this college is known for its quality & perfection and recognized by industries for its practical orientations. The alumni of MBA course from this college are working at leading positions in the companies of repute. The Faculty of Management Science department also conducts various value addition activities such as Campus Outreach Programmes, Management Development Programmes, Faculty Development Programmes & Interdisciplinary Seminars.
MBA from this college is ranked No 1 in the affiliating university since the beginning and awarded with Academic Excellence Awards of the university. A high degree of interaction is maintained with industries for imparting practical training. The department offers comprehensive management educa t ion b lended wi th Entrepreneurship development, Case study, Economic policy analysis etc. Certification courses in Finance,Insurance, International Business, Project management & HR Management provides extra edge to the students of SRMS Bareilly & they are ready by to move from campus to corporate.
The department is having well equipped Class Rooms, Computer Lab, Seminar Halls, Team Rooms etc. to provide best required infrastructure for effective teaching and learning process. In order to promote research, the department publishes management journal Bizcraft (ISSN: 2231-0231,
RNI No: UPEGN/2007/19207) and its newsletter 'Enterpriser'.
Bizcraft, the Journal of Management Sciences (SRMS FMS) is a bi-annual, peer reviewed journal with national circulation.
It publishes original communications of research that advances, illuminates Management science and that educates the journal readers.
Manuscripts dealing management aspects will be considered for publication, provided. They contain results of original investigations. Articles need to be of general interest - e.g., they cross the boundaries of specialties or are of sufficient novelty and importance that the journal's readers, whatever their specialty, should be made aware of the findings.
Research papers reporting original research, review articles, correspondence on published articles will also be considered. Papers of routine nature which are merely records of interesting cases as also those dealing with modifications of routine methodology will not be encouraged.
The SRMS FMS prefers the original research work done by Faculties or Management for their research work.
The SRMS FMS strongly discourages duplication/reduplication of data already published in other journals. If and when duplication is detected after publishing in SRMS FMS, the journal will be forced to 'retract' such articles.
All papers submitted to SRMS FMS are subject to peer review process. All accepted papers will be suitably edited before publication.
Disclaimer Statement
The articles, which are published, in BIZCRAFT reflects the personal opinions and view of the author(s) and it do not reflects the view of BIZCRAFT or the publishing institute itself. The articles are published with the understanding that it is the original unpublished work of the author(s) and it does not contravene with copyright in any form.
All cares are taken to remove any type of errors however the editorial board will not be responsible for any type of printing errors.
About FMS(Faculty of Management Science)
About Journal
iii
Editor’s Profile
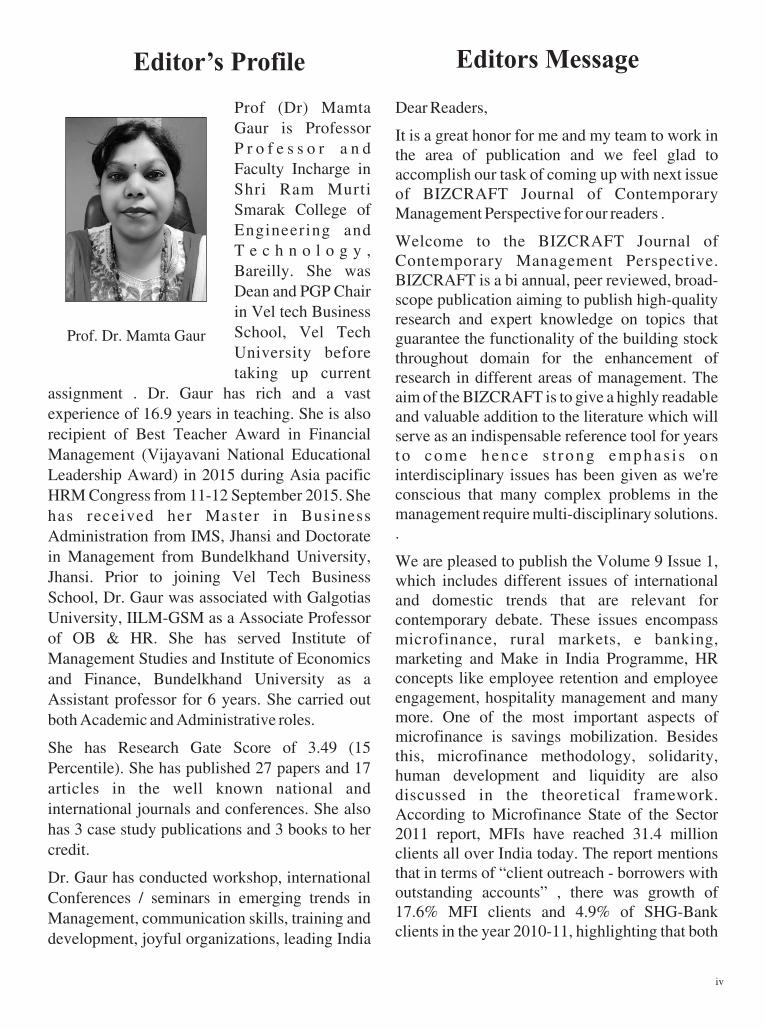
Prof (Dr) Mamta Gaur is Professor P r o f e s s o r a n d Faculty Incharge in Shri Ram Murti Smarak College of Engineering and T e c h n o l o g y , Bareilly. She was Dean and PGP Chair in Vel tech Business School, Vel Tech University before taking up current
assignment . Dr. Gaur has rich and a vast experience of 16.9 years in teaching. She is also recipient of Best Teacher Award in Financial Management (Vijayavani National Educational Leadership Award) in 2015 during Asia pacific HRM Congress from 11-12 September 2015. She has received her Master in Business Administration from IMS, Jhansi and Doctorate in Management from Bundelkhand University, Jhansi. Prior to joining Vel Tech Business School, Dr. Gaur was associated with Galgotias University, IILM-GSM as a Associate Professor of OB & HR. She has served Institute of Management Studies and Institute of Economics and Finance, Bundelkhand University as a Assistant professor for 6 years. She carried out both Academic and Administrative roles.
She has Research Gate Score of 3.49 (15 Percentile). She has published 27 papers and 17 articles in the well known national and international journals and conferences. She also has 3 case study publications and 3 books to her credit.
Dr. Gaur has conducted workshop, international Conferences / seminars in emerging trends in Management, communication skills, training and development, joyful organizations, leading India
Dear Readers,
It is a great honor for me and my team to work in the area of publication and we feel glad to accomplish our task of coming up with next issue of BIZCRAFT Journal of Contemporary Management Perspective for our readers .
Welcome to the BIZCRAFT Journal of Contemporary Management Perspective. BIZCRAFT is a bi annual, peer reviewed, broad-scope publication aiming to publish high-quality research and expert knowledge on topics that guarantee the functionality of the building stock throughout domain for the enhancement of research in different areas of management. The aim of the BIZCRAFT is to give a highly readable and valuable addition to the literature which will serve as an indispensable reference tool for years t o come hence s t rong emphas i s on interdisciplinary issues has been given as we're conscious that many complex problems in the management require multi-disciplinary solutions. .
We are pleased to publish the Volume 9 Issue 1, which includes different issues of international and domestic trends that are relevant for contemporary debate. These issues encompass microfinance, rural markets, e banking, marketing and Make in India Programme, HR concepts like employee retention and employee engagement, hospitality management and many more. One of the most important aspects of microfinance is savings mobilization. Besides this, microfinance methodology, solidarity, human development and liquidity are also discussed in the theoretical framework. According to Microfinance State of the Sector 2011 report, MFIs have reached 31.4 million clients all over India today. The report mentions that in terms of “client outreach - borrowers with outstanding accounts” , there was growth of 17.6% MFI clients and 4.9% of SHG-Bank clients in the year 2010-11, highlighting that both
Prof. Dr. Mamta Gaur
Editors Message
iv
in Management Education, and knowledge management and MDPs for various organizations such as Madhya Pradesh Electricity Board, UP Jal Nigam, SBI- Jhansi and City Hospital-Farrukhabad. She has been associated with Sanjeevani (NGO)¸ Qutub institutional Area¸ New Delhi for imparting Training in Counseling Skills . Has done programmes for managers in private and public sectors on issues in people management strategies¸ diversity management and employee relations. She commands in teaching Business taxation, Financial Management ,Strategic Human Resource Management and Organizational Behavior through innovative teaching methods. The other interest areas of teaching are International Business Management , Global HRM¸ Diversity Management , Performance management system¸ Compensation management , Strategic Change through People Management Strategy, leadership development, New Industrial Relations¸ and Social Security Issues for Organized as well as Unorganized Sector Workforce and Employment Law. Her major areas of research and consulting are Financial Management and Performance M a n a g e m e n t S y s t e m , C o m p e n s a t i o n Management, HR as Service concept, Creating role directory¸ Strategic Change through People Management Strategy¸ Joyful Organization¸ Strategies for Flexibility and Change.
SHG and MFI models co-existed and flourished over the years.
As the Editor of the BIZCRAFT, I take this opportunity to express my sincere gratitude to authors who have chosen the BIZCRAFT to disseminate their research. Further, I would like to thank Editor-in-Chief and other supporting staff at Shri Ram Murti Smarak College of Engineering and Technology, Bareilly for the success of this Journal.
We are more than happy to receive contributions for our next issue from academicians, scholars and practitioners to ensure the consistency and the success of the Journal. We welcome comments and suggestions that would advance the objectives of the Journal
.
We are very much grateful to our friends and all involved and contributed a lot in accomplishing this piece of work to be a successful one. All this can be achieved through constant feedback from our readers. So, please, do not hesitate to contact me with your comments, complaints and suggestions. They will surely help me in making this Transaction more and more useful and desirable.
With best wishes,
Too often we forget that a journal, even a scientific journal, can survive only if it meets the expectations of its readers and is fruitful to them. However, authors, before being authors, were readers; and every new work is – and shall be – inspired by a thorough literature search. New results shall always be validated by comparing them with the already existing ones. Moreover, today's readers will probably be tomorrow's authors. If we offer them a qualified, broad insight on the most innovative works in the management field, we not only serve them, but we also contribute to educate new generations of authors, thus ensuring a bright future for this journal.
and help in progressing and improving to meet target of quality I hope that these Issues will help us to better serve our readers.
We look forward to welcoming your submissions.
v
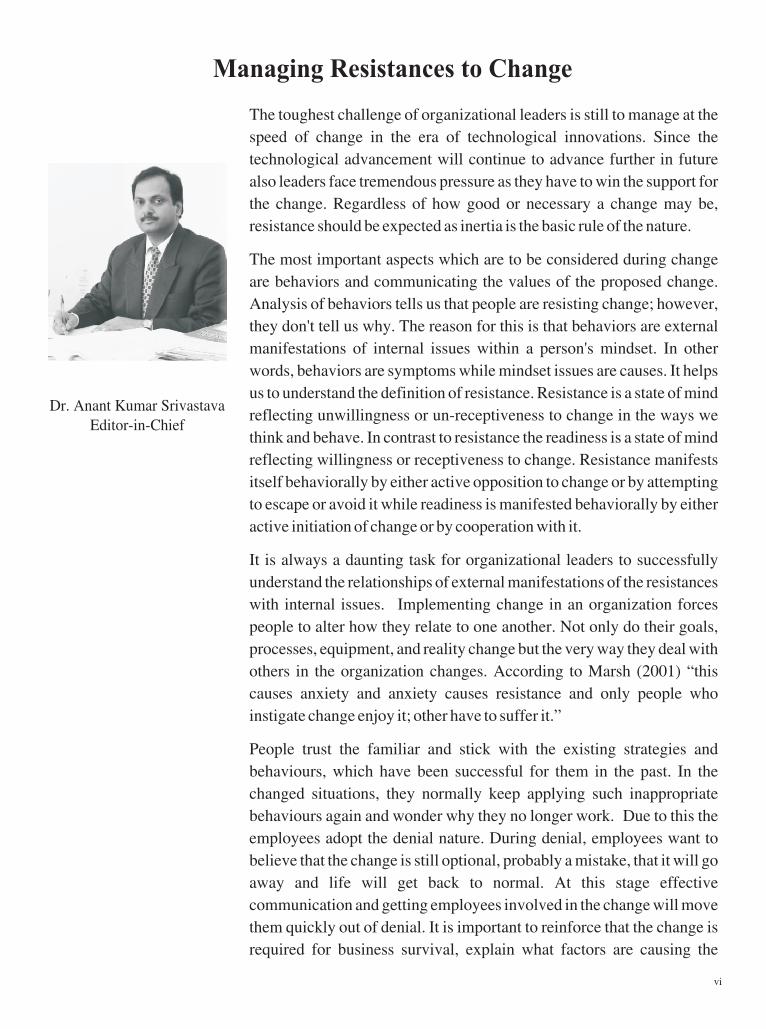
Managing Resistances to Change
Dr. Anant Kumar SrivastavaEditor-in-Chief
The toughest challenge of organizational leaders is still to manage at the
speed of change in the era of technological innovations. Since the
technological advancement will continue to advance further in future
also leaders face tremendous pressure as they have to win the support for
the change. Regardless of how good or necessary a change may be,
resistance should be expected as inertia is the basic rule of the nature.
The most important aspects which are to be considered during change
are behaviors and communicating the values of the proposed change.
Analysis of behaviors tells us that people are resisting change; however,
they don't tell us why. The reason for this is that behaviors are external
manifestations of internal issues within a person's mindset. In other
words, behaviors are symptoms while mindset issues are causes. It helps
us to understand the definition of resistance. Resistance is a state of mind
reflecting unwillingness or un-receptiveness to change in the ways we
think and behave. In contrast to resistance the readiness is a state of mind
reflecting willingness or receptiveness to change. Resistance manifests
itself behaviorally by either active opposition to change or by attempting
to escape or avoid it while readiness is manifested behaviorally by either
active initiation of change or by cooperation with it.
It is always a daunting task for organizational leaders to successfully
understand the relationships of external manifestations of the resistances
with internal issues. Implementing change in an organization forces
people to alter how they relate to one another. Not only do their goals,
processes, equipment, and reality change but the very way they deal with
others in the organization changes. According to Marsh (2001) “this
causes anxiety and anxiety causes resistance and only people who
instigate change enjoy it; other have to suffer it.”
People trust the familiar and stick with the existing strategies and
behaviours, which have been successful for them in the past. In the
changed situations, they normally keep applying such inappropriate
behaviours again and wonder why they no longer work. Due to this the
employees adopt the denial nature. During denial, employees want to
believe that the change is still optional, probably a mistake, that it will go
away and life will get back to normal. At this stage effective
communication and getting employees involved in the change will move
them quickly out of denial. It is important to reinforce that the change is
required for business survival, explain what factors are causing the
vi

change, focus on a clear goal, and institute robust two-way communication to deal with issues and
move people out of the denial phase. The suggested execution of plan for increasing the acceptance of
the proposed change consists of followings:
1. Encourage the employees to openly express their thoughts and feelings about the change
program
2. Listen carefully to their concerns, explore their fears, and take their comments seriously
3. Engage them in the planning and implementation processes.
4. Identify those who have something to lose, and anticipate how they might respond.
5. Help them find new roles either in your group or somewhere else in the organization. Such
roles must represent genuine contributions and mitigate their losses.
Dr. Anant Kumar Srivastava
vii

SHRI RAM MURTI SMARAK COLLEGE OF ENGINEERING & TECHNOLOGY
(Faculty of Management Science)
RNI No. : UPENG/2007/19207ISSN : 2231 - 0231
BIZCRAFT
SUBCRIPTION FORM
I wish to subscribe /renew my subscription of “BIZCRAFT” for 1 year/2 year/3 year for individual/ Academy/ Corporate/ Foreign
A bank draft/cheque, bearing no.:……………………………………………………………………...............….................
Dated worth Rs. / US $ :………………………………………………………………………………................…........….
Drawn in favour of “SRMSCET” payable at Bareilly (U.P.) is enclosed.
Name : ……………………………………………………………………… …………...….….……………..….....
Designation: …………………………………………………………………................…………………….........….…….
Address: ………………………………………………………………....……………………...................…………...……
………………………………………………………………………………………………………………………………
….…city :……………………… State:………………….…...country :………....…………Pin Code:……………………
E-mail : ………………….......……………… Phone:…………………....……….mobile:……………………..…………
……….
Mail the completed form along with the Bank Draft/Cheque to :
The Editor
Bizcraft
Faculty of Management Science
SRMS college of Engineering &Technology
Ram Murti Puram, 13 KM. Bareilly-Nainital Road
Bareilly-243202, Uttar Pradesh, India
Ph: 0581-2582246, 2582249, 2592331, 32 Fax 0581-2582330, E-mail: [email protected]
Please fill the form below (IN BLOCK LETTERS)
Subscription Rates
Subcription Rates* One year Two year Three Year
Individual 300/- 500/- 800/-
Academy/Corporate 500/- 800/- 1100/-
Foreign 50 $ 60 $ 80 $
viii
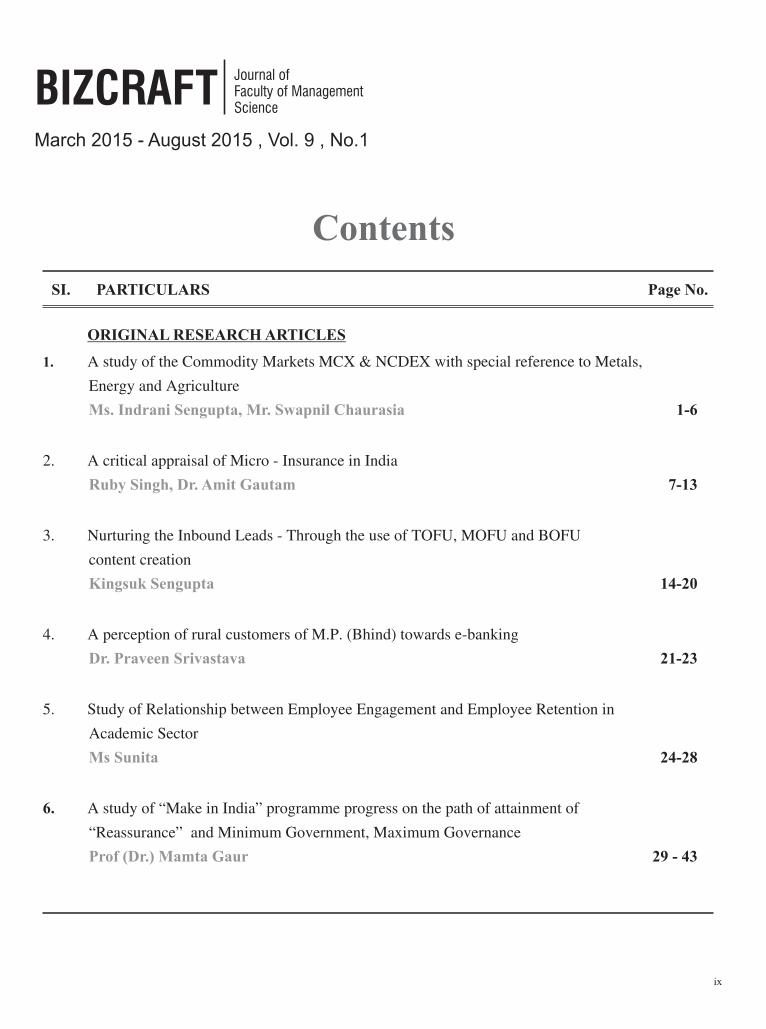
Contents
SI. PARTICULARS Page No.
ORIGINAL RESEARCH ARTICLES
1. A study of the Commodity Markets MCX & NCDEX with special reference to Metals,
Energy and Agriculture
1-6
2. A critical appraisal of Micro - Insurance in India
7-13
3. Nurturing the Inbound Leads - Through the use of TOFU, MOFU and BOFU
content creation
14-20
4. A perception of rural customers of M.P. (Bhind) towards e-banking
21-23
5. Study of Relationship between Employee Engagement and Employee Retention in
Academic Sector
24-28
6. A study of “Make in India” programme progress on the path of attainment of
“Reassurance” and Minimum Government, Maximum Governance
29 - 43
Ms. Indrani Sengupta, Mr. Swapnil Chaurasia
Ruby Singh, Dr. Amit Gautam
Kingsuk Sengupta
Dr. Praveen Srivastava
Ms Sunita
Prof (Dr.) Mamta Gaur
March 2015 - August 2015 , Vol. 9 , No.1
Journal of Faculty of Management Science
BIZCRAFT
ix

Research article
A STUDY OF THE COMMODITY MARKETS MCX & NCDEX WITH SPECIAL REFERENCE TO METALS,
ENERGY AND AGRICULTURE.
Ms. Indrani SenguptaAssistant ProfessorAuro University, [email protected]
Mr. Swapnil ChaurasiaAssistant ProfessorUka Tadsadia University,Bardoli, [email protected]
Abstract
Multi Commodity Exchange of India Limited (MCX) is a National Commodity Exchange with branches spread all over India facilitating online Futures trading, clearing and settlement in Commodities Futures. It offers around 40 Commodities in various sectors like Agriculture, Energy, Precious and Non Precious metals. It consists of group Indices i.e. Agriculture (MCX Agriculture), Bullion (MCX bullion), Metal (MCX Metal) and Energy (MCX Energy). In this paper an attempt is made to study the relationship between the commodity of metals (Aluminum and copper), energy (crude and natural gas), agriculture (cotton and rubber) with the general economic factor Inflation, Cost of dollar in terms of INR and GDP of the country. To show relationship statistical tool i.e. Pearson coefficient of correlation was used to analyze the data. The analysis of data revealed the relationship among the variable and factors that is low, moderate or high positive correlation and inverse or negative low, high and moderate correlation.
INTRODUCTION
For many years modern economies facing significant problem of overall increasing general price level. During which the value of monetary unit falls and decreases its purchasing power– so called inflation appears. Inflation affects not only the area of prices, but directly and indirectly it touches the various areas of economic and social life, causing many negative consequences for country’s economic development. Commodities prices are volatile as well as most of commodity exchanges are volatile and dynamic. It affects the domain of specific fields, such as agricultural economics. For many financial institutions worldwide commodity trading has become an important mean to gain profit. Commodities nowadays are an important component of many investors’ portfolios. One of the most influential factors affecting inflation rate is the price of production costs, from which mainly depends the final price of goods and services in a market. Therefore, the price changes of the most important commodities in the world’s. Multiple commodity exchange markets (MCX) influence the price of local producers or imported production. This paper analyses the influence of price changes of commodities to general price level in India. The aim of the research is to analyze the variation of general price level in India and change in the prices of commodities in the world commodity exchange markets, identify the influence of the price changes of commodities on variations of general factors as inflation, foreign exchange in terms of
Dollar and Gross Domestic Product of India as parameter. In order to achieve the aim Pearson’s coefficient of correlation analysis was used. It allows setting the relation and establishing the connection between price changes of commodities and general factors.
LITERATURE REVIEW
Jabir Ali, Kriti Bardhan Gupta, (2011) studied the long-term relationship between Futures and Spot Prices for the Agricultural Commodities like Maize, Chickpea, Black Lentil, Pepper, Castor Seed, Soybean and Sugar and found co-integration in the Futures and Spot prices. There was a short-term relationship between them and the Futures markets had ability to predict spot prices for Chickpea, Castor Seed, Soybean and Sugar. There was a bi-directional relationship in the short run among the Maize, Black Lentil and Pepper.
Kumar, B. (2009) in his study analyzed the relationship between futures trading activity and spot market volatility and assessed whether the futures trading in Indian commodity futures market stabilizes or destabilizes the spot market. The commodities for the study were Agricultural (includes Soyabean, Maize, Castorseed and Guarseed), Metal (includes Aluminium, Copper and Zinc), Precious Metal (includes Gold and Silver) and Energy (includes Crude Oil and Natural gas). For agricultural commodities Data of volume and open interest (hedging) are collected
FMS, SRMS College of Engg. & Tech. ( Bizcraft September 14 - February 15 Vol. 8, No.2 ) 1

from NCDEX and for Non–agricultural commodities MCX data was considered. The selection of exchange for selecting the futures contract is based on comparatively higher trading volume of a commodity at exchange.
Kenonrgios, D.F. & Aristeidis F. Samitas (2004), in their paper attempted to analyse the Joint Hypothesis of market efficiency and unbiasedness of futures prices for the Copper Futures contract traded on the London Metal Exchange. The long run efficiency of the Copper futures market is tested using both Engle-Granger Cointegration Tests and The Johansen Maximum Likelihood Procedure and short run efficiency is examined by constructing and investigating an Error Correction Model. Cointegration of two price series is a necessary condition for market efficiency and if the two series are cointegrated then the futures price is an unbiased predictor of the futures spot price.
The data consists of three-time series:
(i) Daily Copper Spot Prices.
(ii) Daily prices for the Copper Futures Contract with maturity three months
(iii) Daily prices for the Copper Futures Contract with maturity fifteen months.
The period of study is 3 January 1989 and 30 April 2000. The data are collected from the London Metal Exchange Archives. The results indicated that the spot prices and the fifteen months futures prices are not co-integrated. This could be due to the turbulence and increased Volatility characteristics of the Copper Futures Market during 1990’s, resulting to the presence of factors determining the Future Copper Spot prices that are not reflected in the futures prices of contracts with extensive expiration date. Since the co-integration is least, the fifteen months futures market is not efficient.
On the other hand, the co-integration hypothesis betweenthe three months Copper Futures prices and the relative spot prices is accepted and so the first necessary condition for market efficiency holds. However as far as long run and short run efficiency is concerned, the second and the third necessary condition do not hold. So the three months futures contact are also not efficient. The results concluded that the Copper Futures Market in London Metal Exchange is inefficient and the three and fifteen months of futures prices do not provide unbiased estimates of the future spot prices in both the long run and short run.
Kaur, G. and D.N. Rao (2010) in their study presented that much empirical research has been done for studying efficiency of stock markets in developed and developing countries. However not much research has been done on testing the efficiency of the commodity markets. Hence their paper attempts at testing the efficiency of commodity markets in India with reference to Agricultural Derivatives
traded on National Commodity Derivatives and Exchange (NCDEX).
Their study examined the Random Walk Hypothesis and tested the Weak form efficiency of the four major agricultural commodity futures traded on NCDEX using daily data of trading price for the period of 13 months. In their study they selected NCDEX as it is considered as prime national level commodity exchange for agricultural commodities. The time frame chosen for the study is the future contracts originating and expiring during the period July2008 to July 2009. They selected pepper, Malabar, Refined Soya Oil, Guar seed and Chana as they account for almost two- third of the volume and value of agricultural commodities traded on NCDEX. They analysed the 27 future contracts for the above four commodities for the period of study.
Two different statistical tools namely Autocorrelation test and Run test are used to test the efficiency of the agricultural commodity markets.
RESEARCH METHODOLOGY
The present study is conducted on multiple commodity exchange market in India. The study is descriptive and quantitative in nature. The literature and data are mainly based on secondary source, which has been collected from commodity market and their various reputed journals, research paper, through various internet sources. The various reports and records issues maintained by the Government of India (GOI) are also used in the study. There is only a single tool applied to values commodity market that is correlation. All the data are collected for ten years and on yearly basis.
OBJECTIVE
The basic objective of this study was
·To identify that the market fluctuation in the commodity market i.e. MCX are from the macroeconomic factor and are not specific to any region.
·Later on the study can be conducted by taking the global macroeconomic factor for finding that which factors are affecting the commodity market as global level.
CONDITIONS
1. MCX AGRI COMMODITY:
A1. Price of Rubber with Inflation.
A2. Price of Rubber with GDP
A3. Price of Rubber with Dollar.
A4. Price of Cotton with Inflation,
A5. Price of Cotton with GDP
A6. Price of Cotton with Dollar
FMS, SRMS College of Engg. & Tech. ( Bizcraft September 14 - February 15 Vol. 8, No.2 )2
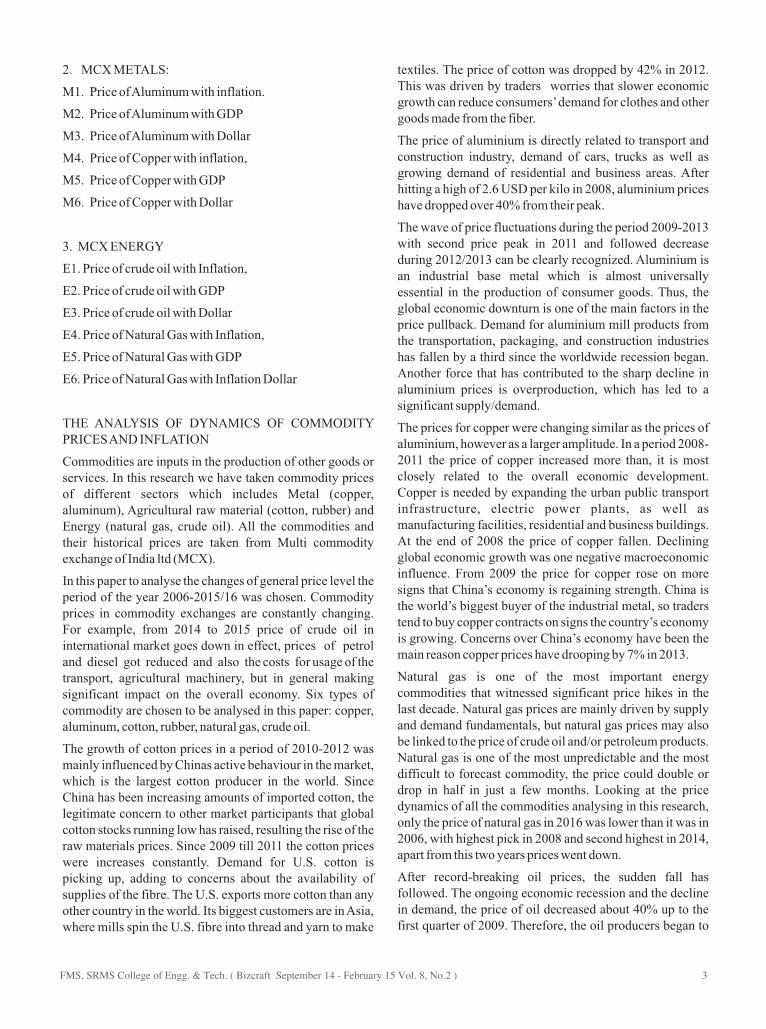
2. MCX METALS:
M1. Price of Aluminum with inflation.
M2. Price of Aluminum with GDP
M3. Price of Aluminum with Dollar
M4. Price of Copper with inflation,
M5. Price of Copper with GDP
M6. Price of Copper with Dollar
3. MCX ENERGY
E1. Price of crude oil with Inflation,
E2. Price of crude oil with GDP
E3. Price of crude oil with Dollar
E4. Price of Natural Gas with Inflation,
E5. Price of Natural Gas with GDP
E6. Price of Natural Gas with Inflation Dollar
THE ANALYSIS OF DYNAMICS OF COMMODITY PRICES AND INFLATION
Commodities are inputs in the production of other goods or services. In this research we have taken commodity prices of different sectors which includes Metal (copper, aluminum), Agricultural raw material (cotton, rubber) and Energy (natural gas, crude oil). All the commodities and their historical prices are taken from Multi commodity exchange of India ltd (MCX).
In this paper to analyse the changes of general price level the period of the year 2006-2015/16 was chosen. Commodity prices in commodity exchanges are constantly changing. For example, from 2014 to 2015 price of crude oil in international market goes down in effect, prices of petrol and diesel got reduced and also the costs for usage of the transport, agricultural machinery, but in general making significant impact on the overall economy. Six types of commodity are chosen to be analysed in this paper: copper, aluminum, cotton, rubber, natural gas, crude oil.
The growth of cotton prices in a period of 2010-2012 was mainly influenced by Chinas active behaviour in the market, which is the largest cotton producer in the world. Since China has been increasing amounts of imported cotton, the legitimate concern to other market participants that global cotton stocks running low has raised, resulting the rise of the raw materials prices. Since 2009 till 2011 the cotton prices were increases constantly. Demand for U.S. cotton is picking up, adding to concerns about the availability of supplies of the fibre. The U.S. exports more cotton than any other country in the world. Its biggest customers are in Asia, where mills spin the U.S. fibre into thread and yarn to make
textiles. The price of cotton was dropped by 42% in 2012. This was driven by traders worries that slower economic growth can reduce consumers’ demand for clothes and other goods made from the fiber.
The price of aluminium is directly related to transport and construction industry, demand of cars, trucks as well as growing demand of residential and business areas. After hitting a high of 2.6 USD per kilo in 2008, aluminium prices have dropped over 40% from their peak.
The wave of price fluctuations during the period 2009-2013 with second price peak in 2011 and followed decrease during 2012/2013 can be clearly recognized. Aluminium is an industrial base metal which is almost universally essential in the production of consumer goods. Thus, the global economic downturn is one of the main factors in the price pullback. Demand for aluminium mill products from the transportation, packaging, and construction industries has fallen by a third since the worldwide recession began. Another force that has contributed to the sharp decline in aluminium prices is overproduction, which has led to a significant supply/demand.
The prices for copper were changing similar as the prices of aluminium, however as a larger amplitude. In a period 2008-2011 the price of copper increased more than, it is most closely related to the overall economic development. Copper is needed by expanding the urban public transport infrastructure, electric power plants, as well as manufacturing facilities, residential and business buildings. At the end of 2008 the price of copper fallen. Declining global economic growth was one negative macroeconomic influence. From 2009 the price for copper rose on more signs that China’s economy is regaining strength. China is the world’s biggest buyer of the industrial metal, so traders tend to buy copper contracts on signs the country’s economy is growing. Concerns over China’s economy have been the main reason copper prices have drooping by 7% in 2013.
Natural gas is one of the most important energy commodities that witnessed significant price hikes in the last decade. Natural gas prices are mainly driven by supply and demand fundamentals, but natural gas prices may also be linked to the price of crude oil and/or petroleum products. Natural gas is one of the most unpredictable and the most difficult to forecast commodity, the price could double or drop in half in just a few months. Looking at the price dynamics of all the commodities analysing in this research, only the price of natural gas in 2016 was lower than it was in 2006, with highest pick in 2008 and second highest in 2014, apart from this two years prices went down.
After record-breaking oil prices, the sudden fall has followed. The ongoing economic recession and the decline in demand, the price of oil decreased about 40% up to the first quarter of 2009. Therefore, the oil producers began to
FMS, SRMS College of Engg. & Tech. ( Bizcraft September 14 - February 15 Vol. 8, No.2 ) 3

reduce the volumes of oil production. In late 2009, as the world economy started to recover and the demand of oil began to rise, the prices of oil recovered pretty fast and within a year had almost doubled, from 2.4 thousand inr per barrel in the 2009 to 4.8 thousand in per barrel in the 2011.
Price of rubber have been falling because of slowdown in automobile segment especially in truck and buses and at the same time there is increase in natural rubber production in context to India only. Apart from demand and supply, prices were also influenced by such factors like weather, currency exchange rate, oil prices, policy changes etc. the gap between global prices and Indian ones have widened, as Indian counters are much below the international benchmark. In November 2012, international prices were lower than the prices in the kochi and kottaym markets (productions regions) by Rs. 15/18 a kg. and that continuous till current season with declining prices.
The commodities which were chosen to be analysed in this paper constitute a significant part of total import of goods and services of India. After the 2011 the inflation rate constantly increased and in the 2009, 14.97 has reached the highest value around. During a period of 2011 inflation rate decreased and in the 2010 reached 1,3%. With the recovery of the economy, the prices changed correspondent to the situation and after the 2011 the rate of inflation rocket up again. In the period of 2011-2014 the rate of inflation decreased to a record level – slightly over 1%, due to the recession in some EU countries.
Real GDP growth or Gross Domestic Product (GDP) growth of India at constant (2011-12) prices in the year 2015-16 is estimated at 7.56 percent as compared to the growth rate of 7.24 percent in 2014-15. According to IMF World Economic Outlook (April-2016), GDP growth rate of India in 2015 is 7.336% and India is 9th fastest growing nation of the world. In 2014, India was 14th fastest growing nation of the world with GDP growth rate of 7.244%. Average growth rate from 1980 to 2014 stands at 6.27%, reaching an all-time high of 10.26% in 2010 and a record low of 1.06% in the 1991.
Typically, there is an inverse relationship between the value of the dollar and commodity prices. When the dollar strengthens against other major currencies, the prices of commodities tend to drop. When the value of the dollar weakens against other major currencies, the prices of commodities generally move higher. There were incidents when dollar fall twice 2008 and 2011 when there was scope for commodities to move up
.Summarizing the analysis of dynamic of commodity prices in a period of 2006-2016, it can be assumed that the prices of commodities are very sensitive to the changes of market conditions. In addition, the prices of mostly all analysed commodities grew or be constant from 100% to more than
300% in the period of 2006-2016. It was determined that only the price of natural gas in 2012 was lower than it was in 2006. The significant changes of commodity prices in world commodity exchanges could have an impact for prices changes of final goods and services in India. The research of the dependence and the results of it are presented in the next chapter.
THE EVALUATION OF IMPACT OF COMMODITY PRICES CHANGES TO GDP, INFLATION AND DOLLAR PRICES IN INDIA.
As it was mentioned in the beginning, the aim of this paper is to investigate if the influence of changes of commodity price level in the Multi commodity exchanges makes significant impact on the Indian general price level fluctuations. If the following findings show that the influence is significant, the dependency expression will be found. To identify the influence of changes of commodity price level on general price level a correlation analysis will be used. Will be identified the dependence between Y (the rate of inflation, Dollar price and GDP of India) and selected factors
1 Metal [copper(X1), aluminium(X2)]
2 Agricultural raw material [rubber(X3), cotton(X4)]
3 Energy [natural gas(X5), crude oil(X6)]
4 Now, independent factors which are economical/ macroeconomic factors:
5 GDP (Y1)
6 Inflation (Y2)
7 Dollar price (Y3)
H0 There is a negative or no correlation between the variables (Xn) and factors (Yn)
H1 There is a positive correlation between variables (Xn) and factors (Yn)
H0 There is a negative or no correlation between the Copper (X1) and GDP (Y1)
H1 There is a positive correlation between variables Copper (X1) and GDP (Y1)
H0 There is a negative or no correlation between the Copper (X1) and Inflation (Y2)
H1 There is a positive correlation between variables Copper (X1) and Inflation (Y2)
H0 There is a negative or no correlation between the Copper (X1) and Dollar (Y3)
H1 There is a positive correlation between variables
FMS, SRMS College of Engg. & Tech. ( Bizcraft September 14 - February 15 Vol. 8, No.2 )4
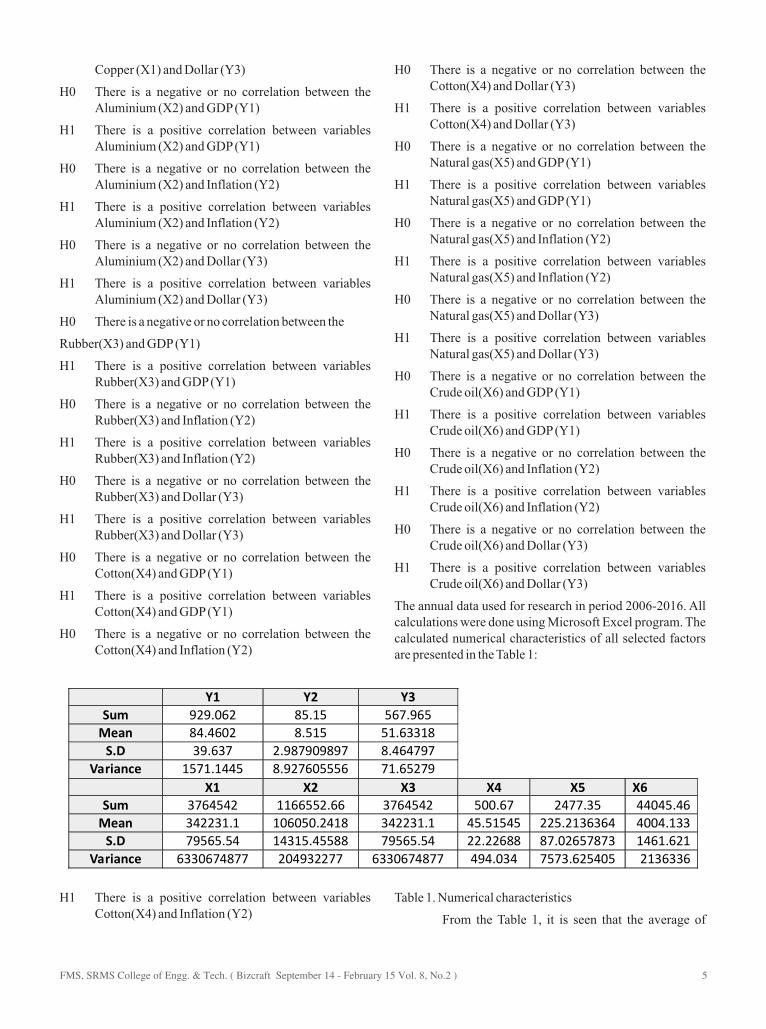
Copper (X1) and Dollar (Y3)
H0 There is a negative or no correlation between the Aluminium (X2) and GDP (Y1)
H1 There is a positive correlation between variables Aluminium (X2) and GDP (Y1)
H0 There is a negative or no correlation between the Aluminium (X2) and Inflation (Y2)
H1 There is a positive correlation between variables Aluminium (X2) and Inflation (Y2)
H0 There is a negative or no correlation between the Aluminium (X2) and Dollar (Y3)
H1 There is a positive correlation between variables Aluminium (X2) and Dollar (Y3)
H0 There is a negative or no correlation between the
Rubber(X3) and GDP (Y1)
H1 There is a positive correlation between variables Rubber(X3) and GDP (Y1)
H0 There is a negative or no correlation between the Rubber(X3) and Inflation (Y2)
H1 There is a positive correlation between variables Rubber(X3) and Inflation (Y2)
H0 There is a negative or no correlation between the Rubber(X3) and Dollar (Y3)
H1 There is a positive correlation between variables Rubber(X3) and Dollar (Y3)
H0 There is a negative or no correlation between the Cotton(X4) and GDP (Y1)
H1 There is a positive correlation between variables Cotton(X4) and GDP (Y1)
H0 There is a negative or no correlation between the Cotton(X4) and Inflation (Y2)
H1 There is a positive correlation between variables Cotton(X4) and Inflation (Y2)
H0 There is a negative or no correlation between the Cotton(X4) and Dollar (Y3)
H1 There is a positive correlation between variables Cotton(X4) and Dollar (Y3)
H0 There is a negative or no correlation between the Natural gas(X5) and GDP (Y1)
H1 There is a positive correlation between variables Natural gas(X5) and GDP (Y1)
H0 There is a negative or no correlation between the Natural gas(X5) and Inflation (Y2)
H1 There is a positive correlation between variables Natural gas(X5) and Inflation (Y2)
H0 There is a negative or no correlation between the Natural gas(X5) and Dollar (Y3)
H1 There is a positive correlation between variables Natural gas(X5) and Dollar (Y3)
H0 There is a negative or no correlation between the Crude oil(X6) and GDP (Y1)
H1 There is a positive correlation between variables Crude oil(X6) and GDP (Y1)
H0 There is a negative or no correlation between the Crude oil(X6) and Inflation (Y2)
H1 There is a positive correlation between variables Crude oil(X6) and Inflation (Y2)
H0 There is a negative or no correlation between the Crude oil(X6) and Dollar (Y3)
H1 There is a positive correlation between variables Crude oil(X6) and Dollar (Y3)
The annual data used for research in period 2006-2016. All calculations were done using Microsoft Excel program. The calculated numerical characteristics of all selected factors are presented in the Table 1:
Table 1. Numerical characteristics
From the Table 1, it is seen that the average of
Y1 Y2 Y3 Sum 929.062 85.15 567.965
Mean 84.4602 8.515 51.63318 S.D 39.637 2.987909897 8.464797
Variance 1571.1445 8.927605556 71.65279 X1 X2 X3 X4 X5 X6
Sum 3764542 1166552.66 3764542 500.67 2477.35 44045.46 Mean 342231.1 106050.2418 342231.1 45.51545 225.2136364 4004.133
S.D 79565.54 14315.45588 79565.54 22.22688 87.02657873 1461.621 Variance 6330674877 204932277 6330674877 494.034 7573.625405 2136336
FMS, SRMS College of Engg. & Tech. ( Bizcraft September 14 - February 15 Vol. 8, No.2 ) 5
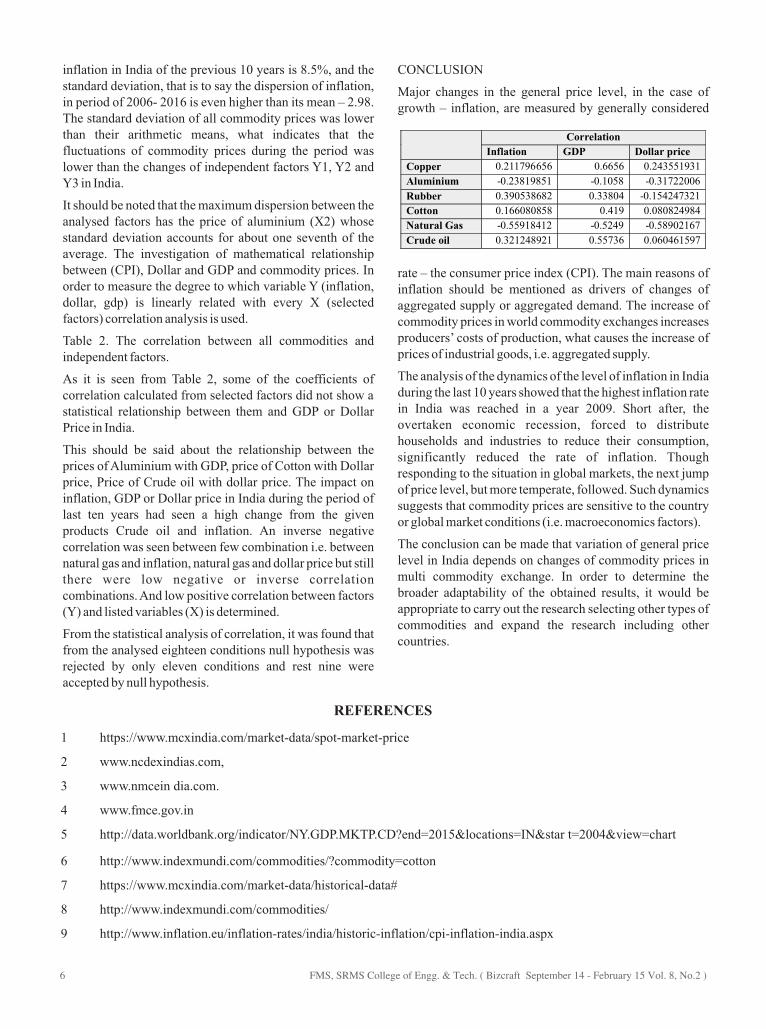
inflation in India of the previous 10 years is 8.5%, and the standard deviation, that is to say the dispersion of inflation, in period of 2006- 2016 is even higher than its mean – 2.98. The standard deviation of all commodity prices was lower than their arithmetic means, what indicates that the fluctuations of commodity prices during the period was lower than the changes of independent factors Y1, Y2 and Y3 in India.
It should be noted that the maximum dispersion between the analysed factors has the price of aluminium (X2) whose standard deviation accounts for about one seventh of the average. The investigation of mathematical relationship between (CPI), Dollar and GDP and commodity prices. In order to measure the degree to which variable Y (inflation, dollar, gdp) is linearly related with every X (selected factors) correlation analysis is used.
Table 2. The correlation between all commodities and independent factors.
As it is seen from Table 2, some of the coefficients of correlation calculated from selected factors did not show a statistical relationship between them and GDP or Dollar Price in India.
This should be said about the relationship between the prices of Aluminium with GDP, price of Cotton with Dollar price, Price of Crude oil with dollar price. The impact on inflation, GDP or Dollar price in India during the period of last ten years had seen a high change from the given products Crude oil and inflation. An inverse negative correlation was seen between few combination i.e. between natural gas and inflation, natural gas and dollar price but still there were low negative or inverse correlation combinations. And low positive correlation between factors (Y) and listed variables (X) is determined.
From the statistical analysis of correlation, it was found that from the analysed eighteen conditions null hypothesis was rejected by only eleven conditions and rest nine were accepted by null hypothesis.
CONCLUSION
Major changes in the general price level, in the case of growth – inflation, are measured by generally considered
rate – the consumer price index (CPI). The main reasons of inflation should be mentioned as drivers of changes of aggregated supply or aggregated demand. The increase of commodity prices in world commodity exchanges increases producers’ costs of production, what causes the increase of prices of industrial goods, i.e. aggregated supply.
The analysis of the dynamics of the level of inflation in India during the last 10 years showed that the highest inflation rate in India was reached in a year 2009. Short after, the overtaken economic recession, forced to distribute households and industries to reduce their consumption, significantly reduced the rate of inflation. Though responding to the situation in global markets, the next jump of price level, but more temperate, followed. Such dynamics suggests that commodity prices are sensitive to the country or global market conditions (i.e. macroeconomics factors).
The conclusion can be made that variation of general price level in India depends on changes of commodity prices in multi commodity exchange. In order to determine the broader adaptability of the obtained results, it would be appropriate to carry out the research selecting other types of commodities and expand the research including other countries.
Correlation
Inflation GDP Dollar price
Copper 0.211796656 0.6656 0.243551931
Aluminium -0.23819851 -0.1058 -0.31722006
Rubber 0.390538682 0.33804 -0.154247321
Cotton 0.166080858 0.419 0.080824984
Natural Gas -0.55918412 -0.5249 -0.58902167
Crude oil 0.321248921 0.55736 0.060461597
REFERENCES
1 https://www.mcxindia.com/market-data/spot-market-price
2 www.ncdexindias.com,
3 www.nmcein dia.com.
4 www.fmce.gov.in
5 http://data.worldbank.org/indicator/NY.GDP.MKTP.CD?end=2015&locations=IN&star t=2004&view=chart
6 http://www.indexmundi.com/commodities/?commodity=cotton
7 https://www.mcxindia.com/market-data/historical-data#
8 http://www.indexmundi.com/commodities/
9 http://www.inflation.eu/inflation-rates/india/historic-inflation/cpi-inflation-india.aspx
FMS, SRMS College of Engg. & Tech. ( Bizcraft September 14 - February 15 Vol. 8, No.2 )6
Research article
A CRITICAL APPRAISAL OF MICRO-INSURANCE IN INDIA
Ruby SinghResearch Scholar,
Faculty of Management Studies, BHU.
Dr. Amit GautamAssistant Professor,
Faculty of Management Studies, BHU.
Abstract
Micro-Insurance in India is mounting day by day. It is vital to indicate
interest within the social uplift particularly, the weaker section of the society or
low income persons. Micro-Insurance provides such an opportunity to possess
inclusive growth within the country. This study outlines the potential ways in
which application of Micro-Insurance investment for social implications. This
paper attempts to study the contribution of micro insurance business towards
economic development and additionally the social implication of the micro
Insurances.
This research paper relates to meet the financial requirement of the capital
industries and particularly Micro-Insurance Industry to larger society on its fold
by working out certain strategy to encourage the low income group for
investment opportunity.
This paper widens the future scope for further studies, as it will be able to provide
relevant existing data on the current status of the Micro Insurance investment in
India and assist the company to tap low income group and mobilize all the
segments of market.
There is also a huge discussion and debate on the social responsibilities of
corporate business houses. Many criticize that the corporate world in India is not
showing social responsibilities particularly in the field of investment by the
poorest of the poor of this country.
Keywords: Micro-Insurance, Social Implication, Prospects, India.
INTRODUCTION
Low-income persons survive in risky environments, at risk of varied perils, as well as health problem, accidental death and incapacity, loss of property owing to thieving or hearth, agricultural losses, and disasters of each the natural and manmade varieties. The poor are additional at risk of several of those risks than the remainder of the population, and that they are the smallest amount able to cope once a crisis will occur.
Peters et al. (2002), remarked that about one-fourth of hospitalized Indians fall below the poverty line as a result of their stay in hospitals. The same study reports that more than 40 percent of hospitalized patients take loans or sell assets to pay for hospitalization.
Micro-Insurance is Insurance merchandise that
provides coverage to low-income families. A small insurance put together and offers safe guard to in habitants with the intention that have exceptionally petitere serves and made to order exclusively designed for poorer peoples as well as their valuable chattels and indemnified against specific perils as illness, injuries or death.
Micro-Insurance is the security of low financial gain households against particular risk or hazard in exchange for premium costs proportionate to the chance and price of the risk concerned. It's particularly intended for the safety of low financial gain individuals with cheap insurance product to assist them deal with and pass though common risk. A key strategy for enhancing economic development and
FMS, SRMS College of Engg. & Tech. ( Bizcraft September 14 - February 15 Vol. 8, No.2 ) 7
assuaging poorness is to form monetary systems additional comprehensive, as an example by rising access to savings and credit services for up and under-served markets. In part, poorness stems from the very fact that low-income households and markets don't have an equivalent opportunity to finance investments accumulate capital or secured assets (including human chattels).
The poorest sections don't continuously take pleasure in the contribution, whereas people that will afford insurance usually notice ways in which to access these edges. In general, governments have created very {little} effort to shift the burden of risk-pooling to market-led schemes; and therefore the personal sector (commercial insurers) looks to own little incentive to hunt out this market section. In essence, micro-insurance works like several typical insurance businesses. However, thereopen areas or accessibility determine many things that differentiate it from traditional insurance. First, it's insurance which will cowl thousands of consumers underneath one contract. Second, micro-insurance needs an associatebetween the consumers and insurance providers.
The UNDP report has analyzed six key issues pertinent to the growth of the Micro-Insurance industry in India, capturing the concerns of different stakeholders as indicated below:
I. There are specific reasons for low demand for insurance in spite of intense need. Suppliers have their own concerns which help to explain why there have been so little efforts at market development. Consequently, the rural market is characterized by limited and inappropriate services, inadequate information and capacity gaps.
II. There are challenges in product design, which has resulted in a mismatch between needs and standard products on offer. Efforts at product development / diversification have been limited.
III. Pricing, including willingness to pay and the availability of subsidies, influence the market. In the absence of a historical data base on claims, premium calculations are based on remote macro aggregates and overcautious margins. Building and sharing claims histories can help in aligning
pricing decisions with actuarial calculations, thereby reducing prices.
IV. Difficulty in distribution is one of the most cited reasons for absence of rural insurance. The high costs of penetrating rural markets, combined with underutilization of available distribution channels, hinder the growth of rural insurance services. This adds to costs, both, managerial and financial. Like Inclusive credit, inclusive insurance is expected to be a “low ticket” business, requiring volumes for viability.
V. Cumbersome and inappropriate procedures inhibit the development of this sector.
VI. Contrasting perspectives of the insured and the insurers, lead to low customization of products and low demand for what is available.
OBJECTIVES OF THE STUDY
?? To determine the contribution of Micro-Insurance
industry towards the economic development and also inquired about the publicparticipation in micro insurance investment.
?? To study the knowledge of investors about micro
insurance investment.
?? To distinguish the income that is invested in Micro
Insurance investment.
?? To analyzethe investors awareness regarding
Micro-Insurance offers lesser risk as compare to other direct investment options.
?? To demonstratethe investors perception towards
benefit of Micro-Insurance industry.
?? To find out the investors awareness regarding
Micro-Insurance scheme.
HYPOTHESES OF THE STUDY
?? Investors are not aware about Micro-Insurance
scheme.
?? There is no minimum amount that can invest in
Micro-Insurance investment.
?? Investors' perception towards the Micro-Insurance
as the best investment plan.
?? Micro-Insurance has lesser risk option then other
direct investment.
FMS, SRMS College of Engg. & Tech. ( Bizcraft September 14 - February 15 Vol. 8, No.2 )8
LITERATURE REVIEW
In reality, every individualon the globedesires a level of security against hazards, as well ascover uptheeffects that may perhapsbreak downthe poor lives. In emerging countries in particular, families and diminutive businesses repeatedlyexperience greater risks (e.g. because of natural calamities) in comparison of urbanized countries. At the same time, social insurance is repeatedly very weak in underprivilegedcountries, so people only have themselves or their families to rely on for any kind of protection.
Devaux(2000) noted that Micro-Insurance enables credit and savings to be used more productively on generating employment opportunities.
Wiedmaier-Pfister (2004) revealed that a number of clarifications are important for the insurers.The first point relates to the delineation of social protection schemes (government driven and “provided” to the poorest), and privately, market-led insurance services (provided by a private insurer or informally organized and “bought” by those who can afford them). The second point relates to the role of reinsurance, which is definitively a crucial area for micro-insurance. Third, the history and experiences of the regulation and supervision of “micro-insurance” in industrialized countries could also not be considered.
Churchill (2006) defined Micro-Insurance as a financial arrangement to protect low income people against specific perils in exchange for regular premiums payments proportionate to the likelihood and cost of the risk involved.
Banerjeen (2008) documented that Micro-Insurance policy offers protection against a set of pre-determined risks relating primarily to business, health, agriculture and life. But in the micro insurance sphere, the target market is specific; low insurance communities where people live on less than US $ 2 a day according to a group of which pools together its risk and prepaid contributions rather than to the individual, as in the case with conventional insurance. Contributions or Premium are typically small and paid frequently, suiting the paying capacity of these communities. He further adds that poling into a risk fund offers on affordable way for low income people to be protected against vulnerability to further economic hardship caused by exposure to such as livestock, crops and tools due to natural calamities such as drought,
flooding and earthquake illness and debilitating disease, death and widowhood.
Linnerooth–Bayer,Mechler and Pepiat(2006)opined that Micro-Insurance can break the cycle ofpoverty” by providing low-income households, business and farmers with aces to postdisaster liquidity, thus protect their livelihoods and providing for reconstruction. Therefore, insured households and firms are more credit worthy; these kinds of insurance can also promote investments in productive assets and higher risk yield crops. They emphasize that micro insurance can encourage investment in disaster prevention, if insurers offer lower premiums to reward risk reducing behaviors. Thus, arguably, micro-insurance can be seenas effective risk - transfer mechanism and integral part of overall disaster risk management strategy.
Ganesan andJayaprakash (2007) about Micro Banc assurance Models for India suggest that the growth of micro insurance in India does not lies only in the hands of the product design, distribution network but also in creating the proper infrastructure that can support the servicing of insurance policies. India is a very big country with villages as its backbones. Enormous involvement of various stakeholders is required to create proper infrastructure for the growth of insurance/micro insurance in the rural areas. He stresses the need for viewing the banks not as a mere distribution channel for insurance but to convert the same into a strategic business unit wherein the banks will be the epicenter of operations for the growth of the infrastructure in the rural.
Roth, McCord and Libber (2007) presented a report which gives a description about the functioning of Micro-Insurance and detailed quantities overview of micro insurance in world's 100 poorest countries in which he explains about distribution channels, types of micro insurers and various micro insurance products, regulation and social security schemes in 100 countries including India.
Churchill (2008) viewed that poverty is just a state of deprivation but has talent vulnerability Micro-Insurance should therefore, provide greater economic and psychological security to the poor as it reduces exposure to multiple risks and cushions the impact of a disaster. There is an overwhelming demand for social protection among the poor, micro insurance in conjunction with micro saving and micro credit could, therefore go a long way in keeping this segment away
FMS, SRMS College of Engg. & Tech. ( Bizcraft September 14 - February 15 Vol. 8, No.2 ) 9
from the poverty trap and would truly be an integral component of financial inclusion.
Malika and Kuriakose (2008) discussed the role of Micro-Insurance in mitigating external shocks on poor household. He also stressed on careful attention and expert technical input is required in designing micro insurance products and programs as they are significantly more complex than and credit programs offered by different organizations. Use of different risk layering using different form of reinsurance to cover the insurer is crucial from a financial sustainability standpoint, and the use of various outreach mechanism to reach poor household is necessary from an equity point of view.
McCord (2008) suggested many inputs required to reach Micro-Insurance to billions of poor people's some of these inputs are - Coordination of knowledge of activities to allow all parties- mutual's, commercial insurers, intermediaries and delivery channels, governments, donors, and others—to maximize effectiveness, Improving products and processes that recognize the needs of low-income families and satisfy their needs with value, Innovation in processes that can be replaced or augmented by technology. This requires financial and regulatory facilitation, and an openness to offer such technology on a public platform, Careful development of regulation that effectively balances the need for consumer protection with the flexibility needed to develop and service a massive market.
Pierre (2008) presents an general idea of Christian Aid awareness in harvest/ climate Micro-Insurance (MI) as well as partners involvement in micro-insurance related products and services” in his research he found that majority of people interviewed (85%) believe crop/weather insurance would help poor farmers in managing weather risks and this percentage rises to 100 % for interviewees based in field. For most respondents conditions for successful MI would be the presence of empowered communities and the absence of conflict, while protection to different categories of poor (not only farmers but also landless and marginalized past oralist communities) makes weather insurance more appealing than traditional crop insurance.
Tomchin sky (2008) opined that consumer education,
marketing and grievance handling will certainly improve Micro-Insurance schemes. He cited that the micro insurance sector is unique in the sense that there is an ongoing challenge to explain the concept and benefits to the insured. Creating awareness through use of pictorial posters, local folk arts and street treaties might be useful to explain the mechanisms of insurance. Local community based organizations could organize premium collection, as they have better access to the local people. To make it more acceptable to the people micro insurance products, apart from covering only risks should also provide an opportunity for providing long term savings (endowment).
Werner (2009) analyses micro-insurance schemes in Bangladesh with contrasting examples from India and found that these plans are covers the issues related with the physical condition of deprived peoples and as well it lessen paucity, these micro insurance plans had abridged the hurdles related to health services for deprived and supported them to utilize the clinic facilities and skilled medicin altre at ment i.e. the micro-insurance schemes for health in Bangladeshi have increased access to basic healthcare , However, there is both demand and necessity for surgeries and more expensive medical procedures among the poor that remains unaddressed by basic micro insurance for health. Micro-Insurance can provide the benefits to meager peoples by means of risk-sharing to deal with erratic employment, proper movement of revenues, and disastrous actions. Professional management, product development, management information systems, and re-insurance these are the measures that have to be implemented by the micro insurance provider's for the protection of the chattels and safety of the poor.
COLLECTION OF DATA
The study is based on primary as well as secondary sources of data. For the primary data collection a structured questionnaire is being used to receive the required information for analysis of hypothesis.
As regarding secondary data, these is collected through published information in various journals of professional institutes, newspaper and the articles and books written by several eminent authors. The data structure for the study also based on official publications.
FMS, SRMS College of Engg. & Tech. ( Bizcraft September 14 - February 15 Vol. 8, No.2 )10
SOCIAL IMPLICATION OF MICRO INSURANCE INVESTMENT
Social participation in the micro-insurance market is an important for the overall growth of the nation. Otherwise, there would be a huge gap between the haves and haves not's, as it has happened in the nations all the time. It is the responsibility of a nation to include people from all spheres of the society in inclusive growth and for which Micro-Insurance will be a media or social instrument through which it can be achieved. For the above said purpose, Micro-Insurance by the nature of some advantage.
One need not be an expert in the micro-insurance market to invest money into Micro-Insurance. And in depth knowledge is not required along with the other
investment strategies for participation in the micro insurance industry. In addition, one may not need huge sums of money to be an investor in the micro insurance scheme with a little savings. Hence the Micro-Insurance investment can be utilized effectively for the social implication.
There is also a huge discussion and debate on the social responsibility of corporate business houses. Many criticize that the corporate world in India not showing social responsibility particularly in the field of investment by the poor of this country. Socially responsible investment decisions by some of the insurance managers are being taken in India too, however, we are stressing the need of the industry to include people of all spheres in its fold and encourage all types of people to invest and make some profits.
BENEFITS OF INVESTING IN A MICRO-INSURANCE
Financial protection
It provides financial protection to the weaker section of the society by granting loans and protection against sickness and uncertain losses to the lives in
consideration of a small amount of premium.
Reduce risk
Micro insurance can play a critical role in reducing risk, since insurers have an incentive to prevent risks from occurring.
Stimulate productivity and asset accumulation
The working poor invest more in their livelihoods, and get higher returns, if they are protected by insurance. They can also build savings through a long-term life insurance policy.
Better access to health care
High and poor families, sick and healthy people contribute micro insurance schemes. The micro insurance institution is a device of social justice. The system works best for the most vulnerable people who would otherwise have no real access to the health care system.
Deliver tangible benefits
Insurance with tangible benefits, such as a hot line for medical advice or health camps that provide vaccinations and mosquito nets, can make a huge difference in the lives of millions.
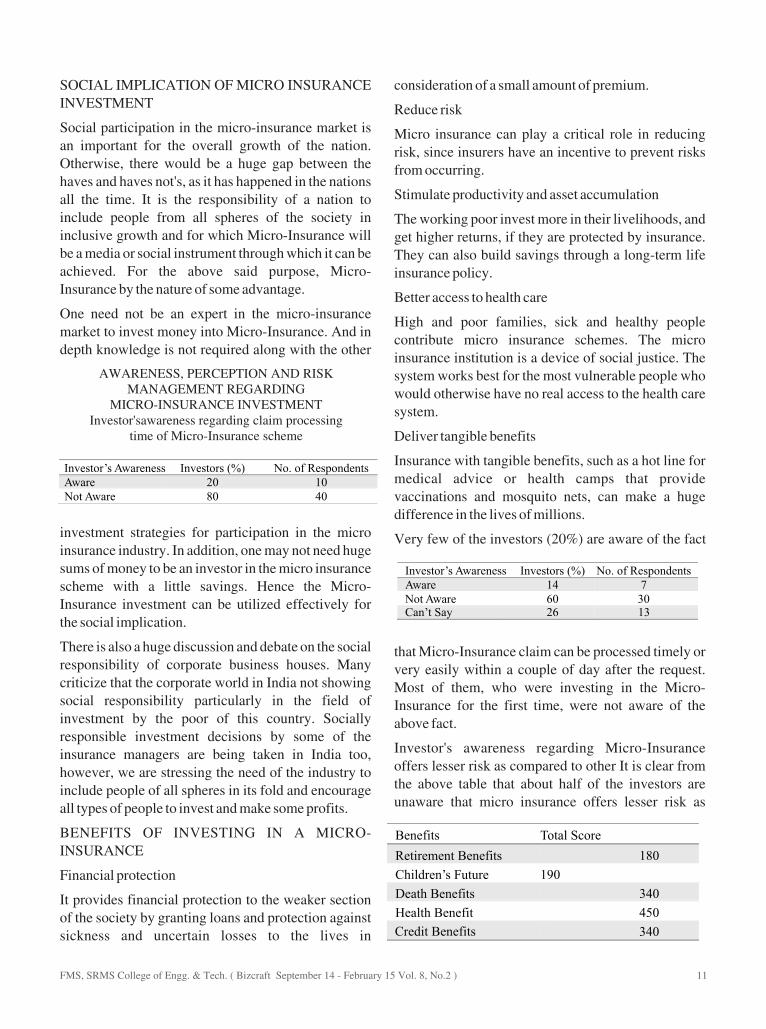
Very few of the investors (20%) are aware of the fact
that Micro-Insurance claim can be processed timely or very easily within a couple of day after the request. Most of them, who were investing in the Micro-Insurance for the first time, were not aware of the above fact.
Investor's awareness regarding Micro-Insurance offers lesser risk as compared to other It is clear from the above table that about half of the investors are unaware that micro insurance offers lesser risk as
AWARENESS, PERCEPTION AND RISK MANAGEMENT REGARDING
MICRO-INSURANCE INVESTMENTInvestor'sawareness regarding claim processing
time of Micro-Insurance scheme
Investor’s Awareness Investors (%) No. of RespondentsAware 20 10Not Aware 80 40
Investor’s Awareness Investors (%) No. of RespondentsAware 14 7Not Aware 60 30Can’t Say 26 13
Benefits Total Score
Retirement Benefits 180
Children’s Future 190
Death Benefits
340
Health Benefit
450
Credit Benefits
340
FMS, SRMS College of Engg. & Tech. ( Bizcraft September 14 - February 15 Vol. 8, No.2 ) 11
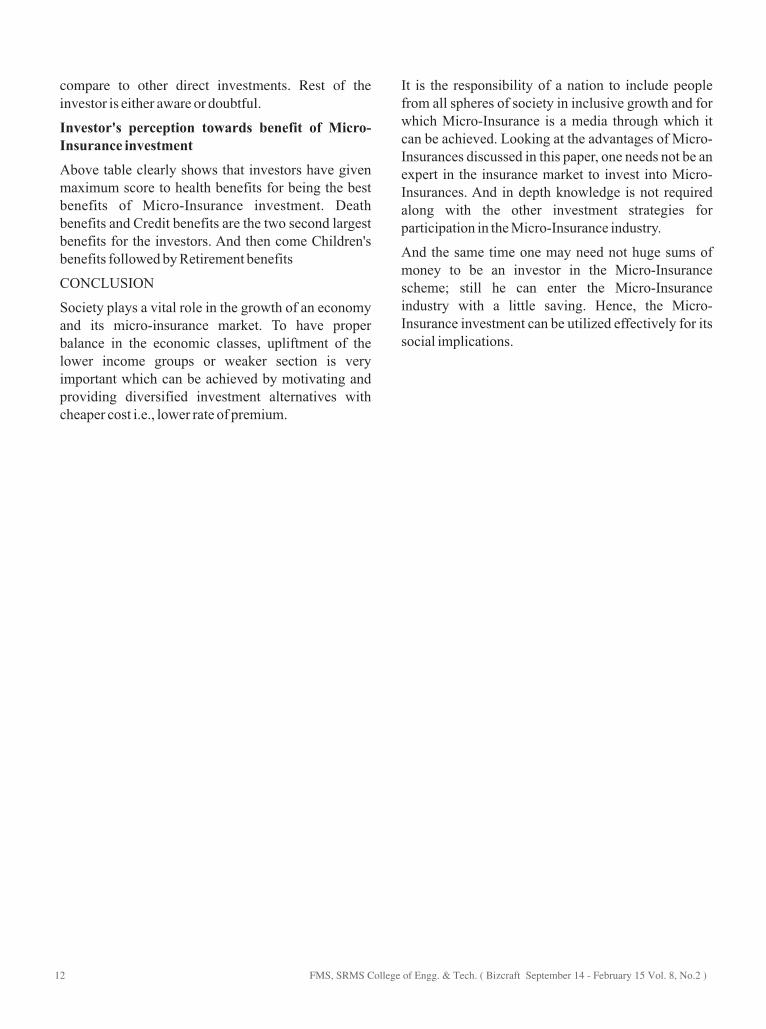
compare to other direct investments. Rest of the investor is either aware or doubtful.
Above table clearly shows that investors have given maximum score to health benefits for being the best benefits of Micro-Insurance investment. Death benefits and Credit benefits are the two second largest benefits for the investors. And then come Children's benefits followed by Retirement benefits
CONCLUSION
Society plays a vital role in the growth of an economy and its micro-insurance market. To have proper balance in the economic classes, upliftment of the lower income groups or weaker section is very important which can be achieved by motivating and providing diversified investment alternatives with cheaper cost i.e., lower rate of premium.
Investor's perception towards benefit of Micro-Insurance investment
It is the responsibility of a nation to include people from all spheres of society in inclusive growth and for which Micro-Insurance is a media through which it can be achieved. Looking at the advantages of Micro-Insurances discussed in this paper, one needs not be an expert in the insurance market to invest into Micro-Insurances. And in depth knowledge is not required along with the other investment strategies for participation in the Micro-Insurance industry.
And the same time one may need not huge sums of money to be an investor in the Micro-Insurance scheme; still he can enter the Micro-Insurance industry with a little saving. Hence, the Micro-Insurance investment can be utilized effectively for its social implications.
FMS, SRMS College of Engg. & Tech. ( Bizcraft September 14 - February 15 Vol. 8, No.2 )12
REFERENCES
1. Balkenhol, B.,& Churchill, C.(2002). “From microfinance to micro-health insurance” in Dror, D. and A. Preker
(eds.), Social Re-insurance: A New Approach to Sustaining Community Health Financing. Washington,
DC:ILO/World Bank, www.ilo.org/socialre.
2. Banarje, A. (2008). Technology indispensable in marketing micro insurance Acesible, in Asia insurance review,
online portal of 3I Infotech. Retrieved on 12/07/2014 by 18:0pm. www.asiainsurancereview.com.
3. Bhat, R.,& Jain, N. (2006).“Factoring affecting the demand for health insurance in a micro insurance scheme.”
4. Churchill, C. (2006). Protecting the Por: A Micro insurance Compendium. Geneva: ILO. (2007). Insurance in the low
income market: Chalenges and Solutions for Commercial Insurers. Geneva, papers on risks and insurance. Vol. 32, Is
3, P. 401 – 412.(2008) “Micro Insurance Context and Oportunites” A Paper presented at Micro insurance Round
table, Held at AdisAdaba, Ethopia: ILO. October.
5. Deliya, M., Patel, Dr. K., &Parmar, B. (2012). Awareness of Micro Insurance Product InPatan District. Abhinav
Journal, 1(5), 16- 35. Retrieved from http://www.abhinavjournal.com/images/Commerce_
&_Management/May12/3.pdf.
6. Devaux, P. (2000). Credit and Investment in rural areas of LDCs: Micro-finance News Letter Issue No7 Pg. 9-10
January-March 2000.
7. Ganesan, Dr. S.,&Jayaprakash, Dr. S. (2007).“Micro Bancassurance Models for India.”Rmi.nccu. Proc. of Eleventh
Annual APRIA Conference, National Chengchi University, Taipei. 2007. Web. 27 Nov. 2008.
<ww.rmi.nccu.edu.tw/.. . /15207Micro%20Banc%20assurance%20Models%20for%20India-%...>
http://www.icrier.org/pdf/wp162.pdf.
8. Lineroth - Bayer, J.,Mechler, R.,&Pepiat, D. (2006).“Disaster Insurance for the Poor? A Review of Micro Insurance
for National Disaster Risks in Developing Countries” A prevention /IASA study sponsored by IFRC.
9. Mohammed, A. H., &Mukhtar, S. (2012).“The Prospects of Micro - Insurance in the Rural Areas of Nigeria.”
European Scientific Journal Vol. 8, .No. 3: 66-76. http://eujournal.org. Web. 1 July 2014.
10. “Potential and Prospects of Microinsurance in India; UNDP Regional Centre of Human Development Unit 2009,
“Pension Reforms for Unorganised Sector; ADB, 2006 and IIMS DataWorks Survey 2008.
11. Roth, J., McCord, Michael. J., & Liber, D. (2007). “The landscape of microinsurance in the world's 100 poorest
countries. MicroInsurance Centre, 2007.”
12. Srijanani, D. (2013). “Micro Insurance in India: A Safety Net for the Poor.” International Journal of Manage M Ent&
Bus ines s S tud ie s Vo l . 3 , . I s sue 1 J an - March 2013 : 52 -56 . Web . 10 June 2014 .
<http://www.ijmbs.com/31/drsijanani.pdf>.
13. Srinivasan, G., &Arunachalam, R. S. (2002). “MicroinsuranceIn India” ILO Social Finance Working Paper (draft).
14. Tomchinsky, G. (2008). “Introduction to Micro insurance Historical perspective” A Paper Presented at 4th
International Micro insurance Conference. Held at Cartagena, Colombia on 5th November, 2008.
15. Wiedmaier-Pfister, M. (2004).“Regulation and Supervision of Microinsurance.”
FMS, SRMS College of Engg. & Tech. ( Bizcraft September 14 - February 15 Vol. 8, No.2 ) 13
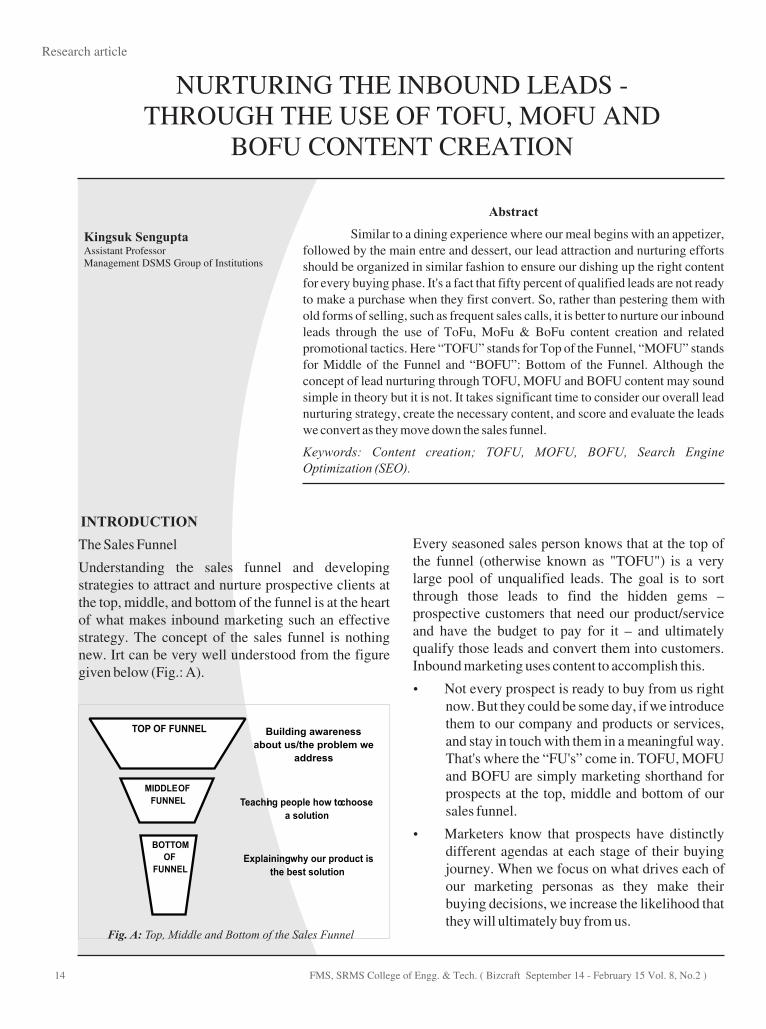
Research article
NURTURING THE INBOUND LEADS - THROUGH THE USE OF TOFU, MOFU AND
BOFU CONTENT CREATION
Kingsuk SenguptaAssistant Professor Management DSMS Group of Institutions
Abstract
Similar to a dining experience where our meal begins with an appetizer, followed by the main entre and dessert, our lead attraction and nurturing efforts should be organized in similar fashion to ensure our dishing up the right content for every buying phase. It's a fact that fifty percent of qualified leads are not ready to make a purchase when they first convert. So, rather than pestering them with old forms of selling, such as frequent sales calls, it is better to nurture our inbound leads through the use of ToFu, MoFu & BoFu content creation and related promotional tactics. Here “TOFU” stands for Top of the Funnel, “MOFU” stands for Middle of the Funnel and “BOFU”: Bottom of the Funnel. Although the concept of lead nurturing through TOFU, MOFU and BOFU content may sound simple in theory but it is not. It takes significant time to consider our overall lead nurturing strategy, create the necessary content, and score and evaluate the leads we convert as they move down the sales funnel.
Keywords: Content creation; TOFU, MOFU, BOFU, Search Engine Optimization (SEO).
INTRODUCTION
The Sales Funnel
Understanding the sales funnel and developing strategies to attract and nurture prospective clients at the top, middle, and bottom of the funnel is at the heart of what makes inbound marketing such an effective strategy. The concept of the sales funnel is nothing new. Irt can be very well understood from the figure given below (Fig.: A).
Every seasoned sales person knows that at the top of the funnel (otherwise known as "TOFU") is a very large pool of unqualified leads. The goal is to sort through those leads to find the hidden gems – prospective customers that need our product/service and have the budget to pay for it – and ultimately qualify those leads and convert them into customers. Inbound marketing uses content to accomplish this.
?Not every prospect is ready to buy from us right now. But they could be some day, if we introduce them to our company and products or services, and stay in touch with them in a meaningful way. That's where the “FU's” come in. TOFU, MOFU and BOFU are simply marketing shorthand for prospects at the top, middle and bottom of our sales funnel.
?Marketers know that prospects have distinctly different agendas at each stage of their buying journey. When we focus on what drives each of our marketing personas as they make their buying decisions, we increase the likelihood that they will ultimately buy from us.
Fig. A: Top, Middle and Bottom of the Sales Funnel
FMS, SRMS College of Engg. & Tech. ( Bizcraft September 14 - February 15 Vol. 8, No.2 )14

?As our website visitors could be at any given point in the cycle, it's essential to present the type of content that each type of person is uniquely looking for - in other words, something for everyone. For instance, an offer of a free trial or equipment demonstration is way too premature for an early-stage prospect, but it's perfect for a visitor who is finalizing his buying decision.
HOW THIS IS DONE?
?This can be done by offering them answers to their questions and solutions to their problems. Because most people begin their buying process online, one of the most powerful strategies for attracting visitors and converting leads at the top of the funnel is to create keyword-rich content in the form of blogs.
?The idea is that when someone Googles to learn more about a topic related to our products or services, they find us. The blogs can act as the fuel that makes our inbound marketing engine go. A research done by HubSpot indicates that companies that blog get 55% more website traffic than those who do not.
?The first step to ensure that our blogs get found is to properly optimize our posts for search engines. Two of the most important questions here is “Are we using relevant long tail keywords in the blog title and copy?”, and “Do we have good meta titles and descriptions that include your keywords and fit within the character limits imposed by search engines (generally, 60 characters for titles and 160 characters for meta descriptions)?”
?Once our blogs are optimized, then it's time to let the whole world know all about them. We have to make some noise and get our blogs in front of the people we are trying to reach by promoting them via social media.
UNDERSTANDING THE CONCEPT OF TOFU, MOFU AND BOFUTOP OF THE FUNNEL (TOFU)
Top of the Funnel (TOFU) content like blogs is great for increasing website visitor traffic, but what good is traffic if we cannot turn those visitors into leads and capture information about them? That is the purpose of middle of the funnel offers. A TOFU strategy without a MOFU strategy is like toast. Tastes good, but without something in between the two slices, we don't have a sandwich.
MIDDLE OF THE FUNNEL (MOFU)
While blogs are very effective at bringing visitors to our website, they won't help us qualify prospects or make a sale. MOFU offers are arguably the most critical part of the sales funnel because they turn visitors into leads and help separate good leads from bad.
Prospects in the middle of the funnel know that they have a problem or a need that must be solved and have moved on to determining the best solution. As a result, their commitment to making a purchase is higher and the probability of closing a deal with them greater. Because they are one step closer to making a purchase, MOFU prospects are usually pretty good leads, and the content we offer them at this stage will determine whether it is worth having a salesperson contact them directly.
Whereas top of the funnel content is aimed at educating buyers and showing them how they can solve their problems, middle of the funnel offers - show why our products or services are the best choice. They distinguish between casual information gatherers and the people who really are interested in buying.
It's not enough to simply offer our website visitors great content. We need to capture information about them so that we can qualify and nurture the best leads. This can be done by “gating” our content and putting it behind a landing page with a conversion form. At the very least, we can make sure that our forms require visitors to provide their name and email address. With this information, we can create email lead nurturing campaigns and personalize those emails.
Once a prospect has moved through the middle of the
Fig. B: understanding TOFU, MOFU, BOFU
FMS, SRMS College of Engg. & Tech. ( Bizcraft September 14 - February 15 Vol. 8, No.2 ) 15
funnel, we should know whether they are planning to make a purchase or not. At this point, having a good BOFU strategy is critical to converting our leads into customers.
Mid-funnel content may take any (or more) of the following forms:
?Targeted newsletters
This mid-funnel format often takes a psychological, action-oriented approach. For example, Co Schedule, a Word Press editorial calendar plug-in, tracks the behavior of its audience and segments individuals based on their engagement within emails and on the site. This is a strong of example of the role of mid-funnel content as an engaging, educational tool.
?Detailed e-books
E-books can be a great way to generate top-funnel leads. They can also serve to deepen the relationship between us and our audience by providing rich information on a particular topic. As a mid-funnel tool, the focus is not on acquiring leads, but on assisting the buyer in his or her evaluation process.
?Case studies
Case studies are an easy way to show prospects exactly what you do through the eyes of the consumer. NuSpark, a lead-generation tool, uses on-site case studies to clearly state a client's problems, NuSpark's solution, and the overall result. The company demonstrates the power of its tools through a user's lens. Case studies are incredibly useful for content marketers as they can be repurposed into many formats, like blog posts, social media material, newsletter highlights, testimonials, and more.
?Fact sheets
A fact sheet is a concise way to say to our prospects, “Here's what you should know about the biggest problem in your industry and here's why we are best suited to address it.” HP's fact sheet demonstrates industry leadership by identifying a “state of the industry” issue and providing data on why its solution has an advantage over competitors. Simple and to-the-point, it directs the reader during a key moment in their purchase journey.
?White papers
A white paper typically looks like a long form fact sheet or an e-book on statistical steroids. The NCIA has nailed its white papers on evolving cannabis policy providing data and actionable how-to's for its entrepreneurial audience.
?Integrated email campaigns
Email campaigns can be more strategic than a weekly newsletter blast - they're the bread and butter of the mid-funnel process. In addition to its long form weekly newsletter, Safari, an education reader service, distributes “Pop forms,” which deliver weekly questions to team leaders and their members to help facilitate productive one-on-one meetings. The goal here is to provide an additional source of utility, strengthening the connection between prospect and brand.
?ROI calculator
Rather intuitively, ROI calculators allow prospects to plug in website and company information to determine the necessary investment to reach set goals.
The above list is neither exhaustive nor precise. Exactly what our content looks like will depend on how different segments fit into our overall sales goals. The short answer to mid-funnel content creation is that there is no universal content template. Mid-funnel strategy is successful by the nature of its specificity, creativity and case-specific data.
BOTTOM OF THE FUNNEL (BOFU)
By the time a lead reaches the bottom of the funnel, they are ready to buy and the only question is who they will buy from. These leads are the "low hanging fruit" of the sales funnel. Often times, leads at the bottom of the funnel just need a gentle nudge to get them to take action. The right BOFU offer can be very effective in helping us to speed up the rate with which we close deals.
Most websites are full of BOFU offers like free trials or assessments, “schedule a meeting” buttons, coupons, etc. While it's definitely important to have a few good BOFU offers, most of our website visitors are nowhere near ready to buy.
There is lot of research out there to indicate that buyers get between 60 and 70% of the way through the buying
FMS, SRMS College of Engg. & Tech. ( Bizcraft September 14 - February 15 Vol. 8, No.2 )16

process before they are willing to speak to a salesperson. Given that BOFU offers are essentially an invitation to be sold to, odds are that most of our visitors would not convert on these.
A better approach is to combine our BOFU offers with MOFU offers so that we have something to offer visitors regardless of where they are in the buying process. This will dramatically increase our lead conversion rates and keep us in front of prospective buyers at a much earlier stage in their decision making process, allowing us to influence their choice of solution and positioning us as the preferred provider.
It's important not to forget that the bottom of the funnel is about more than simply closing deals. It's also the jumping off point for closed loop analytics. The best inbound marketers are constantly evaluating the effectiveness of their campaigns and adjusting their strategies to maximize results.
Example: If we see that social media is generating a ton of traffic to our website; we might assume that we should put more resources into it. But, if our visitor to lead or lead to customer conversion rates is low for
social media, but high for email marketing, we might get better return for our money by focusing on email. This is another great example of the need for an integrated TOFU, MOFU, and BOFU strategy. Many marketers rely solely on visitor traffic numbers to guide their marketing strategies without taking the time to truly understand how effective each marketing channel is in turning those visitors into leads and customers.
Review of how the inbound process aligns with each stage of the conversion funnel
Let us review how the inbound process aligns with each stage of the conversion funnel
?Generate Site Traffic: To begin with, we attract site visitors through quality blog posts, social media, and keywords.
?Convert Traffic to Leads: Once visitors are on our site, we offer compelling TOFU content offers like eBooks and How-to-Guides to generate leads.
?Nurture Leads: Once a visitor becomes a lead i.e. they've clicked on our CTA, filled out a form on our content offer landing page, and clicked submit, then we are ready to nurture that lead. If the lead is early in his buyer journey, we would want to build the relationship with additional relevant TOFU offers. As we nurture the lead, he moves further down the buyer journey, then MOFU offers such as case studies come into play.
?Convert Leads to Sales: Finally, BOFU offers help to convert a lead into a customer. These
Fig. C: Inbound Marketing Conversion Funnel
Fig. D: TOFU to BOFU: Making content matter along the sales funnel
FMS, SRMS College of Engg. & Tech. ( Bizcraft September 14 - February 15 Vol. 8, No.2 ) 17

?offers include assessments and consultations.
TOFU to BOFU: Making content matter along the sales funnel
?
?
?
?
There is so much written about how to create and execute an effective digital strategy. The hard part is determining what to say and when to say it. CONTENT is the challenge. The effectiveness of any marketing strategy is the “stuff” we do to ensure that our voice is heard; not that our story makes your audience take notice, but that they stand up and actively engage with us. The key is the content strategy – defining the right mix of created and curated content, and defining what content should go where - and when in the prospect lifecycle.
Let us consider leads and their lifecycle. Today's buyers are informed. Although it varies greatly with product complexity and market maturity, today's buyers might be anywhere from 60 to 90% of the way through their journey before they reach out to a vendor ready to buy. Owning a much bigger piece of the lead-to-revenue journey is marketing's job. We need to engage the customer through as much of this buying cycle as possible, focusing on delivering the right content at the right time during this lead-to-cash process.
At top of the funnel there is a need to educate our buyers. Our content should be a mix of created and curated content. This is when our audience is researching and seeking knowledge. It is important to consider content that will educate, engage and enlighten them. We should consider curated content about the industry, trends or statistics while creating thought provoking but easy-to-read white papers, eBooks, or infographics. The intent is to become their authority, their mentor, and their teacher or in other words someone they can trust.
The middle of the funnel is time to start to introduce our offerings. The content should be original so that it can help our buyer differentiate our product from the competition. We can also use curated content here, but focuses on third-party content that puts us in good standing. You want the prospective buyer to understand that not only we can be trusted, but that we are also offering a solution that is
compelling and meets their needs. We should consider using product webinars, product case studies, press releases, blogs, demo videos, buying guides, ROI calculators, etc. We should just keep it crisp and digestible. We should not overwhelm our future customers with tech jargons that may confuse them.
Once we reach BOFU, our sales team has completed their selling. But it is still important that the buyer has the information they need to make the final decision. We need to prove that we deserve the business. It is time to show how our customers feel about our offering through more customer success stories, videos, industry analyst feedback, or even free trials.
The sales funnel is universal for any brand or business that is looking to sell products or services. We should consider developing a marketing culture that positions our brand with content that is consistent with buyer needs depending on where they are along their purchasing journey.
AUTOMATING DISTRIBUTION OF OUR LEAD NURTURING CONTENT
Although the concept of lead nurturing through ToFu, MoFu and BoFu content may sound simple in theory, it's not. It takes significant time to consider our overall lead nurturing strategy, create the necessary content, and score and evaluate the leads we convert as they move down the sales funnel.
It's also unrealistic to think we have the time in our day to manage this process manually. This is where an automated marketing software solution is a must if we plan to implement multiple lead nurturing campaigns.
Automating our campaigns can still be personal by deploying emails with a customized greeting or subject line, and having them deployed from a specific contact from our company. But they can be created before a lead even converts and then triggered based on a specific conversion that is then scheduled at a frequency that is aligned with our industry's buying cycle.
This frees up your time to create more compelling content and keeps your sales team well fed with warm, MQLs (Marketing Qualified Leads) that are closer to a point of making a purchase for your product or service
?
?
FMS, SRMS College of Engg. & Tech. ( Bizcraft September 14 - February 15 Vol. 8, No.2 )18
.CONCLUSION
?Sales & marketing love funnels. We have the sales funnel, showing the path of a prospect to a lead to a customer. They're a great way to visualize the journey that our new customers will take to find us.
? The inbound marketing funnel works much like the sales funnel of yesterday, but with one key difference. It tells us, as marketers, what exactly your marketing message should be saying when. Our inbound strategy is built on this funnel and it's served us and our clients well.
?At the top of the funnel, we should cast a wide net to attract a large audience of leads, because we want to generate relevant traffic without deliberately filtering or discouraging conversions. We can bring in leads through search-optimized blog posts and calls-to-action that leads TOFU prospects to conversion opportunities. For example, offering a downloadable eBook encourages site visitors to trade their contact information for the helpful content inside. Since leads at the TOFU are in the Awareness stage of the buyer's journey, we should educate them on a specific question, need, or pin point that they're looking to address.
?Prospects in "Learning Mode" tend to fall into the Top of the Funnel. They are typically interested in solutions for their problems and may not have even considered that our product can even help them yet. Focus on attracting them with relevant keywords and blog content.
?A visitor becomes a lead once they convert on a TOFU content offer, and start their journey into
the MOFU. At this point, our content should reflect the fact that leads have not been fully qualified. So, we should continue to educate leads, but start to position our company as the solution to their needs and challenges. Comparative white papers or case studies are great content offerings during this stage because they present our solution as a viable option to solving their problem at hand, which also helps us build credibility.
?We have entered the bottom of the funnel once our leads know us and are comfortable engaging one-on-one. This is where a free trial, consultation, or product demo works nicely to start the dialogue and to begin to fully qualify our most interested leads.
?Conducting a complete content audit can help us identify if we are ignoring at least one part. If that's the case, we are only speaking to certain segments and possibly missing out on huge swaths of potential customers.
?The basic premise of the inbound marketing funnel is that not all visitors to a web site are equal and more importantly, they're not all looking for the same thing.
?The sales funnel is universal for any brand or business that is looking to sell products or services. We should consider developing a marketing culture that positions our brand with content that is consistent with buyer needs depending on where they are along their purchasing journey.
FMS, SRMS College of Engg. & Tech. ( Bizcraft September 14 - February 15 Vol. 8, No.2 ) 19
REFERENCES
1. Pulizzi J., “Epic Content Marketing: How to Tell a Different Story, Break through the Clutter, and
Win more Customers by Marketing Less”, McGraw Hill Professional, September 2013.
nd2. Halvorson K., Rach M., “Content Strategy for the Web”, 2 Edition, Pearson Education,
February 2012.
3. Walter E., Gioglio J., “The Power of Visual Storytelling: How to Use Visuals, Videos, and Social
Media to Market Your Brand”, McGraw Hill, March 2014.
4. Kawasaki G., Fitzpatrck P., “The Art of Social Media: Power Tips for Power Users, Penguin
Books, December 2014.
WEB REFERENCES
1. https://www.chooseimpulse.com/inbound-marketing-sales-funnel
2. https://blog.bufferapp.com/new-marketing-strategies
3. http://blog.trap.it/blog/tofu-to-bofu-making-content-matter-along-the-sales-funnel
4. http://blog.denamico.com/heres-the-difference-between-tofu-mofu-and-bofu-offers
5. https://www.thekingdom.com.au/knowledge/the-sales-funnel-tofu-mofu-bofu-explained
FMS, SRMS College of Engg. & Tech. ( Bizcraft September 14 - February 15 Vol. 8, No.2 )20
Research article
A PERCEPTION OF RURAL CUSTOMERS OF M.P(BHIND) TOWARDS E-BANKING
Dr. Praveen SrivastavaAssistant ProfessorSchool of BusinessITM-University,Gwalior,M.P.
Abstract
It is very true that the banking Industry is the backbone of the financial system of our country. The need to survive in the changing environment has lead the banking industry to adopt internet as a medium of operating in the urban as well as rural market. Internet banking provides different alternatives for faster delivery of banking services to a wider range of customers. Internet banking refers to the use of internet as a remote delivery channel for banking services. It means any user with a computer and a browser can get connected to his bank website to perform any of the banking function. India is predominantly an agricultural country and it's above 65 % of the population lives in the villages. Spread of E-delivery channels in those areas is very less till date because of difficulty in reaching technology and other infrastructure which supports and helps in carrying the technology to these area as well as lack of knowledge of the technology and internet operating training. The objective of this paper is to examine the illiteracy of rural areas bank customer and by designing the model how it will helpful to them while carrying the internet banking transactions and also it will helpful to banking sector to get a benefit from rural areas bank customers to explore a banking industry.
Keywords: Banking Industry, Internet banking, E-deliver, Remote delivery channel.
INTRODUCTION
E-Banking is also known as electronic funds transfer (EFT),
is simply the use of electronic means to transfer funds
directly from one account to another, rather than by cheque
or cash. You can use electronic funds transfer to:
?Have your paycheck deposited directly into your bank
or credit union checking account.
?Withdraw money from your checking account from an
ATM machine with a personal identification number
(PIN), at your convenience, day or night.
?Instruct your bank or credit union to paycertain
monthly bills from your account, such as your auto
loan or your mortgage payment.
?Have the bank or credit uniontransfer funds each
month from your checking account to your mutual
fund account.
?Have your government social security benefits check
or your tax refund deposited directly into your
checking account.
• Buy groceries, gasoline and other purchases at the
point-of sale, using a check card rather than cash,
credit or a personal check.
VARIOUS FORMS OF E-BANKING
INTERNET BANKING: Internet banking lets you handle
many banking transactions via your personal computer. For
instance, you may use your computer to view your account
balance, request transfers between accounts, and pay bills
electronically. Internet banking system and method in
which a personal computer is connected by a network
service provider directly to a host computer system of a
bank such that customer service requests can be processed
automatically without need for intervention by customer
service representatives. The system is capable of
distinguishing between those customer service requests
which are capable of automated fulfillment and those
requests which require handling by a customer service
representative. The system is integrated with the host
computer system of the bank so that the remote banking
customer can access other automated services of the bank.
FMS, SRMS College of Engg. & Tech. ( Bizcraft September 14 - February 15 Vol. 8, No.2 ) 21
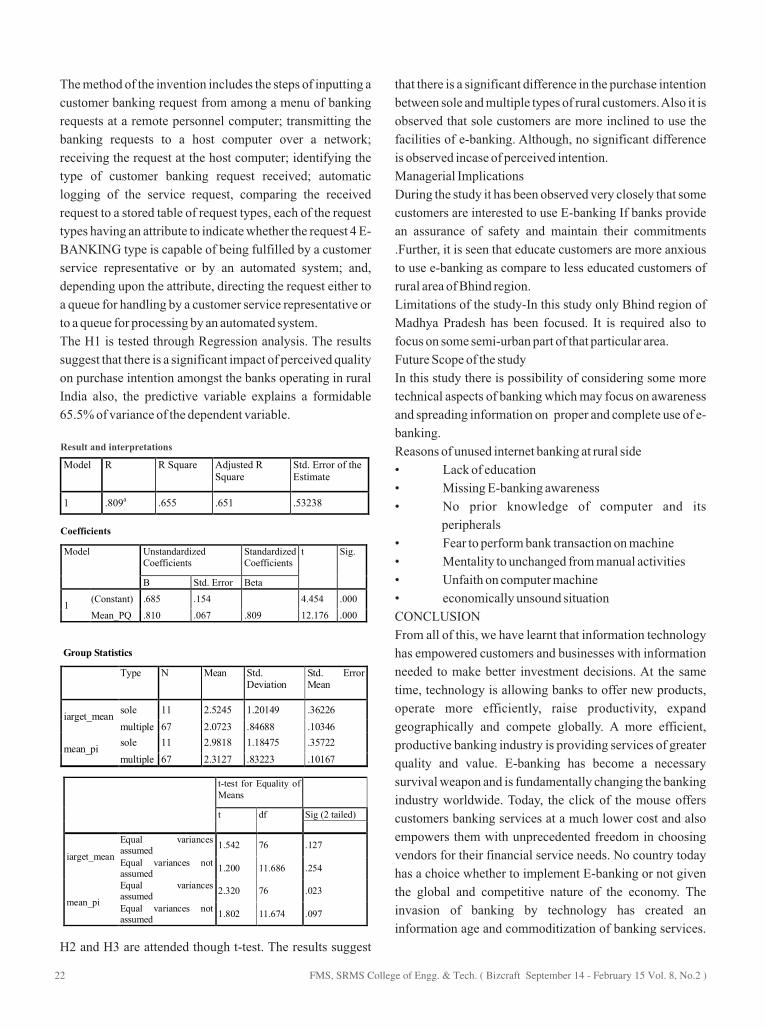
The method of the invention includes the steps of inputting a
customer banking request from among a menu of banking
requests at a remote personnel computer; transmitting the
banking requests to a host computer over a network;
receiving the request at the host computer; identifying the
type of customer banking request received; automatic
logging of the service request, comparing the received
request to a stored table of request types, each of the request
types having an attribute to indicate whether the request 4 E-
BANKING type is capable of being fulfilled by a customer
service representative or by an automated system; and,
depending upon the attribute, directing the request either to
a queue for handling by a customer service representative or
to a queue for processing by an automated system.
The H1 is tested through Regression analysis. The results
suggest that there is a significant impact of perceived quality
on purchase intention amongst the banks operating in rural
India also, the predictive variable explains a formidable
65.5% of variance of the dependent variable.
H2 and H3 are attended though t-test. The results suggest
that there is a significant difference in the purchase intention
between sole and multiple types of rural customers. Also it is
observed that sole customers are more inclined to use the
facilities of e-banking. Although, no significant difference
is observed incase of perceived intention.
Managerial Implications
During the study it has been observed very closely that some
customers are interested to use E-banking If banks provide
an assurance of safety and maintain their commitments
.Further, it is seen that educate customers are more anxious
to use e-banking as compare to less educated customers of
rural area of Bhind region.
Limitations of the study-In this study only Bhind region of
Madhya Pradesh has been focused. It is required also to
focus on some semi-urban part of that particular area.
Future Scope of the study
In this study there is possibility of considering some more
technical aspects of banking which may focus on awareness
and spreading information on proper and complete use of e-
banking.
Reasons of unused internet banking at rural side
• Lack of education
• Missing E-banking awareness
• No prior knowledge of computer and its
peripherals
• Fear to perform bank transaction on machine
• Mentality to unchanged from manual activities
• Unfaith on computer machine
• economically unsound situation
CONCLUSION
From all of this, we have learnt that information technology
has empowered customers and businesses with information
needed to make better investment decisions. At the same
time, technology is allowing banks to offer new products,
operate more efficiently, raise productivity, expand
geographically and compete globally. A more efficient,
productive banking industry is providing services of greater
quality and value. E-banking has become a necessary
survival weapon and is fundamentally changing the banking
industry worldwide. Today, the click of the mouse offers
customers banking services at a much lower cost and also
empowers them with unprecedented freedom in choosing
vendors for their financial service needs. No country today
has a choice whether to implement E-banking or not given
the global and competitive nature of the economy. The
invasion of banking by technology has created an
information age and commoditization of banking services.
Model
R R Square
Adjusted R Square
Std. Error of the Estimate
1 .809a .655 .651 .53238
Coefficients
Model
Unstandardized Coefficients
Standardized Coefficients
t Sig.
B Std. Error Beta
1(Constant) .685 .154 4.454 .000
Mean_PQ .810 .067 .809 12.176 .000
Result and interpretations
Group Statistics
Type N Mean Std. Deviation
Std. ErrorMean
iarget_mean sole 11 2.5245 1.20149 .36226
multiple 67 2.0723 .84688 .10346
mean_pi sole 11 2.9818 1.18475 .35722
multiple 67 2.3127 .83223 .10167
t-test for Equality of Means
t df Sig (2 tailed)
iarget_mean
Equal variancesassumed
1.542 76 .127
Equal variances not assumed
1.200 11.686 .254
mean_pi
Equal variancesassumed
2.320 76 .023
Equal variances not assumed
1.802 11.674 .097
FMS, SRMS College of Engg. & Tech. ( Bizcraft September 14 - February 15 Vol. 8, No.2 )22
Banks have come to realize that survival in the new e-
economy depends on delivering some or all of their banking
services on the Internet while continuing to support their
traditional infrastructure. The rise of E-banking is
redefining business relationships and the most successful
banks will be those that can truly strengthen their
relationship with their customers. 68 E-BANKING Without
any doubt, the international scope of E-banking provides
new growth perspectives and Internet business is a catalyst
for new technologies and new business processes. With
rapid advances in telecommunication systems and digital
technology, E-banking has become a strategic weapon for
banks to remain profitable. Internet banking has evolved
rapidly over the years with technological advances and
increasing number of Internet users across various regions.
REFERENCES
1. Acharya.R. and Lingam, A.(2008). Online banking applications and community bank performance.
The International Journal of Bank Marketing, Vol.26 No. 6, 2008 pp.418-439.
2. Broderick, A. and Vachirapornpuk,S. (2002). Service quality in Internet Banking: the importance of
customer role. Marketing Intelligence & Planning, Vol.20, No.6,pp.327-335
3. Casalo, L.,Flavia'n C., Guinali'u M.(2007). The role of security,privacy, usability and reputation in
the development of online banking. Online Information Review,Vol.31 No.5,2007 pp.583-603
4. Kumbhar, Vijay (2011)- “Service Quality Perception and Customer's Satisfaction” in Internet
Banking Service:A case study of Public Sector and Private Sector Banks”, Cyber Literature Online
Journal, Vol.2 No.4, pp.21-30
5. Laforet, S and Li,X. (2005). Consumers' attitudes towards online and mobile banking in China.
International Journal of Bank Marketing, Vol.23 No.5, 2005, pp.362-380.
6. Nath Ravi &SchrickPoul (2001), Banker's Perspective on Internet Banking, e-service
Journal,vol.1,no.1,21-36
7. Neha Dixit & Dr. Saroj K Dutta (2010), Journal of Internet Banking and commerce, Acceptance of
E-Banking among Adult Customers:An Empirical Investigation in India, Vol.15 no.2.
8. PoojaMalhotra&Balwinder Singh (2009), Eurasian Journal of Business and Economics, the Impact
of Internet Banking on Bank performance and Risk:The Indian Experience, Vol.2 no.4.
9. Rod M ;N J Ashil; J Shao and J Carrethers(2008),”An Examination of the Relationship between
Service Quality Dimensions, Overall Internet Banking Service Quality and Customer satisfaction: A
New Zealand study”,Marketing Intelligence & Planning. Vol. 27 No.1 pp.103-126.
It has developed as an effective distribution channel for
banking products and services. It helps to attract customers,
also do banking anywhere without opening branch. Various
services provided and available anytime, anywhere which
increased its popularity. The Efficiency of e-banking is fully
dependent on how it is used by rural area bank customer the
above emergent proposed model highly strive to rural area
bank customer for using net banking for using net banking
facility. It optimizes the time and money of rural area bank
customer as well as banking organization. In short, the
above paper mainly focuses on emergent model which
enable efficiency and productivity of rural area society
people
FMS, SRMS College of Engg. & Tech. ( Bizcraft September 14 - February 15 Vol. 8, No.2 ) 23

Research article
STUDY OF RELATIONSHIP BETWEEN EMPLOYEE ENGAGEMENT AND EMPLOYEE
RETENTION IN ACADEMIC SECTOR
Ms SunitaResearch ScholarDepartment of Management studiesM.J.P Rohilkhand University [email protected]
Abstract
Organizations now a day have realized the importance of the committed workforce to gain the competitive edge. In order to achieve the peak performance organizations need to unleash the talents and motivations of all their employees (Katzenbach, 2000). There is considerable evidence, that many organizations are falling short however. The growth of a nation depends upon the quality of the education its citizens are getting. In this perspective the role of teachers is quite important. However retention of academicians in higher educational institutions is a major concern in India. Employee engagement has been shown to have a statistically positive relationship with employee retention, productivity, profitability and customer satisfaction (Buckingham & Coffman, 1999; Coffman & Gonzalez-Molina, 2002).
This study aims at identifying the level of engagement of employees in higher educational institutions and studying the relationship between work engagement as independent variable with employee retention as dependent factors.
Keywords: Employee engagement, Employee retention, Academic sector.
INTRODUCTION
The word employee engagement conceptualized by Kahn is gaining attention of many academicians now days. Highly engaged employees in the organizations are the true asset for the organization as they promote talent retention and improve performance of the organization (Lockwood, 2007). Researches reveal that employee engagement has a potential to predict some important outcomes at organizational and individual level like intention to quit, job satisfaction, organizational commitment, organizational citizenship behavior etc ( Saks, 2006).In the research of 94 HR directors from higher education institutions in the UK, majority of respondents reported that engagement and motivation of employees has increased in importance over the past decade however only 47% had a talent management strategy in place (Newcombe, 2013). The research also found the top three tactics of engaging employees in the higher education institutions viz. clarity of roles, setting performance expectations and regular appraisals.
Engagement according to Kahn (1990) occurs when an individual is emotionally connected and
cognitively vigilant in his work. 'Engagement is a positive attitude held by the employee towards the organization and its values. An engaged employee is aware of business context, and works with colleagues to improve performance within the job for the benefit of the organization (Robinson et al, 2004). Employee retention is defined as the ability of the organization to retain its employees.
This study is expected to contribute to the literature of employee engagement especially in the Indian context, where there is a serious need for such a research to be conducted
The paper is structured as follows. First the literature on the relationship between employee engagements and employee retention were reviewed and presented. Second, a discussion of the research methodology procedures and issues is provided. Third, the quantitative results of the questionnaire surveyed. Finally, the discussions of the findings in addition to the study, scope for future study and conclusions are presented.
FMS, SRMS College of Engg. & Tech. ( Bizcraft September 14 - February 15 Vol. 8, No.2 )24
LITERATURE REVIEW
If the learning of the students need to be improved than it is very important to study the level of faculty engagement (Ewell, 1997).
Employee Engagement
Employee engagement has been conceptualized in many ways in academic and practitioner literature. The concept was first conceptualized by Kahn in 1990. Kahn (1990) defined employee engagement as the harnessing of organizational members selves to their roles at work; in engagement, people employ and express themselves physically, cognitively, and emotionally during role performances. Personal disengagement as defined by Kahn (1990) is however the uncoupling of selves from work roles; in disengagement employee withdraw and defend himself from his work role performances physically, cognitively and emotionally. Thus according to him employee is engaged when he is physically and psychologically present in his work roles. Maslach et al. claimed that engagement is just opposite of three burnout dimensions of exhaustion, cynicism and inefficacy; and is defined by energy, involvement and efficacy. According to Schaufeli et al. (2002) work engagement is the positive fulfilling work related state of mind characterized by vigor, dedication and absorption. Vigor is high energy level at work, dedication is the strong involvement in work, feeling of pride, inspiration and enthusiasm and absorption is full concentration and engrossment in one's work.
Employee Retention
Cascio (2003) describes retention as initiatives taken by the management to keep employees from leaving the organization, such as rewarding employees for performing their jobs effectively; ensuring harmonious working relations between employees and managers; and maintaining a safe, healthy work environment. Literature surveys conducted by McNee et al.(1998) and Döckel (2003) identified the following six critical factors that need to be considered in the retention of high technology employees: compensation (base salary); job characteristics (skill variety and job autonomy); training and development opportunit ies; supervisor support ; career opportunities and work/life policies.
Research has shown that medical (Hill 2011; Holtom
& O'Neill 2004) and information technology (IT) professionals have a strong tendency to leave the organizations for which they work (Korunka, Hoonakker & Carayon 2008) and the country where they live (Bezuidenhout, Joubert, Hiemstra & Struwig 2009; Rasool & Botha 2011; Statistics South Africa 2005). Professionals such as these are regarded as 'intellectual capital' and are necessary in the knowledge economy; therefore, understanding and managing their turnover can have significant consequences for the organization's competitive advantage (Niederman, Sumner & Maertz 2007; Powell & Snellman 2004). Consequently, the organization's ability to retain employees by providing a satisfying work environment has gained great importance. However, employees may still leave a highly regarded organization to join an organization that is perceived to have attractive alternative opportunities (Jiang & Klein 2001). Although varying in intensity, the personal and organizational costs of leaving a job are often high and disruptive (Holtom & Inderrieden 2006; Mitchell, Holtom, Lee, Sablynski & Erez 2001).
RESEARCH METHODOLOGY
Objective of the study
1. To study the engagement level of faculty in higher educational institutions.
2. To study the relationship between employee engagement and employee retention in higher educational institutions.
3. To check if employee engagement is the predictor of employee retention.
Research Hypothesis
H1: Employee Retention in the academic sector is positively related to employee engagement.
H2: Employee Engagement predicts employee retention.
Sample: The element of the population consist of Faculty from Management and Engineering students in private colleges of Ghaziabad and Noida region. Sample size for the study was 60 faculty. Questionnaires were filled online using Qualtrics software by forwarding the link to respondents on their mail id. In total 65 questionnaires were sent but only 60 responses received making the response rate 92%.
FMS, SRMS College of Engg. & Tech. ( Bizcraft September 14 - February 15 Vol. 8, No.2 ) 25

Reliability Statistics
.Mean age of respondents was between30 to 40 years.
Measure
Employee engagement:EE was measured with the help of Utrecht Engagement scale(UWES) developed by Schaufeli et al. (2002). It is a seventeen item scale consisting of three subscales called vigor, dedication and absorption. Cronbach alpha for the whole scale lie between 0.88-0.95. All the items were measured on 5 point likert scale (1-strongly agree, 5-strongly disagree). For the current study Cronbach alpha value is as below:
EMPLOYEE RETENTION
Employee engagement was measured by employee retention scale developed by Kyndt et al (2009). Cronbach alpha for the scale is 0.91. Responses were coded in 5 point Likert scale (1- strongly agree, 5-strongly disagree). The scale has three subscales (Job satisfaction 2-items, intention to quit-4 items and organizational commitment 5 items). For the current study Cronbach alpha is :
The overall scale with 32 items is reliable for the study with Cronbach alpha 0.906.
Table1: Descriptive statistics:
Data Analysis: The analysis of the result was done with the help of statistical measures like mean, standard deviation, coefficient of correlat ion and regression analysis.
To check the level of engagement i n e m p l o y e e s , s c o r e o f engagement scale were grouped
into low, medium and high categories. The high engagement group consist of respondents who responded 1 or 2 on five point Likert scale items, where 1 is strongly agreed and 5 is strongly disagreed (the score was 17 to 34 out of 85). Medium engagement group scores between 34-68 and low engagement group have score above 68. In total 33.33% employees belong to high engagement category 60% were in medium engagement and 6.67% belong to low engagement category.
The correlation table is shown below indicating positive correlation between all the variables. The employee retention which is taken as a dependant variable is positively related with employee engagement (independent variable). The two variable are moderately correlated (r=0.46, p<0.01), hence supporting the hypothesis H1. The acceptance of hypothesis indicates that improvement in engagement practices will lead to improvement in employee retention. It can also be noted that employee engagement is more correlated to job satisfaction dimension of employee retention 9(r=0.5,p<0.01).
Table2: Correlations between employee engagement and employee retention:
Table 3: CORRELATION BETWEEN EE AND ER DIMENSIONS
Employee engagement as a predictor of employee retention:
Reliability Statistics
FMS, SRMS College of Engg. & Tech. ( Bizcraft September 14 - February 15 Vol. 8, No.2 )26
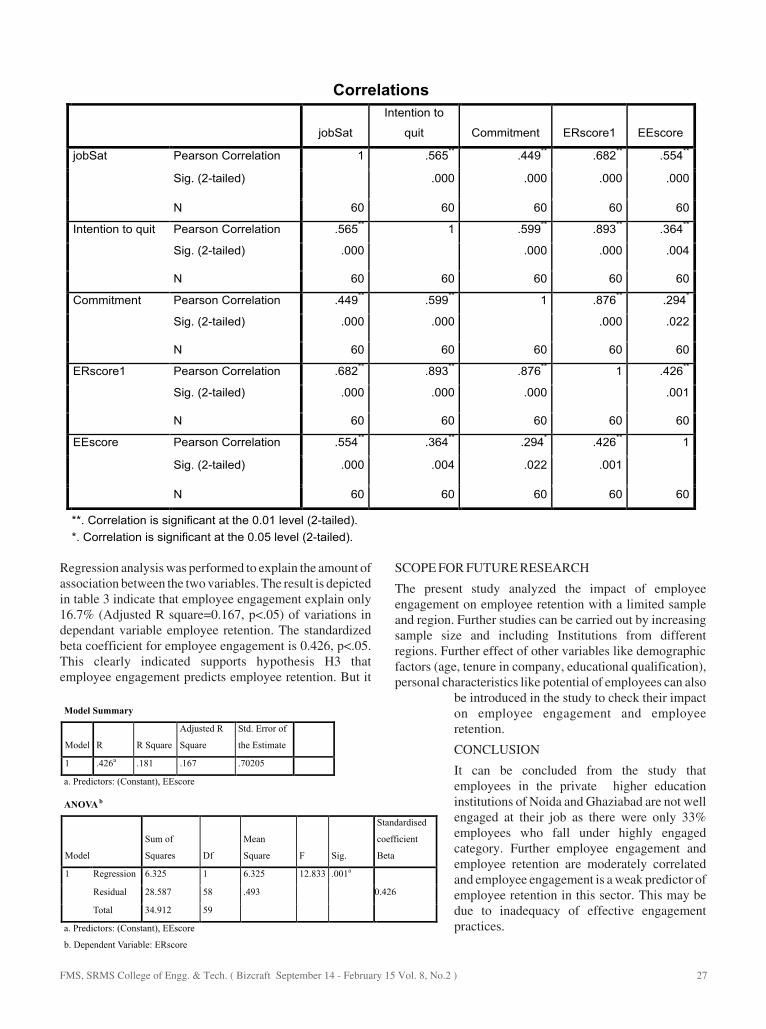
Regression analysis was performed to explain the amount of association between the two variables. The result is depicted in table 3 indicate that employee engagement explain only 16.7% (Adjusted R square=0.167, p<.05) of variations in dependant variable employee retention. The standardized beta coefficient for employee engagement is 0.426, p<.05. This clearly indicated supports hypothesis H3 that employee engagement predicts employee retention. But it
SCOPE FOR FUTURE RESEARCH
The present study analyzed the impact of employee engagement on employee retention with a limited sample and region. Further studies can be carried out by increasing sample size and including Institutions from different regions. Further effect of other variables like demographic factors (age, tenure in company, educational qualification), personal characteristics like potential of employees can also
be introduced in the study to check their impact on employee engagement and employee retention.
CONCLUSION
It can be concluded from the study that employees in the private higher education institutions of Noida and Ghaziabad are not well engaged at their job as there were only 33% employees who fall under highly engaged category. Further employee engagement and employee retention are moderately correlated and employee engagement is a weak predictor of employee retention in this sector. This may be due to inadequacy of effective engagement practices.
FMS, SRMS College of Engg. & Tech. ( Bizcraft September 14 - February 15 Vol. 8, No.2 ) 27
REFERENCES
1. Bakker, A.B. & Demerouti, E. (2008), “Towards a model of work engagement”, Career Development International,
Vol.13, No.3, pp. 209-223.
2. Buckingham, M. & Coffman, C. (1999). “First, break all the rules: What the world's greatest managers
dodifferently”. New York, NY: Simon & Shuster.
3. Hakanen J., A.B. Bakker, and W.B. Schaufeli, 2006, “Burnout and Work Engagement among Teachers,” Journal of
School Psychology, 43 495–513.
4. Harter, J. K., Schmidt, F. L., & Hayes, T. L. (2002).Business-unit-level relationship between employee satisfaction,
employee engagement, and business outcomes: A meta-analysis. Journal of Applied Psychology, 87, 268-279
5. Hewitt Associates. (2010). “Hewitt Analysis Shows Steady Decline in Global Employee Engagement Levels”,
http://www.hewittassociates.com/Intl/NA/en-US/AboutHewitt/Newsroom/PressReleaseDetail.aspx?cid=8775
6. Kahn, W.A. (1990), “Psychological conditions of personal engagement and disengagement at work”, Academy of
Management Journal, Vol. 33, pp. 692-724.
7. Katzenbach, J.R. (2000), Peak Performance: Aligning the Hearts and Minds of Your Employees, Harvard
Business School Press, Boston, MA.
8. Lockwood, N. R. (2007, March). Leveraging Employee Engagement for Competitive
9. Advantage. SHRM Research Quarterly, 2-10.
10. Newcombe, T. (2013) 'Hospitality and tourism employers should focus on staff retention to improve productivity,
says report'.www.hrmagazine.co.uk
11. Saks, A. M. (2006), “Antecedents and Consequences of Employee Engagement”, Journal of Managerial
Psychology, Vol 21, No.7, pp.600-619.
12. Schaufeli, W. and Bakker, A. (2003), “Utrecht Work Engagement Scale”, Occupational Health Psychology Unit
Utrecht University, pp.10-48.
13. Schaufeli, W.B., Salanova, M., Gonzalez-Roma, V. and Bakker, A.B. (2002), “The measurement of engagement
and burnout: a two sample confirmatory factor analytic approach”, Journal of Happiness Studies, Vol. 3, pp. 71-92.
14. Schaufeli, W.B., and M. Salanova, 2007, “Work Engagement: An Emerging Psychological Concept and Its
Implications for Organizations,” in S.W. Gilliland, D.D. Steiner, and D.P. Skarlicki (Eds.), Research in Social
Issues in Management: Managing Social and Ethical Issues in Organizations. Vol. 5, Greenwich, CT: Information
Age Publishers.
FMS, SRMS College of Engg. & Tech. ( Bizcraft September 14 - February 15 Vol. 8, No.2 )28
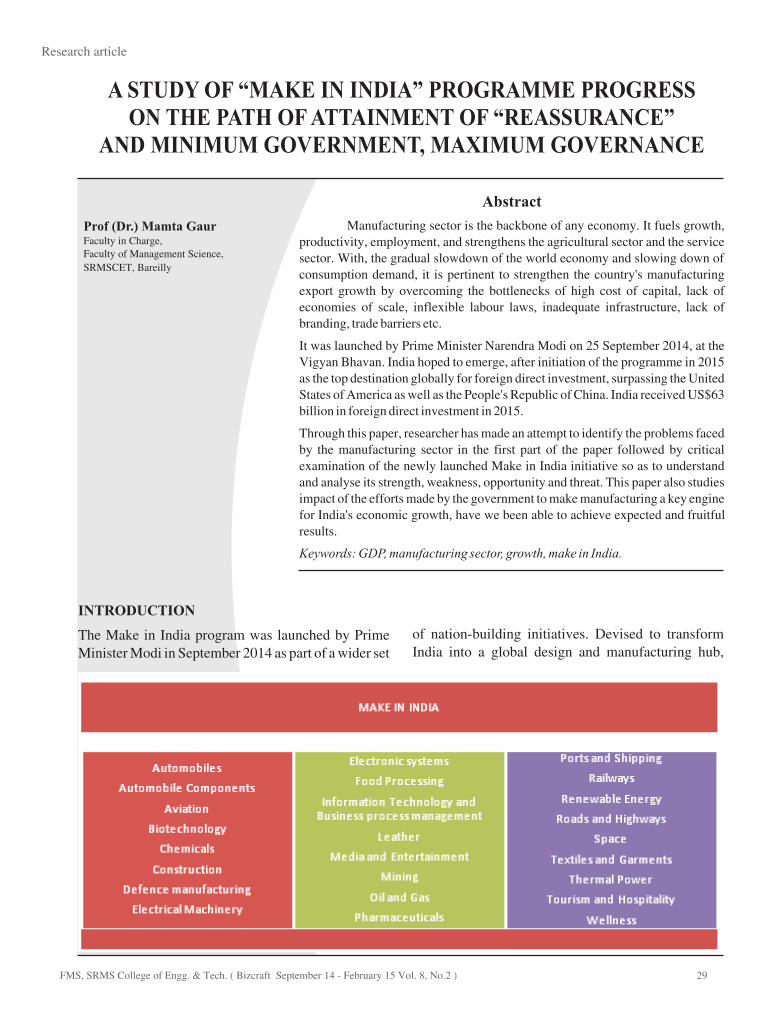
Research article
A STUDY OF “MAKE IN INDIA” PROGRAMME PROGRESS ON THE PATH OF ATTAINMENT OF “REASSURANCE”
AND MINIMUM GOVERNMENT, MAXIMUM GOVERNANCE
Prof (Dr.) Mamta GaurFaculty in Charge, Faculty of Management Science,
SRMSCET, Bareilly
Abstract
Manufacturing sector is the backbone of any economy. It fuels growth, productivity, employment, and strengthens the agricultural sector and the service sector. With, the gradual slowdown of the world economy and slowing down of consumption demand, it is pertinent to strengthen the country's manufacturing export growth by overcoming the bottlenecks of high cost of capital, lack of economies of scale, inflexible labour laws, inadequate infrastructure, lack of branding, trade barriers etc.
It was launched by Prime Minister Narendra Modi on 25 September 2014, at the Vigyan Bhavan. India hoped to emerge, after initiation of the programme in 2015 as the top destination globally for foreign direct investment, surpassing the United States of America as well as the People's Republic of China. India received US$63 billion in foreign direct investment in 2015.
Through this paper, researcher has made an attempt to identify the problems faced by the manufacturing sector in the first part of the paper followed by critical examination of the newly launched Make in India initiative so as to understand and analyse its strength, weakness, opportunity and threat. This paper also studies impact of the efforts made by the government to make manufacturing a key engine for India's economic growth, have we been able to achieve expected and fruitful results.
Keywords: GDP, manufacturing sector, growth, make in India.
INTRODUCTION
The Make in India program was launched by Prime Minister Modi in September 2014 as part of a wider set
of nation-building initiatives. Devised to transform India into a global design and manufacturing hub,
FMS, SRMS College of Engg. & Tech. ( Bizcraft September 14 - February 15 Vol. 8, No.2 ) 29
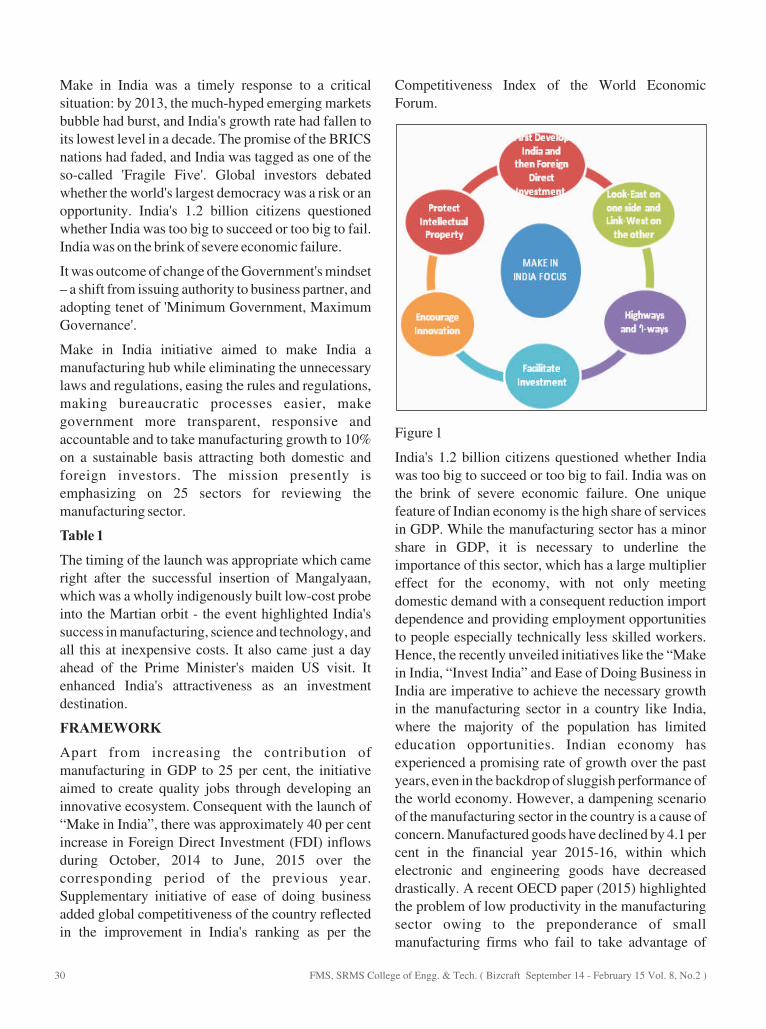
Make in India was a timely response to a critical situation: by 2013, the much-hyped emerging markets bubble had burst, and India's growth rate had fallen to its lowest level in a decade. The promise of the BRICS nations had faded, and India was tagged as one of the so-called 'Fragile Five'. Global investors debated whether the world's largest democracy was a risk or an opportunity. India's 1.2 billion citizens questioned whether India was too big to succeed or too big to fail. India was on the brink of severe economic failure.
It was outcome of change of the Government's mindset – a shift from issuing authority to business partner, and adopting tenet of 'Minimum Government, Maximum Governance'.
Make in India initiative aimed to make India a manufacturing hub while eliminating the unnecessary laws and regulations, easing the rules and regulations, making bureaucratic processes easier, make government more transparent, responsive and accountable and to take manufacturing growth to 10% on a sustainable basis attracting both domestic and foreign investors. The mission presently is emphasizing on 25 sectors for reviewing the manufacturing sector.
Table 1
The timing of the launch was appropriate which came right after the successful insertion of Mangalyaan, which was a wholly indigenously built low-cost probe into the Martian orbit - the event highlighted India's success in manufacturing, science and technology, and all this at inexpensive costs. It also came just a day ahead of the Prime Minister's maiden US visit. It enhanced India's attractiveness as an investment destination.
FRAMEWORK
Apart from increasing the contribution of manufacturing in GDP to 25 per cent, the initiative aimed to create quality jobs through developing an innovative ecosystem. Consequent with the launch of “Make in India”, there was approximately 40 per cent increase in Foreign Direct Investment (FDI) inflows during October, 2014 to June, 2015 over the corresponding period of the previous year. Supplementary initiative of ease of doing business added global competitiveness of the country reflected in the improvement in India's ranking as per the
Competitiveness Index of the World Economic Forum.
Figure 1
India's 1.2 billion citizens questioned whether India was too big to succeed or too big to fail. India was on the brink of severe economic failure. One unique feature of Indian economy is the high share of services in GDP. While the manufacturing sector has a minor share in GDP, it is necessary to underline the importance of this sector, which has a large multiplier effect for the economy, with not only meeting domestic demand with a consequent reduction import dependence and providing employment opportunities to people especially technically less skilled workers. Hence, the recently unveiled initiatives like the “Make in India, “Invest India” and Ease of Doing Business in India are imperative to achieve the necessary growth in the manufacturing sector in a country like India, where the majority of the population has limited education opportunities. Indian economy has experienced a promising rate of growth over the past years, even in the backdrop of sluggish performance of the world economy. However, a dampening scenario of the manufacturing sector in the country is a cause of concern. Manufactured goods have declined by 4.1 per cent in the financial year 2015-16, within which electronic and engineering goods have decreased drastically. A recent OECD paper (2015) highlighted the problem of low productivity in the manufacturing sector owing to the preponderance of small manufacturing firms who fail to take advantage of
FMS, SRMS College of Engg. & Tech. ( Bizcraft September 14 - February 15 Vol. 8, No.2 )30
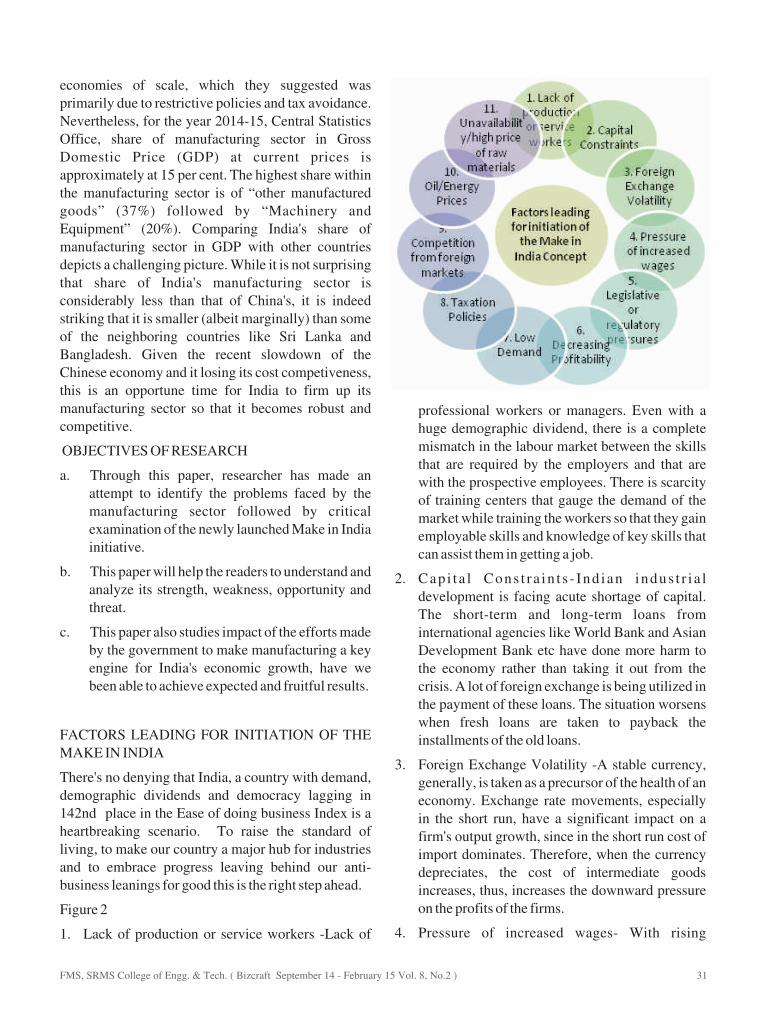
economies of scale, which they suggested was primarily due to restrictive policies and tax avoidance. Nevertheless, for the year 2014-15, Central Statistics Office, share of manufacturing sector in Gross Domestic Price (GDP) at current prices is approximately at 15 per cent. The highest share within the manufacturing sector is of “other manufactured goods” (37%) followed by “Machinery and Equipment” (20%). Comparing India's share of manufacturing sector in GDP with other countries depicts a challenging picture. While it is not surprising that share of India's manufacturing sector is considerably less than that of China's, it is indeed striking that it is smaller (albeit marginally) than some of the neighboring countries like Sri Lanka and Bangladesh. Given the recent slowdown of the Chinese economy and it losing its cost competiveness, this is an opportune time for India to firm up its manufacturing sector so that it becomes robust and competitive.
OBJECTIVES OF RESEARCH
a. Through this paper, researcher has made an attempt to identify the problems faced by the manufacturing sector followed by critical examination of the newly launched Make in India initiative.
b. This paper will help the readers to understand and analyze its strength, weakness, opportunity and threat.
c. This paper also studies impact of the efforts made by the government to make manufacturing a key engine for India's economic growth, have we been able to achieve expected and fruitful results.
FACTORS LEADING FOR INITIATION OF THE MAKE IN INDIA
There's no denying that India, a country with demand, demographic dividends and democracy lagging in 142nd place in the Ease of doing business Index is a heartbreaking scenario. To raise the standard of living, to make our country a major hub for industries and to embrace progress leaving behind our anti-business leanings for good this is the right step ahead.
Figure 2
1. Lack of production or service workers -Lack of
professional workers or managers. Even with a huge demographic dividend, there is a complete mismatch in the labour market between the skills that are required by the employers and that are with the prospective employees. There is scarcity of training centers that gauge the demand of the market while training the workers so that they gain employable skills and knowledge of key skills that can assist them in getting a job.
2. Cap i t a l Cons t r a in t s - Ind ian indus t r i a l development is facing acute shortage of capital. The short-term and long-term loans from international agencies like World Bank and Asian Development Bank etc have done more harm to the economy rather than taking it out from the crisis. A lot of foreign exchange is being utilized in the payment of these loans. The situation worsens when fresh loans are taken to payback the installments of the old loans.
3. Foreign Exchange Volatility -A stable currency, generally, is taken as a precursor of the health of an economy. Exchange rate movements, especially in the short run, have a significant impact on a firm's output growth, since in the short run cost of import dominates. Therefore, when the currency depreciates, the cost of intermediate goods increases, thus, increases the downward pressure on the profits of the firms.
4. Pressure of increased wages- With rising
FMS, SRMS College of Engg. & Tech. ( Bizcraft September 14 - February 15 Vol. 8, No.2 ) 31
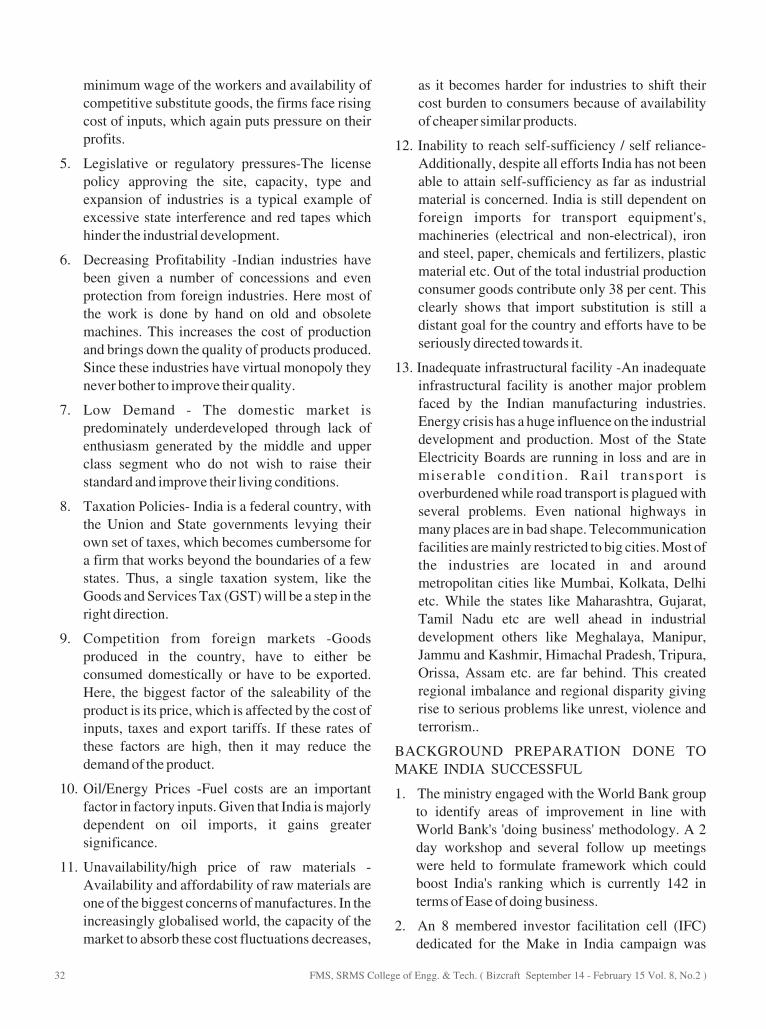
minimum wage of the workers and availability of competitive substitute goods, the firms face rising cost of inputs, which again puts pressure on their profits.
5. Legislative or regulatory pressures-The license policy approving the site, capacity, type and expansion of industries is a typical example of excessive state interference and red tapes which hinder the industrial development.
6. Decreasing Profitability -Indian industries have been given a number of concessions and even protection from foreign industries. Here most of the work is done by hand on old and obsolete machines. This increases the cost of production and brings down the quality of products produced. Since these industries have virtual monopoly they never bother to improve their quality.
7. Low Demand - The domestic market is predominately underdeveloped through lack of enthusiasm generated by the middle and upper class segment who do not wish to raise their standard and improve their living conditions.
8. Taxation Policies- India is a federal country, with the Union and State governments levying their own set of taxes, which becomes cumbersome for a firm that works beyond the boundaries of a few states. Thus, a single taxation system, like the Goods and Services Tax (GST) will be a step in the right direction.
9. Competition from foreign markets -Goods produced in the country, have to either be consumed domestically or have to be exported. Here, the biggest factor of the saleability of the product is its price, which is affected by the cost of inputs, taxes and export tariffs. If these rates of these factors are high, then it may reduce the demand of the product.
10. Oil/Energy Prices -Fuel costs are an important factor in factory inputs. Given that India is majorly dependent on oil imports, it gains greater significance.
11. Unavailability/high price of raw materials -Availability and affordability of raw materials are one of the biggest concerns of manufactures. In the increasingly globalised world, the capacity of the market to absorb these cost fluctuations decreases,
as it becomes harder for industries to shift their cost burden to consumers because of availability of cheaper similar products.
12. Inability to reach self-sufficiency / self reliance-Additionally, despite all efforts India has not been able to attain self-sufficiency as far as industrial material is concerned. India is still dependent on foreign imports for transport equipment's, machineries (electrical and non-electrical), iron and steel, paper, chemicals and fertilizers, plastic material etc. Out of the total industrial production consumer goods contribute only 38 per cent. This clearly shows that import substitution is still a distant goal for the country and efforts have to be seriously directed towards it.
13. Inadequate infrastructural facility -An inadequate infrastructural facility is another major problem faced by the Indian manufacturing industries. Energy crisis has a huge influence on the industrial development and production. Most of the State Electricity Boards are running in loss and are in miserable condition. Rail transport is overburdened while road transport is plagued with several problems. Even national highways in many places are in bad shape. Telecommunication facilities are mainly restricted to big cities. Most of the industries are located in and around metropolitan cities like Mumbai, Kolkata, Delhi etc. While the states like Maharashtra, Gujarat, Tamil Nadu etc are well ahead in industrial development others like Meghalaya, Manipur, Jammu and Kashmir, Himachal Pradesh, Tripura, Orissa, Assam etc. are far behind. This created regional imbalance and regional disparity giving rise to serious problems like unrest, violence and terrorism..
BACKGROUND PREPARATION DONE TO MAKE INDIA SUCCESSFUL
1. The ministry engaged with the World Bank group to identify areas of improvement in line with World Bank's 'doing business' methodology. A 2 day workshop and several follow up meetings were held to formulate framework which could boost India's ranking which is currently 142 in terms of Ease of doing business.
2. An 8 membered investor facilitation cell (IFC) dedicated for the Make in India campaign was
FMS, SRMS College of Engg. & Tech. ( Bizcraft September 14 - February 15 Vol. 8, No.2 )32
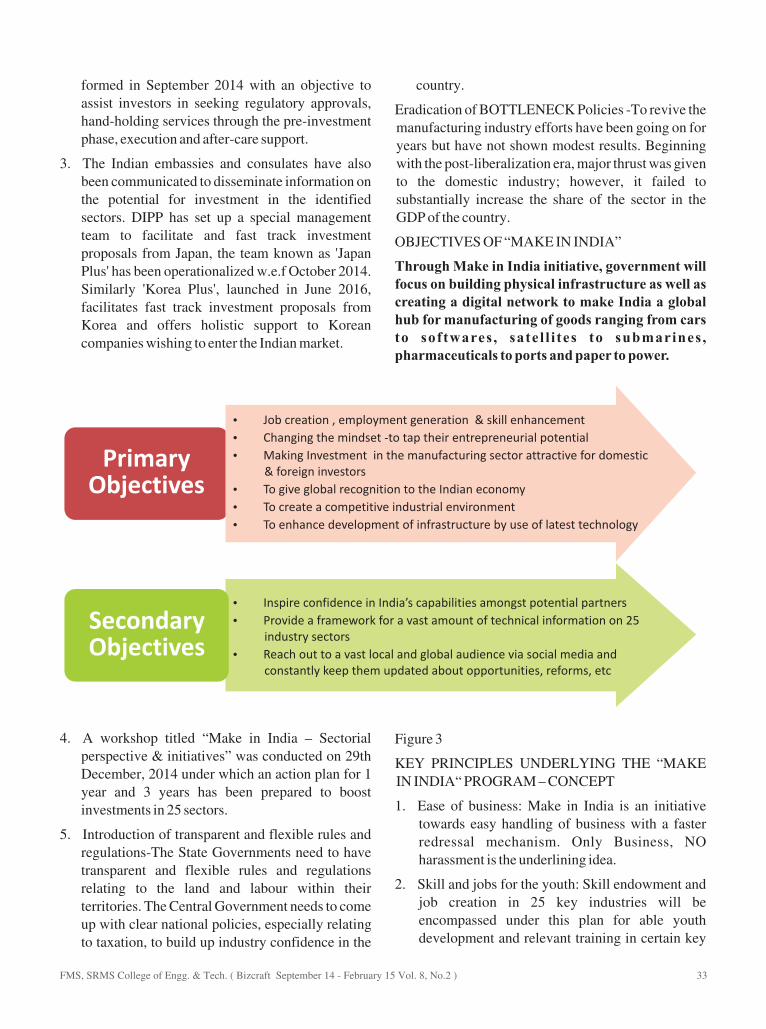
formed in September 2014 with an objective to assist investors in seeking regulatory approvals, hand-holding services through the pre-investment phase, execution and after-care support.
3. The Indian embassies and consulates have also been communicated to disseminate information on the potential for investment in the identified sectors. DIPP has set up a special management team to facilitate and fast track investment proposals from Japan, the team known as 'Japan Plus' has been operationalized w.e.f October 2014. Similarly 'Korea Plus', launched in June 2016, facilitates fast track investment proposals from Korea and offers holistic support to Korean companies wishing to enter the Indian market.
4. A workshop titled “Make in India – Sectorial perspective & initiatives” was conducted on 29th December, 2014 under which an action plan for 1 year and 3 years has been prepared to boost investments in 25 sectors.
5. Introduction of transparent and flexible rules and regulations-The State Governments need to have transparent and flexible rules and regulations relating to the land and labour within their territories. The Central Government needs to come up with clear national policies, especially relating to taxation, to build up industry confidence in the
country.
Eradication of BOTTLENECK Policies -To revive the manufacturing industry efforts have been going on for years but have not shown modest results. Beginning with the post-liberalization era, major thrust was given to the domestic industry; however, it failed to substantially increase the share of the sector in the GDP of the country.
OBJECTIVES OF “MAKE IN INDIA”
Through Make in India initiative, government will focus on building physical infrastructure as well as creating a digital network to make India a global hub for manufacturing of goods ranging from cars to softwares , satel l i tes to submarines , pharmaceuticals to ports and paper to power.
Figure 3
KEY PRINCIPLES UNDERLYING THE “MAKE IN INDIA“ PROGRAM – CONCEPT
1. Ease of business: Make in India is an initiative towards easy handling of business with a faster redressal mechanism. Only Business, NO harassment is the underlining idea.
2. Skill and jobs for the youth: Skill endowment and job creation in 25 key industries will be encompassed under this plan for able youth development and relevant training in certain key
Primary Objectives
?Job creation , employment generation & skill enhancement
?Changing the mindset -to tap their entrepreneurial potential
?Making Investment in the manufacturing sector attractive for domestic & foreign investors
?To give global recognition to the Indian economy
?To create a competitive industrial environment
?To enhance development of infrastructure by use of latest technology
Secondary Objectives
?Inspire confidence in India’s capabilities amongst potential partners
?Provide a framework for a vast amount of technical information on 25 industry sectors
?Reach out to a vast local and global audience via social media and constantly keep them updated about opportunities, reforms, etc
FMS, SRMS College of Engg. & Tech. ( Bizcraft September 14 - February 15 Vol. 8, No.2 ) 33
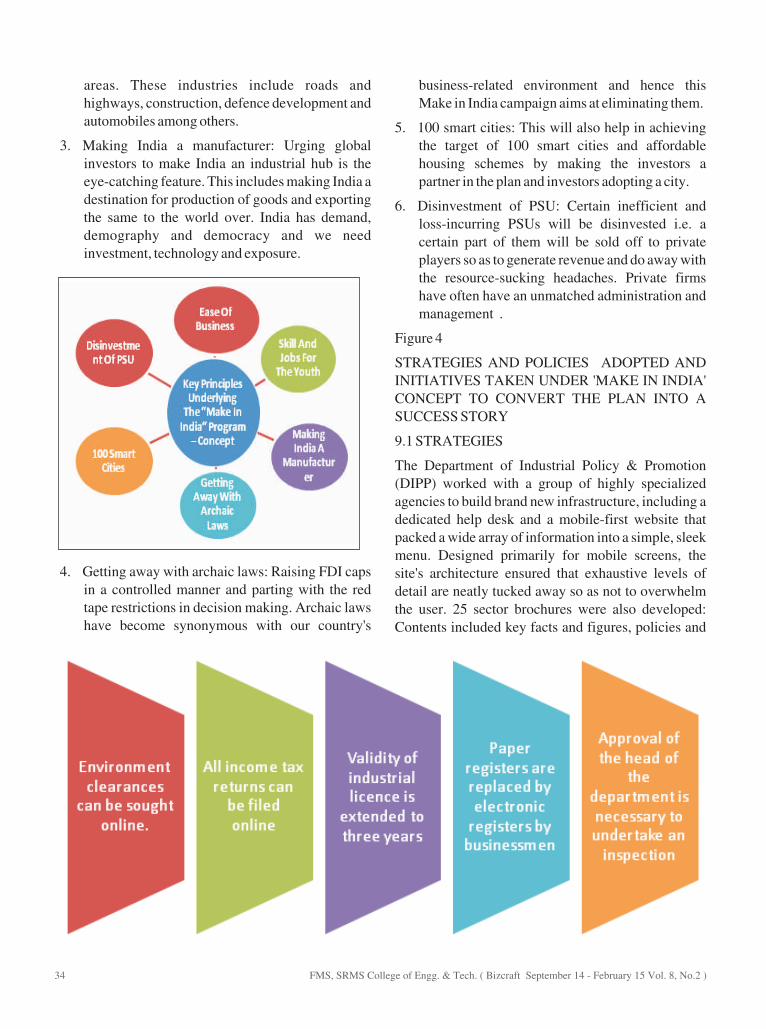
areas. These industries include roads and highways, construction, defence development and automobiles among others.
3. Making India a manufacturer: Urging global investors to make India an industrial hub is the eye-catching feature. This includes making India a destination for production of goods and exporting the same to the world over. India has demand, demography and democracy and we need investment, technology and exposure.
4. Getting away with archaic laws: Raising FDI caps in a controlled manner and parting with the red tape restrictions in decision making. Archaic laws have become synonymous with our country's
business-related environment and hence this Make in India campaign aims at eliminating them.
5. 100 smart cities: This will also help in achieving the target of 100 smart cities and affordable housing schemes by making the investors a partner in the plan and investors adopting a city.
6. Disinvestment of PSU: Certain inefficient and loss-incurring PSUs will be disinvested i.e. a certain part of them will be sold off to private players so as to generate revenue and do away with the resource-sucking headaches. Private firms have often have an unmatched administration and management .
Figure 4
STRATEGIES AND POLICIES ADOPTED AND INITIATIVES TAKEN UNDER 'MAKE IN INDIA' CONCEPT TO CONVERT THE PLAN INTO A SUCCESS STORY
9.1 STRATEGIES
The Department of Industrial Policy & Promotion (DIPP) worked with a group of highly specialized agencies to build brand new infrastructure, including a dedicated help desk and a mobile-first website that packed a wide array of information into a simple, sleek menu. Designed primarily for mobile screens, the site's architecture ensured that exhaustive levels of detail are neatly tucked away so as not to overwhelm the user. 25 sector brochures were also developed: Contents included key facts and figures, policies and
FMS, SRMS College of Engg. & Tech. ( Bizcraft September 14 - February 15 Vol. 8, No.2 )34
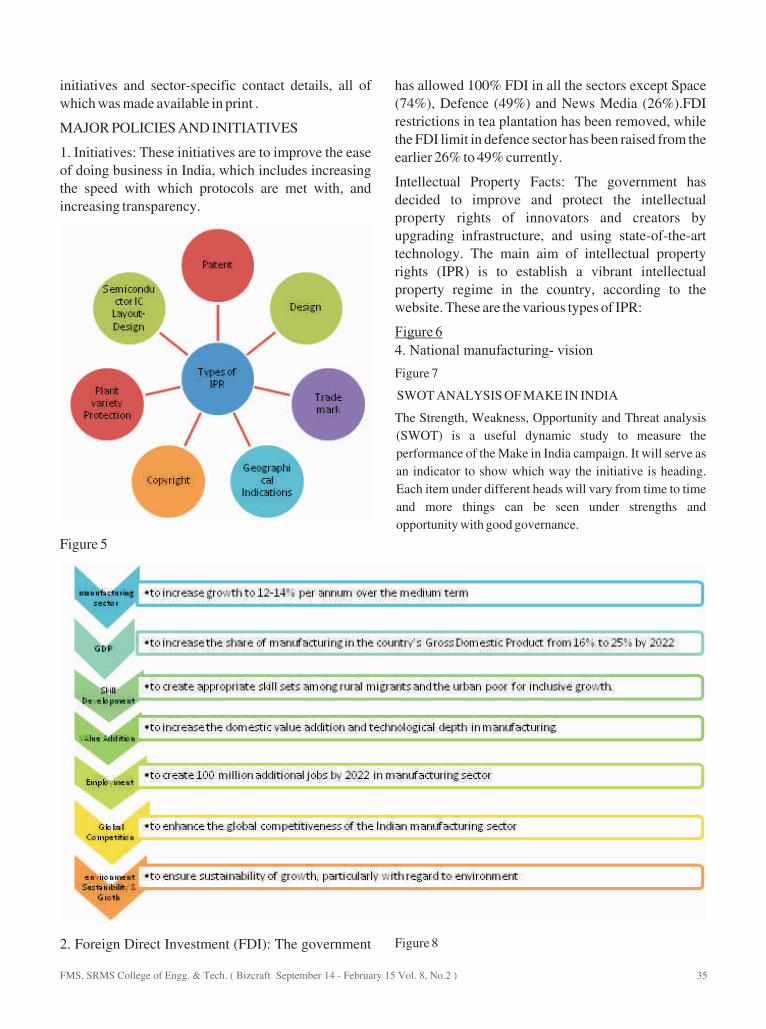
initiatives and sector-specific contact details, all of which was made available in print .
MAJOR POLICIES AND INITIATIVES
1. Initiatives: These initiatives are to improve the ease of doing business in India, which includes increasing the speed with which protocols are met with, and increasing transparency.
Figure 5
2. Foreign Direct Investment (FDI): The government
has allowed 100% FDI in all the sectors except Space (74%), Defence (49%) and News Media (26%).FDI restrictions in tea plantation has been removed, while the FDI limit in defence sector has been raised from the earlier 26% to 49% currently.
Intellectual Property Facts: The government has decided to improve and protect the intellectual property rights of innovators and creators by upgrading infrastructure, and using state-of-the-art technology. The main aim of intellectual property rights (IPR) is to establish a vibrant intellectual property regime in the country, according to the website. These are the various types of IPR:
Figure 7
SWOT ANALYSIS OF MAKE IN INDIA
The Strength, Weakness, Opportunity and Threat analysis
(SWOT) is a useful dynamic study to measure the
performance of the Make in India campaign. It will serve as
an indicator to show which way the initiative is heading.
Each item under different heads will vary from time to time
and more things can be seen under strengths and
opportunity with good governance.
Figure 8
Figure 6
4. National manufacturing- vision
FMS, SRMS College of Engg. & Tech. ( Bizcraft September 14 - February 15 Vol. 8, No.2 ) 35
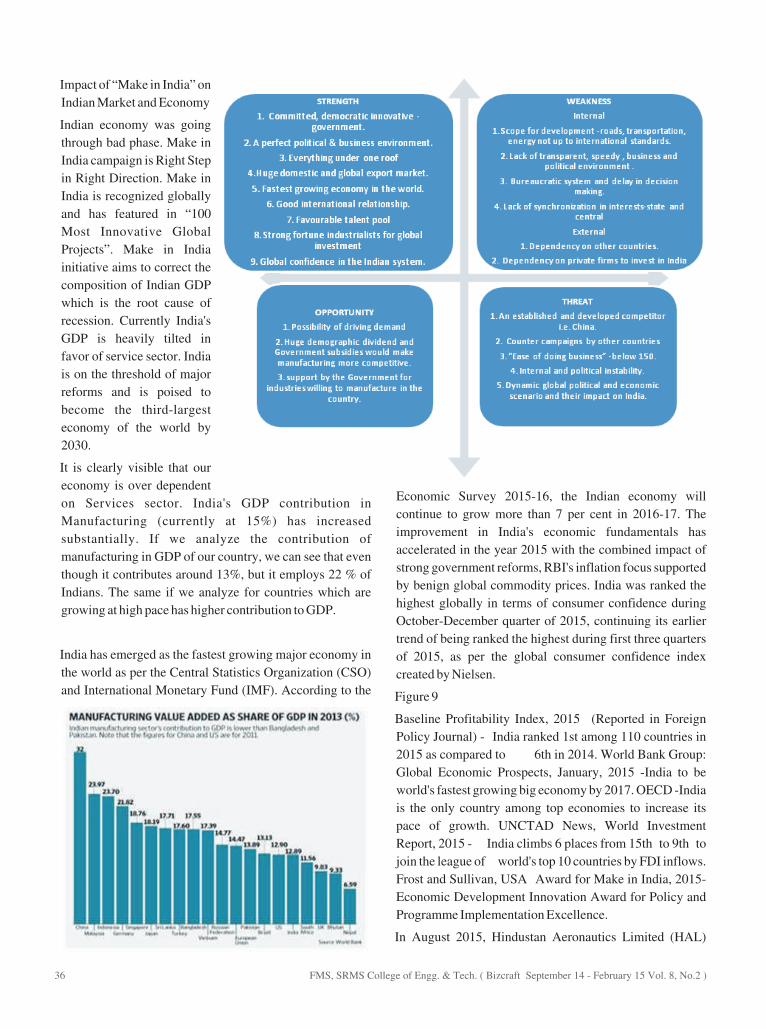
Impact of “Make in India” on
Indian Market and Economy
Indian economy was going
through bad phase. Make in
India campaign is Right Step
in Right Direction. Make in
India is recognized globally
and has featured in “100
Most Innovative Global
Projects”. Make in India
initiative aims to correct the
composition of Indian GDP
which is the root cause of
recession. Currently India's
GDP is heavily tilted in
favor of service sector. India
is on the threshold of major
reforms and is poised to
become the third-largest
economy of the world by
2030.
It is clearly visible that our
economy is over dependent
on Services sector. India's GDP contribution in
Manufacturing (currently at 15%) has increased
substantially. If we analyze the contribution of
manufacturing in GDP of our country, we can see that even
though it contributes around 13%, but it employs 22 % of
Indians. The same if we analyze for countries which are
growing at high pace has higher contribution to GDP.
India has emerged as the fastest growing major economy in
the world as per the Central Statistics Organization (CSO)
and International Monetary Fund (IMF). According to the
Economic Survey 2015-16, the Indian economy will
continue to grow more than 7 per cent in 2016-17. The
improvement in India's economic fundamentals has
accelerated in the year 2015 with the combined impact of
strong government reforms, RBI's inflation focus supported
by benign global commodity prices. India was ranked the
highest globally in terms of consumer confidence during
October-December quarter of 2015, continuing its earlier
trend of being ranked the highest during first three quarters
of 2015, as per the global consumer confidence index
created by Nielsen.
Figure 9
Baseline Profitability Index, 2015 (Reported in Foreign
Policy Journal) - India ranked 1st among 110 countries in
2015 as compared to 6th in 2014. World Bank Group:
Global Economic Prospects, January, 2015 -India to be
world's fastest growing big economy by 2017. OECD -India
is the only country among top economies to increase its
pace of growth. UNCTAD News, World Investment
Report, 2015 - India climbs 6 places from 15th to 9th to
join the league of world's top 10 countries by FDI inflows.
Frost and Sullivan, USA Award for Make in India, 2015-
Economic Development Innovation Award for Policy and
Programme Implementation Excellence.
In August 2015, Hindustan Aeronautics Limited (HAL)
FMS, SRMS College of Engg. & Tech. ( Bizcraft September 14 - February 15 Vol. 8, No.2 )36

began talks with Russia's Irkut Corp to transfer technology
of 332 components of the Sukhoi Su-30MKI fighter aircraft
under the Make in India program. These components, also
called line replacement units (LRUs) refer to both critical
and non-critical components and fall into four major heads
such as Radio and Radar; Electrical & Electronics System;
Mechanical System and Instrument System.
The Ministry of Defence is auctioning a 600 billion (US$8.9
billion) contract to design and build a Fighting Infantry
Combat Vehicle (FICV) in India. The contract will be
awarded in 2016.
In February 2016, Lockheed Martin stated that it was "ready
to manufacture F-16 in India and support the Make in India
initiative", although it did not announce any time frame.
According to IMF World Economic Outlook Update
(January 2016), Indian economy is expected to grow at 7-
7.75 per cent during FY 2016-17, despite the uncertainties
in the global market. The Economic Survey 2015-16 had
forecasted that the Indian economy will growing by more
than seven per cent for the third successive year 2016-17
and can start growing at eight per cent or more in next two
years. Foreign direct investment (FDI) in India have
increased by 29 per cent during October 2014-December
2015 period post the launch of Make in India campaign,
compared to the 15-month period before the launch. The
Nikkei/Markit Manufacturing Purchasing Managers' Index
(PMI) for February 2016 was reported at 51.1, indicating
expansion in Indian manufacturing activity for a second
month in a row, as both domestic and foreign demand
increased due to lower prices. The steps taken by the
government in recent times have shown positive results as
India's gross domestic product (GDP) at factor cost at
constant (2011-12) prices 2015-16 is Rs 113.5 trillion (US$
1.668 trillion), as against Rs 105.5 trillion (US$ 1.55
trillion) in 2014-15, registering a growth rate of 7.6 per cent.
The economic activities which witnessed significant
growth were 'financing, insurance, real estate and business
services' at 11.5 per cent and 'trade, hotels, transport,
communication services' at 10.7 per cent.
According to a Goldman Sachs report released in
September 2015, India could grow at a potential 8 per cent
on average during from fiscal 2016 to 2020 powered by
greater access to banking, technology adoption,
urbanization and other structural reforms.
Milestones Which Will Revive Economy
India has emerged as one of the strongest performers with
respect to deals across the world in terms of Aergers and
Acquisitions (M&A). The total transaction value of M&A
involving Indian companies stood at US$ 26.3 billion with
930 deals in 2015 as against US$ 29.4 billion involving 870
deals in 2014.In the M&A space, Telecom was the
dominant sector, amounting to 40 per cent of the total
transaction value. Also, Private equity (PE) investments
increased 86 per cent y-o-y to US$ 1.43 billion. Total
private equity (PE) investments in India for 2015 reached a
record high of US$ 19.5 billion through 159 deals,
according to the PwC Money Tree India report. According
to The World Bank, India's per capita income is expected to
cross Rs 100,000 (US$ 1,505.4) in FY 2017 from Rs 93,231
(US$ 1,403.5) in FY 2016. This initiative is expected to
increase the purchasing power of an average Indian
consumer, which would further boost demand, and hence
spur development, in addition to benefiting investors.
:
1. The Union Cabinet has approved the introduction of
several short term (within one year) and medium
term measures (within two years) to be implemented
by government ministries, departments and
organisations for promotion of payments through
cards and digital means, and to reduce cash
transactions.
2. The Government of India plans to build five new
railway links with Nepal, which will boost India's
economic links with its neighbouring country and
promote growth, employment and prosperity in the
region.
3. Government of India plans to create a National
Investment Grid to map business opportunities
across the country which will make it easier for
investors, especially domestic investors, to access
and explore investment opportunities.
4. British telecom giant Vodafone, India's second
largest telecom operator, plans to invest over Rs
13,000 crore (US$ 1.91 billion) in India, to upgrade
and expand its network and also for its payments
bank operations.
5. Chinese smartphone handset maker, Vivo, has set
up an assembly unit in India at Greater Noida which
will initially manufacture 150,000 smartphone units
a month, to produce three smartphone models,
namely Y11, Y21 and Y15S.
6. Foxconn Technology group, Taiwan's electronics
manufacturer, is planning to manufacture Apple
iPhones in India. Besides, Foxconn aims to establish
FMS, SRMS College of Engg. & Tech. ( Bizcraft September 14 - February 15 Vol. 8, No.2 ) 37
10-12 facilities in India including data centers and
factories by 2020.
7. US-based First Solar Inc and China's Trina Solar
have plans to set up manufacturing facilities in
India. Clean energy investments in India increased
to US$ 7.9 billion in 2014, helping the country
maintain its position as the seventh largest clean
energy investor in the world.
8. Hyderabad is set to become the mobile phone
manufacturing hub in India and is expected to create
150,000 – 200,000 jobs. Besides, the Telangana
Government aims to double IT exports to Rs 1.2
trillion (US$ 17.61 billion) by 2019.
9. General Motors plans to invest US$1 billion in India
by 2020, mainly to increase the capacity at the
Talegaon plant in Maharashtra from 130,000 units a
year to 220,000 by 2025.
10. Hyundai Heavy Industries (HHI) and Hindustan
Shipyard Ltd have joined hands to build warships in
India. Besides, Samsung Heavy Industries and
Kochi Shipyard will be making Liquefied Natural
Gas (LNG) tankers.
11. The Ministry of Human Resource Development
recently launched KendriyaVidyalayaSangthan's
(KVS) e-initiative 'KV ShaalaDarpan' aimed at
providing information about students electronically
on a single platform. The program is a step towards
realising Digital India and will depict good
governance.
12. The Government of India announced that all the
major tourist spots like Sarnath, Bodhgaya and Taj
Mahal will have a Wi-Fi facility as part of digital
India initiative. Besides, the Government has started
providing free Wi-Fi service at Varanasi ghats.
13. Based on the recommendations of the Foreign
Investment Promotion Board (FIPB), FDI inflows
have increased 40 per cent during April-December
2015 to reach US$ 29.44 billion.
The International Monetary Fund (IMF) and the Moody's
Investors Service have forecasted that India will witness a
GDP growth rate of 7.5 per cent in 2016, due to improved
investor confidence, lower food prices and better policy
reforms. Besides, according to mid-year update of United
Nations World Economic Situation and Prospects, India is
expected to grow at 7.6 per cent in 2015 and at 7.7 per cent in
2016. As per the latest Global Economic Prospects (GEP)
report by World Bank, India is leading The World Bank's
growth chart for major economies. The Bank believes India
to become the fastest growing major economy growing at
7.5 per cent.
According to Mr Jayant Sinha, Minister of State for
Finance, Indian economy would continue to grow at 7 to 9
per cent and would double in size to US$ 4–5 trillion in a
decade, becoming the third largest economy in absolute
terms.
A N A L Y S I S O F T H E P E R F O R M A N C E
EFFECTIVENESS OF THE PROGRAM
The effectiveness of these programs, some barely few
months old, cannot be fully assessed until they mature over
the next several years. However, preliminary assessments
can be made on the basis of industry projections, the level of
collaboration between central and state governments, the
commitment of private sector participants, and FDI flows.
India ranked 130th out of 189 countries in the World Bank's
2016 ease of doing business index, covering the period from
June 2014 and June 2015. India was ranked 134th in the
2015 index.
January–June 2015
?In January 2015, the Spice Group said it would start a
mobile phone manufacturing unit in Uttar Pradesh with an
investment of 5 billion (US$74 million). A memorandum of
understanding was signed between the Spice Group and the
Government of Uttar Pradesh.
?? In January 2015, Hyun Chil Hong, the President & CEO
of Samsung South Asia, met with Kalraj Mishra, Union
Minister for Micro, Small and Medium Enterprises
(MSME), to discuss a joint initiative under which 10
"MSME-Samsung Technical Schools" will be
established in India. In February, Samsung said that
will manufacture the Samsung Z1 in its plant in Noida.
?? In February 2015, Hitachi said it was committed to the
initiative. It said that it would increase its employees in
India from 10,000 to 13,000 and it would try to increase
its revenues from India from ¥100 billion in 2013 to
¥210 billion. It said that an auto-component plant will
be set up in Chennai in 2016.
?? In February 2015, Huawei opened a new research and
development (R&D) campus in Bengaluru. It had
invested US$170 million to establish the research and
development centre.It is also in the process of setting up
a Telecom hardware manufacturing plant in Chennai,
the approvals of which have been granted by the central
FMS, SRMS College of Engg. & Tech. ( Bizcraft September 14 - February 15 Vol. 8, No.2 )38

government.]Also in February, Marine Products
Export Development Authority said that it was
interested in supplying shrimp eggs to shrimp farmers
in India under the initiative.
?? In February 2015, Xiaomi began initial talks with the
Andhra Pradesh government to begin manufacturing
smartphones at a Foxconn-run facility in Sri City. On 11
August 2015, the company announced that the first
manufacturing unit was operational and introduced the
Xiaomi Redmi 2 Prime, a smartphone that was
assembled at the facility. Xiaomi India chief executive
Manu Jain stated, "We announced our Make in India
plans in the beginning of this year 2015. We thought it
would take us two years to set up this manufacturing
plant. But surprisingly we were able to set up
everything and our production started within seven
months."
?? In June 2015, France-based LH Aviation signed an
MoU with OIS Advanced Technologies to set up a
manufacturing plant in India to manufacture drones.
July–December 2015
?? On 8 August 2015, Foxconn announced that it would
invest US$5 billion over five years to set up a research
and development and hi-tech semiconductor
manufacturing facility in Maharashtra. Less than a
week earlier, General Motors had announced that it
would invest US$1 billion to begin manufacturing
automobiles in the state.
?? On 18 August 2015, Lenovo announced that it had
begun manufacturing Motorola smartphones at a plant
in Sriperumbudur near Chennai, run by Singapore-
based contract manufacturer Flextronics International
Ltd. The plant has separate manufacturing lines for
Lenovo and Motorola, as well as quality assurance, and
product testing. The first smartphone manufactured at
the facility was the 4G variant of the Motorola Moto E
(2nd generation).
?? On 16 October 2015, Boeing chairman James
McNerney said that the company could assemble
fighter planes and either the Apache or Chinook
defence helicopter in India. The company is also
willing to manufacture the F/A-18 Super Hornet in
India if the Indian Air Force (IAF) were to purchase it.
?? In November 2015, Taiwan's Wistron Corp, which
makes devices for companies such as Blackberry, HTC
and Motorola, announced that it would begin
manufacturing the devices at a new factory in Noida,
Uttar Pradesh. A company spokesperson stated, "The
government's 'Make in India' campaign, coupled with
the country's growing consumption, makes an excellent
case for the Indian manufacturing sector to emerge as a
global manufacturing hub across sectors."
?? On 30 November 2015, the Ministry of Railways
signed formal agreements with Alstom and GE
Transport worth 400 billion (US$5.9 billion) to set-up
locomotive manufacturing factories in Madhepura and
Marhaura in Bihar.
?? In December 2015, Qualcomm announced that it was
starting a "Design in India" programme to help mentor
up to ten Indian hardware companies with the potential
to come up with innovative solutions and help them
reach scale. Qualcomm chairman had promised Prime
Minister Modi that they would do so during the latter's
visit to Silicon Valley in September 2015. As part of the
programme, the company will set up an Innovation Lab
in Bengaluru to provide technical and engineering
support to the selected companies. In the same month,
Micromax announced that it would three new
manufacturing units in Rajasthan, Telangana and
Andhra Pradesh at a cost of 3 billion (US$45 million).
The plants will begin functioning in 2016, and will each
employ 3,000-3,500 people.
?? Following Japanese Prime Minister Shinzo Abe's visit
to India in December 2015, it was announced that Japan
would set up a US$12 billion fund for Make in India
related projects called the "Japan-India Make-in-India
Special Finance Facility".In late December, phone
manufacturer Vivo Mobile India began manufacturing
smartphones at a plant in Greater Noida. The plant
employs 2,200 people.
?? A defence deal was signed during Prime Minister
Narendra Modi's visit to Russia in December 2015
which will see the Kamov Ka-226 multi-role helicopter
being built in India. This is widely seen as the first
defence deal to be actually signed under the Make in
India campaign.
Key Deals signed and Initiated in 2016
1. Sterlite Group company TwinStar Display
Technologies & MIDC for LCD manufacturing unit
in technical collaboration with Autron of Taiwan
2. BAE Systems and Mahindra for assembling and
testing of M777 Howitzers
3. ORACLE's USD 400 million investment in India to
FMS, SRMS College of Engg. & Tech. ( Bizcraft September 14 - February 15 Vol. 8, No.2 ) 39
set up 9 incubation center
4. Trivitron healthcare manufacturing unit in Chennai
5. Gujarat Government and Vestas (Denmark) for wind
mill blades manufacturing unit at Ahmedabad
6. Raymond Industries to invest Rs. 1400 crore for
manufacturing linen yarn and fabric facility
7. Mahindra & Mahindra: Investment – Rs. 8000 crores
(Nashik: Rs. 6500 crores, Chakan – Rs. 1,500 crore)
8. Gujarat Government and Tar Kovacs Systems
(France) for offshore platform to develop marine
applications in Gujarat
9. Tar Kovacs and Government of Karnataka for setting
up ocean based renewable energy project
10. Yes Bank and IREDA for financing of renewable
power projects
11. Ascendas | Investment: Rs. 4571 crore |
Employment: 1.09 Lakh
12. Mercedes | Investment: Rs. 1500 crore |
Employment: 4270
13. Rashtriya Chemicals and Fertilizers | Investment: Rs.
6204 cr | Employment: 140
14. Godrej Industries| Investment: Rs. 3000 cr |
Employment: 2000
15. JSW Jaigarh Port Ltd | Investment: Rs. 6000 crores |
Employment: 1000
16. CREDAI and MCHI for 5.7 Lakh affordable homes
with an investment of Rs.1.1 lakh crore and 7.6 lakh
jobs
17. Government of Jharkhand and Vedanta Ltd
18. Government of Jharkhand and Adani group to set up
a thermal power plant with a total capacity of 1,600
MW to be supplied to Bangladesh Grid
19. Agreement between Government of Jharkhand and
Adani Group to set up a Coal based Methane
fertilizer plant
20. Uber and Skill Development and Entrepreneurship
Department (SDED) of the Maharashtra government
?21. Solar Industries and Government of Maharashtra to
set up a Nagpur plant for manufacturing of
ammunition for armed force
The listed points have been taken from various discussions
held at various forums helping in analyzing the performance
effectiveness of the program
?? Value-added Manufacturing: Unlike major
manufacturing economies where workers are moving
towards hi-tech manufacturing units, Indian workers
are ready to take up the challenge of working in low
value-added manufacturing units.
?? Ease of Doing Business: Government has initiated steps
to create “one-day procedure” by identifying eight key
areas. This would reduce the procedure time to start a
business from 27 days to 1 day as in developed
countries like New Zealand, Canada, etc. Tax payments
are expected to be simplified in the near future.
?? Single country dependency: Many companies in the
developed world like US, Japan, etc are looking to
outsource from more than one country to avoid risk of
dependence on one country. India is a potential
alternative for these companies to look forward to.
?? Foreign Direct Investment: FDI cap in railways has
already increased, and investment portals have been
created to draw the attention of global investors. Recent
visits to Japan and China by the Prime Minister is
expected to bring in significant investments into
Infrastructure sector and towards revitalizing the
backbone of our transport system - Indian Railways.
?? State Empowerment: All states in India are advised to
issue self-certification for manufacturing that avoids
delays and complexities.
?? Taxation system: Introduction of the GST that would
essentially replace all the indirect taxes would aid in
redistributing the burden of taxation equitably between
manufacturing and services. It will foster a common
market across the country reducing the compliance
costs and will facilitate investment decisions being
made on purely economic concerns, independent of tax
considerations.
?? Scaling up capabilities: Building the infrastructure of
the future – including i-ways besides highways and
industrial corridors like DMIC, together with the
mentioned port-led model of economic development,
optical fibre networks, gas grids and water grids would
fast-track our progress towards becoming a developed
nation. Digital India mission would ensure that
Government processes remain in tune with corporate
processes.
?? Advancement and enhancement in Electronic System
and Design Manufacturing-Following up on the call to
Make in India, consumer electronics manufacturing
companies have led the way with some concrete
FMS, SRMS College of Engg. & Tech. ( Bizcraft September 14 - February 15 Vol. 8, No.2 )40

investments. The industry recently witnessed
significant investments by smartphone makers Lenovo
& Motorola, Sony, Xiaomi and Gionee. Some
executives from these companies point to Make in India
as influencing their decision to begin local production.
Other global smartphone makers like Asus, Oppo and
HTC have similarly expressed their interest in
manufacturing in India.
?Automotive-In the automobile industry, the Make in
India campaign has highlighted automatic approval for
foreign equity investment up to 100 percent with no
minimum investment criteria, and that manufacturing
and imports are exempt from licensing and approvals.
Responding to this, major foreign players have
announced plans to manufacture components for
luxury cars – such as Mercedes Benz – and localizing
manufacturing to lower costs – such as BMW, Volvo,
Renault and Ford.
?Auto component manufacturing in India is already
genuinely competitive in the global market – Hyundai,
Honda, and Toyota all make parts in India on a reliable
basis and are increasing exports. However, Make in
India is increasing the country's reputation in the
industry. Recently, General Motors announced it will
invest US $1 billion in its bid to make cars for domestic
consumption and export.
?Defense-To support Make in India, the government has
recently raised the FDI cap for defense manufacturing
up to 49 percent and eased some other regulations for
the industry. These reforms have caused a flurry of
investment activity. Hyundai Heavy Industries (HHI)
of South Korea has announced it will work with
Hindustan Shipyard Limited to build warships in India,
while Samsung has agreed to build LNG tankers with
Kochi Shipyard. Reliance Infrastructure is in
discussion with multiple partners to build nuclear
submarines and stealth warships in India.
?U.S. defense manufacturer Lockheed Martin has been
granted clearance for a project office in New Delhi.
Their largest programme in India is the C-130J Super
Hercules, and through its joint venture with Tata
Advanced Systems, Tata Lockheed Martin
Aerostructures will manufacture airframe components
for the C-130J.
?Renewable Energy-The solar industry has also
benefited from the Make in India initiative as the
government has projected the sector to be a US $100
billion investment magnet over the next seven years.
The government has designed an attractive incentive
package to help achieve this target with foreign
companies of all sizes. A number of major corporations
have announced investments in the past year, including
Foxconn, SoftBank, Bharati Enterprises, Adani.
?Through this project 30,000 top firms across the world
has been sent invite, to come invest in India and become
a part in making India a manufacturing hub. Instead of
being a dumping ground for the companies across the
world, India could attain a unique position of
manufacturing excellence by this program.
It has lead to strengthening of Rupee against dollar
At present India is humongous importer of finished goods
in various sectors, which is shameful because we export
large amount of raw material required to produce these
goods. So why not we foster technical excellence, with skill
enhancement in our workers and build world class products
for our own consumption as well as for export.
Not to mention the fact that it will have a domino effect
for all the other sectors. Large number of companies will set
up shop in India, which will lead to increase in Service
Sector growth. With the increase in number of projects with
this campaign, there will be boom in IT Sectors that will
cater to the projects locally.
Now with make in India our government is trying to
dilute the policy of investment in India. The idea is not new,
but the thing is wide scale implementation across all state.
Not to go too far, we have states that have already done
these things at their level to promote industries. Look at
Karnataka, this whole thing started when Texas
Instruments came to India. They wanted to develop their
hub here but the state government were in fray to harass
them. At that time, than CM of karnataka stepped up and
helped them through and Bangalore is now Silicon valley
of India. Same deeds were done to promote IT industry in
Andhra and now we see Hyderabad. Same story happenned
to Chennai, is now called Detroit of Asia. Gujarat, Pune are
examples that thing they are doing it is not imposible. The
whole thing is it takes some time to make big things to get
completed, it will not be too soon, but it's result will hail
India.
You will see things happening nationwide and our
economy booming like never before.
CONCLUSION
Unfortunately, for India, the industrial wave in the post-
independence phase failed to catch up and the direct
transition to a service led growth meant that large number of
FMS, SRMS College of Engg. & Tech. ( Bizcraft September 14 - February 15 Vol. 8, No.2 ) 41
people could not find opportunities that aligned to their
capabilities. Thus, a large number of our populace is still
engaged in agriculture, where there is a possibility of
disguised unemployment. Therefore, it is essential that the
manufacturing sector of the country be developed so that
India is able to utilize its untapped demographic advantage,
which countries like China have employed to become the
world's largest demographic hub. “Make in India” has a
tremendous potential of reforming the manufacturing
sector of the country. In order to make a wholesome
development of the sector there should be complementary
improvements in infrastructure, labour, policies and rules
and regulations in the country.
The Government has initiated in developing smart
cities and industrial corridors in some key areas and has
started working on five smart cities as part of the Delhi-
Mumbai Industrial Corridor. On skilling the workforce,
recent initiatives by the Government like the “Pradhan
Mantri Kaushal Vikas Yojana (PMKVY)”, which aims at
aligning its training programs with important programmes
('Swachh Bharat', 'Make in India', 'Digital India', 'National
Solar Mission' etc.) is a significant step in solving the
problem of unproductive labour force in India. For
facilitating investment, we need to build trust of both the
foreign and domestic investors, and ensure that there is
“ease of doing business” in India through transparent and
less cumbersome procedures.
This is now quite obvious as in the “Make in India”
week in the year 2016 the initiative received Rs. 15.2 lakh
crore investment proposals. In a short space of time, the
obsolete and obstructive frameworks of the past have been
dismantled and replaced with a transparent and user-
friendly system that is helping drive investment, foster
innovation, develop skills, protect IP and build best-in-class
manufacturing infrastructure. The most striking indicator
of progress is the unprecedented opening up of key sectors –
including Railways, Defence, Insurance and Medical
Devices – to dramatically higher levels of Foreign Direct
Investment.
The make in India has been fairly successful at its inception,
if we analyze the buzz that it has created not only in India
but throughout the world too. Today, India's credibility is
stronger than ever. There is visible momentum, energy and
optimism.
FMS, SRMS College of Engg. & Tech. ( Bizcraft September 14 - February 15 Vol. 8, No.2 )42
REFERENCE
1. Challenges and Opportunities of India's Manufacturing Sector”, Joumard, I., U. Sila and H. Morgavi (2015), OECD
2. Cohen, Stephen S., and John Zysman. "Why manufacturing matters: The myth of the post-industrial economy."
California Management Review 29.3 (1987): 9-26.
3. India Manufacturing Barometer 2014 Turning the corner, Pricewaterhousecoopers India
4. Investment Opportunities in India, Department of Industrial Policy & Promotion
5. Saurabh Sanyal, 'Exploring prospects of make in India and made in India'.
6. Dr.T.V. Ramana, 2015, Make in India: Illusion or Possible Reality Check?, International Journal of Academic
Research.
E -REFERENCE
1. "Look East, Link West, says PM Modi at Make in India launch". Hindustan Times. 25 September 2014.
2. Jump up^ "Centre, States to ready 'Make in India' plan". The Hindu. 28 December 2014. Retrieved 28 February 2015.
3. ^ Jump up to:a b "Focus on 'Make In India'". Business Standard. 25 September 2014. Retrieved 27 February 2015.
4. Jump up^ "7 facts not known about PM Modi's Make In India". Newsroom Post. 27 May 2015. Retrieved 27 May
2015.
5. Jump up^ "Modi for 'zero defect' Make in India products". The Hindu Business Line. 29 December 2014. Retrieved 27
February 2015.
6. Jump up^ "Revealed: Man behind PM's Make in India campaign". DNA India. 18 November 2014. Retrieved 27
February 2015.
7. Jump up^ "Modi Launches 'Make in India' Campaign, Portal and Logo". The New Indian Express. 26 September 2014.
Retrieved 27 February 2015.
8. Jump up^ "Cabinet approves raising (FDI) cap in defense to 49 per cent, opens up railways". The Economic Times. 7
August 2014. Retrieved 9 March 2015.
9. Jump up^ "Make in India: Centre gets Rs 1.20 lakh crore worth investment proposals in electronics sector".
timesofindia-economictimes.
10. Jump up^ Press Trust of India (24 August 2015). "Global Electronics Manufacturers Propose Rs 90,000 Crore
Investment In India". Huffingtonpost.in. Retrieved 1 October 2015.
11. Jump up^ "Make in India: Govt receives proposals worth Rs 90,000 crore from global electronics companies".
Dnaindia.com. 24 August 2015. Retrieved 1 October 2015.
12. Jump up^ "E-boost for Make in India: Global electronic companies line up Rs 90,000 cr for India plants". Firstpost.
Retrieved 1 October 2015.
13. Jump up^ "India pips US, China as No. 1 foreign direct investment destination". The Times of India. Times News
Network. 30 Sep 2015.
14. Jump up^ "India Pips China, US to Emerge as Favourite Foreign Investment Destination". Profit.ndtv.com.
15. Jump up^ "Pay-off time for Modi: India displaces US, China as the top FDI destination in 2015". Firstpost. 29 July
2015.
16. ^ Jump up to:a b "Digital India Initiative To Transform Country, Says Ravi Shankar Prasad", NDTV, 15 February
2016
17. Jump up^ "Sectors". Make In India. Archived from the original on 14 August 2015. Retrieved 1 October 2015.
18. Jump up^ "PM Modi's 'Make in India' turns one: All you need to know about the initiative". dna. 25 September 2015.
URL
1. https://en.wikipedia.org/wiki/Make_in_India
2. http://www.nitinbhatia.in/views/make-in-india/
3. www.makeinindia.com
FMS, SRMS College of Engg. & Tech. ( Bizcraft September 14 - February 15 Vol. 8, No.2 ) 43

E-mail : [email protected] Website : www.srmscet-lkr.ac.in
E-mail : [email protected] Website : www.ibs.srms.ac.in
E-mail : [email protected]
E-mail : [email protected] Website : www.srmscet.edu
E-mail : [email protected] Website : www.srmswcet.ac.in
SRMS SCHOOL OF NURSING R.R. CANCER INSTITUTE & RESEARCH CENTRE
E-mail : [email protected] Website : www.srmsims.ac.in
Shri Ram Murti Smarak College of Engineering & Technology
Ph : 0581-2582246, 2582249, 2592331, 32 Fax 0581-2582330 website: www.srms.ac.in/cet
SRMS College of Engineering & Technology, BareillyShri Ram Murti Smarak College of Engineering & Technology Bareilly campus is
offering AICTE approved M.Tech, MBA, MCA and B.Tech (Computer Science &
Engineering, Electronics & Communication Engineering, Information Technology,
Electrical & Electronics and Mechanical Engineering). SRMS College of
Engineering & Technology (Pharmacy) is offering M.Pharm & B. Pharm Courses.
The college is affiliated to Dr. A.P.J.A.K. Technical University, Lucknow.
SRMS College of Engineering, Technology & Research, BareillyShri Ram Murti Smarak College of Engineering, Technology & Research is offering
AICTE approved B.Tech Course in Computer Science & Engineering, Electronics &
Communication Engineering, Electrical Engineering. It is affiliated to Dr. A.P.J.A.K.
Technical University, Lucknow.
SRMS Institute of Medical Sciences, Bareilly
1. HOSPITAL :
950 beds multi super speciality tertiary & trauma care hospital.
2. MEDICAL COLLEGE : Shri Ram Murti Smarak Institute of Medical Sciences,
Bareilly is offering MBBS & MD, MS Course approved by Medical Council of
India, New Delhi since academic session 2005-2006. It is affiliated to MJP
Rohilkhand University, Bareilly.
3. R.R. CANCER INSTITUTE & RESEARCH CENTRE
4. SRMS SCHOOL OF NURSING : Offering diploma in General Nursing &
Midwifery (GNM)
5. SRMS INSTITUTE OF PARAMEDICAL SCIENCES
SRMS College of Engineering & Technology, LucknowShri Ram Murti Smarak College of Engineering & Technology Unnao campus is
offering AICTE approved B.Tech Course in Computer Science & Engineering,
Electronics & Communication Engineering, Mechanical Engineering, Electrical &
Electronics Engineering, Electronics Engineering. It is affiliated to Dr. A.P.J.A.K.
Technical University, Lucknow.
SRMS International Business School, LucknowShri Ram Murti Smarak International Business School is a world class management
school in Lucknow region offering AICTE approved PGDM course. It has distinctive
faculty, global curriculum and world class infrastructure.
SRMS Functional Imaging & Medical Centre, LucknowShri Ram Murti Smarak Functional Imaging & Medical Centre, Lucknow is India’s
one of the most advanced diagnostic centre at Lucknow which is a ONE STOP for all
diagnostic needs under ONE ROOF like PET-CT Scan, Brain SPECT, DTPA Renal
Scan, Bone Scan, Thyroid Scan & Nuclear Cardiology.
Shri Ram Murti Smarak Institute of Medical Sciences, Bareilly is a
ISSN : 2231- 0231
CET
ollege of ngineering & echnology, Bareilly
SRMS
Faculty of Management Science
Shri Ram Murti Smarak College of Engg. & Tech., Bareilly (U.P.) India
Published by :
Related Documents