BRITISH FINANCIAL EXPERIENCE 1790-1830 NORMAN J. SILBERLING T HE monetary and financial events which attended the military operations carried on by Great Britain and her continental allies against the armies of France, between 1793 and 1815, have acquired at this time a special interest. The wars of the Napoleonic era pre- sent, in their political and economic aspects, numerous points of similarity to, as well as interesting points of contrast with, the great war of the past five years. An examination of some of the financial experiences of England during and immediately following this earlier period may be useful, not only in setting forth historical parallels and contrasts, but in furnishing valuable lessons for our own time. It is proposed to consider in this paper, certain as- pects of the financial history of England for a period beginning just before the war and extending to the year 1830, thus including the interval of recovery and return to normal conditions. The object of this study is primarily to bring together statistical data concerning currency, prices, the rate of interest, etc., which are available without elaborate research and special cal- culation. It is not intended to enter at any length into a causal inquiry or reasoned interpretation of the events disclosed, but rather to present the materials in clear and usable form, enabling comparison to be made be- tween the various sets of data and laying a basis for further investigation. COMMODITY PRICES Statistics of price movements form a natural starting point for an inquiry of this sort. For the well-known index numbers of W. Stanley Jevons, for the years from 1782 until 1865, we are primarily indebted to Mr. Thomas Tooke, an English merchant in the Russian trade whose career extended through and beyond the war period. Tooke, an earnest student of currency and prices, published in 1823 a work entitled Thoughts and Details on the High and Low Prices of the Last Thirty Years, later expanded into the first two volumes of his more widely familiar History of Prices. In his Thoughts and Details Tooke included a table, extending from 1782 to 1822, of the prices of seventy-eight raw materials and foodstuffs (including different varieties) which were fur- nished by a friend, Mr. A. Hinrichs. The principal source was Prince's Price Current established in 1782, the leading publication of its kind in that day. Only about forty of these quotations were later copied and 1 Vol. 2, Appendix, 1838. 2 Reprinted in his Investigations in Currency and Finance, 1884, pp. 119 f. In the reference above to the Journal of the Royal Statistical Society I have used the present name of the publication. Previous to 1887 it was called the Statistical Journal. [282] brought down to 1837 i n the History ofPrices,1with the assistance of Mr. M. L. Merac, who likewise derived practically all of hisfiguresfrom the Price Current. The table of prices as given in this volume includes the high and low quotations at four periods within each year: (1) about the middle of January, (2) the last days of March and first days of April, (3) about the middle of July, and (4) about the middle of November. There are many gaps in the data, especially in the quotations for the first and last periods during the earlier years. This series was continued in the subsequent volumes of the History of Prices. In the early sixties, Professor Jevons conceived the plan of casting these materials into the form of an index number, in order that the general trend of prices might be ascertained. His re- sults first appeared in the Journal of the Royal Statistical Society for June, 1865. 2 Jevons utilized practically all of Tooke's quotations, as given in the History of Prices, and supplemented these by a very few others from dif- ferent sources. No attempt was made to average the four sets of quotations for each article each year, and Jevons used merely those for the second quarter, for which the figures were on the whole most complete. This fact is of importance in the proper use and under- standing of his results. Taking the prices of 1782 as a base, Jevons constructed a series of index numbers, using the geometric mean of the individual ratios to obtain the final indices. No weights were given to the various commodities except by the inclusion in some instances of several varieties of the same article, as in the case of cotton, coffee, and sugar. Jevons also ob- tained index numbers for various groups of commodities such as " corn " (six cereals), metals, fibres, oriental and tropical produce. The commodities entering into his general index number, and the composition of the special groups for the limited period 1782-1830 are enumerated in Table 1. An examination of this list TABLE 1. —COMMODITIES REPRESENTED IN JEVONS' INDEX NUMBERS FROM 1782 TO 1830 CORN Wheat, Gazette average Barley, " Oats, Rye, Beans, « Peas, " " from 1792. MEAT Mutton, St. Thomas' Hospital average. Beef, St. Thomas' Hospital average. Irish mess beef, St. Thomas' Hospital average. Digitized for FRASER http://fraser.stlouisfed.org/ Federal Reserve Bank of St. Louis

Welcome message from author
This document is posted to help you gain knowledge. Please leave a comment to let me know what you think about it! Share it to your friends and learn new things together.
Transcript
BRITISH FINANCIAL EXPERIENCE1790-1830
NORMAN J. SILBERLING
THE monetary and financial events which attendedthe military operations carried on by Great Britain
and her continental allies against the armies of France,between 1793 and 1815, have acquired at this time aspecial interest. The wars of the Napoleonic era pre-sent, in their political and economic aspects, numerouspoints of similarity to, as well as interesting points ofcontrast with, the great war of the past five years. Anexamination of some of the financial experiences ofEngland during and immediately following this earlierperiod may be useful, not only in setting forth historicalparallels and contrasts, but in furnishing valuablelessons for our own time.
It is proposed to consider in this paper, certain as-pects of the financial history of England for a periodbeginning just before the war and extending to the year1830, thus including the interval of recovery and returnto normal conditions. The object of this study isprimarily to bring together statistical data concerningcurrency, prices, the rate of interest, etc., which areavailable without elaborate research and special cal-culation. It is not intended to enter at any length intoa causal inquiry or reasoned interpretation of the eventsdisclosed, but rather to present the materials in clearand usable form, enabling comparison to be made be-tween the various sets of data and laying a basis forfurther investigation.
COMMODITY PRICES
Statistics of price movements form a natural startingpoint for an inquiry of this sort. For the well-knownindex numbers of W. Stanley Jevons, for the years from1782 until 1865, we are primarily indebted to Mr.Thomas Tooke, an English merchant in the Russiantrade whose career extended through and beyond thewar period. Tooke, an earnest student of currency andprices, published in 1823 a work entitled Thoughts andDetails on the High and Low Prices of the Last ThirtyYears, later expanded into the first two volumes of hismore widely familiar History of Prices. In his Thoughtsand Details Tooke included a table, extending from 1782to 1822, of the prices of seventy-eight raw materials andfoodstuffs (including different varieties) which were fur-nished by a friend, Mr. A. Hinrichs. The principalsource was Prince's Price Current established in 1782,the leading publication of its kind in that day. Onlyabout forty of these quotations were later copied and
1 Vol. 2, Appendix, 1838.2 Reprinted in his Investigations in Currency and Finance, 1884,
pp. 119 f. In the reference above to the Journal of the Royal StatisticalSociety I have used the present name of the publication. Previous to1887 it was called the Statistical Journal.
[282]
brought down to 1837 in the History of Prices,1 with theassistance of Mr. M. L. Merac, who likewise derivedpractically all of his figures from the Price Current. Thetable of prices as given in this volume includes the highand low quotations at four periods within each year:(1) about the middle of January, (2) the last days ofMarch and first days of April, (3) about the middle ofJuly, and (4) about the middle of November. Thereare many gaps in the data, especially in the quotationsfor the first and last periods during the earlier years.This series was continued in the subsequent volumes ofthe History of Prices. In the early sixties, ProfessorJevons conceived the plan of casting these materialsinto the form of an index number, in order that thegeneral trend of prices might be ascertained. His re-sults first appeared in the Journal of the Royal StatisticalSociety for June, 1865.2 Jevons utilized practically all ofTooke's quotations, as given in the History of Prices,and supplemented these by a very few others from dif-ferent sources. No attempt was made to average thefour sets of quotations for each article each year, andJevons used merely those for the second quarter, forwhich the figures were on the whole most complete.This fact is of importance in the proper use and under-standing of his results. Taking the prices of 1782 asa base, Jevons constructed a series of index numbers,using the geometric mean of the individual ratios toobtain the final indices. No weights were given to thevarious commodities except by the inclusion in someinstances of several varieties of the same article, as inthe case of cotton, coffee, and sugar. Jevons also ob-tained index numbers for various groups of commoditiessuch as " corn " (six cereals), metals, fibres, orientaland tropical produce. The commodities entering intohis general index number, and the composition of thespecial groups for the limited period 1782-1830 areenumerated in Table 1. An examination of this list
TABLE 1. —COMMODITIES REPRESENTED INJEVONS' INDEX NUMBERS FROM
1782 TO 1830
CORN
Wheat, Gazette averageBarley, "Oats,Rye,Beans, «Peas, " " from 1792.
MEAT
Mutton, St. Thomas' Hospital average.Beef, St. Thomas' Hospital average.Irish mess beef, St. Thomas' Hospital average.
Digitized for FRASER http://fraser.stlouisfed.org/ Federal Reserve Bank of St. Louis
BRITISH FINANCIAL EXPERIENCE, 1790-1830 283
FIBRES
Cotton, Upland, 1793 Tooke until 1801; after 1801" Pernam, 1788 from Journal of the Royal Statis-" Surat, 1790 tical Society, December 1862." Surinam, 1782-1844; Demerara after 1820.
Wool, Southdown, average 1784-1845, McCulloch's Dic-tionary.
Silk, China, raw.Flax, St. Petersburg.
TIMBER
Memel fir, in bond.Quebec yellow pine, 1784-1806, 1820-39, 1813-21,
McCulloch's Dictionary.
OILS
Gallipoli, in bond.Fish.
FODDER
Hay, Gentlemen's Magazine^ 1798.Clover, Gentlemen's Magazine, 1803.Straw, Gentlemen's Magazine, 1798.
METALS
Copper, tough cakes.Lead, British pigs.Tin, English bars.
Pig.Iron Wrought, Russia.
Bars, Welsh.DYES
Logwood, Jamaica.Indigo superior and inferior, East India.Cochineal, Spanish.
TROPICAL FOODS, ETC.*
Sugar, Muscovados, Tooke 1782-1805, Gazette average after1800.
" Havannah, for exportation, after 1801.
Tea ^°n g 0 U-hyson
Coffee, superior British plantation." inferior British plantation." St. Domingo, for exportation, after 1807.
Rum, Jamaica,Rice, Carolina.Pepper, East India black.Cinnamon, first quality, in bond.Tobacco, Virginia, in bond.
MISCELLANEOUS
Butter, Waterford, etc.Tallow, St. Petersburg.Ashes, barilla, Carthagena in bond.
u pearl; Danzig or Russia.Hemp, St. Petersburg, clean.Tar, Stockholm.
* Another group of " oriental produce " for which a separateseries was calculated includes sugar, tea, pepper, cinnamon, indigo,China silk, and Surat cotton.
discloses an aggregate of fifty-two items — countingdifferent varieties of the same article — and of aboutforty distinct commodities. For several articles thefirst quotations obtained were for years later than the
1 The years in which the quotations begin are as follows: 1792,1793, 1798, 1801, 1803, 1806, and 1808.
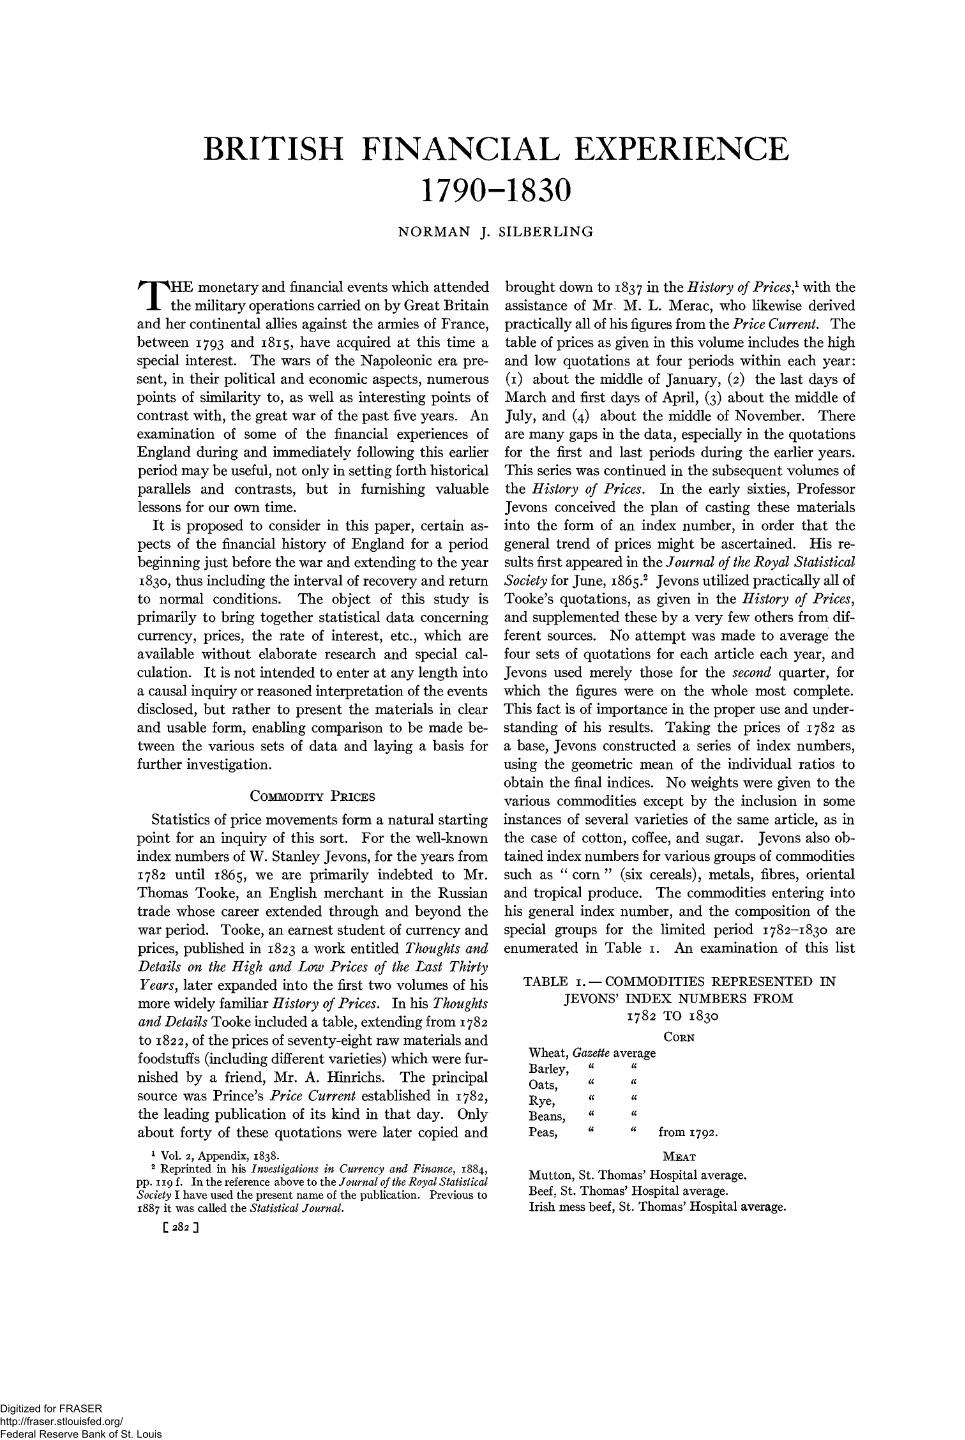
base year, 1782; and for eight commodities, later than1790, the year from which I shall hereafter compareJevons' series with various other series.1 All the articlesin Jevons' list are foods and raw materials, but theyinclude a fair proportion of the important articles ofthis nature for the period concerned. Table 2 contains
TABLE 2. —JEVONS' INDEX NUMBERS OF PRICESFOR FORTY COMMODITIES AND FOR CEREALS,METALS, AND ORIENTAL PRODUCE, 1782-1830.*
* Based on currency prices relative to those in 1782. Jevons' datafor various groups of articles are given for the years 1801-20 inclusive,in terms of gold; these figures were therefore reconverted to paper bythe index of the price of gold which Jevons used.
Year (usually thesecond quarter)
1782
1783
1784
17851786
17871788
1789
I79O
1791
I792
1793
1794
1795
1796
1797
1798
1799l8oo
I8OI
I8O2
1803
1804
I805
1806
1807
1808
1809
l8lO
l8ll
I8l2
1813
1814
I8I5
I8l6
1817
I8l8
1819
I82O
I82I
l822
1823
1824
1825
1826
1827
1828
1829
183O
Fortycommodities
IOO
9390
85
87878587
89939998
117
125no118
130141
153119128122
136
*33132149161164147148149153132109120
135117
106
94888988
103909081
7981
Cereals
IOO
I27
Il6
IO4
IO5IO2
99I 05
117
112
no129140168I53112
116IS9252
253140127138182163
173201
211
203
182
272
25616513714819820918615211692
125147i57152
155136
135138
Metals
IOO
IOO
9O
89
959396
9392
IOO
108
113in108117123122127
*35
152148148
151166
i74156160164
165161
i45144
151138
115no122119109101
IOO
107
108
123
III103
95
8981
Orientalproduce
IOO
IOI
94
9382
9i9i
8580
89107
96
8496
85107IOO80
8780
76738181
75868896818188121
98
82
83
93
78
67
68
67
6561805658535i
52
Digitized for FRASER http://fraser.stlouisfed.org/ Federal Reserve Bank of St. Louis
284 THE REVIEW OF ECONOMIC STATISTICS
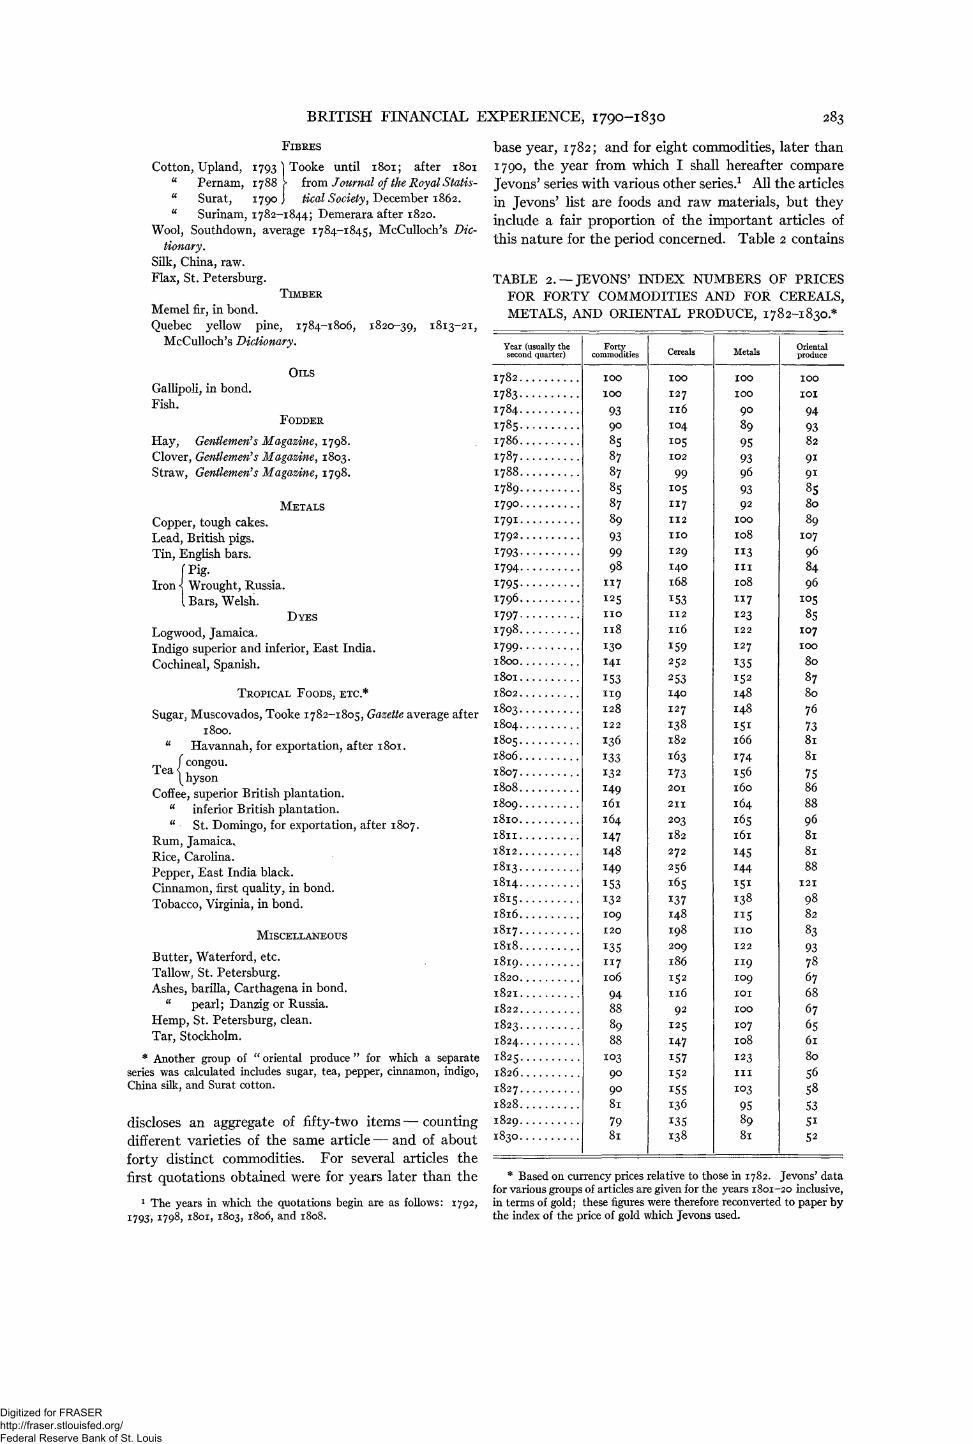
CHART 1. —JEVONS' INDEX NUMBERS OF PRICES FOR FORTY COMMODITIES, FOR CORN, FOR METALS,
AND FOR ORIENTAL PRODUCE, 1782-1830
(DATA GIVEN IN TABLE 2)
(a) FORTY COMMODITIES. UNITS OP ONE PER CENT. (C) METALS. UNITS OF ONE PER CENT.
(b) CORN (CEREALS). " « « " (d) ORIENTAL PRODUCE. " « " «* SERIOUSLY DEFICIENT HARVESTS.
the index numbers derived for all articles, and for thoseof three important special groups, namely, " corn,"metals, and oriental produce. These data are plottedin Chart 1.
Before interpreting the Jevons indices, it will be wellto consider another series which appeal's hitherto tohave escaped the attention of economists and statisti-cians. In 1848 Mr. John Taylor, a London publisherinterested in monetary questions, presented before theCommons' Secret Committee on Commercial Distressa table containing the average index numbers for ninetycommodities for seven-year periods, from 1784-90 (thebase period) down to 1833-37 (the last being only a five-year period). These were presented both for each com-modity separately, and averaged for the entire list.1
This list embraces all of the articles used by Jevons2
1 See Parliamentary Papers, 1847-48, 8, Pt. 1, p. 434. The origi-nal table bears the heading: " Table of the comparative prices ofninety of the principal articles of commerce, expressed in centesimalproportions," and is given in full in the appendix to the presentpaper. 2 Irrespective of minor diversities in variety or grade.
with the exception of beans, peas, mutton, Georgiacotton, fodder, and wrought iron; and in addition itcontains those listed in Table 3.
TABLE 3. —COMMODITIES REPRESENTED INTAYLOR'S INDEX NUMBERS, BUT
NOT USED BY JEVONS
Alum, British.Ashes, pot.Bark, oak, British.Brandy, cognac.Candles.Coal, Newcastle.
tt Sunderland.Coffee, Mocha.Copper, sheets.Cotton, Berbice and Smyrna.Cotton yarn, Turkish.
« « British.Currants.Figs.Flour, British.
Raisins, Malaga." Smyrna, red.
Rum, Leeward Islands.Seeds, Caraway, foreign.
tt Clover, red, foreign." Clover, white, foreign." Rape, British." Linseed, foreign.
Silk, raw, Bengal and Brutia.Silk, thrown, Piedmont.Spirits, British malt.Sugar, Refined, powder-loaves.
" Refined, lumps.Sugar, Raw (brown), Jamaica.
" Raw (fine), Jamaica.
Digitized for FRASER http://fraser.stlouisfed.org/ Federal Reserve Bank of St. Louis
BRITISH FINANCIAL EXPERIENCE, 1790-1830 285
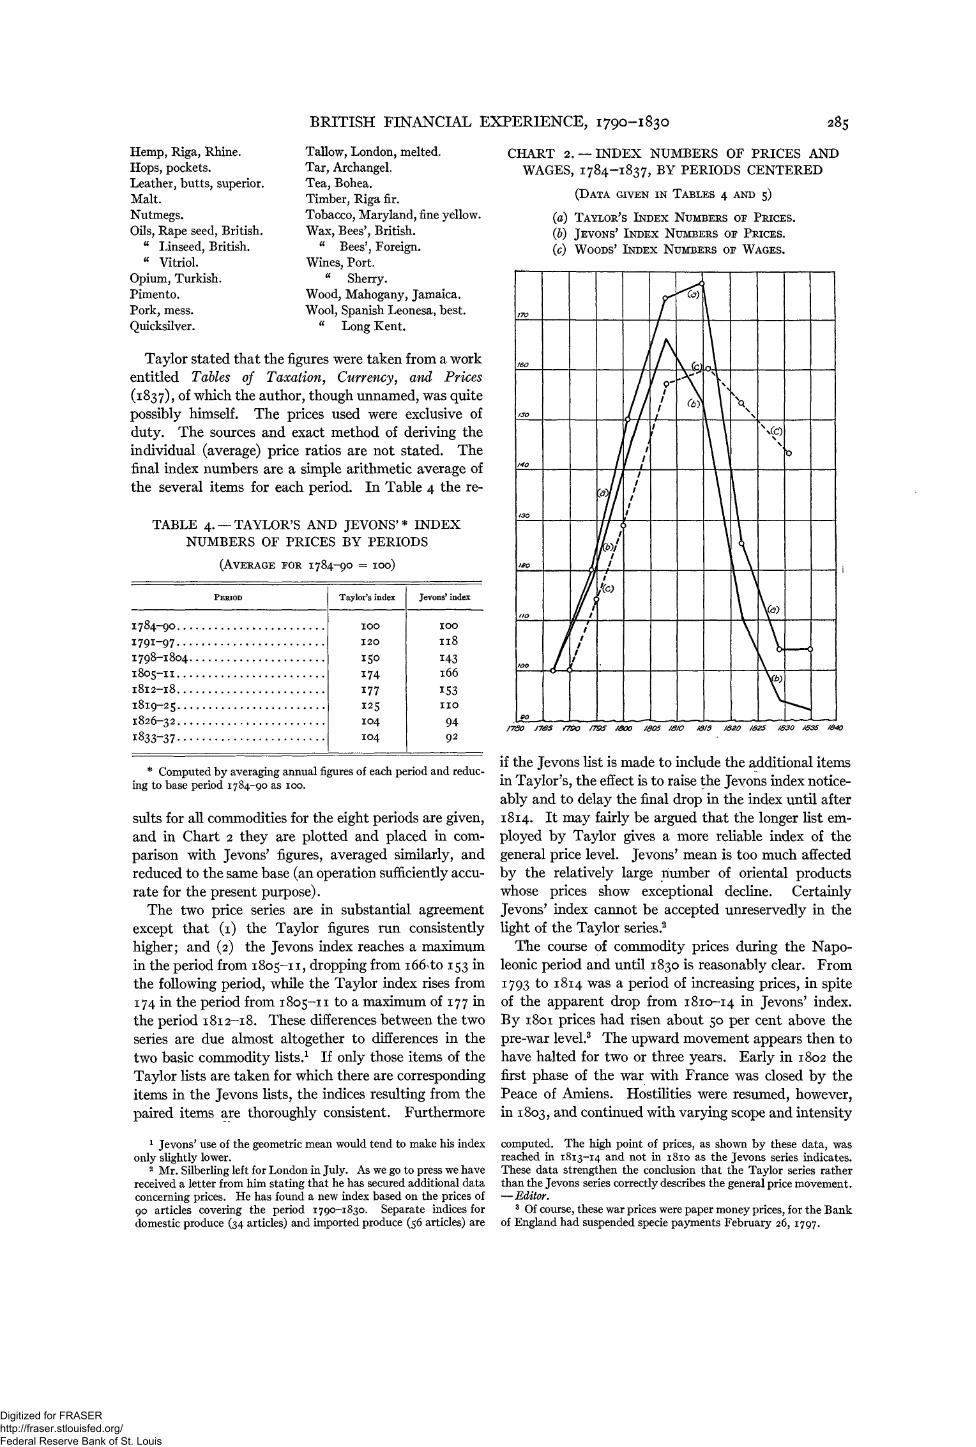
Hemp, Riga, Rhine.Hops, pockets.Leather, butts, superior.Malt.Nutmegs.Oils, Rape seed, British.
" Linseed, British." Vitriol.
Opium, Turkish.Pimento.Pork, mess.Quicksilver.
Tallow, London, melted.Tar, Archangel.Tea, Bohea.Timber, Riga fir.Tobacco, Maryland, fine yellow.Wax, Bees', British.
" Bees', Foreign.Wines, Port.
" Sherry.Wood, Mahogany, Jamaica.Wool, Spanish Leonesa, best.
" Long Kent.
Taylor stated that the figures were taken from a workentitled Tables of Taxation, Currency, and Prices(1837), of which the author, though unnamed, was quitepossibly himself. The prices used were exclusive ofduty. The sources and exact method of deriving theindividual (average) price ratios are not stated. Thefinal index numbers are a simple arithmetic average ofthe several items for each period. In Table 4 the re-
TABLE 4. —TAYLOR'S AND JEVONS'* INDEXNUMBERS OF PRICES BY PERIODS
(AVERAGE FOR 1784-90 = 100)
PERIOD
1784-901791-97... . .I798-18041805-II
I8I2-I8
1819-25
1826-32. . ,
1833-37
Taylor's index
100
120
150174177
1 2 5104
104
Jevons' index
100
1l8
143166
1531109492
* Computed by averaging annual figures of each period and reduc-ing to base period 1784-90 as 100.
suits for all commodities for the eight periods are given,and in Chart 2 they are plotted and placed in com-parison with Jevons' figures, averaged similarly, andreduced to the same base (an operation sufficiently accu-rate for the present purpose).
The two price series are in substantial agreementexcept that (1) the Taylor figures run consistentlyhigher; and (2) the Jevons index reaches a maximumin the period from 1805-11, dropping from 166 to 153 inthe following period, while the Taylor index rises from174 in the period from 1805-11 to a maximum of 177 inthe period 1812-18. These differences between the twoseries are due almost altogether to differences in thetwo basic commodity lists.1 If only those items of theTaylor lists are taken for which there are correspondingitems in the Jevons lists, the indices resulting from thepaired items are thoroughly consistent. Furthermore
1 Jevons' use of the geometric mean would tend to make his indexonly slightly lower.
2 Mr. Silberling left for London in July. As we go to press we havereceived a letter from him stating that he has secured additional dataconcerning prices. He has found a new index based on the prices of90 articles covering the period 1790-1830. Separate indices fordomestic produce (34 articles) and imported produce (56 articles) are
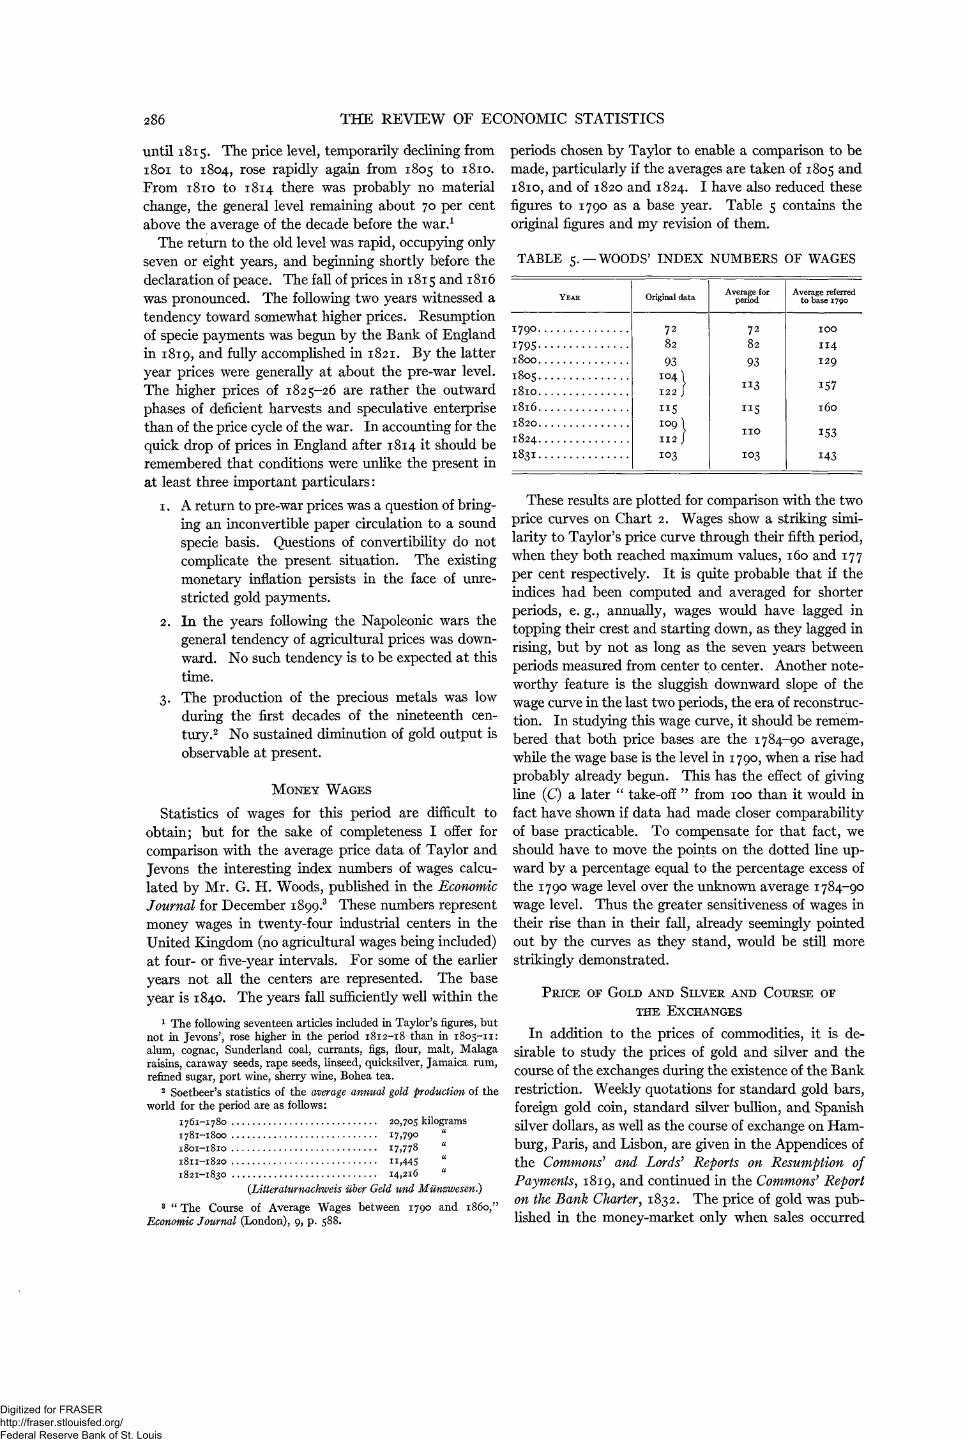
CHART 2. — INDEX NUMBERS OF PRICES ANDWAGES, 1784-1837, BY PERIODS CENTERED
(DATA GIVEN IN TABLES 4 AND 5)
(a) TAYLOR'S INDEX NUMBERS OF PRICES.
(b) JEVONS' INDEX NUMBERS OF PRICES.
(c) WOODS' INDEX NUMBERS OF WAGES.
if the Jevons list is made to include the additional itemsin Taylor's, the effect is to raise the Jevons index notice-ably and to delay the final drop in the index until after1814. It may fairly be argued that the longer list em-ployed by Taylor gives a more reliable index of thegeneral price level. Jevons' mean is too much affectedby the relatively large number of oriental productswhose prices show exceptional decline. CertainlyJevons' index cannot be accepted unreservedly in thelight of the Taylor series.2
The course of commodity prices during the Napo-leonic period and until 1830 is reasonably clear. From1793 to 1814 was a period of increasing prices, in spiteof the apparent drop from 1810-14 in Jevons' index.By 1801 prices had risen about 50 per cent above thepre-war level.3 The upward movement appears then tohave halted for two or three years. Early in 1802 thefirst phase of the war with France was closed by thePeace of Amiens. Hostilities were resumed, however,in 1803, and continued with varying scope and intensity
computed. The high point of prices, as shown by these data, wasreached in 1813-14 and not in 1810 as the Jevons series indicates.These data strengthen the conclusion that the Taylor series ratherthan the Jevons series correctly describes the general price movement.—Editor.
3 Of course, these war prices were paper money prices, for the Bankof England had suspended specie payments February 26, 1797.
Digitized for FRASER http://fraser.stlouisfed.org/ Federal Reserve Bank of St. Louis
286 THE REVIEW OF ECONOMIC STATISTICS
until 1815. The price level, temporarily declining from1801 to 1804, rose rapidly again from 1805 to 1810.From 1810 to 1814 there was probably no materialchange, the general level remaining about 70 per centabove the average of the decade before the war.1
The return to the old level was rapid, occupying onlyseven or eight years, and beginning shortly before thedeclaration of peace. The fall of prices in 1815 and 1816was pronounced. The following two years witnessed atendency toward somewhat higher prices. Resumptionof specie payments was begun by the Bank of Englandin 1819, and fully accomplished in 1821. By the latteryear prices were generally at about the pre-war level.The higher prices of 1825-26 are rather the outwardphases of deficient harvests and speculative enterprisethan of the price cycle of the war. In accounting for thequick drop of prices in England after 1814 it should beremembered that conditions were unlike the present inat least three important particulars:
1. A return to pre-war prices was a question of bring-ing an inconvertible paper circulation to a soundspecie basis. Questions of convertibility do notcomplicate the present situation. The existingmonetary inflation persists in the face of unre-stricted gold payments.
2. In the years following the Napoleonic wars thegeneral tendency of agricultural prices was down-ward. No such tendency is to be expected at thistime.
3. The production of the precious metals was lowduring the first decades of the nineteenth cen-tury.2 No sustained diminution of gold output isobservable at present.
MONEY WAGES
Statistics of wages for this period are difficult toobtain; but for the sake of completeness I offer forcomparison with the average price data of Taylor andJevons the interesting index numbers of wages calcu-lated by Mr. G. H. Woods, published in the EconomicJournal for December 1899.3 These numbers representmoney wages in twenty-four industrial centers in theUnited Kingdom (no agricultural wages being included)at four- or five-year intervals. For some of the earlieryears not all the centers are represented. The baseyear is 1840. The years fall sufficiently well within the
1 The following seventeen articles included in Taylor's figures, butnot in Jevons7, rose higher in the period 1812-18 than in 1805-11:alum, cognac, Sunderland coal, currants, figs, flour, malt, Malagaraisins, caraway seeds, rape seeds, linseed, quicksilver, Jamaica rum,refined sugar, port wine, sherry wine, Bohea tea.
2 Soetbeer's statistics of the average annual gold production of theworld for the period are as follows:
1761-1780 20,705 kilograms1781-1800 17,790 "
1801-1810 17,778 "
1811-1820 11,445 "
1821-1830 14,216 "
(Litteraturnachweis uber Geld und Munzwesen.)3 " The Course of Average Wages between 1790 and 1860,"
Economic Journal (London), 9, p. 588.
periods chosen by Taylor to enable a comparison to bemade, particularly if the averages are taken of 1805 and1810, and of 1820 and 1824. I have also reduced thesefigures to 1790 as a base year. Table 5 contains theoriginal figures and my revision of them.
TABLE 5.—WOODS' INDEX NUMBERS OF WAGES
These results are plotted for comparison with the twoprice curves on Chart 2. Wages show a striking simi-larity to Taylor's price curve through their fifth period,when they both reached maximum values, 160 and 177per cent respectively. It is quite probable that if theindices had been computed and averaged for shorterperiods, e. g., annually, wages would have lagged intopping their crest and starting down, as they lagged inrising, but by not as long as the seven years betweenperiods measured from center to center. Another note-worthy feature is the sluggish downward slope of thewage curve in the last two periods, the era of reconstruc-tion. In studying this wage curve, it should be remem-bered that both price bases are the 1784-90 average,while the wage base is the level in 1790, when a rise hadprobably already begun. This has the effect of givingline (C) a later " take-off " from 100 than it would infact have shown if data had made closer comparabilityof base practicable. To compensate for that fact, weshould have to move the points on the dotted line up-ward by a percentage equal to the percentage excess ofthe 1790 wage level over the unknown average 1784-90wage level. Thus the greater sensitiveness of wages intheir rise than in their fall, already seemingly pointedout by the curves as they stand, would be still morestrikingly demonstrated.
PRICE OF GOLD AND SILVER AND COURSE OF
THE EXCHANGES
In addition to the prices of commodities, it is de-sirable to study the prices of gold and silver and thecourse of the exchanges during the existence of the Bankrestriction. Weekly quotations for standard gold bars,foreign gold coin, standard silver bullion, and Spanishsilver dollars, as well as the course of exchange on Ham-burg, Paris, and Lisbon, are given in the Appendices ofthe Commons' and Lords' Reports on Resumption ofPayments, 1819, and continued in the Commons' Reporton the Bank Charter, 1832. The price of gold was pub-lished in the money-market only when sales occurred
YEAR
179°17951800180518101816182018241831
Original data
7282
93104122
115109112
103
Average forperiod
7282
93
113
115
no
103
Average referredto base 1790
IOO
114129
157
l6o
153
143
Digitized for FRASER http://fraser.stlouisfed.org/ Federal Reserve Bank of St. Louis
BRITISH FINANCIAL EXPERIENCE, 1790-1830 287
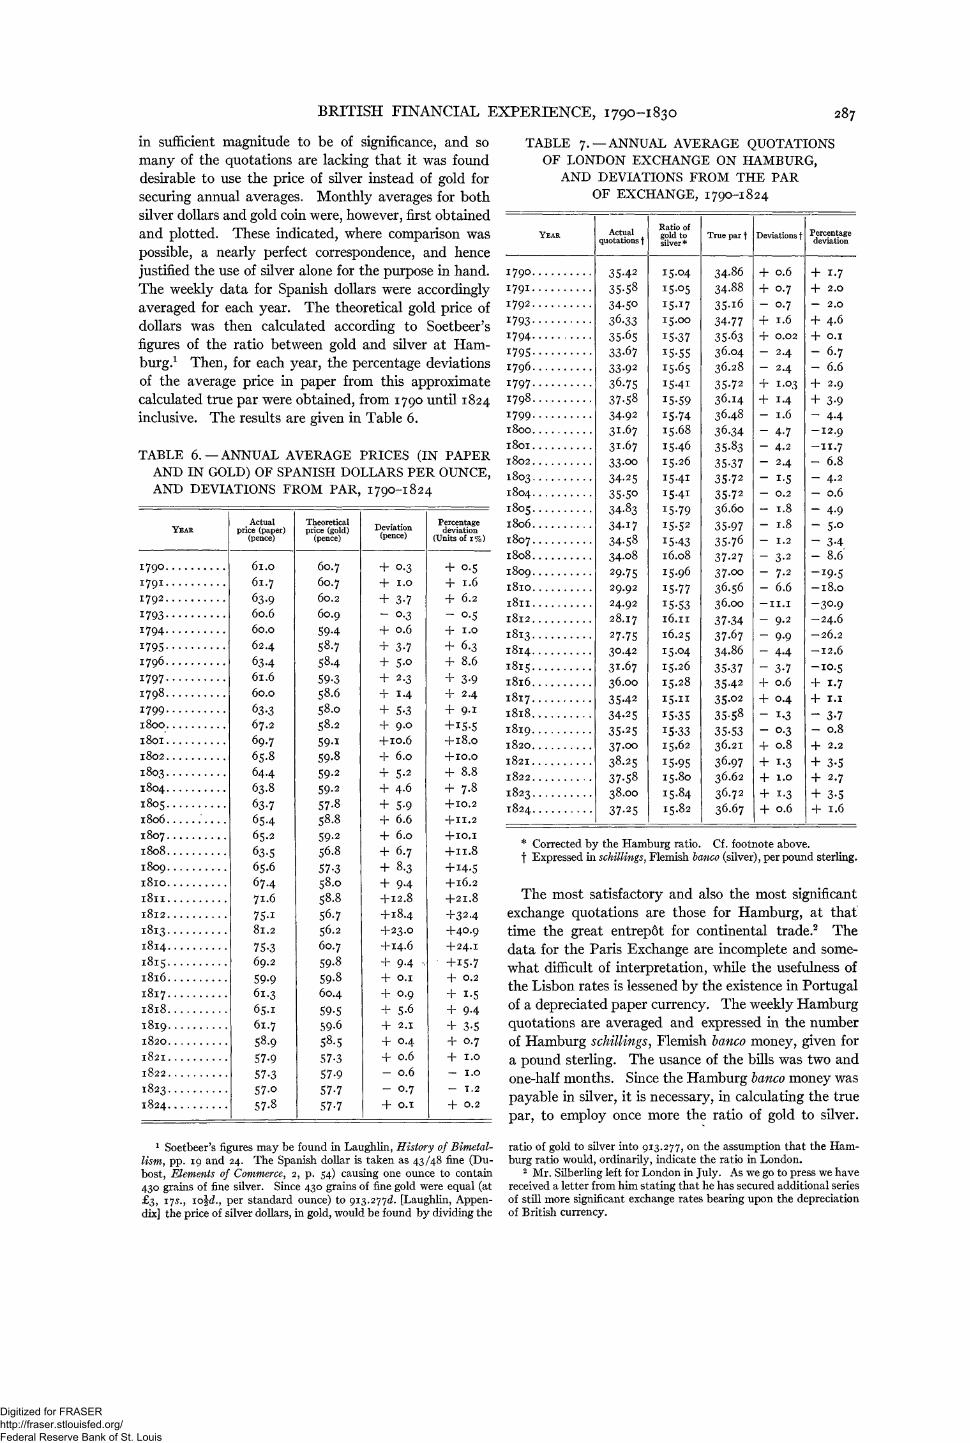
in sufficient magnitude to be of significance, and somany of the quotations are lacking that it was founddesirable to use the price of silver instead of gold forsecuring annual averages. Monthly averages for bothsilver dollars and gold coin were, however, first obtainedand plotted. These indicated, where comparison waspossible, a nearly perfect correspondence, and hencejustified the use of silver alone for the purpose in hand.The weekly data for Spanish dollars were accordinglyaveraged for each year. The theoretical gold price ofdollars was then calculated according to Soetbeer'sfigures of the ratio between gold and silver at Ham-burg.1 Then, for each year, the percentage deviationsof the average price in paper from this approximatecalculated true par were obtained, from 1790 until 1824inclusive. The results are given in Table 6.
TABLE 6.—ANNUAL AVERAGE PRICES (IN PAPERAND IN GOLD) OF SPANISH DOLLARS PER OUNCE,AND DEVIATIONS FROM PAR, 1790-1824
TABLE 7. —ANNUAL AVERAGE QUOTATIONSOF LONDON EXCHANGE ON HAMBURG,
AND DEVIATIONS FROM THE PAROF EXCHANGE, 1790-1824
YEAR
179°I791
i792
1793179417951796
179717981799180018011802180318041805180618071808180918101811181218131814
1815181618171818181918201821182218231824
Actualprice (paper)
(pence)
6 l . O
61.7
63.96O.66O.O62.4
6346l.66O.O
67.269.765.864.463.863-765-465.2
63.565.667.471.6
75-i81.2
75-369.2
59.961.3
65.161.7
58.957.957-357-O57.8
Theoreticalprice (gold)
(pence)
6O.760.76O.260.959458.7584
59-358.658.058.2
59-i59.8
59-2
59-257.858.859-256.8
57-358.058.8
56.756.260.759.859-860.4
59-559-658.557-357-957-757-7
Deviation(pence)
+ O.3
+ I.O
+ 3.7- °-3+ 0.6
+ 3.7+ 5.o+ 2.3+ 14+ 5.3+ 9.0+10.6+ 6.0+ 5.2+ 4-6
+ 5-9+ 6.6+ 6.0+ 6.7+ 8.3
+ 94+12.8
+18.4+23.0+14.6+ 94 -+ 0.1+ 0.9+ 5.6+ 2.1+ 0.4+ 0.6- 0.6~ 0.7+ O.I
Percentagedeviation
(Units of 1%)
+ O.5+ 1.6+ 6.2- 0.5+ 1.0+ 6.3+ 8.6+ 3-9+ 2.4+ 9-1+15.5+18.0+10.0+ 8.8+ 7.8+10.2+11.2+10.1+11.8+14-5+16.2+21.8+324+40.9+24.1
• +15-7+ 0.2+ 1.5+ 94+ 3-5+ 0.7+ 1.0— 1.0
— T.2
+ O.2
1 Soetbeer's figures may be found in Laughlin, History of Bimetal-lism, pp. 19 and 24. The Spanish dollar is taken as 43/48 fine (Du-bost, Elements of Commerce, 2, p. 54) causing one ounce to contain430 grains of fine silver. Since 430 grains of fine gold were equal (at£3, 17s., 10 1/2d., per standard ounce) to 913.277d. [Laughlin, Appen-dix] the price of silver dollars, in gold, would be found by dividing the
YEAR
I79O17911792
1793179417951796
17971798
17991800l8oiI8O21803180418051806180718081809l8lOl8lll8l2181318141815I8l61817I8l81819I82OI82I18221823T824
Actualquotations
354235.5834.5O36-3335-6533-6733-9236.7537.5834.9231.6731.6733.0034.2535.5O34.8334.1734.5834.08
29-7529.9224.9228.17
27-7530.42
31-6736.00
354234.2535-2537.00
38.2537.5838.00
37.25
Ratio ofgold tosilver*
I5.O4I5.O515-1715.OO
15.3715.5515-6515-41x5-5915.7415.6815.4615.26I54I154115-79I5-52
154316.0815.9615-7715.5316.1116.2515.0415.2615.2815.1115.3515.3315,62
15.9515.80
15.8415.82
True par f
34-8634.8835.1634.7735.6336.0436.28
35.7236.1436.4836.3435.8335-373572357236.60
35.9735.7637.2737.OO
36.5636.OO37.3437.6734.86
35.37354235.O235-5835.5336.21
36.9736.6236.7236.67
Deviations f
+ O.6+ O.7- O.7+ 1.6+ 0.02- 2.4- 2.4+ I-°3+ 14- 1.6
- 4-7- 4.2- 2.4
- i-5— 0.2- 1.8- 1.8— 1.2
- 3-2- 7.2- 6.6— 1 1 . 1
- 9.2
- 9.9- 44- 3.7+ 0.6+ 0.4
- i-3- 0.3+ 0.8
+ i-3+ 1.0
+ 1.3+ 0.6
Percentagedeviation
+ 1.7+ 2.O- 2.O
+ 4.6+ O.I" 6.7- 6.6+ 2.9+ 3-9- 44— 12.9
- 1 1 . 7
- 6.8- 4.2- 0.6- 4-9- 5.o- 34- 8.6'
-18 .0
-30 .9-24 .6— 26.2-12 .6-10 .5
+ 1.7+ 1.1
- 3.7- 0.8+ 2.2
+ 3.5+ 2.7+ 3.5+ 1.6
* Corrected by the Hamburg ratio. Cf. footnote above.f Expressed in schillings, Flemish banco (silver), per pound sterling.
The most satisfactory and also the most significantexchange quotations are those for Hamburg, at thattime the great entrepot for continental trade.2 Thedata for the Paris Exchange are incomplete and some-what difficult of interpretation, while the usefulness ofthe Lisbon rates is lessened by the existence in Portugalof a depreciated paper currency. The weekly Hamburgquotations are averaged and expressed in the numberof Hamburg schillings, Flemish banco money, given fora pound sterling. The usance of the bills was two andone-half months. Since the Hamburg banco money waspayable in silver, it is necessary, in calculating the truepar, to employ once more the ratio of gold to silver.
ratio of gold to silver into 913.277, on the assumption that the Ham-burg ratio would, ordinarily, indicate the ratio in London.
2 Mr. Silberling left for London in July. As we go to press we havereceived a letter from him stating that he has secured additional seriesof still more significant exchange rates bearing upon the depreciationof British currency.
Digitized for FRASER http://fraser.stlouisfed.org/ Federal Reserve Bank of St. Louis

388 THE REVIEW OF ECONOMIC STATISTICS
CHART 3. — PERCENTAGE DEVIATIONS FROM PAR OF SPANISH SILVER DOLLARS ANDHAMBURG EXCHANGE, 1790-1824
(DATA GIVEN IN TABLES 6 AND 7)
(a) SPANISH SILVER DOLLARS. PERCENTAGE DEVIATIONS FROM PAR. UNITS OF ONE PER CENT.
(6) HAMBURG EXCHANGE. U " « " « " « "
This par having been calculated,1 the percentage de-viations from it were taken for each year. The data, asthey appear in Table 7, are believed to be as accurateand complete as it is possible to make them; but for aperfect measure of the depreciation of the currency fromits standard by means of the exchange it would be neces-sary to have further data relative to the balance of pay-ments, to the specie points, and to the discount rates atLondon and Hamburg. All that can be stated regardingthe specie points is that the cost of transporting specieto the continent rose from about 3 per cent in 1797 toabout 5 §-7 per cent in 1810, but fluctuated consider-
1 According to an appendix in the Lords' Report of 1819 (fur-nished by Dr. Kelly, the cambist) 2§ Hamburg schillings Flemishbanco equaled one Flemish marc banco, of which it took 27! to pur-chase one marc (Cologne weight) of fine silver equal to 3608 grainsfine. A schilling Flemish banco would, then, be worth 48.7567 +grains of fine silver. A pound sterling is 113.0016 + grains of fine
gold. If the market ratio be multiplied, therefore, by
= 2.3177, the result will be the number of schillings given in Hamburgfor the bullion equivalent of a pound sterling.
2 Bullion Reporty Parliamentary Papers, 1810, 3, p. 11.
ably from week to week.2 In 1811, the embargoesagainst British trade and the confiscation of Britishmanufactures in Europe reached a high degree ofeffectiveness, and the consequent probable rise of freightand insurance may have produced the peculiar resultsindicated for that year on Chart 3, where the deviationsof the price of silver and the course of exchange fromtheir respective calculated pars are presented. Thegeneral inverse movement is virtually perfect exceptduring 1810-12, but deviations of silver are in generalgreater than for exchange rates. The maximum priceof silver was reached in 1813, two years after the maxi-mum price level according to Jevons. Comparing thesilver curve of Chart 3 with the two price curves ofChart 2, it is instructive to observe that: (1) the rangeof deviations from 100 per cent is much narrower forsilver than for either Taylor's or Jevons' general com-modities; (2) the silver curve increased later anddropped earlier than any of the curves on Chart 2, inother words showing a naturally much greater stabilityabout its par than commodities at large. A detailed
Digitized for FRASER http://fraser.stlouisfed.org/ Federal Reserve Bank of St. Louis

BRITISH FINANCIAL EXPERIENCE, 1790-1830 289
study of the changes in both silver and gold exchangewould disclose at many points a close connection be-tween their fluctuations and the state of military andnaval operations.1
INTEREST AND DISCOUNT RATES
We now turn to a consideration of interest and dis-count rates. It has long been customary to measurethe changes in the rate of interest in England by thecalculated yield upon 3 per cent Consolidated Annui-ties. In order to obtain more reliable figures than areafforded by the usual average of the yearly high andlow quotations for consols, an annual average has beentaken of the mean of the monthly high and low pricesgiven by the Gentlemen's Magazine.2 The averageyield is derived in the usual manner by dividing 3 percent by the average price, and the results are given inTable 8.
TABLE 8. —ANNUAL AVERAGE PRICE AND YIELDOF BRITISH 3 PER CENT CONSOLS, 1790-1830
YEAR
I79O1791I79 2
1793179417951796179717981799I8OOl8oiI8O21803180418051806180718081809l 8 l O
Averageprice
(Units of£1)
76.89
83.759O.O4
75-7O
68.2O
66.3762.4750.845O.5359.1763.646O.9370.8960.16
56.5959-3O61.4762.74
66.3568.3268.41
Yield(Units of
1%)
3-93.63-33-94.4
4.54.8
5-95-95.14.74.94.25.o5.35.i4.94.8
4-54.44.4
YEAR
l 8 l l
I8l2
181318141815181618171818181918201821182218231824182518261827182818291830
Averageprice
(Units of£1)
64.I959-7258.8l66.7959-9O62.I375.3O78.177O.9368.54744879.3479-5193.7889.6979.6284.14
85.7288.8389.68
Yield(Units of
1%)
4-75-o5-i4.55-o4.84.03-84.24.44-o3-83.83-23.33.83.63-53-434
I shall defer comment upon the data until I haveexplained several other series of interest rates assembledon Chart 4.
To ascertain the rate of interest at this time uponfunds invested in private undertakings involves unusualdifficulties. The published quotations of security prices
1 A study of the exchanges from week to week in connection withpolitical affairs would be desirable, though not possible within thescope of the present article, in which annual data alone have beenused.
2 Of the trustworthiness of this source William Newmarch testifiesas follows, in an article dealing with Pitt's war finance: "Thosereturns (of prices in the magazine) were furnished by the brokerswhose names they bear, and give the highest and lowest price of eachkind of stock on each week-day of each month; and of their accu-racy, and sufficiency for the present purpose, there can be no question."Statistical Journal, (1855) 18, p. 262.
CHART 4. —INTEREST RATES, 1790-1830
(DATA GIVEN IN TABLES 8, 9, 10)
(a) AVERAGE YIELD ON BRITISH THREE PER CENT CONSOLS,
1790-1830.(b) AVERAGE INTEREST PAID BY GOVERNMENT ON EXCHEQUER
BILLS, 1790-1830.(c) AVERAGE YIELD ON WEST INDIA DOCK COMPANY STOCK,
1806-28.
are meagre and must be pieced together from diversesources (mainly monthly periodicals). In the secondplace, funds were much more frequently invested inconsols and the stocks and shares of docks, insurancecompanies, and other undertakings, than loaned at afixed rate of interest upon bonds. I have been able todiscover one enterprise, however, which meets our re-quirements to a fair degree for the years 1806-28. Inthe year 1806 there were completed in London the WestIndia Docks, running through from Blackwall to Lime-house on the Thames. The dock company was formedin 1799; it opened an import dock with warehouses in1802, and an export dock, which completed the under-taking, in 1806. The capital of the company, originally£500,000, was increased to £1,200,000 at the completionof the construction, and was entirely paid up at thattime. By the terms of the charter the docks were toenjoy a monopoly of all the shipping with the WestIndies until 1824, and until then the dividends upon thecapital stock were not to exceed 10 per cent per annumfrom the time that the entire plant was put into opera-tion. The enterprise was ably planned and managed,and proved extremely successful. But what is impor-tant for the present investigation, the gross dividendsdeclared remained constant at 10 per cent from 1807until July 1829, when, according to the Gentlemen'sMagazine, they dropped to 8 per cent. During thistime, therefore, the price of this stock can furnish in-formation as to the rate of interest, which is probably asaccurate and reliable as that which would be given by afirst-class seasoned "public utility" bond at the pres-ent time. The quotations of the company's stock areto be found in several contemporary periodicals: priorto September 1813, they are taken from the LondonMonthly Magazine; thereafter from the Gentlemen'sMagazine, with occasional use of the New MonthlyMagazine and the European Magazine for purposes of
Digitized for FRASER http://fraser.stlouisfed.org/ Federal Reserve Bank of St. Louis

290 THE REVIEW OF ECONOMIC STATISTICS
comparison and checking. The quotations were fur-nished to these magazines by various stock brokers,and give the ruling market price (sometimes the highand low, which are never far apart) for about the firstthree weeks of each month. Dividends were paid inJanuary and July, and the stock was frequently, butnot uniformly, quoted ex dividend during these and somesucceeding months; but in converting the monthlyprices into annual averages no correction for this factwas thought possible or necessary. It is important toadd that during the war the company usually paiddividends with the property tax deducted; the netdividends actually paid are to be found in the appendixto a Parliamentary Report of 1823 in which the com-pany's history and affairs are examined in great detail,and these have been used in the calculation of the actualyields.1 These have been obtained by dividing thedividend by the average yearly price of the stock. Theresults appear in Table 9.
TABLE 9. —YIELD OF STOCK OF THE WEST INDIADOCK COMPANY, 1806-28
NET DIVIDEND (EXCLUSIVE OF TAX) AND
ANNUAL AVERAGE PRICE OF THE STOCK*
YEAR
1806180718081809l8lOl8 l lI8l218131814I8I5I8l6181718181819l82OI82I1822182318241825182618271828
Actualdividends(Units of£1000)
IO8.6III.2
"54I2O.OIO8.OIO8.OIO8.OIO8.OIO8.OIO8.OI2O.O
I2O.O
I2O.O
I2O.O
I2O.O
I2O.O
I2O.O
I2O.O
I2O.O
I2O.O
I2O.O
I2O.O
I2O.O
Actual rateof dividend
(Units of 1 %)
9-O59.279.61
IO.OO
9.OO
9.OO
9.OO
9.OO
9.OO
9.OO
IO.OO
IO.OO
IO.OO
IO.OO
IO.OO
IO.OO
IO.OO
IO.OO
IO.OO
IO.OO
IO.OO
IO.OO
IO.OO
Average priceof stock f
(Units of £1)
144.7I46.8
153-5177.6172.0161.1150.8146.2156.9149.2145.8184.6199-5181.8170.7172.1184.4
i9I-5236.4218.7187.6202.2213.8
Net yield(Units of 1 %)
6.26.36.35-65.25.65.96.2
5-76.06.85-45.o5-55-9
' 5.85-45-24.24.65-34.94-7
The capital was £1,200,000. t Par = £100.
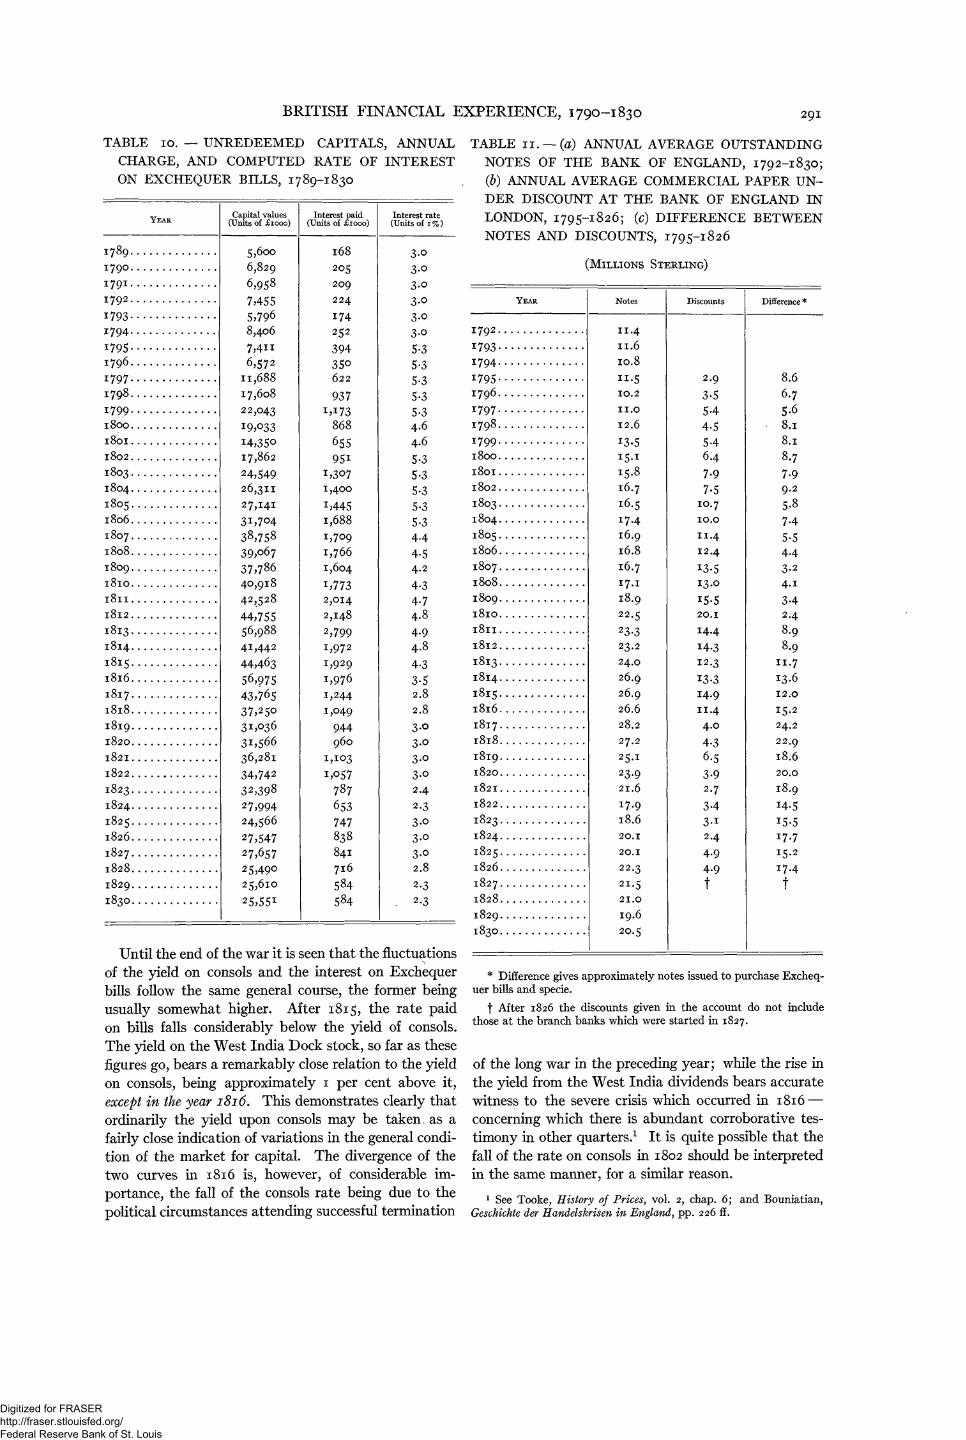
As a still further expedient for measuring interestrates, and particularly those upon securities of inter-mediate maturity, resort may be had to the interestpaid by the government on Exchequer bills. These weresecurities issued annually for current expenses and usu-ally against the revenues of the succeeding years, andat the option of the holder might be redeemed at theend of one year at par, or converted into the subsequentissue. The rate of interest allowed on them was varied
from time to time to correspond as nearly as possibleto the rate prevailing in the market, but might notexceed 5 1/2 per cent nor fall below 2 per cent. A consider-able proportion of the unfunded debt consisted of suchExchequer bills. In the Parliamentary Accounts andPapers for 1857-58, vol. 33, is given a statement of thecapital value and interest charge on Exchequer billsfor each year (ending January 5), from 1696 to 1857.2
Dividing the latter by the former we obtain approximatefigures of the rate of interest actually paid to the holdersfrom 1790 to 1830. These rates being fixed at statedintervals (once a year) naturally do not respond to in-fluences bearing upon the money market during thoseperiods, but nevertheless they will be found a valuablesupplement to our other data (see Table 10).
During the Napoleonic war and continuing down tothe year 1834, the rates of interest and discount in Eng-land were subject to the limitations imposed through-out the period of this study by the Usury Laws, whichproclaimed a maximum rate of 5 per cent. The exist-ence of these laws did not, of course, prevent higherrates of interest than 5 per cent from being obtainedthrough security transactions;3 nor did it prevent thegovernment from occasionally paying a higher rate.The Laws did have the effect, however, of discouragingthe published statement of the rates of discount (pluscommissions) charged by all banks save the Bank ofEngland.4 The Bank maintained a constant rate of 5per cent for the discount of private paper (usuallysixty-five day bills) until June 20, 1822, when the rateon the best securities was lowered to 4 per cent. OnDecember 13, 1825, the rate again became 5 per centand remained so until July 5, 1827, when the 4 per centrate was resumed and continued through 1830.5
Let us now examine these statistics of interest ratesas they appear together on Chart 4. The course of thethree curves indicates unmistakably the limits of theperiod of war strain. By 1819-22 the rate on bills isprecisely what it was during 1789-94. In 1821-22 theyield on consols is clearly back at the pre-war level.Thus the effects of the war on the market seem to havebeen overcome by the opening of the decade of thetwenties.
1 Report from the Select Committee (Commons') Appointed to Con-sider the Means of Improving and Maintaining the Foreign Trade of theCountry. West India Docks. — With minutes of evidence and appen-dix; 1823. (Parliamentary Papers, 1823, vol. 1.) Brief accounts ofthe docks will be found in Palgrave's Dictionary, Rees's Cyclopedia,vol. xii, (1809), art. Docks; and in earlier editions of the EncyclopediaBritannica.
2 Following the table is an historical and descriptive account ofExchequer bills (pp. 94-105). See also Penny Cyclopedia, vol. 10(1837), sub nom: Charles Fenn, Compendium of the English andForeign Funds, and Wm. Fairman, Public Funds of England.
3 See the evidence given by David Ricardo and others before theCommittee of the Commons appointed in 1818 to inquire into theUsury Laws.
4 The only market rates of discount thus far obtained are those ofOverend, Gurney and Co., monthly, from 1824 to 1847. (Lords'Report of 1848, p. 467.) It is barely possible that by intensive searchamong the records of some of the older banking houses, materialsmay be found throwing light upon these rates for earlier years.
5 Charles Fenn, Compendium of the English and Foreign Funds,14th ed., p. 74.
Digitized for FRASER http://fraser.stlouisfed.org/ Federal Reserve Bank of St. Louis
BRITISH FINANCIAL EXPERIENCE, 1790-1830 291
TABLE 10. — UNREDEEMED CAPITALS, ANNUAL
CHARGE, AND COMPUTED RATE OF INTEREST
ON EXCHEQUER BILLS, 1789-1830
YEAR
1789I79O1791I792
I7Q3
17941795179617971798
179918OO
l8oiI8O21803180418051806180718081809l8lOl8lll8l2181318141815l8l61817I8l8
1819I82O
l82I
1822
18231824182518261827182818291830
Capital values(Units of £1000)
5,6OO
6,829
6,958
7,4555,7968,406
7,4ii6,572
11,68817,60822,043X9,°33i4,35o17,862
24,54926,31127,1413i,7O438,75839?o6737,78640,91842,528
44,75556,98841,44244,46356,97543,76537,25031,0363i,56636,28134,74232,39%27,99424,56627,54727,65725,49025,610
25,55!
Interest paid(Units of £1000)
1682O5209224174252
39435O622
937M73
S6S
65595i
x,3O71,400
i,4451,6881,7091,7661,604
i,7732,014
2,148
2,7991,9721,9291,9761,2441,049
944960
1,103
i,o57787
653747838841716584584
Interest rate(Units of 1%)
3.O3-o3-o3-o3-o3-o5-35-35-35-35-34.64.65-35-35-35-35-34.4
4.54.2
4-34-74.84.94.84.33-52.82.8
3-o3-o3-o3-o2.4
2.33-o3-o3-o2.8
2.3. 2.3
Until the end of the war it is seen that the fluctuationsof the yield on consols and the interest on Exchequerbills follow the same general course, the former beingusually somewhat higher. After 1815, the rate paidon bills falls considerably below the yield of consols.The yield on the West India Dock stock, so far as thesefigures go, bears a remarkably close relation to the yieldon consols, being approximately 1 per cent above it,except in the year 1816. This demonstrates clearly thatordinarily the yield upon consols may be taken. as afairly close indication of variations in the general condi-tion of the market for capital. The divergence of thetwo curves in 1816 is, however, of considerable im-portance, the fall of the consols rate being due to thepolitical circumstances attending successful termination
TABLE 11. — (a) ANNUAL AVERAGE OUTSTANDING
NOTES OF THE BANK OF ENGLAND, 1792-1830;
(6) ANNUAL AVERAGE COMMERCIAL PAPER UN-
DER DISCOUNT AT THE BANK OF ENGLAND IN
LONDON, 1795-1826; (c) DIFFERENCE BETWEEN
NOTES AND DISCOUNTS, 1795-1826
(MILLIONS STERLING)
YEAR
1792179317941795179617971798
179918OOI8OII8O21803180418051806180718081809l8lOl8lll8l218131814
18151816181718181819I82O
I82I
1822
18231824182518261827182818291830
Notes
II.411.610.8
" • 510.2
11.0
12.6
13.5i5-i
15.816.716.517.416.916.816.717.118.922.5
23.323.224.026.926.926.628.227.225-i23-921.617.918.620.1
20.1
22.3
21.5
21.0
19.620.5
Discounts
2.9
3-55-44.55-46.47-97.5
10.710.0
11.4
12.4
x3-513.0
!5-520.1
14.4
14-312.3
13-314.911.44.04.36.53-92.7
3-43-i2.4
4.94.9f
Difference *
8.66.75-68.18.18.7
7.99.2
5.87-45-5443-24.13-42.48.9
8.911.713.612.0
15.2
24.2
22.9
18.620.0
18.914.515-517.715.2
17.4f
* Difference gives approximately notes issued to purchase Excheq-uer bills and specie.
f After 1826 the discounts given in the account do not includethose at the branch banks which were started in 1827.
of the long war in the preceding year; while the rise inthe yield from the West India dividends bears accuratewitness to the severe crisis which occurred in 1816 —concerning which there is abundant corroborative tes-timony in other quarters.1 It is quite possible that thefall of the rate on consols in 1802 should be interpretedin the same manner, for a similar reason.
1 See Tooke, History of Prices, vol. 2, chap. 6; and Bouniatian,Geschichte der Handelskrisen in England, pp. 226 ff.
Digitized for FRASER http://fraser.stlouisfed.org/ Federal Reserve Bank of St. Louis

292 THE REVIEW OF ECONOMIC STATISTICS
CHART 5. — OUTSTANDING CIRCULATION AND DISCOUNT OF COMMERCIAL PAPER, AND DIFFERENCEBETWEEN NOTES AND DISCOUNTS OF THE BANK OF ENGLAND
(DATA GIVEN IN TABLE I I )
(a) ANNUAL AVEEAGE OUTSTANDING CIRCULATION OF THE BANK OF ENGLAND, I 792-1830. UNITS OF £1,000,000 STEELING.
(b) ANNUAL AVERAGE DISCOUNTS OF COMMERCIAL PAPER HELD BY BANK OF ENGLAND, 1795-1826. " " " "
(c) EXCESS OF NOTES OVER DISCOUNTS, 1795-1826. " " " u
CURRENCY
In passing to statistics of currency, we may beginwith the note circulation of the Bank of England. InAppendix 82 to the Report of the Committee on the BankCharter of 1832, there are data of the average outstand-ing bank notes for each quarter year from 1792 to 1831.From these quarterly averages annual averages werederived. In Appendices 56 and 58 of the same Report,the quarterly average and also annual average holdingsof private commercial paper discounted by the Bank aregiven; and these annual figures have been placed to-gether with the outstanding circulation in Table 11.Appendices 24 and 32 of the Report give the averagepublic and private deposits in the Bank beginning with1807,1 from which it appears that the private depositswere very moderate and steady, varying between oneand two millions at the outside. The great bulk of theprivate discounts therefore involved note issues. If,then, the difference between the average discounts andthe average total circulation be taken, the result willindicate with fair accuracy the notes issued by the Bankfor the purchase from the public or the government ofExchequer and Treasury bills (the only forms of publicsecurity in which the Bank then invested) and for thepurchase of bullion and coin. The results are plotted
1 Prior to 1807 no distinct accounts were kept at the Bank forpublic and private deposits.
on Chart 5. Unfortunately, we do not possess officialannual data for either of these last mentioned accounts.The nearest approximation to them are figures for buttwo days in each year, one at the end of February, theother at the end of August— to be found in Appendix5 of the Report for 1832. It would be unsafe to attemptto employ such meagre data for comparison with, andfurther elaboration of, the above statistics; but sinceduring the restriction the specie holdings of the Bankprobably did not fluctuate with very great suddenness,the February-August data for the reserve may be pre-sented for purposes of a rough comparison (Table 12).These figures permit the statement, in a general way,that the Bank made considerable purchases of bullionfrom 1798 to 1800, 1805 to 1808, and subsequent to1816, when preparations began for the resumption ofcash payments.
Making due allowance for the issue of notes forspecie, it appears from the different curves on Chart 5that the advance in notes made by the Bank directly orindirectly to the government were extremely small dur-ing the war, and during 1805-10 almost negligible. Themagnitude of the credits granted to the government inother forms can be very roughly seen only for the periodafter 1807 in the data of the annual average publicdeposits. (See Table 13.) These vary but little fromyear to year, and decline sharply after 1816. The
Digitized for FRASER http://fraser.stlouisfed.org/ Federal Reserve Bank of St. Louis

BRITISH FINANCIAL EXPERIENCE, 1790-1830 293
TABLE 12. — GOLD RESERVES OF THE BANK OFENGLAND: (a) BULLION AND COIN HELD BYTHE BANK OF ENGLAND ON FEBRUARY 28 ANDAUGUST 31 , 1790-1830; (6) AVERAGE OF FEBRU-ARY 28 AND AUGUST 31
TABLE 13. —ANNUAL AVERAGE PUBLIC DEPOSITSHELD BY THE BANK OF ENGLAND, 1807-1830*
(UNITS or £100,000)
Year
I79O
1791
1792
1793
1794
1795
1796
1797
I798
1799
I8OO
l8oi
I8O2
1803
1804
1805
1806
1807
1808
1809
l8lO
[f/Iff
|
{{{{{{{{{{{{{
Month
Feb.Aug.Feb.Aug.Feb.Aug.Feb.Aug.Feb.Aug.Feb.Aug.Feb.Aug.Feb.Aug.Feb.Aug.Feb.Aug.Feb.Aug.Feb.Aug.Feb.Aug.Feb.Aug.Feb.Aug.Feb.Aug.Feb.Aug.Feb.Aug.Feb.Aug.Feb.Aug.Feb.Aug.
Reserve(Units of£1000)
8,6338,3867,8698,0566,468
5,3574,0115>3226,9876,7706,1285,1362,5402,1231,0864,0905,8296,5467,5647,0006,1445,1504,6404,3354,1533,8923,7773,5923,3725,8795,8847,624
5,9876,215
6,1436,484
- 7,8556,016
4,4893,6523,5oi3,192
AverageReserve(Units ofmillion £)
}}}}}}}}}}}}}}}}}}}}}
8.5
8.O
6.O
4.6
6.9
5.6
2.3
2.6
6.2
7.3
5.6
4 4
4.o
3-7
4.6
6.8
6.1
6.3
6.9
4 . 0
3-4
Year
l 8 l l
l8l2
1813
1814
1815
I8l6
1817
I8l8
1819
I82O
I82I
1822
1823
1824
1825
1826
1827
1828
1829
1830
[|[
|
[f{{{{{{{{{{{{{
Month
Feb.Aug.Feb.Aug.Feb.Aug.Feb.Aug.Feb.Aug.Feb.Aug.Feb.Aug.Feb.Aug.Feb.Aug.Feb.Aug.Feb.Aug.Feb.Aug.Feb.Aug.Feb.Aug.Feb.Aug.Feb.Aug.Feb.Aug.Feb.Aug.Feb.Aug.Feb.Aug.Feb.Aug.
Reserve(Units of£1000)
3,3513,2432,9833,O992,8842,7122,2O42,098
2,O373,4O94,641
7,5639,68l
11,668IO,o556,3634,1853,5954,9n8,211
11,870
" ,234Ix,o5710,09810,38412,65813,81011,787
8,7793,6342,460
6,75410,15910,464!o,34710,499
6,8356,7969,i7i
11,150
AverageReserve
(Units ofmillion £)
}}}}}}}}}}}}}}}}}}}}
3-3
3-o
2.8
2 .2
2.7
6.1
10.7
8.2
3.9
6.5
11.6
10.6
" •3
12.8
6.2
4.6
10.6
10.4
6.8
9.6
AverageReserve
(Units ofmillion £)
advances in the form of notes made by the Bank to themercantile community and to other banks are the out-standing feature of its accounts. During the war, themarket rate of interest was frequently above, or verylittle below, the fixed Bank rate of 5 per cent, and theBank directors pursued a policy of granting as liberalaccommodation to commerce as was consistent withtheir customary limitations respecting the quality of thepaper accepted. One consequence of the Bank's fixeddiscount rate (until 1822) was that, in periods offinancial strain, the Bank was called upon to grant anextra measure of accommodation, so that the maximumpoints upon the curve of its discounts do not, in all cases,
Year
1807I8O81809l8lOl 8 l ll8 l2
I8I318141815I8l61817I8l8
Average
12.6
11.8
11.1
12.0
10.2
10.410.412.211.710.88.7
Year
1819I82Ol82I18221823182418251826182718281829183O
Average
4.53.73-94.1
5.57.25.34.24.23*3-94.8
* Commons1 Report of 1832, Appendix.
TABLE 15. —VALUES OF ENGLISH COUNTRY BANKNOTES (OF £1 AND £5) STAMPED IN EACHYEAR: ONE POUND NOTES, 1805-25; FIVEPOUND NOTES, 1805-30; ONE AND FIVE POUNDNOTES COMBINED, 1805-25
(UNITS OF £1,000,000 STERLING)
Year*
i8oq180618071808180018101811181218131814181c;1816181718181810182018211822182318241821?1826182718281820
1830
£1 notes
3.752.402.143.O84.752.882.883.014.0334O2.631.863.283.541.681.662.171.851.90
2.453-O4
£5 notes
5.O63.232.29
4.194.I93.IO3-°64.213.762.752.352.30
3.5i3.7313.0I.OI1.221.301.322.172.56
.701.231.881.67
i-35
£1 and £5 notes
8.315^34437.278.945.985-947.22
7-796.15
4.984.166.797.272.982.673.393.153.224.625.60
* Year beginning January 6.
coincide with the peaks of the price curve.1 After 1816the rate of interest paid by the government on Excheq-uer bills declined so greatly that the Bank was forcedto carry a much larger amount; and the investment by
1 The Bank's discounts together with other data are comparedwith prices in Chart 6.
Digitized for FRASER http://fraser.stlouisfed.org/ Federal Reserve Bank of St. Louis

2Q4 THE REVIEW OF ECONOMIC STATISTICS
TABLE 14. — (a) AMOUNT OF STAMP DUTY PAID IN EACH YEAR BY COUNTRY BANKS ON PROMISSORYNOTES; (b) ESTIMATED VALUE OF NOTES STAMPED
OFFICIAL YEARS; AND CHANGES OF DUTY
Duties imposed by 44 Geo. Ill, ch. 98 (1804)
Year ended January 5, 1806" " « " 1807« " " " 1808
January 5, 1808 to October 10, 1808
Duties imposed by 48 Geo. Ill , ch. 149 (1808)
October 10, 1808 to January 5, 1809Year ended January 5, 1810
« « « « 1811" « " 1812
« 1813« " " " 1814
« « 1815January 5, 1815 to October xo, 1815
Duties imposed by 55 Geo. Ill, ch. 184 (1815 )
October 10, 1815 to January 5, 1816Year ended January 5,1817
« « « « 1818« " 1819
« " " " 1820« " " " 1821« « « « 1822
« « 1823« .« « « 1824
« « 1825« « " « 1826« « « « 1827
« « 1828« « 1829
« 1830« « « « 1831« « " « 1832
(a)
Not exceeding£1/1
At tf. Uo)
£40,58029,96426,77416,808
At Ad. {-h)
£28,97879,11148,019
47,94150,16267,19156,69421,421
At sd. (is)
£27,95238,70168,380
73,656
35,O9934,600
45,15938,616
39,69551,02863,310
(b)
Value of notes(taken at £1)
£3,246,0002,397,0002,142,0001,344,000
£1,739,0004,747,0002,881,0002,876,0003,010,0004,031,0003,402,0001,285,000
£1,342,0001,858,0003,282,0003,535,0001,685,0001,661,0002,168,0001,854,0001,905,0002,449,0003,039,000
(a)
Notes over £2/2,not over £5/5
At**. Orb-)
£37,96024,258
17,15420,380
At is. (yta)
£14,742
41,9353O,97730,65142,14437,6O927,479IX,959
At is. sd. (A)
£14,41728,715
43,&1446,59816,259
j 12,63615,23316,201
1 16,44927,15731,934
8,72515,36923,54520,89716,88218,142
(b)
Value of notes(taken at £5)
£5,061,0003,234,0002,287,0002,717,000
£1,474,0004,193,0003,098,0003,065,0004,214,0003,761,0002,748,0001,196,000
£1,153,0002,297,0003,508,0003,728,0001,301,0001,011,0001,219,0001,296,0001,316,0002,172,000
2,555,ooo698,000
1,230,0001,884,0001,672,0001,350,0001,451,000
the Bank in public securities was made all the morenecessary by the fact that the market rate of discounton commercial paper fell much further below the Bankrate than it had been in the earlier years.1 From 1821on the amount of accommodation granted by the Bankto the mercantile community was no greater than at theopening of the war period.
Statistics of the metallic circulation of England forthis period do not exist. We know simply that soonafter the commencement of the Bank restriction, in1797, specie began to disappear from circulation, andits place was taken by paper. The loss of the gold coinwas earliest and most seriously felt (the silver being in amuch more worn and degraded condition), and the Bankconsequently was permitted to issue, during the con-
1 I have not attempted to include data of the note circulation inScotland or Ireland. It may be mentioned, however, that after therestriction of cash payments had been extended by Parliament to theBank of Ireland, an extraordinary increase of its notes, as well as ofthe circulation issued by countless country banks and even trades-
tinuance of the suspension, notes of one and two pounds.In 1798 the country banks likewise were given thisprivilege, which lasted until 1829. Other importantsubstitutes were (1) the Exchequer bills of the govern-ment, which were negotiable and passed not only inpayments to the government but to some extent inordinary transactions; (2) the notes and checks of thecountry banks; (3) inland bills of exchange. Thelast were very commonly circulated in commercialdealings, being endorsed from holder to holder untilcompletely covered with signatures. In the WestRiding, bills of exchange were long used almost to theexclusion of other forms of large currency. Of theamount of these bills created there are no immediatelyavailable statistics for our period, except estimates for
men, took place. A rapid depreciation, observable in the prices ofgoods and specie and in the Irish exchanges, took place, culminatingin 1804. As the result of a Parliamentary inquiry in that year, greatercaution was observed by the Irish Bank, and steps were taken tolimit the provincial paper.
Digitized for FRASER http://fraser.stlouisfed.org/ Federal Reserve Bank of St. Louis

BRITISH FINANCIAL EXPERIENCE, 1790-1830 295
CHART 6. — SMALL COUNTRY BANK NOTE CIRCULATION, GENERAL PRICES, INTEREST RATES,AND BANK *OF ENGLAND DISCOUNTS
(DATA GIVEN IN TABLES 2, 9, n , 15)
(a) ESTIMATED CIRCULATION OF SMALL COUNTRY BANK NOTES, 1805-30. UNITS OF £1,000,000.(b) JEVONS' INDEX NUMBERS OF PRICES OF FORTY COMMODITIES, 1782-1830. UNITS OF TEN PER CENT.
(c) AVERAGE YIELD OF WEST INDIA DOCK COMPANY STOCK, 1806-28. UNITS OF ONE PER CENT
(d) DISCOUNTS OF BANK OF ENGLAND, 1795-1826. UNITS OF £1,000,000.
1815, 1824, 1825, and 1826-27. Mr. William Leatham,a reliable Wakefield banker, calculated from the re-turns of bill stamps, which he obtained directly fromthe Stamp Office, that in those years the total amountsof bills drawn were as follows:1
Total bills drawn Bills outstanding
1815 £649,921,163 £l62,OOO,OOO
1824 316,363,783 79,000,000
1825 354,405,293 87,000,000
1826-27* 282,222,305 71,000,000
1835 405,403,051 101,000,000
* Last half of 1826; first half of 1827.
Leatham calculated (for other than the above years)that the average amount of bills outstanding at a giventime was one-fourth of the total number created,2 andthe figures inserted in column 2 are obtained in thismanner.
In any statement of the displacement of coin by paperduring the restriction, it is most important to make
allowance for the practically unknown quantity of thisbill circulation.3
A stamp tax was imposed, not only upon bills ofexchange, but also upon bankers' reissuable notes, be-ginning October 1804. The returns of the StampOffice of receipts from the stamps on the notes of bank-ers, from that year until 1831, are to be found in theReport of 1832, Appendix 99. The rates of duty oneach class of notes were twice increased, in 1808 and in
1 Letters to William Raynor Woody 26. series, 1841, p. 13. Leathamincluded estimates for the years 1832-39. See also Newmarch, Statis-tical Journal, (1852), 14, p. 143. The accessible published returns ofthe Stamp Office were found by the present writer not to give suffi-ciently complete returns to permit a calculation of the amountscreated for other years.
2 Assuming the average maturity to be three months.3 Thus Bouniatian, op. cit., pp. 217, 218, takes an estimate of the
gold coin in 1798 as 35 millions sterling (Lord Liverpool) and in 1811as 3 millions (George Rose) and, adding these respective amounts tothe Bank circulation, he obtains a total of 46.3 millions and 26.0 mil-lions, respectively, and draws the conclusion that upon the whole thecurrency was not enlarged.
Digitized for FRASER http://fraser.stlouisfed.org/ Federal Reserve Bank of St. Louis
296 THE REVIEW OF ECONOMIC STATISTICS
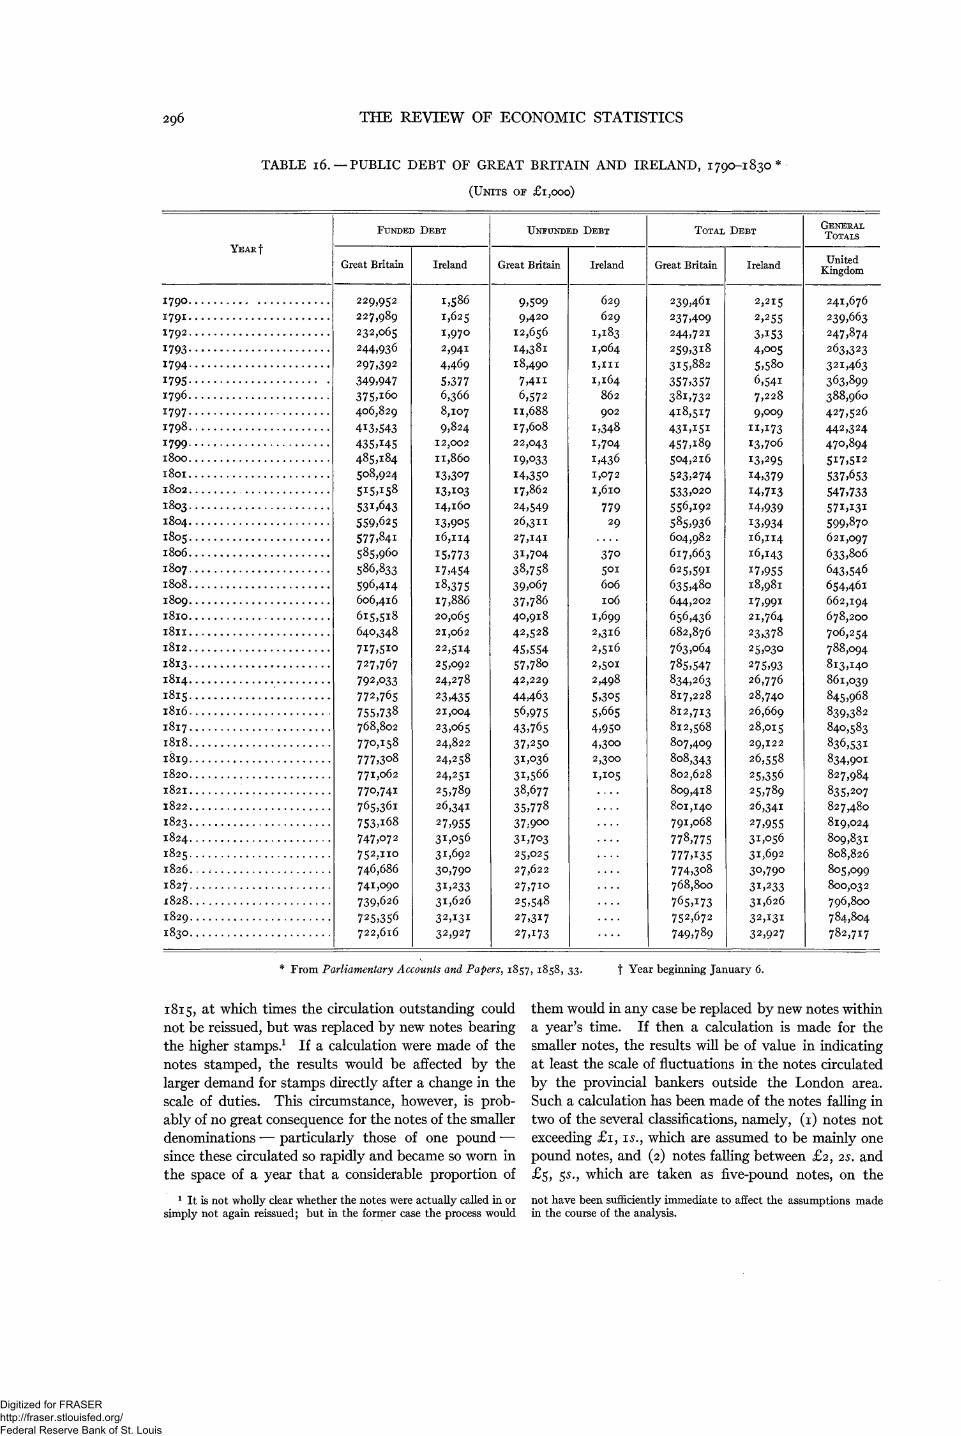
TABLE 16. —PUBLIC DEBT OF GREAT BRITAIN AND IRELAND, 1790-1830*
(UNITS OF £1,000)
FUNDED DEBT
YEARfGreat Britain
I790 229,952
1791 227,989
I792 232,065
1793 244,936
1794 297,392
I79S 349,947
1796 375^60
1797 406,829
1798 413,543
1799 435,X451800 485,184
1801 508,924
1802 515,158
1803 53^6431804 559,625
1S05 577,841
1806 585,960
1807 586,833
1808 596,414
1809 606,416
1810 615,518
1811 640,348
1812 717,5^
1813 727,767
1814 792,033
1815 772,765
1816 755,738
1817 768,802
1818 770,158
1819 777,3o8
1820 771,062
1821 77o,74i
1822 765,361
1823 753,i68
1824 747,072
1825. 752,no
1826..., 746,686
1827 741,090
1828 739,626
1829 725,356
1830 722,616
Ireland
1,586
1,625
1,970
2,941
4,469
5,3776,366
8,107
9,824
12,002
11,860
13,307
13,103
14,160
13,90516,114
15,773
17,454
18,37517,886
20,065
21,062
22,514
25,092
24,278
23,43521,004
23,065
24,822
24,258
24,251
25,789
26,341
27,95531,056
31,692
30,790
31,23331,626
32,13132,927
UNFUNDED DEBT
Great Britain
9,5O99,42O
12,656
I4,38i
18,490
7,4H
6,572
11,688
17,608
22,043
I9,O33
I4,35O17,862
24,54926,311
27,141
31,704
38,758
39,o67
37,786
40,918
42,528
45,554
57,78o
42,229
44463
56,975
43,765
37,25O
31,036
31,566
38,677
35,778
37,900
31,703
25,025
27,622
27,710
25,548
27,317
27,173
Ireland
629
629
1,183
1,064
I,III
1,164862
902
1,3481,704
1,4361,072
I,6lO
77929
37o501
606106
1,699
2,316
2,516
2,501
2,498
5,3O5
5,665
4,95o
4,300
2,300
1,105
....
....
....
....
....
....
....
TOTAL
Great Britain
239,461
237,409
244,721
259,318
315,882
357,357
381,732
418,517
43i,i5i
457,i89
504,216
523,274533,020
556,192
585,936
604,982
617,663
625,591
635,480
644,202
656,436
682,876
763,064
785,547834,263
817,228
812,713
812,568
807,409
808,343
802,628
809,418
801,140
791,068
778,775
777,135
774,3o8
768,800
765,173752,672
749,789
DEBT
Ireland
2,215
2,255
3,1534,005
5,58o
6,541
7,228
9,009
H,I7313,706
13,295
14,379J4,7i3
*4,939X3,93416,114
16,143
!7,95518,981
i7,99i
21,764
23,378
25,030
275,9326,776
28,740
26,669
28,015
29,122
26,558
25,356
25,789
26,341
27,95531,056
31,692
30,790
31,23331,626
32,131
32,927
GENERALTOTALS
UnitedKingdom
241,676
239,663
247,874
263,323
321,463
363,899388,960
427,526
442,324
470,894
537,653
547,733
57i,i3i
599,87o
621,097
633,806
643,546
654,461
662,194
678,200
706,254
788,094
813,140
861,039
845,968
839,382
840,583
836,531834,901
827,984
835,207
827,480
819,024
809,831
808,826
805,099
800,032
796,800
784,804
782,717
* From Parliamentary Accounts and Papers, 1857, 1858, 33. t Year beginning January 6.
1815, at which times the circulation outstanding couldnot be reissued, but was replaced by new notes bearingthe higher stamps.1 If a calculation were made of thenotes stamped, the results would be affected by thelarger demand for stamps directly after a change in thescale of duties. This circumstance, however, is prob-ably of no great consequence for the notes of the smallerdenominations — particularly those of one pound —since these circulated so rapidly and became so worn inthe space of a year that a considerable proportion of
them would in any case be replaced by new notes withina year's time. If then a calculation is made for thesmaller notes, the results will be of value in indicatingat least the scale of fluctuations in the notes circulatedby the provincial bankers outside the London area.Such a calculation has been made of the notes falling intwo of the several classifications, namely, (1) notes notexceeding £1, is., which are assumed to be mainly onepound notes, and (2) notes falling between £2, 2s. and£5, $s.9 which are taken as five-pound notes, on the
1 It is not wholly clear whether the notes were actually called in orsimply not again reissued; but in the former case the process would
not have been sufficiently immediate to affect the assumptions madein the course of the analysis.
Digitized for FRASER http://fraser.stlouisfed.org/ Federal Reserve Bank of St. Louis
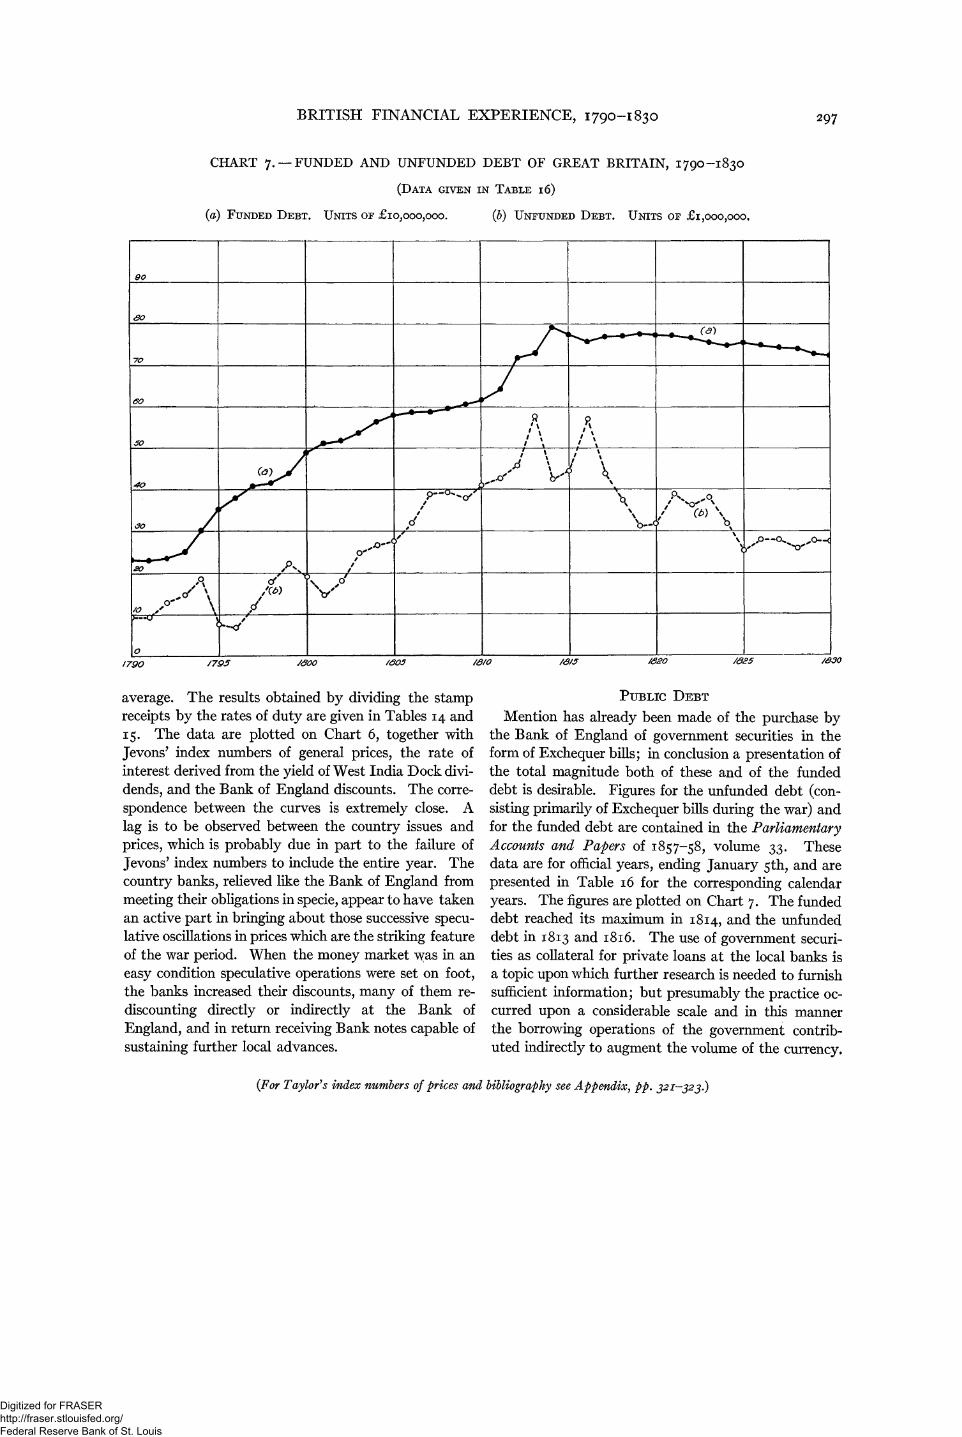
BRITISH FINANCIAL EXPERIENCE, 1790-1830 297
CHART 7. —FUNDED AND UNFUNDED DEBT OF GREAT BRITAIN, 1790-1830
(DATA GIVEN IN TABLE 16)
(a) FUNDED DEBT. UNITS OF £10,000,000. (b) UNFUNDED DEBT. UNITS OF £I,000,000,
average. The results obtained by dividing the stampreceipts by the rates of duty are given in Tables 14 and15. The data are plotted on Chart 6, together withJevons' index numbers of general prices, the rate ofinterest derived from the yield of West India Dock divi-dends, and the Bank of England discounts. The corre-spondence between the curves is extremely close. Alag is to be observed between the country issues andprices, which is probably due in part to the failure ofJevons' index numbers to include the entire year. Thecountry banks, relieved like the Bank of England frommeeting their obligations in specie, appear to have takenan active part in bringing about those successive specu-lative oscillations in prices which are the striking featureof the war period. When the money market \^as in a n
easy condition speculative operations were set on foot,the banks increased their discounts, many of them re-discounting directly or indirectly at the Bank ofEngland, and in return receiving Bank notes capable ofsustaining further local advances.
PUBLIC DEBT
Mention has already been made of the purchase bythe Bank of England of government securities in theform of Exchequer bills; in conclusion a presentation ofthe total magnitude both of these and of the fundeddebt is desirable. Figures for the unfunded debt (con-sisting primarily of Exchequer bills during the war) andfor the funded debt are contained in the ParliamentaryAccounts and Papers of 1857-58, volume 33. Thesedata are for official years, ending January 5th, and arepresented in Table 16 for the corresponding calendaryears. The figures are plotted on Chart 7. The fundeddebt reached its maximum in 1814, and the unfundeddebt in 1813 and 1816. The use of government securi-ties as collateral for private loans at the local banks isa topic upon which further research is needed to furnishsufficient information; but presumably the practice oc-curred upon a considerable scale and in this mannerthe borrowing operations of the government contrib-uted indirectly to augment the volume of the currency.
{For Taylor's index numbers of prices and bibliography see Appendix, pp. 321-323.)
Digitized for FRASER http://fraser.stlouisfed.org/ Federal Reserve Bank of St. Louis
Related Documents