BRITISH COLUMBIA PERINATAL HEALTH PROGRAM Optimizing Neonatal, Maternal and Fetal Health BRITISH COLUMBIA PERINATAL DATABASE REGISTRY Annual Report 2007

Welcome message from author
This document is posted to help you gain knowledge. Please leave a comment to let me know what you think about it! Share it to your friends and learn new things together.
Transcript

BRITISH COLUMBIA PERINATAL HEALTH PROGRAM
Optimizing Neonatal, Maternal and Fetal Health
BRITISH COLUMBIA PERINATAL DATABASE REGISTRY
Annual Report 2007

For further information contact:
BRITISH COLUMBIA PERINATAL HEALTH PROGRAM
Telephone: (604) 875-3737Fax: (604) 875-3747Website: <http://www.bcphp.ca>Address: F502 – 4500 Oak Street
Vancouver, BC V6H 3N1
This publication can also be accessed electronically via the Internet at:http://www.bcphp.ca/
Suggested Citation: British Columbia Perinatal Health Program. British Columbia Perinatal Database RegistryAnnual Report 2007. Vancouver, BC.
Graphic production by Angela G. Atkins

BRITISH COLUMBIA PERINATAL HEALTH PROGRAM – PERINATAL DATABASE REGISTRY ANNUAL REPORT 2007 i
The BCPHP is pleased to present the 2007 British Columbia Perinatal Database Registry Annual Report. This report wasprepared and developed by Susan Barker, Romy McMaster and Lisa Miyazaki with clinical contribution and counsel fromthe following individuals:
Ms. Karen Vida, Acting Program Director, BC Perinatal Health ProgramMs. Sheryll Dale, Manager, BC Perinatal Database RegistryMs. Lucy Barney, Perinatal Nurse Consultant, BC Perinatal Health ProgramMs. Lily Lee, Perinatal Nurse Consultant, BC Perinatal Health ProgramMs. Barbara Selwood, Perinatal Nurse Consultant, BC Perinatal Health ProgramDr. Leanne Dahlgren, Assistant Professor, Department of Obstetrics and Gynaecology, UBC;
Perinatologist, BC Women’s HospitalDr. Duncan Etches, Family Practice ConsultantDr. Duncan F. Farquharson, Medical Director, BC Perinatal Health Program; Medical Director,
Maternal Fetal Medicine, North Fraser Health Region; Head Obstetrics, Royal Columbian HospitalDr. Patti Janssen, Associate Professor, Department of Health Care and Epidemiology, UBCDr. Janusz Kaczorowski, Associate Professor, Department of Family Practice, UBC;
Director of Primary Care and Community Research, Child and Family Research InstituteDr. Robert Liston, Chairman, Provincial Perinatal Advisory Committee, BC Perinatal Health Program;
Department Head, UBC Obstetrics and GynaecologyDr. Alfonso Solimano, Neonatal Consultant, BC Perinatal Health Program; Neonatal Medical Leader,
Provincial Specialized Perinatal Services (PSPS Program), BC Women’s HospitalDr. Anne Synnes, Clinical Associate Professor, Faculty of Medicine, UBC; Neonatologist,
Children’s and Women’s Health Centre of BC
The BCPHP gratefully acknowledges the assistance of health records staff at the participating hospitals, as well as the physi-cians and nurses who generated the records, in addition to the data analysts for their valuable work in the collection, extractionand analysis of data. The program also wishes to acknowledge the BC Ministry of Health Services and the BC Vital StatisticsAgency for their ongoing support in data quality initiatives.
ACKNOWLEDGEMENTS

ii BRITISH COLUMBIA PERINATAL HEALTH PROGRAM – PERINATAL DATABASE REGISTRY ANNUAL REPORT 2007
HIGHLIGHTS AND EXECUTIVE SUMMARY . . . . . . . . . . . . . . . . . . . . . . . . . . . . . . . . . . . . . . . . . . . . . . . . . . . . . . . . . . . . . . . . . . . . . . . . . . . . . . . . . . . . . . 1 BACKGROUND . . . . . . . . . . . . . . . . . . . . . . . . . . . . . . . . . . . . . . . . . . . . . . . . . . . . . . . . . . . . . . . . . . . . . . . . . . . . . . . . . . . . . . . . . . . . . . . . . . . . . . . . . . . 2INTRODUCTION . . . . . . . . . . . . . . . . . . . . . . . . . . . . . . . . . . . . . . . . . . . . . . . . . . . . . . . . . . . . . . . . . . . . . . . . . . . . . . . . . . . . . . . . . . . . . . . . . . . . . . . . . . . 3
SECTION I Demographics• Demographics . . . . . . . . . . . . . . . . . . . . . . . . . . . . . . . . . . . . . . . . . . . . . . . . . . . . . . . . . . . . . . . . . . . . . . . . . . . . . . . . . . . . . . . . . . . . 6
SECTION II Maternal Indicators• Care Provider Delivering Baby by Place of Delivery for Health Service Delivery Areas, Health Authorities
and Province, 2002/2003 to 2006/2007 . . . . . . . . . . . . . . . . . . . . . . . . . . . . . . . . . . . . . . . . . . . . . . . . . . . . . . . . . . . . . . . . . . . . . . . 10 • Teen Birth Rate by Place of Residence for Health Service Delivery Areas, Health Authorities and Province,
2002/2003 to 2006/2007 . . . . . . . . . . . . . . . . . . . . . . . . . . . . . . . . . . . . . . . . . . . . . . . . . . . . . . . . . . . . . . . . . . . . . . . . . . . . . . . . . . . . 12• Maternal Smoking Rate by Place of Residence for Health Service Delivery Areas, Health Authorities and Province,
2002/2003 to 2006/2007 . . . . . . . . . . . . . . . . . . . . . . . . . . . . . . . . . . . . . . . . . . . . . . . . . . . . . . . . . . . . . . . . . . . . . . . . . . . . . . . . . . . . 14• Induction of Labour Rate by Place of Delivery for Health Service Delivery Areas, Health Authorities and Province,
2002/2003 to 2006/2007 . . . . . . . . . . . . . . . . . . . . . . . . . . . . . . . . . . . . . . . . . . . . . . . . . . . . . . . . . . . . . . . . . . . . . . . . . . . . . . . . . . . . 16• Fetal Surveillance During Labour by Place of Delivery for Health Service Delivery Areas,
Health Authorities and Province, 2004/2005 to 2006/2007 . . . . . . . . . . . . . . . . . . . . . . . . . . . . . . . . . . . . . . . . . . . . . . . . . . . . . . . 18 • Episiotomy Rate by Place of Delivery for Health Service Delivery Areas, Health Authorities and Province,
2002/2003 to 2006/2007 . . . . . . . . . . . . . . . . . . . . . . . . . . . . . . . . . . . . . . . . . . . . . . . . . . . . . . . . . . . . . . . . . . . . . . . . . . . . . . . . . . . . 20• Postpartum Length of Stay (Vaginal Deliveries) by Place of Delivery for Health Service Delivery Areas,
Health Authorities and Province, 2002/2003 to 2006/2007 . . . . . . . . . . . . . . . . . . . . . . . . . . . . . . . . . . . . . . . . . . . . . . . . . . . . . . . 22 • Postpartum Length of Stay (Caesarean Section Deliveries) by Place of Delivery for Health Service Delivery Areas,
Health Authorities and Province, 2002/2003 to 2006/2007 . . . . . . . . . . . . . . . . . . . . . . . . . . . . . . . . . . . . . . . . . . . . . . . . . . . . . . . 24• Pre-pregnancy Body Mass Index (BMI) by Place of Residence for Health Service Delivery Areas,
Health Authorities and Province, 2002/2003 to 2006/2007 . . . . . . . . . . . . . . . . . . . . . . . . . . . . . . . . . . . . . . . . . . . . . . . . . . . . . . . 26• Maternal Postpartum Readmission to Hospital by Place of Delivery for Health Service Delivery Areas,
Health Authorities and Province, 2002/2003 to 2005/2006 . . . . . . . . . . . . . . . . . . . . . . . . . . . . . . . . . . . . . . . . . . . . . . . . . . . . . . . 28• Method of Delivery Rate (Vaginal vs Caesarean Section Deliveries) by Place of Delivery for
Health Service Delivery Areas, Health Authorities and Province, 2002/2003 to 2006/2007 . . . . . . . . . . . . . . . . . . . . . . . . . . . 30
SECTION III Fetal and Newborn Indicators• Newborn Feeding by Place of Delivery for Health Service Delivery Areas,
Health Authorities and Province, 2004/2005 to 2006/2007 . . . . . . . . . . . . . . . . . . . . . . . . . . . . . . . . . . . . . . . . . . . . . . . . . . . . . . . 34• Changes in Birth Rate by Place of Residence for Health Service Delivery Areas,
Health Authorities and Province, 2000/2001 to 2006/2007 . . . . . . . . . . . . . . . . . . . . . . . . . . . . . . . . . . . . . . . . . . . . . . . . . . . . . . . 36• Birth Weight vs Gestational Age by Place of Residence for Health Service Delivery Areas,
Health Authorities and Province, 2002/2003 to 2006/2007 . . . . . . . . . . . . . . . . . . . . . . . . . . . . . . . . . . . . . . . . . . . . . . . . . . . . . . . 38
SECTION IV Appendices and References
Appendix 1 Definitions and Notes on Indicators . . . . . . . . . . . . . . . . . . . . . . . . . . . . . . . . . . . . . . . . . . . . . . . . . . . . . . . . . . . . . . . . 43
Appendix 2 British Columbia Perinatal Database – Information Resources . . . . . . . . . . . . . . . . . . . . . . . . . . . . . . . . . . . . . . . . . 46
Appendix 3 Health Authorities, Health Service Delivery Areas and Institutions . . . . . . . . . . . . . . . . . . . . . . . . . . . . . . . . . . . . . 47
Appendix 4 Birth Weight and Gestational Age Charts for British Columbia Population for Singleton Males (1981-2000) . . . . . 49
Appendix 5 Birth Weight and Gestational Age Charts for British Columbia Population for Singleton Females (1981-2000) . . . 50
Appendix 6 Live Births, Deaths, Marriages and Stillbirths – British Columbia, 1950 to 2005 . . . . . . . . . . . . . . . . . . . . . . . . . . 51Infant Mortality – British Columbia and Canada, 1965 to 2005 . . . . . . . . . . . . . . . . . . . . . . . . . . . . . . . . . . . . . . . . . 52Total Fertility Rates – British Columbia, 1950 to 2005 . . . . . . . . . . . . . . . . . . . . . . . . . . . . . . . . . . . . . . . . . . . . . . . . 53
Appendix 7 Map – Health Authorities and Health Service Delivery Areas . . . . . . . . . . . . . . . . . . . . . . . . . . . . . . . . . . . . . . . . . . 54
Appendix 8 Other Relevant Sources of Information . . . . . . . . . . . . . . . . . . . . . . . . . . . . . . . . . . . . . . . . . . . . . . . . . . . . . . . . . . . . . 55
Appendix 9 BC Perinatal Database Registry Information Request Form . . . . . . . . . . . . . . . . . . . . . . . . . . . . . . . . . . . . . . . . . . . . 56
Appendix 10 Data Tables . . . . . . . . . . . . . . . . . . . . . . . . . . . . . . . . . . . . . . . . . . . . . . . . . . . . . . . . . . . . . . . . . . . . . . . . . . . . . . . . . . . . 57
References . . . . . . . . . . . . . . . . . . . . . . . . . . . . . . . . . . . . . . . . . . . . . . . . . . . . . . . . . . . . . . . . . . . . . . . . . . . . . . . . . . . . . . . . . . . . . . . 72
TABLE OF CONTENTS PAGE

BRITISH COLUMBIA PERINATAL HEALTH PROGRAM – PERINATAL DATABASE REGISTRY ANNUAL REPORT 2007 iii
Table 1 Introduction Sources of Perinatal Data . . . . . . . . . . . . . . . . . . . . . . . . . . . . . . . . . . . . . . . . . . . . . . . . . . . . . . . . . . . . . . . . . . . . . . . . . . 3Table 2 Section I Total Births Per Fiscal Year . . . . . . . . . . . . . . . . . . . . . . . . . . . . . . . . . . . . . . . . . . . . . . . . . . . . . . . . . . . . . . . . . . . . . . . . . 6Table 3 Section I Population of Women in BC Aged 15-54, 2002 to 2006 . . . . . . . . . . . . . . . . . . . . . . . . . . . . . . . . . . . . . . . . . . . . . . . . . . 7Table 4 Section II Care Provider Delivering Baby by Place of Delivery for Health Service Delivery Areas,
Health Authorities and Province 2002/2003 to 2006/2007 . . . . . . . . . . . . . . . . . . . . . . . . . . . . . . . . . . . . . . . . . . . . . . . 11Table 5 Section II Teen Births by Place of Residence for Health Service Delivery Areas, Health Authorities and Province,
2002/2003 to 2006/2007 . . . . . . . . . . . . . . . . . . . . . . . . . . . . . . . . . . . . . . . . . . . . . . . . . . . . . . . . . . . . . . . . . . . . . . . . . . . . 13Table 6 Section II Maternal Smoking During Pregnancy by Place of Residence for Health Service Delivery Areas,
Health Authorities and Province, 2002/2003 to 2006/2007 . . . . . . . . . . . . . . . . . . . . . . . . . . . . . . . . . . . . . . . . . . . . . . 15Table 7 Section II Induction of Labour by Place of Delivery for Health Service Delivery Areas,
Health Authorities and Province 2002/2003 to 2006/2007 . . . . . . . . . . . . . . . . . . . . . . . . . . . . . . . . . . . . . . . . . . . . . . . 17Table 8 Section II Fetal Surveillance During Labour by Place of Delivery for Health Service Delivery Areas,
Health Authorities and Province 2004/2005 to 2006/2007 . . . . . . . . . . . . . . . . . . . . . . . . . . . . . . . . . . . . . . . . . . . . . . . 19Table 9 Section II Episiotomies by Place of Delivery for Health Service Delivery Areas, Health Authorities and Province,
2002/2003 to 2006/2007 . . . . . . . . . . . . . . . . . . . . . . . . . . . . . . . . . . . . . . . . . . . . . . . . . . . . . . . . . . . . . . . . . . . . . . . . . . . . 21Table 10 Section II Postpartum Length of Stay (Vaginal Deliveries) by Place of Delivery for Health Service Delivery Areas,
Health Authorities and Province, 2002/2003 to 2006/2007 . . . . . . . . . . . . . . . . . . . . . . . . . . . . . . . . . . . . . . . . . . . . . . 23Table 11 Section II Postpartum Length of Stay (Caesarean Section Deliveries) by Place of Delivery for Health Service
Delivery Areas, Health Authorities and Province, 2002/2003 to 2006/2007 . . . . . . . . . . . . . . . . . . . . . . . . . . . . . . . . 25Table 12 Section II Health Risk Classification According to Body Mass Index (BMI) . . . . . . . . . . . . . . . . . . . . . . . . . . . . . . . . . . . . . . . . . 26Table 13 Section II Maternal Postpartum Readmission by Place of Delivery for Health Service Delivery Areas,
Health Authorities and Province, 2002/2003 to 2005/2006 . . . . . . . . . . . . . . . . . . . . . . . . . . . . . . . . . . . . . . . . . . . . . . 29Table 14 Section II Method of Delivery by Place of Delivery for Health Service Delivery Areas,
Health Authorities and Province, 2002/2003 to 2006/2007 . . . . . . . . . . . . . . . . . . . . . . . . . . . . . . . . . . . . . . . . . . . . . . 31Table 15 Section II Spontaneous Vaginal vs Operative Deliveries by Place of Delivery for Health Service
Delivery Areas, Health Authorities and Province, 2002/2003 to 2006/2007 . . . . . . . . . . . . . . . . . . . . . . . . . . . . . . . . 32Table 16 Section III Newborn Feeding by Place of Delivery for Health Service Delivery Areas,
Health Authorities and Province, 2004/2005 to 2006/2007 . . . . . . . . . . . . . . . . . . . . . . . . . . . . . . . . . . . . . . . . . . . . . . 35Table 17 Section III Changes in Birth Rate by Place of Residence for Health Service Delivery Areas,
Health Authorities and Province, 2001/2002 to 2006/2007 (Year-to-Year Comparison) . . . . . . . . . . . . . . . . . . . . . . 37Table 18 Section III Birth Weight vs Gestational Age (Term Births) by Place of Residence for Health Service
Delivery Areas, Health Authorities and Province, 2002/2003 to 2006/2007 . . . . . . . . . . . . . . . . . . . . . . . . . . . . . . . . 39Table 19 Section III Birth Weight vs Gestational Age (Preterm Births) by Place of Residence for Health Service
Delivery Areas, Health Authorities and Province, 2002/2003 to 2006/2007 . . . . . . . . . . . . . . . . . . . . . . . . . . . . . . . . 40
Data Table 4A Appendix 10 Care Provider Delivering Baby by Place of Delivery for Health Service Delivery Areas, Health Authorities and Province, 2002/2003 to 2006/2007 . . . . . . . . . . . . . . . . . . . . . . . . . . . . . . . . . . . . . . . . . . . . . . 57
Data Table 5A Appendix 10 Teen Births by Place of Residence for Health Service Delivery Areas, Health Authorities and Province, 2002/2003 to 2006/2007 . . . . . . . . . . . . . . . . . . . . . . . . . . . . . . . . . . . . . . . . . . . . . . . . . . . . . . . . . . . . . . . . . . . . . . . . . . . . 58
Data Table 6A Appendix 10 Maternal Smoking During Pregnancy by Place of Residence for Health Service Delivery Areas, Health Authorities and Province 2002/2003 to 2006/2007 . . . . . . . . . . . . . . . . . . . . . . . . . . . . . . . . . . . . . . . . . . . . . . . 59
Data Table 7A Appendix 10 Induction of Labour by Place of Delivery for Health Service Delivery Areas, Health Authoritiesand Province 2002/2003 to 2006/2007 . . . . . . . . . . . . . . . . . . . . . . . . . . . . . . . . . . . . . . . . . . . . . . . . . . . . . . . . . . . . . . . . 60
Data Table 8A Appendix 10 Fetal Surveillance During Labour by Place of Delivery for Health Service Delivery Areas, Health Authorities and Province, 2004/2005 to 2006/2007 . . . . . . . . . . . . . . . . . . . . . . . . . . . . . . . . . . . . . . . . . . . . . . 61
Data Table 9A Appendix 10 Episiotomies by Place of Delivery for Health Service Delivery Areas, Health Authorities and Province, 2002/2003 to 2006/2007 . . . . . . . . . . . . . . . . . . . . . . . . . . . . . . . . . . . . . . . . . . . . . . . . . . . . . . . . . . . . . . . . . . . 62
Data Table 10A Appendix 10 Postpartum Length of Stay (Vaginal Deliveries) by Place of Delivery for Health Service Delivery Areas, Health Authorities and Province 2002/2003 to 2006/2007 . . . . . . . . . . . . . . . . . . . . . . . . . . . . . . . . . 63
Data Table 11A Appendix 10 Postpartum Length of Stay (Caesarean Section Deliveries) by Place of Delivery for Health Service Delivery Areas, Health Authorities and Province, 2002/2003 to 2006/2007 . . . . . . . . . . . . . . . . . . . 64
Data Table 12A Appendix 10 Body Mass Index (BMI) by Place of Residence for Health Service Delivery Areas, Health Authorities and Province, 2002/2003 to 2006/2007 . . . . . . . . . . . . . . . . . . . . . . . . . . . . . . . . . . . . . . . . . . . . . . 65
Data Table 13A Appendix 10 Maternal Postpartum Readmission by Place of Delivery for Health Service Delivery Areas, Health Authorities and Province, 2002/2003 to 2005/2006 . . . . . . . . . . . . . . . . . . . . . . . . . . . . . . . . . . . . . . . . . . . . . . 66
LIST OF TABLES PAGE
Data Table 14A Appendix 10 Method of Delivery by Place of Delivery for Health Service Delivery Areas, Health Authorities and Province, 2002/2003 to 2006/2007 . . . . . . . . . . . . . . . . . . . . . . . . . . . . . . . . . . . . . . . . . . . . . . . . . . . . . . . . . . . . . . . 67
Data Table 15A Appendix 10 Spontaneous Vaginal vs Operative Deliveries by Place of Delivery for Health Service Delivery Areas, Health Authorities and Province, 2002/2003 to 2006/2007 . . . . . . . . . . . . . . . . . . . . . . . . . . . . . . . . 68
Data Table 16A Appendix 10 Newborn Feeding by Place of Delivery for Health Service Delivery Areas, Health Authorities and Province 2004/2005 to 2006/2007 . . . . . . . . . . . . . . . . . . . . . . . . . . . . . . . . . . . . . . . . . . . . . . . . . . . . . . . . . . . . . . . . 69
Data Table 18A Appendix 10 Birth Weight vs Gestational Age (Term Births) by Place of Residence for Health Service Delivery Areas, Health Authorities and Province, 2002/2003 to 2006/2007 . . . . . . . . . . . . . . . . . . . . . . . . . . . . . . . . 70
Data Table 19A Appendix 10 Birth Weight vs Gestational Age (Preterm Births) by Place of Residence for Health ServiceDelivery Areas, Health Authorities and Province, 2002/2003 to 2006/2007 . . . . . . . . . . . . . . . . . . . . . . . . . . . . . . . . 71
iv BRITISH COLUMBIA PERINATAL HEALTH PROGRAM – PERINATAL DATABASE REGISTRY ANNUAL REPORT 2007
Figure 1 Section I Age-Specific Fertility Rates . . . . . . . . . . . . . . . . . . . . . . . . . . . . . . . . . . . . . . . . . . . . . . . . . . . . . . . . . . . . . . . . . . . . . . . . . 7Figure 2 Section II Care Provider (Obstetrician/Family Physician) Delivering Baby by Place of Delivery for
Health Authorities and Province, 2002/2003 to 2006/2007 . . . . . . . . . . . . . . . . . . . . . . . . . . . . . . . . . . . . . . . . . . . . . . 11Figure 3 Section II Teen Births by Place of Residence for Health Authorities and Province, 2002/2003 to 2006/2007 . . . . . . . . . . . . . 13Figure 4 Section II Maternal Smoking During Pregnancy by Place of Residence for Health Authorities and Province,
2002/2003 to 2006/2007 . . . . . . . . . . . . . . . . . . . . . . . . . . . . . . . . . . . . . . . . . . . . . . . . . . . . . . . . . . . . . . . . . . . . . . . . . . . . 15Figure 5 Section II Induction of Labour by Place of Delivery for Health Authorities and Province,
2002/2003 to 2006/2007 . . . . . . . . . . . . . . . . . . . . . . . . . . . . . . . . . . . . . . . . . . . . . . . . . . . . . . . . . . . . . . . . . . . . . . . . . . . . 17Figure 6 Section II Fetal Surveillance During Labour by Place of Delivery for Health Authorities and Province,
2004/2005 to 2006/2007 . . . . . . . . . . . . . . . . . . . . . . . . . . . . . . . . . . . . . . . . . . . . . . . . . . . . . . . . . . . . . . . . . . . . . . . . . . . . 19Figure 7 Section II Episiotomies by Place of Delivery for Health Authorities and Province, 2002/2003 to 2006/2007 . . . . . . . . . . . . . 21Figure 8 Section II Postpartum Length of Stay (Vaginal Deliveries) by Place of Delivery for Health Authorities and
Province, 2002/2003 to 2006/2007 . . . . . . . . . . . . . . . . . . . . . . . . . . . . . . . . . . . . . . . . . . . . . . . . . . . . . . . . . . . . . . . . . . . 23Figure 9 Section II Postpartum Length of Stay (Caesarean Section Deliveries) by Place of Delivery for
Health Authorities and Province, 2002/2003 to 2006/2007 . . . . . . . . . . . . . . . . . . . . . . . . . . . . . . . . . . . . . . . . . . . . . . 25Figure 10 Section II Body Mass Index by Place of Residence for Health Authorities and Province,
2002/2003 to 2006/2007 . . . . . . . . . . . . . . . . . . . . . . . . . . . . . . . . . . . . . . . . . . . . . . . . . . . . . . . . . . . . . . . . . . . . . . . . . . . . 27Figure 11 Section II Maternal Postpartum Readmission by Place of Delivery for Health Authorities and Province,
2002/2003 to 2005/2006 . . . . . . . . . . . . . . . . . . . . . . . . . . . . . . . . . . . . . . . . . . . . . . . . . . . . . . . . . . . . . . . . . . . . . . . . . . . . 29Figure 12 Section II Method of Delivery by Place of Delivery for Health Authorities and Province,
2002/2003 to 2006/2007 . . . . . . . . . . . . . . . . . . . . . . . . . . . . . . . . . . . . . . . . . . . . . . . . . . . . . . . . . . . . . . . . . . . . . . . . . . . . 31Figure 13 Section II Spontaneous Vaginal vs Operative Deliveries by Place of Delivery for Health Authorities
and Province, 2002/2003 to 2006/2007 . . . . . . . . . . . . . . . . . . . . . . . . . . . . . . . . . . . . . . . . . . . . . . . . . . . . . . . . . . . . . . . 32Figure 14 Section III Newborn Feeding by Place of Delivery for Health Authorities and Province,
2004/2005 to 2006/2007 . . . . . . . . . . . . . . . . . . . . . . . . . . . . . . . . . . . . . . . . . . . . . . . . . . . . . . . . . . . . . . . . . . . . . . . . . . . . 35Figure 15 Section III Changes in Birth Rate by Place of Residence for Health Authorities and Province,
2000/2001 to 2006/2007 (Overall Comparison) . . . . . . . . . . . . . . . . . . . . . . . . . . . . . . . . . . . . . . . . . . . . . . . . . . . . . . . . 37Figure 16 Section III Birth Weight vs Gestational Age (Term Births) by Place of Residence for Health Authorities
and Province, 2002/2003 to 2006/2007 . . . . . . . . . . . . . . . . . . . . . . . . . . . . . . . . . . . . . . . . . . . . . . . . . . . . . . . . . . . . . . . 39Figure 17 Section III Birth Weight vs Gestational Age (Preterm Births) by Place of Residence for Health Authorities
and Province, 2002/2003 to 2006/2007 . . . . . . . . . . . . . . . . . . . . . . . . . . . . . . . . . . . . . . . . . . . . . . . . . . . . . . . . . . . . . . . 40
LIST OF FIGURES PAGE
LIST OF TABLES (CONT’D) PAGE
BRITISH COLUMBIA PERINATAL HEALTH PROGRAM – PERINATAL DATABASE REGISTRY ANNUAL REPORT 2007 1
The 2007 Annual Report includes perinatal data from fivefiscal years (April 1 to March 31) 2002/2003, 2003/2004,2004/2005, 2005/2006 and 2006/2007. The data provide evi-dence regarding issues pertaining to the care, treatmentand outcomes of mothers and newborns in British Columbia.BC residents who delivered out of province are not capturedin this report. Refer to page 43 Appendix 1 for definitions ofterms used throughout this report.
Some of the key highlights from this report are:
MothersClose to half (46.6%) of the women delivering in BC in 2006/2007were first time mothers.
The average age of women at the time of delivery continues toincrease: in 2006/2007, women were, on average, 30.4 yearsold at the time of delivery. Women having their first babywere, on average, 28.7 years old in 2006/2007, while womenhaving twins or multiples were, on average, 32.5 years old.
Fertility rates are slowly increasing for women in their 30’s,while for other age groups, the fertility rates are stabilizing orslowly declining.
Less than 4% of births in the province are to teenage women.In the Northern Health Authority (HA), however, close to 10%of births are to teenage women. In the last fiscal year, the pro-portion of births to teenage women in the Northern HAincreased 32% (from 7.1% to 9.4%).
Slightly more than 10% of all pregnant women in BC smokedduring their current pregnancy. In the last fiscal year, rates ofsmoking in pregnancy increased in every HA except theVancouver Coastal HA.
The majority of women delivering in BC are of normal weightpre-pregnancy. Rates of pre-pregnancy overweight and obesityare slowing increasing in BC, and together represent approxi-mately 32% of all delivering women with known pre-pregnancyBody Mass Index (BMI). Unknown BMI continues to be an issue:approximately one-third of delivered mothers in BC do not havesufficient information recorded to calculate pre-pregnancy BMI.
Labour & DeliveryApproximately 1 in 5 women had their labour induced in2006/2007. Women delivering in the Interior Health Authorityhad their labour induced more often in 2006/2007 than in anyof the previous four fiscal years. The Provincial HealthServices Authority continues to have the lowest inductionrates in the province (excluding births at home attended byregistered midwives).
The most common method of fetal surveillance in labour is acombination of intermittent auscultation and electronic fetal
monitoring, although rates of (exclusive) intermittent auscul-tation are slowly increasing across the province and rates of(exclusive) electronic fetal monitoring are slowly decreasing.
Less than 15% of women had an episiotomy during vaginaldelivery in the last fiscal year. There is variation throughoutthe province, with the highest rates of episiotomy in theFraser HA at 17%.
Only 60% of women in BC in 2006/2007 had a spontaneous vagi-nal delivery. The next most common method of delivery wasemergent caesarean section (approximately 20%), followed byelective caesarean delivery (slightly more than 11%) and oper-ative vaginal delivery (slightly fewer than 11%). Rates of cae-sarean section delivery continue to increase, while operativeand spontaneous vaginal deliveries continue to decrease.
NewbornsThe number of all births (singletons, twins and multiples) inBC increased from 40,407 in 2002/2003 to 42,198 in 2006/2007.Approximately 3% of births were twins or multiples. TheNortheast Health Service Delivery Area (HSDA) experiencedthe largest increase in the number of singleton births in thelast fiscal year (12.4% increase), while the Northern InteriorHSDA had the largest decrease in the last fiscal year (-3.9%).
The average birth weight for term singletons in BC was 3460grams in 2006/2007 (decreased from 3482 in 2002/2003). Themajority of both term and preterm singletons are average-for-gestational age. Fewer than 10% of term and preterm single-tons are small-for-gestational age.
Just under half of singleton births in BC were delivered byobstetricians, followed closely by family physicians (41.6% in2006/2007). The remaining births were delivered by registeredmidwives (close to 6%) and nurses (less than 3%). Close to10% of births in hospitals within the Vancouver Island HealthAuthority were delivered by registered midwives.
The majority of singletons born in BC received exclusivebreast milk and approximately 5% were formula fed (receivedno breast milk) during the birth admission.
PostpartumPostpartum lengths of stay continue to decrease across BC,after both vaginal and caesarean section delivery. The major-ity of women stay fewer than two days after a vaginal deliveryor fewer than four days after a caesarean delivery.
In 2006/2007, less than 3% of women having caesarean deliv-ery and 2% of women having vaginal delivery were readmittedto hospital (inpatient or same-day surgery) within 42 days ofdelivery for reasons other than routine follow-up. These rateshave increased slightly from the previous year.
HIGHLIGHTS AND EXECUTIVE SUMMARY

The Ministry of Health and the British Columbia MedicalAssociation (BCMA) initiated the British ColumbiaReproductive Care Program (BCRCP) in June 1988. A small, butdedicated group of individuals committed to ensuring thatinformation on perinatal health was made available to a wideaudience of professionals and planners, founded the BritishColumbia Perinatal Database Registry (BCPDR) in 1993.Notably, these individuals included Dr. Sidney Effer, Dr. WilliamJ. Ehman, Dr. Margaret Pendray, Mr. Peter Hayles and Dr. AlanThomson with the support of the BC Ministry of Health. TheBCRCP became part of the Provincial Health Services Authority(PHSA) in 2001 when the government of British Columbia intro-duced five geographically based health authorities and oneprovincial health service authority. In 2007, a new organiza-tional structure – the BC Perinatal Health Program (BCPHP) –was created to coordinate both the BCRCP and the ProvincialSpecialized Perinatal Services (PSPS). The BCPHP continues towork towards optimizing neonatal, maternal and fetal health inthe province through educational support to care providers,outcome analysis and multidisciplinary perinatal guidelines.
The BCPHP is overseen by a Provincial Perinatal AdvisoryCommittee and has representation from the Ministry of HealthServices (MOHS), the Provincial Health Services Authority(PHSA), Children’s and Women’s Health Centre of BC, HealthAuthorities, health care providers and academic organizations.
One of the mandates of the BCPHP is “the collection andanalysis of data to evaluate perinatal outcomes, careprocesses and resources via a province-wide computerizeddatabase”. This mandate led to the development of the BritishColumbia Perinatal Database Registry (BCPDR), with itsstated mission to collect, maintain, analyze and disseminatecomprehensive, province-wide perinatal data for the pur-poses of monitoring and improving perinatal care. Rollout ofthe Registry began in 1994, with collection of data from asmall number of hospital sites. Participation increased everyyear, resulting in full provincial data collection commencingApril 1, 2000. The BCPDR is a relational database containingover 300 fields, and now with complete provincial data, is avaluable source of perinatal information.
Data CollectionThe BCPDR consists of data collected from obstetrical facilitiesas well as births occurring at home attended by BC RegisteredMidwives with records for over 400,000 births currently in theprovincial database.
BC women who deliver in Alberta or in hospitals out of provinceare not captured in the BC Perinatal Database Registry.Therefore data from high outflow communities borderingAlberta will be under-reported.
The perinatal data presented in this report are collected fromfacilities throughout the province and imported into the cen-tral BC Perinatal Database Registry. Data from the CanadianInstitute for Health Information (CIHI) and matched files fromthe British Columbia Vital Statistics Agency complement thedata elements. Mortality data normally reported in the BCPDRAnnual Report consists of singleton pregnancy deaths identi-fied by the BCPDR supplemented by deaths identified by VitalStatistics records, in order to provide complete mortality datafor babies up to one year of age. Due to unavailability of cur-rent mortality information, this section has not been includedin the Annual Report 2007. Please refer to the Annual Report2006 for mortality information.
2 BRITISH COLUMBIA PERINATAL HEALTH PROGRAM – PERINATAL DATABASE REGISTRY ANNUAL REPORT 2007
BACKGROUND
BRITISH COLUMBIA PERINATAL HEALTH PROGRAM – PERINATAL DATABASE REGISTRY ANNUAL REPORT 2007 3
Table 1 Sources of Perinatal Data
BC Vital Discharge BC Perinatal Perinatal Data
Statistics Agency Abstract Database Database Registry
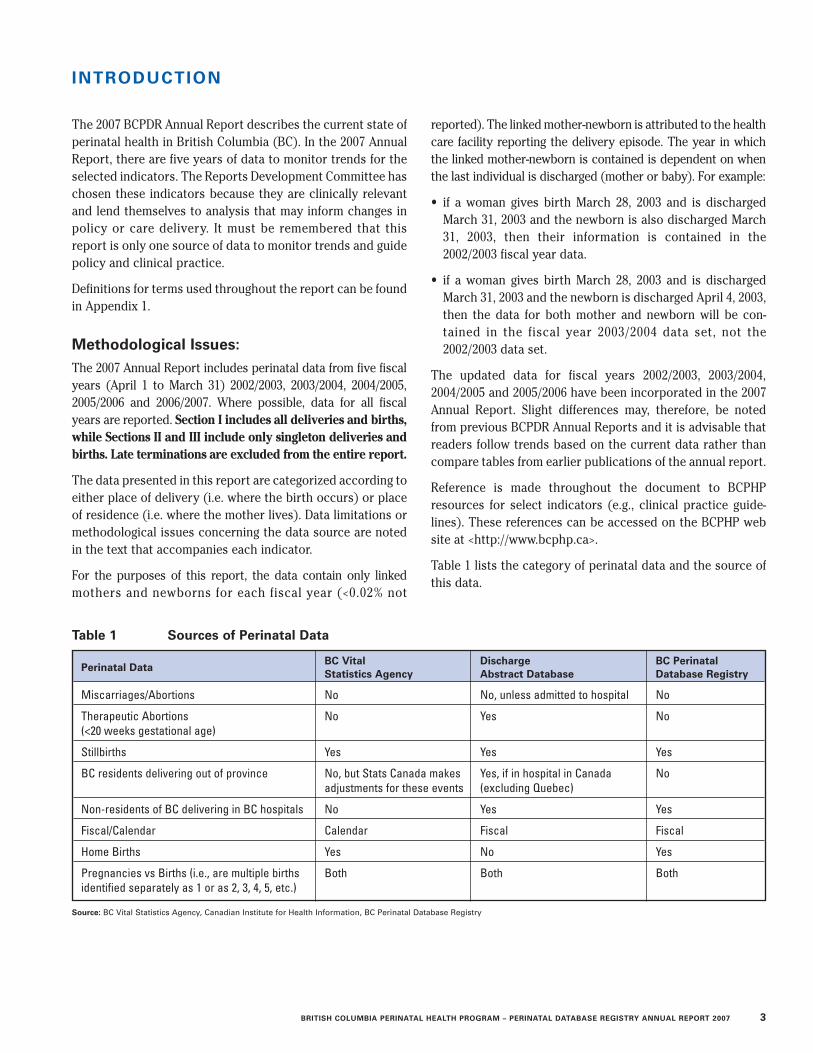
Miscarriages/Abortions No No, unless admitted to hospital No
Therapeutic Abortions No Yes No(<20 weeks gestational age)
Stillbirths Yes Yes Yes
BC residents delivering out of province No, but Stats Canada makes Yes, if in hospital in Canada Noadjustments for these events (excluding Quebec)
Non-residents of BC delivering in BC hospitals No Yes Yes
Fiscal/Calendar Calendar Fiscal Fiscal
Home Births Yes No Yes
Pregnancies vs Births (i.e., are multiple births Both Both Bothidentified separately as 1 or as 2, 3, 4, 5, etc.)
Source: BC Vital Statistics Agency, Canadian Institute for Health Information, BC Perinatal Database Registry
The 2007 BCPDR Annual Report describes the current state ofperinatal health in British Columbia (BC). In the 2007 AnnualReport, there are five years of data to monitor trends for theselected indicators. The Reports Development Committee haschosen these indicators because they are clinically relevantand lend themselves to analysis that may inform changes inpolicy or care delivery. It must be remembered that thisreport is only one source of data to monitor trends and guidepolicy and clinical practice.
Definitions for terms used throughout the report can be foundin Appendix 1.
Methodological Issues:The 2007 Annual Report includes perinatal data from five fiscalyears (April 1 to March 31) 2002/2003, 2003/2004, 2004/2005,2005/2006 and 2006/2007. Where possible, data for all fiscalyears are reported. Section I includes all deliveries and births,while Sections II and III include only singleton deliveries andbirths. Late terminations are excluded from the entire report.
The data presented in this report are categorized according toeither place of delivery (i.e. where the birth occurs) or placeof residence (i.e. where the mother lives). Data limitations ormethodological issues concerning the data source are notedin the text that accompanies each indicator.
For the purposes of this report, the data contain only linkedmothers and newborns for each fiscal year (<0.02% not
reported). The linked mother-newborn is attributed to the healthcare facility reporting the delivery episode. The year in whichthe linked mother-newborn is contained is dependent on whenthe last individual is discharged (mother or baby). For example:
• if a woman gives birth March 28, 2003 and is dischargedMarch 31, 2003 and the newborn is also discharged March31, 2003, then their information is contained in the2002/2003 fiscal year data.
• if a woman gives birth March 28, 2003 and is dischargedMarch 31, 2003 and the newborn is discharged April 4, 2003,then the data for both mother and newborn will be con-tained in the fiscal year 2003/2004 data set, not the2002/2003 data set.
The updated data for fiscal years 2002/2003, 2003/2004,2004/2005 and 2005/2006 have been incorporated in the 2007Annual Report. Slight differences may, therefore, be notedfrom previous BCPDR Annual Reports and it is advisable thatreaders follow trends based on the current data rather thancompare tables from earlier publications of the annual report.
Reference is made throughout the document to BCPHPresources for select indicators (e.g., clinical practice guide-lines). These references can be accessed on the BCPHP website at <http://www.bcphp.ca>.
Table 1 lists the category of perinatal data and the source ofthis data.
INTRODUCTION

SECTION I
DEMOGRAPHICS

SECTION I – DEMOGRAPHICS
distribution of these births between singleton and multiplebirths is illustrated in Table 2. Of the births in 2006/2007,51.5% were male; in 2002/2003, 51.4% were male.
BirthsIn 2006/2007, 42,198 babies were born in British Columbia,an increase from 2002/2003 when 40,407 babies were born.This increasing trend in the number of births, along with the
Birth WeightIn 2006/2007, the average birth weight of newborns in BC was3460 grams for term singletons and 2800 grams for term twinsor multiples. Average birth weights have decreased slightlyfrom 2002/2003, when the average birth weight was 3482 gramsfor singletons and 2830 grams for twins or multiples.
ParityOf women delivering in BC in 2006/2007, 46.6% were first-time mothers, an increase from 2002/2003, when 44.9% werenulliparous.
Maternal AgeThe average age of mothers in British Columbia in 2006/2007at the time of delivery was 30.4 years, an increase from2002/2003, when the average age was 30.1 years. The averageage of first-time mothers in BC increased from 28.6 years in2002/2003 to 28.7 years in 2006/2007. The average age ofmothers delivering twins or multiples increased from 31.5years in 2002/2003 to 32.5 years in 2006/2007.
Across Canada the proportion of live births to mothers over theage of 30 has been increasing. In 1991, 34.1% of babies in Canadawere born to mothers over the age of 30; by 2000, this propor-tion had increased to 41.9% [1]. Data from BC Vital Statisticsshows that the proportion of live births to mothers over the ageof 35 in British Columbia has more than doubled over the pasteighteen years, from 8.1% in 1986 to 21.5% in 2005 [2].
Table 2 Total Births Per Fiscal Year
Multiple Births Singleton Births Total Births
(includes twins and other multiple births)
Fiscal Year # % # % #
2002/2003 39,150 96.9 1,257 3.1 40,407
2003/2004 39,202 97.0 1,201 3.0 40,403
2004/2005 39,407 97.1 1,191 2.9 40,598
2005/2006 39,692 96.8 1,303 3.2 40,995
2006/2007 40,878 96.9 1,320 3.1 42,198
Source: BC Perinatal Database RegistryNote: The numbers correspond to births, not pregnancies. Late terminations are excluded. Only linked mothers and newborns included. Fiscal Year is dependent on when the last
individual is discharged (mother or baby).
6 BRITISH COLUMBIA PERINATAL HEALTH PROGRAM – PERINATAL DATABASE REGISTRY ANNUAL REPORT 2007

BRITISH COLUMBIA PERINATAL HEALTH PROGRAM – PERINATAL DATABASE REGISTRY ANNUAL REPORT 2007 7
Table 3 Population of Women in BC Aged 15 – 54, 2002 to 2006
2002 2003 2004 2005 2006
Age # % # % # % # % # %
15-19 136,805 11.3 136,440 11.2 135,975 11.0 136,341 11.0 137,302 10.9
20-24 135,660 11.2 139,824 11.4 144,637 11.7 147,974 11.9 150,381 12.0
25-29 133,479 11.0 133,475 10.9 135,551 11.0 138,736 11.1 142,277 11.3
30-34 151,532 12.5 150,210 12.3 148,028 12.0 146,207 11.7 144,471 11.5
35-39 166,355 13.7 161,447 13.2 158,394 12.9 158,659 12.7 160,643 12.8
40-44 177,046 14.6 178,385 14.6 179,818 14.6 179,429 14.4 177,555 14.1
45-49 167,404 13.8 171,365 14.0 174,514 14.2 177,305 14.2 180,124 14.3
50-54 147,541 12.1 150,776 12.3 155,213 12.6 160,102 12.9 165,349 13.1
Total 1,215,822 100.0 1,221,922 100.0 1,232,130 100.0 1,244,753 100.0 1,258,102 100.0
Source: Demography Division, Statistics Canada, OttawaPrepared by: BC Stats, Service BC, Ministry of Labour and Citizens’ Services, VictoriaNote: Population counts based on calendar year. All figures as of July 1st of the year stated.
AG
E-S
PE
CIF
ICFE
RT
ILIT
YR
AT
EP
ER
1,00
0
YEAR
140
120
100
80
60
40
20
0
15-19
20-24
25-29
30-34
35-39
40-44
45-49
1987
1988
1989
1990
1991
1992
1993
1994
1995
1996
1997
1998
1999
2000
2001
2002
2003
2004
2005
2006
Figure 1 Age-Specific Fertility Rates
Source: Fertility Rates and Population – BC STATS, Victoria, BC
BC Female PopulationThe population of women between the ages of 15 and 54 inBritish Columbia increased over the past five calendaryears. Table 3 illustrates this increase and also describes the
Age-Specific FertilityWhen looking at the age-specific fertility rates in BritishColumbia, it can be seen that fewer 20-29 year-olds are
delivering, while the proportion of women over the age of30 is increasing, particularly in the 35 to 39 year-olds.
distribution by age group. The proportion of women in BCbetween the ages of 15-19 and 30-44 continues to decrease.
DEMOGRAPHICS

SECTION I I
MATERNAL INDICATORS
10 BRITISH COLUMBIA PERINATAL HEALTH PROGRAM – PERINATAL DATABASE REGISTRY ANNUAL REPORT 2007(Only singleton deliveries and births included)
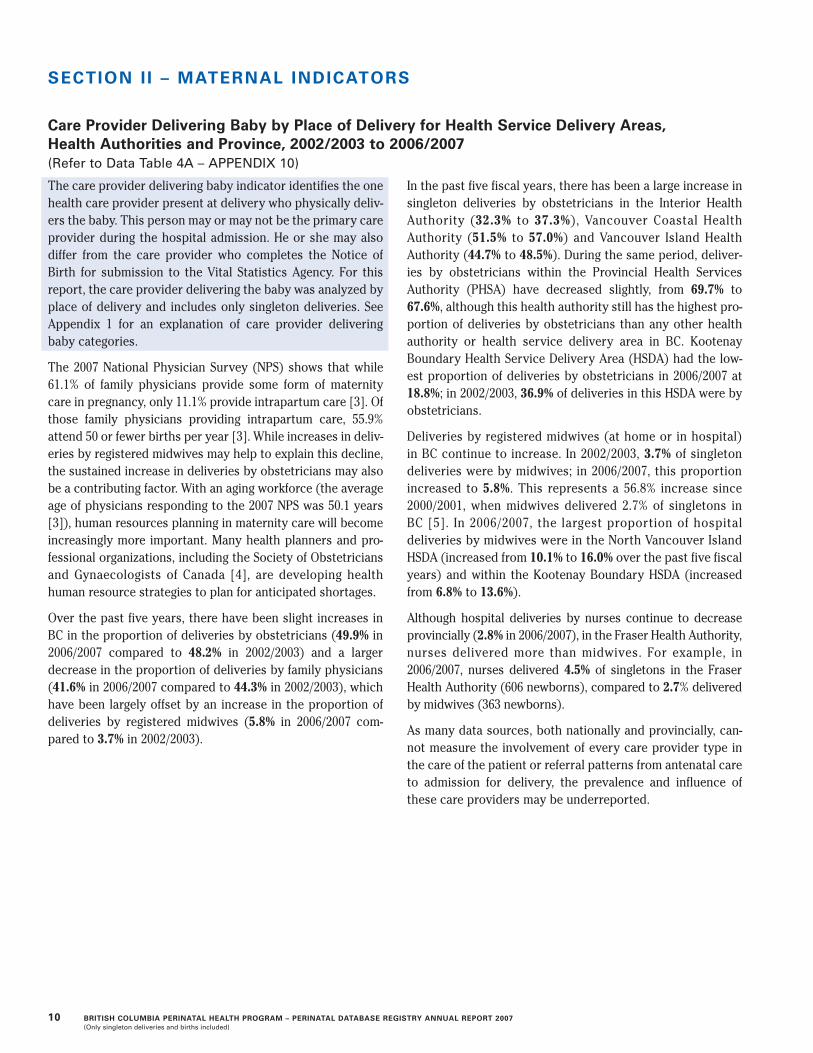
Care Provider Delivering Baby by Place of Delivery for Health Service Delivery Areas, Health Authorities and Province, 2002/2003 to 2006/2007 (Refer to Data Table 4A – APPENDIX 10)
The care provider delivering baby indicator identifies the onehealth care provider present at delivery who physically deliv-ers the baby. This person may or may not be the primary careprovider during the hospital admission. He or she may alsodiffer from the care provider who completes the Notice ofBirth for submission to the Vital Statistics Agency. For thisreport, the care provider delivering the baby was analyzed byplace of delivery and includes only singleton deliveries. SeeAppendix 1 for an explanation of care provider deliveringbaby categories.
The 2007 National Physician Survey (NPS) shows that while61.1% of family physicians provide some form of maternitycare in pregnancy, only 11.1% provide intrapartum care [3]. Ofthose family physicians providing intrapartum care, 55.9%attend 50 or fewer births per year [3]. While increases in deliv-eries by registered midwives may help to explain this decline,the sustained increase in deliveries by obstetricians may alsobe a contributing factor. With an aging workforce (the averageage of physicians responding to the 2007 NPS was 50.1 years[3]), human resources planning in maternity care will becomeincreasingly more important. Many health planners and pro-fessional organizations, including the Society of Obstetriciansand Gynaecologists of Canada [4], are developing healthhuman resource strategies to plan for anticipated shortages.
Over the past five years, there have been slight increases inBC in the proportion of deliveries by obstetricians (49.9% in2006/2007 compared to 48.2% in 2002/2003) and a largerdecrease in the proportion of deliveries by family physicians(41.6% in 2006/2007 compared to 44.3% in 2002/2003), whichhave been largely offset by an increase in the proportion ofdeliveries by registered midwives (5.8% in 2006/2007 com-pared to 3.7% in 2002/2003).
In the past five fiscal years, there has been a large increase insingleton deliveries by obstetricians in the Interior HealthAuthority (32.3% to 37.3%), Vancouver Coastal HealthAuthority (51.5% to 57.0%) and Vancouver Island HealthAuthority (44.7% to 48.5%). During the same period, deliver-ies by obstetricians within the Provincial Health ServicesAuthority (PHSA) have decreased slightly, from 69.7% to67.6%, although this health authority still has the highest pro-portion of deliveries by obstetricians than any other healthauthority or health service delivery area in BC. KootenayBoundary Health Service Delivery Area (HSDA) had the low-est proportion of deliveries by obstetricians in 2006/2007 at18.8%; in 2002/2003, 36.9% of deliveries in this HSDA were byobstetricians.
Deliveries by registered midwives (at home or in hospital)in BC continue to increase. In 2002/2003, 3.7% of singletondeliveries were by midwives; in 2006/2007, this proportionincreased to 5.8%. This represents a 56.8% increase since2000/2001, when midwives delivered 2.7% of singletons inBC [5]. In 2006/2007, the largest proportion of hospitaldeliveries by midwives were in the North Vancouver IslandHSDA (increased from 10.1% to 16.0% over the past five fiscalyears) and within the Kootenay Boundary HSDA (increasedfrom 6.8% to 13.6%).
Although hospital deliveries by nurses continue to decreaseprovincially (2.8% in 2006/2007), in the Fraser Health Authority,nurses delivered more than midwives. For example, in2006/2007, nurses delivered 4.5% of singletons in the FraserHealth Authority (606 newborns), compared to 2.7% deliveredby midwives (363 newborns).
As many data sources, both nationally and provincially, can-not measure the involvement of every care provider type inthe care of the patient or referral patterns from antenatal careto admission for delivery, the prevalence and influence ofthese care providers may be underreported.
SECTION I I – MATERNAL INDICATORS

BRITISH COLUMBIA PERINATAL HEALTH PROGRAM – PERINATAL DATABASE REGISTRY ANNUAL REPORT 2007 11(Only singleton deliveries and births included)
MATERNAL INDICATORS
Table
4C
areP
rovid
erD
elivering
Bab
yb
yP
laceo
fD
eliveryfo
rH
ealthS
erviceD
eliveryA
reas,Health
Au
tho
ritiesan
dP
rovin
ce,2002/2003
to2006/2007
*PH
SA
:Refers
toB
CW
om
en’s
Ho
spitalp
atients
on
lyN
ote:P
leaserefer
tob
ackflap
for
legen
do
fth
eH
ealthA
uth
orities
and
Health
Service
Delivery
Areas
FHA
IHA
NH
AV
CH
AV
IHA
PH
SA
*H
BB
CFE
FNFS
Total
EK
KB
OK
TC
STo
talN
EN
IN
WTo
talC
ST
RIC
HV
AN
CTo
talC
VI
NV
IS
VI
Total
%%
%%
%%
%%
%%
%%
%%
%%
%%
%%
%%
%%
Obstetrician
02/0331.3
46.664.3
51.215.5
36.939.6
27.032.3
19.425.0
30.525.1
34.351.8
71.051.5
55.445.5
37.844.7
69.70.0
48.203/04
33.548.5
66.553.3
22.722.7
41.834.1
35.310.6
26.130.0
23.034.7
56.972.9
53.758.9
51.537.2
46.571.2
0.050.0
04/0534.3
49.165.0
53.230.9
21.342.2
33.836.1
6.826.6
35.623.5
34.057.1
71.153.0
55.558.2
40.948.6
70.90.0
50.105/06
32.248.3
61.250.6
25.225.0
42.332.3
35.510.7
24.938.8
24.635.1
59.571.0
54.355.2
51.341.6
47.770.4
0.049.3
06/0730.1
52.261.0
51.829.1
18.845.9
33.237.3
18.926.3
37.026.7
37.662.5
75.157.0
54.853.6
42.548.5
67.60.0
49.9
Family
Physician02/03
61.747.2
27.641.6
72.553.8
56.566.3
61.378.5
68.365.7
70.357.1
43.823.0
41.938.2
42.453.8
46.826.6
0.044.3
03/0460.0
45.225.6
39.764.6
68.254.3
58.658.2
84.265.8
65.870.7
54.539.3
19.938.5
33.936.0
52.543.9
25.00.0
42.004/05
57.444.9
28.340.0
52.466.3
52.657.4
55.590.2
68.362.3
72.756.0
37.820.9
38.935.5
30.248.2
41.024.9
0.041.6
05/0658.8
44.731.1
41.756.1
63.654.7
58.657.0
86.168.8
57.070.5
53.233.4
21.436.6
35.334.3
47.941.5
24.30.0
41.706/07
60.040.5
31.340.2
51.767.2
50.257.9
54.577.7
66.359.6
68.151.4
31.518.4
34.835.6
29.547.1
40.325.3
0.041.6
Midw
ife02/03
1.22.8
1.61.9
2.36.8
1.10.0
1.40.0
2.20.0
1.03.0
0.14.4
2.73.6
10.16.6
6.21.9
99.23.7
03/042.2
2.91.7
2.25.5
7.61.9
0.12.2
0.02.7
0.01.2
5.30.0
6.44.4
3.710.6
8.27.2
2.299.2
4.404/05
2.92.6
1.82.3
9.011.9
2.20.0
3.20.1
2.30.2
1.24.8
0.37.0
4.56.5
9.89.1
8.42.3
96.54.9
05/063.5
2.62.2
2.610.6
10.31.3
0.32.9
0.03.7
0.11.8
5.71.0
6.84.9
6.612.9
9.08.8
3.897.2
5.406/07
2.63.2
2.32.7
11.813.6
1.70.0
3.40.0
3.90.1
1.84.9
1.55.3
4.26.9
16.09.1
9.55.3
97.55.8
Nurse
02/035.3
3.06.4
4.95.0
2.12.7
2.62.9
1.83.9
3.53.2
3.64.0
1.33.0
2.41.8
1.71.9
1.20.0
3.103/04
4.13.1
5.94.5
1.80.8
1.83.9
2.44.5
4.83.3
4.32.8
3.50.4
2.13.1
1.31.7
2.11.1
0.02.9
04/054.8
2.84.6
4.02.3
0.22.5
4.73.0
2.72.3
1.62.2
2.44.5
0.52.2
2.21.4
1.51.7
1.40.0
2.705/06
4.72.5
5.24.1
2.40.4
1.44.3
2.42.4
2.13.5
2.52.7
5.50.5
2.62.5
1.21.3
1.70.9
0.02.6
06/076.8
2.65.1
4.52.9
0.21.9
4.32.6
2.92.5
3.62.6
2.84.1
0.82.4
2.40.8
0.91.4
1.30.0
2.8
Obstetrician
Family
PhysicianP
LA
CE
OF
DE
LIV
ER
Y
PERCENT OF DELIVERIES
02/0303/04
04/0505/06
06/07
FHA
IHA
NH
AVCH
AVIH
APH
SA*
BC
8070605040302010002/03
03/0404/05
05/0606/07
02/0303/04
04/0505/06
06/0702/03
03/0404/05
05/0606/07
02/0303/04
04/0505/06
06/0702/03
03/0404/05
05/0606/07
02/0303/04
04/0505/06
06/07
*PH
SA
:Refers
toB
CW
om
en’s
Ho
spitalp
atients
on
lyN
ote:P
leaserefer
tob
ackflap
for
legen
do
fth
eH
ealthA
uth
orities
and
Health
Service
Delivery
Areas
Figu
re2
Care
Pro
vider
(Ob
stetrician/Fam
ilyP
hysician
)D
elivering
Bab
yb
yP
laceo
fD
eliveryfo
rH
ealthA
uth
orities
and
Pro
vince,
2002/2003to
2006/2007

12 BRITISH COLUMBIA PERINATAL HEALTH PROGRAM – PERINATAL DATABASE REGISTRY ANNUAL REPORT 2007(Only singleton deliveries and births included)
Teen Birth Rate by Place of Residence for Health Service Delivery Areas, Health Authorities and Province, 2002/2003 to 2006/2007 (Refer to Data Table 5A – APPENDIX 10)
The teen birth rate is defined as the number of deliveries tomothers 19 years of age or younger at the time of delivery, ata given place and time and expressed as a proportion of thetotal number of mothers, of any age, who deliver during thesame time and at the same place. For this report, teen birthrate was analyzed by place of residence and includes only sin-gleton deliveries.
Despite an overall decrease in the proportion of births toteens over the past five years, the proportion of singletonbirths to mothers aged 19 and younger (at the time of deliv-ery) increased from 3.3% in 2005/2006 to 3.6% in 2006/2007. Inthe years prior to 2006/2007, the proportion of all teen birthsin BC decreased from 4.0% in 2002/2003 to 3.6% in 2006/2007.The largest increase in teen births over the last five fiscalyears was in the Northern Health Authority (NHA), where theproportion of births to mothers between the ages of 18 and 19years increased from 5.4% in 2002/2003 to 6.8% in 2006/2007.
In the younger subset of teenaged mothers (<–17 years), theproportion of births decreased from 1.3% in 2002/2003 to1.1% in 2006/2007. The NHA, however, has a large proportionof births in this group. Specifically, in the Northwest HealthService Delivery Area (HSDA) 3.8% of deliveries in 2006/2007
were to women in this younger age group. Conversely, only0.3% of deliveries to residents of Richmond HSDA were towomen <–17 years of age in 2006/2007. In fact, the NorthwestHSDA has the largest proportion of births to teens (11.5% in2006/2007), followed by the Northeast HSDA with 9.3% andthe Northern Interior HSDA with 8.3%.
As teenage mothers have been associated, in the literature,with health indicators such as smoking and repeat pregnancyand their births have been associated with outcomes such aslow birth weight, spontaneous vaginal delivery rates, andpreterm delivery [6-8], further analysis was completed. In BCin 2006/2007, the prevalence of smoking in pregnancy was34.0% in teenage mothers compared to 9.8% in non-teenagemothers [9]. Of the teens who delivered in BC in 2006/2007,11.5% were parity >– 1 [9], consistent with 2005/2006 at 11.1%[10]. The average birth weight of term singletons born toteenage mothers in BC in 2006/2007 was 3475.1 grams com-pared to 3491.8 grams in non-teenage mothers [9]. Pretermbirth rates among teenaged mothers in BC in 2006/2007, were10.1%, compared to 8.1% in non-teenaged mothers [9]. Ratesof spontaneous vaginal delivery of singletons for teenagemothers were 71.0% in BC in 2006/2007 compared to 59.5% ofnon-teenaged mothers [9].
SECTION II

BRITISH COLUMBIA PERINATAL HEALTH PROGRAM – PERINATAL DATABASE REGISTRY ANNUAL REPORT 2007 13(Only singleton deliveries and births included)
MATERNAL INDICATORS
Table
5Teen
Birth
sb
yP
laceo
fR
esiden
cefo
rH
ealthS
erviceD
eliveryA
reas,Health
Au
tho
ritiesan
dP
rovin
ce,2002/2003
to2006/2007
FHA
IHA
NH
AV
CH
AV
IHA
BC
No
nB
CFE
FNFS
Total
EK
KB
OK
TC
STo
talN
EN
IN
WTo
talC
ST
RIC
HV
AN
CTo
talC
VI
NV
IS
VI
Total
Unspec
Res
%%
%%
%%
%%
%%
%%
%%
%%
%%
%%
%%
%%
<–17
years02/03
1.70.5
0.80.9
1.41.3
1.82.4
1.92.0
2.93.5
2.91.1
0.30.5
0.62.2
2.51.1
1.71.9
0.71.3
03/041.5
0.50.7
0.81.5
0.71.2
1.61.3
3.12.0
2.72.5
0.70.4
0.40.5
2.12.9
1.11.7
1.60.0
1.104/05
1.90.5
0.50.8
2.20.7
1.32.2
1.62.6
2.34.3
2.90.6
0.10.5
0.52.7
2.90.9
1.91.8
0.01.2
05/061.5
0.60.6
0.70.6
0.81.7
1.61.5
2.01.3
3.42.0
0.70.3
0.40.5
1.83.7
0.91.7
0.60.7
1.006/07
1.20.5
0.80.8
2.21.2
1.31.9
1.61.9
2.23.8
2.61.0
0.30.4
0.52.6
1.70.7
1.51.9
0.01.1
18-19Years
02/033.8
1.62.0
2.26.0
3.02.8
5.24.0
5.54.8
6.45.4
1.90.9
1.01.2
5.75.1
2.64.1
3.85.7
2.803/04
3.11.8
1.92.1
5.22.0
3.54.0
3.76.5
5.16.9
6.01.9
0.60.9
1.14.3
5.62.4
3.61.6
2.22.6
04/053.3
1.31.6
1.95.1
2.83.4
3.93.7
4.05.3
6.45.2
1.91.1
0.81.1
3.96.4
2.33.5
4.45.4
2.505/06
2.81.1
1.61.7
4.43.0
2.74.6
3.55.6
4.16.2
5.11.9
0.70.9
1.14.6
3.32.5
3.43.9
2.72.3
06/073.4
1.01.7
1.83.9
2.43.0
4.53.5
7.46.0
7.66.8
1.80.6
1.01.1
4.35.7
2.63.8
5.23.3
2.6TotalTeen
02/035.4
2.22.9
3.17.4
4.34.6
7.75.9
7.47.8
9.98.3
3.01.2
1.51.8
7.97.6
3.75.8
5.76.4
4.0M
oms
03/044.6
2.32.6
2.96.7
2.84.7
5.55.0
9.77.1
9.68.5
2.51.0
1.31.6
6.48.5
3.55.3
3.12.2
3.704/05
5.21.8
2.22.7
7.33.5
4.76.1
5.36.6
7.610.7
8.22.5
1.21.3
1.66.6
9.33.2
5.46.2
5.43.7
05/064.3
1.62.2
2.45.0
3.94.4
6.25.0
7.65.5
9.67.1
2.61.0
1.31.5
6.47.0
3.45.0
4.43.4
3.306/07
4.61.5
2.52.6
6.13.6
4.36.4
4.49.3
8.311.5
9.42.8
0.91.4
1.66.9
7.43.3
5.37.1
3.33.6
No
te:Please
referto
back
flapfo
rleg
end
of
the
Health
Au
tho
ritiesan
dH
ealthS
erviceD
eliveryA
reas
Figu
re3
TeenB
irths
by
Place
of
Resid
ence
for
Health
Au
tho
ritiesan
dP
rovin
ce,2002/2003
to2006/2007
18-19Years
<–17
YearsP
LA
CE
OF
RE
SID
EN
CE
PERCENT OF TEEN BIRTHS
02/0303/04
04/0505/06
06/07
FHA
IHA
NH
AVCH
AVIH
AB
C
8642002/03
03/0404/05
05/0606/07
02/0303/04
04/0505/06
06/0702/03
03/0404/05
05/0606/07
02/0303/04
04/0505/06
06/0702/03
03/0404/05
05/0606/07
No
te:Please
referto
back
flapfo
rleg
end
of
the
Health
Au
tho
ritiesan
dH
ealthS
erviceD
eliveryA
reas

14 BRITISH COLUMBIA PERINATAL HEALTH PROGRAM – PERINATAL DATABASE REGISTRY ANNUAL REPORT 2007(Only singleton deliveries and births included)
SECTION II
Maternal Smoking Rate by Place of Residence for Health Service Delivery Areas, Health Authorities and Province, 2002/2003 to 2006/2007 (Refer to Data Table 6A – APPENDIX 10)
The maternal smoking rate is defined as the number of preg-nant women who were reported to have smoked at any timein the current pregnancy expressed as a proportion of thetotal number of pregnant women at a given time and place.For this report, maternal smoking rates are reported by placeof residence and include only singleton deliveries.
Smoking in pregnancy and exposure to second hand smokeduring pregnancy has been associated with specific adverseoutcomes in the fetus and newborn as well as increased riskof pregnancy related complications. Increased risk of pretermbirths, stillbirths, low birthweight, and placental abruptionare a few of these adverse outcomes [11]. Although manywomen attempt to quit smoking after learning of her preg-nancy, these women may cycle through cessation attemptsand relapses throughout pregnancy, making it difficult tomonitor these fluctuations [12]. The longer a pregnant womansmokes during pregnancy, the greater the risk to her fetus. Ithas been shown, however, that cessation of smoking at anytime during pregnancy is beneficial [13]. Women who smokein pregnancy, therefore, should be encouraged to quit smok-ing at the start of her pregnancy as well as throughout thepregnancy and have access to adequate and appropriatesmoking cessation material.
The BC government announced the ActNow BC initiative in2005 to be achieved by 2010. For pregnant women, this initia-tive encourages healthy choices during pregnancy includinghealthy eating, increased physical activity, reduction intobacco use, reduction in overweight and obesity andincreased awareness of fetal alcohol spectrum disorder [ActNow BC – Welcome].
There are large differences in the rates of smoking in preg-nancy in BC. While the provincial prevalence of smoking inpregnancy has been relatively stable for the past five fiscalyears (10.7% in 2006/2007), rates are persistently high in cer-tain parts of the province. Specifically, the Northern HealthAuthority (NHA) had the highest smoking in pregnancy ratesin the province for the last five fiscal years, with a rate of18.7% in 2006/2007, followed by the IHA at 16.4% and theVIHA at 16.2%. Conversely, rates of smoking in pregnancy inthe Vancouver Coastal Health Authority have remained thelowest in the province for the last five years, at 5.2% in2002/2003 and 4.0% in 2006/2007.
The highest rates of smoking in pregnancy in any HealthService Delivery Area in BC in 2006/2007 was in the NorthernInterior, where approximately 1 in 5 women smoked in thecurrent pregnancy (20.6%). Richmond Health ServiceDelivery Area had the lowest rate of smoking in pregnancy in2006/2007, at 3.0%. While smoking in pregnancy rates are gen-erally decreasing across the province, the majority of theHealth Service Delivery Areas within the Vancouver IslandHealth Authority and the Northern Health Authority haveseen increasing rates from 2002/2003 to 2006/2007.

BRITISH COLUMBIA PERINATAL HEALTH PROGRAM – PERINATAL DATABASE REGISTRY ANNUAL REPORT 2007 15(Only singleton deliveries and births included)
MATERNAL INDICATORS
Table
6M
aternalS
mo
king
Du
ring
Preg
nan
cyb
yP
laceo
fR
esiden
cefo
rH
ealthS
erviceD
eliveryA
reas,Health
Au
tho
ritiesan
dP
rovin
ce,2002/2003
to2006/2007
FHA
IHA
NH
AV
CH
AV
IHA
BC
No
nB
CFE
FNFS
Total
EK
KB
OK
TC
STo
talN
EN
IN
WTo
talC
ST
RIC
HV
AN
CTo
talC
VI
NV
IS
VI
Total
Unspec
Res
%%
%%
%%
%%
%%
%%
%%
%%
%%
%%
%%
%%
02/0315.4
7.99.8
10.221.8
13.116.5
21.518.4
19.419.0
16.918.5
7.84.3
4.55.2
17.215.9
14.215.5
13.39.9
11.6
02/0314.0
7.88.6
9.417.0
14.714.6
18.016.0
21.020.1
17.719.6
6.04.0
4.04.5
16.116.9
14.315.3
16.06.7
10.9
04/0515.1
7.68.8
9.619.3
15.915.5
17.316.6
19.020.1
15.418.5
6.52.1
4.04.3
16.915.7
15.215.9
17.816.3
11.0
05/0613.0
5.98.1
8.316.2
16.013.5
18.815.8
19.919.4
13.618.0
6.83.3
3.74.4
16.617.8
14.916.0
15.515.5
10.4
06/0713.8
6.19.0
8.918.8
12.015.6
18.116.4
19.620.6
14.218.7
6.83.0
3.24.0
17.617.8
14.516.2
19.511.3
10.7
No
te:Please
referto
back
flapfo
rleg
end
of
the
Health
Au
tho
ritiesan
dH
ealthS
erviceD
eliveryA
reas
Figu
re4
Matern
alSm
okin
gD
urin
gP
regn
ancy
by
Place
of
Resid
ence
for
Health
Au
tho
ritiesan
dP
rovin
ce,2002/2003
to2006/2007
02/0310.2
18.418.5
5.215.5
11.6
03/049.4
16.019.6
4.515.3
10.9
04/059.6
16.618.5
4.315.9
11.0
05/068.3
15.818.0
4.416.0
10.4
06/078.9
16.418.7
4.016.2
10.7
PERCENT OF MOTHERS WHO SMOKEDDURING PREGNANCY
0 5 10 15 20 25
PL
AC
EO
FR
ES
IDE
NC
E
BC
VIHA
VC
HA
NH
AIH
AFH
A
No
te:Please
referto
back
flapfo
rleg
end
of
the
Health
Au
tho
ritiesan
dH
ealthS
erviceD
eliveryA
reas

16 BRITISH COLUMBIA PERINATAL HEALTH PROGRAM – PERINATAL DATABASE REGISTRY ANNUAL REPORT 2007(Only singleton deliveries and births included)
SECTION II
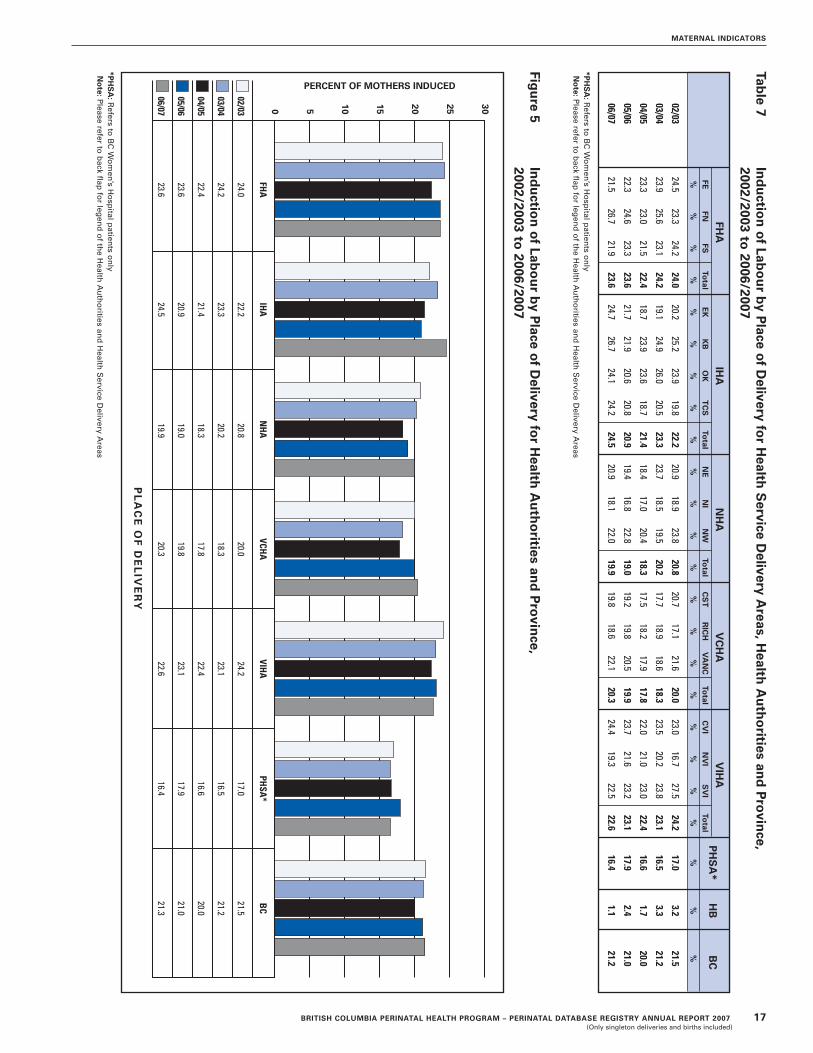
Induction of Labour Rate by Place of Delivery for Health Service Delivery Areas, Health Authorities and Province, 2002/2003 to 2006/2007 (Refer to Data Table 7A – APPENDIX 10)
The induction of labour rate is defined as the number of moth-ers whose labour is artificially initiated by medical (oxytocinand/or prostaglandin) or surgical (artificial rupture of mem-branes) means prior to the onset of spontaneous labour,expressed as a proportion of the total number of motherswho delivered at the same time and place. For this report,labour induction rates are reported by place of delivery andinclude only singleton deliveries. See Appendix 1 for the BCPerinatal Database Registry definition of induction used inthis report.
Approximately 1 in 5 pregnant women in British Columbia hadlabour induced by artificial (medical or surgical) means in2006/2007. As a method of initiation of labour, in addition tospontaneous labour or caesarean section before labour com-mences, inducing labour is an option that can be undertakenfor a number of reasons. These include post-term pregnancy,maternal conditions (such as gestational diabetes or hyper-tension), pre-labour rupture of membranes, evidence of fetalcompromise, fetal death, or other logistical or geographicalconstraints. In fact, in 2006/2007 the most common primaryindication for induction of labour in singleton pregnancieswas post-term pregnancy (36.7% of all inductions); this hasremained the most common primary indication for inductionsince 2000/2001 [14].
Although labour induction can be beneficial in certain situa-tions, it is also associated with a number of risks to bothmother and baby. Current BCPHP Guidelines recommend thatinduction of labour should only be undertaken after dis-cussing the known risks with the mother and her partner andthat elective induction of labour without clearly identifiedmedical or clinical indication should be avoided [15].
Induction of labour has been associated with many conditionsincluding increased risk of caesarean delivery, longer labour,fetal compromise and uterine hyperstimulation [16]. The sig-nificance of these risk factors and the potential success (orfailure) of labour induction can vary with such factors as thecondition of the cervix, maternal age, parity, maternal bodymass index and timing of induction (e.g. pre-term vs. post-term induction) [17, 18]. Induction should only occur afterconsideration for these factors, accurate assessment of gesta-tional age, and after analysis of risks of continuing the preg-nancy without induction. Labour induction in pregnantwomen with a history of previous caesarean section shouldbe cautiously considered, as the risk of uterine rupture asso-ciated with labour induction in this subset of women, whileremote, has severe consequences [19].
In BC, labour induction rates have been stable for the past fivefiscal years, at 21.5% in 2002/2003 and 21.2% in 2006/2007,and a low of 20.0% in 2004/2005. The PHSA, followed by theNorthern Health Authority had the lowest labour inductionrate in 2006/2007, at 16.4% and 19.9% respectively, excludinghome births. The Interior Health Authority had the highestlabour induction rate, at 24.5%.
Pregnant women delivering in the Fraser North and KootenayBoundary Health Service Delivery Areas (HSDA) had thehighest rates of labour induction in 2006/2007, at 26.7%, withdeliveries occurring in the East Kootenay HSDA followingclosely behind at 24.7%. Births at home consistently havethe lowest rates of labour induction; among facility-baseddeliveries, those occurring in Northern Interior had the low-est rates of labour induction in 2006/2007, at 18.1%. SouthVancouver Island has shown the largest decrease in induc-tion rates from 27.5% in 2002/2003 to 22.5% in 2006/2007,while all the Health Service Delivery Areas in the InteriorHealth Authority continue to show a trend of increasinglabour induction rates.
BRITISH COLUMBIA PERINATAL HEALTH PROGRAM – PERINATAL DATABASE REGISTRY ANNUAL REPORT 2007 17(Only singleton deliveries and births included)
MATERNAL INDICATORS
Table
7In
du
ction
of
Labo
ur
by
Place
of
Delivery
for
Health
Service
Delivery
Areas,H
ealthA
uth
orities
and
Pro
vince,
2002/2003to
2006/2007
Figu
re5
Ind
uctio
no
fLab
ou
rb
yP
laceo
fD
eliveryfo
rH
ealthA
uth
orities
and
Pro
vince,
2002/2003to
2006/2007
PERCENT OF MOTHERS INDUCED
0 5 10 15 20 25 30
BC
PHSA
*VIH
AVCH
AN
HA
IHA
FHA
PL
AC
EO
FD
EL
IVE
RY
02/0324.0
22.220.8
20.024.2
17.021.5
03/0424.2
23.320.2
18.323.1
16.521.2
04/0522.4
21.418.3
17.822.4
16.620.0
05/0623.6
20.919.0
19.823.1
17.921.0
06/0723.6
24.519.9
20.322.6
16.421.3
*PH
SA
:Refers
toB
CW
om
en’s
Ho
spitalp
atients
on
lyN
ote:P
leaserefer
tob
ackflap
for
legen
do
fth
eH
ealthA
uth
orities
and
Health
Service
Delivery
Areas
FHA
IHA
NH
AV
CH
AV
IHA
PH
SA
*H
BB
CFE
FNFS
Total
EK
KB
OK
TC
STo
talN
EN
IN
WTo
talC
ST
RIC
HV
AN
CTo
talC
VI
NV
IS
VI
Total
%%
%%
%%
%%
%%
%%
%%
%%
%%
%%
%%
%%
02/0324.5
23.324.2
24.020.2
25.223.9
19.822.2
20.918.9
23.820.8
20.717.1
21.620.0
23.016.7
27.524.2
17.03.2
21.5
03/0423.9
25.623.1
24.219.1
24.926.0
20.523.3
23.718.5
19.520.2
17.718.9
18.618.3
23.520.2
23.823.1
16.53.3
21.2
04/0523.3
23.021.5
22.418.7
23.923.6
18.721.4
18.417.0
20.418.3
17.518.2
17.917.8
22.021.0
23.022.4
16.61.7
20.0
05/0622.3
24.623.3
23.621.7
21.920.6
20.820.9
19.416.8
22.819.0
19.219.8
20.519.9
23.721.6
23.223.1
17.92.4
21.0
06/0721.5
26.721.9
23.624.7
26.724.1
24.224.5
20.918.1
22.019.9
19.818.6
22.120.3
24.419.3
22.522.6
16.41.1
21.2
*PH
SA
:Refers
toB
CW
om
en’s
Ho
spitalp
atients
on
lyN
ote:P
leaserefer
tob
ackflap
for
legen
do
fth
eH
ealthA
uth
orities
and
Health
Service
Delivery
Areas

18 BRITISH COLUMBIA PERINATAL HEALTH PROGRAM – PERINATAL DATABASE REGISTRY ANNUAL REPORT 2007(Only singleton deliveries and births included)
SECTION II
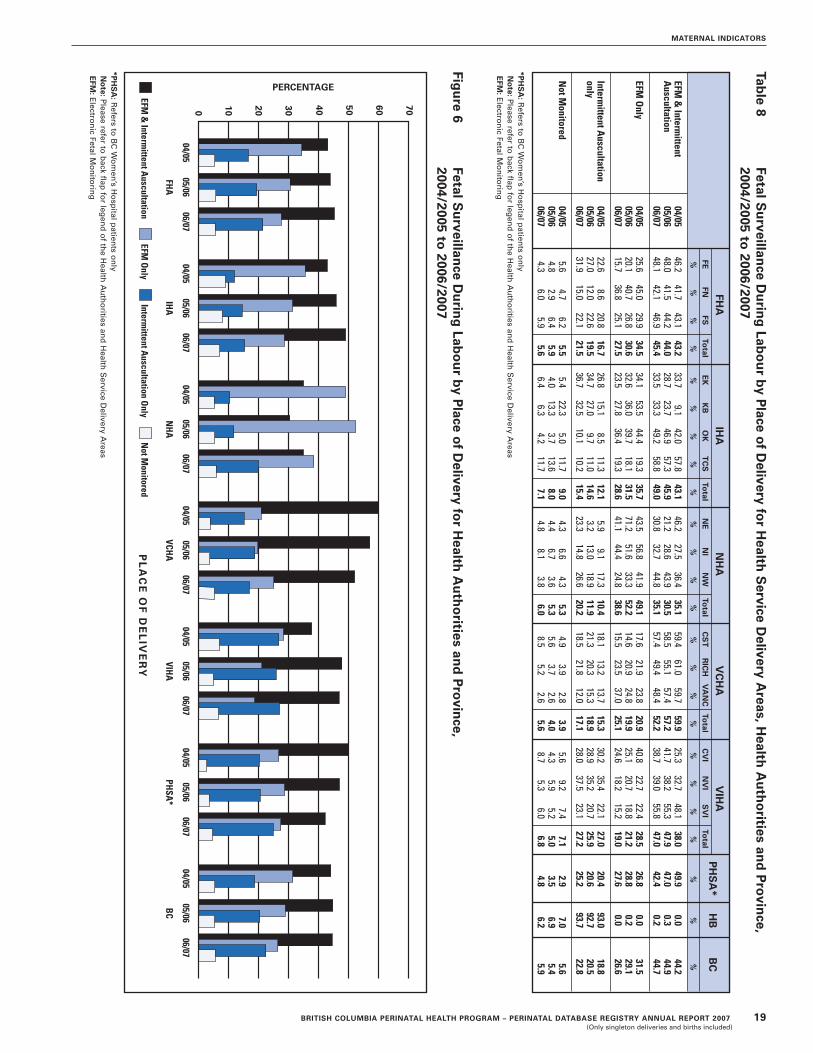
Fetal Surveillance During Labour by Place of Delivery for Health Service Delivery Areas, Health Authorities and Province, 2004/2005 to 2006/2007(Refer to Data Table 8A – APPENDIX 10)
Fetal surveillance during labour is defined as the number ofmothers receiving electronic fetal monitoring, intermittentauscultation, a combination of electronic fetal monitoring andintermittent auscultation, or no fetal surveillance duringlabour, expressed as a proportion of the total number ofmothers who laboured and delivered at the same time andplace. Prior to 2004/2005, reporting of fetal surveillance dur-ing labour was limited to describing whether the mother hadelectronic monitoring during labour or not. Intermittent aus-cultation was not collected in the BCPDR until 2004/2005. Forthis report, fetal surveillance during labour was analyzed byplace of delivery and includes only singleton deliveries.
A recently (2007) revised guideline, jointly developed by theBCPHP and the Society of Obstetricians and Gynaecologists ofCanada, recommends intermittent auscultation in labour forhealthy term women in spontaneous labour in the absence ofrisk factors for adverse perinatal outcome, as opposed to elec-tronic fetal monitoring [20]. Many studies and meta-analyseshave shown that electronic fetal monitoring should be used inlow-risk pregnancies only if adverse risk factors develop orintermittent auscultation becomes non-reassuring [21, 22].
In British Columbia, use of intermittent auscultation duringlabour increased, from 18.8% in 2004/2005 to 22.8% in2006/2007, while the use of electronic fetal monitoring inlabour decreased, from 31.5% in 2004/2005 to 26.6% in2006/2007. In BC, almost 6% of women are not monitored inlabour. Vancouver Island Health Authority had the highestrate of intermittent auscultation (27.2%) and the lowest rateof electronic fetal monitoring (19.0%), while 47.0% of womenin labour had a mix of electronic fetal monitoring and inter-mittent auscultation (2006/2007). The highest rate of elec-tronic fetal monitoring in 2006/2007 was in the NorthernHealth Authority, at 38.6%, although this was a dramaticdecrease from 52.2% in 2005/2006. Deliveries occurring athome have consistently had the highest rates of intermittentauscultation (93.0% in 2004/2005 and 93.7% in 2006/2007).
North Vancouver Island Health Service Delivery Area (HSDA)had the highest rate of intermittent auscultation in 2006/2007,excluding home births at 37.5%, followed closely by EastKootenay HSDA at 36.7%. While the Northern Interior HSDAand the Northeast HSDA had the highest rates of exclusiveelectronic fetal monitoring in 2006/2007 at 44.4% and 41.1%respectively, these HSDAs both demonstrated declines inrates since 2004/2005. Simultaneously, the Northeast HSDAincreased its intermittent auscultation rate from 3.2% in2005/2006 to 23.3% in 2006/2007.
BRITISH COLUMBIA PERINATAL HEALTH PROGRAM – PERINATAL DATABASE REGISTRY ANNUAL REPORT 2007 19(Only singleton deliveries and births included)
MATERNAL INDICATORS
Figu
re6
FetalSu
rveillance
Du
ring
Labo
ur
by
Place
of
Delivery
for
Health
Au
tho
ritiesan
dP
rovin
ce,2004/2005
to2006/2007
PERCENTAGE
BC
PHSA
*VIH
AVCH
AN
HA
IHA
FHA
0 10 20 30
40 50 60 70
PL
AC
EO
FD
EL
IVE
RY
EFM&
IntermittentA
uscultationEFM
Only
IntermittentA
uscultationO
nlyN
otMonitored
06/0704/05
05/0606/07
04/0505/06
06/0704/05
05/0606/07
04/0505/06
06/0704/05
05/0606/07
04/0505/06
06/0704/05
05/06
*PH
SA
:Refers
toB
CW
om
en’s
Ho
spitalp
atients
on
lyN
ote:P
leaserefer
tob
ackflap
for
legen
do
fth
eH
ealthA
uth
orities
and
Health
Service
Delivery
Areas
EFM
:Electro
nic
FetalMo
nito
ring
Table
8FetalS
urveillan
ceD
urin
gLab
ou
rb
yP
laceo
fD
eliveryfo
rH
ealthS
erviceD
eliveryA
reas,Health
Au
tho
ritiesan
dP
rovin
ce,2004/2005
to2006/2007
FHA
IHA
NH
AV
CH
AV
IHA
PH
SA
*H
BB
CFE
FNFS
Total
EK
KB
OK
TC
STo
talN
EN
IN
WTo
talC
ST
RIC
HV
AN
CTo
talC
VI
NV
IS
VI
Total
%%
%%
%%
%%
%%
%%
%%
%%
%%
%%
%%
%%
EFM&
Intermittent
04/0546.2
41.743.1
43.233.7
9.142.0
57.843.1
46.227.5
36.435.1
59.461.0
59.759.9
25.332.7
48.138.0
49.90.0
44.2A
uscultation05/06
48.041.5
44.244.0
28.723.7
46.957.3
45.921.2
28.643.9
30.558.5
55.157.4
57.241.7
38.255.3
47.947.0
0.344.9
06/0748.1
42.146.9
45.433.5
33.349.2
58.849.0
30.832.7
44.835.1
57.449.4
48.452.2
38.739.0
55.847.0
42.40.2
44.7
EFMO
nly04/05
25.645.0
29.934.5
34.153.5
44.419.3
35.743.5
56.841.9
49.117.6
21.923.8
20.940.8
22.722.4
28.526.8
0.031.5
05/0620.1
40.726.8
30.632.6
36.039.7
18.131.5
71.251.6
33.352.2
14.620.9
24.819.9
25.120.7
18.821.2
28.80.2
29.106/07
15.736.8
25.127.5
23.527.8
36.419.3
28.641.1
44.424.8
38.615.5
23.537.0
25.124.6
18.215.2
19.027.6
0.026.6
IntermittentA
uscultation04/05
22.68.6
20.816.7
26.815.1
8.511.3
12.15.9
9.117.3
10.418.1
13.213.7
15.330.2
35.422.1
27.020.4
93.018.8
only05/06
27.012.0
22.619.5
34.727.0
9.711.0
14.63.2
13.018.9
11.921.3
20.315.3
18.928.9
35.220.7
25.920.6
92.720.5
06/0731.9
15.022.1
21.536.7
32.510.1
10.215.4
23.314.8
26.620.2
18.521.8
12.017.1
28.037.5
23.127.2
25.293.7
22.8
NotM
onitored04/05
5.64.7
6.25.5
5.422.3
5.011.7
9.04.3
6.64.3
5.34.9
3.92.8
3.95.6
9.27.4
7.12.9
7.05.6
05/064.8
2.96.4
5.94.0
13.33.7
13.68.0
4.46.7
3.65.3
5.63.7
2.64.0
4.35.9
5.25.0
3.56.9
5.406/07
4.36.0
5.95.6
6.46.3
4.211.7
7.14.8
8.13.8
6.08.5
5.22.6
5.68.7
5.36.0
6.84.8
6.25.9
*PH
SA
:Refers
toB
CW
om
en’s
Ho
spitalp
atients
on
lyN
ote:P
leaserefer
tob
ackflap
for
legen
do
fth
eH
ealthA
uth
orities
and
Health
Service
Delivery
Areas
EFM
:Electro
nic
FetalMo
nito
ring

20 BRITISH COLUMBIA PERINATAL HEALTH PROGRAM – PERINATAL DATABASE REGISTRY ANNUAL REPORT 2007(Only singleton deliveries and births included)
SECTION II
Episiotomy Rate by Place of Delivery for Health Service Delivery Areas, Health Authorities and Province, 2002/2003 to 2006/2007(Refer to Data Table 9A – APPENDIX 10)
The episiotomy rate is defined as the number of mothers hav-ing an episiotomy during vaginal delivery expressed as a pro-portion of the total mothers delivering vaginally during thesame time and within the same place. For this report, epi-siotomy rates were analyzed by place of delivery and includeonly singleton deliveries.
The Society of Obstetricians and Gynaecologists of Canada rec-ommends that episiotomy is not necessary for an assisted vagi-nal birth [23]. A systematic review by Hartmann et al in 2005also concluded that there were no improved outcomes from epi-siotomy, and that in some circumstances, the use of episiotomymay increase morbidity [24]. Despite this evidence andalthough the use of episiotomy has decreased substantiallyover the last twenty years, it persists in many countries, withvariation among regions, hospitals and care providers [25-27].
Across British Columbia, rates of episiotomy in vaginal deliv-eries have stabilized in the past two fiscal years, reaching alow of 14.1% in 2006/2007. The Fraser Health Authority (FHA),Provincial Health Services Authority (PHSA), and theVancouver Coastal Health Authority (VCHA) had slightlyhigher episiotomy rates than the provincial average in
2006/2007, at 17.5%, 16.0% and 15.0% respectively. Over thepast five fiscal years, the PHSA has had the largest drop inrates, from a high of 23.6% in 2002/2003 to 16.0% in 2006/2007.Conversely, the Interior Health Authority has had the moststable episiotomy rates in the past five fiscal years, with a rateof 11.4% in 2002/2003 (the lowest in the province that year,excluding home births), and 10.3% in 2006/2007 (the lowestrate in the province that fiscal year, excluding home births).Home births have had a slight increase in episiotomy rates inthe last fiscal year, increasing to a high of 1.4% in 2006/2007.
The highest episiotomy rate in 2006/2007 in any of the HealthService Delivery Areas in BC was in Fraser South and Richmond,where 21.5% and 21.4%, respectively, of women delivering vagi-nally had an episiotomy. Women with the lowest likelihood ofepisiotomy in vaginal delivery in 2006/2007, excluding homebirths, delivered in Kootenay Boundary (6.2%). Although thereis a wide range of rates across the province, all Health ServiceDelivery Areas have had a decrease in episiotomy in vaginaldelivery rates from 2002/2003 to 2006/2007, except theOkanagan Health Service Delivery Area, where there was avery slight increase in rates, from 12.6% in 2002/2003 to 13.7%in 2006/2007.

BRITISH COLUMBIA PERINATAL HEALTH PROGRAM – PERINATAL DATABASE REGISTRY ANNUAL REPORT 2007 21(Only singleton deliveries and births included)
MATERNAL INDICATORS
Table
9E
pisio
tom
iesb
yP
laceo
fD
eliveryfo
rH
ealthS
erviceD
eliveryA
reas,Health
Au
tho
ritiesan
dP
rovin
ce,2002/2003
to2006/2007
FHA
IHA
NH
AV
CH
AV
IHA
PH
SA
*H
BB
CFE
FNFS
Total
EK
KB
OK
TC
STo
talN
EN
IN
WTo
talC
ST
RIC
HV
AN
CTo
talC
VI
NV
IS
VI
Total
%%
%%
%%
%%
%%
%%
%%
%%
%%
%%
%%
%%
02/0317.2
18.424.3
20.715.7
10.812.6
8.411.4
15.610.9
9.511.8
17.723.1
19.219.1
13.910.6
10.711.7
23.61.2
17.6
03/0414.8
18.521.9
19.214.3
9.013.4
8.311.4
15.09.6
9.311.0
14.227.5
17.818.7
13.710.6
11.712.2
20.00.6
16.3
04/0516.7
16.622.3
19.19.3
11.414.3
8.611.6
16.08.6
5.19.8
11.623.5
14.615.6
13.710.0
11.612.1
18.50.7
15.4
05/0612.7
14.818.8
16.09.9
6.614.7
7.711.0
16.69.1
9.111.2
11.622.1
13.715.0
11.78.8
11.311.0
17.41.0
14.0
06/0713.2
15.021.5
17.59.7
6.213.7
6.810.3
14.59.2
7.710.4
13.221.4
12.215.0
13.67.8
9.810.8
16.01.4
14.1
*PH
SA
:Refers
toB
CW
om
en’s
Ho
spitalp
atients
on
lyN
ote:P
leaserefer
tob
ackflap
for
legen
do
fth
eH
ealthA
uth
orities
and
Health
Service
Delivery
Areas
Figu
re7
Ep
isioto
mies
by
Place
of
Delivery
for
Health
Au
tho
ritiesan
dP
rovin
ce,2002/2003
to2006/2007
PERCENT OF MOTHERS HAVING AN EPISIOTOMY
2520151050B
CPH
SA*
VIHA
VCHA
NH
AIH
AFH
A
02/0320.7
11.411.8
19.111.7
23.617.6
03/0419.2
11.411.0
18.712.2
20.016.3
04/0519.1
11.69.8
15.612.1
18.515.4
05/0616.0
11.011.2
15.011.0
17.414.1
06/0717.5
10.310.4
15.010.8
16.014.1
PL
AC
EO
FD
EL
IVE
RY
*PH
SA
:Refers
toB
CW
om
en’s
Ho
spitalp
atients
on
lyN
ote:P
leaserefer
tob
ackflap
for
legen
do
fth
eH
ealthA
uth
orities
and
Health
Service
Delivery
Areas
22 BRITISH COLUMBIA PERINATAL HEALTH PROGRAM – PERINATAL DATABASE REGISTRY ANNUAL REPORT 2007(Only singleton deliveries and births included)
SECTION II
Postpartum Length of Stay (Vaginal Deliveries) by Place of Delivery for Health Service Delivery Areas, Health Authorities and Province, 2002/2003 to 2006/2007(Refer to Data Table 10A – APPENDIX 10)
Postpartum length of stay is defined as the amount of time, inhours, from delivery of the infant to maternal discharge fromthe hospital. For this report, postpartum lengths of stay weregrouped into time ranges and the number of mothers in eachrange was expressed as a proportion of the total number ofwomen delivering. Postpartum length of stay was analyzed byplace of delivery and reported separately for vaginal and forcaesarean deliveries. As mothers who deliver at home are notdischarged from care in the same manner as mothers whodeliver in a hospital, only deliveries occurring in hospitalswere included in the length of stay analysis. In addition,lengths of stay for maternal transfers to other facilities afterdelivery were not included in this analysis.
The duration of postpartum length of stay in hospital aftervaginal delivery continues to decline in British Columbia.Provincially, in 2006/2007, 72.5% of mothers having a vaginaldelivery of a singleton stayed in hospital less than 48 hourspost-delivery. In 2002/2003, 66.9% of mothers having a vaginaldelivery of a singleton stayed in hospital less than 48 hoursand in 2000/2001, this percentage was 61.9% [14].
While the proportion of mothers staying in hospital for lessthan 48 hours post-delivery continues to increase across theprovince, Fraser Health Authority continues to have the largestproportion of mothers with the shortest postpartum length-of-stay. In 2006/2007, 82.0% of women delivering within the FraserHealth Authority left within two days of delivering, comparedto 66.0% of women delivering in Vancouver Island HealthAuthority (VIHA). The VIHA and the Interior Health Authorityhad the largest proportion of women who remained in hospitalfor at least 72 hours (3 days) after vaginal delivery of a single-ton in 2006/2007 (11.2% and 12.2% respectively). Variationamong Health Service Delivery Areas (HSDAs) in BC showsthat 30.0% of women who delivered in Kootenay Boundarystayed between two and three days in hospital postpartum(2006/2007), compared to only 9.8% of women who deliveredin the Fraser South HSDA.
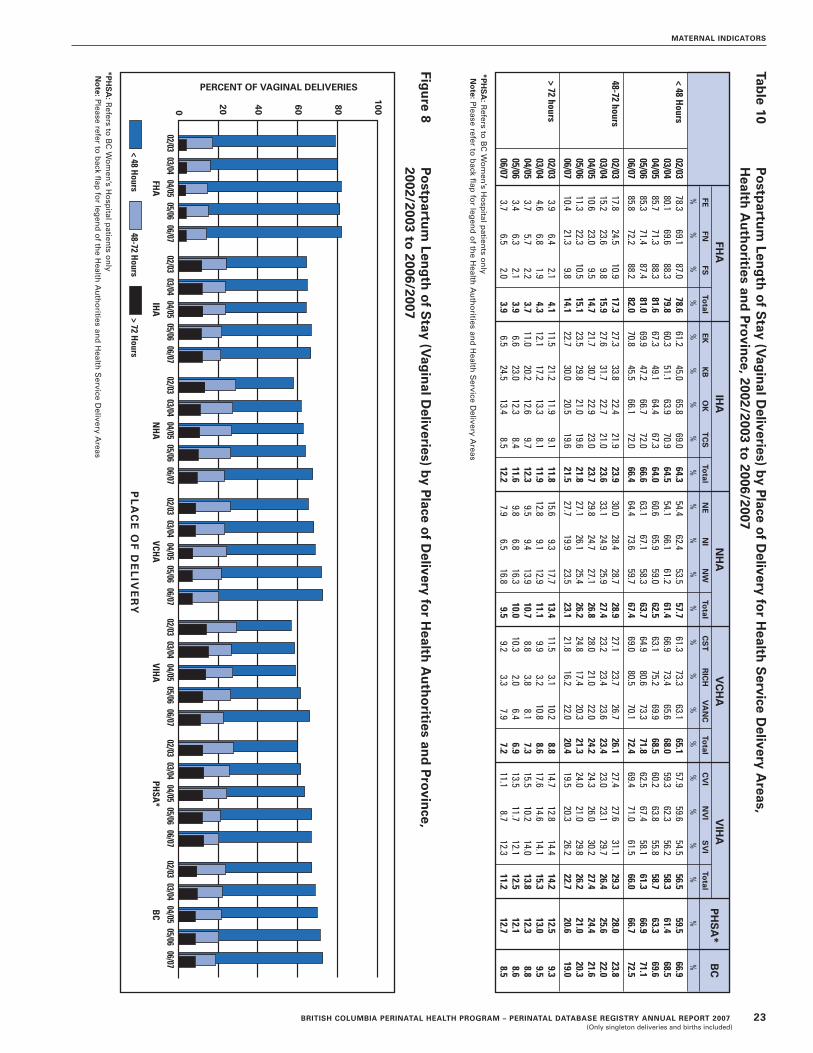
Figu
re8
Po
stpartu
mLen
gth
of
Stay
(Vag
inalD
eliveries)b
yP
laceo
fD
eliveryfo
rH
ealthA
uth
orities
and
Pro
vince,
2002/2003to
2006/2007
<48
Hours
48-72H
ours>
72H
ours
002/03
03/0404/05
05/0606/07
02/0303/04
04/0505/06
06/07
FHA
IHA
NH
AVCH
AVIH
APH
SA*
BC
20 40 60 80
100
PERCENT OF VAGINAL DELIVERIES
PL
AC
EO
FD
EL
IVE
RY
02/0303/04
04/0505/06
06/0702/03
03/0404/05
05/0606/07
02/0303/04
04/0505/06
06/0702/03
03/0404/05
05/0606/07
02/0303/04
04/0505/06
06/07
*PH
SA
:Refers
toB
CW
om
en’s
Ho
spitalp
atients
on
lyN
ote:P
leaserefer
tob
ackflap
for
legen
do
fth
eH
ealthA
uth
orities
and
Health
Service
Delivery
Areas
Table
10P
ostp
artum
Leng
tho
fS
tay(V
agin
alDeliveries)
by
Place
of
Delivery
for
Health
Service
Delivery
Areas,
Health
Au
tho
ritiesan
dP
rovin
ce,2002/2003to
2006/2007
*PH
SA
:Refers
toB
CW
om
en’s
Ho
spitalp
atients
on
lyN
ote:P
leaserefer
tob
ackflap
for
legen
do
fth
eH
ealthA
uth
orities
and
Health
Service
Delivery
Areas
FHA
IHA
NH
AV
CH
AV
IHA
PH
SA
*B
CFE
FNFS
Total
EK
KB
OK
TC
STo
talN
EN
IN
WTo
talC
ST
RIC
HV
AN
CTo
talC
VI
NV
IS
VI
Total
%%
%%
%%
%%
%%
%%
%%
%%
%%
%%
%%
%
<48
Hours
02/0378.3
69.187.0
78.661.2
45.065.8
69.064.3
54.462.4
53.557.7
61.373.3
63.165.1
57.959.6
54.556.5
59.566.9
03/0480.1
69.688.3
79.860.3
51.163.9
70.964.5
54.166.1
61.261.4
66.973.4
65.668.0
59.362.3
56.258.3
61.468.5
04/0585.7
71.388.3
81.667.3
49.164.4
67.364.0
60.665.9
59.062.5
63.175.2
69.968.5
60.263.8
55.858.7
63.369.6
05/0685.3
71.487.4
81.069.9
47.266.7
72.066.6
63.167.1
58.363.7
64.980.6
73.371.8
62.567.4
58.161.3
66.971.1
06/0785.8
72.288.2
82.070.8
45.566.1
72.066.4
64.473.6
59.767.4
69.080.5
70.172.4
69.471.0
61.566.0
66.772.5
48-72hours
02/0317.8
24.510.9
17.327.3
33.822.4
21.923.9
30.028.4
28.728.9
27.123.7
26.726.1
27.427.6
31.129.3
28.023.8
03/0415.2
23.69.8
15.927.6
31.722.7
21.023.6
33.124.9
25.927.4
23.223.4
23.623.4
23.023.1
29.726.4
25.622.0
04/0510.6
23.09.5
14.721.7
30.722.9
23.023.7
29.824.7
27.126.8
28.021.0
22.024.2
24.326.0
30.227.4
24.421.6
05/0611.3
22.310.5
15.123.5
29.821.0
19.621.8
27.126.1
25.426.2
24.817.4
20.321.3
24.021.0
29.826.2
21.020.3
06/0710.4
21.39.8
14.122.7
30.020.5
19.621.5
27.719.9
23.523.1
21.816.2
22.020.4
19.520.3
26.222.7
20.619.0
>72
hours02/03
3.96.4
2.14.1
11.521.2
11.99.1
11.815.6
9.317.7
13.411.5
3.110.2
8.814.7
12.814.4
14.212.5
9.303/04
4.66.8
1.94.3
12.117.2
13.38.1
11.912.8
9.112.9
11.19.9
3.210.8
8.617.6
14.614.1
15.313.0
9.504/05
3.75.7
2.23.7
11.020.2
12.69.7
12.39.5
9.413.9
10.78.8
3.88.1
7.315.5
10.214.0
13.812.3
8.805/06
3.46.3
2.13.9
6.623.0
12.38.4
11.69.8
6.816.3
10.010.3
2.06.4
6.913.5
11.712.1
12.512.1
8.606/07
3.76.5
2.03.9
6.524.5
13.48.5
12.27.9
6.516.8
9.59.2
3.37.9
7.211.1
8.712.3
11.212.7
8.5
BRITISH COLUMBIA PERINATAL HEALTH PROGRAM – PERINATAL DATABASE REGISTRY ANNUAL REPORT 2007 23(Only singleton deliveries and births included)
MATERNAL INDICATORS

24 BRITISH COLUMBIA PERINATAL HEALTH PROGRAM – PERINATAL DATABASE REGISTRY ANNUAL REPORT 2007(Only singleton deliveries and births included)
SECTION II
Postpartum Length of Stay (Caesarean Section Deliveries) by Place of Delivery for Health Service Delivery Areas, Health Authorities and Province, 2002/2003 to 2006/2007(Refer to Data Table 11A – APPENDIX 10)
Postpartum length of stay is defined as the amount of time, inhours, from delivery of the infant to maternal discharge fromthe hospital. For this report, postpartum lengths of stay weregrouped into time ranges and the number of mothers in eachrange was expressed as a proportion of the total number ofwomen delivering. Postpartum length of stay was analyzed byplace of delivery and reported separately for vaginal and forcaesarean deliveries. Only deliveries occurring in hospitalswere included in the length of stay analysis. In addition,lengths of stay for maternal transfers to other facilities afterdelivery were not included in this analysis.
The proportion of mothers staying in hospital after caesareansection for longer than 96 hours is decreasing provincially. In2006/2007, only 13.7% of mothers stayed longer than 96 hoursafter delivering by caesarean section. In 2002/2003, 19.9% ofmothers had a postpartum length of stay of at least 96 hours(4 days) post-caesarean section.
Vancouver Island Health Authority had the largest proportionof mothers staying greater than 96 hours post-caesarean sec-tion compared to other Health Authorities in 2006/2007, at19.9%. This is a decrease from 2002/2003, where 29.6% ofmothers delivering within VIHA stayed in hospital at least 96hours post-caesarean. Conversely, women who had a cae-sarean section in facilities within the Fraser Health Authorityhave the lowest likelihood of staying longer than 96 hourspostpartum. In 2006/2007, only 7.0% of women did so, which isa decline from 10.5% in 2002/2003. With the lowest caesareansection rate in the province in 2006/2007 at 22.8%, KootenayBoundary Health Service Delivery Area (HSDA) has the highestproportion of mothers who stay longer than 96 hours post-cae-sarean section, at 46.9%.

Table
11P
ostp
artum
Leng
tho
fS
tay(C
aesareanS
ection
Deliveries)
by
Place
of
Delivery
for
Health
Service
Delivery
Areas,
Health
Au
tho
ritiesan
dP
rovin
ce,2002/2003to
2006/2007
*PH
SA
:Refers
toB
CW
om
en’s
Ho
spitalp
atients
on
lyN
ote:P
leaserefer
tob
ackflap
for
legen
do
fth
eH
ealthA
uth
orities
and
Health
Service
Delivery
Areas
FHA
IHA
NH
AV
CH
AV
IHA
PH
SA
*B
CFE
FNFS
Total
EK
KB
OK
TC
STo
talN
EN
IN
WTo
talC
ST
RIC
HV
AN
CTo
talC
VI
NV
IS
VI
Total
%%
%%
%%
%%
%%
%%
%%
%%
%%
%%
%%
%
<–96
Hours
02/0393.2
84.891.8
89.583.3
56.877.8
83.178.2
75.376.0
57.770.1
77.088.5
72.078.5
69.770.5
70.770.4
78.380.1
03/0494.3
86.494.0
91.381.5
58.176.9
86.979.8
79.583.5
70.578.8
78.592.7
74.780.5
73.074.0
73.373.3
77.582.2
04/0595.9
89.792.3
92.181.3
53.279.6
85.279.9
87.580.8
74.080.8
84.292.6
82.485.5
73.175.8
73.974.0
81.884.1
05/0693.8
89.192.5
91.587.3
63.679.4
82.180.2
88.384.7
68.281.8
82.792.8
87.086.9
78.583.5
77.778.7
81.584.8
06/0794.4
90.494.7
93.088.5
53.182.5
83.781.6
91.186.3
74.585.2
88.695.9
82.887.9
84.390.5
75.580.1
82.586.3
>96
Hours
02/036.8
15.28.2
10.516.7
43.222.2
16.921.8
24.724.0
42.329.9
23.011.5
28.021.5
30.329.5
29.329.6
21.719.9
03/045.7
13.66.0
8.718.5
41.923.1
13.120.2
20.516.5
29.521.2
21.57.3
25.319.5
27.026.0
26.726.7
22.517.8
04/054.1
10.37.7
7.918.8
46.820.4
14.820.1
12.519.2
26.019.2
15.87.4
17.614.5
26.924.2
26.126.0
18.215.9
05/066.2
10.97.5
8.512.7
36.420.6
17.919.8
11.715.3
31.818.2
17.37.2
13.013.1
21.516.5
22.321.3
18.515.2
06/075.6
9.65.3
7.011.5
46.917.5
16.318.4
8.913.7
25.514.8
11.44.1
17.212.1
15.79.5
24.519.9
17.513.7
Figu
re9
Po
stpartu
mLen
gth
of
Stay
(Caesarean
Sectio
nD
eliveries)b
yP
laceo
fD
eliveryfo
rH
ealthA
uth
orities
and
Pro
vince,
2002/2003to
2006/2007
<–96
Hours
>96
Hours
PL
AC
EO
FD
EL
IVE
RY
PERCENT OF CAESAREAN SECTION DELIVERIES
02/0303/04
04/0505/06
06/07
FHA
IHA
NH
AVCH
AVIH
APH
SA*
BC
100908070605040302010002/03
03/0404/05
05/0606/07
02/0303/04
04/0505/06
06/0702/03
03/0404/05
05/0606/07
02/0303/04
04/0505/06
06/0702/03
03/0404/05
05/0606/07
02/0303/04
04/0505/06
06/07
*PH
SA
:Refers
toB
CW
om
en’s
Ho
spitalp
atients
on
lyN
ote:P
leaserefer
tob
ackflap
for
legen
do
fth
eH
ealthA
uth
orities
and
Health
Service
Delivery
Areas
BRITISH COLUMBIA PERINATAL HEALTH PROGRAM – PERINATAL DATABASE REGISTRY ANNUAL REPORT 2007 25(Only singleton deliveries and births included)
MATERNAL INDICATORS
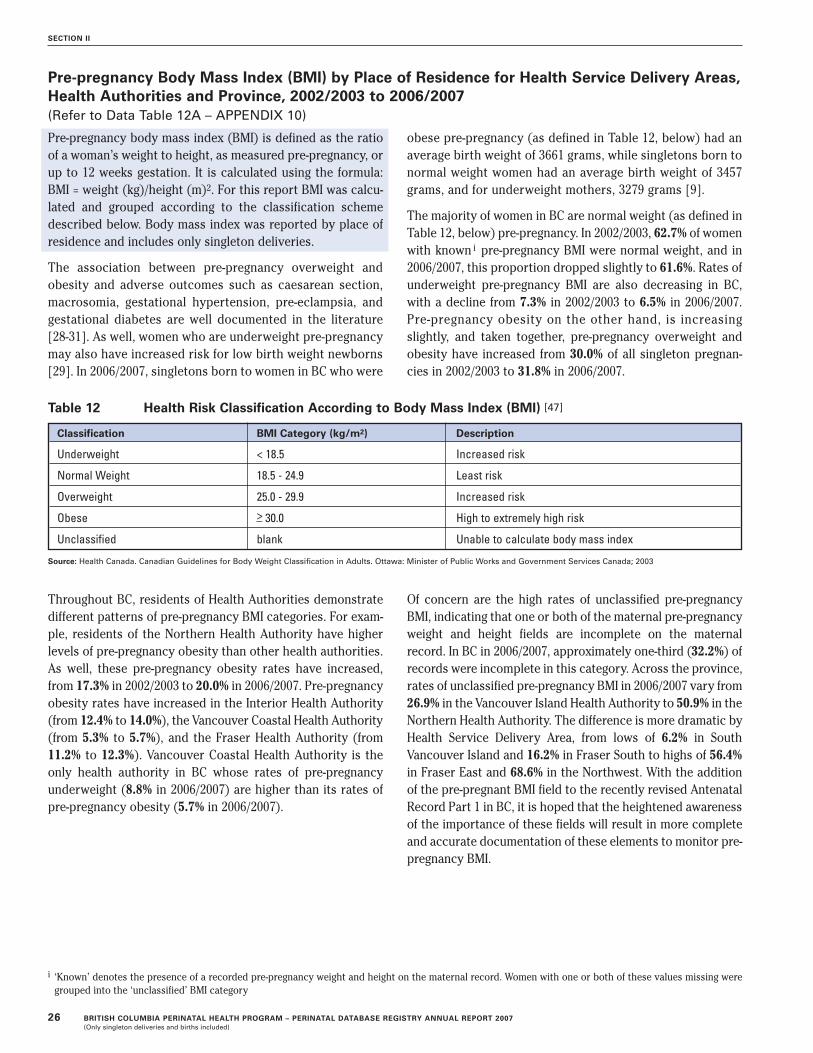
26 BRITISH COLUMBIA PERINATAL HEALTH PROGRAM – PERINATAL DATABASE REGISTRY ANNUAL REPORT 2007(Only singleton deliveries and births included)
SECTION II
Pre-pregnancy Body Mass Index (BMI) by Place of Residence for Health Service Delivery Areas,Health Authorities and Province, 2002/2003 to 2006/2007(Refer to Data Table 12A – APPENDIX 10)
Pre-pregnancy body mass index (BMI) is defined as the ratioof a woman’s weight to height, as measured pre-pregnancy, orup to 12 weeks gestation. It is calculated using the formula:BMI = weight (kg)/height (m)2. For this report BMI was calcu-lated and grouped according to the classification schemedescribed below. Body mass index was reported by place ofresidence and includes only singleton deliveries.
The association between pre-pregnancy overweight andobesity and adverse outcomes such as caesarean section,macrosomia, gestational hypertension, pre-eclampsia, andgestational diabetes are well documented in the literature[28-31]. As well, women who are underweight pre-pregnancymay also have increased risk for low birth weight newborns[29]. In 2006/2007, singletons born to women in BC who were
Throughout BC, residents of Health Authorities demonstratedifferent patterns of pre-pregnancy BMI categories. For exam-ple, residents of the Northern Health Authority have higherlevels of pre-pregnancy obesity than other health authorities.As well, these pre-pregnancy obesity rates have increased,from 17.3% in 2002/2003 to 20.0% in 2006/2007. Pre-pregnancyobesity rates have increased in the Interior Health Authority(from 12.4% to 14.0%), the Vancouver Coastal Health Authority(from 5.3% to 5.7%), and the Fraser Health Authority (from11.2% to 12.3%). Vancouver Coastal Health Authority is theonly health authority in BC whose rates of pre-pregnancyunderweight (8.8% in 2006/2007) are higher than its rates ofpre-pregnancy obesity (5.7% in 2006/2007).
Table 12 Health Risk Classification According to Body Mass Index (BMI) [47]
Classification BMI Category (kg/m2) Description
Underweight < 18.5 Increased risk
Normal Weight 18.5 - 24.9 Least risk
Overweight 25.0 - 29.9 Increased risk
Obese >– 30.0 High to extremely high risk
Unclassified blank Unable to calculate body mass index
Source: Health Canada. Canadian Guidelines for Body Weight Classification in Adults. Ottawa: Minister of Public Works and Government Services Canada; 2003
Of concern are the high rates of unclassified pre-pregnancyBMI, indicating that one or both of the maternal pre-pregnancyweight and height fields are incomplete on the maternalrecord. In BC in 2006/2007, approximately one-third (32.2%) ofrecords were incomplete in this category. Across the province,rates of unclassified pre-pregnancy BMI in 2006/2007 vary from26.9% in the Vancouver Island Health Authority to 50.9% in theNorthern Health Authority. The difference is more dramatic byHealth Service Delivery Area, from lows of 6.2% in SouthVancouver Island and 16.2% in Fraser South to highs of 56.4%in Fraser East and 68.6% in the Northwest. With the additionof the pre-pregnant BMI field to the recently revised AntenatalRecord Part 1 in BC, it is hoped that the heightened awarenessof the importance of these fields will result in more completeand accurate documentation of these elements to monitor pre-pregnancy BMI.
obese pre-pregnancy (as defined in Table 12, below) had anaverage birth weight of 3661 grams, while singletons born tonormal weight women had an average birth weight of 3457grams, and for underweight mothers, 3279 grams [9].
The majority of women in BC are normal weight (as defined inTable 12, below) pre-pregnancy. In 2002/2003, 62.7% of womenwith known i pre-pregnancy BMI were normal weight, and in2006/2007, this proportion dropped slightly to 61.6%. Rates ofunderweight pre-pregnancy BMI are also decreasing in BC,with a decline from 7.3% in 2002/2003 to 6.5% in 2006/2007.Pre-pregnancy obesity on the other hand, is increasingslightly, and taken together, pre-pregnancy overweight andobesity have increased from 30.0% of all singleton pregnan-cies in 2002/2003 to 31.8% in 2006/2007.
i ‘Known’ denotes the presence of a recorded pre-pregnancy weight and height on the maternal record. Women with one or both of these values missing weregrouped into the ‘unclassified’ BMI category

BRITISH COLUMBIA PERINATAL HEALTH PROGRAM – PERINATAL DATABASE REGISTRY ANNUAL REPORT 2007 27(Only singleton deliveries and births included)
MATERNAL INDICATORS
Figu
re10
Bo
dy
Mass
Ind
exb
yP
laceo
fR
esiden
cefo
rH
ealthA
uth
orities
and
Pro
vince,
2002/2003to
2006/2007
Norm
alWeight
60.561.5
60.560.5
59.862.0
60.259.8
59.960.5
53.552.9
52.051.4
50.770.8
71.471.1
70.470.4
59.158.6
59.859.2
58.062.7
62.962.4
62.261.6
Overw
eight20.4
20.220.7
21.121.1
20.322.0
20.721.4
20.124.3
24.025.4
26.226.0
14.814.8
14.914.6
15.121.1
22.521.5
21.823.2
19.319.6
19.719.9
20.1
Obese
11.211.2
11.811.9
12.312.4
12.513.8
13.714.0
17.318.5
19.118.2
20.05.3
5.65.4
6.25.7
14.514.1
13.914.3
14.310.7
10.811.2
11.411.7
Underw
eight7.9
7.17.0
6.56.8
5.45.2
5.65.0
5.44.8
4.63.6
4.23.4
9.18.2
8.68.8
8.85.3
4.94.7
4.74.4
7.36.7
6.76.5
6.5
PERCENT OF DELIVERIES80706050403020100
02/0303/04
04/0505/06
06/0706/07
FHA
IHA
NH
AVCH
A
02/0303/04
04/0505/06
02/0303/04
04/0505/06
02/0303/04
04/0505/06
02/0303/04
04/0505/06
02/0303/04
04/0505/06
PL
AC
EO
FR
ES
IDE
NC
E
VIHA
BC
06/0706/07
06/0706/07
No
te:Un
derw
eigh
t=
BM
I<18.5
No
rmalW
eigh
t=
BM
Ibetw
een18.5
and
24.9O
verweig
ht
=B
MIb
etween
25.0an
d29.9
Ob
ese=
BM
I >–30.0
No
te:Please
referto
back
flapfo
rleg
end
of
the
Health
Au
tho
ritiesan
dH
ealthS
erviceD
eliveryA
reas
No
te:Exclu
ded
from
analysis
isth
e“U
nclassified
”B
MIg
rou
pfo
rw
hich
either
the
heig
ht
and
/or
weig
ht
info
rmatio
nis
missin
g.D
etailedd
atatab
lesare
available
inth
eA
nn
ualR
epo
rt2007
section
of
the
BC
PH
Pw
ebsite
(ww
w.b
cph
p.ca).

28 BRITISH COLUMBIA PERINATAL HEALTH PROGRAM – PERINATAL DATABASE REGISTRY ANNUAL REPORT 2007(Only singleton deliveries and births included)
SECTION II
Maternal Postpartum Readmission to Hospital by Place of Delivery for Health Service Delivery Areas, Health Authorities and Province, 2002/2003 to 2005/2006(Refer to Data Table 13A – APPENDIX 10)
Postpartum readmission to hospital is defined as any motherwho is readmitted to hospital, as an inpatient or surgical daycare patient, within 42 days of delivery. Readmissions for rou-tine follow-up care have been excluded. For this report, post-partum readmission was analyzed by hospital of delivery,although the readmission could be to any facility in BC (notnecessarily the same as the delivery facility), and includesonly singleton deliveries.
Rates of postpartum readmission to hospital have increasedslightly in the province of BC, after both caesarean sectionand vaginal deliveries. For vaginal deliveries, rates of readmis-sion have increased from 1.5% of all deliveries in 2002/2003 to2.0% in 2005/2006, while readmission after caesarean sectiondelivery have increased from 2.1% in 2002/2003 to 2.7% in2005/2006. All Health Authorities in BC have had an increasein postpartum readmission rates, for both vaginal and cae-sarean deliveries since 2002/2003. Although most HealthAuthorities have higher rates of postpartum readmission
following caesarean delivery, the Northern Health Authorityhad a higher postpartum readmission rate following vaginaldelivery than caesarean delivery (2.8% compared to 2.2%) in2005/2006. Rates of postpartum readmission following birthsat home are the lowest in the province along with theRichmond Health Service Delivery Area (HSDA) (both at 1.0%of all deliveries in 2005/2006).
The highest rates of postpartum readmission in 2005/2006were following caesarean delivery in the Thompson-Cariboo-Shuswap HSDA and North Vancouver Island HSDA, where4.3% of mothers delivering were readmitted postpartum.Readmission rates following vaginal delivery were highest in2005/2006 in the Northeast and Central Vancouver IslandHSDAs (both at 2.9%), followed closely by the NorthwestHSDA (2.8%) and Fraser East HSDA (2.8%). More detailedanalysis of the reasons for readmission will be possible withthe collection of postpartum readmission data in the newversion of the BC Perinatal Database beginning with April2008 discharges.

BRITISH COLUMBIA PERINATAL HEALTH PROGRAM – PERINATAL DATABASE REGISTRY ANNUAL REPORT 2007 29(Only singleton deliveries and births included)
MATERNAL INDICATORS
Table
13M
aternalP
ostp
artum
Read
missio
nb
yP
laceo
fD
eliveryfo
rH
ealthS
erviceD
eliveryA
reas,Health
Au
tho
ritiesan
dP
rovin
ce,2002/2003
to2005/2006
*PH
SA
:Refers
toB
CW
om
en’s
Ho
spitalp
atients
on
lyN
ote:P
leaserefer
tob
ackflap
for
legen
do
fth
eH
ealthA
uth
orities
and
Health
Service
Delivery
Areas
FHA
IHA
NH
AV
CH
AV
IHA
PH
SA
*H
BB
CFE
FNFS
Total
EK
KB
OK
TC
STo
talN
EN
IN
WTo
talC
ST
RIC
HV
AN
CTo
talC
VI
NV
IS
VI
Total
%%
%%
%%
%%
%%
%%
%%
%%
%%
%%
%%
%%
Caesarean02/03
1.71.7
2.11.9
1.22.1
2.82.3
2.41.4
3.32.5
2.50.8
1.83.0
1.91.6
2.52.3
2.12.0
0.02.1
Section03/04
2.52.3
1.62.0
2.94.6
2.72.7
2.92.9
3.71.7
2.91.1
1.83.2
2.11.8
2.63.3
2.71.5
0.02.2
04/052.3
2.01.6
1.91.9
0.83.3
3.12.9
3.71.3
2.22.2
2.22.0
3.42.6
1.92.9
3.12.7
2.40.0
2.3
05/061.3
2.62.4
2.33.6
0.92.8
4.33.3
2.82.1
2.02.2
1.31.4
3.12.1
1.74.3
3.63.1
3.10.0
2.7
Vaginal02/03
1.81.2
1.31.4
2.50.8
1.81.7
1.72.5
1.22.7
2.01.9
0.81.6
1.62.0
1.71.6
1.71.5
0.81.5
03/041.3
1.21.4
1.33.1
2.12.1
1.72.1
2.11.5
1.11.5
0.91.0
2.11.3
1.81.2
1.81.7
1.11.6
1.5
04/051.8
1.41.3
1.43.0
1.72.4
2.12.3
1.51.4
0.81.3
1.91.7
2.11.9
2.10.9
1.61.7
1.70.8
1.7
05/062.8
1.61.8
1.92.3
2.62.1
2.52.3
2.92.7
2.82.8
2.71.0
2.12.0
2.91.9
1.82.2
1.31.0
2.0
Figu
re11
Matern
alPo
stpartu
mR
eadm
ission
by
Place
of
Delivery
for
Health
Au
tho
ritiesan
dP
rovin
ce,2002/2003
to2005/2006
VaginalCaesarean
SectionP
LA
CE
OF
DE
LIV
ER
Y
PERCENT OF DELIVERIES
002/03
03/0404/05
05/06
FHA
IHA
NH
AVCH
AVIH
APH
SA*
HB
BC
1 2 3 4
02/0303/04
04/0505/06
02/0303/04
04/0505/06
02/0303/04
04/0505/06
02/0303/04
04/0505/06
02/0303/04
04/0505/06
02/0303/04
04/0505/06
02/0303/04
04/0505/06
*PH
SA
:Refers
toB
CW
om
en’s
Ho
spitalp
atients
on
lyN
ote:P
leaserefer
tob
ackflap
for
legen
do
fth
eH
ealthA
uth
orities
and
Health
Service
Delivery
Areas
30 BRITISH COLUMBIA PERINATAL HEALTH PROGRAM – PERINATAL DATABASE REGISTRY ANNUAL REPORT 2007(Only singleton deliveries and births included)
SECTION II
Method of Delivery Rate (Vaginal vs. Caesarean Section) by Place of Delivery for Health Service Delivery Areas, Health Authorities and Province, 2002/2003 to 2006/2007(Refer to Data Tables 14A and 15A – APPENDIX 10)
The method of delivery is defined as the type of delivery (spon-taneous vaginal, assisted vaginal or caesarean section) themother had. For this report, method of delivery was analyzedby place of delivery and includes only singleton deliveries.
In 2005/2006, the caesarean section rate in British Columbia(BC) for all births (singletons, twins and multiples) reached anational high of 30.4%, higher than the Canadian rate of 26.3%and surpassing every other province and/or territory inCanada to have the highest rate [32]. Caesarean delivery isassociated with specific maternal health risks, such as hem-orrhage, puerperal infection, anesthetic complications, andemergency hysterectomy [33, 34], as well as risk in subse-quent pregnancies that include higher incidence of placentaprevia, placenta accreta, abdominal adhesions, and repeatcaesarean sections [35-37]. Infant and neonatal health risksassociated with caesarean section have been found to behigher than for those infants delivered vaginally and includehigher respiratory morbidity rates, neonatal intensive careadmission rates, and neonatal mortality [38-41]. Despite theserisks, caesarean delivery rates continue to rise. Concurrentwith these increases are concerns over loss of skill set to per-form instrumental vaginal delivery, lowering thresholds tomake the decision to perform caesarean section, and the effectof obstetricians increasing their role in primary care of preg-nant women. As well, changing maternal demographics, suchas increasing maternal age and pre-pregnancy weight havealso been associated with changes in caesarean section rate[42]. Despite a perception that many women are requestingcaesarean section without medical indication, this trend hasyet to be substantiated in the scientific literature.
In 2006/2007, (Table 14) the Northern Health Authority contin-ued to have the lowest caesarean section rate in the province,at 26.5%. In fact, the Northern Health Authority is the onlyHealth Authority with a caesarean section rate that has notincreased since 2002/2003. Vancouver Island Health Authorityhad the highest caesarean section rate in 2006/2007 at 31.5%.
Vancouver Coastal Health Authority (VCHA) had the highestelective caesarean section rate in 2006/2007, (Table 15) at13.0% of all deliveries, an increase from 9.9% in 2002/2003. In2006/2007, Vancouver Island Health Authority had the highestemergent caesarean section rate in the province, at 21.3% of alldeliveries. All of the Health Authorities, except for VancouverCoastal Health Authority, have had increases in emergent cae-sarean section rates over the last five fiscal years.
Rates of operative vaginal deliveries (Table 15) have beenconsistently the lowest within the Vancouver Island HealthAuthority for the past five years. In contrast, the Fraser HealthAuthority and the Provincial Health Services Authority (PHSA)had the two highest rates of operative vaginal delivery in2006/2007, at 12.7% and 13.3% respectively. In fact, in 2006/2007,these two health authorities (FHA and PHSA) were the only twohealth authorities whose operative vaginal delivery rates werehigher than their elective caesarean section rates.
In February 2008, BCPHP released the findings of the CaesareanBirth Task Force, which culminated the work of 18 months ofexamination of trends and discussion of recommendations forthe province with an aim to optimize caesarean delivery ratesand identify factors that have contributed to the rise in cae-sarean section rates. In January 2008 a Caesarean ConsensusConference was held to discuss collaboration at the local,regional and provincial level to optimize caesarean birth.The final report of the Caesarean Birth Task Force, whichincludes the consensus statement from the CaesareanConsensus Conference, can be accessed at the BCPHP web-site: http://www.bcphp.ca/

BRITISH COLUMBIA PERINATAL HEALTH PROGRAM – PERINATAL DATABASE REGISTRY ANNUAL REPORT 2007 31(Only singleton deliveries and births included)
MATERNAL INDICATORS
Table
14M
etho
do
fD
eliveryb
yP
laceo
fD
eliveryfo
rH
ealthS
erviceD
eliveryA
reas,Health
Au
tho
ritiesan
dP
rovin
ce,2002/2003
to2006/2007
*PH
SA
:Refers
toB
CW
om
en’s
Ho
spitalp
atients
on
lyN
ote:P
leaserefer
tob
ackflap
for
legen
do
fth
eH
ealthA
uth
orities
and
Health
Service
Delivery
Areas
FHA
IHA
NH
AV
CH
AV
IHA
PH
SA
*H
BB
CFE
FNFS
Total
EK
KB
OK
TC
STo
talN
EN
IN
WTo
talC
ST
RIC
HV
AN
CTo
talC
VI
NV
IS
VI
Total
%%
%%
%%
%%
%%
%%
%%
%%
%%
%%
%%
%%
Caesarean02/03
25.225.5
26.726.0
27.228.0
26.429.9
27.824.6
25.529.8
26.524.9
29.330.4
28.026.0
25.332.3
29.027.5
0.026.9
Section03/04
25.827.1
28.127.3
29.422.5
27.231.5
28.524.1
25.826.9
25.727.4
29.131.1
29.128.4
26.031.2
29.528.3
0.027.7
04/0528.1
28.029.8
28.834.5
22.829.6
31.230.0
24.526.7
26.226.0
27.426.1
29.928.0
27.130.5
35.031.7
30.10.0
28.8
05/0626.2
27.530.6
28.631.5
21.130.0
31.929.9
24.928.0
25.026.4
29.731.6
34.331.8
28.025.7
35.931.6
29.80.0
29.2
06/0724.6
31.229.3
29.129.6
22.831.9
31.530.6
27.626.8
24.626.5
30.126.8
33.930.7
26.027.3
36.631.5
30.10.0
29.3
Vaginal02/03
74.874.5
73.374.0
72.872.0
73.670.1
72.275.4
74.570.2
73.575.1
70.769.6
72.074.0
74.767.7
71.072.5
100.073.1
03/0474.2
72.971.9
72.770.6
77.572.8
68.571.5
75.974.2
73.174.3
72.670.9
68.970.9
71.674.0
68.870.5
71.7100.0
72.3
04/0571.9
72.070.2
71.265.5
77.270.4
68.870.0
75.573.3
73.874.0
72.673.9
70.172.0
72.969.5
65.068.3
69.9100.0
71.2
05/0673.8
72.569.4
71.468.5
78.970.0
68.170.1
75.172.0
75.073.6
70.368.4
65.768.2
72.074.3
64.168.4
70.2100.0
70.8
06/0775.4
68.870.7
70.970.4
77.268.1
68.569.4
72.473.2
75.473.5
69.973.2
66.169.3
74.072.7
63.468.5
69.9100.0
70.7
Figu
re12
Meth
od
of
Delivery
by
Place
of
Delivery
for
Health
Au
tho
ritiesan
dP
rovin
ce,2002/2003
to2006/2007
PERCENT OF DELIVERIES
02/0303/04
04/0505/06
06/07
FHA
IHA
NH
AVCH
AVIH
APH
SA*
BC
100908070605040302010002/03
03/0404/05
05/0606/07
02/0303/04
04/0505/06
06/0702/03
03/0404/05
05/0606/07
02/0303/04
04/0505/06
06/0702/03
03/0404/05
05/0606/07
02/0303/04
04/0505/06
06/07
PL
AC
EO
FD
EL
IVE
RY
VaginalCaesarean
Section
*PH
SA
:Refers
toB
CW
om
en’s
Ho
spitalp
atients
on
lyN
ote:P
leaserefer
tob
ackflap
for
legen
do
fth
eH
ealthA
uth
orities
and
Health
Service
Delivery
Areas

32 BRITISH COLUMBIA PERINATAL HEALTH PROGRAM – PERINATAL DATABASE REGISTRY ANNUAL REPORT 2007(Only singleton deliveries and births included)
SECTION II
Table
15S
po
ntan
eou
sV
agin
alvsO
perative
Deliveries
by
Place
of
Delivery
for
Health
Service
Delivery
Areas,
Health
Au
tho
ritiesan
dP
rovin
ce,2002/2003to
2006/2007
FHA
IHA
NH
AV
CH
AV
IHA
PH
SA
*H
BB
CFE
FNFS
Total
EK
KB
OK
TC
STo
talN
EN
IN
WTo
talC
ST
RIC
HV
AN
CTo
talC
VI
NV
IS
VI
Total
%%
%%
%%
%%
%%
%%
%%
%%
%%
%%
%%
%%
ElectiveCS
02/039.5
8.210.3
9.412.1
9.910.6
9.610.4
11.811.2
13.111.9
10.810.0
8.99.9
9.010.5
8.99.2
10.10.0
9.803/04
10.510.1
10.910.5
13.49.5
10.210.2
10.510.2
10.714.2
11.514.2
9.79.7
11.510.2
11.38.5
9.510.5
0.010.4
04/0511.0
10.411.6
11.013.7
8.211.0
10.911.0
10.611.4
11.211.1
12.69.6
11.211.4
10.113.2
9.310.2
11.30.0
10.905/06
10.110.1
12.311.1
15.18.8
12.412.0
12.310.3
11.710.9
11.113.1
12.612.4
12.711.5
10.910.4
10.811.3
0.011.3
06/0710.4
10.811.6
11.111.7
8.511.9
10.511.1
11.111.1
10.110.9
14.610.7
12.813.0
8.910.7
10.810.2
11.60.0
11.1Em
ergencyCS
02/0315.7
17.316.4
16.615.1
18.115.8
20.317.5
12.814.3
16.714.6
14.219.4
21.418.0
16.914.8
23.419.8
17.40.0
17.103/04
15.317.0
17.216.8
15.913.0
17.021.3
17.913.9
15.112.7
14.113.2
19.421.4
17.618.2
14.622.7
19.917.9
0.017.2
04/0517.1
17.618.2
17.820.8
14.618.6
20.319.0
14.015.4
15.114.9
14.816.5
18.616.6
17.117.3
25.721.5
18.80.0
18.005/06
16.117.4
18.317.5
16.412.3
17.619.9
17.714.6
16.314.1
15.316.5
19.021.9
19.116.5
14.825.5
20.818.5
0.017.9
06/0714.3
20.417.7
18.117.9
14.420.0
21.019.5
16.515.7
14.515.6
15.516.1
21.117.7
17.116.6
25.821.3
18.50.0
18.3O
perativeVaginal
02/0312.5
11.415.4
13.37.5
6.68.6
7.37.8
8.76.8
10.88.5
11.113.8
15.413.3
8.07.9
5.86.9
15.10.0
11.403/04
11.012.0
15.113.2
9.26.8
8.77.4
8.17.9
7.59.5
8.29.1
12.414.3
11.77.8
8.17.0
7.414.6
0.011.2
04/0511.6
12.014.3
12.95.6
7.79.5
7.68.2
7.27.3
8.17.5
9.810.6
14.111.5
6.59.5
5.86.7
13.20.2
10.705/06
9.912.5
13.312.3
5.89.3
9.17.5
8.26.1
8.19.9
8.09.4
8.513.3
10.66.2
9.26.8
7.013.3
0.010.5
06/0712.0
12.013.7
12.76.1
8.59.1
7.58.2
5.29.6
10.28.4
9.78.6
16.011.7
6.79.0
5.86.7
13.30.0
10.7Spontaneous
02/0362.3
63.157.9
60.765.3
65.465.0
62.864.3
66.767.7
59.465.1
64.056.9
54.358.8
66.066.7
61.964.1
57.4100.0
61.7Vaginal
03/0463.2
60.956.8
59.661.4
70.764.2
61.163.4
68.066.7
63.666.2
63.658.5
54.659.2
63.866.0
61.863.1
57.1100.0
61.204/05
60.360.0
55.958.3
59.969.5
60.961.2
61.768.2
65.965.7
66.562.8
63.356.0
60.566.3
60.059.1
61.656.7
99.860.5
05/0663.9
60.056.1
59.162.7
69.560.9
60.661.8
69.163.9
65.165.6
60.959.9
52.457.6
65.865.1
57.261.3
56.9100.0
60.406/07
63.456.8
57.058.1
64.368.7
59.061.1
61.267.2
63.665.2
65.160.2
64.650.1
57.767.3
63.757.5
61.856.6
100.060.0
PERCENT OF DELIVERIES
70605040302010002/03
03/0404/05
05/0606/07
FHA
02/0303/04
04/0505/06
06/07
IHA
02/0303/04
04/0505/06
06/07
NH
A
02/0303/04
04/0505/06
06/07
VCHA
02/0303/04
04/0505/06
06/07
VIHA
02/0303/04
04/0505/06
06/07
PHSA
*
02/0303/04
04/0505/06
06/07
BC
PL
AC
EO
FR
ES
IDE
NC
EO
pVag
ElectCSEm
ergCS
SpontVag
*PH
SA
:Refers
toB
CW
om
en’s
Ho
spitalp
atients
on
lyN
ote:P
leaserefer
tob
ackflap
for
legen
do
fth
eH
ealthA
uth
orities
and
Health
Service
Delivery
Areas
Figu
re13
Sp
on
taneo
us
Vag
inalvs
Op
erativeD
eliveriesb
yP
laceo
fD
eliveryfo
rH
ealthA
uth
orities
and
Pro
vince,
2002/2003to
2006/2007
*PH
SA
:Refers
toB
CW
om
en’s
Ho
spitalp
atients
on
lyN
ote:P
leaserefer
tob
ackflap
for
legen
do
fth
eH
ealthA
uth
orities
and
Health
Service
Delivery
Areas
No
te:Op
erativeVag
inalin
clud
esvacu
um
,forcep
san
db
reechd
eliveries

SECTION I I I
FETAL AND
NEWBORN INDICATORS
34 BRITISH COLUMBIA PERINATAL HEALTH PROGRAM – PERINATAL DATABASE REGISTRY ANNUAL REPORT 2007(Only singleton deliveries and births included)
Newborn Feeding by Place of Delivery for Health Service Delivery Areas, Health Authorities and Province, 2004/2005 to 2006/2007 (Refer to Data Table 16A – APPENDIX 10)
Newborn feeding is defined as the number of singleton live-born infants breastfed, either exclusively or supplementedwith breast milk substitutes (formula) during the birth admis-sion, expressed as a proportion of all singleton live borninfants. See Appendix 1 for the BCPDR categorizations of new-born feeding. As this field captures data that reflects activityduring the hospital admission, newborn feeding for birthsthat occur at home were not included in the analysis.
Breastfeeding has been demonstrated to be the most benefi-cial method to provide optimum nutritional and emotionalhealth benefits to newborns and infants, and has been shownto contribute to positive health outcomes into childhood aswell. These benefits include a reduction in the incidence ofmany conditions in the newborn, including diarrhea, otitismedia, and respiratory tract infections, with additional litera-ture associating breastfeeding with a reduction in the inci-dence of asthma and allergies in childhood [43-45]. Benefits tothe mother include reduced risk of ovarian and uterine cancer,more rapid uterine involution, weight loss post-pregnancy, anda protective effect on maternal bone mineral density [45]. TheWorld Health Organization advocates the promotion of exclu-sive breastfeeding, with complementary feeding supplementa-tion for up to two years of age and beyond [44]. In 1991, theWHO/UNICEF developed a world-wide initiative, the 10 Stepsfor Baby Friendly Hospitals as a way of supporting and recog-nizing facilities providing the best practices in the protection,promotion and support of breastfeeding [44]. To date, BritishColumbia has one hospital, GR Baker Memorial Hospital inQuesnel that has achieved Baby-Friendly designation.Promotion and support of exclusive breastfeeding should beframed in the context of these benefits, while recognizing thatbarriers to breastfeeding may still exist (e.g. hospital policies,maternal education about how to breastfeed, lack of continu-ous support from family members or other support groups,separation at birth/delayed contact after birth due to NICUadmission or caesarean section, etc.) [48].
Beginning with April 1, 2004 discharges, the BCPDR began col-lecting data on newborn feeding during the birth admissionbased on the Breastfeeding Committee for Canada (BCC) def-initions, which have also been adopted by the CanadianPerinatal Program Coalition Committee as the definitionsused by Perinatal Programs [46]. Because of this, reporting ofthis field can only begin with 2004/2005 data and may reflecta transition period as the new definitions are adoptedthroughout the province. The effects of the change in this def-inition as well as continued efforts from Health Authoritiesthroughout BC to achieve ‘Baby-Friendly’ designation are justbeginning to be reflected in this data indicator.
In 2006/2007 in BC, 69.2% of newborns were reported to beexclusively breastfed during the birth admission, a slightdecrease from 2004/2005 when the exclusive breastfeedingrate was 69.5%. Breast milk substitute (formula) feeding dur-ing the birth admission accounted for only 4.8% of singletonsdeliveries in 2006/2007, a decrease from 5.6% in 2004/2005.Throughout the province, the majority of singleton newbornswere reported to receive exclusive breast milk during thebirth admission, with some differences between HealthAuthorities. Vancouver Island Health Authority reported thehighest rates of exclusive breastfeeding at 79.1% in 2006/2007,while the Provincial Health Services Authority reported thelowest rate in 2006/2007 at 60.5%. Breast milk substitute(formula) feeding rates were reported the highest in theNorthern Health Authority in 2006/2007, with 8.2% of single-ton newborns receiving only formula (no breast milk) dur-ing the birth admission. This is a decline from 2004/2005,when the rate was 10.2%.
SECTION I I I – FETAL AND NEWBORN INDICATORS

Figu
re14
New
bo
rnFeed
ing
by
Place
of
Delivery
for
Health
Au
tho
ritiesan
dP
rovin
ce,2004/2005
to2006/2007
PERCENT OF DELIVERIES
BC
PHSA
*VIH
AVCH
AN
HA
IHA
FHA
1009080706050403020100
PL
AC
EO
FD
EL
IVE
RY
ExclusiveB
reastMilk
PartialBreastM
ilkN
oB
reastMilk
06/0704/05
05/0606/07
04/0505/06
06/0704/05
05/0606/07
04/0505/06
06/0704/05
05/0606/07
04/0505/06
06/0704/05
05/06
*PH
SA
:Refers
toB
CW
om
en’s
Ho
spitalp
atients
on
lyN
ote:P
leaserefer
tob
ackflap
for
legen
do
fth
eH
ealthA
uth
orities
and
Health
Service
Delivery
Areas
Table
16N
ewb
orn
Feedin
gb
yP
laceo
fD
eliveryfo
rH
ealthS
erviceD
eliveryA
reas,Health
Au
tho
ritiesan
dP
rovin
ce,2004/2005
to2006/2007
FHA
IHA
NH
AV
CH
AV
IHA
PH
SA
*B
CFE
FNFS
Total
EK
KB
OK
TC
STo
talN
EN
IN
WTo
talC
ST
RIC
HV
AN
CTo
talC
VI
NV
IS
VI
Total
%%
%%
%%
%%
%%
%%
%%
%%
%%
%%
%%
%
ExclusiveB
reastMilk
04/0567.2
72.668.6
69.876.9
77.884.6
82.782.4
46.974.5
68.765.3
69.068.0
70.469.2
84.889.8
74.680.5
52.269.5
05/0667.8
70.869.4
69.668.4
86.079.4
82.579.8
69.776.9
73.674.2
66.063.2
66.665.5
79.086.2
75.078.1
57.469.9
06/0764.2
69.065.3
66.572.7
86.272.9
84.978.0
64.677.7
68.271.5
65.764.9
68.866.6
79.486.9
76.479.1
60.569.2
PartialBreastM
ilk04/05
25.022.8
24.423.9
16.619.3
9.17.5
10.442.3
11.821.4
22.827.8
25.925.3
26.58.5
4.721.2
14.342.2
24.205/06
24.724.4
23.724.2
23.88.5
11.37.6
11.223.1
10.919.1
16.230.5
32.629.3
30.614.6
9.621.6
17.437.8
24.006/07
28.926.0
28.527.7
21.111.5
20.26.5
15.127.3
10.924.9
19.331.3
31.326.3
29.514.9
8.420.4
16.635.7
25.3
No
BreastM
ilk04/05
6.54.1
6.55.6
4.22.7
5.18.3
5.810.5
10.79.0
10.22.2
4.83.9
3.45.7
4.03.5
4.35.5
5.605/06
7.24.4
6.65.9
5.65.1
4.97.9
6.07.0
9.55.8
7.92.6
3.63.5
3.25.2
3.83.3
4.04.6
5.206/07
6.64.4
5.85.4
5.51.9
5.67.4
5.87.6
9.95.7
8.22.2
3.43.9
3.14.8
4.03.0
3.83.4
4.8
Unknow
n04/05
1.30.5
0.50.7
2.30.2
1.21.5
1.30.3
3.00.9
1.71.0
1.30.4
0.91.0
1.50.7
0.90.1
0.805/06
0.30.4
0.30.4
2.10.4
4.32.1
3.00.2
2.61.5
1.70.9
0.60.6
0.71.2
0.40.1
0.50.2
0.906/07
0.30.7
0.30.5
0.60.4
1.21.2
1.10.4
1.51.1
1.10.9
0.41.1
0.80.9
0.60.1
0.50.4
0.6
*PH
SA
:Refers
toB
CW
om
en’s
Ho
spitalp
atients
on
lyN
ote:P
leaserefer
tob
ackflap
for
legen
do
fth
eH
ealthA
uth
orities
and
Health
Service
Delivery
Areas
BRITISH COLUMBIA PERINATAL HEALTH PROGRAM – PERINATAL DATABASE REGISTRY ANNUAL REPORT 2007 35(Only singleton deliveries and births included)
FETAL AND NEWBORN INDICATORS

36 BRITISH COLUMBIA PERINATAL HEALTH PROGRAM – PERINATAL DATABASE REGISTRY ANNUAL REPORT 2007(Only singleton deliveries and births included)
SECTION III
Changes in Birth Rate by Place of Residence for Health Service Delivery Areas, Health Authorities and Province, 2000/2001 to 2006/2007
The birth rate change is defined as the change in the numberof singleton births by fiscal year and expressed as a percent-age increase or decrease. For this report, birth rate changesare analyzed two different ways: the overall birth rate changecompares the change in number of births over seven fiscalyears (2000/2001 to 2006/2007), while the remaining reportedbirth rates compare each fiscal year to the previous one. Onlysingleton deliveries of live births and stillbirths were included,and were analyzed by place of residence.
The number of singleton births in the province of BritishColumbia has increased from 39,412 to 40,878 [9], a +3.7%increase over the past seven fiscal years. Analysis of changesin overall birth rate, comparing 2000/2001 to 2006/2007,shows disparity throughout the province with VancouverIsland Health Authority showing the largest increase in over-all birth rate at +6.8%, followed closely by the Fraser HealthAuthority with +6.4%, and the Northern Health Authorityshowing a decrease of -2.6% (Figure 15).
Fluctuations in birth rates exist from year to year as well(Table 17). For example, in the last fiscal year (2006/2007 com-pared to 2005/2006), BC had a +3.0% increase in birth rate. Inaddition, every Health Authority except for the NorthernHealth Authority and the Vancouver Island Health Authorityhad an increase in birth rate in the last fiscal year. Interior
Health Authority had the largest increase in birth rate in thelast year when compared to other Health Authorities at +5.0%.The Northern Health Authority had an increase in birth ratefrom 2004/2005 to 2005/2006 (+1.2%) and from 2005/2006 to2006/2007 (+0.8%). However, this increase was the smallestincrease in the province.
The Northeast Health Service Delivery Area experienced thelargest increase in birth rate in the last fiscal year at +12.4%(871 singleton births in 2005/2006 and 979 singleton births in2006/2007). Other HSDAs also experienced large increases inthe last fiscal year, such as East Kootenay (+8.8%), Okanagan(+7.1%), and Fraser East (+4.7%). Health Service DeliveryAreas that have had decreases in the last fiscal year includethe Northern Interior (-3.9%), the Northwest (-2.3%),Kootenay Boundary (-1.9%), and the South Vancouver IslandHSDA (-0.6%).
This analysis provides a preliminary examination of the birthrate changes in the province of BC. Further analysis of thedata would be beneficial to determine factors contributingto the disproportionate birth rate changes within the HAsand HSDAs.

BRITISH COLUMBIA PERINATAL HEALTH PROGRAM – PERINATAL DATABASE REGISTRY ANNUAL REPORT 2007 37(Only singleton deliveries and births included)
FETAL AND NEWBORN INDICATORS
Table 17 Changes in Birth Rate by Place of Residence for Health Service Delivery Areas, Health Authorities and Province, 2001/2002 to 2006/2007 (Year-to-Year Comparison)
Note: Please refer to back flap for legend of the Health Authorities and Health Service Delivery AreasNote: Includes Livebirths and Stillbirths
2001/2002 2002/2003 2003/2004 2004/2005 2005/2006 2006/2007HA HSDA
FHA FE 6.0 2.8 1.8 0.3 -1.0 4.7FN 0.2 0.0 0.3 -0.9 -1.1 3.1FS 0.2 2.7 -0.9 2.4 -0.8 3.0
Total 1.3 1.7 0.0 0.8 -0.9 3.4IHA EK -5.5 6.8 -5.6 2.8 1.6 8.8
KB -0.8 -5.7 -2.5 5.5 3.3 -1.9OK -1.1 -4.7 -0.1 3.3 2.2 7.1TCS -2.3 -3.5 2.1 2.4 -0.1 2.9
Total -2.0 -3.1 -0.3 3.2 1.5 5.0NHA NE 3.2 2.1 -0.3 2.8 -1.4 12.4
NI -0.6 -4.4 1.6 -1.6 5.6 -3.9NW -4.7 0.3 -7.3 -2.6 -3.6 -2.3
Total -0.9 -1.4 -1.5 -0.8 1.2 0.8VCHA CST -7.8 3.2 1.2 -1.7 -4.2 2.0
RICH -1.0 -3.0 -4.4 7.0 -1.1 4.2VANC -2.1 0.1 1.2 -2.1 5.6 2.2
Total -3.4 0.3 0.3 -0.6 2.2 2.5VIHA CVI 4.5 -3.5 0.7 1.8 6.1 2.1
NVI -1.3 0.3 -6.9 3.9 -3.0 2.2SVI 4.6 -2.3 5.9 -1.4 1.5 -0.6
Total 3.5 -2.2 1.8 0.5 2.3 0.8British Columbia -0.3 -0.3 0.1 0.5 0.7 3.0
Figure 15 Changes in Birth Rate by Place of Residence for Health Authorities and Province,2000/2001 to 2006/2007 (Overall Comparison)
BIR
TH
RA
TE
CH
AN
GE
8.0
6.0
4.0
2.0
0.0
-2.0
-4.0BCVIHAVCHANHAIHAFHA
% 6.4 4.0 -2.6 1.2 6.8 3.7
Note: Please refer to back flap for legend of the Health Authorities and Health Service Delivery Areas

38 BRITISH COLUMBIA PERINATAL HEALTH PROGRAM – PERINATAL DATABASE REGISTRY ANNUAL REPORT 2007(Only singleton deliveries and births included)
Birth Weight vs Gestational Age by Place of Residence for Health Service Delivery Areas,Health Authorities and Province, 2002/2003 to 2006/2007(Refer to Data Tables 18A and 19A – APPENDIX 10)
Birth weight by gestational age groups were created by cate-gorizing the gender and gestational age according to birthweight percentiles. (Based on Appendix 4 and 5 birth weightand gestational age charts developed by BC Vital StatisticsAgency using 1981-2000 population as a standard). Newbornswere categorized as small-for-gestational age if they wereunder the 10th percentile for their gender and gestational age,large-for-gestational age if they were greater than the 90th per-centile, and average-for-gestational age if they were betweenthe 10th and 90th percentiles. Rates of these birth weight bygestational age groups were analyzed by place of residencefor both term and pre-term newborns and includes only sin-gleton deliveries.
Term (at least 37 completed weeks or 259 days gestation) sin-gletons born in British Columbia (BC) are increasingly average-for-gestational-age (80.8% in 2006/2007). Small-for-gestationalage in term newborns dropped slightly in the last fiscal year,from 7.0% to 6.8% of all term newborns. Similarly, large-for-ges-tational age in term singletons decreased, from 13.3% in2002/2003 to 12.4% in 2006/2007. The highest proportion oflarge-for-gestational-age term newborns was in VancouverIsland Health Authority at 15.6% in 2006/2007, followed closelyby the Northern Health Authority at 15.2%. The largest propor-tion of small-for-gestational-age term newborns in 2006/2007was in the Fraser Health Authority at 7.3%.
Over the last five fiscal years, a number of Health ServiceDelivery Areas (HSDA) in BC have seen an increase in the pro-portion of small-for-gestational-age term newborns. TheNortheast, Fraser East, Fraser North, and Thompson-Cariboo-Shuswap all have had slight increases in small-for-gestationalterm newborns while Kootenay Boundary had the largestincrease in BC, from 5.6% in 2002/2003 to 8.3% in 2006/2007.Conversely, the largest increase in large-for-gestational termnewborns was in the Coastal HSDA, where the rate increasedfrom 13.3% in 2002/2003 to 14.4% in 2006/2007.
Approximately 10% of preterm (less than 37 completed weeksor 259 days gestation) singletons born in BC are small-for-ges-tational age (9.4% in 2006/2007), while 13.4% of singletonpreterms in 2006/2007 are large-for-gestational-age. By HealthAuthority, the largest proportion of small-for-gestational agepreterms were in the Fraser Health Authority, increasing from9.7% in 2002/2003 to 11.6% in 2006/2007. Both the FraserHealth Authority and the Interior Health Authority have seenincreases in the proportion of small-for-gestational-agepreterms over the last five fiscal years. Large-for-gestational-age preterms were most prevalent in 2006/2007 in theNorthern Health Authority (17.4%), followed closely by theVancouver Island Health Authority (17.2%).
In 2006/2007, the Northwest Health Service Delivery Area(HSDA) had the highest proportion of large-for-gestational-agepreterms at 20.3%, although the North Vancouver IslandHSDA and the Central Vancouver Island HSDA followedclosely, with 18.7% and 18.5%, respectively. Small-for-gesta-tional-age preterms were most common in 2006/2007 in theFraser South HSDA (12.3%) and Vancouver HSDA (11.7%).
SECTION III

BRITISH COLUMBIA PERINATAL HEALTH PROGRAM – PERINATAL DATABASE REGISTRY ANNUAL REPORT 2007 39(Only singleton deliveries and births included)
FETAL AND NEWBORN INDICATORS
Table
18B
irthW
eigh
tvs
Gestatio
nalA
ge
(TermB
irths)
by
Place
of
Resid
ence
for
Health
Service
Delivery
Areas,
Health
Au
tho
ritiesan
dP
rovin
ce,2002/2003to
2006/2007
FHA
IHA
NH
AV
CH
AV
IHA
BC
No
nB
CFE
FNFS
Total
EK
KB
OK
TC
STo
talN
EN
IN
WTo
talC
ST
RIC
HV
AN
CTo
talC
VI
NV
IS
VI
Total
Unspec
Res
%%
%%
%%
%%
%%
%%
%%
%%
%%
%%
%%
%%
AG
A02/03
79.180.2
78.979.4
81.281.2
81.580.6
81.176.9
77.873.2
76.281.7
80.981.4
81.476.3
78.578.8
77.982.1
72.079.6
03/0478.7
80.479.4
79.681.8
80.780.4
79.480.3
80.477.2
75.077.5
79.880.1
82.081.1
76.277.8
78.877.7
84.383.1
79.704/05
79.580.3
80.680.3
82.182.6
80.781.4
81.379.4
77.674.4
77.382.8
80.582.3
82.179.2
76.878.0
78.275.1
73.880.3
05/0678.3
80.379.9
79.882.0
80.182.0
80.681.3
81.180.9
73.279.0
80.680.2
81.581.1
80.778.8
78.379.2
80.777.5
80.206/07
80.081.0
80.480.5
81.584.9
81.380.8
81.578.1
79.376.2
78.280.7
83.682.8
82.579.1
81.279.2
79.576.7
82.980.8
LGA
02/0315.0
12.812.9
13.311.1
13.311.9
13.312.4
15.715.1
21.617.2
13.39.9
9.910.7
17.716.5
15.216.3
12.414.4
13.303/04
14.612.7
12.613.0
10.711.8
12.913.7
12.812.3
15.421.0
16.114.5
11.39.3
10.918.5
16.315.9
16.810.3
10.213.3
04/0513.8
12.211.5
12.211.7
10.111.6
11.611.5
14.215.2
21.016.5
12.210.8
8.79.9
15.316.5
16.115.9
10.915.0
12.405/06
15.612.1
11.912.7
11.211.5
12.313.1
12.312.9
12.921.4
15.013.4
10.710.1
11.015.8
15.616.3
16.010.2
16.312.9
06/0713.3
11.911.8
12.111.0
6.812.4
12.211.6
12.714.5
19.615.2
14.49.3
9.210.4
15.715.0
15.815.6
13.57.8
12.4
SGA
02/035.9
6.98.2
7.37.7
5.66.6
6.16.5
7.47.1
5.26.6
5.19.1
8.77.9
6.04.9
6.05.8
5.613.6
7.103/04
6.76.9
8.17.4
7.57.6
6.76.9
6.97.2
7.44.0
6.45.7
8.68.7
7.95.3
5.95.4
5.55.4
6.87.1
04/056.6
7.67.9
7.66.2
7.47.7
7.07.3
6.47.1
4.66.3
5.08.7
9.08.0
5.56.7
5.85.9
14.011.2
7.305/06
6.17.5
8.27.6
6.88.4
5.76.4
6.36.0
6.35.5
6.06.1
9.18.4
8.03.5
5.55.4
4.79.0
6.27.0
06/076.7
7.27.7
7.37.5
8.36.3
7.16.9
9.26.3
4.26.6
4.87.0
8.07.1
5.23.9
5.14.9
9.99.3
6.8
Figu
re16
Birth
Weig
ht
vsG
estation
alAg
e(Term
Birth
s)b
yP
laceo
fR
esiden
cefo
rH
ealthA
uth
orities
and
Pro
vince,
2002/2003to
2006/2007
AG
ALG
ASG
A
PERCENT
908070605040302010002/03
03/0404/05
05/0606/07
FHA
02/0303/04
04/0505/06
06/07
IHA
02/0303/04
04/0505/06
06/07
NH
A
02/0303/04
04/0505/06
06/07
VCHA
02/0303/04
04/0505/06
06/07
VIHA
02/0303/04
04/0505/06
06/07
BC
PL
AC
EO
FR
ES
IDE
NC
E
No
te:Please
referto
back
flapfo
rleg
end
of
the
Health
Au
tho
ritiesan
dH
ealthS
erviceD
eliveryA
reas
No
te:Please
referto
back
flapfo
rleg
end
of
the
Health
Au
tho
ritiesan
dH
ealthS
erviceD
eliveryA
reasA
GA
:Averag
e-for-g
estation
alage
LGA
:Large-fo
r-gestatio
nalag
eS
GA
:Sm
all-for-g
estation
alage

40 BRITISH COLUMBIA PERINATAL HEALTH PROGRAM – PERINATAL DATABASE REGISTRY ANNUAL REPORT 2007(Only singleton deliveries and births included)
SECTION III
Table
19B
irthW
eigh
tvs
Gestatio
nalA
ge
(Preterm
Birth
s)b
yP
laceo
fR
esiden
cefo
rH
ealthS
erviceD
eliveryA
reas,H
ealthA
uth
orities
and
Pro
vince,2002/2003
to2006/2007
FHA
IHA
NH
AV
CH
AV
IHA
BC
No
nB
CFE
FNFS
Total
EK
KB
OK
TC
STo
talN
EN
IN
WTo
talC
ST
RIC
HV
AN
CTo
talC
VI
NV
IS
VI
Total
Unspec
Res
%%
%%
%%
%%
%%
%%
%%
%%
%%
%%
%%
%%
AG
A02/03
77.978.4
75.977.2
75.882.2
82.776.9
79.973.8
77.669.6
74.479.3
83.575.6
77.573.2
78.375.2
75.162.1
87.577.0
03/0478.6
82.976.8
79.487.5
71.483.2
78.080.5
87.275.4
63.073.1
79.079.3
83.481.8
73.674.4
76.074.9
75.085.7
78.904/05
72.676.9
72.574.1
88.682.8
78.975.0
79.073.3
72.776.2
74.179.2
80.483.3
82.073.5
73.578.1
75.856.7
71.476.7
05/0680.9
74.374.6
75.782.6
80.077.7
81.579.7
66.779.8
67.172.6
71.273.0
82.679.0
72.867.4
80.475.3
71.483.3
76.806/07
79.877.0
73.475.8
92.082.0
77.885.5
82.274.0
75.275.7
75.177.3
76.577.3
77.275.5
70.776.8
75.490.7
94.477.2
LGA
02/0312.6
12.713.7
13.118.2
11.112.7
17.514.7
16.712.9
24.617.2
17.13.1
11.211.4
22.013.3
14.216.7
13.86.3
13.803/04
14.19.7
15.112.9
7.526.2
12.013.4
13.55.1
13.928.4
17.412.7
11.78.5
9.916.6
15.916.0
16.218.8
0.013.2
04/0517.3
12.516.8
15.46.8
12.113.4
15.813.4
20.018.2
20.219.3
13.911.8
8.910.4
20.017.6
17.018.2
33.39.5
14.805/06
10.914.6
15.114.1
6.511.1
12.115.8
12.617.8
14.423.5
18.421.8
18.09.6
13.217.3
22.114.5
16.87.1
0.014.3
06/0710.5
11.514.3
12.78.0
12.012.9
8.210.7
16.016.2
20.317.4
16.017.4
11.013.1
18.518.7
15.817.2
4.75.6
13.4
SGA
02/039.5
8.910.4
9.76.1
6.74.6
5.65.3
9.59.5
5.88.4
3.713.4
13.211.0
4.98.4
10.68.2
24.16.3
9.203/04
7.37.4
8.17.7
5.02.4
4.78.5
5.97.7
10.78.6
9.58.3
9.08.1
8.39.8
9.88.0
8.96.3
14.37.9
04/0510.1
10.610.6
10.54.5
5.27.7
9.27.6
6.79.1
3.66.6
6.97.8
7.87.6
6.58.8
4.96.1
10.019.0
8.505/06
8.311.0
10.310.2
10.98.9
10.22.7
7.715.6
5.89.4
9.07.1
9.07.8
7.89.9
10.55.1
7.821.4
16.78.9
06/079.6
11.512.3
11.60.0
6.09.3
6.37.0
10.08.5
4.17.5
6.76.1
11.79.8
6.010.7
7.57.4
4.70.0
9.4
No
te:Please
referto
back
flapfo
rleg
end
of
the
Health
Au
tho
ritiesan
dH
ealthS
erviceD
eliveryA
reasA
GA
:Averag
e-for-g
estation
alage
LGA
:Large-fo
r-gestatio
nalag
eS
GA
:Sm
all-for-g
estation
alage
Figu
re17
Birth
Weig
ht
vsG
estation
alAg
e(P
retermB
irths)
by
Place
of
Resid
ence
for
Health
Au
tho
ritiesan
dP
rovin
ce,2002/2003
to2006/2007
AG
ALG
ASG
A
PERCENT
908070605040302010002/03
03/0404/05
05/0606/07
FHA
02/0303/04
04/0505/06
06/07
IHA
02/0303/04
04/0505/06
06/07
NH
A
02/0303/04
04/0505/06
06/07
VCHA
02/0303/04
04/0505/06
06/07
VIHA
02/0303/04
04/0505/06
06/07
BC
PL
AC
EO
FR
ES
IDE
NC
E
No
te:Please
referto
back
flapfo
rleg
end
of
the
Health
Au
tho
ritiesan
dH
ealthS
erviceD
eliveryA
reas

SECTION IV
APPENDICES AND
REFERENCES


BRITISH COLUMBIA PERINATAL HEALTH PROGRAM – PERINATAL DATABASE REGISTRY ANNUAL REPORT 2007 43
APPENDICES AND REFERENCES
AgeAge on date of event/age at last birth date preceding the event.
Age-Specific Fertility RateThe number of live births per 1,000 women in a specificage group.
AntepartumOccurring before birth.
BC Unspecified (Place of Residence)The postal code is unknown but it is known that the person isa resident of BC.
Birth weightFirst weight of the fetus or newborn obtained after birth, ex-pressed in grams. Low birth weight (LBW) birth weight is lessthan 2,500 grams. Very low birth weight (VLBW) – birthweight is less than 1,500 grams. (Excludes newborns withweight between 0-300 grams).
Care Provider for DeliveryPerson who provides the actual, hands-on care for the deliv-ery of the baby. The categories are: OB/GYN – includes obste-tricians (or fellow) and obstetrical residents; Family physician– includes general practitioners, and family practice resi-dents; Midwife – includes BC registered midwife and midwifetrainee; Nurse – includes nurses; Other/Unknown – includessurgeons, family members, ambulance attendants, medicalstudent intern (MSI), if there was no one in attendance or ifthere was no documentation.
Count of casesThe most basic measure is a simple count of cases or condi-tions of interest and is often expressed as a variable. Such fig-ures are important for strategic planning in health caresystems, especially in terms of resource allocation. Counts ofcases provide an idea of the number of people who will requirea specific treatment, intervention or service. The definition ofa variable is any attribute, phenomenon or event that can havedifferent values but is expressed as a single data element:• Yes, no, not applicable• A number (e.g., age)
Caesarean Section (C/Section) Method of DeliveryA delivery involving the surgical incision of the abdomen anduterine walls.
Electronic Fetal Monitoring (EFM)Mother received external or internal electronic fetal heart moni-toring during 1st or 2nd stage of labour. May include patients withelectronic fetal monitoring during latent phase of labour. Motherswho do not go into labour are classified as “Not Applicable”.
EpisiotomyA surgical incision into the perineum and vagina at the time ofbirth. If it is unknown if mother received an episiotomy, thiscase would be included in the category “No”.
FrequencyNumber of events or cases in a category.
Gestational AgeThe number of completed weeks a fetus has developed sincethe beginning of the pregnancy (gestation).
SGA – Small for Gestational AgeTerm used to describe babies who are born weighingless than the usual amount for the number of weeksof pregnancy. SGA babies have birth weights belowthe 10th percentile of a population specific weightversus gestational age plot.
AGA – Average for Gestational AgeTerm used to describe babies who are born withinthe normal range of weight for that gestational age.AGA babies have birth weights between the 10th and90th percentile of a population specific weight ver-sus gestational age plot.
LGA – Large for Gestational AgeTerm used to describe babies born weighing morethan the usual amount for the number of weeks ofpregnancy. LGA babies have birth weights greaterthan the 90th percentile of a population specificweight versus gestational age plot.
APPENDIX 1 – DEFINITIONS AND NOTES ON INDICATORS

44 BRITISH COLUMBIA PERINATAL HEALTH PROGRAM – PERINATAL DATABASE REGISTRY ANNUAL REPORT 2007
APPENDICES AND REFERENCES
Health Authority (HA)/Health Service Delivery Areas(HSDA) – DeliveryRefers to the Health Authority or Health Service Delivery Areain which the patient delivered. The BC Ministry of Health hasdefined six macro level administrative boundaries calledhealth authorities, which govern the manner in which healthcare services are delivered within the province of BC. HealthAuthorities are further divided into sixteen Health ServiceDelivery areas. HSDAs are micro level geographic boundaries.There may be more than one institution in a HA or HSDA.
Health Authority (HA)/ Health Service Delivery Areas(HSDA) – ResidenceRefers to the Health Authority or Health Service Delivery Areain which the patient resided at the time of delivery. Statisticsrelating to the client’s residence are determined via theTranslation Master File (TMF). The TMF file is a comprehen-sive demographic mapping file, which consists of valid BCpostal codes and their associated Health Service DeliveryAreas (HSDA) and Health Authorities (HA). The geographicarea to which a postal code belongs seldom changes overtime but in cases where the postal code has changed, appro-priate amendments have been made to reflect that postalcode’s associated HSDA for that particular year.
Home BirthBirth that occurred at home and mother was not admitted toan inpatient facility within 24 hours of the birth. The primarycare provider was a BC registered midwife.
Induction of LabourPatient who received instrumental or pharmacological assis-tance to promote labour, prior to the onset of first stage oflabour. A patient may be induced by any of the following meth-ods: artificial rupture of membranes (ARM), oxytocin,prostaglandin or other methodology. A failed medical inductionis classified as an induction. Induction is categorized as “un-known” if it is unknown how the patient’s labour was initiated.
Inductions performed prior to a delivery admission (e.g., asan antepartum admission or an outpatient visit) that have re-sulted in labour with subsequent admission are also classifiedas an induction.
Intermittent AuscultationA systematic method of listening to fetal heart tones with anacoustical device (fetascope) or hand-held ultrasound (dop-tone), paying attention to rate, rhyrthm and variability for atleast one full minute, most usually following a uterine con-traction (UC), and timing with a watch or clock with a sweepsecond hand.
Intrapartum (IP)The period between the onset of the first stage of labour andthe delivery of the placenta.
Late TerminationThe medical termination of a pregnancy beyond 20 weeks ofgestation. Gestation is measured in weeks and estimated fromthe first day of the last normal menstrual period.
Live BirthThe complete expulsion or extraction from the mother, irrespec-tive of the duration of the pregnancy, of a fetus in which there isbreathing, beating of the heart, pulsation of the umbilical cordor unmistakable movement of voluntary muscle, whether or notthe umbilical cord has been cut or the placenta is attached.
Maternal SmokingThere is documentation that the patient smoked during thecurrent pregnancy. If a patient smoked at any time duringpregnancy, even if she quit during the pregnancy, she is cate-gorized as a smoker in the current pregnancy.
Method of DeliveryVaginal
The complete separation of an infant from thematernal body via the vaginal canal.
Operative vaginal deliveryA vaginal delivery involving forceps or vacuum tofacilitate delivery of the fetus; includes vaginalbreech deliveries.
Caesarean sectionA delivery involving the surgical incision of theabdomen and uterine walls.
Elective caesarean sectionA caesarean section delivery in which the decisionfor caesarean section is made prior to labour; abooked caesarean section.
Emergent caesarean sectionA caesarean section delivery in which there is a threatto maternal or fetal health; the patient may or maynot be in labour at the time of an emergent cae-sarean section.
APPENDIX 1 – DEFINITIONS AND NOTES ON INDICATORS (CONT’D)

BRITISH COLUMBIA PERINATAL HEALTH PROGRAM – PERINATAL DATABASE REGISTRY ANNUAL REPORT 2007 45
Multiple BirthBirth in which more than one infant is born, including livebirths and stillbirths.
Multiple PregnancyA pregnancy with more than one fetus.
Newborn FeedingBreastfeeding definitions in the PDR have been updated to in-clude the WHO/UNICEF recommendations.
Exclusive breast milk:No food or liquid other than breast milk, not evenwater, is given to the infant from birth by the mother,health care provider or family member/supporterwith the exception of undiluted drops of syrups con-sisting of vitamin or mineral supplements or medi-cines (BCC adapted from WHO/UNICEF, 2004).
Breast milk and formula (partial breast milk):Infant receives both breast milk and supplementa-tion (such as formula, water, glucose water) with theexception of undiluted drops and syrups consistingof vitamins or mineral supplements or medicinesduring the hospital period.
No breast milk:The infant/child receives no breast milk.
Not applicable:The baby was immediately transferred to anotherhospital, was a stillbirth or neonatal death or a mid-wife case.
Unknown:No documentation as to how the newborn was fedduring hospital stay.
Non-residentThe woman delivers in British Columbia but is not a residentof British Columbia. She may be from out of province or outof country.
NulliparaA woman who has never delivered a baby (500 grams birthweight or 20 weeks gestation) in a previous pregnancy.
Parity >– 1The condition of having carried a previous pregnancy to apoint of viability (500 grams birth weight or 20 weeks gesta-tion) regardless of outcome.
APPENDICES AND REFERENCES
Postpartum LOS – Vaginal/ Caesarean SectionLength of hospital stay calculated from delivery date/time todischarge date/time of mother, stratified into vaginal and cae-sarean births. This category excludes those who delivered athome with a BC registered midwife in attendance.
Preterm BirthLive birth after 20 and before 37 weeks completed weeks ofgestation.
ProportionA proportion is a measure of the number of persons having aspecific condition or intervention at a designated time. It isdefined as the number of existing cases divided by total pop-ulation from which those arose. It is reported as a percent, forexample, the percent of women giving birth in a specifichealth region, of all women in the region.
Rate“A rate is a measure of the frequency of occurrence of aphenomenon. In epidemiology, demography and vital sta-tistics, a rate is an expression of the frequency with whichan event occurs in a defined population; the use of ratesrather than raw numbers is essential for comparison of ex-perience between populations at different times, differentplaces or among different classes of persons. The compo-nents of a rate are the numerator, the denominator, thespecified time in which events occur and usually a multipli-er, a power of 10, which converts the rate from an awkwardfraction to a decimal or whole number”. (A Dictionary ofEpidemiology, 3rd Edition. John M. Last, Oxford UniversityPress, 1995)
StillbirthThe complete expulsion or extraction from the maternal bodyafter at least 20 weeks of gestation or after attaining a weightof at least 500 grams of a fetus in which at birth, there is nobreathing, beating heart, pulsation of the umbilical cord orunmistakable movement of voluntary muscle.
Term BirthLive birth after 37 completed weeks (or 259 days) of gestation.
Multiple reports can be accessed and various methods can beused to obtain BCPDR data in order to conduct analysis onperinatal processes and outcomes in British Columbia:
• Hospital Reports – these are hospital-specific, pre-pro-grammed reports, which can be run at all locations wherethe database is installed. Other participating sites, wherethe database is not installed, may obtain their specific hos-pital reports from the BCPDR central office.
• Ad hoc Reports – the database can be used to answer spe-cific requests through user-defined queries. These queriescan be developed and run at the hospital installation sitesor at the BCPDR central office.
• BC Facility Comparison Reports – these reports are creat-ed annually and allow the individual facility to compare andbenchmark selected maternal and newborn events and out-comes with provincial and similar sized sites.
• Perinatal Database Reporting Tool – The PerinatalReporting Tool is an interactive CD, which has been designedto allow health care providers, administrators and data ana-lysts access to summarized data sets extracted from the BCPerinatal Database Registry and is updated yearly. The PRTcan be used for analysis of population based and compara-tive reporting between institutions, Health Authorities andagainst provincial totals for some of the most commonand/or important practices and health outcomes related toperinatal care.
• Specific Requests for Data – clients, health care profes-sionals, researchers etc., may request specific data via theweb at <http://www.bcrcp.ca>. See Appendix 9.
46 BRITISH COLUMBIA PERINATAL HEALTH PROGRAM – PERINATAL DATABASE REGISTRY ANNUAL REPORT 2007
APPENDICES AND REFERENCES
APPENDIX 2 – BRITISH COLUMBIA PERINATAL DATABASEINFORMATION RESOURCES

BRITISH COLUMBIA PERINATAL HEALTH PROGRAM – PERINATAL DATABASE REGISTRY ANNUAL REPORT 2007 47
APPENDICES AND REFERENCES
Health Health ServiceInstitution Name
Authority Delivery Area
Fraser Fraser East Chilliwack General HospitalFraser Canyon Hospital (Hope)Matsqui-Sumas-Abbotsford General HospitalMission Memorial Hospital
Fraser North Burnaby HospitalEagle Ridge Hospital & Health Care Centre (Port Moody)Ridge Meadows Hospital & Health Care CentreRoyal Columbian Hospital (New Westminster)
Fraser South Delta HospitalLangley Memorial HospitalPeace Arch District Hospital (White Rock)Surrey Memorial Hospital
Interior East Kootenay Creston Valley HospitalEast Kootenay Regional Hospital (Cranbrook)Elk Valley Hospital (Fernie)Golden and District General HospitalInvermere and District HospitalKimberley and District HospitalSparwood Health Centre
Kootenay Boundary Arrow Lakes Hospital (Nakusp)Boundary Hospital (Grand Forks)Castlegar and District Community Health CentreKootenay Boundary Regional Hospital (Trail)Kootenay Lake Hospital (Nelson)Slocan Community Health Centre (New Denver)Victorian Community Health Centre of Kaslo
Okanagan Enderby & District Memorial HospitalKelowna General HospitalPenticton Regional HospitalPrinceton General HospitalSouth Okanagan General Hospital (Oliver)Summerland Health CentreVernon Jubilee Hospital
Thompson Cariboo Shuswap 100 Mile District General HospitalAshcroft and District General HospitalCariboo Memorial Hospital (Williams Lake)Dr. Helmcken Memorial Hospital (Clearwater)Lillooet Hospital and Health CentreNicola Valley Health Centre (Merritt)Queen Victoria Hospital (Revelstoke)Royal Inland Hospital (Kamloops)Shuswap Lake General Hospital (Salmon Arm)St. Bartholomew's Hospital (Lytton)
APPENDIX 3 – HEALTH AUTHORITIES, HEALTH SERVICE DELIVERY AREASAND INSTITUTIONS*
*For a list of the level of services provided at BC hospitals, refer to the BCPHP website at http://www.bcphp.caRefer to document: BC Deliveries By Maternal Residence & Delivery Hospital Highest Level Of Service

48 BRITISH COLUMBIA PERINATAL HEALTH PROGRAM – PERINATAL DATABASE REGISTRY ANNUAL REPORT 2007
APPENDICES AND REFERENCES
Health Health ServiceInstitution Name
Authority Delivery Area
Northern Health Northeast Chetwynd General HospitalDawson Creek and District HospitalFort Nelson General HospitalFort St. John General Hospital
Northern Interior G.R. Baker Memorial Hospital (Quesnel)Lakes District Hospital and Health Centre (Burns Lake)MacKenzie and District HospitalMcBride and District HospitalPrince George Regional HospitalSt. John Hospital (Vanderhoof)Stuart Lake Hospital (Fort St. James)
Northwest Bulkley Valley District Hospital (Smithers)Kitimat General HospitalMills Memorial Hospital (Terrace)Prince Rupert Regional HospitalQueen Charlotte Islands General Hospital (Village of Queen Charlotte)Stewart General HospitalWrinch Memorial Hospital (Hazelton)
Vancouver Coastal North Shore/Coastal Garibaldi Bella Coola General HospitalLions Gate Hospital (North Vancouver)Powell River General HospitalR.W. Large Memorial Hospital (Waglisla)Squamish General HospitalSt. Mary's Hospital (Sechelt)
Richmond The Richmond Hospital
Vancouver Mount Saint Joseph HospitalSt. Paul's HospitalVancouver General Hospital
Vancouver Island Central Vancouver Island Cowichan District Hospital (Duncan)Ladysmith Community Health CentreNanaimo Regional General HospitalTofino General HospitalWest Coast General Hospital (Port Alberni)
North Vancouver Island Campbell River and District General HospitalPort Alice HospitalPort Hardy HospitalPort McNeill and District HospitalCormorant Island Community Health Centre (Alert Bay)St. Joseph’s General Hospital (Comox)
South Vancouver Island The Lady Minto Gulf Islands Hospital (Salt Spring Island)Saanich Peninsula HospitalVictoria General Hospital
PHSA Provincial Health BC Women's HospitalServices Authority
*For a list of the level of services provided at BC hospitals, refer to the BCPHP website at http://www.bcphp.caRefer to document: BC Deliveries By Maternal Residence & Delivery Hospital Highest Level Of Service
APPENDIX 3 – HEALTH AUTHORITIES, HEALTH SERVICE DELIVERY AREAS AND INSTITUTIONS* (CONT’D)

BRITISH COLUMBIA PERINATAL HEALTH PROGRAM – PERINATAL DATABASE REGISTRY ANNUAL REPORT 2007 49
APPENDICES AND REFERENCES
Descriptive Statistics for Singleton Males
Weeks of Number of Lower 95% Upper 95% StandardGestation Cases Conf. Limit Mean Conf. Limit Deviation Skewness Percentile Ranks
3rd 5th 10th Median 90th 95th 97th
20 57 383.9 423.12 462.35 147.84 1.97 265 275 290 380 590 800 885
21 81 411.37 478.27 545.17 302.54 7.39 320 340 360 430 550 620 650
22 137 509.98 535.01 560.05 148.18 2.39 360 375 400 520 675 757 800
23 162 584.24 604.34 624.44 129.55 1.44 380 400 460 600 710 800 900
24 231 710.61 735.53 760.44 192.19 2.94 500 520 590 710 870 1,000 1,310
25 237 793.79 812.41 831.02 145.49 1.95 580 600 640 810 937 1,020 1,060
26 313 909.42 933.16 956.9 213.46 1.17 550 620 700 920 1,150 1,295 1,370
27 326 1,035.57 1,061.80 1,088.02 240.67 2.12 630 700 809 1,045 1,300 1,375 1,492
28 457 1,212.63 1,244.87 1,277.11 350.73 2.24 680 780 930 1,200 1,540 1,790 2,009
29 479 1,373.65 1,407.64 1,441.62 378.57 3.52 850 925 1,049 1,380 1,690 1,910 2,100
30 671 1,591.72 1,631.47 1,671.22 524.42 1.97 880 990 1,160 1,550 2,060 2,905 3,260
31 737 1,733.17 1,765.98 1,798.80 453.79 1.98 1,040 1,135 1,300 1,730 2,130 2,380 2,975
32 1,323 1,951.36 1,974.07 1,996.78 421.03 0.93 1,235 1,340 1,520 1,950 2,410 2,669 2,940
33 1,642 2,159.62 2,179.57 2,199.53 412.28 0.78 1,450 1,559 1,700 2,160 2,630 2,880 3,077
34 3,143 2,396.59 2,411.70 2,426.81 431.98 0.58 1,637 1,760 1,900 2,381 2,900 3,160 3,335
35 4,721 2,603.65 2,616.22 2,628.78 440.41 0.44 1,835 1,944 2,116 2,600 3,155 3,375 3,515
36 11,433 2,879.96 2,888.48 2,897.00 464.78 0.36 2,060 2,180 2,340 2,863 3,480 3,690 3,835
37 21,134 3,096.64 3,102.82 3,108.99 457.83 0.2 2,280 2,390 2,560 3,085 3,680 3,870 4,010
38 57,855 3,327.10 3,330.75 3,334.39 447.69 0.21 2,525 2,637 2,790 3,311 3,900 4,090 4,220
39 87,266 3,484.89 3,487.82 3,490.75 441.36 0.2 2,696 2,800 2,948 3,470 4,050 4,231 4,360
40 157,563 3,631.98 3,634.20 3,636.43 450.37 0.19 2,830 2,928 3,080 3,620 4,215 4,400 4,520
41 67,662 3,768.60 3,772.06 3,775.51 458.34 0.15 2,948 3,046 3,201 3,760 4,360 4,540 4,670
42 22,931 3,818.51 3,824.70 3,830.88 477.55 0.1 2,948 3,060 3,232 3,813 4,440 4,621 4,750
43 2,032 3,841.95 3,863.08 3,884.21 485.75 0.12 2,977 3,090 3,260 3,856 4,480 4,677 4,800
44 255 3,747.81 3,812.22 3,876.62 522.26 0.11 2,807 2,948 3,175 3,770 4,550 4,734 4,904
Source: BC Vital Statistics Agency
APPENDIX 4
Birth Weight and Gestational Age Charts for British Columbia Population for Singleton Males (1981-2000)

50 BRITISH COLUMBIA PERINATAL HEALTH PROGRAM – PERINATAL DATABASE REGISTRY ANNUAL REPORT 2007
APPENDICES AND REFERENCES
Descriptive Statistics for Singleton Females
Weeks of Number of Lower 95% Upper 95% StandardGestation Cases Conf. Limit Mean Conf. Limit Deviation Skewness Percentile Ranks
3rd 5th 10th Median 90th 95th 97th
20 37 357.88 461.3 564.71 310.17 2.79 200 200 260 380 850 1,500 1,500
21 83 415.74 444.61 473.49 132.25 1.92 280 300 320 420 570 728 810
22 98 478.67 497.56 516.46 94.25 0.29 310 360 400 495 630 670 700
23 139 551.05 567.79 584.53 99.83 0.31 415 440 454 560 700 765 800
24 183 652.76 682.59 712.42 204.52 4.81 410 490 520 655 840 907 975
25 171 767.54 804.52 841.5 244.97 2.82 454 540 600 780 964 1,070 1,389
26 276 873.74 911.11 948.48 315.37 4.5 540 570 685 873 1,100 1,260 1,370
27 278 988.27 1,014.61 1,040.95 223.1 0.63 555 660 740 1,010 1,260 1,370 1,480
28 369 1,168.98 1,215.36 1,261.74 453.08 3.05 705 755 850 1,160 1,500 1,860 2,800
29 353 1,281.94 1,325.32 1,368.70 414.39 2.4 700 770 930 1,295 1,640 1,830 2,320
30 494 1,579.02 1,628.96 1,678.89 564.89 1.87 880 940 1,150 1,520 2,280 3,005 3,340
31 560 1,641.78 1,680.63 1,719.48 468.03 1.91 980 1,083 1,235 1,645 2,046 2,517 2,880
32 1,055 1,862.63 1,890.12 1,917.60 455.02 1.06 1,110 1,247 1,401 1,843 2,381 2,693 2,980
33 1,325 2,087.82 2,111.82 2,135.83 445.38 0.72 1,315 1,440 1,620 2,080 2,600 2,900 3,180
34 2,377 2,308.51 2,326.38 2,344.26 444.53 0.66 1,570 1,670 1,820 2,300 2,852 3,130 3,374
35 3,824 2,527.88 2,541.97 2,556.07 444.59 0.39 1,740 1,885 2,020 2,521 3,090 3,317 3,487
36 9,450 2,782.68 2,792.06 2,801.43 464.9 0.3 1,950 2,075 2,250 2,770 3,400 3,600 3,750
37 18,260 2,988.23 2,994.70 3,001.16 445.44 0.29 2,183 2,305 2,460 2,977 3,550 3,750 3,895
38 51,757 3,206.86 3,210.61 3,214.36 435.07 0.25 2,435 2,530 2,680 3,193 3,770 3,941 4,080
39 82,769 3,351.27 3,354.16 3,357.05 424.44 0.23 2,600 2,695 2,835 3,340 3,900 4,080 4,196
40 155,547 3,483.26 3,485.41 3,487.55 432.38 0.2 2,720 2,807 2,950 3,470 4,040 4,220 4,337
41 66,228 3,606.69 3,610.06 3,613.43 442.37 0.22 2,815 2,920 3,062 3,600 4,180 4,350 4,480
42 21,306 3,652.96 3,659.10 3,665.24 457.18 0.19 2,840 2,940 3,090 3,650 4,245 4,430 4,545
43 1,853 3,681.13 3,703.54 3,725.94 491.73 0.17 2,800 2,892 3,090 3,710 4,330 4,540 4,650
44 153 3,610.57 3,692.87 3,775.17 515.26 0.18 2,736 2,863 3,025 3,660 4,309 4,706 4,763
Source: BC Vital Statistics Agency
APPENDIX 5
Birth Weight and Gestational Age Charts for British Columbia Population for Singleton Females (1981-2000)

BRITISH COLUMBIA REPRODUCTIVE CARE PROGRAM – PERINATAL DATABASE REGISTRY ANNUAL REPORT 2007 51
APPENDICES AND REFERENCES
Live Births, Deaths, Marriages, and Stillbirths – British Columbia, 1950 to 2005
Mid-Year Live Births Deaths Marriages Stillbirths
Year Population Number Rate Number Rate Number Rate Number Rate
1950 1,137,000 27,116 23.85 11,581 10.19 11,110 9.77 369 13.431951 1,165,210 28,077 24.10 11,638 9.99 11,272 9.67 365 12.831952 1,205,000 29,827 24.75 12,080 10.02 11,081 9.20 375 12.421953 1,248,000 31,746 25.44 12,218 9.79 11,298 9.05 375 11.671954 1,295,000 32,946 25.44 12,414 9.59 10,991 8.49 373 11.191955 1,342,000 34,138 25.44 12,816 9.55 11,011 8.20 381 11.041956 1,398,464 36,241 25.91 13,415 9.59 11,950 8.55 413 11.271957 1,482,000 38,744 26.14 13,711 9.25 12,620 8.52 422 10.771958 1,538,000 39,577 25.73 13,741 8.93 12,094 7.86 414 10.351959 1,567,000 39,971 25.51 14,336 9.15 11,910 7.60 404 10.011960 1,602,000 40,116 25.04 14,696 9.17 11,203 6.99 437 10.781961 1,629,100 38,591 23.69 14,403 8.84 10,935 6.71 410 10.511962 1,660,000 38,128 22.97 14,912 8.98 11,196 6.74 377 9.791963 1,699,000 37,478 22.06 15,029 8.85 11,677 6.87 476 12.541964 1,745,000 35,897 20.57 16,051 9.20 12,158 6.97 485 13.331965 1,797,000 33,669 18.74 15,784 8.78 13,639 7.59 447 13.101966 1,873,674 32,502 17.35 16,290 8.69 14,682 7.84 409 12.431967 1,945,000 32,899 16.91 16,170 8.31 16,026 8.24 422 12.661968 2,003,000 33,687 16.82 16,828 8.40 16,914 8.44 433 12.691969 2,060,000 35,383 17.18 17,377 8.44 18,284 8.88 468 13.051970 2,128,000 36,861 17.32 17,020 8.00 20,020 9.41 407 10.921971 2,184,620 34,852 15.95 17,783 8.14 20,389 9.33 442 12.521972 2,241,400 34,563 15.42 18,021 8.04 20,659 9.22 356 10.201973 2,302,400 34,352 14.92 18,095 7.86 21,303 9.25 339 9.771974 2,375,700 35,450 14.92 19,177 8.07 21,734 9.15 364 10.161975 2,433,200 36,281 14.91 19,151 7.87 21,824 8.97 414 11.281976 2,466,610 35,848 14.53 18,788 7.62 21,536 8.73 361 9.971977 2,493,800 36,691 14.71 18,021 7.23 21,156 8.48 330 8.911978 2,530,100 37,231 14.72 19,057 7.53 21,388 8.45 331 8.811979 2,571,200 38,432 14.95 19,204 7.47 22,087 8.59 313 8.081980 2,640,100 40,104 15.19 19,371 7.34 23,830 9.03 316 7.821981 2,744,470 41,679 15.19 19,857 7.24 24,694 9.00 371 8.821982 2,787,700 42,942 15.40 20,704 7.43 23,831 8.55 317 7.331983 2,813,800 43,047 15.30 19,895 7.07 23,692 8.42 310 7.151984 2,847,700 44,040 15.47 20,781 7.30 23,394 8.22 303 6.831985 2,990,000 42,989 14.38 21,131 7.07 22,270 7.45 333 7.691986 3,004,104 41,714 13.89 21,008 6.99 21,843 7.27 308 7.331987 3,050,160 41,611 13.64 21,618 7.09 23,417 7.68 291 6.941988 3,115,357 42,860 13.76 22,357 7.18 24,514 7.87 295 6.841989 3,197,880 43,589 13.63 22,786 7.13 25,177 7.87 324 7.381990 3,290,814 45,347 13.78 23,415 7.12 25,226 7.67 298 6.531991 3,373,464 45,346 13.44 23,819 7.06 23,665 7.02 298 6.531992 3,468,445 46,030 13.27 24,463 7.05 23,762 6.85 297 6.411993 3,567,406 45,956 12.88 25,603 7.18 23,478 6.58 292 6.311994 3,675,699 46,837 12.74 25,830 7.03 23,772 6.47 312 6.621995 3,777,004 46,701 12.36 26,225 6.94 23,632 6.26 350 7.441996 3,874,276 45,960 11.86 27,390 7.07 22,882 5.91 292 6.311997 3,948,544 44,402 11.25 27,260 6.90 21,883 5.54 335 7.491998 3,983,077 42,871 10.76 27,807 6.98 21,778 5.47 278 6.441999 4,011,342 41,748 10.41 27,882 6.95 21,628 5.39 313 7.442000 4,039,198 40,497 10.03 27,327 6.77 22,096 5.47 311 7.622001 4,078,447 40,393 9.90 28,235 6.92 20,573 5.04 287 7.062002 4,115,413 39,905 9.70 28,710 6.98 21,261 5.17 307 7.632003 4,154,591 40,305 9.70 29,151 7.02 21,985 5.29 305 7.512004 4,201,867 40,339 9.60 29,710 7.07 22,081 5.26 281 6.922005 4,254,522 40,653 9.56 30,033 7.06 22,631 5.32 313 7.64
Source: BC Vital Statistics AgencyNote: Rates shown for live births, deaths and marriages are crude rates per 1,000 population.
Stillbirth rate is per 1,000 total births (live births plus stillbirths).The definition of a stillbirth was revised in 1963 and 1986.Population information from BC STATS, Ministry of Management Services.Above information includes late registrations and amendments.Gender unknown included. Non-residents are excluded from all data except marriages.
APPENDIX 6

Source: BC Vital Statistics AgencyNote: Rates per 1,000 live births in the specified year.
N.S. – Not stated. Above information includes late registrations and amendments.Canadian rates from Statistics Canada. *Rates were not available. Non-residents are excluded.
52 BRITISH COLUMBIA PERINATAL HEALTH PROGRAM – PERINATAL DATABASE REGISTRY ANNUAL REPORT 2007
APPENDICES AND REFERENCES
Infant Mortality – British Columbia and Canada, 1965 to 2005
British Columbia Canada
Age at Death (in Days)0-6 Days 0-27 Days 28-364 Days Total
Year Number Rate Number Rate Number Rate N.S. Number Rate Rate
1965 415 12.33 453 13.45 227 6.74 3 683 20.29 24.01966 435 13.38 494 15.20 263 8.09 4 761 23.41 23.11967 429 13.04 470 14.29 218 6.63 1 689 20.94 22.01968 375 11.13 438 13.00 214 6.35 4 656 19.47 21.01969 329 9.30 374 10.57 199 5.62 – 573 16.19 19.01970 369 10.01 416 11.29 193 5.24 2 611 16.58 19.01971 409 11.74 450 12.91 185 5.31 – 635 18.22 17.51972 322 9.32 373 10.79 195 5.64 1 569 16.46 17.01973 317 9.23 363 10.57 185 5.39 3 551 16.04 16.01974 310 8.74 348 9.82 196 5.53 2 546 15.40 15.01975 278 7.66 321 8.85 169 4.66 1 491 13.53 14.31976 292 8.15 324 9.04 152 4.24 2 478 13.33 13.51977 246 6.70 276 7.52 200 5.45 – 476 12.97 12.41978 245 6.58 286 7.68 178 4.78 – 464 12.46 12.01979 196 5.10 239 6.22 167 4.35 – 406 10.56 10.91980 188 4.69 235 5.86 186 4.64 – 421 10.50 10.41981 232 5.57 259 6.21 140 3.36 3 402 9.65 9.61982 217 5.05 251 5.85 150 3.49 – 401 9.34 9.11983 193 4.48 212 4.92 145 3.37 2 359 8.34 8.51984 184 4.18 205 4.65 150 3.41 1 356 8.08 8.11985 180 4.19 198 4.61 133 3.09 – 331 7.70 8.01986 164 3.93 195 4.67 147 3.52 – 342 8.20 7.91987 159 3.82 195 4.69 160 3.85 – 355 8.53 7.31988 191 4.46 220 5.13 136 3.17 – 356 8.31 7.21989 186 4.27 215 4.93 138 3.17 – 353 8.10 7.31990 183 4.04 221 4.87 112 2.47 – 333 7.34 6.81991 140 3.09 164 3.62 126 2.78 – 290 6.40 6.41992 153 3.32 173 3.76 104 2.26 – 277 6.02 6.11993 121 2.63 139 3.02 110 2.39 – 249 5.42 6.31994 175 3.74 198 4.23 90 1.92 – 288 6.15 6.31995 158 3.38 181 3.88 94 2.01 – 275 5.89 6.11996 133 2.89 160 3.48 68 1.48 – 228 4.96 5.61997 125 2.82 146 3.29 56 1.26 – 202 4.55 5.51998 94 2.19 114 2.66 60 1.40 – 174 4.06 5.31999 87 2.08 108 2.59 51 1.22 – 159 3.81 5.32000 84 2.07 105 2.59 45 1.11 – 150 3.70 5.32001 103 2.55 126 3.12 36 0.89 – 162 4.01 5.22002 98 2.46 125 3.13 54 1.35 – 179 4.49 5.42003 104 2.58 120 2.98 47 1.17 – 167 4.14 5.32004 108 2.68 122 3.02 49 1.21 – 171 4.24 *2005 104 2.56 124 3.05 50 1.23 – 174 4.28 *
APPENDIX 6 (CONT’D)

BRITISH COLUMBIA PERINATAL HEALTH PROGRAM – PERINATAL DATABASE REGISTRY ANNUAL REPORT 2007 53
APPENDICES AND REFERENCES
Total Fertility Rates – British Columbia, 1950 to 2005
Note: Total Fertility Rate – Sum of age-specific fertility rates multiplied by the number of years in each age group (see glossary for definition).Rates per 1,000 women age 15 to 44.Non-residents are excluded.
Total Year Fertility Rate Live Births
1950 3,074 27,1161951 3,201 28,0771952 3,327 29,8271953 3,542 31,7461954 3,656 32,946 1955 3,748 34,138 1956 3,875 36,241 1957 3,921 38,744 1958 3,900 39,577 1959 3,958 39,971 1960 3,949 40,116 1961 3,785 38,591 1962 3,709 38,128 1963 3,564 37,478 1964 3,284 35,897 1965 2,710 33,669 1966 2,442 32,502 1967 2,307 32,899 1968 2,228 33,687 1969 2,223 35,383 1970 2,185 36,861 1971 1,994 34,852 1972 1,890 34,563 1973 1,751 34,352 1974 1,735 35,450 1975 1,682 36,281 1976 1,618 35,848 1977 1,636 36,6911978 1,620 37,2311979 1,721 38,432
Total Year Fertility Rate Live Births
1980 1,716 40,1041981 1,718 41,6791982 1,749 42,9421983 1,751 43,0471984 1,781 44,0401985 1,642 42,9891986 1,603 41,7141987 1,608 41,6111988 1,640 42,8601989 1,645 43,5891990 1,682 45,3471991 1,665 45,3461992 1,661 46,0301993 1,638 45,9561994 1,642 46,8371995 1,609 46,7011996 1,545 45,9601997 1,480 44,4021998 1,447 42,8711999 1,421 41,7482000 1,389 40,4972001 1,386 40,3932002 1,368 39,9052003 1,384 40,3052004 1,380 40,3392005 1,383 40,653
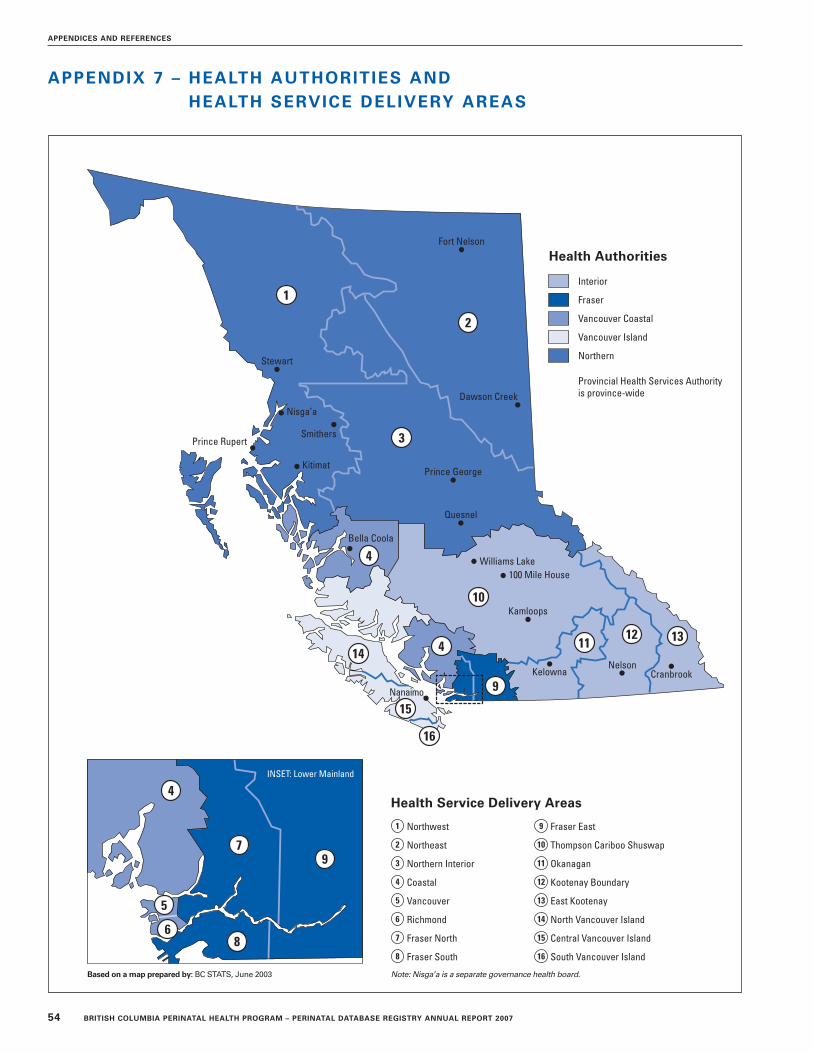
54 BRITISH COLUMBIA PERINATAL HEALTH PROGRAM – PERINATAL DATABASE REGISTRY ANNUAL REPORT 2007
APPENDICES AND REFERENCES
APPENDIX 7 – HEALTH AUTHORITIES AND HEALTH SERVICE DELIVERY AREAS
1
2
3
4
414
15
16
10
131211
Fort Nelson
Dawson Creek
Prince George
Kamloops
NelsonKelowna
Quesnel
Williams Lake100 Mile House
Stewart
Nisga’a
SmithersPrince Rupert
Kitimat
Bella Coola
Health Service Delivery Areas
Cranbrook
Nanaimo
Northwest
Northeast
Northern Interior
Coastal
Vancouver
Richmond
Fraser North
Fraser South
Health Authorities
Interior
Fraser
Vancouver Coastal
Vancouver Island
Northern
Note: Nisga’a is a separate governance health board.
Fraser East
Thompson Cariboo Shuswap
Okanagan
Kootenay Boundary
East Kootenay
North Vancouver Island
Central Vancouver Island
South Vancouver Island
INSET: Lower Mainland
Provincial Health Services Authorityis province-wide
Based on a map prepared by: BC STATS, June 2003
6
5
4
8
9
9
1
2
3
7
4
5
6
7
8
9
10
11
12
13
14
15
16

BRITISH COLUMBIA PERINATAL HEALTH PROGRAM – PERINATAL DATABASE REGISTRY ANNUAL REPORT 2007 55
APPENDICES AND REFERENCES
ProvincialAlberta Perinatal Health Program:
http://www.aphp.ca/
BC Ministry of Health Services: http://www.gov.bc.ca/health/
BC Vital Statistics Agency: http://www.vs.gov.bc.ca/stats
Niday Perinatal Database (Eastern Ontario): http://www.pppeso.on.ca/
Office of the Provincial Health Officer: http://www.healthservices.gov.bc.ca/pho/
PEI Reproductive Care Perinatal Database Report InfoPEI: PEI Reproductive Care Program
Reproductive Care Program of Nova Scotia: http://rcp.nshealth.ca/
NationalBreastfeeding Committee for Canada:
http://www.breastfeedingcanada.ca/
Canadian Institute for Health Information: http:://http://www.cihi.ca/
Canadian Institute of Child Health: http://www.cich.ca
Canadian Paediatric Society: http://www.cps.ca/english/
Canadian Perinatal Surveillance System: http://www.phac-aspc.gc.ca/rhs-ssg/
Canadian Public Health Association: http://www.cpha.ca/
Canadian Women’s Health Network: http://www.cwhn.ca
Health Canada: http://www.hc-sc.gc.ca/
Public Health Agency of Canada: http://www.publichealth.gc.ca
Statistics Canada: http://www.statcan.gc.ca/
The Society of Obstetricians and Gynaecologists of Canada: http://sogc.medical.org/
Vital Statistics (Can): http://www.statcan.ca/
InternationalAmerican Academy of Pediatrics:
http://www.aap.org/
Association of Women’s Health, Obstetric and NeonatalNurses (AWHONN): http://www.awhonn.org/
Medline Plus – Health Information: http://www.medlineplus.gov/
National Institute of Child Health & Human Development(US): http://www.nichd.nih.gov/
National Perinatal Association (US): http://www.nationalperinatal.org/
National Perinatal Epidemiology Unit (NPEU): http://www.npeu.ox.ac.uk
The Academy of Breastfeeding Medicine: http://www.bfmed.org/
The Cochrane Library: http://www.nicsl.com.au/cochrane/
Vermont Oxford Network: http://www.vtoxford.org
World Health Organization (WHO): http://www.who.int
National Centre for Health Statistics (NCHS) Data 2010…theHealthy People 2010 Database:http://www.cdc.gov/nchs
APPENDIX 8 – OTHER RELEVANT SOURCES OF INFORMATION
Below is a list of sources and web sites where other relevant information on perinatal health information and statistics at theprovincial, national and international level can be located.

56 BRITISH COLUMBIA PERINATAL HEALTH PROGRAM – PERINATAL DATABASE REGISTRY ANNUAL REPORT 2007
APPENDICES AND REFERENCES
APPENDIX 9 – BRITISH COLUMBIA PERINATAL DATABASE REGISTRYINFORMATION REQUEST FORM
The website for the BC Perinatal Database Registry Information For Request form is http://www.bcrcp.ca/

BRITISH COLUMBIA PERINATAL HEALTH PROGRAM – PERINATAL DATABASE REGISTRY ANNUAL REPORT 2007 57(Only singleton deliveries and births included)
APPENDICES AND REFERENCES
2002/20032003/2004
2004/20052005/2006
2006/2007O
bste-Fam
ilyO
bste-Fam
ilyO
bste-Fam
ilyO
bste-Fam
ilyO
bste-Fam
ilytrician
PhysicianM
idwife
Nurse
tricianPhysician
Midw
ifeN
ursetrician
PhysicianM
idwife
Nurse
tricianPhysician
Midw
ifeN
ursetrician
PhysicianM
idwife
Nurse
HA
HS
DA
#%
#%
#%
#%
#%
#%
#%
#%
#%
#%
#%
#%
#%
#%
#%
#%
#%
#%
#%
#%
FHAFE
80931.3
159561.7
321.2
1365.3
88133.5
157560.0
572.2
1074.1
89134.3
149057.4
762.9
1244.8
82532.2
150958.8
903.5
1204.7
78630.1
156660.0
682.6
1776.8
FN2260
46.62286
47.2134
2.8144
3.02293
48.52137
45.2136
2.9148
3.12314
49.12114
44.9123
2.6130
2.82281
48.22115
44.7124
2.6120
2.52587
52.22011
40.5159
3.2128
2.6FS
363164.3
155627.6
881.6
3596.4
377166.5
145325.6
941.7
3375.9
374965.0
163028.3
1041.8
2664.6
338661.2
172231.1
1232.2
2885.2
361961.0
185831.3
1362.3
3015.1
Total6700
51.25437
41.6254
1.9639
4.96945
53.35165
39.7287
2.2592
4.56954
53.25234
40.0303
2.3520
4.06492
50.65346
41.7337
2.6528
4.16992
51.85435
40.2363
2.7606
4.5
IHAEK
9515.5
44572.5
142.3
315.0
13522.7
38564.6
335.5
111.8
18930.9
32052.4
559.0
142.3
15725.2
34956.1
6610.6
152.4
19229.1
34151.7
7811.8
192.9
KB190
36.9277
53.835
6.811
2.1110
22.7331
68.237
7.64
0.8111
21.3346
66.362
11.91
0.2134
25.0340
63.655
10.32
0.4102
18.8365
67.274
13.61
0.2OK
94739.6
135356.5
261.1
642.7
100741.8
130854.3
461.9
441.8
103142.2
128752.6
542.2
612.5
106742.3
138054.7
341.3
351.4
123445.9
134950.2
451.7
501.9
TCS471
27.01155
66.30
0.045
2.6609
34.11046
58.62
0.170
3.9621
33.81053
57.40
0.086
4.7583
32.31056
58.66
0.378
4.3613
33.21070
57.90
0.080
4.3
Total1703
32.33230
61.375
1.4151
2.91861
35.33070
58.2118
2.2129
2.41952
36.13006
55.5171
3.2162
3.01941
35.43125
57.0161
2.9130
2.42141
37.33125
54.5197
3.4150
2.6
NHA
NE
17319.4
69978.5
00.0
161.8
9110.6
72684.2
00.0
394.5
606.8
80190.2
10.1
242.7
9410.7
75486.1
00.0
212.4
18718.9
76877.7
00.0
292.9
NI
36225.0
98968.3
322.2
563.9
38326.1
96665.8
392.7
714.8
38826.6
99568.3
342.3
342.3
39024.9
107968.8
583.7
332.1
39426.3
99466.3
583.9
382.5
NW
28730.5
61865.7
00.0
333.5
26930.0
59065.8
00.0
303.3
30935.6
54162.3
20.2
141.6
31738.8
46657.0
10.1
293.5
29837.0
48059.6
10.1
183.6
Total822
25.12306
70.332
1.0105
3.2743
23.02282
70.739
1.2140
4.3757
23.52337
72.737
1.272
2.2801
24.62299
70.559
1.883
2.5879
26.72242
68.159
1.885
2.6
VCHACST
65834.3
109657.1
573.0
703.6
66434.7
104254.5
1025.3
542.8
63134.0
104056.0
904.8
452.4
61635.1
93453.2
1015.7
472.7
71637.6
97951.4
934.9
542.8
RICH696
51.8588
43.81
0.154
4.0655
56.9453
39.30
0.040
3.5654
57.1433
37.83
0.351
4.5683
59.4384
33.411
1.063
5.5732
62.5369
31.518
1.548
4.1VAN
C1179
71.0381
23.073
4.422
1.31235
72.9337
19.9109
6.47
0.41205
71.1355
20.9118
7.09
0.51189
71.0358
21.4113
6.89
0.51272
75.1312
18.489
5.314
0.8
Total2533
51.52065
41.9131
2.7146
3.02554
53.71832
38.5211
4.4101
2.12490
53.01828
38.9211
4.5105
2.22488
54.31676
36.6225
4.9119
2.62720
57.01660
34.8200
4.2116
2.4
VIHACVI
94655.4
65238.2
613.6
412.4
102958.9
59233.9
643.7
553.1
99355.5
63535.5
1176.5
392.2
101755.2
65135.3
1216.6
472.5
104854.8
68035.6
1326.9
462.4
NVI
42445.5
39542.4
9410.1
171.8
45851.5
32036.0
9410.6
121.3
53458.2
27730.2
909.8
131.4
46851.3
31334.3
11812.9
111.2
50053.6
27529.5
14916.0
70.8
SVI1025
37.81460
53.8178
6.645
1.71049
37.21480
52.5232
8.247
1.71128
40.91327
48.2250
9.141
1.51175
41.61351
47.9253
9.037
1.31193
42.51320
47.1254
9.126
0.9
Total2395
44.72507
46.8333
6.2103
1.92536
46.52392
43.9390
7.2114
2.12655
48.62239
41.0457
8.493
1.72660
47.72315
41.5492
8.895
1.72741
48.52275
40.3535
9.579
1.4
PHSA*4710
69.71798
26.6130
1.981
1.24943
71.21738
25.0150
2.275
1.14924
70.91730
24.9163
2.394
1.45174
70.41789
24.3282
3.868
0.94919
67.61840
25.3387
5.392
1.3
HB0
0.00
0.0489
99.20
0.00
0.00
0.0511
99.20
0.00
0.00
0.0580
96.50
0.00
0.00
0.0596
97.20
0.00
0.00
0.0633
97.50
0.0
BritishColum
bia18863
48.217343
44.31444
3.71225
3.119582
50.016479
42.01706
4.41151
2.919732
50.116374
41.61922
4.91046
2.719556
49.316550
41.72152
5.41023
2.620392
49.916577
41.62374
5.81128
2.8
Care
Pro
vider
Deliverin
gB
aby
by
Place
of
Delivery
for
Health
Service
Delivery
Areas,
Health
Au
tho
ritiesan
dP
rovin
ce,2002/2003to
2006/2007
*PH
SA
:Refers
toB
CW
om
en’s
Ho
spitalp
atients
on
lyN
ote:P
leaserefer
tob
ackflap
for
legen
do
fth
eH
ealthA
uth
orities
and
Health
Service
Delivery
Areas
Detailed
data
tables
areavailab
lein
the
An
nu
alRep
ort
2007sectio
no
fth
eB
CP
HP
web
site(w
ww
.bcp
hp
.ca)
APPENDIX 10 –DATA TABLES
DATA TABLE 4A

58 BRITISH COLUMBIA PERINATAL HEALTH PROGRAM – PERINATAL DATABASE REGISTRY ANNUAL REPORT 2007(Only singleton deliveries and births included)
APPENDICES AND REFERENCES
2002/20032003/2004
2004/20052005/2006
2006/2007To
talTeenTo
talTeenTo
talTeenTo
talTeenTo
talTeen<–
1718-19
Mo
thers
<–17
18-19M
oth
ers<–
1718-19
Mo
thers
<–17
18-19M
oth
ers<–
1718-19
Mo
thers
HA
HS
DA
#%
#%
#%
#%
#%
#%
#%
#%
#%
#%
#%
#%
#%
#%
#%
FHA
FE49
1.7110
3.8159
5.446
1.592
3.1138
4.657
1.998
3.3155
5.243
1.584
2.8127
4.338
1.2104
3.4142
4.6FN
280.5
891.6
1172.2
250.5
981.8
1232.3
280.5
721.3
1001.8
300.6
571.1
871.6
270.5
541.0
811.5
FS58
0.8137
2.0195
2.947
0.7128
1.9175
2.638
0.5114
1.6152
2.239
0.6111
1.6150
2.258
0.8120
1.7178
2.5
Total135
0.9336
2.2471
3.1118
0.8318
2.1436
2.9123
0.8284
1.9407
2.7112
0.7252
1.7364
2.4123
0.8278
1.8401
2.6
IHA
EK9
1.439
6.048
7.49
1.532
5.241
6.714
2.232
5.146
7.34
0.628
4.432
5.015
2.227
3.942
6.1KB
71.3
173.0
244.3
40.7
112.0
152.8
40.7
162.8
203.5
50.8
183.0
233.9
71.2
142.4
213.6
OK42
1.867
2.8109
4.629
1.284
3.5113
4.732
1.383
3.4115
4.743
1.767
2.7110
4.435
1.381
3.0116
4.3TCS
422.4
915.2
1337.7
281.6
704.0
985.5
392.2
713.9
1106.1
291.6
844.6
1136.2
361.9
844.5
1206.4
Total100
1.9214
4.0314
5.970
1.3197
3.7267
5.089
1.6202
3.7291
5.381
1.5197
3.5278
5.093
1.6206
3.5257
4.4
NH
AN
E17
2.047
5.564
7.427
3.156
6.583
9.723
2.635
4.058
6.617
2.049
5.666
7.619
1.972
7.491
9.3N
I44
2.972
4.8116
7.830
2.077
5.1107
7.135
2.379
5.3114
7.621
1.365
4.186
5.534
2.291
6.0125
8.3N
W35
3.563
6.498
9.925
2.763
6.988
9.638
4.357
6.495
10.729
3.453
6.282
9.632
3.864
7.696
11.5
Total96
2.9182
5.4278
8.382
2.5196
6.0278
8.596
2.9171
5.2267
8.267
2.0167
5.1234
7.185
2.6227
6.8312
9.4
VCHA
CST26
1.142
1.968
3.015
0.743
1.958
2.514
0.643
1.957
2.516
0.740
1.956
2.622
1.039
1.861
2.8RICH
40.3
140.9
181.2
60.4
80.6
141.0
20.1
161.1
181.2
50.3
100.7
151.0
40.3
100.6
140.9
VANC
280.5
581.0
861.5
220.4
530.9
751.3
300.5
430.8
731.3
240.4
510.9
751.3
240.4
611.0
851.4
Total58
0.6114
1.2172
1.843
0.5104
1.1147
1.646
0.5102
1.1148
1.645
0.5101
1.1146
1.550
0.5110
1.1160
1.6
VIHA
CVI42
2.2107
5.7149
7.939
2.182
4.3121
6.452
2.775
3.9127
6.636
1.894
4.6130
6.454
2.690
4.3144
6.9N
VI25
2.551
5.176
7.627
2.952
5.679
8.528
2.962
6.490
9.335
3.731
3.366
7.016
1.755
5.771
7.4SVI
281.1
692.6
973.7
301.1
662.4
963.5
260.9
622.3
883.2
260.9
692.5
953.4
180.7
732.6
913.3
Total95
1.7227
4.1322
5.896
1.7200
3.6296
5.3106
1.9199
3.5305
5.497
1.7194
3.4291
5.088
1.5218
3.8306
5.3
BC
UN
SPEC5
1.910
3.815
5.74
1.64
1.68
3.14
1.810
4.414
6.21
0.67
3.98
4.45
1.914
5.219
7.1
NO
NRES
10.7
85.7
96.4
00.0
32.2
32.2
00.0
75.4
75.4
10.7
42.7
53.4
00.0
53.3
53.3
British
Columbia
4901.3
10912.8
15814.0
4131.1
10222.6
14353.7
4641.2
9752.5
14393.7
4041.0
9222.3
13263.3
4441.1
10582.6
14603.6
TeenB
irths
by
Place
of
Resid
ence
for
Health
Service
Delivery
Areas,H
ealthA
uth
orities
and
Pro
vince,
2002/2003to
2006/2007
No
te:Please
referto
back
flapfo
rleg
end
of
the
Health
Au
tho
ritiesan
dH
ealthS
erviceD
eliveryA
reasD
etailedd
atatab
lesare
available
inth
eA
nn
ualR
epo
rt2007
section
of
the
BC
PH
Pw
ebsite
(ww
w.b
cph
p.ca)
DATA TABLE 5A
APPENDIX 10 – DATA TABLES (CONT’D)

BRITISH COLUMBIA PERINATAL HEALTH PROGRAM – PERINATAL DATABASE REGISTRY ANNUAL REPORT 2007 59(Only singleton deliveries and births included)
APPENDICES AND REFERENCES
2002/20032003/2004
2004/20052005/2006
2006/2007
YesN
oYes
No
YesN
oYes
No
YesN
o
HA
HS
DA
#%
#%
#%
#%
#%
#%
#%
#%
#%
#%
FHA
FE451
15.42478
84.6419
14.02564
86.0452
15.12541
84.9385
13.02577
87.0429
13.82672
86.2FN
4327.9
500992.1
4237.8
503292.2
4107.6
499692.4
3135.9
503694.1
3386.1
517893.9
FS669
9.86171
90.2586
8.66192
91.4611
8.86332
91.2556
8.16331
91.9635
9.06459
91.0
Total1552
10.213658
89.81428
9.413788
90.61473
9.613869
90.41254
8.313944
91.71402
8.914309
91.1
IHA
EK141
21.8505
78.2104
17.0506
83.0121
19.3506
80.7103
16.2534
83.8130
18.8563
81.2KB
7313.1
48586.9
8014.7
46485.3
9115.9
48384.1
9516.0
49884.0
7012.0
51388.0
OK394
16.51995
83.5348
14.62039
85.4383
15.52082
84.5339
13.52180
86.5421
15.62276
84.4TCS
37321.5
136178.5
31918.0
145182.0
31417.3
149982.7
34018.8
147281.2
33718.1
152881.9
Total981
18.44346
81.6851
16.04460
84.0909
16.64570
83.4877
15.84684
84.2958
16.44880
83.6
NH
AN
E167
19.4695
80.6180
21.0679
79.0168
19.0715
81.0173
19.9698
80.1192
19.6787
80.4N
I283
19.01209
81.0304
20.11212
79.9300
20.11191
79.9306
19.41268
80.6312
20.61201
79.4N
W167
16.9819
83.1162
17.7752
82.3137
15.4753
84.6117
13.6741
86.4119
14.2719
85.8
Total617
18.52723
81.5646
19.62643
80.4605
18.52659
81.5596
18.02707
82.0623
18.72707
81.3
VCHA
CST177
7.82084
92.2138
6.02151
94.0147
6.52103
93.5146
6.82010
93.2150
6.82049
93.2RICH
644.3
142595.7
574.0
136796.0
322.1
149197.9
503.3
145696.7
473.0
152397.0
VANC
2504.5
536295.5
2294.0
544896.0
2234.0
533796.0
2203.7
565496.3
1953.2
580796.8
Total491
5.28871
94.8424
4.58966
95.5402
4.38931
95.7416
4.49120
95.6392
4.09379
96.0
VIHA
CVI324
17.21556
82.8304
16.11589
83.9326
16.91601
83.1340
16.61704
83.4368
17.61718
82.4N
VI159
15.9840
84.1157
16.9773
83.1152
15.7814
84.3167
17.8770
82.2171
17.8787
82.2SVI
37214.2
225585.8
39814.3
238485.7
41715.2
232584.8
41514.9
236985.1
40014.5
236785.5
T otal855
15.54651
84.5859
15.34746
84.7895
15.94740
84.1922
16.04843
84.0939
16.24872
83.8
BC
UN
SPEC35
13.3229
86.741
16.0215
84.040
17.8185
82.228
15.5153
84.552
19.5215
80.5
NO
NRES
149.9
12790.1
96.7
12693.3
2116.3
10883.7
2315.5
12584.5
1711.3
13388.7
British
Columbia
454511.6
3460588.4
425810.9
3494489.1
434511.0
3506289.0
411610.4
3557689.6
438310.7
3649589.3
No
te:Please
referto
back
flapfo
rleg
end
of
the
Health
Au
tho
ritiesan
dH
ealthS
erviceD
eliveryA
reasD
etailedd
atatab
lesare
available
inth
eA
nn
ualR
epo
rt2007
section
of
the
BC
PH
Pw
ebsite
(ww
w.b
cph
p.ca)
Matern
alSm
okin
gD
urin
gP
regn
ancy
by
Place
of
Resid
ence
for
Health
Service
Delivery
Areas,
Health
Au
tho
ritiesan
dP
rovin
ce,2002/2003to
2006/2007DATA TABLE 6A

60 BRITISH COLUMBIA PERINATAL HEALTH PROGRAM – PERINATAL DATABASE REGISTRY ANNUAL REPORT 2007(Only singleton deliveries and births included)
APPENDICES AND REFERENCES
APPENDIX 10 – DATA TABLES (CONT’D)
Ind
uctio
no
fLab
ou
rb
yP
laceo
fD
eliveryfo
rH
ealthS
erviceD
eliveryA
reas,Health
Au
tho
ritiesan
dP
rovin
ce,2002/2003
to2006/2007
2002/20032003/2004
2004/20052005/2006
2006/2007Yes
No
Total
YesN
oTo
talYes
No
Total
YesN
oTo
talYes
No
Total
HA
HS
DA
#%
#%
#%
#%
#%
#%
#%
#%
#%
#%
#%
#%
#%
#%
#%
FHA
FE632
24.51951
75.52583
100.0629
23.91998
76.12627
100.0604
23.31992
76.72596
100.0572
22.31993
77.72565
100.0560
21.52050
78.52610
100.0FN
113123.3
371576.7
4846100.0
121025.6
351874.4
4728100.0
108323.0
363077.0
4713100.0
116424.6
356475.4
4728100.0
130026.2
366073.8
4960100.0
FS1369
24.24278
75.85647
100.01312
23.14358
76.95670
100.01238
21.54531
78.55769
100.01292
23.34243
76.75535
100.01302
21.94634
78.15936
100.0
Total3132
24.09944
76.013076
100.03151
24.29874
75.813025
100.02925
22.410153
77.613078
100.03028
23.69800
76.412828
100.03162
23.410344
76.613506
100.0
IHA
EK124
20.2490
79.8614
100.0114
19.1482
80.9596
100.0114
18.7497
81.3611
100.0135
21.7487
78.3622
100.0163
24.7496
75.3659
100.0KB
13025.2
38574.8
515100.0
12124.9
36475.1
485100.0
12523.9
39776.1
522100.0
11721.9
41878.1
535100.0
14526.7
39873.3
543100.0
OK572
23.91822
76.12394
100.0626
26.01785
74.02411
100.0577
23.61869
76.42446
100.0519
20.62005
79.42524
100.0648
24.12038
75.92686
100.0TCS
34519.8
139880.2
1743100.0
36720.5
141979.5
1786100.0
34418.7
149181.3
1835100.0
37620.9
142779.1
1803100.0
44724.2
140075.8
1847100.0
Total1171
22.24095
77.85266
100.01228
23.34050
76.75278
100.01160
21.44254
78.65414
100.01147
20.94337
79.15484
100.01403
24.54332
75.55735
100.0
NH
AN
E186
20.9704
79.1890
100.0204
23.7658
76.3862
100.0163
18.4725
81.6888
100.0170
19.4706
80.6876
100.0206
20.9782
79.1988
100.0N
I273
18.91174
81.11447
100.0272
18.51196
81.51468
100.0248
17.01209
83.01457
100.0263
16.81305
83.21568
100.0271
18.11229
81.91500
100.0N
W224
23.8717
76.2941
100.0175
19.5721
80.5896
100.0177
20.4692
79.6869
100.0186
22.8631
77.2817
100.0177
22.0628
78.0805
100.0
Total683
20.82595
79.23278
100.0651
20.22575
79.83226
100.0588
18.32626
81.73214
100.0619
19.02642
81.03261
100.0654
19.92639
80.13293
100.0
VCHA
CST398
20.71522
79.31920
100.0338
17.71573
82.31911
100.0325
17.51531
82.51856
100.0338
19.21419
80.81757
100.0377
19.81527
80.21904
100.0RICH
23017.1
111382.9
1343100.0
21818.9
93481.1
1152100.0
20818.2
93781.8
1145100.0
22819.8
92180.2
1149100.0
21818.6
95381.4
1171100.0
VANC
35921.6
130178.4
1660100.0
31518.6
137981.4
1694100.0
30317.9
139282.1
1695100.0
34420.5
133079.5
1674100.0
37522.1
131977.9
1694100.0
Total987
20.03936
80.04923
100.0871
18.33886
81.74757
100.0836
17.83860
82.24696
100.0910
19.93670
80.14580
100.0970
20.33799
79.74769
100.0
VIHA
CVI393
23.01314
77.01707
100.0410
23.51337
76.51747
100.0393
22.01395
78.01788
100.0437
23.71407
76.31844
100.0467
24.41445
75.61912
100.0N
VI156
16.7776
83.3932
100.0180
20.2710
79.8890
100.0193
21.0724
79.0917
100.0197
21.6715
78.4912
100.0180
19.3753
80.7933
100.0SVI
74627.5
196872.5
2714100.0
67023.8
214776.2
2817100.0
63523.0
212077.0
2755100.0
65423.2
216876.8
2822100.0
63022.5
217577.5
2805100.0
T otal1295
24.24058
75.85353
100.01260
23.14194
76.95454
100.01221
22.44239
77.65460
100.01288
23.14290
76.95578
100.01277
22.64373
77.45650
100.0
PHSA
*1150
17.05611
83.06761
100.01147
16.55800
83.56947
100.01153
16.65793
83.46946
100.01315
17.96033
82.17348
100.01196
16.46080
83.67276
100.0
HB
163.2
47796.8
493100.0
173.3
49896.7
515100.0
101.7
58998.3
599100.0
152.4
59897.6
613100.0
71.1
64298.9
649100.0
British
Columbia
843421.5
3071678.5
39150100.0
832521.2
3087778.8
39202100.0
789320.0
3151480.0
39407100.0
832221.0
3137079.0
39692100.0
866921.2
3220978.8
40878100.0
*PH
SA
:Refers
toB
CW
om
en’s
Ho
spitalp
atients
on
lyN
ote:P
leaserefer
tob
ackflap
for
legen
do
fth
eH
ealthA
uth
orities
and
Health
Service
Delivery
Areas
DATA TABLE 7A

BRITISH COLUMBIA PERINATAL HEALTH PROGRAM – PERINATAL DATABASE REGISTRY ANNUAL REPORT 2007 61(Only singleton deliveries and births included)
APPENDICES AND REFERENCES
FetalSu
rveillance
Du
ring
Labo
ur
by
Place
of
Delivery
for
Health
Service
Delivery
Areas,
Health
Au
tho
ritiesan
dP
rovin
ce,2004/2005to
2006/2007
2004/20052005/2006
2006/2007EFM
&Interm
ittentEFM
&Interm
ittentEFM
&Interm
ittentInterm
ittentEFM
Auscultation
Not
Mom
sTotal
Intermittent
EFMA
uscultationN
otM
oms
TotalInterm
ittentEFM
Auscultation
Not
Mom
sTotal
Auscultation
Only
Only
Monitored
LabouredN
AM
oms
Auscultation
Only
Only
Monitored
LabouredN
AM
oms
Auscultation
Only
Only
Monitored
LabouredN
AM
oms
HA
HS
DA
#%
#%
#%
#%
#%
##
#%
#%
#%
#%
#%
##
#%
#%
#%
#%
#%
##
FHAFE
104446.2
57825.6
51222.6
1275.6
2261100.0
3352596
108248.0
45320.1
60927.0
1084.8
2252100.0
3132565
110148.1
35915.7
73031.9
994.3
2289100.0
3212610
FN1721
41.71859
45.0357
8.6193
4.74130
100.0583
47131711
41.51678
40.7493
12.0243
5.94125
100.0603
47281804
42.11576
36.8644
15.0256
6.04280
100.0680
4960FS
214643.1
149229.9
103520.8
3096.2
4982100.0
7875769
209644.2
126826.8
107022.6
3046.4
4738100.0
7975535
240646.9
128625.1
113622.1
3045.9
5132100.0
8045936
Total4911
43.23929
34.51904
16.7629
5.511373
100.01705
130784889
44.03399
30.62172
19.5655
5.911115
100.01713
128285311
45.43221
27.52510
21.5659
5.611701
100.01805
13506
IHAEK
17633.7
17834.1
14026.8
285.4
522100.0
89611
14928.7
16932.6
18034.7
214.0
519100.0
103622
18833.5
13223.5
20636.7
366.4
562100.0
97659
KB43
9.1252
53.571
15.1105
22.3471
100.051
522114
23.7173
36.0130
27.064
13.3481
100.054
535164
33.3137
27.8160
32.531
6.3492
100.051
543OK
89342.0
94444.4
1818.5
1075.0
2125100.0
3212446
101946.9
86439.7
2119.7
813.7
2175100.0
3492524
114049.2
84336.4
23510.1
984.2
2316100.0
3702686
TCS921
57.8307
19.3180
11.3186
11.71594
100.0241
1835888
57.3280
18.1170
11.0211
13.61549
100.0254
1803947
58.8310
19.3165
10.2188
11.71610
100.0237
1847
Total2033
43.11681
35.7572
12.1426
9.04712
100.0702
54142170
45.91486
31.5691
14.6377
8.04724
100.0760
54842439
49.01422
28.6766
15.4353
7.14980
100.0755
5735
NHA
NE
36546.2
34443.5
475.9
344.3
790100.0
98888
16321.2
54871.2
253.2
344.4
770100.0
106876
26530.8
35441.1
20123.3
414.8
861100.0
127988
NI
35227.5
72656.8
1169.1
846.6
1278100.0
1791457
39128.6
70551.6
17813.0
926.7
1366100.0
2021568
43232.7
58744.4
19514.8
1078.1
1321100.0
1791500
NW
27836.4
32041.9
13217.3
334.3
763100.0
106869
31744.2
23933.3
13618.9
263.6
718100.0
99817
32144.8
17824.8
19126.6
273.8
717100.0
88805
Total995
35.11390
49.1295
10.4151
5.32831
100.0383
3214871
30.51492
52.3339
11.9152
5.32854
100.0407
32611018
35.11119
38.6587
20.2175
6.02899
100.0394
3293
VCHACST
95259.4
28217.6
29118.1
794.9
1604100.0
2521856
87258.5
21814.6
31821.3
835.6
1491100.0
2661757
91757.4
24815.5
29618.5
1368.5
1597100.0
3071904
RICH609
61.0219
21.9132
13.239
3.9999
100.0146
1145536
55.0204
20.9198
20.336
3.7974
100.0175
1149509
49.4242
23.5225
21.854
5.21030
100.0141
1171VAN
C875
59.7349
23.8201
13.741
2.81466
100.0229
1695817
57.3354
24.8218
15.337
2.61426
100.0248
1674687
48.4525
37.0171
12.037
2.61420
100.0274
1694
Total2436
59.9850
20.9624
15.3159
3.94069
100.0627
46962225
57.2776
19.9734
18.9156
4.03891
100.0689
45802113
52.21015
25.1692
17.1227
5.64047
100.0722
4769
VIHACVI
38724.8
62540.0
46229.6
875.6
1561100.0
2271788
65741.7
39625.1
45628.9
684.3
1577100.0
2671844
65738.7
41724.6
47628.0
1478.7
1697100.0
2151912
NVI
25632.7
17822.7
27735.4
729.2
783100.0
134917
30738.2
16620.7
28335.2
475.9
803100.0
109912
31939.0
14918.2
30637.5
435.3
817100.0
116933
SVI1125
48.1525
22.4516
22.1173
7.42339
100.0416
27551304
55.3442
18.8487
20.7123
5.22356
100.0466
28221309
55.8356
15.2542
23.1140
6.02347
100.0458
2805
T otal1768
37.81328
28.41255
26.8332
7.14683
100.0777
54602268
47.91004
21.21226
25.9238
5.04736
100.0842
55782285
47.0922
19.01324
27.2330
6.84861
100.0789
5650
PHSA*2964
49.91589
26.81211
20.4172
2.95936
100.01010
69462929
47.01797
28.81282
20.6221
3.56229
100.01119
73482619
42.41708
27.61560
25.2297
4.86184
100.01092
7276
HB0
0.00
0.0557
93.042
7.0599
100.00
5992
0.31
0.2568
92.742
6.9613
100.00
6131
0.20
0.0608
93.740
6.2649
100.00
649
BritishColum
bia15107
44.210767
31.56418
18.81911
5.634203
100.05204
3940715354
44.99954
29.17012
20.51841
5.434161
100.05530
3969215786
44.79407
26.68047
22.82081
5.935321
100.05557
40878
*PH
SA
:Refers
toB
CW
om
en’s
Ho
spitalp
atients
on
lyN
ote:P
leaserefer
tob
ackflap
for
legen
do
fth
eH
ealthA
uth
orities
and
Health
Service
Delivery
Areas
EFM
:Electro
nic
FetalMo
nito
ring
NA
:No
tA
pp
licable
–m
oth
ern
ot
inlab
ou
r
DATA TABLE 8A
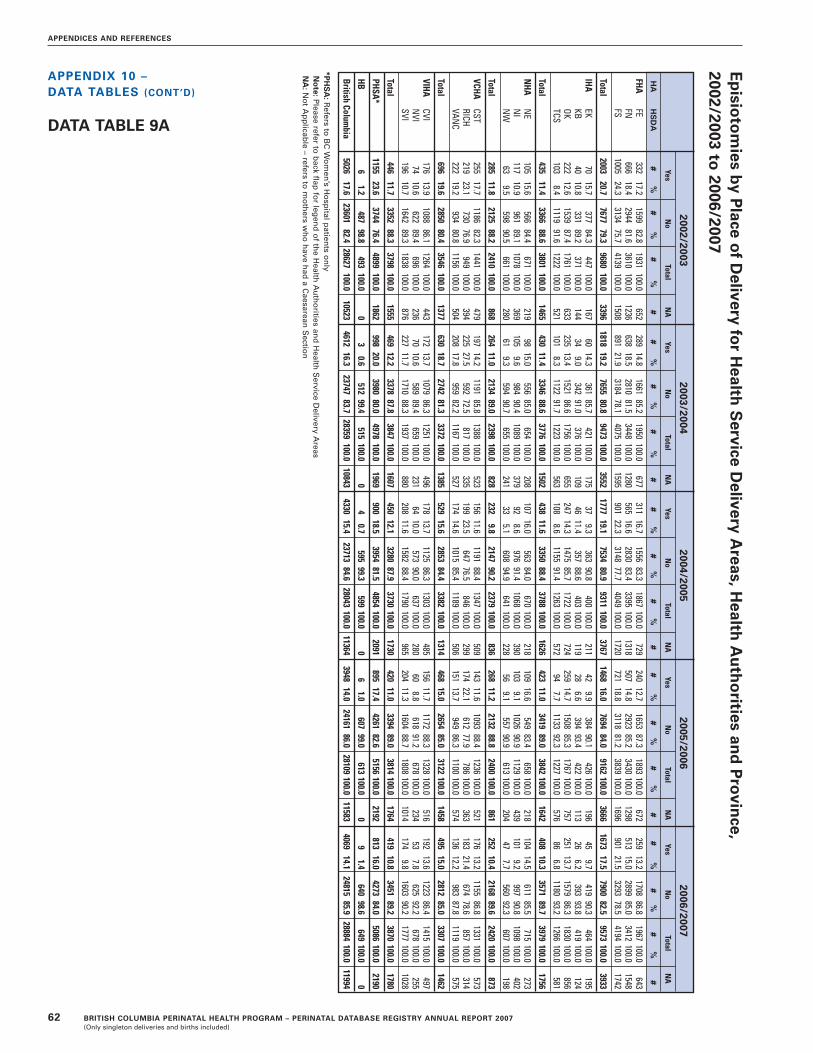
62 BRITISH COLUMBIA PERINATAL HEALTH PROGRAM – PERINATAL DATABASE REGISTRY ANNUAL REPORT 2007(Only singleton deliveries and births included)
APPENDICES AND REFERENCES
APPENDIX 10 – DATA TABLES (CONT’D)
2002/20032003/2004
2004/20052005/2006
2006/2007Yes
No
TotalN
AYes
No
TotalN
AYes
No
TotalN
AYes
No
TotalN
AYes
No
TotalN
A
HA
HS
DA
#%
#%
#%
##
%#
%#
%#
#%
#%
#%
##
%#
%#
%#
#%
#%
#%
#
FHAFE
33217.2
159982.8
1931100.0
652289
14.81661
85.21950
100.0677
31116.7
155683.3
1867100.0
729240
12.71653
87.31893
100.0672
25913.2
170886.8
1967100.0
643FN
66618.4
294481.6
3610100.0
1236638
18.52810
81.53448
100.01280
56516.6
283083.4
3395100.0
1318507
14.82923
85.23430
100.01298
51315.0
289985.0
3412100.0
1548FS
100524.3
313475.7
4139100.0
1508891
21.93184
78.14075
100.01595
90122.3
314877.7
4049100.0
1720721
18.83118
81.23839
100.01696
90121.5
329378.5
4194100.0
1742
Total2003
20.77677
79.39680
100.03396
181819.2
765580.8
9473100.0
35521777
19.17534
80.99311
100.03767
146816.0
769484.0
9162100.0
36661673
17.57900
82.59573
100.03933
IHAEK
7015.7
37784.3
447100.0
16760
14.3361
85.7421
100.0175
379.3
36390.8
400100.0
21142
9.9384
90.1426
100.0196
459.7
41990.3
464100.0
195KB
4010.8
33189.2
371100.0
14434
9.0342
91.0376
100.0109
4611.4
35788.6
403100.0
11928
6.6394
93.4422
100.0113
266.2
39393.8
419100.0
124OK
22212.6
153987.4
1761100.0
633235
13.41521
86.61756
100.0655
24714.3
147585.7
1722100.0
724259
14.71508
85.31767
100.0757
25113.7
157986.3
1830100.0
856TCS
1038.4
111991.6
1222100.0
521101
8.31122
91.71223
100.0563
1088.6
115591.4
1263100.0
57294
7.71133
92.31227
100.0576
866.8
118093.2
1266100.0
581
Total435
11.43366
88.63801
100.01465
43011.4
334688.6
3776100.0
1502438
11.63350
88.43788
100.01626
42311.0
341989.0
3842100.0
1642408
10.33571
89.73979
100.01756
NHA
NE
10515.6
56684.4
671100.0
21998
15.0556
85.0654
100.0208
10716.0
56384.0
670100.0
218109
16.6549
83.4658
100.0218
10414.5
61185.5
715100.0
273N
I117
10.9961
89.11078
100.0369
1059.6
98490.4
1089100.0
37992
8.6976
91.41068
100.0390
1039.1
102690.9
1129100.0
439101
9.2997
90.81098
100.0402
NW
639.5
59890.5
661100.0
28061
9.3594
90.7655
100.0241
335.1
60894.9
641100.0
22856
9.1557
90.9613
100.0204
477.7
56092.3
607100.0
198
Total285
11.82125
88.22410
100.0868
26411.0
213489.0
2398100.0
828232
9.82147
90.22379
100.0836
26811.2
213288.8
2400100.0
861252
10.42168
89.62420
100.0873
VCHACST
25517.7
118682.3
1441100.0
479197
14.21191
85.81388
100.0523
15611.6
119188.4
1347100.0
509143
11.61093
88.41236
100.0521
17613.2
115586.8
1331100.0
573RICH
21923.1
73076.9
949100.0
394225
27.5592
72.5817
100.0335
19923.5
64776.5
846100.0
299174
22.1612
77.9786
100.0363
18321.4
67478.6
857100.0
314VAN
C222
19.2934
80.81156
100.0504
20817.8
95982.2
1167100.0
527174
14.61015
85.41189
100.0506
15113.7
94986.3
1100100.0
574136
12.2983
87.81119
100.0575
Total696
19.62850
80.43546
100.01377
63018.7
274281.3
3372100.0
1385529
15.62853
84.43382
100.01314
46815.0
265485.0
3122100.0
1458495
15.02812
85.03307
100.01462
VIHACVI
17613.9
108886.1
1264100.0
443172
13.71079
86.31251
100.0496
17813.7
112586.3
1303100.0
485156
11.71172
88.31328
100.0516
19213.6
122386.4
1415100.0
497N
VI74
10.6622
89.4696
100.0236
7010.6
58989.4
659100.0
23164
10.0573
90.0637
100.0280
608.8
61891.2
678100.0
23453
7.8625
92.2678
100.0255
SVI196
10.71642
89.31838
100.0876
22711.7
171088.3
1937100.0
880208
11.61582
88.41790
100.0965
20411.3
160488.7
1808100.0
1014174
9.81603
90.21777
100.01028
Total446
11.73352
88.33798
100.01555
46912.2
337887.8
3847100.0
1607450
12.13280
87.93730
100.01730
42011.0
339489.0
3814100.0
1764419
10.83451
89.23870
100.01780
PHSA*1155
23.63744
76.44899
100.01862
99820.0
398080.0
4978100.0
1969900
18.53954
81.54854
100.02091
89517.4
426182.6
5156100.0
2192813
16.04273
84.05086
100.02190
HB6
1.2487
98.8493
100.00
30.6
51299.4
515100.0
04
0.7595
99.3599
100.00
61.0
60799.0
613100.0
09
1.4640
98.6649
100.00
BritishColum
bia5026
17.623601
82.428627
100.010523
461216.3
2374783.7
28359100.0
108434330
15.423713
84.628043
100.011364
394814.0
2416186.0
28109100.0
115834069
14.124815
85.928884
100.011994
Ep
isioto
mies
by
Place
of
Delivery
for
Health
Service
Delivery
Areas,H
ealthA
uth
orities
and
Pro
vince,
2002/2003to
2006/2007
*PH
SA
:Refers
toB
CW
om
en’s
Ho
spitalp
atients
on
lyN
ote:P
leaserefer
tob
ackflap
for
legen
do
fth
eH
ealthA
uth
orities
and
Health
Service
Delivery
Areas
NA
:No
tA
pp
licable
–refers
tom
oth
ersw
ho
have
had
aC
aesareanS
ection
DATA TABLE 9A

BRITISH COLUMBIA PERINATAL HEALTH PROGRAM – PERINATAL DATABASE REGISTRY ANNUAL REPORT 2007 63(Only singleton deliveries and births included)
APPENDICES AND REFERENCES
Po
stpartu
mLen
gth
of
Stay
(Vag
inalD
eliveries)b
yP
laceo
fD
eliveryfo
rH
ealthS
erviceD
eliveryA
reas,H
ealthA
uth
orities
and
Pro
vince,2002/2003
to2006/2007
2002/20032003/2004
2004/20052005/2006
2006/2007<48
Ho
urs
48-72H
ou
rs>72
Ho
urs
<48H
ou
rs48-72
Ho
urs
>72H
ou
rs<48
Ho
urs
48-72H
ou
rs>72
Ho
urs
<48H
ou
rs48-72
Ho
urs
>72H
ou
rs<48
Ho
urs
48-72H
ou
rs>72
Ho
urs
HA
HS
DA
#%
#%
#%
#%
#%
#%
#%
#%
#%
#%
#%
#%
#%
#%
#%
FHA
FE1492
78.3340
17.874
3.91555
80.1296
15.290
4.61591
85.7197
10.668
3.71598
85.3212
11.363
3.41673
85.8203
10.473
3.7FN
248369.1
88124.5
2316.4
238469.6
80723.6
2346.8
241071.3
77823.0
1915.7
243171.4
75822.3
2146.3
244572.2
72321.3
2196.5
FS3586
87.0448
10.987
2.13583
88.3397
9.879
1.93556
88.3383
9.587
2.23340
87.4401
10.580
2.13680
88.2410
9.882
2.0
Total7561
78.61669
17.3392
4.17522
79.81500
15.9403
4.37557
81.61358
14.7346
3.77369
81.01371
15.1357
3.97798
82.01336
14.1374
3.9
IHA
EK265
61.2118
27.350
11.5245
60.3112
27.649
12.1263
67.385
21.743
11.0286
69.996
23.527
6.6318
70.8102
22.729
6.5KB
16145.0
12133.8
7621.2
18751.1
11631.7
6317.2
19549.1
12230.7
8020.2
19347.2
12229.8
9423.0
18845.5
12430.0
10124.5
OK1152
65.8392
22.4208
11.91113
63.9396
22.7232
13.31102
64.4392
22.9216
12.61170
66.7368
21.0215
12.31203
66.1373
20.5243
13.4TCS
83169.0
26421.9
1099.1
85570.9
25321.0
988.1
83267.3
28523.0
1209.7
86272.0
23519.6
1008.4
89472.0
24319.6
1058.5
Total2409
64.3895
23.9443
11.82400
64.5877
23.6442
11.92392
64.0884
23.7459
12.32511
66.6821
21.8436
11.62603
66.4842
21.5478
12.2
NH
AN
E362
54.4200
30.0104
15.6350
54.1214
33.183
12.8400
60.6197
29.863
9.5407
63.1175
27.163
9.8456
64.4196
27.756
7.9N
I653
62.4297
28.497
9.3699
66.1263
24.996
9.1687
65.9258
24.798
9.4737
67.1287
26.175
6.8792
73.6214
19.970
6.5N
W347
53.5186
28.7115
17.7385
61.2163
25.981
12.9368
59.0169
27.187
13.9347
58.3151
25.497
16.3353
59.7139
23.599
16.8
Total1362
57.7683
28.9316
13.41434
61.4640
27.4260
11.11455
62.5624
26.8248
10.71491
63.7613
26.2235
10.01601
67.4549
23.1225
9.5
VCHA
CST868
61.3384
27.1163
11.5913
66.9317
23.2135
9.9842
63.1374
28.0118
8.8794
64.9303
24.8126
10.3903
69.0286
21.8120
9.2RICH
69373.3
22423.7
293.1
59673.4
19023.4
263.2
63375.2
17721.0
323.8
63080.6
13617.4
162.0
68980.5
13916.2
283.3
VANC
72763.1
30826.7
11710.2
76065.6
27323.6
12510.8
82369.9
25922.0
968.1
79773.3
22120.3
706.4
77770.1
24422.0
877.9
Total2288
65.1916
26.1309
8.82269
68.0780
23.4286
8.62298
68.5810
24.2246
7.32221
71.8660
21.3212
6.92369
72.4669
20.4235
7.2
VIHA
CVI718
57.9340
27.4182
14.7734
59.3285
23.0218
17.6774
60.2312
24.3199
15.5814
62.5313
24.0176
13.5971
69.4273
19.5155
11.1N
VI404
59.6187
27.687
12.8405
62.3150
23.195
14.6402
63.8164
26.064
10.2450
67.4140
21.078
11.7473
71.0135
20.358
8.7SVI
99454.5
56831.1
26314.4
108256.2
57229.7
27114.1
99155.8
53730.2
24814.0
104458.1
53629.8
21712.1
108261.5
46126.2
21712.3
T otal2116
56.51095
29.3532
14.22221
58.31007
26.4584
15.32167
58.71013
27.4511
13.82308
61.3989
26.2471
12.52526
66.0869
22.7430
11.2
PHSA
*2898
59.51363
28.0608
12.53038
61.41268
25.6641
13.03054
63.31179
24.4594
12.33431
66.91078
21.0622
12.13374
66.71043
20.6641
12.7
HB
00.0
00.0
00.0
00.0
00.0
00.0
00.0
00.0
00.0
00.0
00.0
00.0
00.0
00.0
00.0
British
Columbia
1863466.9
662123.8
26009.3
1888468.5
607222.0
26169.5
1892369.6
586821.6
24048.8
1933171.1
553220.3
23338.6
2027172.5
530819.0
23838.5
*PH
SA
:Refers
toB
CW
om
en’s
Ho
spitalp
atients
on
lyN
ote:P
leaserefer
tob
ackflap
for
legen
do
fth
eH
ealthA
uth
orities
and
Health
Service
Delivery
Areas
Detailed
data
tables
areavailab
lein
the
An
nu
alRep
ort
2007sectio
no
fth
eB
CP
HP
web
site(w
ww
.bcp
hp
.ca)
DATA TABLE 10A
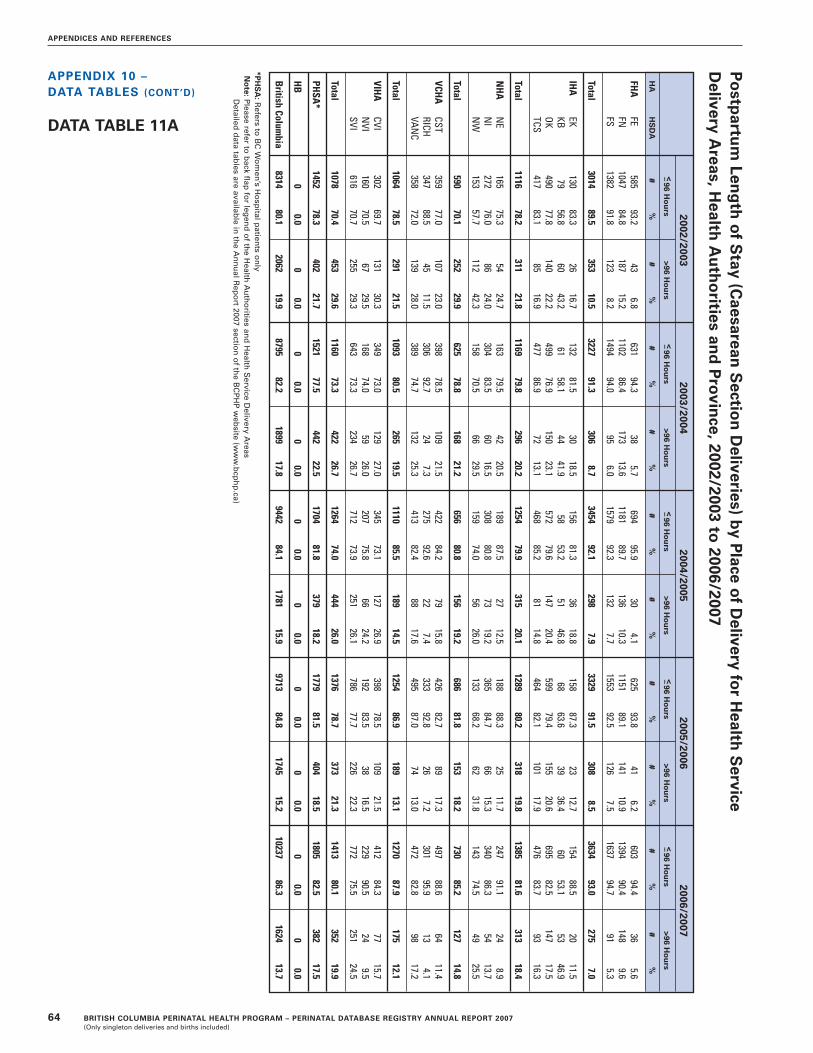
Po
stpartu
mLen
gth
of
Stay
(Caesarean
Sectio
nD
eliveries)b
yP
laceo
fD
eliveryfo
rH
ealthS
erviceD
eliveryA
reas,Health
Au
tho
ritiesan
dP
rovin
ce,2002/2003to
2006/2007
2002/20032003/2004
2004/20052005/2006
2006/2007<–
96H
ou
rs>96
Ho
urs
<–96
Ho
urs
>96H
ou
rs<–
96H
ou
rs>96
Ho
urs
<–96
Ho
urs
>96H
ou
rs<–
96H
ou
rs>96
Ho
urs
HA
HS
DA
#%
#%
#%
#%
#%
#%
#%
#%
#%
#%
FHA
FE585
93.243
6.8631
94.338
5.7694
95.930
4.1625
93.841
6.2603
94.436
5.6FN
104784.8
18715.2
110286.4
17313.6
118189.7
13610.3
115189.1
14110.9
139490.4
1489.6
FS1382
91.8123
8.21494
94.095
6.01579
92.3132
7.71553
92.5126
7.51637
94.791
5.3
Total3014
89.5353
10.53227
91.3306
8.73454
92.1298
7.93329
91.5308
8.53634
93.0275
7.0
IHA
EK130
83.326
16.7132
81.530
18.5156
81.336
18.8158
87.323
12.7154
88.520
11.5KB
7956.8
6043.2
6158.1
4441.9
5853.2
5146.8
6863.6
3936.4
6053.1
5346.9
OK490
77.8140
22.2499
76.9150
23.1572
79.6147
20.4599
79.4155
20.6695
82.5147
17.5TCS
41783.1
8516.9
47786.9
7213.1
46885.2
8114.8
46482.1
10117.9
47683.7
9316.3
Total1116
78.2311
21.81169
79.8296
20.21254
79.9315
20.11289
80.2318
19.81385
81.6313
18.4
NH
AN
E165
75.354
24.7163
79.542
20.5189
87.527
12.5188
88.325
11.7247
91.124
8.9N
I272
76.086
24.0304
83.560
16.5308
80.873
19.2365
84.766
15.3340
86.354
13.7N
W153
57.7112
42.3158
70.566
29.5159
74.056
26.0133
68.262
31.8143
74.549
25.5
Total590
70.1252
29.9625
78.8168
21.2656
80.8156
19.2686
81.8153
18.2730
85.2127
14.8
VCHA
CST359
77.0107
23.0398
78.5109
21.5422
84.279
15.8426
82.789
17.3497
88.664
11.4RICH
34788.5
4511.5
30692.7
247.3
27592.6
227.4
33392.8
267.2
30195.9
134.1
VANC
35872.0
13928.0
38974.7
13225.3
41382.4
8817.6
49587.0
7413.0
47282.8
9817.2
Total1064
78.5291
21.51093
80.5265
19.51110
85.5189
14.51254
86.9189
13.11270
87.9175
12.1
VIHA
CVI302
69.7131
30.3349
73.0129
27.0345
73.1127
26.9398
78.5109
21.5412
84.377
15.7N
VI160
70.567
29.5168
74.059
26.0207
75.866
24.2192
83.538
16.5229
90.524
9.5SVI
61670.7
25529.3
64373.3
23426.7
71273.9
25126.1
78677.7
22622.3
77275.5
25124.5
T otal1078
70.4453
29.61160
73.3422
26.71264
74.0444
26.01376
78.7373
21.31413
80.1352
19.9
PHSA
*1452
78.3402
21.71521
77.5442
22.51704
81.8379
18.21779
81.5404
18.51805
82.5382
17.5
HB
00.0
00.0
00.0
00.0
00.0
00.0
00.0
00.0
00.0
00.0
British
Columbia
831480.1
206219.9
879582.2
189917.8
944284.1
178115.9
971384.8
174515.2
1023786.3
162413.7
*PH
SA
:Refers
toB
CW
om
en’s
Ho
spitalp
atients
on
lyN
ote:P
leaserefer
tob
ackflap
for
legen
do
fth
eH
ealthA
uth
orities
and
Health
Service
Delivery
Areas
Detailed
data
tables
areavailab
lein
the
An
nu
alRep
ort
2007sectio
no
fth
eB
CP
HP
web
site(w
ww
.bcp
hp
.ca)
64 BRITISH COLUMBIA PERINATAL HEALTH PROGRAM – PERINATAL DATABASE REGISTRY ANNUAL REPORT 2007(Only singleton deliveries and births included)
APPENDICES AND REFERENCES
DATA TABLE 11A
APPENDIX 10 – DATA TABLES (CONT’D)

BRITISH COLUMBIA PERINATAL HEALTH PROGRAM – PERINATAL DATABASE REGISTRY ANNUAL REPORT 2007 65(Only singleton deliveries and births included)
APPENDICES AND REFERENCES
2002/20032003/2004
2004/20052005/2006
2006/2007N
ormal
Over-
Under-
Norm
alO
ver-U
nder-N
ormal
Over-
Under-
Norm
alO
ver-U
nder-N
ormal
Over-
Under-
Weight
weight
Obese
weight
Weight
weight
Obese
weight
Weight
weight
Obese
weight
Weight
weight
Obese
weight
Weight
weight
Obese
weight
HA
HS
DA
#%
#%
#%
#%
#%
#%
#%
#%
#%
#%
#%
#%
#%
#%
#%
#%
#%
#%
#%
#%
FHAFE
95559.5
33420.8
22013.7
955.9
64558.8
22120.1
17115.6
605.5
70657.5
26921.9
19616.0
574.6
72157.2
28822.8
19815.7
544.3
73054.0
32023.7
24017.8
614.5
FN2653
61.6837
19.4484
11.2334
7.82590
63.2802
19.6434
10.6275
6.72635
62.5845
20.0450
10.7287
6.82506
61.0845
20.6479
11.7280
6.82523
61.2861
20.9473
11.5267
6.5FS
358260.0
125221.0
62910.5
5108.5
340060.7
115920.7
60710.8
4337.7
357959.8
124720.8
70011.7
4627.7
360660.8
125421.1
66711.2
4056.8
357060.1
123320.8
69511.7
4457.5
Total7190
60.52423
20.41333
11.2939
7.96635
61.52182
20.21212
11.2768
7.16920
60.52361
20.71346
11.8806
7.06833
60.52387
21.11344
11.9739
6.56823
59.82414
21.11408
12.3773
6.8
IHAEK
20262.3
6419.8
4012.3
185.6
14661.1
4820.1
3414.2
114.6
14855.2
5821.6
5319.8
93.4
16858.1
5418.7
5117.6
165.5
20458.1
6618.8
5916.8
226.3
KB217
66.070
21.330
9.112
3.6205
64.361
19.133
10.320
6.3239
67.554
15.335
9.926
7.3244
70.559
17.128
8.115
4.3224
72.044
14.128
9.015
4.8OK
99061.7
33020.6
19011.8
945.9
91561.1
33422.3
17711.8
724.8
98160.2
34421.1
20412.5
1016.2
108362.1
35720.5
21512.3
895.1
121161.7
39820.3
24812.6
1075.4
TCS662
61.0215
19.8153
14.156
5.2525
57.3212
23.1129
14.151
5.6564
57.7214
21.9155
15.845
4.6480
52.4234
25.5156
17.046
5.0501
54.9202
22.1162
17.847
5.2
Total2071
62.0679
20.3413
12.4180
5.41791
60.2655
22.0373
12.5154
5.21932
59.8670
20.7447
13.8181
5.61975
59.9704
21.4450
13.7166
5.02140
60.5710
20.1497
14.0191
5.4
NHA
NE
26851.5
12624.2
10319.8
234.4
29754.2
13624.8
9016.4
254.6
27850.0
14526.1
11019.8
234.1
30956.3
12522.8
9717.7
183.3
28150.5
13824.8
11821.2
193.4
NI
50354.9
22424.4
14115.4
495.3
50653.3
22523.7
17518.4
444.6
48856.2
21124.3
13815.9
323.7
46550.1
25327.3
16317.6
475.1
42051.4
21025.7
15719.2
303.7
NW
13952.7
6424.2
5119.3
103.8
7846.4
3923.2
4426.2
74.2
12243.1
7727.2
7827.6
62.1
11845.9
7629.6
5621.8
72.7
12848.7
7729.3
5219.8
62.3
Total910
53.5414
24.3295
17.382
4.8881
52.9400
24.0309
18.576
4.6888
52.0433
25.4326
19.161
3.6892
51.4454
26.2316
18.272
4.2829
50.7425
26.0327
20.055
3.4
VCHACST
110569.0
28017.5
1096.8
1076.7
107570.1
27217.7
986.4
885.7
106670.2
27117.9
1067.0
754.9
101070.8
24016.8
1067.4
704.9
99568.5
27118.7
1198.2
684.7
RICH837
70.3177
14.965
5.5112
9.4777
66.8200
17.286
7.4100
8.6802
68.8186
16.060
5.2117
10.0741
65.0182
16.079
6.9138
12.1767
66.8193
16.877
6.7111
9.7VAN
C3017
71.6582
13.8194
4.6419
9.93005
73.2534
13.0197
4.8371
9.02882
72.0542
13.5193
4.8384
9.63129
71.7592
13.6242
5.5400
9.22914
72.1542
13.4181
4.5407
10.1
Total4959
70.81039
14.8368
5.3638
9.14857
71.41006
14.8381
5.6559
8.24750
71.1999
14.9359
5.4576
8.64880
70.41014
14.6427
6.2608
8.84676
70.41006
15.1377
5.7586
8.8
VIHACVI
67056.3
24420.5
20417.2
716.0
58455.6
24223.0
16415.6
605.7
62458.9
22721.4
16215.3
474.4
64356.5
26223.0
16714.7
665.8
64555.0
29525.2
18015.4
524.4
NVI
32857.2
12521.8
8815.4
325.6
29157.5
11021.7
8015.8
254.9
32060.0
11321.2
7514.1
254.7
31458.8
11421.3
8716.3
193.6
27757.3
11223.2
7214.9
224.6
SVI1423
61.0495
21.2300
12.9116
5.01467
60.1546
22.4318
13.0110
4.51526
60.2549
21.7337
13.3122
4.81578
60.3558
21.3361
13.8118
4.51545
59.5581
22.4356
13.7114
4.4
Total2421
59.1864
21.1592
14.5219
5.32342
58.6898
22.5562
14.1195
4.92470
59.8889
21.5574
13.9194
4.72535
59.1934
21.8615
14.3203
4.72467
58.0988
23.2608
14.3188
4.4
BCUN
SPEC137
67.228
13.724
11.815
7.4108
65.531
18.817
10.39
5.5100
63.329
18.419
12.010
6.382
64.623
18.114
11.08
6.3108
62.429
16.824
13.912
6.9
NON
RES57
67.113
15.39
10.66
7.137
62.78
13.68
13.66
10.242
62.712
17.95
7.58
11.946
70.810
15.44
6.25
7.746
67.67
10.37
10.38
11.8
BritishColum
bia17745
62.75460
19.33034
10.72079
7.316651
62.95180
19.62862
10.81767
6.717102
62.45393
19.73076
11.21836
6.717243
62.25526
19.93170
11.41801
6.517089
61.65579
20.13248
11.71813
6.5
Bo
dy
Mass
Ind
ex(B
MI)
by
Place
of
Resid
ence
for
Health
Service
Delivery
Areas,H
ealthA
uth
orities
and
Pro
vince,
2002/2003to
2006/2007
No
te:Un
derw
eigh
t=
BM
I<18.5
No
rmalW
eigh
t=
BM
Ibetw
een18.5
and
24.9O
verweig
ht
=B
MIb
etween
25.0an
d29.9
Ob
ese=
BM
I >–30.0
No
te:Please
referto
back
flapfo
rleg
end
of
the
Health
Au
tho
ritiesan
dH
ealthS
erviceD
eliveryA
reasN
ote:E
xclud
edfro
man
alysisis
the
“Un
classified”
BM
Igro
up
for
wh
icheith
erth
eh
eigh
tan
d/o
rw
eigh
tin
form
ation
ism
issing
.Detailed
data
tables
areavailab
lein
the
An
nu
alRep
ort
2007sectio
no
fth
eB
CP
HP
web
site(w
ww
.bcp
hp
.ca).
DATA TABLE 12A

Matern
alPo
stpartu
mR
eadm
ission
by
Place
of
Delivery
for
Health
Service
Delivery
Areas,
Health
Au
tho
ritiesan
dP
rovin
ce,2002/2003to
2005/2006
2002/20032003/2004
2004/20052005/2006
CS
Vag
inal
CS
Vag
inal
CS
Vag
inal
CS
Vag
inal
Read
mits
Total
Read
mits
Total
Read
mits
Total
Read
mits
Total
Read
mits
Total
Read
mits
Total
Read
mits
Total
Read
mits
Total
HA
HS
DA
#%
##
%#
#%
##
%#
#%
##
%#
#%
##
%#
FHA
FE11
1.7652
341.8
193117
2.5677
251.3
195017
2.3729
331.8
18679
1.3672
532.8
1893FN
211.7
123644
1.23610
292.3
128042
1.23448
272.0
131846
1.43395
342.6
129855
1.63430
FS32
2.11508
531.3
413926
1.61595
581.4
407527
1.61720
541.3
404941
2.41696
691.8
3841
Total64
1.93396
1311.4
968072
2.03552
1251.3
947371
1.93767
1331.4
931184
2.33666
1771.9
9164
IHA
EK2
1.2167
112.5
4475
2.9175
133.1
4214
1.9211
123.0
4007
3.6196
102.3
426KB
32.1
1443
0.8371
54.6
1098
2.1376
10.8
1197
1.7403
10.9
11311
2.6422
OK18
2.8633
311.8
176118
2.7655
372.1
175624
3.3724
422.4
172221
2.8757
382.1
1768TCS
122.3
52121
1.71222
152.7
56321
1.71223
183.1
57227
2.11263
254.3
57631
2.51228
Total35
2.41465
661.7
380143
2.91502
792.1
377647
2.91626
882.3
378854
3.31642
902.3
3844
NH
AN
E3
1.4219
172.5
6716
2.9208
142.1
6548
3.7218
101.5
6706
2.8218
192.9
658N
I12
3.3369
131.2
107814
3.7379
161.5
10895
1.3390
151.4
10689
2.1439
312.7
1129N
W7
2.5280
182.7
6614
1.7241
71.1
6555
2.2228
50.8
6414
2.0204
172.8
614
Total22
2.5868
482.0
241024
2.9828
371.5
239818
2.2836
301.3
237919
2.2861
672.8
2401
VCHA
CST4
0.8479
281.9
14416
1.1523
130.9
138811
2.2509
251.9
13477
1.3521
332.7
1237RICH
71.8
3948
0.8949
61.8
3358
1.0817
62.0
29914
1.7846
51.4
3638
1.0786
VANC
153.0
50419
1.61156
173.2
52724
2.11167
173.4
50625
2.11189
183.1
57423
2.11100
Total26
1.91377
551.6
354629
2.11385
451.3
337234
2.61314
641.9
338230
2.11458
642.0
3123
VIHA
CVI7
1.6443
252.0
12649
1.8496
231.8
12519
1.9485
282.1
13039
1.7516
392.9
1329N
VI6
2.5236
121.7
6966
2.6231
81.2
6598
2.9280
60.9
63710
4.3234
131.9
678SVI
202.3
87629
1.61838
293.3
88035
1.81937
303.1
96529
1.61790
363.6
101433
1.81808
Total33
2.11555
661.7
379844
2.71607
661.7
384747
2.71730
631.7
373055
3.11764
852.2
3815
PHSA
*38
2.01862
721.5
489930
1.51969
571.1
497850
2.42091
811.7
485467
3.12195
671.3
5157
HB
00.0
04
0.8493
00.0
08
1.6515
00.0
05
0.8599
00.0
06
1.0613
British
Columbia
2182.1
10523442
1.528627
2422.2
10843417
1.528359
2672.3
11364464
1.728043
3092.7
11586556
2.028117
*PH
SA
:Refers
toB
CW
om
en’s
Ho
spitalp
atients
on
lyN
ote:P
leaserefer
tob
ackflap
for
legen
do
fth
eH
ealthA
uth
orities
and
Health
Service
Delivery
Areas
66 BRITISH COLUMBIA PERINATAL HEALTH PROGRAM – PERINATAL DATABASE REGISTRY ANNUAL REPORT 2007(Only singleton deliveries and births included)
APPENDICES AND REFERENCES
DATA TABLE 13A
APPENDIX 10 – DATA TABLES (CONT’D)

BRITISH COLUMBIA PERINATAL HEALTH PROGRAM – PERINATAL DATABASE REGISTRY ANNUAL REPORT 2007 67(Only singleton deliveries and births included)
APPENDICES AND REFERENCES
Meth
od
of
Delivery
by
Place
of
Delivery
for
Health
Service
Delivery
Areas,H
ealthA
uth
orities
and
Pro
vince,
2002/2003to
2006/2007
2002/20032003/2004
2004/20052005/2006
2006/2007
C/S
ection
Vag
inal
C/S
ection
Vag
inal
C/S
ection
Vag
inal
C/S
ection
Vag
inal
C/S
ection
Vag
inal
HA
HS
DA
#%
#%
#%
#%
#%
#%
#%
#%
#%
#%
FHA
FE652
25.21931
74.8677
25.81950
74.2729
28.11867
71.9672
26.21893
73.8643
24.61967
75.4FN
123625.5
361074.5
128027.1
344872.9
131828.0
339572.0
129827.5
343072.5
154831.2
341268.8
FS1508
26.74139
73.31595
28.14075
71.91720
29.84049
70.21696
30.63839
69.41742
29.34194
70.7
Total3396
26.09680
74.03552
27.39473
72.73767
28.89311
71.23666
28.69162
71.43933
29.19573
70.9
IHA
EK167
27.2447
72.8175
29.4421
70.6211
34.5400
65.5196
31.5426
68.5195
29.6464
70.4KB
14428.0
37172.0
10922.5
37677.5
11922.8
40377.2
11321.1
42278.9
12422.8
41977.2
OK633
26.41761
73.6655
27.21756
72.8724
29.61722
70.4757
30.01767
70.0856
31.91830
68.1TCS
52129.9
122270.1
56331.5
122368.5
57231.2
126368.8
57631.9
122768.1
58131.5
126668.5
Total1465
27.83801
72.21502
28.53776
71.51626
30.03788
70.01642
29.93842
70.11756
30.63979
69.4
NH
AN
E219
24.6671
75.4208
24.1654
75.9218
24.5670
75.5218
24.9658
75.1273
27.6715
72.4N
I369
25.51078
74.5379
25.81089
74.2390
26.71068
73.3439
28.01129
72.0402
26.81098
73.2N
W280
29.8661
70.2241
26.9655
73.1228
26.2641
73.8204
25.0613
75.0198
24.6607
75.4
Total868
26.52410
73.5828
25.72398
74.3836
26.02379
74.0861
26.42400
73.6873
26.52420
73.5
VCHA
CST479
24.91441
75.1523
27.41388
72.6509
27.41347
72.6521
29.71236
70.3573
30.11331
69.9RICH
39429.3
94970.7
33529.1
81770.9
29926.1
84673.9
36331.6
78668.4
31426.8
85773.2
VANC
50430.4
115669.6
52731.1
116768.9
50629.9
118970.1
57434.3
110065.7
57533.9
111966.1
Total1377
28.03546
72.01385
29.13372
70.91314
28.03382
72.01458
31.83122
68.21462
30.73307
69.3
VIHA
CVI443
26.01264
74.0496
28.41251
71.6485
27.11303
72.9516
28.01328
72.0497
26.01415
74.0N
VI236
25.3696
74.7231
26.0659
74.0280
30.5637
69.5234
25.7678
74.3255
27.3678
72.7SVI
87632.3
183867.7
88031.2
193768.8
96535.0
179065.0
101435.9
180864.1
102836.6
177763.4
T otal1555
29.03798
71.01607
29.53847
70.51730
31.73730
68.31764
31.63814
68.41780
31.53870
68.5
PHSA
*1862
27.54899
72.51969
28.34978
71.72091
30.14854
69.92192
29.85156
70.22190
30.15086
69.9
HB
00.0
493100.0
00.0
515100.0
00.0
599100.0
00.0
613100.0
00.0
649100.0
British
Columbia
1052326.9
2862773.1
1084327.7
2835972.3
1136428.8
2804371.2
1158329.2
2810970.8
1199429.3
2888470.7
*PH
SA
:Refers
toB
CW
om
en’s
Ho
spitalp
atients
on
lyN
ote:P
leaserefer
tob
ackflap
for
legen
do
fth
eH
ealthA
uth
orities
and
Health
Service
Delivery
Areas
Detailed
data
tables
areavailab
lein
the
An
nu
alRep
ort
2007sectio
no
fth
eB
CP
HP
web
site(w
ww
.bcp
hp
.ca)
DATA TABLE 14A

2002/20032003/2004
2004/20052005/2006
2006/2007Elective
Emergency
OperativeSpontaneous
ElectiveEm
ergencyOperative
SpontaneousElective
Emergency
OperativeSpontaneous
ElectiveEm
ergencyOperative
SpontaneousElective
Emergency
OperativeSpontaneous
CSCS
VaginalVaginal
CSCS
VaginalVaginal
CSCS
VaginalVaginal
CSCS
VaginalVaginal
CSCS
VaginalVaginal
HA
HS
DA
#%
#%
#%
#%
#%
#%
#%
#%
#%
#%
#%
#%
#%
#%
#%
#%
#%
#%
#%
#%
FHAFE
2469.5
40615.7
32212.5
160962.3
27510.5
40215.3
28911.0
166163.2
28511.0
44417.1
30111.6
156660.3
26010.1
41216.1
2559.9
163863.9
27110.4
37214.3
31312.0
165463.4
FN396
8.2840
17.3551
11.43059
63.1476
10.1804
17.0569
12.02879
60.9489
10.4829
17.6565
12.02830
60.0477
10.1821
17.4593
12.52837
60.0535
10.81013
20.4597
12.02815
56.8FS
58410.3
92416.4
86715.4
327257.9
61710.9
97817.2
85515.1
322056.8
67011.6
105018.2
82314.3
322655.9
68312.3
101318.3
73413.3
310556.1
68911.6
105317.7
81113.7
338357.0
Total1226
9.42170
16.61740
13.37940
60.71368
10.52184
16.81713
13.27760
59.61444
11.02323
17.81689
12.97622
58.31420
11.12246
17.51582
12.37580
59.11495
11.12438
18.11721
12.77852
58.1
IHAEK
7412.1
9315.1
467.5
40165.3
8013.4
9515.9
559.2
36661.4
8413.7
12720.8
345.6
36659.9
9415.1
10216.4
365.8
39062.7
7711.7
11817.9
406.1
42464.3
KB51
9.993
18.134
6.6337
65.446
9.563
13.033
6.8343
70.743
8.276
14.640
7.7363
69.547
8.866
12.350
9.3372
69.546
8.578
14.446
8.5373
68.7OK
25410.6
37915.8
2068.6
155565.0
24610.2
40917.0
2098.7
154764.2
27011.0
45418.6
2329.5
149060.9
31412.4
44317.6
2309.1
153760.9
32011.9
53620.0
2459.1
158559.0
TCS167
9.6354
20.3127
7.31095
62.8183
10.2380
21.3132
7.41091
61.1200
10.9372
20.3140
7.61123
61.2217
12.0359
19.9135
7.51092
60.6194
10.5387
21.0138
7.51128
61.1
Total546
10.4919
17.5413
7.83388
64.3555
10.5947
17.9429
8.13347
63.4597
11.01029
19.0446
8.23342
61.7672
12.3970
17.7451
8.23391
61.8637
11.11119
19.5469
8.23510
61.2
NHA
NE
10511.8
11412.8
778.7
59466.7
8810.2
12013.9
687.9
58668.0
9410.6
12414.0
647.2
60668.2
9010.3
12814.6
536.1
60569.1
11011.1
16316.5
515.2
66467.2
NI
16211.2
20714.3
986.8
98067.7
15710.7
22215.1
1107.5
97966.7
16611.4
22415.4
1077.3
96165.9
18311.7
25616.3
1278.1
100263.9
16711.1
23515.7
1449.6
95463.6
NW
12313.1
15716.7
10210.8
55959.4
12714.2
11412.7
859.5
57063.6
9711.2
13115.1
708.1
57165.7
8910.9
11514.1
819.9
53265.1
8110.1
11714.5
8210.2
52565.2
Total390
11.9478
14.6277
8.52133
65.1372
11.5456
14.1263
8.22135
66.2357
11.1479
14.9241
7.52138
66.5362
11.1499
15.3261
8.02139
65.6358
10.9515
15.6277
8.42143
65.1
VCHACST
20710.8
27214.2
21311.1
122864.0
27114.2
25213.2
1739.1
121563.6
23412.6
27514.8
1829.8
116562.8
23113.1
29016.5
1669.4
107060.9
27814.6
29515.5
1859.7
114660.2
RICH134
10.0260
19.4185
13.8764
56.9112
9.7223
19.4143
12.4674
58.5110
9.6189
16.5121
10.6725
63.3145
12.6218
19.098
8.5688
59.9125
10.7189
16.1101
8.6756
64.6VAN
C148
8.9356
21.4255
15.4901
54.3165
9.7362
21.4242
14.3925
54.6190
11.2316
18.6239
14.1950
56.0207
12.4367
21.9222
13.3878
52.4217
12.8358
21.1271
16.0848
50.1
Total489
9.9888
18.0653
13.32893
58.8548
11.5837
17.6558
11.72814
59.2534
11.4780
16.6542
11.52840
60.5583
12.7875
19.1486
10.62636
57.6620
13.0842
17.7557
11.72750
57.7
VIHACVI
1549.0
28916.9
1378.0
112766.0
17810.2
31818.2
1377.8
111463.8
18010.1
30517.1
1176.5
118666.3
21211.5
30416.5
1156.2
121365.8
1718.9
32617.1
1296.7
128667.3
NVI
9810.5
13814.8
747.9
62266.7
10111.3
13014.6
728.1
58766.0
12113.2
15917.3
879.5
55060.0
9910.9
13514.8
849.2
59465.1
10010.7
15516.6
849.0
59463.7
SVI241
8.9635
23.4158
5.81680
61.9240
8.5640
22.7197
7.01740
61.8256
9.3709
25.7161
5.81629
59.1293
10.4721
25.5193
6.81615
57.2304
10.8724
25.8163
5.81614
57.5
Total493
9.21062
19.8369
6.93429
64.1519
9.51088
19.9406
7.43441
63.1557
10.21173
21.5365
6.73365
61.6604
10.81160
20.8392
7.03422
61.3575
10.21205
21.3376
6.73494
61.8
PHSA*683
10.11179
17.41019
15.13880
57.4727
10.51242
17.91012
14.63966
57.1787
11.31304
18.8916
13.23938
56.7832
11.31360
18.5976
13.34180
56.9841
11.61349
18.5971
13.34115
56.6
HB0
0.00
0.00
0.0493
100.00
0.00
0.00
0.0515
100.00
0.00
0.01
0.2598
99.80
0.00
0.00
0.0613
100.00
0.00
0.00
0.0649
100.0
BritishColum
bia3827
9.86696
17.14471
11.424156
61.74089
10.46754
17.24381
11.223978
61.24276
10.97088
18.04200
10.723843
60.54473
11.37110
17.94148
10.523961
60.44526
11.17468
18.34371
10.724513
60.0
Sp
on
taneo
us
Vag
inalvs
Op
erativeD
eliveriesb
yP
laceo
fD
eliveryfo
rH
ealthS
erviceD
eliveryA
reas,H
ealthA
uth
orities
and
Pro
vince,2002/2003
to2006/2007
*PH
SA
:Refers
toB
CW
om
en’s
Ho
spitalp
atients
on
lyN
ote:P
leaserefer
tob
ackflap
for
legen
do
fth
eH
ealthA
uth
orities
and
Health
Service
Delivery
Areas
Detailed
data
tables
areavailab
lein
the
An
nu
alRep
ort
2007sectio
no
fth
eB
CP
HP
web
site(w
ww
.bcp
hp
.ca)N
ote:O
perative
Vagin
alinclu
des
vacuu
m,fo
rceps
and
breech
deliveries
68 BRITISH COLUMBIA PERINATAL HEALTH PROGRAM – PERINATAL DATABASE REGISTRY ANNUAL REPORT 2007(Only singleton deliveries and births included)
APPENDICES AND REFERENCES
DATA TABLE 15A
APPENDIX 10 – DATA TABLES (CONT’D)

BRITISH COLUMBIA PERINATAL HEALTH PROGRAM – PERINATAL DATABASE REGISTRY ANNUAL REPORT 2007 69(Only singleton deliveries and births included)
APPENDICES AND REFERENCES
DATA TABLE 16A
New
bo
rnFeed
ing
by
Place
of
Delivery
for
Health
Service
Delivery
Areas,H
ealthA
uth
orities
and
Pro
vince,
2004/2005to
2006/2007
2004/20052005/2006
2006/2007Exclusive
PartialN
oExclusive
PartialN
oExclusive
PartialN
oB
reastB
reastB
reastB
reastB
reastB
reastB
reastB
reastB
reastM
ilkM
ilkM
ilkU
nknown
TotalN
AM
ilkM
ilkM
ilkU
nknown
TotalN
AM
ilkM
ilkM
ilkU
nknown
TotalN
A
HA
HS
DA
#%
#%
#%
#%
#%
##
%#
%#
%#
%#
%#
#%
#%
#%
#%
#%
#
FHAFE
172467.2
64225.0
1686.5
331.3
2567100.0
291724
67.8629
24.7182
7.27
0.32542
100.023
165964.2
74728.9
1706.6
80.3
2584100.0
26FN
340172.6
106722.8
1924.1
250.5
4685100.0
283325
70.81143
24.4205
4.421
0.44694
100.034
339769.0
127926.0
2164.4
340.7
4926100.0
34FS
392068.6
139524.4
3706.5
290.5
5714100.0
553813
69.41302
23.7360
6.617
0.35492
100.043
384465.3
167928.5
3405.8
200.3
5883100.0
53
Total9045
69.83104
23.9730
5.687
0.712966
100.0112
886269.6
307424.2
7475.9
450.4
12728100.0
1008900
66.53705
27.7726
5.462
0.513393
100.0113
IHAEK
46376.9
10016.6
254.2
142.3
602100.0
9414
68.4144
23.834
5.613
2.1605
100.017
47272.7
13721.1
365.5
40.6
649100.0
10KB
40477.8
10019.3
142.7
10.2
519100.0
3456
86.045
8.527
5.12
0.4530
100.05
46386.2
6211.5
101.9
20.4
537100.0
6OK
205584.6
2219.1
1235.1
291.2
2428100.0
181990
79.4284
11.3124
4.9109
4.32507
100.017
194172.9
53920.2
1505.6
331.2
2663100.0
23TCS
150782.7
1377.5
1518.3
281.5
1823100.0
121476
82.5136
7.6141
7.937
2.11790
100.013
155284.9
1186.5
1357.4
221.2
1827100.0
20
Total4429
82.4558
10.4313
5.872
1.35372
100.042
433679.8
60911.2
3266.0
1613.0
5432100.0
524428
78.0856
15.1331
5.861
1.15676
100.059
NHA
NE
41146.9
37142.3
9210.5
30.3
877100.0
11598
69.7198
23.160
7.02
0.2858
100.018
63664.6
26927.3
757.6
40.4
984100.0
4N
I1076
74.5170
11.8155
10.744
3.01445
100.013
119576.9
16910.9
1489.5
412.6
1553100.0
151157
77.7163
10.9147
9.922
1.51489
100.011
NW
58868.7
18321.4
779.0
80.9
856100.0
13593
73.6154
19.147
5.812
1.5806
100.011
54768.2
20024.9
465.7
91.1
802100.0
3
Total2075
65.3724
22.8324
10.255
1.73178
100.037
238674.2
52116.2
2557.9
551.7
3217100.0
442340
71.5632
19.3268
8.235
1.13275
100.018
VCHACST
127669.0
51527.8
402.2
191.0
1850100.0
61154
66.0534
30.546
2.615
0.91749
100.08
123765.7
58931.3
412.2
170.9
1884100.0
20RICH
77668.0
29525.9
554.8
151.3
1141100.0
4723
63.2373
32.641
3.67
0.61144
100.05
75564.9
36431.3
393.4
50.4
1163100.0
8VAN
C1183
70.4426
25.366
3.96
0.41681
100.014
111066.6
48829.3
583.5
100.6
1666100.0
81155
68.8441
26.365
3.918
1.11679
100.015
Total3235
69.21236
26.5161
3.440
0.94672
100.024
298765.5
139530.6
1453.2
320.7
4559100.0
213147
66.61394
29.5145
3.140
0.84726
100.043
VIHACVI
150584.8
1508.5
1015.7
181.0
1774100.0
141445
79.0268
14.695
5.222
1.21830
100.014
150179.4
28214.9
914.8
170.9
1891100.0
21N
VI817
89.843
4.736
4.014
1.5910
100.07
78086.2
879.6
343.8
40.4
905100.0
7803
86.978
8.437
4.06
0.6924
100.09
SVI2044
74.6582
21.297
3.518
0.72741
100.014
210175.0
60621.6
923.3
40.1
2803100.0
192130
76.4570
20.485
3.04
0.12789
100.016
T otal4366
80.5775
14.3234
4.350
0.95425
100.035
432678.1
96117.4
2214.0
300.5
5538100.0
404434
79.1930
16.6213
3.827
0.55604
100.046
PHSA*3585
52.22903
42.2375
5.59
0.16872
100.073
417657.4
275337.8
3364.6
150.2
7280100.0
684348
60.52566
35.7246
3.427
0.47187
100.089
HB0
0.00
0.00
0.00
0.00
0.0599
00.0
00.0
00.0
00.0
00.0
6130
0.00
0.00
0.00
0.00
0.0649
BritishColum
bia26735
69.59300
24.22137
5.6313
0.838485
100.0922
2707369.9
931324.0
20305.2
3380.9
38754100.0
93827597
69.210083
25.31929
4.8252
0.639861
100.01017
*PH
SA
:Refers
toB
CW
om
en’s
Ho
spitalp
atients
on
lyN
A:N
ot
Ap
plicab
lerefers
toS
tillbirth
s,Death
san
dH
om
eB
irths
No
te:Please
referto
back
flapfo
rleg
end
of
the
Health
Au
tho
ritiesan
dH
ealthS
erviceD
eliveryA
reas

70 BRITISH COLUMBIA PERINATAL HEALTH PROGRAM – PERINATAL DATABASE REGISTRY ANNUAL REPORT 2007(Only singleton deliveries and births included)
APPENDICES AND REFERENCES
DATA TABLE 18A
APPENDIX 10 – DATA TABLES (CONT’D)
2002/20032003/2004
2004/20052005/2006
2006/2007A
GA
LGA
SG
AA
GA
LGA
SG
AA
GA
LGA
SG
AA
GA
LGA
SG
AA
GA
LGA
SG
A
HA
HS
DA
#%
#%
#%
#%
#%
#%
#%
#%
#%
#%
#%
#%
#%
#%
#%
FHA
FE2155
79.1409
15.0161
5.92150
78.7400
14.6182
6.72185
79.5380
13.8182
6.62130
78.3423
15.6167
6.12290
80.0380
13.3192
6.7FN
402380.2
64412.8
3486.9
403680.4
63912.7
3456.9
399180.3
60512.2
3777.6
393780.3
59512.1
3697.5
409781.0
60011.9
3647.2
FS5014
78.9820
12.9519
8.24992
79.4791
12.6507
8.15172
80.6738
11.5509
7.95051
79.9750
11.9519
8.25211
80.4767
11.8500
7.7
Total11192
79.41873
13.31028
7.311178
79.61830
13.01034
7.411348
80.31723
12.21068
7.611118
79.81768
12.71055
7.611598
80.51747
12.11056
7.3
IHA
EK498
81.268
11.147
7.7466
81.861
10.743
7.5478
82.168
11.736
6.2484
82.066
11.240
6.8524
81.571
11.048
7.5KB
40981.2
6713.3
285.6
40580.7
5911.8
387.6
42682.6
5210.1
387.4
43880.1
6311.5
468.4
45184.9
366.8
448.3
OK1801
81.5264
11.9146
6.61765
80.4283
12.9146
6.71825
80.8263
11.6174
7.71889
82.0283
12.3131
5.72000
81.3305
12.4156
6.3TCS
127680.6
21013.3
976.1
127379.4
21913.7
1116.9
135181.4
19211.6
1177.0
133980.6
21713.1
1066.4
137580.8
20712.2
1207.1
Total3984
81.1609
12.4318
6.53909
80.3622
12.8338
6.94080
81.3575
11.5365
7.34150
81.3629
12.3323
6.34350
81.5619
11.6368
6.9
NH
AN
E626
76.9128
15.760
7.4658
80.4101
12.359
7.2660
79.4118
14.253
6.4667
81.1106
12.949
6.0723
78.1118
12.785
9.2N
I1068
77.8207
15.198
7.11071
77.2214
15.4102
7.41077
77.7211
15.299
7.11183
80.9188
12.992
6.31100
79.3201
14.587
6.3N
W666
73.2197
21.647
5.2618
75.0173
21.033
4.0596
74.4168
21.037
4.6562
73.2164
21.442
5.5581
76.2149
19.632
4.2
Total2360
76.2532
17.2205
6.62347
77.5488
16.1194
6.42333
77.3497
16.5189
6.32412
79.0458
15.0183
6.02404
78.2468
15.2204
6.6
VCHA
CST1710
81.7278
13.3106
5.11699
79.8309
14.5121
5.71717
82.8253
12.2103
5.01609
80.6267
13.4121
6.11636
80.8292
14.498
4.8RICH
112680.9
1389.9
1279.1
105280.1
14811.3
1138.6
114180.5
15310.8
1238.7
111580.2
14910.7
1279.1
121383.7
1359.3
1027.0
VANC
420381.4
5099.9
4518.7
427882.0
4889.3
4548.7
418082.3
4448.7
4579.0
435181.5
54110.1
4478.4
456182.8
5059.2
4408.0
Total7039
81.4925
10.7684
7.97029
81.1945
10.9688
7.97038
82.1850
9.9683
8.07075
81.1957
11.0695
8.07410
82.5932
10.4640
7.1
VIHA
CVI1300
76.3301
17.7103
6.01312
76.2318
18.592
5.31390
79.2269
15.397
5.51481
80.7290
15.864
3.51500
79.1297
15.799
5.2N
VI717
78.5151
16.545
4.9659
77.8138
16.350
5.9687
76.8148
16.560
6.7670
78.8133
15.647
5.5714
81.1132
15.034
3.9SVI
188978.8
36515.2
1436.0
200778.8
40415.9
1375.4
196578.0
40616.1
1475.8
199678.3
41516.3
1375.4
199879.2
39815.8
1285.1
T otal3906
77.9817
16.3291
5.83978
77.7860
16.8279
5.54042
78.2823
15.9304
5.94147
79.2838
16.0248
4.74212
79.5827
15.6261
4.9
BC
UN
SPEC192
82.129
12.413
5.6188
84.323
10.312
5.4145
75.121
10.927
14.0134
80.717
10.215
9.0171
76.730
13.522
9.9
NO
NRES
9072.0
1814.4
1713.6
9883.1
1210.2
86.8
7973.8
1615.0
1211.2
10077.5
2116.3
86.2
10782.9
107.8
129.3
British
Columbia
2876379.6
480313.3
25567.1
2872779.7
478013.3
25537.1
2906580.3
450512.4
26487.3
2913680.2
468812.9
25277.0
3025280.8
463312.4
25636.8
Birth
Weig
ht
vsG
estation
alAg
e(Term
Birth
s)b
yP
laceo
fR
esiden
cefo
rH
ealthS
erviceD
eliveryA
reas,H
ealthA
uth
orities
and
Pro
vince,2002/2003
to2006/2007
No
te:Please
referto
back
flapfo
rleg
end
of
the
Health
Au
tho
ritiesan
dH
ealthS
erviceD
eliveryA
reasD
etailedd
atatab
lesare
available
inth
eA
nn
ualR
epo
rt2007
section
of
the
BC
PH
Pw
ebsite
(ww
w.b
cph
p.ca)
AG
A:A
verage-fo
r-gestatio
nalag
eLG
A:Larg
e-for-g
estation
alage
SG
A:S
mall-fo
r-gestatio
nalag
e
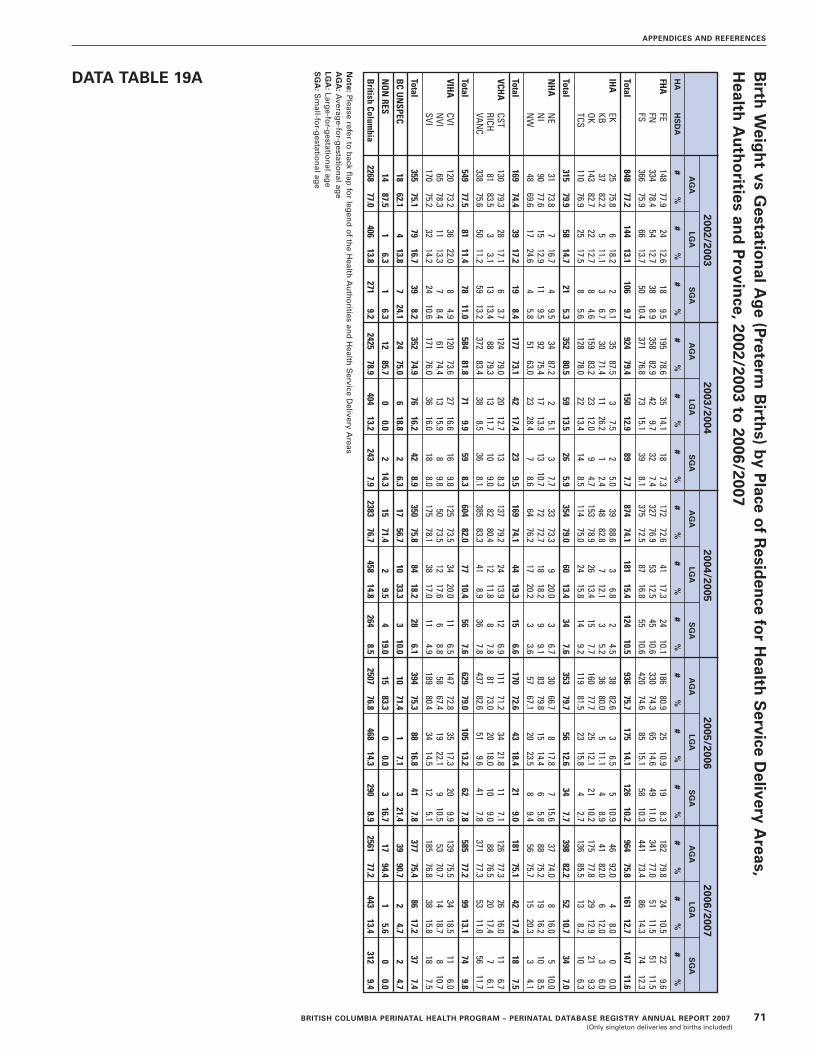
BRITISH COLUMBIA PERINATAL HEALTH PROGRAM – PERINATAL DATABASE REGISTRY ANNUAL REPORT 2007 71(Only singleton deliveries and births included)
APPENDICES AND REFERENCES
Birth
Weig
ht
vsG
estation
alAg
e(P
retermB
irths)
by
Place
of
Resid
ence
for
Health
Service
Delivery
Areas,
Health
Au
tho
ritiesan
dP
rovin
ce,2002/2003to
2006/2007
2002/20032003/2004
2004/20052005/2006
2006/2007A
GA
LGA
SG
AA
GA
LGA
SG
AA
GA
LGA
SG
AA
GA
LGA
SG
AA
GA
LGA
SG
A
HA
HS
DA
#%
#%
#%
#%
#%
#%
#%
#%
#%
#%
#%
#%
#%
#%
#%
FHA
FE148
77.924
12.618
9.5195
78.635
14.118
7.3172
72.641
17.324
10.1186
80.925
10.919
8.3182
79.824
10.522
9.6FN
33478.4
5412.7
388.9
35882.9
429.7
327.4
32776.9
5312.5
4510.6
33074.3
6514.6
4911.0
34177.0
5111.5
5111.5
FS366
75.966
13.750
10.4371
76.873
15.139
8.1375
72.587
16.855
10.6420
74.685
15.158
10.3441
73.486
14.374
12.3
Total848
77.2144
13.1106
9.7924
79.4150
12.989
7.7874
74.1181
15.4124
10.5936
75.7175
14.1126
10.2964
75.8161
12.7147
11.6
IHA
EK25
75.86
18.22
6.135
87.53
7.52
5.039
88.63
6.82
4.538
82.63
6.55
10.946
92.04
8.00
0.0KB
3782.2
511.1
36.7
3071.4
1126.2
12.4
4882.8
712.1
35.2
3680.0
511.1
48.9
4182.0
612.0
36.0
OK143
82.722
12.78
4.6159
83.223
12.09
4.7153
78.926
13.415
7.7160
77.725
12.121
10.2175
77.829
12.921
9.3TCS
11076.9
2517.5
85.6
12878.0
2213.4
148.5
11475.0
2415.8
149.2
11981.5
2315.8
42.7
13685.5
138.2
106.3
Total315
79.958
14.721
5.3352
80.559
13.526
5.9354
79.060
13.434
7.6353
79.756
12.634
7.7398
82.252
10.734
7.0
NH
AN
E31
73.87
16.74
9.534
87.22
5.13
7.733
73.39
20.03
6.730
66.78
17.87
15.637
74.08
16.05
10.0N
I90
77.615
12.911
9.592
75.417
13.913
10.772
72.718
18.29
9.183
79.815
14.46
5.888
75.219
16.210
8.5N
W48
69.617
24.64
5.851
63.023
28.47
8.664
76.217
20.23
3.657
67.120
23.58
9.456
75.715
20.33
4.1
Total169
74.439
17.219
8.4177
73.142
17.423
9.5169
74.144
19.315
6.6170
72.643
18.421
9.0181
75.142
17.418
7.5
VCHA
CST130
79.328
17.16
3.7124
79.020
12.713
8.3137
79.224
13.912
6.9111
71.234
21.811
7.1126
77.326
16.011
6.7RICH
8183.5
33.1
1313.4
8879.3
1311.7
109.0
8280.4
1211.8
87.8
8173.0
2018.0
109.0
8876.5
2017.4
76.1
VANC
33875.6
5011.2
5913.2
37283.4
388.5
368.1
38583.3
418.9
367.8
43782.6
519.6
417.8
37177.3
5311.0
5611.7
Total549
77.581
11.478
11.0584
81.871
9.959
8.3604
82.077
10.456
7.6629
79.0105
13.262
7.8585
77.299
13.174
9.8
VIHA
CVI120
73.236
22.08
4.9120
73.627
16.616
9.8125
73.534
20.011
6.5147
72.835
17.320
9.9139
75.534
18.511
6.0N
VI65
78.311
13.37
8.461
74.413
15.98
9.850
73.512
17.66
8.858
67.419
22.19
10.553
70.714
18.78
10.7SVI
17075.2
3214.2
2410.6
17176.0
3616.0
188.0
17578.1
3817.0
114.9
18980.4
3414.5
125.1
18576.8
3815.8
187.5
T otal355
75.179
16.739
8.2352
74.976
16.242
8.9350
75.884
18.228
6.1394
75.388
16.841
7.8377
75.486
17.237
7.4
BC
UN
SPEC18
62.14
13.87
24.124
75.06
18.82
6.317
56.710
33.33
10.010
71.41
7.13
21.439
90.72
4.72
4.7
NO
NRES
1487.5
16.3
16.3
1285.7
00.0
214.3
1571.4
29.5
419.0
1583.3
00.0
316.7
1794.4
15.6
00.0
British
Columbia
226877.0
40613.8
2719.2
242578.9
40413.2
2437.9
238376.7
45814.8
2648.5
250776.8
46814.3
2908.9
256177.2
44313.4
3129.4
No
te:Please
referto
back
flapfo
rleg
end
of
the
Health
Au
tho
ritiesan
dH
ealthS
erviceD
eliveryA
reasA
GA
:Averag
e-for-g
estation
alage
LGA
:Large-fo
r-gestatio
nalag
eS
GA
:Sm
all-for-g
estation
alage
DATA TABLE 19A

72 BRITISH COLUMBIA PERINATAL HEALTH PROGRAM – PERINATAL DATABASE REGISTRY ANNUAL REPORT 2007(Only singleton deliveries and births included)
APPENDICES AND REFERENCES
REFERENCES
1. Health Canada, Canadian Perinatal Health Report 2003. 2003, CanadianPerinatal Surveillance System: Ottawa.
2. British Columbia Vital Statistics Agency, Selected Vital Statistics andHealth Status Indicators. Annual Report 2005. 2005, British Columbia VitalStatistics Agency: Victoria.
3. College of Family Physicians of Canada, C.M.A., Royal College ofPhysicians and Surgeons of Canada. 2007 National Physician Survey. 2008[cited 2008 February 1]; Available from: http://www.nationalphysiciansurvey.ca/nps/2007_Survey/2007nps-e.asp.
4. SOGC. Society of Obstetricians and Gynaecologists of Canada website.[Website] [cited 2008; Available from: http://www.sogc.org.
5. BCRCP, British Columbia Perinatal Database Registry Annual Report 2003.2003, British Columbia Reproductive Care Program: Vancouver, BC.
6. Klein, J.D., Adolescent pregnancy: current trends and issues. Pediatrics,2005. 116(1): p. 281-6.
7. Jolly, M.C., Sebire, N., Harris, J., Robinson, S. and Regan, L., Obstetric risksof pregnancy in women less than 18 years old. Obstet Gynecol, 2000. 96(6):p. 962-6.
8. Eure, C.R., M.K. Lindsay, and W.L. Graves, Risk of adverse pregnancy out-comes in young adolescent parturients in an inner-city hospital. Am J ObstetGynecol, 2002. 186(5): p. 918-20.
9. British Columbia Perinatal Health Program, British Columbia PerinatalDatabase Registry: Vancouver: Canada.
10. BCRCP, British Columbia Perinatal Database Registry Annual Report 2006.2006, British Columbia Reproductive Care Program: Vancouver, BC.
11. Pollack, H., P.M. Lantz, and J.G. Frohna, Maternal smoking and adversebirth outcomes among singletons and twins. Am J Public Health, 2000.90(3): p. 395-400.
12. Pickett, K.E., Wakschlag, L.S., Dai, L. and Leventhal, B.L., Fluctuations of ma-ternal smoking during pregnancy. Obstet Gynecol, 2003. 101(1): p. 140-7.
13. ACOG committee opinion. Number 316, October 2005. Smoking cessationduring pregnancy. Obstet Gynecol, 2005. 106(4): p. 883-8.
14. BCRCP, British Columbia Perinatal Database Registry Annual Report 2004.2004, British Columbia Reproductive Care Program: Vancouver, BC.
15. BCRCP. Obstetric guideline 1. Cervical Ripening and Induction of Labour.2005 [cited 2008 February 1].
16. Battista, L., Chung., J.H., Lagren, D.C. and Wing, D.A., Complications of laborinduction among multiparous women in a community-based hospital system.Am J Obstet Gynecol, 2007. 197(3): p. 241 e1-7; discussion 322-3, e1-4.
17. Peregrine, E., O'Brien, P., Omar, R. and Jauniaux, E., Clinical and ultrasoundparameters to predict the risk of cesarean delivery after induction of labor.Obstet Gynecol, 2006. 107(2 Pt 1): p. 227-33.
18. Crane, J.M., Factors predicting labor induction success: a critical analysis.Clin Obstet Gynecol, 2006. 49(3): p. 573-84.
19. SOGC, SOGC clinical practice guidelines. Guidelines for vaginal birth afterprevious caesarean birth. Number 155 (Replaces guideline Number 147),February 2005. Int J Gynaecol Obstet, 2005. 89(3): p. 319-31.
20. Liston, R., D. Sawchuck, and D. Young, Fetal health surveillance: antepar-tum and intrapartum consensus guideline. J Obstet Gynaecol Can, 2007.29(9 Suppl 4): p. S3-56.
21. Thacker, S.B., D. Stroup, and M. Chang, Continuous electronic heart ratemonitoring for fetal assessment during labor. Cochrane Database Syst Rev,2001(2): p. CD000063.
22. Cole, C., Admission electronic fetal monitoring does not improve neonataloutcomes. J Fam Pract, 2003. 52(6): p. 443-4.
23. SOGC clinical practice guidelines: Guidelines for Operative Vaginal Birth.Number 148 Ottawa: SOGC, 2004.
24. Hartmann, K., Viswanathan, M., Palmieri, R., Gartlehner, G., Thorp, J. andLohr., K.N., Outcomes of routine episiotomy: a systematic review. JAMA,2005. 293(17): p. 2141-8.
25. Graham, I.D., Carroli, G., Davies, C. and Medves, J.M., Episiotomy ratesaround the world: an update. Birth, 2005. 32(3): p. 219-23.
26. Goode, K.T., Weiss, P.M., Koller, C., Kemmel, S. and Hess, L.W., Episiotomyrates in private vs. resident service deliveries: a comparison. J Reprod Med,2006. 51(3): p. 190-2.
27. Weber, A.M. and L. Meyn, Episiotomy use in the United States, 1979-1997.Obstet Gynecol, 2002. 100(6): p. 1177-82.
28. Abenhaim, H.A., Kinch, R.A., Morin, L., Benjamin, A. and Usher, R., Effectof prepregnancy body mass index categories on obstetrical and neonataloutcomes. Arch Gynecol Obstet, 2007. 275(1): p. 39-43.
29. Doherty, D.A., Magann, E.F., Francis, J., Morrison, J.C. and Newnman, J.P.,Pre-pregnancy body mass index and pregnancy outcomes. Int J GynaecolObstet, 2006. 95(3): p. 242-7.
30. Chu, S.Y., Callaghan, W.M., Kim, S.Y., Schmid, C.H., Lau, J., England, L.J.and Dietz, P.M., Maternal obesity and risk of cesarean delivery: a meta-analysis. Obes Rev, 2007. 8(5): p. 385-94.
31. Robinson, H.E., O'Connell, C.M., Joseph K.S. and McLeod, N.L., Maternaloutcomes in pregnancies complicated by obesity. Obstet Gynecol, 2005.106(6): p. 1357-64.
32. CIHI, Health Indicators 2007. 2007, Canadian Institute for Health Information:Ottawa.
33. Liu, S., Liston, R.M., Joseph, K.S., Heaman, M., Sauve, R. and Kramer, M.S.,Maternal mortality and severe morbidity associated with low-risk plannedcesarean delivery versus planned vaginal delivery at term. CMAJ, 2007.176(4): p. 455-60.
34. Baskett, T.F. and C.M. O'Connell, Severe obstetric maternal morbidity: a 15-year population-based study. J Obstet Gynaecol, 2005. 25(1): p. 7-9.
35. Hemminki, E., Impact of caesarean section on future pregnancy--a review ofcohort studies. Paediatr Perinat Epidemiol, 1996. 10(4): p. 366-79.
36. Hemminki, E., J. Shelley, and M. Gissler, Mode of delivery and problems insubsequent births: a register-based study from Finland. Am J ObstetGynecol, 2005. 193(1): p. 169-77.
37. Myers, S.A. and T.L. Bennett, Incidence of significant adhesions at repeatcesarean section and the relationship to method of prior peritoneal closure.J Reprod Med, 2005. 50(9): p. 659-62.
38. Hansen, A.K., Wisborg, K., Uldbjerg, N. and Henricksen, T.B., Risk of respi-ratory morbidity in term infants delivered by elective caesarean section: co-hort study. BMJ, 2008. 336(7635): p. 85-7.
39. Morrison, J.J., J.M. Rennie, and P.J. Milton, Neonatal respiratory morbidityand mode of delivery at term: influence of timing of elective caesarean sec-tion. Br J Obstet Gynaecol, 1995. 102(2): p. 101-6.

BRITISH COLUMBIA PERINATAL HEALTH PROGRAM – PERINATAL DATABASE REGISTRY ANNUAL REPORT 2007 73(Only singleton deliveries and births included)
APPENDICES AND REFERENCES
40. Hernandez-Diaz, S., Van Marter, L.J., Werler, M.M., Louik, C. and Mitchell,A.A., Risk factors for persistent pulmonary hypertension of the newborn.Pediatrics, 2007. 120(2): p. e272-82.
41. MacDorman, M.F., Declercq, E., Menacker, F. and Malloy, M.H., Infant andneonatal mortality for primary cesarean and vaginal births to women with"no indicated risk," United States, 1998-2001 birth cohorts. Birth, 2006.33(3): p. 175-82.
42. Joseph, K.S., Young, D.C., Dodds, L., O'Connell, C.M., Allen, V.M., Chandra,S. and Allen, A.C., Changes in maternal characteristics and obstetric practiceand recent increases in primary cesarean delivery. Obstet Gynecol, 2003.102(4): p. 791-800.
43. Gartner, L.M., Morton, J., Lawrence, R.A., Naylor, A.J., O'Hare, D., Schanler,R.J. and Eidelman, A.I., Breastfeeding and the use of human milk.Pediatrics, 2005. 115(2): p. 496-506.
44. World Health Organization, Global Strategy for Infant and Young ChildFeeding. 2003, World Health Organization: Geneva.
45. Ip, S., C.M., Raman, G., Chew, P., Magula, N., DeVine, D., Trikalinos, T.,Lau, J., Breastfeeding and Maternal and Infant Health Outcomes inDeveloped Countries, in Evidence Report/Technology Assessment No. 153.2007, Agency for Healthcare Research and Quality: Rockville, MD.
46. Breastfeeding Committee for Canada, Breastfeeding Statement of theBreastfeeding Committee for Canada. 2006, Breastfeeding Committee forCanada.
47. Health Canada. Body Mass Index Nomogram. Ottawa: Office of NutritionPolicy and Promotion. Accessed on January 17, 2007 at:http://www.hc-sc.gc.ca/hpfb-dgpsa/onpp-bppn/bmi_chart_java_e.html
48. World Health Organization, Evidence for the ten steps to successful breast-feeding. 2004, World Health Organization: Geneva.

74 BRITISH COLUMBIA PERINATAL HEALTH PROGRAM – PERINATAL DATABASE REGISTRY ANNUAL REPORT 2007(Only singleton deliveries and births included)
APPENDICES AND REFERENCES
NOTES
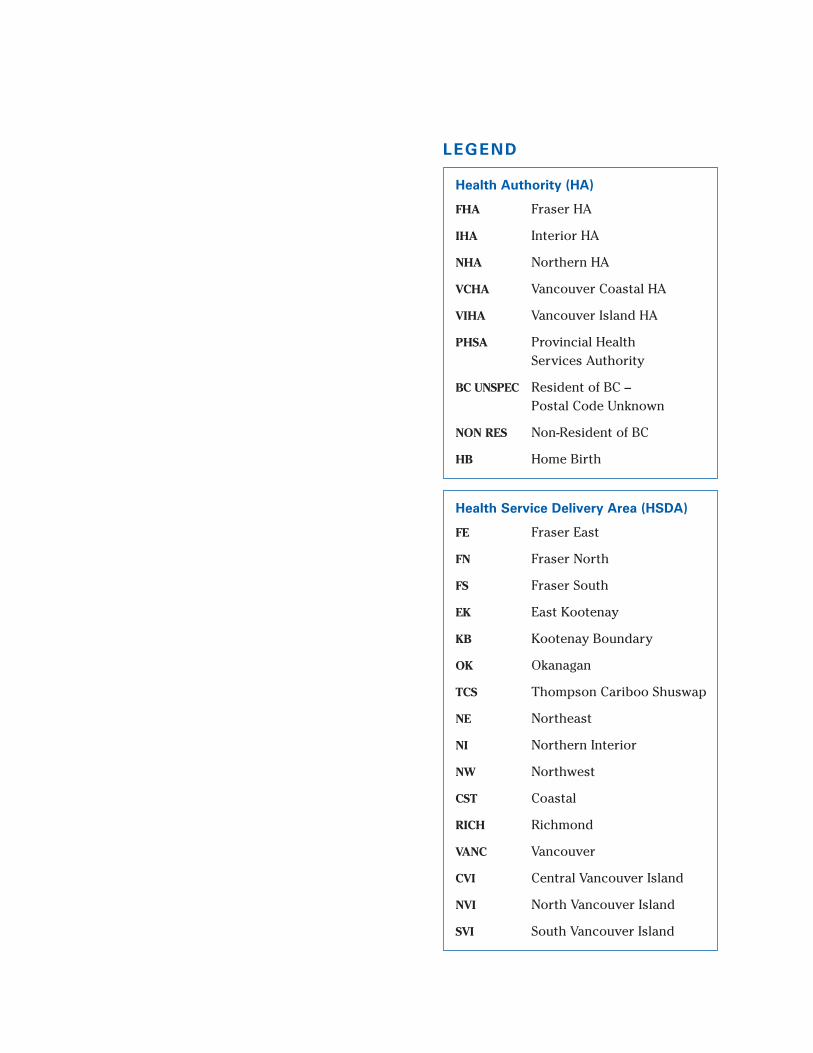
LEGEND
Health Service Delivery Area (HSDA)
FE Fraser East
FN Fraser North
FS Fraser South
EK East Kootenay
KB Kootenay Boundary
OK Okanagan
TCS Thompson Cariboo Shuswap
NE Northeast
NI Northern Interior
NW Northwest
CST Coastal
RICH Richmond
VANC Vancouver
CVI Central Vancouver Island
NVI North Vancouver Island
SVI South Vancouver Island
Health Authority (HA)
FHA Fraser HA
IHA Interior HA
NHA Northern HA
VCHA Vancouver Coastal HA
VIHA Vancouver Island HA
PHSA Provincial Health Services Authority
BC UNSPEC Resident of BC – Postal Code Unknown
NON RES Non-Resident of BC
HB Home Birth

Related Documents