British Columbia Apple Industry September 2012 Strategic Choices and Directions for the Next Decade By Globalwise Inc., Vancouver, WA In Association with Belrose Inc., Pullman, WA British Columbia apple growers and the Province’s major packing house face significant challenges. This study concludes that the industry is approaching a crisis point. Decisive action is needed. The report concludes with some key recommendations for action.

Welcome message from author
This document is posted to help you gain knowledge. Please leave a comment to let me know what you think about it! Share it to your friends and learn new things together.
Transcript

British Columbia Apple Industry
September 2012 Strategic Choices and Directions for the Next Decade
By Globalwise Inc., Vancouver, WA In Association with Belrose Inc., Pullman, WA
British Columbia apple growers and the Province’s major packing house
face significant challenges. This study concludes that the industry is
approaching a crisis point. Decisive action is needed. The report
concludes with some key recommendations for action.

Acknowledgements Funding for this project was provided by Agriculture and Agri-Food Canada and the B.C. Ministry of
Agriculture through the Canada-British Columbia Tree Fruit Market and Infrastructure Initiative. The Initiative was funded through the Agricultural Flexibility Fund (AgriFlex), a five-year fund created to help sectors
reduce costs of production, improve environmental sustainability, promote innovation and respond to emerging opportunities and market challenges.
Thank you to the packing house managers who participated in the interview process.
Opinions and recommendations expressed in this report are those of the authors and interviewees, and are not necessarily those of the Government of British Columbia, the B.C. Fruit Growers’ Association, nor the
Government of Canada.

B.C. Apple Industry Strategic Choices and Directions
globalwiseinc. page i
Table of Contents Introduction ........................................................................................................................................... 1
Industry Background ............................................................................................................................. 1
World Apple Industry Trends .................................................................................................................................................. 1 Rising World Apple Production ....................................................................................................................................... 1 Sluggish Per Capita Consumption of Fresh Apples in the Developed World ........................................................ 2 Retailer Consolidation and Increased Buying Power .................................................................................................. 2 Price trends .......................................................................................................................................................................... 2 Increased Competition in Foreign and Domestic Markets .......................................................................................... 2 Increasing Popularity of Integrated Grower-Packer-Marketer Operations .......................................................... 3 Heavy Attrition Among Smaller Producers .................................................................................................................... 3
Trends in Canadian Apple Industry ....................................................................................................................................... 3 Declining Numbers of Apple Growers, and of Acreage and Production ............................................................... 3 Increased Import Competition .......................................................................................................................................... 3 Transferring Acreage to Alternative Fruits and Berries ............................................................................................. 4
Trends in B.C. Apple Industry .................................................................................................................................................. 4 Declining Numbers of Apple Growers, and of Acreage and Production ............................................................... 4 Land Cost and Availability ............................................................................................................................................... 4 Labor Cost and Availability ............................................................................................................................................. 4 Increased Imports, Reduced Exports .............................................................................................................................. 4 Transferring Acreage to Alternative Fruits and Berries ............................................................................................. 5 Role of New Varieties and Apple Replant Programs ................................................................................................ 5 Grower Intentions Survey Results .................................................................................................................................... 6
Current Competitiveness of Industry Sectors ......................................................................................... 7
Growers ....................................................................................................................................................................................... 7 Average Yields ................................................................................................................................................................... 7 Fresh Packout ...................................................................................................................................................................... 7 Average Returns ................................................................................................................................................................. 8 Varietal Options ................................................................................................................................................................. 8
Storage and Packing ................................................................................................................................................................ 9 Critical Role of Okanagan Tree Fruit Cooperative..................................................................................................... 9 Comparisons with Chelan Cooperative ......................................................................................................................... 9 Role of Independent Packers ......................................................................................................................................... 10 Problems of Finance, Labor and Succession ................................................................................................................ 10
Marketing .................................................................................................................................................................................. 10 Critical Role of B.C. Tree Fruits ...................................................................................................................................... 10 Importance of Western Canada Markets ................................................................................................................... 11 Role of Independent Marketers .................................................................................................................................... 11 Influence of “Local” Sales ............................................................................................................................................... 11 Other Niche Markets ....................................................................................................................................................... 11 Danger of Splintering Marketing Effort ...................................................................................................................... 11

B.C. Apple Industry Strategic Choices and Directions
globalwiseinc. page ii
Cooperation and Communication among Industry Sectors ................................................................. 12
OTFC and Apple Producers .................................................................................................................................................. 12 OTFC and B.C. Tree Fruits ...................................................................................................................................................... 12 B.C. Tree Fruits and Apple Producers .................................................................................................................................. 12 Independent Packers and Apple Producers ....................................................................................................................... 12
Potential Future Scenarios for B.C. Apple Industry .............................................................................. 13
Known and Potential Future Risks ......................................................................................................................................... 13 Industry Scenario Based on Continuation of Current Trends ........................................................................................... 13
Potential Remedial Actions ................................................................................................................. 16
Grower Level ............................................................................................................................................................................ 16 Packing and Storage Level ................................................................................................................................................... 17 Marketing Level ....................................................................................................................................................................... 18 Industry Structural Changes ................................................................................................................................................... 18 Communications ........................................................................................................................................................................ 18
Outlook for B.C. Apple Industry .......................................................................................................... 19
Recommendations ............................................................................................................................... 20
Appendix A Packer Interview Survey ................................................................................................. 21
Tables and Figures Table 1: Canada and British Columbia Estimates of Harvested Acres, Value of Farm Sales and Farm Sales per Acre, For Apples and Five Competing Fruits, 2000 and 2011 .................................................................. 5
Table 2: British Columbia Average Tree Fruit Acreage – Percentage of Growers in Acreage Ranges, 2005 and 2012 ................................................................................................................................................ 6
Table 3: British Columbia and Washington State Average Production Of Fresh Packs per Acre, by Variety .......................................................................................................................................................................................... 8
Figure 1: British Columbia Acreage Planted in Apples, 1997-2011 ................................................................................... 14
Table 4: British Columbia Alternative Scenarios for Apple Acreage and Production, 2011, 2016 and 2021 .......... 15
Table 5: Charges per Packed Box Required from Patrons for a $40 Million Loan, At Different Interest Rates and Different Packed Volumes .................................................................................................... 17
B.C. Apple Industry Strategic Choices and Directions
globalwiseinc. page 1
British Columbia Apple Industry S T R A T E G I C C H O I C E S A N D D I R E C T I O N S F O R T H E N E X T D E C A D E
Introduction This report is commissioned by the British Columbia Fruit Growers’ Association, with funding from Agriculture and Agri-Food Canada and the B.C. Ministry of Agriculture. This report is the second phase of research for the B.C. apple industry and follows key economic analysis that compared several factors within the B.C. industry with external conditions found in North Central Washington. The primary factors evaluated in Phase I were grade standards and packing charges as well as taxes and regulations. The Phase I report was completed in June 2011 and some of the analysis discussed here is described in more detail in the earlier report.1
In the current phase of the project we examined the strategic choices available to the industry in light of the current provincial, national and global situation in the apple market. The next section of this report is an analysis of the key trends in the world, Canadian and B.C. fruit systems. These trends will affect the strategic choices available to the B.C. apple Industry. In the third section we discuss the implications of various measures of the competitiveness of the B.C. apple industry at the grower, packer and marketing level. The fourth section focuses on current cooperation and communication within the different segments of the B.C. apple industry. It is vital that all segments of the B.C. apple industry be working from the same script as they attempt to restore the vitality of the B.C. apple Industry. In the fifth section we examine potential future scenarios that the B.C. apple industry may face in the decade ahead. Its strategic options will be different under different possible scenarios. The sixth section examines possible remedial actions that the B.C. apple industry can take under alternative scenarios. Finally in the last section we look at the long-term outlook for the B.C. apple industry if it takes the necessary remedial actions.
The authors of this report are Globalwise Inc., an economic consulting company in Vancouver, Washington in association with Belrose, Inc., Pullman, Washington. Globalwise and Belrose conduct a broad spectrum of economic analysis in the food and agriculture industries.
Industry Background
World Apple Industry Trends The apple industry in different countries has become increasingly linked by the forces of globalization and trade. A number of global trends are particularly relevant to the future of the B.C. apple industry.
RISING WORLD APPLE PRODUCTION The Food and Agriculture Organization of the United Nations data show that world production of all major fruits rose by 45.1% between 1983-85 and 1998-2000, and by a further 29.7% between 1998-2000 and 2008-10. In the same period, world apple production grew by 43.9% and 20.3% and world population grew by 23.2% and 13.0% respectively. Thus, world per capita supplies of apples, and of all fruit, have continued to grow faster than world population. Current trends in acreage and yields suggest that world apple production could increase by over 24% between 2010 and 2020. This will further challenge apple
1 The Phase I report is titled Apple Industry Cost and Returns Analysis for British Columbia and North Central Washington, dated June 2011. It is available from the B.C. Fruit Growers’ Association.

B.C. Apple Industry Strategic Choices and Directions
globalwiseinc. page 2
producers and marketers to find increased sales opportunities if they are to avoid continued downward pressure on prices and profits.
SLUGGISH PER CAPITA CONSUMPTION OF FRESH APPLES IN THE DEVELOPED WORLD At the same time that apple production has been growing, per capita consumption of fresh apples has been stagnant or declining in most developed country markets in Europe, North America and Asia. As consumers become more affluent, they seek increasing diversity in their diets. They reduce their consumption of traditional fruits like apples and pears, and increase consumption of mangos, papayas, pineapples, and other tropical and exotic fruits. For example, per capita consumption of fresh apples in the United States has fallen by one percent per year for the last two decades and is now about 7 kilograms per capita. Per capita consumption of apples in Canada has been more resilient, having fallen by about 7% in the last two decades to a current level of about 11 kilograms.
RETAILER CONSOLIDATION AND INCREASED BUYING POWER The grocery business through which most fresh apples are sold has become increasingly concentrated in the hands of a few, large multinational retailers. These retailers have spread their influence from their home bases in the developed world to the developing countries of Asia, Latin America, and now Africa. These large retailers continue to ratchet up their demand for higher quality standards at lower prices. In addition, they now place an ever-expanding list of additional requirements on their suppliers regarding method and timing of deliveries, merchandising and promotional support, and assurances on traceability, food safety, worker health, energy use, carbon emissions, etc. The cumulative effect of these requirements has been increased costs to suppliers, and the departure of many smaller suppliers from the produce business.
These large retailers have also introduced a number of new wrinkles that have had a major impact on the produce business. Many now operate large superstores where food is used to generate increased foot traffic in their non-food sections. Food prices are set well below the levels set by specialized grocery stores. Many also seek out "preferred suppliers", often linked to short-term contracts, rather than buying their supplies from the spot market.
PRICE TRENDS Prices for a product such as fresh apples tend to vary by origin and market based on local supply-demand balances, variety, quality, seasonality, availability of competing fruits, etc., so it is difficult to generalize about price trends. However, prices in any individual country are affected by what is happening in world markets. For example, the world food shortage in 2008 tended to drive up prices of all foods. The prices at which imported apples are being offered affects the prices domestic apple producers can receive, although locally-produced product may receive a small price premium. Another very current example is 2012 pricing, which is certainly expected to be affected by crop failures in Ontario and in the Eastern U.S.
Two other specific forces affect the prices received by producers. One is the tendency of major retailers to set a constant price for many different varieties. As a result, consumers do not get accurate information on the relative availability of different varieties. In turn, producers do not get accurate price signals to guide their production and marketing decisions. The second is the influence of new varieties. These tend to displace older varieties with both retailers and consumers, and depress the demand (and price) of older varieties.
INCREASED COMPETITION IN FOREIGN AND DOMESTIC MARKETS Because of the increasing volume of world apple supplies, major apple exporting countries, such as China, the United States, Chile, Argentina, New Zealand, South Africa, France and Italy, have become much more

B.C. Apple Industry Strategic Choices and Directions
globalwiseinc. page 3
aggressive in seeking out new markets with new varieties, improved quality and competitive pricing. As a result, the advantages that local apple producers used to have in their domestic markets have been eroded. In addition, as previously mentioned, global supplies of many competing fruits have also been increasing.
INCREASING POPULARITY OF INTEGRATED GROWER-PACKER-MARKETER OPERATIONS In response to the changing structure and demands of the large retail chains, more and more of the apple industry in many countries has moved towards a system of integrated grower-packer-marketers. A single marketer will handle apples and related fruits for a number of independent packers in addition to apples grown and packed by its subsidiary companies. Affiliated packers, in turn, will handle apples grown by their own subsidiary companies and by independent producers. This structure has enabled the marketers to become preferred suppliers for even the largest retailers. In order to supply a wide range of varieties for twelve months per year, packers and marketers will often supplement network production with imports from other countries. They are also in a better position to gain access to new varieties as they become available.
HEAVY ATTRITION AMONG SMALLER PRODUCERS The combination of all these forces has led to heavy attrition among small producers in almost every major apple producing country in the world. Small producers lack the economies of scale needed to drive down unit costs. They lack the capital needed to introduce new varieties or to acquire new technologies that would boost yield or quality. Historically the cooperative system provided support for the small producers. For a number of reasons, more recently cooperatives have not been able to provide solutions that help the smaller growers adapt to the ongoing changes in the global food system.
Trends in Canadian Apple Industry The Canadian apple industry has been buffeted by these global trends, and has also been affected by special conditions in Canada. Together, these pressures have affected the long-term viability of the industry.
DECLINING NUMBERS OF APPLE GROWERS, AND OF ACREAGE AND PRODUCTION The Canadian apple industry has suffered substantial declines, by most major measures, in the last decade. Area harvested fell by one third between 1999-2001 and 2009-2011. Production fell from an average of 527,000 metric tons in 1999-2001 to 373,000 metric tons in 2009-2011, a slightly smaller decline of about 30%. The numbers of apple producers and of individual orchard holdings have also declined rapidly. The shrinkage of the industry has made it increasingly difficult to marshal the needed resources to orchestrate an industry turnaround.
INCREASED IMPORT COMPETITION A major contributing factor to the problems of the industry has been the increase in imports of fresh apples and of apple juice concentrate. Cheap imported apple juice concentrate from China has come to dominate the apple juice category and has led to lower prices being paid to producers of processing apples. Canada's fresh apple imports first exceeded 100,000 metric tons in 1994, passed 150,000 metric tons in 2004 and could surpass 200,000 metric tons by 2014. Even more of a threat has come from the nature of the imports. Imported varieties like Gala, Fuji and Granny Smith have displaced home-grown favorites such as McIntosh with many Canadian consumers. Because of climatic conditions, many of these newer varieties do not flourish in Canadian orchards.

B.C. Apple Industry Strategic Choices and Directions
globalwiseinc. page 4
TRANSFERRING ACREAGE TO ALTERNATIVE FRUITS AND BERRIES Rather than attempt to compete with imported apples, many Canadian apple producers have switched to production of sweet cherries, wine grapes and berries, especially blueberries. In the Okanogan Valley, considerable apple acreage has switched to wine grapes and sweet cherries. The relatively high cost of land has been a further incentive for a switch to higher-valued crops.
Trends in B.C. Apple Industry Trends in the B.C. apple industry have been influenced by similar factors to those that have affected all of Canada. In addition, there have been unique factors in the Okanagan Valley that have altered the trajectory of the B.C. apple industry.
DECLINING NUMBERS OF APPLE GROWERS, AND OF ACREAGE AND PRODUCTION Acreage in apple production declined in B.C. by 40% between 2000 and 2011, slightly faster than the 36% decline for the entire Canadian apple industry. Marketed production in both B.C. and Canada declined by 26% in the decade. In 2011, B.C. marketed 96,614 metric tons of apples, about one quarter of the 390,362 metric tons marketed by the Canadian apple industry, about the same share as in 2000. Surveys suggest that most of the decline in acreage has been among mid-sized growers.
LAND COST AND AVAILABILITY Due to past governmental decisions, the land available for orchard production in the Okanagan Valley has tended to be in relatively small blocks. Thus, it has been difficult for orchardists to gain economies of scale by combining contiguous blocks into a larger holding. In addition, the demand for land for housing, industrial, commercial and competing agricultural uses has been strong. The Okanagan Valley has been an attractive destination for affluent retirees. It has also become an attractive location for small wineries. These forces were exacerbated in the boom years before the global financial crisis of 2008. We heard many anecdotal stories about acreage suitable for wine grapes being sold for $100,000 or more, about 10 times the price of comparable land just south of the border in Washington State. The high price of land may have acted as an incentive for some, especially older, landowners to cash out of farming.
LABOR COST AND AVAILABILITY We also heard much anecdotal evidence that labor costs at both the orchard and packing house level in B.C. were relatively high, and contributed to higher unit costs. Farmers often had to make special efforts to acquire labor, for example, under a program that allows the hiring of temporary workers from Mexico. These programs are useful for increasing the supply of farm labor.
INCREASED IMPORTS, REDUCED EXPORTS The once flourishing apple export market in B.C. has eroded over time due to a combination of factors. The emergence of China has snuffed out export opportunities in Asia. Sales to Europe have been limited by the EU's variable levy system. As mentioned previously, competition from other exporters has intensified. Finally, the exchange rate of the Canadian dollar has made Canadian products more expensive in many export markets. For example, the average rate of exchange for Canadian dollars against U.S. dollars moved from 1.49 in 1999-2001 to 1.07 in 2009-2011. While the strong Canadian dollar benefits importers and consumers of apples, it is a further blow to apple producers. Despite all these negative forces, exports continue to be made on an opportunistic basis to the United States, Mexico and Asian countries.

B.C. Apple Industry Strategic Choices and Directions
globalwiseinc. page 5
TRANSFERRING ACREAGE TO ALTERNATIVE FRUITS AND BERRIES Another major factor in the decline of apple acreage and production has been the conversion of apple acreage for production of other fruits and berries. Table 1 provides estimates for harvested acreage, farm value of sales, and average sales per acre, for apples and five competing fruits in B.C. and in Canada. Harvested acreage of apples, pears and strawberries has fallen sharply in both Canada and B.C., while acreage of blueberries, sweet cherries and grapes has risen sharply, especially in B.C. While the farm value of sales per acre has risen for all fruits except blueberries in B.C., these do not take account of the substantial inflation in the decade. However, the total value of farm sales declined for apples and pears in both Canada and B.C. and for strawberries in B.C. In contrast, the value of farm sales of blueberries, sweet cherries and grapes more than doubled in B.C., and that of blueberries and grapes came close to doubling for all of Canada. Table 1 also suggests that much of the acreage removed from apples in B.C. was transferred to other tree fruits such as sweet cherries and grapes. In the rest of Canada, very little of the lost apple acreage went into other tree fruits.
Table 1: Canada and British Columbia Estimates of Harvested Acres, Value of Farm Sales and Farm Sales per Acre,
For Apples and Five Competing Fruits, 2000 and 2011
2000 2011
Fruit Harvested Acres
Value of Farm Sales
Farm Sales per
Acre
Harvested Acres
Value of Farm Sales
Farm Sales per
Acre
(#) ($’000) ($) (#) ($’000) ($) Canada Apples 59,990 183,717 3,062 39,325 160,469 4,081 Blueberries 58,830 106,085 1,803 94,920 203,449 2,143 Sweet Cherries 2,505 14,120 5,637 3,710 33,115 8,926 Grapes 21,560 62,695 2,908 26,324 112,574 4,276 Pears 3,470 10,171 2,931 1,713 6,992 4,082 Strawberries 11,525 53,550 4,646 7,709 72,396 9,391 British Columbia Apples 13,550 39,230 2,895 8,581 37,807 4,406 Blueberries 6,700 43,350 6,470 17,625 105,757 6,000 Sweet Cherries 1,700 10,985 6,462 3,233 30,838 9,539 Grapes 5,500 16,950 3,082 8,606 39,333 4,570 Pears 850 3,500 4,118 511 2,500 4,892 Strawberries 1,470 7,630 5,190 558 5,685 10,188
Source: B.C. Ministry of Agriculture and Agriculture and Agri-Food Canada.
ROLE OF NEW VARIETIES AND APPLE REPLANT PROGRAMS The leaders of the apple industry in British Columbia were early in recognizing that consumer tastes were moving away from their traditional varieties and that it would be beneficial to assist producers in replanting
B.C. Apple Industry Strategic Choices and Directions
globalwiseinc. page 6
orchards to newer, more competitive varieties. Between 1991 and 2010, a total of 6,324 acres of apples were replanted under these schemes. The leading new varieties planted were Gala (43%), Fuji (9%), Spartan (8%) and Ambrosia (13%). It is not known how many of these replanted acres were subsequently removed when orchard ownership or crop mix changed. The best available data for 2010 indicates that newer varieties accounted for about 54% of total acreage with the remainder still in older varieties like Spartan, McIntosh and Red and Golden Delicious.
The B.C. replant program has aided the trend toward newer, better suited apple varieties. The effort and investment needs to be further accelerated to improve the B.C. competitive position.
GROWER INTENTIONS SURVEY RESULTS The March 2012 B.C. grower survey and analysis by Ipsos Reid provides valuable current insight on fruit grower actions and intentions. It also allows for comparisons to a similar survey conducted in 2005. The data is a random sample drawn from growers who are members of the B.C. Fruit Growers' Association, which covers the vast majority all tree fruit growers in the province.
The 2012 survey shows the average of 18.9 acres of tree fruits grown per respondent which is virtually unchanged from the 2005 survey. However the 2012 survey shows the average acreage in apples was 10.1 acres of apples per grower which is down significantly from 2005 when the average was 14.0 acres of apples per grower. This reveals the degree of shift in acreage to the other tree fruits.
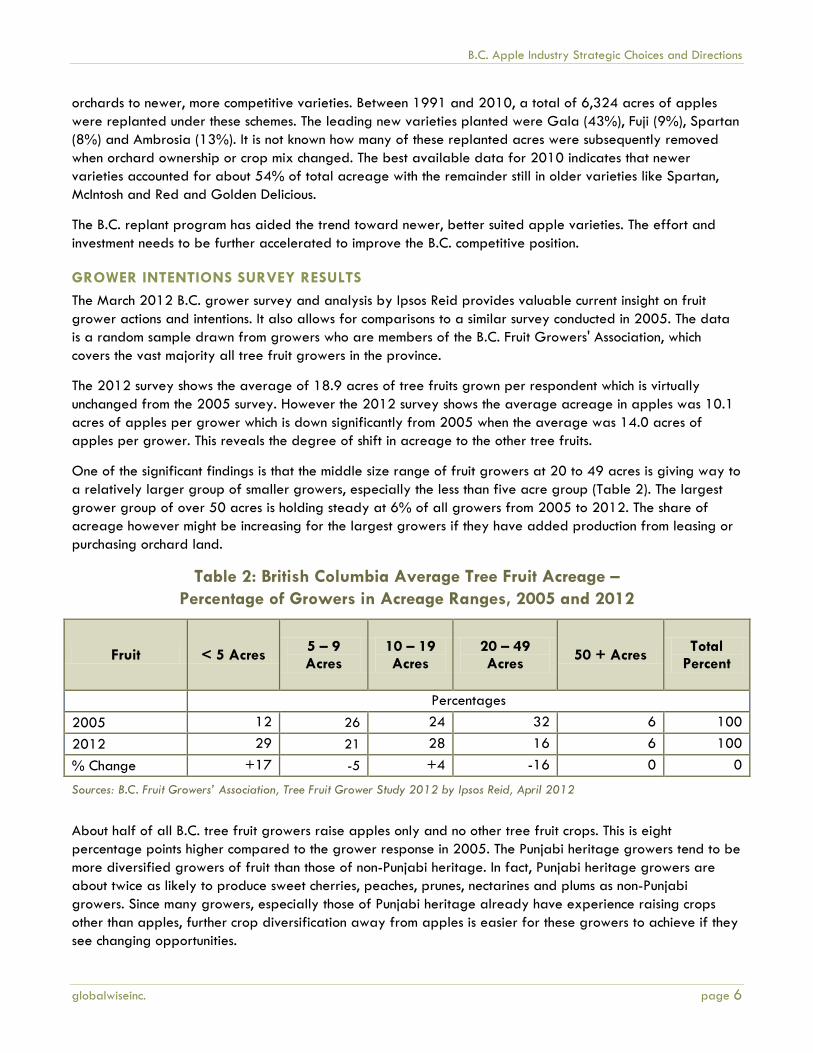
One of the significant findings is that the middle size range of fruit growers at 20 to 49 acres is giving way to a relatively larger group of smaller growers, especially the less than five acre group (Table 2). The largest grower group of over 50 acres is holding steady at 6% of all growers from 2005 to 2012. The share of acreage however might be increasing for the largest growers if they have added production from leasing or purchasing orchard land.
Table 2: British Columbia Average Tree Fruit Acreage – Percentage of Growers in Acreage Ranges, 2005 and 2012
Fruit < 5 Acres 5 – 9 Acres
10 – 19 Acres
20 – 49 Acres 50 + Acres Total
Percent
Percentages 2005 12 26 24 32 6 100 2012 29 21 28 16 6 100 % Change +17 -5 +4 -16 0 0
Sources: B.C. Fruit Growers’ Association, Tree Fruit Grower Study 2012 by Ipsos Reid, April 2012
About half of all B.C. tree fruit growers raise apples only and no other tree fruit crops. This is eight percentage points higher compared to the grower response in 2005. The Punjabi heritage growers tend to be more diversified growers of fruit than those of non-Punjabi heritage. In fact, Punjabi heritage growers are about twice as likely to produce sweet cherries, peaches, prunes, nectarines and plums as non-Punjabi growers. Since many growers, especially those of Punjabi heritage already have experience raising crops other than apples, further crop diversification away from apples is easier for these growers to achieve if they see changing opportunities.

B.C. Apple Industry Strategic Choices and Directions
globalwiseinc. page 7
Another important finding is that 82% of growers do not know what varieties of apples they would likely plant over the next five years. A corresponding high percentage of growers do not know what varieties they might decrease over the next five years.
The current survey also revealed that growers are more likely to replant tree fruits with a provincially backed replant program. Subsequent to the survey, the B.C. government announced a $2.0 million replant program which is an important positive step for the industry.
Current Competitiveness of Industry Sectors The competitiveness of any apple producing region is dependent on the combined performance of all key parts of the system. Growers need to be comparable to major competitors in terms of productivity and unit costs of production. They need to be supported by storage systems that maintain fruit at optimal quality for long periods, and by packing systems that can efficiently match retailers' specifications. Finally, growers need the services of sophisticated marketing organizations that can find the best markets for their products and provide them with the best possible returns. This section reviews the major components of the B.C. apple industry.
Growers As the number of apple growers, and the acres harvested, have declined, increasing the productivity of the remaining orchards is critical to maintenance of the B.C. apple industry.
AVERAGE YIELDS Direct comparisons of average yields are difficult to make because yields in any year can be distorted by unusual weather. One way to reduce the distortion is to use three-year averages. For the three seasons 2009-2011, the average yield per hectare for 32 major apple producing countries in the world was 17.9 metric tons. The average yield for all Canada was 22.8 metric tons, and that for British Columbia was 25.5 metric tons. However, both B.C. and Canada lagged the average yield of 30.2 metric tons for their nearest rival, the United States. They lagged far behind the average yields of New Zealand (55.8), Chile (44.1) and Italy (40.4). These yield comparisons are very similar to those reported by Ference Weicker & Company in their 2006 report, "Strategic Plan for the Tree Fruit Industry." Over time, the productivity of the B.C. apple industry has been above the world average, but has lagged that of many of its most relevant competitors. The cooler climate in B.C. compared to Washington State, New Zealand, etc. makes it more difficult to obtain high yields. However, B.C. growers could offset that effect somewhat by doing a better job of growing young trees and managing mature ones and by specializing in varieties suited to the shorter growing season and cooler B.C. climate.
FRESH PACKOUT While average yields are important, the quality of those yields is even more important to grower returns. Limited data for the 2010 season indicate that 64.6% of B.C. production handled by Okanagan Tree Fruit Cooperative (OTFC) was packed fresh. In the same year, 82% of production across the border in Washington State was packed fresh. Only one minor variety handled by OTFC, Braeburn, had a packout percentage greater than 80%. For five varieties, Ambrosia, Gala, Fuji, Golden Delicious and Granny Smith, the packout percentage was between 70 and 80%, for Spartan, Red Delicious and Honeycrisp, it was between 60 and 70%, and for McIntosh, it was a dismal 44.2%.
By combining average yields per acre with fresh packout percentages, we were able to estimate the fresh packs per acre for major varieties in B.C. for 2010 and in Washington State for the three-year average

B.C. Apple Industry Strategic Choices and Directions
globalwiseinc. page 8
period, 2009-2011 (Table 3). Clearly, Washington State had an advantage in fresh packs produced per acre for all varieties and a major (over 50%) advantage in fresh yields for Fuji, Red Delicious, Golden Delicious and Braeburn. In the major B.C. variety, Gala, Washington State had a 48% advantage. Even if allowance is made for a higher percentage of younger trees in B.C. orchards due to the replant programs, the differences in productivity are still striking. Improving the productivity of B.C. orchards will be critical to any revival of the B.C. apple industry.
Table 3: British Columbia and Washington State Average Production Of Fresh Packs per Acre, by Variety
Variety British Columbia 2010
Washington State 2009-2011
Difference In Percent
Ambrosia 526.7 n.a. n.a. Gala 491.6 727.8 +48.0 Spartan 452.9 n.a. n.a. McIntosh 394.3 n.a. n.a. Fuji 310.5 580.2 +86.9 Golden Delicious 478.4 724.5 +51.4 Red Delicious 477.7 807.3 +69.0 Granny Smith 528.2 716.2 +35.6 Honeycrisp 387.5 542.0 +39.9 Braeburn 79.6 738.4 +827.6 Jonagold n.a. 689.4 n.a. Cameo n.a. 335.5 n.a. Cripps Pink n.a. 674.5 n.a. Other 137.7 733.7 +432.8
Total 387.0 704.9 +82.1
Sources: B.C data provided by B.C. Ministry of Agriculture, Washington data from Washington Agricultural Statistics Service, Annual Statistical Bulletin, 2010.
AVERAGE RETURNS The information on average returns to B.C. orchardists also tends to be piecemeal. Table 1 showed that the average value of farm sales per acre of apples in B.C. in 2011 was $4,406, or 8% above the average for all Canadian apple orchards, and 52.2% above the level in the year 2000. However, the average return per pound was only 17.7 cents. A cost of production study of B.C. apple orchards in 2011 indicated that direct costs of a mature orchard amounted to 22.6 cents, and indirect costs added a further 9.7 cents. Thus, on average B.C. apple growers would have been losing money in 2011. They could only stay in business by subsidizing direct costs out of other income. They would also have had to find other sources of income to cover indirect costs. Clearly, many B.C. apple operations are unsustainable at the present levels of orchard returns.
VARIETAL OPTIONS As previously noted, the B.C. apple industry was very proactive in planting newer varieties in place of older varieties that had fallen out of favor with consumers. However, the solution was only partial. While the plantings of Gala and Ambrosia apples have been relatively successful, a number of new varieties that have
B.C. Apple Industry Strategic Choices and Directions
globalwiseinc. page 9
been tried have had mixed success, while some replanting involved older varieties. As a result, almost half of B.C. apple acreage is still tied up in varieties that generate poor yields, or poor prices, or both. Much work still needs to be done to modernize the productive capacity of the industry. The recently announced replant program is a step in the right direction, but the funds currently allocated will not be sufficient to complete the transformation of the industry.
Storage and Packing
CRITICAL ROLE OF OKANAGAN TREE FRUIT COOPERATIVE In the 2005-07 seasons, an average of 6.5 million boxes of apples was produced in B.C. Most of these were packed by four regional cooperatives. Each suffered from aging facilities and insufficient scale to afford the technologies available to their global competitors. A rational decision was made to merge these entities into a single organization, the Okanagan Tree Fruit Cooperative. OTFC's first year of operation was the 2008-09 marketing year when B.C. apple production hit a low point of 3.1 million boxes. It has averaged 4.2 million boxes in the following three seasons, but it is forecast to bounce back to 5.5 million boxes in 2012-2013, still 15% below the pre-merger level. The OTFC apple volume has not been hit as hard. It averaged 108,874 tons pre-merger in 2005-07 and 107,631 tons in 2008. It slipped to 94,598 tons in 2009 and 86,813 tons in 2010, about 20% below 2005-07 levels.
In the OTFC's first season, the global financial crisis hit and the property boom in B.C. crested, at least temporarily. This made it difficult for OTFC to generate much needed cash from the sale of surplus properties. It arranged a demand operating credit facility of $29,500,000 from CIBC. At the end of the 2010-11 season, its bank indebtedness was still $20 million. OTFC believed that the proceeds of sales of surplus properties could exceed $30 million, enough to pay down debt and contribute to its Futures Facilities project. However, it would also need government help for that project, to build globally competitive, state-of-the-art packing and storage facilities.
The financial position of OTFC remains precarious. Its current ratio (current assets over current liabilities) was 0.631 at the end of the 2010-11season. It has made drastic reductions in general and administrative expenses by reducing its management wages. However, indirect expenses have continued to creep up. A sudden reduction in crop proceeds or the volume shipped to the cooperative in a future year, such as from a trucking strike or apples being bid away by Eastern packers, could threaten its solvency as a going concern.
In May 2012 interviews were held with managers or board members of four fresh apple packers in B.C. The questions posed to the packers are given in Appendix A. This survey revealed that all packers, even the independents who compete with OTFC, value the role of the cooperative in building and maintaining consumer awareness of B.C. fruit. There was general agreement that the size of the OTFC was also an advantage for selling to larger retailers. Concern was expressed that without the cooperative, new small packers would underline the pricing of the fruit and harm overall returns realized by the industry.
COMPARISONS WITH CHELAN COOPERATIVE Comparisons between the operations of OTFC and Chelan Cooperative in Washington State were begun under Phase I of the project and continued in phase II. Chelan Cooperative is also the result of mergers of smaller cooperatives, but it has had more time to streamline the merged operations, while OTFC is still completing that process. However, in 2010-11, Chelan Cooperative handled more than twice as much fruit as

B.C. Apple Industry Strategic Choices and Directions
globalwiseinc. page 10
OTFC on a similar asset base and with slightly lower total expenses. Chelan Cooperative had a healthy financial situation with a current ratio of 1.416 and positive working capital of $13 million.2
Of greater concern to B.C. growers was that OTFC packing charges per box of apples in 2010-11 were $11.53 compared to $8.13 for Chelan Cooperative. Grower fresh returns per box from OTFC were $9.59, compared to $11.66 from Chelan Cooperative. This is crucial because OTFC handles an estimated 85% of all B.C. apples. With a declining crop base, it will be extremely difficult for OTFC to reduce fixed costs per unit. While acquisition of a new state-of-the-art facility could lead to some efficiencies, if it required additional borrowing by OTFC, it would be likely to drive up fixed costs per unit. Without very substantial government grants, it will be difficult for OTFC to acquire the modern infrastructure it needs to compete.
ROLE OF INDEPENDENT PACKERS An estimated 15% of B.C. apples are handled by independent packers. However, these tend to be small, serve only nearby growers, or serve a niche such as the organic market. In one sense, inefficiencies at OTFC help provide a ceiling under which independent packers can continue to operate. However, the independent packers we interviewed were concerned that dissatisfaction with OTFC would lead to other small, poorly capitalized packing operations being set up. This would further weaken OTFC's crop base and further fractionate B.C. apple marketing efforts.
The recent 2012 entry of Eastern packers willing to buy bulk bins of apples happens when packers in other regions face localized shortages. Generally these are abnormal, short-term responses which end once temporary imbalances in supply are resolved. However, this periodic disruption adds to the complexity and uncertainties for a local packer such as OTFC.
PROBLEMS OF FINANCE, LABOR AND SUCCESSION Both OTFC and independent packers face common problems in getting financing for modernization and in acquiring the needed labor at reasonable wage rates to operate their plants. The small, independent packers also face problems in attracting skilled management to replace existing managers, given the many uncertainties surrounding the future supply of B.C. apples and the future pressure from retailer customers for an expanded array of services.
Marketing
CRITICAL ROLE OF B.C. TREE FRUITS B.C. Tree Fruits celebrated its 75th anniversary as a marketing agency in 2012. It has built an excellent reputation as a merchandiser in the produce trade. It is now a wholly-owned subsidiary of OTFC, responsible for marketing 85% of the B.C. apple crop in addition to sweet cherries, pears, and stone fruit. As the dominant B.C. apple marketer, B.C. Tree Fruits has good access to major Canadian retailers. However, since its mix of varieties is limited, retailers must turn to suppliers from Washington State, Chile, New Zealand, etc., for many of the newer varieties consumers demand. As a result, access for B.C. Tree Fruits appears to provide little in the way of price premiums. If the B.C. apple crop continues to shrink, it will reduce the number of sales representatives, the size of promotional budgets and the relative clout of B.C. Tree Fruits with major retailers.
Another concern arises about whether in its role as a subsidiary of OTFC, B.C. Tree Fruits will be called on to "find a home" for what is produced and packed. B.C. Tree Fruits needs to maintain its role as a marketing
2 Due to near parity of the Canadian dollar and the U.S. dollar, B.C. and U.S. comparisons are made directly in each currency without currency conversion.

B.C. Apple Industry Strategic Choices and Directions
globalwiseinc. page 11
agency that can transmit back to packers and growers what changes they need to make to meet the changing demands of consumers and retailers.
IMPORTANCE OF WESTERN CANADA MARKETS As the B.C. apple crop has shrunk, B.C. apple sales have gradually pulled back from most distant markets (both in Canada and in export markets) and become increasingly concentrated in western Canada. The combined population of British Columbia and Alberta was 8.045 million in 2011. If per capita consumption was at the Canadian average of 11 kg (22 pounds) per capita, these two provinces would have consumed about 4.4 million boxes of apples annually, almost twice the total B.C. apple production. While western Canada offers the B.C. apple industry a large and profitable market, it is also open to apple supplies from many other countries. Overdependence on the western Canada market could create additional vulnerability for the B.C. apple industry.
ROLE OF INDEPENDENT MARKETERS Existing independent packers either sell their own fruit, or rely on independent marketers who attempt to fill niches not filled by B.C. Tree Fruits. The existing independent B.C. packers show minor interest in expanding apple production and marketing so it is not likely they will make up for potential future declines by OTFC. However, the independent packers are concerned that any new, independent B.C. packers will attempt to use price cutting tactics to gain market access and undermine the B.C. Tree Fruits marketing effort.
INFLUENCE OF “LOCAL” SALES The Okanagan Valley has a thriving tourist trade in the summer months. This is more conducive to local sales of summer fruits such as sweet cherries and peaches, than to sales of fresh apples which only become available as the tourist season is ending. There are opportunities for local sales to residents of the Okanagan Valley. However, we did not find any data on the size of this trade. The word “local” has also been co-opted by some activists who want to support domestic suppliers against outsiders, and by other activists that oppose large commercial operations like OTFC and B.C. Tree Fruits. At this stage, it is too early to project how these different strains of buy local will impact the B.C. apple industry. B.C. Tree Fruits is confident that there is a preference in Western Canada for B.C. fruit as opposed to imported fruit. However the data available for this analysis does not reveal a price premium for B.C. apples. If B.C. Tree Fruits has such data it should be shared with the industry.
The B.C. government announced on August 30, 2012 a $2 million investment to help B.C. farmers and food processors promote local foods. However, at present there is little detail on the workings of the program.
OTHER NICHE MARKETS At certain times, opportunities arise in specific markets that have a preference for particular varieties. While other countries are the major suppliers of those varieties, existing or new buyers may have reasons to seek alternative sources such as B.C. Such sales can be made on an opportunistic basis. They include opportunities for sales of Fuji to Taiwan, Ambrosia and McIntosh to the United States, and Red Delicious to India and Mexico. Marketers need to be flexible enough to meet these demands when they arise.
DANGER OF SPLINTERING MARKETING EFFORT As previously noted, under the present market situation, independent marketers adjust their pricing strategies to avoid conflict with B.C. Tree Fruits. As a result, FOB prices for B.C. apples are commensurate with those for other suppliers with similar varieties, grades and sizes. However, there is widespread concern that if more entities become unhappy with the returns from OTFC, they will set up additional independent packers and
B.C. Apple Industry Strategic Choices and Directions
globalwiseinc. page 12
marketers that lead to chaotic market conditions and make viability even more difficult for every segment of the industry. This is one more reason why it is so vital for OTFC to transition rapidly to an efficient, modern, low cost entity so it can retain the volume of fruit needed to get maximum economies of scale. OTFC has made some progress with cost reductions and increased returns to apple growers. Returns have risen from $0.14 per pound to $0.17 per pound in 2011. However this is still far below the estimated 2011 cost of production of $0.32 per pound discussed previously.
Cooperation and Communication among Industry Sectors
OTFC and Apple Producers The main source of tension between OTFC and apple producers is OTFC's relatively high packing charges, and producers' resultant relatively low returns. By some estimates, B.C. apple growers need an additional 10 cents per pound to break even. Some of that gap could be bridged by lowered unit costs at OTFC. An additional source of tension has been OTFC's efforts to cut off low quality suppliers, especially those suppliers who can produce only small volumes of apples. What may be necessary for the long term viability of the industry can cause resistance among the affected producers, especially in a one-person, one-vote cooperative. It is important to explain clearly in advance what changes are being contemplated, the reasons for the changes, and how growers can achieve change on their farm to remain members of the OTFC. There is some concern that the cooperative has not communicated or provided growers with options to adjust their operations.
OTFC has made an effort to win cooperation from producer members for their long-term plans through a series of grower meetings and newsletters. However, often those who most need to hear the message are least likely to attend meetings or read circulars. OTFC needs to be much more transparent in its operations and more aggressive in its outreach programs.
OTFC and B.C. Tree Fruits As previously noted, B.C. Tree Fruits has now become a subsidiary of OTFC. We were not able to ascertain how that relationship operates in practice. As discussed above, our main concern is that B.C. Tree Fruits continue to retain the independence to convey back to producers the unvarnished realities of the market place.
B.C. Tree Fruits and Apple Producers During its 75 year history, B.C. Tree Fruits has enjoyed varying relationships with apple producers. In some cases, this has been the result of government policies that put B.C. Tree Fruits in confrontation with other elements in the B.C. apple industry. In recent years, some producers have blamed their low orchard returns on the failure of B.C. Tree Fruits to get sufficiently high prices for packed fruit. However, the evidence we have seen suggests that B.C. Tree Fruits has earned prices comparable to those of major competitors for similar fruit. B.C. Tree Fruits may also need to be more aggressive in its outreach programs in explaining how market forces influence the prices they can generate.
Independent Packers and Apple Producers The small number of independent packers work closely with a tight group of producers that they service. Communication is made easier because the packing houses are close to most producers and because of

B.C. Apple Industry Strategic Choices and Directions
globalwiseinc. page 13
longstanding personal relationships. It would not be possible to duplicate such close ties across the length and breadth of the Okanagan fruit growing area. This makes it all the more important for the large entities like OTFC and B.C. Tree Fruits to find alternative methods for improving communications and building cooperation.
Potential Future Scenarios for B.C. Apple Industry
Known and Potential Future Risks The B.C. apple industry faces a number of known current risks and future potential risks. Among the known risks are the high costs of land and the relatively low grower returns which make it difficult for producers to earn a profit that can be ploughed back into upgrading their operations with new varieties and improved technologies. The future risk is that producers will continue to exit the apple industry and that acreage and production will continue to fall. This will tend to reduce economies of scale in packing and marketing.
For the packing industry, there is perhaps a high risk that growers will not be supportive of acquiring the capital needed to modernize its facilities. However, without modernization, producers will not have the support of the modern packing and storage infrastructure that they need to compete successfully. The risk of failure by OTFC would be increased by any further reduction in apple supplies. In turn, if OTFC fails to modernize, it increases the risk that other independent packers will emerge, further draining supplies from OTFC, and adding the risk of chaotic pricing.
Other long-term risks include the possibility that per capita consumption of fresh apples will continue to fall and that supplies of imported apples will continue to increase, putting further downward pressure on market prices. This would be particularly hazardous for the B.C. apple industry if western Canada markets were heavily impacted.
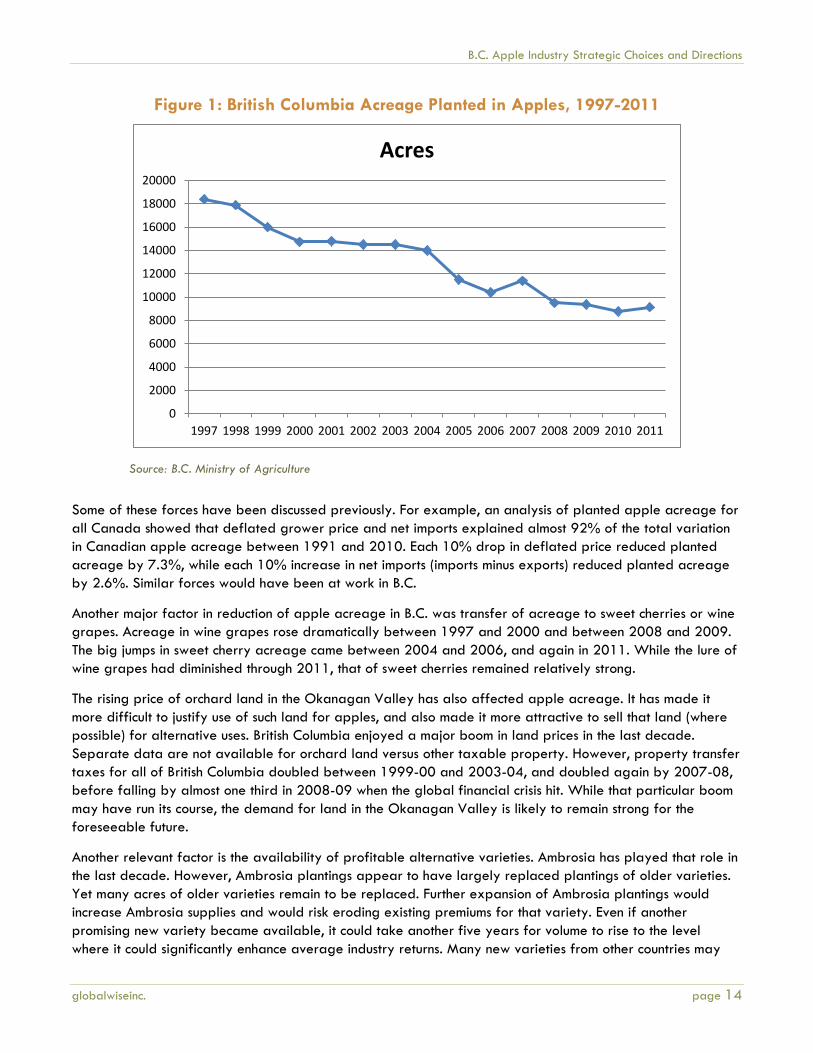
Industry Scenario Based on Continuation of Current Trends Figure 1 shows the trend in planted acreage of apples in British Columbia between 1997 and 2011. While it is impossible to predict future trends in acreage and production, it is possible to define alternative future scenarios based on an assessment of past forces that impacted producer decisions about continuation, removal or addition of apple acreage, and on likely future forces. The implications of these scenarios for the apple industry, and the actions suggested by each scenario are discussed further.
While B.C. apple acreage has declined by 50% between 1997 and 2011, the rate of decline has not been steady. For example, acreage declined by 20% between 1997 and 2000, changed little between 2000 and 2004, declined by 32% between 2004 and 2008, and then stabilized somewhat after 2008. This pattern suggests that forces built up over a number of years before they led a substantial number of producers to reduce their apple acreage.
B.C. Apple Industry Strategic Choices and Directions
globalwiseinc. page 14
Figure 1: British Columbia Acreage Planted in Apples, 1997-2011
Source: B.C. Ministry of Agriculture
Some of these forces have been discussed previously. For example, an analysis of planted apple acreage for all Canada showed that deflated grower price and net imports explained almost 92% of the total variation in Canadian apple acreage between 1991 and 2010. Each 10% drop in deflated price reduced planted acreage by 7.3%, while each 10% increase in net imports (imports minus exports) reduced planted acreage by 2.6%. Similar forces would have been at work in B.C.
Another major factor in reduction of apple acreage in B.C. was transfer of acreage to sweet cherries or wine grapes. Acreage in wine grapes rose dramatically between 1997 and 2000 and between 2008 and 2009. The big jumps in sweet cherry acreage came between 2004 and 2006, and again in 2011. While the lure of wine grapes had diminished through 2011, that of sweet cherries remained relatively strong.
The rising price of orchard land in the Okanagan Valley has also affected apple acreage. It has made it more difficult to justify use of such land for apples, and also made it more attractive to sell that land (where possible) for alternative uses. British Columbia enjoyed a major boom in land prices in the last decade. Separate data are not available for orchard land versus other taxable property. However, property transfer taxes for all of British Columbia doubled between 1999-00 and 2003-04, and doubled again by 2007-08, before falling by almost one third in 2008-09 when the global financial crisis hit. While that particular boom may have run its course, the demand for land in the Okanagan Valley is likely to remain strong for the foreseeable future.
Another relevant factor is the availability of profitable alternative varieties. Ambrosia has played that role in the last decade. However, Ambrosia plantings appear to have largely replaced plantings of older varieties. Yet many acres of older varieties remain to be replaced. Further expansion of Ambrosia plantings would increase Ambrosia supplies and would risk eroding existing premiums for that variety. Even if another promising new variety became available, it could take another five years for volume to rise to the level where it could significantly enhance average industry returns. Many new varieties from other countries may
0
2000
4000
6000
8000
10000
12000
14000
16000
18000
20000
1997 1998 1999 2000 2001 2002 2003 2004 2005 2006 2007 2008 2009 2010 2011
Acres

B.C. Apple Industry Strategic Choices and Directions
globalwiseinc. page 15
not adapt well to B.C. growing conditions. Thus, the industry may have to depend for most of its new varieties on future breakthroughs by the breeding program at Summerland.
Finally, demographics could significantly influence the decisions of B.C. apple producers about their future in the apple industry. A study by Ipsos Reid in 2012 estimated that 25% of tree fruit growers were aged 60 to 74 and 10% 75 years or older. These older producers are more likely to leave the industry in the next decade. While some may leave their orchards to their heirs, or sell them to younger operators, some of their acreage in apples is likely to be removed when they exit the industry. In a comparable 2005 study, Ipsos Reid found that 30% of growers planned to leave the industry in the next five years while a further 23% planned to leave in 5 to 10 years. In fact, the actual reduction in apple acreage between 2005 and 2011 was about 20%. In the 2012 survey, Ipsos Reid found that 22% planned to leave the industry in less than five years and 41% in 5 to 10 years. Allowing for the fact that some exiting apple growers might sell their orchards, or pass them along to younger family members as going concerns, the actual decline in apple acreage by 2021 could be in the range of 10 to 20%.
It seems unlikely that any of these negative forces will be alleviated soon. Competition from imports is not likely to diminish. This will keep downward pressure on average B.C. apple prices. Transferring land to competing fruits, such as sweet cherries and wine grapes, will remain attractive to apple growers as long as expansion of those alternative fruits is not overdone. The demand for orchard land for alternative fruits and for non-farm uses is likely to remain strong. It will continue to be difficult to find newer varieties for which the B.C. apple industry can find unique niches. Finally, the large number of older growers will make exiting from the industry attractive for many, especially the non-Punjabis who tend to be older. Based on these trends, two alternative scenarios for future acreage and production are presented in Table 4.
Table 4: British Columbia Alternative Scenarios for Apple Acreage and Production, 2011, 2016 and 2021
Scenario Item Units 2011 2016 2021
Percent Change 2011-2021
1. Moderate Decline
Acreage Harvested
# 8,581 8,152 7,723 - 10.0
Yield lbs. 24,822 26,088 27,418 + 10.5
Production 1,000 lbs.
213,000 212,669 211,749 - 0.6
2. Significant
Decline Acreage
Harvested # 8,581 7,723 6,865 - 20.0
Yield lbs. 24,822 26,088 27,418 + 10.5
Production 1,000
lbs. 213,000 201,478 188,225 - 11.6
Source: Projections by Belrose, Inc. and Globalwise Inc.
B.C. Apple Industry Strategic Choices and Directions
globalwiseinc. page 16
The first scenario assumes a moderate decline of 10% in apple acreage harvested between 2011 and 2021. The second assumes a significant decline of 20%. It is assumed that average yields will continue to increase at the trend level of one percent per year. Under scenario 1, increases in average yields would almost compensate for acreage declines. Under scenario 2, production would fall by 5.4% by 2016 and by 11.6% by 2021.
Under scenario 1, the volume of apples for fresh packing would change little in the decade. Given the customary shares diverted to processing and handled by independent packers, about 3 million packed boxes would remain to be handled by OTFC. Under scenario 2, only about 2.7 million boxes would be handled by OTFC. If the acreage decline was even more severe than in scenario 2, the OTFC pack could easily fall below 2.5 million boxes. On the other hand, such a fall could be averted if average yields increased at a faster rate than the past trend rate. Another factor to consider is that these forecasts are point estimates. Due to normal year-to-year variations in yields due to weather, actual yields could be higher or lower in any future year. Thus, under the second scenario, OTFC would need to plan to handle a range of packs between 2.0 and 3.0 million boxes.
Potential Remedial Actions
Grower Level Clearly, many B.C. apple producers need to make major adjustments in the varieties that they grow, and major improvements in average yields and fresh packouts from their orchards, if they are to continue to operate their orchards on a sustainable basis. We define a “sustainable” orchard as one that generates adequate annual income for the grower, and that also generates enough surplus that can be reinvested in continually upgrading the orchard. That is the standard that competitors in other countries that supply the Canadian market are setting. The intensity of global competition means that standards for yields and quality will continue to rise in the future.
The key to improvement lies initially with each individual grower. If he, or she, does not make a commitment to the need for continual improvement, it will not occur. A second key is to work with like-minded, neighboring growers to share information, techniques and production and marketing strategies. Many growers around the world have formed such groups for mutual support. Once such small groups of growers learn what the major weaknesses of their operations may be, they can call upon outside resources such as packing house fieldmen, extension workers, researchers or industry organization executives to provide support.
In many countries, special organizations for younger growers have been very successful. Younger growers have more common interests and are often more open to new ideas than the broad array of growers. For example, in the United Kingdom, the organization of Under 40s Fruit Growers has local chapters and also holds biennial conferences and study tours in different major fruit-growing regions. These activities are self-financed.
In other countries, national efforts have been made to help improve orchard operations. For example, to prepare its growers for the ending of import protection, the Australian national body, the Apple and Pear Association Limited (APAL), launched a program in 2006 called “Future Orchards” to bring orchardists up to international competitiveness standards. Sub-goals were to increase orchard productivity, lower unit costs and increase the percentage of premium fruit harvested. The initial funding for the project was $1 million (Australian dollars) generated from existing levy funds. A New Zealand consulting firm, AgFirst, was hired to lead orchard tours and give demonstrations of improved orchard techniques in Australia's six major producing districts, with the goal of converting all Australian orchards to intensive production systems by 2012. The

B.C. Apple Industry Strategic Choices and Directions
globalwiseinc. page 17
“Future Orchards 2012 project” was renewed for a further three years in 2008, and is likely to continue in some form in the next few years. In APAL’s 2011-2012 annual report, chairman John Lawrenson comments: “It is interesting to note that approximately 25 to 30% of Australian growers have achieved world best practice. We believe the next 40 to 50% could also become internationally competitive if given appropriate assistance to work through the changes that will be needed.”
The New Zealand pipfruit (apple and pear) industry has a long history of coordinating nationwide projects to improve its competitiveness. In the 1990s, when the industry was highly centralized, a major effort was undertaken to have all New Zealand growers adopt integrated production methods in order to enhance New Zealand's “clean, green” reputation. In recent years, retailers in major markets have been indicating that they will soon require that apples and pears have zero chemical residues.
In response, in the 2007-08 season, the national body, Pipfruit New Zealand, which represents growers, packers and exporters, launched an “Apple Futures” program in partnership with the economic development agencies from the three major pipfruit producing regions. While the ultimate goal of zero chemical residues is not yet feasible, the New Zealand bodies recognized the value of having all segments of the industry working together to meet ever higher quality standards with reduced chemical inputs.
Packing and Storage Level Under the strategic plan adopted in 2006, four major storage/packing cooperatives merged into a single operation, the Okanagan Tree Fruit Cooperative. The intent of the merger was to pool resources to develop a single, modern storage/packing operation and to gain the economies of scale that the individual units had not been able to achieve. However, since the merger, OTFC has not been able to generate the funds needed to build a state-of-the-art facility from internal resources. The slowdown in real estate prices has made it difficult to sell off surplus buildings, and the decline in member grower incomes has reduced OTFC's ability to generate investment funds. At the same time, the B.C. apple industry has continued to shrink, the potential economies of scale have eroded, and the unit costs of packing and storage have risen as OTFC has struggled to reduce its fixed costs.
Between 2006 and 2011, the total volume of fresh apples in B.C. has fallen by about 30%. Under the second scenario shown above, that volume could fall further by 2021. Thus, OTFC needs to be planning for storage and packing capacity that can efficiently handle a maximum of 3 million and a minimum of 2 million packed boxes in any season. This will put tight constraints on the ability of OTFC to finance modern facilities with revenue earned from storage and packing charges. For example, to meet interest and repayments on a loan of $40 million at 5% for 20 years would require an annual charge to patrons of $3,167,784. A similar loan at 7% would require an annual charge to patrons of $3,721,440. Table 5 shows the equivalent per box charges required for different packed volumes.
Table 5: Charges per Packed Box Required from Patrons for a $40 Million Loan, At Different Interest Rates and Different Packed Volumes
Term of Loan Interest Rate 3.0 Million
Packed Boxes
2.5 Million Packed Boxes
2.0 Million Packed Boxes
20 Years 5% $1.06 $1.27 $1.58 20 Years 7% $1.24 $1.49 $1.86 Sources: Estimates by Belrose, Inc. & Globalwise Inc.
B.C. Apple Industry Strategic Choices and Directions
globalwiseinc. page 18
OTFC finds itself in a stalemate. To lower its unit charges, it needs modern facilities. However, with its current facilities, charges to growers are non-competitive, returns to growers are lower than they should be, and growers have limited capacity to pay extra charges needed to pay for modern facilities. Thus, modernization plans are unlikely to move forward without substantial subventions from the B.C. or Canadian governments. In addition, OTFC needs to sit down with its grower patrons and openly discuss the options that might be available to break the stalemate.
Marketing Level Most B.C. apples are marketed through B.C. Tree Fruits, which is now a subsidiary of OTFC. Interviews conducted in previous studies and by the authors of the present study suggest that the B.C. Tree Fruits organization is well respected in western Canada for its merchandizing capabilities. However, that respect rarely translates into a premium for B.C. apples. Retailers admit that they can buy comparable apple products from Washington State, and furthermore Washington State has an advantage over B.C. in the range of varieties, sizes and pack types it can offer, and in the consistency of quality its shippers can provide. In addition, in the off-season, there are plentiful supplies of a wide array of attractive, fresh apple varieties from the Southern Hemisphere. A compounding factor is that a substantial share of the products that B.C. Tree Fruits must market is older varieties that are losing favor with consumers.
A second major problem is that as the B.C. fresh pack has shrunk over the last decade, the funds used by B.C. Tree Fruits have also declined for normal marketing, merchandising, and promotional programs, and to introduce marketing innovations. This places B.C. Tree Fruits in the position of constantly fighting a rearguard action to maintain its share of produce shelf space and of consumer mouths even in western Canada.
Limited marketing of B.C. apples is conducted by independent packers or their marketing agents with little formal promotional support. Indeed, the independent packers we spoke to were in favor of a strong marketing effort by B.C. Tree Fruits and were fearful of the marketing chaos that would ensue if other independent packers emerged with their own sales programs.
Industry Structural Changes The B.C. apple industry appears to be moving in the right direction in centralizing its storage and packing operations. The major problem is that it has been unable to implement the concept at the level of technology needed to lower unit costs to its patrons, and deliver enhanced quality to its customers. It also may have put the cart before the horse in making its marketing arm B.C. Tree Fruits, a subsidiary of its service arm, the OFTC. In our view, for the industry to be successful in a highly competitive marketplace, it needs to be market driven. Growing, storage and packing operations need to change in response to signals being received from the market place. If the present structural arrangement is not allowing marketing signals to be fed back to the industry, it needs to be changed.
Communications Good communications can increase cooperation within any industry. There are clearly opportunities for improved communications among all the major entities in the B.C. apple industry. However, even the best communication skills cannot compensate for the lack of good news. That good news can include recent achievements, for example, OTFC's ability to reduce management costs and increase crop proceeds in the 2010-11 season. It can also include announcements of positive steps to change the outlook or attitudes of industry participants such as those by Australia's “Future Orchards” program or New Zealand’s “Apple Futures” program.

B.C. Apple Industry Strategic Choices and Directions
globalwiseinc. page 19
Outlook for B.C. Apple Industry The observed trend of declining B.C. apple acreage and production is not showing signs of a reversal. It is not possible to estimate the minimum size the apple industry must maintain to be financially viable. However it is likely that the further declining production would in relatively short time severely jeopardize the operations at the single remaining large packing operation. The fresh pack volume of the OTFC is needed to protect and promote the brand franchise of B.C. apples and other tree fruits and provide market leadership. Without the OTFC, the B.C. apple industry would most likely become fragmented with a period of chaotic marketing conditions with lower profit margins for most sellers. This is likely because the loss of the major cooperative would lead to several new, inexperienced packers joining existing small-scale packers in the supply channel.
Decisive action is needed to begin to reverse the perilous current trend. The industry must act soon to implement plans that stabilize the industry.

B.C. Apple Industry Strategic Choices and Directions
globalwiseinc. page 20
Recommendations The competitive challenges facing the B.C. industry are significant for both the apple growers and the OTFC. The industry and government have pursued a comprehensive assessment with the Tree Fruit Industry Development Strategy B.C. along with Action Plans in 2007 and an update in 2011. It is recommended that the current action plan be prioritized for the most critical steps by all participants and implemented with dispatch.
Based on our review of the industry, some particularly important actions are recommended. The starting point for constructively moving forward is to address the mistrust and adversarial positions between growers and the OTFC. To foster open communications and a shared vision for the future, it is recommended that a professional facilitator meet with growers, the cooperative board and management to address the conflicts. Directly airing the issues and constructively exploring their resolution are prerequisites to advance the industry.
One key area for moving the industry forward relates to apple variety development. The latest grower survey results indicate growers are unsure about what varieties to plant. The Okanagan Plant Improvement Corporation (PICO) is taking a stronger role in horticultural testing of new varieties, including post-harvest handling. The OTFC, other packers and growers can enhance these efforts to determine the premium varieties best suited for commercial development. When the comprehensive assessments are completed, results and recommendations should be widely disseminated to growers.
In this era of ever greater competition for consumer acceptance, it is critical to understand the needs and desires of consumers and then properly position B. C. apples. The industry is focused on markets in Western Canada and B.C. Tree Fruits is a leader in fruit merchandizing. However, new emphasis is needed for consumer research that is tied to forward market planning with strategies for strengthening B.C. apples against competitor’s products. The B.C. industry needs to decide who should design and execute market strategies with a five year horizon and how the funding resources will be raised to ensure this outcome.
OFTC should strategically modernize its facilities and operations. Improvements to cold storage facilities are a useful step that is underway. Future plans call for very high capital expenditures which would indicate much higher debt and repayment burden. The cooperative needs internal assurance that it is not endangering their solvency and then this needs to be vetted with the growers. We are not sure both actions have been taken.
At the grower level, average yields and fruit quality both need to rise. Growers need to move more quickly to adopt practices that increase yields and packouts while also further converting to more attractive apple varieties demanded by consumers.
BCFGA should consider setting up programs such as the UK Under 40 Fruit Growers, Australia's Future Orchards program, or New Zealand's Apple Futures program, to gradually expand the proportion of B.C. growers that meet “world best practice levels.” A starting point might be to identify the core group of B.C. growers that already meet world best practice levels, and use them as models for elevating the performance of other B.C. growers.
The recently announced Replant Program has introduced guidelines for suitable varieties. This should be monitored and assessed regularly to ensure varieties in the guidelines match with projections of future variety requirements and ability to produce high quality product.

B.C. Apple Industry Strategic Choices and Directions
globalwiseinc. page 21
Appendix A Packer Interview Survey
B.C. Apple Industry Analysis Packer Interview Survey
Revision 5/22/12 Name ____________________________________________ Telephone __________________ Address __________________________________________ Email _______________________ Date ________________________ Person Interviewed_______________________ If you have questions about completing this form, please contact Bruce Prenguber, tel 360-696-3888 or email [email protected]. We will keep all individual responses confidential. Contact Bruce if you have any concerns or questions. We would like to get data for the 2010 marketing year (from September 1, 2010 to August 31, 2011). We will start with asking a few basic questions about your firm/cooperative.
1) How long have you been in business, what fruits do you pack and what is the percentage that apples comprise of your total sales? __________________________________________________________________________________________________________________________________________________________________________________________________________________________________________________________________
2) What was the total volume of packed boxes of apples by your packing operations in the 2010-2011 marketing year? ____________________________________________________________________________________________________________________________________________________________________________
Indicate the net product weight per packed apple box:__________________________________________
3) What was the FOB value of all packed apples from your own packing operation in the 2010/2011 year?) __________________________________________________________________________________________________________________________________________________________________________________________________________________________________________________________________
4) What markets are key destinations for your apple sales? What percent of your sales are outside Western Canada? ________________________________________________________________________________________________________________________________________________________________________________________________________________________________________________________________________________________________________________________________________________________

B.C. Apple Industry Strategic Choices and Directions
globalwiseinc. page 22
For most remaining questions, we will ask you to discuss your business practices.
5) How does your company/cooperative help growers with orchard planning, replant decisions, quality control in the orchard, harvesting management and other field level activities ____________________________________________________________________________________________________________________________________________________________________________________________________________________________________________________________________________________________________________________________________________________________________________________________________________________________________________________________________________________________________________________________________
6) How does your company/cooperative communicate market information between your
company/cooperative and the growers in your network? __________________________________________________________________________________________________________________________________________________________________________________________________________________________________________________________________
a. How does market information flow between your company/cooperative and growers? ________________________________________________________________________________________________________________________________________________________________________________________________________________________________________________
b. How is information communicated to growers? ________________________________________________________________________________________________________________________________________________________________________________________________________________________________________________
7) This year there was a major loss of crop production in Eastern Canada and in parts of the U.S. What
special (outside of normal) planning is being done as a result? __________________________________________________________________________________________________________________________________________________________________________________________________________________________________________________________________
8) The Okanagan is a relatively small player in the world market, with an increasing market focus on local markets. With population growth and if the industry output continues to shrink, will there be enough apples to service all of your current customers? __________________________________________________________________________________________________________________________________________________________________________________________________________________________________________________________________
a. If there is an insufficient future supply of B.C. apples to serve the market, how will your company make its sales decisions regarding which customers to service? ________________________________________________________________________________________________________________________________________________________________________________________________________________________________________________
9) What financial and operational measures do you track and with what frequency? ________________________________________________________________________________________________________________________________________________________________________________________________________________________________________________________________________________________________________________________________________________________

B.C. Apple Industry Strategic Choices and Directions
globalwiseinc. page 23
a. What measures are used to evaluate the success of the year in the grading and packing and in the marketing operations? ________________________________________________________________________________________________________________________________________________________________________________________________________________________________________________________________________________________________________________________________
b. Please generally describe your financial planning and control, processes. ________________________________________________________________________________________________________________________________________________________________________________________________________________________________________________________________________________________________________________________________________________________________________________________________________________
10) What key information you glean from your information technology (IT) system? ________________________________________________________________________________________________________________________________________________________________________________________________________________________________________________________________________________________________________________________________________________________
a. Is this information frequently updated? ________________________________________________________________________________________________________________________________________________________________________________________________________________________________________________
11) How do you conduct long term planning with respect to grower sizes, regions for fruit production,
volumes needed, fruit qualities, lot numbers and sizes, etc.? ________________________________________________________________________________________________________________________________________________________________________________________________________________________________________________________________________________________________________________________________________________________
a. For such functions as labor requirement, operational finance, capital requirements and marketing/sales, is this an informal process or formalized? Please explain ________________________________________________________________________________________________________________________________________________________________________________________________________________________________________________
b. In terms of planning effort, how much effort would you estimate is placed into the following timelines by category?
One year (% effort) 2- 5 years (% effort) More than 5 years (%
effort) Labor Financial (operating) Capital (plant) Marketing/Sales
Note: the effort should total 100% for each row of the table.

B.C. Apple Industry Strategic Choices and Directions
globalwiseinc. page 24
12) Are the capital planning and financing processes significant, on-going management functions or is this handled just as the need for capital improvements arise? __________________________________________________________________________________________________________________________________________________________________________________________________________________________________________________________________
a. Are you competitive in securing competitive rates for capital you need for new capital projects? ________________________________________________________________________________________________________________________________________________________________
13) Please describe your process for marketing and sales planning, both short term and long term.
______________________________________________________________________________________________________________________________________________________________________________________________________________________________________________________________________________________________________________________________________________________________________________________________________________________________________________
14) When customers have complaints about fruit quality, how do you address these complaints and recover any added costs you incur? __________________________________________________________________________________________________________________________________________________________________________________________________________________________________________________________________
a. Are quality problems tracked back to the responsible lot or grower, or are the costs assigned to the pool? ________________________________________________________________________________________________________________________________________________________________
15) The volume and cull rate for fruit is highly variable from season-to-season. What processes do you use for
estimating the crop and the quality of the crop, and are revisions made as the season progresses? __________________________________________________________________________________________________________________________________________________________________________________________________________________________________________________________________
a. Do you track longer term trends in the volume of culls and if so, how does this influence your plans ________________________________________________________________________________________________________________________________________________________________________________________________________________________________________________
16) Collection of sales revenue can be a challenge in the fresh fruit industry. Please describe how you
minimize this risk? __________________________________________________________________________________________________________________________________________________________________________________________________________________________________________________________________
a. What is your process for non-paying customers? ________________________________________________________________________________________________________________________________________________________________
B.C. Apple Industry Strategic Choices and Directions
globalwiseinc. page 25
b. Are certain markets or channels highly restricted because of payment problems? ________________________________________________________________________________________________________________________________________________________________
17) What do you see as the main business risks (e.g. financial, operational, and marketing) in the future, and
how is the organization managing each of these risks? ____________________________________________________________________________________________________________________________________________________________________________________________________________________________________________________________________________________________________________________________________________________________________________________________________________________________________________________________________________________________________________________________________
a. Is currency exchange risk a factor for your operation and if so how are you addressing this? ________________________________________________________________________________________________________________________________________________________________
b. Do you foresee any extremely challenging risks to your business in the next 2-3 years and if so what are they? ________________________________________________________________________________________________________________________________________________________________
18) Is it important to your business to get growers participation or input to the planning and policy setting
with your firm’s executive management? ________________________________________________________________________________________________________________________________________________________________________________________________________________________________________________________________________________________________________________________________________________________
a. FOT OTFC – How do you obtain useful grower input for executive management decision making? ________________________________________________________________________________________________________________________________________________________________
b. FOR OTFC – Do growers provide input on hiring key management? ________________________________________________________________________________________________________________________________________________________________
19) How are benchmarks or written evaluations used to assist growers (provide service and help increase grower returns)? __________________________________________________________________________________________________________________________________________________________________________________________________________________________________________________________________
20) Do you benchmark your labor cost, both rates paid for labor and the total labor requirements, to other
fruit growing areas? __________________________________________________________________________________________________________________________________________________________________________________________________________________________________________________________________
B.C. Apple Industry Strategic Choices and Directions
globalwiseinc. page 26
21) What procedures do you use to obtain ideas from plant workers regarding improved operating efficiency? __________________________________________________________________________________________________________________________________________________________________________________________________________________________________________________________________
22) FOR OTFC ONLY – How are tax benefits from the cooperative structure communicated to growers?
____________________________________________________________________________________________________________________________________________________________________________ Final question for all respondents---
23) Do you have other comments about managing your business for success that we have not adequately covered in this interview? __________________________________________________________________________________________________________________________________________________________________________________________________________________________________________________________________________________________________________________________________________________________________________________________________________________________________________________________________________________________________________________________________________________________________________________________________________________________________________________________________________________________________________________________________________________________________________________________________________________________________________________________________________________________________________________________________________________________________________________________________________________________________________________________________________________________________________________________________________________________________________________________________________________________________________________________________________________________________________________________________________ Thank you for your valuable input. We want to reiterate that no individual company you have shared with be divulged to any other party.
SURVEY ENDS HERE
Related Documents


