INTERNATIONAL THE GLOBAL MAGAZINE FOR GEOMATICS WWW.GIM-INTERNATIONAL.COM ISSUE 2 • VOLUME 29 • FEBRUARY 2015 Bringing Colour to Point Clouds Developments in Multispectral Lidar Are Changing the Way We See Point Clouds ALLAN CARSWELL GIM International Interview . OPERATION ICEBRIDGE Largest-ever Airborne Survey of Earth’s Polar Regions. BUILDING A UAV FROM SCRATCH Young Geo in Focus.

Welcome message from author
This document is posted to help you gain knowledge. Please leave a comment to let me know what you think about it! Share it to your friends and learn new things together.
Transcript
I N T E R N A T I O N A L
THE GLOBAL MAGAZINE FOR GEOMATICSWWW.GIM-INTERNATIONAL.COM
ISSUE 2 • VOLUME 29 • FEBRUARY 2015
Bringing Colour to Point CloudsDevelopments in Multispectral Lidar Are Changing the Way We See Point Clouds
ALLAN CARSWELL GIM International Interview.
OPERATION ICEBRIDGE Largest-ever Airborne Survey of Earth’s Polar Regions.
BUILDING A UAV FROM SCRATCH Young Geo in Focus.
GIM0215_Cover 1 28-01-2015 14:19:46
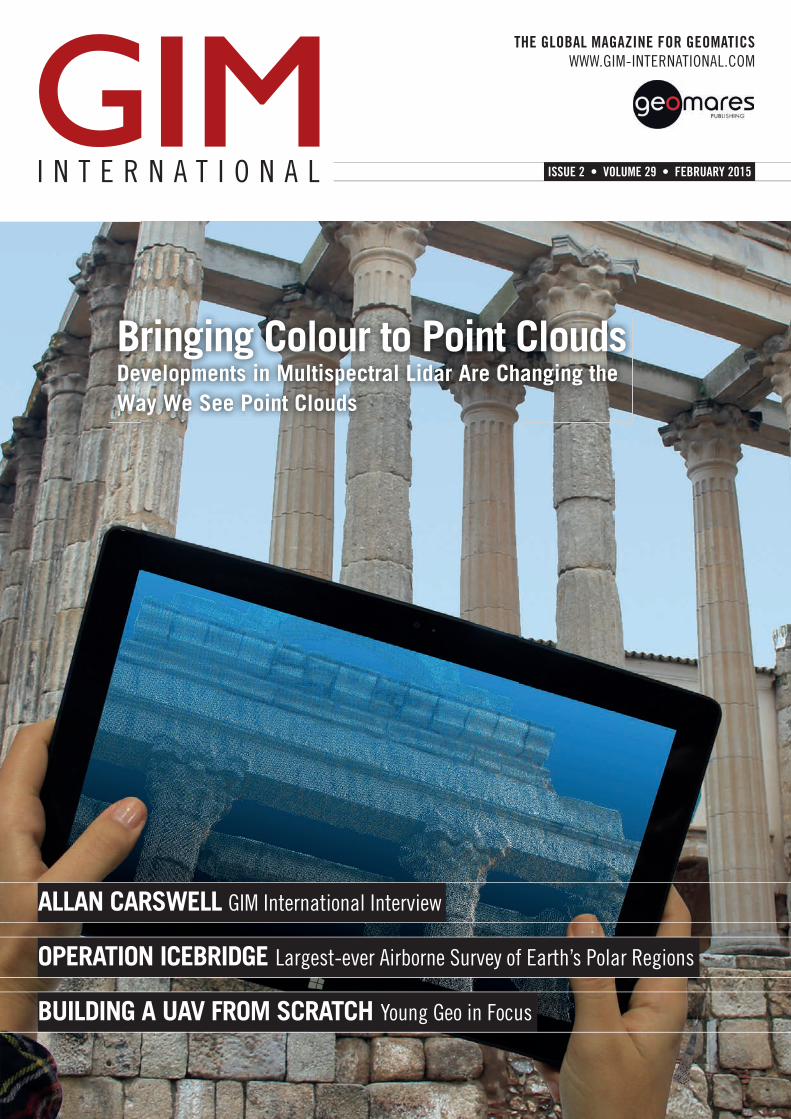
Need a large format camera system for low-altitude, corridor missions? High-altitude ortho collections? Something in between?
Need to be able to collect oblique imagery? How about oblique and nadir imagery in panchromatic, color and near-infrared all in the same pass?
Need a software system that will allow you to take that aerial imagery and create point clouds in LAS format, digital surface models, and orthomosaics? No problem.
The UltraCam series of large format photogrammetric digital aerial sensors includes systems of varying image footprints and focal lengths. Whether you need multi-spectral nadir imagery or obliques—or both from the same camera—we have a system for you.
process UltraCam data to Level 3, radiometrically corrected and color-balanced imagery, high-density point clouds, DSMs, DSMorthos and DTMorthos.
We’ve got you covered.
©2014 Microsoft Corporation. All rights reserved. Microsoft, UltraMap and UltraCam Osprey, Eagle, Falcon and Hawk are either registered trademarks or trademarks of Microsoft Corporation in the United States and/or other countries.
No
2715
GIM0215_Cover 2 28-01-2015 14:19:48
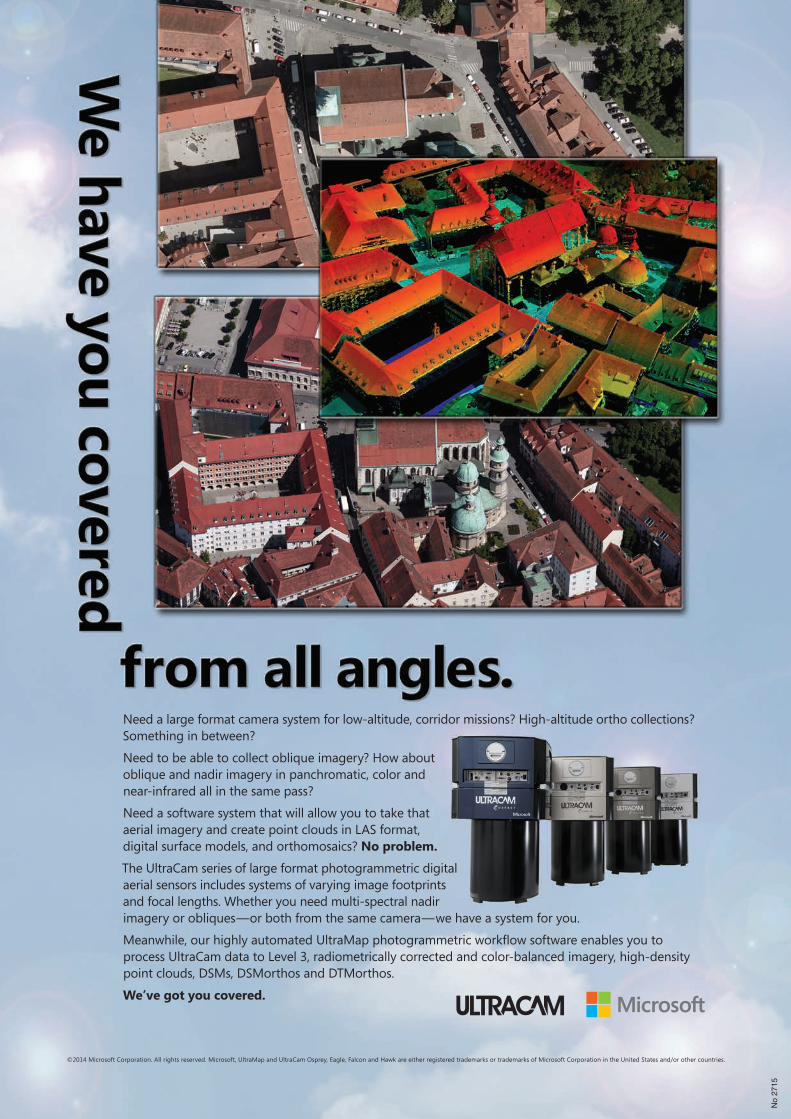
CONTENTS
ADVERTISERS INDEX
3FEBRUARY 2015 | INTERNATIONAL |
Get your back-issuesin the storewww.geomares.nl/store
FEATURE PAGE 18Mapping Flood VulnerabilityDeriving Risk Indicators from Open Data
YOUNG GEO IN FOCUS PAGE 36Building a UAV from ScratchDŠGS FlyEye in the Sky
COMPANY’S VIEW PAGE 38The Future Is in Our Handse-Capture R&D
News & Opinion page Editorial 5
Insider’s View 7
News 8
5 Questions 9
GIM Perspectives 11
Endpoint 13
International organisations page FIG 41
GSDI 43
IAG 45
ICA 47
ISPRS 49
Other page Advertisers Index 3
Agenda 50
INTERVIEW PAGE 14
From the Depths of the Ocean to the Surface of MarsGIM International Interviews Allan Carswell
FEATURE PAGE 22
Bringing Colour to Point CloudsDevelopments in Multispectral Lidar Are Changing the Way We See
Point Clouds
FEATURE PAGE 27
Operation IceBridgeLargest-ever Airborne Survey of Earth’s Polar Regions
ComNav Technology, www.comnavtech.com 24
Effi gis, www.effi gis.com 42
FOIF, www.foif.com 46
Hi-Target Surveying, www.zhdgps.com 51
KCS TraceMe, www.trace.me 40
Kolida Instrument, www.kolidainstrument.com 20
Leica Geosystems, www.leica-geosystems.com 6
Microsoft, www.microsoft.com/ultracam 2
MicroSurvey, www.microsurvey.com 16
Optech, www.optech.com 12
Pacifi c Crest, www.pacifi ccrest.com 10
Racurs, www.racurs.ru 35
RIEGL, www.riegl.com 30
Ruide, www.ruideinstrument.com 32
South Surveying, www.southinstrument.com 44
Supergeo, www.supergeotek.com 28
TI Asahi, www.pentaxsurveying.com/en 48
TI Linertec, www.tilinertec.com 28
Trimble/Ashtech, intech.trimble.com 26
Trimble, www.trimble.com 44
This month’s front cover of GIM International shows a 3D point cloud of the Roman Temple of Diana in Mérida, Spain, captured using the EyesMap tablet. This new solution is an all-in-one product which generates 3D measurements, points clouds, real-time 3D models, orthophotos and GPS surveys.
FEATURE PAGE 33
Lidar Quality AssuranceOpen-source Software for Processing Lidar Point Clouds
GIM0215_Content 3GIM0215_Content 3 28-01-2015 17:10:3128-01-2015 17:10:31
©2015, Trimble Navigation Limited. All rights reserved. Nikon is a registered trademark of Nikon Corporation.
All other trademarks are the property of their respective owners. (2015/01)
Nikon QualityThere are things you can still count on in this world. The sun will rise, taxes will be
levied, surveyors will be working, and Nikon total stations will be right there with them
day after day. Your customers count on you and surveyors have always relied on
Nikon total stations to provide quality results.
Nivo™ C Series features a Windows CE touchscreen interface and powerful Survey
Pro, Layout Pro and Survey Basic with Roads field software.
Nivo M+ Series uses the intuitive Nikon onboard field software and is available in 2”, 3”
and 5” models. Point memory size has been increased to 25,000 points and a USB port
added for convenient and portable data transfer.
NPL-322+ and DTM-322+ Series offer economical choices with Nikon quality
and precision. Available in 2” and 5” models, Bluetooth is now standard and point
memory has been increased to 25,000 points.
Visit www.nikonpositioning.com to choose the model that is right for you.
Your jobs. Your choice.
Simply Nikon Quality
NPL-322+ DTM-322+
Nivo M+ Series
Nivo C Series
Visit www.nikonpositioning.com for
the latest product information and
to locate your nearest distributor.
Count On ItNEW
FOR2015
Scan the QR code to receive a
FREE brochureAMERICAS
Spectra Precision Division10368 Westmoor Drive
Westminster, CO 80021, USA
+1-720-587-4700 Phone
888-477-7516 (Toll Free in USA)
EUROPE, MIDDLE EAST AND AFRICA
Spectra Precision DivisionRue Thomas Edison
ZAC de la Fleuriaye - CS 60433
44474 Carquefou (Nantes), France
+33 (0)2 28 09 38 00 Phone
ASIA-PACIFIC
Spectra Precision Division80 Marine Parade Road
#22-06, Parkway Parade
Singapore 449269, Singapore
+65-6348-2212 Phone
No
2723
GIM0215_Content 4 28-01-2015 14:18:15
5FEBRUARY 2015 | INTERNATIONAL |
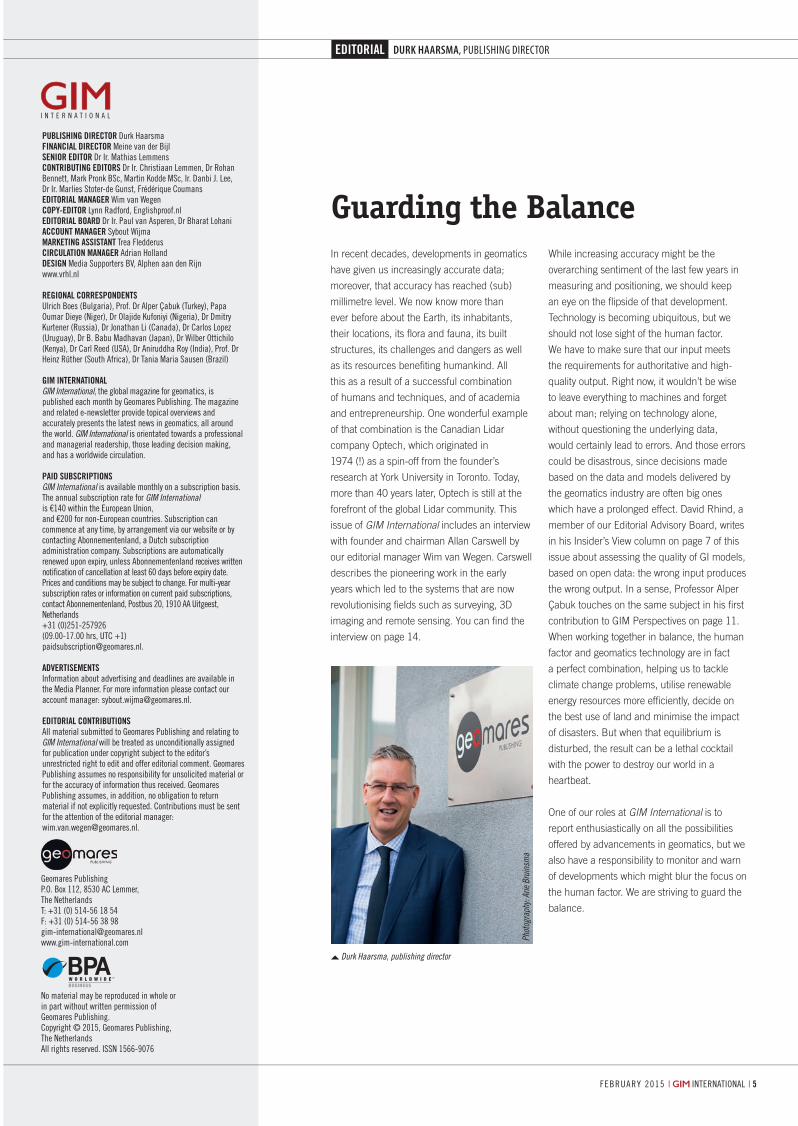
Durk Haarsma, publishing director
Phot
ogra
phy:
Ari
e B
ruin
sma
In recent decades, developments in geomatics
have given us increasingly accurate data;
moreover, that accuracy has reached (sub)
millimetre level. We now know more than
ever before about the Earth, its inhabitants,
their locations, its fl ora and fauna, its built
structures, its challenges and dangers as well
as its resources benefi ting humankind. All
this as a result of a successful combination
of humans and techniques, and of academia
and entrepreneurship. One wonderful example
of that combination is the Canadian Lidar
company Optech, which originated in
1974 (!) as a spin-off from the founder’s
research at York University in Toronto. Today,
more than 40 years later, Optech is still at the
forefront of the global Lidar community. This
issue of GIM International includes an interview
with founder and chairman Allan Carswell by
our editorial manager Wim van Wegen. Carswell
describes the pioneering work in the early
years which led to the systems that are now
revolutionising fi elds such as surveying, 3D
imaging and remote sensing. You can fi nd the
interview on page 14.
While increasing accuracy might be the
overarching sentiment of the last few years in
measuring and positioning, we should keep
an eye on the fl ipside of that development.
Technology is becoming ubiquitous, but we
should not lose sight of the human factor.
We have to make sure that our input meets
the requirements for authoritative and high-
quality output. Right now, it wouldn’t be wise
to leave everything to machines and forget
about man; relying on technology alone,
without questioning the underlying data,
would certainly lead to errors. And those errors
could be disastrous, since decisions made
based on the data and models delivered by
the geomatics industry are often big ones
which have a prolonged effect. David Rhind, a
member of our Editorial Advisory Board, writes
in his Insider’s View column on page 7 of this
issue about assessing the quality of GI models,
based on open data: the wrong input produces
the wrong output. In a sense, Professor Alper
Çabuk touches on the same subject in his fi rst
contribution to GIM Perspectives on page 11.
When working together in balance, the human
factor and geomatics technology are in fact
a perfect combination, helping us to tackle
climate change problems, utilise renewable
energy resources more effi ciently, decide on
the best use of land and minimise the impact
of disasters. But when that equilibrium is
disturbed, the result can be a lethal cocktail
with the power to destroy our world in a
heartbeat.
One of our roles at GIM International is to
report enthusiastically on all the possibilities
offered by advancements in geomatics, but we
also have a responsibility to monitor and warn
of developments which might blur the focus on
the human factor. We are striving to guard the
balance.
Guarding the Balance
PUBLISHING DIRECTOR Durk Haarsma
FINANCIAL DIRECTOR Meine van der Bijl
SENIOR EDITOR Dr Ir. Mathias Lemmens
CONTRIBUTING EDITORS Dr Ir. Christiaan Lemmen, Dr Rohan
Bennett, Mark Pronk BSc, Martin Kodde MSc, Ir. Danbi J. Lee,
Dr Ir. Marlies Stoter-de Gunst, Frédérique Coumans
EDITORIAL MANAGER Wim van Wegen
COPY-EDITOR Lynn Radford, Englishproof.nl
EDITORIAL BOARD Dr Ir. Paul van Asperen, Dr Bharat Lohani
ACCOUNT MANAGER Sybout Wijma
MARKETING ASSISTANT Trea Fledderus
CIRCULATION MANAGER Adrian Holland
DESIGN Media Supporters BV, Alphen aan den Rijn
www.vrhl.nl
REGIONAL CORRESPONDENTSUlrich Boes (Bulgaria), Prof. Dr Alper Çabuk (Turkey), Papa
Oumar Dieye (Niger), Dr Olajide Kufoniyi (Nigeria), Dr Dmitry
Kurtener (Russia), Dr Jonathan Li (Canada), Dr Carlos Lopez
(Uruguay), Dr B. Babu Madhavan (Japan), Dr Wilber Ottichilo
(Kenya), Dr Carl Reed (USA), Dr Aniruddha Roy (India), Prof. Dr
Heinz Rüther (South Africa), Dr Tania Maria Sausen (Brazil)
GIM INTERNATIONALGIM Inter na tion al, the global mag a zine for geo mat ics, is
pub lished each month by Geomares Publishing. The mag azine
and related e-newsletter pro vide top i cal over views and
ac cu rate ly presents the lat est news in geo mat ics, all around
the world. GIM Inter na tion al is or ien tat ed towards a pro fes sion al
and man a ge ri al read er ship, those lead ing de ci sion mak ing,
and has a world wide cir cu la tion.
PAID SUBSCRIPTIONS GIM International is available monthly on a subscription basis.
The annual subscription rate for GIM International
is €140 within the European Union,
and €200 for non-European countries. Subscription can
commence at any time, by arrangement via our website or by
contacting Abonnementenland, a Dutch subscription
administration company. Subscriptions are automatically
renewed upon expiry, unless Abonnementenland receives written
notification of cancellation at least 60 days before expiry date.
Prices and conditions may be subject to change. For multi-year
subscription rates or information on current paid subscriptions,
contact Abonnementenland, Postbus 20, 1910 AA Uitgeest,
Netherlands
+31 (0)251-257926
(09.00-17.00 hrs, UTC +1)
AD VER TISE MENTSIn for ma tion about ad ver tising and dead lines are avail able in
the Me dia Plan ner. For more in for ma tion please con tact our
account man ag er: [email protected].
ED I TO RI AL CON TRI BU TIONS All ma te ri al sub mit ted to Geomares Publishing and re lat ing to
GIM Inter na tion al will be treat ed as un con di tion al ly as signed
for pub li ca tion under copy right sub ject to the editor’s
un re strict ed right to ed it and of fer ed i to ri al com ment. Geomares
Publishing as sumes no re spon sibil ity for un so lic it ed ma te ri al or
for the ac cu ra cy of in for ma tion thus re ceived. Geomares
Publishing as sumes, in ad di tion, no ob li ga tion to return
ma te ri al if not ex pli cit ly re quest ed. Con tri bu tions must be sent
for the at ten tion of the editorial manager:
Geomares Publishing
P.O. Box 112, 8530 AC Lem mer,
The Neth er lands
T: +31 (0) 514-56 18 54
F: +31 (0) 514-56 38 98
www. gim-international.com
No ma te ri al may be re pro duced in whole or
in part with out writ ten per mis sion of
Geomares Publishing.
Copy right © 2015, Geomares Publishing,
The Neth er lands
All rights re served. ISSN 1566-9076
EDITORIAL DURK HAARSMA, PUBLISHING DIRECTOR
GIM0215_Editorial 5 28-01-2015 14:00:48
For more information visithttp://di.leica-geosystems.com
www.leica-geosystems.com
Airborne Bathymetry
Airborne Imaging
3D City Modelling
UAV
Airborne LiDAR
Mobile Mapping
Leica GeosystemsGeospatial Solutions
Everything you can imagine ...
Whether you are creating smart cities with precise 3D data, working in environmental change and disaster management or
want to fi nd out about the endless possibilities of Unmanned Aerial Vehicles (UAV), terrestrial or aerial mobile mapping,
you can rely on Geospatial Solutions brought to you by Leica Geosystems.
... all from one source. Leica Geosystems. Leaders in Geospatial Imaging.
No
2726
GIM0215_Editorial 6 28-01-2015 14:00:49

INSIDER’S VIEW
7FEBRUARY 2015 | INTERNATIONAL |
EABThe Editorial Advisory Board (EAB) of GIM International consists of profes sionals who, each in their discipline and with an independent view, assist the editorial board by making recommen dations on potential authors and specific topics. The EAB is served on a non- committal basis for two years.
PROF ORHAN ALTANIstanbul Technical University, Turkey
PROF DEREN LIWuhan University, China
MR SANTIAGO BORREROSecretary-general of Pan American Institute of Geography and History (PAIGH), Mexico
PROF STIG ENEMARKHonorary President, FIG, Denmark
DR ANDREW U FRANK Head, Institute for Geoinformation, Vienna University of Technology, Austria
DR AYMAN HABIB, PENGProfessor and Head, Department of Geomatics Engineering, University of Calgary, Canada
DR GABOR REMETEY-FÜLÖPPSecretary General, Hungarian Association for Geo-information (HUNAGI), Hungary
PROF PAUL VAN DER MOLENTwente University, The Netherlands
PROF DR IR MARTIEN MOLENAARTwente University, The Netherlands
MR JOSEPH BETITSenior Land Surveyor, Dewberry, USA
PROF SHUNJI MURAIInstitute Industrial Science, University of Tokyo, Japan
PROF DAVID RHINDret. Vice-Chancellor, The City University, UK
PROF DR HEINZ RÜTHER Chairman Financial Commission ISPRS, University of Cape Town, Department of Geomatics, South Africa
MR FRANÇOIS SALGÉSecretary-general, CNIG (National Council for Geographic Information), France
PROF DR TONI SCHENKProfessor, The Ohio State University, Department of Civil and Environmental Engineering, USA
PROF JOHN C TRINDERFirst Vice-President ISPRS, School of Surveying and SIS, The University of New South Wales, Australia
MR ROBIN MCLARENDirector, Know Edge Ltd, United Kingdom
Is GIS Dead?
Three colleagues and I have been wrestling
for two years with how we can best deliver a
new version of our GIS textbook. The three
previous editions have been successful,
having sold 80,000 copies and being trans-
lated into fi ve languages. The challenge we
faced is that everything is changing so rapidly
that it would be easy to be out of date or even
irrelevant. Advancing technology is at the
heart of the problem (and opportunity), but its
consequences are manifested in many
different ways.
For example, publishers are transitioning to a
different publishing model with different staff,
using digital versions of books to minimise the
second-hand market in printed books.
Obtaining explicit copyright permission for
images to avoid legal challenges is mandatory
– even if the originator has died! Meanwhile,
competitive online materials (of widely
differing standards of quality) are available
from many sources, including those created
to underpin massive open online courses
(MOOCs).
We decided that our response should
continue to focus on long-lasting scientifi c
principles which underpin the use of GI
systems. But beyond that continuity, we have
had to take account of many other factors.
That has led us to replace ‘GIS’ in the title
with ‘GISS’ – Geographic Information Science
and Systems. The systemic characteristics of
GI and the selection of assumptions plugged
into our models and software matter ever
more. Last year, parts of the UK (and
elsewhere) suffered major fl ooding with
catastrophic consequences for families and
businesses. The public reaction forced
government to change some policies and
provide additional funds for fl ood assessment
and protection. Modelling of likely scenarios
using GI was an important input. However, a
hugely experienced expert has just published
a paper claiming that estimates of the
economic risk produced using the offi cial
model of fl ood damage are exaggerated by a
factor of between four and fi ve. How do we
assess the likely quality of such GI-based
modelling?
Big data and open data are facts of life which
we now have to take directly into account as
governments and businesses seek to provide
better service at lower cost, minimise fraud
and understand what causes what. We in GIS
have long been engaged with big data so we
can help – but only if we understand the
whole ecosystem of science, the tools, the
data, the decision-making context and the
users’ needs.
For better or worse, the law is increasingly
pervasive whether it relates to competition,
human rights, information access, intellectual
property rights or liability. Beyond that, ethics
and morality are becoming signifi cant in the
world of GISS. Machines now fl y planes, steer
cars, recognise images, process speech and
translate languages. Much GI-based analysis
and many operations in future seem likely to
be based on artifi cial intelligence (AI). How do
we implant human decision-making into AI –
e.g. in driverless cars faced with the choice of
colliding with another vehicle, or mounting a
pavement to avoid it and mowing down a
child instead?
GISS is all that GIS used to be – and much
more. Our book is now at the printer’s so it’s
too late to change anything. We will soon see
if the GI world agrees with our judgements…
PROF DAVID RHIND, THE CITY UNIVERSITY, UNITED KINGDOM
David Rhind
GIM2015_News 7 28-01-2015 14:10:29
NEWS
88 | INTERNATIONAL | FEBRUARY 2015
Commercial UAV Expo Announced for October
SPAR Point Group recently
announced that it is launching
Commercial UAV Expo, to be held
from 5-7 October 2015 at Caesars
Palace, Las Vegas, Nevada, USA.
As organisers of premier 3D
technology events in North
America, Europe and Asia, SPAR
Point Group is well established in
the data capture and imaging
technology arena.
http://bit.ly/158aF1V
Website of Commercial UAV Expo.
SkyTech 2015 UAV Conference and Exhibition SkyTech 2015, to be held on 24 April 2015 in Islington, London, UK, is the latest addition
to the UAV industry calendar. The event is a one-day conference and exhibition serving as
a platform to defi ne, understand and ultimately integrate UAVs into the commercial sector.
SkyTech can be attended at no cost and will bring together 60 exhibitors, 40 speakers and
over 1,000 attendees from a range of targeted industries.
http://bit.ly/158c4Fy
SkyTraq Introduces GNSS Receiver Module Offering Continuous Positioning SkyTraq, a Taiwan-based GNSS positioning technology
company, has introduced the all-in-one S2525DR8 GNSS
dead-reckoning module with onboard integration of MEMS
sensor and interface logic. The module is especially suitable
for road vehicles requiring high accuracy and 100%
positioning availability.
http://bit.ly/158bS9o
ScanEx Becomes Authorised Mapping Partner of GoogleScanEx has become an authorised partner of Google in Russia
and the CIS countries. The companies will be cooperating on
developing integrated mapping solutions based on ScanEx
software solutions and Google services.
http://bit.ly/158bqrR
Google Maps service solution.
OGC Adopts IndoorGML Standard for Encoding Indoor Navigation DataThe Open Geospatial Consortium (OGC) membership
has approved the OGC IndoorGML Encoding
Standard. This OGC standard specifi es an open
abstract data model and XML schema for indoor
spatial information. The driving requirement for
IndoorGML is navigation.
http://bit.ly/158bYxX
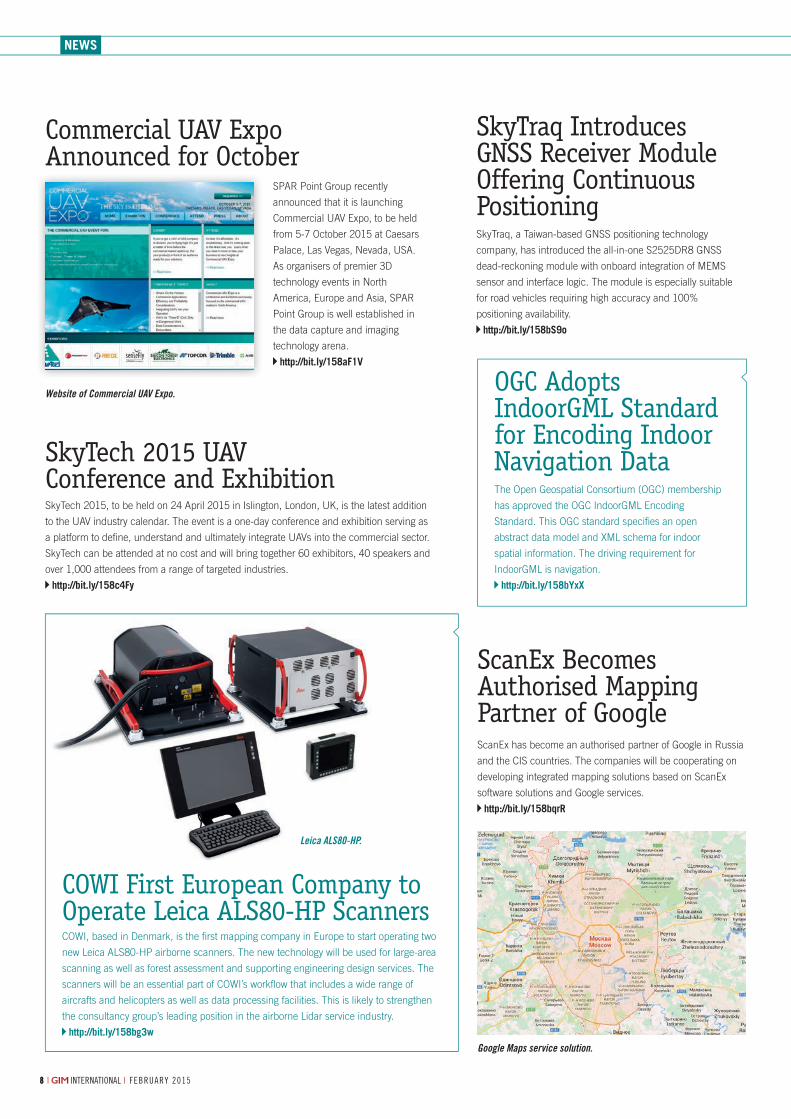
Leica ALS80-HP.
COWI First European Company to Operate Leica ALS80-HP ScannersCOWI, based in Denmark, is the fi rst mapping company in Europe to start operating two
new Leica ALS80-HP airborne scanners. The new technology will be used for large-area
scanning as well as forest assessment and supporting engineering design services. The
scanners will be an essential part of COWI’s workfl ow that includes a wide range of
aircrafts and helicopters as well as data processing facilities. This is likely to strengthen
the consultancy group’s leading position in the airborne Lidar service industry.
http://bit.ly/158bg3w
GIM2015_News 8 28-01-2015 14:10:29
NEWS
9FEBRUARY 2015 | INTERNATIONAL |
MORE NEWS GIM-INTERNATIONAL.COM
Mohamed AyariThe 9th edition of Geo-Tunis will be held from 1-5 April 2015. Who should attend your event, and why?Firstly I would like to
thank GIM
International for its
interest in the
Geo-Tunis congress.
As an organisation we
regard your magazine
as a leader in this
fi eld and we regularly
read your online
version since it
provides us with the latest discoveries about
geomatics, GIS and related technologies.
Geo-Tunis is well known in the Arab world and
Africa and also attracts participants from other
parts of the world. Researchers, experts, students
and employees from institutions working in the
fi eld of geomatics and any other people interested
in this kind of technology regularly participate in
the event. An exhibition is held in parallel with the
congress. I would like to mention that I sincerely
hope companies and researchers from Europe
will fi nd their way to our international event.
Can you give us a brief overview of the congress programme?A varied congress programme will run throughout
the fi ve days and will include:
• A study day on GIS and security, organised by
the Tunisian Association of Digital Geographic
5 Questions to... Information and the Syndicate of National
Internal Security Forces, involving 300
commanders and commissioners from the
ministry of interior and civil defence from
Tunisia and other representatives from the
Libyan, Algerian and Moroccan security
sectors.
• ‘The Survey Arab Day’, organised by the
Tunisian Association of Digital Geographic
Information and the EuroArab Union of
Geomatics, for syndicates, associations and
institutions as well as survey offi ces.
• ‘The GIS Libyan Day’, organised by Arjalibya
company and the Tunisian Association of
Digital Geographic Information, discussing
GIS technology and investment in Libya.
• ‘Desertifi cation and Water Resources Day’,
organised by the Iraqi Desertifi cation Studies
Center, Tunisian Arid Lands Institute and the
Tunisian Association of Digital Geographic
Information, including 180-250 scientifi c
interventions, 40 scientifi c sessions and B2B
meetings.
Geo-Tunis will include also dozens of oral presen-
tations and around 200 presenters, workshops,
roundtables, presentations of the latest GIS and
geomatics programmes and tools. It also is an
excellent occasion for producers and users of
geographic technologies to meet.
Geo-Tunis is one of the main geomatics events in North Africa and the Arab world. Which latest developments in this part of the world will it be highlighting?Geo-Tunis is considered one of the most
important events for GIS in the MENA region
since those countries need such technologies for
sustainable development and solving problems in
the fi elds of urban and rural planning, agriculture,
water management, telecommunication, security
and intelligence as well as healthcare, energy and
the environment. Public institutions in MENA
countries have already started using GIS
technology, often with help from foreign experts.
What can participants expect from the exhibition that is being held alongside the congress?The exhibition and the congress complement one
another. At the exhibition, companies introduce
their GIS latest technologies to experts and repre-
sentatives of Arab and African countries’ govern-
ments. Hence, Geo-Tunis gives producers and
users of the technology an opportunity to meet
and discuss investment opportunities, and many
agreements are concluded as a result. Geo-Tunis
benefi ts from the fact that Tunisia is attractive to
investors in knowledge.
What will be the main themes of the workshops held in parallel with the congress?Geo-Tunis has three aspects: academic,
commercial, and training. In terms of academic,
the workshops will be focusing on a number of
research studies, many of which have been
published in scientifi c journals and specialist inter-
national magazines such as GIM International.
Other workshops will be covering investment and
commercial aspects, related to the exhibition that
is organised during the congress. And we address
the training aspect by including a number of
workshops on various specialisms which require
GIS technologies. Just some of the workshop
subjects during the congress programme include:
water management and desertifi cation, agricultural
technologies, the role of geomatics in intelligence,
security and civil defence, surveying, urban
planning, land management and real estate
matters, GIS and remote sensing, aerial photog-
raphy and geomatics and heritage and archaeo-
logical surveying.
www.geotunis.org
Orbit GT Supports LASzip for LAS 1.2 and LAS 1.4Orbit GeoSpatial Technologies has announced that full support
of LASzip has been completed and integrated in all products.
This means that the company has extended its support for
LASzip to both LAS 1.2 and LAS 1.4. The Belgium-based GIS
and mapping software developer is committed to offering
continued support for international standards and open formats
for the growing range of applications that make use of point
clouds and regards LASzip as very valuable in these markets.
http://bit.ly/158cR9x
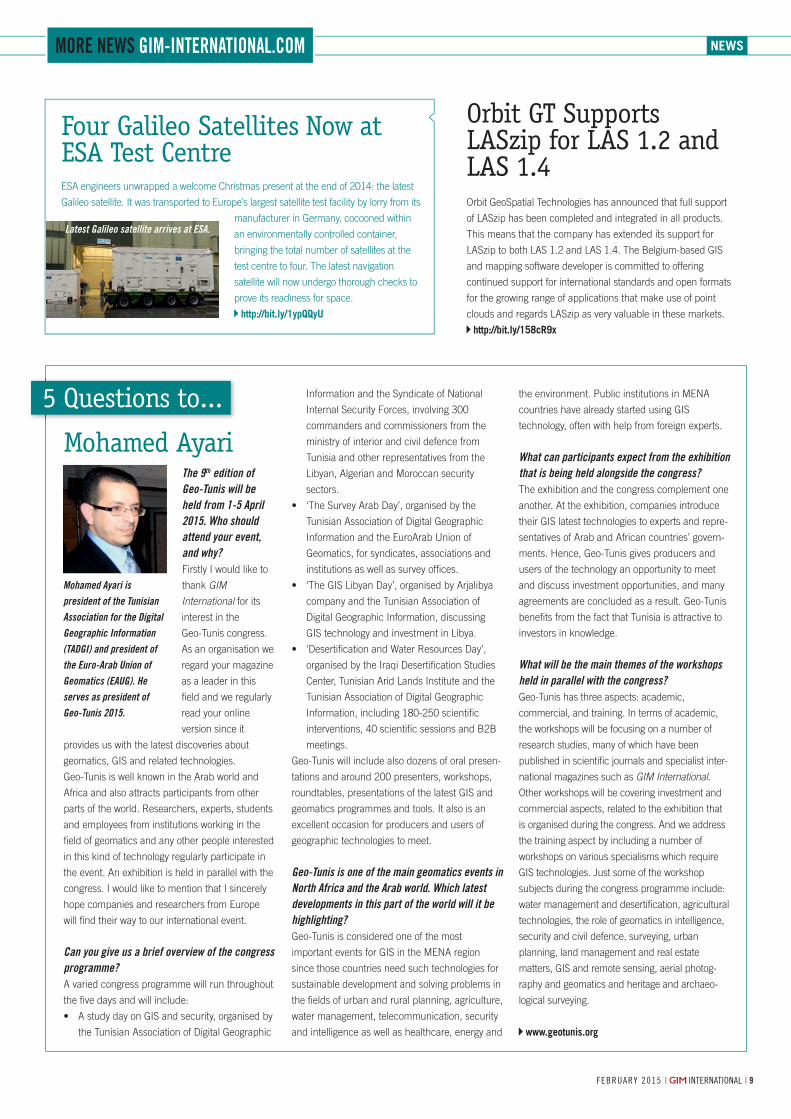
Four Galileo Satellites Now at ESA Test CentreESA engineers unwrapped a welcome Christmas present at the end of 2014: the latest
Galileo satellite. It was transported to Europe’s largest satellite test facility by lorry from its
manufacturer in Germany, cocooned within
an environmentally controlled container,
bringing the total number of satellites at the
test centre to four. The latest navigation
satellite will now undergo thorough checks to
prove its readiness for space.
http://bit.ly/1ypQQyU
Mohamed Ayari is president of the Tunisian Association for the Digital Geographic Information (TADGI) and president of the Euro-Arab Union of Geomatics (EAUG). He serves as president of Geo-Tunis 2015.
Latest Galileo satellite arrives at ESA.
GIM2015_News 9 28-01-2015 14:10:30
NEWS
1010 | INTERNATIONAL | FEBRUARY 2015
®
No
2719
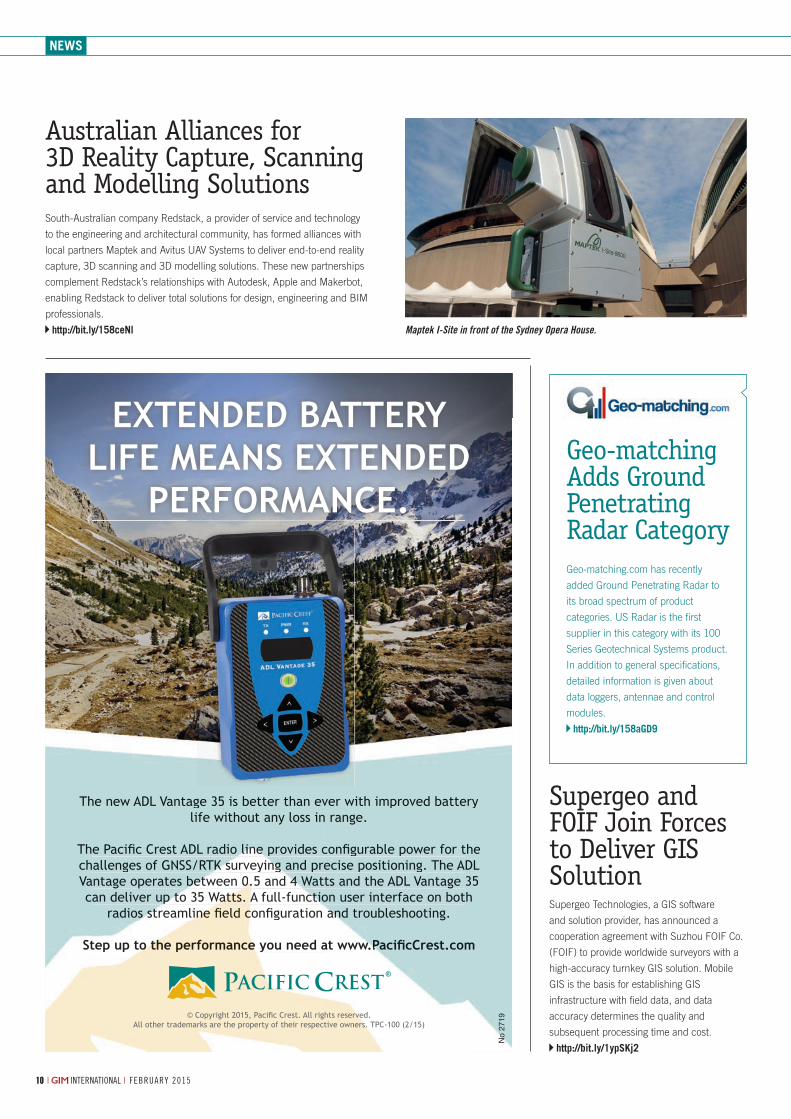
Australian Alliances for 3D Reality Capture, Scanning and Modelling Solutions South-Australian company Redstack, a provider of service and technology
to the engineering and architectural community, has formed alliances with
local partners Maptek and Avitus UAV Systems to deliver end-to-end reality
capture, 3D scanning and 3D modelling solutions. These new partnerships
complement Redstack’s relationships with Autodesk, Apple and Makerbot,
enabling Redstack to deliver total solutions for design, engineering and BIM
professionals.
http://bit.ly/158ceNl Maptek I-Site in front of the Sydney Opera House.
Supergeo and FOIF Join Forces to Deliver GIS Solution Supergeo Technologies, a GIS software
and solution provider, has announced a
cooperation agreement with Suzhou FOIF Co.
(FOIF) to provide worldwide surveyors with a
high-accuracy turnkey GIS solution. Mobile
GIS is the basis for establishing GIS
infrastructure with fi eld data, and data
accuracy determines the quality and
subsequent processing time and cost.
http://bit.ly/1ypSKj2
Geo-matching Adds Ground Penetrating Radar CategoryGeo-matching.com has recently
added Ground Penetrating Radar to
its broad spectrum of product
categories. US Radar is the fi rst
supplier in this category with its 100
Series Geotechnical Systems product.
In addition to general specifi cations,
detailed information is given about
data loggers, antennae and control
modules.
http://bit.ly/158aGD9
GIM2015_News 10 28-01-2015 14:10:31
11FEBRUARY 2015 | INTERNATIONAL |
GIM PERSPECTIVESBY ALPER ÇABUK, ANADOLU UNIVERSITY, TURKEY
Delicate Touches of Geomatics on the Earth
I am very excited to be providing input for this
corner of GIM International from now on. As a
person who has dedicated his life to dissemi-
nating the utilisation of geomatic technologies
to create a more liveable and sustainable
world, I am looking forward to sharing my
opinions and experiences about the impor-
tance of geomatic technologies for the future
of our planet, starting here with a popular
topic: geodesign.
Throughout history, man has always inter-
acted with the environment to create a safe
place to live. Exploring ancient settlements
often reveals that they were built with respect
to natural and environmental characteristics.
This limited the human impact on the
environment while also protecting man
against the negative forces of nature.
However, over time, rapid population growth,
industrialisation, advancements in technology
and improperly planned urban environments
have increased man’s disregard for the
natural and environmental factors which are
in fact vital for survival. Hence, many
settlement areas have suffered the devas-
tating effects of natural disasters. Biological
diversity has been damaged. This situation
has inspired people to seek various solutions
for making the world a more liveable place.
One such solution is the geodesign approach,
which is in fact based on a previously adopted
but long forgotten behaviour of man: corre-
sponding with nature.
GIS pioneers have put forward the theory of
using GIS as a tool for reapplying geodesign.
Geodesign brings together science, design
and technology. It bridges the gaps between
planners, citizens and decision-makers, and
helps create alternative scenarios for the
future based on design and planning
solutions. While this is not a new practice, as
mentioned above, geodesign is now being
seen as a solution to ‘heal the world’ and will
probably start a new movement for modern
physical planning and design.
My colleague and role model Jack
Dangermond underlines that geodesign is
made up of the words ‘geo’ and ‘design’. ‘Geo’
refers to the whole spectrum of the world’s life
support system, while ‘design’ is the overall
creative process of fi nding proper solutions for
problems using the available resources. I
believe that the main goal of geodesign is to
meet man’s vital needs through a ‘delicate
touch’ on Earth. Geodesign helps us to under-
stand the virtual capacity of natural and
environmental resources, and thus effi ciently
utilise the natural systems and functions.
Consequently, the results support people and
nature alike. The fundamentals of geodesign
theory are based on obtaining geographical
information correctly and accurately, and
analysing that information effi ciently.
Understanding the geography and knowing its
characteristics, advantages, shortfalls and
risks makes it easier to develop and compare
design alternatives. Geodesign provides a
precious framework for identifying
geographical characteristics of land fully and
accurately to enable development of the most
appropriate solutions in accordance with its
natural characteristics and functions. As a
result, man can correspond with nature and
the environment once again. This under-
standing during the planning and design
process is also of great importance for
sustainability; in other words, sustainable
planning is directly related to geodesign.
Global climate change, natural disasters with
increasingly devastating impact, environ-
mental problems…man has to face all this
and more. Technology can make a difference;
it can change our destiny. A geodesign
approach can help us utilise renewable
energy resources more effi ciently, tackle
climate change problems, determine suitable
land for various uses and minimise the effects
of disasters. Thus, man is not threatened by
nature nor is nature threatened by man.
Don’t forget to use delicate touches of
geomatics to heal the Earth. Until next time!
Biography
Prof Dr Alper Çabuk has a BSc in
landscape architecture, two MScs (in
environmental management and
landscape planning) and a PhD in
environmental economics. He has
contributed to numerous articles,
books and national and international
projects on geodesy, geographical
information systems and remote
sensing technologies. He is currently
manager of the Earth and Space
Sciences Institute of Anadolu
University, Turkey.
Most shared during the last month from www.gim-international.com
Navigating the Future of the Geospatial and Geomatics Sectors 1. - http://bit.ly/1BnvcZJ
Help! What Should We Do With All These 3D Points? 2. - http://bit.ly/1BnvrDT
SPOT 7 Satellite Commercially Launched3. - http://bit.ly/1Az3UQW
UAVs Revolutionise Land Administration 4. - http://bit.ly/1tem2Lo
Promising 3D Portable Measuring Instrument Launched5. - http://bit.ly/1tZqgM3
GIM2015_News 11 28-01-2015 14:10:32
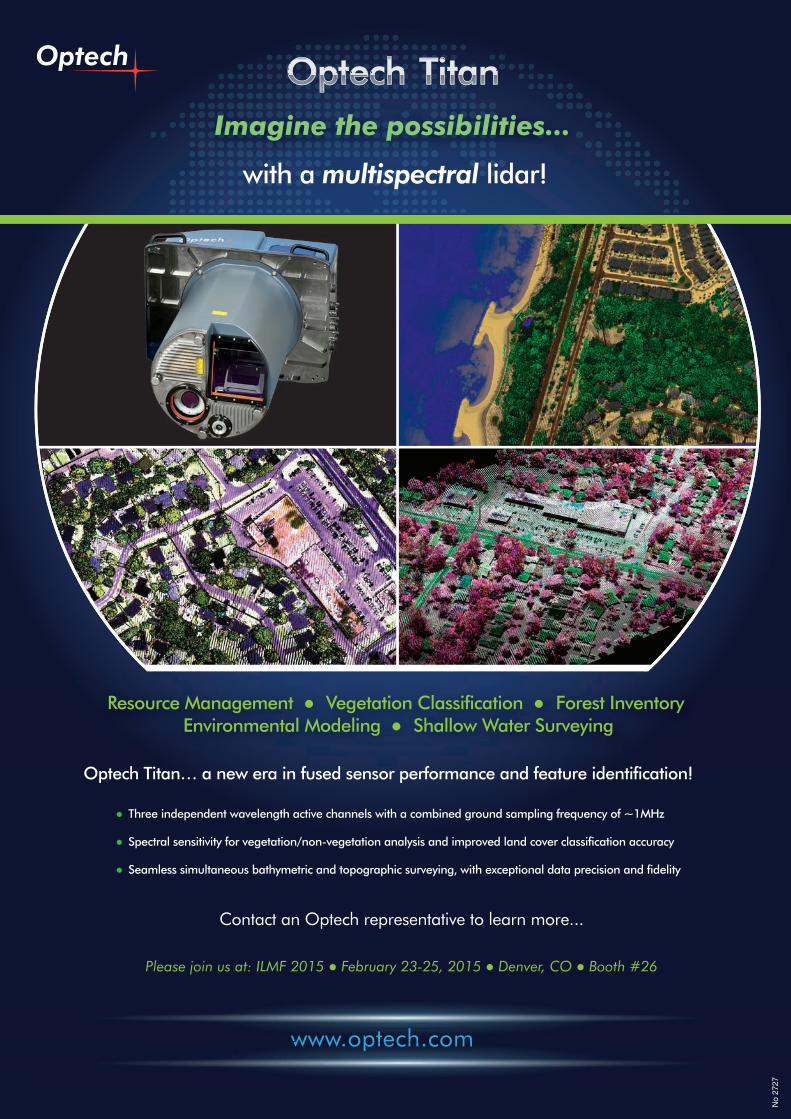
Resource Management Vegetation Classification Forest Inventory Environmental Modeling Shallow Water Surveying
Imagine the possibilities...
Optech Titan… a new era in fused sensor performance and feature identification!
Three independent wavelength active channels with a combined ground sampling frequency of ~1MHz
Spectral sensitivity for vegetation/non-vegetation analysis and improved land cover classification accuracy
Seamless simultaneous bathymetric and topographic surveying, with exceptional data precision and fidelity
Contact an Optech representative to learn more...
www.optech.comwww optech comwww.optech.comch comwww optecwww optech com
Please join us at: ILMF 2015 February 23-25, 2015 Denver, CO Booth #26
No
2727
GIM2015_News 12 28-01-2015 14:10:33
13FEBRUARY 2015 | INTERNATIONAL |
ENDPOINT
In 1994 the European Commission saw the
need for a European involvement in global
satellite navigation. Twenty years have
passed since then; what has Europe
achieved? After eight years of scuffl ing, the
EC agreed on the launch of the European
civil satellite navigation programme, Galileo.
That was in 2002. Progress was steady:
Galileo’s Giove A was put into orbit in late
2005 and Giove B followed in April 2008.
Two initial operational capability (IOC) satel-
lites became operational in October 2011,
with the second pair launched one year later.
These four satellites enabled validation of the
Galileo concept both in space and on Earth.
There was much disagreement among the
EU member states from the start, but the
blade of hope that amalgamated the clashing
minds was that Galileo would become a
commercial success because users would be
willing to pay for superior services. Together
with GPS, Galileo would enable better
coverage and higher reliability, also indoors
and in urban canyons, which is key for
safety-critical applications. But that hope
was in vain. Cooperation is diffi cult,
especially when it concerns a broad
spectrum of bureaucratic institutions. The
plethora of issues raised can be grouped into
two main categories: converging interests
and funding. The US was unhappy with a
competitor which purely focused on the
civilian user. At that time, selective availa-
bility had not yet been turned off, Beidou
was still on China’s to-do list of upcoming
projects while Glonass was in an advanced
stage of decomposition. Another GNSS,
especially from such a well-developed region
as Europe, would threaten the US’s space
Milena is Disappointed
hegemony. The European countries with
strong trade relations with the US agreed
with the claims of Galileo’s superfl uity and
opposed it strongly.
How should a multibillion-euro project be
funded? The panacea discovered in the
mid-nineties was public-private partnership
(PPP). Banks and multinationals were
persuaded to invest two-thirds of the
deployment cost, triggered by revenues
through charges on high-precision services
(low-precision services would be free and
open to all citizens). That business model
mouldered in 2007 when the US publicised
that its military did not mind the rest of the
world using GPS for free. The PPP vaporised
and the burden of Galileo came to rest on EU
taxpayers’ shoulders. By 2010 the project,
once marketed as a catalyst for economic
growth, was three times over budget without
having raised a penny and nearly a decade
behind schedule. The system would not be
operational before 2020 and would cost EU
taxpayers over EUR20 billion. Another issue
was the discrepancy in time horizon. Public-
sector timelines blow in the political winds
gusting through the various EU countries,
while political preferences may change over
time – a guarantee that projects will take
decades. The private sector cannot afford to
wait patiently for profi t to materialise.
In an attempt to win the sympathies of EU
taxpayers, in 2011 the EC organised a
drawing contest open to children born in
2000, 2001 and 2002. After all, our future is
in the hands of our youth. The Galileo satel-
lites would be named after the 27 winners –
one per EU country (Croatia did not become
an EU member until 2013). Hence, the four
satellites launched in 2011 and 2012 bear
the names Thijs, Natalia, David and Sif. The
two satellites launched August 2014 –
Doresa and Milena – were injected into the
wrong orbit. Doresa Demay from Germany
can nevertheless be proud since the
engineers succeeded in switching on
Doresa’s navigation payload once it reached
its target orbit. However, Milena Kaznatsejeva
from Estonia will remain disappointed; her
satellite will continue circling aimlessly. It will
be the year 202X before the Galileo signals
will fi nally be operational for positioning and
navigation purposes. Some call the project a
textbook example of how not to run a large-
scale infrastructure project.
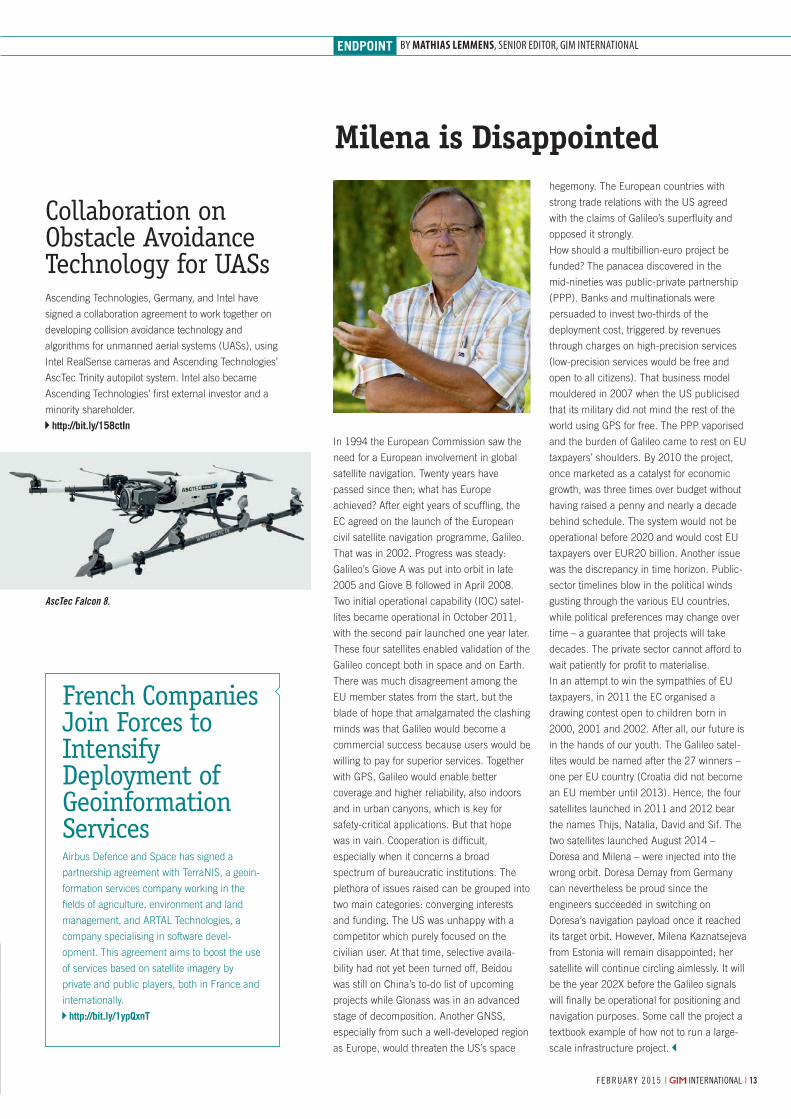
Collaboration on Obstacle Avoidance Technology for UASs Ascending Technologies, Germany, and Intel have
signed a collaboration agreement to work together on
developing collision avoidance technology and
algorithms for unmanned aerial systems (UASs), using
Intel RealSense cameras and Ascending Technologies’
AscTec Trinity autopilot system. Intel also became
Ascending Technologies’ fi rst external investor and a
minority shareholder.
http://bit.ly/158ctIn
AscTec Falcon 8.
French Companies Join Forces to Intensify Deployment of Geoinformation ServicesAirbus Defence and Space has signed a
partnership agreement with TerraNIS, a geoin-
formation services company working in the
fi elds of agriculture, environment and land
management, and ARTAL Technologies, a
company specialising in software devel-
opment. This agreement aims to boost the use
of services based on satellite imagery by
private and public players, both in France and
internationally.
http://bit.ly/1ypQxnT
BY MATHIAS LEMMENS, SENIOR EDITOR, GIM INTERNATIONAL
GIM2015_News 13 28-01-2015 14:10:33
1414 | INTERNATIONAL | F E B RU A RY 2 015| INTERNATIONAL | F E B RU A RY 2 0151414
Can you tell our readers about the start of your career and the foundation of your company?I joined the faculty of York University in 1968,
and started an atmospheric Lidar research
programme to combine my previous laser
experience with York’s strong atmospheric
science programme. Ontario Hydro was
supporting the use of the York Lidar to map
the smoke plume from a new coal-burning
power station equipped with the latest
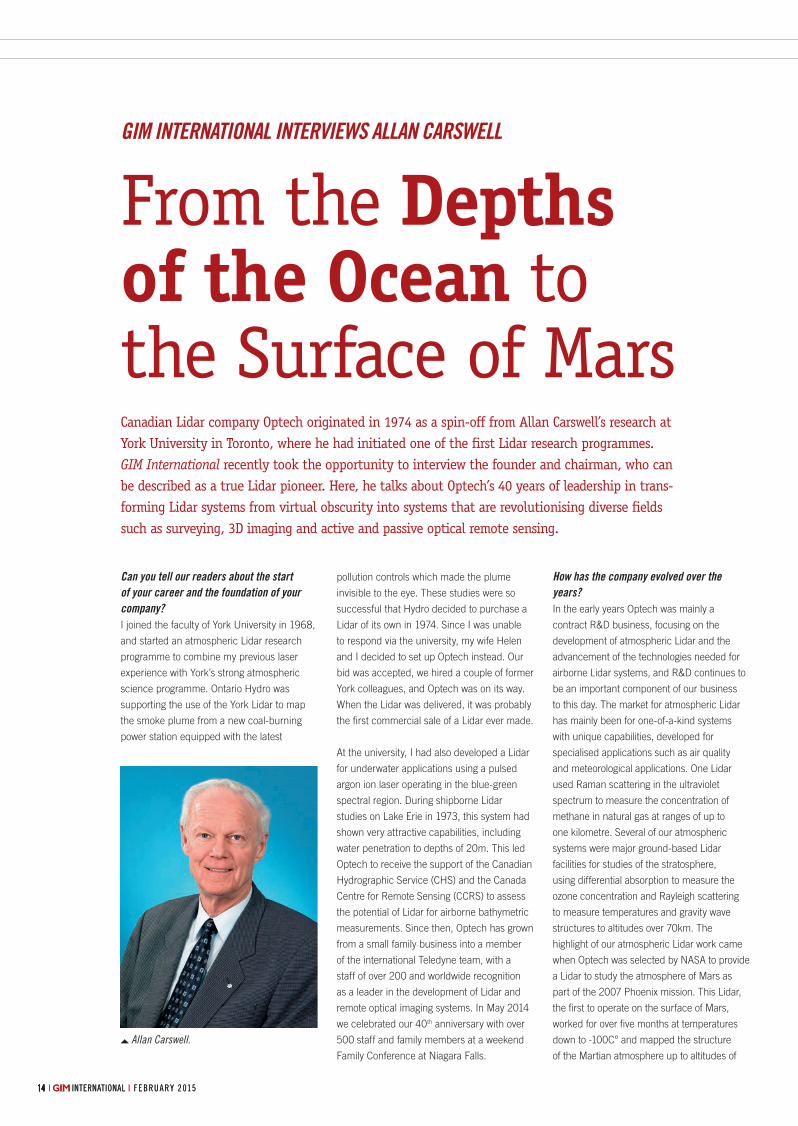
Canadian Lidar company Optech originated in 1974 as a spin-off from Allan Carswell’s research at York University in Toronto, where he had initiated one of the fi rst Lidar research programmes. GIM International recently took the opportunity to interview the founder and chairman, who can be described as a true Lidar pioneer. Here, he talks about Optech’s 40 years of leadership in trans-forming Lidar systems from virtual obscurity into systems that are revolutionising diverse fi elds such as surveying, 3D imaging and active and passive optical remote sensing.
pollution controls which made the plume
invisible to the eye. These studies were so
successful that Hydro decided to purchase a
Lidar of its own in 1974. Since I was unable
to respond via the university, my wife Helen
and I decided to set up Optech instead. Our
bid was accepted, we hired a couple of former
York colleagues, and Optech was on its way.
When the Lidar was delivered, it was probably
the fi rst commercial sale of a Lidar ever made.
At the university, I had also developed a Lidar
for underwater applications using a pulsed
argon ion laser operating in the blue-green
spectral region. During shipborne Lidar
studies on Lake Erie in 1973, this system had
shown very attractive capabilities, including
water penetration to depths of 20m. This led
Optech to receive the support of the Canadian
Hydrographic Service (CHS) and the Canada
Centre for Remote Sensing (CCRS) to assess
the potential of Lidar for airborne bathymetric
measurements. Since then, Optech has grown
from a small family business into a member
of the international Teledyne team, with a
staff of over 200 and worldwide recognition
as a leader in the development of Lidar and
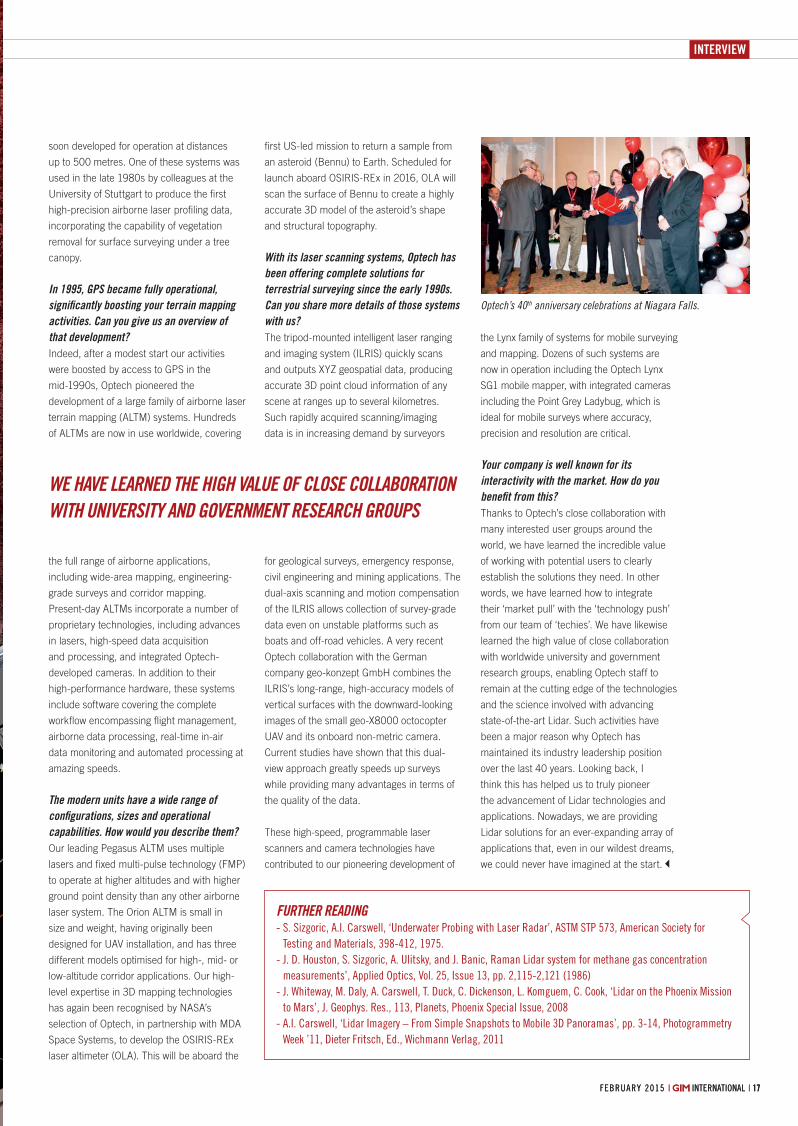
remote optical imaging systems. In May 2014
we celebrated our 40th anniversary with over
500 staff and family members at a weekend
Family Conference at Niagara Falls.
How has the company evolved over the years?In the early years Optech was mainly a
contract R&D business, focusing on the
development of atmospheric Lidar and the
advancement of the technologies needed for
airborne Lidar systems, and R&D continues to
be an important component of our business
to this day. The market for atmospheric Lidar
has mainly been for one-of-a-kind systems
with unique capabilities, developed for
specialised applications such as air quality
and meteorological applications. One Lidar
used Raman scattering in the ultraviolet
spectrum to measure the concentration of
methane in natural gas at ranges of up to
one kilometre. Several of our atmospheric
systems were major ground-based Lidar
facilities for studies of the stratosphere,
using differential absorption to measure the
ozone concentration and Rayleigh scattering
to measure temperatures and gravity wave
structures to altitudes over 70km. The
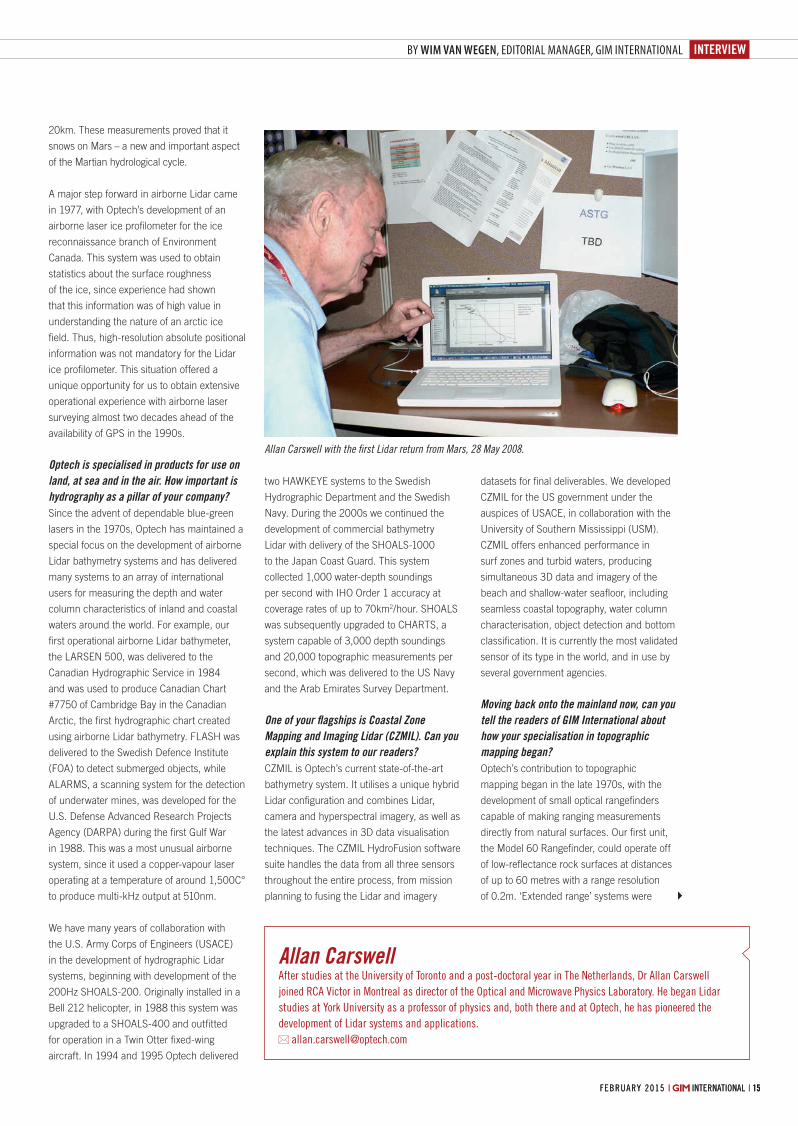
highlight of our atmospheric Lidar work came
when Optech was selected by NASA to provide
a Lidar to study the atmosphere of Mars as
part of the 2007 Phoenix mission. This Lidar,
the fi rst to operate on the surface of Mars,
worked for over fi ve months at temperatures
down to -100C° and mapped the structure
of the Martian atmosphere up to altitudes of
From the Depths of the Ocean to the Surface of Mars
Allan Carswell.
GIM INTERNATIONAL INTERVIEWS ALLAN CARSWELL
GIM0215_Interview 14 28-01-2015 13:16:58
INTERVIEW
15FEBRUARY 2015 | INTERNATIONAL |FEBRUARY 2015 | INTERNATIONAL | 15
BY WIM VAN WEGEN, EDITORIAL MANAGER, GIM INTERNATIONAL
two HAWKEYE systems to the Swedish
Hydrographic Department and the Swedish
Navy. During the 2000s we continued the
development of commercial bathymetry
Lidar with delivery of the SHOALS-1000
to the Japan Coast Guard. This system
collected 1,000 water-depth soundings
per second with IHO Order 1 accuracy at
coverage rates of up to 70km2/hour. SHOALS
was subsequently upgraded to CHARTS, a
system capable of 3,000 depth soundings
and 20,000 topographic measurements per
second, which was delivered to the US Navy
and the Arab Emirates Survey Department.
One of your fl agships is Coastal Zone Mapping and Imaging Lidar (CZMIL). Can you explain this system to our readers?CZMIL is Optech’s current state-of-the-art
bathymetry system. It utilises a unique hybrid
Lidar confi guration and combines Lidar,
camera and hyperspectral imagery, as well as
the latest advances in 3D data visualisation
techniques. The CZMIL HydroFusion software
suite handles the data from all three sensors
throughout the entire process, from mission
planning to fusing the Lidar and imagery
datasets for fi nal deliverables. We developed
CZMIL for the US government under the
auspices of USACE, in collaboration with the
University of Southern Mississippi (USM).
CZMIL offers enhanced performance in
surf zones and turbid waters, producing
simultaneous 3D data and imagery of the
beach and shallow-water seafl oor, including
seamless coastal topography, water column
characterisation, object detection and bottom
classifi cation. It is currently the most validated
sensor of its type in the world, and in use by
several government agencies.
Moving back onto the mainland now, can you tell the readers of GIM International about how your specialisation in topographic mapping began?Optech’s contribution to topographic
mapping began in the late 1970s, with the
development of small optical rangefi nders
capable of making ranging measurements
directly from natural surfaces. Our fi rst unit,
the Model 60 Rangefi nder, could operate off
of low-refl ectance rock surfaces at distances
of up to 60 metres with a range resolution
of 0.2m. ‘Extended range’ systems were
20km. These measurements proved that it
snows on Mars – a new and important aspect
of the Martian hydrological cycle.
A major step forward in airborne Lidar came
in 1977, with Optech’s development of an
airborne laser ice profi lometer for the ice
reconnaissance branch of Environment
Canada. This system was used to obtain
statistics about the surface roughness
of the ice, since experience had shown
that this information was of high value in
understanding the nature of an arctic ice
fi eld. Thus, high-resolution absolute positional
information was not mandatory for the Lidar
ice profi lometer. This situation offered a
unique opportunity for us to obtain extensive
operational experience with airborne laser
surveying almost two decades ahead of the
availability of GPS in the 1990s.
Optech is specialised in products for use on land, at sea and in the air. How important is hydrography as a pillar of your company?Since the advent of dependable blue-green
lasers in the 1970s, Optech has maintained a
special focus on the development of airborne
Lidar bathymetry systems and has delivered
many systems to an array of international
users for measuring the depth and water
column characteristics of inland and coastal
waters around the world. For example, our
fi rst operational airborne Lidar bathymeter,
the LARSEN 500, was delivered to the
Canadian Hydrographic Service in 1984
and was used to produce Canadian Chart
#7750 of Cambridge Bay in the Canadian
Arctic, the fi rst hydrographic chart created
using airborne Lidar bathymetry. FLASH was
delivered to the Swedish Defence Institute
(FOA) to detect submerged objects, while
ALARMS, a scanning system for the detection
of underwater mines, was developed for the
U.S. Defense Advanced Research Projects
Agency (DARPA) during the fi rst Gulf War
in 1988. This was a most unusual airborne
system, since it used a copper-vapour laser
operating at a temperature of around 1,500C°
to produce multi-kHz output at 510nm.
We have many years of collaboration with
the U.S. Army Corps of Engineers (USACE)
in the development of hydrographic Lidar
systems, beginning with development of the
200Hz SHOALS-200. Originally installed in a
Bell 212 helicopter, in 1988 this system was
upgraded to a SHOALS-400 and outfi tted
for operation in a Twin Otter fi xed-wing
aircraft. In 1994 and 1995 Optech delivered
Allan CarswellAfter studies at the University of Toronto and a post-doctoral year in The Netherlands, Dr Allan Carswell
joined RCA Victor in Montreal as director of the Optical and Microwave Physics Laboratory. He began Lidar
studies at York University as a professor of physics and, both there and at Optech, he has pioneered the
development of Lidar systems and applications.
Allan Carswell with the fi rst Lidar return from Mars, 28 May 2008.
GIM0215_Interview 15 28-01-2015 13:16:59

MicroSurvey CAD 2015 is now available, and you owe it to yourself to try it!
Unlock the full potential of your workstation with the 64-bit version of MicroSurvey CAD. Harness the power and capabilities of the integrated IntelliCAD 8 engine, and experience faster drafting and calculation operations while working with larger drawings, more points, and an overall more powerful MicroSurvey CAD than ever before.
Download a free demo from ourwebsite: www.microsurvey.com
Built on IntelliCAD® 864-bit and 32-bit versionsImproved performanceDWG 2013 support(AutoCAD® 2013, 2014, 2015)Layer states and filtersQuick-selectAdaptive gridNew 3D orbit commands
Dynamic licensingAutoMAP plotted descriptionsAutoMAP substitution codesGoogle Earth™ KML exportLeica codelists & ghost pointsLine/curve/tie table selectionsCOGO bearing rotation displayDraw cluster error vectorsMore .xyz point cloud formats
® M
icro
Sur
vey
is re
gist
ered
in th
e U
.S. P
aten
t and
Tr
adem
ark
Off
ice
by M
icro
Sur
vey
Sof
twar
e In
c.
Mic
roS
urve
y is
par
t of H
exag
on.
Goo
gle
Ear
th is
a tr
adem
ark
of G
oogl
e In
c.
Auto
CA
D is
a re
gist
ered
trad
emar
k of
Aut
odes
k,
Inc.
, in
the
US
A a
nd o
ther
cou
ntri
es.
No
2717
GIM0215_Interview 16 28-01-2015 13:17:00
INTERVIEW
FEBRUARY 2015 | INTERNATIONAL | 1717FEBRUARY 2015 | INTERNATIONAL |
soon developed for operation at distances
up to 500 metres. One of these systems was
used in the late 1980s by colleagues at the
University of Stuttgart to produce the fi rst
high-precision airborne laser profi ling data,
incorporating the capability of vegetation
removal for surface surveying under a tree
canopy.
In 1995, GPS became fully operational, signifi cantly boosting your terrain mapping activities. Can you give us an overview of that development?Indeed, after a modest start our activities
were boosted by access to GPS in the
mid-1990s, Optech pioneered the
development of a large family of airborne laser
terrain mapping (ALTM) systems. Hundreds
of ALTMs are now in use worldwide, covering
the full range of airborne applications,
including wide-area mapping, engineering-
grade surveys and corridor mapping.
Present-day ALTMs incorporate a number of
proprietary technologies, including advances
in lasers, high-speed data acquisition
and processing, and integrated Optech-
developed cameras. In addition to their
high-performance hardware, these systems
include software covering the complete
workfl ow encompassing fl ight management,
airborne data processing, real-time in-air
data monitoring and automated processing at
amazing speeds.
The modern units have a wide range of confi gurations, sizes and operational capabilities. How would you describe them?Our leading Pegasus ALTM uses multiple
lasers and fi xed multi-pulse technology (FMP)
to operate at higher altitudes and with higher
ground point density than any other airborne
laser system. The Orion ALTM is small in
size and weight, having originally been
designed for UAV installation, and has three
different models optimised for high-, mid- or
low-altitude corridor applications. Our high-
level expertise in 3D mapping technologies
has again been recognised by NASA’s
selection of Optech, in partnership with MDA
Space Systems, to develop the OSIRIS-REx
laser altimeter (OLA). This will be aboard the
fi rst US-led mission to return a sample from
an asteroid (Bennu) to Earth. Scheduled for
launch aboard OSIRIS-REx in 2016, OLA will
scan the surface of Bennu to create a highly
accurate 3D model of the asteroid’s shape
and structural topography.
With its laser scanning systems, Optech has been offering complete solutions for terrestrial surveying since the early 1990s. Can you share more details of those systems with us?The tripod-mounted intelligent laser ranging
and imaging system (ILRIS) quickly scans
and outputs XYZ geospatial data, producing
accurate 3D point cloud information of any
scene at ranges up to several kilometres.
Such rapidly acquired scanning/imaging
data is in increasing demand by surveyors
for geological surveys, emergency response,
civil engineering and mining applications. The
dual-axis scanning and motion compensation
of the ILRIS allows collection of survey-grade
data even on unstable platforms such as
boats and off-road vehicles. A very recent
Optech collaboration with the German
company geo-konzept GmbH combines the
ILRIS’s long-range, high-accuracy models of
vertical surfaces with the downward-looking
images of the small geo-X8000 octocopter
UAV and its onboard non-metric camera.
Current studies have shown that this dual-
view approach greatly speeds up surveys
while providing many advantages in terms of
the quality of the data.
These high-speed, programmable laser
scanners and camera technologies have
contributed to our pioneering development of
the Lynx family of systems for mobile surveying
and mapping. Dozens of such systems are
now in operation including the Optech Lynx
SG1 mobile mapper, with integrated cameras
including the Point Grey Ladybug, which is
ideal for mobile surveys where accuracy,
precision and resolution are critical.
Your company is well known for its interactivity with the market. How do you benefi t from this?Thanks to Optech’s close collaboration with
many interested user groups around the
world, we have learned the incredible value
of working with potential users to clearly
establish the solutions they need. In other
words, we have learned how to integrate
their ‘market pull’ with the ‘technology push’
from our team of ‘techies’. We have likewise
learned the high value of close collaboration
with worldwide university and government
research groups, enabling Optech staff to
remain at the cutting edge of the technologies
and the science involved with advancing
state-of-the-art Lidar. Such activities have
been a major reason why Optech has
maintained its industry leadership position
over the last 40 years. Looking back, I
think this has helped us to truly pioneer
the advancement of Lidar technologies and
applications. Nowadays, we are providing
Lidar solutions for an ever-expanding array of
applications that, even in our wildest dreams,
we could never have imagined at the start.
FURTHER READING- S. Sizgoric, A.I. Carswell, ‘Underwater Probing with Laser Radar’, ASTM STP 573, American Society for
Testing and Materials, 398-412, 1975.
- J. D. Houston, S. Sizgoric, A. Ulitsky, and J. Banic, Raman Lidar system for methane gas concentration
measurements’, Applied Optics, Vol. 25, Issue 13, pp. 2,115-2,121 (1986)
- J. Whiteway, M. Daly, A. Carswell, T. Duck, C. Dickenson, L. Komguem, C. Cook, ‘Lidar on the Phoenix Mission
to Mars’, J. Geophys. Res., 113, Planets, Phoenix Special Issue, 2008
- A.I. Carswell, ‘Lidar Imagery – From Simple Snapshots to Mobile 3D Panoramas’, pp. 3-14, Photogrammetry
Week ’11, Dieter Fritsch, Ed., Wichmann Verlag, 2011
WE HAVE LEARNED THE HIGH VALUE OF CLOSE COLLABORATION WITH UNIVERSITY AND GOVERNMENT RESEARCH GROUPS
Optech’s 40th anniversary celebrations at Niagara Falls.
GIM0215_Interview 17 28-01-2015 13:17:01

1818 | INTERNATIONAL | F E B RU A RY 2 015181818 | INTERNATIONAL | F E B RU A RY 2 015| INTERNATIONAL | F E B RU A RY 2 0151818
The risk of devastating fl oods is being
increased by heavier and more frequent
rainfall due to climate change, as well as
by the removal of vegetation and soil that
used to absorb water. Flooding can damage
infrastructure and buildings, costing human
lives and causing considerable economic
losses. Decision-makers need to estimate
how susceptible various elements are to
the impact of fl ooding. This is called ‘fl ood
Floods have a high impact in densely populated areas, especially when strategic infrastructure is affected. There are various human and territorial factors that infl uence an area’s vulnerability to fl ooding. Intensive agricultural activity and large urbanised areas are examples of such human factors, while the soil’s ability to absorb water is a major territorial factor. A quantifi cation of fl ood vulnerability can be created by combining numerical indicators for the various factors into a single index number that is easy to interpret for decision-makers. GIS tools can easily be applied to calculate these indicators from various open spatial data sources, offering a low-cost methodology to produce vulnerability maps.
vulnerability’. Maps that show the spatial
distribution and quantify the vulnerability of
at-risk elements facilitate decision-making.
The challenge is to quantify multiple human
and territorial factors and express fl ood
vulnerability as a single index number.
The severity of fl ood damage depends on how
many people live in an area, the economic
value of land and the density of buildings,
roads and other infrastructure. These factors
are combined to form the human vulnerability
index. Furthermore, the extent of the area
affected by fl ooding depends on the ability of
the soil to absorb water and on the presence
of dams, dykes and other fl ood-protection
infrastructure. If local protection volunteers
or early warning systems, such as monitoring
stations, are present in an area, the
vulnerability will be lower. All of these factors
are included in the territorial vulnerability
index.
VULNERABILITY INDEXThe overall vulnerability index ranks the
vulnerability based on four classes: low,
medium, medium-high and high. Its
calculation combines two main components:
the human vulnerability index and the
territorial vulnerability index (Table 1).
Commonly available open spatial datasets can
be used in GIS to calculate the factors each
index comprises.
The human vulnerability index includes three
factors:
1. Human system indicator (HSI): the
normalised percentage of people younger
than 5 years of age and older than 65,
multiplied by population density within a
given municipal area. This is a combination
of statistical data and municipal
boundaries.
2. Social system indicator (SSI): the type of
Mapping Flood Vulnerability
DERIVING RISK INDICATORS FROM OPEN DATA
Figure 1, Spatial distribution of the human vulnerability index over the Musone watershed area (Marche Region, Italy)
with high values along the coast and in towns near the Castreccioni dam.
GIM0215_Feature Sini 18 28-01-2015 13:30:08
FEATURE
19FEBRUARY 2015 | INTERNATIONAL | 19FEBRUARY 2015 | INTERNATIONAL |FEBRUARY 2015 | INTERNATIONAL | 19
BY CHIARA TAGNANI, MARCHE POLYTECHNIC UNIVERSITY, FRANCESCA SINI, MARCHE REGION, AND MARCO PELLEGRINI, LIF SRL, ITALY
example in case of opening the bottom
outlet of a dam. Maps with predicted
fl ooded areas from hydrologic and
hydraulic models in combination with
topographic maps are needed, and these
are usually provided by dam owners.
TEST AREA AND MATERIALThe test area was the Musone watershed,
located in the Marche Region, which is in
the eastern part of central Italy. The basin is
mostly mountainous, except for the urbanised
coast. The national and regional cartographic
and statistical datasets which were used are
publicly accessible via web portals [1,2,3]
or provided by the relevant organisation for
institutional purposes [4]. Table 2 shows
the open datasets which were employed to
calculate each of the vulnerability factors.
1:10,000 orthophoto maps dating from 2006
were used as a reference for overlays with the
fl ood vulnerability maps.
GIS PROCESSING AND RESULTSRoad, land use and geological maps were
classifi ed as indicated in Table 1. The
vulnerability indicators were calculated and
their values were assigned to the attribute
tables of the associated layer. For each layer,
a 10m x 10m vector grid was created to
enable spatial comparison of the datasets
and addition of the associated vulnerability
indicators. The grid divides the vector map
into individual grid cells which are polygon
land cover from land-use maps, ranked
based on estimated population density as
an indicator of economic damage.
3. Infrastructure system indicator (ISI): the
summation of the type of road (R) from
road maps and number of buildings per
square kilometre from topographic maps,
assigning the highest value to hospitals (B).
The territorial vulnerability index also takes
into account three factors:
1. Monitoring and prevention system indicator
(MPSI): the summation of the number of
hydro-meteorological monitoring stations
and local civil protection volunteer corps
per square kilometre within a given
municipal area. Meteorological-hydrological
monitoring networks can provide these
numbers which can be combined with
maps showing municipal boundaries.
2. Morphology indicator (MI): the ability of
the soil to absorb water. This data is gained
from geological maps.
3. Waterway infrastructure indicator (WII):
the highest ranking for fl ooded areas, for
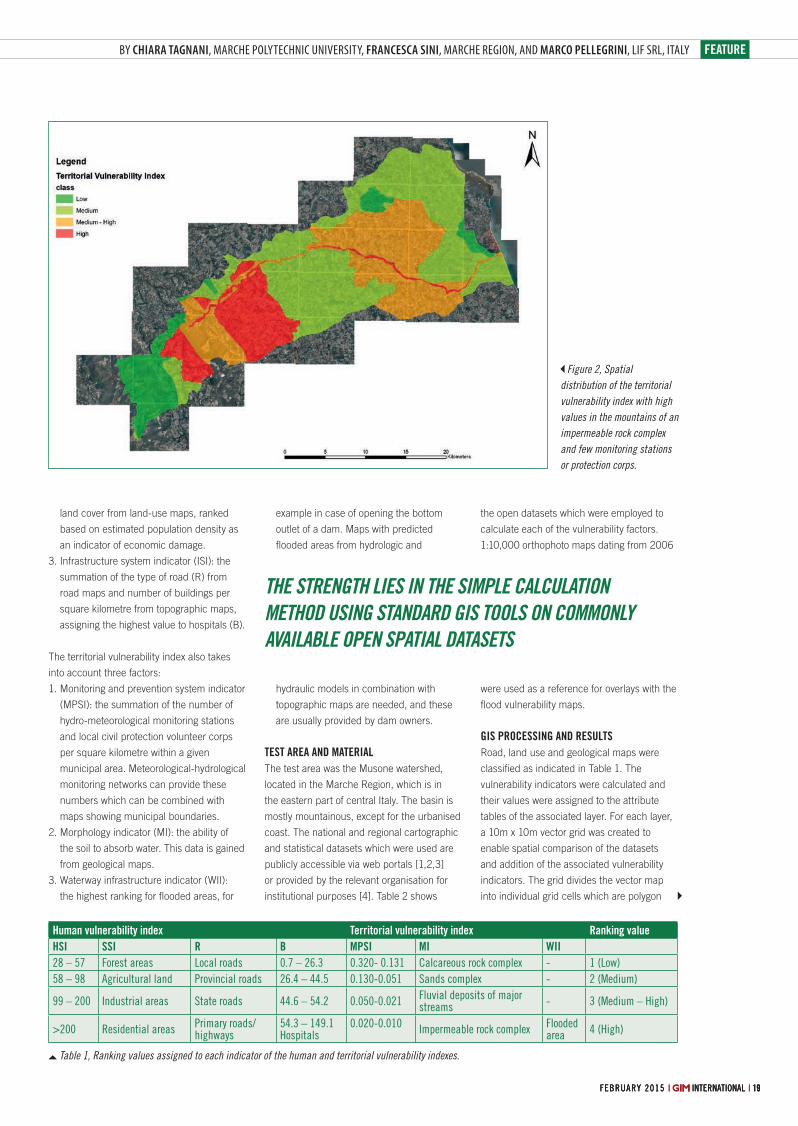
Figure 2, Spatial
distribution of the territorial
vulnerability index with high
values in the mountains of an
impermeable rock complex
and few monitoring stations
or protection corps.
Human vulnerability index Territorial vulnerability index Ranking valueHSI SSI R B MPSI MI WII28 – 57 Forest areas Local roads 0.7 – 26.3 0.320- 0.131 Calcareous rock complex - 1 (Low)
58 – 98 Agricultural land Provincial roads 26.4 – 44.5 0.130-0.051 Sands complex - 2 (Medium)
99 – 200 Industrial areas State roads 44.6 – 54.2 0.050-0.021Fluvial deposits of major streams
- 3 (Medium – High)
>200 Residential areasPrimary roads/ highways
54.3 – 149.1 Hospitals
0.020-0.010Impermeable rock complex
Flooded area
4 (High)
Table 1, Ranking values assigned to each indicator of the human and territorial vulnerability indexes.
THE STRENGTH LIES IN THE SIMPLE CALCULATION METHOD USING STANDARD GIS TOOLS ON COMMONLY AVAILABLE OPEN SPATIAL DATASETS
GIM0215_Feature Sini 19 28-01-2015 13:30:09
No
2675
GIM0215_Feature Sini 20 28-01-2015 13:30:09
FEATURE
FEBRUARY 2015 | INTERNATIONAL | 2121FEBRUARY 2015 | INTERNATIONAL |
CHIARA TAGNANIChiara Tagnani received an MSc degree in
environmental sustainability and civil protection
from Marche Polytechnic University in 2013.
FRANCESCA SINIFrancesca Sini is a hydrologist at Marche
Region and contract professor of GIS tools in
civil and environmental protection at Marche
Polytechnic University in Italy. In 2006 she gained a PhD
in methods and technologies for environmental
monitoring from the University of Basilicata, Italy.
MARCO PELLEGRINIMarco Pellegrini is an ICT engineer at LIF srl
and assistant lecturer in physics and
telecommunications engineering at Marche
Polytechnic University. He holds a PhD in methods and
technologies for environmental monitoring from the
University of Basilicata, Italy.
features and can be attributed and selected.
The 10m x 10m grid size was a compromise
between the computation load and the need
to distinguish small elements such as roads
and buildings. Ranking values from 1 (low)
to 4 (high) were assigned to each indicator
according to ranges and classes in Table 1.
For each polygon of the vector grid, indicator
values related to the human vulnerability
index and to the territorial vulnerability
index have been summed. Each indicator is
assumed to have equal weighting. The index
values have again been ranked from low to
high using a classifi cation method based on
natural breaks in the histogram. This standard
method chooses class breaks that best group
similar values and maximise the differences
between classes. Figures 1 and 2 show the
resulting human and territorial vulnerability
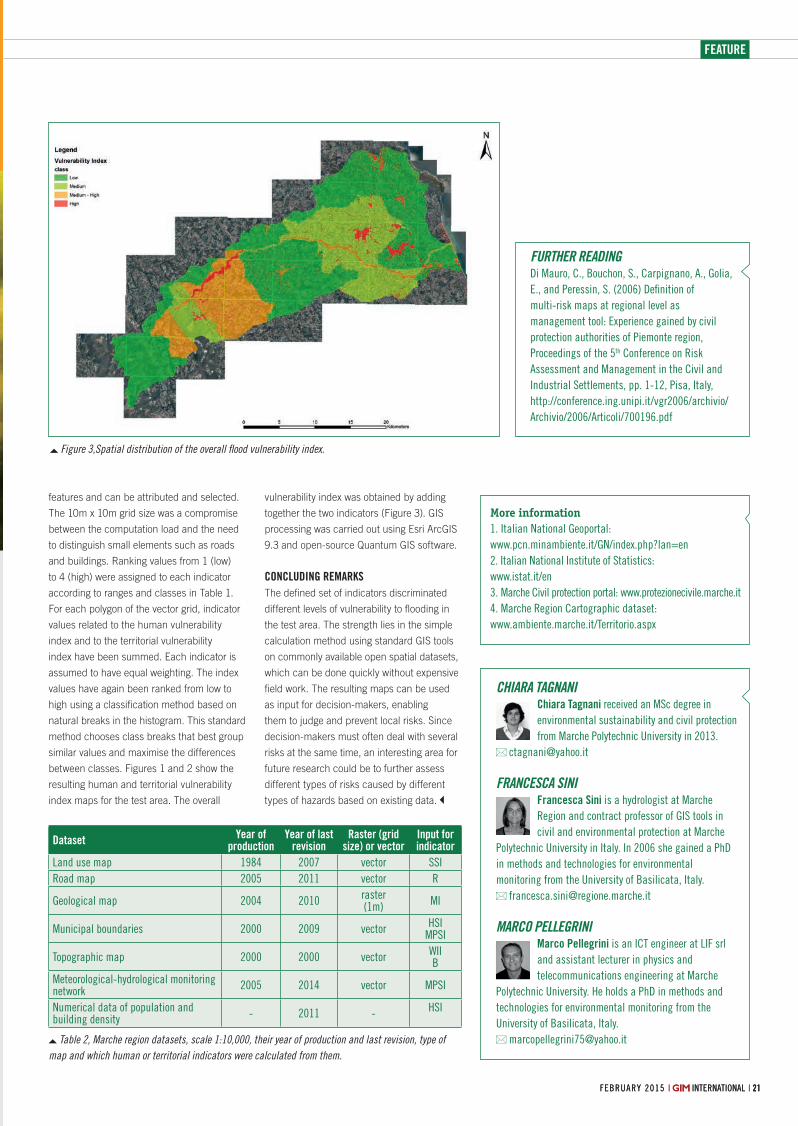
index maps for the test area. The overall
vulnerability index was obtained by adding
together the two indicators (Figure 3). GIS
processing was carried out using Esri ArcGIS
9.3 and open-source Quantum GIS software.
CONCLUDING REMARKSThe defi ned set of indicators discriminated
different levels of vulnerability to fl ooding in
the test area. The strength lies in the simple
calculation method using standard GIS tools
on commonly available open spatial datasets,
which can be done quickly without expensive
fi eld work. The resulting maps can be used
as input for decision-makers, enabling
them to judge and prevent local risks. Since
decision-makers must often deal with several
risks at the same time, an interesting area for
future research could be to further assess
different types of risks caused by different
types of hazards based on existing data.
Figure 3,Spatial distribution of the overall fl ood vulnerability index.
Dataset Year of production
Year of last revision
Raster (grid size) or vector
Input for indicator
Land use map 1984 2007 vector SSI
Road map 2005 2011 vector R
Geological map 2004 2010raster(1m)
MI
Municipal boundaries 2000 2009 vectorHSI
MPSI
Topographic map 2000 2000 vectorWIIB
Meteorological-hydrological monitoring network
2005 2014 vector MPSI
Numerical data of population and building density
- 2011 -HSI
Table 2, Marche region datasets, scale 1:10,000, their year of production and last revision, type of
map and which human or territorial indicators were calculated from them.
More information
1. Italian National Geoportal:
www.pcn.minambiente.it/GN/index.php?lan=en
2. Italian National Institute of Statistics:
www.istat.it/en
3. Marche Civil protection portal: www.protezionecivile.marche.it
4. Marche Region Cartographic dataset:
www.ambiente.marche.it/Territorio.aspx
FURTHER READINGDi Mauro, C., Bouchon, S., Carpignano, A., Golia,
E., and Peressin, S. (2006) Defi nition of
multi-risk maps at regional level as
management tool: Experience gained by civil
protection authorities of Piemonte region,
Proceedings of the 5th Conference on Risk
Assessment and Management in the Civil and
Industrial Settlements, pp. 1-12, Pisa, Italy,
http://conference.ing.unipi.it/vgr2006/archivio/
Archivio/2006/Articoli/700196.pdf
GIM0215_Feature Sini 21 28-01-2015 13:30:10
2222 | INTERNATIONAL | F E B RU A RY 2 015| INTERNATIONAL | F E B RU A RY 2 0152222
Lidar systems have fundamentally changed
the world of mapping and surveying. Airborne
systems can cover large areas and remote
places, while terrestrial systems can be used
for local yet detailed scans both outside and
inside buildings. The ICESat satellite has even
shown that Lidar technology can be used for
mapping from space. Since the introduction
of the fi rst Lidar system there have been
many technological developments such
as multiple pulses in air and full waveform
recording, and the next major development
will most likely be multispectral Lidar.
Until now, most commercially available airborne Lidar systems have operated on one single wavelength, refl ecting energy from a pulse which is then used for classifi cation or visualisation. New developments have produced the fi rst multispectral Lidar systems, which scan using laser pulses in a number of different wave-lengths. Multispectral Lidar data contains valuable information about the objects scanned. The fast-moving advancements in this fi eld are likely to represent the next technological leap in Lidar systems.
IMAGES AND LIDARMultispectral imaging data has been used for
decades. Apart from the visible red, green and
blue values, these datasets contain refl ection
data for many other wavelengths in the infrared
part of the electromagnetic spectrum. The
technology relies on cameras that are sensitive
to a large number of different wavelengths.
Cameras which can pick up between four and
20 wavelengths are called ‘multispectral’, and
the term ‘hyperspectral’ is applied to cameras
that are capable of recording more than 20
wavelengths. Multispectral imaging data is
used to classify regions or objects by their
spectral response, for instance to recognise
different plant species. In recent years there
has been growing interest in combining such
multispectral data with Lidar data. This can
be done by gridding the Lidar data in a raster
with a cell size similar to the multispectral data.
Alternatively, a look-up method can be applied
to fi nd the corresponding value from the
multispectral data for each laser point.
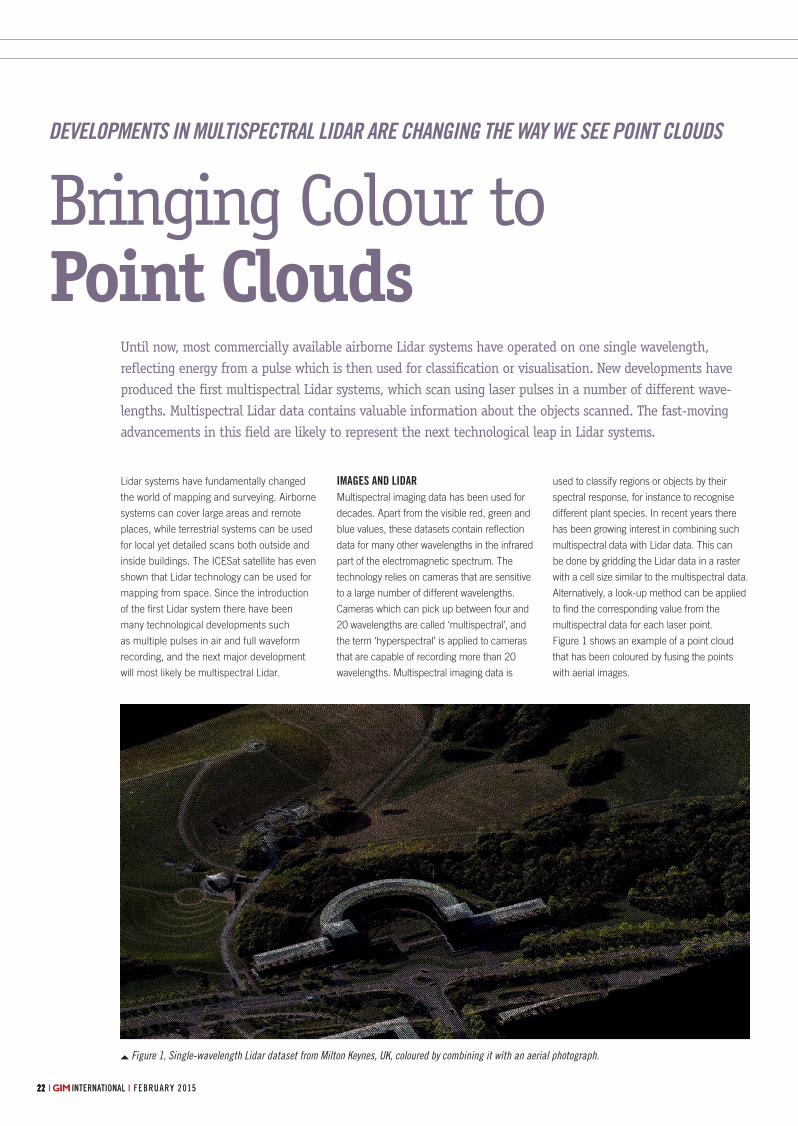
Figure 1 shows an example of a point cloud
that has been coloured by fusing the points
with aerial images.
Bringing Colour to Point Clouds
DEVELOPMENTS IN MULTISPECTRAL LIDAR ARE CHANGING THE WAY WE SEE POINT CLOUDS
Figure 1, Single-wavelength Lidar dataset from Milton Keynes, UK, coloured by combining it with an aerial photograph.
GIM0215_Feature Fleming 22 28-01-2015 13:56:45
FEATURE
23FEBRUARY 2015 | INTERNATIONAL | 23FEBRUARY 2015 | INTERNATIONAL |FEBRUARY 2015 | INTERNATIONAL | 23
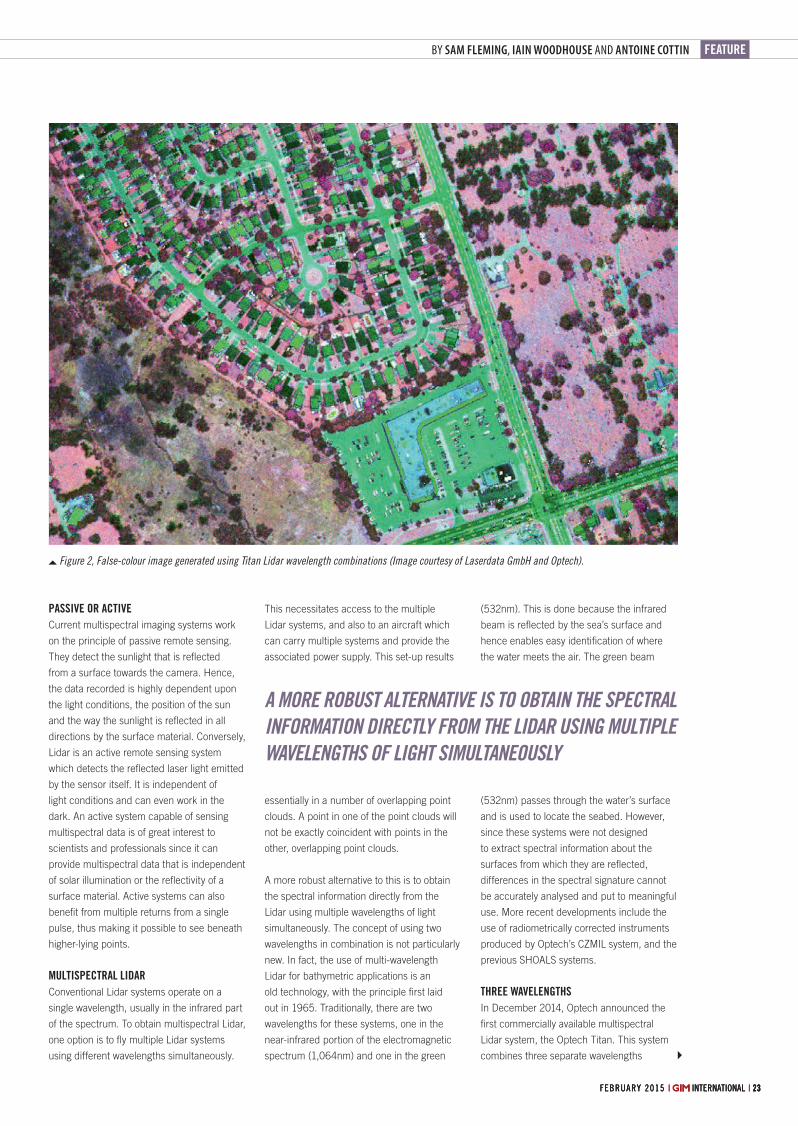
BY SAM FLEMING, IAIN WOODHOUSE AND ANTOINE COTTIN
This necessitates access to the multiple
Lidar systems, and also to an aircraft which
can carry multiple systems and provide the
associated power supply. This set-up results
essentially in a number of overlapping point
clouds. A point in one of the point clouds will
not be exactly coincident with points in the
other, overlapping point clouds.
A more robust alternative to this is to obtain
the spectral information directly from the
Lidar using multiple wavelengths of light
simultaneously. The concept of using two
wavelengths in combination is not particularly
new. In fact, the use of multi-wavelength
Lidar for bathymetric applications is an
old technology, with the principle fi rst laid
out in 1965. Traditionally, there are two
wavelengths for these systems, one in the
near-infrared portion of the electromagnetic
spectrum (1,064nm) and one in the green
(532nm). This is done because the infrared
beam is refl ected by the sea’s surface and
hence enables easy identifi cation of where
the water meets the air. The green beam
(532nm) passes through the water’s surface
and is used to locate the seabed. However,
since these systems were not designed
to extract spectral information about the
surfaces from which they are refl ected,
differences in the spectral signature cannot
be accurately analysed and put to meaningful
use. More recent developments include the
use of radiometrically corrected instruments
produced by Optech’s CZMIL system, and the
previous SHOALS systems.
THREE WAVELENGTHSIn December 2014, Optech announced the
fi rst commercially available multispectral
Lidar system, the Optech Titan. This system
combines three separate wavelengths
PASSIVE OR ACTIVECurrent multispectral imaging systems work
on the principle of passive remote sensing.
They detect the sunlight that is refl ected
from a surface towards the camera. Hence,
the data recorded is highly dependent upon
the light conditions, the position of the sun
and the way the sunlight is refl ected in all
directions by the surface material. Conversely,
Lidar is an active remote sensing system
which detects the refl ected laser light emitted
by the sensor itself. It is independent of
light conditions and can even work in the
dark. An active system capable of sensing
multispectral data is of great interest to
scientists and professionals since it can
provide multispectral data that is independent
of solar illumination or the refl ectivity of a
surface material. Active systems can also
benefi t from multiple returns from a single
pulse, thus making it possible to see beneath
higher-lying points.
MULTISPECTRAL LIDARConventional Lidar systems operate on a
single wavelength, usually in the infrared part
of the spectrum. To obtain multispectral Lidar,
one option is to fl y multiple Lidar systems
using different wavelengths simultaneously.
Figure 2, False-colour image generated using Titan Lidar wavelength combinations (Image courtesy of Laserdata GmbH and Optech).
A MORE ROBUST ALTERNATIVE IS TO OBTAIN THE SPECTRAL INFORMATION DIRECTLY FROM THE LIDAR USING MULTIPLE WAVELENGTHS OF LIGHT SIMULTANEOUSLY
GIM0215_Feature Fleming 23 28-01-2015 13:56:46

No
2690
o 26
90
GIM0215_Feature Fleming 24 28-01-2015 13:56:46
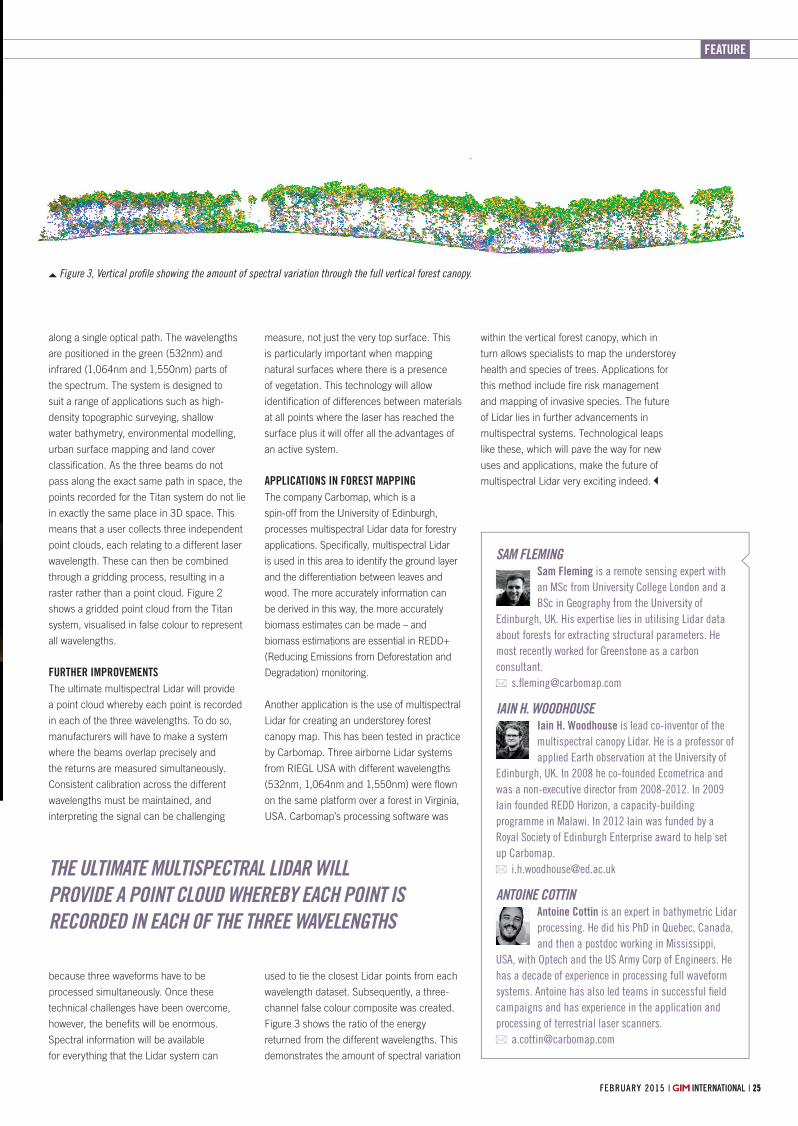
FEATURE
FEBRUARY 2015 | INTERNATIONAL | 2525FEBRUARY 2015 | INTERNATIONAL |
SAM FLEMINGSam Fleming is a remote sensing expert with
an MSc from University College London and a
BSc in Geography from the University of
Edinburgh, UK. His expertise lies in utilising Lidar data
about forests for extracting structural parameters. He
most recently worked for Greenstone as a carbon
consultant.
s.fl [email protected]
IAIN H. WOODHOUSEIain H. Woodhouse is lead co-inventor of the
multispectral canopy Lidar. He is a professor of
applied Earth observation at the University of
Edinburgh, UK. In 2008 he co-founded Ecometrica and
was a non-executive director from 2008-2012. In 2009
Iain founded REDD Horizon, a capacity-building
programme in Malawi. In 2012 Iain was funded by a
Royal Society of Edinburgh Enterprise award to help set
up Carbomap.
ANTOINE COTTINAntoine Cottin is an expert in bathymetric Lidar
processing. He did his PhD in Quebec, Canada,
and then a postdoc working in Mississippi,
USA, with Optech and the US Army Corp of Engineers. He
has a decade of experience in processing full waveform
systems. Antoine has also led teams in successful fi eld
campaigns and has experience in the application and
processing of terrestrial laser scanners.
along a single optical path. The wavelengths
are positioned in the green (532nm) and
infrared (1,064nm and 1,550nm) parts of
the spectrum. The system is designed to
suit a range of applications such as high-
density topographic surveying, shallow
water bathymetry, environmental modelling,
urban surface mapping and land cover
classifi cation. As the three beams do not
pass along the exact same path in space, the
points recorded for the Titan system do not lie
in exactly the same place in 3D space. This
means that a user collects three independent
point clouds, each relating to a different laser
wavelength. These can then be combined
through a gridding process, resulting in a
raster rather than a point cloud. Figure 2
shows a gridded point cloud from the Titan
system, visualised in false colour to represent
all wavelengths.
FURTHER IMPROVEMENTSThe ultimate multispectral Lidar will provide
a point cloud whereby each point is recorded
in each of the three wavelengths. To do so,
manufacturers will have to make a system
where the beams overlap precisely and
the returns are measured simultaneously.
Consistent calibration across the different
wavelengths must be maintained, and
interpreting the signal can be challenging
because three waveforms have to be
processed simultaneously. Once these
technical challenges have been overcome,
however, the benefi ts will be enormous.
Spectral information will be available
for everything that the Lidar system can
measure, not just the very top surface. This
is particularly important when mapping
natural surfaces where there is a presence
of vegetation. This technology will allow
identifi cation of differences between materials
at all points where the laser has reached the
surface plus it will offer all the advantages of
an active system.
APPLICATIONS IN FOREST MAPPINGThe company Carbomap, which is a
spin-off from the University of Edinburgh,
processes multispectral Lidar data for forestry
applications. Specifi cally, multispectral Lidar
is used in this area to identify the ground layer
and the differentiation between leaves and
wood. The more accurately information can
be derived in this way, the more accurately
biomass estimates can be made – and
biomass estimations are essential in REDD+
(Reducing Emissions from Deforestation and
Degradation) monitoring.
Another application is the use of multispectral
Lidar for creating an understorey forest
canopy map. This has been tested in practice
by Carbomap. Three airborne Lidar systems
from RIEGL USA with different wavelengths
(532nm, 1,064nm and 1,550nm) were fl own
on the same platform over a forest in Virginia,
USA. Carbomap’s processing software was
used to tie the closest Lidar points from each
wavelength dataset. Subsequently, a three-
channel false colour composite was created.
Figure 3 shows the ratio of the energy
returned from the different wavelengths. This
demonstrates the amount of spectral variation
within the vertical forest canopy, which in
turn allows specialists to map the understorey
health and species of trees. Applications for
this method include fi re risk management
and mapping of invasive species. The future
of Lidar lies in further advancements in
multispectral systems. Technological leaps
like these, which will pave the way for new
uses and applications, make the future of
multispectral Lidar very exciting indeed.
Figure 3, Vertical profi le showing the amount of spectral variation through the full vertical forest canopy.
THE ULTIMATE MULTISPECTRAL LIDAR WILL PROVIDE A POINT CLOUD WHEREBY EACH POINT IS RECORDED IN EACH OF THE THREE WAVELENGTHS
GIM0215_Feature Fleming 25 28-01-2015 13:56:47
The MB-ONE’s extremely compact, dual-core design
enables low power consumption and high performance.
Count on accurate GNSS-based heading and attitude
for static and dynamic applications. Man the unmanned
and more with the full range of Ashtech’s GNSS receivers
from Integrated Technologies, a division of Trimble.
Man the Unmannedwith centimeter- to decimeter-level accuracy.
InTech.trimble.com
© Copyright 2014 Ashtech. All rights reserved. The Ashtech logo and Z-Blade are trademarks of Ashtech. All other trademarks are the property of their respective owners. TPC099 (11/14)
THE ASHTECH MB-ONE — A NEXT GENERATION COMPACT, POWERFUL GNSS OEM RECEIVER MODULEImpressive GNSS and RTK technology paired with Ethernet support in a
miniature, power-saving design achieves centimeter- to decimeter-level
accuracy for unmanned applications and more.
MB-ONE RECEIVER: FOR HIGH-PERFORMANCE, CENTIMETER-LEVEL POSITIONING IN A MINIATURE, POWER-SAVING DESIGN
• Precise Heading + Pitch/Roll
• Precise Point Positioning using L-Band services
• 240 Channel Dual Core Engine with Ashtech Z-Blade Technology
• L1-only RTK and L1/L2 RTK with Precise Platform Positioning (P3) including Heading
Trimble GNSS OEM
No
2669
GIM0215_Feature Fleming 26 28-01-2015 13:56:47
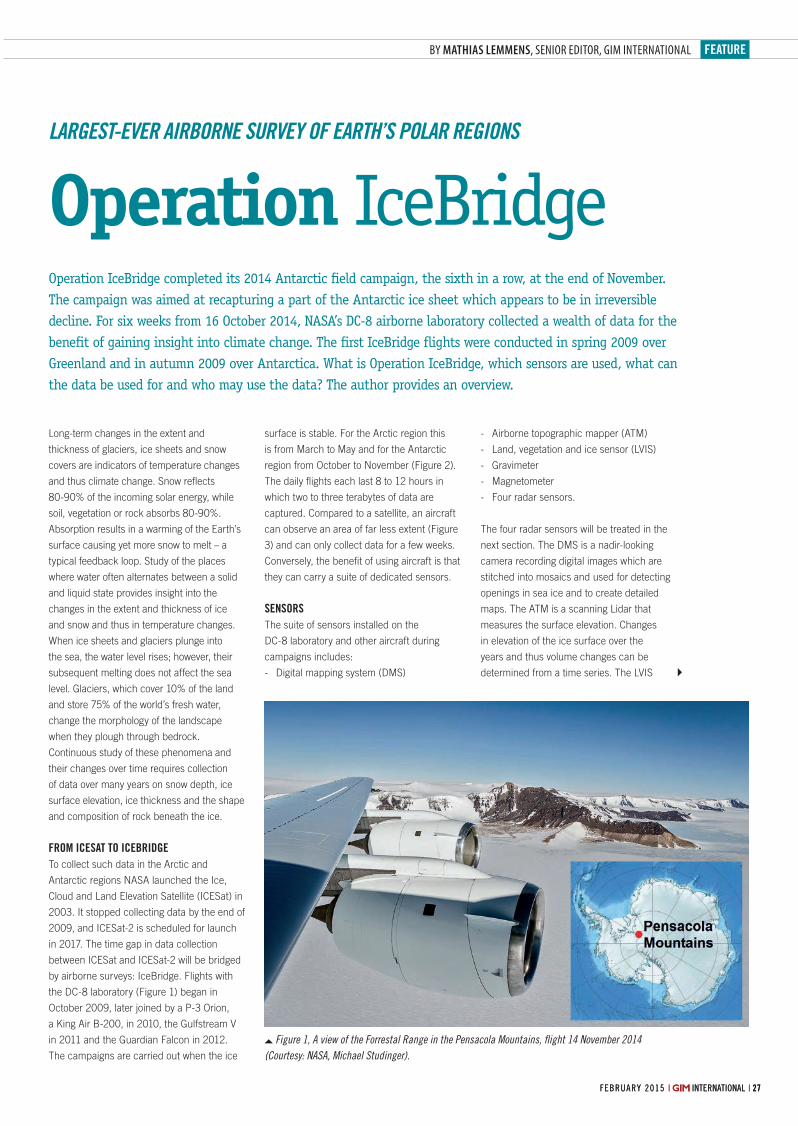
FEATURE
27FEBRUARY 2015 | INTERNATIONAL |FEBRUARY 2015 | INTERNATIONAL | 27
BY MATHIAS LEMMENS, SENIOR EDITOR, GIM INTERNATIONAL
Long-term changes in the extent and
thickness of glaciers, ice sheets and snow
covers are indicators of temperature changes
and thus climate change. Snow refl ects
80-90% of the incoming solar energy, while
soil, vegetation or rock absorbs 80-90%.
Absorption results in a warming of the Earth’s
surface causing yet more snow to melt – a
typical feedback loop. Study of the places
where water often alternates between a solid
and liquid state provides insight into the
changes in the extent and thickness of ice
and snow and thus in temperature changes.
When ice sheets and glaciers plunge into
the sea, the water level rises; however, their
subsequent melting does not affect the sea
level. Glaciers, which cover 10% of the land
and store 75% of the world’s fresh water,
change the morphology of the landscape
when they plough through bedrock.
Continuous study of these phenomena and
their changes over time requires collection
of data over many years on snow depth, ice
surface elevation, ice thickness and the shape
and composition of rock beneath the ice.
FROM ICESAT TO ICEBRIDGETo collect such data in the Arctic and
Antarctic regions NASA launched the Ice,
Cloud and Land Elevation Satellite (ICESat) in
2003. It stopped collecting data by the end of
2009, and ICESat-2 is scheduled for launch
in 2017. The time gap in data collection
between ICESat and ICESat-2 will be bridged
by airborne surveys: IceBridge. Flights with
the DC-8 laboratory (Figure 1) began in
October 2009, later joined by a P-3 Orion,
a King Air B-200, in 2010, the Gulfstream V
in 2011 and the Guardian Falcon in 2012.
The campaigns are carried out when the ice
Operation IceBridge completed its 2014 Antarctic fi eld campaign, the sixth in a row, at the end of November. The campaign was aimed at recapturing a part of the Antarctic ice sheet which appears to be in irreversible decline. For six weeks from 16 October 2014, NASA’s DC-8 airborne laboratory collected a wealth of data for the benefi t of gaining insight into climate change. The fi rst IceBridge fl ights were conducted in spring 2009 over Greenland and in autumn 2009 over Antarctica. What is Operation IceBridge, which sensors are used, what can the data be used for and who may use the data? The author provides an overview.
surface is stable. For the Arctic region this
is from March to May and for the Antarctic
region from October to November (Figure 2).
The daily fl ights each last 8 to 12 hours in
which two to three terabytes of data are
captured. Compared to a satellite, an aircraft
can observe an area of far less extent (Figure
3) and can only collect data for a few weeks.
Conversely, the benefi t of using aircraft is that
they can carry a suite of dedicated sensors.
SENSORSThe suite of sensors installed on the
DC-8 laboratory and other aircraft during
campaigns includes:
- Digital mapping system (DMS)
- Airborne topographic mapper (ATM)
- Land, vegetation and ice sensor (LVIS)
- Gravimeter
- Magnetometer
- Four radar sensors.
The four radar sensors will be treated in the
next section. The DMS is a nadir-looking
camera recording digital images which are
stitched into mosaics and used for detecting
openings in sea ice and to create detailed
maps. The ATM is a scanning Lidar that
measures the surface elevation. Changes
in elevation of the ice surface over the
years and thus volume changes can be
determined from a time series. The LVIS
Operation IceBridge LARGEST-EVER AIRBORNE SURVEY OF EARTH’S POLAR REGIONS
Figure 1, A view of the Forrestal Range in the Pensacola Mountains, fl ight 14 November 2014
(Courtesy: NASA, Michael Studinger).
GIM0215_Feature Lemmens 27 28-01-2015 13:52:32
No
2565
No
2714
GIM0215_Feature Lemmens 28 28-01-2015 13:52:32
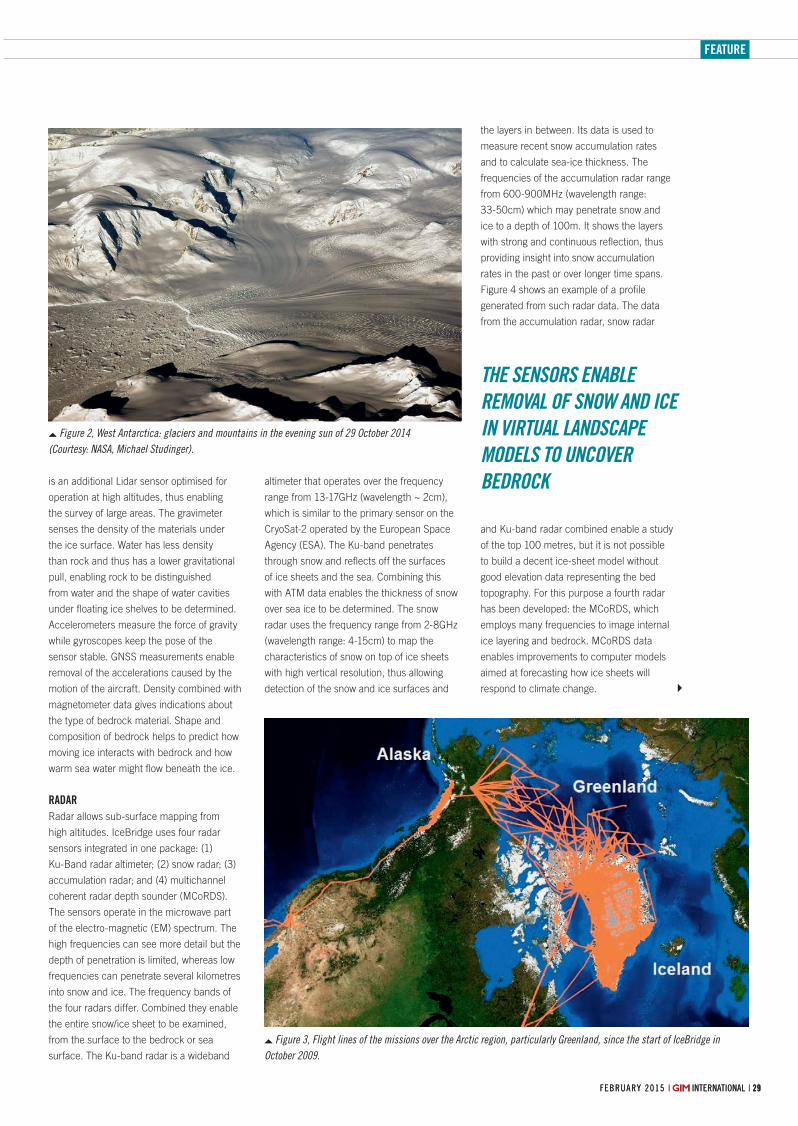
FEATURE
29FEBRUARY 2015 | INTERNATIONAL |FEBRUARY 2015 | INTERNATIONAL | 29
is an additional Lidar sensor optimised for
operation at high altitudes, thus enabling
the survey of large areas. The gravimeter
senses the density of the materials under
the ice surface. Water has less density
than rock and thus has a lower gravitational
pull, enabling rock to be distinguished
from water and the shape of water cavities
under fl oating ice shelves to be determined.
Accelerometers measure the force of gravity
while gyroscopes keep the pose of the
sensor stable. GNSS measurements enable
removal of the accelerations caused by the
motion of the aircraft. Density combined with
magnetometer data gives indications about
the type of bedrock material. Shape and
composition of bedrock helps to predict how
moving ice interacts with bedrock and how
warm sea water might fl ow beneath the ice.
RADARRadar allows sub-surface mapping from
high altitudes. IceBridge uses four radar
sensors integrated in one package: (1)
Ku-Band radar altimeter; (2) snow radar; (3)
accumulation radar; and (4) multichannel
coherent radar depth sounder (MCoRDS).
The sensors operate in the microwave part
of the electro-magnetic (EM) spectrum. The
high frequencies can see more detail but the
depth of penetration is limited, whereas low
frequencies can penetrate several kilometres
into snow and ice. The frequency bands of
the four radars differ. Combined they enable
the entire snow/ice sheet to be examined,
from the surface to the bedrock or sea
surface. The Ku-band radar is a wideband
altimeter that operates over the frequency
range from 13-17GHz (wavelength ~ 2cm),
which is similar to the primary sensor on the
CryoSat-2 operated by the European Space
Agency (ESA). The Ku-band penetrates
through snow and refl ects off the surfaces
of ice sheets and the sea. Combining this
with ATM data enables the thickness of snow
over sea ice to be determined. The snow
radar uses the frequency range from 2-8GHz
(wavelength range: 4-15cm) to map the
characteristics of snow on top of ice sheets
with high vertical resolution, thus allowing
detection of the snow and ice surfaces and
the layers in between. Its data is used to
measure recent snow accumulation rates
and to calculate sea-ice thickness. The
frequencies of the accumulation radar range
from 600-900MHz (wavelength range:
33-50cm) which may penetrate snow and
ice to a depth of 100m. It shows the layers
with strong and continuous refl ection, thus
providing insight into snow accumulation
rates in the past or over longer time spans.
Figure 4 shows an example of a profi le
generated from such radar data. The data
from the accumulation radar, snow radar
and Ku-band radar combined enable a study
of the top 100 metres, but it is not possible
to build a decent ice-sheet model without
good elevation data representing the bed
topography. For this purpose a fourth radar
has been developed: the MCoRDS, which
employs many frequencies to image internal
ice layering and bedrock. MCoRDS data
enables improvements to computer models
aimed at forecasting how ice sheets will
respond to climate change.
Figure 2, West Antarctica: glaciers and mountains in the evening sun of 29 October 2014
(Courtesy: NASA, Michael Studinger).
Figure 3, Flight lines of the missions over the Arctic region, particularly Greenland, since the start of IceBridge in
October 2009.
THE SENSORS ENABLE REMOVAL OF SNOW AND ICE IN VIRTUAL LANDSCAPE MODELS TO UNCOVER BEDROCK
GIM0215_Feature Lemmens 29 28-01-2015 13:52:34

RIEGL Laser Measurement Systems GmbH, Austria RIEGL USA Inc. RIEGL Japan Ltd. RIEGL China Ltd.
www.riegllidar.com
RIEGL
International User ConferenceTerrestrial Airborne Mobile Unmanned Industrial
LIDAR 2015
Join us for the third RIEGL International User Conference in May 2015!
The conference will cover terrestrial, airborne, mobile, unmanned and industrial laser scanningapplications. Choose to participate in Hong Kong (May 5 through 7), Guangzhou (May 7 and 8) or both locations!
One conference in two exciting locations!
CONFERENCE HIGHLIGHTS
Stay connected with RIEGL
» Experience the future of LiDAR technology
» See and hear about the latest RIEGL hard- and software products
» Attend captivating keynotes, presentations and workshops from industry experts
» Meet with members of the worldwide RIEGL community
Hong Kong | Guangzhou, China
May 5 - 8, 2015
Register now!www.riegllidar.com
No
2721
GIM0215_Feature Lemmens 30 28-01-2015 13:52:35

FEATURE
FEBRUARY 2015 | INTERNATIONAL | 3131FEBRUARY 2015 | INTERNATIONAL |
No
2721
MATHIAS LEMMENSMathias Lemmens gained a PhD degree from
Delft University of Technology, The Netherlands,
where he presently lectures on geodata
acquisition technologies and geodata quality. He was
editor-in-chief of GIM International for ten years and now
contributes as senior editor.
JACOBSHAVNThe sensors discussed above enable removal
of snow and ice in virtual landscape models
created by a computer, thus uncovering
bedrock. Removing ice and snow from the
land area of Greenland revealed a canyon,
the longest on Earth, under the ice sheet:
the Jacobshavn bed (Figure 5). Extending
over 750km and with a depth of 800m
and a width of 10km, the ravine matches
the Grand Canyon in scale. Its discovery in
August 2013 will bring better insight into how
water, snow and ice move over the island.
It may explain why Greenland is not fi lled
with buried lakes, which one would expect
given the bowl-shaped basin in the interior
caused by the weight of the ice sheet. Water
melting under the interior ice sheet seems
to drain into the sea through the northern
part of the canyon instead of pooling in the
middle. The distinctive V shape and the
fl at bottom suggests that the canyon was
carved by water, rather than ice, but that
still does not suffi ciently explain the absence
of buried lakes. Maybe other canyons, as
yet undiscovered, also contribute to water
draining into the sea.
OPEN DATAThe masses of data have to be processed
within six months to enable timely
publication on the NSIDC website. The
fi rst of the many processing steps is
archiving and quality control. Next, four
data categories are produced from raw
data for over 60 data products. These end
products result from processing data from
single sensors, combining data from several
sensors or from applying computer models.
The ATM data, for example, is available in a
raw format as distance between the aircraft
and the ice sheet. Such raw range data
enables users themselves to calculate ice
surface elevation, ice slope and roughness,
and elevation changes over time. The data
can be accessed at the NSIDC website
through an interactive map from which
individual fl ight lines and datasets can be
selected for downloading. The products
stick to the standards of NASA’s 2006 Earth
Science Reference Handbook, which eases
understanding and use. Its free availability
allows anyone to explore the data. Scientists
around the world are building maps of the
bedrocks of Greenland and Antarctica,
and improving seasonal forecasts of Arctic
sea-ice coverage and glacial melt rates.
CONCLUDING REMARKSUnmanned aerial systems (UASs) may enable
creation of even more detailed maps of the
bedrock. The fi ner the resolution, the better –
and since UASs enable dense fl ight lines
to be followed, they would be well-suited.
IceBridge’s upcoming Arctic campaign is
scheduled to begin in March 2015.
ACKNOWLEDGEMENTSThanks are due to George Hale, Science
Outreach Coordinator of Operation IceBridge,
NASA Goddard Space Flight Center, for
providing information and commenting on the
fi nal draft.
Figure 5, The Jacobshavn bed in Greenland is cloven by a colossal canyon.
Figure 4, An example of a profi le created from the data returned by the accumulation radar.
GIM0215_Feature Lemmens 31 28-01-2015 13:52:36
No
2713
GIM0215_Feature Lemmens 32 28-01-2015 13:52:36
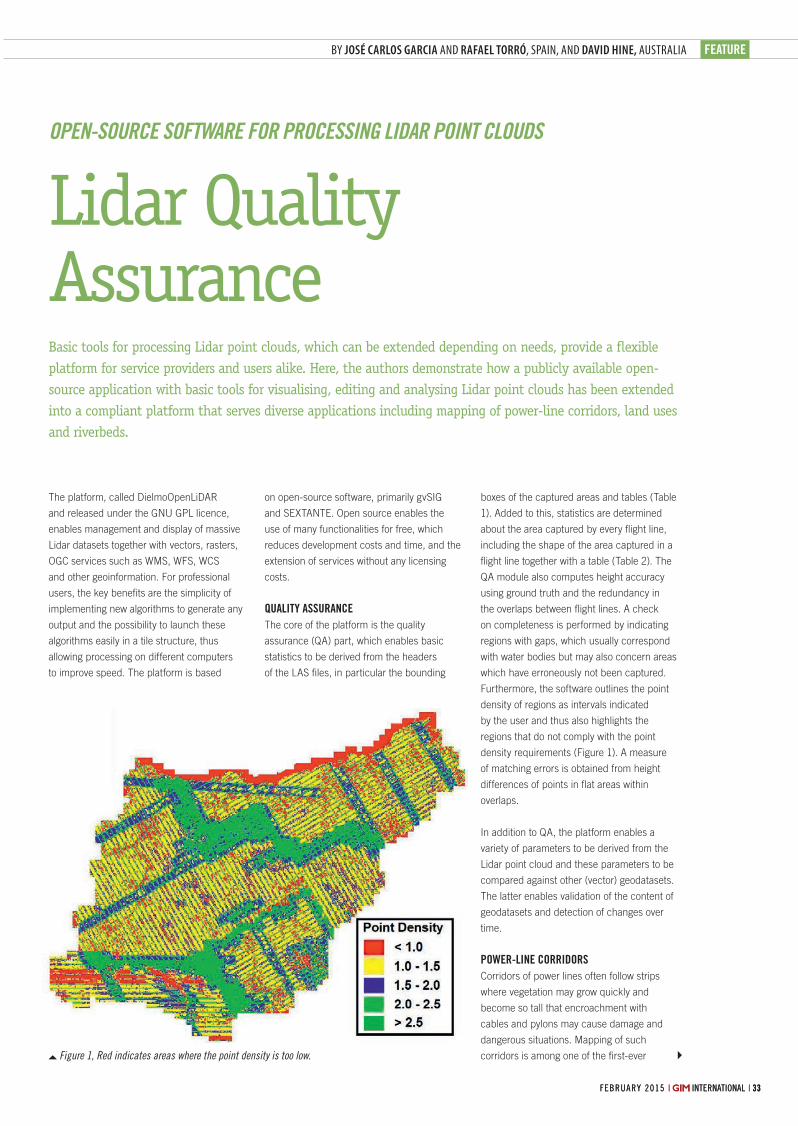
FEATURE
33FEBRUARY 2015 | INTERNATIONAL |FEBRUARY 2015 | INTERNATIONAL | 33
BY JOSÉ CARLOS GARCIA AND RAFAEL TORRÓ, SPAIN, AND DAVID HINE, AUSTRALIA
The platform, called DielmoOpenLiDAR
and released under the GNU GPL licence,
enables management and display of massive
Lidar datasets together with vectors, rasters,
OGC services such as WMS, WFS, WCS
and other geoinformation. For professional
users, the key benefi ts are the simplicity of
implementing new algorithms to generate any
output and the possibility to launch these
algorithms easily in a tile structure, thus
allowing processing on different computers
to improve speed. The platform is based
Basic tools for processing Lidar point clouds, which can be extended depending on needs, provide a fl exible platform for service providers and users alike. Here, the authors demonstrate how a publicly available open-source application with basic tools for visualising, editing and analysing Lidar point clouds has been extended into a compliant platform that serves diverse applications including mapping of power-line corridors, land uses and riverbeds.
on open-source software, primarily gvSIG
and SEXTANTE. Open source enables the
use of many functionalities for free, which
reduces development costs and time, and the
extension of services without any licensing
costs.
QUALITY ASSURANCEThe core of the platform is the quality
assurance (QA) part, which enables basic
statistics to be derived from the headers
of the LAS fi les, in particular the bounding
boxes of the captured areas and tables (Table
1). Added to this, statistics are determined
about the area captured by every fl ight line,
including the shape of the area captured in a
fl ight line together with a table (Table 2). The
QA module also computes height accuracy
using ground truth and the redundancy in
the overlaps between fl ight lines. A check
on completeness is performed by indicating
regions with gaps, which usually correspond
with water bodies but may also concern areas
which have erroneously not been captured.
Furthermore, the software outlines the point
density of regions as intervals indicated
by the user and thus also highlights the
regions that do not comply with the point
density requirements (Figure 1). A measure
of matching errors is obtained from height
differences of points in fl at areas within
overlaps.
In addition to QA, the platform enables a
variety of parameters to be derived from the
Lidar point cloud and these parameters to be
compared against other (vector) geodatasets.
The latter enables validation of the content of
geodatasets and detection of changes over
time.
POWER-LINE CORRIDORSCorridors of power lines often follow strips
where vegetation may grow quickly and
become so tall that encroachment with
cables and pylons may cause damage and
dangerous situations. Mapping of such
corridors is among one of the fi rst-ever
Lidar Quality Assurance
OPEN-SOURCE SOFTWARE FOR PROCESSING LIDAR POINT CLOUDS
Figure 1, Red indicates areas where the point density is too low.
GIM0215_Feature Garcia 33 28-01-2015 15:19:31
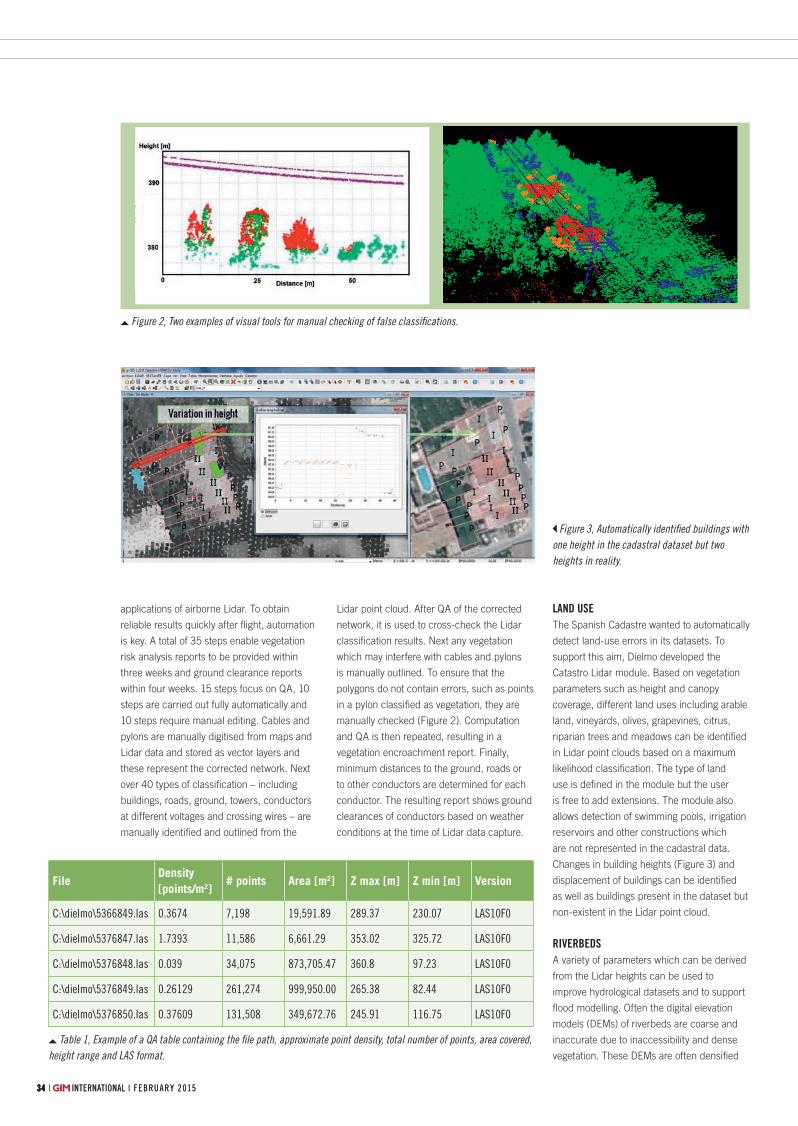
| INTERNATIONAL | F E B RU A RY 2 0153434 | INTERNATIONAL | F E B RU A RY 2 0153434
applications of airborne Lidar. To obtain
reliable results quickly after fl ight, automation
is key. A total of 35 steps enable vegetation
risk analysis reports to be provided within
three weeks and ground clearance reports
within four weeks. 15 steps focus on QA, 10
steps are carried out fully automatically and
10 steps require manual editing. Cables and
pylons are manually digitised from maps and
Lidar data and stored as vector layers and
these represent the corrected network. Next
over 40 types of classifi cation – including
buildings, roads, ground, towers, conductors
at different voltages and crossing wires – are
manually identifi ed and outlined from the
Lidar point cloud. After QA of the corrected
network, it is used to cross-check the Lidar
classifi cation results. Next any vegetation
which may interfere with cables and pylons
is manually outlined. To ensure that the
polygons do not contain errors, such as points
in a pylon classifi ed as vegetation, they are
manually checked (Figure 2). Computation
and QA is then repeated, resulting in a
vegetation encroachment report. Finally,
minimum distances to the ground, roads or
to other conductors are determined for each
conductor. The resulting report shows ground
clearances of conductors based on weather
conditions at the time of Lidar data capture.
LAND USEThe Spanish Cadastre wanted to automatically
detect land-use errors in its datasets. To
support this aim, Dielmo developed the
Catastro Lidar module. Based on vegetation
parameters such as height and canopy
coverage, different land uses including arable
land, vineyards, olives, grapevines, citrus,
riparian trees and meadows can be identifi ed
in Lidar point clouds based on a maximum
likelihood classifi cation. The type of land
use is defi ned in the module but the user
is free to add extensions. The module also
allows detection of swimming pools, irrigation
reservoirs and other constructions which
are not represented in the cadastral data.
Changes in building heights (Figure 3) and
displacement of buildings can be identifi ed
as well as buildings present in the dataset but
non-existent in the Lidar point cloud.
RIVERBEDSA variety of parameters which can be derived
from the Lidar heights can be used to
improve hydrological datasets and to support
fl ood modelling. Often the digital elevation
models (DEMs) of riverbeds are coarse and
inaccurate due to inaccessibility and dense
vegetation. These DEMs are often densifi ed
FileDensity[points/m2]
# points Area [m2] Z max [m] Z min [m] Version
C:\dielmo\5366849.las 0.3674 7,198 19,591.89 289.37 230.07 LAS10F0
C:\dielmo\5376847.las 1.7393 11,586 6,661.29 353.02 325.72 LAS10F0
C:\dielmo\5376848.las 0.039 34,075 873,705.47 360.8 97.23 LAS10F0
C:\dielmo\5376849.las 0.26129 261,274 999,950.00 265.38 82.44 LAS10F0
C:\dielmo\5376850.las 0.37609 131,508 349,672.76 245.91 116.75 LAS10F0
Figure 2, Two examples of visual tools for manual checking of false classifi cations.
Table 1, Example of a QA table containing the fi le path, approximate point density, total number of points, area covered,
height range and LAS format.
Figure 3, Automatically identifi ed buildings with
one height in the cadastral dataset but two
heights in reality.
GIM0215_Feature Garcia 34 28-01-2015 15:19:31
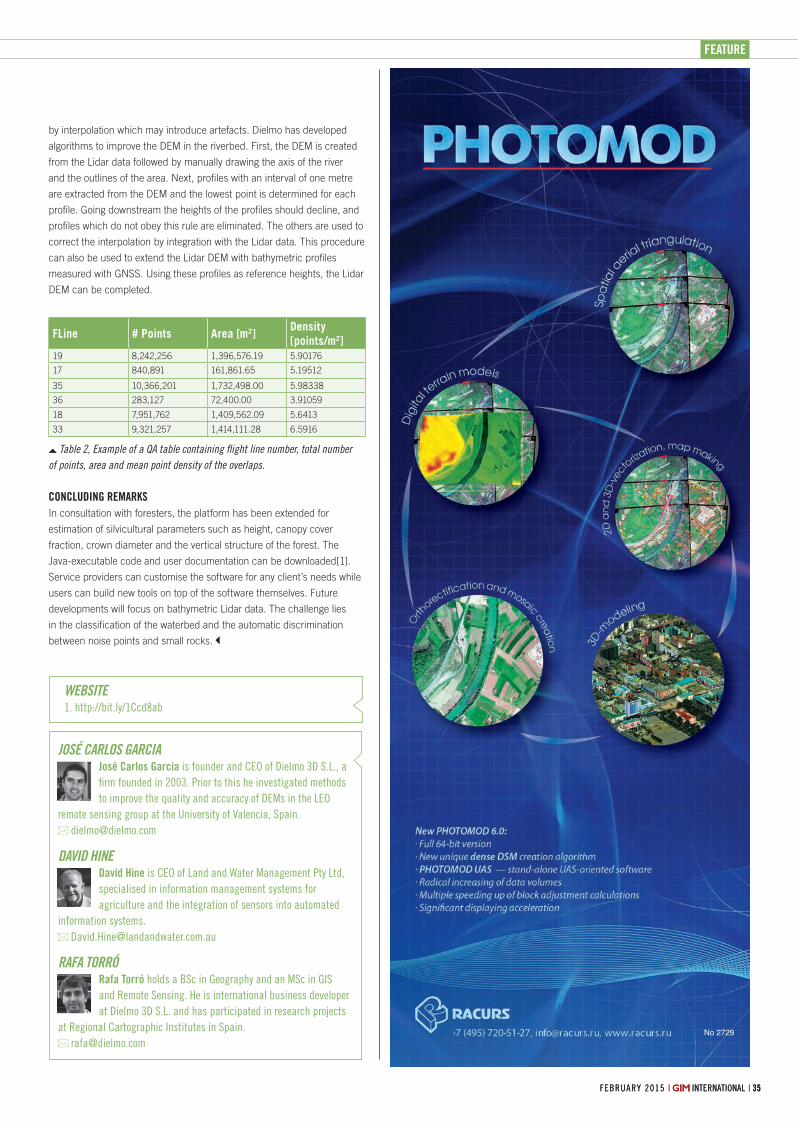
FEATURE
FEBRUARY 2015 | INTERNATIONAL | 3535FEBRUARY 2015 | INTERNATIONAL |
No 2729
JOSÉ CARLOS GARCIAJosé Carlos Garcia is founder and CEO of Dielmo 3D S.L., a
fi rm founded in 2003. Prior to this he investigated methods
to improve the quality and accuracy of DEMs in the LEO
remote sensing group at the University of Valencia, Spain.
DAVID HINEDavid Hine is CEO of Land and Water Management Pty Ltd,
specialised in information management systems for
agriculture and the integration of sensors into automated
information systems.
RAFA TORRÓRafa Torró holds a BSc in Geography and an MSc in GIS
and Remote Sensing. He is international business developer
at Dielmo 3D S.L. and has participated in research projects
at Regional Cartographic Institutes in Spain.
by interpolation which may introduce artefacts. Dielmo has developed
algorithms to improve the DEM in the riverbed. First, the DEM is created
from the Lidar data followed by manually drawing the axis of the river
and the outlines of the area. Next, profi les with an interval of one metre
are extracted from the DEM and the lowest point is determined for each
profi le. Going downstream the heights of the profi les should decline, and
profi les which do not obey this rule are eliminated. The others are used to
correct the interpolation by integration with the Lidar data. This procedure
can also be used to extend the Lidar DEM with bathymetric profi les
measured with GNSS. Using these profi les as reference heights, the Lidar
DEM can be completed.
CONCLUDING REMARKSIn consultation with foresters, the platform has been extended for
estimation of silvicultural parameters such as height, canopy cover
fraction, crown diameter and the vertical structure of the forest. The
Java-executable code and user documentation can be downloaded[1].
Service providers can customise the software for any client’s needs while
users can build new tools on top of the software themselves. Future
developments will focus on bathymetric Lidar data. The challenge lies
in the classifi cation of the waterbed and the automatic discrimination
between noise points and small rocks.
FLine # Points Area [m2]Density[points/m2]
19 8,242,256 1,396,576.19 5.90176
17 840,891 161,861.65 5.19512
35 10,366,201 1,732,498.00 5.98338
36 283,127 72,400.00 3.91059
18 7,951,762 1,409,562.09 5.6413
33 9,321,257 1,414,111.28 6.5916
Table 2, Example of a QA table containing fl ight line number, total number
of points, area and mean point density of the overlaps.
WEBSITE1. http://bit.ly/1Ccd8ab
GIM0215_Feature Garcia 35 28-01-2015 15:19:32
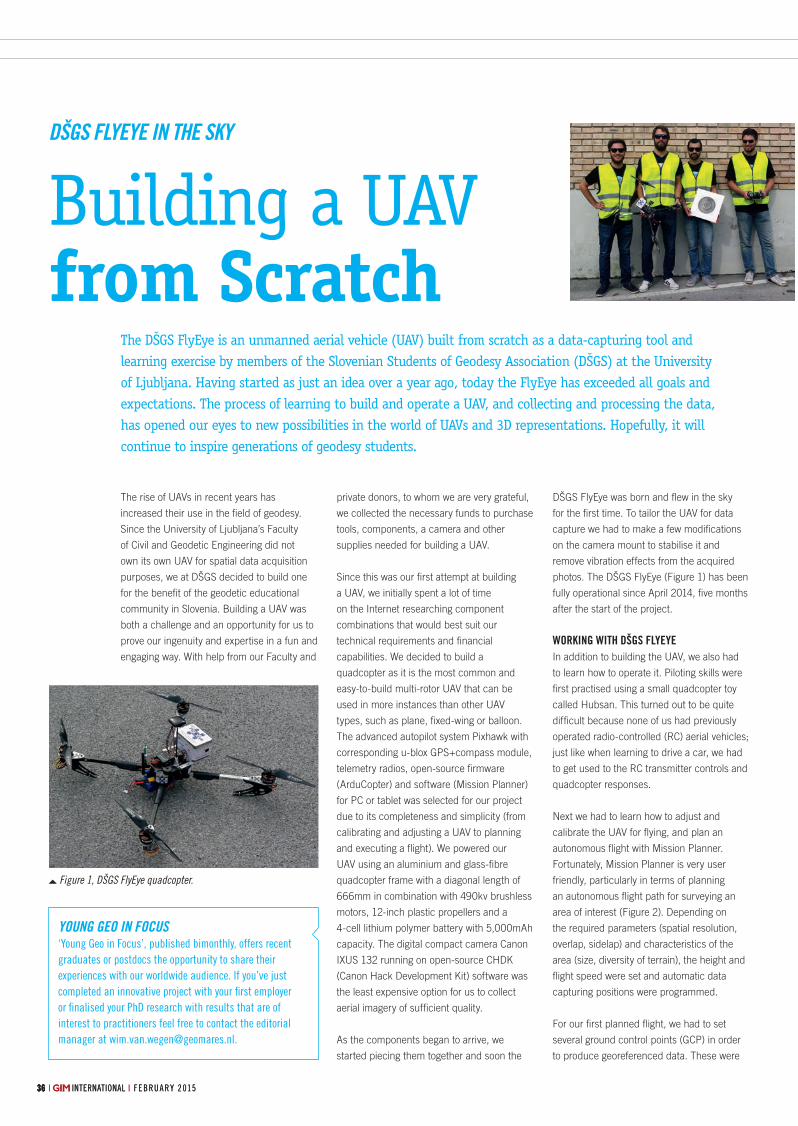
3636 | INTERNATIONAL | F E B RU A RY 2 015| INTERNATIONAL | F E B RU A RY 2 0153636
YOUNG GEO IN FOCUS‘Young Geo in Focus’, published bimonthly, offers recent
graduates or postdocs the opportunity to share their
experiences with our worldwide audience. If you’ve just
completed an innovative project with your fi rst employer
or fi nalised your PhD research with results that are of
interest to practitioners feel free to contact the editorial
manager at [email protected].
The rise of UAVs in recent years has
increased their use in the fi eld of geodesy.
Since the University of Ljubljana’s Faculty
of Civil and Geodetic Engineering did not
own its own UAV for spatial data acquisition
purposes, we at DŠGS decided to build one
for the benefi t of the geodetic educational
community in Slovenia. Building a UAV was
both a challenge and an opportunity for us to
prove our ingenuity and expertise in a fun and
engaging way. With help from our Faculty and
private donors, to whom we are very grateful,
we collected the necessary funds to purchase
tools, components, a camera and other
supplies needed for building a UAV.
Since this was our fi rst attempt at building
a UAV, we initially spent a lot of time
on the Internet researching component
combinations that would best suit our
technical requirements and fi nancial
capabilities. We decided to build a
quadcopter as it is the most common and
easy-to-build multi-rotor UAV that can be
used in more instances than other UAV
types, such as plane, fi xed-wing or balloon.
The advanced autopilot system Pixhawk with
corresponding u-blox GPS+compass module,
telemetry radios, open-source fi rmware
(ArduCopter) and software (Mission Planner)
for PC or tablet was selected for our project
due to its completeness and simplicity (from
calibrating and adjusting a UAV to planning
and executing a fl ight). We powered our
UAV using an aluminium and glass-fi bre
quadcopter frame with a diagonal length of
666mm in combination with 490kv brushless
motors, 12-inch plastic propellers and a
4-cell lithium polymer battery with 5,000mAh
capacity. The digital compact camera Canon
IXUS 132 running on open-source CHDK
(Canon Hack Development Kit) software was
the least expensive option for us to collect
aerial imagery of suffi cient quality.
As the components began to arrive, we
started piecing them together and soon the
DŠGS FlyEye was born and fl ew in the sky
for the fi rst time. To tailor the UAV for data
capture we had to make a few modifi cations
on the camera mount to stabilise it and
remove vibration effects from the acquired
photos. The DŠGS FlyEye (Figure 1) has been
fully operational since April 2014, fi ve months
after the start of the project.
WORKING WITH DŠGS FLYEYEIn addition to building the UAV, we also had
to learn how to operate it. Piloting skills were
fi rst practised using a small quadcopter toy
called Hubsan. This turned out to be quite
diffi cult because none of us had previously
operated radio-controlled (RC) aerial vehicles;
just like when learning to drive a car, we had
to get used to the RC transmitter controls and
quadcopter responses.
Next we had to learn how to adjust and
calibrate the UAV for fl ying, and plan an
autonomous fl ight with Mission Planner.
Fortunately, Mission Planner is very user
friendly, particularly in terms of planning
an autonomous fl ight path for surveying an
area of interest (Figure 2). Depending on
the required parameters (spatial resolution,
overlap, sidelap) and characteristics of the
area (size, diversity of terrain), the height and
fl ight speed were set and automatic data
capturing positions were programmed.
For our fi rst planned fl ight, we had to set
several ground control points (GCP) in order
to produce georeferenced data. These were
The DŠGS FlyEye is an unmanned aerial vehicle (UAV) built from scratch as a data-capturing tool and learning exercise by members of the Slovenian Students of Geodesy Association (DŠGS) at the University of Ljubljana. Having started as just an idea over a year ago, today the FlyEye has exceeded all goals and expectations. The process of learning to build and operate a UAV, and collecting and processing the data, has opened our eyes to new possibilities in the world of UAVs and 3D representations. Hopefully, it will continue to inspire generations of geodesy students.
Building a UAV from Scratch
DŠGS FLYEYE IN THE SKY
Figure 1, DŠGS FlyEye quadcopter.
GIM0215_Young GEO 36 28-01-2015 14:23:50
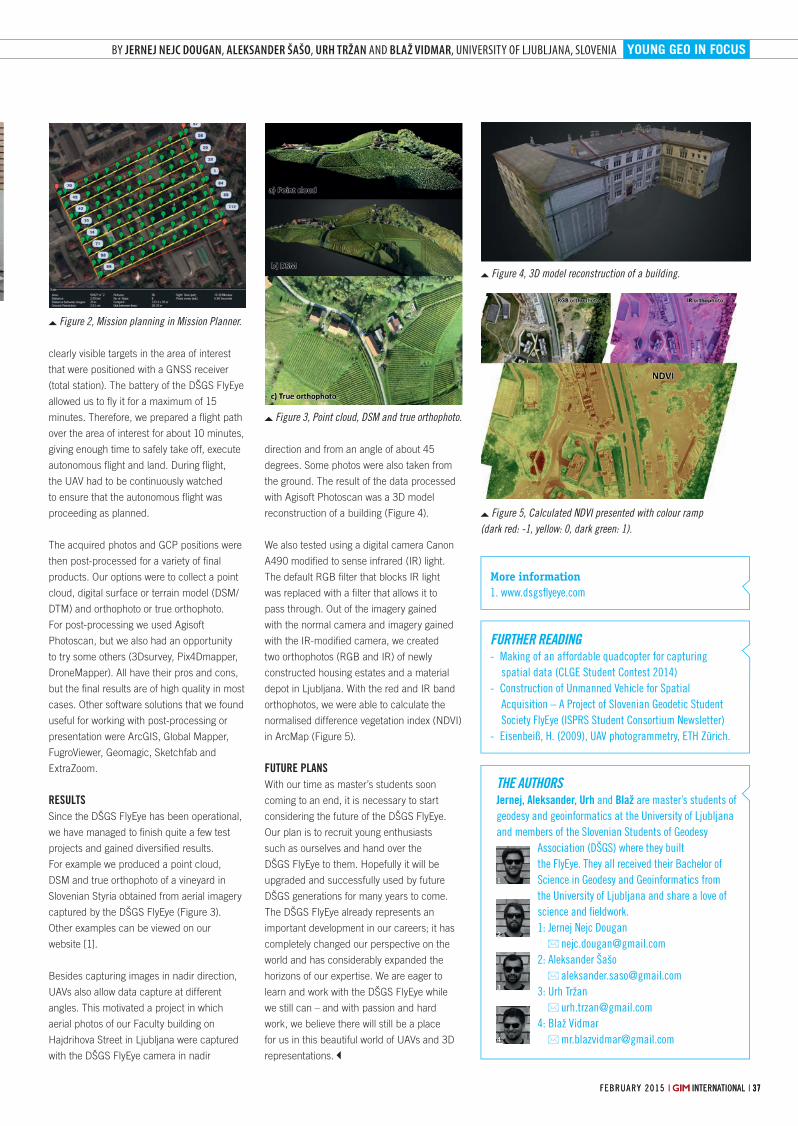
37FEBRUARY 2015 | INTERNATIONAL |FEBRUARY 2015 | INTERNATIONAL | 37
YOUNG GEO IN FOCUS
Figure 3, Point cloud, DSM and true orthophoto.
BY JERNEJ NEJC DOUGAN, ALEKSANDER ŠAŠO, URH TRŽAN AND BLAŽ VIDMAR, UNIVERSITY OF LJUBLJANA, SLOVENIA
direction and from an angle of about 45
degrees. Some photos were also taken from
the ground. The result of the data processed
with Agisoft Photoscan was a 3D model
reconstruction of a building (Figure 4).
We also tested using a digital camera Canon
A490 modifi ed to sense infrared (IR) light.
The default RGB fi lter that blocks IR light
was replaced with a fi lter that allows it to
pass through. Out of the imagery gained
with the normal camera and imagery gained
with the IR-modifi ed camera, we created
two orthophotos (RGB and IR) of newly
constructed housing estates and a material
depot in Ljubljana. With the red and IR band
orthophotos, we were able to calculate the
normalised difference vegetation index (NDVI)
in ArcMap (Figure 5).
FUTURE PLANSWith our time as master’s students soon
coming to an end, it is necessary to start
considering the future of the DŠGS FlyEye.
Our plan is to recruit young enthusiasts
such as ourselves and hand over the
DŠGS FlyEye to them. Hopefully it will be
upgraded and successfully used by future
DŠGS generations for many years to come.
The DŠGS FlyEye already represents an
important development in our careers; it has
completely changed our perspective on the
world and has considerably expanded the
horizons of our expertise. We are eager to
learn and work with the DŠGS FlyEye while
we still can – and with passion and hard
work, we believe there will still be a place
for us in this beautiful world of UAVs and 3D
representations.
clearly visible targets in the area of interest
that were positioned with a GNSS receiver
(total station). The battery of the DŠGS FlyEye
allowed us to fl y it for a maximum of 15
minutes. Therefore, we prepared a fl ight path
over the area of interest for about 10 minutes,
giving enough time to safely take off, execute
autonomous fl ight and land. During fl ight,
the UAV had to be continuously watched
to ensure that the autonomous fl ight was
proceeding as planned.
The acquired photos and GCP positions were
then post-processed for a variety of fi nal
products. Our options were to collect a point
cloud, digital surface or terrain model (DSM/
DTM) and orthophoto or true orthophoto.
For post-processing we used Agisoft
Photoscan, but we also had an opportunity
to try some others (3Dsurvey, Pix4Dmapper,
DroneMapper). All have their pros and cons,
but the fi nal results are of high quality in most
cases. Other software solutions that we found
useful for working with post-processing or
presentation were ArcGIS, Global Mapper,
FugroViewer, Geomagic, Sketchfab and
ExtraZoom.
RESULTSSince the DŠGS FlyEye has been operational,
we have managed to fi nish quite a few test
projects and gained diversifi ed results.
For example we produced a point cloud,
DSM and true orthophoto of a vineyard in
Slovenian Styria obtained from aerial imagery
captured by the DŠGS FlyEye (Figure 3).
Other examples can be viewed on our
website [1].
Besides capturing images in nadir direction,
UAVs also allow data capture at different
angles. This motivated a project in which
aerial photos of our Faculty building on
Hajdrihova Street in Ljubljana were captured
with the DŠGS FlyEye camera in nadir
THE AUTHORSJernej, Aleksander, Urh and Blaž are master’s students of
geodesy and geoinformatics at the University of Ljubljana
and members of the Slovenian Students of Geodesy
Association (DŠGS) where they built
the FlyEye. They all received their Bachelor of
Science in Geodesy and Geoinformatics from
the University of Ljubljana and share a love of
science and fi eldwork.
1: Jernej Nejc Dougan
2: Aleksander Šašo
3: Urh Tržan
4: Blaž Vidmar
Figure 2, Mission planning in Mission Planner.
FURTHER READING- Making of an affordable quadcopter for capturing
spatial data (CLGE Student Contest 2014)
- Construction of Unmanned Vehicle for Spatial
Acquisition – A Project of Slovenian Geodetic Student
Society FlyEye (ISPRS Student Consortium Newsletter)
- Eisenbeiß, H. (2009), UAV photogrammetry, ETH Zürich.
Figure 4, 3D model reconstruction of a building.
Figure 5, Calculated NDVI presented with colour ramp
(dark red: -1, yellow: 0, dark green: 1).
More information
1. www.dsgsfl yeye.com
1
2
3
4
GIM0215_Young GEO 37 28-01-2015 14:23:53
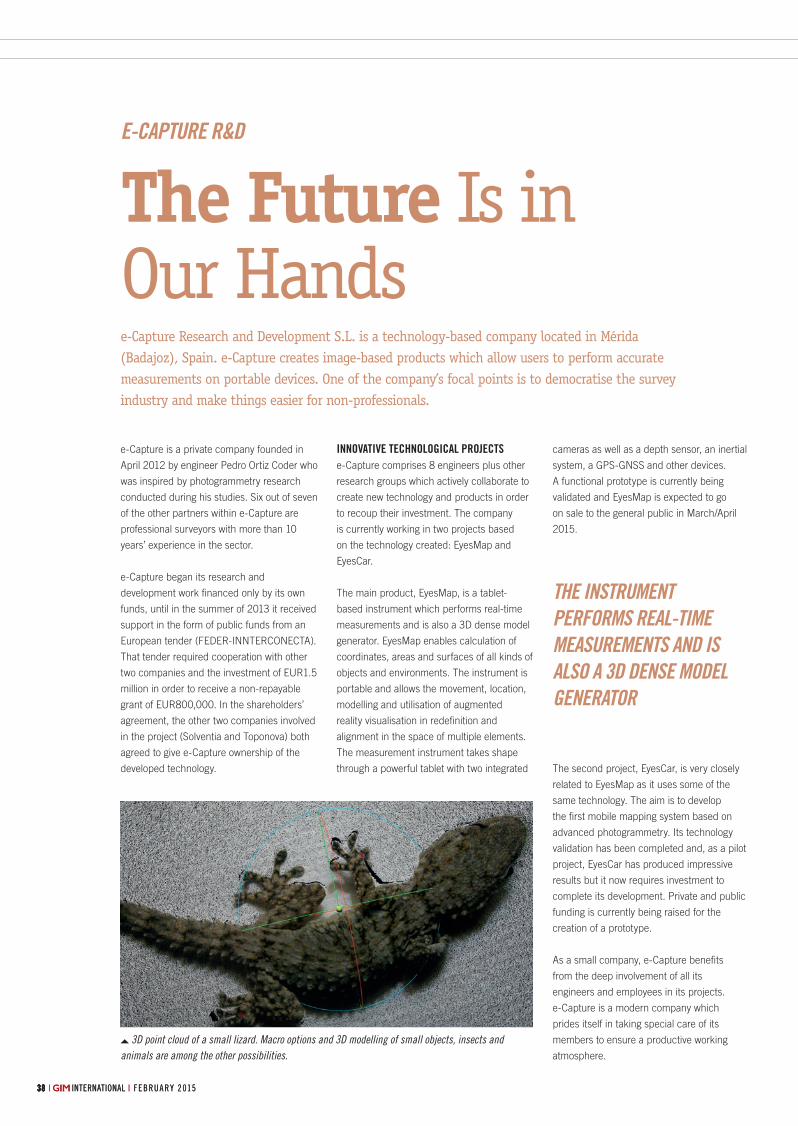
3838 | INTERNATIONAL | F E B RU A RY 2 015| INTERNATIONAL | F E B RU A RY 2 0153838
e-Capture is a private company founded in
April 2012 by engineer Pedro Ortiz Coder who
was inspired by photogrammetry research
conducted during his studies. Six out of seven
of the other partners within e-Capture are
professional surveyors with more than 10
years’ experience in the sector.
e-Capture began its research and
development work fi nanced only by its own
funds, until in the summer of 2013 it received
support in the form of public funds from an
European tender (FEDER-INNTERCONECTA).
That tender required cooperation with other
two companies and the investment of EUR1.5
million in order to receive a non-repayable
grant of EUR800,000. In the shareholders’
agreement, the other two companies involved
in the project (Solventia and Toponova) both
agreed to give e-Capture ownership of the
developed technology.
INNOVATIVE TECHNOLOGICAL PROJECTSe-Capture comprises 8 engineers plus other
research groups which actively collaborate to
create new technology and products in order
to recoup their investment. The company
is currently working in two projects based
on the technology created: EyesMap and
EyesCar.
The main product, EyesMap, is a tablet-
based instrument which performs real-time
measurements and is also a 3D dense model
generator. EyesMap enables calculation of
coordinates, areas and surfaces of all kinds of
objects and environments. The instrument is
portable and allows the movement, location,
modelling and utilisation of augmented
reality visualisation in redefi nition and
alignment in the space of multiple elements.
The measurement instrument takes shape
through a powerful tablet with two integrated
cameras as well as a depth sensor, an inertial
system, a GPS-GNSS and other devices.
A functional prototype is currently being
validated and EyesMap is expected to go
on sale to the general public in March/April
2015.
The second project, EyesCar, is very closely
related to EyesMap as it uses some of the
same technology. The aim is to develop
the fi rst mobile mapping system based on
advanced photogrammetry. Its technology
validation has been completed and, as a pilot
project, EyesCar has produced impressive
results but it now requires investment to
complete its development. Private and public
funding is currently being raised for the
creation of a prototype.
As a small company, e-Capture benefi ts
from the deep involvement of all its
engineers and employees in its projects.
e-Capture is a modern company which
prides itself in taking special care of its
members to ensure a productive working
atmosphere.
e-Capture Research and Development S.L. is a technology-based company located in Mérida (Badajoz), Spain. e-Capture creates image-based products which allow users to perform accurate measurements on portable devices. One of the company’s focal points is to democratise the survey industry and make things easier for non-professionals.
E-CAPTURE R&D
The Future Is in Our Hands
3D point cloud of a small lizard. Macro options and 3D modelling of small objects, insects and
animals are among the other possibilities.
THE INSTRUMENT PERFORMS REAL-TIME MEASUREMENTS AND IS ALSO A 3D DENSE MODEL GENERATOR
GIM0215_Company View 38 28-01-2015 13:22:27
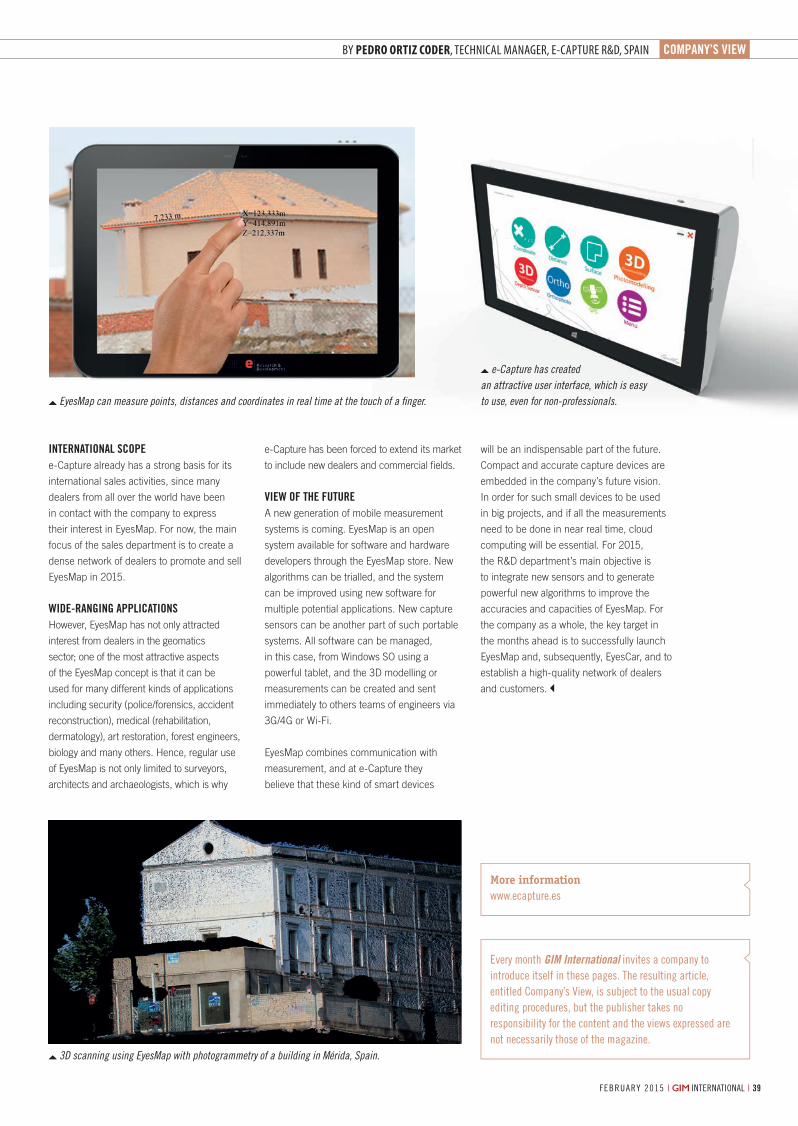
COMPANY’S VIEW
Every month GIM International invites a company to
introduce itself in these pages. The resulting article,
entitled Company’s View, is subject to the usual copy
editing procedures, but the publisher takes no
responsibility for the content and the views expressed are
not necessarily those of the magazine.
39FEBRUARY 2015 | INTERNATIONAL |
BY PEDRO ORTIZ CODER, TECHNICAL MANAGER, E-CAPTURE R&D, SPAIN
e-Capture has been forced to extend its market
to include new dealers and commercial fi elds.
VIEW OF THE FUTUREA new generation of mobile measurement
systems is coming. EyesMap is an open
system available for software and hardware
developers through the EyesMap store. New
algorithms can be trialled, and the system
can be improved using new software for
multiple potential applications. New capture
sensors can be another part of such portable
systems. All software can be managed,
in this case, from Windows SO using a
powerful tablet, and the 3D modelling or
measurements can be created and sent
immediately to others teams of engineers via
3G/4G or Wi-Fi.
EyesMap combines communication with
measurement, and at e-Capture they
believe that these kind of smart devices
will be an indispensable part of the future.
Compact and accurate capture devices are
embedded in the company’s future vision.
In order for such small devices to be used
in big projects, and if all the measurements
need to be done in near real time, cloud
computing will be essential. For 2015,
the R&D department’s main objective is
to integrate new sensors and to generate
powerful new algorithms to improve the
accuracies and capacities of EyesMap. For
the company as a whole, the key target in
the months ahead is to successfully launch
EyesMap and, subsequently, EyesCar, and to
establish a high-quality network of dealers
and customers.
INTERNATIONAL SCOPEe-Capture already has a strong basis for its
international sales activities, since many
dealers from all over the world have been
in contact with the company to express
their interest in EyesMap. For now, the main
focus of the sales department is to create a
dense network of dealers to promote and sell
EyesMap in 2015.
WIDE-RANGING APPLICATIONSHowever, EyesMap has not only attracted
interest from dealers in the geomatics
sector; one of the most attractive aspects
of the EyesMap concept is that it can be
used for many different kinds of applications
including security (police/forensics, accident
reconstruction), medical (rehabilitation,
dermatology), art restoration, forest engineers,
biology and many others. Hence, regular use
of EyesMap is not only limited to surveyors,
architects and archaeologists, which is why
More information
www.ecapture.es
EyesMap can measure points, distances and coordinates in real time at the touch of a fi nger.
e-Capture has created
an attractive user interface, which is easy
to use, even for non-professionals.
3D scanning using EyesMap with photogrammetry of a building in Mérida, Spain.
GIM0215_Company View 39 28-01-2015 13:22:27

No
2716
GIM0215_Company View 40 28-01-2015 13:22:28
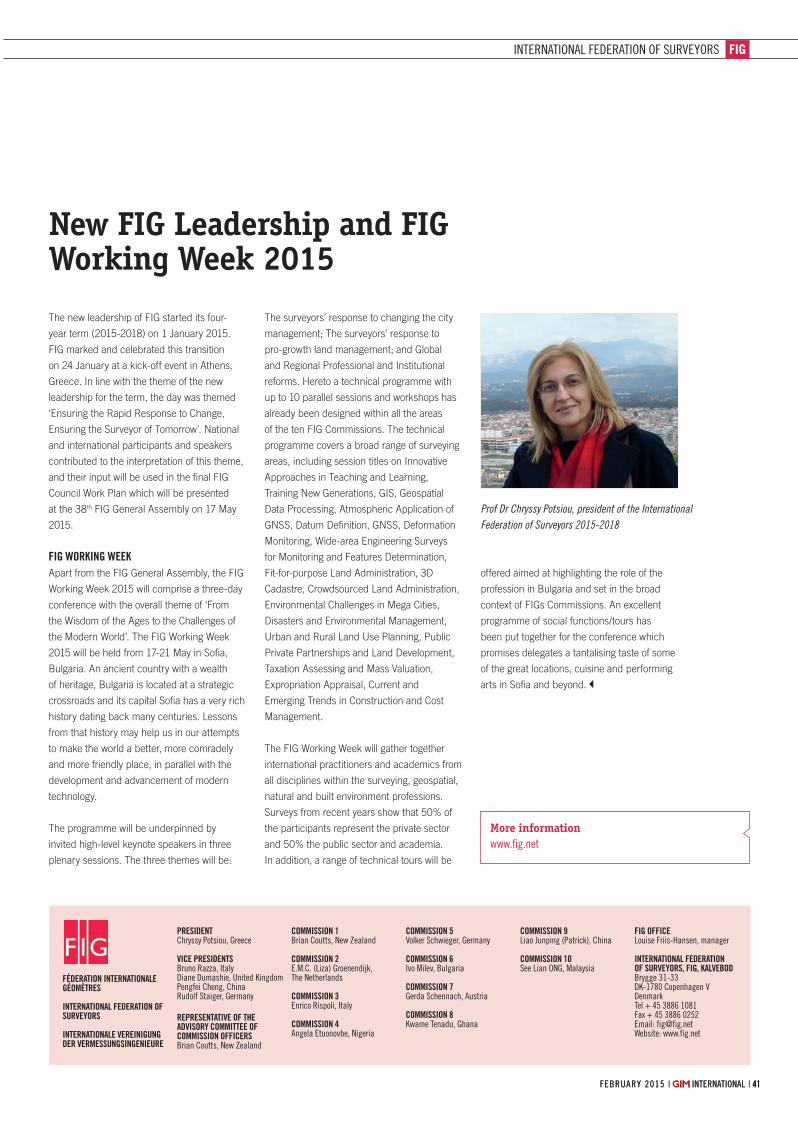
FIG
41FEBRUARY 2015 | INTERNATIONAL |FEBRUARY 2015 | INTERNATIONAL | 41
FÉDERATION INTERNATIONALE GÉOMÈTRES
INTERNATIONAL FEDERATION OF SURVEYORS
INTERNATIONALE VEREINIGUNG DER VERMESSUNGSINGENIEURE
PRESIDENTChryssy Potsiou, Greece
VICE PRESIDENTSBruno Razza, ItalyDiane Dumashie, United KingdomPengfei Cheng, China Rudolf Staiger, Germany
REPRESENTATIVE OF THE ADVISORY COMMITTEE OF COMMISSION OFFICERSBrian Coutts, New Zealand
COMMISSION 1Brian Coutts, New Zealand
COMMISSION 2E.M.C. (Liza) Groenendijk, The Netherlands
COMMISSION 3Enrico Rispoli, Italy
COMMISSION 4Angela Etuonovbe, Nigeria
COMMISSION 5Volker Schwieger, Germany
COMMISSION 6Ivo Milev, Bulgaria
COMMISSION 7Gerda Schennach, Austria
COMMISSION 8Kwame Tenadu, Ghana
COMMISSION 9Liao Junping (Patrick), China
COMMISSION 10See Lian ONG, Malaysia
FIG OFFICELouise Friis-Hansen, manager
INTERNATIONAL FEDERATION OF SURVEYORS, FIG, KALVEBOD Brygge 31-33DK-1780 Copenhagen V DenmarkTel + 45 3886 1081 Fax + 45 3886 0252Email: [email protected] Website: www.fig.net
INTERNATIONAL FEDERATION OF SURVEYORS
Prof Dr Chryssy Potsiou, president of the International
Federation of Surveyors 2015-2018
More information
www.fi g.net
The new leadership of FIG started its four-
year term (2015-2018) on 1 January 2015.
FIG marked and celebrated this transition
on 24 January at a kick-off event in Athens,
Greece. In line with the theme of the new
leadership for the term, the day was themed
‘Ensuring the Rapid Response to Change,
Ensuring the Surveyor of Tomorrow’. National
and international participants and speakers
contributed to the interpretation of this theme,
and their input will be used in the fi nal FIG
Council Work Plan which will be presented
at the 38th FIG General Assembly on 17 May
2015.
FIG WORKING WEEKApart from the FIG General Assembly, the FIG
Working Week 2015 will comprise a three-day
conference with the overall theme of ‘From
the Wisdom of the Ages to the Challenges of
the Modern World’. The FIG Working Week
2015 will be held from 17-21 May in Sofi a,
Bulgaria. An ancient country with a wealth
of heritage, Bulgaria is located at a strategic
crossroads and its capital Sofi a has a very rich
history dating back many centuries. Lessons
from that history may help us in our attempts
to make the world a better, more comradely
and more friendly place, in parallel with the
development and advancement of modern
technology.
The programme will be underpinned by
invited high-level keynote speakers in three
plenary sessions. The three themes will be:
The surveyors’ response to changing the city
management; The surveyors’ response to
pro-growth land management; and Global
and Regional Professional and Institutional
reforms. Hereto a technical programme with
up to 10 parallel sessions and workshops has
already been designed within all the areas
of the ten FIG Commissions. The technical
programme covers a broad range of surveying
areas, including session titles on Innovative
Approaches in Teaching and Learning,
Training New Generations, GIS, Geospatial
Data Processing, Atmospheric Application of
GNSS, Datum Defi nition, GNSS, Deformation
Monitoring, Wide-area Engineering Surveys
for Monitoring and Features Determination,
Fit-for-purpose Land Administration, 3D
Cadastre, Crowdsourced Land Administration,
Environmental Challenges in Mega Cities,
Disasters and Environmental Management,
Urban and Rural Land Use Planning, Public
Private Partnerships and Land Development,
Taxation Assessing and Mass Valuation,
Expropriation Appraisal, Current and
Emerging Trends in Construction and Cost
Management.
The FIG Working Week will gather together
international practitioners and academics from
all disciplines within the surveying, geospatial,
natural and built environment professions.
Surveys from recent years show that 50% of
the participants represent the private sector
and 50% the public sector and academia.
In addition, a range of technical tours will be
offered aimed at highlighting the role of the
profession in Bulgaria and set in the broad
context of FIGs Commissions. An excellent
programme of social functions/tours has
been put together for the conference which
promises delegates a tantalising taste of some
of the great locations, cuisine and performing
arts in Sofi a and beyond.
New FIG Leadership and FIG Working Week 2015
GIM0215_FIG 41 28-01-2015 13:45:14

effi gis.com/ezsurvCompatible with
POWER AND PRECISIONAT YOUR FINGERTIPS
EZSURV ® POST-PROCESSING SOFTWAREPROVIDES YOU WITH:
Access to more than 8,000 CORS stations data all around the world
Support multiple receiver native data format
State-of-the-art processing engine
Easy-to-use application
Flexible licensing mechanism
White Label version available for manufacturers
No
2626
kubit
Trimble
SPAR Internationalis a conference & exhibition focused on end-to-end business and technology considerations for 3D measurement and imaging for architecture, engi-neering and construction; industrial facilities; and civil infrastructure.
New Learning Levels for 2015! TECHNICAL – Advanced topics for the experienced 3D professional.
BUSINESS – Content focuses on building the case for using 3D technologies.
INTRODUCTION TO 3D TOOLS – Sessions for surveyors interested in exploring 3D tools.
www.SPARPointGroup.com/international
MARCH 30 APRIL 2, 2015 HOUSTON, TEXASRegister for a full conference passport by February 28 for discounted rates!
Exhibit-only passes are just $50!*
*Qualified buyers only.
Produced by Diversified Communications.Maser Consulting
No
2718
GIM0215_FIG 42 28-01-2015 13:45:15
GSDIGLOBAL SPATIAL DATA INFRASTRUCTURE ASSOCIATION
PRESIDENT & EXECUTIVE DIRECTORDavid Coleman, Canada
PAST PRESIDENTAbbas Rajabifard, Australia
PRESIDENT ELECTDavid Lovell, Belgium & UK
SECRETARY GENERALHarlan Onsrud, USA
SECRETARYAlan Stevens, USA
TREASUREREddie Pickle, USA
BUSINESS MANAGERMarilyn Gallant, USA
OPERATIONS & COMMUNICATIONSRoger Longhorn, Belgium & UK
RECRUITMENT MANAGERBruce Westcott, USA
NEWS EDITORKate Lance, USA
GSDI STANDING COMMITTEES
1) LEGAL AND SOCIOECONOMICChair: Dr ir Bastiaan van Loenen, Delft University of Technology, The NetherlandsChair: Dr ir Joep Crompvoets, KU Leuven Public Governance Institute, Belgium
2) TECHNICALChair: Eric van Praag, Venezuela
3) OUTREACH AND MEMBERSHIPChair: Denise McKenzie, UK4) SOCIETAL IMPACTSChair: Carmelle Terborgh, USA
International Geospatial Society
President: Sives Govender, South AfricaPresident-elect: Dav Raj Paudyal, Australia
GSDI OFFICEGSDI Association
Attention: Marilyn Gallant, Business Manager
946 Great Plain Avenue, PMB-194 Needham, MA 02492-3030, USA
www.gsdi.org
GSDIGlobal Spatial Data
Infrastructure Association
43FEBRUARY 2015 | INTERNATIONAL |
More information
1. www.abdatapartnerships.ca
www.gsdi.org
Alberta Data Partnerships: A Public-Private Partnership Approach to SDI
A new brand and long-term agreement with
the Provincial Government of Alberta, Canada,
will provide more opportunities for Spatial
Data Warehouse Ltd. (SDW), AltaLIS, Alberta’s
geospatial community and all Albertans.
SDW was created in 1996 as a not-for-
profi t company to take over digital mapping
activities – at that time primarily cadastral
mapping – that were previously handled by
the Government of Alberta. The original board
members were the provincial utility companies
and the Alberta government. In 1999, a joint
venture agreement was signed with AltaLIS,
a for-profi t private corporation, to provide the
day-to-day updating, licensing, sales and
distribution of cadastral mapping data, while
SDW remained a virtual company focused on
governance and strategy.
Today, SDW board membership has
broadened its depth to also include
organisations that represent the energy
and forestry sectors, urban and rural
municipalities, and the Alberta Energy
Regulator. This board structure has
strengthened SDW’s governance and strategic
vision, as well as the ability to leverage this
group of land users to explore unique mapping
business opportunities. The products offered
by the joint venture have continued to expand
as SDW and AltaLIS have worked together
to provide title and public lands disposition
mapping, as well as to become as a distributor
for imagery, Lidar and utility data.
This business model is extremely successful
in delivering important mapping products
at low costs to users and signifi cant savings
to provincial taxpayers. The introduction of
the cadastral mapping product eliminated
operational data maintenance and
management costs (CAD2.5 million to 3
million annually in 1996) to the Government
of Alberta. The fi ling fee charged to those who
submit plans to be integrated into the fabric
has not changed during that time, and the
licence fee to customers who access the fi nal
product has been cut in half.
Economic, regulatory, legislative and
technological changes have presented SDW
with new opportunities, and the organisation
has recently rebranded itself as ‘Alberta
Data Partnerships’ (ADP)[1]. ADP’s tagline
is ‘Sustainable Spatial Data for Responsible
Development’ and a big part of that is
its commitment to open data, exploring
new business models and stakeholder
engagement. ‘Responsible development’
means regulating, building and operating in
Alberta as transparently and effi ciently as
possible to meet the needs of all stakeholders.
Having accurate, affordable and accessible
data to support Alberta’s industry, government
and the public is important to ensure
that Albertans achieve the best possible
outcomes from the development of the
land base.
On 1 November 2014, ADP signed a new
long-term mapping data agreement with
the Government of Alberta allowing ADP to
undertake greater investment in technology
with AltaLIS as part of the joint venture. It will
also enable ADP to more fully explore other
business opportunities with government and
private industry.
A key deliverable of the agreement was to
begin distribution of selected data products
at no-cost through AltaLIS – data that will
be subject to the Alberta Open Government
Licence. This is the fi rst public-private
partnership that the Government of Alberta
has entered into to distribute open data and is
a result of ADP’s ongoing efforts to offer more
no-cost data to its stakeholders.
Initial feedback on the new brand,
‘Agreement’, and particularly the availability
of open data products has been very positive.
Information sessions held in November
2014 in Edmonton and Calgary have given
stakeholders the chance to share their
ideas and opportunities as ADP undertakes
strategic renewal.
Erik Holmlund, MEng, is executive director of Alberta
Data Partnerships.
Alberta Data Partnerships.
GIM0215_GSDI 43 28-01-2015 14:08:30
No
2712
GIM0215_GSDI 44 28-01-2015 14:08:31
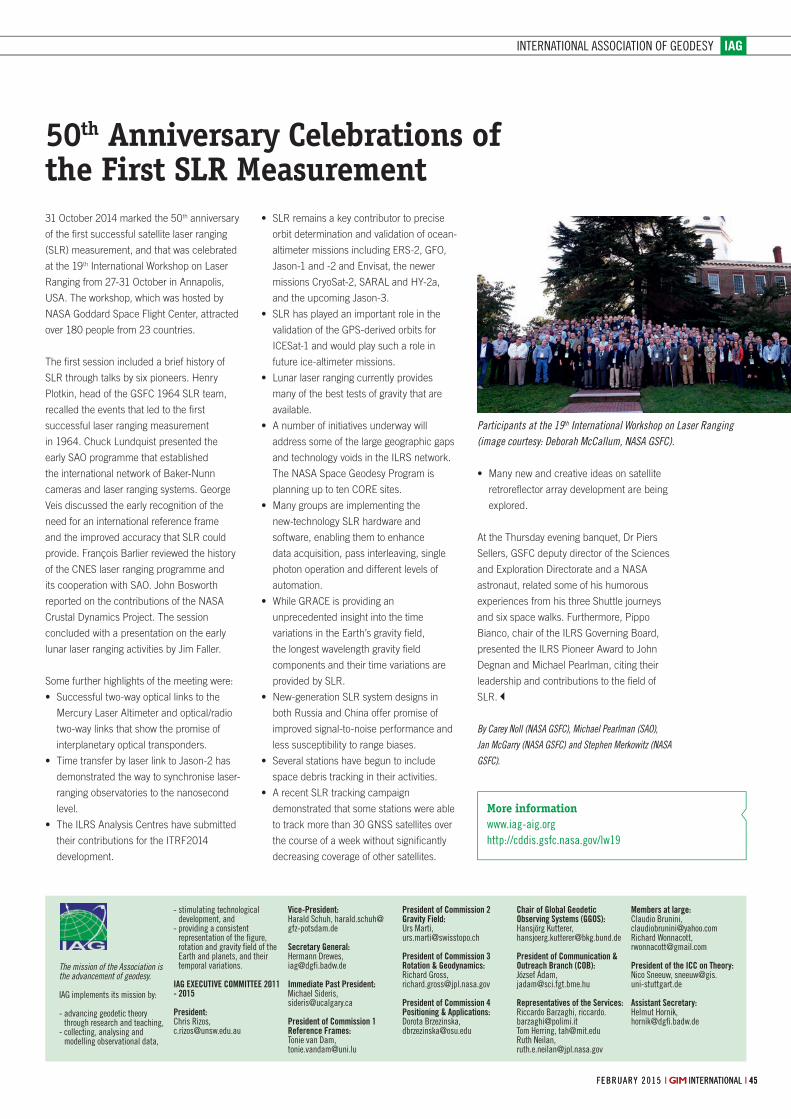
IAG
The mission of the Association is the advancement of geodesy.
IAG implements its mission by:
- advancing geodetic theory through research and teaching,
- collecting, analysing and modelling observational data,
- stimulating technological development, and
- providing a consistent representation of the figure, rotation and gravity field of the Earth and planets, and their temporal variations.
IAG EXECUTIVE COMMITTEE 2011 - 2015
President: Chris Rizos, [email protected]
Vice-President: Harald Schuh, [email protected]
Secretary General: Hermann Drewes, [email protected]
Immediate Past President: Michael Sideris, [email protected]
President of Commission 1 Reference Frames: Tonie van Dam, [email protected]
President of Commission 2 Gravity Field: Urs Marti, [email protected]
President of Commission 3 Rotation & Geodynamics: Richard Gross, [email protected]
President of Commission 4 Positioning & Applications:Dorota Brzezinska, [email protected]
Chair of Global Geodetic Observing Systems (GGOS): Hansjörg Kutterer, [email protected]
President of Communication & Outreach Branch (COB): József Ádam, [email protected]
Representatives of the Services: Riccardo Barzaghi, [email protected] Tom Herring, [email protected] Ruth Neilan, [email protected]
Members at large: Claudio Brunini, [email protected] Richard Wonnacott, [email protected]
President of the ICC on Theory: Nico Sneeuw, [email protected] Assistant Secretary: Helmut Hornik, [email protected]
INTERNATIONAL ASSOCIATION OF GEODESY
45FEBRUARY 2015 | INTERNATIONAL |FEBRUARY 2015 | INTERNATIONAL | 45
More information
www.iag-aig.org
http://cddis.gsfc.nasa.gov/lw19
Participants at the 19th International Workshop on Laser Ranging
(image courtesy: Deborah McCallum, NASA GSFC).
31 October 2014 marked the 50th anniversary
of the fi rst successful satellite laser ranging
(SLR) measurement, and that was celebrated
at the 19th International Workshop on Laser
Ranging from 27-31 October in Annapolis,
USA. The workshop, which was hosted by
NASA Goddard Space Flight Center, attracted
over 180 people from 23 countries.
The fi rst session included a brief history of
SLR through talks by six pioneers. Henry
Plotkin, head of the GSFC 1964 SLR team,
recalled the events that led to the fi rst
successful laser ranging measurement
in 1964. Chuck Lundquist presented the
early SAO programme that established
the international network of Baker-Nunn
cameras and laser ranging systems. George
Veis discussed the early recognition of the
need for an international reference frame
and the improved accuracy that SLR could
provide. François Barlier reviewed the history
of the CNES laser ranging programme and
its cooperation with SAO. John Bosworth
reported on the contributions of the NASA
Crustal Dynamics Project. The session
concluded with a presentation on the early
lunar laser ranging activities by Jim Faller.
Some further highlights of the meeting were:
• Successful two-way optical links to the
Mercury Laser Altimeter and optical/radio
two-way links that show the promise of
interplanetary optical transponders.
• Time transfer by laser link to Jason-2 has
demonstrated the way to synchronise laser-
ranging observatories to the nanosecond
level.
• The ILRS Analysis Centres have submitted
their contributions for the ITRF2014
development.
• SLR remains a key contributor to precise
orbit determination and validation of ocean-
altimeter missions including ERS-2, GFO,
Jason-1 and -2 and Envisat, the newer
missions CryoSat-2, SARAL and HY-2a,
and the upcoming Jason-3.
• SLR has played an important role in the
validation of the GPS-derived orbits for
ICESat-1 and would play such a role in
future ice-altimeter missions.
• Lunar laser ranging currently provides
many of the best tests of gravity that are
available.
• A number of initiatives underway will
address some of the large geographic gaps
and technology voids in the ILRS network.
The NASA Space Geodesy Program is
planning up to ten CORE sites.
• Many groups are implementing the
new-technology SLR hardware and
software, enabling them to enhance
data acquisition, pass interleaving, single
photon operation and different levels of
automation.
• While GRACE is providing an
unprecedented insight into the time
variations in the Earth’s gravity fi eld,
the longest wavelength gravity fi eld
components and their time variations are
provided by SLR.
• New-generation SLR system designs in
both Russia and China offer promise of
improved signal-to-noise performance and
less susceptibility to range biases.
• Several stations have begun to include
space debris tracking in their activities.
• A recent SLR tracking campaign
demonstrated that some stations were able
to track more than 30 GNSS satellites over
the course of a week without signifi cantly
decreasing coverage of other satellites.
• Many new and creative ideas on satellite
retrorefl ector array development are being
explored.
At the Thursday evening banquet, Dr Piers
Sellers, GSFC deputy director of the Sciences
and Exploration Directorate and a NASA
astronaut, related some of his humorous
experiences from his three Shuttle journeys
and six space walks. Furthermore, Pippo
Bianco, chair of the ILRS Governing Board,
presented the ILRS Pioneer Award to John
Degnan and Michael Pearlman, citing their
leadership and contributions to the fi eld of
SLR.
By Carey Noll (NASA GSFC), Michael Pearlman (SAO),
Jan McGarry (NASA GSFC) and Stephen Merkowitz (NASA
GSFC).
50th Anniversary Celebrations of the First SLR Measurement
GIM0215_IAG 45 28-01-2015 14:24:29

No
2711
GIM0215_IAG 46 28-01-2015 14:24:30
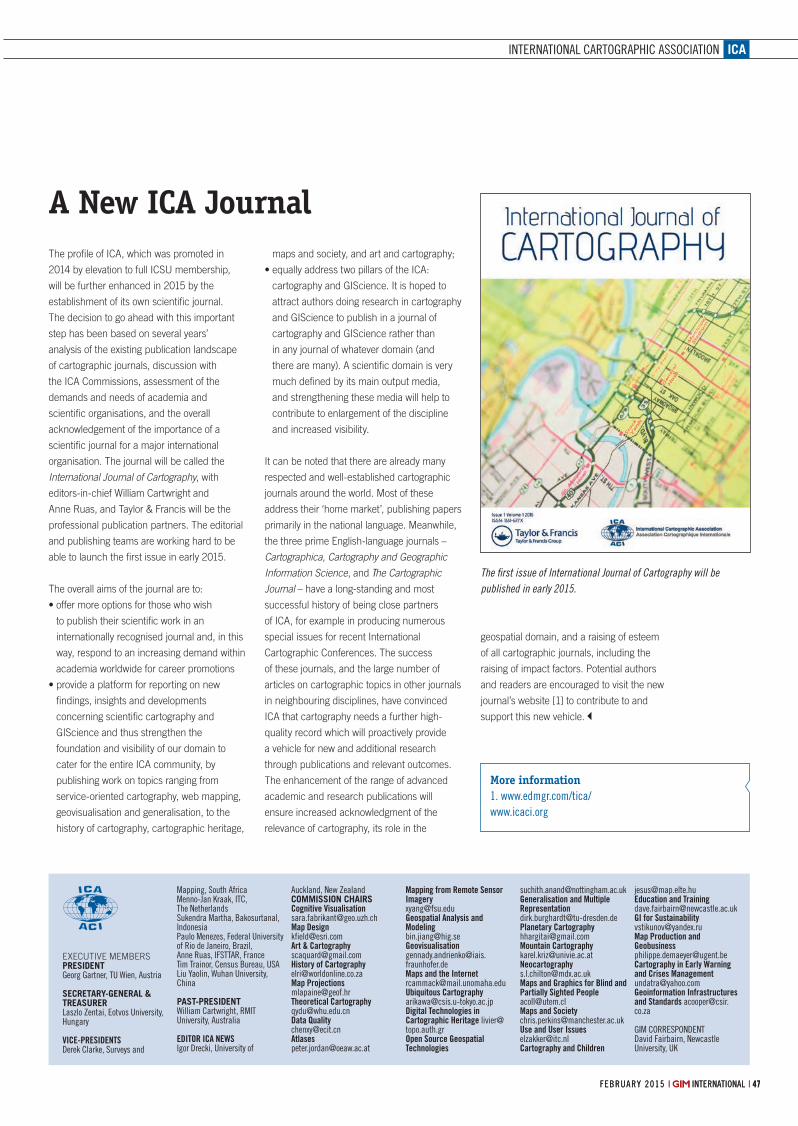
ICA
47FEBRUARY 2015 | INTERNATIONAL |FEBRUARY 2015 | INTERNATIONAL | 47
EXECUTIVE MEMBERSPRESIDENTGeorg Gartner, TU Wien, Austria
SECRETARY-GENERAL & TREASURERLaszlo Zentai, Eotvos University, Hungary
VICE-PRESIDENTSDerek Clarke, Surveys and
Mapping, South AfricaMenno-Jan Kraak, ITC, The NetherlandsSukendra Martha, Bakosurtanal, IndonesiaPaulo Menezes, Federal University of Rio de Janeiro, Brazil, Anne Ruas, IFSTTAR, FranceTim Trainor, Census Bureau, USALiu Yaolin, Wuhan University, China
PAST-PRESIDENTWilliam Cartwright, RMIT University, Australia
EDITOR ICA NEWSIgor Drecki, University of
Auckland, New ZealandCOMMISSION CHAIRSCognitive [email protected] [email protected] & [email protected] of [email protected] [email protected] [email protected] [email protected]@oeaw.ac.at
Mapping from Remote Sensor Imagery [email protected] Geospatial Analysis and Modeling [email protected] [email protected] and the [email protected] [email protected] Technologies in Cartographic Heritage [email protected] Open Source Geospatial Technologies
[email protected] and Multiple Representation [email protected] [email protected] [email protected]@mdx.ac.ukMaps and Graphics for Blind and Partially Sighted [email protected] and [email protected] and User [email protected] and Children
[email protected] Education and [email protected] for [email protected] Production and [email protected] in Early Warning and Crises [email protected] Geoinformation Infrastructures and Standards [email protected]
GIM CORRESPONDENTDavid Fairbairn, Newcastle University, UK
INTERNATIONAL CARTOGRAPHIC ASSOCIATION
More information
1. www.edmgr.com/tica/
www.icaci.org
The fi rst issue of International Journal of Cartography will be
published in early 2015.
The profi le of ICA, which was promoted in
2014 by elevation to full ICSU membership,
will be further enhanced in 2015 by the
establishment of its own scientifi c journal.
The decision to go ahead with this important
step has been based on several years’
analysis of the existing publication landscape
of cartographic journals, discussion with
the ICA Commissions, assessment of the
demands and needs of academia and
scientifi c organisations, and the overall
acknowledgement of the importance of a
scientifi c journal for a major international
organisation. The journal will be called the
International Journal of Cartography, with
editors-in-chief William Cartwright and
Anne Ruas, and Taylor & Francis will be the
professional publication partners. The editorial
and publishing teams are working hard to be
able to launch the fi rst issue in early 2015.
The overall aims of the journal are to:
• offer more options for those who wish
to publish their scientifi c work in an
internationally recognised journal and, in this
way, respond to an increasing demand within
academia worldwide for career promotions
• provide a platform for reporting on new
fi ndings, insights and developments
concerning scientifi c cartography and
GIScience and thus strengthen the
foundation and visibility of our domain to
cater for the entire ICA community, by
publishing work on topics ranging from
service-oriented cartography, web mapping,
geovisualisation and generalisation, to the
history of cartography, cartographic heritage,
maps and society, and art and cartography;
• equally address two pillars of the ICA:
cartography and GIScience. It is hoped to
attract authors doing research in cartography
and GIScience to publish in a journal of
cartography and GIScience rather than
in any journal of whatever domain (and
there are many). A scientifi c domain is very
much defi ned by its main output media,
and strengthening these media will help to
contribute to enlargement of the discipline
and increased visibility.
It can be noted that there are already many
respected and well-established cartographic
journals around the world. Most of these
address their ‘home market’, publishing papers
primarily in the national language. Meanwhile,
the three prime English-language journals –
Cartographica, Cartography and Geographic
Information Science, and The Cartographic
Journal – have a long-standing and most
successful history of being close partners
of ICA, for example in producing numerous
special issues for recent International
Cartographic Conferences. The success
of these journals, and the large number of
articles on cartographic topics in other journals
in neighbouring disciplines, have convinced
ICA that cartography needs a further high-
quality record which will proactively provide
a vehicle for new and additional research
through publications and relevant outcomes.
The enhancement of the range of advanced
academic and research publications will
ensure increased acknowledgment of the
relevance of cartography, its role in the
geospatial domain, and a raising of esteem
of all cartographic journals, including the
raising of impact factors. Potential authors
and readers are encouraged to visit the new
journal’s website [1] to contribute to and
support this new vehicle.
A New ICA Journal
GIM0215_ICA 47 28-01-2015 14:03:48
+ Integrated HDR camera allows
combination of brilliant colours
with high-resolution scan data
+ The fastest laser-scanner
over 1 million points/second
+ Eyesafe laser class 1
+ IP53 dust & water resistance
Scanning System S-3180V3D laser measurement system
www.pentaxsurveying.com/en/
TI Asahi Co., Ltd.International Sales Department 4-3-4 Ueno Iwatsuki-Ku, Saitama-ShiSaitama, 339-0073 JapanTel.: +81-48-793-0118Fax. +81-48-793-0128E-mail: [email protected]
No
2720
GIM0215_ICA 48 28-01-2015 14:03:50
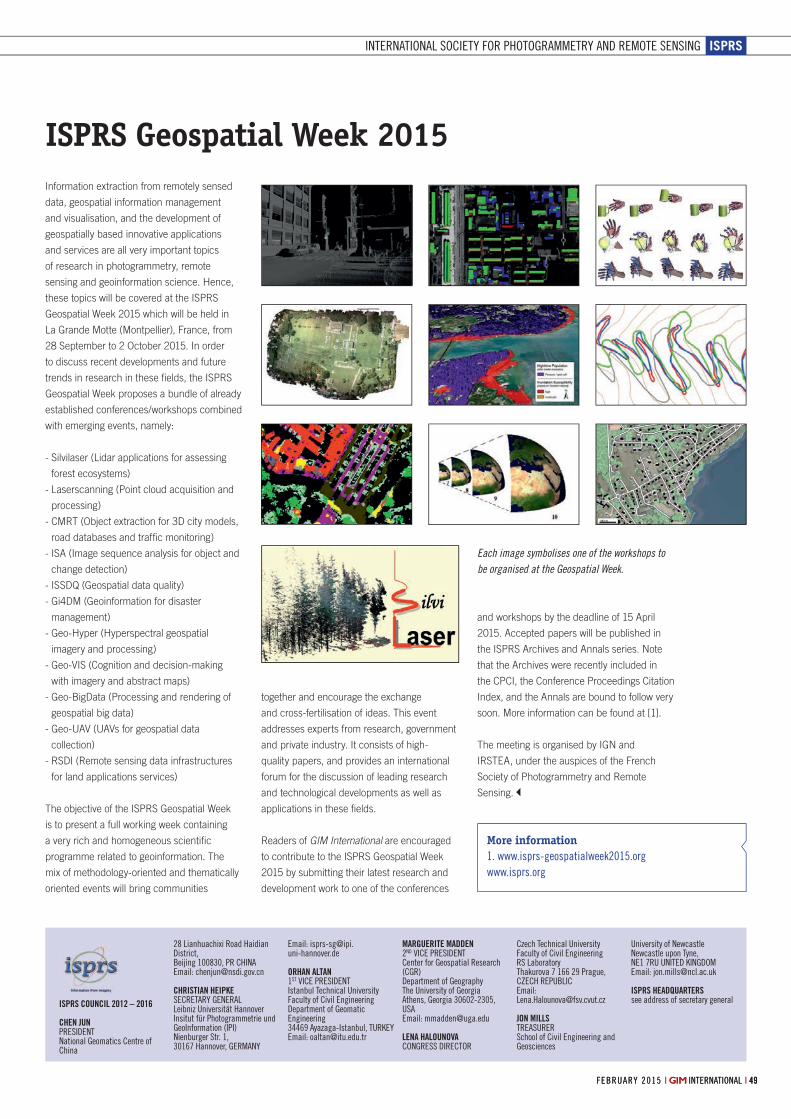
ISPRS
ISPRS COUNCIL 2012 – 2016
CHEN JUNPRESIDENTNational Geomatics Centre of China
28 Lianhuachixi Road Haidian District,Beijing 100830, PR CHINA Email: [email protected]
CHRISTIAN HEIPKESECRETARY GENERALLeibniz Universität HannoverInsitut für Photogrammetrie und GeoInformation (IPI)Nienburger Str. 1,30167 Hannover, GERMANY
Email: [email protected]
ORHAN ALTAN1ST VICE PRESIDENTIstanbul Technical University Faculty of Civil EngineeringDepartment of Geomatic Engineering34469 Ayazaga-Istanbul, TURKEYEmail: [email protected]
MARGUERITE MADDEN2ND VICE PRESIDENT Center for Geospatial Research (CGR)Department of GeographyThe University of GeorgiaAthens, Georgia 30602-2305, USAEmail: [email protected]
LENA HALOUNOVACONGRESS DIRECTOR
Czech Technical UniversityFaculty of Civil EngineeringRS LaboratoryThakurova 7 166 29 Prague, CZECH REPUBLICEmail: [email protected]
JON MILLSTREASURERSchool of Civil Engineering and Geosciences
University of Newcastle Newcastle upon Tyne, NE1 7RU UNITED KINGDOMEmail: [email protected]
ISPRS HEADQUARTERSsee address of secretary general
INTERNATIONAL SOCIETY FOR PHOTOGRAMMETRY AND REMOTE SENSING
49FEBRUARY 2015 | INTERNATIONAL |FEBRUARY 2015 | INTERNATIONAL | 49
More information
1. www.isprs-geospatialweek2015.org
www.isprs.org
Each image symbolises one of the workshops to
be organised at the Geospatial Week.
Information extraction from remotely sensed
data, geospatial information management
and visualisation, and the development of
geospatially based innovative applications
and services are all very important topics
of research in photogrammetry, remote
sensing and geoinformation science. Hence,
these topics will be covered at the ISPRS
Geospatial Week 2015 which will be held in
La Grande Motte (Montpellier), France, from
28 September to 2 October 2015. In order
to discuss recent developments and future
trends in research in these fi elds, the ISPRS
Geospatial Week proposes a bundle of already
established conferences/workshops combined
with emerging events, namely:
- Silvilaser (Lidar applications for assessing
forest ecosystems)
- Laserscanning (Point cloud acquisition and
processing)
- CMRT (Object extraction for 3D city models,
road databases and traffi c monitoring)
- ISA (Image sequence analysis for object and
change detection)
- ISSDQ (Geospatial data quality)
- Gi4DM (Geoinformation for disaster
management)
- Geo-Hyper (Hyperspectral geospatial
imagery and processing)
- Geo-VIS (Cognition and decision-making
with imagery and abstract maps)
- Geo-BigData (Processing and rendering of
geospatial big data)
- Geo-UAV (UAVs for geospatial data
collection)
- RSDI (Remote sensing data infrastructures
for land applications services)
The objective of the ISPRS Geospatial Week
is to present a full working week containing
a very rich and homogeneous scientifi c
programme related to geoinformation. The
mix of methodology-oriented and thematically
oriented events will bring communities
together and encourage the exchange
and cross-fertilisation of ideas. This event
addresses experts from research, government
and private industry. It consists of high-
quality papers, and provides an international
forum for the discussion of leading research
and technological developments as well as
applications in these fi elds.
Readers of GIM International are encouraged
to contribute to the ISPRS Geospatial Week
2015 by submitting their latest research and
development work to one of the conferences
and workshops by the deadline of 15 April
2015. Accepted papers will be published in
the ISPRS Archives and Annals series. Note
that the Archives were recently included in
the CPCI, the Conference Proceedings Citation
Index, and the Annals are bound to follow very
soon. More information can be found at [1].
The meeting is organised by IGN and
IRSTEA, under the auspices of the French
Society of Photogrammetry and Remote
Sensing.
ISPRS Geospatial Week 2015
GIM0215_ISPRS 49 28-01-2015 14:23:15

FUTURE EVENTS AGENDA
| INTERNATIONAL | F E B RU A RY 2 0155050
CALENDAR NOTICESPlease send notices at least
3 months before the event
date to: Trea Fledderus,
marketing assistant, email:
trea.fl [email protected]
For extended information
on the shows mentioned on
this page, see our website:
www.gim-international.com.
FEBRUARY14. OLDENBURGER 3D TAGEOldenburg, Germany
from 04-05 February
For more information:
W: www.jade-hs.de/3dtage
TUSEXPO 2015The Hague, The Netherlands
from 04-06 February
For more information:
W: www.tusexpo.com
MARCHAUVSI’S UNMANNED SYSTEMS EUROPEBrussels, Belgium
from 03-04 March
For more information:
W: www.auvsi.org/
UnmannedSystemsEurope/Home/
GEOSPATIAL ADVANCEMENT CANADA 2015Ottawa, Canada
from 03-05 March
For more information:
W: www.geospatialcanada.com
ANNUAL WORLD BANK CONFERENCE ON LAND AND POVERTY 2015Washington, DC, USA
from 23-27 March
For more information:
W: www.worldbank.org/
en/events/2014/08/06/
landconference2015
JOINT URBAN REMOTE SENSING EVENT Lausanne, Switzerland
from 30 March-01 April
For more information:
W: http://jurse2015.org/
APRILGEO-TUNIS 2015Hammamet, Tunis
from 01-05 April
For more information:
W: www.geotunis.org
III INTERNATIONAL FORUM ‘INTEGRATED GEOSPATIAL SOLUTIONS – THE FUTURE OF INFORMATION TECHNOLOGIES’Moscow, Russia
from 15-17 April
For more information:
W: http://sovzondconference.ru/2015/
THE WORLD CADASTRE SUMMIT, CONGRESS AND EXHIBITIONIstanbul, Turkey
from 20-25 April
For more information:
W: http://wcadastre.org
INTEREXPO GEO-SIBERIA-2015Novosibirsk, Russia
from 20-22 April
For more information:
W: www.expo-geo.ru
AAG ANNUAL MEETING 2015Chicago, IL, USA
from 21-25 April
For more information:
W: www.aag.org/annualmeeting
GISTAM 2015Barcelona, Spain
from 28-30 April
For more information:
W: www.gistam.org/
MAYASPRS 2015 ANNUAL CONFERENCETampa, FL, USA
from 04-08 May
For more information:
W: www.asprs.org/ASPRS-
Conferences.html
MUNDOGEO#CONNECT LATIN AMERICA Sao Paulo, Brazil
from 05-07 May
For more information:
W: http://mundogeoconnect.
com/2015/en/
RIEGL LIDAR 2015Hong Kong and Guangzhou, China
from 05-08 May
For more information:
W: www.riegllidar.com
ISRSE 2015Berlin, Germany
from 11-15 May
For more information:
W: www.isrse36.org
FIG WORKING WEEK 2015Sofi a, Bulgaria
from 17-21 May
For more information:
E: fi g@fi g.net
W: www.fi g.net/fi g2015
GEO BUSINESS 2015London, UK
from 27-28 May
For more information:
W: http://geobusinessshow.com/
conference/
JUNEHXGN LIVELas Vegas, NV, USA
from 01-04 June
For more information:
W: http://hxgnlive.com/las.htm
28. INTERNATIONAL GEODETIC STUDENT MEETING (IGSM)Espoo, Finland
from 01-06 June
For more information:
W: www.igsm.fi
INTERNATIONAL CONFERENCE ON UNMANNED AIRCRAFT SYSTEMSDenver, CO, USA
from 09-12 June
For more information:
W: www.uasconferences.com
JULYESRI INTERNATIONAL USER CONFERENCESan Diego, CA, USA
from 20-24 July
For more information:
W: www.esri.com/events/user-conference
AUGUST27TH INTERNATIONAL CARTOGRAPHIC CONFERENCERio de Janeiro, Brazil
from 23-28 August
For more information:
W: www.icc2015.org
UAV-G CONFERENCE 2015Toronto, CA, Canada
from 30 August-02 September
For more information:
W: www.uav-g-2015.ca
SEPTEMBERPHOTOGRAMMETIC WEEK 2015Stuttgart, Germany
from 7-11 September
For more information:
W: http://www.ifp.uni-stuttgart.de/
phowo/index.en.html
INTERGEO 2015Stuttgart, Germany
from 15 -17 September
For more information:
W: www.intergeo.de
CONVENTION OF SURVEYING “AGRIMENSURA 2015”La Habana, Cuba
from 23-26 September
For more information:
W: www.agrimensuracuba.com/
OCTOBERINTERNATIONAL SYMPOSIUM OF DIGITAL EARTH 2015Halifax, Nova Scotia, Canada
from 06-10 October
For more information:
W: www.digitalearth2015.ca
GIM0215_Agenda 50 28-01-2015 14:21:43
No
2728
GIM0215_Cover 51 28-01-2015 14:19:48
SIGN UP FOR A FREE TRIAL
Find out how Trimble InSphere can help streamline workflows for
your organization with our free trial at www.trimbleinsphere.com
Empowering geospatial organizations with a cloud-based platform of software, data and services.
Trimble InSphere gives you the tools and insight to streamline your workflows
and simplify access to the information you need—whether that’s project
data, public records, equipment utilization and location, maps, or anything in
between. From start to finish, increase how fast you get the job done through
instant access and sharing. With Trimble InSphere, your entire organization
becomes more efficient. Anytime, anywhere.
© 2015, Trimble Navigation Limited. All rights reserved. Trimble and the Globe & Triangle logo are trademarks of Trimble Navigation Limited, registered in the United States and in other countries. Access, InSphere, and Terraflex are trademarks of Trimble Navigation Limited. All other trademarks are the property of their respective owners. GEO051 (01/15)
DATA MANAGER
EQUIPMENT MANAGER
DATA MARKETPLACE
TERRAFLEX
TRIMBLE ACCESSTM
SERVICES
Trimble® InSphereTM ALLOW EVERYONE IN YOUR ORGANIZATION TO
SHARE THE SAME PERSPECTIVE. WHEREVER THEY ARE.
No
2725
GIM0215_Cover 52 28-01-2015 14:19:49
Related Documents