BRINE SAMPLING AND EVALUATION PROGRAM 1992-1993 REPORT AND SUMMARY OF BSEP DATA SINCE 1982 DOE-WIPP 94-011 April 1995 AUTHORS D. E. Deal-IT Corporation R. J. Abitz-IT Corporation D. S. Belski-Westinghouse Electric Corporation J. B. Case-IT Corporation M. E. Crawley-IT Corporation C. A. Givens-IT Corporation P. P. James Lipponer-IT Corporation D. J. Milligan-IT Corporation J. Myers-IT Corporation D. W. Powers-Consulting Geologist M. A. Valdivia-IT Corporation Any comments or questions regarding this report should be directed to the U.S. Department of Energy WIPP Project Office P. O. Box 3090 Carlsbad, New Mexico 88221 or to the Manager Engineering Department Westinghouse Electric Corporation Waste Isolation Division P.O. Box 2078 Carlsbad, New Mexico 88221 This report was prepared for the U.S. Department of Energy by the Engineering Department of the Management and Operating Contractor, Waste Isolation Pilot Plant, under Contract No. DE-AC04-86AL31950.

Welcome message from author
This document is posted to help you gain knowledge. Please leave a comment to let me know what you think about it! Share it to your friends and learn new things together.
Transcript

BRINE SAMPLING AND EVALUATION PROGRAM1992-1993 REPORT AND SUMMARY OF
BSEP DATA SINCE 1982
DOE-WIPP 94-011
April 1995
AUTHORS
D. E. Deal-IT CorporationR. J. Abitz-IT Corporation
D. S. Belski-Westinghouse Electric CorporationJ. B. Case-IT Corporation
M. E. Crawley-IT CorporationC. A. Givens-IT Corporation
P. P. James Lipponer-IT CorporationD. J. Milligan-IT Corporation
J. Myers-IT CorporationD. W. Powers-Consulting Geologist
M. A. Valdivia-IT Corporation
Any comments or questions regarding this report shouldbe directed to the
U.S. Department of EnergyWIPP Project Office
P. O. Box 3090Carlsbad, New Mexico 88221
or to theManager
Engineering DepartmentWestinghouse Electric Corporation
Waste Isolation DivisionP.O. Box 2078
Carlsbad, New Mexico 88221
This report was prepared for the U.S. Department of Energy by the Engineering Department of the Managementand Operating Contractor, Waste Isolation Pilot Plant, under Contract No. DE-AC04-86AL31950.
DISCLAIMER
Portions of this document may be illegiblein electronic image products. Images areproduced from ~he best available originaldocument.
BRINE SAMPUNG AND 'EVALUATION PROGRAM1992-1993 REPORT AND SUMMA~Y OF
BSEP DATA SINCE 1982
DOE-WIPP 94-011
April 1995
AUTHORS
D. E. Deal-IT CorporationR. J. Abitz-IT Corporation
D. S: BelsId-Westinghouse Electric Corporation,J. B. Case-IT Corporation
M. E. Crawley-IT CorporationC. A. Givens-IT Corporation
P. P. James Lipponer-IT CorporationD. J. Milligan-IT Corporation
J. Myers-IT CorporationD. W. Powers-Consulting Geologist
M. A. Valdivia-IT Corporation
Any comments or questions regarding this report shouldbe directed to the
U.S. Department of EnergyWIPP Project Office
P. o. Box 3090Carlsbad, New Mexico 88221
or to theManager
Engineering DepartmentWestinghouse Electric Corporation
Waste Isolation DivisionP.O. Box 2078
Carlsbad, New M~xico 88221
This report was prepared for the u.s. Department of Energy by the Engineering Department of the Managementand Operating Contractor, Waste Isolation Pilot Plant, under Contract No. DE-AC04-86AL31950.
DISTRIBUilON OF T'rliS
BRINE SAMPLING AND EVALUATION PROGRAM REPORT 1992·1993
This document is issued by Westinghouse Electric: Corporation, Waste Isolation Division, asthe Management and Operating Contractor for thf~ u. S. Department of Energy, WasteIsolation Pilot Plant, Carlsbad, New Mexico 88221.
DOE CONTRACT NUMBER: DE-AC04-86AL31950
This document has been submitted as required to:
Office of Scientific and Technical InformationPO Box 62Oak Ridge, TN 37831(615) 576-8401
Additional information about this document may be obtained by calling 1-800-336-9477.Copies may be obtained by contacting the National Technical Information Service, USDepartment of Commerce, 5285 Port Royal Road, Springfield, VA 22161.

BRINE SAMPLING AND EVALUATION PROGRAM REPORT 1992-1993
Acknowledgments _
Dr. Dwight Deal provides overall direction to the Brine Sampling and Evaluation Program(BSEP) at the Waste Isolation Pilot Plant (WIPP) located in Carlsbad, New Mexico.
Dr. Rich Abitz coordinates the geochemical analyses.
Mr. Dave Belski is responsible for the routine collection of brine from the drill holes in therepository, sample measurement and processing, and data analysis.
Mr. Darin Milligan prepared the statistical analysis of the geochemical data (Chapter 3.0).
Mr. Mark Crawley prepared the 1993 file report of the hydrologic testing of the fractured partof the disturbed rock zone beneath the WIPP excavations, which is summarized inChapter 4.0 and Appendix E.
Dr. Dennis Powers contributed the observations in the air intake shaft (Appendix C).
Ms. Pamela James-Lipponer was responsible for entry, analysis, and quality assurance of thebrine inflow data and prepared Appendices A, B, and D.
Mr. Craig Givens edited and condensed Appendices C and E, prepared the final graphs inAppendix B, and wrote Chapter 4.0.
Dr. John Case performed the numerical modeling of brine seepage from clay compactionpresented in Appendix F.
Mr. Miguel Valdivia provided extensive support to both the statistical analysis and thenumerical modeling. He prepared the final version of Appendix F.
Dr. Jonathan Myers provided input to the discussion of brine geochemistry and on theimportance of the BSEP to the assessment of long-term facility performance.
AU02·94IWPIW1P:R3192
so, ,,~. • . ~ .....". _.'", ( ... '. """.'_ . .'J•• :0.) _ j
i
-, -. ~ ~ ..... i L·
301681.008

BRINE SAMPLING AND EVALUAnON PROGRAM REPORT 1992-1993
THIS PAGE INTENTIONt~LLY LEFT BLANK
AU02-94/WP/W1P:R3192 11 301681.008

BRINE SAMPLING AND EVALUATION PROGRAM REPORT 1992-1993
Table of Contents _
Acknowledgments 1
List of Tables ...................;................................. v
List of Figures . . . . . . . . . . . . . . . . . . . . . . . . . . . . . . . . . . . . . . . . . . . . . . . . . . . .. vi
List of Abbreviations!Acronyms '. . . . . . . . . . . . . . . . . . . . . . .. vii
Executive Summary . . . . . . . . . . . . . . . . . . . . . . . . . . . . . . . . . . . . . . . . . . . . . . . .. ix
1.0 Introduction.. . . . . . . . . . . . . . . . . . . . . . . . . . . . . . . . . . . . . . . . . . . . . . . .. 1-1
2.0 Monitoring of Brine Inflow Parameters . . . . . . . . . . . . . . . . . . . . . . . . . . . . . . . 2-1
2.1 Introduction.............................................. 2-1
2.2 Damp or Wet Areas on Drift Floors . . . . . . . . . . 2-1
2.3 Downholes and Brine Beneath the Floor . . . . . . . . . . . . . . . . . . . . . . . . . . 2-1
2.3.1 Downholes 2-1
2.3.2 Shaft Sumps 2-6
2.4 Upholes and Brine Above the Roof 2-6
2.5 Subhorizontal Holes 2-8
2.6 Air Intake Shaft . . . . . . . . . . . . . . . . . . . . . . . . . . . . . . . . . . . . . . . . . . . 2-9
2.7 Discussion of Data Acquisition and Analysis , 2-10
3.0 Statistical Analysis of the BSEP Brines . . . . . . . . . . . . . . . . . . . . . . . . . . . . . . . 3-1
3.1 Introduction 3-1
3.2 Sources of Data 3-2
3.3 Temporal Trends 3-2
3.4 Duplicate Analysis 3-4
3.5 Determination of Statistical Distributions. . . . . . . . . . . . . . . . . . . . . . . . . . 3-4
3.6 Handling of Values 3-7
3.7 Rejection of Outliers 3-7
3.8 Average Brine Chemistry 3-9
3.9 Composition of Non-Salado Brine from the WIPP Underground 3-19
3.10 Conclusions , 3-19
4.0 Hydrologic Testing of the Fractured Part of the Disturbed Rock Zone Beneath
the WIPP Excavations . . . . . . . . . . . . . . . . . . . . . . . . . . . . . . . . . . . . . . . . . . . 4-1
5.0 Numerical Modeling of Brine Seepage as a Result of Clay Compaction 5-1
5.1 Introduction.............................................. 5-1
5.2 Modeling Assumptions 5-1
5.3 Room Q 5-2
AU02·94IWPIWIP:R3192 III 301681.008
BRINE SAMPLING AND EVALUATION PROGRAM REPORT 1992-1993
Table of Contents (Continued) _
5.4 Standard WIPP Waste Storage Room 5-2
5.5 Axial Consolidation Around a Borehole 5-3
5.6 Summary................................................ 5-4
6.0 Summary and Conclusions . . . . . . . . . . . . . . . . . . . . . . . . . . . . . . . . . . . . . . . . 6-1
7.0 References 7-1
Appendix A-Brine Accumulation
Appendix B-Graphs of Brine Accumulation Data
Appendix C-AIS Observations
Appendix D-1993 Analytical Results
Appendix E-Hydrologic Testing
Appendix F-Numerical Modeling of Brine Seepage from Clay Compaction
AU02-94IWPIWIP:R3192 iv 301681.008

BRINE SAMPLING AND EVALUATION PROGRAM REPORT 1992-1993
List of Tables, _
Table
1-1
2-1
3-1
3-2
3-3
3-4
5-1
Title
Points to be Considered When Evaluating BSEP Data
Brine Accumulation Summary
BSEP Drillholes Sampled for Brine between 1987 and 1993
Simple Statistics for BSEP Analyses
Average Composition of Salado Formation Brine
Composition of Salado and Nonsalado Brines
Seepage Rate in Drillholes Penetrating Clay B
AU02·94IWPIWIP:R3192
.- ~ ,~·-'!'.-th' ..
v
,.
301681.008

BRINE SAMPLING AND EVALUATION PROGRAM REPORT 1992-1993
List of Figures _
Figure
1-1
1-2
1-3
2-1
2-2
2-3
3-1
3-2
Title
WIPP Location in Southeastern New Mexico
Surface and Underground Layout of the WIPP Facility
Generalized Stratigraphic Cross Section of the WIPP Site
Map of the WIPP Underground Worldngs Showing BSEP ObservationLocations as of December 31, 1993
Correlation of the Stratigraphy to the Downholes in the Northern Part of theFacility
Correlation of the Stratigraphy to the Upholes in the Northern Part of theFacility
Uphole A1X02 Concentration vs. Time for B, Br, Mg, and K
Means Plots for BSEP Drill Holes for B, Br, K, and Mg
AU02-94IWPIW1P:R3192 vi 301681.008

BRINE SAMPLING AND EVALUATION PROGRAM REPORT 1992-1993
List of Abbreviations/Acronyms _
AISAIALKANOVAAsASTMBBaBrBSEPCaCIcmcm/sCsDOEDRZEPAFFeftIKKgLmMMBMgmg/kgmLmmMnMPaNNaNDNH4N03PPa
AU02-94IWPIWIP:R3192
Air Intake ShaftaluminumalkalinityAnalysis of VariancearsenicAmerican Society for Testing and MaterialsboronbariumbromineBrine Sampling and Evaluation Programcalciumchlorinecentimeter(s)centimeter/secondcesiumU.S. Department of Energydisturbed rock zoneU.S. Environmental Protection Agencyflorineironfoot/feetiodinepotassiumkilogram(s)liter(s)meter(s)MeanMarker Bedmagnesiummilligrams per kilogrammilliliter(s)millimeter(s)manganesemegapascal(s)number of samplessodiumNot detectedAmmoniumNitratephosphorouspascal(s)
vii 301681.008

BRINE SAMPLING AND EVALUATION PROGRAM REPORT 1992-1993
List of Abbreviations/Acronyms (Continued) _
PARbSS04SGSiSNL/NMSPDVSrTDSTICTOCTRUWIPP
AU02-94IWPIWIP:R3192
Performance Assessmentribodiumstandard deviationsulfatespecific gravitysiliconSandia National LaboratorieslNew MexicoSite and Preliminary Design Validationstrontiumtotal dissolved solidstotal inorganic carbontotal organic carbontransuranicWaste Isolation Pilot Plant
viii 301681.008
BRINE SAMPLING AND EVALUATION PROGRAM REPORT 1992-1993
Executive Summary
EXECUTIVE SUMMARY
The data in this report are the result of activities associated with the Brine Sampling andEvaluation Program (BSEP) at the Waste Isolation Pilot Plan (WIPP) during 1992 and 1993.This report is the last one that is currently scheduled in the sequence of reports of new data.and therefore. also includes summary comments referencing important data obtained by BSEPsince 1983. These BSEP activities document and investigate the origins. hydrauliccharacteristics. extent. and composition of brine occurrences in the Permian Salado Formationand seepage of that brine into the excavations at the WIPP. A project concern is that enoughbrine might be present after sealing and closure to generate large quantities of hydrogen gasby corroding the metal in the waste drums and waste inventory.
When excavations began at the WIPP in 1982, small brine seepages (weeps) were observedon the walls. Brine studies began as part of the Site Validation Program and were formalizedas the BSEP in 1985. During eleven years of observations (1982-1993), evidence hasmounted that the amount of brine seeping into the WIPP excavations is limited. local, andonly a small fraction of that required to produce a maximum amount of hydrogen gas. Thedata collected through 1991 are discussed in detail and are summarized by Deal and others(1993). This report describes progress made during the calendar years 1992 and 1993 andfocuses on four major areas: (1) monitoring of brine inflow, e.g., measuring brines recoveredfrom holes drilled downward from the underground drifts (downholes), upward from theunderground drifts (upholes), and from subhorizontal holes from the underground drifts;(2) observations of weeps in the Air Intake Shaft (MS); (3) further characterization of brinegeochemistry; and (4) additional characterization of the hydrologic conditions in the fracturedzone beneath the excavations.
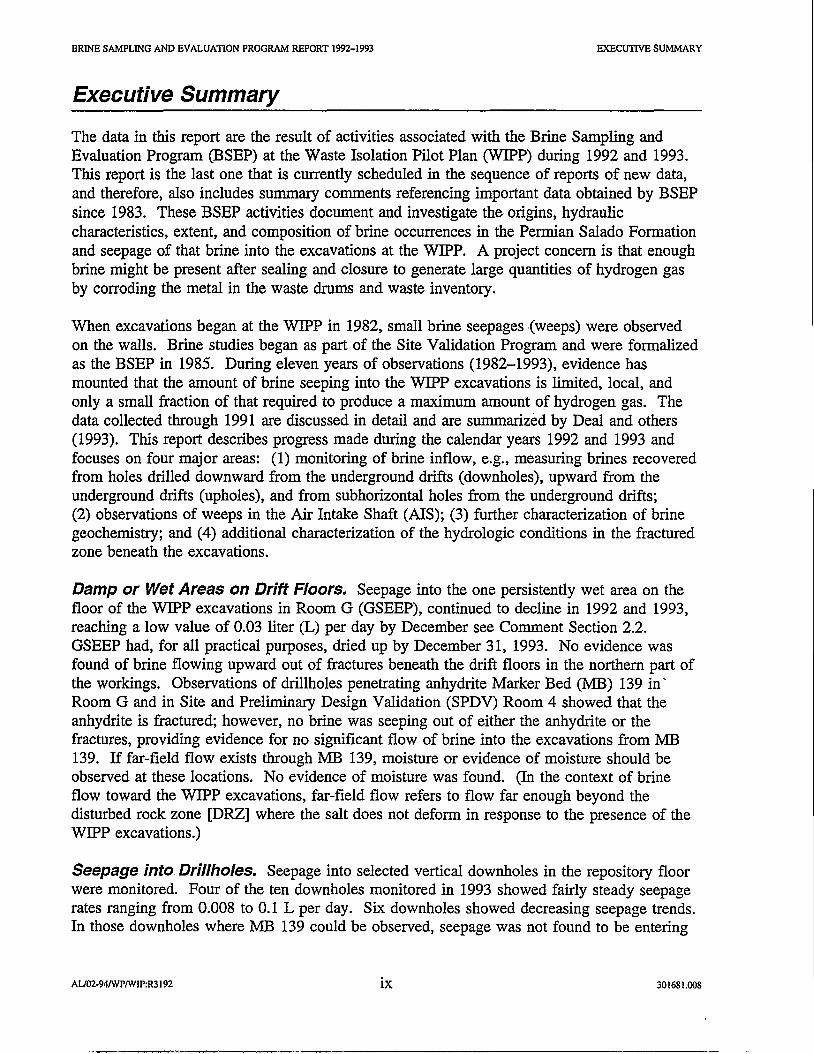
Damp or Wet Areas on Drift Floors. Seepage into the one persistently wet area on thefloor of the WIPP excavations in Room G (GSEEP), continued to decline in 1992 and 1993,reaching a low value of 0.03 liter (L) per day by December see Comment Section 2.2.GSEEP had. for all practical purposes, dried up by December 31. 1993. No evidence wasfound of brine flowing upward out of fractures beneath the drift floors in the northern part ofthe workings. Observations of drillholes penetrating anhydrite Marker Bed (MB) 139 inRoom G and in Site and Preliminary Design Validation (SPDV) Room 4 showed that theanhydrite is fractured; however, no brine was seeping out of either the anhydrite or thefractures, providing evidence for no significant flow of brine into the excavations from MB139. If far-field flow exists through MB 139, moisture or evidence of moisture should beobserved at these locations. No evidence of moisture was found. (In the context of brineflow toward the WIPP excavations, far-field flow refers to flow far enough beyond thedisturbed rock zone [DRZ] where the salt does not deform in response to the presence of theWIPP excavations.)
Seepage into Drillholes. Seepage into selected vertical downholes in the repository floorwere monitored. Four of the ten downholes monitored in 1993 showed fairly steady seepagerates ranging from 0.008 to 0.1 L per day. Six downholes showed decreasing seepage trends.In those downholes where MB 139 could be observed, seepage was not found to be entering
AU02·94IWPIWIP:R3192 ix 301681.008

BRINE SAMPLING AND EVALUATION PROGRAM REPORT 1992-1993 EXECUTIVE SUMMARY
the hole from:ME 139. Rather, seepage was observed to be from deeper horizons, which willnot be intersected by waste storage rooms or be subjected to the fracturing expected to occuraround waste storage rooms.
None of the monitored upholes continue to produce brine. Eleven subhorizontal observationholes (drilled at a slight downward angle) continue to be monitored. Only those four thatintersect the orange band (Map Unit 1) continue to have measurable seepage, which was0.005 to 0.01 L per day.
Seepage into Shaft Sumps. Observations in the shaft sumps show that open fractures in:ME 139 remain dry. The shaft sumps are, in effect, long-term far-field flow experiments.
Seepage into the Air Intake Shaft. The AIS was inspected for evidence of brine inflowand only one small moist area was observed. It occurs at the base of:ME 103, in the upperpart of the Salado Formation not far below the Rustler-Salado contact. Salt encrustations(evidence of past brine seepage) occur more commonly below 1,500-ft depth, are clearlystratigraphically controlled, and are associated with clay interbeds and argillaceous halite.The AIS is, in effect, a long-term far-field flow experiment. The anhydrite exposures aretypically dry and free of salt encrustations, indicating that no significant amount of brineflows through them to the shaft.
Geochemistry. The general trends of the 1992-1993 geochemistry data are similar to thosediscussed by Deal and others (1991b, Chapter 3, Table 3-5 and 3-3). Long-term trends ofstrontium values have been decreasing for samples collected from drillhole DHP402A. Ahigh strontium signature is characteristic of brine that originated as water from the RustlerFormation and was spread for dust control. The lowering of strontium values is consistentwith the hypothesis that there is less dilution from construction water derived from the RustlerFormation occurring at the location of DHP402A in Panel 1.
Data from eleven drillholes that have not been contaminated with construction brine form twovery similar brine populations. One population are those holes that contain brine derivedfrom the repository horizon and the other, holes that contain brine only from horizons belowthe floor of the repository. Brines associated with the repository horizon are slightly higherin Mg and Br and lower in K and B than brines from stratigraphic horizons (probably clay B)below the excavations. An average composition for the repository horizon brines that mightcome into contact with the waste after sealing and closure is presented in Table 3-3.
Hydraulic Tests in the Fractured Part of the DRZ. Fractures are common in the WIPPunderground, and fracture systems locally connect brine-fIlled drillholes at some driftintersections. Fracturing creates pathways that can greatly alter apparent flow rates toindividual downholes.
Hydrologic tests were performed in the fractured part of the DRZ at the following threelocations:
AU02-94/WP/WIP:R3192 x 301681.008

BRINE SAMPLING AND EVALUATION PROGRAM REPORT 1992-1993 EXECUTIVE SUMMARY
• Intersection of S90 and W620 near the AIS• Intersection of W170 and S400 at the Underground Core Storage Area• Intersection of EO and N620.
The test results confmned that the width of an excavation influences the development ofintegrated fractures and showed that integrated fracture systems were only found beneathintersections. This supports the concept of limited, bounded, fractured fluid reservoirs. Sincebrine stands at different levels in closely spaced drillholes in the floor and is not seeping outof fractures observed in the Salt Shaft and Waste Shaft sumps, it can be concluded that largescale hydrologically interconnected fracture systems do not exist below the WIPPunderground excavation.
Numerical Modeling of Brine Seepage as a Result of Clay Compaction. It haspreviously been pointed out (Deal and others, 1993, Sections 4 and 5; Deal and Bills, 1994)that there appears to be enough moisture present in the clays within the Salado Formation toaccount for all the brine that is observed to seep into the WIPP excavations. The excavationof WIPP rooms result in stress redistribution around those openings that can cause theconsolidation of thin clays within the stratigraphic sequence. Additionally, the excavations(including drillholes) provide a sink at atmospheric pressure allowing brine to flow from theconsolidating clays.
A series of order-of-magnitude seepage calculations (Appendix F) were made in order tonumerically model clay consolidation and estimate the resultant brine seepage into the WIPP.
These order-of-magnitude seepage calculations compare well with the observed seepage intoRoom Q. Calculated seepage rate after 1,600 days is on the order of 0.3 L/day, where theactual observed rate is 0.17 L/day. In this case the model is for flow towards the room alonga thin clay seam. Extending this model to a waste storage room predicts that the totalseepage into the room will be on the order of 9,000 L, far short of the 220,000 L necessary toreact anoxically with all the susceptible metal placed in the room (Deal and others, 1991b,Section 4.6). Furthermore, seepage into the room will cease after about 100 years.
The case for seepage into a downhole drilled into the strata below a WIPP excavationbehaves differently, as flow is radially toward the drillhole rather than parallel to the wall of aroom. In this case, some seepage continues for a long time, perhaps a thousand years ormore. It is clear that seepage into drillholes is strikingly different from seepage into arepository excavation. Deal and others (1994, Section 2.7.2) pointed out that seepage intodrillholes probably should not be used to predict long term seepage into a WIPP wastestorage room. The calculation provides additional support for this caution.
AU02·94IWPIWIP:R3192 xi 301681.008

BRINE SAMPLING AND EVALUATION PROGRAM REPORT 1992-1993 EXECUTIVESU~ARY
THIS PAGE INTENTIONJ~LLY LEFT BLANK
ALJ02-94/WPIWIP:R3192 xii 301681.008

BRINE SAMPLING AND EVALUATION PROGRAM REPORT 1992-1993
1.0 Introduction
INTRODUCTION
The Waste Isolation Pilot Plant (WIPP), a U.S. Department of Energy (DOE) research
facility, was established to demonstrate the safe disposal of defense-generated transuranic
(TRU) waste in the United States. The WIPP facility is 26 miles (42 kilometers) east of
Carlsbad, New Mexico (Figure 1-1). The surface and underground layout of the facility is
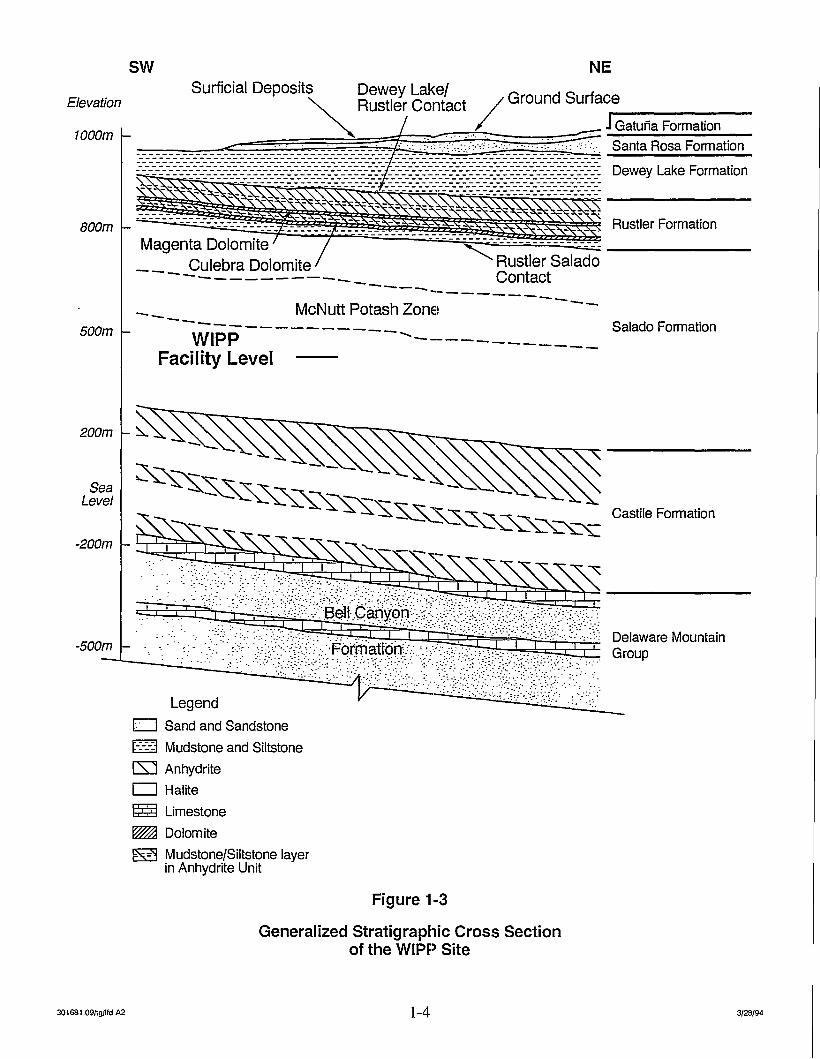
presented in Figure 1-2. The repository is approximately 2,150 feet (ft) (655 meters [mD
below the surface in the Salado Formation. The Salado Formation and underlying Castile
Formation make up an evaporite sequence over 3,300 ft (1,000 m) thick (Figure 1-3). An
extensive program of site characterization was initiated in 1976 (powers and others, 1978;
Bechtel, 1983) and continued through 1991 (Deal and others, 1993). The hydrogeological
activities of the Brine Sampling and Evaluation Program (BSEP) are part of a continuing
effort to refine the understanding of the repository geology. The data in this report update the
previous studies summarized in Deal and others (1993) and in Deal and Bills (1994).
Brine studies began in 1982 as part of the Site Validation Program (Black and others, 1983)
and were formalized in 1985 by Morse and Hassinger (1985). The focus of the BSEP is the
origin, hydraulic characteristics, extent, and chemical composition of brine in the Salado
Formation at the repository horizon and seepage of brine into the excavations at the WIPP.
Although the repository is dry, brine weeps from exposed surfaces, accumulates in drillholes
and sumps, and forms encrustations on the walls as the brine evaporates over time. The
chemistry of the brine may affect chemical reactions in the buried waste, and the volume of
brine and the hydrologic system that drives the brine seepage need to be known in order to
assess the long-term performance of the repository after closure.
Brine inflow systems have been discussed in previous BSEP reports. There are three different
conceptual models that have been considered:
• Far-field Flow Model: flow from the far-field, either by radial flow to theexcavation or laterally through stratigraphically-constrained flow.
• Redistribution Model: movement of interstitial brine within the disturbed rockzone (DRZ) toward the excavations by excavation-induced stress redistribution.This does not consider displacement of brine from inside the clays, onlyredistribution of brine already in available pore spaces in the salt, polyhalite, andanhydrite units.
AUOI-9SIWPIWIP/:R3192 1-1 301681.08
-~~-~---_.~.-. -~.---- -- ----- - -- ------_._- _._- .--~--

o 5 10 mi
~o 10km
New Mexicci
W1PP
carIS~\G'.
-------:::....:::-:._.....,
I
WIPPBoundary
II1
II
~i~::S' c:0 1~:O'tJ~I OJ"C' alwl-J
uJal
301681.009.00.0009/19 AS
Figure 1-~
WIPP Location in Southeastern New Mexico
1-2 9/16/94

~
'"~m~b15~o
~~
.1
Waste Handling Building
Not to Scale
WasteEmplacementArea
~~~G>~~~
"9"~~~
II II II Salt Handling Shaft
II II Waste Shaft
Exhaust Shaft
NorthernExperimentalArea
...I
u.l
~'e Figure 1-2
Surface and Underground Layout of the WIPP Facility
NE
WIPPFacility Level
------------.......------------------------
800m
500m
Castile Formation
~ ~-~--~~~~~~"'\....""\...~',.',.--s:'S~"_""_""_"_"_"-..........."---...,...~
~--~~~~~~~~9
SeaLevel
200m
-200m
-500mDelaware MountainGroup
Legend
~ Sand and SandstoneI::-...J Siltstonet-:-:-:i Mudstone and
[SJ Anhydrite
o Halite
~ Limestone
~ Dolomite
M dstone/Siltst!Jne layer~ "InuAnhYdrite Umt 1 3
Figure -
Sectionf raphic CrossGeneralized~t~~~~IPP Site
'0. ' ••
301681.09/lgllfd A2 1-4 3/28/94

BRINE SAMPLING AND EVALUATION PROGRAM REPORT 1992-1993 INTRODUCTION
• Clay Compaction Model: brine squeezed from clays within a short distance (afew m) of the excavations.
Additional effects, such as gas exsolution, development of enhanced porosity and permeability
within the DRZ, and preferential flow along bedding planes, may modify brine inflow.
However, it is fundamentally important to distinguish between far-field sources and local,
relatively limited redistribution of brine in the immediate vicinity of the WIPP excavations.
In both cases, the driving mechanism is the pressure gradient caused by the excavation of the
underground openings. Flow pathways are through permeable interbeds, along stratigraphic
discontinuities, or through fractures.
The relative importance of these systems needs to be determined. For example, if there is
sufficient far-field flow into the repository, enough brine may come into the excavations to
completely corrode the metal in the waste and the waste drums. In that case, the potential for
hydrogen generation due to the corrosion would be limited by the total metal inventory. If
brine seepage is a purely local phenomenon that occurs as a results of redistribution of brine
in the immediate vicinity of the excavations, there would be insufficient brine available to
cause much corrosion after closure. In the latter case, gas generation would be limited by
brine availability and would not be a problem. Evidence suggests that brine is derived from
clay within a few meters of the excavations, and will not result in the production of large
quantities of hydrogen gas by anoxic corrosion.
The predicted consequences of human-intrusion events, the fate of the waste-generated gases,
and the migration of the hazardous constituents during undisturbed performance are all
sensitive to brine inflow assumptions. If the far-field model is valid, a human-intrusion event
(Le., drilling into the sealed repository at a future date) will lower fluid pressure in the waste
storage rooms, create pressure gradients toward the rooms, and reinstate far-field flow. This
will lead to a greater release of radionuclides from the repository, because the inflowing brine
would infiltrate through the waste and flow up the drillhole. Alternatively, if a near-field
model is valid, the only brine available for transport of radionuclides is the volume of brine
that is trapped in the room at the time of sealing.
Collection techniques and certain general observations should be kept in mind when
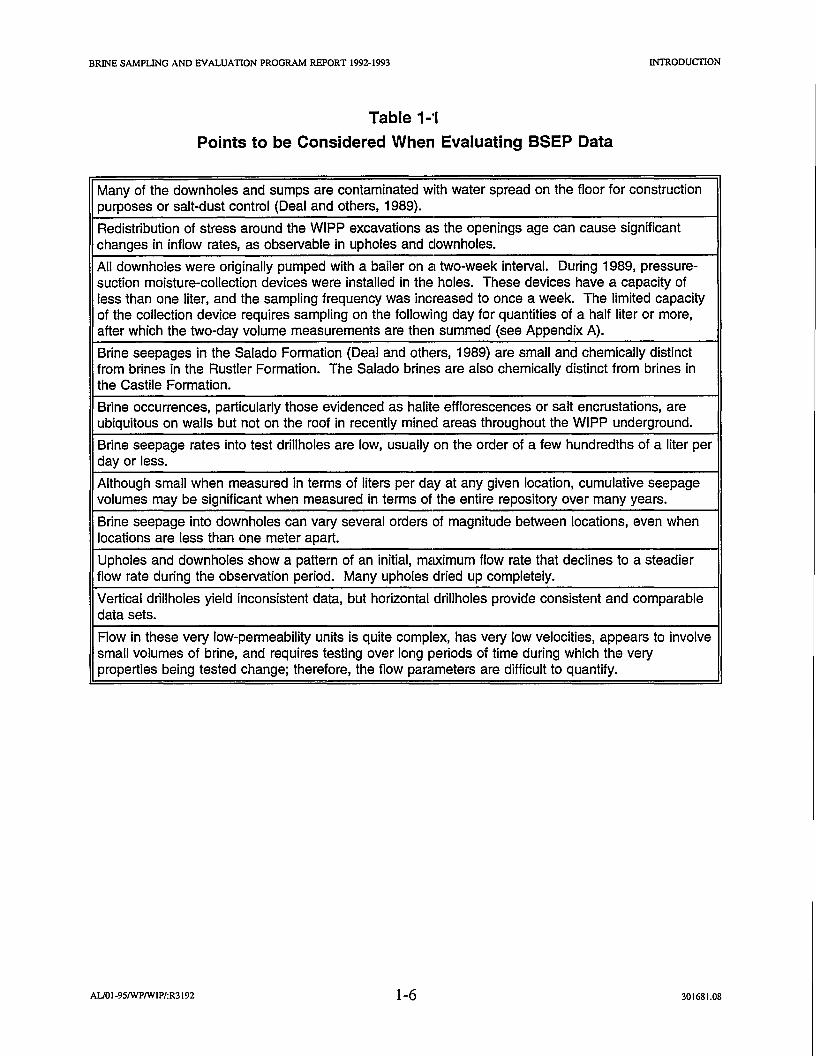
evaluating the BSEP data. These are listed in Table 1-1. Care should also be exercised when
AUOI-95IWPIWIP/:R3192 1-5 301681.08
BRINE SAMPLING AND EVALUATION PROGRAM REPORT 1992-1993
Table 1-'1
Points to be Considered When Evaluating BSEP Data
lNTRODUcnON
Many of the downholes and sumps are contaminated with water spread on the floor for constructionpurposes or salt-dust control (Deal and others, 1989).
Redistribution of stress around the WIPP excavations as the openings age can cause significantchanges in inflow rates, as observable in upholes and clownholes.
All downholes were originally pumped with a bailer on a two-week interval. During 1989, pressure-suction moisture-collection devices were installed in the holes. These devices have a capacity ofless than one liter, and the sampling frequency was increased to once a week. The limited capacityof the collection device requires sampling on the following day for quantities of a half liter or more,after which the two-day volume measurements are then summed (see AppendiX A).
Brine seepages in the Salado Formation (Deal and others, 1989) are small and chemically distinctfrom brines in the Rustler Formation. The Salado brines are also chemically distinct from brines inthe Castile Formation.
Brine occurrences, particularly those evidenced as halite efflorescences or salt encrustations, areubiquitous on walls but not on the roof in recently mined areas throughout the WIPP underground.
Brine seepage rates into test drillholes are low, usually on the order of a few hundredths of a liter perday or less.
Although small when measured in terms of liters per day at any given location, cumulative seepagevolumes may be significant when measured in terms of the entire repository over many years.
Brine seepage into downholes can vary several orders of magnitude between locations, even whenlocations are less than one meter apart.
Upholes and downholes show a pattern of an initial, maximum flow rate that declines to a steadierflow rate during the observation period. Many upholes dried up completely.
Vertical drillholes yield inconsistent data, but horizontal drillholes provide consistent and comparabledata sets.
Flow in these very low-permeability units is quite complex, has very low velocities, appears to involvesmall volumes of brine, and requires testing over long periods of time during which the veryproperties being tested change; therefore, the flow parameters are difficult to quantify.
AUOI-9SIWPIWIP/:R3192 1-6 301681.08

BRINE SAMPLING AND EVALUATION PROGRAM REPORT 1992-1993 INfRODUcnON
interpreting the various diagrams of drillhole lengths and stratigraphic thicknesses. Although
the strata at the WIPP are quite unifonn in both composition and thickness, some variation
occurs.
Activities in 1992 and 1993 provided additional infonnation on the brine seepage in the
repository (Chapter 2.0), geochemical properties of the brine (Chapter 3.0), and additional
hydrologic testing (Chapter 4.0). This report supplements the summary of data through 1991
reported and discussed by Deal and others (1993).
Appendix A provides detailed infonnation of the brine seepage into drillholes monitored for
this program. The infonnation includes the name of the drillhole; the date and time of brine
collection or sampling; the volume (in liters) removed; the number of days since January 1,
1985 (an arbitrary reference date); the cumulative volume (L) collected; the inflow rates in L
per day, and specific remarks. Appendix B contains graphs of the data from Appendix A,
presented as an II-point moving average of the data. This averaging reduces variation
introduced by collection techniques and presents a more realistic picture of the real variations
in brine seepage rates than would be presented by plots of raw data. Appendix C documents
brine weeps observed in the AlS. Appendix D shows the results of the chemical analyses,
including ion concentrations in milligrams per liter (mgIL), pH, specific conductivity, and
alkalinity. Appendix E documents additional hydrologic testing of the fractured zone beneath
the floor of the WIPP excavations.
AUOI·95IWPIWIP/:R3192 1-7 301681.08

BRINE SAMPLING AND EVALUATION PROGRAM REPORT 1992·1993
THIS PAGE INTENTIONJ~LLY LEFT BLANK
INTRODUCTION
ALIOI-95IWPIWIP/:R3192 1-8 301681.08

BRINE SAMPLING AND EVALUATION PROGRAM REPORT 1992-1993 MONITORING OF BRINE INFLOW PARAMETERS
2.0 Monitoring of Brine Inflow Parameters
2.1 IntroductionBrine seepage observations have been made at underground locations at the WIPP from 1982
to December 31, 1993. Information regarding the inflow of brine was derived from
observations and mapping of moist areas and measurements of brine seeping into downholes,
upholes, and subhorizontal holes drilled from the underground excavation. The locations of
the 1992-1993 BSEP observation holes, along with other reference locations, are shown in
Figure 2-1. Descriptions and the underground locations of these boreholes are listed in Table
A-I of Appendix A. Part II of Appendix A lists the quantity of brine removed, calculated
inflow rates in liters per day, and cumulative volume in liters for all of the boreholes
monitored in 1992 and 1993.
2.2 Damp or Wet Areas on Drift FloorsA brine seep, GSEEP, on the floor of Room G, at approximately NI100-WI140, has been the
only persistently moist area in the WIPP excavations. Inflow data for GSEEP are contained
in Appendix A, with a smoothed, moving-average graph of the data presented in Appendix B.
A description of the location and a discussion of the brine chemistry and seepage history
through December 1990 are contained in Deal and others (1991b, Section 2.5), who conclude
that the brine from GSEEP has a component from brine spread in the G Access drift for salt
dust control. Note that although no construction water was spread at the location of GSEEP
in Room G, water was spread in the G Access Drift which is topographically higher (uphill)
of GSEEP. The seepage rate reached a maximum of 0.75 L per day in April 1989 but
declined to 0.03 L per day by December 1993. GSEEP had, for all practical purposes, dried
up by December 31, 1993. A total of 1,099 L have been collected, and a thick salt
encrustation on the floor indicates that more has evaporated into the air circulated through the
WIPP workings for ventilation.
2.3 Downholes and Brine Beneath the Floor
2.3.1 DownholesDownholes are drilled vertically downward into the repository floor. Deal and Case (1987,
Table 3-1) discussed brine inflow in 13 downholes, with" observations beginning in late 1984
and early 1985. A detailed discussion of sampling, data scattering, and inflow rates through
AU01·9SfWPfWIP/:R3192 2-1 301681.08

BRINE SAMPUNG AND EVALUATION PROGRAM REPORT 1992-93 MONITORING OF BRINE INFLOW PARAMETERS
DHP401DHP402A
Panel 3
Panel 2
Panel 4
Exhaust Shaft5-700
5-1000
DO[]][}OOm ~panel1
LJJI-j-l;;;r---Salt Handling Shaft
R4S -':C.==:
OH45 to OH47/
Air Intake Shaft
RoomQ===l
PanelS
Panel 6
Panel?
RSSHorizontal Holes OH23 to OH25
,----------------: .-1 ii I'i-I r-I --II I I I I I I I I I I I I
Panel 8 I 1 1 I 1 1 1 I 1 1 I I '1_:::~::_~:_~::_~:_~::_J;::=?;;::::;
Horizontal H~~~?-~~~~~-~~3..a-----~1 S DD;~:----_---------------,: --1 --I --I --I r--1 --1 I -. 1-- .-- ,-- 1-'" .-- ,-- I',I ',I ',I ',I ',', ',I ',', " " I I J I I I II I I II I II I II I I I I I I I I I I I I II I J; I: I: ;: II I I :1 II I. II: I I I I I : I I I I II 1__ 1_- 1_- 1_- 1__ 1__ L __J " ~__ _J L__J L_J L_I L_I L_J L_I __I I,--------------------------, ,---, ,-- --I ,--------------------------'
II II ::5-2520
.-----------------------__J L_J L__ _J L~~~!i~L--------------------,I --1 -, --I --I ...-, --1 r--' r--- r-- -- r---. 1-- 1-- 1-- ,-... ,-- 1-- II I ;1 II ;1 :1 ;1 I: II II II II I: I: I: I( I; I I: I I: ; I I: I: I: I I I; II II: I I; I I I; II I) I:I 1_- 1-- 1-- 1__ \__ 1__ L_J L __..J 1.__ _.I L_J ..._J __I __I __J __I ..._J I
L-------------------------ll--1 :-- -jr--- J
"" 115-3080
,.----------------------....__1L__JL__ _J L~UL--------------------,: --I --. --. --. ""-1 --I r--' r--- r-- -- r--. 1-- 1-- 1-- 1-'" 1-- 1-- :
: I II II II II II I I II:: II I I : I I: I: II I; I I11 I: (I I: II :1 I: II I; ;1: I : ; : I ; I : I : : ( ;I 1-- 1-_ 1__ 1__ \__ 1__ L 1 L__..J 1.__ _.I L__J __ I __I __I __J __I ..._J 1L ,~~~------- ------ J
5-3650
DH215
Horizontal Holes OH20 to OH22
BX01
C2 C1DH41 DH39 DH37 DH35 N·1420 MDH42 DH40 DH38 DH36
P4X84"' "''" D.. B Al A3 <0m iii
N·ll00
tA2
R2DH42A A1X01 A3X01 DH15AoorSeep A1X02
in Room G
o 400 800 FT! --.
o 100 200 m
1. Mine coordinates in feet from the centerof the salt handling shaft
2. Drift widths not to scale. enlarged 2Xfor clarity
Note
LegendCompleted Excavation 12/31/93
Planned Excavation
Drillhole(s) used for brine 0
Observation
Represents 2 or more drill ~
holes
Figure 2-1
Map of WIPP Underground Workings Showing BSEPObservation Locations as of December 31, 1993
301681 00900000119 A7 2-2 4113/95

BRINE SAMPLING AND EVALUATION PROGRAM REPORT 1992-1993 MONITORING OF BRINE INFLOW PARAMETERS
the end of 1990 is presented in Deal and others (1991b). Five of the ten downholes
monitored in 1993 showed steady inflow (A3X01, BX01, DH36, DH38, and DH40).
Downholes DH42 and DH42A showed a decrease in inflow rate as did DHP402A in Panel 1
and OH46 neither of which were included in the original 13 downholes drilled in 1984. Five
of the original 13 holes (A1X01, IG201, IG202, L1XOO, and NG252) could no longer be
observed. Table 2-1 summarizes the data obtained from the downholes, with additional
information presented in Appendix A.
Contamination with non-Salado water, used for construction purposes has been confIrmed in
most downholes by the chemical composition of the brine, which clearly indicates the mixing
of waters with discrete and different chemical signatures (Deal and others, 1989; 1991b;
1993). In some cases, inflow rates vary directly with known water-spreading practices. The
fIrst seven downholes in Table 2-1 are located in the northern part of the repository
(Figure 2-1), where water was not spread during construction; therefore, the brine collected
from these downholes was derived from within the Salado Formation. Brine chemistries from
these holes differ from chemical signatures associated with construction brines.
These seven downholes have a similar nine-year seepage pattern (Appendix B), although these
holes penetrate different stratigraphic horizons (Figure 2-2) and the seepage rates vary more
than two orders of magnitude. These holes were drilled into relatively undisturbed salt
shortly after excavation and then monitored. The following observations, fIrst made in 1986
(Deal and Case, 1987), have been confIrmed:
• Mter drilling a hole, a few days elapse where little or no brine seeps into thehole.
• After the initial no-flow or low-flow period, brine seepage quickly reaches amaximum and then begins to decline.
• Seepage rates decrease over a period of several months to steadier, long-termtrends.
Five of the downholes demonstrated a steady flow (within the scatter of the data points)
through 1993, though slightly decreased from past years, and four showed a decrease in
inflow.
AUOI·95IWPIW1P/:R3192 2-3 301681.08

BRINE SAMPLING AND EVALUATION PROGRAM REPORT 1992-1993 MONITORING OF BRINE INFLOW PARAMETERS
Table 2·'1
Brine Accumulation Summary
DownholesApprox. Approx. Approx. Total
Maximum Inflow Inflow Vol.Date Area Date Hole Date First Inflow 12/93 Trend Removed by
Hole Location Excavated Drilled Observed (UDay)a (UDay) 12/93b 12/93 (L)
A3X01 RoomA3 11/84 1/85 2/85 0.03 0.02 S 65SX01 RoomS 6/84 1/85 1/85 0.06 0.03 S 118DH36 RoomG 12/84 1/85 1/85 0.28 0.1 S 482DH38 RoomG 12/84 1/85 1/85 0.18 0.03 S 135DH40 RoomG 12/84 1/85 1/85 0.04 0.008 S 22DH42 RoomG 12/84 1/85 1/85 0.05 0.01 0 68DH42A RoomG 12/84 1/85 1/85 0.2 0.02 0 245DHP402A S1950/E1330 10/86 12/86 12/86 4.0 0.02 0 644OH46 S3901W320 5/89 6/89 7/89 0.04 0.005 0 21
UpholesApprox. Approx. Approx. Total
Maximum Inflow Inflow Vol.Date Area Date Hole Date First Inflow 12/93 Trend Removed by
Hole Location Excavated Drilled Observed (UDay)a (UDay) 12/93b 12/93 (L)
A1X02 Room A1 10/84 3/85 3/85 0.09 0 DRY 83DH15 N1104lE1688 3/84 3/84 5/86 0.01 0 DRY 4DH35 RoomG 12/84 1/85 2/85 0.02 0 DRY 4DH37 RoomG 12/84 1/85 2/85 0.01 0 DRY 1DH39 RoomG 12/84 1/85 2/85 Trace 0 DRY 0DH41 RoomG 12/84 1/85 2/85 Trace 0 DRY 0DH215 S1960/E153 1/83 2/83 4/84 0.09 0 DRY 18DHP401 S1950/E1330 10/86 1/87 3/87 0.008 0 DRY 2OH47 S3901W320 5/89 7/89 8/89 0.030 0 DRY 4
Subhorizontal HolesApprox. Approx. Approx. Total
Maximum Inflow Inflow Vol.Date Area Date Hole Date First Inflow 12/93 Trend Removed by
Hole Location Excavated Drilled Observed (UDay)a (UDay) 12/93b 12/93 (L)
OH20 S16001W170 9/85 3/89 3/89 0.02 0.005 S 16OH21 S16001W170 9/85 12/88 2/89 0 0 DRY 0OH22 S16001W170 9/85 12/88 2/89 0.006 0 DRY 1OH23 S19501W170 12/85 2/89 2/89 0.06 0.01 0 28OH24 S19501W170 12/85 3/89 3/89 0.002 0 DRY 1OH25 S19501W170 12/85 3/89 3/89 0.001 0 DRY 0.1OH26 S21501W170 8/86 3/89 3/89 0.04 0.01 0 27OH28 S21501W170 8/86 4/89 4/89 0.008 0 DRY 2OH45 S3901W325 5/89 6/89 6/89 0.03 0.003 S 7
aUters (L) per day.~rend derived from data presented in Appendices A and B-Dry; Decreasing (D); Steady (S).
AUOI-95/WPIWIP/:R3192 2-4 301681.08

DETAIL 1
CLAYI-I-u-wWJJiJJJJ.lJ~' 16.7ft(5.1m) ~::;:w:;:;:;:;:;t;;=~-CLAYI
ANHYDRITE 'a']-~~~~CLAYH ~ 6.1 ft(1.9m)
TypX:al4.9 m HighExperimental Room
~~~!WZiWl2~ - ANHYDRITE 'a'
ANHYDRITEb']-h.::m=mm~CLAY G t'" 0 REFERENCE DATUM ~~~~~~ - ANHYDRITE'b'
DETAIL2
ClAYF - _•••••,•••••,.-."...... -13.6 ft(-4.2m)CLAY F - ,-------~-------..
:-:-:-:-:-:-:-:-:-:-:-:-:-:-:-:-:-:-:-:-:-:-:-:-:-:-:-:-:-:-:-:-:-:-:-
ORANGE BAND]- :'::.:.:.:.:.:.:.:.:_: -16.7 ft(-5.0 m)
Room G 3 m High
ORANGE BAND-r.~~~~~~~~~!Q-:-:-:-:-:-:-:-:-:-:-:-:-:-:-:-:-:-:-:-:-:-:-:-:-:-:-:-:-:-:-:-:-:-:-:-
ANHYDRITEJMB-l39ClAYE
-26.4 ft (-8.0 m)
DOWNHOLESFROM NORTHEASTEXPERIMENTALAREA
CLAYD -1-----1 -34.6 ft (-10.6 m)DOWNHOLESFROM FACILITYLEVEL
EXPLANATION
-67.5 ft(-20.6 m)-
-63.5 ft (-19.4 m)- ----fDH38DH40DH42
~DHP402A
~l J
IDrill-Holes
-56.5 ft (-17.3 m)- DH42A
JA1X01A2X01
lBX01l A3X01)
IDrill-holes
HAUTE I IARGILLACEOUS HAUTE F:::::::::::::::::~
ANHYDRITE ~
-51.8 ft (-15.8 m)-51.5 ft (-15.7 m) -52.5 ft (-16.0 m)
70.5 ft (-21.5 m)72.8 ft (-222 m)
-------------------------_ .. _------------------
ANHYDRITE'C']-~~~~CLAYB
NOTE: Distances above and below anhydrite "b" (clay G) vary from place to place in the WIPP excavations dueto natural changes in stratigraphic thickness. This figure represents thicknesses in the northern part of the facility.Distances from clay E down are from Room G and from the orange band up are from Room A1.
Figure 2-2Correlation of the Stratigraphy to the Downholes
in the Northern Part of the Facility
301681 09/u; AS 2-5 4/13/95

BRINE SAMPLING AND EVALUATION PROGRAM REPORT 1992·1993 MONITORING OF BRINE INFLOW PARAMETERS
2.3.2 Shaft SumpsDeal and others (1991b, Section 2.7.1) discuss observations made in the Salt Shaft and Waste
Shaft sumps, where MB 139 and open fractures can be seen. The sumps were inspected
again in 1991 (Deal and others, 1993) and again in 1993. The fractures and MB 139 were
found to be dry and did not contain large quantities of salt encrustations. The shaft sumps
are, in effect, long-term far-field brine inflow experiments. If significant amounts of brine
were flowing toward the repository through MB 139, brine should be found in the shaft
sumps. The fact that brine is not observed seeping from MB 139 in the shafts is evidence
that significant far-field .flow does not exist.
2.4 Upholes and Brine Above the RoofUpho1es are drilled vertically upward into the repository roof. Upho1es characteristically
produce less brine for shorter periods of time than downho1es. Part of this can be attributed
to greater evaporation caused by less effective sealing of upho1es (Deal and Case, 1987) and
loss of moisture by dispersion from the hole collar into the salt. Loss of moisture by
evaporation is evident from salt-crust buildup in and around most of the upho1es. Chemical
data (Chapter 3.0 of this report; Deal and others, 1989, 1991a, and 1991b; Abitz and others,
1990) confmn compositional differences between brine samples from upho1es and downho1es,
which can be explained by the partial evaporation of a brine with typical downhole
composition to produce the upho1e brine. Although the stratigraphy exposed in the upho1es
(Figure 2-3) is slightly different from the stratigraphy exposed in the downho1es, it is unclear
whether this contributes significantly to the differences in either brine quantity or chemistry
(Deal and others, 1989).
Summary data for selected upho1es are presented in Table 2-1. None of the nine upho1es
listed in 1985 continue to produce brine (upho1es A2X02, A3X02, and BX02 are no longer
monitored). As discussed in Deal and others (1991b), AIX02 is longer than any of the other
upho1es (59 ft [18 m]) and intersects an additional anhydrite unit not penetrated by any other
upho1e. No associated clay was observed in the core, but clay commonly occurs below
anhydrite stringers and may be discontinuous at this horizon. Additional data are presented in
Appendix A. During 1992 and 1993, inflow data for AIX02 continues to be sporadic. The
hole is in Room AI, which is inaccessible. AIX02 has not been monitored since August 19,
1993.
AUOI-95/WP/W1P/:R3192 2-6 301681.08

BRINE SAMPLING AND EVALUATION PROGRAM REPORT 1992-93 DRILLHOLES
I
MONITORING OF BRINE INFLOW PARAMETERS
ANHYDRITEi'l-. ~~1?Z&i~6.1 It (1.9 m)CLA.Y.!:!J
ANHYD~@- tm:i!2Z2:i!2Z2:22Zj 0 REFERENCE DATUM
CLAYI - 1-----+ 16.7 It (5.1 m)
ANHYDRITE - f-----+71.71t(21.am)MB137
DRILL
HOfES
( )
J§rH-35DH-215DH-37DH-39
IDHP401
UPHOLES FROMFACILITY LEVEL
45.8 ft (14.0 m)
432 ft (132 m)
- ANHYDRITE 'b'
- ANHYDRITE 'a'
-CLAYI
.1 m) r-A1X02
.2m) ~A2X02
.6m) ~A3X02
.2m) ~BX02
UPHOLES FROMNORTHEASTEXPERIMENTALAREA
DETAIL 1
1YPICAL 4.9 m HIGHEXPERIMENTAL ROOM
75.9 It (23
69.7 It (2167.7 It (2066.2 It (20
21.a It (6.6 m)
51.alt(15.am)
-----------------------------------..-..-..-..-..-..-..-..-..-..-CLAYJ-
CLAY L - ""'::=:~=:::=:~=:::=:::.",:::=-=::+ 40.7 It (12.4 m)------..-..-..-..-..-..-..-..-:=:=:=:=:=:=:=:=:=:=:=--------:_--~--
CLAYM-1 -
AN~~ 1-:_:-_:_-:_:-_:_:--:_-:_:-_:_+ 64.0 It (19.5 m).---------------------
CLAYM·2 - 1----+ 59.alt(1a.2m)
ANHY~::r- I:-:-:-"",:-::'::-:-':"::-:-,=,,::::,::-::,:,,::-:~ 28.6 It (a.7 m)CLAY K --------------~--
DETAIL2CLAY F - ~__:;_:::_":":__:-;;"__:;_:::_":":__:".::'_:I_ -0.6 It (-2.0m)
ORANGEB~ ~grto.rt.12.61t(.3.am)=:=:=:=:=:=:=:=:=:=:=:
CLAY F - ~---~~~-~---w-~j-~_'!'.OJ-~_-_-_-~_-_-_-_-_-~----------------------------------ORANGE BAND - !~~:~
ANHYDR~EMB-139CLAY E
-26.4 It (-8.0 m)EXPLANATION
HAUTE I IARGILLACEOUS HAUTE ~::::::::::::::::3
ANHYDRITE ~
NOTE: Distances above and below anhydrite "b" (day G) vary from place to place in the WIPP excavations due to natural changesin stratigraphic thickness. This figure represents thicknesses in the northern part of the facility. Distances belowthezero datum (day G) are from Room G, distances above day G are from Room A1.
Figure 2-3Correlation of the Stratigraphy to the Upholes
in the Northern Part of the Facility
2-7301681 09/19 A39 4/13195

BRINE SAMPLING AND EVALUATION PROGRAM REPORT 1992·1993 MONITORING OF BRINE INFLOW PARAMETERS
Drillholes in the roof that intersect overlying clay layers (clays J and K and argillaceous halite
between the two clays), including those for the placement of rock bolts, commonly drip brine
for a period of several months, often forming halite stalactites. Seepage is particularly
notable when the drifts are allowed to age for several years, allowin~ bed separations to form
prior to drilling.
The undisturbed roof of the workings at the WIPP rarely shows evidence of brine seeps or
weeps (Deal and others, 1987, Section 2.2). Drill holes provide a route for brine to move
across effectively impermeable clear halite beds, and seepage from drillholes in the roof is a
common occurrence at the WIPP. Typically upholes start to show evidence of brine seepage
a month or so after drilling, exhibit their most active seepage for the following year or so,
and then gradually dry up. Rooms Cl and C2 show this very typical behavior (Deal and
others, 1991b, Section 2.8.1).
2.5 Subhorizontal HolesSubhorizontal brine sampling holes are drilled at a slight downward angle. During 1989,
11 subhorizontal holes were drilled to investigate brine seepage from the WIPP facility
stratigraphic horizon. The holes were oriented slightly downward from the opening to
accumulate brine at the end of the hole where it could be collected and measured without loss
to fractures near the surface of excavations. Ten of the eleven holes were drilled westward
from the W170 drift at the location of future entries to Panels 7 and 8 at S1600, S1950, and
S2180 (Figure 2-1). These portions of the W170 were excavated in September 1985 at
S1600, in December 1985 at S1950, and in August 1986 at S2180 and are considered to have
a mature DRZ around them. Three of the holes (OH20, 0H23, and OH26), which are 150 ft
(46 m) long and 3 in. (7.6 centimeters [em]) in diameter, started in the clayey halite (Map
Unit 4) above the orange band (Map Unit 1) and are deflected slightly downward (Deal and
others, 1993, Figures 2-18, 2-19, and 2-20), so that they end in the clear halite (Map Unit 0)
below the orange band. The 150-ft (46-m) holes reached the orange band about 50 ft (I5 m)
into the holes. Hole OH27A was started at the initial location for OH27 but was terminated
at a depth of 4 ft (1.2 m) because of drilling problems. The six remaining 50-ft (15-m) holes
were drilled either above or below the orange band. One 50-ft (I5-m) hole (OH45), which
cuts the same stratigraphic interval as the three 150-ft (46-m) holes, was drilled in a newer
excavation in May 1989 at S400.
AUOI -95IWPIWIP/:R3192 2-8 301681.08

BRINE SAMPLING AND EVALUATION PROGRAM REPORT 1992-1993 MONITORING OF BRINE INFLOW PARAMETERS
Several of these holes have produced measurable quantities of brine (Table 2-1, Appendix A).
The l50-ft (46-m) holes provide the most uniform and comparable set of measurements yet
obtained in the BSEP and have all produced several orders of magnitude more brine than the
50-ft (15-m) holes. The longer holes are still producing, while the shorter holes are
essentially dry (Le., they have not produced enough brine to be measured by the equipment
and techniques used), with the exception of OH45. OH45 is a 50-ft (15-m) hole that cuts the
same stratigraphic interval as the l50-ft (46-m) longer holes but that was drilled in a more
recently mined area at S400, over 1,000 ft (300 m) north of OH20, OH23, and OH26.
Lateral variation may play a minor role in the difference in brine seepage. This is considered
to be unlikely, as Deal and others (1989) found no significant lateral variation in moisture
content for any of the stratigraphic units exposed in the excavations.
Two explanations have been offered for the brine seepage observations (Deal and others,
1991b, Section 2.9): (1) The longer holes are tapping an area that is not dewatered, because
they extend past the relatively old W170 drift DRZ. As a result, they may only tap about
100 ft (30 m) of undisturbed salt (in this case, the one 50-ft (15-m) hole would still produce
brine, because it was drilled from a young excavation where a significant DRZ had not yet
developed), and (2) Brine flows preferentially from the clay units, so the clay at the top and
bottom of the orange band may be the only significant source of brine. Therefore, only the
four holes (OH20, OH23, 0H26, and OH45) that cut the orange band accumulate brine.
Evidence presented in this report suggests that the second explanation is the more likely one.
2.6 Air Intake ShaftThe Air Intake Shaft (AlS) was inspected for evidence of brine inflow. The entire length of
the shaft was viewed from the man cage, and photographs were taken of various intervals.
Evidence of weep was noted, mainly in the form of salt encrustations. Appendix C provides
details of the AIS inspection and includes photographs of some of the weep surfaces.
Salt encrustations, or weeps, are more common at depths below 1,500 ft, about the midpoint
of the Salado Formation exposed within the AlS. Many of the weeps are stratigraphically
controlled by beddi,ng plains, as indicated by encrustations at single horizons. Most of the
zones of weeping are associated with argillaceous halite; however, some weeps occur at the
claystones underlying sulfate marker beds. There are few weeps within the purer halite beds
deposited subaqueously, and only one wet surface (MB 103) was observed.
AUOI-95fWPfWIP/:R3192 2-9 301681.08

BRINE SAMPLING AND EVALUATION PROGRAM REPORT 1992-1993 MONITORING OF BRINE INFLOW PARAMETERS
The anhydrite surfaces are typically dry and free of salt encrustations, indicating that no
significant amount of brine flows through them to the shaft.
2.7 Discussion of Data Acquisition and An~/ysis
Several different sampling techniques have been used in an attempt to uniformly collect the
very small amounts of brine that seep into the hole between sampling rounds; each technique
has unique problems. The change in sampling methods and difficulties in sampling
techniques was discussed in detail by Deal and others (199Ib) and is sometimes reflected as
apparent variations in seepage rates (Appendix B).
To compensate for sampling-induced apparent variations in seepage rates, the graphs of the
seepage data presented in Appendix B have been smoothed using an II-point moving average
(the average of the data point and the five points on each side of the data point). At the
beginning and end of each curve, the trend is distorted by the smoothing function, because the
eleven point moving average reduces to a 9, 7, 5, 3 average and actual data point on both
ends of the curve for a more accurate graphical representation of the seepage trends. There
are slight differences between the curves presented in this report and in previous BSEP
reports, because a different software package was used to create the plots.
AUOI-95fWPfWIP/:R3192 2-10 301681.08

BRINE SAMPLING AND EVALUATION PROGRAM REPORT Im·I993 STATISTICAL ANALYSIS OF THE BSEP BRINES
3.0 Statistical Analysis of the BSEP Brines
3.1 IntroductionA major objective of the BSEP has been to characterize the composition of brine that seeps
into the WIPP excavations from the Salado Formation. Statistical analysis of BSEP
geochemical data has been used to approximate the chemistry of typical Salado Formation
brine that may come into contact with waste after closure of the WIPP repository. The
analysis of BSEP brine compositions contained here updates previously analysis (Deal and
others 1989, 1991a, 1991b, and 1993).
The geochemistry of brines recovered from the WIPP repository horizon have been the
subject of numerous studies (Stein and Krumhansl, 1986; Krumhansl and Stockman, 1987;
Stein and Krumhansl, 1988; Deal and others 1989; Abitz and others, 1990; Krumbansl and
others, 1991; Deal and others, 1991b; Deal and others, 1993). Both the major and trace
element compositions of the WIPP brines suggest that the brine originated from evaporating
seawater, as substantiated by the high magnesium, potassiu~, and bromine content of the
brines, which differs from the composition of a brine formed by dissolving the Salado
evaporites in infiltrating groundwater (Deal and others, 1991b). The brine chemistry indicates
that seawater has precipitated carbonate minerals, anhydrite, and halite and has been further
modified by diagenetic reactions with gypsum, magnesite, polyhalite, and clay minerals. The
major-element compositions of brines recovered from BSEP holes are distinct from fluid
inclusion in WIPP halite (Stein and Krumhansl, 1988), implying that the brine recovered from
the drillholes is mostly intergranular fluid, rather than fluid released by migration of fluid
inclusions to grain boundaries in response to stress relief.
During 1992, 40 brine samples were recovered from 18 drillholes in the Salado Formation at
the repository horizon. These brine samples were analyzed for up to 27 chemical parameters
by Rust Geotech (formerly UNC Geotech of Grand Junction, Colorado). Brine chemistry data
for all samples collected from 1987 to 1992 are tabulated in Appendix D.
The statistical analysis of BSEP brine compositions includes a measure of the central
tendency of each measured parameter for each drillhole. In order to calculate a central
tendency, such as a mean or a median, the following issues were considered:
AU01-95fWPfWIP/:R3192 3-1 301681.08

BRINE SAMPLING AND EVALUATION PROGRAM REPORT 1992-1993 STATISTICAL ANALYSIS OF THE BSEP BRINES
• Evaluation of data sources• Analysis of data for the presence of temporal trends• Handling of duplicate analysis• Detennination of the type of statistical distributions• Handling of values less than the detection limit of the laboratory equipment• Rejection of outliers.
The statistical analysis also includes the calculation of an average brine chemistry for the
repository horizon. This average brine chemistry was detennined by grouping data together
from drillholes that sample brine from below and within the repository horizon. Data were
tested using an analysis-of-variance calculation to detennine if it is statistically valid to group
the analyses from different drillholes together.
3.2 Sources of DataBSEP brine samples have been collected over five years from several drillholes at various
locations in the underground. Many of the drillholes discussed in previous BSEP reports are
no longer producing brine, and some new holes were added to sampling locations. Only
drillholes that produced a significant volume of brine since sampling began in 1987 are
considered in these calculations. Additionally, some BSEP drillholes have been contaminated
by water spread for dust control and floor consolidation. This report only discusses data from
those drillholes that were not considered to have been contaminated with waters used for dust
control (spread waters), drilling fluids, or synthetic brine used in Room J. These drillholes,
sampled in 1992, are located in areas where contaminating brines have not been spread
(Rooms AI, A2, A3, B, and G) or in subhorizontal holes located where water spread on
floors could not enter them (Table 3-1).
Only geochemical data from Rust Geotech were used in the statistical analysis. Previous
sampling rounds were analyzed by both Rust Geotech and IT analytical laboratories.
Comparisons of geochemical data analyzed by these two laboratories are misleading, because
differences in laboratory technique produce slightly different values for parameters analyzed
(Deal and others, 1991b).
3.3 Temporal TrendsIn order to perfonn a statistical analysis of the brine compositions, it was necessary to first
determine if brine chemistry changes as a function of time. Changes in brine chemistry with
AIJOI-95fWPfWIP/:R3192 3-2 301681.08

BRINE SAMPLING AND EVALUATION PROGRAM REPORT 1992-1993 STATISTICAL ANALYSIS OF TIlE BSEP BRINES
Table 3·1
BSEP Drillholes Sampled for Brine between 1987 and 1993
I Downholes ,I Suspecta Downholes I Upholes I Subhorizontal Holes IA1X01* DH28 A1X02 OH20
A2X01* DH30 OH47 OH23*
A3X01* DH32 OH26*
BX01* DH34 OH45*
DH36* DHP402A
DH38* G090
DH40 GSEEP
DH42* H090
DH42A* L1XOO
NG252 OH62
OH46 OH63
OH66
OH67 ..0
aSuspect holes may be contaminated with water spread on drift floor for construction purposes.*Drillholes used for statistical analysis.
time may indicate that physical processes such as evaporation or mixing are occurring. Brine
chemistry affected by these processes may not be reflective of in situ conditions.
Chemical parameters that are nonsolubility-constrained (i.e., not controlled by precipitation of
evaporite minerals) will behave similarly when evaporation occurs and will become
concentrated in the brine. Likewise, mixing of brine with spread waters will also change the
concentration of the nonsolubility constrained parameters with time. These include boron,
bromide, magnesium, and potassium. Parameters that are controlled by solubility and
precipitate with evaporite minerals included sodium, chloride, calcium, and sulfate.
Temporal trends were analyzed by plotting the concentration data against the sampling date
for the downholes, upholes, and subhorizontal holes. No temporal trends were evident for
nonsolubility-constrained parameters from the downholes and the subhorizontal holes. Thus,
brine from downholes and subhorizontal holes have not been evaporated or mixed with other
AUOI·95IWPIWIP/:R3192 3-3 301681.08

BRINE SAMPLING AND EVALUATION PROGRAM REPORT 1992-1993 STATISTICAL ANALYSIS OF THE BSEP BRINES
waters. However, Figure 3-1 shows that uphole AIX02 is affected by evaporation.
Magnesium, boron, and bromine display similar changes in concentration with time.
Concentrations for these elements in uphole A2XO1 all increase and decrease in the same
samples. Concentrations of potassium, however, arle not similar to magnesium, boron, and
bromine in the latest sampling rounds. This suggests that perhaps some potassium is
substituting into halite, which is precipitating from the brine during evaporation. Because
magnesium, boron, and bromine have similar changes in concentrations with time and because
the ratio of these parameters with each other is constant with time, brine from uphole AIX02
has undergone various amounts of evaporation between sampling events. It has been
previously suspected that partial evaporation has altered the concentrations in the upholes
(Deal and others, 1991b).
3.4 Duplicate AnalysisIn order to measure the concentration of dissolved constituents in brine samples from the
repository horizon, it was necessary for the analytical laboratories to dilute the samples.
Because dilution factors were high ,for the BSEP brines, measurement errors sometimes
occurred, particularly in earlier sampling rounds. Consequently, duplicate analyses were
performed on the brine samples. Duplicate analyses were used to identify analytical errors
and to indicate how precisely the concentrations can be measured.
For the purposes of the statistical analysis, the concentration values for duplicate analyses
were averaged. If one of the duplicate samples was obviously erroneous (i.e., an obvious data
outlier), then only the single best value of the duplicates was included. Additionally, if one
of the duplicates had a value below detection limits and the other duplicate had a detectable
concentration, then only the detected value was chosen for statistics.
3.5 Determination of Statistical DistributiolJs
The fIrst step in data analysis is to determine the distribution of each data set. In this case, a
data set would consist of all data collected for a particular parameter in a particular drillhole.
The specifIc statistical procedure used to analyze the data and the methods used to identify
outliers are dependent on the assumed distributions of the data sets. If a data set was
determined to be normally distributed, then a mean and a standard deviation were calculated.
If a data set was not normal, then nonparametric techniques were used. For the purposes of
this report, the term "nonparametric techniques" refer to statistical procedures that do not
AUOI-95fWPfWIPf:R3192 3-4 301681.08

B Concentration vs Time5000 r-----r---.-..--.,----r----,;----r-.....,...-,----,
4500
4000
_ 3500?2E3000co=e 2500cGO
l!2000oo
1500
1000
500
Ol----L_-I-_..I-_L...----L_-I-_..I-_L...----L_...J
8/11/87 2/27/88 9/14/88 4/2/89 10/19/89 5f7/9O 11/23/90 6/11/9112/28/91 7/15/92 1/31/93
Date
Mg Concentration vs Time9000 r---r---.---,--..,.--..----,;----r-.....,..---r-----,
8000
7000
~ 6000CD.5.g 5000
~~ 4000ucoo 3000
2000
1000
Ol----L_-I-_..I-_L...----L_-I-_..I-_L...----L_...J
8/11/87 2/27/88 9/14/88 4/2/89 10/19/89 5f7/9O 11/23/90 6/11/9112/28/91 7/15/92 1/31/93
Date
Br Concentration vs Time7000 r----r---.-..--.....---r----,---r--,--,----,
6000
5000Cl...0;
.5. 4000co
~~3000ucoo
2000
1000
01----L_.....L.._...l-_.L...---l._.....L.._...l-_.L...----L_....I
8/11/87 2/27/88 9/14/88 4/2/89 10/19/89 5[7f9O 11/23/90 6/11/9112/28/91 7/15/92 1/31/93
Date
K Concentration vs Time3Oooo...---r---r---,--..,.--..----,---r-.....,..---r-----,
25000
~200000;
.5.co=e 15000'EGOUCoo 10000
5000
OL.----l_--L._-I-_...l-_.l..----IL...----L_....J..._....L.----l
8/11/87 2/27/88 9/14/88 4/2/89 10/19/89 5[7f9O 11/23/90 6/11/9112/2&191 7/15/92 1/31/93
Date
301681.09/20 A3
Figure 3-1Uphole A1X02 Concentration VS. Time
for B, Br, Mg, and K
3-5 4/13195

BRINE SAMPLING AND EVALUATION PROGRAM REPORT 1992-1993 STATISTICAL ANALYSIS OF THE BSEP BRINES
require the data to fit any particular distribution. Only a median was reported for a
nonparametric data set.
For each drillhole, 27 parameters were analyzed. Thus, there are 27 data sets for each
drillhole, and there are 11 drillholes that were considered in this statistical analysis
(Table 3-1) for a total of 297 data sets. Because there are so many data sets, it was
impractical to test each one for normality. Consequently, only the nonsolubility-constrained
parameters (boron, bromine, magnesium, and potassium) were tested for normality.
A Kolmogorov-Smirnov statistical test (Kennedy and Neville, 1986) for the 95 percent
confidence level was applied to the data from each drillhole (Table 3-1) for each
nonsolubility-constrained parameter to test for normality. This statistical test determines how
well a set of observations fit a theoretical normal distribution by calculating the maximum
distance between the cumulative distribution functions of the sample and the theoretical
normal distribution. If the distance is too large, the hypothesis that the theoretical distribution
fits the observed distribution is rejected. In all cases, the geochemical data collected from
1987 to 1993 for each nonsolubility-constrained parameter in each drillhole were normally
distributed. After it was determined that the data from nonsolubility-constrained parameters
were normally distributed, it was assumed that data. sets for other parameters were also
normally distributed.
Because each data set was not rigorously tested to determine if it was normally distributed,
the coefficient of variation was also calculated for each data set assumed to be normal.
The coefficient of variation (V) is defined by Kennedy and Neville (1986) as:
V = SIX * 100
where
S = Population standard deviation
X = Population mean.
The coefficient of variation expresses the dispersion of samples on a percentage basis. If the
coefficient of variation is larger than approximately 10 percent, the assumption of normality
for that particular data set is questionable. Thus, data sets with a coefficient of variation
larger than 10 percent were tested for normality using the Kolmogorov-Smirnov test described
above. If a data set had a large coefficient of variation and did not pass the Kolmogorov-
AUOI-9Sf\VPIWIP/:R3192 3-6 301681.08
BRINE SAMPLING AND EVALUATION PROGRAM REPORT 1992-1993 STATISTICAL ANALYSIS OF THE BSEP BRINES
Smirnov test at the 95 percent confidence level, the distribution was assumed to be
nonparametric, and only a median was reported.
3.6 Handling of ValuesA certain proportion of the values presented in this report were reported as being below the
detection limits of the analytical equipment. The u.s. Environmental Protection Agency
(EPA) guidance (EPA, 1989 [EPA/530-SW-89-026]) for dealing with such values was used for
this report. If the data set was nonnal and if less than 15 percent of the values were below
detection limits, the nondetected values were replaced with a value equal to one half of the
detection limit, and a mean and a standard deviation were calculated. This approach should
not have introduced a large bias, because the proportion of nondetected values was low, and
the difference between the detection limit and zero is small using modem analytical methods.
If the percentage of nondetected values were greater than 15 percent of the data set, those
values were replaced with one half of the detection limit, and a median was calculated. The
percentage of those values below the detection limit was also reported. Some of the data sets
contain older data points that have considerably higher detection limits than more recent data.
In fact, the detection limits for some older below-detection-limit data points are higher than
the median of the population. These "high nondetect" data points were deleted from the data
sets because they did not add any additional infonnation and because including them with an
arbitrarily assigned value of one half the detection limit would have added a bias to the
calculated median. "-
3.7 Rejection of OutliersOutliers are data points whose values are anomalously high or low in relation to the rest of
the data set. The following are possible reasons for outliers:
• Improper sampling, analytical error, or laboratory contamination• Errors in transcription of data values, decimal points, or units• The presence of foreign substances or contamination in the sample• A true natural value that is unusually high.
Each data set that was assumed to be nonnally distributed was screened for outliers using the
EPA-r~commended technique (EPA, 1989 [EPA/530-SW-89-026]), which is based on
American Society for Testing and Materials (ASTM) Procedure EI78-80. This procedure
determines if there is statistical evidence that an observation which appears extreme does not
AUOI-95IWPIWIP/:R3192 3-7 301681.08

BRINE SAMPLING AND EVALUATION PROGRAM REPORT 1992·1993 STATISTICAL ANALYSIS OF THE BSEP BRINES
fit the distribution of the rest of the data. The procedure calculates the statistic Tn' which is
defined as:
Tn = (~- X)/S
where
~ = Observation
X = Population mean
S = Population standard deviation.
The calculated Tn value is then compared to a table of one-sided critical values for the
appropriate significance level (upper 5 percent) and sample size (a suitable table is provided
in EPA, 1989 [EPA/530-SW-89-026]). The Tn statistic differs from the standard "t" critical
value distribution in that the Tn statistic is calculated from the entire population, including the
suspected outliers. The standard "t" critical values are used to determine if a new sample
value (not yet included in the population statistics) is an outlier.
If the Tn value for the suspect data is greater than the critical value from the table, then there
is evidence that the value is a statistical outlier. Because of symmetry considerations, the
above equation can be applied to a suspected minimum outlier value by taking the absolute
value of Tn equation and comparing it with the tabulated values. Both minimum and
maximum suspected outliers can be screened from the data sets.
The specific procedure used in this investigation for the identification of outliers is as follows:
• Normal data sets. Calculate a mean and standard deviation. Calculate a Tnstatistic and compare to the table. If outliers are confirmed, delete them fromthe data set and recalculate the mean standard deviation.
• Nonparametric data sets. The screening using the Tn statistic is not applied.The Tn procedure described above is based on an assumption of a normaldistribution in which one can calculate the probability of a given value being amember of a population. NonparametTic data sets are not predictable in thissense.
For all data sets that were assumed to be normal, outliers (if present) were removed from the
data sets, and the average and the standard deviation for each parameter were calculated. If a
data set was nonparametric, the median, the number of nondetects, and the percentage of
AUOI-95IWPIWIP/:R3192 3-8 301681.08

BRINE SAMPLING AND EVALUATION PROGRAM REPORT 1992-1993 STATISTICAL ANALYSIS OF THE BSEP BRINES
nondetects was determined. Values of the mean or median and standard'deviation for each
drillhole are given in Table 3-2.
3.8 Average Brine ChemistryAn average brine chemistry was determined by grouping data together from drillholes used to
sample brine from the repository horizon. To check the validity of grouping these drillholes
together, a one-way analysis of variance (ANOVA) calculation was performed.
Drillholes were separated into two different groupings, based upon whether or not they
sampled stratigraphy within the repository horizon. One group consisted of drillholes DH36,
DH38, DH42, and DH42A. These drillholes are used to sample brine encountered only in
stratigraphy beneath the repository horizon. The second group consisted of drillholes AIXOl,
A2XOl, A3XOl, BXOl, OH23, 0H26, and OH45. These drillholes are used to sample brine
encountered in stratigraphy within and below the repository horizon and are the most
representative of overall repository brine chemistry. Figure 2-3 shows the stratigraphic
locations of the down holes. The subhorizontal holes start just above the orange band
(Figure 2-2, Detail 2) and end below it, just above the floor of the drift. The subhorizontal
holes are primarily to sample brine from the clays above and below the orange band.
A one-way ANOVA was performed for each of the nonsolubility-limited parameters (boron,
bromine, potassium, and magnesium) to determine if the data for a particular parameter from
the drillholes in their respective groupings were part of the same statistical population.
ANOVA is a general method in which the total statistical variation in a set of data is
considered in order to simultaneously test the differences between subpopulation means at a
certain confidence level to determine if the subpopulations can be grouped. In this case, the
subpopulation means consisted of a given parameter from each evaluated drillhole (listed in
Table 3-2). The ANOVA calculation was performed for the 95 percent confidence level.
ANOVA calculations performed on the combined data from drillholes AIXOl, A2XOl,
A3XOl, BXOl, OH23, OH26, and OH45 showed that analyses for boron, broinine, and
potassium are members of the same population (i.e., they have significance at the 95 percent
confidence level). Magnesium analyses for these drillholes did not have significance at the
95 percent confidence level. It is unclear why magnesium failed the ANOVA test for
AUOI-95IWPIWIP/:R3192 3-9 301681.08

BRINE SAMPLING AND EVALUATION PROGRAM REPORT 1992-1993 STATISTICAL ANALYSIS OF THE BSEP BRINES
Table 3·;~
Simple Statistics for EISEP Analyses(in mg/L)
Downhole Ai X01
II~Downhole A2X01 I
N X S Median No. ND %ND X I~ Median INo. ND I% ND
SG 14 1.23 0.01 SG 13 1.23 0.01
TDS 13* 376000 10000 TDS 12* 400,000 8000
pH 14 6.1 pH 12* 6.1
ALK 14 980 33 ALK 13 989 88
TIC 13* 5.6 4.5 TIC 13 26.4 26.7
TOC 12 22 20 TOC 10 53 49
Sr- 14 1500 60 Sr- 1;2* 1510 40
CI- 14 193000 2000 CI- 12* 200,000 2000
F- 14 6 1 F- 13 7 1
1- 14 14.6 2.6 1- 13 13.5 1.0
NH/ 14 150 13 NH/ 12* 148 10
N03- 10 0.8 3 30 N03- 9 0.8 3 33
P 8 <0.1 7 88 P 7 <0.1 6 86
S04-2 14 17500 600 S04-2 13 17300 1000
AI 13* 0.18 0.16 AI 12 0.13 2 17
As 13* 0.003 0.004 As 13 <0.001 8 62
S 14 1460 110 S 13 1430 100
Sa 13* 0.03 0.02 Sa 13 0.07 0.04
Ca 13* 265 32 Ca 13 290 49
Cs 9 0.36 0.04 Cs 7 0.37 0.04
Fe 14 <0.5 8 57 Fe 13 17.1 16.3
K 14 15900 800 K 12* 16100 500
Mg 14 23300 1000 Mg 13 23100 1700
Mn 14 1.6 0.2 Mn 13 1.8 0.1
Na 14 79000 2000 Na 12* 78700 2300
Rb 5 16.5 1.2 Rb 3 16.1 1.5
Si 13* 1.4 0.4 SI 13 1.5 1.2
Sr 13* 1.7 0.1 Sr 12* 1.0 0.2
*Outlier values omitted in statistical calculations.N = Number of samples.X= Mean.S = Standard deviation.
ND = Not detected.
AUOI-95IWPIWIP/:R3192 3-10 301681.08

BRINE SAMPLING AND EVALUATION PROGRAM REPORT 1992-1993 STATISTICAL ANALYSIS OF THE BSEP BRINES
Table 3·2 (Continued)
Simple Statistics for BSEP Analyses(in mg/L)
Downhole A3X01
~Downhol. BX01 I
N X S Median No. ND %ND X I~ Median INo. ND I% ND
SG 18 1.22 0.01 SG 17 1.22 0.01I
TDS 17* 374000 14000 TDS 16* 400,000 12000
pH 17* 6.1 pH 17 6
ALK 18 980 41 ALK 17 873 31
TIC 18 4.8 1 6 TIC 16* 7.1 7.2
TOC 14* 29 17 TOC 14 27 19
Sr- 18 1490 70 Sr- 17 1470 60
CI- 18 192000 5000 Ct- 17 200,000 4000
F· 18 7 1 F- 16* 7 1
I- 17* 14.2 2.8 (- 17 14.0 1.6
NH/ 18 150 17 NH/ 17 150 15
NOs" 14 0.7 4 29 NOs- 15 0.7 5 33
P 14 <0.1 13 93 P 11 <0.1 11 100
S04-2 18 16900 900 S04-2 17 17100 700
AI 18 0.08 8 44 AI 17 0.08 6 35
As 18 0.002 4 22 As 16* 0.002 0.001
S 18 1490 120 B 17 1470 100
Sa 18 0.05 0.02 Sa 17 0.04 0.02
Ca 18 273 32 Ca 17 270 23
Cs 13 0.36 0.03 Cs 12 0.34 0.04
Fe 18 <0.5 10 56 Fe 17 0.7 8 47
K 18 15700 800 K 17 16100 800
Mg 18 23200 1300 Mg 17 22500 1100
Mn 18 1.5 0.1 Mn 16* 1.3 0.2
Na 17* 78300 2000 Na 17 79800 1700
Rb 8* 15.9 0.6 Rb 8 15.8 1.0
Sl 17* 1.7 0.3 Si 16* 1.6 0.8
Sr 17* 1.9 0.2 Sr 17 2.0 0.2
*Outller values omitted in statistical calculations.N = Number of samples.X = Mean.S = Standard deviation.
ND = Not detected.
AUOI-95fWPfWIP/:R3192 3-11 301681.08
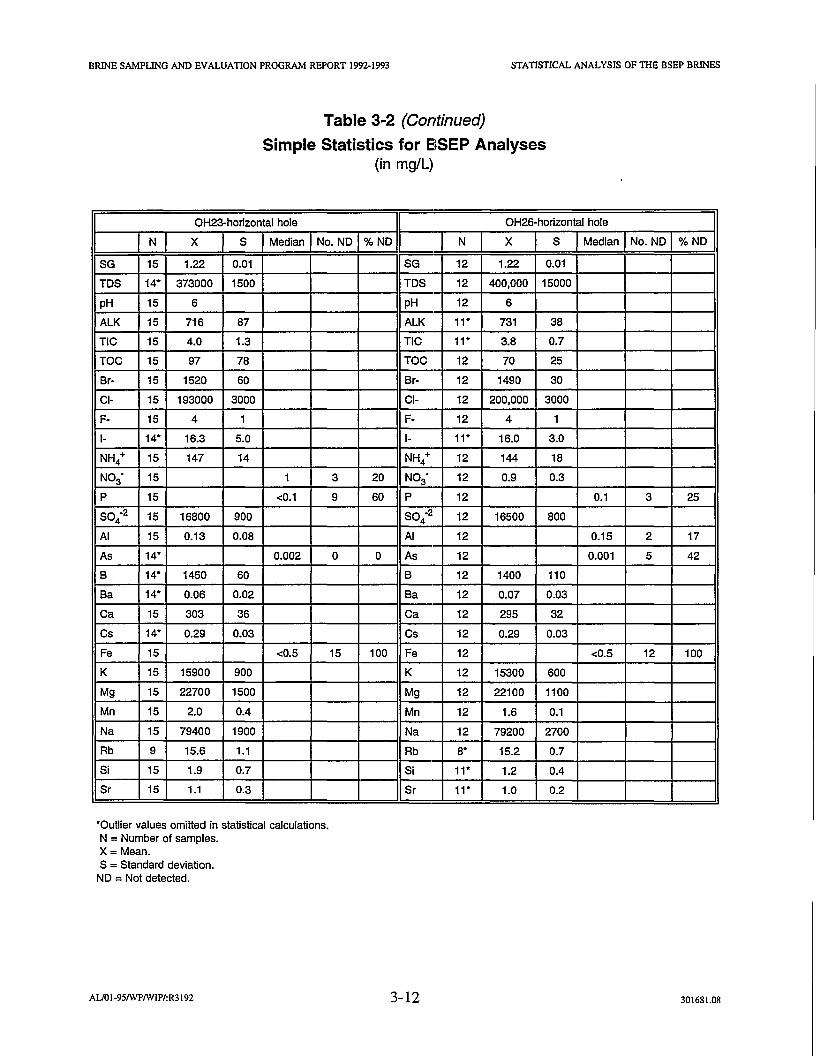
BRINE SAMPLING AND EVALUATION PROGRAM REPORT 1992-1993 STATISTICAL ANALYSIS OFTIIE BSEP BRINES
Table 3·2 (Continued)
Simple Statistics for EISEP Analyses(in mg/L)
OH23-horizontal hole OH26-horizontal hole
N X S Median No. NO %NO N X S Median No. NO %NO
SG 15 1.22 0.01 SG 12 1.22 0.01
TOS 14* 373000 1500 TOS 12 400,000 15000
pH 15 6 pH 12 6
ALK 15 716 87 ALK 11* 731 38
TIC 15 4.0 1.3 TIC 11* 3.8 0.7
TOC 15 97 78 TOC 12 70 25
Sr- 15 1520 60 Sr- 12 1490 30
CI- 15 193000 3000 CI- 12 200,000 3000
F- 15 4 1 F- 12 4 1
1- 14* 16.3 5.0 1- 11* 16.0 3.0
NH4+ 15 147 14 NH/ 12 144 18
N03- 15 1 3 20 N03- 12 0.9 0.3
P 15 <0.1 9 60 P 12 0.1 3 25
S04-2 15 16800 900 SO -2 12 16500 8004
AI 15 0.13 0.08 AI 12 0.15 2 17
As 14- 0.002 0 0 As 12 0.001 5 42
S 14* 1450 60 S 12 1400 110
Sa 14* 0.06 0.02 Sa 12 0.07 0.03
Ca 15 303 36 Ca 12 295 32
Cs 14* 0.29 0.03 Cs 12 0.29 0.03
Fe 15 <0.5 15 100 Fe 12 <0.5 12 100
K 15 15900 900 K 12 15300 600
Mg 15 22700 1500 Mg 12 22100 1100
Mn 15 2.0 0.4 Mn 12 1.6 0.1
Na 15 79400 1900 Na 12 79200 2700
Rb 9 15.6 1.1 Rb 8* 15.2 0.7
Si 15 1.9 0.7 Si 11* 1.2 0.4
Sr 15 1.1 0.3 Sr 11- 1.0 0.2
-Outlier values omitted in statistical calculations.N =Number of samples.X = Mean.S = Standard deviation.
NO =Not detected.
AUOI-95IWPIW1P/:R3192 3-12 301681.08

BRINE SAMPLING AND EVALUATION PROGRAM REPORT 1992-1993 STATISTICAL ANALYSIS OF TIlE BSEP BRINES
Table 3-2 (Continued)
Simple Statistics for BSEP Analyses(in mglL)
OH45·horizontal hole
%ND IDownhole DH36 I
N X S Median No. NO 0 X I~ Median INo. NO I% NO
SG 6* 1.22 0.01 SG 20 1.22 0.01
TOS 6* 372000 14000 TOS 20 400,000 10000
pH 7 6.2 pH 19* 6.1
ALK 6* 856 50 ALK 19* 843 17
TIC 7 5.5 2.4 TIC 18 5.2 0 0
TOC 7 91 28 TOC 15 23 17
Br- 6* 1550 60 Br- 19* 1430 70
CI· 6* 193000 50M CI- 20 200,000 3000
F- 7 5 1 F- 20 5 1
I- 7 16.2 3.9 (- 17* 15.4 1.8
NH/ 7 145 23 NH/ 17* 164 17
NOa• 7 1.0 0.3 NOa- 16 1.0 6 38
P 7 0.1 2 29 P 11 <0.1 10 91
SO ·2 6* 16400 600 SO ·2 20 16300 6004 4
AI 7 0.06 3 43 AI 20 0.19 5 25
As 7 0.002 0.001 As 20 0.010 0.004
B 7 1350 230 B 18 1520 110
Ba 7 0.08 0.03 Ba 19 0.04 0.03
Ca 7 289 62 Ca 20 322 23
Cs 7 0.25 0.03 Cs 12 0.27 0.03
Fe 7 <0.5 7 100 Fe 20 <0.5 14 70
K 6* 16100 1000 K 20 17900 800
Mg 6* 21100 900 Mg 20 18600 900
Mn 6* 1.5 0.1 Mn 20 1.0 0.1
Na 6* 78900 2400 Na 20 85900 2000
Rb 4* 15.3 0.3 Rb 8 14.8 0.6
SI 6 1.3 0.4 Si 20 2.6 1.0
Sr 7 2.5 0.6 Sr 20 1.3 0.1
·Outlier values omitted in statistical calculations.N = Number of samples.X = Mean.S =Standard deviation.
NO =Not detected.
AU01·95IWPIWIP/:R3192 3-13 301681.08

BRINE SAMPLING AND EVALUATION PROGRAM REPORT 1992-1993 STATISTICAL ANALYSIS OF THE BSEP BRINES
Table 3-2 (Continued)
Simple Statistics for E3SEP Analyses(in mg/L)
IDownh~. DH3B ~I
-=0Downhole DH42 I
0 X OJ Median INo. NO % NO X 0 Median INo. NO I% NO
SG 20 1.22 0.01 SG 16 1.23 0.Q1
TDS 20 371000 9000 TDS 15· 400,000 5000
pH 19· 6.2 pH 15· 6.3
ALK 19 939 68 ALK 15· 927 33
TIC 19 6.1 0 0 TIC 16 6.1 0 0
TOC 16 29 21 TOC 13 36 17
Sr- 19· 1410 60 Sr- 16 1410 60
CI- 20 193000 4000 CI- 16 200,000 4000
F- 19· 5 1 F- 16 4 1
1- 18· 16.3 2.3 1- 15· 16.0 1.8
NH/ 19 165 12 NH/ 16 169 16
N03- 16 0.7 3 19 N03- 14 1.0 2 14
P 13 <0.1 9 69 P 9 <0.1 5 56
S04-2 19· 15800 600 S04-2 16 15800 800
AI 20 0.20 7 35 AI 16 0.1 6 38
As 20 0.004 4 20 As 16 0.005 0.002
S 19 1510 90 S 16 1490 100
Sa 19· 0.03 0.01 Sa 15· 0.04 0.02
Ca 20 317 24 Ca 15· 319 25
Cs 13 0.26 0.03 Cs 9· 0.26 0.02
Fe 20 <0.5 17 85 Fe 16 <0.5 9 56
K 20 18000 700 K 16 17800 900
Mg 19· 18200 800 Mg 15· 17800 400
Mn 20 1.0 0.1 Mn 15· 1.1 0.1
Na 20 85700 2000 Na 16 86400 1500
Rb 9 14.4 0.7 Rb 7* 14.0 0.4
Si 20 2.4 0.8 Si 15· 2.6 1.3
Sr 18· 0.8 0.1 Sr 15· 0.9 0.2
·Outlier values omitted in statistical calculations.N = Number of samples.X =Mean.S =Standard deviation.
NO = Not detected.
AUOI-95IWPIWIP/:R3192 3-14 301681.08

BRINE SAMPLING AND EVALUATION PROGRAM REPORT 1992-1993 STATISTICAL ANALYSIS OF TIlE BSEP BRINES
AU01·9SfWPfWIP/:R3192
Table 3·2 (Continued)
Simple Statistics for BSEP Analyses(in mglL)
Downhole DH42A
N X S Median No.ND %ND
SG 20 1.23 0.01
TOS 20 372000 9000
pH 19* 6.2
ALK 19 882 39
TIC 17* 5.0 1.2
TOC 15 20 3 20
Sr- 19* 1400 50
CI· 20 194000 3000
F- 20 4 1
I· 18 16.3 3.8
NH/ 17* 174 17
N03' 16 1.0 5 31
P 11 <0.1 9 82
S04-2 19* 15700 600
AI 20 0.12 7 35
As 20 0.004 3 15
S 18 1480 110
Sa 19 0.03 0.02
Ca 20 322 27
Cs 11* 0.24 0.03
Fe 20 <0.5 15 75
K 20 18200 800
Mg 20 17700 900
Mn 20 1.0 0.1
Na 20 87100 2000
Rb 8 14.1 0.1
Si 20 2.5 0.7
Sr 20 0.8 0.1
*Outlier values omitted in statistical calculations.N = Number of samples.X =Mean.S = Standard deviation.ND = Not detected.
3-15 301681.08

BRINE SAMPLING AND EVALUATION PROGRAM REPORT 1992-1993 STATISTICAL ANALYSIS OF THE BSEP BRINES
these drillholes since the accuracy and precision for the magnesium measurements are similar
to the other nonsolubility-constrained parameters.
ANOVA calculations were also performed on the data from drillholes DH36, DH38, DH42,
and DH42A that sampled the lower stratigraphic units below the repository horizon. ANOVA
calculations indicated that geochemical analyses for boron, bromine, and potassium may be
grouped together for these drillholes. Again, magnesium analyses for these drillholes did not
have significance at the 95 percent confidence level. In addition to the ANOVA calculation,
means plots were also produced. Means plots were created using a Tukey's honest significant
differences method at a 95 percent confidence level. Means plots showed the mean of each
data set as well as the upper and lower 95th confidence interval of each individual population.
Means plots for the nonsolubility-limited parameters indicated the two distinct groupings of
drillholes mentioned above (Figure 3-2). Means plots for bromine, potassium, and
magnesium show the greatest differences between the two groups of drillholes (Figure 3-2).
Because data from drillholes A1X01, A2X01, A3X01, BX01, OH23, OH26, and OH45 for the
nonsolubility-limited parameters (boron, bromine, and potassium) comprise a statistically
significant population, it is reasonable to assume that data for other parameters in these
drillholes can also form a statistically significant population. As mentioned previously, data
from drillholes A1X01, A2X01, A3X01, BX01, OH23, 0H26, and OH45 are most
representative of the repository brine chemistry because these drillholes sample brine
encountered in the stratigraphy within and below the repository horizon. Since data from
these drillholes can be grouped together, a measure of the central tendency for each parameter
can be calculated; however, it was necessary to determine which type of data distribution each
parameter possesses. The data was normally distributed for the nonsolubility-limited
parameters. This was achieved by again applying the Kolmogorov-Smirnov test for normality
to the combined data from each of the drillholes mentioned above. It was then assumed that
other parameters were also normally distributed, as long as the data distributions for each
drillhole were also normal. With this assumption, a mean and a standard deviation were
calculated for each parameter. If the data distributions for individual drillholes were
nonparametric, then only a median was calculated. The average representative brine
chemistry is given in Table 3-3.
AUOI-95/WP/WIP/:R3192 3-16 301681.08

B Concentration vs Drill Hole Br Concentration vs Drill Hole
1500
til~Cl
.§.C
g 1400f!C..uc0(J
1300
" , , ", , " .· . . . . . . . . . . .· . . . . . . . . . . .· . . . . . . . . . . .· .. .· . . . . . . .. . . . .
· ..· . . ............ , .· . . .· .· . . . . . ...... .. , ~.. ···1··· , .· . . . . . .. . .
· . . . . I' .· . . .. . ... .. . ... .. . .· .. . . . .· .. . . . .· . . . . .· . . . . .~.. ···I····I··..I····I··..····.. ·1........ ~....+- ..+..+....· .. . . . .· .. . . .. .: :: I' : : :.. .. .· . .. . . .· . .. .· . .. .· . .. .· . . . . . . .· . . . . . . .· . . . . . . .· . . . . . . .;.... ·:· .. ··:·····;·· .. ·~ .. ···:··· ..;.. ···~······ ..··I·····I..··I····· . . . . . . . .· . . . . . . . .· . . . . . . . .· . . . . . . . . .· . . . . . . . . .· . . . . . . . . . . .· . . . . . . . . . . .· . . . . . . . . . . .· . . . . . . . . . . ... . . . . . . . . . . ... . . . . . . . . . . .· . . . . . . . . . .· . ..· ... ... ..:•.•.. : : ·i ··: ··:.. · ·i .. •· : : i···· .: : .
1700
1300
1600
til~
Ci.§.cg 1500f!C..uc0(J
1400
1600 -:..... •••• • ••• -:••••• : •••••:- •••• -:••••• : •••••:••••• ~ ••••• ~ •••••:.... 0.o .. .. .. .. .. .... .. .. .. .... .. .. .. .... .. .. .. .... .. .. .. .... .. .. .. .... .. .. .. .... .. .. .... .. .. ..· . .· . .· . .· . .
....... , .
.................................................... 0 _ .
o .. .. .. .. ..
.: ! : -: 0. ! : ~ : o'!_"" •• ~ •••••: .o .. .. .. .. .. .. ..· .. .. .. .. .. .. .... .. .. .. .. .. .. .... .. .. .. .. .. .. .... .. . .. .. .. .. .... .. .. .. .. .. .. ..· . .. .. .. .. .. .... . .. .. .. .. .. .... .. .. .. .. .. .. .... .. .. .. .. .. ..· .. .. .. .. .. .... .. .. .. .. .. .... .. .. .. .. .. .... .. .. .. .. .. .... .. .. .. .. .. .. ..
1200 ·:·····i·····j.·····:·····i·····:·····..:·····j·····:···· .-:......;.....:.....A1XOl A3XOI OH23 OH45 DH38 DH42A
A2XOI BXOI OH26 DH36 DH42
Drill Hole
A1XOl A3XOI OH23 OH45 DH38 DH42AA2XOI BXOI OH26 DH36 DH42
Drill Hole
K Concentration vs Drill Hole Mg Concentration vs Drill Hole
25000 -~••••• ~ .....~..... ~..... ~ •••••~••••• ~ ••••• ~ •••• ~..... ~ .....~ .... ~••••• :-19000
18000
til~g 17000
5~c..g 16000o(J
15000
14000
· ., , 0 I ••• •• " ••••••••••• , ••••• " •••• ~••••• , ",••••• ,· . . . . . . . . . . .· . . . . . . .. ..· . . . . . . .. ..· . . . . . . .. ..
: : : : : : : : : : I' :· . . . . . . . .. .· . . . . . . . .. .· . . . . . .. . .· . . . . . . .· . . . . . . .· . . . . . . .····:· .. ·.:·····:·· .. ·~ .. ··.:··· ..:.. ···~· ..·I.. ··I· I :· . . . . . . .· . . . . . . .· . . . . . . .· . . . . . . . .· . . . . . . . .· . . . . . . . .· . . . . .. . ..· . . . . . . .. ..· . . . . . . .. ..........._ - - .
···y1t·-1··1·L.··..l.··L.·.L··i .~ ~ : ~ ~ I' ~ I I ! I :
•••• ; •••••:••••• : ••••• ; •••••:•••••••••• ; •••••:••••• : ••••• :0 •••••:••••• :· . . .. .· . . .. .· . . .. .· . . . . . . . . . . .· . . . . . . . . . . .· . . . . . . . . . . .· . . . . . . . . . . .· . . . . . . . . . . .· . . . . . . . . . . .· . . . . . . . . . . .· . . . . . . . . . . .· . . . . . . . . . . .•••• ; •••••:••••• , ••••• ; •••••:••• •• , ••••• j. •••• •:••••• i···· .j. •••• •: ••••• i
23000
til~
Ci.§.cg 21000f!C..uC0(J
19000
17000
-,···l·l..J.··l~ ..··I:····.l.····,···+···,·····,·······-: . .. I:::::-i·····i····_...·1·····1····_········1··_....1- •••·i···_..'i-
· . . . . . . .. .· . . . . . . .. .· . . . . . . .. .· . . . . . . .. .· . . . . . . .. .· . . .. .. . . . .. . . . .
-,·······..··I····'····r·········'·····lr··fr··'-_.:.....:... ··i·····,.. ... j. ..... •:••••• ,·····r···· ·i"····;·····~· ....;.....!-
A1XOl A3XOI OH23 OH45 DH38 DH42AA2XOI BXOI OH26 DH36 DH42
Drill Hole
A1XOl A3XOI OH23 OH45 DH38 DH42AA2XOI BXOI OH26 DH36 DH42
Drill Hole
Figure 3-2
Means Plots for BSEP Drill Holes for B, Br, K, and Mg
301681.09/zc A4 3-17 4/13/95s
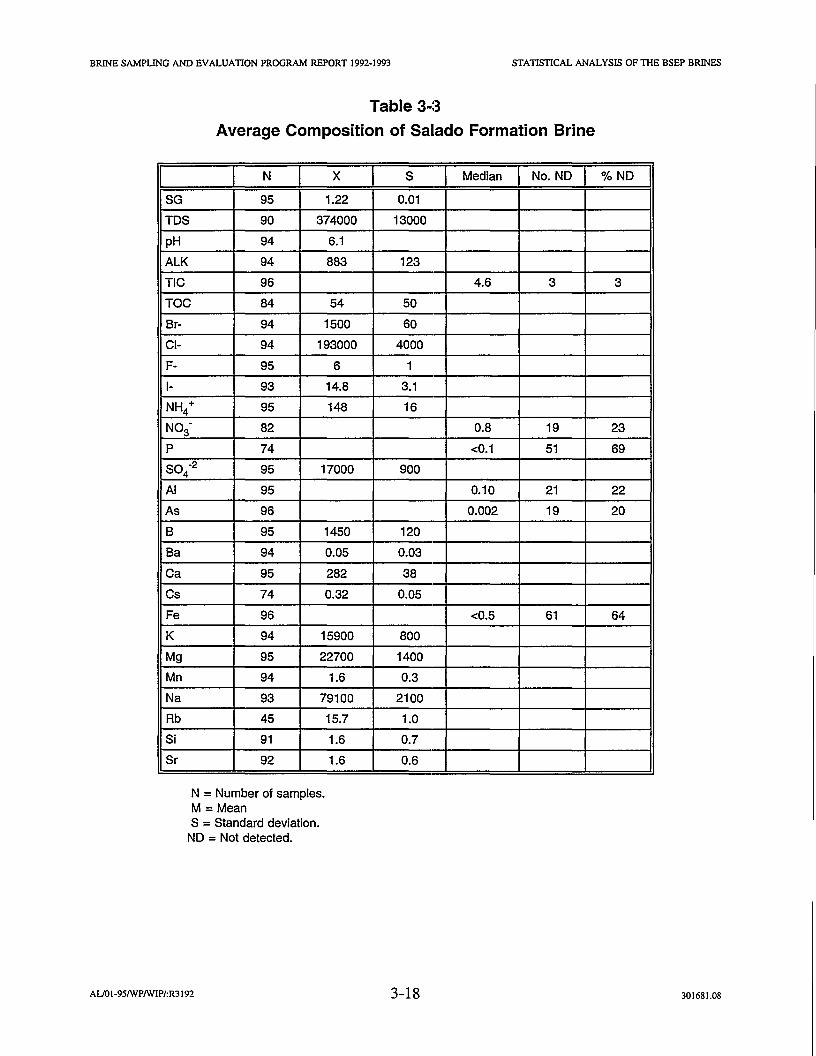
BRINE SAMPLING AND EVALUATION PROGRAM REPORT 1992-1993 STATISTICAL ANALYSIS OF THE BSEP BRINES
Table 3·:3
Average Composition of Salado Formation Brine
I I N I x I S I Median I No. ND I %ND ISG 95 1.22 0.01
TDS 90 374000 13000
pH 94 6.1
ALK 94 883 123
TIC 96 4.6 3 3
TOC 84 54 50
Br- 94 1500 60
CI- 94 193000 4000
F- 95 6 1
1- 93 14.8 3.1
NH/ 95 148 16NOs- 82 0.8 19 23
P 74 <0.1 51 69SO -2 95 17000 9004
AI 95 0.10 21 22
As 96 0.002 19 20
B 95 1450 120
Ba 94 0.05 0.03
Ca 95 282 38
Cs 74 0.32 0.05
Fe 96 <0.5 61 64
K 94 15900 800
Mg 95 22700 1400
Mn 94 1.6 0.3
Na 93 79100 2100
Rb 45 15.7 1.0
Si 91 1.6 0.7
Sr 92 1.6 0.6
N =Number of samples.M = MeanS = Standard deviation.
ND =Not detected.
AUOI-9SIWPIW1P/:R3192 3-18 301681.08

BRINE SAMPLING AND EVALUATION PROGRAM REPORT 1992·1993 STATISTICAL ANALYSIS OF TIlE BSEP BRINES
3.9 Composition of Non-Salado Brine from the WIPP Underground
The BSEP Brine Chemistry database also contains data on some non-Salado brines that have
been encountered in the WIPP excavations. The most important of these are water from the
Culebra Dolomite that has been piped to the repository horizon through temporary drains in
the shafts, the brine in the AlS sump, and artificial brine produced commercially (B&E
Artificial Brine).
Previously unreportefl data are included in Part IT of Appendix D and summarized in
Table 3-4.
The sample for the Culebra brine was collected on March 3, 1990, at the discharge of the AlS
drain on the 'north side of the AlS station. The Sr concentration was found to be 11 mgll in
this sample, which is considered a low value for Culebra water. The data collected for the
Culebra in the vicinity of the WIPP site by the Water Quality Sampling Program show that
there is quite a variation in the Sr values. Data from an individual location (well H-03b3)
range between 12 and 30 mgll as sampling is repeated (DOEIWIPP 92-007, 1992).
Underground brine samples with a relatively high (more than 3 mgll) suggest the possibility
of contamination by Culebra water or of partial evaporation of the sample prior to laboratory
analysis.
The water from the Culebra is collected in a sump at the AlS, where it dissolved additional
salt from the Salado. The AlS sump brine was often used for construction purposes and has
been the main source of underground brine contamination. The salinity of the water in the
sump varies considerable from time to time, ranging from nearly unaltered Culebra water to a
saturated brine. As a result, it is not appropriate to average the analyses for the sump brines,
but rather to show great variations in the chemistry as is done in Table 3-4. The only way to
determine a mixing curve for any given sample that is suspected of being contaminated would
be to have performed an analyses of the actual batch of brine that was spread to cause that
contamination. Such analyses was performed in August 1988 and reported in Deal and others
(1989), Section 3.1.1.3.
3.10 ConclusionsTemporal trends for geochemical data collected as part of the BSEP were determined for
uphole AIX02. Simultaneous changes in nonsolubility-constrained parameters indicated that
evaporation had occurred in this drillhole. No temporal trends were evident in other
AU01·9SrwPrwIP/:R3192 3-19 301681.08

BRINE SAMPLING AND EVALUATION PROGRAM REPORT 1992-1993 STATISTICAL ANALYSIS OF TIlE BSEP BRINES
Table 3-4
Composition of Salado and Nonsalado Brines
WIPP Culebra B&ERepository from AIS Culebra from AIS Sump Artificial
Horizon Drain Brine
SG 1.22 1.04 1.06 - 1.21 1.22TDS 374,000 48,000 96,000 - 333,000 324,000pH 6.1 8.1 7.1 - 8.2 6.6
ALK 883 113 116-177 191TIC 4.6 73 78 -113 190TOC 54 10 5 - 91 31Br- 1,500 28 35 - 90 23CI- 193,000 20,600 50,700 - 190,000 187,000F- 6 1 <1 - 4 31- 14.8 0.2 <0.1 - 0.2 1.5
NH4+ 148 0.34 0.33 - 4.5 0.31N03- 0.8 0.1 <1 -10 4
P <0.1 <0.1 <1 <0.3S04-2 17,000 8,200 6,~~00 - 11,000 3,600
AI 0.10 <0.05 0.17-2.4 <0.05As 0.002 <0.001 ·0.002 0.003B 1,450 35 12 - 31 2Ba 0.05 0.03 Cl.07 - 2.4 0.1
Ca 282 822 El69 - 989 1,520Cs 0.32 NA <0.01 - 0.02 0.02Fe <0.5 0.5 0.1 - 1.4 <0.5K 15,900 376 496 - 3,210 11
Mg 22,700 568 629 -1,630 43Mn 1.6 <0.5 <0.1 - 0.4 <0.1Na 79,100 15,800 32,1500 - 121,000 120,000Rb 15.7 NA NA NASi 1.6 3.8 3.3 - 8.6 50Sr 1.6 11 14 - 33 24
AUOI-95fWPIWIPf:R3192 3-20 301681.08
BRINE SAMPLING AND EVALUATION PROGRAM REPORT 1992-1993 STATISTICAL ANALYSIS OF TIlE BSEP BRINES
drillholes. Data distributions were assumed for each parameter in each drillhole, duplicate
analyses were averaged, outliers were removed, and simple statistics were calculated for each
drillhole (Table 3-2).
Data from different drillholes were then grouped together. One group consisted of drillholes
AIXOl, A2XOl, A3XOl, BXOl, 0H23, OH26, and OH45. These drillholes are used to
sample brine from stratigraphy located within and below the WIPP repository. A second
group consisted of data from drillholes DH36, DH38, DH42, and DH42A. These drillholes
are used to sample brine from stratigraphy located beneath the repository. An ANOVA
calculation indicated two separate populations for the nonsolubility-limited geochemical
parameters. Because brine recovered from drillholes AIXOl, A2XOl, A3XOl, BXOl, OH23,
OH26, and OH45 are more representative of the repository horizon conditions, an average
geochemical composition for brine from these drillholes was calculated (Table 3-3). This
brine composition was the average representative brine composition for the repository
horizon.
AUOI-9SfWPfWIP/:R3192 3-21 301681.08
--------- --- -- ~-----

BRINE SAMPLING AND EVALUATION PROGRAM REPORT 1992-1993 STATISTICAL ANALYSIS OF THE BSEP BRINES
THIS PAGE INTENTION)~LLY LEFT BLANK
AUOI-95fWPfW1P/:R3192 3-22 301681.08

BRINE SAMPLING AND EVALUATION PROGRAM REPORT 1992-1993 HYDROLOGIC TESTING
4.0 Hydrologic Testing of the Fractured Part of theDisturbed Rock Zone Beneath the WIPP Excavations
The main objective of the Hydrologic Testing of the Fractured Part of the Disturbed Rock
Zone Beneath the WIPP Excavations Program is to characterize the fracture system beneath
the floor of the repository. The data resulting from this program will be used by Waste
Isolation Division personnel to develop operational plans for predicting brine and gas
movement through the fracture system. Additionally, the data obtained may be useful in
refining the design of seals to be used within the repository and in assessing the long-tenn
behavior of flow through the fractured zone.
As salt creeps into the WIPP underground excavations, macrofractures develop in the DRZ
beneath the excavations (Bechtel,. 1986; also, see review by Deal and Roggenthen, 1991).
The fractures tend to concentrate in, but are not limited to, MB 139, which is about 1 m
thick, lying 1 to 2 m below the floor of most of the WIPP excavations. The developing
fracture systems may provide pathways for rapid movement of brine and gas (Deal and Case,
1987; Deal and others, 1989; Deal and others, 1991b) and are considered to be one of the
most likely pathways for migration of constituents away from the waste storage panels. The
hydrologic characteristics of the fractured zone must be understood to predict and, if
necessary, modify the movement of fluids and constituents within MB 139 if a release
occurred during operation of the facility.
In 1989, a hydraulic test of short duration was conducted in the DRZ beneath the floor of the
intersection of the S90 and W620 drifts (Deal and others, 1991b). The results indicated that
drawdown-type pump testing in the underlying fracture system could be perfonned
successfully and could yield useful hydrologic data about the DRZ. After evaluating the
results from the preliminary testing effort, a more comprehensive field testing program was
developed, and hydraulic testing was implemented at two additional underground test sites.
This section summarizes the results of short-duration hydraulic tests conducted at the two
additional sites. The original file report (Crawley and others, 1992) without the test
appendices, is edited and presented as Appendix E.
The hydrologic testing areas were selected to evaluate various room and drift dimensions,
excavation ages, areas where water was introduced for construction purposes, and areas
AUOI·95IWPIWIP/:R3192 4-1 301681.08

BRINE SAMPLING AND EVALUATION PROGRAM REPORT 1992-1993 HYDROLOGIC TESTING
isolated from construction fluids. Three sites were selected for drilling and testing as part of
this program because of their age, their physical characteristics, their relationship to other
excavations, the existence of fractures, and exposur,e to long periods of water spread for
construction purposes.
• Test Site No.1 is at the intersection of the S90 and W620 drifts near the AlS.This site consists of 20 test holes drilled at the intersection and along the lengthof the S90 drift (Appendix E, Figure E-2:-2). This test site was not accessibleduring this field investigation period, but was described in detail by Deal andothers (1991a, Section 4).
• Test Site No.2 is located in the EO drift in the general area of N620. The siteincludes nine test holes drilled along the EO drift (Appendix E, Figure E-2-2).
• Test Site No. 3 is located in the W170 drift immediately in front of theunderground core storage room at S400. This site consists of 11 test holesdrilled along the W170 drift and into the core storage room (Appendix E,Figure E-2-2).
Test results indicate that the significant fracture systems that yield water to test holes are
restricted to MB 139. For the two sites tested during this reporting period, there appears to
be separate, saturated, unconnected fracture systems of fairly low transmissivity. At the EO
test site, fracture systems that are connected are confined to the immediate intersection of the
drift and alcove. For the W170 site, the intersection did not contain significant connected
fractures. Based on the observed drawdown response to pumping, the area within the core
storage room appeared to be underlain by a somewhat more connected fracture system. This
condition could be influenced by the width of the individual excavations. The W170 drift,
though much older, has a relatively narrow opening in comparison to the core storage room.
These data indicate that excavation dimensions may have a more important role than age in
fracture development.
The post-test fluid-level recovery observed at the test sites suggests that the fracture systems
beneath these areas are limited, and the available fluid reservoirs are small. Although long
term fluid-level monitoring was not conducted as part of this field program, the data gathered
indicate that pumping at these sites was dewatering the fracture systems.
The results of the pumping tests support the concept of limited, bounded fractured fluid
reservoir that was developed during the 1989 testing program (Deal and others, 1991a). Data
AUOI-95IWPIW1P/:R3192 4-2 301681.08

BRINE SAMPLING AND EVALUATION PROGRAM REPORT 1992-1993 HYDROLOGIC TESTING
analysis from the EO test site showed clear changes in the slope of the plotted drawdown
curves for some test holes, indicating the presence of nearby no-flow or low-permeability
boundaries. Testing at the W170 site did not produce adequate data for aquifer test analysis.
The Jacob and Theis methods (Lohman, 1972) were used to determine transmissivity and
storage coefficients for the first test at the EO site. The calculated transmissivities for all
holes were 0.7 to 9.9 ft2/day. Storage coefficients ranged from 0.00038 to 0.0034, indicating
that the fracture system at the EO site is partially confined.
Additional test sites should be developed to better defme the nature of fracturing in areas
other than the intersections of drifts and rooms. The EO test site could be expanded to both
the north and south of the present site to allow comparative testing. If the test site was
expanded, the results of pump testing away from the drift and alcove intersection could be
compared to·the results produced by this study, and the effects of excavation geometry could
be quantified. Additional testing should be conducted at the lowest possible flow rates for the
longest time achievable, and fluid-level recovery should be monitored long-term.
AUOI-95IWPIWIP/:R3192 4-3 301681.08

BRINE SAMPLING AND EVALUATION PROGRAM REPORT 1992-1993 HYDROLOGIC TESTING
THIS PAGE INTENTIONt!~LLY LEFT BLANK
AI.JOI-95IWPIWIP/:R3192 4-4. 301681.08

BRINE SAMPLING AND EVALUATION PROGRAM REPORT 1992-1993 , NUMERICAL MODELING
5.0 Numerical Modeling of Brine Seepage as a Result ofClay Compacti9n
5.1 IntroductionThere appears to be enough moisture present in the clays within the Salado Formation to
account for all the brine that is observed to seep into the WIPP excavations (Deal and others,
1993, Section 5; Deal and Bills, 1994). The excavation of WIPP rooms result in stress
redistribution around those openings that can cause the consolidation of thin clays within the
stratigraphic sequence. Additionally, the excavations (including drillholes) provide a sink at
atmospheric pressure allowing brine to flow from the consolidating clays.
A series of order-of-magnitude calculations were made for this report (Appendix F) in order
to numerically model clay consolidation and estimate the resultant brine seepage into the
repository horizon.
5.2 Modeling AssumptionsThe modeling assumptions are as follows:
• Stress redistribution results in a localized increase in stress that is far moresignificant in generating excess pore pressure than in near ground surfaceconsolidation. The stress redistribution deforms the clay plastically generatingan excess pore pressure of several megapascals (MPa) within the DRZ.
• Transient flow to the excavation or boundary dissipates the excess pore pressurewithin the clay layer.
• The rate of flow depends on the consolidation properties of the clay (hydraulicconductivity, compressibility, and porosity), the cross sectional area of the clayseams intercepting the excavation, and the extent of the DRZ.
• The tributary method predicts the resulting increase in total stress of 3 MPa.Consider that after 1,000 days (Deal and others, 1989, Section 5), the stressabutment zone extends out about 5 excavation diameters. The average diameterfor the room is about 3 m.
• The compressibility of the clay is 10-7 Pa-l corresponding to a clay of mediumcompressibility. The hydraulic conductivity of the clay is 10-8 crn/s. Under achange in effective stress of 3 MPa after consolidation is complete, the changein porosity is 30 percent.
AUOI·95fWPfWIP/:R3192 5-1 301681.08
---------------------_._--

BRINE SAMPLING AND EVALUATION PROGRAM REPORT 1992·1993 NUMERICAL MODELING
5.3 Room Q
For the case of Room Q, the room has a radius of 1.5 m and a length of 100 m. Two thin
clay seams occur, above and below the orange band. Both are about 3.5 mm thick (Deal and
others, 1993, Table 4-3) and are modeled as a single clay 7 mm thick, centered in the room.
In this case flow occurs linearly along the clay seams toward the room. From previous
modeling analyses (Deal and others, 1989, Section 5), the stress abutment zone around Room
Q will affect the clay seams out to a distance of about 9 m. No brine was collected from
Room Q for the fIrst 800 days (Howarth and others, 1994, Section 4.2.2.3). For this
calculation, brine inflow was assumed to have begun as soon as Room Q was excavated, but
because no records of brine volume were made for the fIrst 800 days, the fIrst 800 days of
predicted seepage were subtracted from these calculations so that the plot (Appendix F,
Fig. F-2-2) shows calculated inflow from 800 days to 25 years after excavation. The
cumulative inflow 1,600 days after excavation was calculated to be about 300 L, slightly
more than the 200 L that was observed (Howarth and others, 1994, Fig. 2). Calculated inflow
rates after 1600 days are on the order of 0.3 L/day (Appendix F, Fig. F-2-2), close to the
observed value of 0.17 L/day (Howarth and others, 1994, Fig. 3). The calculation shows that
seepage ceases after about 25 years (Appendix F, Fig. F-2-2).
5.4 Standard WIPP Waste Storage RoomIn order to estimate the amount of brine that might come in contact with waste stored at the
WIPP after sealing and closure, a similar calculation was made for a standard waste storage
room. A waste storage room was approximated as a circular opening 3.6 m in radius and
91.4 m long with an abutment zone extending 20 m into the salt from the wall of the room.
Three clay layers are observed in the walls of the rooms, the two clays associated with the
orange band that are exposed in Room Q (each about 3.5 mm thick), and clay F, which is
about 10 mm thick (Deal and others, 1993, Table 4-3). For this calculation, the three clays
were combined as a single clay 17 mm thick occurring at the mid-point of the room. This
model predicts rapid initial inflow of about 2 L/day rapidly dropping to less than 0.5 L/day
after about 10 years (Appendix F, Fig. F-3-2). This calculation shows that the pore pressure
is completely depleted after about 100 years (Appendix F, Fig. F-3-2) and inflow then ceases.
The total inflow would be about 9,000 L, much of which would be evaporated during
excavation and emplacement of waste into the air circulated for ventilation.
ALIOI-95IWPIWIP/:R3192 5-2 301681.08

BRINE SAMPLING AND EVALUATION PROGRAM REPORT 1992-1993 NUMERICAL MODELING
5.5 Axial Consolidation Around a Borehole
Brine seepage occurs into drillholes drilled vertically downward from WIPP excavations.
This calculation was performed to estimate inflow into 15 m-deep downholes drilled from
Room G. The vertical drillhole has a radius of 8.9 cm and intersects the clay B layer about
10 m below the floor of the room. Clay B is about 1 cm thick (Deal and others, 1991b,
Section 2.7.3.2). Stress redistribution around Room G will result in compaction of clay B for
a distance of about 20 m from the borehole. Brine flow is radially to the borehole along the
thin clay seam. As a result, complete compaction will take a fairly long time, over
1,000 years, and would ultimately yield about 340 L of brine. Over a period of 60 to
100 years, approximately 100 to 150 L of brine will seep into the borehole (Appendix F,
Fig. F-4-2). After about 10 years, inflow rate is calculated to be about .006 Uday, an order
of magnitude lower than the observed inflow below Room G (Table 5-1). The only other
Table 5·1
Seepage Rate in Drillholes Penetrating Clay B
Seepage RateDrillhole Location (Uday)
DH36 RoomG 0.1
DH38 RoomG 0.03
DH40 RoomG 0.008
DH42 RoomG 0.01
DH42A RoomG 0.02
OH46 S390!W320 0.005
drillhole that penetrates the same stratigraphy and is probably not contaminated with
construction brines is OH46, which is drilled from the underground core storage area.
Consolidation response should be about the same for OH46 as for the holes in Room G.
All of the drillholes listed in Table 5-1 also intersect clay E and clay D, wliichare potential
sources for additional brine. Clay D is thin and discontinuous and was not considered in the
above calculation. The intersection with clay E can be observed from the drillhole collars
and is not providing brine to the downholes in Room G.
AUOl-95IWPIWIP/:R3192 5-3 301681.08
- """'~-~-~~--- - --

BRINE SAMPLING AND EVALUATION PROGRAM REPORT 1992-1993 NUMERICAL MODELING
5.6 SummaryThese order-of-magnitude seepage calculations compare well with the observed seepage into
Room Q. Calculated seepage rate after 1,600 days is on the order of 0.3 L/day, where the
actual observed rate is 0.17 Uday. In this case the model is for flow towards the room along
a thin clay seam. Extending this model to a waste storage room predicts that the total
seepage into the room will be on the order of 9,000 liters, far short of the 220,000 L
necessary to react anoxically with all the susceptible metal placed in the room (Deal and
others, 1991b, Section 4.6). Furthermore, seepage into the room will cease after about
100 years.
The case for seepage into a downhole drilled into the strata below an excavation behaves
differently, as flow is radially toward the drillhole. In this case, some seepage continues for a
long time, perhaps a thousand years or more. It is clear that seepage into drillholes is
strikingly different from seepage into a repository excavation. Deal and others (1994, Section
2.7.2) pointed out that seepage into drillholes probably should not be used to predict long
term seepage into a WIPP waste storage room. This calculation provides additional support
for this caution.
AUOI-95IWPIW1P/:R3192 5-4 301681.08
BRINE SAMPLING AND EVALUATION PROGRAM REPORT 1992·1993
6.0 Summary and Conclusions
SUMMARY AND CONCLUSIONS
During eleven years of observations (1982 to 1993) the amount of brine seeping into the
WIPP excavations is local, limited, and finite. Even a small amount of brine may produce\
hydrogen gas by anoxic corrosion of the metal in the CH-TRU waste drums and waste
inventory. However, the amount of brine that will be available will be only a small
percentage of that necessary to corrode all of the metal. The data through 1990 are discussed
in detail by Deal and others (l991b). It was concluded that it will take on the order of
220,000 L of brine to corrode all the susceptible metal (iron and aluminum) and that there is
probably less than 10 percent available (20,000 L), unless it can be proven that far-field flow
does occur at the WIPP. Far-field flow is theoretically unlikely or impossible (Deal and
Roggenthen, 1991), and evidence so far confirms that significant seepage of bpne ceases
about three years after the excavation of an opening, although small seeps can continue for a
longer period of time (Deal and others, 1993, Section 5; Deal and Bills, 1994). Calculations
presented in Chapter 5 of this report indicate that less than 9,000 L will be available from
clay consolidation.
Data gathered in 1992 and 1993 additionally support those conclusions. Continued
observations of downholes and Salt Shaft and Waste Shaft sumps where fractured MB 139
can be observed confirm that the exposed surfaces are still dry and show very little evidence
of moisture. Inspection of the AIS showed that there was little evidence of moisture or past
seepage. Salt encrustations are more common below a depth of 1,500 ft, are clearly
stratigraphically controlled, and are associated with clay interbeds and argillaceous halite.
Anhydrite exposures are typically dry and free of salt encrustations, indicating that no
significant amount of brine flows through them to the shaft.
Both the shaft sumps and the AIS are, in effect, long-term far-field flow experiments. There
is no evidence confrrming that enough flow exists to supply the needed volume of brine for
complete anoxic corrosion of the susceptible metal waste and waste containers that will be
emplaced at the WIPP.
Hydrologic testing was performed during this reporting period at two additional areas in order
to obtain data on the hydrologic properties of the fractured part of the DRZ that has formed
beneath the WIPP excavations. The test results confirmed that the width of an excavation
AUO1-95/WP/WIP/:R3192 6-1 301681.08

BRINE SAMPLING AND EVALUATION PROGRAM REPORT 1992-1993 SUMMARY AND CONCLUSIONS
influences the development of integrated fractures and showed that, in the tested areas in the
EO drift and near the AlS, integrated fracture systems only exist beneath intersections. This
supports the concept of limited, bounded, fractured fluid reservoirs. Additional evidence that
extensive, large-scale hydrologically interconnected fracture system apparently do not exist
under much of the WIPP excavation is supplied by the fact that brine stands at different
levels in closely spaced drillholes in the floor and that brine is not seeping out of fractures
observed in the Salt Shaft and Waste Shaft sumps.
Long-term observations of the salt encrustations (Deal and others, 1993, Section 2.2) confirm
and semiquantify that the brine weeps cease about three years (1,000 days) after excavation.
Calculations estimate total seepage into a full-sized waste storage room from wall weeps
between 43 and 604 L, with an average of less than 300 L (Deal and others, 1993; Table 2-4
and Figure 2-14), much less than 1 percent of the 220,000 L of brine needed to corrode all
the susceptible metal in the CH-TRU waste and waste storage drums.
Previous efforts to calculate the amount of moisture that might be released to the repository
by clay consolidation (Deal and others, 1993, Section 4) to a full-sized waste storage room
was on the order of 400 L of brine. In order to provide a somewhat more rigorous estimate,
numerical calculations were performed for this report in order to provide order-of-magnitude
estimates of brine seepage that might result from clay compaction. The calculations compare
well with the observed seepage into Room Q. Calculated seepage rate after 1,600 days is on
the order of 0.3 L/day, where the actual observed rate is 0.17 L/day. In this case the model is
for flow towards the room along a thin clay seam. Extending this model to a waste storage
room predicts that the total seepage into the room will be on the order of 9,000 L, much of
which will evaporate during operations. Furthermore, seepage into the room will cease after
about 100 years.
The case for seepage into a downhole drilled into the strata below a WIPP excavation
behaves differently, as flow is radially toward the drillhole. In this case, some seepage
continues for a long time, perhaps a thousand years or more. It is clear that seepage into
drillholes is strikingly different from seepage into a repository excavation. Deal and others
(1994, Section 2.7.2) pointed out that seepage into drillholes probably should not be used to
predict long term seepage into a WIPP waste storage room. This calculation provides
additional support for this caution.
AUOI-95IWPIWIP/:R3192 6-2 301681.08

BRINE SAMPLING AND EVALUATION PROGRAM REPORT 1992-1993 SUMMARY AND CONCLUSIONS
Although there is no observed evidence from the WIPP excavations that brine will seep into
the workings from the underlying anhydrite:ME 139 (Deal and Bills, 1994), Deal and others
(1994) calculated that even if far-field flow occurred in the anhydrite, only about 6,000 L
could flow into a WIPP storage room over a 200-year period of time. They point out that
due to evaporation during the period of time the excavations are open for waste storage, and
because creep closure will repressurize the room even in the absence of gas generation, a
more realistic figure may be on the order of 1,700 L.
All of these estimates and calculations are far short of the 220,000 L required to corrode all
of the metal and cause maximum gas generation by anoxic corrosion.
AUOI -95IWPIWIP/:R3192 6-3 301681.08

BRINE SAMPLING AND EVALUATION PROGRAM REPORT 1992-1993 SUMMARY AND CONCLUSIONS
THIS PAGE INTENTIONALLY LEFT BLANK
AUOI-95IWPIWIP/:R3192 6-4 301681.08

BRINE SAMPLING AND EVALUATION PROGRAM REPORT 1992-1993
7.0 References
REFERENCES
Abitz, R J., J. Myers, P. E. Drez, and D. E. Deal, 1990, "Geochemistry of Salado FonnationBrines Recovered from the Waste Isolation Pilot Plant (WIPP) Repository," Proceedings ofWaste Management '90, Waste Processing, Transportation, Storage and Disposal, TechnicalPrograms and Public Education, R G. Post, ed., Tucson, Arizona, Vol. 2, pp. 881-891.
American Society for Testing and Materials (ASTM), 1980, "Recommended Practice forDealing with Outlying Observations," Procedure E178-80, American Society for Testing andMaterials, Philadelphia, Pennsylvania.
ASTM, see American Society for Testing and Materials.
Bechtel National, Inc. (Bechtel), 1986, "Waste Isolation Pilot Plant Design Validation FinalReport," DOE-WIPP 86-010, prepared for the U.S. Department of Energy by BechtelNational, Inc., San Francisco, California.
Bechtel National, Inc. (Bechtel), 1983, "Waste Isolation Pilot Plant Preliminary DesignValidation Report," prepared for the U.S. Department of Energy by Bechtel National, Inc.,San Francisco, California.
Black, S. R, R S. Newton, and D. K. Shukla, eds., 1983, "Results of Site ValidationExperiments, Waste Isolation Pilot Plant," DOE-TME-3177, TSC-D'Appolonia ConsultingEngineers, Albuquerque, New Mexico.
Crawley, M. E., T. W. Cooper, R G. Richardson, 1992, "Hydrologic Testing of the FracturedPart of the Disturbed Rock Zone Beneath the WIPP Excavations," fIle report prepared for theU.S. Department of Energy by IT Corporation and Westinghouse Electric Corporation,Carlsbad, New Mexico.
Deal, D. E., and J. B. Case, 1987, "Brine Sampling and Evaluation Program, Phase I Report,"DOE-WIPP 87-008, prepared for the U.S. Department of Energy by IT Corporation andWestinghouse Electric Corporation, Carlsbad, New Mexico, 163 pp.
Deal, D. E., and R A. Bills, 1994, "Conclusions After Eleven Years of Studying Brine at theWaste Isolation Pilot Plant," Waste Management '94, Tucson, Arizona, March 2, 1994,IT Corporation, Albuquerque, New Mexico, and U.S. Department of Energy, Carlsbad, NewMexico.
Deal, D. E., and R M. Roggenthen, 1991, "Evolution of Hydrologic Systems and BrineGeochemistry in a Deforming Salt Medium: Data from WIPP Brine Seeps," WasteManagement '91, Waste Processing, Transportation, Storage and Disposal, TechnicalPrograms and Public Education, R G. Post, ed., Vol. 2, pp. 507-516.
AUOI·95IWPIWIP/:R3192 7-1 301681.08

BRINE SAMPLING AND EVALVATION PROGRAM REPORT 1992-1993 REFERENCES
Deal, D. E., R. H. Holt, J. M. Melvin, and S. M. Djordevic, 1994, "Calculation of BrineSeepage from Anhydrite Marker Bed 139 into a Waste Storage Room at the Waste IsolationPilot Plant," DOE-WIPP 94-007, Westinghouse Electric Corporation, Carlsbad, New Mexico.
Deal, D. E., R. J. Abitz, D. S. Belski, J. B. Case, M. E. Crawley, R. M. Deshler, P. E. Drez,C. A. Givens, R. B King, B. A. Lauctes, J. Myers, S. Niou, J. M. Pietz, W. M. Roggenthen,J. R. Tyburski, and M. G. Wallace, 1989, "Brine Sampling and Evaluation Program Report,1988," DOE-WIPP 89-015, prepared for the U.S. Department of Energy by IT Corporationand Westinghouse Electric Corporation, Carlsbad, New Mexico.
Deal, D. E., R. J. Abitz, D. S. Belski, J. B. Clark, M. E. Crawley, and M. L. Martin, 1991a,"Brine Sampling and Evaluation Program Report, 1989," DOE-WIPP 91-009, prepared forU.S. Department of Energy by IT Corporation and 'Westinghouse Electric Corporation,Carlsbad, New Mexico.
Deal, D. E., R. J. Abitz, J. Myers, D. S. Belski, M. L. Martin, D. J. Milligan, R. W.Sobocinski, and P. P. James Lipponer, 1993, "Brine Sampling and Evaluation Program Report1991," DOE-WIPP 93-026, prepared for U.S. Department of Energy by IT Corporation andWestinghouse Electric Corporation, Carlsbad, New Mexico.
Deal, D. E., R. J. Abitz, J. Myers, J. B. Case, D. S. Belski, M. L. Martin, W. M. Roggenthen,1991b, "Brine Sampling and Evaluation Program Report, 1990," DOE-WIPP 91-036, preparedfor U.S. Department of Energy by IT Corporation and Westinghouse Electric Corporation,Carlsbad, New Mexico.
EPA, see U.S. Environmental Protection Agency.
Howarth, S., K. Larson, T. Christian-Frear, R. Beauheim, D. Borns, D. Deal, A. L. Jensen,K. Pickens, R. Roberts, M. Tierney, P. Vaughn, and S. Webb, 1994, "Salado Formation FluidFlow and Transport Containment Group-White Paper for Systems Prioritization andTechnical Baseline, Rev. 1," prepared by Sandia National LaboratorieslNew Mexico for theU.S. Department of Energy, Carlsbad, New Mexico.
Kennedy and Neville, 1986, (ref) ('][ 3.5)
Krumhansl, J. L., and H. W. Stockman, 1987, Memorandum to M. A. Molecke, SandiaNational Laboratories, New Mexico ,"Test Progress Report-Room J."
Krumhansl, J. L., K. M. Kimball, and C. L. Stein, 1991, "Intergranular Fluid Compositionsfrom the Waste Isolation Pilot Plant (WIPP), Southeastern New Mexico," SAND90-0584,Sandia National Laboratories, New Mexico.
Lohman, S. W., 1972, "Ground-Water Hydraulics," U.S. Geological Survey ProfessionalPaper 708, U.S. Government Printing Office, 70 pp.
AUOI-95IWPIWIP/:R3192 7-2 301681.08

BRINE SAMPLING AND EVALUATION PROGRAM REPORT 1992·1993 REFERENCES
Morse, J. G., and B. W. Hassinger, April, 1985, "Brine Testing Program Plan: WasteIsolation Pilot Plant (WIPP) Project, Carlsbad, New Mexico, Revision 2," WD:85:01214,internal document transmitted as a letter from W. R. Cooper to R. H. Neil, Waste IsolationPilot Plant, AEH 85:086.
Powers, D. W., S. J. Lambert, S. E. Shaffer, L. R. Hill, and W. D. Weart, eds., 1978,"Geological Characterization Report, Waste Isolation Pilot Plant (WIPP) Site, SoutheasternNew Mexico," SAND78-1596, Vols. I and IT, Sandia National Laboratories, Albuquerque,New Mexico.
SNLINM, see Sandia National LaboratorieslNew Mexico.
Stein, C. L., and J. L. Krumhansl, 1988, "A Model for the Evolution of Brines in Salt fromthe Lower Salado Formation, Southeastern New Mexico," Geochimica et Cosmochimica Acta,Vol. 52, pp. 1037-1046.
Stein, C. L., and J. L. Krumhansl, 1986, "Chemistry of Brines in Salt From the WasteIsolation Pilot Plant (WIPP), Southeastern New Mexico: A Preliminary Investigation,"SAND85-0897, Sandia National Laboratories, New Mexico.
U.S. Environmental Protection Agency (EPA), 1989, (supply elements) ']{3.6530-SW-89-026.
DOEIWIPP 92-007, 1992, Waste Isolation Pilot Plant Site Environmental Report for CalendarYear 1991, prepared for the U. S. Department of Energy by Westinghouse ElectricCorporation and IT Corporation, Carlsbad, New Mexico.
AUOl·95IWPIWIP/:R3192
-~--- _ , ." J.
7-3 301681.08

BRINE SAMPLING AND EVALUATION PROGRAM ~ORT 1992·1993
THIS PAGE INTENTIONJ~LLY LEFT BLANK
REFERENCES
AUOI-95fWPfWIP/:R3192 7-4 301681.08

BRINE SAMPLING AND EVALUATION PROGRAM REPORT 1992-1993
APPENDIX A
BRINE ACCUMULATION
PART I-LIST OF UNDERGROUND LOCATIONS WHERE BRINEOCCURRENCES WERE OBSERVED AND MONITORED
PART II-BRINE ACCUMULATION DATA TABLES
AU4-95IWPIW1P:R3192A
APPENDIX A
301681.08

BRINE SAMPLING AND EVALUATION PROGRAM REPORT 1992-1993
THIS PAGE INTENTIONALLY LEFT BLANK
AU4-95IWPIWIP:R3192A
APPENDIX A
301681.08

BRINE SAMPLING AND EVALUATION PROGRAM REPORT 1992-1993
APPENDIX A
BRINE ACCUMULATION
PART I-LIST OF UNDERGROUND LOCATIONS WHERE BRINEOCCURRENCES WERE OBSERVED AND MONITORED
AU4-95IWPIW1P:R3192A
APPENDIX A
301681.08

BRINE SAMPLING AND EVALUATION PROGRAM REPORT 1992-1993
THIS PAGE INTENTIONALLY LEFT BLANK
AU4-95IWPIWIP:R3192A
APPENDIX A
301681.08

Table A-1
>List of Underground Locations Where Brine Occurrences
tll
~ Were Observed and Monitored Through December, 1993 ~'" As Part of the Brine Sampling and Evaluation Program at WIPP III
~ til
~ ~'"=.; Survey Direction ~lil Room Accuracy U=Up Angle.... 0
'" Hole or S=Surveyed North-South East-West Elevation Dia. Length D=Down In ?ZN
@ Number Location A=Approximate Coordinates· Coordinates· m cm m H=Horiz. Degrees References" Remarks t:lr"
~A1X01 A1 S N1147.02 E1254.40 400.28 10 15.2 0 90 B,D,E Monitored as part of the BSEP from 3/85 to 2/91. c:
A1X02 A1 S N1146.88 E1254.24 405.78 10 18 U 90 B,D,E Monitored as part of the BSEP since It was drilled In~0
3/85, to 8/93 when collecting device malfunctionedz
and became erratic. ~0
A2X01 A2 S N1393.72 E1338.88 399.65 10 15.3 0 90 B,D,E Monitored as part of the BSEP from 2/85 to 10/90. ~A2X02 A2 S N1393.65 E1338.89 405.03 10 16.1 U 90 B,D,E Monitored as part of the BSEP from 2/85 to 9/89. ~
0
~A3X01 A3 S N1137.94 E1406.84 399.22 10 15.4 0 90 B,D,E Monitored as part of the BSEP from when it was
~drilled In 1/85 to 6/93. Drillers did not report any
~moisture while drilling. Hole started producing brine :ga few weeks later•
....
...>-' A3X02 A3 S N1138.00 E1406.89 404.75 10 15.5 U 90 B,D,E Monitored from 1/85 to 9/89. Drillers did not
encounter moisture while drilling. Hole startedproducing brine a few weeks later.
BTPA1 S16201W170 A S1638 W162 384 7.6 1.6 0 90 B Open from 0 to 1.6 m. Drilled for the B~EP study7/86 and monitored until 12/02/88.
BTPA2 S16201W170 A S1638 W166 384 7.6 2.8 D 90 B Cased from 0 to 1.6 m. Open from 1.6 to 2.8 m.Drilled for the BSEP study 7/86 and monitored until12/02/88.
BTPA3 S16201W170 A S1638 W170 384 7.6 4.1 D 90 B Cased from 0 to 3.1 m. Open from 3.1 to 4.1 m.Drilled for the BSEP study 7/86 and monitored until12/02/88.
BTPA4 S16201W170 A 81638 W166 388 7.6 1.4 U 90 B Open from 0 to 1.4 m. Drilled for the B8EP study7/86 and monitored until 9/27/88. Dry.
BTPA5 816201W170 A 81638 W170 388 7.6 1.6 U 90 B Open from 0 to 1.6 m. Drilled for the BSEP study ~.... 7/86 and monitored until 9/27/88. Dry.~0
0;~ ~0 :t00
·The repository is referenced In feet; therefore, the North-South and East-West coordinates are presented In feet.··For references, see footnote at end of table.

Table A·1 (Continued);l>- List of Underground Locations Where Brine Occurrences ttlc ~~ Were Observed and Monitored Through December, 1993 [rl
'"" en~ As Part of the Brine Sampling and Evaluation Program at WIPP ~~ 'tl
:;; ~:.; (;)
'" Survey Direction~'"N Room Accuracy U=Up Angle~
ttl Hole or S=Surveyed North-South East-West Elevation Dia. Length D=Down in ~r-Number Location A=Approximate Coordinates' Coordinates' m cm m H=Horiz. Degrees References" Remarks
~BTPB1 S16201W170 A S1636 W162 384 7.6 1.6 D 90 B Open from 0 to 1.6 m. Drilled for the BSEP study ~
07/86 and monitored until 9/27/88. z
'tl
~BTPB2 S16201W170 A S1636 W166 384 7.6 2.9 D 90 B Cased 0 to 1.8 m. Open from 1.8 to 2.9 m. Drilled (;)
for the BSEP study 7/86 and monitored until 9/27/88. ~BTPB3 S16201W170 A 51636 W170 384 7.6 4.1 D 90 B Cased 0 to 3.1 m. Open from 3.0 to 4.1 m. Drilled ~
0for the BSEP study 7/86 and monitored until 9/27/88. ~
BTPB4 S16201W170 A 51636 W166 388 7.6 3.0 U 90 B Cased 0 to 2.1 m. Open from 2.1 to 3.0 m. Drilled ~for the BSEP study 7/86 and monitored until 9/27/88. :0
'";J> '"I
BTPB5 S16201W170 A S1636 W170 388 7.6 3.1 U 90 B Cased 0 to 1.9 m. Open from 1.9 to 3.1 m. Drilled1-1Itv for the BSEP study 7/86 and monitored until 9/27/88.
BTPC1 S16201W170 A 51634 W162 384 7.6 1.5 D 90 B Open from 0 to 1.5 m. Drilled for the BSEP study7/86 and monitored until 9/27/88.
BTPC2 S16201W170 A S1634 W166 384 7.6 3.0 D 90 B Cased from 0 to 1.7 m. Open from 1.8 to 3.0 m.Drilled for the BSEP study 8/86 and monitored until9/27/88.
BTPC3 S16201W170 A S1634 W170 384 7.6 4.4 D 90 B Cased from 0 to 3.0 m. Open from 3.0 to 4.4 m.Drilled for the BSEP study 8/86 and monitored until9/27/88.
BTPC4 S16201W170 A S1634 W166 388 7.6 5.4 U 90 B Cased from 0 to 4.2 m. Open from 4.2 to 5.4 m.Drilled for the BSEP study 7/86 and monitored until9/27/88.
BTPC5 S16201W170 A S1634 W170 388 7.6 5.5 U 90 B Cased from 0 to 4.3 m. Open from 4.3 to 5.5 m.Drilled for the BSEP study 7/86 and monitored until ~
'"9/27/88. Dry. ~
~ 0'" x~b :t00
'The repository is referenced in feet; therefore, the North-South and East-West coordinates are presented in feel."For references, see footnote at end of table.

Table A-1 (Continued)
> List of Underground Locations Where Brine Occurrences tilt: Were Observed and Monitored Through December, 1993 ~~ tIl"" As Part of the Brine Sampling and Evaluation Program at WIPP en~
~~ ""~ !i2;a Survey Direction Cl..,:0 Room Accuracy U=Up Angle ~."~ Hole or S=Surveyed North-South East-West Elevation Dia. Length D=Down intil
~.. Number Location A=Approximate Coordinates· Coordinates· m cm m H=Horiz. Degrees References" Remarks
BTR1 S1950/E100 A S1942 E98 387 8.3 0.3 H 5 B Hole slightly declined below horizontal. Collar above ~upper clay seam, about 0.3 m below back. Drilled 0z6/86 and monitored until 9/27188. Dry. "";a0
ClBTR2 S1950/E100 A S1942 E100 387 8.3 1.0 H 5 B Hole slightly declined below horizontal. Collar above
~upper clay seam, about 0.3 m below back. Drilled6/86 and monitored until 12/02/88. ~
0
BTR3 S1950/E100 A S1942 E101 387 8.3 1.0 H 5 B Hole slightly declined below horizontal. Collar above ~
upper clay seam, about 0.3 m below back. Drilled :0~6/86 and monitored until 12/02/88. :0'"> ..,
I BTR4 S1950/E100 A S1942 E98 386 8.3 0.3 H 5 B Hole slightly declined below horizontal. Collar Int-4
halite about 1.1 m below back. Drilled 6/86 andIwmonitored until 12/02/88.
BTR5 S1950/E100 A S1942 E100 386 8.3 0.9 H 5 B Hole slightly declined below horizontal. Collar inhalite about 1.1 m below back. Drilled 6/86 andmonitored until 12/02/88.
BTR6 S1950/E100 A S1942 E101 386 8.3 0.9 H 5 B Hole slightly declined below horizontal. Collar inhalite about 1.1 m below back. Drilled 6/86 andmonitored until 12/02/88.
BTR7 S1950/E100 A S1942 E98 386 8.3 0.3 H 5 B Hole slightly declined below horizontal. Collar justabove orange band. Drilled 6/86 and monitored until12/02/88. Dry.
BTR8 S1950/E100 A S1942 E100 386 8.3 0.9 H 5 B Hole slightly declined below horizontal. Collar justabove orange band. Drilled 6/86 and monitored until12/02/88.
BTR9 S1950/E100 A S1942 E101 386 8.3 0.9 H 5 B Hole slightly declined below horizontal. Collar just ~.., above orange band. Drilled 6/86 and monitored until ~00; 12/02/88.
~00
b~00
*The repository is referenced in feet; therefore, the North-South and East-West coordinates are presented in feet.**For references, see footnote at end of table.
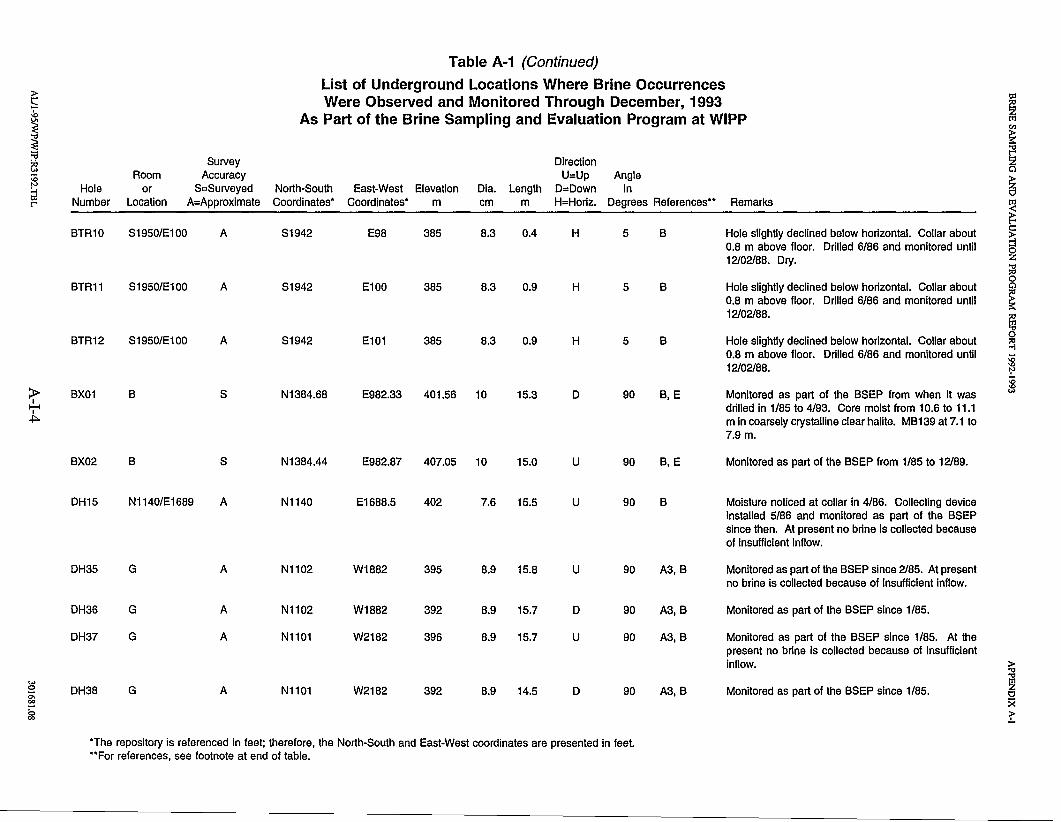
Table A-1 (Continued)
;l>List of Underground Locations Where Brine OccurrencesWere Observed and Monitored Through December, 1993 ttlc
~:b As Part of the Brine Sampling and Evaluation Program at WIPPv. Ct1
~ fIl
~ ~'"Cl
::aSurvey Direction ~;;,
'" Room Accuracy U=Up AngleC)
:0~N Hole or S=Surveyed North-South East-West Elevation Dia. Length D=Down in@
r Number Location A=Approximate Coordinates· Coordinates· m cm m H=Horiz. Degrees References·· Remarks~r
BTR10 S1950/E100 A S1942 E98 385 8.3 0.4 H 5 B Hole slightly declined below horizontal. Collar about c:~0.8 m above floor. Drilled 6/86 and monitored until 0
12/02/88. Dry. z'"Cl;<l0
BTR11 S1950/E100 A S1942 E100 385 8.3 0.9 H 5 B Hole slightly declined below horizontal. Collar about C)
0.8 m above floor. Drilled 6/86 and monitored until ~12/02/88.
~BTR12 S1950/E100 A S1942 E101 385 8.3 0.9 H 5 B Hole slightly declined below horizontal. Collar about
0
~0.8 m above floor. Drilled 6/86 and monitored until :012/02/88. '"':"
;:J>~
BX01 B S N1384.68 E982.33 401.56 10 15.3 0 90 B,E Monitored as part of the BSEP from when it was '"II-i drilled in 1/85 to 4/93. Core moist from 10.6 to 11.1I.j::>. m in coarsely crystalline clear halite. MB139 at 7.1 to
7.9m.
BX02 B S N1384,44 E982.87 407.05 10 15.0 U 90 B, E Monitored as part of the BSEP from 1/85 to 12/89.
DH15 N1140/E1689 A N1140 E1688.5 402 7.6 15.5 U 90 B Moisture noticed at collar in 4/86. Collecting deviceInstalled 5/86 and monitored as part of the BSEPsince then. At present no brine Is collected becauseof insufficient Inflow.
DH35 G A N1102 W1882 395 8.9 15.8 U 90 A3,B Monitored as part of the BSEP since 2/85. At presentno brine is collected because of insufficient Inflow.
DH36 G A N1102 W1882 392 8.9 15.7 0 90 A3,B Monitored as part of the BSEP since 1/85.
DH37 G A N1101 W2182 396 8.9 15.7 U 90 A3,B Monitored as part of the BSEP since 1/85. At thepresent no brine is collected because of Insufficientinflow. ~
'"Cl
'" !.1l0 DH38 G A N1101 W2182 392 8.9 14.5 D 90 A3,B Monitored as part of the BSEP since 1/85.~ ~00
b !:00
·The repository is referenced in feet; therefore, the North-South and East-West coordinates are presented in feet.··For references, see footnote at end of table.

• Table A-1 (Continued)
> List of Underground Locations Where Brine Occurrences tllc: Were Observed and Monitored Through December, 1993 ~
~tIl
As Part of the Brine Sampling and Evaluation Program at WIPP CI:l
~~""
"" ~l" Survey Direction Cl'";;; Room Accuracy U=Up Angle S;..,@ Hole or S=Surveyed North-South East-West Elevation Dia. Length D=Down in 0
r- Number Location A=Approximate Coordinates· Coordinates· m cm m H=Horiz. Degrees References·· Remarks ~c::
DH39 G A N1101 W2482 395 8.9 14.5 U 90 A3,B Monitored as part of the BTP since 2/85. At the ~present no brine is collected because of Insufficient 0zinflow. ""::<l
0Cl
DH40 G A N1101 W2482 392 8.9 15.5 D 90 A3,B Monitored as part of the BSEP since 1/85.~
DH41 G A N1101 W2782 395 8.9 15.2 U 90 A3,B Monitored as part of the BSEP since 2/85. At the ~present no brine is collected because of Insufficient 0
Inflow. ~;;;
DH42 G A N1101 W2782 392 8.9 15.6 D 90 A3,B Monitored as part of the BSEP since 2/85. ~:g
> '"I DH42A G A N1101 W2789 392 8.9 12.6 D 90 A3,B Monitored as part of the BSEP since 2/85.-IUI
Gas releases had been observed In this hole.DH215 S1960/E153 A S1960 E153 388 7.6 15.8 U 90 A1,BMonitored as part of the BSEP from 1/85 to 11/90. Atthe present no brine Is collected due to Insufficientinflow.
DH216 S1960/E153 A S1960 E153 385 7.6 16.5 D 90 A1,B Gas releases had been observed in this hole.Monitored as part of the BSEP from 1/85 to 6/85when collar was destroyed and hole plugged bymining.
DH317 S16001W30 A S1600 W33 388 7.6 15.3 U 90 A2,B Stalactite growth monitored as part of the BSEP from5/85 to 2/86.
DH317A S16001W30 A S1600 W28 388 7.6 1.5 U 90 A2,B Stalactite growth monitored as part of the BSEP from5/85 to 2/86.
DH317B S16001W30 A S1597 W27 388 8.9 15.5 U 90 A2,B Gas pocket at 14.0 m. Brine seeped from hole afterdrill rods were broken at end of run at depth of 5 m.
IProbable source was anhydrite "a". Stalactite growth
'" monitored as part of the BSEP from 5/85 to 2/86.00: I ~00
<:> ~00 .....
·The repository is referenced in feet; therefore, the North-South and East-West coordinates are presented in feet.""For references, see footnote at end of table.

Table A-1 (Continued)
>- List of Underground Locations Where Brine Occurrences tl'lc ~-0 Were Observed and Monitored Through December, 1993 ttl
~ As Part of the Brine Sampling and Evaluation Program at WIPP en
"tl ~~ "tl
:;; ~;<, C)w Survey Direction~
~N Room Accuracy U=Up Angle~tl'l Hole or S=Surveyed North-South East-West Elevation Dia. Length D=Down in
~..
Number Location A=Approxlmate Coordinates· Coordinates· m em m H=Horiz. Degrees References·· Remarksc:
DHP401 S1950/E1330 A S1950 E1330 387 10 15.1 U 90 B Drilled 1/87, observed as part of the BSEP since ~a3/87. At the present no brine is collected due to z
"tlinsufficient Inflow. ::<la
C)
DHP402A S1950/E1330 A S1950 E1330 383 10 15.2 0 90 B Drilled 12/86, observed as part of the BSEP since ~12/86. Hole offset at 13.7 m. There may be a rock
~bolt or piece of steel in hole. a
EES12B N1430/E0140 A N1430 E140 4.7 0 K Drilled 6/86 as part of the Excavation Effects Study.::l
398 3 90
~Observed as part of the BSEP from date of drillinguntil 12/86. Rapid brine and gas Inflow through open ~
'";I> fractures. w
I~I
EES21B S0700/E0066 A S700 E66 381 4.7 2.7 0 90 K Drilled 7/86 as part of the Excavation Effects Study.0\Observed as part of tho BSEP since drilling until12/86. Rapid brine and gas inflow through fractures.
GSEEP G A N1095 W1837 391 B Damp area on the floor of Room G, near south rib,approximately 13.7 m east of DH35. Seep noticed8/85. Damp area larger in 11/85. Monitored as partof the BSEP since 11/85. 40 em diameter collectingsump drilled 9/87.
IG201 2 S N1275.54 W379.51 394.71 7.3 16.4 0 90 A3,B,H,J Monitored as part of the BSEP from 11/84 to 9/87when shear closure pinched hole shut so that samplerwould not go to bottom.
IG202 1 S N1264.79 W246.11 395.17 7.3 14.7 0 90 A3, B, H, J Monitored as part of the BSEP from 11/84 to 7/87when shear closure pinched hole shut so that sampler,would not go to bottom. Last BSEP brine datacollected in 3/87.
>-Drilled 8/08/85; drillers reported water at 2.4 m. Not
"tlJV8 J S N1067 W374 393 91 2.5 0 90 D,F,G "tl
wmonitored after initial observation. ~0
0: tlco S<b ~co
·The repository is referenced in feet; therefore, the North-South and East-West coordinates are presented in feet."For references, see footnote at end of table.

Table A-1 (Continued)
>List of Underground Locations Where Brine OccurrencesWere Observed and Monitored Through December, 1993 til
~ ~'" As Part of the Brine Sampling and Evaluation Program at WIPP~
1Il
'"~ ~
'"~ Survey Direction ~:0'" Room Accuracy U=Up Angle
Cl:0
~'" Hole or S=Surveyed North-South East-West Elevation Oia. Length O=Oown in@ 0l'"" Number Location A=Approximate Coordinates· Coordinates· m em m H=Horiz. Degrees References·· Remarks
~JV9 J S N1067 W378 393.3 91 2.5 0 90 O,G Brine in bottom of pilot hole on 8/20/85. Not c:
~monitored after initial observation.~
L1S25 L1 N1524 W218 400 0 B,H ' Monitored as part of the BSEP from 8/85 to 6/89. '"A 10 3.6 90 :00Cl
L1S26 L1 A N1524 W220 400 10 3.6 0 90 B,H Monitored as part of the BSEP from 8/85 to 6/89. ~L1S27 L1 A N1524 W222 400 10 3.6 0 90 B,H Monitored as part of the BSEP from 8/85 to 6/89. ~
0
L1S28 L1 A N1524 W224 400 10 3.7 0 90 B,H Monitored as part of the BSEP from 8/85 to 6/89.~:0~
L1S29 L1 A N1524 W226 400 10 3.7 0 90 B,H Monitored as part of the BSEP from 8/85 to 6/89. :0'"»- '"I
L1S30 L1 A N1524 W228 400 10 3.7 0 90 B,H Monitored as part of the BSEP from 8/85 to 6/89.~-l
L1S31 L1 A N1524 W235 400 10 3.6 0 90 B,H Monitored as part of the BSEP from 8(85 to 6/89.
L1S32 L1 A N1524 W237 400 10 3.6 0 90 B,H Monitored as part of the BSEP from 8/85 to 6/89.
L1S33 L1 A N1524 W239 400 10 3.6 0 90 B,H Monitored as part of the BSEP from 8/85 to 6/89.
L1S34 L1 A N1524 W241 400 10 3.7 0 90 B,H Monitored as part of the BSEP from 8/85 to 6/89.
L1S35 L1 A N1524 W243 400 10 3.8 0 90 B,H Monitored as part of the BSEP from 8/85 to 6/89.
L1S36 L1 A N1524 W245 400 10 3.7 0 90 B,H Monitored as part of the BSEP from 8/85 to 6/89.
L1XOO L1 A N1538.5 W225 400 10 3.8 0 90 B,H Drillers found water In hole at 3 m, 5/13/84.Monitored as part of the BSEP from 10/84 to 4/89.
/
L2C03 L2 A N1510 W365 400 41 3.7 0 90 B,H Drilled 4/85 overcoring and destroying L2C25. Brineand gas enters hole quickly through open fractures.Monitored intermittently as part of the BSEP from ~
12/85 through 12/86. '"'" ~00; 0~ S<b :t<Xl
-·The repository is referenced in feet; therefore, the North-South and East-West coordinates are presented in feet.""For references, see footnote at end of table.

Table A-1 (Continued)
» List of Underground Locations Where Brine OccurrencesWere Observed and Monitored Through December, 1993 tl:l
S ~'" As Part of the Brine Sampling and Evaluation Program at WIPPv. ttl
~ en
~ ~'tl
:;;Survey Direction 2;0
'" Room Accuracy U=Up AngleC)
:;;~N Hole or S=Surveyed North-South East-West Elevation Oia. Length O=Oown in@ 0
r Number Location A=Approximate Coordinates' Coordinates' m cm m H=Horiz. Degrees References" Remarks
~L2C25 L1 A N1510 W365 400 12.7 3.5 0 90 B,H L2C25 is a 12.7 cm overcore of a previously grouted c::
~SNUNM test hole. The overcore was drilled 3/85 and 0air and brine was blown through fractures into hole z
'tlL2C29, 1.2 m to the north. In 4/85, a 40 cm overcore :0
0was made destroying this hole. The larger hole is C)
designated L2C03. ~MIIT2 J S N1088.03 W377.02 393.44 8.3 0.9 0 90 B,O,G Brine since drilled; monitored from 10/84 to 4/85. ~
0
S N1086.05 W377.13 B, D,G Brine since drilled; monitored from 10/84 to 4/85.~
MIIT4 J 393.44 8.3 1.0 0 90 :;;~
MIIT6 J S N1084.16 W377.15 393.36 8.3 1.0 0 90 B,O,G Brine since drilled; monitored from 10/84 to 4/85. :;;;I> \£I
MIIT8 J S N1082.08 W377.24 393.34 8.3 1.0 0 90 B,D,G Brine since drilled; monitored from 10/84 to 4/85.t-iI
00
MIIT10 J S Ni079.98 W377.23 393.31 n n 1.0 D 90 S,D,G Brine since drilled; monitored from 10/84 to 4/85.0.'>
MIIT12 J S N1078.11 W377.21 393.25 8.3 1.0 0 90 B,O,G Brine since drilled; monitored from 10/84 to 4/85.
MIIT14 J S N1076.18 W377.30 393.14 7.6 1.0 0 90 B,O,G Brine since drilled; monitored from 10/84 to 4/85.
MIIT16 J S N1074.17 W377.18 392.95 7.6 1.0 0 90 B,O,G Brine since drilled; monitored from 10/84 to 4/85.
MIIT17 J S N1072.03 W379.10 393.29 7.6 1.0 0 90 B,O,G Brine since drilled; monitored from 10/84 to 4/85.SNUNM filled hole with Brine A 4/30/85 and pluggedwith rubber cork.
MIIT18 J S N1071.91 W377.18 393.27 7.6 1.0 0 90 B,O,G Brine since drilled; monitored from 10/84 through4/85. SNUNM experiment filled hole with Brine A4/20/85 and plugged hole with rubber cork.
MIIT20 J S N1069.84 W377.22 393.30 7.6 1.8 0 90 B,O,G Brine noted 10/84; monitored from 10/84 through4/85. »
'tl'tl
'" !;£0 MIIT22 J S N1067.93 W377.23 393.30 7.6 1.8 0 90 B,O,G Brine noted 10/84; monitored from 10/84 through~ 0~ 4/85. ><<:> !:ex>
'The repository is referenced in feet; therefore, the North-South and East-West coordinates are presented in feet."For references, see footnote at end of table.

Table A-1 (Continued)
>List of Underground Locations Where Brine Occurrences
tllS Were Observed and Monitored Through December, 1993 ::0
.0 As Part of the Brine Sampling and Evaluation Program at WIPP2!
~ttlen
~ ~'tl
~SUlvey Direction ~:0..., (;)
::0 Room Accuracy U=Up Angle >'" Hole or S=Surveyed North-South East-West Elevation Dia. Length D=Down in z~ 0tll Number Location A=Approximate Coordinates· Coordinates· m em m H=Horiz. Degrees References·· Remarks
~r
rMIIT24 J S N1065.79 W377.21 393.42 7.6 1.8 D 90 B,D,G Brine noted 10/84; monitored 10/84 through 4/85,
c~SNUNM experiment added Brine A to hole 4/30/85 0
and plugged with rubber cork. z'tl::00
MIITP J A N1067 W378 393 3.8 2.7 D 90 B,F Brine since drilled; pilot hole for 0.9-m-diameter hole (;)
that was never completed. Monitored from 4/02/85 ~through 4/23/85.
~Monitored as part of the BSEP from 11/84 to 4/89.
0NG252 2 S N1275.86 W381.05 394.68 3.8 2.3 D 90 A3, B, H, J ~
This hole constantly produced gas. First time noticed ::0was before 10/84. Room closed 6/89. ~
::0'0
~ OH20 S16001W170 S S1610.36 W177.16 386.22 8.9 47.2 H 0-3 L Collared about 0.3 m above the orange band,...,
I-t bottoms in Map Unit 0 below the orange band.I\0 Monitored as part of the BSEP since It was drilled
3/89.
OH21 S16001W170 S S1605.36 W177.16 385.50 8.9 16.2 H 0-3 L Collared about 0.3 m below the orange band.Monitored for the BSEP since it was drilled 12/88.
OH22 S16001W170 S S1615.36 W177.16 386.65 8.9 15.1 H 0-3 L Collared about 0.6 m above the orange band.Monitored for the BSEP since it was drilled 12/88.
OH23 S19501W170 S S1950.41 W178.86 384.94 8.9 46.0 H 0-3 L Collared about 0.3 m above the orange band,bottoms in Map Unit 0 below the orange band.Monitored for the BSEP since it was drilled 2/89.
OH24 S19501W170 S S1945.41 W178.86 384.11 8.9 15.2 H 0·3 L Collared about 0.3 m below the orange band.Monitored for the BSEP from 3/89 to 8/90.
OH25 S19501W170 S 81955.41 W178.86 385.27 8.9 15.2 H 0-3 L Collared about 0.6 m above the orange band.Monitored for the BSEP from 3/89 to 8/90.
~..., OH26 S21801W170 S S2183.01 W177.14 384.70 8.9 45.7 H 0-3 L Collared about 0.3 m above the orange band, ~0 bottoms in Map Unit 0 below the orange band.a; 0~ Monitored for the B8EP since It was drilled 3/89. ><b :t00
·The repository is referenced in feet; therefore, the North-South and East-West coordinates are presented in feet.··For references, see footnote at end of table.

Table A-1 (Continued)
;l>List of Underground Locations Where Brine OccurrencesWere Observed and Monitored Through December, 1993 tl:lS;
~.:,As Part of the Brine Sampling and Evaluation Program at WIPPU\ ttl
~ CIl
~ ~""::a
Survey Direction ~;.:,w
Room Accuracy U=Up Angle0
~
~...,
Hole or S=Surveyed North-South East-West Elevation Dia. Length D=Down in@r Number Location A=Approximate Coordinates· Coordinates· m cm m H=Horlz. Degrees References·· Remarks ~
~OH27 S21801W170 S S2178.01 W177.14 385 8.9 15.1 H 0-3 L Collared about 0.6 m above the orange band. c::
~Monitored for the BSEP since it was drilled 4/89 to a10/91. Hole dry. z
""::<laOH27A S21801W170 S S2177.01 W177.14 385 8.9 1.2 H 0-3 L Short offset hole to OH27. Collared about 0.6 m 0
above the orange band. Monitored for the BSEP ~since it was drilled 4/89 to 12/89. Hole dry.
~OH28 S21801W170 S S2188.01 W177.14 383.78 8.9 15.1 H 0-3 L Collared about 0.3 m below the orange band.
a~
, Monitored for the BSEP since it was drilled 4/89. :gt;>
;I>OH35 AIS/S90 S S100.73 W628.97 383.45 8.9 3.1 D 90 M Drilled for hydrologic testing of fractures beneath the :g
floor. Not a part of routine BSEP sampling. wI~I.......
OH36 AIS/S90 S S96.71 W623.11 M Drilled for hydrologic testing of fractures beneath the0 383.39 8.9 3.1 D 90floor. Not a part of routine BSEP sampling.
OH37 AIS/S90 S S97.66 W609.39 383.35 8.9 3.1 D 90 M Drilled for hydrologic testing of fractures beneath thefloor. Not a part of routine BSEP sampling.
OH38 AIS/S90 S S97.35 W595.62 383.36 8.9 3.1 D 90 M Drilled for Marker Bed 139 hydrologic testing. Not apart of routine BSEP sampling.
OH39 AIS/S90 A S97 W540 383 8.9 3 D 90 M Drilled for hydrologic testing of fractures beneath thefloor. Not a part of routine BSEP sampling.
OH40 AIS/S90 S S96.91 W485.10 383.02 8.9 3 D 90 M Drilled for hydrologic testing of fractures beneath thefloor. Not a part of routine BSEP sampling.
OH41 AIS/S90 S S110.52 W622.79 383.44 8.9 3.5 D 90 M Drilled for hydrologic testing of fractures beneath thefloor. Not a part of routine BSEP sampling.
OH42 AIS/S90 S S43.44 W622.54 383.62 8.9 3.2 D 90 M Drilled for hydrologic testing of fractures beneath the ;l>
""floor. Not a part of routine BSEP sampling. ""w~:=
'" tl00 )<0 3:00
"The repository is referenced in feet; therefore, the North-South and East-West coordinates are presented in feet.""For references, see footnote at end of table.

Table A-1 (Continued)
>List of Underground Locations Where Brine OccurrencesWere Observed and Monitored Through December, 1993 tilc: ::<l
:b As Part of the Brine Sampling and Evaluation Program at WIPP 52"- ttl
~ en
~ ~"":;;
Survey Direction ~::a'" Room Accuracy U=Up Angle
0:0 >t; Hole or S=Surveyed North-South East-West Elevation Dla. Length D=Down in z
0til Number Location A=Approximate Coordinates· Coordinates· m cm m H=Horiz. Degrees References·· Remarks ttll""
~OH43 AIS/S90 S S124.01 W622.52 383.45 8.9 3.7 0 90 M Drilled for hydrologic testing of fractures beneath the c::
~floor. Not a part of routine BSEP sampling. 0zAIS/S90 S S134.53 W622.31 M Drilled for hydrologic testing of fractures beneath the ""OH44 383.46 8.9 3.4 D 90 ::<l
0floor. Not a part of routine BSEP sampling. 0
~OH45 Core Library S S391.51 W326.35 384.15 8.9 14.9 H 0-3 L Monitored for the BSEP since it was drilled 6/89.
~OH46 Core Library S S391.51 W319.01 381.65 8.9 15.3 D 90 L Monitored for the BSEP since it was drilled 6/89.
0
Cl:0
OH47 Core Library S S391.51 W319.01 385.90 8.9 15.2 U 90 L Monitored for the BSEP since It was drilled 7/89. Hole ~
> dry. :g'"I
I-lP4X84 SPDV Room 4 A N1138 W0644 394 91.4 4.8 D 90 B Large diameter downhole in south end of Room 4I......
often shown to visitors. MB 139 and fractures......beneath the floor are well exposed, both of which aredry. This is good evidence that no far-field flowexists.
PR2 S1600/E140 A S1600 E140 388 5 6.1 U 90 BtC Stalactite growth monitored as part of the BSEP from5/85 to 2186.
PR3 S12821E140 A S2182 E140 385 5 6.1 U 90 BtC Stalactite growth monitored as part of the BSEP from5/85 to 2186.
PR4 S2748/E140 A S2748 E140 381 5 6.1 U 90 B,C Stalactite growth monitored as part of the BSEP from5/85 to 2186.
WWC1 Room C1 A, N1420 E1572 398.96 91 4.9 H 0 B Large horizontal hole on south rib of N1420 drift,across from Room C1. Photographically monitoredfor salt buildup.
~""'" ~0
0: 0~ Xb
~'"·The repository is referenced in feet; therefore, the North-South and East-West coordinates are presented in feet.··For references, see footnote at end of table.

>S.0
~~=ti~~@r
>-I
~.....N
wo
'"00
o00
Footnote
A1A2A3BCDEFGHJKLN
Table A-1 (Concluded)
List of Underground Locations Where Brine OccurrencesWere Observed and Monitored Through December, 1993
As Part of the Brine Sampling And Evaluation Program at WIPP
TSC-D'Appolonia, 1983 (WIPP-DOE-163)Bechtel, 1984 (WIPP-DOE-202)Bechtel, 1985 (WIPP-DOE-213)Brine Sampling and Evaluation Program FileRecords of Special Drill Holes, September 12, 1983: BSEP FilesAs-Built Survey Calculation Sheets: BSEP FilesField Notes, J. Gallerani, Bechtel: BSEP FilesField Notes, D. Deal, IT Corporation: BSEP FilesRoom J Brine Survey: BSEP FilesRoom L1 and L2 Field Notes: BSEP FilesGeotechnical Instrumentation List, November 2, 1983: BSEP filesExcavation Effects Drilling Program, Data Transmittal August 12, 1986: Excavation Effects Files: WIPP Geotechnical Engineering FilesDrilling Record Log: BSEP FilesSurvey Data Sheet: WIPP Geotechnical Engineering Files
l:J:l
~tIl
~"'"~Cl
~
~~oz
~Cl
~~~
~;;;~
~
~><~

APPENDIX A
BRINE ACCUMULATION
PART II-BRINE ACCUMULATION DATA TABLES

BRINE SAMPLING AND EVALUATION PROGRAM REPORT 1992-1993
THIS PAGE INTENTIONALLY LEFT BLANK
AU4-95IWPIWIP:R3192A
APPENDIX A
301681.08

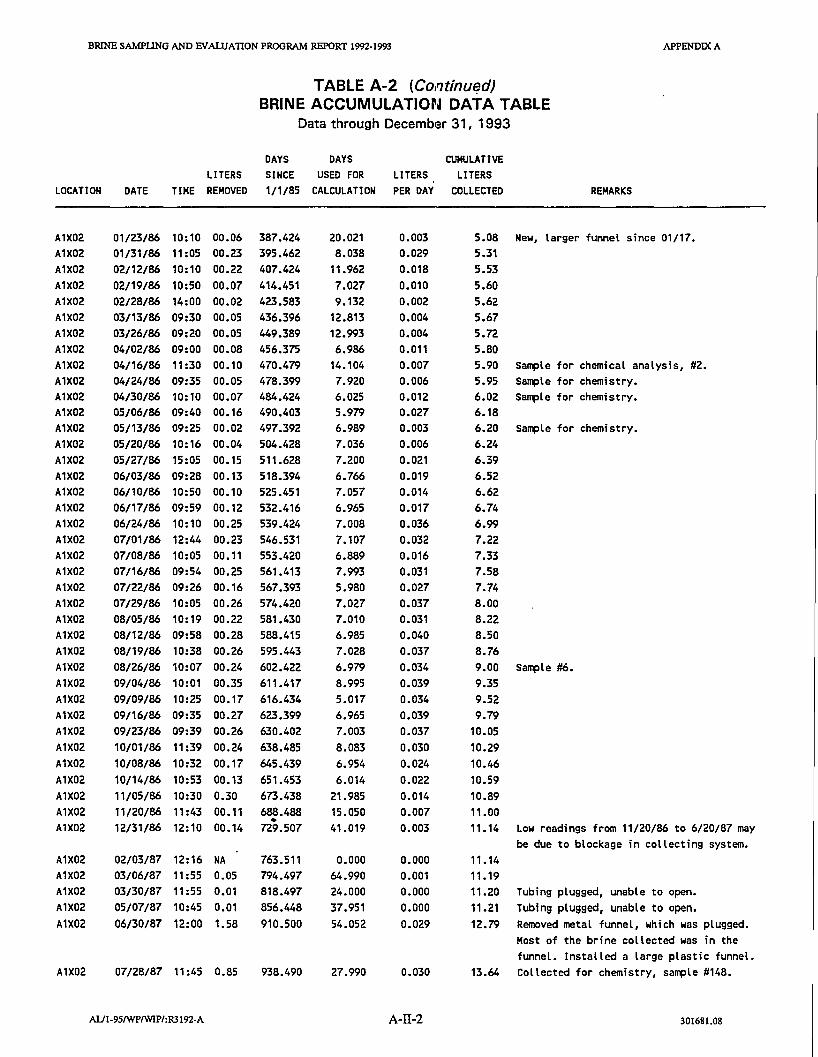
BRINE SAMPliNG AND EVALUATION PROGRAM REPORT 1992-1993 APPENDIX A
TABLE A-2 (Continu~d)
BRINE ACCUMULATION DATA TABLEData through Decembler 31, 1993
DAYS DAYS CUMULATIVELITERS SINCE USED FOR LITERS LITERS
LOCATION DATE TIME REMOVED 1/1/85 CALCULATION PER DAY COLLECTED REMARKS
A1XD2 01/23/86 10: 10 00.06 387.424 20.021 0.003 5.08 New, larger funnel since 01/17.A1X02 01/31/86 11:05 00.23 395.462 8.038 0.029 5.31A1X02 02/12/86 10:10 00.22 407.424 11.962 0.018 5.53A1X02 02/19/86 10:50 00.07 414.451 7.027 0.010 5.60A1X02 02/28/86 14:00 00.02 423.583 9.132 0.002 5.62A1X02 03/13/86 09:30 00.05 436.396 12.813 0.004 5.67A1X02 03/26/86 09:20 00.05 449.389 12.993 0.004 5.nA1X02 04/02/86 09:00 00.08 456.375 6.986 0.011 5.80A1X02 04/16/86 11:30 00.10 470.479 14.104 0.007 5.90 Sample for chemical analysis, #2.A1X02 04/24/86 09:35 00.05 478.399 7.920 0.006 5.95 Sample for chemistry.A1X02 04/30/86 10:10 00.07 484.424 6.025 0.012 6.02 Sample for chemistry.A1X02 05/06/86 09:40 00.16 490.403 5.979 0.027 6.18A1X02 05/13/86 09:25 00.02 497.392 6.989 0.003 6.20 Sample for chemistry.A1X02 OS/20/86 10: 16 00.04 504.428 7.036 0.006 6.24A1X02 OS/27/86 15:05 00.15 511.628 7.200 0.021 6.39A1X02 06/03/86 09:28 00.13 518.394 6.766 0.019 6.52A1X02 06/10/86 10:50 00.10 525.451 7.057 0.014 6.62A1X02 06/17/86 09:59 00.12 532.416 6.965 0.017 6.74A1X02 06/24/86 10:10 00.25 539.424 7.008 0.036 6.99A1X02 07/01/86 12:44 00.23 546.531 7.107 0.032 7.22A1X02 07/08/86 10:05 00.11 553.420 6.889 0.016 7.33A1X02 07/16/86 09:54 00.25 561.413 7.993 0.031 7.58A1X02 07/22/86 09:26 00.16 567.393 5.980 0.027 7.74A1X02 07/29/86 10:05 00.26 574.420 7.027 0.037 8.00A1X02 08/05/86 10:19 00.22 581.430 7.010 0.031 8.22A1X02 08/12/86 09:58 00.28 588.415 6.985 0.040 8.50A1X02 08/19/86 10:38 00.26 595.443 7.028 0.037 8.76A1X02 08/26/86 10:07 00.24 602.422 6.979 0.034 9.00 Sample #6.A1X02 09/04/86 10:01 00.35 611.417 8.995 0.039 9.35A1X02 09/09/86 10:25 00.17 616.434 5.017 0.034 9.52A1X02 09/16/86 09:35 00.27 623.399 6.965 0.039 9.79A1X02 09/23/86 09:39 00.26 630.402 7.003 0.037 10.05A1X02 10/01/86 11:39 00.24 638.485 8.083 0.030 10.29A1X02 10/08/86 10:32 00.17 645.439 6.954 0.024 10.46A1X02 10/14/86 10:53 00.13 651.453 6.014 0.022 10.59A1X02 11/05/86 10:30 0.30 673.438 21.985 0.014 10.89A1X02 11/20/86 11:43 00.11 688.488 15.050 0.007 11.00.A1X02 12/31/86 12:10 00.14 n9.507 41.019 0.003 11.14 Low readings from 11/20/86 to 6/20/87 may
be due to blockage in collecting system.A1X02 02/03/87 12:16 NA 763.511 0.000 0.000 11.14A1X02 03/06/87 11:55 0.05 794.497 64.990 0.001 11.19A1X02 03/30/87 11:55 0.01 818.497 24.000 0.000 11.20 Tubing plugged, unable to open.A1X02 05/07/87 10:45 0.01 856.448 37.951 0.000 11.21 Tubing plugged, unable to open.A1X02 06/30/87 12:00 1.58 910.500 54.052 0.029 12.79 Removed metal funnel, which was plugged.
Most of the brine collected was in thefunnel. Installed a large plastic funnel.
A1X02 07/28/87 11:45 0.85 938.490 27.990 0.030 13.64 Collected for chemistry, sample #148.
AUI-951WPIWIP/:R3192-A A-II-2 301681.08

BRINE SAMPUNG AND EVALUATION PROGRAM REPORT 1992-1993 APPENDIX A
TABLE A-2 (Continued)BRINE ACCUMULATION DATA TABLE
Data through December 31, 1993
DAYS DAYS CUMULATIVELITERS SINCE USED FOR LITERS LITERS
LOCATION DATE TIME REMOVED 1/1/85 CALCULATION PER DAY COLLECTED REMARKS
-A1X02 09/01/87 11:55 0.94 973.497 35.007 0.027 14.58 Collected for chemistry, sallllle #159 A&B.A1X02 10/20/87 10:59 1.84 1022.458 48.961 0.038 16.42A1X02 11/19/87 10:30 1.09 1052.438 29.980 0.036 17.51 Collected for chemistry, sallllle 226.A1X02 01/04/88 11:05 3.73 1098.462 46.024 0.081 21.24A1X02 02/08/88 13:17 1.65 1133.553 35.091 0.047 22.89 Collected for chemistry, sallllle #299, #300,
#301 & #302.A1X02 03/30/88 12:20 4.86 1184.514 50.961 0.095 27.75 Collected for chemistry, sallllle #343 -
#352.A1X02 06/14/88 09:00 5.15 1260.375 75.861 0.068 32.90 Collected for chemistry, sallllle #402 -
#406. Removed to provide room for furthercollection.
A1X02 07/12/88 09:30 1.11 1288.396 28.021 0.040 34.01 Collected for chemistry, sallllle #458 &
#459.A1X02 09/15/88 11:00 0.18 1353.458 0.000 0.000 34.19 Not fully evacuated. Do not use for
calculation.A1X02 09/27/88 08:30 3.00 1365.354 76.958 0.041 37.19 Collected for chemistry, sallllle #514 -
#519. Used 3.18 liters for calculationCO.18 on 9/15 + 3.00 on 9/27).
A1X02 12/13/88 09:30 2.50 1442.396 77.042 .0.032 39.69 Collected for chemistry, sallllle #597 -#601.
A1X02 03/14/89 09:30 2.96 1533.396 91.000 0.033 42.65A1X02 04/06/89 11:55 NA 1556.497 0.000 0.000 42.65 Room locked.A1X02 04/20/89 10:00 NA 1570.417 0.000 0.000 42.65 Room locked.A1X02 05/17/89 12:05 4.47 1597.503 64.107 0.070 47.12 Sallllle saved for chemistry, sallllle #750 -
751 A & B.A1X02 07/11/89 10:05 2.32 1652.420 54.917 0.042 49.44A1X02 09/12/89 11:35 2.77 1715.483 63.063 0.044 52.21 S8Illlle saved for chemistry.A1X02 10/10/89 09:25 1.57 1743.392 27.909 0.056 53.78 Sallllle saved for chemistry, sallllle #847.A1X02 10/10/89 10:00 NA 1743.417 0.000 0.000 53.78 Repositioned collecting tube from funnel.
Collection point for brine located outsideroom.
A1X02 10/20/89 10:44 NA 1753.447 0.000 0.000 53.78 No S8llllle.A1X02 11/10/89 10:08 1.90 1774.422 31.030 0.061 55.68 Sallllle saved for chemistry, sallllle
#862-1,2,3,4.A1X02 11/29/89 12:10 0.53 1793.507 19.085 0.028 56.21 Sallllle saved for chemistry, sallllle #873.A1X02 12/12/89 09:20 0.05 1806.389 12.882 0.004 56.26 Sallllle saved for chemistry, sallllle #884.
A1X02 01/04/90 10:50 0.22 1829.451 23.062 0.010 56.48 Hose broken, some brine leaked to floor.Fixed hose, funnel full of brine.
A1X02 01/17/90 11:35 1.20 1842.483 13.032 0.092 57.68A1X02 01/31/90 10:27 0.53 1856.435 13.952 0.038 58.21A1X02 02/13/90 09:53 0.29 1869.412 12.977 0.022 58.50A1X02 02/27/90 12:17 0.45 1883.512 14.100 0.032 58.95A1X02 03/05/90 11:11 0.58 1889.466 5.954 0.097 59.53A1X02 03/21/90 11:26 0.18 1905.476 16.010 0.011 59.71A1X02 04/06/90 10:40 0.34 1921.444 15.968 0.021 60.05A1X02 04/17/90 11:53 0.17 1932.495 11.051 0.015 60.22A1X02 04/24/90 10:40 0.01 1939.444 6.949 0.001 60.23
AUl-95fWPIWIP/:R3192-A A-II-3 301681.08

BRINE SAMPUNG AND EVALUATION PROGRAM REPORT 1992-1993 APPENDIX A
TABLE A-2 (Continued)BRINE ACCUMULATION DATA TABLE
Data through DecembElr 31, 1993
DAYS DAYS CUMULATIVELITERS SINCE USED FOR LITERS LITERS
LOCATION DATE TIME REMOVED 1/1/85 CALCULATION PER DAY COLLECTED REMARKS
A1X02 05/02/90 11:49 0.23 1947.492 8.048 0.029 60.46I
A1X02 05/09/90 11:13 0.19 1954.467 6.975 0.027 60.65A1X02 05/16/90 10:49 0.23 1961.451 6.984 0.033 60.88A1X02 OS/23/90 12:32 0.20 1968.522 7.071 0.028 61.08A1X02 05/31/90 10:29 0.25 1976.437 7.915 0.032 61.33A1X02 06/06/90 11:20 0.13 1982.472 6.035 0.022 61.46A1X02 06/14/90 09:51 0.11 1990.410 . 7.938 0.014 61.57A1X02 06/28/90 10:08 0.24 2004.422 14.012 0.017 61.81A1X02 07/14/90 10:00 NA 2020.417 0.000 0.000 61.81 Heaters turned off.A1X02 07/17/90 09:51 0.23 2023.410 18.988 0.012 62.04A1X02 07/25/90 08:30 0.15 2031.354 7.944 0.019 62.19A1X02 08/07/90 10:53 0.32 2044.453 13.099 0.024 62.51A1X02 08/16/90 11:30 0.11 2053.479 9.026 0.012 62.62A1X02 08/22/90 11:52 0.25 2059.494 6.015 0.042 62.87A1X02 08/29/90 12:52 0.32 2066.536 7.042 0.045 63.19A1X02 09/05/90 11:50 0.27 2073.493 6.957 0.039 63.46A1X02 09/13/90 09:58 0.33 2081.415 7.922 0.042 63.79A1X02 09/25/90 12:15 0.46 2093.510 12.095 0.038 64.25A1X02 10/03/90 10:03 0.28 2101.419 7.909 0.035 64.53A1X02 10/10/90 11:43 0.25 2108.488 7.069 0.035 64.78A1X02 10/18/90 11:04 0.31 2116.461 7.973 0.039 65.09A1X02 10/24/90 12:22 0.20 2122.515 6.054 0.033 65.29A1X02 10/31/90 11:50 0.22 2129.493 6.978 0.032 65.51A1X02 11/07/90 10:56 0.23 2136.456 6.963 0.033 65.74A1X02 11/14/90 11:54 0.20 2143.496 7.040 0.028 65.94A1X02 11/28/90 10:56 0.47 2157.456 13.960 0.034 66.41A1X02 12/05/90 09:02 0.21 2164.376 6.920 0.030 66.62A1X02 12/13/90 09:45 0.27 2172.406 8.030 0.034 66.89A1X02 12/20/90 09:04 0.24 2179.378 6.972 0.034 67.13A1X02 01/09/91 09:10 0.71 2199.382 20.004 0.035 67.84A1X02 01/16/91 09:25 0.28 2206.392 7.010 0.040 68.12A1X02 01/23/91 10:20 0.26 2213.431 7.039 0.037 68.38A1X02 01/30/91 10:34 0.27 2220.440 7.009 0.039 68.65A1X02 02/13/91 11:40 0.50 2234.486 14.046 0.036 69.15A1X02 02/20/91 10:55 0.26 2241.455 6.969 0.037 69.41A1X02 02/27/91 10:35 0.24 2248.441 6.986 0.034 69.65A1X02 03/07/91 10:30 0.26 2256.438 7.997 0.033 69.91A1X02 03/20/91 11:31 0.35 2269.480 13.042 0.027 70.26A1X02 03/28/91 11:13 0.15 2277.467 7.987 0.019 70.41A1X02 04/10/91 09:30 0.30 2290.396 12.929 0.023 70.71A1X02 05/14/91 09:57 1.58 2324.415 0.000 0.000 72.29 Partial evacuation.A1X02 05/15/91 10:36 0.12 2325.442 35.046 0.049 72.41 Combined with 1.58 liters from 05/14/91.A1X02 05/30/91 12:15 0.62 2340.510 15.068 0.041 73.03A1X02 06/05/91 14:18 0.20 2346.596 6.086 0.033 73.23A1X02 q6/12/91 10:51 0.25 2353.452 6.856 0.036 73.48A1X02 06/19/91 15:10 0.25 2360.632 7.180 0.035 73.73A1X02 06/26/91 09:50 0.24 2367.410 6.778 0.035 73.97
AU1-951WP1WIP/:R3192-A A-II-4 301681.08
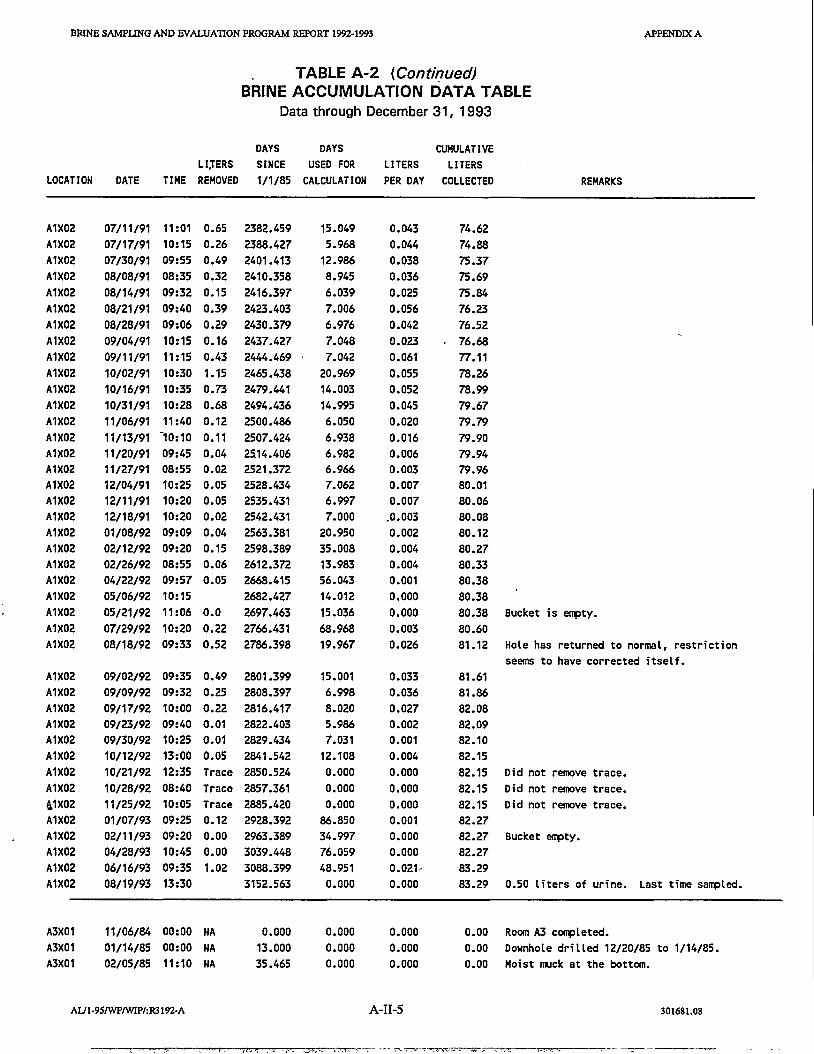
BRINE SAMPUNG AND EVALUATION PROGRAM REPORT 1992-1993 APPENDlXA
TABLE A-2 (ContifJued)BRINE ACCUIYIULATION DATA TABLE
Data through December 31, 1993
DAYS DAYS CUMULATIVELI,TERS SINCE USED FOR LITERS LITERS
LOCATION DATE TIME REMOVED 1/1/85 CALCULATION PER DAY COLLECTED REMARKS
A1X02 07/11/91 11:01 0.65 2382.459 15.049 0.043 74.62A1X02 07/17/91 10:15 0.26 2388.427 5.968 0.044 74.88A1X02 07/30/91 09:55 0.49 2401.413 12.986 0.038 75.37A1X02 08/08/91 08:35 0.32 2410.358 8.945 0.036 75.69A1X02 08/14/91 09:32 0.15 2416.397 6.039 0.025 75.84A1X02 08/21/91 09:40 0.39 2423.403 7.006 0.056 76.23A1X02 08/28/91 09:06 0.29 2430.379 6.976 0.042 76.52A1X02 09/04/91 10:15 0.16 2437.427 7.048 0.023 76.68A1X02 09/11/91 11:15 0.43 2444.469 7.042 0.061 77.11A1X02 10/02/91 10:30 1.15 2465.438 20.969 0.055 78.26A1X02 10/16/91 10:35 0.73 2479.441 14.003 0.052 78.99A1X02 10/31/91 10:28 0.68 2494.436 14.995 0.045 79.67A1X02 11/06/91 11:40 0.12 2500.486 6.050 0.020 79.79A1X02 11/13/91 "10: 10 0.11 2507.424 6.938 0.016 79.90A1X02 11/20/91 09:45 0.04 25.14.406 6.982 0.006 79.94A1X02 11/27/91 08:55 0.02 2521.372 6.966 0.003 79.96A1X02 12/04/91 10:25 0.05 2528.434 7.062 0.007 80.01A1X02 12/11/91 10:20 0.05 2535.431 6.997 0.007 80.06A1X02 12/18/91 10:20 0.02 2542.431 7.000 .0.003 80.08A1X02 01/08/92 09:09 0.04 2563.381 20.950 0.002 80.12A1X02 02/12/92 09:20 0.15 2598.389 35.008 0.004 80.27A1X02 02/26/92 08:55 0.06 2612.372 13.983 0.004 80.33A1X02 04/22/92 09:57 0.05 2668.415 56.043 0.001 80.38A1X02 05/06/92 10:15 2682.427 14.012 0.000 80.38A1X02 OS/21/92 11 :06 0.0 2697.463 15.036 0.000 80.38 Bucket is ~ty.
A1X02 07/29/92 10:20 0.22 2766.431 68.968 0.003 80.60A1X02 08/18/92 09:33 0.52 2786.398 19.967 0.026 81.12 Hole has returned to normal, restriction
seems to have corrected itself.A1X02 09/02/92 09:35 0.49 2801.399 15.001 0.033 81.61A1X02 09/09/92 09:32 0.25 2808.397 6.998 0.036 81.86A1X02 09/17/92 10:00 0.22 2816.417 8.020 0.027 82.08A1X02 09/23/92 09:40 0.01 2822.403 5.986 0.002 82.09A1X02 09/30/92 10:25 0.01 2829.434 7.031 0.001 82.10A1X02 10/12/92 13:00 0.05 2841.542 12.108 0.004 82.15A1X02 10/21/92 12:35 Trace 2850.524 0.000 0.000 82.15 Did not remove trace.A1X02 10/28/92 08:40 Trace 2857.361 0.000 0.000 82.15 Did not remove trace.a1X02 11/25/92 10:05 Trace 2885.420 0.000 0.000 82.15 Did not remove trace.A1X02 01/07/93 09:25 0.12 2928.392 86.850 0.001 82.27A1X02 02/11/93 09:20 0.00 2963.389 34.997 0.000 82.27 Bucket ~ty.A1X02 04/28/93 10:45 0.00 3039.448 76.059 0.000 82.27A1X02 06/16/93 09:35 1.02 3088.399 48.951 0.021, 83.29A1X02 08/19/93 13:30 3152.563 0.000 0.000 83.29 0.50 liters of urine. Last time sampled.
A3X01 11/06/84 00:00 NA 0.000 0.000 0.000 0.00 Room A3 completed.A3X01 01/14/85 00:00 NA 13.000 0.000 0.000 0.00 Downhole drilled 12/20/85 to 1/14/85.A3X01 02/05/85 11:10 NA 35.465 0.000 0.000 0.00 Moist muck at the bottom.
AU1·951WPIWIP/:R3192-A A-II-5 301681.08
• j- "·to -,~_.::; <; -------~---J><:. >,., . ..1 ... ;:;' . -.... ..r. ,---,'r... ~." I .•' .... , _", ~ ._- '7'."';"""":""...o-'~~_ - _/Wo r ,

BRINE SAMPliNG AND EVALUATION PROGRAM REPORT 1992-1993 APPENDIX A
TABLE A-2 (Continued)BRINE ACCUMULATIOI\l DATA TABLE
Data through December 31, 1993
DAYS DAYS CUMULATIVELITERS SINCE USED FOR LITERS LITERS
LOCATION DATE TIME REMOVED 1/1/85 CALCULATION PER DAY COLLECTED REMARKS
A3X01 02/19/85 13:40 00.30 49.569 14.104 0.021 0.30 Some oil. First time collected.A3X01 02/26/85 13:20 00.23 56.556 6.987 0.033 0.53 Brine and oil.A3X01 03/07/85 09:45 00.26 65.406 8.850 0.029 0.79A3X01 03/12/85 11:45 00.17 70.490 5.084 0.033 0.96A3X01 03/20/85 13:14 00.19 78.551 8.061 0.024 1.15 Valved leaked, some brine drained back down
hole.A3X01 03/26/85 11 :12 00.22 84.467 5.916 0.037 1.37A3X01 04/02/85 12:00 00.21 91.500 7.033 0.030 1.58A3X01 04/10/85 12:00 00.23 99.500 8.000 0.029 1.81A3X01 04/17/85 11:20 00.20 106.472 6.972 0.029 2.01A3X01 04/23/85 10:41 00.16 112.445 5.973 0.027 2.17A3X01 04/30/85 13:35 00.20 119.566 7.121 0.028 2.37A3X01 05/07/85 08:55 00.20 126.372 6.806 0.029 2.57A3X01 05/14/85 09:56 00.17 133.414 7.042 0.024 2.74A3X01 OS/21/85 12:00 00.20 140.500 7.086 0.028 2.94A3X01 OS/29/85 09:25 00.21 148.392 7.892 0.027 3.15A3X01 06/04/85 09:55 00.16 154.413 6.021 0.027' 3.31A3X01 06/11/85 09:25 00.18 161.392 6.979 0.026 3.49A3X01 06/18/85 09:27 00.18 168.394 7.002 0.026 3.67A3X01 06/25/85 09:30 00.19 175.396 7.002 0.027' 3.86A3X01 07/02/85 11:00 00.19 182.458 7.062 0.027' 4.05A3X01 07/09/85 09:50 00.17 189.410 6.952 0.02~, 4.22A3X01 07/16/85 10:50 00.18 196.451 7.041 0.026 4.40 Brine effervesces.A3X01 07/24/85 09:47 00.21 204.408 7.957 0.026 4.61A3X01 07/30/85 09:30 00.15 210.396 5.988 0.025 4.76A3X01 08/06/85 09:30 00.17 217.396 7.000 0.02l, 4.93A3X01 08/14/85 09:21 00.20 225.390 7.994 0.025 5.13A3X01 08/20/85 10:08 00.16 231.422 6.032 0.027 5.29A3X01 08/28/85 09:05 00.21 239.378 7.956 0.02£> 5.50A3X01 09/04/85 09:29 00.17 246.395 7.017 0.021, 5.67A3X01 09/10/85 09:20 00.15 252.389 5.994 0.02~i 5.82A3X01 09/17/85 09:06 00.16 259.379 6.990 0.0~5 5.98A3X01 09/24/85 09:03 00.17 266.377 6.998 0.021. . 6.15A3X01 10/01/85 09:18 00.18 273.388 7.011 0.026 6.33A3X01 10/08/85 12:35 00.18 280.524 7.136 0.025 6.51 Room A3 heaters turned on 10/02/85.A3X01 10/15/85 09:35 00.16 287.399 6.875 0.023 6.67A3X01 10/23/85 09:40 00.19 295.403 8.004 0.02/. 6.86A3X01 10/29/85 11:11 00.14 301.466 6.063 0.023 7.00A3X01 11/05/85 08:42 00.16 308.363 6.897 0.023 7.16A3X01 11/13/85 09:30 00.19 316.396 8.033 0.024 7.35A3X01 11/21/85 10:30 00.19 324.438 8.042 0.024 7.54A3X01 11/26/85 09:55 00.10 329.413 4.975 0.020 7.64A3X01 12/04/85 14:03 00.18 337.585 8.172 0.022 7.82 Sample for chemical analysis, #10.A3X01 12/10/85 10:46 00.14 343.449 5.864 0.024 7.96A3X01 12/17/85 13:55 00.14 350.580 7.131 0.020 8.10A3X01 01/03/86 10:00 00.39 367.417 16.837 0.023 8.49A3X01 01/08/86 10:10 00.11 372.424 5.007 0.022 8.60
AlJI-95IWPfWlP/:R3192-A A-II-6 301681.08

BRINE SAMPUNG AND EVALUATION PROGRAM REPORT 1992-1993 APPENDIX A
TABLE A-2 (Continued)BRINE ACCUMULATION DATA TABLE
Data through December 31, 1993
DAYS DAYS CUMULATIVELITERS SINCE USED FOR LITERS LITERS
LOCATION DATE TIME REMOVED 1/1/85 CALCULATION PER DAY COLLECTED REMARKS
A3X01 01/16/86 09:35 00.18 380.399 7.975 - 0.023 8.78A3X01 01/23/86 10:00 00.15 387.417 7.018 0.021 8.93A3X01 01/31/86 10:55 00.18 395.455 8.038 0.022 9.11A3X01 02/12/86 10:00 00.27 407.417 11.962 0.023 9.38A3X01 02/19/86 10:40 00.15 414.444 7.027 0.021 9.53A3X01 02/28/86 14:20 00.22 423.597 9.153 0.024 9.75A3X01 03/06/86 09:50 00.14 429.410 5.813 0.024 9.89A3X01 03/13/86 09:20 00.15 436.389 6.979 0.021 10.04A3X01 03/26/86 09:15 00.30 449.385 12.996 0.023 10.34A3X01 04/02/86 08:50 00.16 456.368 6.983 0.023 10.50A3X01 04/08/86 09:05 00.14 462.378 6.010 0.023 10.64A3X01 04/16/86 11 :25 00.18 470.476 8.098 0.022 10.82A3X01 04/24/86 09:30 00.18 478.396 7.920 0.023 11.00A3X01 04/30/86 10:00 00.14 484.417 6.021 0.023 11.14A3X01 05/06/86 09:35 00.14 490.399 5.982 0.023 11.28A3X01 05/13/86 09:20 00.15 497.389 6.990 0.021 11.43A3X01 OS/20/86 10:10 00.15 504.424 7.035 0.021 11.58A3X01 OS/27/86 15:00 00.16 511.625 7.201 0.022 11.74A3X01 06/03/86 09:20 00.15 518.389 6.764 .0.022 11.89A3X01 06/10/86 10:42 00.16 525.446 7.057 0.023 12.05A3X01 06/17/86 09:51 00.12 532.410 6.964 0.017 12.17 Sample for brine chemistry, #18.A3X01 06/24/86 10:05 00.16 539.420 7.010 0.023 12.33A3X01 07/01/86 12:35 00.16 546.524 7.104 0.023 12.49A3X01 07/08/86 09:57 00.15 553.415 6.891 0.022 12.64A3X01 07/16/86 09:47 00.19 561.408 7.993 0.024 12.83A3X01 07/22/86 09:23 00.14 567.391 5.983 0.023 12.97A3X01 07/29/86 10:00 00.14 574.417 7.026 0.020 13.11A3X01 08/05/86 10:15 00.18 581.427 7.010 0.026 13.29A3X01 08/12/86 09:50 00.16 588.410 6.983 0.023 13.45A3X01 08/19/86 10:35 00.16 595.441 7.031 0.023 13.61A3X01 08/26/86 10:00 00.15 602.417 6.976 0.022 13.76 Static level not measured.A3X01 09/04/86 09:52 00.20 611.411 8.994 0.022 13.96 Sample # 16.A3X01 09/09/86 10:35 00.12 616.441 5.030 0.024 14.08A3X01 09/16/86 09:29 00.14 623.395 6.954 0.020 14.22A3X01 09/23/86 09:36 00.18 630.400 7.005 0.026 14.40A3X01 10/01/86 11:30 00.19 638.479 8.079 0.024 14.59A3X01 10/08/86 10:24 00.14 645.433 6.954 0.020 14.73A3X01 10/14/86 10:47 00.12 651.449 6.016 0.020 14.85A3X01 11/05/86 10:20 0.52 673.431 21.982 0.024 15.37A3X01 11/20/86 11:33 00.33 688.481 15.050 0.022 15.70A3X01 12/31/86 11 :45 00.88 729.490 41.009 0.021 16.58A3X01 02/03/87 12:00 00.73 763.500 34.010 0.021 17.31A3X01 03/06/87 11:45 0.68 794.490 30.990 0.022 17.99A3X01 03/30/87 12:00 0.55 818.500 24.010 0.023 18.54A3X01 05/07/87 10:39 0.80 856.444 37.944 0.021 19.34A3X01 06/17/87 11:25 0.89 897.476 41.032 0.022 20.23 Collected for chemistry, samples #126A,
#1268.
AUI-95fWPIWIP/:RJ192-A A-II-7 301681.08
" __• __ .,.... - ---0 ___ -_ .._---....._~___________________

BRINE SAMPUNG AND EVALUATION PROGRAM REPORT 1992-1993 APPENDIX A
TABLE A-2 (Continued)BRINE ACCUMULATIOr~ DATA TABLE
Data through December 31, 1993
DAYS DAYS CUMULATIVELITERS SINCE USED FOR LITERS LITERS
LOCATION DATE TIME REMOVED 1/1/85 CALCULATION PER DAY COLLECTED REMARKS
A3X01 07/28/87 12:02 0.92 938.501 41.025 0.022 2'1.15A3X01 09/01/87 11:45 0.77 973.490 34.989 0.022 21.92 Collected for chemistry, sa~le #172 A&B.A3X01 10/20/87 10:55 1.10 1022.455 48.965 0.022 23.02A3X01 11/19/87 10:20 0.66 1052.431 29.976 0.022 23.68 Collected for chemistry, s~le #220.A3X01 01/04/88 11:00 1.01 1098.458 46.027 0.022 24.69A3X01 02/08/88 13:30 0.67 1133.563 35.105 0.019 25.36 Collected for chemistry, sa~le #297 &
#298.A3X01 03/30/88 12:10 1.02 1184.507 50.944 0.020 26.38 Collected for chemistry, sa~le #387 &
#388.A3X01 05/12/88 10:20 0.88 1227.431 42.924 0.021 27.26 Sa~led for SNL/NM PA.A3X01 07/12/88 09:40 1.28 1288.403 60.972 0.021 28.54 Collected for chemistry, sa~le #456 &
#457.A3X01 09/27/88 08:20 1365.347 0.000 0.000 28.54 Cannot be sa~led. Room has bad back.A3X01 12/13/88 09:25 3.35 1442.392 153.989 0.022 31.89 Collected for chemistry, sa~le #591 -
#596.A3X01 03/14/89 09:15 1.90 1533.385 90.993 0.021 33.79 Collected for chemistry, sa~le #656 - 659.A3X01 04/06/89 12:04 NA 1556.503 0.000 0.000 33.79 Room locked.A3X01 04/20/89 10:00 NA 1570.417 0.000 0.000 33.79 Room locked.A3X01 05/17/89 11:45 1.42 1597.490 64.105 0.022 35.21 Collected for chemistry, sa~le #758 A & B.A3X01 07/11/89 09:55 0.93 1652.413 54.923 0.017 36.14A3X01 09/12/89 11:26 1.51 1715.476 63.063 0.024 37.65 Sa~le saved for chemistry.A3X01 10/10/89 09:43 NA 1743.405 0.000 0.000 37.65 Installed collection device. Collection
point for brine located outside room.A3X01 10/20/89 10:39 0.36 1753.444 37.968 0.009 38.01 Collected for chemistry, sa~le #850.A3X01 11/10/89 09:40 0.50 1774.403 20.959 0.024 38.51 Collected for chemistry, sa~le #860-1.A3X01 11/29/89 11 :56 0.63 1793.497 19.094 0.033 39.14 Collected for chemistry, sa~le #871.A3X01 12/12/89 09:00 0.43 1806.375 12.878 0.033 39.57 Collected for chemistry, sample #882.A3X01 01/04/90 10:00 0.50 1829.417 23.042 0.022 40.07A3X01 01/17/90 11:24 0.25 1842.475 13.058 0.019 40.32A3X01 01/31/90 09:40 0.24 1856.403 13.928 0.017 40.56A3X01 02/13/90 09:21 0.31 1869.390 12.987 0.024 40.87A3X01 02/27/90 11:43 0.32 1883.488 14.098 0.023- 41.19A3X01 03/05/90 10:45 0.30 1889.448 5.960 0.050 41.49A3X01 03/21/90 11:15 0.15 1905.469 16.021 0.009 41.64 Brine probably left in hole.A3X01 04/06/90 10:29 0.35 1921.437 15.968 0.022 41.99A3X01 04/17/90 11:13 0.13 1932.467 11.030 0.012 42.12A3X01 04/24/90 10:26 0.02 1939.435 0.000 0.000 42.14A3X01 04/25/90 09:35 0.15 1940.399 7.932 0.021 42.29 Reinstalled sa~ler. Combined with 0.02
liters from 04/24/90. Used 0.17 liters forcalculation.
A3X01 05/02/90 11 :20 0 1947.472 0.000 0.000 42.29 Could not sample.A3X01 05/16/90 10:26 NA 1961.435 0.000 0.001l 42.29 S~ler malfunction.A3X01 OS/23/90 12:35 0.08 1968.524 28.125 0.00;1 42.37A3X01 05/31/90 10:51 0.14 1976.452 7.928 0.0113 42.51A3X01 06/01/90 10:25 NA 1977.434 0.000 0.000 42.51 Replaced sampler.A3X01 06/06/90 11:06 0.49 1982.463 6.011 0.082 43.00A3X01 06/14/90 08:38 0.17 1990.360 7.897 0.022 43.17
AU1·95IWPfWIP/:R3192·A A-II-8 301681.08

BRINE SAMPUNG AND EVALUATION PROGRAM REPORT 1992-1993 APPENDIX A
TABLE A-2 (Continued)BRINE ACCUMULATION DATA TABLE
Data through December 31, 1993
DAYS DAYS CUMULATIVELITERS SINCE USED FOR LITERS LITERS
LOCATION DATE TIME REMOVED 1/1/85 CALCULATION PER DAY COLLECTED REMARKS
A3X01 07/17/90 10:18 0.60 2023.429 0.000 0.000 43.77A3X01 07/18/90 10: 11 0.09 2024.424 34.064 0.020 43.86 Combined with 0.60 liters from 07/17/90.
Used 0.69 liters for calculation.A3X01 07/25/90 08:20 0.70 2031.347 0.000 0.000 44.56A3X01 08/07/90 11:21 0.24 2044.473 20.049 0.047 44.80 Combined with 0.7 liters from 07/25/90.
Used 0.94 liters for calculation.A3X01 08/16/90 11:11 0.27 2053.466 8.993 0.030 45.07A3X01 08/22/90 11:42 0.15 2059.488 6.022 0.025 45.22A3X01 08/23/90 10:00 NA 2060.417 0.000 0.000 45.22 Heaters turned off.A3X01 08/29/90 12:44 0.16 2066.531 7.043 0.023 45.38A3X01 09/05/90 11:35 0.15 2073.483 6.952 0.022 45.53A3X01 09/13/90 09:56 0.18 2081.414 7.931 0.023 45.71A3X01 09/25/90 12:34 0.25 2093.524 12.110 0.021 45.96A3X01 09/26/90 11:09 0.02 2094.465 0.941 0.021 45.98A3X01 10/03/90 09:50 0.16 2101.410 6.945 0.023 46.14A3X01 10/10/90 11:40 0.15 2108.486 7.076 0.021 46.29A3X01 10/18/90 10:53 0.16 2116.453 7.967 0.020 46.45A3X01 10/24/90 12:08 0.14 2122.506 6.053 0.023 46.59A3X01 10/31/90 11:35 0.16 2129.483 6.977 0.023 46.75A3X01 11/07/90 10:52 0.15 2136.453 6.970 0.022 46.90A3X01 11/14/90 11:50 0.15 2143.493 7.040 0.021 47.05A3X01 11/28/90 10:51 0.30 2157.452 13.959 0.021 47.35A3X01 12/05/90 08:55 0.15 2164.372 6.920 0.022 47.50A3X01 12/13/90 09:35 0.17 2172.399 8.027 0.021 47.67A3X01 12/20/90 08:56 0.18 2179.372 6.973 0.026 47.85A3X01 01/09/91 09:07 0.39 2199.380 20.008 0.019 48.24A3X01 01/16/91 09:15 0.16 2206.385 7.005 0.023 48.40A3X01 01/23/91 10:05 0.15 2213.420 7.035 0.021 48.55A3X01 01/30/91 10:16 0.16 2220.428 7.008 0.023 48.71A3X01 02/13/91 11:22 0.36 2234.474 14.046 0.026 49.07A3X01 02/20/91 10:45 0.16 2241.448 6.974 0.023 49.23A3X01 02/27/91 10:20 0.14 2248.431 6.983 0.020 49.37A3X01 03/07/91 10:15 0.26 2256.427 7.996 0.033 49.63A3X01 03/20/91 11 :21 0.28 2269.473 13.046 0.021 49.91A3X01 03/28/91 '1:07 0.18 2277.463 7.990 0.023 50.09A3X01 04/10/91 09:19 0.26 2290.388 12.925 0.020 50.35A3X01 05/14/91 09:50 0.34 2324.410 0.000 0.000 50.69 Partial evacuation.A3X01 05/15/91 10:20 0.30 2325.431 35.043 0.018 50.99 Combined with 0.34 liters from 05/14/91.A3X01 05/30/91 11:45 0.31 2340.490 15.059 0.021 51.30A3X01 06/05/91 14:22 0.16 2346.599 6.109 0.026 51.46A3X01 06/12/91 10:50 0.15 2353.451 6.852 0.022 51.61A3X01 06/19/91 15:12 0.15 2360.633 7.182 0.021 51.76A3X01 06/26/91 09:45 0.14 2367.406 6.m 0.021 51.90A3X01 07/11/91 11:16 0.30 2382.469 15.063 0.020 52.20A3X01 07/17/91 10:10 0.15 2388.424 5.955 0.025 52.35A3X01 07/30/91 09:50 0.40 2401.410 12.986 0.031 52.75A3X01 08/08/91 08:30 0.24 2410.354 8.944 0.027 52.99
AUI-9SIWPIWIP/:R3192-A A-II-9 301681.08
.- _~ _;.~, ... } ~ ., ~ 10' » ",.. .... "' .. '0 .~~--,.,..,., -~--~ ........ -- ~----_ ...... ----- - ~ .~e~.'-~. ,,_

BRINE SAMPUNG AND EVALUATION PROGRAM REPORT 1992-1993 APPENDIX A
TABLE A-2 (Continued)BRINE ACCUMULATION DATA TABLE
Data through December 31, 1993
DAYS DAYS CUMULATIVELITERS SINCE USED FOR LITERS LITERS
LOCATION DATE TIME REMOVED 1/1/85 CALCULATION PER DAY COLLECTED REMARKS
A3X01 08/14/91 09:25 0.13 2416.392 6.038 0.022 53.12A3X01 08/21/91 09:22 0.15 2423.390 6.998 0.021 53.27A3X01 08/28/91 08:53 0.13 2430.370 6.980 0.019 53.40A3X01 09/04/91 10:14 0.22 2437.426 7.056 0.031 53.62A3X01 09/11/91 11:10 0.17 2444.465 7.039 0.024 53.79A3X01 10/02/91 10:25 0.13 2465.434 20.969 0.006 53.92A3X01 10/16/91 10:25 0.48 2479.434 14..000 0.034 54.40A3X01 10/31/91 10:40 0.01 2494.444 0.000 0.000 54.41 Some brine may have been left in hole.
Lost vacuum prior to sampling.A3X01 11/06/91 11 :35 0.06 2500.483 0.000 0.000 54.47 Some brine may have been left in hole.
Line clogged.A3X01 11/20/91 9:30 0.53 2514.375 34.941 0.017 55.00 Combined with 0.01 liters from 10/31/91 and
0.06 liters from 11/06/91.A3X01 11/27/91 09:04 0.21 2521.378 7.003 0.030 55.21A3X01 12/04/91 10:20 0.17 2528.431 7.053 0.024 55.38A3X01 12/11/91 10: 15 0.13 2535.427 6.996 0.019 55.51A3X01 12/18/91 10:15 0.17 2542.427 7.000 0.024 55.68A3X01 12/23/91 09:10 0.14 2547.382 4.955 0.028 55.82A3X01 01/08/92 09:05 0.15 2563.378 15.996 .0.009 55.97A3X01 01/15/92 09:21 0.35 2570.390 7.012 0.050 56.32A3X01 01/22/92 09:45 0.15 2577.406 7.016 0.021 56.47A3X01 01/29/92 10:26 0.14 2584.435 7.029 0.020 56.61A3X01 02/12/92 09:15 0.38 2598.385 13.950 0.027 56.99A3X01 02/19/92 10:00 0.14 2605.417 7.032 0.020 57.13A3X01 02/26/92 08:45 0.15 2612.365 6.948 0.022 57.28A3X01 03/11/92 08:55 0.28 2626.3n 14.007 0.020 57.56A3X01 03/18/92 08:40 0.16 2633.361 6.989 0.023 57.nA3X01 03/25/92 09:55 0.14 2640.413 7.052 0.020 57.86A3X01 04/01/92 09:50 0.15 2647.410 6.997 0.021 58.01A3X01 04/07/92 09:55 0.12 2653.413 6.003 0.020 58.13A3X01 04/15/92 08:35 0.16 2661.358 7.945 0.020 58.29A3X01 04/22/92 09:55 0.15 2668.413 7.055 0.021 58.44A3X01 05/06/92 10:29 0.27 2682.437 14.024 0.019 58.71A3X01 05/13/92 13:15 0.17 2689.552 7.115 0.024 58.88A3X01 OS/21/92 10:57 0.15 2697.456 7.904 0.019 59.03A3X01 OS/27/92 09:40 0.12 2703.403 5.947 0.020 59.15A3X01 06/09/92 09:50 0.25 2716.410 13.007 0.019 59.40A3X01 06/18/92 08:45 0.19 2n5.365 8.955 0.021 59.59A3X01 06/25/92 10:15 0.14 2732.427 7.062 0.020 59.73A3X01 07/01/92 09:04 0.12 2738.378 5.951 0.020 59.85A3X01 07/08/92 09:50 0.14 2745.410 7.032 0.020 59.99A3X01 07/15/92 09:01 0.15 2752.376 6.966 0.022 60.14A3X01 07/22/92 10:15 0.14 2759.427 7.051 0.020 60.28A3X01 07/29/92 10:15 0.14 2766.427 7.000 0.020 60.42A3X01 08/04/92 09:11 0.14 2m.383 5.956 0.024 60.56A3X01 08/18/92 09:30 0.25 2786.396 14.013 0.018 60.81A3X01 09/02/92 09:30 0.30 2801.396 15.000 0.020 61.11
AUI-95fWPIWIP/:R3192-A A-II-IO 301681.08

BRINE SAMPliNG AND EVALUATION PROGRAM REPORT 1992-1993 APPENDIX A
TABLE A-2 (Continued)BRINE ACCUMULATION DATA TABLE
Data through December 31, 1993
DAYS DAYS CUMULATIVELITERS SINCE USED FOR LITERS LITERS
LOCATION DATE TIME REMOVED 1/1/85 CALCULATION PER DAY COLLECTED -REMARKS
A3X01 09/09/92 09:30 0.15 2808.396 7.000 0.021 61.26A3X01 09/17/92 09:55 0.15 2816.413 8.017 0.019 61.41A3X01 09/23/92 09:45 0.14 2822.406 5.993 0.023 61.55A3X01 09/30/92 10:20 0.13 2829.431 7.025 0.019 61.68A3X01 10/12/92 12:59 0.25 2841.541 12.110 0.021 61.93A3X01 10/21/92 12:31 0.16 2850.522 8.981 0.018 62.09A3X01 10/28/92 08:45 0.14 2857.365 6.843 0.020 62.23A3X01 11/11/92 10:45 0.26 2871.448 14.083 0.018 62.49A3X01 11/18/92 12:50 0.15 2878.535 7.087 0.021 62.64A3X01 11/25/92 10:00 0.05 2885.417 6.882 0.007 62.69A3X01 12/09/92 13:20 0.36 2899.556 14.139 0.025 63.05A3X01 12/16/92 09:45 0.14 2906.406 6.850 0.020 63.19A3X01 01/07/93 09:20 0.37 2928.389 21.983 0.017 63.56A3X01 01/13/93 09:20 0.15 2934.389 6.000 0.025 63.71A3X01 01/28/93 09:46 0.29 2949.407 15.018 0.019 64.00A3X01 02/11/93 09:20 0.00 2963.389 0.000 0.000 64.00 No suction.A3X01 02/26/93 0.00 2978.000 0.000 0.000 64.00 No vacul.lll.A3X01 03/19/93 10:35 0.15 2999.441 0.000 0.000 64.15 Partial evacuation.A3X01 03/25/93 09:30 0.13 3005.396 55.989 0.005 64.28 Combine with 0.15 liters from 03-19-93.A3X01 03/31/93 12:10 0.14 3011.507 6.111 0.023 64.42A3X01 06/16/93 09:45 0.34 3088.406 76.899 0.004 64.76 Last time sampled.
BX01 06/02/84 00:00 NA 0.000 0.000 0.000 0.00 Room B completed.BX01 01/27/85 00:00 NA 26.000 0.000 0.000 0.00 Downhole drilled 1/24/85 to 1/27/85. Wet
core and brine encountered 1/26/85 at 35 to36.5 feet.
BX01 02/05/85 11:00 00.39 35.458 248.458 0.002 0.39 First time collected.BX01 02/11/85 12:00 00.72 41.500 6.042 0.119 1.11BX01 02/19/85 13:00 00.70 49.542 8.042 0.087 1.81BX01 02/26/85 12:45 00.61 56.531 6.989 0.087 2.42BX01 03/07/85 09:15 00.70 65.385 8.854 0.079 3.12BX01 03/12/85 11:45 00.41 70.490 5.105 0.080 3.53BX01 03/20/85 12:50 00.61 78.535 8.045 0.076 4.14BX01 03/26/85 10:45 00.45 84.448 5.913 0.076 4.59BX01 04/02/85 11:44 00.51 91.489 7.041 0.072 5.10BX01 04/10/85 11:38 00.55 99.485 7.996 0.069 5.65BX01 04/17/85 11:00 00.45 106.458 6.973 0.065 6.10BX01 04/23/85 10:05 00.38 112.420 5.962 0.064 6.48 Room B heaters turned on 4/23/85.BX01 05/01/85 11:40 00.46 120.486 8.066 0.057 6.94BX01 06/04/85 09:30 02.00 154.396 33.910 0.059 8.94 First cheCK in several weeKS.BX01 07/16/85 10:15 02.34 196.427 42.031 0.056 11.28 Brine effervesces.BX01 08/26/85 13:56 02.38 237.581 41.154 0.058 13.66 Room temperature 98 degrees F at collar,
103 F in center of room.BX01 10/08/85 12:00 02.27 280.500 42.919 0.053 15.93BX01 11/21/85 10:05 02.42 324.420 43.920 0.055 18.35BX01 12/04/85 13:35 00.69 337.566 13.146 0.052 19.04 Collected for chemistry, sample #8.
AIJl-95/WPIWIP/:R3192-A A-II-ll 301681.08

BRINE SAMPUNG AND EVALUAll0N PROGRAM REPORT 1992-1993 APPENDIX A
TABLE A-2 (Continued)BRINE ACCUMULATION DATA TABLE
Data through December 31, 1993
DAYS DAYS CUMULATIVELITERS SINCE USED FOR LITERS LITERS
LOCATION DATE TIME REMOVED 1/1/85 CALCULATION PER DAY COLLECTED REMARKS
BX01 01/31/86 10:25 02.95 395.434 57.868 0.051 21.99BX01 02/12/86 09:30 00.80 407.396 11.962 0.067 22.79BX01 04/16/86 11:00 03.45 470.458 63.062 0.055 26.24BX01 04/30/86 09:45 00.73 484.406 13.948 0.052 26.97BX01 05/06/86 09:18 00.30 490.388 5.982 0.050 27.27BX01 06/10/86 10:20 01.85 525.431 35.043 0.053 29.12 Collected for chemistry, sample #12.BX01 08/19/86 10:50 03.21 595.451 70.020 0.046 32.33BX01 09/09/86 11:00 01.30 616.458 21.007 0.062 33.63BX01 10/01/86 11:08 01.16 638.464 22.006 0.053 34.79BX01 11/05/86 10:00 NA 673.417 0.000 0.000 34.79 Not collected.BX01 11/20/86 10:39 02.40 688.444 49.980 0.048 37.19BX01 12/30/86 14:10 01.75 728.590 40.146 0.044 38.94BX01 02/03/87 11:00 01.67 763.458 34.868 0.048 40.61BX01 03/06/87 11:50 NA 794.493 0.000 0.000 40.61 Room closed, bad back, not sampled.BX01 10/20/87 1022.000 0.000 0.000 40.61 Room closed, could not sample. No
calculation.BX01 11/16/87 11:10 12.86 1049.465 286.007 0.045 53.47 Collected for chemistry, sample #198A,
#201A, #204A, #207A, #210A #198B, #201B,#204B, #2078, ÒB.
BX01 01/04/88 1098.000 0.000 0.000 53.47 Could not sample. Room closed.BX01 02/08/88 12:35 3.71 1133.524 84.059 0.044 57.18 Collected for chemistry, sample #287, #288,
#289, #290, #291, #292 #293 Ħ.BX01 03/29/88 12:00 2.30 1183.500 49.976 0.046 59.48 Collected for chemistry, sample #379 •
#383.BX01 05/12/88 10:44 1.67 1227.447 43.947 0.038 61.15 Sampled for SNL PA.BX01 07/12/88 09:50 2.23 1288.410 60.963 0.037 63.38 Collected for chemistry, sample #449 •
#452.BX01 09/27/88 08:00 2.61 1365.333 76.923 0.034 65.99 Collected for chemistry, sample #504 -
#509.BX01 12/13/88 09:00 0 1442.375 0.000 0.000 65.99 Could not sample. Room locked.BX01 01/30/89 NA NA 1490.000 0.000 0.000 65.99 Heaters in Room B turned off at 14:20 on
1/30/89.BX01 03/14/89 08:40 6.17 1533.361 168.028 0.037 72.16 Collected for chemistry, sample #646 - 651.BX01 04/06/89 11:53 NA 1556.495 0.000 0.000 72.16 Room locked.BX01 04/20/89 10:00 NA 1570.417 0.000 0.000 72.16 Room locked.BX01 05/17/89 11:00 2.90 1597.458 64.097 0.04~j 75.06 Sample saved for chemistry, sample #759 -
761 A &B.BX01 07/11/89 09:30 1.77 1652.396 54.938 0.032 76.83BX01 09/12/89 10:50 1.90 1715.451 63.055 0.030 78.73 Increased buildup of salt crust on cap. No
indication of leakage into hole, walls dry.BX01 10/11/89 10:30 NA 1744.438 0.000 0.000 78.73 Installed collection device. Collection
point for brine located outside heatedroom.
BX01 10/20/89 10:30 0.61 1753.438 37.987 0.016 79.34 Sample saved for chemistry, sample #848.BX01 11/10/89 08:50 0.65 1774.368 20.930 0.031 79.99 Sample saved for chemistry, sample
#858-1,2.BX01 11/29/89 10:50 0.66 1793.451 19.083 0.035· 80.65 Sample saved for chemistry, sample #869.
AU1-95/WPIWIPI:R3192-A A-II-12 301681.08

-~----
BRINE SAMPUNG AND EVALUATION PROGRAM REPORT 1992·1993 APPENDIX A
TABLE A-2 (Continued)BRINE ACCUMULATION DATA TABLE
Data through December 31, 1993
DAYS DAYS CUMULATIVELITERS SINCE USED FOR LITERS LITERS
LOCATION DATE TIME REMOVED 1/1/85 CALCULATION PER DAY COLLECTED REMARKS
aX01 12/12/89 08:49 0.63 1806.367 12.916 0.049 81.28 SampLe saved for chemistry, sampLe #880.aX01 01/04/90 09:03 0.14 1829.377 23.010 0.006 81.42aX01 01/17/90 10:10 0.17 1842.424 13.047 0.013 81.59aX01 01/31/90 08:57 0.20 1856.373 13.949 0.014 81.79aX01 02/13/90 10:23 0.41 1869.433 13.060 0.031 82.20aX01 02/27/90 11:12 0.61 1883.467 14.034 0.043 82.81aX01 03/05/90 10:24 0.35 1889.433 5.966 0.059 83.16aX01 03/21/90 10:59 0.58 1905.458 16.025 0.036 83.74aX01 04/04/90 10:26 0.60 1919.435 13.977 0.043 84.34aX01 04/17/90 10:47 0.71 1932.449 0.000 0.000 85.05aX01 04/24/90 09:45 0.63 1939.406 0.000 0.000 85.68aX01 04/25/90 09:00 0.76 1940.375 20.940 0.100 86.44 Combined with 0.71 Liters from 04/17/90 and
0.63 Liters from 04/24/90. Used 2.1 Litersfor caLcuLation.
aX01 05/02/90 10:59 0.67 1947.458 7.083 0.095 87.11aX01 05/09/90 10:39 0.19 1954.444 6.986 0.027 87.30aX01 05/16/90 09:56 0.20 1961.414 6.970 0.029 87.50aX01 OS/23/90 12:55 0.03 1968.538 7.124 0.004 87.53aX01 05/31/90 11:11 0.13 1976.466 7.928 .0.016 87.66aX01 06/01/90 10:15 NA 1977.427 0.000 0.000 87.66 RepLaced sampLer.aX01 06/06/90 10:53 0.41 1982.453 5.987 0.068 88.07aX01 06/14/90 09:14 0.28 1990.385 7.932 0.035 88.35aX01 06/20/90 08:42 0.05 1996.363 5.978 0.008 88.40aX01 06/28/90 09:35 0.40 2004.399 8.036 0.050 88.80aX01 07/17/90 10:20 0.12 2023.431 0.000 0.000 88.92 PartiaL evacuation.aX01 07/18/90 09:54 0.47 2024.413 20.014 0.029 89.39 Combined with 0.12 Liters from 07/17/90.
Used 0.59 Liters for caLcuLation.aX01 07/25/90 08:10 0.38 2031.340 6.927 0.055 89.77aX01 08/07/90 11:40 0.40 2044.486 13.146 0.030 90.17aX01 08/16/90 10:52 0.31 2053.453 8.967 0.035 90.48aX01 08/22/90 11:40 0.21 2059.486 6.033 0.035 90.69aX01 08/29/90 12:27 0.09 2066.519 7.033 0.013 90.78aX01 09/05/90 11:10 0.12 2073.465 6.946 0.017 90.90aX01 09/13/90 09:27 0.30 2081.394 7.929 0.038 91.20aX01 09/25/90 12:51 0.48 2093.535 0.000 0.000 91.68 arine probabLy Left in hoLe.aX01 09/26/90 11:18 0.02 2094.471 13.077 0.038 91.70 Combined with 0.48 liters from 09/25/90.
Used 0.50 Liters for caLcuLation.aX01 10/03/90 09:25 0.21 2101.392 6.921 0.030 91.91aX01 10/10/90 11:10 0.23 2108.465 7.073 0.033 92.14aX01 10/18/90 10:46 0.23 2116.449 7.984 0.029 92.37aX01 10/24/90 12:02 0.20 2122.501 6.052 0.033 92.57aX01 10/31/90 11:26 0.22 2129.476 6.975 0.032 92.79aX01 11/07/90 10:49 0.15 2136.451 6.975 0.022 92.94aX01 11/14/90 12:01 0.26 2143.501 7.050 0.037 93.20aX01 11/28/90 10:41 0.49 2157.445 13.944 0.035 93.69aX01 12/05/90 08:53 0.21 2164.370 6.925 0.030 93.90aX01 12/13/90 09:30 0.10 2172.396 8.026 0.012 94.00
AUl·951WPIWIP/:RJ192·A A-II-13 301681.08

BRINE SAMPUNG AND EVALUATION PROGRAM REPORT 1992·1993 APPENDIX A
TABLE A-2 (Continued)BRINE ACCUMULATION DATA TABLE
Data through December 31, 1993
DAYS DAYS CUMULATIVELITERS SINCE USED FOR LITERS LITERS
LOCATION DATE TIME REMOVED 1/1/85 CALCULATION PER DAY COLLECTED REMARKS
BX01 12/20/90 08:47 0.38 2179.366 6.970 0.055 94.38BX01 01/09/91 09:00 0.30 2199.375 20.009 0.015 94.68BX01 01/16/91 09:00 0.45 2206.375 7.000 0.064 95.13BX01 01/23/91 10:00 0.29 2213.417 7.042 0.041 95.42BX01 01/30/91 09:45 0.20 2220.406 6.989 0.029 95.62BX01 02/13/91 11:05 0.43 2234.462 14.056 0.031 96.05BX01 02/20/91 10:32 0.21 2241.439 6.977 0.030 96.26BX01 - 02/27/91 10:12 0.12 2248.425 6.986 0.017 96.38BX01 03/07/91 10:00 0.27 2256.417 7.992 0.034 96.65BX01 03/20/91 11:09 0.38 2269.465 13.048 0.029 97.03BX01 03/28/91 10:57 0.19 2277.456 7.991 0.024 97.22BX01 04/10/91 09:07 0.43 2290.380 12.924 0.033 97.65BX01 05/14/91 09:30 0.45 2324.396 0.000 0.000 98.10 Partial evacuation.BX01 05/15/91 09:52 0.61 2325.411 35.031 0.030 98.71 Combined with 0.45 liters from 05/14/91.BX01 05/30/91 11:30 0.67 2340.479 15.068 0.044 99.38BX01 06/05/91 14:00 0.20 2346.583 6.104 0.033 99.58BX01 06/12/91 10:30 0.20 2353.438 6.855 0.029 99.78BX01 06/19/91 14:48 0.21 2360.617 7.179 0.029 99.99BX01 06/26/91 09:33 0.20 2367.398 6.781 0.029 100.19BX01 07/11/91 10:28 0.46 2382.436 15.038 0.031 100.65BX01 07/17/91 09:55 0.18 2388.413 5.977 0.030 100.83BX01 07/30/91 09:45 0.43 2401.406 0.000 0.000 101.26 Partial evacuation.BX01 07/31/91 09:43 0.06 2402.405 13.992 0.035 101.32 Combined with 0.43 liters from 07/30/91.BX01 08/08/91 08:21 0.26 2410.348 7.943 0.033 101.58BX01 08/14/91 09:15 0.18 2416.385 6.037 0.030 101.76BX01 08/21/91 09:16 0.20 2423.386 7.001 0.029 101.96BX01 08/28/91 09:10 0.22 2430.382 6.996 0.031 102.18BX01 09/04/91 10: 18 0.39 2437.429 7.047 0.055 102.57BX01 09/11/91 11:06 0.22 2444.463 7.034 0.031 102.79BX01 10/02/91 10:15 0.48 2465.427 20.964 0.023 103.27BX01 10/16/91 10:00 0.52 2479.417 13.990 0.037 103.79BX01 10/31/91 11:00 0.44 2494.458 15.041 0.029 104.23BX01 11/06/91 11:13 0.22 2500.467 6.009 0.037 104.45BX01 11/13/91 10:00 0.22 2507.417 6.950 0.032 104.67BX01 11/20/91 9:38 0.20 2514.381 6.964 0.029 104.87BX01 11/27/91 08:45 0.21 2521.365 6.984 0.030 105.08BX01 12/04/91 10:05 0.23 2528.420 7.055 0.033 105.31BX01 12/11/91 10:10 0.20 2535.424 7.004 0.02S' 105.51BX01 12/23/91 09:00 0.15 2547.375 11.951 0.013 105.66BX01 01/08/92 09:00 0.45 2563.375 16.000 0.026 106.11BX01 01/15/92 09:30 0.24 2570.396 7.021 0.03/, 106.35BX01 01/22/92 09:35 0.24 2577.399 7.003 0.031, 106.59BX01 01/29/92 10:14 0.20 2584.426 7.027 0.02U 106.79BX01 02/12/92 09:10 0.40 2598.382 13.956 0.029 107.19BX01 02/19/92 09:35 0.20 2605.399 7.017 0.029 107.39BX01 02/26/92 08:35 0.21 2612.358 6.959 0.030 107.60BX01 03/11/92 08:45 0.40 2626.365 14.007 0.029 108.00
AJJ1-95/WPIWIP/:R3192-A A-II-14 301681.08

BRINE SAMPUNG AND EVALUATION PROGRAM REPORT 1992-1993 APPENDlXA
TABLE A-2 (Continued)BRINE ACCUMULATION DATA TABLE
Data through December 31, 1993
DAYS DAYS CUMULATIVELITERS SINCE USED FOR LITERS LITERS
LOCATION DATE TIME REMOVED 1/1/85 CALCULATION PER DAY COLLECTED REMARKS
aX01 03/18/92 08:35 0.22 2633.358 6.993 0.031 108.22aX01 03/25/92 09:45 0.20 2640.406 7.048 0.028 108.42aX01 04/01/92 09:45 0.20 2647.406 7.000 0.029 108.62aX01 04/07/92 09:50 0.17 2653.410 6.004 0.028 108.79aX01 04/15/92 08:30 0.23 2661.354 7.944 0.029 109.02aX01 04/22/92 09:53 0.20 2668.412 7.058 0.028 109.22aX01 05/06/92 10:43 0.09 2682.447 0.000 0.000 109.31 Partial evacuation. No vacul.J11.aX01 05/07/92 09:45 0.33 2683.406 14.994 0.028 109.64 Combined with 0.09 liters removed 05/06/92
for total voll.J11e.aX01 05/13/92 13:18 0.19 2689.554 6.148 0.031 109.83aX01 OS/21/92 10:52 0.34 2697.453 7.899 0.043 110.17aX01 OS/27/92 09:32 0.18 2703.397 5.944 0.030 110.35aX01 06/09/92 09:40 0.36 2716.403 13.006 0.028 110.71aX01 06/18/92 09:10 0.28 2725.382 8.979 0.031 110.99aX01 06/25/92 10:07 0.21 2732.422 7.040 0.030 111.20aX01 07/01/92 08:59 0.16 2738.374 5.952 0.027 111.36aX01 07/08/92 09:55 0.20 2745.413 7.039 0.028 111.56aX01 07/15/92 08:50 0.21 2752.368 6.955 0.030 111.77aX01 07/22/92 10:00 0.19 2759.417 7.049 .0.027 111.96aX01 07/29/92 10:12 0.21 2766.425 7.008 0.030 112.17aX01 08/04/92 09:20 0.17 2m.389 5.964 0.029 112.34aX01 08/18/92 09:25 0.40 2786.392 14.003 0.029 112.74aX01 09/02/92 09:24 0.40 2801.392 15.000 0.027 113.14aX01 09/09/92 09:20 0.23 2808.389 6.997 0.033 113.37aX01 09/17/92 09:45 0.23 2816.406 8.017 0.029 113.60aX01 09/23/92 09:30 0.17 2822.396 5.990 0.028 113.77aX01 09/30/92 10:13 0.21 2829.426 7.030 0.030 113.98aX01 10/12/92 12:55 0.36 2841.538 12.112 0.030 114.34aX01 10/21/92 12:30 0.05 2850.521 8.983 0.006 114.39aX01 10/28/92 08:55 0.38 2857.372 6.851 0.055 114.77aX01 11/11/92 10:35 0.20 2871.441 14.069 0.014 114.97aX01 11/18/92 12:45 0.15 2878.531 7.090 0.021 115.12aX01 11/25/92 09:55 0.20 2885.413 6.882 0.029 115.32aX01 12/09/92 13:10 0.14 2899.549 14.136 0.010 115.46aX01 12/16/92 09:40 0.20 2906.403 6.854 0.029 115~66
aX01 01/07/93 09:10 0.23 2928.382 21.979 0.010 115.89aX01 01/13/93 08:44 0.26 2934.364 5.982 0.043 116.15aX01 01/28/93 09:44 0.25 2949.406 15.042 0.017 116.40aX01 02/11/93 09:25 0.27 2963.392 13.986 0.019 116.67aX01 02/26/93 08:00 0.30 2978.333 14.941 0.020 116.97aX01 03/19/93 10:30 0.52 2999.438 21.105 0.025 117.49aX01 03/25/93 09:15 0.57 3005.385 5.947 0.096 118.06aX01 04/28/93 10:35 0.24 3039.441 34.056 0.007 118.30 Last time sampled.aX01 08/19/93 3152.000 0.000 0.000 118.30 Collecting hose plugged; unable to open.
DH36 11/21/84 00:00 NA -41.000 112.559 0.000 0.00 Approximate date this part of Room G
AUI-95/WPIWIP/:RJI92-A A-II-IS 301681.08

BRINE SAMPllNG AND EVALUATION PROGRAM REPORT 1992-1993 APPENDIX A
TABLE A-2 (Continued)BRINE ACCUMULATION DATA TABLE
Data through December 31, 1993
DAYS DAYS CUMULATIVELITERS SINCE USED FOR LITERS LITERS
LOCATION DATE TIME REMOVED 1/1/85 CALCULATION PER DAY COLLECTED REMARKS
excavated.DH36 01/26/85 00:00 NA 25.000 66.000 0.000 0.00 Downhole drilled 1/26/85.DH36 01/28/85 09:00 NA 27.375 0.000 0.000 0.00 Moist muck at the bottom.DH36 02/05/85 11:15 02.50 35.469 10.469 0.239 2.50 About 1 ft. muck, brine and hydraulic
fluid. First time bailed.DH36 02/11/85 11:00 01.51 41.458 5.989 0.252 4.01 Brine, muck, hydraulic fluid.DH36 02/19/85 12:10 01.78 49.507 8.049 0.221 5.79 Some muck.DH36 02/26/85 10:45 01.48 56.448 6.941 0.213 7.27 Brine and muck.DH36 03/05/85 10:00 01.76 63.417 6.969 0.253 9.03DH36 03/12/85 10:00 01.55 70.417 7.000 0.221 10.58DH36 03/20/85 10:26 01.59 78.435 8.018 0.198 12.17DH36 03/26/85 09:45 01.35 84.406 5.971 0.226 13.52DH36 04/02/85 10:15 01.58 91.427 7.021 0.225 15.10DH36 04/10/85 10:25 01.71 99.434 8.007 0.214 16.81DH36 04/17/85 13:30 01.49 106.563 7.129 0.209 18.30DH36 04/23/85 11:46 01.45 112.490 5.927 0.245 19.75DH36 04/30/85 11:21 01.49 119.473 6.983 0.213 21.24DH36 05/07/85 09:58 01.55 126.415 6.942 0.223 22.79DH36 05/14/85 10:54 01.77 133.454 7.039 .0.251 24.56DH36 OS/21/85 10:45 01.61 140.448 6.994 0.230 26.17DH36 OS/29/85 10:00 01.50 148.417 7.969 0.188 27.67DH36 06/04/85 11 :33 01.40 154.481 6.064 0.231 29.07DH36 06/11/85 11:15 01.55 161.469 6.988 0.222 30.62DH36 06/18/85 10: 17 01.58 168.428 6.959 0.227 32.20DH36 06/25/85 10:40 01.43 175.444 7.016 0.204 33.63DH36 07/02/85 11:00 01.59 182.458 7.014 0.227' 35.22DH36 07/09/85 11:15 01.54 189.469 7.011 0.220 36.76DH36 07/16/85 11:50 01.58 196.493 7.024 0.225 38.34 Brine effervesces.DH36 07/24/85 10:46 01.78 204.449 7.956 0.22(, 40.12DH36 07/30/85 10:20 01.39 210.431 5.982 0.232 41.51DH36 08/06/85 10:43 01.70 217.447 7.016 0.24'~ 43.21DH36 08/14/85 11:02 01.58 225.460 8.013 0.197 44.79 Valve leaked, some brine drained back down
hole.DH36 08/20/85 11:11 01.42 231.466 6.006 0.236 46.21DH36 08/28/85 10:00 01.94 239.417 7.951 0.241. 48.15DH36 09/04/85 10:32 01.69 246.439 7.022 0.24'\ 49.84DH36 09/10/85 10:35 01.41 252.441 6.002 0.235 51.25DH36 09/17/85 09:42 01.53 259.404 6.963 0.220 52.78DH36 09/24/85 09:50 01.53 266.410 7.006 0.218 54.31DH36 10/01/85 09:55 01.58 273.413 7.003 0.226 55.89DH36 10/08/85 10:52 01.63 280.453 7.040 0.232 57.52DH36 10/15/85 10:30 01.58 287.438 6.985 0.226 59.10DH36 10/23/85 10:23 01.82 295.433 7.995 0.228 60.92DH36 10/29/85 09:51 01.36 301.410 5.977 0.228 62.28DH36 11/05/85 09:27 01.63 308.394 6.984 0.233 63.91DH36 11/13/85 10:14 01.79 316.426 8.032 0.223 65.70DH36 11/21/85 11:36 01.91 324.483 8.057 0.237 67.61
AU1-9SIWPIWIP/:R3192-A A-II-16 301681.08

BRINE SAMPUNG AND EVALUATION PROGRAM REPORT 1m-1993 APPENDIX A
TABLE A-2 (Continued)BRINE ACCUMULATION DATA TABLE
Data through December 31, 1993
DAYS DAYS CUMULATIVELITERS SINCE USED FOR LITERS LITERS
LOCATION DATE TIME REMOVED 1/1/85 CALCULATJON PER DAY COLLECTED REMARKS
OH36 11/26/85 11:30 01.01 329.479 4.996 0.202 68.62OH36 12/03/85 13:35 01.50 336.566 7.087 0.212 70.12 .50 liters for chemical analysis, s8lrple
#4.OH36 12/10/85 12:15 01.52 343.510 6.944 0.219 71.64OH36 01/23/86 11:00 09.30 387.458 43.948 0.212 80.94 Entry restricted since 12/10/85 due to
mining activities.OH36 01/31/86 12:20 01.38 395.514 8.056 0.171 82.32OH36 02/12/86 11:00 03.02 407.458 11.944 0.253 85.34OH36 02/19/86 11:45 01.55 414.490 7.032 0.220 86.89OH36 02/28/86 13:20 01.85 423.556 9.066 0.204 88.74OH36 03/06/86 10:45 01.30 429.448 5.892 0.221 90.04 Volune was estimated.OH36 03/13/86 10:10 01.50 436.424 6.976 0.215 91.54OH36 03/26/86 10:20 02.56 449.431 13.007 0.197 94.10OH36 04/02/86 09:40 01.75 456.403 6.9n 0.251 95.85OH36 04/08/86 09:45 00.97 462.406 6.003 0.162 96.82OH36 04/16/86 12:25 01.65 470.517 8.111 0.203 98.47OH36 04/24/86 10:20 02.00 478.431 7.914 0.253 100.47OH36 04/30/86 10:55 01.21 484.455 6.024 0.201 101.68OH36 05/06/86 10:14 01.20 490.426 5.971 .0.201 102.88OH36 05/13/86 11:13 01.42 497.467 7.041 0.202 104.30OH36 OS/20/86 11:10 01.50 504.465 6.998 0.214 105.80OH36 OS/27/86 15:45 01.40 511.656 7.191 0.195 107.20OH36 06/03/86 10:10 01.38 518.424 6.768 0.204 108.58OH36 06/10/86 11:35 01.24 525.483 7.059 0.176 109.82 Valve leaked, some brine drained back down
hole.OH36 06/17/86 11:00 01.65 532.458 6.975 0.237 111.47 S8Irple for brine chemistry, #24.OH36 06/24/86 11:00 01.45 539.458 7.000 0.207 112.92OH36 07/01/86 14:05 01.55 546.587 7.129 0.217 114.47OH36 07/08/86 10:45 01.40 553.448 6.861 0.204 115.87OH36 07/16/86 1P:45 01.76 561.448 8.000 0.220 117.63OH36 07/22/86 10:07 01.29 567.422 5.974 0.216 118.92OH36 07/29/86 10:40 01.45 574.444 7.022 0.206 120.37OH36 08/05/86 11:20 01.46 581.4n 7.028 0.208 121.83OH36 08/12/86 10:37 01.50 588.442 6.970 0.215 123.33OH36 08/19/86 11:35 01.38 595.483 7.041 0.196 124.71OH36 08/26/86 10:38 01.49 602.443 6.960 0.214 126.20 Static level not measured.OH36 09/04/86 10:41 01.70 611.445 9.002 0.189 127.90OH36 09/09/86 10:15 01.20 616.427 4.982 0.241 129.10 Sal1lJle #26.OH36 09/16/86 10:20 01.37 623.431 7.004 0.196 130.47OH36 09/23/86 10:18 01.40 630.429 6.998 0.200 131.87OH36 10/01/86 12:18 01.76 638.513 8.084 0.218 133.63OH36 10/08/86 11:10 01.44 645.465 6.952 0.207 135.07 Brine efferveces as it is poured into
beaker.OH36 10/14/86 11:57 01.21 651.498 6.033 0.201 136.28 Static level not measured.OH36 11/05/86 11:38 4.28 673.485 21.987 0.195 140.56OH36 11/20/86 12:35 03.12 688.524 15.039 0.207 143.68OH36 12/30/86 12:25 01.n n8.517 0.000 0.000 145.40 Partial evacuation. No calculation. Do not
AUI-9SfWPIWIP/:R3192-A A-II-17 301681.08
~-,-r--. -~_ - --------~-----

BRINE SAMPUNG AND EVALUATION PROGRAM REPORT 1992-1993 APPENDIX A
TABLE A-2 (Continued)BRINE ACCUMULATION DATA TABLE
Data through December 31, 1993
DAYS DAYS CUMULATIVELITERS SINCE USED FOR LITERS LITERS
LOCATION DATE TIME REMOVED 1/1/85 CALCULATION PER DAY COLLECTED REMARKS
plot or use zero value.OH36 12/31/86 12:38 6.54 729.526 41.002 0.201 151.94 Calculated using 8.26 liters in 41.002 days
(1.72 liters 12/30/86 plus 6.54 liters12/31/86).
OH36 02/03/87 13:35 06.84 763.566 34.040 0.201 158.78OH36 03/06/87 11:20 5.84 794.472 30.906 0.189 164.62OH36 03/30/87 11:27 4.95 818.4n 24.005 0.206 169.57OH36 05/07/87 11:33 6.62 856.481 38.004 0.174 176.19OH36 06/17/87 10:45 7.25 897.448 0.000 0.000 183.44 Sample for chem. #108A, #1088, #114A,
#1148, #121A, #1218, #127A, #1278, #134A,#1348. Some brine left in hole, nocalculation.
OH36 06/18/87 12:10 0.49 898.507 42.026 0.184 183.93 Original l/day calculation too high due toresidual brine left in hole. Recalculatedusing 7.74 l (7.25 l 6/17/87 plus 0.49 l6/18/87).
OH36 07/28/87 11:27 7.76 938.4n 39.970 0.194 191.69OH36 09/01/87 10:50 6.99 973.451 34.974 0.200 198.68 Collected for chemistry, sample #153 A&8,
#160 A&8, #163 A&8, #158 A&8, #155 A&8,#167 A&8.
OH36 10/20/87 11:56 8.58 1022.497 49.046 0.175 207.26OH36 11/19/87 11:30 4.19 1052.479 29.982 0.140 211.45 Collected for chemistry, sample #199, #205,
#208, & #211.OH36 01/04/88 11:50 6.74 1098.493 46.014 0.146 218.19OH36 02/08/88 11:50 4.90 1133.493 35.000 0.140 223.09 Collected for chemistry, sample #261, #262,
#263, #264, #265, #266, #267, #268, #269 Ď.
OH36 03/29/88 11:35 7.25 1183.483 49.990 0.145 230.34 Collected for chemistry, sample #367 -#378.
OH36 05/05/88 09:45 5.01 1220.406 36.923 0.136 235.35 Sampled for SNL PA.OH36 05/12/88 09:50 1.30 1227.410 7.004 0.186 236.65 Sampled for SNL PA.OH36 07/12/88 08:50 7.90 1288.368 60.958 0.130 244.55 Collected for chemistry, sample #422 •
#436.OH36 07/28/88 10:25 1.50 1304.434 16.066 0.093 246.05 Sampled for SNL PA.OH36 08/11/88 10:30 3.66 1318.438 14.004 0.261 249.71 Sampled for SNL PA~
OH36 08/25/88 09:24 2.05 1332.392 13.954 0.147 251.76 Sampled for SNL PA.OH36 09/08/88 14:50 1346.618 0.000 0.000 251.76 Did not sample.OH36 09/14/88 08:40 2.36 1352.361 19.969 0.118 254.12 Slight orange color.OH36 09/27/88 10:45 1.30 1365.448 13.087 0.099 255.42 Collected for chemistry, sample #537 -
#539.OH36 12/13/88 10:00 10.63 1442.417 76.969 0.138 266.05 Collected for chemistry, sample #570 -
#581.OH36 03/14/89 10:10 11.16 1533.424 91.007 0.123 2n.21 Sample saved for chemistry, sample #684 •
695.OH36 04/06/89 09:31 2.73 1556.397 22.973 0.119 279.94 2.5 ~iters saved for SNL brine study.OH36 04/20/89 09:40 1.79 1570.403 14.006 0.128 281.73 Sample saved for SNL/NM brine study.OH36 05/17/89 10:20 6.45 1597.431 27.028 0.239 288.18 Sample saved for SNL/NM brine study.
AUI-95fWPfWlP/:R3192-A A-II-I 8 301681.08

BRINE SAMPIlNG AND EVALUATION PROGRAM REPORT 1992-1993 APPENDIX A
TABLE A-2 (Continued)BRINE ACCUMULATION DATA TABLE
Data through December 31, 1993
DAYS DAYS CUMULATIVELITERS SINCE USED FOR LITERS LITERS
LOCATION DATE TIME REMOVED 111/85 CALCULATION PER DAY COLLECTED REMARKS
OH36 06/06/89 10:10 2.62 1617.424 19.993 0.131 290.80 Sample saved for chemistry.OH36 06/29/89 10:35 2.42 1640.441 23.017 0.105 293.22 Sample saved for SNL/NM brine study.OH36 07/06/89 09:10 1.08 1647.382 6.941 0.156 294.30OH36 07/25/89 09:55 2.35 1666.413 19.031 0.123 296.65 Sample saved for SNL/NM brine study.OH36 08/16/89 09:27 2.75 1688.394 21.981 0.125 299.40 Sample saved for SNL/NM brine study.OH36 09/12/89 09:30 3.81 1715.396 27.002 0.141 303.21 Sample saved for chemistry.OH36 12/13/89 11:10 11.07 1807.465 92.069 0.120 314.28 Sample saved for chemistry, sample #900.OH36 01/10/90 10:18 2.48 1835.429 27.964 0.089 316.76OH36 01/24/90 09:37 2.0 1849.401 13.9n 0.143 318.76OH36 02/07/90 10:17 1.53 1863.428 14.027 0.109 320.29OH36 02/21/90 09:50 1.75 1877.410 13.982 0.125 322.04OH36 03/05/90 09:25 1.10 1889.392 11.982 0.092 323.14OH36 03/14/90 12:30 NA 1898.521 0.000 0.000 323.14 Installed sampler.OH36 03/19/90 10:36 0.80 1903.442 0.000 0.000 323.94 Brine probably left in hole.OH36 03/21/90 10:16 0.57 1905.428 16.036 0.085 324.51 Combined with 0.80 liters from 03/19/90.
Used 1.37 liters for calculation.OH36 04/04/90 09:09 1.08 1919.381 13.953 0.077 325.59OH36 04/10/90 08:34 0.97 1925.357 5.976 0.162 326.56OH36 ·04/17/90 10:17 0.85 1932.428 7.071 .0.120 327.41OH36 04/24/90 09:14 0.86 1939.385 0.000 0.000 328.27OH36 04/25/90 08:45 0.57 1940.365 7.937 0.180 328.84 Combined with 0.86 liters from 04/27/90.
Used 1.43 liters for calculation.OH36 05/02/90 10:24 1.37 1947.433 7.068 0.194 330.21OH36 05/09/90 08:35 0.68 1954.358 6.925 0.098 330.89OH36 05/16/90 08:45 0.78 1961.365 7.007 0.111 331.67OH36 05/17/90 07:50 0.17 1962.326 0.961 0.177 331.84OH36 OS/23/90 12:02 0.68 1968.501 6.175 0.110 332.52OH36 05/31/90 08:38 0.85 1976.360 7.859 0.108 333.37OH36 06/01/90 11:00 0.15 1977.458 1.098 0.137 ' 333.52 Repaired sampler, evacuated hole.OH36 06/06/90 08:47 0.45 1982.366 4.908 0.092 333.97OH36 06/14/90 08:38 0.82 1990.360 7.994 0.103 334.79OH36 06/20/90 09:53 0.59 1996.412 6.052 0.097 335.38OH36 06/28/90 08:38 0.88 2004.360 7.948 0.111 336.26OH36 07/17/90 10:52 0.41 2023.453 0.000 0.000 336.67OH36 07/18/90 10:20 0.62 2024.431 20.071 0.051 337.29 Combined with 0.41 liters from 07/17/90.
Used 1.03 liters for calculation.OH36 07/25/90 09:45 0.61 2031.406 ~.975 0.087 337.90OH36 08/01/90 10:38 0.61 2038.443 7.037· 0.087 338.51OH36 12/12/90 09:47 11.54 2171.408 132.965 0.087 350.05 First evacuation since 08/07/90.OH36 12/19/90 11:22 3.61 2178.474 0.000 0.000 353.66 Combined with 11.54 liters from 12/12/90.
Brine stored in fractures may have drainedinto hole after evacuation of 11.5 literson 12/12/90. Used 140.03 days, 15.15liters.
OH36 01/09/91 09:50 2.34 2199.410 28.002 0.212 356.00OH36 01/16/91 08:35 0.73 2206.358 6.948 0.105 356.73OH36 01/23/91 08:35 0.54 2213.358 7.000 0.077 357.27
AUI-95/WPIWIP/:R3192-A A-II-19 301681.08
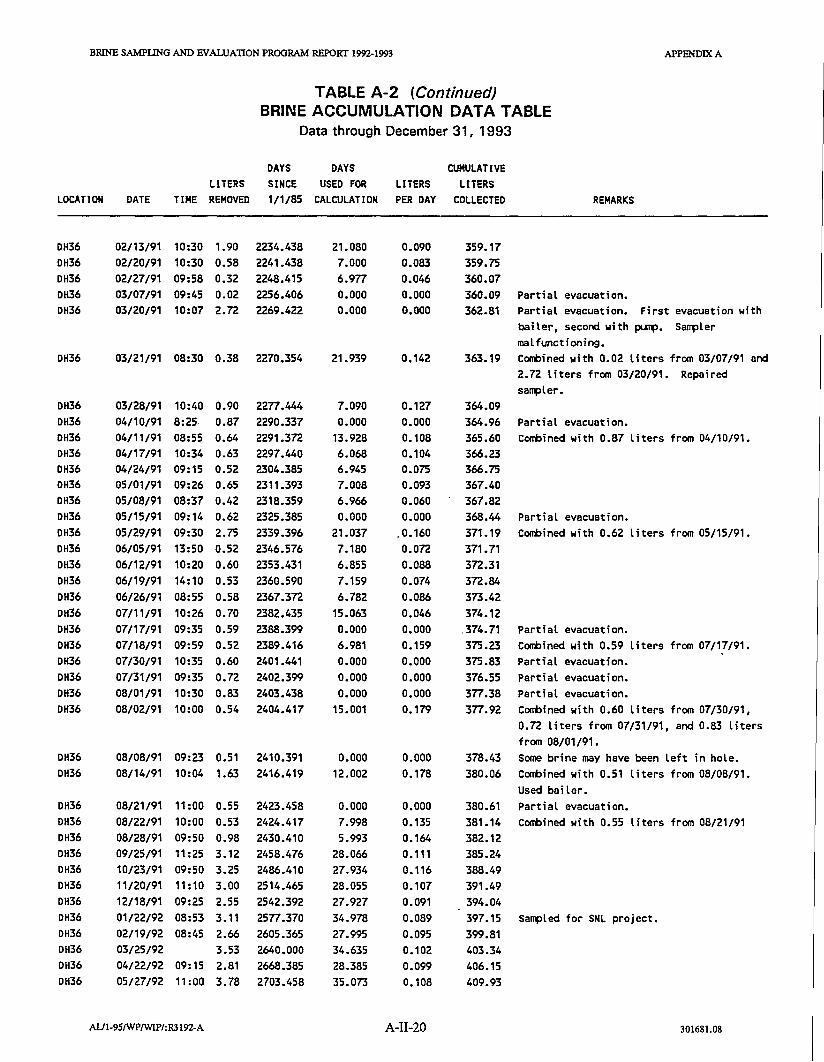
BRINE SAMPUNG AND EVALUATION PROGRAM REPORT 1992-1993 APPENDIX A
TABLE A-2 (Continued)BRINE ACCUMULATION DATA TABLE
Data through December 31, 1993
DAYS DAYS CUMULATIVELITERS SINCE USED FOR LITERS LITERS
LOCATION DATE TIME REMOVED 1/1/85 CALCULATION PER DAY COLLECTED REMARKS
OH36 02/13/91 10:30 1.90 2234.438 21.080 0.090 359.17OH36 02/20/91 10:30 0.58 2241.438 7.000 0.083 359.75OH36 02/27/91 09:58 0.32 2248.415 6.977 0.046 360.07OH36 03/07/91 09:45 0.02 2256.406 0.000 0.000 360.09 Partial evacuation.OH36 03/20/91 10:07 2.72 2269.422 0.000 0.000 362.81 Partial evacuation. First evacuation with
bailer, second with pump. Sarrplermalfunctioning.
OH36 03/21/91 08:30 0.38 2270.354 21.939 0.142 363.19 Combined with 0.02 liters from 03/07/91 and2.72 liters from 03/20/91. Repairedsarrpler.
DH36 03/28/91 10:40 0.90 2277.444 7.090 0.127 364.09OH36 04/10/91 8:25 0.87 2290.337 0.000 0.000 364.96 Partial evacuation.OH36 04/11/91 08:55 0.64 2291.372 13.928 0.108 365.60 Combined with 0.87 liters from 04/10/91.OH36 04/17/91 10:34 0.63 2297.440 6.068 0.104 366.23OH36 04/24/91 09:15 0.52 2304.385 6.945 0.075 366.75OH36 05/01/91 09:26 0.65 2311.393 7.008 0.093 367.40OH36 05/08/91 08:37 0.42 2318.359 6.966 0.060 367.82DH36 05/15/91 09:14 0.62 2325.385 0.000 0.000 368.44 Partial evacuation.OH36 OS/29/91 09:30 2.75 2339.396 21.037 .0.160 371.19 Combined with 0.62 liters from 05/15/91.OH36 06/05/91 13:50 0.52 2346.576 7.180 0.072 371.71OH36 06/12/91 10:20 0.60 2353.431 6.855 0.088 372.31OH36 06/19/91 14:10 0.53 2360.590 7.159 0.074 372.84DH36 06/26/91 08:55 0.58 2367.372 6.782 0.086 373.42OH36 07/11/91 10:26 0.70 2382.435 15.063 0.046 374.12OH36 07/17/91 09:35 0.59 2388.399 0.000 0.000 374.71 Partial evacuation.OH36 07/18/91 09:59 0.52 2389.416 6.981 0.159 375.23 Combined with 0.59 liters from 07/17/91.OH36 07/30/91 10:35 0.60 2401.441 0.000 0.000 375.83 Partial evacuation.OH36 01/31/91 09:35 0.72 2402.399 0.000 0.000 376.55 Partial evacuation.OH36 08/01/91 10:30 0.83 2403.438 0.000 0.000 377.38 Partial evacuation.OH36 08/02/91 10:00 0.54 2404.417 15.001 0.179 377.92 Combined with 0.60 liters from 07/30/91,
0.72 liters from 07/31/91, and 0.83 litersfrom 08/01/91.
OH36 08/08/91 09:23 0.51 2410.391 0.000 0.000 378.43 Some brine may have been left in hole.OH36 08/14/91 10:04 1.63 2416.419 12.002 0.178 380.06 Combined with 0.51 liters from 08/08/91.
Used bailer.OH36 08/21/91 11:00 0.55 2423.458 0.000 0.000 380.61 Partial evacuation.OH36 08122/91 10:00 0.53 2424.417 7.998 0.135 381.14 Combined with 0.55 liters from 08/21/91OH36 08/28/91 09:50 0.98 2430.410 5.993 0.164 382.12OH36 09/25/91 11:25 3.12 2458.476 28.066 0.111 385.24OH36 10/23/91 09:50 3.25 2486.410 27.934 0.116 388.49OH36 11/20/91 11:10 3.00 2514.465 28.055 0.107 391.49OH36 12/18/91 09:25 2.55 2542.392 27.927 0.091 394.04OH36 01/22/92 08:53 3.11 2577.370 34.978 0.089 397.15 Sarrpled for SNL project.OH36 02/19/92 08:45 2.66 2605.365 27.995 0.095 399.81OH36 03/25/92 3.53 2640.000 34.635 0.102 403.34OH36 04122/92 09:15 2.81 2668.385 28.385 0.099 406.15OH36 OS/27/92 11:00 3.78 2703.458 35.073 0.108 409.93
AUI-951WPIWIP/:R3192-A A-II-20 301681.08

BRINE SAMPUNG AND EVALUATION PROGRAM REPORT 1992-1993 APPENDIX A
TABLE A-2 (Continued)BRINE ACCUMULATION DATA TABLE
Data through December 31, 1993
DAYS DAYS CUMULATIVELITERS SINCE USED FOR LITERS LITERS
LOCATION DATE TIME REMOVED 1/1/85 CALCULATION PER DAY COLLECTED REMARKS
OH36 06/25/92 09:25 4.0 2732.392 28.934 0.138 413.93OH36 07/29/92 09:30 4.17 2766.396 34.004 0.123 418.10 Saved for SNL.OH36 08/20/92 08:50 1.00 2788.368 0.000 0.000 419.10 Partial evacuation for BSEP analytical
program.OH36 09/09/92 10:2~ 4.45 2808.434 42.038 0.130 423.55 Combine with 1.0 liter evacuated on
08-20-92.OH36 11/11/92 09:00 8.23 2871.375 62.941 0.131 431.78OH36 02/26/93 09:30 13.85 2978.396 107.021 0.129 445.63OH36 04/28/93 10:20 8.40 3039.431 61.035 0.138 454.03OH36 06/16/93 11:10 7.75 3088.465 49.034 0.158 461.78 Used bailer.OH36 08/18/93 14:00 8.17 3151.583 63.118 0.129 469.95 Used bailer.OH36 11/12/93 10:07 11.63 3237.422 85.839 0.135 481.58 Used bailer.
OH38 12/05/84 .00:00 NA 0.000 0.000 0.000 0.00 Approximate date this part of Room Gexcavated.
OH38 01/26/85 00:00 NA 25.000 52.000 0.000 0.00 Downhole drilled 1/25/85 to 1/26/85.OH38 01/28/85 09:00 NA 27.375 2.375 0.000 0.00 Dry.OH38 02/05/85 11:15 NA 35.469 8.094 .0.000 0.00 \let at bottom.OH38 02/19/85 12:10 00.80 49.507 14.038 9.057 0.80 Brine and fine muck.OH38 02/26/85 10:45 01.26 56.448 6.941 0.182 2.06 Brine and fine muck.OH38 03/05/85 10:00 00.45 63.417 6.969 0.065 . 2.51OH38 03/12/85 10:00 00.39 70.417 7.000 0.056 2.90OH38 03/20/85 10:37 00.45 78.442 8.025 0.056 3.35OH38 03/26/85 09:50 00.36 84.410 5.968 0.060 3.71OH38 04/02/85 10:25 00.41 91.434 7.024 0.058 4.12 Some muck.OH38 04/10/85 10:31 00.44 99.438 8.004 0.055 4.56OH38 04/17/85 13:30 00.41 106.563 7.125 0.058 4.97OH38 04/23/85 11:41 00.34 112.487 5.924 0.057 5.31OH38 04/30/85 11:05 00.39 119.462 6.975 0.056 5.70OH38 05/07/85 09:50 00.42 126.410 6.948 0.060 6.12OH38 05/14/85 10:45 00.41 133.448 7.038 0.058 6.53OH38 OS/21/85 10:35 00.41 140.441 6.993 0.059 6.94OH38 OS/29/85 11:35 00.47 148.483 8.042 0.058 7.41OH38 06/04/85 11:25 00.35 154.476 5.993 0.058 7.76OH38 06/11/85 10:35 00.40 161.441 6.965 0.057 8.-16 - -OH38 06/18/85 10:09 00.39 168.423 6.982 0.056 8.55OH38 06/25/85 10:50 00.42 175.451 7.028 0.060 8.97OH38 07/02/85 11:00 00.44 182.458 7.007 0.063 9.41OH38 07/09/85 11:05 00.43 189.462 7.004 0.061 9.84OH38 07/16/85 11:45 00.43 196.490 7.028 0.061 10.27 Brine effervesces.OH38 07/24/85 10:35 00.49 204.441 7.951 0.062 10.76OH38 07/30/85 10:14 00.38 210.426 5.985 0.063 11.14OH38 08/06/85 10:34 00.42 217.440 7.014 0.060 11.56OH38 08/14/85 10:51 00.49 225.452 8.012 0.061 12.05OH38 08/20/85 11:02 00.37 231.460 6.008 0.062 12.42OH38 08/28/85 10:00 00.51 239.417 7.957 0.064 12.93
AUl·951WPIWIP/:R3192·A A-II-21 301681.08

BRINE SAMPUNG AND EVALUATION PROGRAM REPORT Im-l993 APPENDIX A
TABLE A-2 (Continued)BRINE ACCUMULATIO~~ DATA TABLE
Data through December 31, 1993
DAYS DAYS CUMULATIVELITERS SINCE USED FOR LITERS LITERS
LOCATION DATE TIME REMovED 1/1/85 CALCULATION PER DAY COLLECTED REMARKS
DH38 09/04/85 10:23 00.44 246.433 7.016 0.063 13.37DH38 09/10/85 10:19 00.39 252.430 5.997 0.065 13.76DH38 09/17/85 09:37 00.44 259.401 6.971 0.063 14.20DH38 09/24/85 09:45 00.44 266.406 7.005 0.063 14.64DH38 10/01/85 09:53 00.44 273.412 7.006 0.063 15.08DH38 10/08/85 10:38 00.46 280.443 7.031 0.065 15.54DH38 10/15/85 10:15 00.44 287.427 6.984 0.063 15.98DH38 10/23/85 10:20 00.49 295.431 8.004 0.061 16.47DH38 10/29/85 09:40 00.39 301.403 5.9n 0.065 16.86DH38 11/05/85 09:14 00.43 308.385 6.982 0.062 17.29DH38 11/13/85 10:00 00.52 316.417 8.032 0.065 17.81DH38 11/21/85 11:29 00.47 324.478 8.061 0.058 18.28DH38 11/26/85 11:20 00.33 329.4n 4.994 0.066 18.61DH38 12/03/85 13:30 00.42 336.563 7.091 0.059 19.03 0.37 liters for chemical analysis, #3.
DH38 12/10/85 12:30 00.41 343.521 6.958 0.059 19.44DH38 01/23/86 11:20 02.70 387.4n 43.951 0.061 22.14 Entry restricted since 12/10/85 due to
mining activities.DH38 01/31/86 12:10 00.53 395.507 8.035 0.066 22.67DH38 02/12/86 10:50 00.75 407.451 11.944 .0.063 23.42DH38 02/19/86 11:40 00.43 414.486 7.035 0.061 23.85DH38 02/28/86 13:15 00.37 423.552 9.066 0.041 24.22 Lost substantial volume due to break in
suction line. Brine flowed back down intohole.
DH38 03/06/86 10:35 00.45 429.441 5.889 0.076 24.67DH38 03/13/86 10:05 00.43 436.420 6.979 0.062 25.10DH38 03/26/86 10:10 00.59 449.424 13.004 0.045 25.69DH38 04/02/86 09:35 00.58 456.399 6.975 0.083 26.27DH38 04/08/86 09:40 00.35 462.403 6.004 0.058 26.62DH38 04/16/86 12: 10 00.50 470.507 8.104 0.062 27.12DH38 04/24/86 10:12 00.47 478.425 7.918 0.059 27.59DH38 04/30/86 10:50 00.35 484.451 6.026 0.058 27.94DH38 05/06/86 10:14 00.31 490.426 5.975 0.052 28.25DH38 05/13/86 11:05 00.41 497.462 7.036 0.058 28.66DH38 OS/20/86 11:05 00.40 504.462 7.000 0.057 29.06DH38 OS/27/86 15:40 00.38 511.653 7.191 0.053 29.44DH38 06/03/86 10:05 00.44 518.420 6.767 0.065 29.88DH38 06/10/86 11:22 00.43 525.474 7.054 0.061 30.31DH38 06/17/86 10:50 00.37 532.451 6.977 0.053 30.68 Sample for brine chemistry, #23.DH38 06/24/86 10:52 00.50 539.453 7.002 0.071 31.18DH38 07/01/86 14:01 00.40 546.584 7.131 0.056 31.58DH38 07/08/86 10:30 00.38 553.438 6.854 0.055 31.96DH38 07/16/86 10:34 00.43 561.440 8.002 0.05l, 32.39DH38 07/22/86 09:58 00.35 567.415 5.975 0.059 32.74DH38 07/29/86 10:40 00.38 574.444 7.029 0.051, 33.12DH38 08/05/86 11:10 00.39 581.465 7.021 0.056 33.51DH38 08/12/86 10:30 00.40 588.438 6.973 0.057 33.91DH38 08/19/86 11 :30 00.41 595.479 7.041 0.0513 34.32
AUI-95fWPIWIP/:R3192-A A-II-22 301681.08

BRINE SAMPIlNG AND EVALUATION PROGRAM REPORT 1992-1993 APPENDIX A
TABLE A-2 (Continued)BRINE ACCUMULATION DATA TABLE
Data through December 31, 1993
DAYS OAYS CUMULATIVELITERS SINCE USED FOR LITERS LITERS
LOCATION DATE TIME REMOVED 1/1/85 CALCULATION PER DAY COLLECTED REMARKS
OH38 08/26/86 10:32 00.36 602.439 6.960 0.052 34.68 Static level not measured.OH38 09/04/86 10:35 00.49 611.441 9.002 0.054 35.17OH38 09/09/86 10:00 00.30 616.417 4.976 0.060 35.47 Sarrple #25.OH38 09/16/86 10: 11 00.38 623.424 7.007 0.054 35.85OH38 09/23/86 10:10 00.37 630.424 7.000 0.053 36.22OH38 10/01/86 12:07 00.43 638.505 8.081 0.053 36.65OH38 10/08/86 11:30 00.36 645.479 6.974 0.052 37.01OH38 10/14/86 11:45 00.35 651.490 6.011 0.058 37.36OH38 11/05/86 11:26 1.10 673.476 21.986 0.050 38.46OH38 11/20/86 12:27 00.82 688.519 15.043 0.055 39.28OH38 12/30/86 12:15 01.87 728.510 39.991 0.047 41.15 Brown color, pH. 5.89.OH38 02/03/87 13:15 01.72 763.552 35.042 0.049 42.87OH38 03/06/87 11 :05 1.58 794.462 30.910 0.051 44.45OH38 03/30/87 11:13 1.17 818.467 24.005 0.049 45.62OH38 05/01/87 11:20 1.89 856.472 38.005 0.050 47.51OH38 06/11/87 10:45 1.91 897.448 0.000 0.000 49.42 Samples removed for chemistry, #106A,
#109A, #1098. Some brine left in hole, nocalculation.
OH38 06/18/87 12:05 0.16 898.503 42.031 .0.049 49:58 Calculated using 2.07 liters (1.91 liters6/17/87 plus 0.16 liters 6/18/87).
OH38 07/28/87 10:53 1.88 938.453 39.950 0.047 51.46 Collected for chemistry, sample #106.OH38 09/01/87 10:45 1.70 973.448 34.995 0.049 53.16 Collected for chemistry, sample #152 A&B.OH38 10/20/87 11:40 2.29 1022.486 49.038 0.047 55.45OH38 11/19/87 11:05 1.42 1052.462 29.976 0.047 56.87 Collected for chemistry, sample #230.OH38 01/04/88 11:35 2.05 1098.483 46.021 0.045 58.92OH38 02/08/88 11:40 1.48 1133.486 35.003 0.042 60.40 Collected for chemistry, sample #258, #259
Ą.OH38 03/29/88 11 :30 2.10 1183.479 49.993 0.042 62.50 Collected for chemistry, sample #363 -
#366.OH38 05/05/88 09:55 1.70 1220.413 36.934 0.046 64.20 Sampled for SNL/NM PA.OH38 05/12/88 11:20 0.31 1227.472 7.059 0.044 64.51 sampled for SNL/NM PA.OH38 07/12/88 08:45 2.44 1288.365 60.893 0.040 66.95 Collected for chemistry, sample #417 -
#421.OH38 07/28/88 10:20 -0.88 1304.431 16.066 0.055 67.83 Sampled for SNL/NM PA.OH38 09/27/88 10:30 1.92 1365.438 61.007 0.031 69.75 Collected for chemistry, sample #533 -
#536.OH38 12/13/88 09:55 3.45 1442.413 76.975 0.045 73.20 Collected for chemistry, sample #582 •
#587.OH38 03/14/89 09:55 3.25 1533.413 91.000 0.036 76.45 Sample saved for chemistry, sample #696 •
701.OH38 04/06/89 09:45 1.03 1556.406 22.993 0.045 77.48OH38 04/20/89 09:35 0.75 1570.399 13.993 0.054 78.23OH38 05/11/89 10:05 1.11 1597.420 27.021 0.041 79.34OH38 06/06/89 10:00 0.70 1617.417 19.997 0.035 80.04 Sample saved for chemistry.OH38 06/29/89 10:30 0.64 1640.438 23.021 0.028 80.68OH38 01/25/89 10:27 0.92 1666.435 25.997 0.035 81.60OH38 08/16/89 09:57 0.81 1688.415 21.980 0.037 82.41
AUl·9SIWPIWIP/:R3192·A A-II-23 301681.08

BRINE SAMPliNG AND EVALUATION PROGRAM REPORT 1992-1993 APPENDIX A
TABLE A-2 (Continued)BRINE ACCUMULATIO~I DATA TABLE
Data through DecembElr 31, 1993
DAYS DAYS CUMULATIVELITERS SINCE USED FOR LITERS LITERS
LOCATION DATE TIME REMOVED 1/1/85 CALCULATION PER DAY COLLECTED REMARKS
OH38 09/12/89 09:20 1.16 1715.389 26.974 0.043 83.57 Sample saved for chemistry.OH38 12/13/89 10:55 3.20 1807.455 92.066 0.035 86.77 sample saved for chemistry, sample #899.OH38 01/10/90 10:03 1.00 1835.419 27.964 0.036 87.77OH38 01/24/90 10:10 0.21 1849.424 14.005 0.015 87.98OH38 02/07/90 10:30 0.48 1863.438 14.014 0.034 88.46OH38 03/05/90 09:18 0.53 1889.388 25.950 0.020 88.99OH38 03/13/90 14:00 NA 1897.583 0.000 0.000 88.99 Installed sampler.OH38 03/19/90 11:30 0.61 1903.479 0.000 0.000 89.60 Hole not completely evacuated.OH38 03/21/90 10:30 0.57 1905.438 16.050 0.074 90.17 Combined with 0.61 liters from 03/19/90.
Used 1.18 liters for calculation.OH38 04/04/90 09:37 0.62 1919.401 13.963 0.044 90.79OH38 04/10/90 08:56 0.34 1925.372 5.971 0.057 91.13OH38 04/17/90 10:39 0.23 1932.444 7.072 0.033 91.36OH38 04/24/90 09:30 0.27 1939.396 6.952 0.039 91.63OH38 05/02/90 10:47 0.32 1947.449 8.053 0.040 91.95OH38 05/09/90 09:08 0.23 1954.381 6.932 0.033 92.18OH38 05/16/90 09:35 0.25 1961.399 7.018 0.036 92.43OH38 OS/23/90 12:03 0.25 1968.502 7.103 0.035 92.68OH38 05/31/90 09:04 0.28 1976.378 7.876 .0.036 92.96OH38 06/06/90 09:40 0.22 1982.403 6.025 0.037 93.18OH38 06/14/90 08:53 0.27 1990.370 7.967 0.034 93.45OH38 06/20/90 09:49 0.22 1996.409 6.039 0.036 93.67OH38 06/28/90 09:15 0.29 2004.385 7.976 0.036 93.96OH38 07/17/90 11:30 0.50 2023.479 0.000 0.000 94.46OH38 07/18/90 10:40 0.20 2024.444 20.059 0.035 94.66 Combined with 0.50 liters from 07/17/90.
Used 0.70 liters for calculation.OH38 07/25/90 09:42 0.30 2031.404 6.960 0.043 94.96OH38 08/01/90 10:30 0.14 2038.438 7.034 0.020 95.10OH38 03/07/91 09:30 5.55 2256.396 0.000 0.000 100.65 Some brine may have been left in hole.
Access denied due to unsound back. Samplerstill functioning after 5 months. Rockbolting in "G
OH38 03/20/91 09:51 1.67 2269.410 230.972 0.031 102.32 Combined with 5.55 liters from 03/07/91.First evacuation with bailer, second withplIl1). Brine probably draining fromfractures/storage.
OH38 03/28/91 10:32 0.52 2277.439 8.029 0.065 102.84OH38 04/10/91 8:34 0.40 2290.336 0.000 0.000 103.24 Partial evacuation.OH38 04/11/91 08:50 0.03 2291.368 13.929 0.031 103.27 Combined wi~h 0.40 liters from 04/10/91.OH38 04/17/91 10:36 0.10 2297.442 6.074 0.016 103.37OH38 04/24/91 09:15 0.34 2304.385 6.943 0.049 103.71OH38 05/01/91 09:22 0.23 2311.390 7.005 0.033 103.94OH38 05/08/91 08:30 0.23 2318.354 6.964 0.033 104.17OH38 05/15/91 09:10 0.23 2325.382 7.028 0.033 104.40OH38 OS/29/91 09:45 0.46 2339.406 14.024 0.033 104.86OH38 06/05/91 13:45 0.18 2346.573 7.167 0.025 105.04OH38 06/12/91 10:15 0.27 2353.427 6.854 0.039 105.31
AUI-951WPIWIP/:R3192-A A-II-24 301681.08
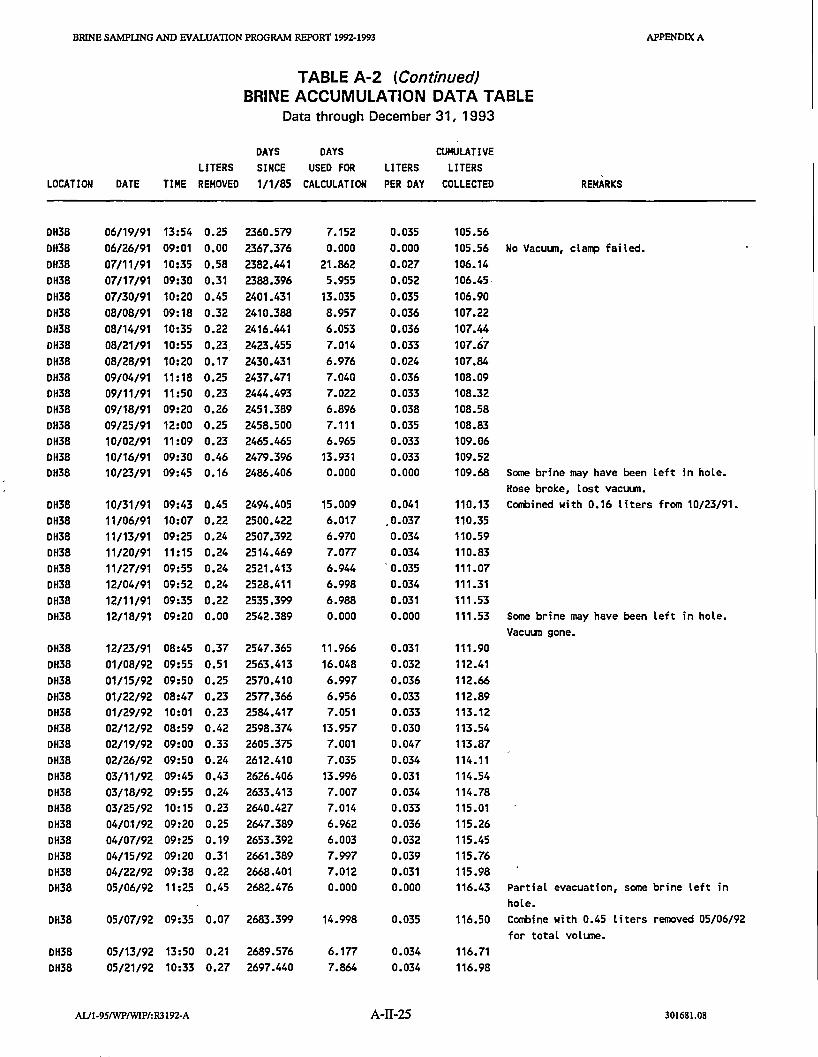
BRINE SAMPUNG AND BYALUA1l0N PROGRAM REPORT 1992-1993 APPENDIX A
TABLE A-2 (Continued)BRINE ACCUMULATION DATA TABLE
Data through December 31, 1993
DAYS DAYS CUMULATIVELITERS SINCE USED FOR LITERS LITERS
LOCATION DATE TIME REMOVED 1/1/85 CALCULATION PER DAY COLLECTED REMARKS
DH38 06/19/91 13:54 0.25 2360.579 7.152 0.035 105.56DH38 06/26/91 09:01 0.00 2367.376 0.000 0.000 105.56 No Vacuum, clamp failed.DH38 07/11/91 10:35 0.58 2382.441 21.862 0.027 106.14DH38 07/17/91 09:30 0.31 2388.396 5.955 0.052 106.45DH38 07/30/91 10:20 0.45 2401.431 13.035 0.035 106.90DH38 08/08/91 09:18 0.32 2410.388 8.957 0.036 107.22DH38 08/14/91 10:35 0.22 2416.441 6.053 0.036 107.44DH38 08/21/91 10:55 0.23 2423.455 7.014 0.033 107.67DH38 08/28/91 10:20 0.17 2430.431 6.976 0.024 107.84DH38 09/04/91 11:18 0.25 2437.471 7.040 0.036 108.09DH38 09/11/91 11:50 0.23 2444.493 7.022 0.033 108.32DH38 09/18/91 09:20 0.26 2451.389 6.896 0.038 108.58DH38 09/25/91 12:00 0.25 2458.500 7.111 0.035 108.83DH38 10/02/91 11:09 0.23 2465.465 6.965 0.033 109.06DH38 10/16/91 09:30 0.46 2479.396 13.931 0.033 109.52DH38 10/23/91 09:45 0.16 2486.406 0.000 0.000 109.68 Some brine may have been left in hole.
Hose broke, lost vacuum.DH38 10/31/91 09:43 0.45 2494.405 15.009 0.041 110.13 Combined with 0.16 liters from 10/23/91.DH38 11/06/91 10:07 0.22 2500.422 6.017 .0.037 110.35DH38 11/13/91 09:25 0.24 2507.392 6.970 0.034 110.59DH38 11/20/91 11:15 0.24 2514.469 7.077 0.034 110.83DH38 11/27/91 09:55 0.24 2521.413 6.944 ' 0.035 111.07DH38 12/04/91 09:52 0.24 2528.411 6.998 0.034 111.31DH38 12/11/91 09:35 0.22 2535.399 6.988 0.031 111.53DH38 12/18/91 09:20 0.00 2542.389 0.000 0.000 111.53 Some brine may have been left in hole.
Vacuum gone.DH38 12/23/91 08:45 0.37 2547.365 11.966 0.031 111.90DH38 01/08/92 09:55 0.51 2563.413 16.048 0.032 112.41DH38 01/15/92 09:50 0.25 2570.410 6.997 0.036 112.66DH38 01/22/92 08:47 0.23 2577.366 6.956 0.033 112.89DH38 01/29/92 10:01 0.23 2584.417 7.051 0.033 113.12DH38 02/12/92 08:59 0.42 2598.374 13.957 0.030 113.54DH38 02/19/92 09:00 0.33 2605.375 7.001 0.047 113.87DH38 02/26/92 09:50 0.24 2612.410 7.035 0.034 114.11DH38 03/11/92 09:45 0.43 2626.406 13.996 0.031 114.54DH38 03/18/92 09:55 0.24 2633.413 7.007 0.034 114.78DH38 03/25/92 10: 15 0.23 2640.427 7.014 0.033 115.01DH38 04/01/92 09:20 0.25 2647.389 6.962 0.036 115.26DH38 04/07/92 09:25 0.19 2653.392 6.003 0.032 115.45DH38 04/15/92 09:20 0.31 2661.389 7.997 0.039 115.76DH38 04/22/92 09:38 0.22 2668.401 7.012 0.031 115.98DH38 05/06/92 11:25 0.45 2682.476 0.000 0.000 116.43 Partial evacuation, some brine left in
hole.DH38 05/07/92 09:35 0.07 2683.399 14.998 0.035 116.50 Combine with 0.45 liters removed 05/06/92
for total volume.DH38 05/13/92 13:50 0.21 2689.576 6.177 0.034 116.71DH38 OS/21/92 10:33 0.27 2697.440 7.864 0.034 116.98
AUI-951WPIWIPI:R3192-A A-II-2S 301681.08

BRINE SAMPUNG AND EVALUATION PROGRAM REPORT 1992-1993 APPENDIX A
TABLE A-2 (Continued)BRINE ACCUMULATION DATA TABLE
Data through December 31, 1993
DAYS DAYS CUMULATIVELITERS SINCE USED FOR LITERS LITERS
LOCATION DATE TIME REMOVED 1/1/85 CALCULATION PER DAY COLLECTED REMARKS
DH38 OS/27/92 09:25 0.00 2703.392 0.000 0.000 116.98 No vacuUl'l.DH38 06/09/92 09:25 0.51 2716.392 18.952 0.027 117.49DH38 06/18/92 10:05 0.42 2725.420 9.028 0.047 117.91DH38 06/25/92 09:55 0.25 2732.413 6.993 0.036 118.16DH38 07/01/92 09:36 0.33 2738.400 5.987 0.055 118.49DH38 07/08/92 09:35 0.15 2745.399 6.999 0.021 118.64DH38 07/15/92 09:30 0.24 2752.396 6.997 0.034 118.88DH38 07/22/92 09:20 0.29 2759.389 6.993 0.041 119.17DH38 07/29/92 10:05 0.26 2766.420 7.031 0.037 119.43DH38 08/04/92 09:53 0.25 2m.412 5.992 0.042 119.68DH38 08/18/92 10:22 0.38 2786.432 14.020 0.027 120.06DH38 09/02/92 10:20 0.56 2801.431 14.999 0.037 120.62DH38 09/09/92 10:15 0.34 2808.427 6.996 0.049 120.96DH38 09/17/92 09:25 0.23 2816.392 7.965 0.029 121.19DH38 09/23/92 10:15 0.24 2822.427 6.035 0.040 121.43DH38 09/30/92 11:15 0.27 2829.469 7.042 0.038 121.70DH38 10/12/92 12:50 0.38 2841.535 12.066 0.031 122.08DH38 10/21/92 0.38 2850.000 8.465 0.045 122.46DH38 10/28/92 09:25 0.28 2857.392 7.392 0.038 122.74DH38 11/11/92 09:45 0.43 2871.406 14.014 0.031 123.17DH38 11/18/92 13:22 0.36 2878.557 7.151 0.050 123.53DH38 11/25/92 09:45 0.26 2885.406 6.849 0.038 123.79DH38 12/09/92 12:55 0.28 2899.538 14.132 0.020 124.07DH38 12/16/92 10:25 0.42 2906.434 6.896 0.061 124.49DH38 01/07/93 08:45 0.35 2928.365 21.931 0.016 124.84DH38 01/13/93 09:40 0.53 2934.403 6.038 0.088 125.37DH38 01/28/93 10:35 0.50 2949.441 15.038 0.033 125.87DH38 02/11/93 10:00 0.50 2963.417 13.976 0.036 126.37DH38 02/26/93 10:50 0.40 2978.451 15.034 0.027 126.77DH38 03/10/93 10:45 0.35 2990.448 11.997 0.029 127.12DH38 03/19/93 09:25 0.46 2999.392 8.944 0.051 127.58DH38 03/25/93 10:35 0.44 3005.441 6.049 0.073 128.02DH38 03/31/93 13:25 0.27 3011.559 6.118 0.044 128.29DH38 04/28/93 09:30 0.22 3039.396 0.000 0.000 128.51 Partial evacuation.DH38 06/16/93 11:20 1.11 3088.472 76.913 0.017 129.62 Used bailer • Combine with 0.22 liters from
04-28-93.DH38 08/18/93 14:19 0.28 3151.597 0.000 0.000 129.90 Partial evacuation. Unable to sample since
06-16-93.DH38 08/19/93 14:02 2.10 3152.585 0.000 0.000 132.00 Partial evacuation.DH38 08/20/93 09:56 0.33 3153.414 64.942 0.042 132.33 Combine with 0.28 liters from 08-18-93 and
2.10 liters from 08-19-93.DH38 11/12/93 10:41 3.01 3237.445 84.031 0.036 135.34 Used bai ler.
DH40 12/13/84 00:00 NA 0.000 0.000 0.000 0.00 Approximate date this part of Room Gexcavated.
DH40 01/25/85 00:00 NA 24.000 43.000 0.000 0.00 Downhole drilled 1/24/85 to 1/25/85.
AlJI-95/WPIWIP/:R3192-A A-II-26 301681.08

BRINE SAMPUNG AND EVALUATION PROGRAM REPORT Im-l993 APPENDIX A
TABLE A-2 (Continued)BRINE ACCUMULATION DATA TABLE
Data through December 31, 1993
DAYS DAYS CUMULATIVE I
LITERS SINCE USED FOR LITERS LITERSLOCATION DATE TIME REMOVED 1/1/85 CALCULATION PER DAY COLLECTED REMARKS
OH40 01/28/85 09:00 NA 27.375 3.375 0.000 0.00 Dry.OH40 02/05/85 11:15 NA 35.469 8.094 0.000 0.00 Moist at bottom.OH40 03/12/85 10:10 NA 70.424 34.955 0.000 0.00 Moist nick.OH40 03/26/85 09:55 NA 84.413 13.989 0.000 0.00 Moist nick.OH40 04/17/85 13:30 00.98 106.563 22.150 0.044 0.98 Brine, nick, and oil.OH40 04/23/85 11:33 00.26 112.481 5.918 0.044 1.24 Brine and nick.OH40 04/30/85 10:49 00.11 119.451 6.970 0.016 1.35 Feel something spongy in bottom of hole.OH40 05/07/85 09:42 00.10 126.404 6.953 0.014 1.45OH40 05/14/85 10:40 00.09 133.444 7.040 0.013 1.54OH40 OS/21/85 10:26 00.07 140.435 6.991 0.010 1.61OH40 OS/29/85 11:30 00.08 148.479 8.044 0.010 1.69OH40 06/04/85 11:15 00.10 154.469 5.990 0.017 1.79 Salt nick in hole.OH40 06/11/85 10:30 00.05 161.438 6.969 0.007 1.84OH40 06/18/85 10:01 00.09 168.417 6.979 0.013 1.93OH40 06/25/85 11:00 00.08 175.458 7.041 0.011 2.01OH40 07/02/85 11:00 00.09 182.458 7.000 0.013 2.10OH40 07/09/85 10:45 00.12 189.448 6.990 0.017 2.22OH40 07/16/85 11 :38 00.09 196.485 7.037 0.013 2.31OH40 07/24/85 10:31 00.07 204.438 7.953 .0.009 2.38OH40 07/30/85 10:08 00.07 210.422 5.984 0.012 2.45OH40 08/06/85 10:20 00.06 217.431 7.009 0.009 2.51OH40 08/14/85 10:43 00.07 225.447 8.016 0.009 2.58OH40 08/20/85 10:50 00.05 231.451 6.004 0.008 2.63OH40 08/28/85 09:53 00.08 239.412 7.961 0.010 2.71OH40 09/04/85 10:18 00.03 246.429 7.017 0.004' 2.74OH40 09/10/85 10: 11 00.04 252.424 5.995 0.007 2.78OH40 09/17/85 09:31 00.03 259.397 6.973 0.004 2.81OH40 09/24/85 09:40 00.06 266.403 7.006 0.009 2.87OH40 10/01/85 09:47 00.06 273.408 7.005 0.009 2.93OH40 10/08/85 10:32 00.04 280.439 7.031 0.006 2.97OH40 10/15/85 10:05 00.09 287.420 6.981 0.013 3.06OH40 10/23/85 10:13 00.04 295.426 8.006 0.005 3.10OH40 10/29/85 09:32 00.07 301.397 5.971 0.012 3.17OH40 11/05/85 09:10 00.04 308.382 6.985 0.006 3.21OH40 11/13/85 09:55 00.07 316.413 8.031 0.009 3.28OH40 11/21/85 11:24 00.02 324.475 8.062 0.002 3.30OH40 12/03/85 13:20 00.08 336.556 12.081 0.007 3.38OH40 12/10/85 12:40 00.04 343.528 6.972 0.006 3.42OH40 01/23/86 11:25 00.24 387.476 43.948 0.005 3.66 Entry restricted since 12/10/85 due to
mining activities.OH40 01/31/86 12:10 00.02 395.507 8.031 0.002 3.68OH40 02/19/86 11:20 00.14 414.472 18.965 0.007 3.82OH40 02/28/86 13:10 00.05 423.549 9.077 0.006 3.87OH40 03/13/86 10:00 00.02 436.417 12.868 0.002 3.89OH40 04/24/86 10:05 00.13 478.420 42.003 0.003 4.02OH40 OS/20/86 11:05 00.10 504.462 26.042 0.004 4.12OH40 06/03/86 09:58 00.20 518.415 13.953 0.014 4.32
AUI-9SIWPIWIP/:RJ192·A A-II-27 301681.08
---"~-~I-

BRINE SAMPliNG AND EVALUATION PROGRAM REPORT 1992-1993 APPENDIX A
TABLE A-2 (Continued)BRINE ACCUMULATIOl\1 DATA TABLE
Data through December 31, 1993
DAYS DAYS CUMULATIVELITERS SINCE USED FOR LITERS LITERS
LOCATION DATE TIME REMOVED 1/1/85 CALCULATION PER DAY COLLECTED REMARKS
OH40 09/16/86 10:05 00.34 623.420 105.005 0.003 4.66 Did not collect for several months.OH40 11/05/86 11:18 0.27 673.471 50.051 0.005 4.93OH40 12/30/86 12:00 00.25 728.500 55.029 0.005 5.18 Very dirty, pH 6.00.OH40 02/03/87 13:00 00.13 763.542 35.042 0.004 5.31OH40 03/06/87 10:55 0.09 794.455 30.913 0.003 5.40OH40 03/30/87 11:05 0.10 818.462 24.007 0.004 5.50OH40 06/18/87 12:00 0.19 898.500 80.038 0.002 5.69OH40 09/01/87 10:25 0.16 973.434 74.934 0.002 5.85OH40 02/08/88 11 :30 0.55 1133.479 160.045 0.003 6.40 Collected for chemistry, sarrple #257.OH40 03/29/88 11:25 0.14 1183.476 49.997 0.003 6.54 Collected for chemistry, sarrple #326.OH40 05/12/88 11:40 0.20 1227.486 44.010 0.005 6.74 Sarrpled for SNL/NM PA.OH40 07/12/88 08:40 0.15 1288.361 60.875 0.002 6.89OH40 09/27/88 10:25 0.21 1365.434 77.073 0.003 7.10 Collected for chemistry, sarrple #532.OH40 12/13/88 09:45 0.12 1442.406 76.972 0.002 7.22OH40 03/15/89 10:35 Trace 1534.441 0.000 0.000 7.22 No sarrple. Trace of brine found.OH40 04/06/89 09:50 0.27 1556.410 114.004 0.002 7.49OH40 04/20/89 09:20 0.09 1570.389 13.979 0.006 7.58OH40 05/17/89 10:00 0.30 1597.417 27.028 0.011 7.88OH40 06/06/89 09:55 0.12 1617.413 19.996 .0.006 8.00OH40 06/29/89 10:25 Trace 1640.434 0.000 0.000 8.00 Trace of brine found.OH40 07/25/89 10:18 0.07 1666.429 49.016 0.001 8.07OH40 08/16/89 09:49 0.06 1688.409 21.980 0.003 8.13OH40 09/12/89 09:10 Trace 1715.382 0.000 0.000 8.13 Trace of fluid in hole.OH40 12/13/89 10:25 0.20 1807.434 119.025 0.002 8.33OH40 01/10/90 09:50 0.08 1835.410 27.976 0.003 8.41OH40 03/05/90 09:10 0.50 1889.382 53.972 0.009 8.91OH40 03/13/90 13:30 NA 1897.563 0.000 0.000 8.91 Installed sarrpler.OH40 03/19/90 11:25 0.09 1903.476 0.000 0.000 9.00 Brine probably left in hole.OH40 03/21/90 10:25 0.02 1905.434 16.052 0.007 9.02 Combined with 0.09 liters from 03/19/90.
Used 0.11 liters for calculation.OH40 04/04/90 09:31 0.03 1919.397 13.963 0.002 9.05OH40 05/02/90 10:41 0.09 1947.445 28.048 0.003 9.14OH40 05/16/90 09:26 0.07 1961.393 13.948 0.005 9.21OH40 06/14/90 11 :19 0.13 1990.472 29.079 O.OO~. 9.34OH40 06/20/90 09:40 0.02 1996.403 5.931 0.003 9.36OH40 06/28/90 09:00 0.03 2004.375 7.972 0.004 9.39OH40 07/17/90 11 :17 0.10 2023.470 19.095 0.005 9.49OH40 03/20/91 09:24 0.72 2269.392 0.000 0.000 10.21 Some brine may have been left in hole.
First evacuation with bailer, second withpurp.
OH40 03/28/91 10:17 0.54 2277.428 253.958 O.OO!i 10.75 Combined with 0.72 liters from 03/20/91.OH40 04/10/91 8:40 0.10 2290.333 12.905 o.ooa 10.85OH40 04/17/91 10:22 0.04 2297.432 7.099 0.006 10.89OH40 05/01/91 09:20 0.10 2311.389 13.957 0.007 10.99OH40 OS/29/91 09:50 0.16 2339.410 28.021 0.006 11.15OH40 06/26/91 09:05 0.17 2367.378 27.968 0.006 11.32OH40 07/11/91 10:40 0.11 2382.444 15.066 0.007 11.43
AUI-9SfWPfWIP/:R3192-A A-II-28 301681.08

BRINE SAMPUNG AND EVALUATION PROGRAM REPORT 1992-1993 APPENDIX A
TABLE A-2 (Continued)BRINE ACCUMULATION DATA TABLE
Data through December 31, 1993
DAYS DAYS CUMULATIVELITERS SINCE USED FOR LITERS LITERS
LOCATION DATE TIME REMOVED 1/1/85 CALCULATION PER DAY COLLECTED REMARKS
OH40 08/08/91 09:15 0.18 2410.385 27.941 0.006 11.61OH40 08/21/91 10:50 0.10 2423.451 13.066 0.008 11.71OH40 09/18/91 09:15 0.14 2451.385 27.934 0.005 11.85OH40 09/25/91 11 :55 0.13 2458.497 7.112 0.018 11.98OH40 10/16/91 09:25 0.15 2479.392 20.895 0.007 12.13OH40 10/23/91 09:40 0.07 2486.403 7.011 0.010 12.20OH40 11/13/91 09:30 0.14 2507.396 20.993 0.007 12.34OH40 11/27/91 10:00 0.10 2521.417 14.021 0.007 12.44OH40 12/11/91 09:40 0.11 2535.403 13.986 0.008 12.55OH40 01/08/92 09:52 0.13 2563.411 28.008 0.005 12.68OH40 01/22/92 08:42 0.10 25n.363 13.952 0.007 12.78OH40 01/29/92 09:56 0.05 2584.414 7.051 0.007 12.83OH40 02/12/92 08:53 0.11 2598.370 13.956 0.008 12.94OH40 02/19/92 09:15 0.07 2605.385 7.015 0.010 13.01OH40 02/26/92 09:45 0.05 2612.406 7.021 0.007 13.06OH40 03/11/92 09:40 0.02 2626.403 13.997 0.001 13.08OH40 03/18/92 09:50 0.18 2633.410 7.007 0.026 13.26OH40 03/25/92 10:30 0.04 2640.438 7.028 0.006 13.30OH40 04/15/92 09:15 0.15 2661.385 20.947 .0.007 13.45OH40 04/22/92 09:35 0.07 2668.399 7.014 0.010 13.52OH40 05/06/92 11:20 0.13 2682.472 14.073 0.009 13.65OH40 OS/27/92 09:1~ 0.16 2703.385 20.913 0.008 13.81OH40 06/09/92 09:15 0.11 2716.385 13.000 0.008 13.92OH40 06/18/92 10:00 0.09 2n5.417 9.032 0.010 14.01OH40 06/25/92 09:50 0.08 2732.410 6.993 0.011 14.09OH40 07/01/92 09:30 0.18 2738.396 5.986 0.030 14.27OH40 07/15/92 09:25 0.19 2752.392 13.996 0.014 14.46
-oH40 07/22/92 09:15 0.16 2759.385 6.993 0.023 14.62OH40 07/29/92 09:57 0.10 2766.415 7.030 0.014 14.nOH40 08/04/92 09:45 0.12 2m.406 5.991 0.020 14.84OH40 08/18/92 09:59 0.28 2786.416 14.010 0.020 15.12 .OH40 09/02/92 10:00 0.30 2801.417 15.001 0.020 15.42OH40 09/09/92 10:05 0.15 2808.420 7.003 0.021 15.57OH40 09/17/92 09:15 0.16 2816.385 7.965 0.020 15.73OH40 09/23/92 10:10 0.11 2822.424 6.039 0.018 15.84OH40 10/.12/92 12:45 0.20 2841.531 19.107 0.010 16.04OH40 10/21/92 13:10 0.28 2850.549 9.018 0.031 16.32OH40 10/28/92 09:20 0.10 2857.389 6.840 0.015 16.42OH40 11/11/92 09:40 0.38 2871.403 14.014 0.027 16.80OH40 11/18/92 13:15 0.17 2878.552 7.149 0.024 16.97OH40 11/25/92 09:40 0.09 2885.403 6.851 0.013 17.06OH40 12/09/92 12:45 0.25 2899.531 14.128 0.018 17.31OH40 12/16/92 10:20 0.04 2906.431 6.900 0.006 17.35OH40 01/07/93 08:40 0.27 2928.361 21.930 0.012 17.62OH40 01/13/93 09:53 0.53 2934.412 6.051 0.088 18.15OH40 01/28/93 10:25 0.30 2949.434 15.022 0.020 18.45OH40 02/11/93 09:55 0.30 2963.413 13.979 0.021 18.75
AUI-951WPIWIP/:R3192·A A-II-29 301681.08
--- -----------------------

..-.,-~2:._
BRINE SAMPUNG AND EVALUATION PROGRAM REPORT 1992-1993 APPENDIX A
TABLE A-2 (Continued)BRINE ACCUMULATION DATA TABLE
Data through DecembElr 31, 1993
DAYS DAYS CUMULATIVELITERS SINCE USED FOR LITERS LITERS
LOCATION DATE TIME REMOVED 1/1/85 CALCULATION PER DAY COLLECTED REMARKS
DH40 02/26/93 10:45 0.23 2978.448 15.035 0.015 18.98OH40 03/10/93 10:40 0.43 2990.444 11.996 0.036 19.41OH40 03/19/93 09:28 0.22 2999.394 8.950 0.025 19.63OH40 03/25/93 10:15 0.10 3005.427 6.033 0.017 19.73OH40 03/31/93 13:05 0.13 3011.545 6.118 0.021 19.86OH40 04/28/93 09:15 0.48 3039.385 27.840 0.017 20.34OH40 06/16/93 11:30 0.45 3088.479 49.094 0.009 20.79OH40 08/19/93 14:12 0.42 3152.592 64.113 0.007 21.21OH40 11/12/93 10:28 0.78 3237.436 84.844 0.009 21.99
OH42 12/30/84 00:00 NA 0.000 0.000 0.000 0.00 Approximate date this part of Room Gexcavated.
OH42 01/23/85 00:00 NA 22.000 24.000 0.000 0.00 Downhole drilled.OH42 01/28/85 09:00 NA 27.375 0.000 0.000 0.00 Moist muck at the bottom.OH42 02/05/85 11:15 00.27 35.469 13.469 0.020 0.27 First time collected.OH42 02/11/85 11:00 00.30 41.458 5.989 0.050 0.57OH42 02/19/85 13:10 00.33 49.549 8.091 0.041 0.90OH42 02/26/85 10:45 00.26 56.448 6.899 .0.038 1.16OH42 03/05/85 10:00 00.28 63.417 6.969 0.040 1.44OH42 03/12/85 10:20 00.25 70.431 7.014 0.036 1.69OH42 03/20/85 10:54 00.25 78.454 8.023 0.031 1.94 Valve leaked, some brine drained back down
hole.OH42 03/26/85 10:06 00.28 84.421 5.967 0.047 2.22OH42 04/02/85 10:45 00.26 91.448 7.027 0.037 2.48OH42 04/10/85 10:45 00.29 99.448 8.000 0.036 2.77OH42 04/17/85 13:30 00.24 106.563 7.115 0.034 3.01OH42 04/23/85 13:23 00.04 112.558 5.995 0.007 3.05 Significant volume of brine drained back
down hole.OH42 04/30/85 10:31 00.38 119.438 6.880 0.055 3.43OH42 05/07/85 09:25 00.33 126.392 6.954 0.047 3.76OH42 05/14/85 10:30 00.25 133.438 7.046 0.035 4.01OH42 OS/21/85 10:17 00.26 140.428 6.990 0.037 4.27OH42 OS/29/85 10:10 00.30 148.424 7.996 0.038 4.57OH42 06/04/85 10:45 00.22 154.448 6.024 0.037 4.79OH42 06/11/85 10:10 00.25 161.424 6.976 0.036 5.04OH42 06/18/85 09:53 00.25 168.412 6.988 0.036 5.29OH42 06/25/85 11:15 00.25 175.469 7.057 0.035 5.54OH42 07/02/85 11 :00 00.24 182.458 6.989 0.034 5.78OH42 07/09/85 10:30 00.25 189.438 6.980 0.036 6.03OH42 07/16/85 11:08 00.25 196.464 7.026 0.036 6.28 Brine effervesces.OH42 07/24/85 10: 19 00.28 204.430 7.966 0.035 6.56OH42 07/30/85 09:57 00.22 210.415 5.985 0.037 6.78OH42 08/06/85 10: 13 00.26 217.426 7.011 0.037 7.04OH42 08/14/85 10:59 00.27 225.458 8.032 0.03/. 7.31OH42 08/20/85 10:45 00.21 231.448 5.990 0.035 7.52OH42 08/28/85 09:45 00.29 239.406 7.958 0.036 7.81
AUl·951WPIWIP/:R3192-A A-II-30 301681.08

BRINE SAMPUNG AND EVALUATION PROGRAM REPORT 1992-1993 APPENDIX A
TABLE A-2 (Continued)BRINE ACCUMULATION DATA TABLE
Data through December 31, 1993
DAYS DAYS CUMULATIVELITERS SINCE USED FOR LITERS LITERS
LOCATION DATE TIME REMOVED 1/1/85 CALCULATION PER DAY COLLECTED REMARKS
oH42 09/04/85 10: 12 00.25 246.425 7.019 0.036 8.06OH42 09/10/85 09:56 00.21 252.414 5.989 0.035 8.27OH42 09/17/85 09:26 00.28 259.393 6.979 0.040 8.55oH42 09/24/85 09:37 00.24 266.401 7.008 0.034 8.79oH42 10/01/85 09:44 00.24 273.406 7.005 0.034 9.03oH42 10/08/85 10:25 00.23 280.434 7.028 0.033 9.26oH42 10/15/85 10:00 00.23 287.417 6.983 0.033 9.49oH42 10/23/85 10:07 00.26 295.422 8.005 0.032 9.75oH42 10/29/85 09:16 00.24 301.386 5.964 0.040 9.99OH42 11/05/85 09:05 00.22 308.378 6.992 0.031 10.21oH42 11/13/85 09:46 00.26 316.407 8.029 0.032 10.47oH42 11/21/85 10:53 00.26 324.453 8.046 0.032 10.73oH42 11/26/85 10:59 00.16 329.458 5.005 0.032 10.89OH42 12/03/85 13:10 00.20 336.549 7.091 0.028 11.09 Sample for chemistry analysis, #2.oH42 12/10/85 12:50 00.22 343.535 6.986 0.031 11.31oH42 01/23/86 11:30 01.32 387.479 43.944 0.030 12.63 Entry restricted since 12/10/85 due to
mining activities.OH42 01/31/86 12:05 00.30 395.503 8.024 0.037 12.93OH42 02/12/86 10:35 00.38 407.441 11.938 .0.032 13.31OH42 02/19/86 11:10 00.22 414.465 7.024 0.031 13.53oH42 02/28/86 13:00 00.31 423.542 9.077 0.034 13.84oH42 03/06/86 10:30 00.17 429.438 5.896 0.029 14.01oH42 03/13/86 09:53 00.21 436.412 6.974 0.030 14.22OH42 03/26/86 10:00 00.39 449.417 13.005 0.030 14.61OH42 04/02/86 09:25 00.20 456.392 6.975 0.029 14.81OH42 04/08/86 09:30 00.20 462.396' 6.004 0.033 15.01OH42 04/16/86 11:55 00.24 470.497 8.101 0.030 15.25oH42 04/24/86 09:55 00.21 478.413 7.916 0.027 15.46OH42 04/30/86 10:41 00.17 484.445 6.032 0.028 15.63OH42 05/06/86 10:10 00.19 490.424 5.979 0.032 15.82OH42 05/13/86 10:00 00.20 497.417 6.993 0.029 16.02OH42 OS/20/86 11 :00 00.20 504.458 7.041 0.028 16.22OH42 OS/27/86 15:35 00.20 511.649 7.191 0.028 16.42OH42 06/03/86 09:50 00.20 518.410 6.761 0.030 16.62oH42 06/10/86 11:13 00.17 525.467 7.057 0.024 16.79oH42 06/17/86 10:40.00.20 532.444 6.977 0.029 16.99 Sample for brine chemistry, #22.oH42 06/24/86 10:40 00.18 539.444 • 7.000 0.026 17.17oH42 07/01/86 13:45 00.20 546.573 7.129 0.028 17.37OH42 07/08/86 10:22 00.20 553.432 6.859 0.029 17.57oH42 07/16/86 10: 15 00.30 561.427 7.995 0.038 17.87OH42 07/22/86 09:50 00.16 567.410 5.983 0.027 18.03oH42 07/29/86 10:25 00.20 574.434 7.024 0.028 18.23OH42 08/05/86 11:00 00.22 581.458 7.024 0.031 18.45oH42 08/12/86 10:20 00.20 588.431 6.973 0.029 18.65OH42 08/19/86 11 :20 00.18 595.472 7.041 0.026 18.83oH42 08/26/86 10:25 00.20 602.434 6.962 0.029 19.03 Static level not measured.OH42 09/04/86 10:20 00.25 611.431 8.997 0.028 19.28
AUI-95fWPIWIP/:R3192-A A-II-31 301681.08
------ _._~~. - - ...... , ---- ----_._-

BRINE SAMPUNG AND EVALUATION PROGRAM REPORT 1992-1993 APPENDIX A
TABLE A-2 (Continqed)BRINE ACCUMULATION DATA TABLE
Data through December 31, 1993
DAYS DAYS CUMULATIVELITERS SINCE USED FOR LITER,S LITERS
LOCATION DATE TIME REMOVED 1/1/85 CALCULATION PER DAY COLLECTED REMARKS
DH42 09/09/86 09:46 00.14 616.407 4.976 0.028 19.42 Sarrple #24.DH42 09/16/86 09:52 00.20 623.411 7.004 0.029 19.62DH42 09/23/86 09:58 00.15 630.415 7.004 0.021 19.77DH42 10/01/86 12:03 00.36 638.502 8.087 0.045 20.13DH42 10/08/86 10:55 00.15 645.455 6.953 0.022 20.28DH42 10/14/86 11:19 00.15 651.472 6.017 0.025 20.43DH42 11/05/86 11 :07 0.52 673.463 21.991 0.024 20.95DH42 11/20/86 12:10 00.33 688.507 15.044 0.022 21.28DH42 12/30/86 11 :45 00.78 728.4.90 39.983 0.020 22.06 0.50 liters for sarrple, pH 5.91.DH42 02/03/87 12:50 00.85 763.535 35.045 0.024 22.91DH42 03/06/87 10:45 0.68 794.448 30.913 0.022 23.59DH42 03/30/87 11:00 0.53 818.458 24.010 0.022 24.12DH42 05/07/87 11:15 0.90 856.469 38.011 0.024 25.02 Brine effervesces.DH42 06/17/87 10:35 0.91 897.441 0.000 0.000 25.93 Sarrples removed for chemistry, #112A,
#112B. ~ood fragments in hole. Some brineleft in hole, no calculation.
DH42 06/18/87 11:56 0.10 898.497 42.028 0.024 ?6.03 Calculated using 1.01 liters (0.91 liters6/17/87 plus 0.10 liters 6/18/87).
DH42 07/28/87 11:10 0.94 938.465 39.968 0.024 26.97DH42 09/01/87 10:15 0.79 973.427 34.962 0.023 27.76 Collected for chemistry, sarrple #151 A&B.DH42 10/20/87 11:31 1.29 1022.480 49.053 0.026 29.05DH42 11/19/87 10:55 0.75 1052.455 29.975 0.025 29.80 Collected for chemistry, sarrple #229.DH42 01/04/88 11 :30 1.13 1098.479 46.024 0.025 30.93DH42 02/08/88 11:20 0.75 1133.472 34.993 0.021 31.68 Collected for chemistry, sarrple #255 &
#256.DH42 03/29/88 11:20 1.10 1183.472 50.000 0.022 32.78 Collected for chemistry, sarrple #323 •
#325.DH42 05/05/88 09:30 0.75. 1220.396 36.924 0.020 33.53 Sarrpled for SNL/NM PA.DH42 05/12/88 09:45 0.13 1227.406 7.010 0.019 33.66 Sarrpled for SNL/NM PA.DH42 07/12/88 08:35 1.15 1288.358 60.952 0.019 34.81 Collected for chemistry, sarrple #415 &
#416.DH42 07/28/88 10:10 0.34 1304.424 16.066 0.02'( 35.15 Sarrpled for SNL/NM PA.DH42 09/27/88 10:20 0.66 1365.431 61.007 0.01'1 35.81 Collected for chemistry, sarrple #530 &
#531.DH42 12/13/88 09:38 1.71 1442.401 76.970 0.022 37.52 Collected for chemistry. sarrple #628 •
#631.DH42 03/15/89 10:30 1.50 1234.438 92.037 0.016 39.02 Sarrple saved for chemistry, sarrple #722 .
724.DH42 04/06/89 10: 10 0•.54 1556.424 21.986 0.025 39.56DH42 04/20/89 09:10 0.50 1570.382 13.958 0.036 40.06DH42 05/17/89 09:45 0.66 1597.406 27.024 0.024 40.72DH42 06/06/89 09:50 0.41 1617.410 20.004 0.020 41.13 Sarrple saved for chemistry.DH42 06/29/89 10:20 0.35 1640.431 23.021 0.015 41.48DH42 07/25/89 10:10 0.55 1666.424 25.993 0.021 42.03 Sarrple saved for SNL brine study.DH42 08/16/89 09:40 0.36 1688.403 21.979 0.016 42.39DH42 09/12/89 09:00 0.35 1715.375 26.972 0.013 42.74 Sarrple saved for chemistry.DH42 12/13/89 10:03 1.50 1807.419 92.044 0.016 44.24 Sarrple saved for chemistry, sarrple #898.
AUI-9SIWPIWIP/:R3192-A A-II-32 301681.08

BRINE SAMPUNG AND EVALUATION PROGRAM REPORT 1992·1993 APPENDIX A
TABLE A-2 (Continued)BRINE ACCUMULATION DATA TABLE
Data through December 31, 1993
DAYS DAYS CUMULATIVELITERS SINCE USED FOR LITERS LITERS
LOCATION DATE TIME REMOVED 1/1/85 CALCULATION PER DAY COLLECTED REMARKS
OH42 01/10/90 09:45 0.70 1835.406 27.987 0.025 44.94OH42 01/24/90 09:57 0.27 1849.415 14.009 0.019 45.21OH42 02/07/90 10:23 0.34 1863.433 14.018 0.024 45.55OH42 02/21/90 10: 19 0.32 1877.430 13.997 0.023 45.87OH42 03/05/90 09:00 0.36 1889.375 11.945 0.030 46.23OH42 03/13/90 12:00 NA 1897.500 0.000 0.000 46.23 Installed sampler.OH42 03/19/90 11:12 0.06 1903.467 14.092 0.004 46.29 Brine probably left in hole.OH42 03/21/90 10:23 0.08 1905.433 1.966 0.041 46.37 Combined with 0.06 liters from 03/19/90.
Used 0.14 liters for calculation.OH42 04/04/90 09:24 0.24 1919.392 13.959 0.017 46.61OH42 04/10/90 08:43 0.14 1925.363 5.971 0.023 46.75OH42 04/17/90 10:29 0.14 1932.437 7.074 0.020 46.89OH42 04/24/90 09:26 0.13 1939.393 6.956 0.019 47.02OH42 05/02/90 10:39 0.15 1947.444 8.051 0.019 47.17OH42 05/09/90 09:01 0.13 1954.376 6.932 0.019 47.30OH42 05/16/90 09:11 0.13 1961.383 7.007 0.019 47.43OH42 OS/23/90 12:08 0.14 1968.506 7.123 0.020 47.57OH42 05/31/90 08:59 0.13 1976.374 7.868 0.017 47.70OH42 06/06/90 09:37 0.13 1982.401 6.027 0.022 47.83OH42 06/14/90 08:46 0.16 1990.365 7.964 0.020 47.99OH42 06/20/90 09:35 0.12 1996.399 6.034 0.020 48.11OH42 06/28/90 08:55 0.15 2004.372 7.973 0.019 48.26OH42 07/17/90 11:08 0.31 2023.464 19.092 0.016 48.57OH42 07/25/90 09:40 0.20 2031.403 7.939 0.025 48.77OH42 08/01/90 10:20 0.15 2038.431 7.028 0.021 48.92OH42 03/28/91 10:06 3.02 2277.421 0.000 0.000 51.94 Some brine may have been left in hole.
Sampler still functioning.OH42 04/10/91 08:46 0.90 2290.365 0.000 0.000 52.84 Partial evacuation.OH42 04/11/91 08:42 0.50 2291.363 252.932 0.017 53.34 Combined with 3.02 liters from 03/28/91 and
0.90 liters from 04/10/91.OH42 04/17/91 10: 17 0.11 2297.428 6.065 0.018 53.45OH42 04/24/91 09:05 0.12 2304.378 6.950 0.017 53.57OH42 05/01/91 09:11 0.12 2311.383 7.005 0.017 53.69OH42 05/08/91 08:24 0.12 2318.350 6.967 0.017 53.81OH42 05/15/91 09:02 0.12 2325.376 7.026 0.017 53.93OH42 OS/29/91 09:55 0.27 2339.413 14.037 0.019 54.20OH42 06/05/91 13:40 0.14 2346.569 7.156 0.020 54.34OH42 06/12/91 10:07 0.12 2353.422 6.853 0.018 54.46OH42 06/19/91 13:35 0.13 2360.566 7.144 0.018 54.59OH42 06/26/91 09:10 0.12 2367.382 6.816 0.018 54.71OH42 07/11/91 10:49 0.27 2382.451 15.069 0.018 54.98OH42 07/17/91 09:22 0.11 2388.390 5.939 0.019 55.09OH42 07/30/91 10: 15 0.30 2401.427 13.037 0.023 55.39OH42 08/08/91 09:10 0.24 2410.382 8.955 0.027 55.63OH42 08/14/91 10:33 0.16 2416.440 6.058 0.026 55.79OH42 08/21/91 10:45 0.17 2423.448 7.008 0.024 55.96OH42 08/28/91 10: 10 0.24 2430.424 6.976 0.034 56.20
AUl·9SIWPIWIP/:R3192·A A-II-33 301681.08
-----

BRINE SAMPUNG AND EVALUATION PROGRAM REPORT 1992-1993 APPENDIX A
TABLE A-2 (Continued)BRINE ACCUMULATION! DATA TABLE
Data through December 31, 1993
DAYS DAYS CUMULATIVELITERS SINCE USED FOR LITERS LITERS
LOCATION DATE TIME REMOVeD 1/1/85 CALCULATION PER DAY COLLECTED . REMARKS
DH42 09/04/91 11:10 0.18 2437.465 7.041 0.026 56.38DH42 09/11/91 11 :40 0.16 2444.486 7.021 0.023 56.54DH42 09/18/91 09:10 0.18 2451.382 6.896 0.026 56.72DH42 09/25/91 11:52 0.15 2458.494 7.112 0.021 56.87DH42 10/02/91 11:00 0.15 2465.458 6.964 0.022 57.02DH42 10/16/91 09:15 0.26 2479.385 13.927 0.019 57.28DH42 10/23/91 09:31 0.16 2486.397 7.012 0.023 57.44DH42 11/06/91 10:03 0.28 2500.419 14.022 0.020 57.72DH42 11/13/91 09:35 0.15 2507.399 6.980 0.021 57.87DH42 11/20/91 11:20 0.14 2514.472 7.073 0.020 58.01DH42 11127/91 10:05 0.13 2521.420 6.948 0.019 58.14DH42 12/04/91 09:52 0.12 2528.411 6.991 . 0.017 58.26DH42 12/11/91 09:35 0.10 2535.399 6.988 0.014 58.36DH42 12/18/91 09:15 0.13 2542.385 6.986 0.019 58.49DH42 12/23/91 08:40 0.10 2547.361 4.976 0.020 58.59DH42 01/08/92 09:50 0.31 2563.410 16.049 0.019 58.90DH42 01/15/92 09:40 0.11 2570.403 6.993 0.016 59.01DH42 01/22/92 08:35 0.16 2577.358 6.955 0.023 59.17DH42 01/29/92 09:53 0.17 2584.412 7.054 .0.024 59.34DH42 02/12/92 08:49 0.26 2598.367 13.955 0.019 59.60DH42 02/19/92 09:18 0.10 2605.388 7.021 0.014 59.70DH42 02/26/92 09:35 0.17 2612.399 7.011 0.024 59.87DH42 03/11/92 09:30 0.23 2626.396 13.997 0.016 60.10DH42 03/18/92 09:52 0.13 2633.411 7.015 0.019 60.23DH42 03/25/92 10:25 0.39 2640.434 7.023 0.056 60.62DH42 04/01/92 09:10 0.13 2647.382 6.948 0.019 60.75DH42 04/07/92 09:13 0.09 2653.384 6.002 0.015 60.84DH42 04/15/92 09:08 0.15 2661.381 7.997 0.019 60.99DH42 04/22/92 09:30 0.13 2668.396 7.015 0.019 61.12DH42 05/06/92 11:15 0.06 2682.469 14.073 0.004 61.18 Hole examined, no brine left in hole.DH42 05/13/92 13:47 0.19 2689.574 7.105 0.027 61.37DH42 OS/21/92 10:29 0.26 2697.437 7.863 0.033 61.63DH42 OS/27/92 09:10 0.12 2703.382 5.945 0.020 61. 75DH42 06/09/92 09:10 0.22 2716.382 13.000 0.017 61.97DH42 06/18/92 09:55 0.09 2725.413 9.031 0.010 62.06DH42 06/25/92 09:45 0.17 2732.406 6.993 0.024 62.23DH42 07/01/92 09:15 0.09 2738.385 5.979 0.015 62.32DH42 07/08/92 09:25 0.12 2745.392 7.007 0.017 62.44DH42 07/15/92 09:18 0.12 2752.388 6.996 0.017 62.56DH42 07/22/92 09:10 0.12 2759.382 6.994 0.017 62.68DH42 07/29/92 09:51 0.14 2766.410 7.028 0.020 62.82DH42 08/04/92 09:37 0.10 2m.401 5.991 0.017 62.92DH42 08/18/92 09:54 0.23 2786.413 14.012 0.016 63.15DH42 09/02/92 09:53 0.23 2801.412 14.999 0.015 63.38DH42 09/09/92 10:00 0.16 2808.417 7.005 0.023 63.54DH42 09/17/92 09:10 0.08 2816.382 7.965 0.010 63.62DH42 09/23/92 10:04 0.12 2822.419 6.037 0.020 63.74
AU1-95fWPfWIP/:R3192-A A-II-34 301681.08

BRINE SAMPUNG AND EVALUATION PROGRAM REPORT 1992·1993 APPENDIX A
TABLE A-2 (Continued)BRINE ACCUMULATION DATA TABLE
Data through December 31, 1993
DAYS DAYS CUMULATIVEqTERS SINCE USED FOR LITERS LITERS
LOCATION DATE TIME REMOVED 1/1185 CALCULATION PER DAY COLLECTED REMARKS
OH42 09/30/92 11:05 0.10 2829.462 7.043 0.014 63.84OH42 10/12/92 12:40 0.10 2841.528 12.066 0.008 63.94OH42 10/21/92 13:05 0.28 2850.545 9.017 0.031 64.22OH42 10/28/92 09:15 0.13 2857.385 6.840 0.019 64.35OH42 11/11/92 09:35 0.20 2871.399 14.014 0.014 64.55OH42 11/18/92 13:11 0.10 2878.549 7.150 0.014 64.65OH42 11/25/92 09:35 0.10 2885.399 6.850 0.015 64.75OH42 12/09/92 12:35 0.27 2899.524 14.125 0.019 65.02OH42 12/16/92 10:15 0.15 2906.427 6.903 0.022 65.17OH42 01/07/93 08:35 0.07 2928.358 21.931 0.003 65.24OH42 01/13/93 09:48 0.22 2934.408 6.050 0.036 65.46OH42 01/28/93 10:20 0.09 2949.431 15.023 0.006 65.55OH42 02/11/93 09:45 0.02 2963.406 13.975 0.001 65.57OH42 02/26/93 10:30 0.13 2978.438 15.032 0.009 65.70OH42 03/10/93 10: 16 0.26 2990.428 11.990 0.022 65.96OH42 03/19/93 09:40 0.00 2999.403 8.975 0.000 65.96OH42 03/25/93 10:10 0.05 3005.424 6.021 0.008 66.01OH42 03/31/93 12:45 0.22 3011.531 6.107 0.036 66.23OH42 04/28/93 09:00 0.23 3039.375 27.844 .0.008 66.46OH42 06/16/93 11:35 0.16 3088.483 49.108 0.003 66.62OH42 08/18/93 10:30 0.35 3151.438 0.000 0.000 66.97 Partial evacuation. Unable to sample since
06-16-93.OH42 08/20/93 09:49 0.35 3153.409 64.926 0.011 67.32 Combine with 0.35 liters from 08-18-93.OH42 11/09/93 10:37 0.34 3234.442 0.000 0.000 67.66 Partial evacuation.OH42 11/12/93 10:24 0.65 3237.433 84.024 0.012 68.31 Used bailer. Combine with 0.34 liters from
11-09-93.
OH42A 12/30/84 00:00 NA 0.000 0.000 0.000 0.00 Approximate date this part of Room Gexcavated.
OH42A 01/25/85 00:00 NA 24.000 0.000 0.000 0.00 Downhole drilled ere-drill of OH42) torecover core from 20 to 40 ft.
OH42A 01/28/85 09:00 NA 27.375 0.000 0.000 0.00 Brine in hole.OH42A 02/05/85 11:15 00.85 35.469 37.469 0.023 0.85 First time collected.OH42A 02/11/85 11:00 00.99 41.458 5.989 0.165 1.84OH42A 02/19/85 12:10 01.45 49.507 8.049 0.180 3.29
..oH42A 02/26/85 10:45 01.18 56.448 6.941 0.170 4.47OH42A 03/05/85 10:00 01.24 63.417 6.969 0.178 5.71OH42A 03/12/85 10:20 01.29 70.431 7.014 0.184 7.00OH42A 03/20/85 11:00 01.45 78.458 8.027 0.181 8.45OH42A 03/26/85 10: 10 01.07 84.424 5.966 0.179 9.52OH42A 04/02/85 10:45 01.15 91.448 7.024 0.164 10.67OH42A 04/10/85 10:45 01.45 99.448 8.000 0.181 12.12OH42A 04/17/85 13:30 01.32 106.563 7.115 0.186 13.44OH42A 04/23/85 13:23 01.07 112.558 5.995 0.178 14.51OH42A 04/30/85 10:23 01.35 119.433 6.875 0.196 15.86OH42A 05/07/85 09:23 01.39 126.391 6.958 0.200 17.25
AU1·95fWPIWIP/:RJ 192·A A-II-35 301681.08
-r_-- .... -~~ ) c •. ~v:-~ ._- - ~----_._--- ._--_._-~~--

BRINE SA.'\fPUNG AND EVALUATION PROGRAM REPORT 1992-1993 APPENDIX A
TABLE A-2 (Continued)BRINE ACCUMULATION DATA TABLE
Data through December 31, 1993
DAYS DAYS CUMULATIVELITERS SINCE USED FOR LITERS LITERS
LOCATION DATE TIME REMOVED 1/1/85 CALCULATION PER DAY COLLECTED REMARKS
DH42A 05/14/85 10:25 01.34 133.434 7.043 0.190 18.59DH42A OS/21/85 10: 14 01.29 140.426 6.992 0.184 19.88DH42A OS/29/85 10:30 01.28 148.438 8.012 0.160 21.16DH42A 06/04/85 10:50 01.03 154.451 6.013 0.171 22.19DH42A 06/11/85 10: 15 01.19 161.427 6.976 0.171 23.38DH42A 06/18/85 09:51 01.18 168.410 6.983 0.169 24.56DH42A 06/25/85 11 :05 01.16 175.462 7.052 0.164 25.nDH42A 07/02/85 11:00 01.12 182.458 6.996 0.160 26.84DH42A 07/09/85 10:25 01.12 189.434 6.976 0.161 27.96 Gas effervescing from sample.DH42A 07/16/85 11:10 01.11 196.465 7.031 0.158 29.07 Brine effervesces.DH42A 07/24/85 10:25 01.23 204.434 7.969 0.154 30.30DH42A 07/30/85 09:54 00.94 210.413 5.979 0.15;' 31.24DH42A 08/06/85 10:10 01.05 217.424 7.011 0.150 32.29DH42A 08/14/85 10:33 01.11 225.440 8.016 0.138 33.40DH42A 08/20/85 10: 14 00.92 231.426 5.986 0.154 34.32DH42A 08/28/85 09:40 01.17 239.403 7.977 0.147 35.49DH42A 09/04/85 10:10 00.99 246.424 7.021 0.141 36.48DH42A 09/10/85 09:55 00.83 252.413 5.989 0.139 37.31DH42A 09/17/85 09:25 00.92 259.392 6.979 0.132 38.23DH42A 09/24/85 09:25 00.94 266.392 7.000 0.13(, 39.17DH42A 10/01/85 09:40 00.93 273.403 7.011 0.133 40.10DH42A 10/08/85 10:24 00.96 280.433 7.030 0.137 41.06DH42A 10/15/85 10: 15 00.81 287.427 6.994 0.116 41.87DH42A 10/23/85 10:10 01.02 295.424 7.997 0.128 42.89DH42A 10/29/85 09:20 00.75 301.389 5.965 0.126 43.64DH42A 11/05/85 09:00 00.86 308.375 6.986 0.123 44.50DH42A 11/13/85 09:44 01.03 316.406 8.031 0.128 45.53DH42A 11/21/85 10:50 00.94 324.451 8.045 0.117 46.47DH42A 11/26/85 10:55 00.61 329.455 5.004 0.122 47.08DH42A 12/03/85 13:05 00.78 336.545 7.090 0.110 47.86 Sample for chemistry analysis, #1.DH42A 12/10/85 12:50 00.86 343.535 6.990 0.123 48.nDH42A 01/23/86 11:40 05.13 387.486 43.951 0.117 53.85 Entry restricted since 12/10/85 due to
mining activities.DH42A 01/31/86 12:00 00.92 395.500 8.014 0.115 54.77DH42A 02/12/86 10:40 01.36 407.444 11.944 0.114 56.13DH42A 02/19/86 11:15 00.80 414.469 7.025 0.114 56.93DH42A 02/28/86 12:55 00.90 423.538 9.069 0.099 57.83DH42A 03/06/86 10:25 00.70 429.434 5.896 0.119 58.53DH42A 03/13/86 09:48 00.73 436.408 6.974 0.105 59.26DH42A 03/26/86 09:40 01.39 449.403 12.995 0.107 60.65DH42A 04/02/86 09:20 00.80 456.389 6.986 0.115 61.45DH42A 04/08/86 09:28 00.63 462.394 6.005 0.105 62.08DH42A 04/16/86 11:50 00.89 470.493 8.099 0.110 62.97DH42A 04/24/86 09:50 00.67 478.410 7.917 0.085 63.64DH42A 04/30/86 10:36 00.76 484.442 6.032 0.126 64.40DH42A 05/06/86 10:00 00.55 490.417 5.975 0.092 64.95DH42A 05/13/86 10:00 00.73 497.417 7.000 0.104 65.68
AUI-95/WPfWIP/:R3192-A A-II-36 301681.08

BRINE SAMPUNG AND EVALUATION PROGRAM REPORT 1992-1993 APPENDIX A
TABLE A-2 (Continued)BRINE ACCUMULATION DATA TABLE
Data through December 31, 1993
DAYS DAYS CUMULATIVELITERS SINCE USED FOR LITERS LITERS
LOCATION DATE TIME REMOVED 1/1/85 CALCULATION PER DAY COLLECTED REMARKS
DH42A OS/20/86 11:00 00.70 504.458 7.041 0.099 66.38DH42A OS/27/86 15:35 00.65 511.649 7.191 0.090 67.03DH42A 06/03/86 09:50 00.66 518.410 6.761 0.098 67.69DH42A 06/10/86 11:15 00.54 525.469 7.059 0.076 68.23DH42A 06/17/86 10:31 00.65 532.438 6.969 0.093 68.88 Sample for brine chemisrtry, #21.DH42A 06/24/86 10:45 00.63 539.448 7.010 0.090 69.51DH42A 07/01/86 13:50 00.71 546.576 7.128 0.100 70.22DH42A 07/08/86 10:25 00.63 553.434 6.858 0.092 70.85DH42A 07/16/86 10:00 00.66 561.417 7.983 0.083 71.51DH42A 07/22/86 09:48 00.61 567.408 5.991 0.102 72.12DH42A 07/29/86 10:25 00.71 574.434 7.026 0.101 72.83DH42A 08/05/86 10:55 00.66 581.455 7.021 0.094 73.49DH42A 08/12/86 10:23 00.63 588.433 6.978 0.090 74.12DH42A 08/19/86 11:22 00.68 595.474 7.041 0.097 74.80DH42A 08/26/86 10:28 00.68 602.436 6.962 0.098 75.48 Static level not measured.DH42A 09/04/86 10:25 00.71 611.434 8.998 0.079 76.19 Valve broke off and left in hole after
collecting most of brine. Some brine leftin hole.
DH42A 09/09/86 09:40 00.07 616.403 4.969 .0.014 76.26 80ttom obstructed by object in hole.Sample #23.
DH42A 09/16/86 09:59 00.95 623.416 7.013 0.135 77.21DH42A 09/23/86 10:02 00.60 630.418 7.002 0.086 77.81DH42A 10/01/86 11:57 00.43 638.498 8.080 0.053 78.24DH42A 10/08/86 10:55 00.81 645.455 6.957 0.116 79.05DH42A 10/14/86 11:24 00.56 651.475 6.020 0.093 79.61
. DH42A 11/05/86 11:04 1.94 673.461 21.986 0.088 81.55DH42A 11/20/86 12:08 01.40 688.506 15.045 0.093 82.95DH42A 12/31/86 11 :30 02.91 729.479 40.973 0.071 85.86 0.99 liters for sample, pH 5.86.DH42A 02/03/87 12:35 03.15 763.524 34.045 0.093 89.01DH42A 03/06/87 10:45 2.61 794.448 30.924 0.084 91.62DH42A 03/30/87 10:56 2.52 818.456 24.008 0.105 94.14DH42A 05/07/87 11:10 3.17 856.465 38.009 0.083 97.31DH42A 06/17/87 10:30 2.94 897.438 O.OQO 0.000 100.25 Samples removed for chemistry. #113A,
#1138, #115A, #1158, #118A, #1188.Approximately 0.01 liter spilled. Somebrine left in hole, no calculation.
DH42A 06/18/87 11:54 0.11 898.496 42.031 0.073 100.36 Calculated using 3.05 liters (2.94 litersfrom 6/17/87 plus 0.11 liters from6/18/87).
DH42A 07/28/87 11:03 3.07 938.460 39.964 0.077 103.43DH42A 09/01/87 10:08 2.69 973.422 34.962 0.077 106.12 Collected for chemistry, sample #154 A&8
and Sample #150 A&8. Samples effervesce.DH42A 10/20/87 11:28 3.73 1022.478 49.056 0.076 109.85DH42A 11/19/87 10:55 2.17 1052.455 29.977 0.072 112.02 Collected for chemistry, sample #228 &
#233.DH42A 01/04/88 11 :25 3.28 1098.476 46.021 0.071 115.30DH42A 02/08/88 11:10 2.47 1133.465 34.989 0.071 117.77 Collected for chemistry, sample #250, #251,
AU1·951WPIWIP/:R3192-A A-IJ-37 301681.08

BRINE SAMPUNG AND EVALUATION PROGRAM REPORT 1992-1993 APPENDIX A
TABLE A-2 (Continued)BRINE ACCUMULATION DATA TABLE
Data through December 31, 1993
DAYS DAYS CUMULATIVELITERS SINCE USED FOR LITERS LITERS
LOCATION DATE TIME REMOVED 1/1/85 CALCULATION PER DAY COLLECTED REMARKS
#252, #253, & #254.DH42A 03/29/88 11:15 3.57 1183.469 50.004 0.071 121.34 Collected for chemistry, sarrple #316 •
#322.DH42A 05/05/88 09:00 2.38 1220.375 36.906 0.064 123.n Sarrpled for SNL/NM PA.DH42A 05/12/88 09:40 0.50 1227.403 7.028 0.071 124.22 Sarrpled for SNL/NM PA.DH42A 07/12/88 08:30 4.06 1288.354 60.951 0.067 128.28 Collected for chemistry, sarrple #407 -
#414.DH42A 07/28/88 10:15 1.25 1304.427 16.073 0.078 129.53 Sarrpled for SNL/NM PA.DH42A 09/14/88 08:45 3.00 1352.365 47.938 0.063 132.53DH42A 09/27/88 10: 10 1.07 1365.424 13.059 0.082 133.60 Collected for chemistry, sarrple #528 &
#529.DH42A 12/13/88 09:35 7.95 1442.399 76.975 0.103 141.55 Collected for chemistry, sarrpl e #618 -
#627.DH42A 03/15/89 10:00 5.82 1534.417 92.018 0.063 147.37 Sarrple saved for chemistry, sarrple #714 -
n1.DH42A 04/06/89 10:15 1.44 1556.427 22.010 0.065 148.81DH42A 04/20/89 09:00 0.75 1570.375 13.948 0.054 149.56DH42A 05/17/89 09:45 .1.91 1597.406 27.031 0.071 151.47DH42A 06/06/89 09:45 1.30 1617.406 20.000 .0.065 152.77 Sarrple saved for chemistry.DH42A 06/29/89 10:15 1.35 1640.427 23.021 0.059 154.12DH42A 07/25/89 10:05 1.51 1666.420 25.993 0.058 155.63 Sarrple saved for SNL/NM brine study.DH42A 08/16/89 09:31 1.48 1688.397 21.977 0.067 157.11 Sarrple saved for SNL/NM brine study.DH42A 09/12/89 08:50 1.63 1715.368 26.971 0.060 158.74 Sarrple saved for chemistry.DH42A 12/13/89 09:20 5.28 1807.389 92.021 0.057 164.02 Sarrple saved for chemistry, #897.DH42A 01/10/90 09:36 1.95 1835.400 28.011 0.070 165.97DH42A 01/24/90 09:52 0.75 1849.411 14.011 0.054 166.nDH42A 02/07/90 10:20 0.95 1863.431 14.020 0.068 167.67DH42A 02/21/90 09:56 0.81 1877.414 13.983 0.058 168.48DH42A 03/05/90 08:47 0.68 1889.366 11.952 0.057 169.16DH42A 03/13/90 11:36 NA 1897.483 0.000 0.000 169.16 Installed sarrpler.OH42A 03/19/90 11:07 0.51 1903.463 0.000 0.000 169.67 Partial evacuation.DH42A 03/21/90 10:21 0.28 1905.431 16.065 0.049 169.95 Combined with 0.51 liters from 03/19/90.
Used 0.79 liters for calculation.DH42A 04/04/90 09:14 0.60 1919.385 13.954 0.043 170.55DH42A 04/10/90 08:40 0.58 1925.361 5.976 0.097 171.13DH42A 04/17/90 10: 19 0.38 1932.430 7.069 0.05l, 171.51DH42A 04/24/90 09:18 0.42 1939.388 6.958 0.060 171. 93DH42A 05/02/90 10:32 0.51 1947.439 8.051 0.06:\ 172.44DH42A 05/09/90 08:48 0.39 1954.367 6.928 0.056 1n.83DH42A 05/16/90 09:07 0.43 1961.380 7.013 0.06'1 173.26DH42A OS/23/90 12:08 0.40 1968.506 7.126 0.056 173.66DH42A 05/31/90 08:47 0.46 1976.366 7.860 0.059 174.12DH42A 06/06/90 09:30 0.34 1982.396 6.030 0.056 174.46DH42A 06/14/90 08:38 0.39 1990.360 7.964 0.049 174.85DH42A 06/20/90 09:33 0.45 1996.398 6.038 0.075 175 .30DH42A 06/28/90 08:50 0.45 2004.368 7.970 0.056 175.75DH42A 07/17/90 11:04 0.56 2023.461 0.000 0.000 176.31 Partial evacuation.
AUl-95/WPIWIP/:R3192-A A-II-38 301681.08

BRINE SAMPUNG AND EVALUATION PROGRAM REPORT 1992·1993 APPENDIX A
TABLE A-2 {Continued}BRINE ACCUMULATION DATA TABLE
Data through December 31, 1993
DAYS DAYS CUMULATIVELITERS SINCE USED FOR LITERS LITERS
LOCATION DATE TIME REMOVED 1/1/85 CALCULATION PER DAY COLLECTED REMARKS
DH42A 07/18/90 10:30 0.48 2024.438 20.070 0.052 176.79 Combined with 0.56 liters from 07/17/90.Used 1.04 liters for calculation.
DH42A 07/25/90 09:37 0.43 2031.401 6.963 0.062 177.22DH42A 08/01/90 10:18 0.50 2038.429 7.028 0.071 177.72DH42A 03/28/91 09:40 18.89 2277.403 0.000 0.000 196.61 Some brine may have been left in hole.DH42A 04/10/91 8:46 0.89 2290.338 0.000 0.000 197.50 Partial evacuation.DH42A 04/11/91 08:30 0.14 2291.354 252.925 0.079 197.64 Combined with 18.89 liters from 03/28/91
and 0.89 liters from 04/10/91.DH42A 04/17/91 10: 15 0.35 2297.427 6.073 0.058 197.99DH42A 04/24/91 09:05 0.40 2304.378 6.951 0.058 198.39DH42A 05/01/91 09:10 0.40 2311.382 7.004 0.057 198.79DH42A 05/08/91 08:19 0.34 2318.347 6.965 0.049 199.13DH42A 05/15/91 08:58 0.40 2325.374 7.027 0.057 199.53DH42A OS/29/91 09:56 0.65 2339.414 14.040 0.046 200.18DH42A 06/05/91 13:35 0.47 2346.566 7.152 0.066 200.65DH42A 06/12/91 10:00 0.53 2353.417 6.851 0.077 201.18DH42A 06/19/91 13:30 0.41 2360.563 7.146 0.057. 201.59DH42A 06/26/91 09:16 0.39 2367.386 6.823 0.057 201.98DH42A 07/11/91 10:45 0.55 2382.448 15.062 0.037 202.53DH42A 07/17/91 09:20 0.58 2388.389 0.000 0.000 203.11 Partial evacuation.DH42A 07/18/91 09:50 0.11 2389.410 0.000 0.000 203.22 Partial evacuation.DH42A 07/30/91 10: 10 0.42 2401.424 18.976 0.058 203.64 Combined with 0.58 liters from 07/17 and
0.11 liters from 07/18/91.DH42A 08/08/91 09:05 0.47 2410.378 8.954 0.052 204.11DH42A 08/14/91 10:30 0.45 2416.438 6.060 0.074 204.56DH42A 08/21/91 10:40 0.38 2423.444 7.006 0.054 204.94DH42A 08/28/91 09:58 0.39 2430.415 6.971 0.056 205.33DH42A 09/04/91 11:00 0.53 2437.458 7.043 0.075 205.86DH42A 09/11/91 11:35 0.39 2444.483 7.025 0.056 206.25DH42A 09/18/91 09:00 0.40 2451.375 6.892 0.058 206.65DH42A 09/25/91 11:50 0.31 2458.493 7.118 0.044 206.96DH42A 10/02/91 11 :07 0.41 2465.463 6.970 0.059 207.37DH42A 10/16/91 09:10 0.43 2479.382 13.919 0.031 207.80DH42A 10/23/91 09:30 0.43 2486.396 7.014 0.061 208.23DH42A 10/31/91 09:40 0.50 2494.403 8.007 0.062 208.73DH42A 11/06/91 10:00 0.36 2500.417 6.014 0.060 209.09DH42A 11/13/91 09:39 0.28 2507.402 6.985 0.040 209.37DH42A 11/20/91 11:24 0.44 2514.475 7.073 0.062 209.81DH42A 11/27/91 10:05 0.33 2521.420 6.945 0.048 210.14DH42A 12/04/91 09:52 0.40 2528.411 6.991 0.057 210.54DH42A 12/11/91 09:30 0.38 2535.396 6.985 0.054 210.92DH42A 12/18/91 09:10 0.41 2542.382 6.986 0.059 211.33DH42A 12/23/91 08:35 0.37 2547.358 4.976 0.074 211.70DH42A 01/08/92 09:45 0.22 2563.406 16.048 0.014 211.92DH42A 01/15/92 09:44 0.37 2570.406 7.000 0.053 212.29DH42A 01/22/92 08:30 0.25 2577.354 6.948 0.036 212.54DH42A 01/29/92 09:50 0.27 2584.410 7.056 0.038 212.81
AU1·9SlWPfWlP/: R3192-A A-II-39 301681.08
" ~....~...... ...-- ~~.~--- -~¥..,- --~----,.-----~ ¥~ ...T,...""'7~'"

BRINE SAMPUNG AND EVALUATION PROGRAM REPORT 1992-1993 APPENDIX A
TABLE A-2 (Continued)BRINE ACCUMULATION DATA TABLE
Data through December 31, 1993
DAYS DAYS CUMULATIVELITERS SINCE USED FOR LITERS LITERS
LOCATION DATE TIME REMOVED 1/1/85 CALCULATION PER DAY COLLECTED REMARKS
DH42A 02/12/92 08:40 0.40 2598.361 13.951 0.029 213.21DH42A 02/19/92 09:21 0.37 2605.390 7.029 0.053 213.58DH42A 02/26/92 09:35 0.40 2612.399 7.009 0.057 213.98DH42A 03/11/92 09:30 0.48 2626.396 13.997 0.034 214.46DH42A 03/18/92 09:51 0.47 2633.410 7.014 0.067 214.93DH42A 03/25/92 10:23 0.13 2640.433 7.023 0.019 215.06DH42A 04/01/92 09:00 0.45 2647.375 6.942 0.065 215.51DH42A 04/07/92 09:10 0.40 2653.382 6.007 0.067 215.91DH42A 04/15/92 09:00 0.48 2661.375 7.993 0.060 216.39DH42A 04/22/92 09:30 0.44 2668.396 7.021 0.063 216.83DH42A 05/06/92 11:10 0.45 2682.465 0.000 0.000 217.28 Partial evacuation, some brine left in
hole.OH42A 05/07/92 09:30 0.07 2683.396 15.000 0.035 217.35 Combine with 0.45 liters removed 05/06/92
for total volume.DH42A 05/13/92 13:45 0.40 2689.573 6.177 0.065 217.75DH42A OS/21/92 10:22 0.43 2697.432 7.859 0.055 218.18DH42A OS/27/92 09:05 0.35 2703.378 5.946 0.059 218.53DH42A 06/09/92 09:00 0.44 2716.375 12.997 0.034 218.97DH42A 06/18/92 09:45 0.29 2725.406 9.031 0.032 219.26DH42A 06/25/92 09:40 0.46 2732.403 6.997 0.066 219.nDH42A 07/01/92 09:10 0.58 2738.382 5.979 0.097 220.30DH42A 07/08/92 09:22 0.44 2745.390 7.008 0.063 220.74DH42A 07/15/92 09:14 0.40 2752.385 6.995 0.057 221.14DH42A 07/22/92 09:00 0.46 2759.375 6.990 0.066 221.60DH42A 07/29/92 09:48 0.48 2766.408 7.033 0.068 222.08DH42A 08/04/92 09:34 0.41 2m.399 5.991 0.068 222.49DH42A 08/18/92 09:56 0.67 2786.414 14.015 0.048 223.16DH42A 09/02/92 09:50 0.59 2801.410 14.996 0.039 223.75DH42A 09/09/92 10:03 2.38 2808.419 7.009 0.340 226.13DH42A 09/17/92 09:00 0.28 2816.375 7.956 0.035 226.41DH42A 09/23/92 10:03 0.43 2822.419 6.044 0.071 226.84DH42A 09/30/92 11:00 0.49 2829.458 7.039 0.070 227.33DH42A 10/12/92 12:35 0.34 2841.524 12.066 0.028 227.67DH42A 10/21/92 13:03 0.69 2850.544 9.020 0.076 228.36DH42A 10/28/92 09:10 0.66 2857.382 6.838 0.097 229.02DH42A 11/11/92 09:30 0.90 2871.396 14.014 0.061. 229.92DH42A 11/18/92 13:09 0.30 2878.548 7.152 0.042 230.22DH42A 11/25/92 09:30 0.39 2885.396 6.848 0.057 230.61DH42A 12/09/92 12:30 0.65 2899.521 14.125 0.046 231.26DH42A 12/16/92 10:15 0.46 2906.427 6.906 0.067 231.72DH42A 01/07/93 08:30 0.55 2928.354 21.927 0.025 232.27DH42A 01/13/93 09:45 0.69 2934.406 6.052 0.114 232.96DH42A 01/28/93 10:10 0.75 2949.424 15.018 0.050 233.71DH42A 02/11/93 09:40 0.63 2963.403 13.979 0.045 234.34DH42A 02/26/93 10:15 1.25 2978.427 15.024 0.083 235.59DH42A 03/10/93 10: 10 0.67 2990.424 11.997 0.056 236.26DH42A 03/19/93 09:37 0.43 2999.401 8.977 0.048 236.69
AUI-951WPIWIP/:R3192-A A-II-40 301681.08

BRINE SAMPUNG AND EVALUATION PROGRAM REPORT 1992-1993 APPENDIX A
TABLE A-2 (Continued)BRINE ACCUMULATION DATA TABLE
Data through December 31, 1993
DAYS DAYS CUMULATIVELITERS SINCE USED FOR LITERS LITERS
LOCATION DATE TIME REMOVED 111/85 CALCULATION PER DAY COLLECTED REMARKS
DH42A 03/25/93 09:50 0.28 3005.410 6.009 0.047 236.97DH42A 03/31/93 12:35 0.40 3011.524 6.114 0.065 237.37DH42A 04/28/93 08:45 1.26 3039.365 27.841 0.045 238.63 Used bailer, hole left dry.DH42A 06/16/93 11:50 1.85 3088.493 49.128 0.038 240.48 Used bail er •DH42A 08/18/93 10:48 3.25 3151.450 0.000 0.000 243.73 Partial evacuation. Unable to sample since
06-16-93.DH42A 08/20/93 09:36 0.50 3153.400 64.907 0.058 244.23 Combine with 3.25 liters from 08-18-93.DH42A 11/09/93 10:33 0.38 3234.440 0.000 0.000 244.61 Partial evacuation.DH42A 11/12/93 10:21 0.58 3237.431 84.031 0.011 245.19 Used bailer. Combine with 0.38 liter from
11-09-93.
DHP402A 10/29/86 00:00 NA 0.000 0.000 0.000 0.00 Drift excavated at S1950/E1320.DHP402A 12/05/86 00:00 NA 703.000 37.000 0.000 0.00 Downhole completed.DHP402A 03/06/87 09:40 0.14 794.403 0.000 0.000 0.14 First time sampled.DHP402A 03/30/87 09:15 0.00 818.385 0.000 0.000 0.14DHP402A 04/22/87 11 :24 0.03 841.475 138.475 0.001 0.17 Bailer stuck in hole. Hole appears offset
or blocked at 45 feet. There may be a rockbolt or piece of rod in the hole.
DHP402A 07/08/87 00:00 NA 918.000 0.000 0.000 0.17 Horizontal pilot hole for Room 7 of thefirst Waste Storage Panal started justnorth of this location, drilled with brine.
DHP402A 01/16/87 09:20 0.00 926.389 0.000 0.000 0.17 Hole entirely filled with brine fromdrilling the pilot /gas release hole forthe last room of the first panel.
DHP402A 01/28/87 10:20 17.50 938.431 0.000 0.000 17.67 Removed 17:5 liters of brine from hole,mostly drilling fluid.
DHP402A 07/29/87 09:10 15.00 939.382 0.000 0.000 32.67 Drilling brine removed from hole. Partialevacuation, brine left in hole.
DHP402A 08/16/87 00:00 NA 957.000 0.000 0.000 32.67 Brine from the AIS sump spread in Panel 1to assist in the reconstitution of loosemuck on the floor.
DHP402A 08/20/87 00:00 NA 961.000 0.000 0.000 32.67 Brine from the AIS sump spread in Panel 1to assist in the reconstitution of loosemuck on the floor.
DHP402A 10/01/87 00:00 NA 1003.000 0.000 0.000 32.67 Approximate date the salt muck stockpilewas placed at the east end of S1950,covering the collar of this hole.
DHP402A 07/12/88 13:50 1288.576 0.000 0.000 32.67 Muck piled over hole, could not collect.DHP402A 08/19/88 10:00 57.25 1326.417 484.942 0.185 89.92 Collected for chemistry, sample #492 -
#497. Used 72.25 liters for calculation(15.0 on 7/29 + 57.25 on 8/19).
DHP402A 08/30/88 11:00 42.75 1337.458 11.041 3.872 132.67 Depth of water 28.8 feet below floor.Bottom of hole at 44.3 feet. 5.7 feet ofsalt on bottom of hole.
DHP402A 09/15/88 10:00 0.24 1353.417 0.000 0.000 132.91 Not fully evacuated. Don't use forcalculation. Sampled for bacteriology.
AUI-9SfWPIWIP/:RJI92-A A-II-41 301681.08
~-------- - - ---

BRINE SAMPUNG AND EVALUATION PROGRAM REPORT 1992·1993 APPENDIX A
TABLE A-2 (Continued)BRINE ACCUMULATION DATA TABLE
Data through December 31, 1993
LOCATION DATELITERS
TI ME REMOVED
DAYS DAYSSINCE USED FOR1/1/85 CALCULATION
LITERSPER DAY
CUMULATIVELITERS
COLLECTED REMARKS
01/20/89 10:30 19 1480.438
01/04/89 13:30 13.5 1464.563
12/29/88 12:00 43.60 1458.500
11/15/88 10:30 40.65 1414.438
Hole evacuated to 44.2' level. Chemistrysamples #498 - #503.Some moisture could have entered hole dueto water spread for dust controlEvacuated to 43.75 foot level. Obstructionnear bottom of hole prevents additionalevacuation.Collected for chemistry, sample #606 #617. Not fully evacuated, some brine leftin hole.Used 49.6 liters for calculation (6.0 on12/13 + 43.6 on 12/29).Complete evacuation to 43.3 ft. level.Strong odor of diesel from hole and bailer.Volume removed includes 2.5 gallons ofbrine introduced to hole by Intera.Hole open to 44.2 feet.Sample removed from above packer.Level measured at 33.1 feet.Level of brine at 27.2 feet.Hole bottom measured at 44.3 feet.Fluid level at 44.6 feet.Fluid measured at 39.8 feet. Hole notevacuated.Measured hole fluid level at 37.6 feet.Sample saved for Intera brine study. Holepumped to fluid level of 41.1 feet.Sample not obtained. Fluid level at 36.5feet.Observed fluid level at 35.4 feet. Notsampled.Partial collection for chemistry.Sample saved for Intera brine study.Sample saved for Intera brine study.Sample saved for chemistry and for Interabrine study, sample #901.Hol; not completely evacuated.Hole not completely evacuated.Hole not sampled, water level at 36.0 feet.2 liters for BSEP, .25 liters for SNL/NM.Partial evacuation. Combined with 4.0liters (3/22) and 7.0 liters (3/26).Partial evacuation.Hole not sampled, water level at 34.2 feet.Combined with 2.25 liters from 10/05/90.Used 42.95 liters for calculation.Partial evacuation.
551.12558.12558.12573.12
618.07
575.37575.37616.07
490.00515.50531.50547.12
483.70
483.70
364.41
282.31
288.31
345.41
459.70483.70
196.66
331.91
376.51377.70377.70377.70426.70459.70459.70
241.66
0.000
0.0000.0000.235
0.0000.0000.000O.13a
0.1261.2790.3640.556
0.000
1.197
2.227
0.0000.353
0.000
1.459
1.126
1.718
2.792
0.3100.0320.0000.0002.3501.6530.000
0.0000.000
0.000
50.11119.93743.98028.070
0.000
0.000
6.063
15.875
0.00008.035
27.865
39.05537.0700.0000.000
20.85419.9580.000
22.917
26.198
44.062
0.0000.000
182.982
0.0000.0000.000
188.930
2241.542
1906.3701910.3921976.4191996.438
1695.490
1715.5211735.4581779.4381807.508
1640.3751665.410
1688.375
1442.451
1519.4931556.5631570.5451576.4381577.4171597.3751631.417
1386.573
02/20/91 13:00 2.0
10/05/90 09:30 2.250 2103.39611/14/90 10:20 0.0 2143.43112/20/90 10:05 40.7 2179.420
03/22/90 08:53 4.003/26/90 09:25 7.005/31/90 10:03 0.006/20/90 10:31 15.0
09/12/89 12:30 6.3010/02/89 11:00 25.511/15/89 10:30 1612/13/89 12:12 15.62
08/23/89 11:45 NA
12/13/88 10:50 6.0
08/16/89 09:00 NA
10/18/88 13:45 45
06/29/89 09:00 NA07/24/89 09:50 24
02/28/89 11:50 12.104/06/89 13:30 1.1904/20/89 13:05 NA04/26/89 10:30 NA04/27/89 10:00 49.0005/17/89 09:00 3306/20/89 10:00 NA
09/22/88 09:00 63.75 1360.375
DHP40ZADHP40ZADHP40ZA
DHP40ZA
DHP40ZADHP40ZADHP40ZADHP40ZA
DHP40ZADHP40ZADHP40ZADHP40ZA
DHP40ZA
DHP40ZA
DHP40ZADHP40ZA
DHP40ZA
DHP40ZA
DHP40ZA
DHP402A
DHP40ZA
DHP40ZA
DHP40ZA
DHP40ZADHP40ZADHP40ZADHP40ZADHP40ZADHP40ZADHP40ZA
AUl-951WPIWIP/:R3192-A A-II-42 301681.08

BRINE SAMPUNG AND EVALUATION PROGRAM REPORT Im-1993
TABLE A-2 (Continued)BRINE ACCUMULATION DATA TABLE
Data through December 31, 1993
APPENDIX A
LOCATION DATELITERS
TIME REMOVED
DAYS DAYSSINCE USED FOR1/1/85 CALCULATION
LITERSPER DAY
CUMULATIVELITERS
COLLECTED REMARKS
DHP402A 03/11/91 10:45 12.72 2260.448
DHP402A 03/27/91 10:27 5.20 2276.435
0.000
97.015
0.000
0.205
630.79 Partial evacuation. Removed for SNL/NMstudy.
635.99 Combined with 2.0 liters from 02/20/91 and12.72 liters from 03/11/91. Sample givento INTERA.
DHP402ADHP402ADHP402A
DHP402ADHP402A
07/11/91 10:00 2.0009/18/91 10:15 0.0609/25/91 12:43 2.0
04/16/92 12:15 3.0008/20/92 09:20 1.00
2382.4172451.4272458.530
2662.5102788.389
0.0000.000
182.095
203.980125.879
0.0000.0000.022
0.0150.008
637.99638.05640.05
643.05644.05
Partial evacuation.Collected over two week period.Combined with 2.0 liters from 07/11/91 and0.06 liters from 09/18/91.Saved for BSEP.Partial evacuation for BSEP analyticalprogram.
GSEEP
GSEEP
GSEEP
GSEEP
GSEEPGSEEP
11/21/84
08/28/85
11/12/85
11/12/85 2
11/26/85 12:00 3.0012/03/85 12:00 1.50
0.000
239.000
315.001
315.001
329.500336.500
0.000
0.000
0.000
0.000
14.4987.000
0.000
0.000
0.000
0.000
0.2070.214
0.00 Approximate date this part of Room Gexcavated.
0.00 Noticed damp area on floor at thislocation.
0.00 Damp area on floor near S. rib approx.-E1140 (45 ft. E. of DH35) and at E1149.Crusted moist area is about 4'x 4 " hasincreased ~oticeably in size over the lasttwo months.
0.00 Damp area covers 16 ft. E-W, 13 ft. N-Sacross width of Room G. Many weeps onlower 3 ft. of S. rib. Brine is seepingout of air pipe support hole.
3.00 First time collection. Dug out salt.4.50 Partial removal. Collected 0.05 liters for
chemisty analysis #5.
GSEEPGSEEPGSEEPGSEEPGSEEPGSEEPGSEEP
GSEEPGSEEPGSEEPGSEEPGSEEPGSEEPGSEEPGSEEPGSEEP
12/04/85 12:00 1.1312/10/85 12:00 1.8001/23/86 12:00 0.5001/31/86 12:00 0.9402/12/86 12:00 2.2302/19/86 12:00 2.1402/28/86 12:00 1.95
03/04/86 11:20 2.6203/06/86 10:50 2.0703/13/86 11:46 3.2303/26/86 10:20 3.0004/02/86 10:00 2.6804/08/86 10:00 2.5004/16/86 12:00 2.2404/24/86 10:30 2.3504/30/86 11:00 2.40
337.500343.500387.500395.500407.500414.500423.500
427.472429.451436.490449.431456.417462.417470.500478.438484.458
1.0006.000
44.0008.000
12.0007.0009.000
3.9721.9797.039
12.9416.9866.0008.0837.9386.020
1.1300.3000.0110.1180.1860.3060.217
0.6601.0460.4590.2320.3840.4170.2770.2960.399
5.637.437.938.87
11.1013.2415.19
17.8119.8823.1126.1128.7931.2933.5335.8838.28
Salt in pool.
Purped twice.
Partial removal. No pump, scooped withbeaker.
Collected three times.
AUI-9SIWPIWIP/:R3192-A A-II-43 301681.08

BRINE SA.\iPUNG AND EVALUATION PROGRAM REPORT 1992·1993 APPENDIX A
TABLE A-2 (Continued)BRINE ACCUMULATION DATA TABLE
Data through December 31, 1993
DAYS DAYS CUMULATIVELITERS SINCE USED FOR LITERS LITERS
LOCATION DATE TIME REMOVED 1/1/85 CALCULATION PER DAY COLLECTED REMARKS
GSEEP 05/06/86 10:30 2.49 490.438 5.980 0.416 40.77GSEEP 05/13/86 11:20 2.66 497.472 7.034 0.378 43.43GSEEP OS/20/86 11:20 2.44 504.472 7.000 0.349 45.87GSEEP OS/27/86 15:30 3.11 511.646 7.174 0.434 48.98GSEEP 06/03/86 10:40 3.31 518.444 6.798 0.487 52.29GSEEP 06/10/86 11:38 3.21 525.485 7.041 0.456 55.50GSEEP 06/17/86 11:15 3.11 532.469 6.984 0.445 58.61 Sample for brine chemistry, #20.GSEEP 06/24/86 11:00 4.60 539.458 6.989 0.658 63.21 Very humid air in workings.GSEEP 07/01/86 14:00 5.43 546.583 7.125 0.762 68.64 Very humid last week, rain on surface.GSEEP 07/08/86 10:50 4.14 553.451 6.868 0.603 72.78GSEEP 07/16/86 10:50 3.32 561.451 8.000 0.415 76.10GSEEP 07/22/86 10: 15 2.29 567.427 5.976 0.383 78.39GSEEP 07/29/86 10:45 2.68 574.448 7.021 0.382 81.07GSEEP 08/05/86 11 :20 2.60 581.472 7.024 0.370 83.67GSEEP 08/12/86 10:45 3.67 588.448 6.976 0.526 87.34GSEEP 08/19/86 11:40 3.90 595.486 7.038 0.554 91.24GSEEP 08/26/86 11:00 3.73 602.458 6.972 0.535 94.97GSEEP 09/04/86 10:55 5.15 611.455 8.997 0.572 100.12 Last week has been humid and rainy.GSEEP 09/09/86 10:00 3.70 616.417 4.962 .0.746 103.82GSEEP 09/16/86 10:25 3.82 623.434 7.017 0.544 107.64GSEEP 09/23/86 10:20 4.29 630.431 6.997 0.613 111.93GSEEP 10/01/86 12:24 3.70 638.517 8.086 0.458 115.63GSEEP 10/08/86 10:45 3.80 645.448 0.000 0.000 119.43 Partial collection.GSEEP 10/08/86 14:57 1.87 645.623 7.106 0.798 121.30 Second collection for this day. Use (3.80
+ 1.87)/(6.931 + 0.175) = 0.798 l/day.GSEEP 10/10/86 09:16 1.24 647.386 1.763 0.703 122.54GSEEP 10/14/86 11:10 2.19 651.465 4.079 0.537 124.73GSEEP 11/05/86 10:45 4.44 673.4'48 21.983 0.202 129.17 First time 3.74 liters, second time 0.70
liters.GSEEP 11/20/86 12:02 3.84 688.501 15.053 0.255 133.01GSEEP 12/30/86 12:50 4.44 728.535 40.034 0.111 137.45GSEEP 02/03/87 13:45 3.45 763.573 35.038 0.098 140.90GSEEP 03/06/87 11:30 3.0 794.479 30.906 0.097 143.90GSEEP 03/30/87 11 :34 2.51 818.482 24.003 0.105 146.41GSEEP 05/07/87 11:48 3.31 856.492 38.010 0.087 149.72GSEEP 06/30/87 10:00 12.24 910.417 53.925 0.227 161.96GSEEP 07/16/87 10:30 11.66 926.438 16.021 0.728 173.62GSEEP 07/23/87 09:20 3.87 933.389 6.951 0.557 177.49GSEEP 07/28/87 11:35 2.36 938.483 5.094 0.463 179.85GSEEP 08/07/87 09:15 5.33 948.385 9.902 0.538 185.18GSEEP 08/12/87 10:12 2.80 953.425 5.040 0.556 187.98GSEEP 08/24/87 08:46 6.53 965.365 11.940 0.547 194.51GSEEP 09/01/87 11:00 5.26 973.458 8.093 0.650 199.77 Collected for chemistry, sample #164 A&B,
#166 A&B, #169 A&B, #165 A&B, #168 A&B.GSEEP 09/11/87 09:00 5.03 983.375 9.917 0.507 204.80GSEEP 09/16/87 09:33 2.42 988.398 5.023 0.482 207.22GSEEP 09/25/87 08:55 4.12 997.372 8.974 0.459 211.34 Sump drilled to facilitate accumulation of
AU1·95IWPfWlP/: R3192-A A-II-44 301681.08

BRINE SAMPUNG AND EVALUATION PROGRAM REPORT 1992·1993 APPENDIX A
TABLE A-2 (Continued)BRINE ACCUMULATION DATA TABLE
Data through December 31, 1993
DAYS DAYS CUMULATIVELITERS SINCE USED FOR LITERS LITERS.
LOCATION DATE TIME REMOVED 1/1/85 CALCULATION PER DAY COLLECTED REMARKS
brine.GSEEP 10/01/87 12:15 2.81 1003.510 6.138 0.458 214.15GSEEP 10/08/87 10:25 2.97 1010.434 6.924 0.429 217.12GSEEP 10/16/87 10:41 3.37 1018.445 8.011 0.421 220.49GSEEP 10/20/87 11:59 2.06 1022.499 4.054 0.508 222.55GSEEP 11/12/87 10:41 10.21 1045.445 22.946 0.445 232.76GSEEP 11/19/87 11:35 2.90 1052.483 7.038 0.412 235.66 Collected for chemistry, sample #202, #219
ç.GSEEP 12/07/87 12:50 7.02 1070.535 18.052 0.389 242.68 Collected for chemistry, salll'le #239.GSEEP 01/04/88 12:10 16.11 1098.507 27.972 0.576 258.79GSEEP 01/20/88 11:25 8.68 1114.476 15.969 0.544 267.47GSEEP 02/08/88 12:15 9.58 1133.510 19.034 ' 0.503 277.05 Collected for chemistry, salll'le #271, #272,
#273, #274, #275, #276, #277, #278, #279,#280, #281, #282, #283, #284, #285, Ğ.
GSEEP 02/25/88 10:40 11.87 1150.444 16.934 0.701 288.92GSEEP 03/09/88 10:18 . 7.35 1163.429 12.985 0.566 296.27GSEEP 03/17/88 11:20 4.45 1171.472 8.043 0.553 300.72GSEEP 03/29/88 11:45 5.42 1183.490 12.018 0.451 306.14 Collected for chemistry, salll'le #327 -
#337.GSEEP 04/15/88 11:01 7.43 1200.459 16.969 0.438 313.57GSEEP 05/05/88 10:10 9.34 1220.424 19.965 0.468 322.91 Salll'led for SNL/NH PA.GSEEP 05/12/88 09:30 3.55 1227.396 6.972 0.509 326.46 Salll'led for SNL/NM PA.GSEEP 06/09/88 08:45 12.00 1255.365 27.969 0.429 338.46 Removed for SNL/NH PA.GSEEP 06/16/88 09:43 4.13 1262.405 7.040 0.587 342.59 Salll'led for SNL/NM PA.GSEEP 06/30/88 08:30 6.00 1276.354 13.949 0.430 348.59 Salll'led for SNL/NH PA.GSEEP 07/12/88 09:00 6.40 1288.375, 12.021 0.532 354.99 Collected for chemistry, salll'le #437 •
#448.GSEEP 07/28/88 10:30 11.35 1304.438 16.063 0.707 366.34 Salll'led for SNL/NH PA.GSEEP 08/11/88 10:00 12.02 1318.417 13.979 0.860 378.36 Salll'led for SNL/NH PA.GSEEP 08/25/88 09:07 6.72 1332.380 13.963 0.481 385.08 Hole covered with tight fitting brattice
cloth. Salll'led for SNL/NH PA.GSEEP 09/08/88 14:48 7.31 1346.617 14.237 0.513 392.39 Salll'led for SNL/NH PA.GSEEP 09/14/88 08:30 3.00 1352.354 5.737 0.523 395.39GSEEP 09/27/88 10:50 6.45 1365.451 13.097 0.492 401.84 Collected for chemistry, salll'le #545 -
#556.GSEEP 10/18/88 10:22 10.20 1386.432 20.981 0.486 412.04GSEEP 11/10/88 09:08 12.62 1409.381 22.949 0.550 424.66 Smell of urine in salll'le and coming from.
hole.GSEEP 12/13/88 10:20 17.81 1442.431 33.050 0.539 442.47 Collected for chemistry, salll'le #564 •
#569. Salll'le effervesces and brine feelswarmer than usual.
GSEEP 01/10/89 13:30 17.38 1470.563 28.132 0.618 459.85 Salll'le saved for SNL/NH brine study.GSEEP 02/09/89 10:22 19.5 1500.432 29.869 0.653 479.35 Salll'le saved for SNL/NH brine study.GSEEP 03/01/89 10:00 3.90 1520.417 19.985 0.195 483.25 Partial collection for Westinghouse.GSEEP 03/14/89 12:45 19.57 1533.531 13.114 1.492 502.82 Salll'le saved for chemistry, salll'le #672 •
683. Add 3.9 liters collected 3/01/90 to19.57 liters Use 23.47 liters for
AUl·951WPIWIP/:R3192·A A-II-45 301681.08

BRINE SAMPUNG AND EVALUATION PROGRAM REPORT 1992-1993 APPENDIX A
TABLE A-2 (Continued)BRINE ACCUMULATION DATA TABLE
Data through December 31, 1993
DAYS DAYS CUMULATIVELITERS SINCE USED FOR LITER~ LITERS
LOCATION DATE TIME REMOVED 1/1185 CALCULATION PER DAY COLLECTED REMARKS
calculation.GSEEP 04/06/89 08:56 16.35 1556.372 22.841 0.716 519.17 16 liters of sample saved for SNL/NM brine
study.GSEEP 04/20/89 08:45 10.43 1570.365 13.993 0.745 529.60 Sample saved for SNL/NM brine study.GSEEP 05/17/89 09:40 19.72 1597.403 27.038 0.729 549.32 Sample saved for SNL/NM brine study.GSEEP 06/06/89 09:40 14.52 1617.403 20.000 0.726 563.84 Sample saved for chemistry. Extra saved for
SNL/NM brine study.GSEEP 06/29/89 10:01 15.95 1640.417 23.014 0.693 579.79 Sample saved for SNL/NM brine study.GSEEP 07/06/89 09:00 4.67 1647.375 6.958 0.671 584.46 Sample saved for SNL/NM brine study.GSEEP 07/25/89 09:30 12.60 1666.396 19.021 0.662 597.06 Sample saved for SNL/NM brine study.GSEEP 08/16/89 09: 15 14.73 1688.385 21.989 0.670 611.79 Sample saved for SNL/NM brine study.GSEEP 09/12/89 08:30 18.68 1715.354 26.969 0.693 630.47 Sample saved for chemistry.GSEEP 10/11/89 09:47 17.70 1744.408 29.054 0.609 648.17 Sample saved for SNL/NM brine study.GSEEP 11/15/89 09:30 21.44 1779.396 34.988 0.613 669.61 Sample saved for SNL/NM brine study.GSEEP 12/13/89 09:13 16.30 1807.384 27.988 0.582 685.91 Sample saved for SNL/NM brine study, sample
#896.GSEEP 01/10/90 09:21 16.40 1835.390 28.006 0.586 702.31GSEEP 01/24/90 09:19 9.0 1849.388 13.998 0.643 711.31GSEEP 02/07/90 10:07 9.0 1863.422 14.034 0.641 720.31GSEEP 02/21/90 09:40 8.32 1877.403 13.981 0.595 728.63GSEEP 03/21/90 09:49 16.55 1905.409 28.006 0.591 745.18GSEEP 04/24/90 11:16 20.33 1939.469 34.060 0.597 765.51GSEEP OS/23/90 11:51 16.66 1968.494 29.025 0.574 782.17GSEEP 06/06/90 12:30 10.50 1982.521 0.000 0.000 792.67GSEEP 06/20/90 08:56 15.72 1996.372 27.878 0.941 808.39GSEEP 07/25/90 08:50 15.0 2031.368 34.996 0.429 823.39GSEEP 12/11/90 10:30 2.0 2170.438 0.000 0.000 825.39 Partial removal. First time sampled since
07/25/90.GSEEP 12/13/90 08:56 49.89 2172.372 141.004 0.368 875.28 Combined with 2.0 liters from 12/11/90.
Used 51.89 liters for calculation.GSEEP 12/20/90 08:23 0.0 2179.349 0.000 0.000 875.28 Could not sample.GSEEP 01/23/91 09:30 26.14 2213.396 41.024 0.637 901.42 Combined with 2.0 liters from 12/11/90 and
49.89 liters from 12/13/90.GSEEp· 02lP/91 09:52 17.6 2248.411 35.015 0.503 919.02GSEEP 03/11/91 08:20 6.9 2260.347 11.936 0.578 925.92 Removed out of cycle for SNL/NM biology
study.GSEEP 03/20/91 10:10 2.02 2~69.424 0.000 0.000 927.94 Partial evacuation. First evacuation with
bai ler, second wi th purp.GSEEP 03/21/91 08:45 3.17 2270.365 10.018 0.518 931.11 Combined with 2.02 liters from 03/20/91.GSEEP 04/24/91 09:02 15.85 2304.376 34.011 0.466 946.96GSEEP OS/29/91 09:06 15.72 2339.379 35.003 0.449 962.68GSEEP 06/26/91 08:50 12.0 2367.368 27.989 0.429 974.68GSEEP 07/11/91 10:20 2.25 2382.431 0.000 0.000 976.93 Partial evacuation.GSEEP 07/31/91 09:30 11.72 2402.396 35.028 0.399 988.65 Combined with 2.25 liters from 07/11/91.GSEEP 08/28/91 09:15 11.40 2430.385 27.989 0.407 1000.05GSEEP 09/25/91 11:20 2.0 2458.472 0.000 0.000 1002.05 Some brine may have been left in hole.GSEEP 10/23/91 09:55 15.0 2486.413 56.028 0.30~i 1017.05 Combined with 2 liters from 10/23/91.
AU1-951WPIWIP/:R3192-A A-U-46 301681.08

BRINE SAMPUNG AND EVALUATION PROGRAM REPORT 1992·1993 APPENDIX A
TABLE A-.2 (Continued)BRINE ACCUMULATION DATA TABLE
Data through December 31, 1993
DAYS DAYS CUMULATIVELITERS SINCE USED FOR LITERS LITERS
LOCATION DATE TIME REMOVED 1/1/85 CALCULATION PER DAY COLLECTED REMARKS
GSEEP 11/27/91 09:40 10.0 2521.403 34.990 0.286 1027.05GSEEP 12/10/91 10:30 1.7 2534.438 0.000 0.000 1028.75 Partial removal for SNL/NM.GSEEP 01/29/92 09:42 13.10 2584.404 63.001 0.235 1041.85 SNL/NH sal11Jling.GSEEP 02/26/92 09:30 7.23 2612.396 27.992 0.258 1049.08 Saved for SNL/NH.GSEEP 04/16/92 10:30 3.00 2662.438 50.042 0.060 1052.08 Saved for BSEP.GSEEP OS/27/92 09:01 13.23 2703.376 40.938 0.323 1065.31 Saved for SNL/NM Chemistry.GSEEP 07/29/92 09:35 11.75 2766.399 63.023 0.186 1077.06 Saved for SNL/NH.GSEEP 08/20/92 08:58 1.00 2788.374 0.000 0.000 1078.06 Partial evacuat;on for BSEP analyticaL
program.GSEEP 02/26/93 08:45 7.40 2978.365 211.966 0.040 1085.46GSEEP 05/19/93 10:15 6.0 3060.427 82.062 0.073 1091.46 Saved for SNL/NH Brine Study. Cleaned hoLe
of accumulated salt buildup: removed allloose material. PlITped hole dry.
GSEEP 06/16/93 10:48 2.75 3088.450 28.023 0.098 1094.21 Saved for SNL/NH Chemistry.GSEEP 08/19/93 13:44 4.10 3152.572 64.122 0.064 1098.31GSEEP 11/12/93 09:44 2.46 3237.406 84.834 0.029 1100.77
OH20 09/03/85 14:00 NA 245.583 0.000 "O~OOO 0.00 Approximated date this part of driftexcavated.
OH20 03/29/89 14:00 NA 1548.583 0.000 0.000 0.00 Horizontal hole driLled 3/28/89 to 3/29/89.Hole drilled with brine. Fluorescien addedto driLling fluid.
OH20 03/30/89 11:00 NA 1549.458 0.000 0.000 0.00 New hoLe. Installed collection device.HoLe dry.
OH20 04/18/89 09:45 0 1568.406 1322.830 0.000 0.00 Device left with 50 centibars suction.OH20 04/26/89 09:50 0 1576.410 8.004 0.000 0.00 Device left with 50 centibars suction.OH20 06/05/89 09:00 0.31 1616.375 39.965 0.008 0.31 First time sal11Jle recovered from this hoLe.
Sal11Jle colored with Fluorescien dye.RepLaced coLlection device. Sal11Jle savedfor chemistry.
OH20 06/20/89 08:30 0.03 1631.354 14.979 0.002 0.34OH20 07/06/89 11:00 0.02 1647.458 16.104 0.001 0.36 ColLection device retained vacuum. Sal11JLe
coLLected for chemistry.OH20 08/09/89 10:00 0.29 1681.417 33.959 0.009 0.65 Sal11JLe coLLected for chemistry. PlITped
colLection device, repaired hose end.OH20 08/23/89 11 :22 0.16 1695.474 14.057 0.011 0.81 Sal11Jle coLlected for chemistry. StiLL
yellowish green in coLor.OH20 09/14/89 11 :05 0.21 1717.462 21.988 0.010 1.02 Sal11Jle saved for chemistry.OH20 10/02/89 11 :20 0.27 1735.472 18.010 0.015 1.29 Sal11Jle saved for chemistry.OH20 10/20/89 11 :25 0.26 1753.476 18.004 0.014 1.55 Sal11Jle saved for chemistry, sal11JLe #855.OH20 11/10/89 10:18 0.29 1774.429 20.953 0.014 1.84 Sal11Jle saved for chemistry, sal11J Le #868.OH20 11/29/89 13:00 0.37 1793.542 19.113 0.019 "2.21 Sal11JLe saved for chemistry, sal11JLe #876.OH20 12/12/89 10:06 0.20 1806.421 12.879 0.016 2.41 Sal11Jle saved for chemistry, sal11JLe #888.
OA20 01/04/90 11:52 0.27 1829.494 23.073 0.012 2.68OH20 01/17/90 09:59 0.21 1842.416 12.922 0.016 2.89OH20 01/31/90 10:38 0.21 1856.443 14.027 0.015 3.10
AU1·951WPIWIP/:R3192·A A-II-47 301681.08
r~ __ • __.~ ...-~-,...... --~._._-
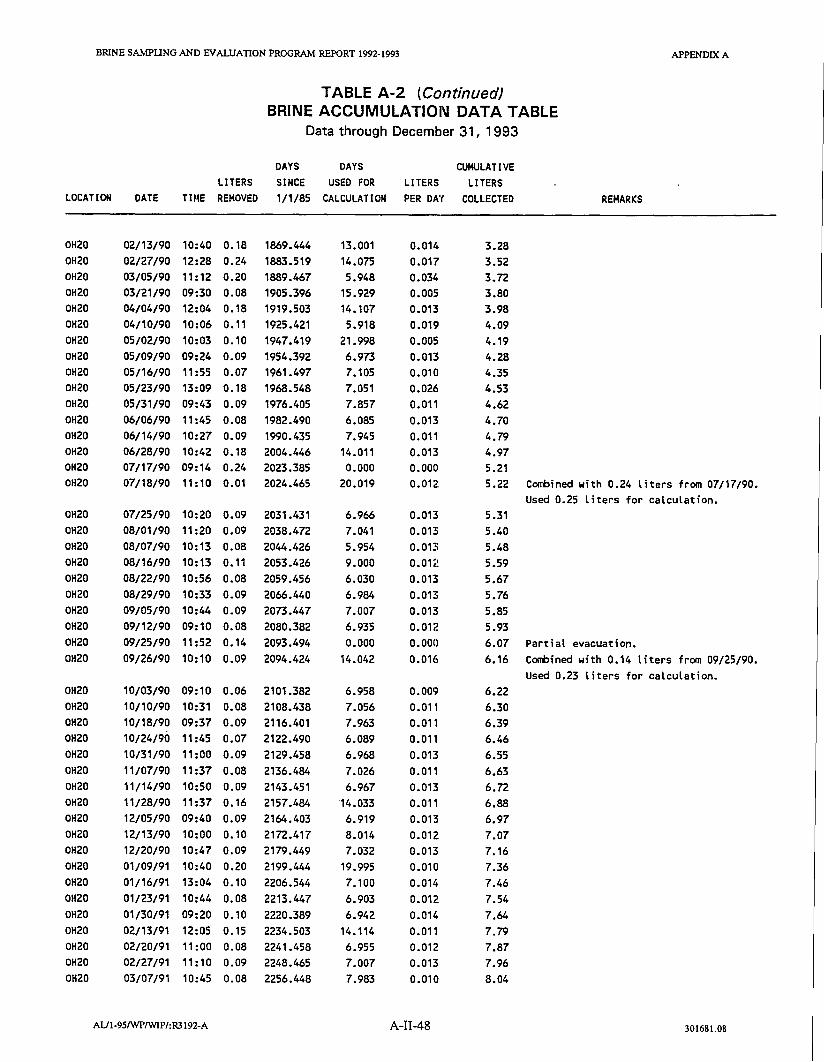
BRINE SAMPUNG AND EVALUATION PROGRAM REPORT 1992-1993 APPENDIX A
TABLE A-2 (Continued)BRINE ACCUMULATION DATA TABLE
Data through December 31, 1993
DAYS DAYS CUMULATIVELITERS SINCE USED FOR LITERS LITERS
LOCATION DATE TIME REMOVED 1/1/85 CALCULATION PER DA'( COLLECTED REMARKS
OH20 02/13/90 10:40 0.18 1869.444 13.001 0.014 3.28OH20 02/27/90 12:28 0.24 1883.519 14.075 0.017 3.52OH20 03/05/90 11:12 0.20 1889.467 5.948 0.034 3.72OH20 03/21/90 09:30 0.08 1905.396 15.929 0.005 3.80OH20 04/04/90 12:04 0.18 1919.503 14.107 0.013 3.98OH20 04/10/90 10:06 0.11 1925.421 5.918 0.019 4.09OH20 05/02/90 10:03 0.10 1947.419 21.998 0.005 4.19OH20 05/09/90 09:24 0.09 1954.392 6.973 0.013 4.28OH20 05/16/90 11:55 0.07 1961.497 7.105 0.010 4.35OH20 OS/23/90 13:09 0.18 1968.548 7.051 0.026 4.53OH20 05/31/90 09:43 0.09 1976.405 7.857 0.011 4.62OH20 06/06/90 11:45 0.08 1982.490 6.085 0.013 4.70OH20 06/14/90 10:27 0.09 1990.435 7.945 0.011 4.79OH20 06/28/90 10:42 0.18 2004.446 14.011 0.013 4.97OH20 07/17/90 09:14 0.24 2023.385 0.000 0.000 5.21OH20 07/18/90 11:10 0.01 2024.465 20.019 0.012 5.22 Combined with 0.24 liters from 07/17/90.
Used 0.25 liters for calculation.OH20 07/25/90 10:20 0.09 2031.431 6.966 0.013 5.31OH20 08/01/90 11:20 0.09 2038.472 7:041 0.013 5.40OH20 08/07/90 10:13 0.08 2044.426 5.954 0.013 5.48OH20 08/16/90 10: 13 0.11 2053.426 9.000 0.012 5.59OH20 08/22/90 10:56 0.08 2059.456 6.030 O.OB 5.67OH20 08/29/90 10:33 0.09 2066.440 6.984 O.Ol~i 5.76OH20 09/05/90 10:44 0.09 2073.447 7.007 O.Ol~i 5.85OH20 09/12190 09:10 0.08 2080.382 6.935 0.012 5.93OH20 09/25/90 11:52 0.14 2093.494 0.000 0.001l 6.07 Partial evacuation.OH20 09/26/90 10:10 0.09 2094.424 14.042 0.016 6.16 Combined with 0.14 liters from 09/25/90.
Used 0.23 liters for calculation.OH20 10/03/90 09:10 0.06 2101.382 6.958 0.009 6.22OH20 10/10/90 10:31 0.08 2108.438 7.056 0.01\ 6.30OH20 10/18/90 09:37 0.09 2116.401 7.963 0.011 6.39OH20 10/24/90 11:45 0.07 2122.490 6.089 0.011 6.46OH20 10/31/90 11:00 0.09 2129.458 6.968 0.013 6.55OH20 11/07/90 11 :37 0.08 2136.484 7.026 0.011 6.63OH20 11/14/90 10:50 0.09 2143.451 6.967 0.013 6.72OH20 11/28/90 11:37 0.16 2157.484 14.033 0.011 6.88OH20 12/05/90 09:40 0.09 2164.403 6.919 0.013 6.97OH20 12/13/90 10:00 0.10 2172.417 8.014 0.012 7.07OH20 12/20/90 10:47 0.09 2179.449 7.032 0.013 7.16OH20 01/09/91 10:40 0.20 2199.444 19.995 0.010 7.36OH20 01/16/91 13:04 0.10 2206.544 7.100 0.014 7.46OH20 01/23/91 10:44 0.08 2213.447 6.903 0.012 7.54OH20 01/30/91 09:20 0.10 2220.389 6.942 0.014 7.64OH20 02/13/91 12:05 0.15 2234.503 14.114 0.011 7.79OH20 02/20/91 11:00 0.08 2241.458 6.955 0.012 7.87OH20 02/27/91 11:10 0.09 2248.465 7.007 0.013 7.96OH20 03/07/91 10:45 0.08 2256.448 7.983 0.010 8.04
AUl-95fWPIWIP/:R3192-A A-II-48 301681.08

BRINE SAMPUNG AND EVALUATION PROGRAM REPORT 1m·1993 APPENDIX A
TABLE A-2 (Cont!nued)BRINE ACCUMULATION DATA TABLE
Data through December 31, 1993
DAYS DAYS CUMULATIVELITERS SINCE USED FOR LITERS LITERS
LOCATION DATE TIME REMOVED 1/1/85 CALCULATION PER DAY COLLECTED REMARKS
OH20 03/20/91 12:51 0.15 2269.535 13.087 0.011 8.19OH20 03/28/91 12:34 0.10 2277.524 7.989 0.013 8.29OH20 04/10/91 09:44 0.14 2290.406 12.882 0.011 8.43OH20 04/17/91 11:10 0.09 2297.465 7.059 0.013 8.52OH20 04/24/91 10:05 0.09 2304.420 6.955 0.013 8.61OH20 05/01/91 10:10 0.09 2311.424 7.004 0.013 8.70OH20 05/08/91 09:10 0.09 2318.382 6.958 0.013 8.79OH20 05/15/91 10:45 0.08 2325.448 7.066 0.011 8.87OH20 OS/29/91 10:33 0.15 2339.440 13.992 0.011 9.02OH20 06/05/91 13:13 0.09 2346.551 7.111 0.013 9.11OH20 06/12/91 09:15 0.08 2353.385 6.834 0.012 9.19OH20 06/19/91 15:45 0.09 2360.656 7.271 0.012 9.28OH20 06/26/91 08:20 0.08 2367.347 6.691 0.012 9.36OH20 07/11/91 11:54 0.16 2382.496 15.149 0.011 9.52OH20 07/17/91 10:36 0.06 2388.442 5.946 0.010 9.58OH20 07/30/91 10:50 0.14 2401.451 13.009 0.011 9.72OH20 08/08/91 09:45 0.10 2410.406 8.955 0.011 9.82OH20 08/14/91 11:00 0.07 2416.458 6.052 0.012 9.89OH20 08/21/91 11:25 0.15 2423.476 7.018 0.021 10.04OH20 08/28/91 10:55 0.07 2430.455 6.979 0.010 10.11OH20 09/04/91 11:30 0.08 2437.479 7.024 0.011 10.19OH20 09/11/91 12:15 0.09 2444.510 7.031 0.013 10.28OH20 09/18/91 09:35 0.08 2451.399 6.889 0.012 10.36OH20 09/25/91 10:37 0.02 2458.442 7.043 0.003 10.38OH20 10/02/91 11:48 0.10 2465.492 7.050 0.014 10.48OH20 10/16/91 10:50 0.11 2479.451 ' 13.959 0.008 10.59OH20 10/23/91 12:41 0.09 2486.528 7.077 0.013 10.68OH20 10/31/91 11:55 0.08 2494.497 7.969 0.010 10.76OH20 11/06/91 11:50 0.11 2500.493 5.996 0.018 10.87OH20 11/13/91 11:14 0.14 2507.468 6.975 0.020 11.01OH20 11/20/91 11:55 0.15 2514.497 7.029 0.021 11.16OH20 11/27/91 10:15 0.04 2521.427 6.930 0.006 11.20OH20 12/04/91 12:05 0.09 2528.503 7.076 0.013 11.29OH20 12/11/91 11:15 0.10 2535.469 6.966 0.014 11.39OH20 12/18/91 10:20 0.04 2542.431 6.962 0.006 11.43OH20 01/08/92 11:07 0.16 2563.463 -21.032 0.008 11.59OH20 01/15/92 10:15 0.08 2570.427 6.964 0.011 11.67.OH20 01/22/92 09:55 0.14 2577.413 6.986 0.020 11.81OH20 01/29/92 0.11 2584.000 6.587 0.017 11.92OH20 02/12/92 10:00 0.15 2598.417 14.417 0.010 12.07OH20 02/19/92 10:25 0.14 2605.434 7.017 0.020 12.21OH20 02/26/92 10:06 0.06 2612.421 6.987 0.009 12.27OH20 03/11/92 10: 15 0.08 2626.427 14.006 0.006 12.35OH20 03/18/92 10: 15 0.15 2633.427 7.000 0.021 12.50OH20 03/25/92 12:30 0.08 2640.521 7.094 0.011 12.58OH20 04/01/92 10: 10 0.18 2647.424 6.903 0.026 12.76OH20 04/07/92 10:25 0.16 2653.434 6.010 0.027 12.92
AU1·9SIWPIWIP/:R3192·A A-II-49 301681.08
-- ~-.- ,----- -~- -----~~--

BRINE SAMPUNG AND EVALUATION PROGRAM REPORT 1992-1993 APPENDIX A
TABLE A-2 (Continued)BRINE ACCUMULATION DATA TABLE
Data through December 31, 1993
DAYS DAYS CUMULATIVELITERS SINCE USED FOR LITERS LITERS
LOCATION DATE TIME REMOVED 1/1/85 CALCULATION PER DAY COLLECTED REMARKS
OH20 04/15/92 09:45 0.09 2661.406 7.972 0.011 13.01OH20 04/22/92 11:03 0.07 2668.460 7.054 0.010 13.08OH20 05/06/92 11:40 0.17 2682.486 14.026 0.012 13.25OH20 05/13/92 14:10 0.15 2689.590 7.104 0.021 13.40OH20 OS/21/92 11:30 0.06 2697.479 7.889 0.008 13.46OH20 OS/27/92 10:08 0.03 2703.422 5.943 0.005 13.49OH20 06/09/92 10:00 0.14 2716.417 12.995 0.011 13.63OH20 06/18/92 10:20 0.10 2725.431 9.014 0.011 13.73OH20 06/25/92 10:55 0.05 2732.455 7.024 0.007 13.78OH20 07/01/92 10:10 0.03 2738.424 5.969 0.005 13.81OH20 07/08/92 0.06 2745.000 6.576 0.009 13.87OH20 07/15/92 10:00 0.05 2752.417 7.417 0.007 13.92OH20 07/22/92 11:30 0.06 2759.479 7.062 0.008 13.98OH20 07/29/92 10:45 0.05 2766.448 6.969 0.007 14.03OH20 08/04/92 10:20 0.07 2m.431 5.983 0.012 14.10OH20 08/18/92 10:35 0.13 2786.441 14.010 0.009 14.23OH20 09/02/92 10:37 0.15 2801.442 15.001 0.010 14.38OH20 09/09/92 10:30 0.08 2808.438 6.996 0.011 14.46OH20 09/17/92 10:25 0.05 2816.434 7.996 0.006 14.51OH20 09/23/92 10:20 0.04 2822.431 5.997 0.007 14.55OH20 09/30/92 11:40 0.04 2829.486 7.055 0.006 14.59OH20 10/12/92 13:20 0.10 2841.556 12.070 0.008 14.69OH20 10/21/92 13:25 0.04 2850.559 9.003 0.004 14.73OH20 10/28/92 09:45 0.04 2857.406 6.847 0.006 14.77OH20 11/11/92 13:15 0.03 2871.552 14.146 0.002 14.80OH20 11/18/92 13:30 0.03 2878.563 7.011 0.004 14.83OH20 11/25/92 10:20 0.00 2885.431 0.000 0.000 14.83 Lost vacul.lll.OH20 12/09/92 13:40 0.04 2899.569 21.006 0.002 14.87OH20 01/07/93 09:45 0.03 2928.406 28.837 0.001 14.90OH20 01/13/93 10:16 0.02 2934.428 6.022 0.003 14.92OH20 01/28/93 10:45 0.03 2949.448 15.020 0.002 14.95OH20 02/11/93 10:20 0.02 2963.431 13.983 0.001 14.97OH20 02/26/93 11:45 0.01 2978.490 15.059 0.001 14.98OH20 03/10/93 10:58 0.00 2990.457 11.967 0.000 14.98OH20 03/25/93 10:55 0.01 3005.455 14.998 0.001 14.99OH20 04/28/93 10:50 0.00 3039.451 33.996 0.000 14.99OH20 06/16/93 09:15 0.20 3088.385 48.934 0.004 15.19OH20 08/19/93 10:03 0.19 3152.419 0.000 0.000 15.38 Partial evacuation.OH20 08/20/93 09:16 0.04 3153.386 65.001 0.004 15.42 Combine with 0.19 liter from 08-19-93.OH20 11/09/93 09:54 0.35 3234.413 0.000 0.000 15.77 Partial evacuation.OH20 11/12/93 11:15 0.03 3237.469 84.083 0.005 15.80 Combine with 0.35 liter from 11-09-93.
OH21 09/03/85 14:00 NA 245.583 0.000 0.000 0.00 Approximate date this part of driftexcavated.
OH21 12/12/88 14:00 NA 1441.583 0.000 0.000 0.00 Horizontal hole drilled 12/12/88 to12/19/88. Hole drilled with brine.
AUI-95fWPfWlP/:R3192-A A-II-50 301681.08

BRINE SAMPUNG AND EVALUATION PROGRAM REPORT 1992-1993
TABLE A-2 (Continued)BRINE ACCUMULATION DATA TABLE
Data through December 31, 1993
APPENDIX A
LOCATION DATELITERS
TIME REMOVED
DAYS DAYSSINCE USED FOR1/1/85 CALCULATION
LITERSPER DAY
CUMULATIVELITERS
COLLECTED REMARKS
OH21
OH21
OH21OH21OH21
OH21
OH21OH21OH21
OH21
OH21
OH21OH21
OH21
OH21OH21OH21OH21OH21OH21
OH21OH21OH21OH21
OH21OH21
OH22
OH22
OH22
02/06/89 10:00 NA
02/14/89 09:25 0
02/21/89 10:30 002/28/89 10:50 003/01/89 11:45 NA
03/08/89 09:45 0
03/15/89 11:35 003/30/89 10:20 004/18/89 09:50 0
04/26/89 09:55 0
06/05/89 09:10 0
06/20/89 08:40 007/06/89 11:10 0
08/09/89 10:05 0
08/23/89 11:20 010/02/89 11:25 010/20/89 11:25 011/10/89 10:20 011/29/89 12:52 012/12/89 10:10 0
03/28/91 12:45 0.0004/24/91 10:07 0.0007/17/91 10:36 0.0009/25/91 10:35 0.00
10/31/91 11:48 0.0003/25/93 11:15 0.08
09/03/85 14:00 NA
12/19/88 14:00 NA
02/06/89 11:00 NA
AU1.951WPIWIP/:R3192-A
1497.417
1505.392
1512.4381519.451
. 1520.490
1527.406
1534.4831549.4311568.410
1576.413
1616.382
1631.3611647.465
1681.420
1695.4721735.4761753.4761n4.4311793.5361806.424
22n.5312304.4222388.4422458.441
2494.4923005.469
245.583
1448.583
1497.458
0.000
1259.810
7.0467.0130.000
7.955
7.0n14.94818.979
8.003
39.969
14.97916.104
33.955
14.05240.00418.00020.95519.10512.888
471.10726.89184.02069.999
36.051510.9n
0.000
1203.000
0.000
0.000
0.000
0.0000.0000.000
0.000
0.0000.0000.000
0.000
0.000
'0.0000.000
0.000
0.0000.0000.0000.0000.0000.000
0.0000.0000.0000.000
0.000****.***
0.000
0.000
0.000
A-II-51
Fluorescien added to drilling fluid.0.00 New hole. Installed collection device Q
53' in hole. Hole dry.0.00 Hole plugged with foam. Hole holding vacuum
at approx. 50 centibars.0.00 Holding vacuum.0.00 Holding vacuum.0.00 Device left with approximately 70 centibars
suction.0.00 Device left with approximately 50 centibars
suction.0.00 Hole dry.0.00 Hole dry.0.00 Device left with approximately 50 centibars
suction.0.00 Device left with approximately 50 centibars
suction.0.00 Hole dry, no vacuum in collection device.
Removed and replaced collection device.0.00 Hole dry.0.00 Hole dry. Collection device retained
vacuum.0.00 Hole dry. Pumped collection device,
repaired hose ends.0.00 Hole dry.0.00 Hole dry.0.00 Hole dry.0.00 Hole dry.0.00 Hole dry.0.00 Hole dry. Reseat collection device
(leaking).0.00 Air blowing through tube.0.00 Air blowing through tube.0.00 Air blowing through tube.0.00 Dry. Air blowing through tube. Sampler
under vacuum.0.00 Dry.0.08 Liters/day value> 0.000 and < 0.001.
0.00 Approximate date this part of driftexcavated.
0.00 Horizontal hole drilled 12/12/88 to12/19/88. Hole drilled with brine.Fluorescien added to drilling fluid.
0.00 New hole. Installed collection device @
52.4' in hole. Hole dry.
301681.08
~ - ~- ---- -----

BRINE SAMPUNG AND EVALUATION PROGRAM REPORT 1992-1993 APPENDIX A
TABLE A-2 (Continued)BRINE ACCUMULATION DATA TABLE
Data through December 31, 1993
DAYS DAYS CUMULATIVELITERS SINCE USED FOR LITERS LITERS
LOCATION DATE TIME REMOVED 1/1/85 CALCULATION PER DAY COLLECTED REMARKS
OH22 02/14/89 09:20 0 1505.389 56.806 0.000 0.00 Hole plugged with foam. Hole holding vacuumat approx. 50 centibars.
OH22 02/21/89 10:40 0 1512.444 7.055 0.000 0.00 Holding vacuun.OH22 02/28/89 10:50 0 1519.451 7.007 0.000 0.00 Not holding vacuun.OH22 03/01/89 11:00 NA 1520.458 0.000 0.000 0.00 Device left with approximately 70 centibars
suction.OH22 03/08/89 09:45 0 1527.406 7.955 0.000 0.00 Device left with approximately 50 centibars
suction.OH22 03/15/89 11:35 0 1534.483 7.077 0.000 0.00 Hole dry.OH22 03/30/89 10:22 0 1549.432 14.949 0.000 0.00 Hole dry.OH22 04/18/89 09:55 0 1568.413 18.981 0.000 0.00 Device left with approximately 50 centibars
suction.OH22 04/26/89 10:00 0 1576.417 8.004 0.000 0.00 Device left with approximately 50 centibars
suction.OH22 06/05/89 09:20 0 1616.389 39.972 0.000 0.00 Hole dry. No vacuun on collection device.
Removed and replaced collection device.OH22 06/20/89 08:45 Trace 1631.365 0.000 0.000 0.00 Trace of brine found in hole.OH22 07/06/89 11:20 0 1647.472 31.083 0.000 0.00 Hole dry. Collection device retained
vacuun.OH22 08/09/89 10:10 0 1681.424 33.952 0.000 0.00 Hole dry. Pumped collection device,
repaired hose ends.OH22 08/23/89 11:20 0 1695.472 14.048 0.000 0.00 Hole dry.OH22 10/02/89 11:23 0 1735.474 40.002 0.000 0.00 Hole dry.OH22 10/20/89 11:25 0 1753.476 18.002 0.000 0.00 Hole dry.OH22 11/10/89 10:22 0 1774.432 20.956 0.000 0.00 Hole dry.OH22 11/29/89 12:55 0 1793.538 19.106 0.000 0.00 Hole dry.OH22 12/12/89 10:12 0 1806.425 12.887 0.000 0.00 Dry. Reseat collection device (leaking).OH22 03/28/91 12:45 0.00 2277.531 471.106 0.000 0.00 Air blowing through tube.OH22 04/24/91 10:09 0.00 2304.423 26.892 0.000 0.00 Air blowing through tube.OH22 07/17/91 10:38 0.00 2388.443 84.020 0.000 0.00 Air blowing through tube.OH22 09/25/91 10:34 0.02 2458.440 0.000 0.000 0.02 Some brine may have been left in hole.OH22 10/23/91 12:40 0.57 2486.528 98.085 0.006 0.59 Removed and replaced collection device.
Combined with 0.02 liters from 09/25/91.OH22 10/31/91 11:48 Trace 2494.492 7.964 0.000 0.59OH22 11/13/91 11:10 0.00 2507.465 12.973 0.000 0.59 Dry. Air only.OH22 12/04/91 11:55 Trace 2528.497 21.032 0.000_ 0.59OH22 01/08/92 11:07 0.00 2563.463 34.966 0.000 0.59 Pumped dry.OH22 01/30/92 10: 10 0.18 2585.424 21. 961 0.008 0.77 Brine in hole at 19-20 ft. Brine in
sampler - sampler checked, found notpressurizing. Fixed stopper, revacuuned,reinstalled a 11:43.
OH22 03/11/92 10:20 0 2626.431 41.007 0.000 0.77 Dry.OH22 04/22/92 11:05 0.01 2668.462 42.031 ****.**1r 0.78 Liters/day value> 0.000 and < 0.001.OH22 06/18/92 10:25 0.00 2725.434 56.972 0.000 0.78 Dry.OH22 09/03/92 10:00 0.21 2802.417 76.983 0.003 0.99 Removed collector, repositioned.OH22 03/25/93 11:00 0.00 3005.458 203.041 0.000 0.99OH22 11/09/93 Trace 3234.000 0.000 0.000 0.99 Partial evacuation.
AUI-95IWPfWlP/:R3192-A A-II-52 301681.08

BRINE SAMPUNG AND EVALUATION PROGRAM REPORT 1992-1993
TABLE A-2 (Continued)BRINE ACCUMULATION DATA TABLE
Data through December 31, 1993
APPENDIX A
LOCATION DATELITERS
TIME REMOVED
DAYS DAYSSINCE USED FOR1/1/85 CALCULATION
LITERSPER DAY
CUMULATIVE-LITERS
COLLECTED REMARKS
OH23 12/08/85 14:00 NA 341.583 0.000 0.000 0.00 Approximate date this part of driftexcavated.
OH23 02/06/89 14:00 NA 1497.583 1384.540 0.000 0.00 Horizontal hole drilled 2/6/89. Holedrilled with brine. Fluorescien added todrilli ng flui d.
OH23 02/07/89 14:00 NA 1498.583 1.000 0.000 0.00 New hole. Installed collection device ~
153' in hole. Hole dry.OH23 02/14/89 09:08 0 15Q5.381 6.798 0.000 0.00 Hole plugged with foam. Hole holding vacuum
at approx. 50 centibars.OH23 02/21/89 10:00 0.00 1512.417 7.036 0.000 0.00 Holding vacuum.OH23 02/28/89 10:00 0.43 1519.417 7.000 0.061 0.43 Sample clear, warm and effervescent.OH23 03/08/89 09:30 0.30 1527.396 7.979 0.038 0.73 Device left with approximately 50 centibars
suction.OH23 03/15/89 11:45 0.21 1534.490 7.094 0.030 0.94 Sample saved for chemistry, sample #671.OH23 03/30/89 10:15 0.52 1549.427 14.937 0.035 1.46 Sample saved for chemistry.OH23 04/04/89 09:30 0.10 1554.396 4.969 0.020 1.56 Sample saved for chemistry. Device left
with approximately 50 centibars suction.Outer 75 feet (approx.) of hole dry.
OH23 04/18/89 09:55 0.10 1568.413 14.017 0.007 1.66 No sample. Device left with approximatelY50 centibars suction.
OH23 04/26/89 09:35 0.15 1576.399 7.986 0.019 1.81 Device left with approximately 50 centibarssuction. Combined sample saved forchemistry.
OH23 06/05/89 09:30 0.35 1616.396 39.997 0.009 2.16 Sample saved for chemistry.OH23 06/20/89 08:50 0.62 1631.368 14.972 0.041 2.78OH23 07/06/89 11:30 0.37 1647.479 16.111 0.023 3.15 Collection device retained vacuum. Sample
saved for chemistry.OH23 08/09/89 10:15 0.76 1681.427 33.948 0.022 3.91 Sample saved for chemistry. P~
collection device.OH23 08/23/89 11:13 0.35 1695.467 14.040 0.025 4.26 Sample saved for chemistry.OH23 09/14/89 11:14 0.51 1717.468 22.001 0.023 4.77 Sample s~ved for chemistry.OH23 10/02/89 11 :30 '0.36 1735.479 18.011 0.020 5.13 Sample saved for chemistry.OH23 10/20/89 11:35 0.46 1753.483 18.004 0.026 5.59 Sample saved for chemistry, sample #856.OH23 11/10/89 10:24 NA 1774.433 0.000 0.000 5.59 Collection device-exploded-in-hole-due to
overpressuring during sampling.OH23 11/15/89 09:00 NA 1779.375 0.000 0.000 5.59 Reinstalled collection device.OH23 11/29/89 12:51 0.26 1793.535 40.052 0.006 5.85 Sample saved for chemistry, sample #875.OH23 12/12/89 09:52 0.13 1806.411 12.876 0.010 5.98 Sample saved for chemistry, sample #887.
Reseat collection device (leaking).OH23 01/04/90 11 :57 0.11 1829.498 23.087 0.005 6.09OH23 01/17/90 09:20 0.23 1842.389 12.891 0.018 6.32OH23 03/26/90 09:15 0.60 1910.385 0.000 0.000 6.92 Brine probably left in hole.OH23 04/04/90 11:53 0.58 1919.495 0.000 0.000 7.50 Brine probably left in hole.OH23 04/10/90 09:39 0.33 1925.402 83.013 0.018 7.83 Combined with 0.60 liters from 03/26/90 and
0.58 liters from 04/04/90. Used 1.51 liters
AUl-9SfWPIWIP/:R3192-A A-II-53 301681.08
-_.--._- _. - - -- ------

BRINE SAMPUNG AND EVALUATION PROGRAM REPORT 1992-1993 APPENDIX A
TABLE A-2 (Continued)BRINE ACCUMULATION DATA TABLE
Data through December 31, 1993
DAYS DAYS CUMULATIVELITERS SINCE USED FOR LITERS LITERS
LOCATION DATE TIME REMOVED 1/1/85 CALCULATION PER DAY COLLECTED REMARKS
for calculation.OH23 04/24/90 08:46 0.29 1939.365 13.963 0.021 8.12OH23 05/02/90 09:52 0.17 1947.411 8.046 0.021 8.29OH23 05/09/90 09:32 0.15 1954.397 6.986 0.021 8.44OH23 05/16/90 11:45 0.17 1961.490 7.093 0.024 8.61OH23 OS/23/90 13:07 0.13 1968.547 7.057 0.018 8.74OH23 05/31/90 09:35 0.16 1976.399 7.852 0.020 8.90OH23 06/06/90 11:40 0.12 1982.486 6:087 0.020 9.02OH23 06/14/90 10:35 0.17 1990.441 7.955 0.021 9.19OH23 06/28/90 10:36 0.38 2004.442 14.001 0.027 9.57OH23 07/17/90 09:04 0.33 2023.378 0.000 0.000 9.90OH23 07/18/90 11:05 0.10 2024.462 20.020 0.021 10.00 Combined with 0.33 liters from 07/17/90.
Used 0.43 liters for calculation.OH23 07/25/90 10: 15 0.10 2031.427 6.965 0.014 10.10OH23 08/01/90 11:15 0.14 2038.469 7.042 0.020 10.24OH23 08/07/90 09:58 0.14 2044.415 5.946 0.024 10.38OH23 08/16/90 09:42 0.15 2053.404 8.989 0.017 10.53OH23 08/22/90 10:51 0.10 2059.452 6.048 0.017 10.63OH23 08/29/90 10:30 0.15 2066.438 6.986 0.021 10.78OH23 09/05/90 10:40 0.17 2073.444 7.006 0.024 10.95OH23 09/12/90 09:00 0.10 2080.375 6.931 0.014 11.05OH23 09/25/90 11:42 0.21 2093.488 0.000 0.000 11.26OH23 09/26/90 09:53 0.06 2094.412 14.037 0.019 11.32 Combined with 0.21 liters from 09/25/90.
Used 0.27 liters for calculation.OH23 10/03/90 09:05 0.11 2101.378 6.966 0.016 11.43OH23 10/10/90 10:22 0.13 2108.432 7.054 0.018 11.56OH23 10/18/90 09:30 0.15 2116.396 7.964 0.019 11.71OH23 10/24/90 11 :30 0.10 2122.479 6.083 0.016 11.81OH23 10/31/90 10:53 0.11 2129.453 6.974 0.016 11.92OH23 11/07/90 11 :40 0.10 2136.486 7.033 0.01~· 12.02OH23 11/14/90 10:45 0.13 2143.448 6.962 0.01~1 12.15OH23 11/28/90 11:32 0.22 2157.481 14.033 0.016 12.37OH23 12/05/90 09:35 0.10 2164.399 6.918 0.01~ 12.47OH23 12/13/90 10:15 0.14 2172.427 8.028 0.017 12.61OH23 12/20/90 10:30 0.10 2179.438 7.011 0.01l. 12.71OH23 01/09/91 10:48 0.24 2199.450 - 0.000 0.00(1 12.95 Some brine may have been left in hole.OH23 01/16/91 13:15 0.43 2206.552 27.114 0.025 13.38 Combined with 0.24 liters from 01/09/91.
Collection device replaced on 01/10/91.OH23 01/23/91 10:50 0.08 2213.451 6.899 0.012 13.46OH23 01/30/91 09:01 0.12 2220.376 6.925 0.017 13.58OH23 02/13/91 12:15 0.20 2234.510 14.134 0.01/, 13.78OH23 02/20/91 11:20 0.12 2241.472 6.962 0.017 13.90OH23 02/27/91 11:15 0.11 2248.469 6.997 0.016 14.01OH23 03/07/91 10:50 0.11 2256.451 7.982 0.01/. 14.12OH23 03/20/91 12:50 0.21 2269.535 13.084 0.01C) 14.33OH23 03/28/91 12:15 0.12 2277.510 7.975 0.015 14.45OH23 04/10/91 . 09:55 0.20 2290.413 12.903 0.016 14.65
AUI-95/WPfWIPI:R3192-A A-II-54 301681.08

BRINE SAMPUNG AND EVALUATION PROGRAM REPORT 1992-1993 APPENDIX A
TABLE A-2 (Continued)BRINE ACCUMULATION DATA TABLE
Data through December 31, 1993
DAYS DAYS CUMULATIVELITERS SINCE USED FOR LITERS LITERS
LOCATION DATE TIME REMOVED 1/1/85 CALCULATION PER DAY COLLECTED REMARKS
OH23 04/17/91 10:59 0.11 2297.458 7.045 0.016 14.76OH23 04/24/91 10:10 0.07 2304.424 6.966 0.010 14.83OH23 05/01/91 10:05 0.12 2311.420 6.996 0.017 14.95OH23 05/08/91 09:15 0.06 2318.385 6.965 0.009 15.01OH23 05/15/91 11:00 0.13 2325.458 7.073 0;018 15.14OH23 OS/29/91 10:28 0.04 2339.436 13.978 0.003 15.18OH23 06/05/91 13:10 0.04 2346.549 7.113 0.006 15.22OH23 06/12/91 09:00 0.02 2353.375 6.826 0.003 15.24OH23 06/19/91 15:35 0.43 2360.649 7.274 0.059 15.67OH23 06/26/91 08:15 0.10 2367.344 6.695 0.015 15.77OH23 07/11/91 12:05 0.23 2382.503 15.159 0.015 16.00OH23 07/17/91 10:40 0.09 2388.444 5.941 0.015 16.09OH23 07/30/91 10:45 0.18 2401.448 13.004 0.014 16.27OH23 08/08/91 09:42 0.14 2410.404 8.956 0.016 16.41OH23 08/14/91 11:30 0.13 2416.479 6.075 0.021 16.54OH23 08/21/91 11:20 0.12 2423.472 6.993 0.017 16.66OH23 08/28/91 10:50 0.07 2430.451 6.979 0.010 16.73OH23 09/04/91 11:35 0.14 2437.483 7.032 0.020 16.87OH23 09/11/91 12:10 0.04 2444.507 7.024 .0.006 16.91OH23 09/18/91 09:30 0.16 2451.396 6.889 0.023 17.07OH23 09/25/91 10:30 0.09 2458.438 7.042 0.013 17.16OH23 10/02/91 11:44 0.10 2465.489 7.051. 0.014 17.26OH23 10/16/91 10:57 0.16 2479.456 13.967 0.011 17.42OH23 10/23/91 12:35 0.11 2486.524 7.068 0.016 17.53OH23 10/31/91 11:40 0.08 249.4.486 7.962 0.010 17.61OH23 11/06/91 12:03 0.09 2500.502 6.016 0.015 17.70OH23 11/13/91 11:00 0.05 2507.458 6.956 0.007 17.75OH23 11/20/91 11:50 0.16 2514.493 7.035 0.023 17.91OH23 11/27/91 10:30 0.10 2521.438 6.945 0.014 18.01OH23 12/04/91 11:50 0.10 2528.493 7.055 0.014 18.11OH23 12/11/91 11:30 0.09 2535.479 6.986 0.013 18.20OH23 12/18/91 11 :00 0.07 2542.458 6.979 0.010 18.27OH23 01/08/92 11:03 0.26 2563.460 21.002 0.012 18.53OH23 01/15/92 10:10 0.08 2570.424 6.964 0.011 18.61OH23 01/22/92 09:58 0.11 2577.415 6.991 0.016 18.72OH23 01/29/92 0.13 2584.000- -6.585 0.020- 18.85OH23 02/12/92 10:15 0.13 2598.42T 14.427. 0.009 18.98OH23 02/19/92 10:28 0.14 2605.436 7.009 0.020 19.12OH23 02/26/92 10: 12 0.05 2612.425 6.989 0.007 19.17OH23 03/11/92 10:25 0.21 2626.434 14.009 0.015 19.38OH23 03/18/92 10:25 0.10 2633.434 7.000 0.014 19.48OH23 03/25/92 12:35 0.08 2640.524 7.090 0.011 19.56OH23 04/01/92 10:20 0.10 2647.431 6.907 0.014 19.66OH23 04/07/92 10:35 0.07 2653.441 6.010 0.012 19.73OH23 04/15/92 09:55 0.14 2661.413 7.972 0.018 19.87OH23 04/22/92 0.10 2668.000 6.587 0.015 19.97OH23 05/06/92 11:45 0.20 2682.490 14.490 0.014 20.17
AUI-9SIWPIWIP/:R3I92-A A-II-55 301681.08
----:-.-..

BRINE SA..\iPUNG AND EVALUATION PROGRAM REPORT 1992-1993 APPENDIX A
TABLE A-2 (Continued)BRINE ACCUMULATION DATA TABLE
Data through December 31, 1993
DAYS DAYS CUMULATIVELITERS SINCE USED FOR LITERS LITERS
LOCATION DATE TIME REMOVED 1/1/85 CALCULATION PER DA'( COLLECTED REMARKS
OH23 05/13/92 14:25 0.17 2689.601 7.111 0.024 20.34OH23 OS/21/92 11 :23 0.10 2697.474 7.873 0.013 20.44OH23 OS/27/92 10:02 0.08 2703.418 5.944 0.013 20.52OH23 06/09/92 10:10 0.16 2716.424 13.006 0.012 20.68OH23 06/18/92 10:30 0.12 2725.438 9.014 0.013 20.80OH23 06/25/92 10:50 0.08 2732.451 7.013 0.011 20.88OH23 07/01/92 10: 15 0.08 2738.427 5.976 0.013 20.96OH23 07/08/92 0.09 2745.000 6.573 0.014 21.05OH23 07/15/92 10:20 0.09 2752.431 7.431 0.012 21.14OH23 07/22/92 11:35 0.09 2759.483 7.052 0.013 21.23OH23 07/29/92 10:42 0.085 2766.446 6.963 0.012 21.32OH23 08/04/92 10:27 0.09 2772.435 5.989 0.015 21.41OH23 08/18/92 10:40 0.17 2786.444 14.009 0.012 21.58OH23 09/02/92 10:20 0.16 2801.431 14.987 0.011 21.74OH23 09/09/92 10:35 0.11 2808.441 7.010 0.016 21.85OH23 09/17/92 10:30 0.09 2816.438 7.997 0.011 21.94OH23 09/23/92 10:25 0.08 2822.434 5.996 0.013 22.02OH23 09/30/92 11 :45 0.10 2829.490 7.056 0.014 22.12OH23 10/12/92 13:25 0.14 2841.559 12.069 0.012 22.26OH23 10/21/92 13:30 0.10 2850.563 9.004 0.011 22.36OH23 10/28/92 09:55 0.08 2857.413 6.850 0.012 22.44OH23 11/11/92 13:35 0.15 2871.566 14.153 0.011 22.59OH23 11/18/92 13:35 0.09 2878.566 7.000 0.013 22.68OH23 11/25/92 10:25 0.10 2885.434 6.868 0.015 22.78OH23 12/09/92 13:50 0.15 2899.576 14.142 0.011 22.93OH23 01/07/93 09:55 0.34 2928.413 28.837 0.012 23.27OH23 01/13/93 10:20 0.07 2934.431 6.018 0.012 23.34OH23 01/28/93 11:00 0.18 2949.458 15.027 0.012 23.52OH23 02/11/93 10:40 0.17 2963.444 13.986 0.012 23.69OH23 02/26/93 11:55 0.14 2978.497 15.053 o.oml 23.83OH23 03/10/93 11:05 0.14 2990.462 11.965 0.012 23.97OH23 03/25/93 11:20 0.20 3005.472 15.010 0.013 24.17OH23 04/28/93 10:55 0.41 3039.455 33.983 0.012 24.58OH23 06/16/93 09:10 0.55 3088.382 48.927 0.01'1 25.13OH23 08/19/93 09:38 0.65 3152.401 0.000 0.000 25.78 Partial evacuation.OH23 08/20/93 09:12 0.08 3153.383- -65.001 0.01'1 25.86 Combine with 0.65 liters from 08-19-93.OH23 11/09/93 09:51 0.62 3234.410 0.000 0.000 26.48 Partial evacuation.OH23 11/12/93 11:20 0.27 3237.472 84.089 0.01'1 26.75 Combine with 0.62 liters from 11-09-93.
->
OH24 12/08/85 14:00 NA 341.583 0.000 0.000 0.00 Approximate date this part of driftexcavated.
OH24 03/06/89 14:00 NA 1525.583 1184.000 0.000 0.00 Horizontal hole drilled 3/2/89 to 3/6/89.OH24 03/08/89 09:50 NA 1527.410 0.000 0.000 0.00 New hole. Installed collection device.
Hole dry.OH24 03/15/89 11 :45 0 1534.490 8.907 0.000 0.00 Hole dry.OH24 03/30/89 10:25 0 1549.434 14.944 0.000 0.00 Hole dry.
AU1·951WPIWIPI:R3192-A A-II-56 301681.08

BRINE SAMPUNG AND EVALUATION PROGRAM REPORT 1992·1993 APPENDIX A
TABLE A-2 (Continued)BRINE ACCUMULATION DATA TABLE
Data through December 31, 1993
DAYS DAYS CUMULATIVELITERS SINCE USED FOR LITERS LITERS
LOCATION DATE TIME REMOVED 1/1/85 CALCULATION . PER DAY COLLECTED REMARKS
OH24 04/18/89 10:00 0 1568.417 18.983 0.000 0.00 Device left with approximately 50 centibarssuction.
OH24 04/26/89 09:40 0 1576.403 7.986 0.000 0.00 Device left with approximately 50 centibarssuction.
OH24 06/05/89 09:40 0.05 1616.403 40.000 0.001 0.05 First time sample recovered. No vacuum incollection device. Collection deviceremoved and repl aced.
OH24 06/20/89 09:00 0.03 1631.375 14.9n 0.002 0.08OH24 07/06/89 11:40 0.01 1647.486 16.111 0.001 0.09 Collection device retained vacuum. Sample
saved for chemistry.OH24 08/09/89 10:20 0 1681.431 33.945 0.000 0.09 Hole dry. Pumped collection device.OH24 08/23/89 11:18 0 1695.471 14.040 0.000 0.09 Hole dry.OH24 10/02/89 11:35 0 1735.483 40.012 0.000 0.09 Hole dry.OH24 10/20/89 11 :35 0 1753.483 18.000 0.000 0.09 Hole dry.OH24 11/10/89 10:26 0 1774.435 20.952 0.000 0.09 Hole dry.OH24 11/29/89 12:58 0 1793.540 19.105 0.000 0.09 Hole dry.OH24 12/12/89 09:54 0 1806.413 12.873 0.000 0.09 Hole dry. Reseat collection device
(leaking).OH24 04/10/90 09:46 0.09 1925.407 118.994 .0.001 0.18OH24 04/24/90 08:46 0.03 1939.365 13.958 0.002 0.21OH24 05/02/90 09:55 NA 1947.413 0.000 0.000 0.21 Trace.OH24 08/10/90 09:40 NA 2047.403 0.000 0.000 0.21 Cleaned, checked, and reinstalled vacuum up
to 50 centibars. Checked in one hour.Sampler holding vacuum.
OH24 04/24/91 10:12 0.00 2304.425 0.000 0.000 0.21 Air blowing through tube.OH24 07/17/91 10:45 0.00 2388.448 0.000 0.000 0.21 Air blowing through tube.OH24 09/25/91 10:18 0.00 2458.429 0.000 0.000 0.21 Air blowing through tube.OH24 10/23/91 12:30 0.53 2486.521 547.156 0.001 0.74 Replaced broken collection device. Used
547.156 days.OH24 10/31/91 11:42 Trace 2494.488 7.967 0.000 0.74 Hole wet at 25 feet.OH24 11/13/91 11:05 0.02 2507.462 12.974 0.002 0.76OH24 12/04/91 11:45 Trace 2528.490 21.028 0.000 0.76OH24 01/08/92 11:03 0.00 2563.460 34.970 0.000 0.76 Pumped dry.OH24 01/30/92 10:30 0.03 2585.438 21.978 0.001 0.79 Hole shows brine on plastic hose Q 19.5 ft.
(into hole) Sampler had minimal brine.Revacuumed and reinstalled Q 11:18.
OH24 03/11/92 10:30 0 2626.438 41.000 0.000 0.79 Dry.OH24 04/22/92 0.00 2668.000 41.562 0.000 0.79OH24 06/18/92 10:35 0.0 2725.441 57.441 0.000 0.79 Dry.OH24 09/03/92 10:30 Trace 2802.438 76.997 0.000 0.79 Removed collector, repositioned.OH24 03/25/93 11:25 0.26 3005.476 203.038 0.001 1.05OH24 11/09/93 Trace 3234.000 0.000 0.000 1.05 Partial evacuation.
OH25 12/08/85 14:00 NA 341.583 228.524 0.000 0.00 Approximate date this part of driftexcavated.
OH25 03/27/89 14:00 NA 1546.583 1205.000 0.000 0.00 Horizontal hole drilled on 3/27/89.
AU1·9SIWPIWIP/:R3192·A A-II-57 301681.08
-,,-_._-----...-..- ...~--------".~ - --, ~-~ --..-._------------.--------- -_. -- - ~- - -~---- --

~--
BRINE SAMPUNG AND EVALUA110N PROGRAM REPORT 1992-1993 APPENDIX A
TABLE A-2 (Continued)BRINE ACCUMULATIOr~ DATA TABLE
Data through December 31, 1993
DAYS DAYS CUMULATIVELITERS SINCE USED FOR LITERS LITERS
LOCATION DATE TIME REMOVED 1/1/85 CALCULATION PER DAY COLLECTED REMARKS
OH25 03/30/89 10:27 0 1549.435 0.000 0.000 0.00 Hole dry.OH25 04/18/89 10:05 0 1568.420 21.837 0.000 0.00 Device left with approximately 50 centibars
suction.OH25 04/26/89 09:45 0 1576.406 7.986 0.000 0.00 Device left with approximately 50 centibars
suction.OH25 06/05/89 09:50 0 1616.410 40.004 0.000 0.00 Hole dry. No vacuum on collection device.
Collection device removed and replaced.OHi5 06/20/89 09:10 0 1631.382 14.9n 0.000 0.00 Hole dry.OH25 07/06/89 11:40 0.01 1647.486 16.104 0.001 0.01 Collection device retained vacuum. Sarrple
saved for chemistry.OH25 08/09/89 10:25 0 1681.434 33.948 0.000 0.01 Hole dry.OH25 08/23/89 11 :18 0 1695.471 14.037 0.000 0.01 Hole dry.OH25 10/02/89 11:35 0 1735.483 40.012 0.000 0.01 Hole dry.OH25 10/20/89 11:35 0 1753.483 18.000 0.000 0.01 Hole dry.OH25 11/10/89 10:30 0 1774.438 20.955 0.000 0.01 Hole dry.OH25 11/29/89 13:02 0 1793.543 19.105 0.000 0.01 Hole dry.OH25 12/12/89 09:58 0 1806.415 12.8n 0.000 0.01 Hole dry. Reseat collection device
(leaking).OH25 08/10/90 09:50 NA 2047.410 0.000 0.000 0.01 Cleaned, checked, and reinstalled vacuum up
to 50 centibars. Checked in one hour.Sarrpler holding vacuum.
OH25 04/24/91 10:14 0.00 2304.426 498.011 0.000 0.01 Air blowing through tube.OH25 07/17/91 10:47 0.00 2388.449 84.023 0.000 0.01 Air blowing through tube.OH25 09/25/91 10: 15 0.06 2458.427 69.978 0.001 0.07OH25 10/31/91 11:42 0.00 2494.488 36.061 0.000 0.07 Dry. Hole wet at 30 feet.OH25 03/25/93 11:27 0.07 3005.477 510.989 ****.**'i' 0.14 Liter/day value is > 0.000 and < 0.001.
OH26 08/05/86 14:00 NA 581.583 0.000 0.000 0.00 Approximate date this part of driftexcavated.
OH26 03/27/89 14:00 NA 1546.583 965.000. 0.000 0.00 Horizontal hole drilled on 3/27/89. Holedrilled with brine. Fluorescien added todrilling fluid.
OH26 03/30/89 10:00 NA 1549.417 0.000 0.000 0.00 New hole. Installed collection device.Hole dry.
OH26 04/18/89 10:10 0 1568.424 21.841 0.000 0.00 Device left with approximately 50 centibarssuction.
OH26 04/26/89 09:15 0 1576.385 7.961 0.000 0.00 Device left with approximately 50 centibarssuction.
OH26 06/05/89 10:00 0.20 1616.417 40.032 0.005 0.20 First time sarrple recovered. Collectiondevice removed and replaced. Sarrple savedfor chemistry.
OH26 06/20/89 09:15 0.05 1631.385 14.968 0.003 0.25OH26 07/06/89 11 :50 0.49 1647.493 16.108 0.030 0.74 Collection device retained vacuum. Sarrple
saved for chemistry.OH26 08/09/89 10:30 0.67 1681.438 33.945 0.020 1.41 Sarrple saved for chemistry.OH26 08/23/89 10:30 0.55 1695.438 14.000 0.039 1.96 Sarrple saved for chemistry.
AU1-951WPIWIP/:R3192-A A-II-58 301681.08

BRINE SAMPUNG AND EVALUATION PROGRAM REPORT 1992-1993 APPENDIX A
TABLE A-2 (Continued)BRINE ACCUMULATION DATA TABLE
Data through December 31, 1993
DAYS DAYS CUMULATIVELITERS SINCE USED FOR LITERS LITERS
LOCATION DATE TIME REMOVED 1/1/85 CALCULATION PER DAY COLLECTED REMARKS
OH26 09/14/89 11:21 0.51 1717.473 22.035 0.023 2.47 Sample saved for chemistry.OH26 10/02/89 11:40 0.56 1735.486 18.013 0.031 3.03 Sample saved for chemistry.OH26 10/20/89 11:45 0.45 1753.490 18.004 0.025 3.48 Sample saved for chemistry, sample #857.OH26 11/10/89 11 :04 0.48 1774.461 20.971 0.023 3.96 Sample saved for chemistry, sample #866.OH26 11/29/89 12:40 0.32 1793.528 19.067 0.017 4.28 Sample saved for chemistry, sample #874.OH26 12/12/89 09:38 0.32 1806.401 12.873 0.025 4.60 Sample saved for chemistry, sample #885.OH26 01/04/90 12:05 0.23 1829.503 23.102 0.010 4.83OH26 01/17/90 08:58 0.36 1842.374 12.871 0.028 5.19OH26 01/31/90 10:54 0.26 1856.454 14.080 . 0.018 5.45OH26 02/13/90 11:30 0.26 1869.479 13.025 0.020 5.71OH26 02/27/90 12:46 0.21 1883.532 14.053 0.015 5.92 Brine probably left in hole.OH26 03/05/90 11:27 0.26 1889.477 5.945 0.044 6.18OH26 03/21/90 09:26 0.18 1905.393 15.916 0.011 6.36OH26 04/04/90 11:49 0.28 1919.492 14.099 0.020 6.64 Brine probably left in hole.OH26 04/10/90 09:17 0.22 1925.387 5.895 0.037 6.86OH26 04/24/90 08:33 0.19 1939.356 13.969 0.014 7.05OH26 05/02/90 09:45 0.24 1947.406 8.050 0.030 7.29OH26 05/09/90 09:46 0.21 1954.407 7.001 0.030 7.50OH26 05/16/90 11 :30 0.15 1961.479 7.072 .0.021 7.65OH26 OS/23/90 13:03 0.12 1968.544 7.065 0.017 7.77OH26 05/31/90 09:29 0.14 1976.395 7.851 0.018 7.91OH26 06/06/90 11:35 0.14 1982.483 6.088 0.023 8.05OH26 06/14/90 10:42 0.14 1990.446 7.963 0.018 8.19OH26 06/28/90 10:27 0.16 2004.435 13.989 0.011 8.35OH26 07/17/90 08:56 0.18 2023.372 0.000 0.000 8.53OH26 07/18/90 11:00 0.28 2024.458 20.023 0.023 8.81 Combined with 0.18 liters 07/17/90. Used
0.46 liters for calculation.OH26 07/25/90 10:07 0.05 2031.422 6.964 0.007 8.86 Brine probably left in hole.OH26 08/01/90 11:05 0.25 2038.462 7.040 0.036 9.11OH26 08/07/90 09:40 0.11 2044.403 5.941 ·0.019 9.22OH26 08/16/90 09:18 0.12 2053.388 8.985 0.013 9.34OH26 08/22/90 10:44 0.10 2059.447 6.059 0.017 9.44OH26 08/29/90 10:23 0.11 2066.433 6.986 0.016 9.55OH26 09/05/90 10:34 0.11 2073.440 7.007 0.016 9.66OH26 09/12/90 08:45 0.10 2080.365 6.925 0.014 9.76OH26 09/25/90 11:26 0.19 2093.476 0.000 0.000 9.95OH26 09/26/90 09:48 0.10 2094.408 14.043 0.021 10.05 Combined with 0.19 liters from 09/25/90.
Used 0.29 liters for calculation.OH26 10/03/90 08:55 0.10 2101.372 6.964 0.014 10.15OH26 10/10/90 10:14 0.11 2108.426 7.054 0.016 10.26OH26 10/18/90 09:25 0.13 2116.392 7.966 0.016 10.39OH26 10/24/90 11:16 0.11 2122.469 6.077 0.018 10.50OH26 10/31/90 10:43 0.12 2129.447 6.978 0.017 10.62OH26 11/07/90 11:43 0.13 2136.488 7.041 0.018 10.75OH26 11/14/90 10:40 0.10 2143.444 6.956 0.014 10.85OH26 11/28/90 11:20 0.21 2157.477. 14.028 0.015 11.06OH26 12/05/90 09:30 0.14 2164.396 6.924 0.020 11.20
AUI-9SIWPIWIPI:R3192·A A-II-59 301681.08
~_. ~~~~--~.. ,.._ .• >-~_.-

BRINE SAMPliNG AND EVALUATION PROGRAM REPORT 1992-1993 APPENDlXA
TABLE A-2 (Continued)BRINE ACCUMULATION DATA TABLE
Data through December 31, 1993
DAYS DAYS CUMULATIVELITERS SINCE USED FOR LITERS LITERS
LOCATION DATE TIME REMOVED 1/1/85 CALCULATION PER DAY COLLECTED REMARKS
OH26 12/13/90 10:20 0.13 2172.431 8.035 0.016 11.33OH26 12/20/90 10:20 0.11 2179.431 7.000 0.016 11.44OH26 01/09/91 10:50 0.29 2199.451 20.020 0.014 11. 73OH26 01/16/91 13:25 0.13 2206.559 7.108 0.018 11.86OH26 01/23/91 10:55 0.17 2213.455 6.896 0.025 12.03OH26 01/30/91 08:36 0.11 2220.358 6.903 0.016 12.14OH26 02/13/91 12:20 0.18 2234.514 14.156 0.013 12.32OH26 02/20/91 11 :25 0.12 2241.476 6.962 0.017 12.44OH26 02/27/91 11:20 0.11 2248.472 6.996 0.016 12.55OH26 03/07/91 10:55 0.11 2256.455 7.983 0.014 12.66OH26 03/20/91 12:43 0.19 2269.530 13.075 0.015 12.85OH26 03/28/91 11:53 0.11 2277.495 7.965 0.014 12.96OH26 04/10/91 10:02 0.20 2290.418 12.923 0.015 13.16OH26 04/17/91 10:54 0.12 2297.454 7.036 0.017 13.28OH26 04/24/91 10:25 0.12 2304.434 6.980 0.017 13.40OH26 05/01/91 10:00 0.10 2311.417 6.983 0.014 13.50OH26 05/08/91 09:20 0.10 2318.389 6.972 0.014 13.60OH26 05/15/91 11:10 0.08 2325.465 7.076 0.011 13.68OH26 OS/29/91 10:18 0.19 2339.429 13.964 .0.014 13.87OH26 06/05/91 13:07 0.14 2346.547 7.118 0.020 14.01OH26 06/12/91 08:57 0.17 2353.373 6.826 0.025 14.18OH26 06/19/91 15:22 0.16 2360.640 7.267 0.022 14.34OH26 06/26/91 08:12 0.10 2367.342 6.702 0.015 14.44OH26 07/11/91 12:08 0.19 2382.506 15.164 0.013 14.63OH26 07/17/91 11:00 0.10 2388.458 5.952 0.017 14.73OH26 07/30/91 10:40 0.06 2401.444 0.000 0.000 14.79 Partial evacuation.OH26 07/31/91 09:45 0.14 2402.406 13.948 0.014 14.93 Combined with 0.06 liters from 07/30/91.OH26 08/08/91 09:39 0.15 2410.402 7.996 0.019 15.08OH26 08/14/91 11:35 0.11 2416.483 6.081 0.018 15.19OH26 08/21/91 11: 17 0.13 2423.470 6.987 0.019 15.32OH26 08/28/91 10:46 0.09 2430.449 6.979 0.013 15.41OH26 09/04/91 11:40 0.09 2437.486 7.037 0.013 15.50OH26 09/11/91 12:05 0.05 2444.503 7.017 O.OOi' 15.55OH26 09/18/91 09:25 0.13 2451.392 6.889 0.019 15.68OH26 09/25/91 09:56 0.11 2458.414 7.022 0.016 15.79OH26 10/02/91 11:40 0.10 2465.486 7.072 0.014- 15.89OH26 10/16/91 11:00 0.10 2479.458 13.972 0.007 15.99OH26 10/23/91 10:25 0.15 2486.434 6.976 0.022 16.14OH26 10/31/91 11 :39 0.13 2494.485 8.051 0.016 16.27OH26 11/06/91 12:08 0.06 2500.506 6.021 0.010 16.33OH26 11/13/91 10:50 0.07 2507.451 6.945 0.010 16.40OH26 11/20/91 11:43 0.13 2514.488 7.037 0.0111 16.53OH26 11/27/9·1 10:36 0.09 2521.442 6.954 0.01;5 16.62OH26 12/04/91 11:30 0.08 2528.479 7.037 0.01'1 16.70OH26 12/11/91 11:45 0.09 2535.490 7.011 0.013 16.79OH26 12/18/91 11:05 0.12 2542.462 6.972 0.017 16.91OH26 01/08/92 11:00 0.23 2563.458 20.996 0.011 17.14
AJJI-95IWPfWlP/:R3192-A A-II-60 301681.08

BRINE SAMPUNG AND EVALUATION PROGRAM REPORT 1992·1993 APPENDIX A
TABLE A-.2 (Continued)BRINE ACCUMULATION DATA TABLE
Data through December 31, 1993
DAYS DAYS CUMULATIVELITERS SINCE USED FOR LITERS LITERS
LOCATION DATE TIME REMOVED 1/1/85 CALCULATION PER DAY COLLECTED REMARKS
OH26 01/15/92 10:08 0.10 2570.422 6.964 0.014 17.24OH26 01/22/92 10:10 0.08 2577.424 7.002 0.011 17.32OH26 01/29/92 0.14 2584.000 6.576 0.021 17.46OH26 02/12/92 10:20 0.15 2598.431 14.431 0.010 17.61OH26 02/19/92 10:32 0.11 2605.439 7.008 0.016 17.72OH26 02/26/92 10:15 0.06 2612.427 6.988 0.009 17.78OH26 03/11/92 10:35 0.16 2626.441 14.014 0.011 17.94OH26 03/18/92 10:35 0.11 2633.441 7.000 0.016 18.05OH26 03/25/92 12:40 0.10 2640.528 7.087 0.014 18.15OH26 04/01/92 10:35 0.08 2647.441 6.913 0.012 18.23OH26 04/07/92 10:45 0.05 2653.448 6.007 0.008 18.28OH26 04/15/92 10:05 0.13 2661.420 7.972 0.016 18.41OH26 04/22/92 0.09 2668.000 6.580 0.014 18.50OH26 05/06/92 11:50 0.18 2682.493 14.493 0.012 18.68OH26 05/13/92 14:40 0.16 2689.611 7.118 0.022 18.84OH26 OS/21/92 11:18 0.08 2697.471 7.860 0.010 18.92OH26 OS/27/92 10:14 0.06 2703.426 5.955 0.010 18.98OH26 06/09/92 10:20 0.15 2716.431 13.005 0.012 19.13OH26 06/18/92 10:40 0.15 2725.444 9.013 .0.017 19.28OH26 06/25/92 10:45 0.07 2732.448 7.004 0.010 19.35OH26 07/01/92 10:20 0.08 2738.431 5.983 0.013 19.43OH26 07/08/92 0.11 2745.000 6.569 0.017 19.54OH26 07/15/92 10:40 0.07 2752.444 7.444 0.009 19.61OH26 07/22/92 11:40 0.10 2759.486 1'.042 0.014 19.71OH26 07/29/92 10:38 0.09 2766.443 6.957 0.013 19.80OH26 08/04/92 10:33 0.07 2m.440 5.997 0.012 19.87OH26 08/18/92 10:47 0.15 2786.449 14.009 0.011 20.02OH26 09/02/92 10:15 0.18 2801.427 14.978 0.012 20.20OH26 09/09/92 10:40 0.09 2808.444 7.017 0.013 20.29OH26 09/17/92 10:35 0.14 2816.441 7.997 0.018 20.43OH26 09/23/92 10:30 0.05 2822.438 5.997 0.008 20.48OH26 09/30/92 11:50 0.06 2829.493 7.055 0.009 20.54OH26 10/12/92 13:30 0.15 2841.563 12.070 0.012 20.69OH26 10/21/92 13:45 0.09 2850.573 9.010 0.010 20.78OH26 10/28/92 10:05 0.08 2857.420 6.847 0.012 20.86OH26 11/11/92 13:35 0.15 2871.566 14.146 0.011 21.01OH26 11/18/92 13:40 0.10 2878.569 7.003 0.014 21.11OH26 11/25/92 10:30 0.07 2885.438 6.869 0.010 21.18OH26 12/09/92 14:00 0.16 2899.583 14.145 0.011 21.34OH26 01/07/93 10:05 0.32 2928.420 28.837 0.011 21.66OH26 01/13/93 10:23 0.06 2934.433 6.013 0.010 21.72OH26 01/28/93 11:15 0.18 2949.469 15.036 0.012 21.90OH26 02/11/93 10:58 0.11 2963.457 13.988 0.008 22.01OH26 02/26/93 12:10 0.23 2978.507 15.050 0.015 22.24OH26 03/10/93 11:10 0.13 2990.465 11.958 0.011 22.37OH26 03/25/93 11:35 0.18 3005.483 15.018 0.012 22.55OH26 04/28/93 11:20 0.38 3039.472 33.989 0.011 22.93
AlJl·9SIWPIWIP/:R3192·A A-II-61 301681.08
-------------

BRINE SAMPUNG AND EVALUATION PROGRAM REPORT 1992-1993 APPENDIX A
TABLE A-2 (Continued)BRINE ACCUMULATION DATA TABLE
Data through December 31, 1993
DAYS DAYS CUMULATIVELITERS SINCE USED FOR LITERS LITERS
LOCATION DATE TIME REMOVED 1/1/85 CALCULATION PER DAV COLLECTED REMARKS
OH26 06/16/93 09:00 0.53 3088.375 48.903 0.011 23.46OH26 08/19/93 09:27 0.58 3152.394 0.000 0.000 24.04 Partial evacuation.OH26 08/20/93 09:06 0.06 3153.379 65.004 0.010 24.10 Combine with 0.58 l from 08-19-93.OH26 11/09/93 09:39 0.57 3234.402 0.000 0.000 24.67 Partial evacuation.OH26 11/12/93 11:25 0.36 3237.476 84.097 0.011 25.03 Combine with 0.57 l from 11-09-93.
OH28 08/05/86 14:00 NA 581.583 0.000 0.000 0.00 Approximate date this part of driftexcavated.
OH28 04/12/89 14:00 NA 1562.583 981.000 0.000 0.00 Horizontal hole drilled 4/11/89 to 4/12/89.OH28 04/18/89 10:25 0 1568.434 0.000 0.000 0.00 Device left with approximately 50 centibars
suction.OH28 04/26/89 09:30 0 1576.396 13.813 0.000 0.00 Device left with approximately 50 centibars
suction.OH28 06/05/89 10:30 0.08 1616.438 40.042 0.002 0.08 First time sample recovered. Collection
device removed and replaced. Sample savedfor chemistry.
OH28 06/20/89 09:30 0.03 1631.396 14.958 0.002 0.11OH28 07/06/89 12:00 0 1647.500 16:104 .0.000 0.11 Hole dry. Collection device retained
vacuun.OH28 08/09/89 10:45 0 1681.448 33.948 0.000 0.11 Hole dry.OH28 08/23/89 10:46 0 1695.449 14.001 0.000 0.11 Hole dry.OH28 10/02/89 11:50 0.05 1735.493 40.044 0.001 0.16 Sample saved for chemistry.OH28 10/20/89 11 :45 0 1753.490 17.997 0.001l 0.16 Hole dry.OH28 11/10/89 11:10 0.07 1774.465 20.975 0.00;5 0.23 Sample saved for chemistry, sample #867.OH28 11/29/89 12:48 0 1793.533 19.068 0.000 0.23 Hole dry.OH28 12/12/89 09:48 0.10 1806.408 12.875 O.OOB 0.33 Sample saved for chemistry, sample #886.OH28 04/10/90 09:36 0.14 1925.400 118.992 0.001 0.47OH28 04/24/90 08:36 0.18 1939.358 13.958 0.013 0.65OH28 05/02/90 09:35 0.01 1947.399 8.041 0.001 0.66OH28 05/09/90 09:40 Trace 1954.403 0.000 0.000 0.66 Trace.OH28 05/16/90 11:38 0.02 1961.485 14.086 0.001 0.68OH28 05/31/90 09:33 0.01 1976.398 14.913 0.001 0.69OH28 08/07/90 09:42 0.10 2044.404 68.006 0.001 0.79OH28 08/10/90 09:10 NA 2047.382 0.000 0.000 0.79 Cleaned, checked, and reinstalled vacuun up
to 50 centibars. Checked in one hour.Sampler holding vacuun.
OH28 09/12/90 08:40 0.04 2080.361 35.957 0.001 0.83OH28 09/26/90 09:50 0.05 2094.410 14.049 0.004 0.88OH28 11/28/90 11:28 0.08 2157.478 63.068 0.001 0.96OH28 12/20/90 10:27 0.07 2179.435 21.957 0.003 1.03OH28 01/30/91 08:51 0.07 2220.369 40.934 0.002 1.10OH28 03/20/91 11:55 0.18 2269.497 49.128 0.004 1.28OH28 03/28/91 11:45 0.01 2277.490 7.993 0.001 1.29OH28 04/24/91 10:29 0.00 2304.437 26.947 0.000 1.29 Air blowing through tube.OH28 07/11/91 12:08 0.00 2382.506 78.069 0.000 1.29 Dry.OH28 07/17/91 11 :07 0.00 2388.463 5.957 0.000 1.29 Air blowing through tube.
AUI-95fWPIWIPf:R3192-A A-II-62 301681.08

BRINE SAMPUNG AND EVALUATION PROGRAM REPORT 1992-1993 APPENDIX A
TABLE A-2 (Continued)BRINE'ACCUMULATION DATA TABLE
Data through December 31, 1993
DAYS DAYS CUMULATIVELITERS SINCE USED FOR LITERS LITERS
LOCATION DATE TIME REMOVED 1/1/85 CALCULATION PER DAY COLLECTED REMARKS
OH28 09/25/91 09:56 0.00 2458.414 69.951 0.000 1.29 Air blowing through tube.OH28 10/23/91 10:27 0.27 2486.435' 28.021 0.010 1.56 First time successfull collection since
03/20/91. Used 216.94 days and 0.28 liters'to calculate flow rate.
OH28 10/31/91 11:36 0.00 2494.483 8.048 0.000 1.56 Dry. No VacuUll. Hole wet at 25 feet.OH28 11/13/91 10:55 0.02 2507.455 12.972 0.002 1.58OH28 12/04/91 11:35 Trace 2528.483 21.028 0.000 1.58OH28 01/08/92 11:00 0.00 2563.458 34.975 0.000 1.58 P~ dry.OH28 01/30/92 11:45 0.09 2585.490 22.032 0.004 1.67 Brine on push rods a 25-28 ft. Water pushed
out of hole by sampler when removed (lotsof brine) sampler checked, Found in workingcondit
OH28 03/11/92 10:40 0 2626.444 40.954 0.000 1.67OH28 04/22/92 0.00 2668.000 41.556 0.000 1.67OH28 06/18/92 10:45 0.18 2725.448 57.448 0.003 1.85OH28 09/03/92 11:00 0.05 2802.458 77.010 0.001 1.90 Removed collector, repositioned.OH28 03/25/93 11:25 0.04 3005.476 203.018 ****.*** 1.94 Liter/day value is > 0.000 and < 0.001.OH28 11/09/93 09:45 Trace 3234.406 0.000 0.000 1.94 Partial evacuation.
OH45 05/08/89 14:00 NA 1588.583 0.000 0.000 0.00 Approximate date this part of undergroundcore storage room" excavated.
OH45 06/15/89 14:00 NA 1626.583 0.000 0.000 0.00 Horizontal hole drilled 6/9/89 to 6/15/89.OH45 06/23/89 11:00 NA 1634.458 0.000 0.000 0.00 New hole. Installed collection device.OH45 08/09/89 14:00 0 1681.583 321.930 0.000 0.00 No vacuUll. Reinstalled collection device.
Hole dry.OH45 08/23/89 11:30 0.45 1695.479 13.896 0.032 0.45 First time hole sampled. Sample saved for
chemistry.OH45 09/12/89 12:35 0.15 1715.524 20.045 0.007 0.60 Sample saved for chemistry.OH45 10/02/89 12:15 0.13 1735.510 19.986 'C.007 0.73 Sample saved for chemistry.OH45 10/20/89 11:10 0.11 1753.465 17.955 0.006 0.84 Sample saved for chemistry, saq:lle #852.OH45 11/10/89 10:20 0.13 1774.431 20.966 0.006 0.97 Saq:lle saved for chemistry, saq:lle #863.OH45 11/29/89 13:11 0.11 1793.549 19.118 0.006 1.08 Saq:lLe saved for chemistry, saq:lle #878.OH45 12/12/89 10:19 0.08 1806.430 12.881 0.006 1.16 Saq:lLe saved for chemistry, saq:lle #889.
Sample bubbl ing.OH45 01/04/90 11:41 0.14 1829.487 23.057 0.006 1.30OH45 01/17/90 11:54 0.08 1842.496 13.009 0.006 1.38OH45 01/31/90 11:08 0.01 1856.464 13.968 0.001 1.39OH45 02/13/90 10:54 0.01 1869.454 12.990 0.001 1.40OH45 02/27/90 12:56 0.11 1883.539 14.085 0.008 1.51 Removed and replaced saq:lLer.OH45 03/05/90 11 :45 0.08 1889.490 5.951 0.013 1.59OH45 03/21/90 11 :34 Trace 1905.482 0.000 0.000 1.59 Trace.OH45 04/10/90 10:28 Trace 1925.436 0.000 0.000 1.59 Trace.OH45 05/02/90 09:12 0.06 1947.383 57.893 0.001 1.65OH45 05/09/90 10:03 Trace 1954.419 0.000 0.000 1.65 Trace.OH45 05/17/90 09:20 0.05 1962.389 0.000 0.000 1.70OH45 OS/23/90 13:10 0.01 1968.549 21.166 0.003 1.71
AUI-95fWPfWlP/:R3192-A A-II-63 301681.08
-.-"~,--.';- .•• >~, • _. '--~{""""-':-;-~~..T~"~."~.•-.--~.~.-------

BRINE SA,"\fi'UNG AND EVALUATION PROGRA..\f REPORT 1992-1993 APPENDIX A
TABLE A-2 (Continued)BRINE ACCUMULATION DATA TABLE
Data through December 31, 1993
DAYS DAYS CUMULATIVELITERS SINCE USED FOR LITERS LITERS
LOCATION DATE TIME REMOVED 1/1/85 CALCULATION PER DAY COLLECTED REMARKS
OH45 06/14/90 10:15 0.01 1990.427 0.000 0.000 1.72 Brine probably left in hole.OH45 07/17/90 11:58 0.46 2023.499 54.950 0.009 2.18OH45 08/07/90 08:50 Trace 2044.368 0.000 0.000 2.18 Trace. Could not sample. Brine probably
left in hole.OH45 08/29/90 12:01 0.27 2066.501 43.002 0.006 2.45OH45 09/13/90 10:40 0.02 208~.444 14.943 0.001 2.47OH45 10/18/90 10: 14 0.05 2116.426 0.000 0.000 2.52OH45 02/13/91 12:40 Trace 2234.528 0.000 0.000 2.52 Did not save.OH45 03/21/91 10:30 0.80 2270.438 188.994 0.004 3.32 Repaired and reinstalled sampler. Used 189
days and 0.85 liters.OH45 03/28/91 11:21 0.00 2277.473 7.035 0.000 3.32 Air blowing through tube.OH45 04/10/91 12:15 0.00 2290.510 13.037 0.000 3.32 Dry.OH45 05/01/91 10:30 0.11 2311.438 20.928 0.005 3.43OH45 05/08/91 09:35 0.00 2318.399 6.961 0.000 3.43 Air blowing through tube.OH45 07/18/91 10:20 0.14 2389.431 71.032 0.002 3.57OH45 08/14/91 11:15 0.05 2416.469 27.038 0.002 3.62OH45 09/25/91 12:10 0.19 2458.507 42.038 0.005 3.81OH45 10/23/91 10:09 0.11 2486.423 27.916 0.004 3.92OH45 10/31/91 11:36 0.06 2494.483 8.060 .0.007 3.98OH45 11/13/91 10:36 0.05 2507.442 12.959 0.004 4.03OH45 12/04/91 11:40 0.08 2528.486 21.044 0.004 4.11OH45 12/18/91 11:07 0.02 2542.463 13.977 0.001 4.13OH45 01/08/92 10:35 0.10 2563.441 20.978 0.005 4.23OH45 01/29/92 10:52 0.09 2584.453 21.012 0.004 4.32OH45 02/19/92 10:15 0.08 2605.427 20.974 0.004 4.40OH45 02/26/92 10:02 Trace 2612.418 6.991 0.000 4.40OH45 03/11/92 10:00 0.15 2626.417 13.999 0.011 4.55OH45 03/18/92 10:00 0.05 2633.417 7.000 0.007 4.60OH45 03/25/92 12:45 0.01 2640.531 7.114 0.001 4.61OH45 04/07/92 11:20 0.06 2653.472 12.941 0.005 4.67OH45 04/15/92 09:35 Trace 2661.399 7.927 0.000 4.67OH45 04/22/92 10:10 Trace 2668.424 7.025 0.000 4.67OH45 05/07/92 09:00 Trace 2683.375 14.951 0.000 4.67OH45 06/18/92 10:50 0.14 2725.451 42.076 0.003 4.81OH45 07/01/92 10:00 0.05 2738.417 12.966 0.004 4.86OH45 07/15/92 10:50 0.05 2752.451 14.034 0.004 4.91OH45 08/18/92 10:28 0.10 2786.436 33.985 0.003 5.01OH45 09/02/92 10:30 0.15 2801.438 15.002 0.010 5.16OH45 09/24/92 09:30 0.07 2823.396 21.958 0.003 5.23OH45 10/21/92 14:00 0.15 2850.583 27.187 0.006 5.38OH45 01/07/93 09:35 0.25 2928.399 77.816 0.003 5.63OH45 01/28/93 11:20 0.13 2949.472 21.073 0.006 5.76OH45 03/25/93 10:45 0.05 3005.448 55.976 0.001 5.81OH45 04/28/93 11 :30 0.19 3039.479 34.031 0.006 6.00OH45 06/16/93 08:43 0.15 3088.363 48.884 0.003 6.15OH45 08/19/93 0.20 3152.000 63.637 0.003 6.35OH45 11/12/93 11:09 0.24 3237.465 85.465 0.003 6.59
AU1-95IWPfWIP/:R3192-A A-II-64 301681.08

BRINE SAMPUNG AND EVALUATION PROGRAM REPORT 1992·1993
TABLE A-2 (Continued)BRINE ACCUMULATION DATA TABLE
Data through December 31, 1993
APPENDIX A
LOCATION DATE
DAYS DAYSLITERS SINCE USED FOR
TIME REMOVED 1/1/85 CALCULATION
CUMULATIVELITERS LITERSPER DAY COLLECTED REMARKS
OH46 05/08/89 14:00 NA 1588.583 0.000 0.000 0.00 Approximate date this part of undergroundcore storage roOm excavated.
OH46 06/20/89 14:00 NA 1631.583 0.000 0.000 0.00 Downhole drilled 6/16/89 to 6/20/89.OH46 07/06/89 11 :30 NA 1647.479 0.000 0.000 0.00 First day of observation for hole, blown
dry.OH46 07/25/89 10:48 0.28 1666.450 77.867 0.004 0.28 First time hole sampled. Sample yellow-
with wood chips and other debris.Hydrocarbon odor (diesel lubricant?).
OH46 08/16/89 10:05 0.68 1688.420 21.970 0.031 0.96 Sample saved for chemistry.OH46 09/12/89 12:35 0.47 1715.524 27.104 0.017 1.43 Sample saved for chemistry.OH46 10/02/89 12:30 0.05 1735.521 0.000 0.000 1.48 Sample saved for chemistry. Some brine
probably left in hole.OH46 10/20/89 11:10 0.57 1753.465 37.941 0.016 2.05 Sample saved for chemistry, sample #853.
Combined with 0.05 liters from 10-02-89.Used 0.62 liters for calculation.
OH46 11/10/89 10:30 0.68 1774.438 20.973 0.032 2.73 Sample saved for chemistry, sample #865.OH46 11/29/89 13:15 0.53 1793.552 19.114 . 0.028 3.26 Sample saved for chemistry, sample #879•OH46 12/12/89 10:20 0.46 1806.431 12.879 0.036 3.n Sample saved for chemistry, sample #890.OH46 01/04/90 11:44 0.45 1829.489 23.058 0.020 4.17OH46 01/17/90 11:58 0.25 1842.499 13.010 0.019 4.42OH46 01/31/90 11:12 0.25 1856.467 13.968 0.018 4.67OH46 02/13/90 11:16 0.22 1869.469 13.002 0.017 4.89OH46 02/27/90 13: 10 0.27 1883.549 14.080 0.019 5.16 Brine probably left in hole.OH46 03/05/90 11:54 0.27 1889.496 5.947 0.045 5.43OH46 03/21/90 11:34 0.13 1905.482 15.986 0.008 5.56 Brine probably left in hole.OH46 04/11/90 10:33 0.32 1926.440 20.958 0.015 5.88OH46 05/02/90 09:10 0.25 1947.382 20.942 0.012 6.13 Brine probably left in hole.OH46 05/08/90 10:05 0.15 1953.420 6.038 0.025 6.28OH46 05/17/90 09:30 0.14 1962.396 8.976 0.016 6.42OH46 OS/23/90 13:30 0.10 1968.563 6.167 0.016 6.52OH46 06/14/90 10:01 0.32 1990.417 21.854 0.015 6.84OH46 06/28/90 11:06 0.20 2004.463 14.046 0.014 7.04OH46 07/17/90 11:50 0.30 2023.493 19.030 0.016 7.34OH46 07/25/90 10:50 0.15 2031.451 ·7.958 0.019 7.J.9
OH46 08/07/90 08:50 0.19 2044.368 12.917 0.015 7.68OH46 08/16/90 10:30 0.17 2053.438 9.070 0.019 7.85OH46 08/22/90 11 :05 0.11 2059.462 6.024 0.018 7.96OH46 08/29/90 11 :45 0.11 2066.490 7.028 0.016 8.07OH46 09/05/90 11:04 0.12 2073.461 6.971 0.017 8.19OH46 09/13/90 10:42 0.12 2081.446 7.985 0.015 8.31OH46 09/28/90 10:10 0.22 2096.424 14.978 0.015 8.53OH46 10/18/90 09:52 0.26 2116.411 19.987 0.013 8.79OH46 02/13/91 12:50 0.74 2234.535 118.124 0.006 9.53OH46 02/27/91 11:05 0.55 2248.462 13.927 0.039 10.08OH46 03/20/91 13:37 0.58 2269.567 21.105 0.027 10.66
AUl·9SfWPIWlP/:R3192·A A-II-65 301681.08

APPENDIX ABRINE SAMPUNG AND EVALUATION PROGRAM REPORT 1992-1993
TABLE A-2 (Continued)BRINE ACCUMULATION DATA TABLE
Data through December 31, 1993
DAYS DAYS CUMULATIVELITERS SINCE USED FOR LITERS LITERS
LOCATION DATE TIME REMOVED 1/1/85 CALCULATION ·PER DAY COLLECTED REMARKS
OH46 03/28/91 11 :21 0.19 2277.473 7.906 0.024 10.85OH46 04/10/91 12:15 0.15 2290.510 13.037 0.012 11.00OH46 04/17/91 11 :21 0.28 2297.473 6.963 0.040 11.28OH46 05/01/91 10:30 0.18 2311.438 13.965 0.013 11.46OH46 05/08/91 08:59 0.09 2318.374 6.936 0.013 11.55OH46 05/15/91 10:48 0.09 2325.450 7.076 0.013 11.64OH46 06/12/91 09:45 0.29 2353.406 27.956 0.010 11.93OH46 06/19/91 15:57 0.10 2360.665 7.259 0.014 12.03OH46 06/26/91 10:00 0.10 2367.417 6.752 0.015 12.13OH46 07111/91 10:20 0.20 2382.431 15.014 0.013 12.33OH46 07/17/91 11:04 0.08 2388.461 6.030 0.013 12.41OH46 07/30/91 11:00 0.16 2401.458 12.997 0.012 12.57OH46 08/08/91 09:50 0.13 2410.410 8.952 0.015 12.70OH46 08/14/91 10:45 0.08 2416.448 6.038 0.013 12.78OH46 08/28/91 11:11 0.17 2430.466 14.018 0.012 12.95OH46 09/18/91 09:40 0.26 2451.403 20.937 0.012 13.21OH46 09/25/91 12:35 0.15 2458.524 7.121 0.021 13.36OH46 10/16/91 10:45 0.22 2479.448 20.924 0.011 13.58OH46 10/23/91 10:10 0.12 2486.424 6.976 0.017 13.70OH46 10/31/91 11:30 0.10 2494.479 8.055 '0.012 13.80OH46 11/06/91 12:10 0.09 2500.507 6.028 0.015 13.89OH46 11/13/91 10:36 0.08 2507.442 6.935 0.012 13.97OH46 11/27/91 10: 11 0.14 2521.424 13.982 0.010 14.11OH46 12/04/91 11:45 0.11 2528.490 7.066 0.016 14.22OH46 12/18/91 10:25 0.15 2542.434 13.944 0.011 14.37OH46 01/08/92 10:35 0.23 2563.441 21.007 0.011 14.60OH46 01/29/92 10:53 0.22 2584.453 21.012 0.010 14.82OH46 02/12/92 09:35 0.18 2598.399 13.946 0.013 15.00OH46 02/19/92 10: 15 0.05 2605.427 7.028 0.007 15.05OH46 02/26/92 10:04 0.08 2612.419 6.992 0.011 15.13OH46 03/11/92 10:00 0.05 2626.417 13.998 0.004 15.18OH46 03/18/92 10:05 0.08 2633.420 7.003 0.011 15.26OH46 03/25/92 12:45 0.16 2640.531 7.111 0.023 15.42OH46 04/01/92 10:50 0.08 2647.451 6.920 0.012 15.50OH46 04/07/92 11:25 0.08 2653.476 6.025 0.013 15.58OH46 04/15/92 09:35 0.10 2661.399 7.923 0.013 15.68OH46 04/22/92 10:20 0.08 2668.431 7.032 0.011 - 15.76OH46 05/07/92 09:00 0.15 2683.375 14.944 0.010 15.91OH46 OS/27/92 10:00 0.22 2703.417 20.042 0.011 16.13OH46 06/18/92 10:55 0.24 2n5.455 22.038 0.011 16.37OH46 06/25/92 10:39 0.10 2732.444 6.989 0.014 16.47OH46 07/01/92 10:00 0.07 2738.417 5.973 0.012 16.54OH46 07/08/92 0.08 2745.000 6.583 0.012 16.62OH46 07/15/92 10:50 0.09 2752.451 7.451 0.012 16.71OH46 07/22/92 11:45 0.08 2759.490 7.039 0.011 16.79OH46 08/04/92 10:05 0.15 2m.420 12.930 0.012 16.94OH46 08/18/92 10:28 0.15 2786.436 14.016 0.011 17.09
AUI-9SIWPIWIP/:R3192-AA-II-66 301681.08

BRINE SAMPliNG AND EVALUATION PROGRAM REPORT 1992·1993 APPENDlXA
TABLE A-2 (Continued)BRINE ACCUMULATION DATA TABLE
Data through December 31, 1993
DAYS DAYS CUMULATIVELITERS SINCE USED FOR LITERS LITERS
LOCATION DATE TIME REMOVED 1/1/85 CALCULATION PER DAY COLLECTED REMARKS
OH46 09/02/92 10:35 0.18 2801.441 15.005 0.012 17.27OH46 09/24/92 09:32 0.01 2823.397 21.956 ****.*** 17.28 Liters/day value is > 0.000 and < 0.001
(0.4E-03).OH46 10/21/92 14:05 0.50 2850.587 27.190 0.018 17.78OH46 10/28/92 09:35 0.06 2857.399 6.812 0.009 17.84OH46 11/11/92 12:50 0.15 2871.535 14.136 0.011 17.99OH46 12/09/92 13:30 0.28 2899.563 28.028 0.010 18.27OH46 12/16/92 10:40 0.04 2906.444 6.881 0.006 18.31OH46 01/07/93 09:40 0.23 2928.403 21.959 0.010 18.54OH46 01/13/93 10: 10 0.06 2934.424 6.021 0.010 18.60OH46 01/28/93 11 :25 0.13 2949.476 15.052 0.009 18.73OH46 03/25/93 10:45 0.49 3005.448 55.972 0.009 19.22OH46 04/28/93 11:30 0.33 3039.479 34.031 0.010 19.55OH46 06/16/93 08:43 0.33 3088.363 48.884 0.007 19.88OH46 08/19/93 0.45 3152.000 63.637 0.007 20.33OH46 11/12/93 11:09 0.42 3237.465 85.465 0.005 20.75
AU1·9SIWPIWIP/:R3192-A A-II-67 301681.08

BRINE SAMPLING AND EVALUATION PROGRAM REPORT 1992-1993
THIS PAGE INTENTIONj~LLY LEFT BLANK
AU4-95IWPIWIP:R3192A
APPE:-iDIX A
30168108

APPENDIX B
GRAPHS OF BRINE ACCUMULATION DATA

THIS PAGE INTENTIONALLY LEFT BLANK

BRINE SAMPliNG AND EVALUATION PROGRAM REPORT 1992-1993
APPENDIX B
GRAPHS OF BRINE ACCUMULATION DATA
APPENDIXB
This appendix contains graphs of data presented in Appendix A for selected locations. As
described in Deal and Case (1987), much of the variability in the quantity of brine collected
resulted from limitations of the collection techniques, rather than variations in the actual
inflow of brine from bedrock at the collecting locations. As a result, plotting of the inflow
data from the data tables (Appendix A) results in an irregular plot that implies variations in
inflow which, in fact, do not exist. An II-point moving average was used to smooth the
line. The smoothed data reflect trends in the body of the curve that are representative of the
brine seepage rates, while still showing variations that are probably the result of collection
techniques.
At the beginning and end of each curve, moving average smoothing projects the calculated
trend. As a result, initial and ending values tend to be distorted by the II-point moving
average smoothing program. A"step-down" moving average was used for the data points at
the beginning and end of the curve to correct the distortion. The"step-down" moving
average involves stepping down from an II-point average to a 9-point, 7-point, 5-point and a
3-point average at both ends of the line, utilizing the actual data for the last point.
Additional discussion of the collection and data handling is provided in Deal and Case
(1987).
AUI-951WPIWIP/R3192-B B-1 301681.08

BRINE SAMPliNG AND EVALUATION PROGRAM REPORT 1992-1993
THIS PAGE INTENTIONIALLY LEFT BLANK
APPENDIXB
AUI-951WPIWIP/R3192-B B-2 301681.08

BRINE SAMPUNG AND EVALUATION PROGRAM REPORT 1992·1993 APPENDIXB
0.20 A3X01
0.18
0.16
0.14
>.~ 0.12...~0.10I!!~0.08..J
0.06
0.04
0.02
0.00
0 500 1000 1500 2000 2500 3000 3500Days Since 01-01-1985
0.20 BX010.18
0.16
0.14
~0 0.12...~0.10I!!.~ 0.00..J
0.06
0.04
0.02
0.00
0 500 1000 1500 2000 2500 3000 3500
Days Since 01-01-1985
AUl·9SIWPIWIP/R3192·B B-3 301681.08

BRINE SAMPUNG AND EVALUATION PROGRAM REPORT 1992-1993 APPENDIXB
0.20 OH400.18
0.16
0.14
>-~ 0.12....~0.10l!!~ 0.08...J
0.06
0.04
0.02
0.00
0 500 1000 1500 2000 2500 3000 3500Days Since 01-01-1985
0.20 01-1420.18
0.16
0.14
>-~ 0.12....~0.10l!!~0.08...J
0.06
0.04
0.02
0.00
0 500 1000 1500 2000 2500 3000 3500Days Since 01-01-1985
AUI-95/WPIWIP/R3192-B B-4 301681.08

BRINE SAMPUNG AND EVALUATION PROGRAM: REPORT 1992-1993 APPENDIXB
0.20 DH42A0.18
0.16
0.14
>.~ 0.12...8.0.10l!!CD5 0.08
0.06
0.04
0.02
0.00
0 500 1000 1500 2000 2500 3000 3500Days Since 01-01-1985
2.50 ·DHP402A2.25
2.00
1.75
>.~ 1.50...8.1.25l!!.~ 1.00...J
0.75
0.50
0.25
0.00
0 500 1000 1500 2000 2500 3000 3500Days Since 01-01-1985
AU1·95fWPfWlP/R3192-B B-5 301681.08
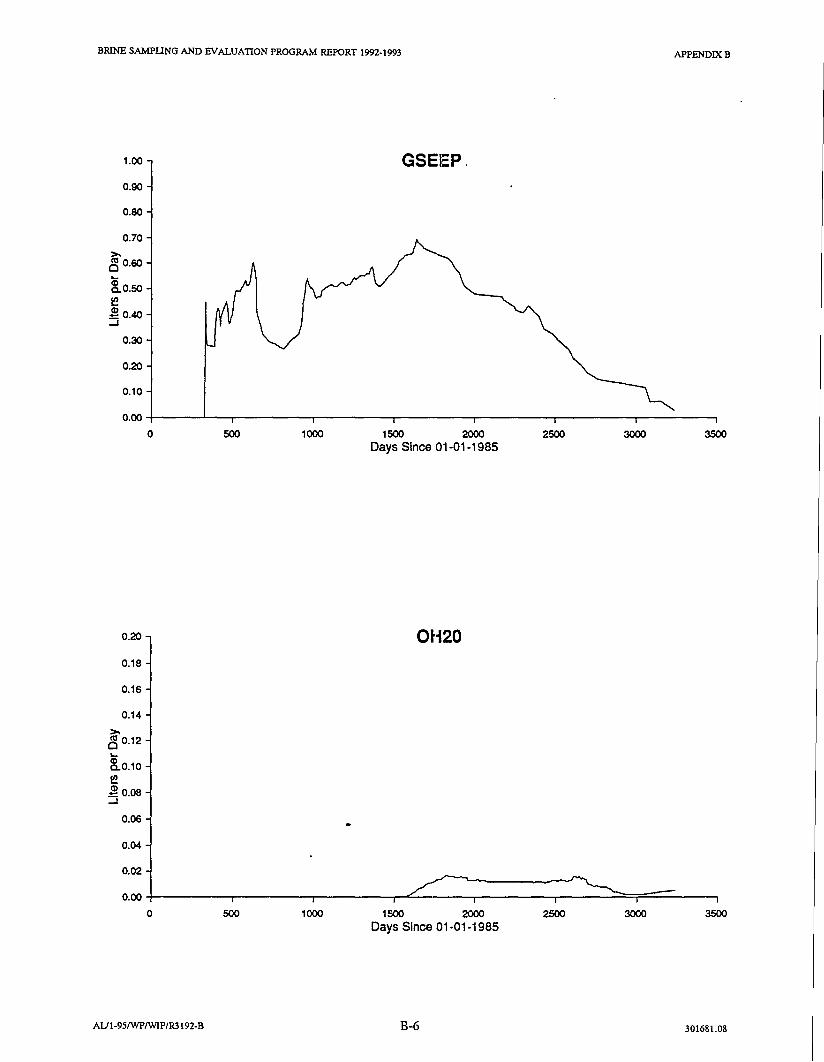
BRINE SAMPUNG AND EVALUATION PROGRAM REPORT 1992-1993 APPENDIXB
1.00 GSEIEP0.90
0.80
0.70
>.~ 0.60....~0.50l!!~0.40...J
0.30
0.20
0.10
0.00
0 500 1000 1500 2000 2500 3000 3500Days Since 01-01-1985
0.20 Ot-l200.18
0.16
0.14
>.~ 0.12....~0.10l!!~0.08...J
0.06
0.04
0.02
0.00
0 500 1000 1500 2000 2500 3000 3500Days Since 01-01-1985
AUI-95/WPIWIP/R3192-B B-6 301681.08

BRINE SAMPUNG AND EVALUATION PROGRAM REPORT 1992-1993 APPENDIXB
0.20 OH230.18
0.16
0.14
>.~ 0.12...~0.10I!!~0.08-I
0.06
0.04
0.02
0.00
0 500 1000 1500 2000 2500 3000 3500Days Since 01-01-1985
0.20 OH260.18
0.16
0.14
>.~ 0.12...~0.10I!!~0.08-I
0.06
0.04
0.02
0.00
0 500 1000 1500 2000 2500 3000 3500Days Since 01-01-1985
AU1·951WPIWIP/R3192·B B-7 301681.08

BRINE SAMPliNG AND EVALUATION PROGRAM REPORT 1992-1993 APPENDIXB
0.20 OH450.18
0.16
0.14
>-cg 0.12...~0.10l!!~ 0.08....J
0.06
0.04
0.02
"'\
0.00
0 500 1000 1500 2000 2500 3000 3500Days Since 01-01-1985
0.20 OH46
0.18
0.16
0.14
>-cg 0.12...~0.10l!!~0.08....J
0.06
0.04
0.02
0.00
0 500 1000 1500 2000 2500 3000 3500Days Since 01-01-1985
AUI-95/WPIWIP/R3192-B B-8 301681.08

BRINE SAMPLING AND EVALUATION PROGRAM REPORT 1992-1993
APPENDIX CAIR INTAKE SHAFT INSPECTION
AU4-95IWPIWIP:R3192·C
APPENDIX C
301681.08

BRINE SAMPLING AND EVALUATION PROGRAM REPORT 1992-1993
THIS PAGE INTENTIONJ~LLY LEFT BLANK
AU4-95IWPIW1P:R3192-C
APPENDIX C
301681.08

BRINE SAMPLING AND EVALUATION PROGRAM REPORT 1992-1993 APPENDlXC
Table of Contents _
C.l.O General Observations C-2
C.2.0 Specific Observations C-3
C.3.0 Discussion : C-6
C.4.0 Summary ~ C-7
C.5.0 Recommendations C-7
C.6.0 References to Appendix C C-8
AU4-95IWPIWIP:R3192·C 301681.08

BRINE SAMPLING AND EVALUATION PROGRAM REPORT 1992-1993
THIS PAGE INTENTIONJ~LLY LEFT BLANK
AU4-95IWPIWIP:R3192·C
APPENDIX C
301681.08

BRINE SAMPLING AND EVALUATION PROGRAM REPORT 1992-1993
AIR INTAKE SHAFT INSPECTION
APPENDlXC
Surfaces of excavated areas for the Waste Isolation Pilot Plant (WIPP) have been observed to
develop salt encrustations from weeps in some locations (TSC-D'Appolonia, 1983; Deal and
others, 1989). These weeps develop salt encrustations over a period of time, if flow is
sufficient, and then dry up and cease to flow within periods ranging from hours to a few
years (Deal and others, 1989). Similar phenomena are observed within some potash mine
areas that are also in the Salado Formation in the vicinity of WIPP (Deal and Case, 1987,
Section 3.2).
The source of the brine, the process of fluid flow, and the rate and volume of fluid flow to
repository panels are significant factors in assessing the volume of water that will accumulate
within the panels. The water volume is an important parameter for calculating gas generation
during breakdown of waste; gas pressure might be sufficient to fracture the surrounding rock
and breach containment (SNLINM, 1992). Deal and Bills (1994) and Deal and others (1994)
have concluded that empirical data from 11 years of observations, as well as some simplified
modeling, indicate that fluid flow will be limited in duration and volume. They conclude that
the brine will be a small fraction of that required to corrode metal and to generate gas
pressures high enough to fracture the surrounding rock. Because of this, it is appropriate to
examine the evidence developed empirically about the weeps, determine limits to inferences
based on this data, and seek any further evidence bearing on interpretations already provided.
The Air Intake Shaft (AIS) at the WIPP provides a different perspective on the distribution
and development of weeps within the Salado Formation. The underground workings reveal a
significant horizontal area within a fairly narrow stratigraphic range and at relatively constant
depth. The underground areas open to visual observation are predominantly halite beds.
Sulfate interbeds are exposed in only a few locations and have been altered by deformation in
the disturbed rock zone (DRZ). It is difficult to accurately determine the undisturbed
hydrologic properties of the sulfate beds from those exposures. The AIS is a vertical, circular
shaft with reasonable access to the beds from the repository level to near the top of the
Salado Formation. Sulfate marker beds, clay-rich units, and halitic beds with differing minor
components are observable at different depths. Although a DRZ has formed around the shaft,
the extensive fracturing that characterizes the DRZ around the .rectangular, horizontal WIPP
excavations (Appendix E, Figure E-2-l) does not exist.
AU4-95IWPIW1P:R3192·C C-I 301681.08

BRINE SAMPLING AND EVALUATION PROGRAM REPORT 1992-1993 APPENDIX C
A portion of the shaft wall was cleaned with high-pressure water during 1989 and was then
allowed to dry. The AIS was mapped in considerable detail based on the cleaned section
(Holt and Powers, 1990). Some sections of the shaft were noted to be yielding some fluid
during mapping. The cleaned and mapped portion of the shaft was observed during recent
inspections to have remained relatively clean and well-exposed, providing the opportunity to
compare the present surface with that mapped during 1989. (For consistency with that report,
English units are used in this appendix.)
On July 19, 1994, an initial assessment of the development of the weeps in the AlS was made
from the man cage. The units were viewed at inspection speed on the down trip to the
repository level, confirming that the south shaft wall was still well-exposed. Significant
marker beds were identified and weeps were found to be present. Salt encrustations were
noted on the stratigraphic log of the shaft mapping (Holt and Powers, 1990). A more detailed
examination was performed during the ascent.
All observations were made from the confines of the man cage, approximately centered in the
shaft and about 9 ft from the shaft wall. Lighting was provided by battery powered miner's
lamps and a flashlight.
C.1.0 GeneraIObservations _A strip ranging from approximately 5 to 20 ft wide along the south side of the AlS was
cleaned with high-pressure water and allowed to dry before the AIS was mapped during 1989
(Holt and Powers, 1990). This strip remains in good condition for observing geologic
features nearly five years later, although the surface has altered somewhat under the intake of
air varying in temperature and humidity.
Salt encrustations are much more common below the depth of 1,500 ft in the shaft,
approximately the midpoint of the exposed Salado in the AlS. Only a few units above
1,500 ft show that weeps have existed, though Marker Bed (MB) 103 (near the top of the
Salado) was the only bed observed to have a wet surface at the time of this survey. The
observations do not differentiate between zones where weeps have ceased and zones where
there might still be seepage under the salt encrustation.
As noted in some of the specific comments below, many of the encrustations appear to
emanate from or are closely associated with contacts between units where Holt and Powers
(1990) inferred exposure surfaces of Permian age, based on the compositions, sedimentary
AU4-95IWPIWIP.R3192-C C-2 301681.08

BRINE SAMPLING AND EVALUATION PROGRAM REPORT 1992-1993 APPENDIX C
features, and textures of the units underlying the contact. The bulk of the encrustations are
also closely associated with argillaceous units.
C.2.0 Specific Observations'--- _The specific observations of salt encrustations in the AIS have been summarized (see
Table C-2-1) for reference relative to the original mapping (Holt and Powers, 1990). There is
a minor difference in depth below approximately 2,000 ft between the present depth markers
and the original depth reference for mapping. Except as noted, the depths in this report
correspond to the original mapping depth to aid in relating them to the stratigraphy presented
from the mapping. Specific examples of features are described briefly; they are ordered here
by increasing depth.
ME 103 (1,029 ft) displays the most significant salt encrustations for any sulfate marker bed
within the AIS (Figure C-2-1). The weeps were restricted to a zone about 1 ft thick that is
dolomitic, overlies a claystone, and was observed to be wet during inspection. The same
zone was yielding fluid during the 1989 mapping. Rock bolts from the argillaceous halite,
below the marker bed and claystone, at 'a depth of approximately 1,030 ft were also wet.
The lower 5-6 ft of the Vaca Triste Sandstone Member 0,342-1,348 ft) displays significant
encrustations, many around the heads of rock bolts used to hold screen in place
(Figures C-2-2 and C-2-3). The upper 2 ft (see Figure C-2-2) reveals sedimentary features,
dish-shaped structures, and soft-sediment deformation consistent with synsedimentary
remobilization of halite in a mud pan. This zone is also halitic and shows no evidence of
weeps (see Figure C-2-2). Encrustations are large in the lower part (see Figure C-3).
Many of the marker beds show no encrustations associated with weeps, as illustrated by the
Union Anhydrite (1,529-1,535 ft) (Figure C-2-4). A distinctive argillaceous unit from about
1,673 to 1,676 ft has produced a number of small encrustations within the unit as well as at
and slightly above the upper surface (see Figure C-2-5). Subaqueous primary halite overlies
the unit. The halite immediately above the argillaceous halite should be examined at close
range to more precisely determine the relationship of weeps to halite. In most areas, high
purity halite shows no encrustations.
A series of stratigraphically controlled encrustations (see Figure C-2-6) from a zone at a depth
of approximately 1,767 to 1,776 ft is related to several exposure surfaces over that interval.
AU4-95IWPIWIP:R3192·C C-3 301681.08

BRINE SAMPLING AND EVALUATION PROGRAM REPORT 1992-1993 APPENDIX C
During original mapping, some of these zones, as well as others nearby, were observed to
have some brine seeps.
Within Figure C-6, two zones (one at approximately 1,770 ft and one from 1,775 ft to
approximately 1,777 ft) do not seem to have yielded any fluid or to have developed any
encrustations. From the descriptions (Holt and Powers, 1990), these two zones, or beds,
differ from adjacent zones in two ways: a higher content of clay and a higher proportion of
"podular" textures. These areas may also warrant closer examination from the work platform
or galloway.
Clay minerals distributed throughout the uppermost deposits of an exposure surface seem to
be the significant control for a number of the intervals with encrustations. The exposure
surface at the 1,825-ft depth (Figure C-2-7) is overlain by halite still exhibiting some primary
fluid inclusion zones. The surface itself developed some of the larger and deeper (some to 10
ft) synsedimentary dissolution pipes within the Salado Formation as the penecontemporaneous
water table dropped below the exposed surface. The clays do not occur in large proportions
under this surface, but they are greater than in underlying or overlying units.
There is very little association of encrustations with marker beds composed mostly of
polyhalite. A thin (less tl}an 1 ft) unit of mixed polyhalite and halite (see Figure C-2-8) at a
depth of approximately 1,845 ft) overlying an exposure surface developed some significant
encrustations. Minor encrustations also developed in the slightly polyhalitic halite overlying
this unit. Because the polyhalite-halite bed appeared slumped and contorted, it may be that
clays are significant in the unit, though not noted during mapping. Solution pipes with
collapse textures underlie this bed and developed small encrustations from collapse material.
Claystones and argillaceous halite underlying several of the marker beds have developed
encrustations. The gray claystone (see Figure C-2-9) underlying MB 131 shows this
stratigraphic control. The exposure surface at approximately 1,867 ft, shown near the bottom
of Figure C-2-9, also developed a line of encrustations similar to other exposure surfaces. As
in other parts of the shaft, it is notable that rock bolts within approximately a foot of the
upper line of encrustations did not develop observable evidence of weeps.
An unnamed anhydrite at approximately 1,940 ft (see Figure C-2-1O) shows encrustations
developed at, and possibly slightly above, the underlying claystone. Rock bolts within the
upper part of the anhydrite indicate that some weeps have developed. This unit should be
AU4-95IWPIWIP:R3192-C C-4 301681.08

BRINE SAMPLING AND EVALUATION PROGRAM REPORT 1992-1993 APPENDIX C
examined more closely for cracking as well as for lithologic control of the weeps. The basal
part of Figure C-2-10 shows possible minor weeps originating from the argillaceous halite
underlying the claystone.
MB 134, at a depth from 1,956 to 1,967 ft, appears to have developed 2 or 3 isolated weeps
within the upper few feet of the unit (see Figure C-2-11). These are unusual among the
observed encrustations in the AIS for two reasons: they are within a thick anhydrite, and they
are isolated. This entire unit should be carefully examined for evidence of fractures and
controls on the weeps.
The claystone at the base of MB 135 appears to control weep locations, as do some other
marker beds (Figure C-2-12 at a depth of approximately 1,985 ft). Some encrustations
developed above MB 135 from clay-filled synsedimentary pits or caves (Figure C-2-12) (Holt
and Powers, 1990). The anhydrite in MB 135 should be more carefully examined for
evidence of fractures.
The major exposure surface at approximately 1,995 ft (Figure C-2-13), as well as secondary
surfaces below that, controls the location of many of the encrustations in that zone. In
addition to discrete surfaces, the clay content increases in the upper 5 ft of this zone of
weeps. The overlying, relatively pure halite did not develop weeps, as in many similar
sequences throughout the AIS.
From a depth of about 2,075 to nearly 2,100 ft, a series of stratigraphically controlled
encrustations developed along mapped exposure surfaces (Figure C-2-14). The clay content
generally increases upward toward the exposure surface, and the overlying halite is relatively
pure with remains of primary fluid inclusion zones in some halite.
The base of MB 138 (Figure C-2-15) shows weeps similar to some other sulfate beds. It is
the closest such claystone-sulfate unit above the repository horizon to develop encrustations.
"Anhydrite a," at an original mapping depth of approximately 2,123 to 2,124 (2,121 to
2,122 ft according to new depth-marker signs) shows a visible fracture but no evidence of
seepage.
Discontinuous small encrustations developed along and above the exposure surface (referred
to as clay I in reference stratigraphy for rock mechanics) originally mapped at approximately
2,113 ft (Figure C-2-16). Above the more significant exposure surface, the halite is thinly
AU4-95IWPIWIP:R3192·C C-5 301681.08
. .,."...,..-,..."....,,<..-.-~~-=~---_. ~ ..._--_. --"

BRINE SAMPLING AND EVALUATION PROGRAM REPORT 1992-1993 APPENDIX C
bedded with anhydrite stringers indicating minor exposure. These encrustations are the
closest observed to the repository horizon.
C.3.0 Discussion _The most common denominator for the salt encrustations observed in the AIS appears to be
stratigraphic discontinuities interpreted by Holt and Powers (1990) as produced by a period of
exposure during the Permian Age before deposition of the overlying sediment. It could also
be reasonably argued that clay content is the common denominator. Exposure surfaces and
increasing clay content upward in a depositional cycle are associated. Nonetheless, the mere
presence of either an exposure surface or a surface of clay does not mean that a weep will
form; most do not develop weeps.
At this time, there is insufficient evidence to draw conclusions from the AIS as to whether
the units that developed salt encrustations might do so if intercepted at another location.
Various locations underground at WIPP do produce weeps within the same stratigraphic units;
therefore, it is suspected that a unit producing weeps in the AIS will be prone to produce
weeps if intercepted elsewhere. This has not been demonstrated by observation. Nor can it
be demonstrated that a shaft some distance from the AIS would only produce weeps from the
exact same stratigraphic intervals. It is expected that any intercept through these units would
produce weeps that preferentially, but not uniquely, are associated with exposure surfaces and
attendant argillaceous halite.
Claystones under some sulfate beds do produce weeps. These are more common at greater
depth. Some might also be interpreted to overlie exposure surfaces. By inspection, it appears
that claystones underlying sulfate beds less than 2 ft thick more frequently produce weeps
than those underlying thicker sulfate beds.
MB 103 has the most significant weeps of any sulfate unit in the AIS, and it also has a wet
surface. In contrast, "anhydrite a" is visibly fractured parallel to bedding but appears not to
have developed any weeps. This observation limits the amount of fluid available from the
unit to that which might have flowed before cleaning and mapping.
In contrast, MB 103 persisted with flow after this period of cleaning and mapping. As the
uppermost unit yielding weeps, unloading may be more of a factor, but it must also be noted
that other marker beds above and below MB 103 did not similarly yield brine.
AU-I-95/wP/wIP:R3192·C C-6 30168108

BRINE SAMPLING AND EVALUATION PROGRAM REPORT 1992-1993 APPENDIX C
C.4.0 Summary _The AlS intercepts a variety of evaporite lithologies and bedding relationships. A number of
these units have developed salt encrustations over the five years since a strip was cleaned and
mapped.
Encrustations are more abundant below a depth of approximately 1,500 ft, about the midpoint
of the exposed Salado Formation in the AlS. The salt encrustations are frequently, but not
uniquely, associated with Permian age exposure surfaces and related argillaceous halite.
Claystones under a few sulfate beds in the lower half also yielded brine. MB 103, near the
top of the exposed Salado, has much more salt encrustation than any other marker bed, and it
shows a small surface that is observably wet now. Most of the sulfate beds,'especially
polyhalitic units, show no weeps or encrustations.
Observations were made from approximately 9 ft away. The encrustations all appeared to be
dry.
C.5.0 Recommendations _It is recommended that some additional, closer, observations of the AlS weep occurrences be
performed to supplement the preliminary data reported here. Selected stratigraphic intervals
should be examined in detail from the galloway to confirm the stratigraphic and textural
relationships between encrustations and previous mapping.
A limited, two-part program in the AIS to confirm the preliminary observations is
recommended. This should be within the capabilities of on-site geotechnical personnel,
especially if trained as indicated above; outside observers can confirm information, if
necessary. The first phase is to document the encrustations in considerably more detail by
demonstrating very specific textural and stratigraphic relationships to the encrustations.
Scaled photographic records should also be included.
During the first phase, some areas of encrustations should be removed within carefully
documented and marked areas. The samples should be preserved for possible analysis
pending further observations. Within selected stratigraphic intervals, part of the encrustations
may be removed to compare any future precipitation with current encrustations. The main
purpose of scraping the areas is to determine if some weeps might still be active and would
develop again.
AU4-95IWPIWIP:R3192·C C-7 301681,08

BRINE SAMPLING AND EVALUATION PROGRAM REPORT 1992-1993 APPENDIX C
The second phase is a modest program of reinspections to determine if weeping is continuing
where the encrustations had been removed, as well as a general survey of the shaft for any
other evidence of renewed weeps. The initial inspections should be within a few weeks, at
most, to not miss small amounts of weeping. Within a year, a few inspections should reveal
any renewed activity. If there are additional weeps, the program of observation can be
reevaluated.
C.6.0 References to Appendix C _
Deal, D. E., and R. A. Bills, 1994, "Conclusions After Eleven Years of Studying Brine at theWaste Isolation Pilot Plant," Waste Management '94, Tucson, Arizona, March 2, 1994,IT Corporation, Albuquerque, New Mexico, and U.S. Department of Energy, Carlsbad, NewMexico.
Deal, D. E., and J. B. Case, 1987, "Brine Sampling and Evaluation Program, Phase I Report,"DOE-WIPP 87-008, prepared for the U.S. Department of Energy by IT Corporation andWestinghouse Electric Corporation, Carlsbad, New Mexico, 163 pp.
Deal, D. E., R. M. Holt, J. M. Melvin, and S. M. Djordjevic, 1994, "Calculation of BrineSeepage from Anhydrite Marker Bed 139 into a Waste Storage Room at the Waste IsolationPilot Plant," DOE-WIPP 94-007, Westinghouse Electric Corp., Carlsbad, New Mexico.
Deal, D. E., R. J. Abitz, D. S. Belski, J. B. Case, M. E. Crawley, R. M. Deshler, P. E. Drez,C. A. Givens, R. B King, B. A. Lauctes, J. Myers, S. Niou, J. M. Pietz, W. M. Roggenthen,J. R. Tyburski, and M. G. Wallace, 1989, "Brine Sampling and Evaluation Program Report,1988," DOE-WIPP 89-015, prepared for the U.S. Department-of Energy by IT Corporationand Westinghouse Electric Corporation, Carlsbad, New Mexico.
Holt, R. M., and D. W. Powers, 1990, "Geologic Mapping of the Air Intake Shaft at theWaste Isolation Pilot Plant," DOEIWIPP 90-051, prepared for the U.S. Department of Energyby IT Corporation, Carlsbad, New Mexico.
Sandia National LaboratorieslNew Mexico (SNLINM), 1992, "Preliminary PerformanceAssessment for the Waste Isolation Pilot Plant, December 1992, Volume 3: ModelParameters," SAND92-0700/3, WIPP Performance Assessment Division, Sandia NationalLaboratories, New Mexico.
TSC-D'Appolonia, 1983, "Geologic Mapping of Access Drifts, 'Double Box' Area,Geotechnical Field Data Report No.5," Carlsbad, New Mexico.
AU4-95IWPIWIP:R3192-C C-8 301681.08
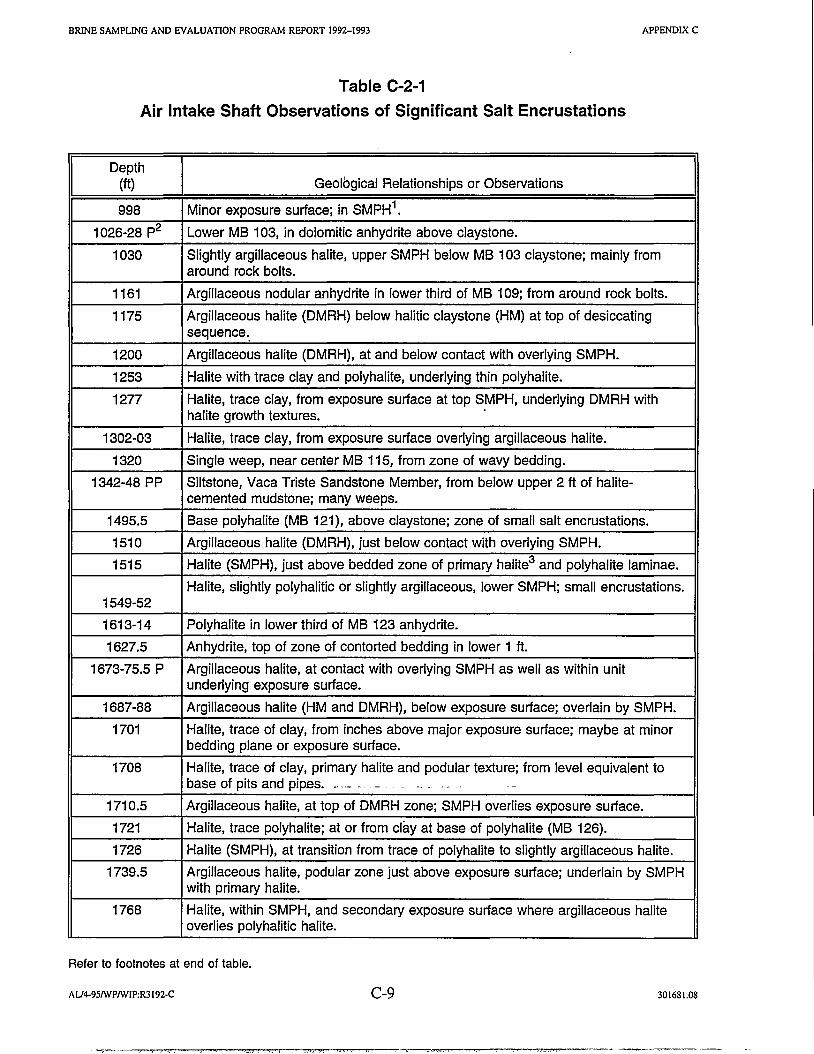
BRINE SAMPLING AND EVALUATION PROGRAM REPORT 1992-1993
Table C-2-1
Air Intake Shaft Observations of Significant Salt Encrustations
APPENDIX C
Depth(ft) Geological Relationships or Observations
998 Minor exposure surface; in SMPH1•
1026-28 p2 Lower MB 103, in dolomitic anhydrite above claystone.
1030 Slightly argillaceous halite, upper SMPH below MB 103 claystone; mainly fromaround rock bolts.
1161 Argillaceous nodular anhydrite in lower third of MB 109; from around rock bolts.
1175 Argillaceous halite (DMRH) below halitic claystone (HM) at top of desiccatingsequence..
1200 Argillaceous halite (DMRH), at and below contact with overlying SMPH.
1253 Halite with trace clay and polyhalite, underlying thin polyhalite.
1277 Halite, trace clay, from exposure surface at top SMPH, underlying DMRH withhalite growth textures.
1302-03 Halite, trace clay, from exposure surface overlying argillaceous halite.
1320 Single weep, near center MB 115, from zone of wavy bedding.
1342-48 PP Siltstone, Vaca Triste Sandstone Member, from below upper 2 ft of halite-cemented mudstone; many weeps.
1495.5 Base polyhalite (MB 121), above claystone; zone of small salt encrustations.
1510 Argillaceous halite (DMRH), just below contact with overlying SMPH.
1515 Halite (SMPH), just above bedded zone of primary halite3 and polyhalite laminae.
Halite, slightly polyhalitic or slightly argillaceous, lower SMPH; small encrustations.1549-52
1613-14 Polyhalite in lower third of MB 123 anhydrite.
1627.5 Anhydrite, top of zone of contorted bedding in lower 1 ft.
1673-75.5 P Argillaceous halite, at contact with overlying SMPH as well as within unitunderlying exposure surface.
1687-88 Argillaceous halite (HM and DMRH), below exposure surface; overlain by SMPH.
1701 Halite, trace of clay, from inches above major exposure surface; maybe at minorbedding plane or exposure surface.
1708 Halite, trace of clay, primary halite and podular texture; from level equivalent tobase of pits and pipes. __ - - - -- - - - - -- --- . -
1710.5 Argillaceous halite, at top of DMRH zone; SMPH overlies exposure surface.
1721 Halite, trace polyhalite; at or from clay at base of polyhalite (MB 126).
1726 Halite (SMPH), at transition from trace of polyhalite to slightly argillaceous halite.
1739.5 Argillaceous halite, podular zone just above exposure surface; underlain by SMPHwith primary halite.
1768 Halite, within SMPH, and secondary exposure surface where argillaceous haliteoverlies polyhalitic halite.
Refer to footnotes at end of table.
AU4-95IWPIWIP:R3192-C C-9 301681.08
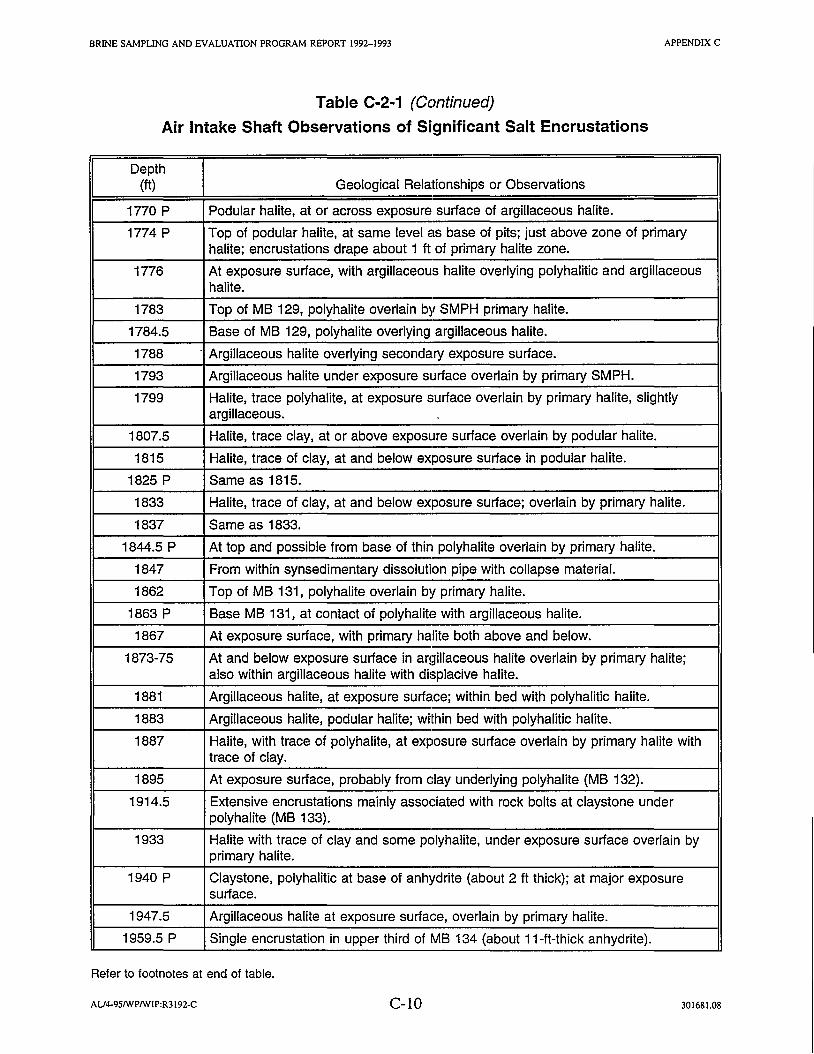
BRINE SAMPLING AND EVALUATION PROGRAM REPORT 1992-1993
Table C-2-1 (Continued)
Air Intake Shaft Observations of Significant Salt Encrustations
APPENDIX C
Depth(ft) Geological Relationships or Observations
1770 P Podular halite, at or across exposure surface of argillaceous halite.
1774P Top of podular halite, at same level as base of pits; just above zone of primaryhalite; encrustations drape about 1 ft of primary halite zone.
1776 At exposure surface, with argillaceous halite overlying polyhalitic and argillaceoushalite.
1783 Top of MB 129, polyhalite overlain by SMPH primary halite.
1784.5 Base of MB 129, polyhalite overlying argillaceous halite.
1788 . Argillaceous halite overlying secondary exposure surface.
1793 Argillaceous halite under exposure surface overlain by primary SMPH.
1799 Halite, trace polyhalite, at exposure surface overlain by primary halite, slightlyargillaceous.
1807.5 Halite, trace clay, at or above exposure surface overlain by podular halite.
1815 Halite, trace of clay, at and below exposure surface in podular halite.
1825 P Same as 1815.
1833 Halite, trace of clay, at and below exposure surface; overlain by primary halite.
1837 Same as 1833.
1844.5 P At top and possible from base of thin polyhalite overlain by primary halite.
1847 From within synsedimentary dissolution pipe with collapse material.
1862 Top of MB 131, polyhalite overlain by primary halite.
1863 P Base MB 131, at contact of polyhalite with argillaceous halite.
1867 At exposure surface, with primary halite both above and below.
1873-75 At and below exposure surface in argillaceous halite overlain by primary halite;also within argillaceous halite with displacive halite.
1881 Argillaceous halite, at exposure surface; within bed with polyhalitic halite.
1883 Argillaceous halite, podular halite; within bed with polyhalitic halite.
1887 Halite, with trace of polyhalite, at exposure surface overlain by primary halite withtrace of clay.
1895 At exposure surface, probably from clay underlying polyhalite (MB 132).
1914.5 Extensive encrustations mainly associated with rock bolts at claystone underpolyhalite (MB 133).
1933 Halite with trace of clay and some polyhalite, under exposure surface overlain byprimary halite.
1940 P Claystone, polyhalitic at base of anhydrite (about 2 ft thick); at major exposuresurface.
1947.5 Argillaceous halite at exposure surface, overlain by primary halite.
1959.5 P Single encrustation in upper third of MB 134 (about 11-ft-thick anhydrite).
Refer to footnotes at end of table.
AU4-95IWPIWIP:R3 192-C C-lO 301681.08

BRINE SAMPLING AND EVALUATION PROGRAM REPORT 1992-1993
Table C·2·1 (Continued)
Air Intake Shaft Observations of Significant Salt Encrustations
APPENDIX C
DepthGeological Relationships or Observations(ft)
1973 Small encrustations at exposure surface; argillaceous halite above and belowsurface. .
1985 P Podular argillaceous halite at exposure surface under anhydrite (MB 135).
1989 Minor encrustations in halite at level of base of secondary pits and pipes.
1995.5 P At exposure surface in argillaceous halite, overlain by halite.
2000,2001 P At secondary exposure surface in argillaceous halite overlying halite.
2012.5 At exposure surface, may come from primary halite just above contact.
2016 Argillaceous halite below exposure surface; overlain by primary halite.
2022 Podular halite, at change from polyhalite and polyhalitic halite to increasing clayupward.
2027 Encrustations around rock bolts at polyhalite-anhydrite transition, upper third of MB136.
2040 At thin anhydrite overlying exposure surface; may also be at contact with overlyingprimary halite.
2076.5 Claystone at exposure surface, overlain by thin anhydrite.
2079.5 P Halitic claystone (also called M-1 in reference stratigraphy for rock mechanicscalculations) at exposure surface.
2084.5 P Halitic claystone (L in reference stratigraphy for rock mechanics calculations) atexposure surface.
2090 Argillaceous halite in podular zone at top secondary exposure surface; overlain byprimary halite.
2094 At secondary exposure surface where podular argillaceous halite overliespolyhalitic halite.
2099 P Top of anhydrite (MB 138), overlain by primary halite.
2099.5 P Argillaceous halite and claystone (K in reference stratigraphy for rock mechanicscalculations) at exposure surface at base of MB 138.
2108 Argillaceous halite in podular zone underlying exposure surface.
2110-11 P At minor exposure surfaces within halite with trace polyhalite.
1Facies designations (e.g., SMPH) are taken from Holt and Powers (1990) "Geologic Mapping.of the AirIntake Shaft at the Waste Isolation Pilot Plant," DOEIWIPP 90-051, U.S. Department of Energy,Carlsbad, New Mexico.2p signifies a photograph is included as a figure in this report.3"Primary halite" refers to halite with observable textures as evidence of subaqueous growth. AllSalado Formation halite is believed to have been deposited during the Permian Age.
AU4-95IWPIWIP:R3 J92·C C-ll 301681.08

BRINE SAMPLING AND EVALUATION PROGRAM REPORT 1992-1993
THIS PAGE INTENTIONj~LLY LEFT BLANK
APPENDIX C
AU4-95IWPIWIP:R3I 92·C C-12 301681.08

BRINE SAMPLING AND EVALUATION PROGRAM REPORT 1992-1993
Figure C-2-1
Composite photograph of MB 103 andencrustations in lower part.
Taken toward south, near 1029ft depth.Note gray claystone in lower third ofphotograph.
APPENDIXC
3016Bl.09.00.00.00/A44 C-13 4/14/95
--;~-.-'

BRINE SAMPLING AND EVALUATION PROGRAM REPORT 1992-1993 APPENDlXC
Figure C-2-2
Photograph ofuppermost Vaca TristeSS Mbr (1340 -1342)with weeps belowhalite cemented zone.
Taken toward south.
Figure C-2-3
Photograph of extensive weeps in lowerVaca Triste SS Mbr.
Taken south side ofshaft.
301661.09.00.00.00/A45 C-14 4/14/95
--------

BRINE SAMPLING AND EVALUATION PROGRAM REPORT 1992-1993 APPENDIXC
Figure C-2-4
Photograph of upperUnion Anhydrite Mbr(about 1530 ft)
Taken toward south,note lack ofweeps.
Figure C-2-4
Small encrustations at theexposure surface overargillaceous halite.
Taken south side ofshaft,about 1672ft.
301681.09.00.00.00/A46 C-15 41495

BRINE SAMPLING AND EVALUATION PROGRAM REPORT I992-1993 APPENDIXC
Figure C-2-6
Photograph ofencrustations atexposure surfaces inargillaceous halite.
Taken toward south,about 1765 -1775ft.
Figure C-2-7
Photograph of smallencrustations in argillaceoushalite at and below exposuresurface at 1825 ft.
Taken south side ofshaft, about1825ft.
Purer halite with primary texturesabove exposure surface shows noencrustations.
301681.09.00.00.00/A47 C-16 4/14/95

BRINE SAMPLING AND EVALUATION PROGRAM REPORT 1992-1993
Figure C-2-8
Photograph of encrustations atpolyhalite at 1844.5 ft.
Taken toward south, about 1844.5 ft.
Note small encrustations from primaryhalite with polyhalite from about 1843 1844ft·
APPENDIXC
Figure C-2-9
Encrustations in claystoneunder MB 131 at 1863 ft.Additional encrustations fromargillaceous halite belowexposure surface.
Taken south side ofshaft, about1863ft·
"Podular» halite textures are wellshown in lower third ofphotograph.
30 J681.09.00.00.001A48 C-17 4/14/95

BRINE SAMPLING AND EVALUATION PROGRAM REPORT 1992-1993 APPENDIXC
Figure C-2-10
Photograph ofencrustations at baseof anhydrite.
Taken toward south,near 1940ft.
Note smallencrustations fromargillaceous haliteunder exposure surface.
Figure C-2-11
Isolated encrustations in MB 134 at about 1960 ftin upper part of unit.
Taken south side ofshaft, about 1960ft.
301681.09.00.oo.00/A49 C-18 4/14/95
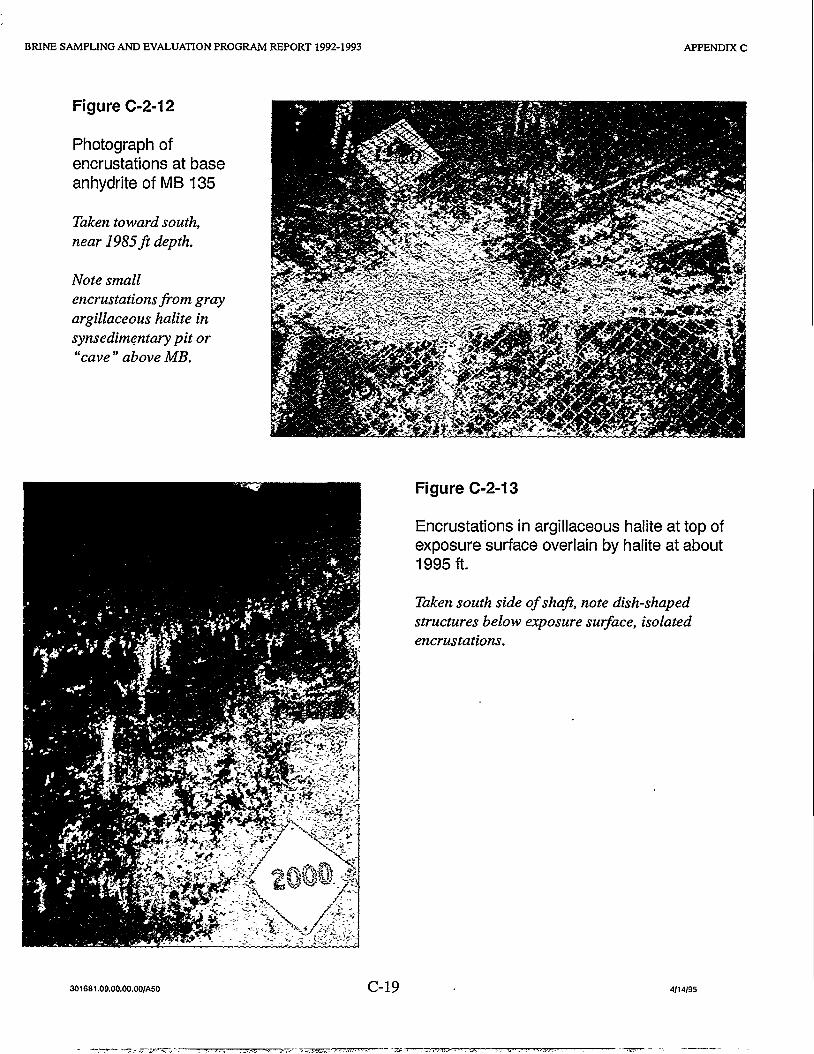
BRINE SAMPLING AND EVALUATION PROGRAM REPORT 1992-1993 APPENDIXC
Figure C-2-12
Photograph ofencrustations at baseanhydrite of MB 135
Taken toward south,near 1985ft depth.
Note smallencrustations from grayargillaceous halite insynsedimt!ntary pit or"cave n above MB.
301691.09.00.00.00/A50 C-19
Figure C-2-13
Encrustations in argillaceous halite at top ofexposure surface overlain by halite at about1995 ft.
Taken south side ofshaft, note dish-shapedstructures below exposure surface, isolatedencrustations.
4/14/95

BRINE SAMPLING AND EVALUATION PROGRAM REPORT 1992-1993 APPENDlXC
Figure C-2-14
Photograph of encrustations atexposure surfaces withclaystones M-1 (above sign) andL (below sign).
Taken toward south, about 2080ft.
Figure C-2-15
Encrustations at claystoneK at exposure surfaceunder MB 138.
Taken south side ofshaft,about 2100ft.
Clay-MB contact aboutmiddle ofphotograph.
301681.09.00.00.00/A51 C-20 4/14/95

BRINE SAMPLING AND EVALUATION PROGRAM REPORT 1992-1993 APPENDlXC
Figure C-2-16
Small encrustationsat exposure surfaceoverlying argillaceoushalite and alongpolyhalitic laminae inhalite.
Taken about 2110ftdepth, south wall.
301681.09.00.00.00/A52 C-21 4/14/95
APPENDIX D
ANALYTICAL RESULTS
PART 1-1992-1993 ANALYTICAL RESULTS FOR SALADO BRINE
PART II-ANALYTICAL RESULTS FOR CULEBRA AND CONSTRUCTION BRINES

THIS PAGE INTENTIONALLY LEFT BLANK

APPENDIX D
ANALYTICAL RESULTS
PART 1-1992-1993 ANALYTICAL RESULTS FOR SALADO BRINE

THIS PAGE INTENTION/ALLY LEFT BLANK

> TABLE D-l l%l
~ ANALYTICAL RESULTS FOR SALADO BRINES is\0
ZVI tIl
Ien
~~ SAMPLE HOLE NUMBER t::
SGb EXT ALKd zCl NUMBER & DIRECTION LAB DATE pHa TOSc TlCe TOCe Br Cl F I N03 NH4 P S04 Q...
(g/cm3) ~\0 (s.u.) (mg/L) (mg/L) (mg/L) (mg/L) (mg/L) (mg/L) (mg/L) (mg/L) (mg/L) (mg/L) (mg/L) (mg/L)':"t:l
~
4037 A1X02 UP UNC 04/16/92 5.8 1.24 394000 897 < 2.5 15 2310 195000 6.8 15.6 0.3 166 < 0.1 21000 G4050 A1X02 UP UNC 08/20/92 3.5 1.23 415000 NA < 2.5 41 6330 259000 < 1 40.7 < 1 356 0.2 36600 ~4038 A3X01 ON UNC 04/16/92 6.1 1.23 374000 1019 4.1 25 1660 188000 6.7 16.2 0.2 175 < 0.1 16100 0z4049 A3X01 ON UNC 08/20/92 6.0 1.23 338000 937 3.0 15 1480 192000 6 13.6 < 1 177 < 0.1 16500 '''1:1
4036 BX01 ON UNC 04/16/92 6.2 1.23 373000 897 2.5 15 1580 190000 5.8 15.5 < 0.2 148 < 0.1 16000 84052 . BX01 ON UNC 08/20/92 6.0 1.22 344000 876 2.5 5 1460 189000 6 13.3 < 1 175 < 0.1 16600 ~4024 OH36 ON UNC 04/16/92 6.2 1.24 375000 848 5.1 36 1560 192000 4.6 24.5 < 0.2 189 < 0.1 16000
~4025 OH36 ON UNC 04/16/92 6.2 1.24 372000 848 5.6 30 1590 193000 4.7 24.2 < 0.2 188 < 0.1 160004026 OH36 ON UNC 04/16/92 6.2 1.24 377000 848 5.1 36 1590 192000 4.8 20.2 < 0.2 164 < 0.1 16000 ~
4048 OH36 ON UNC 08t20/92 6.2 1.23 348000 821 5.6 15 1450 192000 4 15.6 < 1 186 < 0.1 16500 ~4034 OH38 ON UNC 04/16/92 6.3 1.24 372000 958 4.1 61 1540 190000 4.2 21.2 0.2 193 < 0.1 14900 ~
t:1 ....I 4051 OH38 ON UNC 08/20/92 6.2 1.22 357000 931 4•.1 15 1420 194000 4 15.3 < 1 190 < 0.1 15600-.I 4035 OH40 ON UNC 04/16/92 6.4 1.22 365000 1140 6.1 71 1580 186000 4.3 21.8 0.5 184 0.1 15200....
4055 OH40 ON UNC 08/20/92 6.4 1.23 345000 1199 5.1 56 1460 188000 5 15.2 < 1 196 < 0.1 157004033 OH42 ON UNC 04/16/92 6.3 1.25 372000 915 3.6 41 1540 187000 4.4 19.7 0.4 195 < 0.1 148004053 OH42 ON UNC 08/20/92 6.2 1.23 344000 906 3.0 46 1410 189000 4 15.0 < 1 197 0.1 153004021 OH42A ON UNC 04/16/92 6.2 1.24 374000 848 4.1 15 1490 193000 • 4.4 23.2 < 0.2 191 < 0.1 151004022 OH42A ON UNC 04/16/92 6.2 1.24 376000 848 4.6 10 1500 192000 4.2 25.8 < 0.2 214 < 0.1 151004023 OH42A ON UNC 04/16/92 6.2 1.24 373000 842 5.6 15 1510 194000 4.5 2~.8 < 0.2 185 < 0.1 151004054 OH42A ON UNC 08/20/92 6.1 1.23 349000 833 3.0 < 5 1400 190000 4 15.2 < 1 215 < 0.1 153004030 OHP402A ON UNC 04/16/92 .6.1 1.24 378000 763 3.6 10 1690 192000 6.4 14.5 0.3 150 < 0.1 167004031 OHP402A ON UNC 04/16/92 6.1 1.24 381000 787 3.6 15 1670 193000 6.3 14.3 < 0.2 142 < 0.1 166004032 OHP402A ON UNC 04/16/92 6.1 1.25 380000 787 2.5 10 1690 192000 6.2 14.5 0.2 138 < 0.1 166004047 OHP402A ON UNC 08/20/92 6.0 1.23 339QOO 730 7.1 15 1540 192000 7 12.0 < 1 175 < 0.1 174004027 GSEEP ON UNC 04/16/92 6.3 1.24 374000 946 3.0 < 5 1520 186000 3.2 21.9 < 0.2 205 < 0.1 267004028 GSEEP ON UNC 04/16/92 6.3 1.24 373000 958 2.5 < 5 1520 186000 3.0 20.7 0.3 197 < 0.1 26700
a s.u. = standard units
.... b Specific Gravity ~0 c Total Oisolved Solids ~0:00
d Extended Alkalinity measured to an endpoint pH of 2.5 and reported as equivalent bicarbonate (HC03).t:l...~(:,
00 e TIC (Total Inorganic Carbon) and TOC (Total Organic Carbon) are reported as equivalent bicarbonate. t:l
NA Not available.ON DownHZ Horizontal

> TABLE D-1 ttl
S ANALYTICAL RESULTS FOR SALADO BRINES l!:!.0 ZVI
tTl
I '"~
::!:1 SAMPLE HOLE NUMBER CHARGE Cz~ NUMBER & OIRECTlON LAB OATE Al As B Ba Ca Cs Fe K Mg Mn Na Rb Si Sr BALANCE G'l
:D (mg/L) (mg/L) (mg/L) (mg/L) (mg/L) (mg/L) (mg/L) (mg/L) (mg/L) (mg/L) (mg/L) (mg/L) (mg/L) (mg/L) (percent) ~t;-' t:lt:l
~4037 A1X02 UP UNC 04/16/92 < 0.05 0.01 1700 0.053 252 0.379 < 0.50 15700 35000 4.69 63000 18.5 1.29 5.77 NA E4050 A1X02 UP UNC 08/20/92 0.3 0.02 4590 0.026 27 0.566 0.56 13800 86000 5.27 8300 14.9 3.37 < 0.1 NA ~4038 A3X01 ON UNC 04/16/92 < 0.05 < 0.001 1590 0.081 249 0.368 < 0.50 16200 24000 1.51 78000 16.2 1.60 1.75 NA 0
Z4049 A3X01 ON UNC 08/20/92 < 0.05 0.002 1600 0.061 245 0.368 < 0.50 16100 23200 1.45 78000 15.5 1.07 1.76 NA 'd
4036 BX01 ON UNC 04/16/92 < 0.05 0.001 1560 0.074 256 0.336 < 0.50 16200 22700 1.25 80000 15.2 1.22 1.80 NA ~G'l
4052 BX01 ON UNC 08/20/92 0.06 0.002 1570 0.067 241 0.356 < 0.50 16100 22200 1.31 78000 15.3 0.76 1.79 NA ~4024 OH36 ON UNC 04/16/92 < 0.05 0.003 1680 0.14 296 0.285 < 0.50 18300 18400 1.12 83000 14.6 1.91 1.22 NA ~4025 OH36 ON UNC 04/16/92 < 0.05 0.003 1670 0.123 .301 0.29 < 0.50 18800 18900 1.12 84000 14.3 1.83 1.28 NA ~
4026 OH36 ON UNC 04/16/92 < 0.05 0.003 1660 0.064 294 0.281 < 0.50 18200 19300 1.09 85000 14.2 1.88 1.20 NA ~
4048 OH36 ON UNC 08/20/92 0.06 0.009 1650 0.095 286 0.295 1.67 17700 18700 1.09 86000 14.1 1.70 1.21 NA ~t;-'
4034 OH38 ON UNC 04/16/92 < 0.05 < 0.001 1610 0.039 305 0.267 < 0.50 18000 18300 0.94 86000 14.0 2.45 0.77 NA :D0 '"4051 OH38 ON UNC 08/20/92 < 0.05 < 0.001 1630 0.06 277 .0.283 < 0.50 17700 18300 0.97 85000 13.9 1.48 0.74 NA '"I......I 4035 OH40 ON UNC 04/16/92 < 0.05 0.002 1600 0.087 302 0.259 < 0.50 18900 18200 1.72 84000 13.8 2.34 0.96 NAIV
1,055 OH40 ON UNC 08/29/92 < 0.05 0.001 1640 0.056 270 0.270 < 0.50 18200 18300 3.14 84000 14.0 1.69 0.84 NA
4033 OH42 ON UNC 04/16/92 < 0.05 0.004 1600 0.055 302 0.256 < 0.50 18300 17800 1.07 85000 13.5 1.82 0.84 NA
4053 OH42 ON UNC 08/20/92 0.08 0.006 1630 0.056 294 0.259 < 0.50 18100 17500 1.12 86000 13.5 1.42 0.80 NA
4021 OH42A ON UNC 04/1(1/92 <. 0.05 0.004 1620 0.058 294 0.253 < 0.50 18700 17700 1.00 88000 13.7 2.21 0.75 NA
4022 OH42A ON UNC 04/16/92 < 0.05 0.004 1630 0.046 291 0.253 < 0.50 19100 17900 0.96 88000 13.2 2.21 0.75 NA
4023 OH42A ON UNC 04/16/92 < 0.05 0.004 1620 0.057 296 0.253 < 0.50 19100 17800 0.97 87000 13.7 2.12 0.75 NA
4054 OH42A ON UNC 08/20/92 0.06 0.004 1540 0.056 273 0.251 < 0.50 17000 17000 0.98 84000 12.9 1.57 0.75 NA
4030 OHP402A ON UNC 04/16/92 < 0.05 < 0.001 1370 0.065 294 0.368 67.5 14900 24600 2.56 75000 15.5 0.50 2.70 NA
4031 OHP402A ON UNC 04/16/92 < 0.05 < 0.001 1380 0.056 280 0.363 21.4 15000 25400 2.18 77000 15.8 < 0.5 2.44 NA
4032 OHP402A ON UNC 04/16/92 < 0.05 < 0.001 1390 0.08 283 0.352 14.0 15000 25200 2.10 77000 15.3 < 0.5 2.49 NA
4047 OHP402A ON UNC 08/20/92 < 0.05 0.002 1540 0.155 270 0.371 >99 14800 26900 3.10 79000 15.1 < 0.5 2.47 NA
4027 GSEEP ON UNC 04/16/92 < 0.05 0.006 1720 0.061 249 0.215 < 0.50 14300 15100 0.64 96000 12.2 1.25 1.96 NA
4028 GSEEP ON UNC 04/16/92 < 0.05 0.007 1750 0.074 260 0.217 < 0.50 14500 15000 0.64 94000 12.2 1.22 2.24 NA
4029 GSEEP ON UNC 04/16/92 < 0.05 0.006 1710 0.031 251 0.223 < 0.50 14800 15200 0.63 95000 12.3 1.35 1.96 NA
'"~'d
8 !;£'"00 NA Not available. t:l- ~000 t:l

> TABLE D-1 l:l:l
~ ANALYTICAL RESULTS FOR SALADO BRINES isz'" ttlV\
Ien
~4029 GSEEP DN UNC 04/16/92 6.3 1.24 373000 946 3.0 5 1520 185000 3.3 19.8 0.2 178 < 0.1 26500 t::
~ z(g SAMPLE HOLE NUMBER 0
:0 NUMBER & DIRECTION LAB DATE pHa SGb TDSc EXT ALKd TICe TOCe Br Cl F I N03 NH4 P S04 ~'l" t1I:l (s.u.) (g/cm3) (mg/L) (mg/L) (mg/L) (mg/L) (mg/L) (mg/L) (mg/L) (mg/L) (mg/L) (mg/L) (mg/L) (mg/L) !;2
359000 < 58
4046 GSEEP DN UNC 08/20/92 6.3 1.24 943 < 2.5 1410 184000 4 17.0 < 1 199 < 0.1 26900 ~4039 OH20 HZ UNC 04/16/92 6.0 1.23 385000 656 3.6 56 1500 193000 4.8 15.1 1.2 131 < 0.1 17100 0
4z
4058 OH20 HZ UNC 08/20/92 5.9 1.22 354000 675 3.0 56 1480 188000 13.3 < 1 175 < 0.1 16500 "tI
4044 OH22 HZ UNC 04/16/92 6.3 1.23 371000 946 5.1 81 1570 188000 4.1 15.7 0.3 150 0.2 15400 84040 OH23 HZ UNC 04/16/92 6.0 1.22 371000 614 3.0 41 1530 190000 5.2 15.2 1.1 135 < 0.1 16400 ~4056 OH23 HZ UNC 08/20/92 5.9 1.22 335000 597 < 2.5 36 1460 185000 4 13.0 < 1 170 < 0.1 15800 ~4045 OH24 HZ UNC 04/16/92 6.3 1.23 376000 909 4.6 86 1610 190000 4.7 16.3 0.5 175 0.4 16000 C34041 OH26 HZ UNC 04/16/92 6.1 1.23 379000 681 2.5 66 1530 189000 4.8 15.2 0.9 136 0.1 16100 ~
4057 OH26 HZ UNC 08/20/92 6.0 1.22 340000 687 < 2.5 61 1480 186000 4 13.5 < 1 180 0.1 15800 ~4059 OH28 DN UNC 08/20/92 6.0 1.22 335000 760 10.2 97 1470 188000 5 14.3 < 1 168 0.7 16300 :g
t;l 4042 OH45 HZ UNC 04/16/92 6.3 1.23 372000 946 6.6 91 1650 188000 4.8 15.8 0.6 150 < 0.1 16000 '"..L.I 4043 OH46 DN UNC 04/16/92 6.3 1.23 364000 946 6.1 36 1640 188000 4.7 15.8 < 0.2 149 < 0.1 15000w
4060 OH46 DN UNC 08/20/92 6.1 1.22 339000 1016 4.6 30 1600 188000 5 14.4 < 1 182 < 0.1 16000
'"o0:00
o00
a s.u. = standard unitsb Specific Gravityc Total Disolved Solidsd Extended Alkalinity measured to an endpoint pH of 2.5 and reported as equivalent bicarbonate (HCOJ).e TIC (Total Inorganic Carbon) and TOC (Total Organic Carbon) are reported as equivalent bicarbonate.NA Not available.DN DownHZ Horizontal
~~I:l

S TABLE D-1 III
ANALYTICAL RESULTS FOR SALADO BRINES i'!l.0 Z
'"ttl
Ien
~SAMPLE HOLE NUMBER CHARGE t:
~ ziil NUMBER & DIRECTION LAB DATE Al As B Ba Ca Cs Fe K H9 Mn Na Rb Si Sr BALANCE Cl
~ (mg/L) (mg/L) (mg/L) (mg/L) (mg/L) (mg/L) (mg/L) (mg/L) (mg/L) ,(mg/L) (mg/L) (mg/L) (mg/L) (mg/L) (percent) ~tv tltl
I4046 GSEEP ON UNC 08/20/92 < 0.05 0.006 1800 0.045 245 0.235 < 0.50 14500 15700 0.71 97000 12.3 0.93 2.01 NA4039 OH20 HZ UNC 04/16/92 < 0.05 0.002 1480 0.03 336 0.281 < 0.50 15600 21600 1.87 82000 15.1 1.43 1.54 NA4058 OH20 HZ UNC 08/20/92 0.07 0.002 1420 0.095 267 0.281 < 0.50 14800 21400 2.11 78000 14.3 1.88 0.98 NA 0z4044 OH22 HZ UNC 04/16/92 < 0.05 0.002 1510 0.1 291 0.298 1.16 16200 21400 1.58 78000 15.3 2.96 0.95 NA '""~4040 OH23 HZ UNC 04/16/92 0.06 0.002 1470 0.045 279 0.285 < 0.50 15400 21900 1.73 80000 15.3 1.54 0.89 NA Cl
4056 OH23 HZ UNC 08/20/92 0.13 0.002 1490 0.06 270 0.288 < 0.50 15400 21300 1.70 80000 14.8 0.94 0.87 NA ~4045 OH24 HZ UNC 04/16/92 < 0.05 0.003 1510 0.062 294 0.291 < 0.50 15900 22300 1.85 80000 15.0 2.96 0.97 NA fg
4041 OH26 HZ UNC 04/16/92 < 0.05 < 0.001 1460 0.061 276 0.290 < 0.50 15500 22200 1.70 80000 14.9 1.32 0.83 NA (3~
4057 OH26 HZ UNC 08/20/92 0.18 0.001 1470 0.051 261 0.294 < 0.50 15000 21600 1.67 79000 14.8 0.75 0.79 NA
~4059 OH28 ON UNC 08/20/92 0.12 0.002 1520 0.061 314 0.291 1.22 15700 21500 1.79 80000 14.8 1.01 1.36 NA4042 OH45 HZ UNC 04/16/92 0.2 0.002 1460 0.116 286 0.272 < 0.50 16400 21000 1.54 71000 15.0 1.40 2.12 NA :g
C! ...I 4043 OH46 ON UNC 04/16/92 < 0.05 < 0.001 1520 0.037 277 .0.286 < 0.50 16100 20800 1.31 79000 14.9 1.09 1.69 NA......
J,. 4060 OH46 ON UNC 08/20/92 0.09 0.001 1590 0.088 264 0.308 < 0.50 20000 21500 1.47 79000 15.3 0.73 0.98 NA
...:='"~(:,00
NA Not available.~~tl

APPENDIX D
ANALYTICAL RESULTS
PART 11- ANALYTICAL RESULTS FOR CULEBRA AND CONSTRUCTION BRINES

THIS PAGE INTENTIONALLY LEFT BLANK

TABLE D-2S ANALYTICAL RESULTS FOR CULEBRA AND CONSTRUCTION BRINES txJ
~Z... ['1'1... III
I >i!:...,
SAMPLE HOLE NUMBER C;:l:1 pHa SGb TDSc EXT ALKd TlCe TOCe Br Cl F I N03 NH4 P S04 zNUMBER & DIRECTION LAB DATE Cl~ (s.u.) (g/cm3) (mg/L) (mg/L) (mg/L) (mg/L) (mg/L) (mg/L) (mg/L) (mg/L) (mg/L) (mg/L) (mg/L) (mg/L) ~~ tltl ~
1062 AIS CLBRA UNC 03/03/90 8.1 1.04 48000 113 72.6 10 28 20600 0.7 0.2 0.1 0.34 < 0.1 8230 80482 AIS SUMP UNC 07/29/88 7.1 1.21 330000 122 94.0 10 37 190000 4 < 0.1 5 4.3 < 1 6150 >07/29/88 7.1 1.21 333000 116 94.5 5 44 188000 < 1 < 0.1 6 4.0 < 1 6180 ::l0484 AIS SUMP UNC 0z
0486 AIS SUMP UNC 07/29/88 7.1 1.21 333000 128 91.9 30 44 187000 < 1 < 0.1 6 4.5 < 1 6170 ...,0747 AIS SUMP UNC 04/06/89 8.2 1.06 96000 122 77.7 20 35 50700 1.4 0.2 < 1 0.33 < 0.1 7750 80748 AIS SUMP UNC 04/26/89 7.4 1.20 331000 177 112.8 91 90 187000 < 1 0.2 ,10 3.23 < 0.1 10700 ~
i!:0738 B&E BRINE UNC 03/14/89 6.6 1.21 324000 201 201 5 26 187000 ' 6 1.6 5 0.39 < 0.3 3610
~0740 B&E BRINE UNC 03/14/89 6.5 1.22 324000 188 191 51 19 187000 2 1.4 4 0.26 < 0.3 35900742 B&E BRINE UNC 03/14/89 6.8 1.22 324000 183 179 36 23 187000 < 1 1.4 4 0.28 < 0.3 3590 C1
:g':":0'"0IN
I..... SAMPLE HOLE NUMBER CHARGE.....I- NUMBER & DIRECTION LAB DATE Al As B Ba Ca Cs Fe K Mg Mn Na Rb Si Sr BALANCE
(mg/L) (mg/L) (mg/L) (mg/L) (mg/L) (mg/L) (mg/L) (mg/L) (mg/L) (mg/L) (mg/L) (mg/L) (mg/L) (mg/L) (percent)
1062 AIS CLBRA UNC 03/03/90 < 0.05 < 0.001 35 0.027 822 NA 0.51 376 568 < 0.5 15800 NA 3.84 10.72 1.950482 AIS SUMP UNC 07/29/88 0.167 0.002 13 0.236 950 o NA 0.13 1720 1040 0.39 118000 NA 3.32 30.7 -1.670484 AIS SUMP UNC 07/29/88 0.163 0.002 12 0.239 950 NA 0.12 1720 1040 0.39 118000 NA 3.33 30.5 -1.160486 AIS SUMP UNC 07/29/88 0.169 0.002 13 0.215 960 NA 0.12 1720 1040 0.4 118000 NA 3.26 30.5 -0.890747 AIS SUMP UNC 04/06/89 1.35 0.002 30 0.069 989 < 0.01 0.98 496 629 0.18 32600 NA 8.19 13.9 -1.990748 AIS SUMP UNC 04/26/89 2.41 0.002 31 0.196 669 0.021 1.42 3210 1630 < 0.1 121000 NA 8.56 33.4 0.100738 B&E BRINE UNC 03/14/89 < 0.05 0.004 2 0.106 1550 0.054 < 0.5 11 43 < 0.1 120000 NA 49.3 23.8 -0.500740 B&E BRINE UNC 03/14/89 < 0.05 0.003 2 0.104 1500 0.01 < 0.5 11 44 < 0.1 119000 NA 50.3 23.6 -0.920742 B&E BRINE UNC 03/14/89 < 0.05 0.003 1 0.112 1520 0.005 < 0.5 11 42 < 0.1 121000 NA 49.9 23.9 -0.09
IN
~000
<:>00
a s.u. =standard unitsb of' G °Spec) )c rav) tyc Total Disolved Solidsd Extended Alkalinity measured to an endpoint pit of 2.5 and reported as equivalent bicarbonate (HC03).e TIC and TOC are reported as equivalent bicarbonate.NA Not available.
~...,~tlXC

THIS PAGE INTENTIONALLY LEFT BLANK

APPENDIX E
HYDROLOGIC TESTING OF THE FRACTURED PARTOF THE DISTURBED ROCK ZONE
BENEATH THE WIPP EXCAVATIONS

BRINE SAMPLING AND EVALUATION PROGRAM REPORT 1992-1993
THIS PAGE INTENTIONJt\LLY LEFT BLANK
AU04-95IWPIW1P:R3192-E
APPENDIX E
301681.008

BRINE SAMPLING AND EVALUATION PROGRAM REPORT 1992·1993 APPENDIX E
Table of Contents _
El.O
E2.0
E3.0
E4.0
E5.0
E6.0
E7.0
Introduction E-I. .Description of the Test Areas E-2
E2.1 Test Site Locations E-2
E2. 1. I S90 Near the AIS Test Site E-4
E2.1.2 EO at N620 Test Site E-4
E2.1.3 W170 at the Underground Core Storage Library Test Site E-8
E2.2 Test Hole Configurations E-8
Preparatory Activities E-lO
E3.1 Drilling of Test Boreholes . . . . . . . . . . . . . . . . . . . . . . . . . . . . . . . . . . . E-lO
E3.2 Equipment Installation E-IO
E3.3 Geologic and Drilling Logs E-12
E3.4 Scratcher Rod Survey E-12
E3.5 Hole Depths E-12
Observations and Test Site Conditions E-14
E4.1 EO Test Site .Prior to the Initial Pumping Test . . . . . . . . . . . . . . . . . . . . . E-15
E4.2 Wl70/Core Library Test Site E-19
E4.3 EO Test Site Prior to the Retest at This Site E-23
Hydrologic Testing and Data Collection. . . . . . . . . . . . . . . . . . . . . . . . . . . . . . E-24
E5.1 Initial Pumping Drawdown Test at the EO Drift Site E-29
E5.1.1 Test Performance and Results E-32
E5.1.2 Pumping Test Analysis E-34
E5.2 Initial Pump Test at the Core Storage Library (W170) Site E-41
E5.3.1 Test Performance and Results E-50
E5.4 Geologic Logging of Cores . . . . . . . . . . . . . . . . . . . . . . . . . . . . . . . . . . E-53
Summary and Recommendations E-55
References ". E-58
AU().I·95IWPIWIP:R3192·E 301681.008

BRINE SAMPLING AND EVALUATION PROGRAM REPORT 1992·1993
THIS PAGE INTENTIONJ~LLY LEFT BLANK
•
APPENDIX E
AU04·95IWP/WIP:R3192-E 11 301681.008

BRINE SAMPLING AND EVALUATION PROGRAM REPORT 1992·1993
APPENDIX E
APPENDIX E
E1.0 Introduction _The main objective of the hydrologic testing of the fractured part of the disturbed rock zone
(DRZ) beneath the Waste Isolation Pilot Plant (WIPP) Excavations Program is to characterize
the fracture system beneath the floor of the repository. The data resulting from this program
will be used by Waste Isolation Division personnel to develop operational plans for predicting
brine and gas movement through the fracture system. Additionally, the data obtained may be
useful in refining the design of seals to be used within the repository and in assessing the
long-term behavior of flow through the fractured zone. .....
As salt creeps into the WIPP underground excavations, macrofractures develop in the DRZ
beneath the excavations (Bechtel, 1986; see also review by Deal and Roggenthen, 1991). The
fractures tend to concentrate in but are not limited to Marker Bed (MB) 139, which is about
3 feet (ft) (l meter [m]) thick and lies 3 to 6 ft (l to 2 m) below the floor of most of the
WIPP excavations. The developing fracture systems may provide pathways for rapid
movement of brine and gas (Deal and Case 1987; Deal and others, 1989; Deal and others,
1991) and are considered to be one of the most likely pathways for migration of constituents
of concern (COC) away from the waste storage panels. The hydrologic characteristics of the
fractured zone must be understood to predict and, if necessary, modify the movement of
fluids and COCs within MB 139 if a release occurred during operation of the facility.
In 1989, a hydraulic test of short duration was conducted in the DRZ beneath the floor of the
intersection of the 890 and W620 drifts (Deal and others, 1991). The results indicated that
drawdown-type pump testing in the underlying fracture system could be performed
successfully and could yield useful hydrologic data about the DRZ. After evaluating the
results from the preliminary testing effort, a more comprehensive field testing program was
developed, and hydraulic testing was implemented at two additional underground test sites.
This report presents the results of short-duration hydraulic tests conducted at the two
additional sites and provides recommendations for further field data collection.
AU04-95IWPIWIP:R3192-E E-1
--~----
301681.008

BRINE SAMPLING AND EVALUATION PROGRAM REPORT 1992-1993 APPENDIX E
E2.0 Description of the Test Area'S _The Salado Formation is predominantly halite, consisting of alternating sequences of halite,
argillaceous halite, polyhalitic halite, clay partings 0.40- to 1.2-inches (in.)- (1- to
3-centimeters [cm]-) thick clay layers, and thin anhydrite beds as numerous horizontal
discontinuities. Anhydrite beds ranging from a few millimeters to about 3.3 ft (1 m) in
thickness are brittle at repository depths. As the salt deforms, the contrast in ductility
between the salt and the anhydrite causes preferential fracturing in the brittle anhydrite. MB
139, approximately 3.3 ft (1 m) thick, is located 6.6 ft (2 m) beneath the floor of the
excavations and shows how local variation in stratigraphy influences macrofracture
development. The dish-shaped fractures that normally de.velop beneath the floor of excavated
rooms are distorted and tend to flatten near the room center (Figure E-2-1). Although the
fractures concentrate within the, anhydrite, especially beneath the center of drifts or rooms,
they also cut the halite and other units (Bechtel, 1986). Air-filled fractures up to 5.9 in. (15
cm) wide have developed two to five years after excavation (Bechtel, 1986). Five years after
excavation, the largest observed separation is about 9 in. (23 cm) wide.
Some subhorizontal fracturing has been noted just above clay E, at the base of MB 139,
approximately 6.6 ft (2 m) below the floor of the excavations, but no separations at
clay E were noted (Bechtel, 1986). This may be the result of creeping salt that deformed
upward and pushed against the anhydrite to keep the clay confined.
Near the edges of rooms and drifts, fracturing tends to concentrate in the walls or salt above
MB 139 (Figure E-2-1). Eventually fracturing will extend into the salt below MB 139. The
zone of macrofractures was expected to extend about 6.6 ft (2 m) below the floor of the
excavation at this location and to extend laterally a lesser distance into the bedrock beyond
the edges of the rooms. In map view, the fractured zone under investigation is expected to
follow the plan of the underground excavations closely.
E2.1 Test Site Locations
The hydrologic testing areas were selected to evaluate various room and drift dimensions,
excavation ages, areas where water was introduced for construction purposes, and areas
isolated from construction fluids. Three sites were selected for drilling and testing as part of
this program.
AUO-t-95/WPIWIP:R3192-E E-2 301681008

301681.009.00.00CMld Al01/26/95
Cl2:ffi~Ca~otTl
~E~oZ"0
8~~~
~~
ClayG
+-1-----
Anhydrite ub"
SpallingAlong Rib
':::: Marker Bed 139 and Clay E
, Fractures • "'
Waste Storage Room
Fill
'"
Tensile FracturesCaused by Bolting
Bed Separation '"
•
I,I
tTlI
W
Figure E-2-1Idealized Cross Section of Fracturing Around a 4 m-High, 10m-Wide Waste Storage Room at the WIPP
~
~~tTl

BRINE SAMPLING AND EVALUATION PROGRAM REPORT 1992-1993 APPENDIX E
• Test Site No.1 is at the intersection of the S90 and W620 drifts near the AirIntake Shaft (ArS). This site consists of 10 test holes drilled at the intersectionand along the length of the S90 drift (Figure E-2-2). This test site was notaccessible, during the field investigation period and is shown as the firsthydrologic test site on the map in Figure E-2-2.
• Test Site No.2 is located in the EO drift in the general area of N620. The siteincludes nine test holes drilled along the EO drift (Figure E-2-2).
• Test Site No.3 is located in the W170 drift immediately in front of theunderground core storage room. This site consists of 11 test holes drilled alongthe W170 drift and into the core library (Figure E-2-2).
E2. 1. 1 S90 Near the AIS Test SiteTest Site No.1 in the S90 drift near the AIS was scheduled to be the third and final location
tested for this program. However, hydrologic testing at this site was impossible because of
the presence of an electrical substation located in the center of the intersection and electrical
transformers located in an adjacent alcove. The position of the electrical equipment covered
several of the test holes at this site, making testing impossible. The scope of the field
program was revised when it was determined that the electrical equipment could not be
moved within the time frame required to meet field-testing program objectives. The final
field test was moved from the S90 site to the initial site in the EO drift to retest this location.
Therefore, the S90 test site will not be discussed in detail. Table E-2-1 lists the test hole
number, the location, and the date drilling was completed for the test holes drilled as part of
this field program.
E2.1.2 EO at N620 Test Site
This hydrologic test site is located in the EO drift, directly in front of the N620 alcove. The
site was selected because the EO drift is a very old, wide drift where open brine-filled
fractures have been observed beneath the drift floor. Fracturing beneath the drifts develop•
over time, and they develop fastest beneath the widest drifts.
This site also was easily accessed and offered an existing electrical supply and an area within
the N620 alcove to set up instrumentation and store equipment. Figure E-2-3 shows the
layout of the EO test site.
AU().l-95IWP/WIP:R3192-E E-4 301681008

Figure E-2-2Map of Underground Test Locations
~S<lTl
tIl
'"~~c~~o
~E~~
~o
~~::1~§
WasloTesVDisposalAloa
~
c=J Exlsllng Excavallon
f_-_- -_-J PlaMod Exmwtion
301681009.00.000/lldAll1/26/95
JI ~SaJtHardongShaft
- -. -- ..............- ........... GcoCcc:tncaIhN
~
.......
A1t1od<
"
,/
'\.
/
/
/
I
400 800 FEET~
100 200 METERS
o,o
Pon~ 8 [oii-rjoijJJeJlit1JtiTIoDoool Ponoll
,-::::::::::::'J000_- ,';I-'-'r!-' ;1'- -'!' '-1-1-'-1"Panel7:1 IIIII H(.I Illl .1 11 .11 1.IIIIIIlPanol211_ , __ 1_ 1_ .'_JLJ -'L. _. L, _, _, __'.
Fut...o -----------r...-lrlr 'r----------------Dpe<ollons .-------....----_.J._J._ Jl •
Ir' -, -, -'i -, q '--;l[ ,,-' I' ,- ,- r ,- I' Ipan~61IJ!Y.J lJ IJ IJ U_J _ JL! II UUdUUIPonol3-------------...-..iJi , ..--------------..f-'-----------_JL L JL .
./ • rl -I -1 -I -I rl r-~r,r ,r-1 !' ,- 1- ,- ,- I' ·Po1lol5! uUUUU ULJLJL JLJ J L! L! L! UU! Panol4
/ .. -_____ --- 4
,/
fl""','II
41\l.ttJ
---- -
"
- -""
\.\.
\.\.
\
\\\\
\IIII/
//
// ,/
/ ,/,/
/ /
///7
//,/
- -.......
,/
.......
,/
N
.......
--
-:::::..
EXPLODED VIEW
---- - --
-'-
o
D'"DoD: ~~.:~D~
~~DDDDODDDD
---,/
/,/
,/
//
//
//
/
/
/
II
mlI
VII
\\\\\
\ Test Site 3
\ (yoJ-170/Core UbraryTest Site)
\\.
\.\.
" " " ..............
.......

BRINE SAMPLING AND EVALUATION PROGRAM REPORT 1992-1993
Table E-2··1
Test Holes Drilled as Part of theHydrologic Testing of the Fractured Zone
APPENDIX E
I Hole Number I Date Drilled I Hole Location IOH49 1-5-90 W620/S90
OH50 1-9-90 W620/S90
OH51 1-5-90 W620/S90
OH52 1-9-90 W620/S90
OH53 1-11-90 W620/S90
OH54 1-11-90 W620/S90
OH55 1-11-90 W620/S90
OH56 1-16-90 W620/S90
OH57 1-10-90 W620/S90
OH58 1-16-90 W620/S90
OH59 10-19-92 W170/Core Library
OH60 10-19-92 W170/Core Library
OH61 10/19/92 W170/Core Library
OH62 1-24-90 W170/Core Library
OH63 1-19-90 W170/Core Library
OH64 1-23-90 W170/Core Library
OH65 1-23-90 W170/Core Library
OH66 1-18-90 W170/Core Library
OH67 1-22-90 W170/Core Library
OH68 1-19-90 W170/Core Library
OH69 1-17-90 W170/Core Library
OH70 1-29-90 EO/N620
OH71 1-31-90 EO/N620
OH72 1-31-90 EO/N620
OH73 1-31-90 EO/N620
OH74 1-29-90 EO/N620
OH75 1-29-90 EO/N620
OH76 1-31-90 EO/N620
OH77 1-31-90 EO/N620
OH78 1-29-90 EO/N620
AU04-95/WPIWIP:R3192-E E-6 30168100S

BRINE SAMPUNG AND EVALUATION PROGRAM REPORT 1992·1993
N
• Test Hole Location
Figure not to Scale
OH70
N620
OH77
•OH71
oW
APPENDIXE
Figure E-2-3Layout of Test Site No.2
the EO Drift in Front of N620,Holes OH70 through OH78
E-7

BRINE SAMPLING AND EVALUATION PROGRAM REPORT 1992-1993 APPENDIX E
E2.1.3 W170 at the Underground Core Storage Library Test SiteThe third test location is in the W170 drift in front of the underground core library. To best
determine the development of the fracture-related transmissivity with time, this site was
selected to initiate an investigation of a wide, new drift in the floor before significant
fracturing develops. The underground core storage area is a 25-ft-wide, relatively new
excavation mined in May 1989 and is in a low-traffic area. The W170 drift adjacent to the
core library is approximately five years older than the storage room and was expected to
exhibit a well-developed fracture system beneath it. In addition, the W170 drift has been
exposed to a long period of water spreading to control dust and to assist in roadbed
consolidation. The objectives for this site are to test the fracture systems in the W 170 drift
and to monitor the development of fracturing beneath the core storage area. A series of
boreholes were drilled in the core storage area to evaluate the potential hydraulic connection
of the fracture systems within W170 and the core library. A future objective will be to
monitor the development of fractured-zone hydraulic characteristics beneath the core library
area by periodic retesting.
The site also offered electrical power, equipment storage areas, and convenient and safe
access to the test holes. Figure E-2-4 shows the configuration of the W170 test site.
E2.2 Test Hole Configurations
The test locations represent areas with fracture zones that appear to be locally saturated with
brine and exhibit some degree of interconnected fracturing. Test holes were installed at each. .site in a pattern designed to intercept separate fracture systems. At each site, holes were
drilled along the length of the drift, as well as perpendicularly to the drift center line. Test
holes were also emplaced as close to the drift wall (rib) as possible at both test sites
(Figure E-2-3 and E-2-4). Placement of holes in this manner allowed the drawdown response
produced by pumping one hole to be observed in multiple directions, potentially identifying
individual fracture systems.
AU04-95IWPIWIP:R3192-E E-8 301681.008

BRINE SAMPUNG AND EVALUATION PROGRAM REPORT 1992-1993 APPENDIXE
oooo
0)
~"---'"i""'~"""'__---"'r""'~----1"" ----1""~~.o
5400
Test holelocation
•
Figure not to scale
Figure E-2-4Layout of Test Site NO.3 at the Intersection of 5400 and W170 Drifts
(Underground Core Library)Holes OH59 through OH69
E-9
--- - --- -~---------~

BRINE SAMPLING AND EVALUATION PROGRAM REPORT 1992-1993 APPENDIX E
E3.0 Preparatory Activities _The following preparatory activities were performed prior to the pumping drawdown tests:
• Drilling boreholes• Blowing out boreholes to clear out muck• Installing equipment• Surveying hole locations• Core logging• Driller logging• Scratcher rod surveying• Measuring fluid levels• Measuring hole depths• Observing the condition of the holes.
E3.1 Drilling of Test BoreholesBoreholes were drilled at three separate test sites in the WIPP underground workings
(Figure E-2-2). All holes were cored vertically downward to a depth of approximately I ft
(0.30 m) beneath the base of MB 139 and are 4 in. (10.2 cm) in diameter. The holes were all
drilled with air, and great care was taken to not introduce foreign fluids into the test holes.
As mentioned previously, Test Site No.1 was not used because ,of the presence of temporary
electrical equipment in the drift.
E3.2 Equipment InstallationTest holes were instrumented with pressure transducers (Geokon Model 4500-H) before the
pumping began, during the pumping test, and after the pumping was completed. In addition,
a transducer was placed in open air to detect underground air pressure changes that may
influence measured pressure in the holes. Before data were collected, the transducers were
zeroed for atmospheric pressure using a Geokon 401. All transducers were connected to a
junction box, with a single line connecting the junction box to a Geokon CR-lO remote
datalogger that stores data obtained from the transducers (Figure E-3-1). A computer cable
connected the datalogger to a laptop computer (Toshiba Model 1200) for downloading
information and for storage of data on magnetic disk.
A Bennett model air-driven piston pump was used for all tests. This type of pump allows a
user-controlled discharge rate from 1.0 to 50 gallons (gal) per hour (gph) (3.8 to 189 liters per
hour [Lph]). This pump is capable of very low discharge rates and uses compressed air
supplied by a portable air compressor. The pump was lowered into a designated test hole,
AU04-95/WP/WIP:R3192-E E-lO 301681.008

tT1I..........
LaptopComputer
tD, F~
JunctionBox
301681.009 oo.OOOIIfd A141/26/95
I-I~H- WaterLevel
OJ
'"~~ca~c
~~oz
~Cl
~
~?:j
~~
Transducer -t I I. BennettPump
Not to Scale
Figure E-3-1Typical Pump Test Equipment Setup
Borehole »'"0'"0
~><l'I1

BRINE SAMPLING AND EVALVAnON PROGRAM REPORT 1992-1993 APPENDIX E
and the water level was allowed to reach equilibrium. The flow rate was measured by
pumping the brine into a 1 gal (3.78 L) bucket while measuring the time required to fill the
bucket. The bucket of brine was then dumped into a 250-gal (945 L) storage tank.
E3.3 Geologic and Drilling LogsGeological logs were prepared for each core. Cores were logged in accordance with WIPP
Procedure WP 07-502, "Geologic Rock Coring Logging," (Westinghouse, 1987). In addition
to the geological logs, core drilling depth logs were prepared for correlation between the
holes.
E3.4 Scratcher Rod SurveyAs part of ongoing investigations, Geotechnical Engineering is observing and evaluating
fracturing beneath the WIPP excavation. Fracturing was characterized in the holes using
standard procedures for borehole fracture investigation. A scratcher rod was used to
determine the fracture location, the orientation, and the approximate size of the fractures. The
results of the scratcher rod survey were recorded as part of the Excavation Effects Program.
E3.5 Hole DepthsThe general condition and total depth were observed at each test hole. Table E-3-1 shows the
drilled depth, the measured depth, and the date of measurement. Depths were measured using
a standard metal measuring tape.
EO at N620 Test Site. With the exception of OH71 (Figure E-2-3), which had no surface
plug and was partially filled with debris, each hole was reasonably intact. Westinghouse
Experimental Operations staff chipped and vacuumed out much of the debris and fluid and
fluid-level equilibrium had not yet been achieved by the start of the test. All holes showed
signs that the clay layers surrounding MB 139 were deforming and offsetting the test holes.
The bottoms of the test holes appeared either to have filled with muck or to have started to
close in at a depth of approximately 9 ft (2.75 m) and were offset. The muck in the partially
filled holes may have changed the observed hydrologic response to pumping.
For some holes, the depths that were measured were somewhat different from the original
depths drilled as indicated Table E-3-1. In December 1992, the Westinghouse Experimental
Operations staff vacuumed all test holes to remove debris and muck. The test hole depths
AUl»-95IWP/WIP:R31 92-E E-12 301681008

BRINE SAMPLING AND EVALUATION PROGRAM REPORT 1992·1993
Table E·3·1
Drilled and Measured Depths of Test Holesat the EO and W170 Test Sites
Measured Hole Drilled DeRthsHole Number Test Date Depth (in feet)a (in feet)a
OH59 11/9/92 10.29 10.17
OH60 11/9/92 11.25 11.33
OH61 11/9/92 10.00 10.00
OH62 11/9/92 11.25 11.32
OH63 11/9/92 9.50 9.39
OH64 11/9/92 10.20 10.70
OH65 11/9/92 9.25 9.98
OH66 11/9/92 9.00 9.15
OH67 11/9/92 9.67 9.40
OH68 11/9/92 10.42 10.68
OH69 11/9/92 6.17 10.00
OH70 10/12192 8.85 8.7512117/92 8.92
OH71 10/12192 9.15 9.0012117/92 9.08
OH72 10/12192 9.50 8.9612117/92 9.42
OH73 10/12192 9.00 8.9012117/92 9.00
OH74 10/12192 9.33 9.0012117/92 9.33
OH75 10/12192 7.75 7.7012117/92 8.00
OH76 10/12192 9.25 9.1012117/92 9.08
OH77 10/12192 8.00 7.9012117/92 8.15
OH78 10/12192 9.00 9.1012117/92 8.42
aDepths measured below drift floor surface.
APPENDIX E
AU04-95/WP/W1P:R3192-E E-13
~~-_..-._._.-_._--_._-_ ..
301681.008

BRINE SAMPLING AND EVALUATION PROGRAM REPORT 1992-1993 APPENDIX E
were remeasured (Table E-3-1). The total hole depths measured in December 1992 are very
near those recorded on the original drilling logs from January 1990.
W170 Test Site. With the exception of OH69, all test holes appeared to be fairly clean and
free of muck and debris. Hole OH69 was filled with at least 3.5 ft (1.1 m) of muck. All
holes appeared to be straight and did not show obvious signs of the clay layers surrounding
MB 139 squeezing into the holes.
Table E-3-l shows the measured depths of the boreholes, the as-drilled boreholes depths, and
the date drilled. There were some notable differences in water levels across the test site area.
Water levels were somewhat higher in the center of the W170 drift, directly in front of the
core library (OH65, OH66, and OH67). The depths to water increased by almost 2 ft (0.61
m) in the interior of the core library and to an even greater extent elsewhere.
E4.0 Observations and Test Site Conditions _Thorough characterization of the hydrologic conditions present in the test areas was required
before proceeding with actual pumping drawdown tests. These conditions include the number
and locations of fractures, the levels of saturation, the occurrence of saturated muck on the
drift floors, the structure and thickness of MB 139, and the water pressure and fluid levels in
the holes prior to the tests.
Test hole drilling and installation confirmed that fractures saturated with brine occurred
beneath much of the areas for both test sites. Fracture observations were made visually and
with a nail probe rod (scratcher rod), as described in Section 3.4 of this report. Based on
these observations, it appears that fractures and structural separations of individual layers
were restricted to the anhydrite (MB 139) and the clay seams associated with MB 139.
Therefore, the hydrogeologic unit within the DRZ being tested and yielding brine to the test
holes is generally fractured MB 139.
Both hydrologic test sites showed variability in fluid levels in the test holes across each
respective site. Such variability suggests that each test site contained separate and
independent fracture systems acting as isolated brine reservoirs. Geologic logging of the drill
hole cores indicate that MB 139 is not uniform in thickness nor in depth to the top or bottom
AU04-95/WP/WIP:R3192-E E-14 301681008

BRINE SAMPLING AND EVALUATION PROGRAM REPORT 1992-1993 APPENDIX E
of the bed. Logging also revealed that MB 139 appears to be fractured at numerous depths,
particularly in the lower one-half of the unit (Crawley et al., 1992).
The following sections describe specific observations and conditions of the EO and W170 test
site areas in more detail.
E4.1 EO Test Site Prior to the Initial Pumping Test
The initial hydrologic test of this field program was conducted at the EO drift test site during
the period of October 8 through 14, 1992. The nine test holes at this site were preexisting,
having been drilled more than three years prior to the scheduled pumping test.
Considering the history of brine use for dust control in the EO drift, fluid levels in the
boreholes were initially lower than expected, providing only about 3 to 4 ft (1 m) of saturated
hole to be used in pumping. Table E-4-1 shows the measured depths to water in the test
holes prior to the pumping tests. The deeper fluid levels suggested that the pumping test at
this site would likely be very short in duration, if even possible.
Figures E-4-1 and E-4-2, cross-sectional views of the EO test site, show the depths to the top
and bottom of MB 139 and the depths to the standing-water column in each test hole. Fluid
levels in holes OH72, OH73, OH74, OH75, and OH76 are similar and are at equilibrium near
the top of MB 139 (Figure E-4-1). The depth to the top of the fluid column increases
significantly to the north in hole OH77, suggesting that fractures in MB 139 may not be
saturated north of the test site area. The fluid level in OH71 on the south end of the test site
is somewhat lower than that in the center of the test area. However, the lower fluid level in
OH71 may be the result of previously cleaning out and evacuating this test hole and does not
reflect the equilibrium fluid level. Figure E-4-2 shows the cross-sectional view across the EO
drift, depicting fluid levels within or slightly above those of MB 139. Hole OH78 exhibits a
lower fluid level than do OH70 and OH74, perhaps indicating that the fracture system near
the east edge of the drift may not be hydraulically connected to fractures in the center of the
drift.
Drilled depths and measured depths of holes shown in Figures E-4-1 and E-4-2 are often
different. Muck in the holes may cause the measured depth to be less than the original
AU04-95IWPIWIP:R3192-E E-15 301681.008

BRINE SAMPLING AND EVALUATION PROGRAM REPORT 1992-1993
Table E-4··1
Measured Water Levels in Test Holes at the EO SiteDuring the Initial PUlmping Test
APPENDIX E
Hole Number Date Measured Depths to Water (in feet)a
OH70 10/12/92 4.62
OH71 10/12/92 6.83
OH72 10/12/92 4.70
OH73 10/12/92 4.95
OH74 10/12/92 4.98
OH75 10/12/92 4.94
OH76 10/12/92 5.08
OH77 10/12/92 5.90
OH78 10/12/92 6.23
aDepths to water measured below drift floor surface.
AU0+95IWPIWIP:R3I 92-E E-16 301681008

301681.009 OOO/Ild A151/26/95
I1Il
~~~
~~gz
~~
~~~
MeasuredDepth
OH71OH72OH73OH74OH75
MeasuredDepth andDrilled Depth
"'-. Drilled Depth
Measured Depth
,~
OH76
'"Drilled Depth" Measured Depth
OHn
4
7
2
9
6
3
8
10
:5 ~ 5o.C1lC1l C1lO:!:-
iiiFloor level 0 I I i I Iii I I I I I I
ttlI--.....l
45 20 10 0 10
Horizontal Distance(feet)
.$~-
20
LEGEND
o Water Column
IZI Marker Bed 139
45
~~~m
Figure E-4-1Cross Section of Boreholes Along the EO Drift Test Site, October 1992

3016Bl 009.00 OOO/Ild A161/26/95
I I iFloor level 0 I iiiI
4
3
§Vl
~~~
~8oz
i~§:81;->
~W
Measured Depth
Drilled Depth
OH78
/ .
,;)":,~,
, ~,
;;;{'''" Drilled Depth
Measured Depth
OH74
~ Drilled Depth
" Measured Depth
OH70
7
9
8
5
2
10
.c ........0.0)0) 0) 6o:t:-
tTlI.....
00
11 I i I i '
10 o
Horizontal Distance(feet)
10
NLEGEND
D Water Column
Looking North~ Marker Bed 139
;..:iJ~XlT1
Figure E-4-2Cross Section of Boreholes Across the EO Drift Test Site, October 1992

BRINE SAMPLING AND EVALUATION PROGRAM REPORT 1992-1993 APPENDIX E
drilled depth. Conversely, muck buildup on the floor of the drift (the reference point for
measurements) may cause the measured depth to be greater than the original drilled depth.
Figure E-4-1 shows that ME 139 has an apparent dip to the south in this are and that the
depths to the top and bottom of the bed is variable. These structural characteristics may
influence fracture orientation and fluid levels.
Based on the initial observations of test hole fluid levels, it was anticipated that the planned
pumping test may be short in duration, yielding limited data for hydrologic analysis. Hole
OH74 was selected as the primary pumping hole for the test. Data from the preliminary step
drawdown test conducted on October 12, 1992 indicated that a pumping drawdown test could
be conducted at a very low flow rate (Chapter 5.0).
E4.2 W170/Core Library Test Site
The second hydrologic test of this field program was conducted at the intersection of the
W170 drift and the underground core library from November 9 to 13, 1992. Eight of the
eleven test holes at this site were preexisting, having been drilled more than three years prior
to the scheduled test at this site. Three of the holes (OH59, OH60, and OH61) were drilled
on October 19 and 21, 1992, in preparation for testing at this site.
Water levels were measured in all holes prior to any pumping activity. Water levels in holes
in the W170 drift were generally 3 to 5 ft (0.91 to 1.5 m) below the drift surface, with a few
exceptions (Table E-4-2). Figures E-4-3 and E-4-4 show the depths to the top and bottom of
ME 139 and the depths of the standing water columns in each test hole at this site.
As shown in these two cross-sectional figures, there were some notable differences in water
levels across the test site area. Wate~ levels were somewhat higher in the center of the W170
drift, directly in front of the core storage library (OH65, OH66, and OH67). The depths to
water increased by almost 2 ft (0.61 m) in the -interior of-the-core storage library and to an
even greater extent elsewhere. Two holes, OH60 and OH68, exhibited markedly different
water levels. OH60, located interior to the core storage library, is a re<;:ently drilled hole, the
water level may not yet have reached equilibrium, or the borehole does not intersect any
brine-filled fractures.
AU~-95IWPIWIP:R3192-E E-19 301681.008

BRINE SAMPLING AND EVALUATION PROGRAM REPORT 1992-1993
Table E-4-2
Measured Water Levels in Test Holes at the W170 SiteDuring the Initial Pumping Test
APPENDIX E
Hole Number Date Measured Depths to Water (in feet)a
OH59 11/9/92 6.15
OH60 11/9/92 10.86
OH61 11/9/92 5.43
OH62 11/9/92 5.20
OH63 11/9/92 4.98
OH64 11/9/92 4.65
OH65 11/9/92 3.30
OH66 11/9/92 3.35
OH67 11/9/92 3.00
OH68 11/9/92 7.30
OH69 11/9/92 4.10
aDepths to water measured below drift floor surface.
AU04·95IWPIWIP:R3192-E E-20 301681.008

301681.009.00.000/Ud A171/26/95
FI I OH68 OH67 OH66 OH65 OH64oar evel 0 I I I IIii I I iii
2
3
4
5.t:_--Q.Q.)Q.) Q.) 6o:t:.
7
tTl8
It-.l
9
10
11
, Measured Depth
Drilled DepthMeasured Depth Measured Depth
Drilled Depth
Measured Depth
Drilled Depth
IICl
~
~~
~~~~El~~
25 20 15 10 505
Horizontal Distance(feet)
LEGEND
10 15 20 25
Figure E-4-3Cross Section of Boreholes in the W170 Drift at the Core Library, November 1992
-$~-- o Water Column
IZI Marker Bed 139 ~
~;;:::lt1

301681.009 OO.OOO/Ild A 181/26/95
Floor level OH59 OH60 OH61 OH62 OH63 OH66 OH69o I i I I I F"1 iiiI i I I I i
<','
tTlI
I,,)I,,)
1-
2-
3-
4-
5-.t: _........a.Q)Q) Q) 6-0:::-
7-
8-
9-
10-
11-
80
___ Measured Depth
Drilled Depth
70 60
Measured Depth
'.1/ Drilled Depth
50 40
Drilled Depth
Measured Depth
30
Horizontal Distance(feet)
20 10
'/
'/
~".
.'·I\,Drilled~\Depth
MeasuredDepth
o 10
DrilledDepth
~
I~
~~gz
~~a::
~~
~§
N
Looking North
LEGEND
o Water Column
~ Marker Bed 139
~;;:tTl
Figure E-4-4Cross Section of Boreholes Across the W170 Drift and into the Core Library, November 1992

BRINE SAMPLING AND EVALUATION PROGRAM REPORT 1992·1993 APPENDIX E
Hole OH66 was selected as the pumping hole for the initial test based on its location in the
middle of the drift (directly in front of the entrance to the core library) and a pretest standing
fluid column of approximately 5.65 ft (1.7 m). The pretest fluid columns in holes OH62,
OH63, OH64, OH65, OH66, and OH67 were all greater than 5 ft (1.5 m) in length,
suggesting that there would be sufficient water to conduct a pumping test of adequate
duration at this site. Because of concerns about potential dewatering of the proposed
pumping hole (OH66), no preliminary drawdown step test was performed for this site.
E4.3 EO Test Site Prior to the Retest at This Site
The third and final field tests for the hydrologic testing of the fractured part of the DRZ
project were conducted from December 14 through 17, 1992, at WIPP. These tests were
repeats of the initial test conducted at the site located in the EO drift in front of the N620
alcove from October 9 through 14, 1992.
As described in Section E4.1, the test holes at this site appeared to contain some
semiconsolidated muck, which may have had an impact on the results from the initial test.
Prior to the second test attempt at this site, the holes were reconditioned by removing some of
the muck with a vacuum system. The reconditioning effort also removed all of the brine
standing in the holes at that time. The fluid levels in the test holes partially recovered prior
to the December 1992 field test period.
The total depth of each hole was measured, and each hole bottom felt solid and free of muck.
With the exception of OH76, which has a major offset at approximately 6 to 7 ft (1.8 to
2.1 m) beneath the floor of the drift, all holes appeared to be generally straight. This offset
closes about one-half of the hole and made instrument installation difficult.
Figures E-4-5 and E-4-6 show the depths of the top and bottom of MB 139 and the depths of
the standfng water columns in each test hole at this site in December 1992. The depths
measured in December 199Q.are very near the depths recorded on-the ·original drilling logs in
January 1990 (Table E-3-1). Water levels, measured in all holes prior to any pumping
activity, ranged from 6.10 to 8..55 ft (1.86 to 2.61 m) below the drift floor surface
(Table E-4-3). There were some notable differences in water levels between holes OH76 and
OH77 and the other holes at the test site. All of the holes, except these two, had very similar
depth-to-water measurements. Holes OH76 and OH77 had water levels approximately 2 ft
AUO-l-95IWPIWIP:R3I 92·E E-23 301681.008

BRINE SAMPLING AND EVALUATION PROGRAM REPORT 1992-1993 APPENDIX E
(0.61 m) deeper than the other test holes. The standing fluid column in all holes was less
than 3 ft (0.91 m).
Figures E-4-5 and E-4-6 show that during the December 1992 retest period, the fluid levels in
MB 139 were much lower than those measured in October 1992 (Figure E-4-1 and E-4-2).
The large decrease in fluid levels may be in response to the removal of fluid from the holes
during cleaning in December 1992. The lower fluid levels measured in October suggest that
the area may not have fully recovered from the hole reconditioning. However, it is also
possible that the continued removal of brine from test holes at the EO drift site may be locally
depleting the available fluid reservoir.
Based on the shorter standing fluid column in the test holes, it was anticipated that the
pumping test might be shorter in duration than the initial test at this site. Hole OH74, which
was selected for the initial test here in October 1992, was also selected in December 1992 as
the primary pumping hole for the test.
E5.0 Hydrologic Testing and Dat.:l Collection _The main objective of the field testing program was to determine local hydrologic parameters
for the fractured part of the DRZ at the EO and W170 drift test sites using standard pumping
drawdown-type testing techniques. Additional goals include developing and refining testing
techniques and collecting baseline hydrologic data from comparable old and new areas of the
repository. To achieve these objectives, the two test sites were instrumented with downhole
pressure transducers to monitor local fluid pressures in the fractured zone beneath the drifts.
For the pumping drawdown tests, a Bennett model air-driven piston pump was installed in the
selected test hole to provide user-controlled discharge rates from approximately 1 to 50 gph
(3.8 to 189 Lph). This type of pump is capable of very low discharge rates and uses
compressed air from a portable compressor (Figure E-5-1).
The pressure transducer data were stored in random access memory using Geokori CR-10
remote dataloggers. These data were transferred to magnetic disk for analysis and evaluation
using the appropriate computer software. The procedure for conducting pumping drawdown
type hydrologic testing included collecting background water pressure and water-level data
prior to the test, evaluating local fluid-level trends, selecting the pumping hole, pumping
equipment installation, performing a preliminary step drawdown test, estimating the
AU0+-95IWPIWIP:R3I 92-E E-24 301681.008
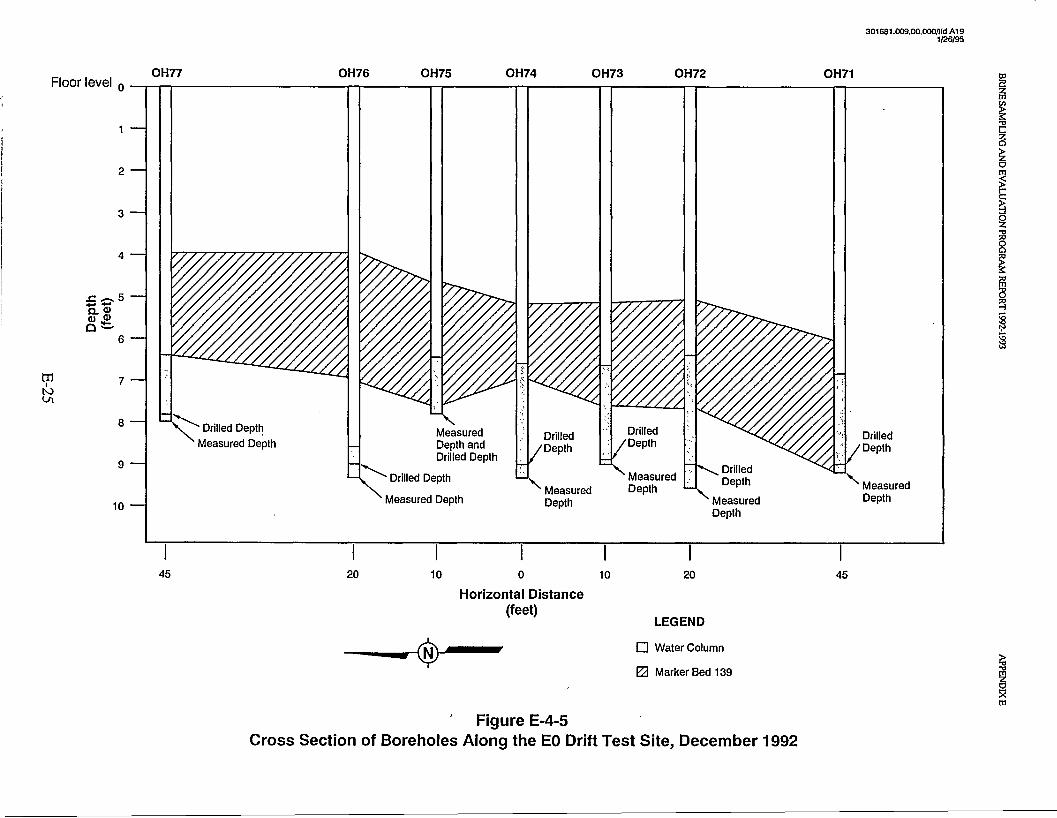
301681.009.00.llOOlIfd A191/26/95
tilC!ffi~i:a~lT1
~E~~
~~
~~
~~
DrilledDepth
'MeasuredDepth
OH71OH72
, MeasuredDepth
MeasuredDepth andDrilled Depth
" Drilled Depth
Measured Depth
OH77 OH76 OH75 OH74 OH73Floor level 0 iii iiiiii IiiIii ,
2
3
4
.c _ 5
amQ.l Q.lc:t:..
6
trl 7Itv
8-1 I:j~ Drilled Depth
VI
Measured DepthI
9
10
45 20 10 0 10
Horizontal Distance(feet)
=~~--
20
LEGEND
o Water Column
~ Marker Bed 139
45
~><lT1
Figure E-4-5Cross Section of Boreholes Along the EO Drift Test Site, December 1992

Floor level OH70 OH74 OH78o iii I i iii
2
3
4
5
J: _......g-~6at
tTl7
IN0\
8
9
10
11
\,I~ Drilled Depth
"Measured Depth
10
N
Looking North
~~!y~ ~
n, Drilled Depth
Measured Depth
o
Horizontal Distance(feet)
LEGEND
o Water Column
lZ] Marker Bed 139
10
Measured Depth
Drilled Depth
301681.009.00.0(XJnld A201/26/95
CD12ffl~""ca~~E~oz""8~
~:l~~
~
~S<m
Figure E-4-6Cross Section of Boreholes Across the EO Drift Test Site, December 1992

BRINE SAMPLING AND EVALUATION PROGRAM REPORT 1992·1993
Table E-4-3
Measured Water Levels in Test Holes at the EO SiteDuring the Second Pumping Test
APPENDIX E
I Hole Number I Date Measured I Depths to Water (in feet)a IOH70 12/14/92 6.50
OH71 12/14/92 6.85
OH72 12/14/92 6.35
OH73 12/14/92 6.75
OH74 12/14/92 6.70
OH75 12/14/92 6.70
OH76 12/14/92 8.55
OH77 12/14/92 8.40
OH78 12/14/92 6.10
aDepths to water measured below drift floor surface.
AUQ.t·95IWPIWIP:R3192-E
,1' "'Hi'
E-27 301681.008

BRINESAMPUNG AND EVALUAll0N PROGRAM REPORT 1992-1993 APPENDIXE
Cable Reel Assembly
Cable Bundle• 3/16-inch Wire Cable• Water Discharge Tube• Air ExhaustTube• Air Inlet Tube• Electric Cable
~-Well Casing orBorehole Sides
/4J--- Gas Piston Pump
Air Motor Section, Stainless Steel• Automatic Reciprocating• Piston Type• Double Acting
}
Pump Section, Stainless Steel• Double Acting• Piston Type
} Water Intake• Stainless Steel, 100 Mesh
Water Level---!!=r::=Jc } Pump Head, Stainless SteelIndicator Probe
Air Exhaust Tube---+I
Air Inlet Tube --t-II-t+i
Electric Cable --H+i
3/16-inch Wire Cable ---+<H
Water DischargeTube-~
Figure E-5-1Schematic of Gas-Driven Piston Pump (Bennett Model 1800)
with Exploded View of Cable Bundle
E-28

BRINE SAMPLING AND EVALUATION PROGRAM REPORT 1992-1993 APPENDIX E
appropriate flow rate, conducting the pumping test for as long as possible, and monitoring
recovery of fluid levels. The sections below present the results of the pumping drawdown
tests at the EO and W170 drift test sites.
E5.1 Initial Pumping Drawdown Test at the EO Drift Site
Background water pressure and water-level data were collected at the EO test site to provide
some definition of long-term trends, and changes regarding test parameters and for
comparison with test results. Background data collection began October 12, 1992, in all holes
at the test site.
Figure E-5-2 shows hydrographs of fluid pressures in holes OH70, OH73, OH74, and OH75,
from the initial instrumentation through completion of the pumping drawdown test. These
hydrographs show the response to pumping OH74. Pu~ping commenced at 10:32 a.m.,
October 13, 1992. The hydrograph also shows that the fluid levels in the holes that
responded to pumping did not recover to their pretest levels by the time data collection was
terminated. This observation suggests that the fluid reservoir being pumped through OH74
may be limited and that pumping from the test area may be dewatering the available fluid
locally from the fracture systems.
Figure E-5-3 shows hydrographs of fluid pressures in holes OH71, OH72, OH76, OH77, and
OH78 from the beginning to the end of the pumping test in OH74. These holes show very
limited, if any, drawdown response to pumping, indicating that the test area may have
separate, unconnected fracture systems that are at least partially saturated with brine.
On October 12, 1992, a preliminary step drawdown test was conducted at the EO Test Site.
OH74 was pumped at several flow rates to establish a discharge rate that could be maintained
for at least several hours. The final flow rate was adjusted to approximately 8.7 gph
(32.9 Lph), producing a drawdown that would appear to allow pumping for the required
duration. The test was terminated after less than 1 hour of pumping, and the area was
allowed to recover overnight. The hole that was pumped and the surrounding holes had only
partially recovered by the beginning of the full-scale pumping drawdown test the following
morning.
AU04·95fWPfWIP:R3192-E E-29 301681.008

0.0
301661.00900 OOO/Ild A224/13/95
tIl
~VI
~
25-, ~Cl
~rn
~c:20 -l ~
0Z"d;<l
8~
1.5 -l 1 r'll-17"l - --- -'\.
~~
6'1.0 =k\
-. Y\.J\...III\-I'I\ - ----- - ~(j) ~0.. w.......Q).....::::l
tTl enenI Q)V.l .....
0 0..50
Start ofPumping
·05 f Iii i I I iii I I Iii iii ii' iii I Iii iii iii i I I Iii iii I Iii iii iii iii iii
15 16 17 16 19 20 2\ 22 23 24 \I
10/13
2 3 4 5 6 7 6 9 10 11 12 13 14 15 16 17 16 19 20 21 22 23 24 1I
10/14
2 3 4 5 6 7 6 9 10 11 12 13 14 15 16 17 16 19 20 21 22 23 24I
10/15
Time (Hours)
Figure E-5-2Hydrographs of the EO Site Test Holes OH70, OH73, OH74, and
OH75 Through the End of the Pumping Test, October 1992
~~~rn

3016B1.009.00.000/Ud A239/21/94
2.5
OH72
2.0
'"'~76.......CJ
OH78(f)0-
1.0........Q)
OH71
....tT1 ::l
C/)IC/)
F ----
OH77
wQ)
- --....0-
OH71.50
OH78
OH76
!en
I~m
~c:~~
~~
~~~
0.0
81allolPumping
·0.5 I I I I I I I Iii iii I I I I I Ii! I Iii i I I i I I I j I I I I I i I Iii I I i I I I I iii I I I I i I
15 16 17 IB 19 20 21 22 23 24 1 2 3 4 5 6 7 0 9 10 11 12 13 14 15 16 17 10 19 20 21 22 23 24 1 2 3 4 5 6 7 0 9 10 11 12 13 14 15 16 17 10 19 20 21 22 23 24I I I
10/13 10114 10/15
Time (Hours)
Figure E-5-3Hydrographs of the EO Site Test Holes OH71, OH72, OH76, OH77, and
OH78 Through the End of the Pumping Test, October 1992
i'.;aJ6xm

BRINE SAMPLING AND EVALUATION PROGRA,\1 REPORT 1992-1993 APPENDIX E
A pumping drawdown-type test was conducted on October 13, 1992, again using hole OH74
as the pumping hole. The test started at 10:00 a.m., but the pump intake soon became
clogged with mud. The pump was removed from the hole, and the intake was cleaned. The
pump was reinstalled, and the test hole was allowed to recover for 30 minutes (min). During
the second pumping attempt at 10:32 a.m., all equipment functioned properly.
The pumping discharge rate was continuously monitored and adjusted until a flow rate of
approximately 6 gph (22.5 Lph) was attained. The actual measured pumping rate ranged
from 7.57 to 5.14 gph (28.6 to 19.5 Lph), with an average of 6.06 gph (22.9 Lph). The test
lasted for approximately 3 hours and 37 min. During the test, fluid levels in, all holes were
continuously monitored using transducers and a datalogger.
E5.1.1 Test Performance and ResultsThe pumping discharge rate became stable after approximately 20 min. The discharge rate
was slightly variable throughout the test but did not significantly influence the steady
drawdown achieved in the pumped hole and surrounding holes. Test hole fluid pressures
were monitored at I-min intervals throughout the test.
The pumping test was terminated at 2: 10 p.m., when the fluid level in the pumped hole
dropped to a level below the pump intake. The pump was then turned off, and the recovery
phase was started. All pumping and monitoring equipment performed well throughout the
test.
Drawdown of fluid levels was observed in most of the test holes surrounding OH74 during
the pumping period. Only holes OH71 and OH77 showed no measurable response. These
two holes, located at either end of the line of holes along the axis of the EO drift, are the
most distant holes from the pumping center. Figure E-5-4 shows the distribution of
drawdown response at the site during the initial test in October 1992.
The hydrographs in Figures E-5-2 and E-5-3 show that OH70, OH73, and OH75 are the only
holes to respond significantly to pumping OH74. Holes OH72 and OH76 showed only a
limited response to pumping, and OH78 shows only a very slight long-term lowering of
downhole fluid pressure. Holes OH71 and OH77 showed no response.
AU().l-95IWPIWIP:R3192-E E-32 301681008

BRINE SAMPUNG AND EVALUATION PROGRAM REPORT 1992·1993
OH77
•Approximate zone of influence
from pumping OH74
OH75
•OH74
• • OH78
OH73
N620 •Test hole location
•OH71
•0W
Figure not to scale
Figure E-5-4Test Holes at the EO Site Showing Response to Pumping OH74
During the Initial Test at This Site, October 1992
E-33
APPENDIXE

BRINE SAMPLING AND EVALUATION PROGRAM REPORT 1992-1993 APPENDIX E
All holes showing some response to pumping exhibited limited fluid-level recovery upon
termination of pumping, including the pumping hole OH74. The limited recovery, combined
with the distribution and degree of drawdown response, suggests that the local fractured
reservoir is limited in radial extent and that fracture systems may not be well interconnected.
Both OH70 and OH78 are located only 10 ft from the pumped hole, but their drawdown
responses are significantly different. Hole OH70 responded well to pumping, while OH78 did
not. The drastic difference in response may indicate that the fracture system intercepted by
OH78 (near the EO drift wall) is not connected to the system intercepted by the other test
holes in the middle of the EO drift. The fracture system in the middle of the EO drift is also
possibly prominent beneath the N620 alcove because of the effect of the alcove excavation
itself. The testing results also suggest that the fractures in:ME 139 at the intersection of the
EO and N620 are fairly well connected and that the connection dissipates as one moves away
from the intersection down the EO drift or toward the drift wall opposite the alcove.
Long-term fluid-level monitoring was not conducted to determine whether the test hole fluid
levels had completely recovered with time. Therefore, no firm conclusion can be made as to
the degree of potential dewatering of the fracture systems that occurred during the pumping
test.
E5.1.2 Pumping Test Analysis
The aquifer test design and analysis computer software package AQTESOLV (Geraghty and
Miller, 1989) was used to determine the hydrologic properties of the fractured zone at the
EO test site. The drawdown data from observation test holes OH70, OH73, OH75, and OH72
and pumping hole OH74 were evaluated using the computer software package. The Jacob
and the Theis methods (Lohman, 1972) were used to determine transmissivity and storage
coefficients (observation holes only) in the holes that responded to pumping.
Figures E-5-5 through E-5-9 show semilog and log-log plots of drawdown-versus-time data
for the five wells listed above. The drawdown curves allowed analysis by Jacob and the
Theis methods and generally showed linear plots of drawdown versus time and a good fit to
Theis-type curves. The calculated transmissivity for the four observation holes, analyzed
using both the Theis and the Jacob methods, ranged from 0.7 to 9.9 square feet per day
(ft2/day), with an average of 3.7 ft2/day. The storage coefficients for the observation holes
AUl»-95/WP/WIP:R3192-E E-34 301681008

BRINE SAMPLING AND EVALUATION PROGRAM REPORT 1992-1993 APPENDIX E
ranged from 0.0004 to a maximum of 0.0034, indicating that the fracture system is at least
partially confined. Transmissivity, calculated from the data for pumping hole OH74, was 3.8
ft2/day for both Theis and Jacob methods (Figure E-5-9). No storage coefficient can be
calculated for the pumping hole.
Both the transmissivity and storage coefficient values, as calculated by the program, agree to
within an order of magnitude for all test holes analyzed. The results of the pumping test
analysis indicate that the transmissivity of the fractured zone beneath the EO drift test site
appears to be uniform (for those holes responding to pumping OH74). The calculated
transmissivity for hole OH72 (Figure E-5-6) is somewhat great~r (but by less than a factor
of 2X) than those calculated for OH74, OH73, and OH75. The value is well within the error
range of the testing and analysis methods, indicating that the transmissivity at OH72 is
consistent with transmissivities calculated for the rest of this test site.
The analysis suggests the fracture system beneath the intersection of the drift and alcove at
the test site is hydraulically connected and has similar hydraulic characteristics. The data also
show that the fracture system acts as a porous medium. It is noted that these methods require
the assumption that the aquifer is infinite. The fracture system tested at this site probably
does not meet this requirement. Also, the testing generally did not provide enough data to
curve-fit for more than one log cycle; therefore, the reported analytical results may be in
violation of this requirement. However, the test results do provide some semiquantitative
estimates of the local hydrologic characteristics of the fracture systems.
Figures E-5-5 through E-5-9 show prominent changes in slope of the drawdown-versus-Iog
time plot for these test holes. This change in slope may indicate that the cone of depression
produced by pumping encountered a low-permeability boundary or an area void of brine-filled
fractures. Changes in the drawdown slope for holes OH70, OH73, and OH74 occurred
between 80 and 150 min into the test. The apparent no-flow or low-permeability boundary
conditions observed in these plots are consistent with the other hydrologic data resulting from
this program and support the conclusion that, at the EO test site, there are separate and
hydraulically unconnected fracture systems saturated with brine.
AU().l-95IWPIWIP:R3192-E E-35 301681.008

BRlNESAMPUNG AND EVALUATION PROGRAM REPORT 1992-1993 APPENDIXE
1,000.100.0.1 1. 10.
Time (min.)
OH70
O. Wu..LWW-l...LJ.J..J.llll.-J..UW.llll....I..l.J.W.lll..ClO.O::t1llll..-UJ.Ll..WJ1.E-003E -002
2.
1.8 T =0.0020 ft. 2/min.S = 0.0021
1.6
1.4
-£ 1.2c3: 1.0'03: 0.8~l-
e0.6
0.4
0.2
1O. ~"""'''''I'''T''I''''''''''''''''''''''''I''l'''I'I''I'T-''''''''''''''''m'I''''''''''''''''''''I''l'lTI~'''''l''T''T'l'm-~~l''Tm
1,000.100.
cPO
0.1 1. 10.
Time (min.)
Figure E-S-SSemilog and Log-log Plots of DrawdownVersus Time for Observation Hole OH70
E-36
T =0.0005 ft. 2/min.S =0.0025
1.
0.1
1.E-003 ..............................j"I"I,l"I,..........................~oIo-O'..............................j"I"I,l"I,...............~
1.E-003E -002
1.E-002

APPENDIXEBRINESAMPUNG AND EVALUATION PROGRAM REPORT 1992·1993
~$ OH72:E~r 1.00g
~ 0.9 T =0.0069 ft.2/min.i8 S =0.0025(;
'" 0.8
0.7-e- 0.6c::
0.50'C::eu 0.4l-
e
0.3
0.2
0.1
0.010. 100. 1,000.
Time (min.)
1. r-----r--....,:--...,.....,-'l""""T..,..,..,...--..,...-.,-----r"..,....,...."I"""l"~
1,000.100.
Time (min.)
Figure E-5-6Semi-log and Log-log Plots of DrawdownVersus Time for Observation Hole OH72
E-37
1.E-002 '---__J...---I.-O-..I--l.-I.--I-""-'-""--__.l......--l._""--L......l.-I-.l....I-.I
10.
T =0.0039 ft.2/min.S =0.0034
-e-c::o 0.1'C::eul-
e

1,000.100.10.1.E-003. ~_......-........-..r."'_--'_"",I,..l-,I",I",l,,,,,,,,_-,,,---r.-"'-..l.o.l....u.u
1.
BRINESAMPUNG AND EVALUATION PROGRAM REPORT 1992-1993 APPENDIXE
"lit OH-73~<O;gil!."'- 3.§8ci T =0.0029 ft.2/min.~ 2.7a; S =0.0004<0
0'" 2.4
2.1-e. 1.8c::
1.50"C::
CIS 1.2'-c0.9
0.6
0.3
O.1. 10. 100. 1,000.
Time (min.)
10.
T =0.0017 ft. 2/min.S =0.0007
1.
-.,;:cc::
0.10"C::
CIS'-c
1.E-002.
Time (min.)
Figure E-5-7Semilog and Log-log Plots by DrawdownVersus Time for Observation Hole OH73
E-38

BRINESAMPUNG AND EVAWA1l0N PROGRAM REPORT 1992-1993 APPENDIXE
Olon OH7S~%:Ell! 2.c;:.~
§g
1.8 T =0.0017 ft.2/min.~~
S =0.00110 1.6'"
E'1.4-c 1.2
==0"C
== 1.ctI"-c 0.8
0.6
0.4
0.2
O.1. 10. 100. 1,000.
Time (min.)
10.
T =0.0009 ft.2/min.S =0.0017
E' 1.-c==0
"C
==ctI"-c
0.1
o1.E-002 ....._'--..................~ .....r.__...........oI.looo._...........Io........I..Ioo""'-loololl1
1. 10. -100. 1,000.
Time (min.)
Figure E-S-8Semilog and Log-log Plots of DrawdownVersus Time for Observation Hole OH7S.
E-39

BRINESAMPUNG AND EVALUA1l0N PROGRAM REPORT 1992-1993 APPENDIXE
en'"~~:E~ 3.~-
:3 T =0.0026 ft.2jmin.~ 2.7~(; 2.4'"
2.1-5. 1.8cs:
1.50't:ls:
1.2ctI'-0
0.9
0.6
0.3
01.0 10. 100. 1,000.
Time (min.)
10. .---.,.....,.....,-r"""'I""T""I""'I""---'-"''''''''''''T'T'l..,.,...---r---r--r-'''T'''''I''''T'T'''n
T =0.0026 ft.2jmin.
- 1.5.c3:0
't:l3:ctIto-
o0.1
1,000.100.10.1.E-002 ------............................-----....- .........................-----......""-"..............
1.Time (min.)
Figure E-5-9Semilog and Log-lo~J Plots of Drawdown
Versus Time for OH74 (Pumphole)
E-40

BRINE SAMPLING AND EVALUATION PROGRAM REPORT 1992-1993 APPENDIX E
E5.2 Initial Pump Test at the Core Storage Library (W170) Site
The second in a series of three fractured zone pumping tests was conducted during the week
of November 9 through 13, 1992. This test was performed at the intersection of the W170
drift and the underground core library. I
Background water pressure and water-level data were collected to provide some definition of
long-term trends and changes regarding test parameters and for comparison with test results.
Background data collection began on November 9, 1992, in all holes at the test site, with the
exception of OH60, which was not instrumented.
Figures E-5-10 and E-5-11 show hydrographs of fluid pressures in all holes (with the
exception of OH60) from the initial instrumentation through completion of the pump test.
These hydrographs show limited response to two different pumping episodes. Figure E-5-10
shows that the first pumped hole, OH66, did not recover from pumping and the li,mited
response of the surrounding holes. Figure E-5-10 also shows that the second pumping hole,
OH62, was slowly recovering before the transducer was pulled. These observations suggest
that the fractured fluid reservoirs are limited and probably isolated from each other.
Figure E-5-11 shows hydrographs of fluid pressures in holes OH59, OH61, OH64, and OH68
through the end of the second pumping test. These holes, with the exception of OH61, which
is adjacent to the second pump hole, show very limited (if any) response. This indicates
some fracture connection between the two holes but limited connection elsewhere.
The pumping drawdown test, using OH66 as the initial pump hole, began at 11:00 a.m. on
November 10, 1992. The pump was turned on at 11:00 a.m., and brine was routed to a
bucket with a I-gal graduate scale. The initial flow rate was calculated at 13.3 gph (50.3
Lph). The flow rate was adjusted, and two additional readings were taken for an average
flow rate of 9 gph (34 Lph). Less than 3.5 gal (13.2 L) were pumped before the hole became
dry. The water level reached the pump intake level- at-approximately- 11:28 a.m., and the
pump was left on until 11 :45 a.m. to clear the pump tubing. Scan rates were changed back to
30-min intervals for overnight recovery data collection.
On November 11, 1992, a second pump test was attempted using OH62 as the pumped hole.
The pump was installed at approximately 8:35 a.m. The water level in OH62 was allowed to
AU04-95IWPIWIP:R3 J92-E E-4l 301681.008

301681.009.00.000nJd MJO1/27/95
35
OH63
OH67 _ ~ _ .. ~---CD~
ffiUl
~"'0CZo
~
~~oZ"'0
8~
~~
~~
OH66
OH62
OH69
00
2.0
2.5
.50
30
a-U)
tTl Q:.1.5
I
.J:>. Q)
tv...~enen~0- 1.0
Start ofPumping
Start ofPumping
·05 r iii iii I I i I I i I I Iii I i f i I I Iii Iii iii i I I Iii I iii l I I I Iii Iii I I I iii I I Iii I I
15 16 17 18 19 20 21 22 23 24 1 2 3 4 5 6 7 8 9 10 11 12 13 14 15 16 17 18 19 20 21 22 23 24 1 2 3 4 5 6 7 8 9 10 11 12 13 14 15 16 17 18 19 20 21 22 23 24 1 2 3 4 5 6 1 8I I I
11/10 11/11 11/12
Time (Hours)
Figure E-5-10Hydrographs of the W170 Site Testholes OH62, OH63, OH65, OH66, OH67, and
OH69 Through the End of the Pumping Test, November 1992
~
~><rn

3016Bl.009.00.OOO/Ifd A311/27/95
3.5
3.0
------------OH64 ~ .,-------2.5
OH61
2.0
8 -I OH68
U5 1.5
tr1 e:-o
Q)~ ....W :Jenen
Q)....0.. 1.0
.50 _____-----r
---------------"- ~OH59 '--..----0.0
tll;:c
~
~
~~
~C
~az
~~~~
~~
StarletPumping
StarletPumping
-0.5 Iii iii I ( iii iii 1 iii iiI 1 iii i ( i i l ( iii iii 1 iii iiI i ( i i ( iii iii ill i i ( iii i I
15 16 17 IB \9 20 2\ 22 23 24 1 2 3 4 5 6 7 8 9 10 11 12 13 14 15 16 17 18 19 20 21 22 23 24 1 2 3 4 5 6 7 8 9 10 11 12 13 14 15 16 17 18 19 20 21 22 23 24 1 2 3 4 5 6 7 BI I I
lmo lml 1m2
Time (Hours)
Figure E-5-11 .Hydrographs of the W170 Site Testholes OH59, OH61, OH64, and
OH68 Through the End of the Pumping Test, November 1992
~~m

BRINE SAMPLING AND EVALUATION PROGRAM REPORT 1992·1993 APPENDIX E
reach equilibrium for approximately 90 min after pump installation. The scan rate was
changed from 30-min to I-min intervals to accommodate rapid water-level changes that might
occur during pumping. Pumping was initiated at 10:00 a.m., with a starting flow rate of 4.8
gph (18.2 Lph). The flow rate was increased to 6 gph (22 Lph). Two additional flow rates
were taken before OH62 became dry at 11:00 a.m. Average flow rate during the
approximately I-hour test was 4.8 gph (18.2 Lph). Scan rates were changed from I-min
intervals during the pump test to 30-min intervals for overnight recovery data collection.
The hydrographs in Figures E-5-1O and E-5-11 show that the pump test holes (OH62 and
OH66) showed the only significant response to pumping. The other holes showed very
limited or no response at all. OH62 showed fairly rapid recovery after the hole was pumped
dry, while OH66 showed no recovery response after being pumped. OH59, OH63, OH64,
OH65, OH67, OH68, and OH69 showed very little response (Figures E-5-1O and E-5-11).
Long-term fluid-level monitoring was not conducted to determine whether the test hole fluid
levels completely recovered with time. Therefore, no firm conclusion can be made as to the
degree of the potential dewatering of the fracture systems that occurred during the pumping
tests. Hole OH66 exhibited limited fluid-level recovery upon termination of pumping. The
limited recovery, combined with the distribution and degree drawdown, suggests that the local .
fractured reservoir is limited in volume and that fracture systems ar~marginally
interconnected.
Response to OH62 pumping was limited to the holes toward the interior of the core library
(Figure E-5-12). The hole adjacent to OH62 (OH61) showed significant response, as
demonstrated in Figure E-5-11. OH63, located only 5 ft (1.5 m) away, showed no response
to OH62 pumping, indicating a very limited fracture system confined to the alcove and not
connected to the older W170 drift.
The hydrologic data generated from pumping OH66 and OH62 were inadequate for
performing aquifer test analysis. Therefore, no analysis other than the- evaluation of fracture
relationships and drawdown was attempted.
The third pumping drawdown test was conducted at the EO drift test site (Figure E-2-2)
during the period of December 14 through 17, 1992. This field effort was performed as a
retest of the initial test conducted here in October 1992. The purpose of the retest was to
AU04-95IWPIWIP:R3192-E E-44 301681008

BRINE SAMPUNG AND EVALUATION PROGRAM REPORT 1992-1993 APPENDLXE
Approximate zone of influencefrom pumping OH62
LO.toJ:o
cotoJ:o
•
•
to c:n~. ~.o 0
('t)
~.o
S400
c~.o
c:n:2.o
• Test Hole Location
Figure not to Scale
Figure E-5-12Test Holes at the W170 Site Showing Response to Pumping OH62,
November 1992
E-45

BRINE SAMPLING AND EVALUATION PROGRAM REPORT 1992-1993 APPENDIX E
determine whether reconditioning of the test holes would enhance the water-yielding
characteristics of the holes, as well as the surrounding fractured zone. However, the
reconditioning effort removed most of the brine from t~e test holes, and their fluid levels had
not fully recovered by the time this test was initiated. Test hole reconditioning including
chipping and vacuuming muck and fill material from the sides and bottoms of the test holes.
For this final test, three separate holes were pumped during individual pumping episodes.
Initially the centrally located hole, OH74, was used as the pumping hole, as it was during the
first test at this site. On the following day, holes OH72 and OH71 were used as pumping
holes. In each effort, the selected hole was pumped dry within 2 hours or less, indicating that
the fractured zone was not yielding brine to the pumped hole at an adequate rate to keep up
with the pumping.
As with the initial test at this site, all holes were instrumented with pressure transducers, and
background pretest water-level data were recorded. These fluid-level data are continuous
through the end of the pumping tests. Background fluid-level data collection began on
December 14, 1992, in preparation for the pumping test scheduled for the following day.
Figures E-5-13 and 5-14 show hydrographs of test holes OH71, OH72, OH73, OH74, OH70,
OH75, and OH78 through the end of all three pumping tests. These hydrographs show that
any significant response to pumping OH74 (the first of the three holes pumped during this
test period) is limited to OH70, OH73, and OH75. These three test holes are the closest to
the pumped hole. However, review of the hydrographs shows that there was at least a minor
response to pumping in most of the holes where a response was observed during the initial
test in October 1992. The hydrographs also show that fluid levels had not completely
recovered by the time that data collection was terminated.
The pumping drawdown-type test was conducted on December 15, 1992, using OH74 as the
pumping hole. The test began at 12:00 p.m., attempting to achieve a flow rate of
approximately 4.5 gph (17 Lph). The pumping discharge rate was continuously monitored
and adjusted until the desired flow rate was attained. The 4.5-gph (17-Lph) flow rate was
selected because it was lower than that used during the October test and could possibly
prolong pumping and, therefore, generate more data for analysis. The actual pumping rate
varied from 4.19 to 5.84 gph (15.9 to 22.1 Lph), with an average of 4.70 gph (17.8 Lph).
AU04-95/WPJWIP:R3 I92-E E-46 3016&1.00&

301681.009.00.OOOIlfd A331/27/95
2.0
til:;Q
~
~"C
Ct5~~r-~::loz
~~~~
~~
TransducerAdjustment
0.0
2.5
,.5
i OH72
8I OH74Ci.ia..
1.0trJ - .J OH71Q)I ....~ ::l-.....l l/l
-"--- OH73l/lQ)....a..
.50
""~
~
":'
I'Start of
Pumping #1Start of Start of
Pumping #2 Pumping #3
·0.5 Iii iii iii I I I I I Iii I i I I I I I i I I I I i I I I Iii i I I i I Iii I I I I i I Iii Iii Iii I I I iii Iii
15 16 17 16 19 20 21 22 23 24 1 2 3 4 '5 6I
10/15
9 10 11 12 13 14 15 16 17 16 19 20 21 22 23 24 1 2 3 4 5 6 7 6 9 10 11 12 13 14 15 16 17 16 19 20 21 22 23 24 I 2 3 4 5 6 7 6 9I I
10/16 10117
Time (Hours)
Figure E-5-13Hydrographs of the EO Site Testholes OH71, OH72, OH73, andOH74 Through the End of the Pumping Test, December 1992
~S<m

0.0
301681.009 00 OOOnld A349/21/94
til
'"~1Il
~"CCza
25, ~0
~c:
20 -i~0Z"C
8& ~U5 15
~
e:. a~
~
=' ~Ul OH76 ,-- ---Ul r-ID ~0: 1.0
-- ---- '"
tTl OH70I
+:>-00
.50~ OH75'\ - '-
Start ofPumping #1
Start of Start ofPumping #2 Pumping #3
·05 \ iii I I I j j iii j iii iii j iii iii iii I i j i j j j iii Iii Ii' i I I j iii iii j i j j j i j j j j j I I
15 16 17 18 19 20 21 22 23 24 1 2 3 4 5 6 7 8 9 10 11 12 13 14 15 16 17 18 19 20 21 22 23 24 1 2 3 4 5 6 7 8 9 10 11 12 13 14 15 16 17 18 19 20 21 22 23 24 1 2 3 4 5 6 7 8 9I I I
12/15 12/16 12/17
Time (Hours)
Figure E-5-14Hydrographs of the EO Site Testholes OH70, OH75, and
OH78 Through the End of the Pumping Test, December 1992
»"C
~><tTl

BRINE SAMPLING AND EVALUATION PROGRAM REPORT 1992·1993 APPENDIX E
This test lasted until 1:50 p.m., when the fluid level in the pumped hole OH74 drew down to
a level below the pump intake for a total test duration of approximately 1 hour and 50 min.
This retest was approximately 1.5 hours shorter in duration than the original test at this site.
The shorter pumping duration is the result of having a shorter fluid column in the pumping
hole, giving less available drawdown. :rhe short duration of the test and rapid drawdown
suggest that reconditioning the holes did little to enhance results from the pumped hole.
During this test, fluid levels in all holes were continuously monitored using transducers and
the datalogger. In add~tion, one transducer was set up as a barometer to monitor changes in
atmospheric pressure.
After allowing the test area to recover overnight, a second pump test, using hole OH72 as the
pumped hole, was attempted on December 16, 1992, at 10:46 a.m. Hole OH74, used for the
test the previous day, had not fully recovered by the time the second test started. At the start
of the second test, the pumping discharge rate was quickly established at approximately 4.0
gph (15.1 Lph). The fluid level dropped below the pump intake before the next flow rate
could be determined. The second pumping event was terminated at 11:14 a.m., after only 28
min of pumping. These results indicate that the surrounding fracture system yielded very
little, if any, fluid to the pumped hole. The volume discharged by pumping appears to equal
the fluid volume stored in the test hole.
Considering the rapid dewatering of the two previous test holes, the decision was made to
perform a third pumping test in a separate test hole. It was anticipated that the staged
pumping episodes might yield some additional information about the geometry and
interconnection of fracturing at the test site by potentially creating overlapping drawdown
responses or different responses in individual test holes.
Prior to initiating the third pumping test, the EO test site was allowed to recover for
approximately 2 hours. Fluid levels in all holes were monitored continuously during this
recovery period. The third pumping event, using hole OH71 as the pumped hole, began at
1:00 p.m. on December 16, 1992. Initially, the pumping discharge rate was measured at
approximately 6.64 gph (25.1 Lph). The discharge rate was subsequently lowered to less than
5.0 gph (18.9 Lph). However, the hole pumped down to a level below the pump intake
before the second flow rate could be accurately determined. The test was stopped 1:16 p.m.
Review of the pressure readings in OH71 showed that negative pressure values were
AU04·95IWPIWIP:R3192·E E-49 301681.008

BRINE SAMPLING AND EVALUATION PROGRAM REPORT 1992-1993 APPENDIX E
registered after only 9 to 10 min of pumping, indicating that the water level had already
dropped below the transducer port by that time.
Recovery of the test area fluid levels was monitored until the following morning, when all
data collection was terminated.
E5.3.1 Test Performance and ResultsFigure E-5-15 shows the holes that exhibited at least some drawdown response to pumping
OH74. The hydrographs in Figures E-5-13 and E-5-14 show that OH70, OH73, and OH75
are the only holes to respond significantly to pumping OH74. In contrast to the initial test
performed at this site in October 1992, drawdown response during the December 1992 test
was not as widespread and was less pronounced. The decreased response to pumping could
be the result of the test area now having fewer interconnected saturated fractures, resulting in
a decrease in reservoir size. The smaller saturated area may be the result of fluid removal
from the test holes during previous pumping and hole reconditioning. The apparent decreased
drawdown may also be the result of the holes not having recovered from previous fluid
withdrawal and now having much lower fluid levels prior to this pumping test.
The test holes that showed measurable drawdown did exhibit recovery after pumping ceased
in hole OH74. The apparent recovery trends as seen in Figures E-5-13 and E-5-14 suggest
that with time, fluid levels may return to their pretest levels. Aquifer test analysis of the
drawdown data from pumping OH74 was not performed. The data generated from this pump
test are inadequate for performing such analysis with confidence.
Figure E-5-16 shows the test holes that showed some response to the pumping of the second
test hole (OH72). Only holes OH73 and OH74 appear to respond to pumping. The apparent
response is limited to a slight short-term decrease in fluid pressure or a reduction in the rate
of recovery from the OH74 pumping test.
The limited response seen in other holes at the site indicates that OH72 is not hydraulically
well connected by fractures to the central part of the test site. This observation is supported
by the drawdown responses seen from the previous tests performed at this site. The holes
that did show a slight response to pumping are located along the EO drift centerline and back
toward the intersection with the N620 alcove. No response was measured at the holes to the
AlJO.l-95IWPI\VIP·R3192-E E-50 301681.008

BRINE SAMPLING AND EVALUAnON PROGRAM REPORT 1992-1993
N
OH77
•Approximate zone of influence
from pumping OH74
N620
Test hole location
•OH71
•oW
Figure not to scale
OH78
APPENDIXE
Figure E-5-15Test Holes at the EO Site Showing Response to Pumping OH74
During the Retest at This Site, December 1992
E-51
----~---

BRINE SAMPUNG AND EVAlUA1l0N PROGRAM REPORT 1992·1993
N
OH77
•
APPENDlXE
Approximate zone of influencefrom pumping OH72
Test hole location
•
Figure not to scale
N62Qi
OH76
•OH75
•OH74
.OH78
OH71
•
ow
Figure E-!5-16Test Holes at the EO Site Showing Response to Pumping OH72
During the Retest at This Site, December 1992
E-52

BRINE SAMPLING AND EVALUATION PROGRAM REPORT 1992-1993 APPENDIXE
south of OH72, down the drift, supporting the conclusion that fracturing at this site is
somewhat limited to the general area of the intersection. The rapid dewatering of OH72
indicates that the fracture system around this test hole has a very low permeability and that
the available fluid reservoir may be very limited in volume.
The hydrologic data generated from pumping OH72 are insufficient for performing an
analysis to define hydrologic parameters. Therefore, no analysis other than the evaluation of
drawdown and fracture relationships was attempted.
'"The third and final pumping test at the EO drift test site was conducted using hole OH71 as
the pumping hole. Figure E-5-17 shows the holes at the test site that responded to pumping.
No drawdown response was seen in any of the test holes, except OH71, which was the
pumped hole. The test results support the conclusion that interconnected fracture systems are
absent or at least not significant away from the intersection of the EO drift and the N620
alcove. Evaluation of the volume of fluid pumped from OH71 suggests that no fluid was
donated to the pump hole by the surrounding fractured formation. Therefore, the fracture
system in the EO drift around OH71 is of very low permeability, and the available fluid
reservoir is small.
The hydrographs in Figures E-5-13 and E-5-14 show that all other test holes continued to
recover from previous pumping activity and were not affected by pumping OH71. Hole
OH71 recovered approximately 50 percent of the drawdown achieved during the test by the
time that data collection was terminated. Posttest fluid-level monitoring was not long enough
to determine whether any of the test holes recovered to their pretest fluid levels.
No drawdown response to pumping OH71 was observed in any of the test holes at the site.
Therefore, no pumping test analysis can be performed for this test.
E5.4 Geologic Logging of CoresAs part of the program for hydrologic testing of the fractured part of the DRZ, continuous
cores were collected from each of the test holes drilled at the EO and W170 test sites. These'
cores were drilled using air to a depth of at least 1 ft beneath the base of MB 139. The cores
were logged according to standard procedures established by the WIPP Geotechnical
Engineering Section. Of particular importance to this study are the descriptions of fractures
AU04-95IWPIWIP:R3192-E E-53 301681.008

... ",
~~
I~oooci8~;;M
BRINE SAMPUNG AND EVALUATlOK PROGRAM REPORT 1992-1993
N
OH77
•
APPENDIXE
OH70 •
Approximate zone of influence N620from pumping OH71 ~
Test hole location
•
OH76
•OH75
•OH74
• OH78
OH73
•OH72
•
oW
Figure not to scale
Figure E··5-17Test Holes at the EO Site Showin£l Response to Pumping OH71
During the Retest at This Site, December 1992E-54

BRINE SAMPLING AND EVALUATION PROGRAM REPORT 1992-1993 APPENDIX E
and separations in the core samples. These core descriptions reveal where the fractured part
~f the hydrologic system being tested occurs. The data presented in the core logs indicate
that, in general, the anhydrite of Iv1B 139 often contains numerous fractures and core breaks,
especially in the lower one-half of the bed. The breaks noted in the lower part of the core
from ME 139 may signify the presence of fractures in those locations in the subsurface.
Figure E-5-18 presents the core descriptions of holes OH66 and OH74, which were used as
pumping holes (and are representative of the conditions) at each of the two test sites.
Figure E-5-18 shows that fractures within the lower portion of Iv1B 139 may be the most
prominent fluid transmitting part of the fractured zone beneath the WIPP underground
excavations. However, the existence of breaks in the core samples·does not necessarily
represent open brine-filled fractures in the subsurface.
Hole OH66 was used as the pumping hole during the second pumping test conducted at the
W170 test site (Section E5.2). This hole pumped dry quickly, indicating that the local
permeability of the fracture system was very low and that the fractures yielded little fluid to
the hole during pumping. Therefore, the fractures and breaks observed in the core of OH66
either may not be open in the subsurface or may not be well connected to the overall test area
fracture system.
Hole OH74, used as a pumping hole at the EO test site, also exhibits fractures and breaks in
the core sample examined. In this case, the performance of the hole during pumping suggests
that the fractures may be better connected to the surrounding area and are possibly more open
to transmit fluid during pumping.
E6.0 Summary and Recommendations'--- _The main objective of the Hydrogeologic Testing of the Fractured Part of the Disturbed Rock
Zone Beneath the WIPP Excavations Program is to characterize the hydrologic conditions of
fracture systems beneath the floor of the repository. Short-duration hydraulic tests were
conducted at two underground test sites. These tests were conducted at the intersection of the
EO drift and N620 alcove and in the W170 drift, in front of the underground core library.
AU04-95IWPIWIP:R3I 92·E E-55 301681.008

8.6· 9.15 Feet: Argillaceous Halite; translucenltoreddish-brown; medium crystallinepolyhalite; gray clay stringers; tracereddish-orange polyhalne blebs.
9 Feet
BRINESAMPUNG AND EVALUATION PROGRAM REPORT 1992-1993 APPENDIXE
OH74 OH66
"'"' jl~~;g~ it~-
8 0.0 • 3.75 Feet: Halne; translucent to light brown;jl
0.0 • 4.8 Feet: Halne; translucent. light brown to
~medium crystalline. scattered light reddish brown; medium crystalline,gray and reddish brown clay stringers. scattered moderate gray clay stringers
f8 Some reddish orange polyhalne blebs. 1 Foot it decreasing downward; some reddish0 orange polyhalne blebs and stringers;'" some core washou1 along clay seamsjl «1/16 inch) thick between 0.15 and
it 1.0 feel.
jl2 Feet it
jlitjl
3 Feet itjlitjl
4 Feet itjl
3.75·5.2 Feet: Polyhalttic Halne; translucent reddish- itorange, medium to coarsely crystalline;abundant reddish-orange polyhalneblebs and stringes.
5 Feet
4.8 • 6.35 Feet: Polyhalnic Haltte; translucent moderatereddish orange; coarsely crystalline;scattered reddish orange polyhaliticblebs and stringers; zone of clear totranslucent halite 5.75·5.85 feet; sharp
5.2· 7.05 Feet: Anhydrne (Marker Bed 139); reddish6 Feet basal contact (·25 degrees).
brown to moderate gray; thinly beddedto laminated; light gray clay filledfractures along bedding planethroughout length of Markerbed 139;fracture zones between 6.0 - 6.5 feet Fracturesand 6.7 - 6.8 feet; thin medium grayclay «1/16 inch) along basal contact.
7 Feet
6.35 • 8.6 Feet: Anhydrite (Marker Bed 139); moderate
Argillaceous Halne; light brown,reddish·brown to medium gray;
7.05 ·9.0 Feet: banded to thick laminar; thintranslucent; medium to coarsely
Fractures«1/4 inch) moderate gray clay along
crystalline. reddish-brown and light basal contact; core breaks at 7.2 feet.gray clay stringers; reddish orange 8.0 feet, 8.05 feel. 8.3 feet, 8.55 feet;polyhalnic blebs and stringers. breaks along bedding planes from
8 Feet 8.0-8.6 feel; sharp horizontal basalcontact.
Figure E·,S-18Core Log Description Diagram for Pump Test Holes
E-56

BRINE SAMPLING AND EVALUATION PROGRAM REPORT 1992·1993 APPENDIX E
These two sites were selected because of their age, their physical characteristics, their
relationships to other excavations, the existence of fractures, and their exposures to long
periods of water-spreading to control dust and to assist in roadbed consolidation.
Test results indicate that the significant fracture systems that yield water to test holes are
restricted to MB 139. For the two sites tested, there appears to be separate, saturated
unconnected fracture systems of fairly low transmissivity. At the EO test site, fracture
systems that are connected are confined to the immediate intersection of the drift and alcove.
For the W170 site, the intersection did not contain significant connected fractures. Based on
the observed drawdown response to pumping, the area within the core library appeared to be
underlain by a somewhat more connected fracture system. This condition could be influenced
by the width of the individual excavations. The W170 drift, although much older, has a
relatively narrow opening in comparison to the core library. These data suggest that
excavation dimensions may play a more important role than age in fracture development.
The posttest fluid-level recovery observed at the test sites suggests that the fracture systems
beneath these areas are limited, and the available fluid reservoirs are smalL Although long
term fluid-level monitoring was not conducted as part of this field program, the data gathered
indicate that pumping at these sites was dewatering the fracture systems.
The results of the pumping tests support the concept of limited, bounded fractured fluid
reservoirs. Data analysis from the EO test site showed clear changes in the slope of the
plotted drawdown curves for some test holes, indicating the presence of nearby no-flow or
low-permeability boundaries. Testing at the W170 site did not produce adequate data for
aquifer test analysis.
The Jacob and Theis methods were used to determine transmissivity and storage coefficients
for the first test at the EO site. The calculated transmissivities for all holes were 0.7 to
9.9 ft2/day. Storage coefficients-ranged from 0;00038 to 0.0034, indicating that the fracture
system at the EO site is partially confined.
Additional test sites should be developed to define better the nature of fracturing in areas
other than the intersections of drifts and rooms. The EO test site could be expanded to both
the north and south of the current site to allow comparative testing. If the test site was
AUQ.t·95IWPIWIP:R3192·E
----------
E-57 301681.008

BRINE SAMPLING AND EVALUATION PROGRAM REPORT 1992-1993 APPENDIX E
expanded, the results of pump testing away from the drift and alcove intersection could be
compared to the results produced by this study, and the effects of excavation geometry could
be quantified. Additional testing should be conducted at the lowest possible flow rates for the
longest time achievable, and fluid-level rec'overy should be monitored long term.
The test site located near the AIS in the S90 drift should be prepared for hydrologic testing
by providing access to all test holes. This will require moving the electrical substation and
other equipment away from the site. This is an important test site, because it was the site of
the original fractured zone test in 1988. Fracturing may have become better developed since
the initial test was conducted. This site may provide the best location to observe time
dependent development of fracture systems.
E7.0 References _
Bechtel National, Inc. (Bechtel), 1986, "Interim Geotechnical Field Data Report," WIPP-DOE86-012, prepared for the U.S. Department of Energy by Bechtel National, Inc., San Francisco,California.
Crawley, M. E., T. W. Cooper, and R. G. Richardson, 1992, "Hydrologic Testing of theFractured Part of the Disturbed Rock Zone Beneath the WIPP Excavations," report filed by ITCorporation for Westinghouse Electric Corporation, Carlsbad, New Mexico.
Deal, D. E., and J. B. Case, 1987, "Brine Sampling and Evaluation Program, Phase I Report,June, 1987," DOE-WIPP-87-008, prepared for the U.S. Department of Energy byIT Corporation and Westinghouse Electric Corporation, Albuquerque, New Mexico.
Deal, D. E., and W. M. Roggenthen, 1991, "Evolution of Hydrologic Systems and BrineGeochemistry in a Deforming Salt Medium: Data from WIPP Brine Seeps," Proceedings ofWaste Management '91, Tucson, Arizona, Vol. 2, pp. 507-516.
Deal, D. E., R. J. Abitz, D. S. Belski, J. B. Case, M. E. Crawley, R. M. Deshler, P. E. Drez,C. A. Givens, R. B. King, B. A. Lauctes, J. Myers, S. Niou, 1. M. Pietz, W. M. Roggenthen,J. R. Tyburski, and M. C. Wallace, 1989, "Brine Sampling and Evaluation- Program 1988Report," DOE-WIPP-89-015, Waste Isolation Pilot Plant, U.S. Department of Energy,Carlsbad, New Mexico.
Deal, D. E., R. J. Abitz, D. S. Belski, J. B. Clark, M. E. Crawley, and M. L. Martin, 1991,"Brine Sampling and Evaluation Program, 1989 Report," DOE-WIPP 91-009, Waste IsolationPilot Plant, U.S. Department of Energy, Carlsbad, New Mexico.
AU04-95IWPIWIP:R3192·E E-58 301681.008

BRINE SAMPLING AND EVALUATION PROGRAM REPORT 1992·1993 APPENDIX E
Geraghty and Miller, 1989, "AQTESOLV," Aquifer Test Design and Analysis ComputerSoftware, Geraghty and Miller Modeling Group, Reston, Virginia.
Lohman, S. W., 1972, "Ground-Water Hydraulics," U.S. Geological Su!\'ey Professional .Paper 708, U.S. Government Printing Office, Washington, D.C., 70 pp.
Westinghouse Electric Corporation, 1987, "Geologic Rock Coring Logging," Waste IsolationPilot Plant Procedure WP 07-502, Carlsbad, New Mexico.
AU04-95IWPIWIP:R3 I92-E E-59 301681.008

BRINE SAMPLING AND EVALUATION PROGRAM REPORT 1992-1993 APPENDlXF
APPENDIX F
NUMERICAL MODELING OF BRINE SEEPAGE FROMCLAY COMPACTION
AU>9·94/WP/WIP:R3192·F 301681.08

BRINE SAMPLING AND EVALUATION PROGRAM REPORT 1992-1993
THIS PAGE INTENTIONALLY LEFT BLANK
AUl9-94!WP/WIP:R3192-F
APPENDIXF
301681.08

BRINE SAMPLING AND EVALUATION PROGRAM REPORT 1992-1993
APPENDIX F
APPEl'o"DIXF
F1.0 Introduction~------------------------
These calculations are order-of-magnitude calculations to approximate how much brine might bereleased to Waste Isolation Pilot Plant (WIPP) excavations assuming that the only source of brineare saturated clays within thin clay seams in the Salado Formation (Deal and others, 1993; Deal andBills, 1994). The three analyses consider consolidation of thin compressible clay layers due to theredistribution of stress and generation of excess pore pressure within the clay layers after entry orroom excavation. The modeling assumptions are as follows:
Stress redistribution results in a localized increase in stress that is far more significant ingenerating excess pore pressure than in near-ground surface consolidation. The stressredistribution deforms the clay, plastically generating an excess pore pressure of severalmegapascals (MPa) within the disturbed rock zone (DRZ).
Transient flow to the excavation or boundary dissipates the excess pore pressure withinthe clay layer.
• The rate of flow depends on the consolidation properties of the clay (hydraulicconductivity, compressibility, and porosity), the cross-sectional area of the clay seamsintercepting the excavation, and the extent of the DRZ.
The tributary method predicts the resulting increasing in the total stress of 3 MPa.Consider that after 1,000 days (Deal and others, 1989, Figure 5-4), the stressabutment zone extends out about 5 excavation diameters. The average diameter forthe room is about 3 meters (m).
• The compressibility of the clay is 10-7 Pa-1 corresponding to a clay of mediumcompressibility. The hydraulic conductivity of the clay is 10-8 centimeters per second(cm/s). Under a change in effective stress-of3"MPa after consolidation is complete,the change in porosity is 30 percent.
F2.0 Room Q. _
F2.1 Problem Statement
Calculate the amount of brine released to Room Q for two clay seams 3.5 millimeters (mm) thickabove and below the orange band (Map Unit 1). The model for consolidation assumes that theincrease in stress deforms the clay seams plastically, resulting in 3 MPa of excess pore pressure.Brine flow is induced to the room excavation because of the excess pore pressure. Theconsolidation of the clay layer is substantial, with a change in porosity of 30 percent.
AL/09-94/WP/WIP:R3192-F F-1 301681.08
'rf",.

BRINE SAMPLING AND EVALUATION PROGRAM REPORT 1992-1993 APPENDIXF
F2.2 Solution
From Deal and others (1989, p. 5-19), the stress abutment zone extends out about 5 diametersafter about 1,000 days. Calculate the size of the abutment for Room Q. The diameter of Room Qis 1.5 m. The length (L) over which flow occurs is:
L :=5·1.5·m L=75()ocm
From Freeze and Cherry (1979, p. 55), the clay compressibility (Uclay) and porosity (<!» are:
10-7 P -1 '" :=0.50a. clay := . a 't'
Calculate the change in porosity that results from compression of the clay in the DRZ.
6a. clay"3· 10 ·Pa = 0.3
The change is substantial and agrees with observation of "squeezing ground."
Calculate the void ratio (e), the conductivity (k), and the coefficient of consolidation (Cy) for the clay.
From Freeze and Cherry (1979) and Scott (1963):
e:=-~1- ~
k:= 1O-8.cmsec
p wo := 1.0· gmcm3
k·(l + e)
p wo·g·uclay
where:
e=1
cm2
c v =O.002·-sec
Pwo = unit weight of water
g =acceleration constant
AL/09-94/WP/WIP:R3192-F F-2 301681.08

BRINE SAMPLING AND EVALUATION PROGRAM REPORT 1992-1993
Calculate the initial excess pore pressure head (Vo)
APPENDIXF
3·106.Pav O:=---p wo·g
We consider the lateral flow to the room over the length of the abutment zone L with zero pressure atthe room boundary and a "no flow" boundary condition at the edge of the DRZ. See Scott (1963, p.184) for explanation of similarities between the thermal case and the consolidation case. We initallydefine the complementary error function.
From Carslaw and Jaeger (1959, p. 309), the solution for excess pore pressure dissipation is asfollows:
erfc(x) := 1- erf(x) 1C :=c v
[
20 20 ]v(x,t) :=V 0- V O' L (_1)D.erfc[(2.n+ 1)·L- x] + L (_1)D.erfc[(2.n+ 1)·L+ x]
n=O 2.~ n=O 2'~
where:
Vo = initial temperature (analogous to initial excess pore pressure)
V(x,t) = temperature as function of space and time (analogous to excess pore pressureover a steady state pore pressure as a function of space and time)
= thermal diffusivity (analogous to coefficient of consolidation)
t = time
x = distance (x= 750 cm at the Room Q boundary, and x=O cm at the far field)
erfc(x) = complimentary error function
erf(x) = error function, and
n = series index.
With the above properties, plot the distribution of excess pore pressure at several times.
x.=0·L,.01·L..L
AL/09-94/WP/WIP:R3192-F F-3 301681.08

BRIN"E SAMPLING At'll) EVALUAnON PROGRAM REPORT 1992-1993 APPENDIXF
700 800600500400300200100
0L...-_--L__--L...__-I--_-..I__~__...L-__.L.....;;::lJ___l
o
Excess PorePressure Head 2"10
4
(em)
t= 0.01 yrt= 1 yrt= 3 yr
Distance (x)(cm)
Figure F-2-1
Pore Pressure Distribution Around Room Q
The analysis shows agreement with boundary conditions of the problem. Differentiate thesubexpressions with respect to x in the brackets to develop the flux rate.
[
20 20 ]va-va· L C_1)n.erfc[C2.n+1).L-X] + L C_1)n.erfc[C2.n+1).L+X]
n=O 2.~ n=O 2.~
Differentiate the following subexpressions:
erfc["':"'C2_·n~+~1....:..)_·L_-_X]
2.~and erfc[C2.n+ 1)·L+ x]
2.~
by differentiation with respect to x yields
[-1 CC2·n+ 1)·L- xl]exp - ....;...;...-----'-----'-
1 4 Cl(·t)
~ ([c.~)
and [-1 CC2.n+1).L+X)2]exp - ....;...;...-----'-'---'-
-1 4 Cl(·t)
~ ([c.~)
AL/09-94f\VPf\VIP:R3192-F F-4 30168I.OlS

BRINE SAMPLING AND EVALUATION PROGRAM REPORT 1992-1993
Check the dimensions of the result for correctness.
t := 100·yr n :=0 x :=L
The dimensions of thesubexpression are correct.
APPEXOIXF
Substitute the subexpressions into the sums to calculate the hydraulic gradient.
[
[-1 ((2·n+ 1)·L- X)2]20 exp - ......;..;...----'---
V _ v. L: (_1)n. _1. 4 (K·t)
o 0 n=O ~ (~.~)
Consider the flux through the cross-sectional area of flow. The flux equals the hydraulic conductivitytimes the thickness times the length of the clay seam times the number of clay seams. The clay seamsizes are from Table 4-3 of Deal and others (1993). Evaluate the area through which the brine isflowing. There are two clays seams each 3.5 mm thick and 100 m long on each side of the room.Area = 2 * 3.5 mm * 2 *100 m = 1.4 m2.Evaluate the the flux q(t) at the boundary x = L.
x:=L
[
[-1 ((2.n+1).L-X)2]]20 exp -.---'----'----'-L: (_1)n. _1. 4 (K·t)
n=O ~ (~.~)20 [exp[=.L((2.n+ 1).L+X)2]]
+ L: (_1)n• .:..!... 4 (K·t)
n=O ~ (~.~)
Check the result with an approximate relation for the derivative after one year.
em3q(l.yr) =823·-
day
AL/09-94/WP/WlP:R3192-F
3k.-l.l.4.m2. veL, 1·yr) - v(.999·L, 1·yr) = 823.em
.001·L day
F-5 301681.08

BRINE SAMPLING Al'm EVALUATION PROGRAM REPORT 1992-1993 APPENDIXF
The results are in agreement. The inflow rate after 10 years and after 20 years will be as follows:
crn3
q( lO'yr) = 59"-day
andcrn
3
q(20·yr) =3.5"-day
Plot the inflow rate as a function of time over the peJiod from 800 days to 25 years. See Howarthand others (1994) for measurement time period.
. :=800·day, lOOO·day .. lOOOO·day
600,..-----.------,.---..,.------..----.----.....
O·day
Inflow Rate 400
(mL/day)
200
30252015105
0~___L___l__-=::l:::===aJ. .l___.....J
o
Time (years)
Figure F-2-2
Brine Inflow into Room Q
Determine the cumulative flow over time by integration of the flow rate relation with time. Integrateeach subexpression separately, and combine in the sums.
r[-1 «2·n+ 1)·L- X)2]exp - ....:...:...----=----=-
1 4 (IN)
~ (J:c.~)
by integration, yields
rr [-1 (-2'L.n-L+X)2] (-2·L·n-L+x) I i l (-2.L.n-L+X)]]2''''I'exp -' T ·'\f1C·e -.--,-----
L 4 (I'K) J:c 2 (J:c.~) _(~.~)
AL/09-94fWPfWIP:R3192-F F-6 301681.08

BRINE SAMPLING AND BYALUATION PROGRAM REPORT 1992-1993
and the following term:
[
exp[.:J..,...:...;((:.....-2·_n...:....+--:1)_.L--=.+_x.:...-)2]-1 4 (JC·t)
J;c (~.~)
by integration, yields
[2r [-1 (2.L.n+L+X)2] (2·L·n+L+x) 1 11 (2.L.n+L+X)]]- ·'lJt·exp -' + ·'I/n·e -'~-:---'--"":-"':"
4 (t·~) ~ 2 (~.~)
APPENDIXF
Substituting the subexpressions into a subexpression (G(t)) and calculating the cummulativeflow rate (Q(t)):
n=O
e(t) :=
and
[[
~ [-1 (-2.L.n-L+X)2] (-2·L·n-L+x) J;c 1 1 (_2.L.n_L+X)]]]20 2· t·exp -4. (t.JC) + 1 . n·e 2',-,--...,.....(-I. r"""-)----'-L (_1)D. 'l/ JC "'JC'lJ t
n=O (J;c.~)
[2 r [-1 (2.L.n+L+X)2] (2·L·n+L+x) 1 11 (2.L.n+L+X)]]
- ·'lJt·exp 4' (t.JC) +. 1 ·'I/n·e 2' (I r)(_1')D. 'II JC '" JC''IJ t
(J;c.~)
(2 V 0 )Q(t) :=e(t)· k·1.4·m . em ·sec
... ·1
Check the analysis against direct numerical integration:
-1Q(l600·day)- Q(800·day) = 317.777'em ·sec 'liter
TOL:= 1.0 (TOL is calculation tolerance)
11600'daYq(t) dt =317.777·liter
800·day
AL/09-94/WP/WIP:R3192-FF-7 301681.08
~--- -~~ ------,-

BRINE SAMPLING AND EVALUATION PROGRAM REPORT 1992-1993 APPENDIXF
The results of the closed-fonn solution agree with the numerical analysis.
Plot the cumulative flow with time.
t := 800·day, 900·day .. 1600·day
400
1O·day
300
200Cumulative Brine(liters)
100
150010005000'-------.1.----'-----'--------1---'
o
Time (days)
Figul'e F-2-3
Cumulative Flow into Room Q
F2.3 Conclusions
The results agree approximately with the measured flow into Room Q (see Howarth and others,1994).
AL/09-94/WPfWIP:R3192-F F-8 301681.08

BRINE SAMPLING AND EVALUATION PROGRAM REPORT 1992-1993 APPENDIXF
F3.0 Standard WIPP Waste Storage Room. _
F3.1 Problem Statement
Calculate the amount of brine released to a Waste Disposal Room, from two clay seams totaling17.1 mm thick above and below the orange band (Map Unit 1). The model for consolidationassumes that the increase in stress deforms the clay seams plastically resulting in 3 MPa of excesspore pressure. Brine flow is induced to the room excavation due to the excess pore pressure. Theconsolidation of the clay layer is substantial with a change in porosity of 30 percent.
F3.2 Solution
From Deal and others (1989, p. 5-19), the stress abutment zone extends out about 5 diametersafter about 1,000 days. Calculate the size of the abutment for the Waste Storage Room. Thediameter of a Waste Disposal Room is 3.56 m (see Deal and others, 1993, p. 2-2). The length (L)over which flow occurs is:
L :=5·3.56·m L =17.S·m
From Freeze and Cherry (1979, p. 55), the clay compressibility (uc1ay) and porosity(<\»
are:
10-7 P -1a. clay := . a lJ> :=0.50
Calculate the change in porosity due to compression of the clay in the DRZ.
The change is substantial and agrees with observation of "squeezing ground."
Calculate the void ratio (e), the conductivity (k), and the coefficient of consolidation (ev) for the clay
(from Scott, 1963 and Freeze and Cherry, 1979):
e:=_lJ>_1-lJ>
k:= 10-8•emsec
p wo := 1.0· gmem3
C'= k·(l+e)
v·p wo·g·a. clay
AL/09-94/WP/WJP:R3192-F
e=l
2emc v =0.002·-
sec
F-9301681.08

BRINESAL\1PLING AL'lD EVALUATION PROGRAM REPORT 1992-1993
Calculate the initial pore pressure head (V0)
APPENDIXF
We consider the lateral flow to the room over the length of the abutment zone L with zero pressureat the room boundary and a "no flow" boundary condition at the edge of the DRZ. See Scott(1963, p.184) for more details in the similarities between the thermal case and the consolidationcase.
From Carlsaw and Jaeger (1959, p. 309), the solution for excess pore pressure dissipation is asfollows:
erfc( x) := 1 - erf( x) lC :=c v
[
20 20 ]v( x, t) := V 0 - v O· L (- 1)n.erfc[ (2'n+ 1)·L- x] + L: (-1 )n.erfc[ (2'n+ 1)·L+ x]
n=O 2.~ n=O 2.~
where:
Vo =initial temperature (analogous to initial excess pore pressure)
v(x,t) = temperature as function of space and til11e (analogous to excess porepressure over a steady state pore pressure as a function of space and time)
K = thermal diffusivity (analogous to coefficient of consolidation)
t = time
x =distance
erfc(x) = complimentary error function
erf(x) =error function, and
n = series index
ALl09-94f\VP/WIP:R3192-F F-lO 301681.08

BRINE SAMPLING AND EVALUATION PROGRAM REPORT 1992-1993
With the above properties, plot the distribution of pore pressure at several times.
x :=O·L,.Ol·L.. L4.104
I I I
Excess Pore 3°104 f=" -- -Pressure Head - .........
(cm) '-k ""-
2°104 I- "- -"-Note that at "-
x = 1780 em is at "- ,
the Waste Disposal 1°104 I- "- " -Room Wall, and at \',x = 0 is at the far field \-boundary. 0 I I I
0 500 1000 1500 2000t= 0.01 yrt= 1 yr Distance (x)(cm)t=3 yr
APPENDIXF
Figure F·3·1
Pore Pressure Distribution Around Standard WIPP Waste Disposal Room
The analysis shows agreement with boundary conditions of the problem. From the former'equation:
[
20 20 ]V 0- V O' L (_1)O.erfc[(2.n+ l)·L- x] + L (_l)o.erfc[(2.n+ l)·L+ x]
n= 0 2.j;r n=·O 2.j;r
Differentiate the following subexpressions from the former equation to develop the flux.
erfe[...:..(2_·n_+,-1-:..)_.L_-_X]
2'~
by differentiation with respect to x yields
[-1 «2·n+ l).L- X)2]exp -.-'-'------
1 4 (IN)
~ (~.~)
AL/09-94/WP/WIP:R3192-F F-ll
erfe[(2.n+ l)'L+X]
2.~
[-1 «2·n+ 1).L+ X)2]exp -.-'-'------
-1 4 (1(·t)
~ (~.~)
301681.08

BRL'lE SAMPLING A.l'm EVALUATION PROGRAM REPORT 1992-1993
Check the dimensions of the result for correctness.
APPE:-'TILX F
t := 100·yr n :=0 x:=L x =17.8·m
The dimensions of thesubexpression are correct.
Substitute the subexpressions into the sums to calculate the hydraulic gradient.
Consider the flux through the cross-sectional area of flow. The flux q(t) equals the hydraulicconductivity times the thickness times the length of the clay seam times the number of clayseams. The clay seam sizes of (3.5 + 3.5 + 10.1) = 17.1 rom for the clay seams are fromTable 4-3 of Deal and others (1993). The length of the room is 91.4 m from Case et al.,(1991, p. 2-4). Note that we multiply by 2 to account for both sides of the room. Evaluate thethe flux at the boundary x = L:
x:=L
q(t) :=k.-l.2.17.1.mm.91.4.m.(V 0.-1).[-1 «2·n+ 1)·L- X)2]]20 exp _.~----'----'-
~ .n 1 4 (lC·t)LA (-1)· -. .'.
n=O . ~ (~.~)
20 exp[=_L «2·n+ 1)·L+ X)2]1~ n -1 4 (lC·1)+ LA (- 1) . -.--=----,----,-------=-
n=O ~ (~.~) _w
Check the result with an approximate relation for the derivative after one year.
em3
q(l'yr) = 1.837.103,-
day
k.- 1.2.17.1.mm.91.4.m. veL, l·yr) - v(.999·L, j.yr) = 1.837.103
.001·L
3,emday
AL/09-94/WP/WIP:R3192-F F-12 301681.08

BRINE SAMPLING AND EYALUATION PROGRAM REPORT 1992-1993
The results are in agreement. The inflow rates after 10 and 20 years will be:
APPENDIXF
cm3q( 10·yr) =573·-
day
cm3
q(20·yr) =341·-day
Plot the inflow rate as a function of time over the period from ato 200 years.
t:= l·yr,2.yr .. 200·yr
2000 r--------,r--------,-------,.-------,
IO·day
1500
Inflow Rate(mL/day)
1000
50 100
Time (years)
150 ZOO
Figure F-3-2
Brine Inflow into a Waste Disposal Room
Determine the cumulative flow over time by integration of the flow rate relation with time. Integrateeach subexpression separately and combine in the sums.
[
[-1 ((2'n+ 1).L- X)Z]]exp -'~-----'"-----'"-
1 4 (IN)
~ ([C.1t)
by integration, yields
[r [-1 (-2'L.n-L+X)Z] (-2·L·n-L+x) , 11 (-2.L.n-L+X)]]2·", t'exp -' + ·'l/1t·e -.-'-----,-----,--
4 (t'K) $c 2 ([C.1t)(~.[c)
AL/09-94twPlWlP:R319Z-F F-13 301681.08

BRINE SAMPLING AND EVALUATION PROGRAM REPORT 1992-1993
similarly,
l exp[:.!.....:...((~2_.n-'-+_1.::-)._L_+......:X)...:...2]-1 4 (K·t)
-Fe (~.~)
by integration, yields
[2r [-1 (2·L·n+ L+ X)2] (2·L·n+ L+ x) 1 11 (2·L·n+ L+ X)]]- ''I[t'exp -' + ·"'1t·e -.-'---....,....---...,---
4 (t'K) ~ 2 (~.~)
APPENDIXF
Substituting the subexpressions into to subexpressions G(t), and calculating the cumulativeflow rate Q(t):
e(t) :=
and
[r [-1 (-2.Lo n-L+X)2] (-2·L·n-L+x) 1 11 (-2.Lo n-L+X)]]
20 2''I[t'exp 4' (t'K) + 1 ·"'1t·e 2'~--;-(-I. r--:-)--'-I: (_1)0. "'K "'K'I[t
n =0 (-Fe.~)
[2r [-1 (2.L.n+L+X)2] (2·Ln+L+x) 1 11 (2.L.n+L+X)]]- ·'I[t·exp -' + ·"'1t·e -'-'-....,....---...,--"':'"
20 4 (t'K) 1 2 ( I. r)+ I: (_1)0. "'K "'K'I[t
n=O (~.~)
Q(t) :=e(t).(ko 1.2.17.1.mm.91.43.m.:: .see)
... ·1
Check the analysis against direct numerical integration:
TOL := 0.05 TOL is calculation tolerance
3 -1Q( 200·yr) - Q( 0.1·yr) = 7.924·10 "em "sec "liter
J200'yr
q(t) dt =7.946.103 "liter.1·yr
The results of the closed form solution agree with the numerical analysis
AL/09-94f\VP/WIP:R3192-F F-14 301681.08

BRINE SAMPLING AND EVALUATION PROGRAM REPORT 1992-1993 APPE!\'DIX F
Plot the cumulative brine with time.
t:= .1·yr,2.1·yr.. 200·yr
8000r----T--===:::==p====9=====,
Cumulative
Brine(liters)
20015010050ol.------...l.-------'--------'"--------'
o
Time (years)
Figure F·3·3Cumulative Flow into a Waste Disposal Room
F3.3 Conclusion
The amount of brine entering a waste disposal room is 8,000 L after about 100 years.
AL/09-94/WPfWlP:R3192-F F-15 301681.08

BRINE SAMPLING AND EVALUATION PROGRAM REPORT 1992-1993 APPE:--TIIX F
F4.0 Axial Consolidation Around a Borehole---------F4.1 Problem Statement
Calculate the amount of brine released to a vertical borehole intercepting a clay layer that isundergoing consolidation. Consider that the borehole is in the floor of Room G and intercepts aI-em-thick clay layer 10 m below the floor.
F4.2 Solution
From Scott (1963, p. 203), the average degree of consolidation, U(Tr,m) is given by:
T r-2·-
U (T r' m) :=1 - e m
r en=
r w
where:t = time,Tr = dimensionless time,
K = constant related to the surface resistance,kr = hydraulic conductiv.ity,
re = effective radius of drainage,
rw = radius of the borehole
cr = coefficient of consolidation
m = dimensionless coefficient, andn = dimensionless coeffi'cient for radius.
Construct a plot of the degree of consolidation with the dimensionless time.
AL/09-94f\VP/WIP:R3192-F F-16 301681.08

BRINE SAMPLING AND EVALUATION PROGRAM REPORT 1992-1993 APPE~'DIXF
T r :=0.01,0.02.. 5
Degreeof
Consolidation (U)
10
Dimensionless Time(Tr)
0.1-1'-------1-------'----"-=---=----'
0.01
m=1m=2m=4m=8
Figure F-4-1
Degree of Consolidation with the Dimensionless Time
The results agree with the results in Scott (1963, p. 202).
From Freeze and Cherry (1979, p. 55), the clay compressibility (Xclay is as follows:
10-7 P -1ex clay := . a
Note that initially the excavation compresses the sidewalls, with a resulting increase in stress thatcould be predicted by the tributary method. Consider that after 1,000 days from Deal and others(1989, p. 5-19), the stress abutment zone extends out about 5 excavation diameters. The averagediameter for the room is:
Y3 0
:" 130ft =3.562-m
At this time the stress abutment zone extends out 17.8 m as given in the VISCOT analysis in Dealand others (1989), the increase in stress in MPa is
3.562. 15 =3.00217.8
AL/09-94/WP/WIP:R3192-F F-17301681.08

BRINE SAMPLING A,\ID EVALUATION PROGRAM REPORT 1992-1993 APPE!'-'DIXF
These calculations suggest that the increase in stress is of the order of 3 to 5 MPa. Calculate thecumulative amount of brine that would flow to the borehole due to an average increase in stress of 3MPa.
ll<jl := 0.3
t:=l·em
t.Aclay·~<PVolume :=--=----
1Volume =2.9860 103 ·liter Volume :=340.234
Where:tAVolume~<!>
=thickness of the clay seam=area affected by a chnage in stress= volume of brine stored in the clay= change in porosity of seam
Consider the properties of the borehole, and the clay. From Deal and others (1989, Table A-I), thediameter of the hole (a) is
a:=3.5·in a=8.89oem
From Freeze and Cherry (1979, p. 37), the porosity (<!» of clays range from 40 to 70 percent. Use
<P :=0.5
The void ratio (e) is:
e:=_<P_1- <P
e=l
From Freeze and Cherry (1979, p. 29), the hydraulic conductivity of clays (kr) ranges from 10-6 to
10-8 em/sec. Use
k r := 10-8. emsec
AL/09-94f\VP/WIP:R3192-F
IbfYwo := 62.4·
ft3
emg = 980.665.
2sec
F-18
Ywo gm--=1·-
g em3
301681.08

BRINE SAMPLING Al'l,'D EVALUATION PROGRA~ REPORT 1992-1993 APPE:-'TIIXF
Calculate the coefficient of consolidation. From Scott (1963, p. 184) ,the coefficient ofconsolidation is
1+eC r :=k r·----
y wo·a. clay
2emc r =0.002o-sec
Consider the effective radius of drainage (re ) equal to the far-field distance from the center of the
borehole (Deal and others, 1989, p. 5-19).
r e :=20'm
and the diameter of the borehole equal to:
rw:=a r w =0.089 om
Calculate the dimensionless coefficients. Consider a range for the ratio
t rT =c·r r 2
r e
n=224.972
2r e- = 62.124 0yrc r
2 2 2. ,n 3'n - 1 . n - 1
Il(Ratlo) .=--·In(n) - + (Rauo)·--? ? ?
n- - 1 4'n- n-
where:I-l(Ratio) = function of the ratio
kr
r ·Kw
kr = the permeability of the undisturbed clay
11K =surface resistanceTr = dimensionless time factor
tr = time
m is not sensitive to the ratio. Use 0.2 for a middle range m value
Ratio :=.2
m := Il( Ratio)
AL/09-94/WP/WIP:R3192-F
m =4.866
F-19 301631.08

BRINE SA..\1PLING AND EVALUATION PROGRAM REPORT 1992-1993
Determine the cumulative amount of brine flowing to the borehole.
T r :=0.01,0.02.. 1.3
150,.---,..---.,..----r----.------,
Cumulative 100
Flow(liters)
50
APPE:-'UIX F
Time (years)
100
Figure F-4-2
Cumulative Inflow to a Borehole
Consider the flow rate as a function of time.
[
t ]c .-r .,
2 r e- C rU d(t,m) :=-·exp -2·-- .-
m m 2r e
t :=0·yr,.1·yr.. 20·yr
AL/09-94/WP/WIP:R3192-F
-5 1U d(l·yr,m) =1.799°10 °dai
F-20 301681.08

BRINE SAMPLING AND EVALUATION PROGRAM REPORT 1992-1993 APPE~'DIXF
Flow Rate(liters/day)
80006000400020000.0052l-------L.----....L...-------'L...-------I
o
Time (No. ofdays)
Figure F-4-3
Brine Inflow to a Borehole
F4.3 Conclusion
It will take a very long time for flow to dissipate pore pressure for a radial hole penetrating a 1 cmthick clay seam. DH36, DH38, DH40, DH42, and DH42A all intersect the clay seam B and showthe following flow rates:
DH36DH38DH40DH42DH42A
0.10.030.0080.010.02
L/DayL/DayL/DayL/DayL/Day
F5.0 Summary. _
These order-of-magnitude seepage calculations compare well with the observed seepages into theWIPP excavations. In the case of Room Q, calculated seepage rates are on the order of 0.3 L/dayafter 1,600 days, where the observable rate is 0.17 L/day (Howarth et aI., 1994, Figure 3). In thiscase, the numerical model is for flow toward the room along a thin clay seam. Extending this modelto a waste storage room predicts that total seepage into the room will be on the order of 9,000 L,far short of the 220,000 L necessary to completely corrode the susceptible metals that will beemplaced in it (Deal et aI., 1991, Section 4.6). Furthermore, seepage into the room will cease afterabout 100 years.
AL/09·9-t/WP/WIP:R3192-F F-21301681.08
~ '.--~----0" _ ... ~__, _

BRINE SAMPLING Ai'll) EVALUATION PROGRAM REPORT 1992-1993 APPE."'DIX F
The case for seepage into a downhole drilled into strata below a WIPP excavation behavesdifferently, because flow is radially toward the drillhole. In this case, some seepage continues for along time, perhaps a thousand years or more. It is clear that seepage into drillholes is strikinglydifferent from seepage into a repository excavation. Deal et al (1993, Section 2.7.2) pointed outthat seepage into drillholes probably should not be used to predict long-term seepage into a WIPPWaste Storage Room after sealing and closure. This calculation provides additional support for thiscaution.
AL/09-94f\VP/WIP:R3192-FF-22 301681.08

BRINE SAMPLING AND EVALUATION PROGRAM REPORT 1992-1993 APPENDIXF
F6.0 References------------------------Carslaw, H. S., and J. C. Jaeger, 1959. "Conduction of Heat in Solids," Oxford at the ClarendonPress, Oxford, England.
Case,1. B., C. A. Givens, and J. R. Tyburski, 1991. "The Geotechnical Effects of AlcoveExcavation on Panel 1," DOEIWIPP 91-017, U. S. Department of Energy, Carlsbad, NM.
Deal, D. E., and R. A. Bills, 1994, "Conclusions After Eleven Years of Studying Brine at the WasteIsolation Pilot Plant", Waste Management '94, Tucson, Arizona, March 2, 1994, IT Corporation,Albuquerque, New Mexico, and Carlsbad Area Office, U. S. Department of Energy, Carlsbad,New Mexico.
Deal, D. E., R. J. Abitz, J. Myers, D. S. Belski, M. L. Martin, D. J. Milligan, R. W. Sobocinski,P. P. James Lipponer, 1993. "Brine Sampling and Evaluation Program: 1991 Report," DOE-WIPP93-026, U. S. Department of Energy, Carlsbad, New Mexico.
Deal, D. E., R. J. Abitz, D. S. Belski, J. B. Case, M. E. Crawley, R. M. Deshler, P. E. Drez, C. A.Givens, R. B. King, B. A. Lauctes, J. Myers, S. Niou, J. M. Pietz, W. M. Roggenthen,1. R. Tyburski, and M. G. Wallace, 1989. "Brine Sampling and Evaluation Program: 1988 Report,"DOE-WIPP-89-015, U. S. Department of Energy, Carlsbad, New Mexico.
Freeze, R. A. and J. Cherry, 1979. "Groundwater," Prentice Hall, Englewood Cliffs, NJ.
Howarth, S., K. Larson, T. Christian-Frear, R. Beauheim, D. Borns, D. Deal, A.L. Jensen,K. Pickens, R. Roberts, M. Tierney, P. Vaughn, and S. Webb, 1994. "Salado Formation FluidFlow and Transport Containment Group - White Paper for Systems Prioritization and TechnicalBaseline, Rev. 1," Prepared by Sandia National Laboratories/New Mexico for the U.S. Departmentof Energy, Carlsbad, New Mexico.
Scott, R. F., 1963. Priliciples ofSoil Mechanics, Addison Wesley, Reading, Massachusetts.
AL/09·94/WP/WIP:R3192·F F-23301681.08

BRINE SAMPLING AND EVALUATION PROGRAM REPORT 1992-1993
THIS PAGE INTENTIONALLY LEFT BLANK
ALI09-94/WP/W1P:R3192-F
APPENDIX F
30168\.08
Related Documents