Vision h-s. Vol. 26. No. 6, pp. 899-908, 1986 0042-6989/86 $3.00 + 0.00 Printed in Great Britain. All rights reserved Copyright c 1986 Pergamon Journals Ltd BRIGHTNESS SHIFT IN DRIFTING RAMP GRATINGS ISOLATES A TRANSIENT MECHANISM PATRICK CAVANAGH’ and Smmr M. ANSTIS~ ‘Dtpartement de Psychologie, Universite de Montreal, Montreal, Quebec, Canada H3C 3J7 and ‘Department of Psychology, York University, Downsview, Ontario, Canada M3J lP3 (Received 17 July 1985; in revised form 13 Jruruary 1986) Abstract-A brightness shift is demonstrated for moving ramp stimuli. The data suggest that the transient visual response to changing luminance is combined with the sustained response to produce an overall impression of brightness. We attribute the brightness shift to the saturation of the transient response: a limitation on the maximum transient when responding to rapid brightening or dimming. The brightness shift provides a new technique for isolating the responses of the transient mechanisms. Brightness Brightness illusion Transient mechanisms Spatial vision Visual psychophysics DJTRODUCTION A ramp grating consists of shaded stripes whose luminance profile is a repetitive ramp or saw- tooth waveform (Fig. 1). This paper investigates some illusory effects of apparent brightening and dimming which are seen when a ramp grating is in motion. To move the image of Fig. 1 across your retina, run your finger along the horizontal border between the two gratings and track it with your eyes. As your eyes move smoothly to the left, the upper grating immedi- ately looks lighter than the lower grating. On moving your finger to the right, the upper grating looks darker than the lower. This effect is the topic of this paper. We measured this shift of brightness with drifting gratings displayed on a T.V. screen. It is important to note that this brightness shift is not simply an attenuation of the high spatial and/or temporal frequencies of the sharp rise or fall at the end of each ramp. A high- frequency rolloff of spatial or temporal fre- quencies will simply round off the corners of the ramp but it cannot shift the mean (or D.C.) level as that is the lowest frequency component: 0 Hz or Oc/deg. Similarly, the well known non- linearity of the receptor luminance response (see Robson, 1975) will affect the mean level of the postreceptor waveform compared to that of the prereceptor signal, but this error, unlike the brightness shift, is unaffected by the direction in which the ramps move. To explain the bright- ness shift we will have to look more closely at the encoding of brightness in the visual system and possible nonlinearities of the response to ramp stimuli. The fact that the brightness shift occurs only during movement or temporal change indicates that it is caused by the transient visual response to the stimulus. The transient response is deter- mined not by the instantaneous luminance level but by its rate of change over time, that is, by its temporal slope. Kitterle and Corwin (I 983) and Kitterle and Toney (1983) have described a flashed stimulus where the rate of onset of the flash influences its perceived brightness, im- plying, according to them, that transient re- sponses do contribute to brightness perception. The Broca-Sulzer and Brucke-Bartley effects (Bartley, 1941; Katz, 1964; Magnussen and Glad, 1973) also suggest the participation of transient mechanisms in brightness perception. Our experiments serve to link directly the brightness shift seen in Fig. 1 to nonlinearities in the transient response. EXPERIMENT 1: LUMINANCE The drifting ramp gratings were displayed on a computer-controlled television set. The dis- play was 8 deg’ and comprised two windows 6 deg wide x 3 deg high one above the other, 899

Welcome message from author
This document is posted to help you gain knowledge. Please leave a comment to let me know what you think about it! Share it to your friends and learn new things together.
Transcript
Vision h-s. Vol. 26. No. 6, pp. 899-908, 1986 0042-6989/86 $3.00 + 0.00 Printed in Great Britain. All rights reserved Copyright c 1986 Pergamon Journals Ltd
BRIGHTNESS SHIFT IN DRIFTING RAMP GRATINGS ISOLATES A TRANSIENT
MECHANISM
PATRICK CAVANAGH’ and Smmr M. ANSTIS~
‘Dtpartement de Psychologie, Universite de Montreal, Montreal, Quebec, Canada H3C 3J7 and ‘Department of Psychology, York University, Downsview, Ontario, Canada M3J lP3
(Received 17 July 1985; in revised form 13 Jruruary 1986)
Abstract-A brightness shift is demonstrated for moving ramp stimuli. The data suggest that the transient visual response to changing luminance is combined with the sustained response to produce an overall impression of brightness. We attribute the brightness shift to the saturation of the transient response: a limitation on the maximum transient when responding to rapid brightening or dimming. The brightness shift provides a new technique for isolating the responses of the transient mechanisms.
Brightness Brightness illusion Transient mechanisms Spatial vision Visual psychophysics
DJTRODUCTION
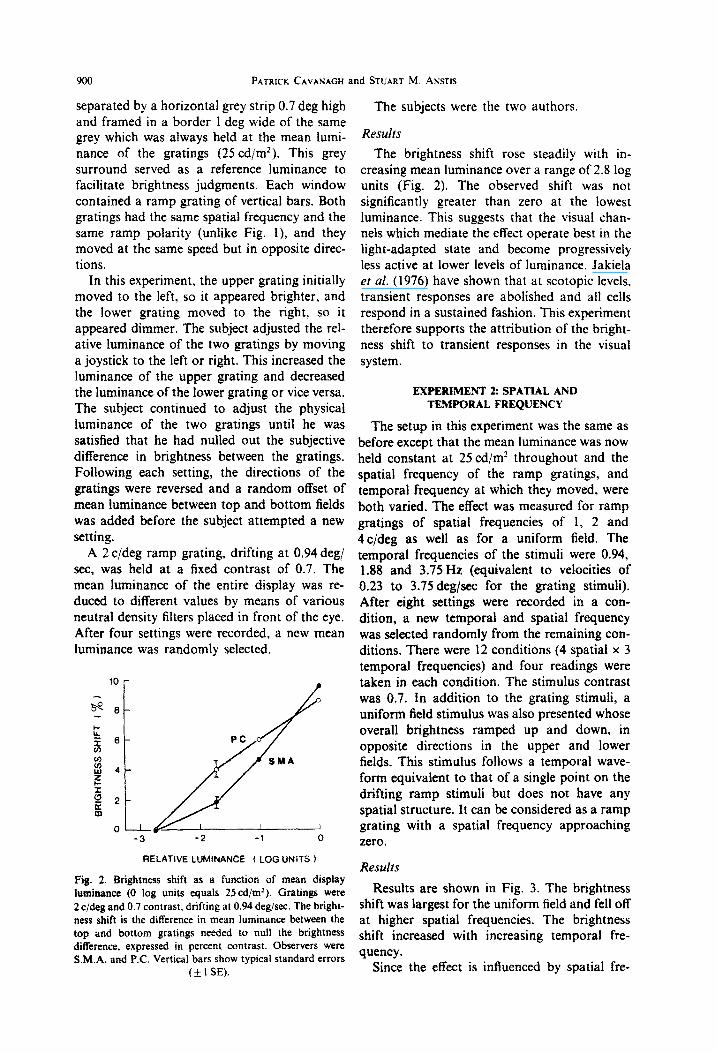
A ramp grating consists of shaded stripes whose luminance profile is a repetitive ramp or saw- tooth waveform (Fig. 1). This paper investigates some illusory effects of apparent brightening and dimming which are seen when a ramp grating is in motion. To move the image of Fig. 1 across your retina, run your finger along the horizontal border between the two gratings and track it with your eyes. As your eyes move smoothly to the left, the upper grating immedi- ately looks lighter than the lower grating. On moving your finger to the right, the upper grating looks darker than the lower. This effect is the topic of this paper. We measured this shift of brightness with drifting gratings displayed on a T.V. screen.
It is important to note that this brightness shift is not simply an attenuation of the high spatial and/or temporal frequencies of the sharp rise or fall at the end of each ramp. A high- frequency rolloff of spatial or temporal fre- quencies will simply round off the corners of the ramp but it cannot shift the mean (or D.C.) level as that is the lowest frequency component: 0 Hz or Oc/deg. Similarly, the well known non- linearity of the receptor luminance response (see Robson, 1975) will affect the mean level of the postreceptor waveform compared to that of the prereceptor signal, but this error, unlike the brightness shift, is unaffected by the direction in
which the ramps move. To explain the bright- ness shift we will have to look more closely at the encoding of brightness in the visual system and possible nonlinearities of the response to ramp stimuli.
The fact that the brightness shift occurs only during movement or temporal change indicates that it is caused by the transient visual response to the stimulus. The transient response is deter- mined not by the instantaneous luminance level but by its rate of change over time, that is, by its temporal slope. Kitterle and Corwin (I 983) and Kitterle and Toney (1983) have described a flashed stimulus where the rate of onset of the flash influences its perceived brightness, im- plying, according to them, that transient re- sponses do contribute to brightness perception. The Broca-Sulzer and Brucke-Bartley effects (Bartley, 1941; Katz, 1964; Magnussen and Glad, 1973) also suggest the participation of transient mechanisms in brightness perception. Our experiments serve to link directly the brightness shift seen in Fig. 1 to nonlinearities in the transient response.
EXPERIMENT 1: LUMINANCE
The drifting ramp gratings were displayed on a computer-controlled television set. The dis- play was 8 deg’ and comprised two windows 6 deg wide x 3 deg high one above the other,
899
9 0 0 PATRICK CAVANAGH and STUART M. A N S T IS
separated by a horizontal grey strip 0.7 deg high and framed in a border 1 deg wide of the same grey which was always held at the mean lumi- nance of the gratings (25 cd/m2). This grey surround served as a reference luminance to facilitate brightness judgments. Each window contained a ramp grating of vertical bars. Both gratings had the same spatial frequency and the same ramp polarity (unlike Fig. 1), and they moved at the same speed but in opposite direc- tions.
In this experiment, the upper grating initially moved to the left, so it appeared brighter, and the lower grating moved to the right, so it appeared dimmer. The subject adjusted the rel- ative luminance of the two gratings by moving a joystick to the left or right. This increased the luminance of the upper grating and decreased the luminance of the lower grating or vice versa. The subject continued to adjust the physical luminance of the two gratings until he was satisfied that he had nulled out the subjective difference in brightness between the gratings. Following each setting, the directions of the gratings were reversed and a random offset of mean luminance between top and bottom fields was added before the subject attempted a new setting.
A 2c/deg ramp grating, drifting at 0.94degl set, was held at a fixed contrast of 0.7. The mean luminance of the entire display was re- duced to different values by means of various neutral density filters placed in front of the eye. After four settings were recorded, a new mean luminance was randomly selected.
1 0 r ?
I OLY -2
I I
-3 -1 0
RELATIVE LUMINANCE ( LOG UNITS f
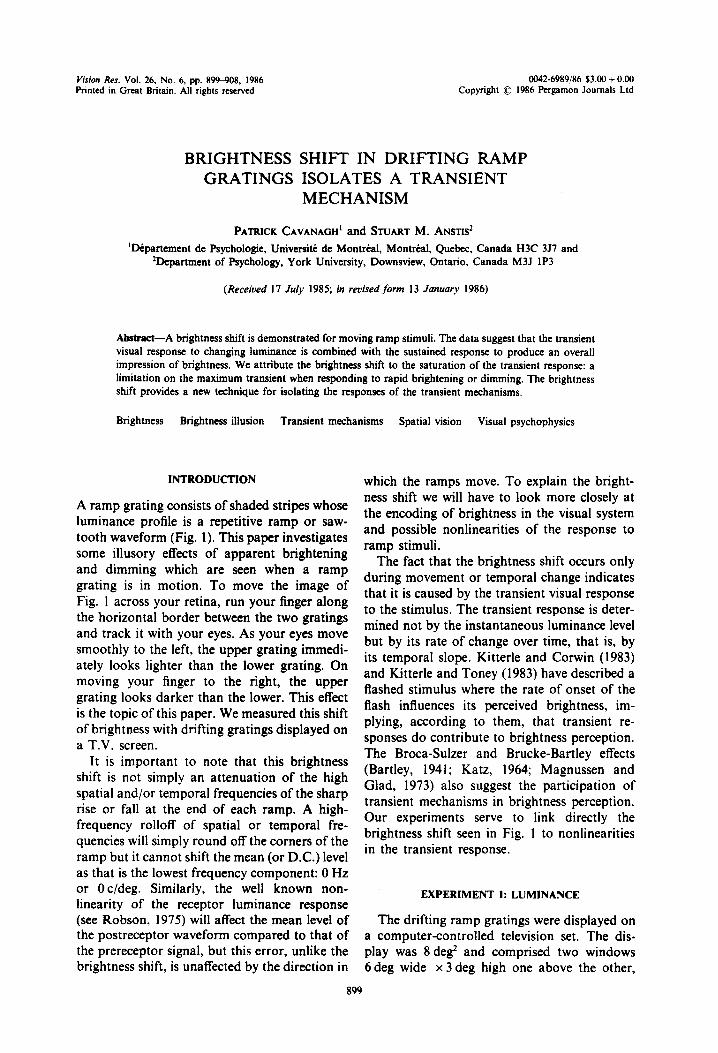
Fig. 2. Brightness shift as a function of mean display luminance (0 log units equals 25cd/m2). Gratings were 2 c/deg and 0.7 contrast, drifting at 0.94 deg/sec. The bright- ness shift is the difference in mean luminance between the top and bottom gratings needed to null the brightness difference, expressed in percent contrast. Observers were S.M.A. and P.C. Vertical bars show typical standard errors
(tl SE).
The subjects were the two authors.
RtWh The brightness shift rose steadily with in-
creasing mean luminance over a range af 2.8 log units (Fig. 2). The observed shift was not significantly greater than zero at the lowest luminance. This suggests that the visual chan- nels which mediate the effect operate best in the light-adapted state and become progressively less active at lower levels of luminance. Jakiela et al. (1976) have shown that at scotopic levels, transient responses are abolished and all cells respond in a sustained fashion. This experiment therefore supports the attribution of the bright- ness shift to transient responses in the visual system.
EXPERIMENT t: SPATIAL AND TEMPORAL FREQUENCY
The setup in this experiment was the same as before except that the mean luminance was now held constant at 25 cd/m2 throughout and the spatial frequency of the ramp gratings, and temporal frequency at which they moved, were both varied. The effect was measured for ramp gratings of spatial frequencies of 1, 2 and 4 c/deg as well as for a uniform field. The temporal frequencies of the stimuli were 0.94, 1.88 and 3.75 Hz (equivalent to velocities of 0.23 to 3.75 degfsec for the grating stimuli). After eight settings were recorded in a con- dition, a new temporal and spatial frequency was selected randomly from the remaining con- ditions. There were 12 conditions (4 spatial x 3 temporal frequencies) and four readings were taken in each condition. The stimulus contrast was 0.7. In addition to the grating stimuli, a uniform field stimulus was also presented whose overall brightness ramped up and down, in opposite directions in the upper and lower fields. This stimulus follows a temporal wave- form equivalent to that of a single point on the drifting ramp stimuli but does not have any spatial structure. It can be considered as a ramp grating with a spatial frequency approaching zero.
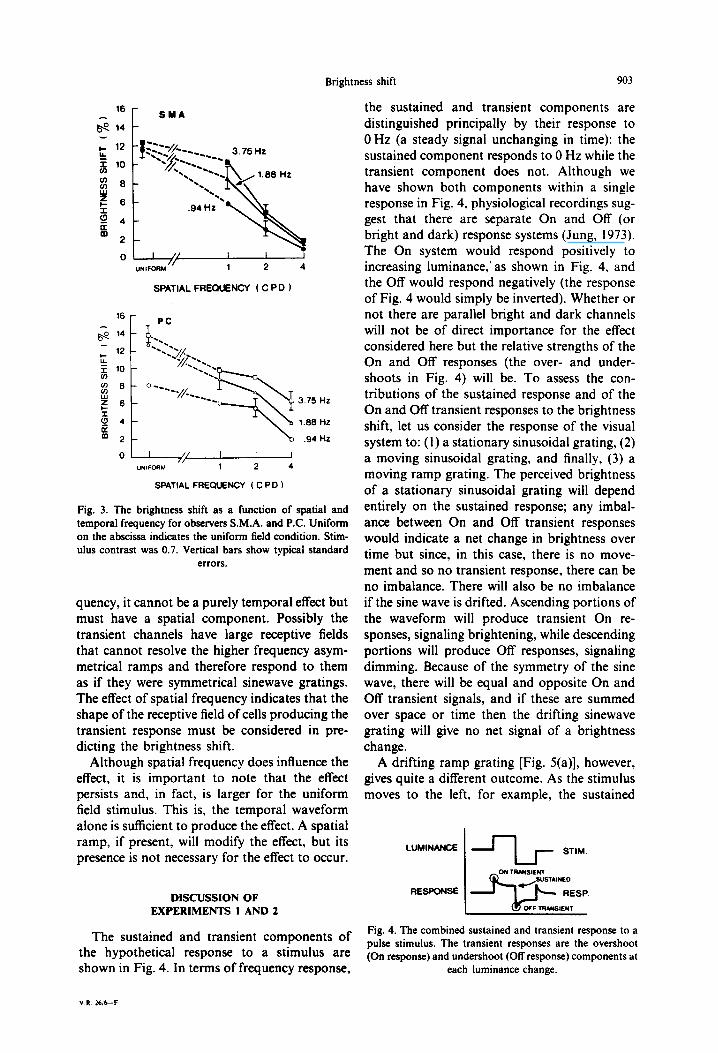
Results Results are shown in Fig. 3. The brightness
shift was largest for the uniform field and fell off at higher spatial frequencies. The brightness shift increased with increasing temporal fre- quency.
Since the effect is influenced by spatial fre-
Fig. 1. Ramp gratings of opposite polarity. Move page rapidly left or right keeping your eyes steady (fixate along the central straight line). Alternatively, move your finger back and forth along the line, following
with your eyes while holding the page steady.
901
Brightness shift 903
% 6 ’ 6 5 p 4
m 2
0 I/
UNIFORM 1 2
SPATIAL FREQUENCY ( C PD )
16 - PC g 14 -
; 12 - Y g 10 -
z 6 -
; 6-
3 4- E m 2-
3.75 HZ
1.66 Hz
.94 HZ
I I I
UNIFORM 1 2 4
SPATIAL FREQUENCY ( C PD )
Fig. 3. The brightness shift as a function of spatial and temporal frequency for observers S.M.A. and P.C. Uniform on the abscissa indicates the uniform field condition. Stim- ulus contrast was 0.7. Vertical bars show typical standard
errors.
quency, it cannot be a purely temporal effect but must have a spatial component. Possibly the transient channels have large receptive fields that cannot resolve the higher frequency asym- metrical ramps and therefore respond to them as if they were symmetrical sinewave gratings. The effect of spatial frequency indicates that the shape of the receptive field of cells producing the transient response must be considered in pre- dicting the brightness shift.
Although spatial frequency does influence the effect, it is important to note that the effect persists and, in fact, is larger for the uniform field stimulus. This is, the temporal waveform alone is sufficient to produce the effect. A spatial ramp, if present, will modify the effect, but its presence is not necessary for the effect to occur.
DISCUSSION OF EXPERIMENTS I AND 2
The sustained and transient components of the hypothetical response to a stimulus are shown in Fig. 4. In terms of frequency response,
the sustained and transient components are distinguished principally by their response to 0 Hz (a steady signal unchanging in time): the sustained component responds to 0 Hz while the transient component does not. Although we have shown both components within a single response in Fig. 4, physiological recordings sug- gest that there are separate On and Off (or bright and dark) response systems (Jung, 1973). The On system would respond positively to increasing luminance,‘as shown in Fig. 4. and the Off would respond negatively (the response of Fig. 4 would simply be inverted). Whether or not there are parallel bright and dark channels will not be of direct importance for the effect considered here but the relative strengths of the On and Off responses (the over- and under- shoots in Fig. 4) will be. To assess the con- tributions of the sustained response and of the On and Off transient responses to the brightness shift, let us consider the response of the visual system to: (1) a stationary sinusoidal grating, (2) a moving sinusoidal grating, and finally, (3) a moving ramp grating. The perceived brightness of a stationary sinusoidal grating will depend entirely on the sustained response; any imbal- ance between On and Off transient responses would indicate a net change in brightness over time but since, in this case, there is no move- ment and so no transient response, there can be no imbalance. There will also be no imbalance if the sine wave is drifted. Ascending portions of the waveform will produce transient On re- sponses, signaling brightening, while descending portions will produce Off responses, signaling dimming. Because of the symmetry of the sine wave, there will be equal and opposite On and Off transient signals, and if these are summed over space or time then the drifting sinewave grating will give no net signal of a brightness change.
A drifting ramp grating [Fig. 5(a)], however, gives quite a different outcome. As the stimulus moves to the left, for example, the sustained
LUMINANCE
Fig. 4. The combined sustained and transient response to a pulse stimulus. The transient responses are the overshoot (On response) and undershoot (Off response) components at
each luminance change.
904 PATRICK CAVANAGH and STUART M. ANSTIS
SUSTAINED
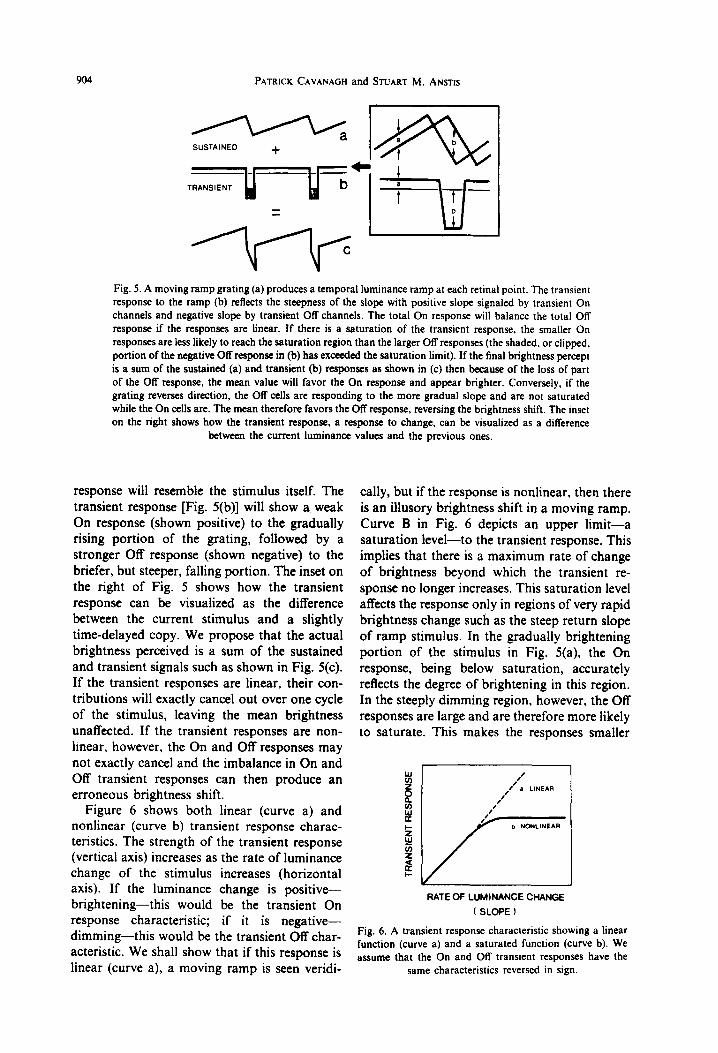
Fig. 5. A moving ramp grating (a) produces a temporal luminance ramp at each retinal point. The transient response to the ramp (b) reflects the steepness of the slope with positive slope signaled by transient On channels and negative slope by transient Off channels. The total On response will balance the total Off response if the responses are linear. If there is a saturation of the transient response. the smaller On responses are less likely to reach the saturation region than the larger Off responses (the shaded, or clipped, portion of the negative Off response in (b) has exceeded the saturation limit). If the final brightness percept is a sum of the sustained (a) and transient (b) responses as shown in (c) then because of the loss of part of the Off response, the mean value will favor the On response and appear brighter. Conversely, if the grating reverses direction, the Off cells are responding to the more gradual slope and are not saturated while the On cells are. The mean therefore favors the Off response, reversing the brightness shift. The inset on the right shows how the transient response, a response to change, can be visualized as a difference
between the current luminance values and the previous ones.
response will resemble the stimulus itself. The transient response [Fig. 5(b)] will show a. weak On response (shown positive) to the gradually rising portion of the grating, followed by a stronger Off response (shown negative) to the briefer, but steeper, falling portion. The inset on the right of Fig. 5 shows how the transient response can be visualized as the difference between the current stimulus and a slightly time-delayed copy. We propose that the actual brightness perceived is a sum of the sustained and transient signals such as shown in Fig. 5(c). If the transient responses are linear, their con- tributions will exactly cancel out over one cycle of the stimulus, leaving the mean brightness unaffected. If the transient responses are non- linear, however, the On and Off responses may not exactly cancel and the imbalance in On and Off transient responses can then produce an erroneous brightness shift.
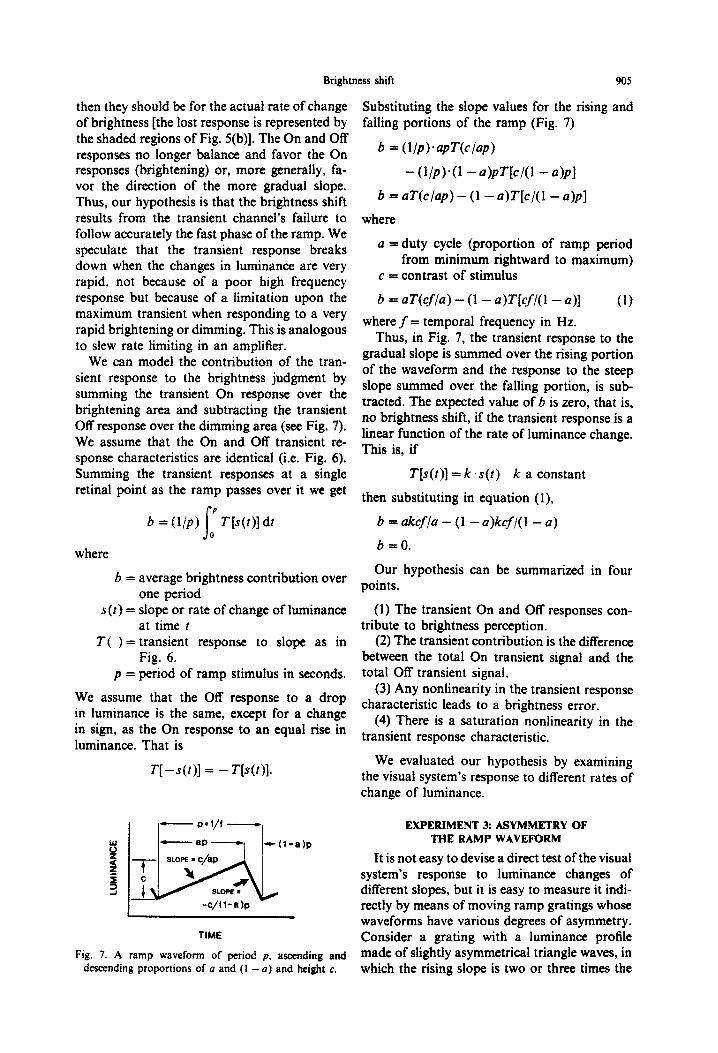
Figure 6 shows both linear (curve a) and nonlinear (curve b) transient response charac- teristics. The strength of the transient response (vertical axis) increases as the rate of luminance change of the stimulus increases (horizontal axis). If the luminance change is positive- brightening-this would be the transient On response characteristic; if it is negative- dimming-this would be the transient Off char- acteristic. We shall show that if this response is linear (curve a), a moving ramp is seen veridi-
cally, but if the response is nonlinear, then there is an illusory brightness shift in a moving ramp. Curve B in Fig. 6 depicts an upper limit-a saturation level-to the transient response. This implies that there is a maximum rate of change of brightness beyond which the transient re- sponse no longer increases. This saturation level affects the response only in regions of very rapid brightness change such as the steep return slope of ramp stimulus. In the gradually brightening portion of the stimulus in Fig. 5(a), the On response, being below saturation, accurately reflects the degree of brightening in this region. In the steeply dimming region, however, the Off responses are large and are therefore more likely to saturate. This makes the responses smaller
RATE OF LUMINANCE CHANGE
(SLOPE)
Fig. 6. A transient response characteristic showing a linear function (curve a) and a saturated function (curve b). We assume that the On and Off transient responses have the
same characteristics reversed in sign.
Brightness shift 905
then they should be for the actual rate of change of brightness [the lost response is represented by the shaded regions of Fig. 5(b)]. The On and Off responses no longer balance and favor the On responses (b~ghtening) or, more generally, fa- vor the direction of the more gradual slope. Thus, our hypothesis is that the brightness shift results from the transient channel’s failure to follow accurately the fast phase of the ramp. We speculate that the transient response breaks down when the changes in luminance are very rapid, not because of a poor high frequency response but because of a limitation upon the maximum transient when responding to a very rapid brightening or dimming. This is analogous to slew rate limiting in an amplifier.
We can model the contribution of the tran- sient response to the brightness judgment by summing the transient On response over the brightening area and subtracting the transient Off response over the dimming area (see Fig. 7). We assume that the On and Off transient re- sponse characteristics are identical (i.e. Fig. 6). Summing the transient responses at a single retinal point as the ramp passes over it we get
’ b = U/P) f
T[s(t)] dt 0
where
s(r) = slope or rate of change of luminance at time t
b = average brightness contribution over one period
T( ) = transient response to slope as in Fig. 6.
p = period of ramp stimulus in seconds.
We assume that the Off response to a drop in l~inance is the same, except for a change in sign, as the On response to an equal rise in luminance. That is
T[ -s(t)] = - T[s(r)].
Fig. 7. A ramp waveform of period p, ascending and descending proportions of (i and (1 - a) and height c.
Substituting the slope values for the rising and falling portions of the ramp (Fig. 7)
b = (l/P).~PW/~P)
- WP)‘(f - QlPm/o - alPI
b = aT(c/fzp) - (1 - u)T[c/(l - U)PJ
where
a = duty cycle (proportion of ramp period from minimum rightward to maximum)
c = contrast of stimulus
b = &&f/Q) - (I - u)T[cf/( 1 - a)]
where f = temporal frequency in Hz. (1)
Thus, in Fig. 7, the transient response to the gradual slope is summed over the rising portion of the waveform and the response to the steep slope summed over the falling portion, is sub- tracted. The expected value of b is zero, that is, no brightness shift, if the transient response is a linear function of the rate of luminance change. This is, if
T[sft)] = k *s(t) k a constant
then substituting in equation (I),
b =ukcf,‘u-(1 -u)kcf/(l -a)
b =O.
Our hypothesis can be summarized in points.
four
(2) The transient contribution is the difference between the total On transient signal and the
(1) The transient On and Off responses
total Off transient signal.
tribute to brightness perception.
(3) Any nonlinearity in the transient response characteristic leads to a brightness error.
(4) There is a saturation nonlinea~ty in the transient response characteristic.
We evaluated our hypothesis by examining the visual system’s response to different rates of change of luminance.
EXPERIMENT 3: ASYMMETRY OF THE RAMP WAVEFORM
It is not easy to devise a direct test of the visual system’s response to luminance changes of different slopes, but it is easy to measure it indi- rectly by means of moving ramp gratings whose waveforms have various degrees of asymmetry. Consider a grating with a luminance profile made of slightly asymmetrical triangle waves, in which the rising slope is two or three times the
906 PATRICK CAVANAGH and STUART M. ANSTIS
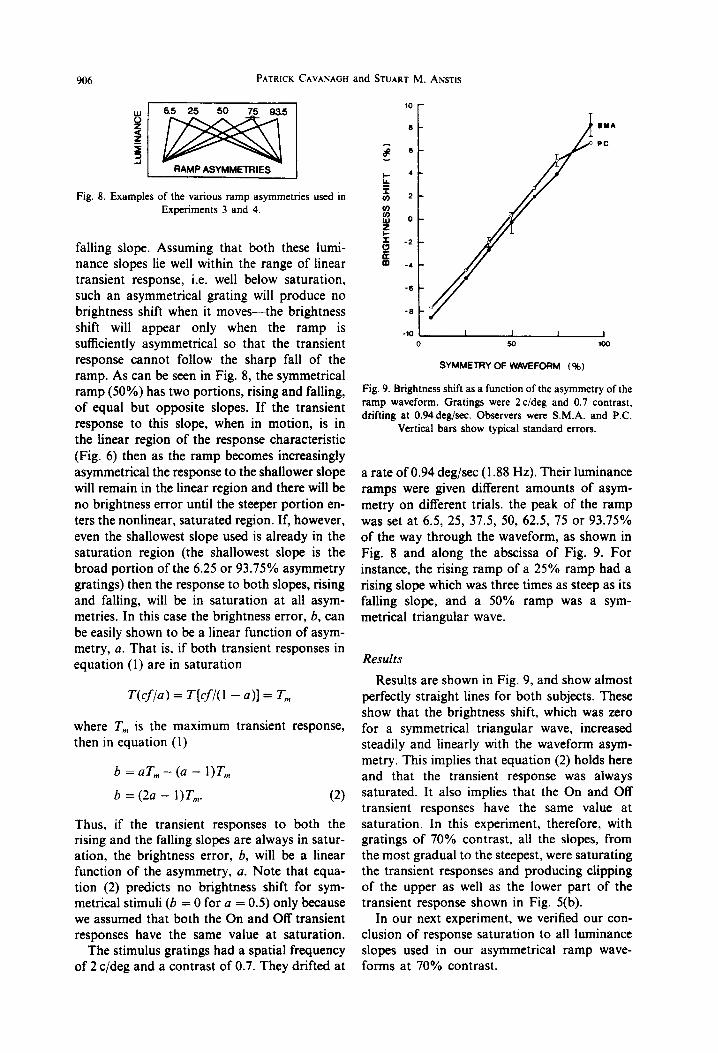
Fig. 8. Examples of the various ramp asymmetries used in Experiments 3 and 4.
falling slope. Assuming that both these lumi- nance slopes lie well within the range of linear transient response, i.e. well below saturation, such an asymmetrical grating will produce no brightness shift when it moves-the brightness shift will appear only when the ramp is sufficiently asymmetrical so that the transient response cannot follow the sharp fall of the ramp. As can be seen in Fig. 8, the symmetrical ramp (50%) has two portions, rising and falling, of equal but opposite slopes. If the transient response to this slope, when in motion, is in the linear region of the response characteristic (Fig. 6) then as the ramp becomes increasingly asymmetrical the response to the shallower slope will remain in the linear region and there will be no brightness error until the steeper portion en- ters the nonlinear, saturated region. If, however, even the shallowest slope used is already in the saturation region (the shallowest slope is the broad portion of the 6.25 or 93.75% asymmetry gratings) then the response to both slopes, rising and falling, will be in saturation at all asym- metries. In this case the brightness error, b, can be easily shown to be a linear function of asym- metry, a. That is, if both transient responses in equation (1) are in saturation
T(cfla) = T[cf/(l - a)] = T,,,
where T,,, is the maximum transient response, then in equation (1)
b = aT,,, - (a - l)T,,,
b = (2~ - l)T,,,. (2)
Thus, if the transient responses to both the rising and the falling slopes are always in satur- ation, the brightness error, 6, will be a linear function of the asymmetry, a. Note that equa- tion (2) predicts no brightness shift for sym- metrical stimuli (b = 0 for a = 0.5) only because we assumed that both the On and Off transient responses have the same value at saturation.
The stimulus gratings had a spatial frequency of 2 c/deg and a contrast of 0.7. They drifted at
10 -
0-
2 e- t 4 -
5 ul *- ul
8 o- E
z _,
-6
-8
SYA
P C
-10 I I 1 I 0 50 loo
SYMMETRY OF WAVEFORM ( 96)
Fig. 9. Brightness shift as a function of the asymmetry of the ramp waveform. Gratings were 2cideg and 0.7 contrast, drifting at 0.94deg/ses. Observers were S.M.A. and P.C.
Vertical bars show typical standard errors.
a rate of 0.94 deg/sec (1.88 Hz). Their luminance ramps were given different amounts of asym- metry on different trials. the peak of the ramp was set at 6.5, 25, 37.5, 50, 62.5, 75 or 93.75% of the way through the waveform, as shown in Fig. 8 and along the abscissa of Fig. 9. For instance, the rising ramp of a 25% ramp had a rising slope which was three times as steep as its falling slope, and a 50% ramp was a sym- metrical triangular wave.
Results Results are shown in Fig. 9, and show almost
perfectly straight lines for both subjects. These show that the brightness shift, which was zero for a symmetrical triangular wave, increased steadily and linearly with the waveform asym- metry. This implies that equation (2) holds here and that the transient response was always saturated. It also implies that the On and Off transient responses have the same value at saturation. In this experiment, therefore, with gratings of 70% contrast, all the slopes, from the most gradual to the steepest, were saturating the transient responses and producing clipping of the upper as well as the lower part of the transient response shown in Fig. 5(b).
In our next experiment, we verified our con- clusion of response saturation to all luminance slopes used in our asymmetrical ramp wave- forms at 70% contrast.
Brightness shift 907
4 . . . . . .
3
75 % ASYMMEIRY 2
~,l
,: 1 :*‘
0 . ..+ . .
0 50 lO0
5-
4- 75% ASYMMETRY
3 -
2 -
I -
CONTRAST (%1
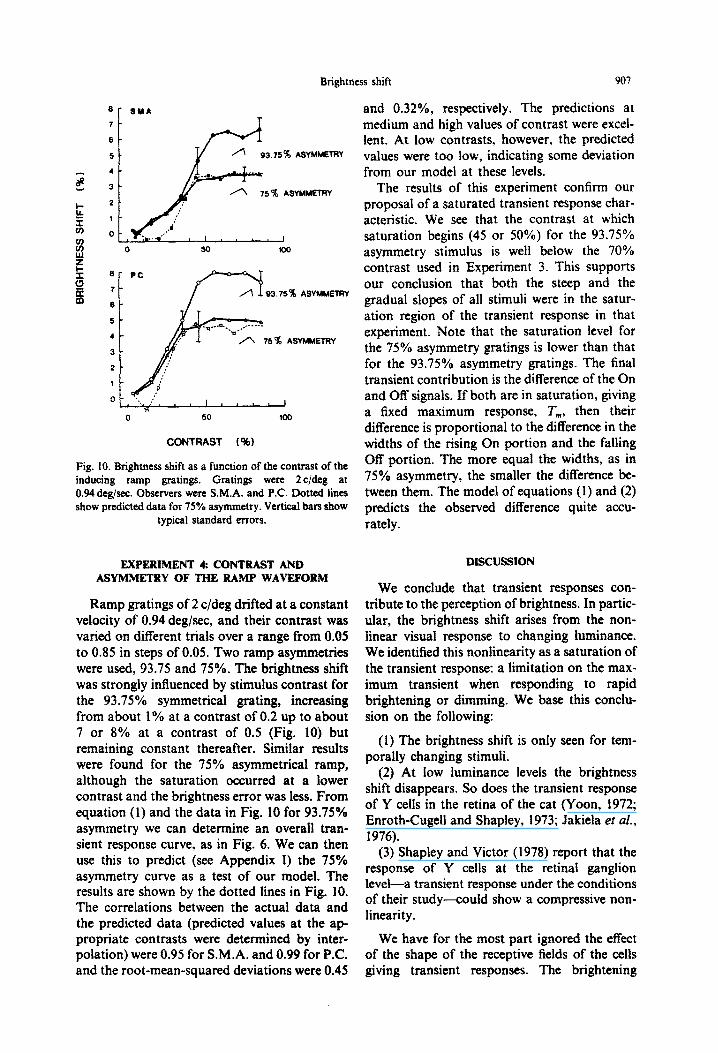
Fig. 10. Brightness shift as a function of the contrast of the inducing ramp gratings. Gratings were 2c/deg at 0.94 deg/sec. Observers were S.M.A. and PC. Dotted lines show predicted data for 75% asymmetry. Vertical bars show
typical standard errors.
EXPERIMENT 4: CONTRAST AND DISCUSSYON ASYMM~RY OF THE RAMP WAHOO
Ramp gratings of 2 c/deg drifted at a constant velocity of 0.94 deg/sec, and their contrast was varied on different trials over a range from 0.05 to 0.85 in steps of 0.05. Two ramp asymmetries were used, 93.75 and 75%. The brightness shift was strongly influenced by stimulus contrast for the 93.75% symmetrical grating, in~~asing from about 1% at a contrast of 0.2 up to about 7 or 8% at a contrast of 0.S (Fig. 10) but remaining constant thereafter. Similar results were found for the 75% asymmetrical ramp, although the saturation occurred at a lower contrast and the brightness error was less. From equation (1) and the data in Fig. 10 for 93.75% asymmetry we can determine an overall tran- sient response curve, as in Fig. 6. We can then use this to predict (see Appendix I) the 75% asymmetry curve as a test of our model, The results are shown by the dotted lines in Fig. 10. The correlations between the actual data and the predicted data (predicted values at the ap- propriate contrasts were determined by inter- polation) were 0.95 for S.M.A. and 0.99 for P.C. and the root-mean-squared deviations were 0.45
We conclude that transient responses con- tribute to the perception of brightness. In partic- ular, the brightness shift arises from the non- linear visual response to changing luminan~. We identified this nonlinearity as a saturation of the transient response: a limitation on the max- imum transient when responding to rapid b~ghtening or dimming. We base this conclu- sion on the following:
(1) The brightness shift is only seen for tem- porally changing stimuli.
(2) At low luminance levels the brightness shift disappears. So does the transient response of Y cefls in the retina of the cat (Yoon, 1972; Enroth-Cugell and Shapley, 1973; Jakiela er al., 1976).
(3) Shapley and Victor (1978) report that the response of Y cells at the retinal ganglion level-a transient response under the conditions of their study-could show a compressive non- linearity.
We have for the most part ignored the effect of the shape of the receptive gelds of the cells giving transient responses. The brightening
and 0.32%, respectively. The predictions at medium and high values of contrast were excel- lent. At low contrasts, however, the predicted values were too low, indicating some deviation from our model at these levels.
The results of this experiment confirm our proposal of a saturated transient response char- acteristic. We see that the contrast at which saturation begins (45 or 50%) for the 93.75% asymmetry stimulus is well below the 70% contrast used in Experiment 3. This supports our conclusion that both the steep and the gradual slopes of all stimuli were in the satur- ation region of the transient response in that experiment. Note that the saturation level for the 75% asymmetry gratings is lower than that for the 93.75% asymmetry gratings. The final transient contribution is the difference of the On and Off signals. If both are in saturation, giving a fixed maximum response, T,,,, then their difference is proportional to the difference in the widths of the rising On portion and the falling OfI portion. The more equal the widths, as in 75% asymmetry, the smaller the difference be- tween them. The model of equations (1) and (2) predicts the observed difference quite accu- rately.
908 PATRICK CAVANAGH and STUART M. ANSTIS
effect was observed for a uniform field indi- cating that the spatial ramp stimuli themselves were not esstential, serving only as a method of presenting temporal brightness ramps to each point on the retina. Brightness comparisons of the moving spatial ramp stimuli were easier than for the purely temporal ramps, however. When the spatial ramps were too small, though, the brightness shift was diminished as the temporal ramp at each point became increasingly blurred by the spatial averaging of the receptive field that covered larger and larger portions of the spatial ramp.
The transient response can be likened to a first derivative. Why would this first order tran- sient response be added to the zero order re- sponse of sustained channels? One reason is that the addition of the transient response improves the response to temporal discontinuities. This may serve to offset the decline in the sustained response at higher temporal frequencies. How- ever, the transient response, being a temporal derivative, will differ in shape over time from the actual brightness profile due to the phase lead of all its components. We should therefore expect that as the transient contribution be- comes more important, the perceived brightness profile will become distorted. We did not mea- sure this formally but it was obvious at high speeds of drift that the brightness profiles of the ramp gratings were becoming more rectangular and less like sawteeth, as would be predicted from the transient response to the slopes of the ramps [Fig. 5(b)].
The brightness shift that we have examined here provides a technique for isolating the tran- sient mechanisms. The response of sustained mechanisms to the ramp grating of Fig. 1 is necessarily the same whether the grating moves to the left or right or not at all. The sustained mechanisms are therefore not involved in the phenomenon. We feel the technique could be useful for evaluating the influence of factors such as contrast, color, orientation and eccen- tricity on transient mechanisms.
Acknowledgemenrs-This research was supported by NSERC grants A 8606 to PC and A0260 to S.M.A. The authors are grateful to John Slavin for technical assistance.
REFERENCES Bartley S. H. (1941) Vision: A Srudy of ifs Basis. Nostrand,
New York. Enroth-Cugell C. and Shapley R. (1973) Adaptation and
dynamics of cat retinal ganglion cells. J. Physiol. 22% 271-309.
Jakiela H. G., Enroth-Cugell C. and Shapley R. (1976)
Adaptation and dynamics in X-cells and Y-cells of the cat retina. Expl Bruin Res. 24. 335-342.
Jung R. (1973) Visual perception and neurophysiology. In Cenrral Processing qf Visual Itrformation A: Inregrariw
functions and Comparative Data (Edited by Jung R.) pp. l-l 52. Springer, Berlin.
Katz M. S. (1964) Brief flash brightness. Vision Res. 4, 361-373.
Kitterle F. L. and Corwin T. R. (1983) The effects of temporal waveform upon apparent contrast. Percepf. Psychophys. 33, 72-74.
Kitterle F. L. and Toney H. C. Jr (1983) The effects of temporal waveform upon temporal darkness enhance- ment. Percept. Psychoph.w. 33, 375-378.
Magnussen S. and Glad A. (1973) Brightness and darkness enhancement during Bicker: Perceptual correlates of neuronal B- and D-systems in human vision. Expl Brain Res. 22, 399-413.
Robson 1. (1975) Receptive fields: Neural representation of the spatial and intensive attributes of the visual image. In Handbook of Perception. Vol. 5. Seeing (Edited by Carterette E. C. and Friedman M. P.), pp. 81-l 16. Academic Press, New York.
Shapley R. M. and Victor J. D. (1978) The effect of contrast on the transfer properties of cat retinal ganglion cells. J. Physiol. 285, 275-298.
Yoon M. (1972) Influence of adaptation level on response pattern and sensitivity of ganglion cells in the cat’s retina. J. Physiol. 221, 93-104.
APPENDIX I The brightness error is given by equation (1)
b = aT(cf/a) - (1 - a)T[cf/(l -a)]
with the parameters defined as in the text. To predict the shift for the 75% asymmetry conditions, we will derive the transient characteristic, T[s(r)], from the 93.75% asym- metry data.
The brightness shift as shown for the 93.75% asymmetry case in Fig. 10 is therefore a function of the transient characteristic at two different points, one for the rising slope, and one for the falling slope. If we consider contrasts above 50%, the brightness error itself stops increasing and we can assume that the response to both slopes has satur- ated. This allows us to calculate the maximum transient response, T,. from the maximum brightness shift, b,, for an a of 93.75%
b, = 0.9375T,,, - O.O625T,
T,,, = l.l4b,.
Since the slope of the steep portion of the 93.75% asym- metry test is 15 times that of the shallow portion, we can reasonably assume that the transient response to this slope will be in saturation even at the lowest contrast tested, 5%. The more gradual slope reaches the same temporal rate of change at a contrast of 75% and we know that both responses are saturated at that contrast. The response to the steep slope will always be T,,, therefore. Substituting in equation (1) and expressing the brightness shift as a function of contrast, b(c)
b(c) = 0.9375T(2.13c) - 0.06257,
T(c) = I .07[b(0.47c) + 0.076,].
This transient response characteristic is then substituted in equation (1) for the case of 75% asymmetry and brightness shift values predicted.
Related Documents