Bright Smiles for Bright Futures Basic Screening Survey A Report on the Oral Health Status of Louisiana’s Third Grade Children Rishu Garg, MD, MPH Oral Health Program Epidemiologist/Evaluator May 2011 628 N. 4 th Street Baton Rouge, LA 70821-3214 Phone: (225) 342-2645

Welcome message from author
This document is posted to help you gain knowledge. Please leave a comment to let me know what you think about it! Share it to your friends and learn new things together.
Transcript
Bright Smiles for Bright Futures
Basic Screening Survey
A Report on the Oral Health Status of
Louisiana’s Third Grade Children
Rishu Garg, MD, MPH
Oral Health Program Epidemiologist/Evaluator
May 2011
628 N. 4th
Street
Baton Rouge, LA 70821-3214
Phone: (225) 342-2645

2
Table of Contents
Background-------------------------------------------------------------------------------3
Methodology and Sampling Size------------------------------------------------------3
Training-----------------------------------------------------------------------------------4
Screening---------------------------------------------------------------------------------4
Data Collection, Entry and Analysis--------------------------------------------------5
Parent Questionnaire--------------------------------------------------------------------5
Map of Louisiana by Geographical Areas--------------------------------------------6
Statistics and Findings by Geographical Areas--------------------------------------7
Map of Louisiana by DHH Administrative Regions--------------------------------13
Statistics and Findings by DHH Administrative Regions -------------------------14
Comparison of OH Status by state and DHH regions------------------------------17
Discussion--------------------------------------------------------------------------------22
Appendix---------------------------------------------------------------------------------24
Appendix I-Parent Questionnaire---------------------------------------------------25
Appendix II-Principal Letter & School MOU--------------------------------------27
Appendix III -Parental Consent Letter for OH Screening------------------------29
Appendix IV-Oral Health Screening Results for children------------------------31
Appendix V-Oral Health Screening Results for schools--------------------------32
Appendix VI-Certificate of Participation-------------------------------------------33

3
Louisiana Department of Health and Hospitals
Oral Health Program
Bright Smiles for Bright Futures
Basic Screening Survey 2007-2009
Background
The Louisiana Oral Health Program is a part of the Department of Health and Hospitals - Office
of Public Health. Every three to five years the Oral Health Program conducts a Basic Screening
Survey (BSS) to collect information on the oral health status of Louisiana’s third graders. The
survey is conducted to meet the reporting requirements of the Maternal and Child Health Block
Grant and to target the program’s interventions. So far, the Oral Health Program has conducted
two rounds of the BSS; once in 1998 and again in 2002. In 1998, 1,390 children were screened
from 14 of the state’s 64 parishes. Of those screened in 1998, 38.1% had untreated cavities,
22.1% had dental sealants and 34.7% were referred for treatment. In 2002, 871 children were
screened from seven parishes; 37.3% had untreated cavities, 63.5% had caries experience, 18%
had dental sealants and 38.5% were referred for treatment. The 2007-2009 screening period was
the first to utilize a representative sample of third grade children in Louisiana. In the summer of
2007, the Oral Health Program began planning for the 2008 survey. The screening of third grade
students began in the spring of 2008 (2007-2008 school year) and was completed in the spring of
the 2009.
2007-2009 Basic Screening Survey
Methodology and Sampling Size: With the assistance of the Association of State and Territorial
Dental Directors (ASTDD), the Oral Health Program Epidemiologist utilized a probability-
proportional- to- size design to select the BSS’s sample size. Louisiana has 64 parishes; all
parishes were included in the sampling methodology. For the purpose of this survey, the 64
parishes were divided into four geographical areas: Northern, Central, Southern and River
Parishes (See Map 1). The data has been analyzed according to these four areas. The State Oral
Health Program also elected to analyze the data based on the DHH administrative regions (See
Map 2). However, since the survey was not initially designed for the DHH regions, the data has a
high standard error in Regions 5 and 6 due to insufficient sample size.
In Louisiana, during 2007-2008 school year, there were 735 public schools and 258
private schools with third grade classes.
Seventy-five public and private schools in 33 parishes were selected for the screening; 65
were public and ten were private.

4
A total of 2,642 children were screened. According to the probability-proportional-to-
size design, this number represents 55,996 third grade children in the state.
The Louisiana Department of Education provided information on the number of schools
with third grade classes and the number of students in the third grade.
Selected schools not able to participate in the BSS were replaced by another school using
the same methodology.
As an incentive, each participating school was given an oral health curriculum kit, a
summary of its results (Appendix V) and a certificate of participation (Appendix VI).
Training: The Oral Health Program developed a five-hour training course designed for school
nurses providing instruction on conducting the BSS, screening protocol, recognition of oral
health status, oral hygiene instruction and completion of screening forms.
One hundred and twenty school nurses attended training; only trained school nurses were
invited to participate in the dental screening.
The training offered five CEU hours.
Training was conducted in eight of the nine DHH administrative regions.
Screening: The Oral Health Program staff and the trained school nurses conducted the
screenings. The Oral Health Program staff contacted each school personally to explain the
program and obtain an agreement to participate (Appendix II). The Oral Health Program
obtained a signed Memorandum of Understanding from each participating school outlining the
program and the school’s responsibility. Once an agreement was reached, the program provided
the school with the necessary permission slips and other information to distribute to the students
and scheduled the screening date.
Three weeks prior to the scheduled screening, parents of eligible children were sent
consent forms (Appendix III) and a parent questionnaire (Appendix I). No child was
screened without the consent of his/her parent or guardian. The school nurse collected
the permission slips and maintained an ongoing communication with the Oral Health
Program to maximize participation.
In schools where the Oral Health Program conducted the screening, the school helped
manage the children.
The program utilized portable equipment and available space to conduct the screenings.
Screeners provided chair-side instruction in good oral hygiene.
Participating children were given toothbrushes, toothpaste, floss, pencils, erasers, and
stickers.
A screening results form (Appendix IV) and contact information for Medicaid-enrolled
dentists (in cases where follow-up care was needed) was sent home with each child.

5
Data Collection, Entry and Analysis: The screening was conducted in accordance with
Louisiana Department of Health and Hospitals Institutional Review Board guidelines and
practices. Information was collected on a hard copy form and the participant’s information was
not shared. Forms were completed by the screener, collected, and sent to the Oral Health
Program to be entered into a database. The data was routinely checked for accuracy using a
double entry system.
The data collection form was developed by the Oral Health program utilizing guidance from
ASTDD, “Basic Screening Surveys: An approach to monitoring community health.”
The Oral Health Program Epidemiologist designed the database in Excel.
Data entry was conducted by trained student workers and checked by the Epidemiologist.
The analysis was conducted using SAS and SUDAAN software.
Parent Questionnaire: The parent questionnaire was a part of the informational packet sent
home with the parent letter and permission slip (see Appendix I). This is the self-reported
information and is subject to information bias.
16% of children reported to have had a toothache during the last six months;
49% of children have not seen a dentist for more than six months;
5% of children have never been to a dentist;
Of the children that reported seeing a dentist, 72.3% went to get a routine examination or
cleaning;
Most of the parents reported having dental insurance for their children when needed;
11% of children could not receive dental care when needed;
90% of children have medical insurance; and
82% of the children reported having dental insurance, which is less than the prevalence of
medical insurance (90%).

6
Map of the Four Geographical Areas Used for BSS Sampling
Map 1
Northern Area-14 Schools: Bienville, Bossier, Caddo, Caldwell, Claiborne, De Soto, East
Carroll, Franklin, Jackson, Lincoln, Madison, Morehouse, Ouachita, Red River, Richland,
Tensas, Union, Webster and West Carroll
Central Area-8 Schools: Avoyelles, Beauregard, Catahoula, Concordia, Grant, La Salle,
Natchitoches, Rapides, Sabine, Vernon and Winn
Southern Area-30 Schools: Allen, Acadia, Assumption, Calcasieu, Cameron, East Feliciana,
Evangeline, Iberia, Iberville, Jefferson Davis, Lafayette, Lafourche, Livingston, Saint Helena,
Saint Landry, Saint Martin, Saint Mary, Saint Tammany, Tangipahoa, Terrebonne, Vermillion
and Washington
River Parishes Area-23 Schools: Ascension, East Baton Rouge, Jefferson, Orleans,
Plaquemines, Pointe Coupee, Saint Bernard, Saint Charles, Saint James, Saint John the Baptist
West Baton Rouge and West Feliciana

7
Statistics and Findings By Geographical Areas
Figure 1: BSS- State Oral Health Status of Louisiana’s Third Grade Children
41.9% (CI= +/- 4.0) had untreated cavities.
65.7% (CI= +/- 3.4) had dental caries experience.
Only 33.2% (CI = +/- 4.4) had sealants present.
42.7% (CI = +/- 3.8) had to be referred to dentists for treatment urgency.
Figure 1
Note: CI stands for confidence interval, which is the probability that a value will fall between an
upper and lower bound of a probability distribution. The confidence interval can take any
number of probabilities, with the most common being 95% or 99%. In this report, 95%
confidence interval values are reported.
41.9
65.7
33.242.7
0
20
40
60
80
100
Untreated Cavities Caries Experience Sealants Present Treatment Urgency
Per
cen
t
Oral Health Status of Louisiana's 3rd Grade Children 2007-2009
Source: Louisiana Basic Screening Survey, 2007-2009
The HP 2010 target for
untreated cavities and caries
experience is 20% and 42%
respectively.
8
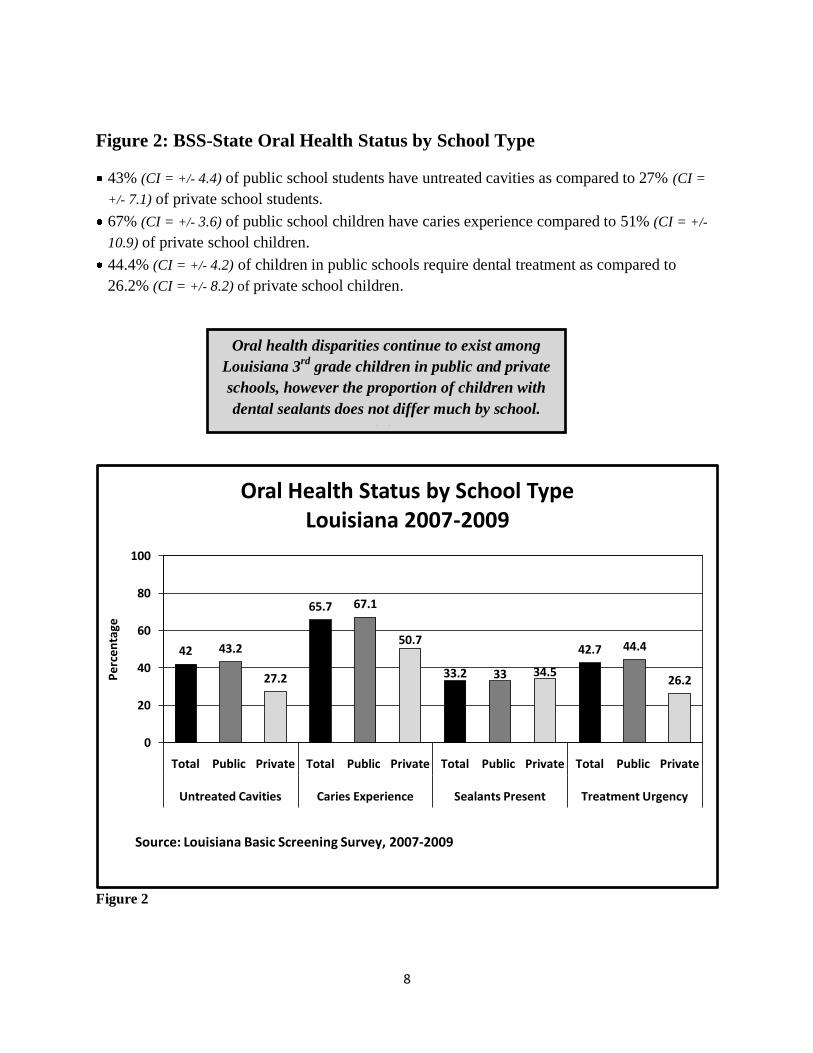
Figure 2: BSS-State Oral Health Status by School Type
43% (CI = +/- 4.4) of public school students have untreated cavities as compared to 27% (CI =
+/- 7.1) of private school students.
67% (CI = +/- 3.6) of public school children have caries experience compared to 51% (CI = +/-
10.9) of private school children.
44.4% (CI = +/- 4.2) of children in public schools require dental treatment as compared to
26.2% (CI = +/- 8.2) of private school children.
Figure 2
42 43.2
27.2
65.7 67.1
50.7
33.2 33 34.5
42.7 44.4
26.2
0
20
40
60
80
100
Total Public Private Total Public Private Total Public Private Total Public Private
Untreated Cavities Caries Experience Sealants Present Treatment Urgency
Per
cen
tage
Oral Health Status by School Type Louisiana 2007-2009
Source: Louisiana Basic Screening Survey, 2007-2009
Oral health disparities continue to exist among
Louisiana 3rd
grade children in public and private
schools, however the proportion of children with
dental sealants does not differ much by school.
status

9
Figure 3: BSS – State Oral Health Status by Gender
Similar proportion of boys and girls experience oral health issues.
Presence of dental sealants is 2.2% greater in girls as compared to boys.
Figure 3
41.8 41.4 42.2
65.7 65.4 65.9
33.2 32 34.2
42.7 42.4 43
0
20
40
60
80
100
Total Male Female Total Male Female Total Male Female Total Male Female
Untreated Cavities Caries Experience Sealants Present Treatment Urgency
Per
cen
t
Oral Health Status by GenderLouisiana 2007-2009
Source: Louisiana Basic Screening Survey, 2007-2009
There is little difference in the oral health of boys as
compared to girls among Louisiana third graders.

10
Figure 4: BSS – State Oral Health Status by Race
Prevalence of untreated cavities is highest among “others” which consists of Hispanic,
Asian, American Indian/Alaskan Native, Native Hawaiian/Pacific Islander, Multiracial
and Unknown followed by blacks.
Black children are more likely to have caries experience than other races.
The prevalence of dental sealants is higher in whites than blacks and others.
Almost half of the Black children are in need of dental care followed by “others,” and
whites.
Figure 4
36.9
46.7 47.7
63.2 68.9 64
37.9
27.9 31.937.2
48.8 45.5
0
20
40
60
80
100
White Black Others White Black Others White Black Others White Black Others
Untreated Cavities Caries Experience Sealants Present Treatment Urgency
Per
cen
tage
Oral Health Status by RaceLouisiana 2007-2009
Source: Louisiana Basic Screening Survey, 2007-2009
Oral health disparities exist among
different races in Louisiana.

11
Figure 5: BSS – Geographical Estimates of Oral Health
Untreated Cavities:
The Central Geographical Area has the highest percent of caries experience followed by
North, River Parishes and Southern areas.
Caries Experience: This is a combined indicator of the presence of untreated cavities and/or the
caries experience in the past based on the presence of restorative work or missing teeth.
65.7% of third grade children have caries experience.
The highest percentage of caries experience is present in Northern Geographical Area,
which is also supported by the DHH Regional Estimates for Regions 7 & 8. (Page 13)
Presence of Dental Sealants:
The Southern and River Parishes Geographical Areas have a higher percentage of third
graders with at least one or more dental sealants on their permanent molars.
The Northern Geographical Area has the lowest percentage of children with dental
sealants.
Access to care is more challenging in the Northern area because of the limited availability
of dentists.
47.3
72.3
27.4
53.367.1
28.137.2
64.7
35.9 40.4
62.2
35.2
0
20
40
60
80
100
Un
tre
ate
d C
avi
tie
s
Car
ies
Exp
erie
nce
Seal
ants
Pre
sen
t
Un
tre
ate
d C
avi
tie
s
Car
ies
Exp
erie
nce
Seal
ants
Pre
sen
t
Un
tre
ate
d C
avi
tie
s
Car
ies
Exp
erie
nce
Seal
ants
Pre
sen
t
Un
tre
ate
d C
avi
tie
s
Car
ies
Exp
erie
nce
Seal
ants
Pre
sen
t
North Central Southern River Parishes
Per
cen
tage
Geograhical Distribution of Oral Health in Louisiana 2007-2009
Source: Louisiana Basic Screening Survey, 2007-2009
Healthy People 2010 Objective 21-8 for dental sealants is to increase the proportion of children
receiving dental sealants on their molar teeth to 50%.

12
Figure 6: BSS – Geographical Area Treatment Urgency
Treatment Urgency has three indicators:
1. No problem: The child has an absence of untreated decay or requirement to see a
dentist so regular care would be sufficient.
2. Early Care: The child has visible decay or problems and needs to see a dentist in the
next two weeks.
3. Urgent Care: The child has a very serious decay or problem and needs to see a dentist
within 24 hours.
The demand for the early care is abundant in the Northern area (Figure 6) and urgent care
is critical in the Central area.
More than 60% of children in Southern area and River parishes have no decay and they
just need regular dental care.
Figure 5
49.244.4
6.5
46.4
37.6
16
62.1
32.3
5.5
60
33.3
6.7
0
20
40
60
80
100
No
Pro
ble
m
Earl
y C
are
Urg
ent
Car
e
No
Pro
ble
m
Earl
y C
are
Urg
ent
Car
e
No
Pro
ble
m
Earl
y C
are
Urg
ent
Car
e
No
Pro
ble
m
Earl
y C
are
Urg
ent
Car
e
North Central Southern River Parishes
Per
cen
tage
Geographical Distribution of Children with Treatment UrgencyLouisiana 2007-2009
Source: Louisiana Basic Screening Survey, 2007-2009
The need for dental care is critical in the areas where
access to care and availability of dentists is limited.

13
Map of the 9 DHH Administrative Regions
Map 2
Region 1 - 13 Schools: Jefferson, Orleans, Plaquemines and Saint Bernard
Region 2 - 8 Schools: Ascension, East Baton Rouge, East Feliciana, Iberville, Point Coupee, West
Baton Rouge and West Feliciana
Region 3 - 6 Schools: Assumption, Lafourche, Saint Charles, Saint James, St. John the Baptist,
Saint Mary and Terrebonne
Region 4 - 13 Schools: Acadia, Evangeline, Iberia, Lafayette, Saint Landry, Saint Martin and
Vermillion
Region 5 - 4 Schools: Allen, Beauregard, Calcasieu, Cameron and Jefferson Davis
Region 6 - 5 Schools: Avoyelles, Catahoula, Concordia, Grant, La Salle, Rapides, Vernon and Winn
Region 7 - 10 Schools: Bienville, Bossier, Caddo, Claiborne, De Soto, Natchitoches, Red River,
Sabine and Webster
Region 8 - 6 Schools: Caldwell, East Carroll, Franklin, Jackson, Lincoln, Madison, Morehouse,
Ouachita, Richland, Tensas, Union and West Carroll
Region 9 - 10 Schools: Livingston, Saint Helena, Saint Tammany, Tangipahoa and Washington

14
Statistics and Findings By DHH Administrative Regions
Untreated Cavities:
The percent of children with untreated cavities is higher in regions 2, 5, 6 and 8 than the
others and lowest in region 9.
Caries Experience:
More than 70% of the children screened from regions 2, 5 and 7 have experienced dental
decay in their life, which is higher than the state average of 65.7%.
The lowest percentage of dental decay was experienced by the children from region 1.
Presence of Dental Sealants:
Currently 33.2% of Louisiana third graders have dental sealants; less than the Healthy
People 2010 goal of at least 50%.
The children from regions 1, 4 and 5 have demonstrated the highest presence of dental
sealants on at least one of the permanent molar teeth.
The lowest presence of dental sealants was found in regions 3 and 8.
DHH has nine administrative regions. Because the sample size was not
designed for nine regions, there is a large standard error (SE) in
regions 5 and 6 when analyzing by region.
Standard error: A statistic indicating how greatly the estimate obtained from
the sample is likely to differ from the population.

15
Figure 7: BSS - DHH Regional Estimates for Oral Health
Figure 6
36.5
55.4
39.2
50.4
71.1
33.838.5
68.6
21.8
35
61.2
39
56.1
70.6
50.1
54.8
64.4
27.3
43.1
71.8
32.5
53
70.3
21.826
67.8
28.6
0
20
40
60
80
100
Un
trea
ted
Cav
itie
s
Car
ies
Exp
erie
nce
Seal
ants
Pre
sen
t
Un
trea
ted
Cav
itie
s
Car
ies
Exp
erie
nce
Seal
ants
Pre
sen
t
Un
trea
ted
Cav
itie
s
Car
ies
Exp
erie
nce
Seal
ants
Pre
sen
t
Un
trea
ted
Cav
itie
s
Car
ies
Exp
erie
nce
Seal
ants
Pre
sen
t
Un
trea
ted
Cav
itie
s
Car
ies
Exp
erie
nce
Seal
ants
Pre
sen
t
Un
trea
ted
Cav
itie
s
Car
ies
Exp
erie
nce
Seal
ants
Pre
sen
t
Un
trea
ted
Cav
itie
s
Car
ies
Exp
erie
nce
Seal
ants
Pre
sen
t
Un
trea
ted
Cav
itie
s
Car
ies
Exp
erie
nce
Seal
ants
Pre
sen
t
Un
trea
ted
Cav
itie
s
Car
ies
Exp
erie
nce
Seal
ants
Pre
sen
t
1 2 3 4 5* 6* 7 8 9
Per
cen
tage
DHH Regions
Oral Health Status Among DHH Administrative Regions Louisiana 2007-2009
Source: Louisiana Basic Screening Survey, 2007-2009* High Standard Error

16
Figure 8: BSS – DHH Regional Estimates of Treatment Urgency
The children from regions 1 and 9 have demonstrated (Figure 8) the best oral health in
Louisiana.
The demand for the early care is abundant in the regions 5 and 8, and urgent care is most
critical in region 6 followed by 3 and 7.
Figure 7
67.5
28.4
5.8
4744.2
8.8
62.8
27.5
9.7
63.4
29.8
6.7
46.452.2
1.4
46.4
35.4
18.1
53
37.8
9.2
4548.4
6.6
72.7
25.3
2.1
0
20
40
60
80
100
No
Pro
ble
m
Earl
y C
are
Urg
ent
Car
e
No
Pro
ble
m
Earl
y C
are
Urg
ent
Car
e
No
Pro
ble
m
Earl
y C
are
Urg
ent
Car
e
No
Pro
ble
m
Earl
y C
are
Urg
ent
Car
e
No
Pro
ble
m
Earl
y C
are
Urg
ent
Car
e
No
Pro
ble
m
Earl
y C
are
Urg
ent
Car
e
No
Pro
ble
m
Earl
y C
are
Urg
ent
Car
e
No
Pro
ble
m
Earl
y C
are
Urg
ent
Car
e
No
Pro
ble
m
Earl
y C
are
Urg
ent
Car
e
1 2 3 4 5* 6* 7 8 9
Per
cen
tage
DHH Administrative Regions
DHH Administrative Regional Distribution of Children with Treatment UrgencyLouisiana 2007-2009
Source: Louisiana Basic Screening Survey, 2007-2009* High Standard Error

17
Figures 9-17: BSS – Comparison of Oral Health Status by State and DHH
Regions
Figure 9: BSS – Comparison of Oral Health Status by State and DHH Region 1
Figure 8
Figure 10: BSS – Comparison of Oral Health Status by State and DHH Region 2
Figure 10
41.936.5
65.7
55.4
33.2 39.2
57.3
67.5
35.628.4
7.1 5.8
0
20
40
60
80
100
State Region 1 State Region 1 State Region 1 State Region 1 State Region 1 State Region 1
Untreated Cavities
Caries Experience
Sealants Present No Problem Early Care Urgent Care
Per
cen
tage
Comparison of Oral Health Status Louisiana and Region 1
2007-2009
41.9
50.465.7 71.7
33.2 33.8
57.3
4735.6
44.2
7.1 8.8
0
20
40
60
80
100
State Region 2 State Region 2 State Region 2 State Region 2 State Region 2 State Region 2
Untreated Cavities
Caries Experience
Sealants Present No Problem Early Care Urgent Care
Per
cen
tage
Comparison of Oral Health StatusLouisiana and Region 2
2007-2009

18
Figure 11: BSS – Comparison of Oral Health Status by State and DHH Region 3
Figure 91
Figures 12: BSS – Comparison of Oral Health Status by State and DHH Region 4
Figure 12
41.9 38.5
65.7 68.6
33.2
21.8
57.362.8
35.627.5
7.1 9.7
0
20
40
60
80
100
State Region 3 State Region 3 State Region 3 State Region 3 State Region 3 State Region 3
Untreated Cavities
Caries Experience Sealants Present No Problem Early Care Urgent Care
Per
cen
tage
Comparison of Oral Health StatusLouisiana and Region 3
2007-2009
41.935
65.7 61.2
33.239
57.363.4
35.6 29.8
7.1 6.7
0
20
40
60
80
100
State Region 4 State Region 4 State Region 4 State Region 4 State Region 4 State Region 4
Untreated Cavities
Caries Experience Sealants Present No Problem Early Care Urgent Care
Per
cen
tage
Comparison of Oral Health StatusLouisiana and Region 4
2007-2009
19
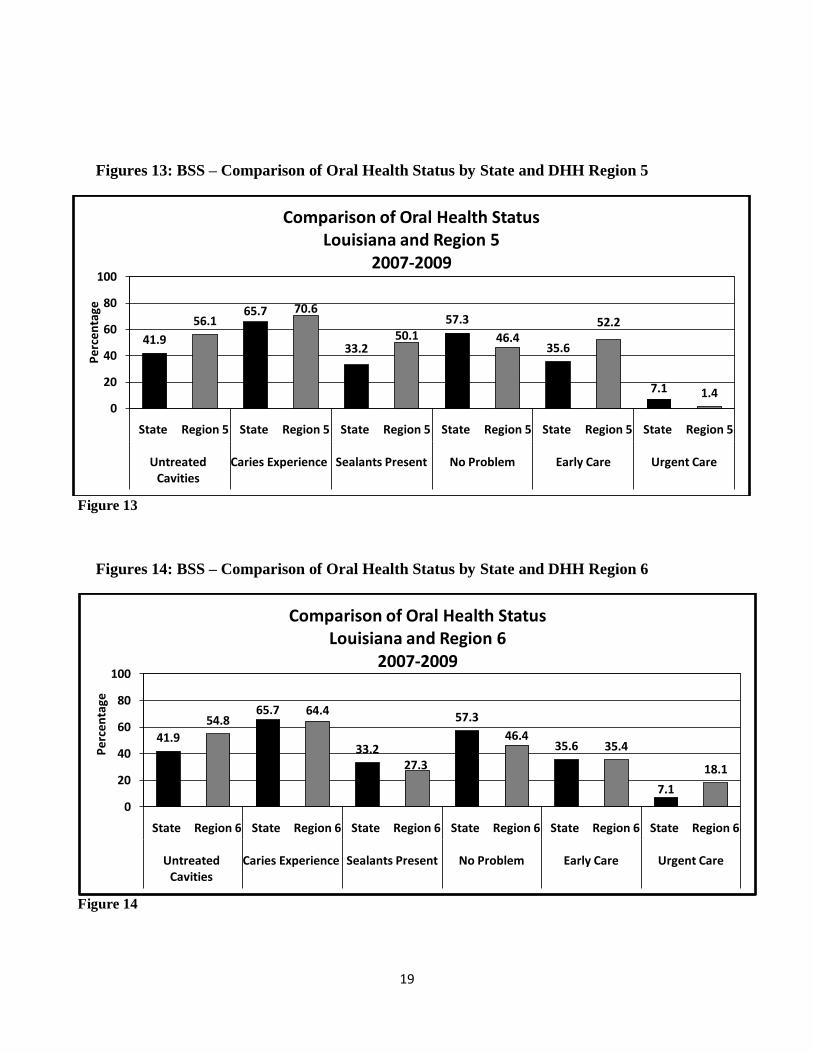
Figures 13: BSS – Comparison of Oral Health Status by State and DHH Region 5
Figure 13
Figures 14: BSS – Comparison of Oral Health Status by State and DHH Region 6
Figure 14
41.9
56.165.7 70.6
33.250.1
57.3
46.435.6
52.2
7.1 1.40
20
40
60
80
100
State Region 5 State Region 5 State Region 5 State Region 5 State Region 5 State Region 5
Untreated Cavities
Caries Experience Sealants Present No Problem Early Care Urgent Care
Per
cen
tage
Comparison of Oral Health StatusLouisiana and Region 5
2007-2009
41.9
54.865.7 64.4
33.227.3
57.3
46.435.6 35.4
7.1
18.1
0
20
40
60
80
100
State Region 6 State Region 6 State Region 6 State Region 6 State Region 6 State Region 6
Untreated Cavities
Caries Experience Sealants Present No Problem Early Care Urgent Care
Per
cen
tage
Comparison of Oral Health StatusLouisiana and Region 6
2007-2009

20
Figures 15: BSS – Comparison of Oral Health Status by State and DHH Region 7
Figure 15
Figures 16: BSS – Comparison of Oral Health Status by State and DHH Region 8
Figure 16
41.9 43.1
65.771.8
33.2 32.5
57.3 53
35.6 37.8
7.1 9.2
0
20
40
60
80
100
State Region 7 State Region 7 State Region 7 State Region 7 State Region 7 State Region 7
Untreated Cavities
Caries Experience
Sealants Present No Problem Early Care Urgent Care
Per
cen
tage
Comparison of Oral Health StatusLouisiana and Region 7
2007-2009
41.9
5365.7 70.3
33.2
21.8
57.3
4535.6
48.4
7.1 6.6
0
20
40
60
80
100
State Region 8 State Region 8 State Region 8 State Region 8 State Region 8 State Region 8
Untreated Cavities
Caries Experience Sealants Present No Problem Early Care Urgent Care
Per
cen
tage
Comparison of Oral Health StatusLouisiana and Region 8
2007-2009

21
Figures 17: BSS – Comparison of Oral Health Status by State and DHH Region 9
Figure 17
41.9
26
65.7 67.8
33.2 28.6
57.3
72.7
35.6
25.3
7.1 2.10
20
40
60
80
100
State Region 9 State Region 9 State Region 9 State Region 9 State Region 9 State Region 9
Untreated Cavities
Caries Experience Sealants Present No Problem Early Care Urgent Care
Per
cen
tage
Comparison of Oral Health StatusLouisiana and Region 9
2007-2009

22
Discussion
Despite the continuous improvement in the oral health of children in the US since 1970’s, dental
caries has remained the most prevalent childhood chronic disease.1 In Louisiana, almost two out
of every three children experience cavities before entering the fourth grade.2 To address this
problem, the Louisiana Oral Health Program conducts two population-based interventions aimed
at prevention: the school-based dental sealant program and the community water fluoridation
program (CWF). Both are designated best practices by the Centers for Disease Control and
Prevention (CDC). Studies have shown that in children, after administration of a dental sealant,
the median decrease in caries on the occlusal (chewing) surface of posterior teeth is 60%.3 The
CDC has proclaimed water fluoridation as one of ten great public health achievements of the 20th
century; every $1 invested in water fluoridation saves $38 in dental treatment costs.
According to the Healthy People 2010 Objective for dental sealants, 50% of children should
have sealants on their permanent molars. In Louisiana, only 33.2% of children have one or more
dental sealants on their permanent molars.4 The goal of the statewide school-based/linked dental
sealant program is to increase the number of children with one or more dental sealants on their
permanent teeth. To achieve this goal, the program utilizes three different strategies: contracting
with local dental providers, working with local clinics (e.g. Federally Qualified Health Centers),
and providing direct services using Oral Health Program staff. Operationally, to conduct a dental
sealant day in a school setting, the program identifies disparate populations for interventions,
works with local school systems/administrators and school nurses and identifies dental providers
for program delivery.
According to the Healthy People 2010 Objective for community water fluoridation, 75% of the
population should receive optimally fluoridated water. In Louisiana, only 41% of the population
benefits from community water fluoridation as compared to 69.2% percent of the United States
(2006).5 In the 2008 regular session, Louisiana enacted Act 761, which requires water systems
with more than 5,000 service connections to fluoridate. To achieve this goal, the program’s
1 U.S. Department of Health and Human Services. Oral health in America: A Report of the Surgeon General. DHHS,
Rockville, MD. 2000. 2 Basic Screening Survey 2007-2009, Louisiana Oral Health Program
3 Truman BI, Gooch BF, Sulemana I, et al. Reviews of evidence regarding interventions to prevent dental caries, oral and pharyngeal cancers, and sports-related craniofacial injuries. Am J Prev Med 2002;23(suppl 1): 21-54. Available from: http://www.thecommunityguide.org/oral/oral-ajpm-ev-rev.pdf
4 Basic Screening Survey 2007-2009, Louisiana Oral Health Program
5 Center for Disease Control and Prevention, Oral Health Program, Water Fluoridation Statistics for 2006. Available
from http://www.cdc.gov/fluoridation/statistics/2006stats.htm

23
fluoridation engineer and community educator work with local governments and residents to
educate on the health benefits and ensure the safe delivery of optimally fluoridated water.
Access to care is a primary indicator of good oral health. In Louisiana, access to oral health care
is challenging. In the FFY 2007-2008, only 32.5% of the Medicaid-eligible (LACHIP enrolled)
children in Louisiana received any dental services.6 Only 27% of the Medicaid-available dentists
(enrolled and billing) see Medicaid-eligible children and only 12% of all available dentists bill
Medicaid for $10,000 or more. Compounding the problem, 56 out of the 64 parishes (87.5%) are
designated by HRSA as Dental Health Professional Shortage Areas7. On average in Louisiana,
among Medicaid- eligible children, one dentist is available for 1,161 children. Socio-economic
status is another indicator of good oral health. As evidenced in the National Survey of
Children’s Health 2007 which says, “of children with household incomes below the federal
poverty level (FPL), about half were reported to have teeth that were in excellent or very good
condition (49.8 %), compared to 61.3 % of children with household incomes between 100 and
199 percent of the FPL, 76.0 % of children with household incomes between 200 and 399
percent of the FPL, and 84.8 % of children with household incomes of 400 percent or more of
the FPL.”8 In the BSS survey, the program did not collect socio-economic data; however, the
survey indicated that children from the private schools tended to have better oral health than
children in the public schools.9
The Oral Health Program will conduct the next BSS in 2012-2013 school year. Survey design
and methodology will aim to increase the sample size to obtain better regional data.
6 Louisiana Medicaid Management Information Systems, Department of Health and Hospitals-Medical, CMS 416
7 Department of Health and Hospitals, Primary Care and Rural Health, Dental Health Professional Shortage Areas Map. Available from http://www.dhh.louisiana.gov/offices/miscdocs/docs-88/hpsa/dental.pdf
8 The National Survey of Children’s Health, 2007. Available at http://mchb.hrsa.gov/nsch07/moreinfo/pdf/nsch07.pdf 9 Basic Screening Survey 2007-2009, Louisiana Oral Health Program

24
Appendix

25
Appendix I
Parent Questionnaire
Please answer the following questions to help us learn more about access to dental care. Your answers
will remain private and will not be shared. If you do not want to answer the questions, you may still give
permission for your child to have his or her teeth checked.
1. During the past 6 months, did your child have a toothache more than once, when biting or
chewing?
No Yes Don’t know/don’t remember
2. About how long has it been since your child last visited a dentist? Include all types of dentists,
such as orthodontists, oral surgeons, and all other dental specialists, as well as dental
hygienists. (Check one)
6 months or less More than 3 years ago
More than 6 months, but not more than 1 year ago Never has been to the dentist
More than 1 year ago, but not more than 3 years ago Don’t know/don’t remember
3. What was the main reason that your child last visited a dentist? (Check one)
Went in on own for check-up, examination or cleaning
Was called in by the dentist for check-up, examination or cleaning
Something was wrong, bothering or hurting
Went for treatment of a condition that dentist discovered at earlier check-up or examination
Other
Don’t know/don’t remember
4. During the past 12 months, was there a time when your child needed dental care but could not
get it?
No (go to question 6) Yes (go to question 5) Don’t know/don’t remember (go to question 6)

26
5. The last time your child could not get the dental care he/she needed, what was the main reason
he/she couldn’t get care? (Check one)
enough problem
No insurance Difficulty in getting appointment Dentist hours are not convenient
Dentist did not take Medicaid/insurance No way to get there Don’t like/trust/believe in dentists
Speak a different language Didn’t know where to go Other reason
Wait is too long in clinic/office No dentist available Don’t know/don’t remember
6. Do you have any kind of insurance that pays for some or all of your child’s MEDICAL OR
SURGICAL CARE? Include health insurance obtained through employment or purchased
directly, as well as government programs like Medicaid.
No Yes Don’t know
7. Do you have any kind of insurance that pays for some or all of your child’s DENTAL CARE?
Include health insurance obtained through employment or purchased directly, as well as
government programs like Medicaid.
No Yes Don’t know
8. Which of the following best describes your child? (Check all that apply)
White Black/African American Hispanic/Latino
Asian American Indian/Alaska Native Native Hawaiian/Pacific Islander

27
Appendix II
Principal Letter and School MOU
Dear Principal:
Your school has been selected to participate in Louisiana’s Bright Smiles for Bright Futures oral health screening
project. Dental decay is the most common chronic disease in children. It is more common than asthma and it is
estimated that dental problems contribute to 51 million hours of school absence. Oral diseases can and do affect a
child’s ability to learn. The Louisiana Oral Health Program in cooperation with the school nurses, conducted oral
health screenings on third grade students. The data show that in 1998, 23% of third grade children had dental
sealants. However, in 2002, only 18 % had sealants. As indicated by the results of the screening, many of the
children of our state are in need of dental treatment. The Maternal and Child Health Bureau (MCHB) requires states
to conduct an oral health screening on third grade children to assess dental sealant presence on permanent molar
teeth. This measure is a National Performance Measure for the MCHB and it is often used to make decisions on
funding oral health programs in states. Therefore, we will assess the oral health status of third graders through the
“Bright Smiles for Bright Futures” oral health screening project. This project will enable the Oral Health
Program to identify the oral health needs of the children of Louisiana, plan effective targeted treatment, as well as,
provide educational programs for children in need.
School nurses are critical to the success of this program. Nurses are required to participate in a day long oral health
screening training in order to perform the screenings. Training opportunities will be made available by the Louisiana
Office of Public Health/Oral Health Program at convenient locations. Children participating in the screening will
require parental consent; no child will be screened without written parental consent. The principal’s and school
nurse’s signatures are required to initiate the screening process. We will contact you shortly to establish the dates for
your school’s oral health screening and training for the school nurse to perform the screening. Please sign the
enclosed screening participation form and return to the Office of Public Health at the address indicated on the form.
I hope that your school will partner with the Louisiana Office of Public Health/ Oral Health Program in the 2007-
2008 screening project. Your continued cooperation and support is appreciated. If you have any questions or
concerns, please contact me for clarification.
Sincerely,
Dionne Richardson, DDS, MPH Rishu Garg, MD, MPH
Director Oral Health Program Oral Health Program Monitor
Email: [email protected] Email: [email protected]
Phone: (225) 342-2645
Kathleen Babineaux Blanco GOVERNOR
Roxane A. Townsend, M.D. SECRETARY
STATE OF LOUISIANA
DEPARTMENT OF HEALTH AND HOSPITALS

28
Department of Health & Hospitals / Office of Public Health
Oral Health Program / Bright Smiles for Bright Futures
Screening Participation Form
Date: _____________
Our school will participate in the oral health screening.
Our school will not participate in the oral health screening.
Reason, why not: _________________________________________________
Name of the school: _____________________________________________________
Address: ______________________________________________________________
Parish: __________________
Phone Number: ____________________ Fax Number: _____________________
Signature:
_____________________________ ______________________________
Principal Nurse
Name: _______________________ Name: _________________________
Phone: ( ) _________________ Phone: ( ) ____________________
Email: _______________________ Email: _________________________
Please send it to the following address:
Rishu Garg
Program Monitor
Oral Health Program
DHH/ Office of Public Health/ 3rd
Floor
628 North 4th Street
P.O. Box 3214 Bin 4
Baton Rouge, LA 70821-3214

29
Appendix III
Parental Consent Cover Letter for Oral Health Screening
Dear Parent:
All third graders in your child’s school have been chosen to take part in a very important program,
“Bright Smiles for Bright Futures” oral health screening, conducted by the Louisiana Department of
Health and Hospitals, Oral Health Program. His/Her participation will help us to learn about the health
of children’s teeth in your parish and across the state. Results of this screening program will be used to
plan treatment and education programs for children and families.
With your consent, a school nurse, dentist or dental hygienist will examine your child’s teeth to check
for tooth decay and other dental problems. This is only an examination; no treatment will be performed
on your child. Please be assured that the dental screening will be carried out in a safe and healthy
manner, using sterile gloves, and disposable, sterilized mirror and probe. Each participant will receive a
toothbrush, a letter reporting on the health of his/her teeth, and a list of dental health providers in your
area. Please remember that this screening does not take the place of a regular dental check-up.
Remember this examination is at no cost to you and
your child will not be named in any report.
To give your consent for your child’s participation, please complete and sign the attached consent form
and return the form to your child’s teacher tomorrow. Thank you for joining with us in this effort. If you
have any questions about “Bright Smiles for Bright Futures,” please contact Rishu Garg at (225) 342-
2645.
Sincerely,
Oral Health Program
Dionne Richardson, DDS, MPH Rishu Garg, MD, MPH.
Director Oral Health Program Oral Health Program Monitor
Email: [email protected] Email: [email protected]
Kathleen Babineaux Blanco GOVERNOR
Roxane A. Townsend, M.D. SECRETARY
STATE OF LOUISIANA
DEPARTMENT OF HEALTH AND HOSPITALS

30
Bright Smiles for Bright Futures
Parent Consent Form
Please complete this form and return it to your child’s teacher tomorrow. Thank you.
Child’s Name:____________________________________ Child’s Age:____________
_______ Yes, I give permission for my child to have his/her teeth checked.
_______ No, I do not give permission for my child to have his/ her teeth checked.
_________________________________________ _______________________
Signature of Parent or Guardian: Date:

31
Appendix IV
Bright Smiles for Bright Futures
Oral Health Screening Results
Dear Parent or Guardian:
Your child ___________________________, was seen today by Dr. Dionne Richardson, Director of the
Louisiana Oral Health Program or by school nurse for an oral health screening. This screening does not
take the place of a regular dental check-up. Therefore, please see your family dentist on a regular (every 6
months) schedule.
Today’s oral health screening revealed the following:
___________ No obvious need for dental treatment. See your dentist as regularly scheduled.
___________ Your child is in need of non-urgent dental treatment and may have dental caries that
should be checked. Please schedule a dental appointment within the next 2 weeks.
___________ Your child is in need of urgent dental treatment and may be experiencing dental pain
and /or infection. Please schedule a dental appointment within the next 24 hours.
It is very important for your child to brush his/her teeth every day and use fluoridated toothpaste. Please
limit sugary between-meal snacks and be sure to have regular dental check-ups to prevent cavities.
If you have any questions, please contact Dr. Dionne Richardson, DDS, MPH, Director Oral Health
Program at (225) 342- 9047 or Rishu Garg, MD, MPH, Oral Health Program Data Monitor at (225) 342-
2645.
Kathleen Babineaux Blanco GOVERNOR
Roxane A. Townsend, M.D. SECRETARY
STATE OF LOUISIANA
DEPARTMENT OF HEALTH AND HOSPITALS
32
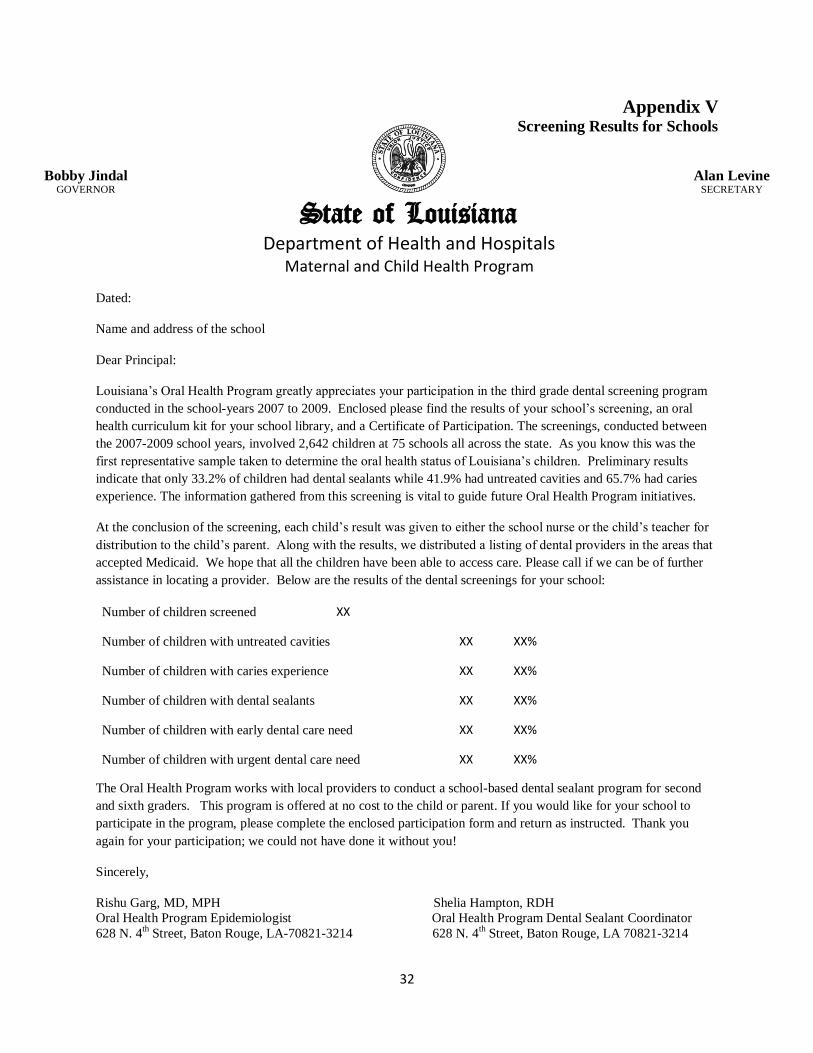
Appendix V Screening Results for Schools
Dated:
Name and address of the school
Dear Principal:
Louisiana’s Oral Health Program greatly appreciates your participation in the third grade dental screening program
conducted in the school-years 2007 to 2009. Enclosed please find the results of your school’s screening, an oral
health curriculum kit for your school library, and a Certificate of Participation. The screenings, conducted between
the 2007-2009 school years, involved 2,642 children at 75 schools all across the state. As you know this was the
first representative sample taken to determine the oral health status of Louisiana’s children. Preliminary results
indicate that only 33.2% of children had dental sealants while 41.9% had untreated cavities and 65.7% had caries
experience. The information gathered from this screening is vital to guide future Oral Health Program initiatives.
At the conclusion of the screening, each child’s result was given to either the school nurse or the child’s teacher for
distribution to the child’s parent. Along with the results, we distributed a listing of dental providers in the areas that
accepted Medicaid. We hope that all the children have been able to access care. Please call if we can be of further
assistance in locating a provider. Below are the results of the dental screenings for your school:
Number of children screened XX
Number of children with untreated cavities XX XX%
Number of children with caries experience XX XX%
Number of children with dental sealants
XX XX%
Number of children with early dental care need XX XX%
Number of children with urgent dental care need XX XX%
The Oral Health Program works with local providers to conduct a school-based dental sealant program for second
and sixth graders. This program is offered at no cost to the child or parent. If you would like for your school to
participate in the program, please complete the enclosed participation form and return as instructed. Thank you
again for your participation; we could not have done it without you!
Sincerely,
Rishu Garg, MD, MPH Shelia Hampton, RDH
Oral Health Program Epidemiologist Oral Health Program Dental Sealant Coordinator
628 N. 4th Street, Baton Rouge, LA-70821-3214 628 N. 4
th Street, Baton Rouge, LA 70821-3214
Bobby Jindal GOVERNOR
Alan Levine SECRETARY
State of Louisiana
Department of Health and Hospitals Maternal and Child Health Program

33
Appendix VI Certificate of Participation
Certificate of Participation
Awarded to
Name of the School
In appreciation for your school’s support in
Louisiana’s Bright Smiles for Bright Futures
Oral Health Screening Project
________________ _______________
M. Rony Francois, MD, MSPH, PhD Dionne J. Richardson, DDS, MPH DHH, Office of Public Health Oral Health Program
_______________
Rishu Garg, MD, MPH Oral Health Program
Bright Smiles for Bright Futures 2007-2009
Related Documents